Arab vs Potawatomi Married-Couple Family Poverty
COMPARE
Arab
Potawatomi
Married-Couple Family Poverty
Married-Couple Family Poverty Comparison
Arabs
Potawatomi
5.7%
MARRIED-COUPLE FAMILY POVERTY
5.4/ 100
METRIC RATING
228th/ 347
METRIC RANK
5.5%
MARRIED-COUPLE FAMILY POVERTY
12.4/ 100
METRIC RATING
216th/ 347
METRIC RANK
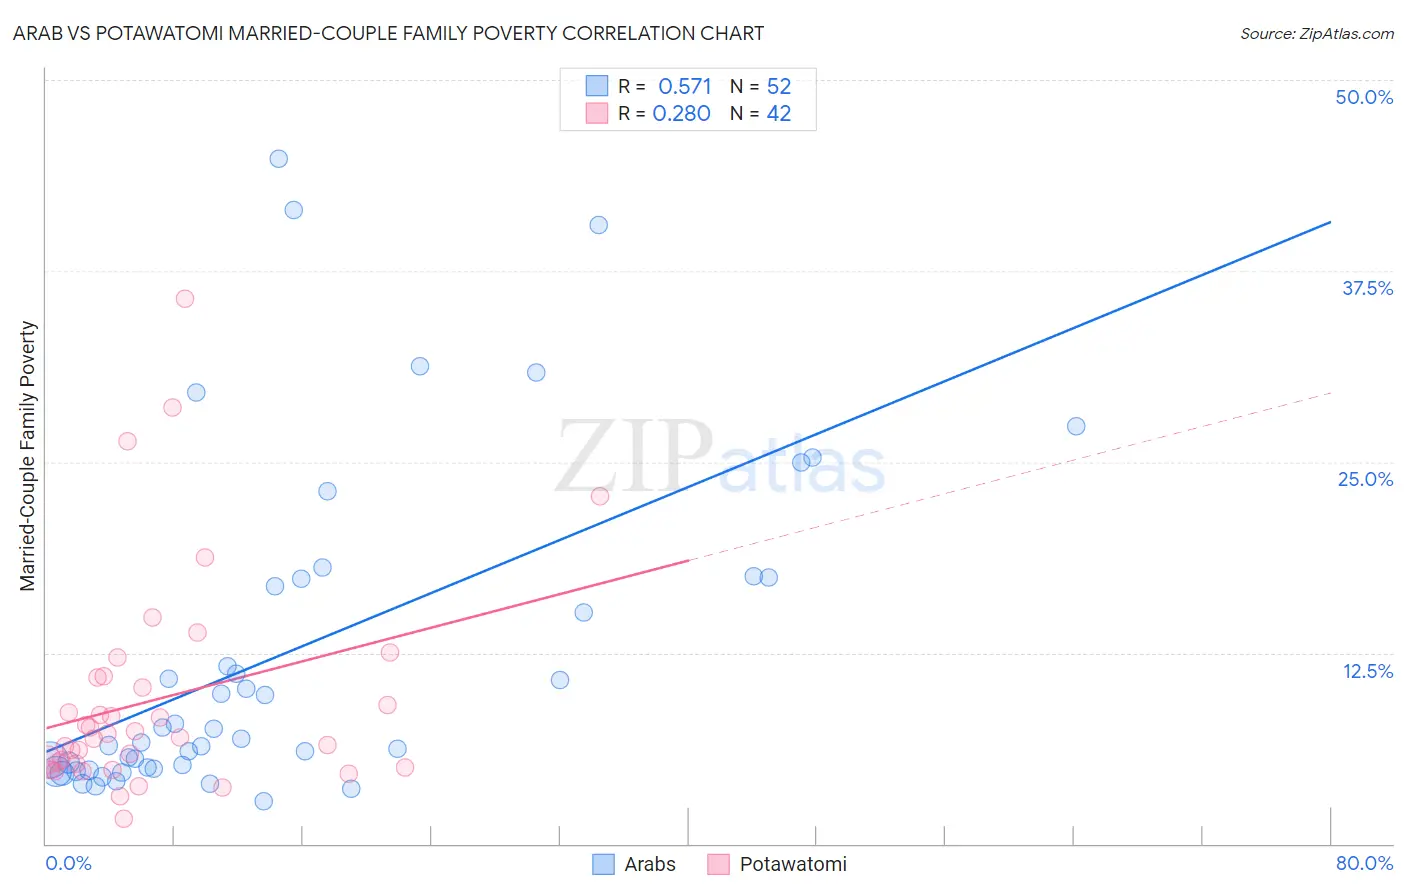
Arab vs Potawatomi Married-Couple Family Poverty Correlation Chart
The statistical analysis conducted on geographies consisting of 480,161,401 people shows a substantial positive correlation between the proportion of Arabs and poverty level among married-couple families in the United States with a correlation coefficient (R) of 0.571 and weighted average of 5.7%. Similarly, the statistical analysis conducted on geographies consisting of 117,481,648 people shows a weak positive correlation between the proportion of Potawatomi and poverty level among married-couple families in the United States with a correlation coefficient (R) of 0.280 and weighted average of 5.5%, a difference of 2.5%.
Married-Couple Family Poverty Correlation Summary
| Measurement | Arab | Potawatomi |
| Minimum | 2.8% | 1.6% |
| Maximum | 44.8% | 35.6% |
| Range | 42.1% | 34.0% |
| Mean | 12.5% | 9.5% |
| Median | 7.2% | 7.1% |
| Interquartile 25% (IQ1) | 5.0% | 5.2% |
| Interquartile 75% (IQ3) | 17.4% | 10.9% |
| Interquartile Range (IQR) | 12.4% | 5.7% |
| Standard Deviation (Sample) | 10.8% | 7.2% |
| Standard Deviation (Population) | 10.7% | 7.1% |
Demographics Similar to Arabs and Potawatomi by Married-Couple Family Poverty
In terms of married-couple family poverty, the demographic groups most similar to Arabs are Immigrants from Zaire (5.6%, a difference of 0.13%), South American (5.6%, a difference of 0.15%), Subsaharan African (5.7%, a difference of 0.25%), Moroccan (5.7%, a difference of 0.28%), and Immigrants from Cambodia (5.6%, a difference of 0.37%). Similarly, the demographic groups most similar to Potawatomi are Armenian (5.5%, a difference of 0.12%), Iroquois (5.5%, a difference of 0.18%), Immigrants from Liberia (5.5%, a difference of 0.23%), Immigrants from Nigeria (5.5%, a difference of 0.29%), and Afghan (5.5%, a difference of 0.31%).
| Demographics | Rating | Rank | Married-Couple Family Poverty |
| Immigrants | Thailand | 14.0 /100 | #212 | Poor 5.5% |
| Immigrants | Liberia | 13.3 /100 | #213 | Poor 5.5% |
| Iroquois | 13.1 /100 | #214 | Poor 5.5% |
| Armenians | 12.8 /100 | #215 | Poor 5.5% |
| Potawatomi | 12.4 /100 | #216 | Poor 5.5% |
| Immigrants | Nigeria | 11.3 /100 | #217 | Poor 5.5% |
| Afghans | 11.2 /100 | #218 | Poor 5.5% |
| Japanese | 9.8 /100 | #219 | Tragic 5.6% |
| Colombians | 9.2 /100 | #220 | Tragic 5.6% |
| Panamanians | 9.2 /100 | #221 | Tragic 5.6% |
| Cajuns | 6.9 /100 | #222 | Tragic 5.6% |
| Immigrants | Fiji | 6.7 /100 | #223 | Tragic 5.6% |
| Sudanese | 6.4 /100 | #224 | Tragic 5.6% |
| Immigrants | Cambodia | 6.1 /100 | #225 | Tragic 5.6% |
| South Americans | 5.7 /100 | #226 | Tragic 5.6% |
| Immigrants | Zaire | 5.6 /100 | #227 | Tragic 5.6% |
| Arabs | 5.4 /100 | #228 | Tragic 5.7% |
| Sub-Saharan Africans | 4.9 /100 | #229 | Tragic 5.7% |
| Moroccans | 4.9 /100 | #230 | Tragic 5.7% |
| Immigrants | Iraq | 4.4 /100 | #231 | Tragic 5.7% |
| Immigrants | Laos | 4.4 /100 | #232 | Tragic 5.7% |