Arab vs Immigrants from Germany Married-Couple Family Poverty
COMPARE
Arab
Immigrants from Germany
Married-Couple Family Poverty
Married-Couple Family Poverty Comparison
Arabs
Immigrants from Germany
5.7%
MARRIED-COUPLE FAMILY POVERTY
5.4/ 100
METRIC RATING
228th/ 347
METRIC RANK
4.7%
MARRIED-COUPLE FAMILY POVERTY
96.8/ 100
METRIC RATING
107th/ 347
METRIC RANK
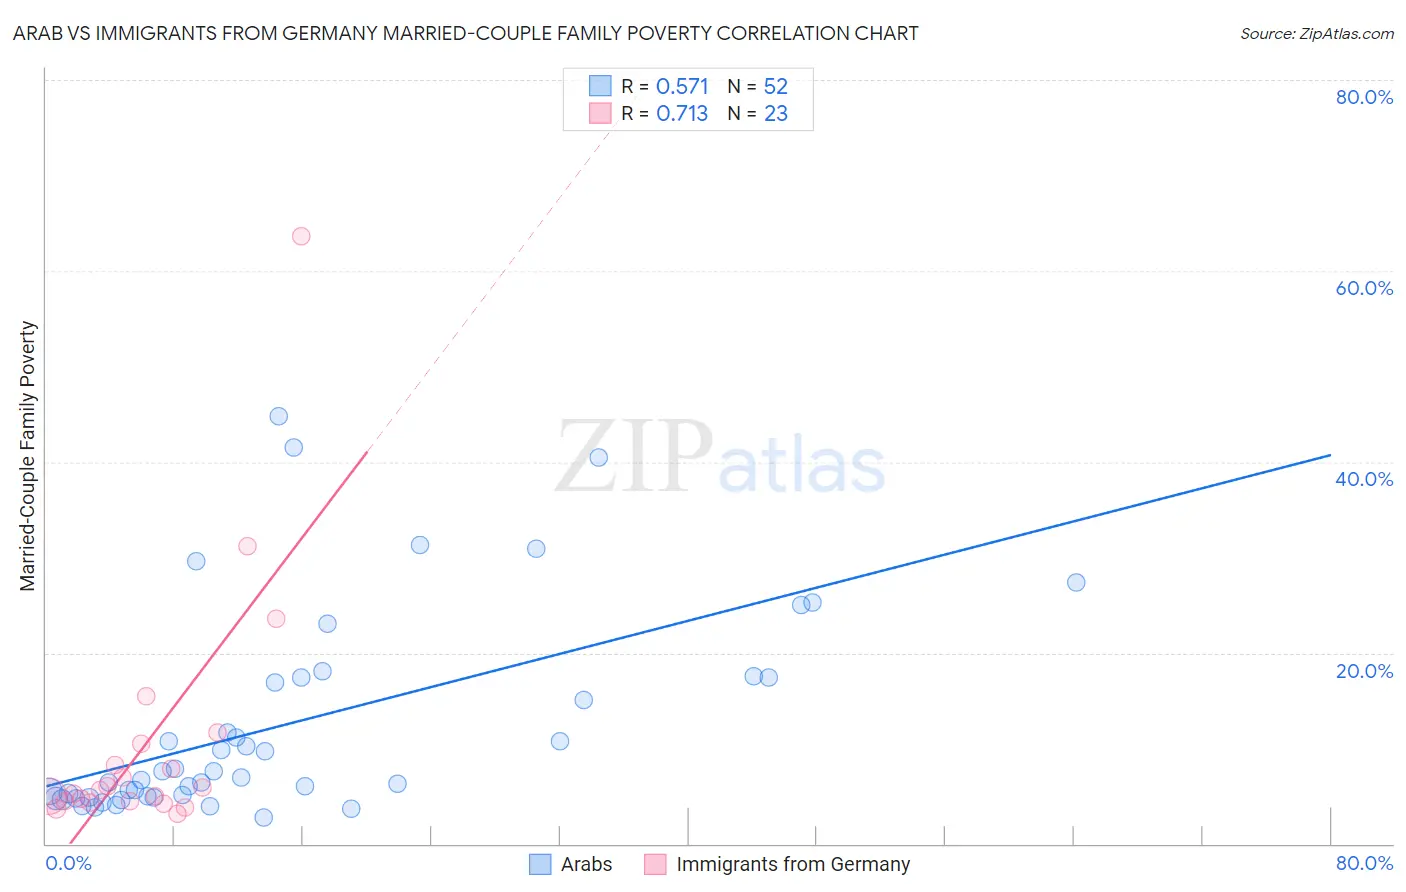
Arab vs Immigrants from Germany Married-Couple Family Poverty Correlation Chart
The statistical analysis conducted on geographies consisting of 480,161,401 people shows a substantial positive correlation between the proportion of Arabs and poverty level among married-couple families in the United States with a correlation coefficient (R) of 0.571 and weighted average of 5.7%. Similarly, the statistical analysis conducted on geographies consisting of 458,355,071 people shows a strong positive correlation between the proportion of Immigrants from Germany and poverty level among married-couple families in the United States with a correlation coefficient (R) of 0.713 and weighted average of 4.7%, a difference of 20.3%.
Married-Couple Family Poverty Correlation Summary
| Measurement | Arab | Immigrants from Germany |
| Minimum | 2.8% | 3.1% |
| Maximum | 44.8% | 63.6% |
| Range | 42.1% | 60.5% |
| Mean | 12.5% | 10.6% |
| Median | 7.2% | 5.6% |
| Interquartile 25% (IQ1) | 5.0% | 4.4% |
| Interquartile 75% (IQ3) | 17.4% | 10.5% |
| Interquartile Range (IQR) | 12.4% | 6.1% |
| Standard Deviation (Sample) | 10.8% | 13.4% |
| Standard Deviation (Population) | 10.7% | 13.1% |
Similar Demographics by Married-Couple Family Poverty
Demographics Similar to Arabs by Married-Couple Family Poverty
In terms of married-couple family poverty, the demographic groups most similar to Arabs are Immigrants from Zaire (5.6%, a difference of 0.13%), South American (5.6%, a difference of 0.15%), Subsaharan African (5.7%, a difference of 0.25%), Moroccan (5.7%, a difference of 0.28%), and Immigrants from Cambodia (5.6%, a difference of 0.37%).
| Demographics | Rating | Rank | Married-Couple Family Poverty |
| Panamanians | 9.2 /100 | #221 | Tragic 5.6% |
| Cajuns | 6.9 /100 | #222 | Tragic 5.6% |
| Immigrants | Fiji | 6.7 /100 | #223 | Tragic 5.6% |
| Sudanese | 6.4 /100 | #224 | Tragic 5.6% |
| Immigrants | Cambodia | 6.1 /100 | #225 | Tragic 5.6% |
| South Americans | 5.7 /100 | #226 | Tragic 5.6% |
| Immigrants | Zaire | 5.6 /100 | #227 | Tragic 5.6% |
| Arabs | 5.4 /100 | #228 | Tragic 5.7% |
| Sub-Saharan Africans | 4.9 /100 | #229 | Tragic 5.7% |
| Moroccans | 4.9 /100 | #230 | Tragic 5.7% |
| Immigrants | Iraq | 4.4 /100 | #231 | Tragic 5.7% |
| Immigrants | Laos | 4.4 /100 | #232 | Tragic 5.7% |
| Immigrants | Colombia | 3.7 /100 | #233 | Tragic 5.7% |
| Immigrants | Uruguay | 3.7 /100 | #234 | Tragic 5.7% |
| Immigrants | Sudan | 3.5 /100 | #235 | Tragic 5.7% |
Demographics Similar to Immigrants from Germany by Married-Couple Family Poverty
In terms of married-couple family poverty, the demographic groups most similar to Immigrants from Germany are Immigrants from France (4.7%, a difference of 0.010%), Aleut (4.7%, a difference of 0.16%), Immigrants from Moldova (4.7%, a difference of 0.24%), Laotian (4.7%, a difference of 0.26%), and Immigrants from Hong Kong (4.7%, a difference of 0.46%).
| Demographics | Rating | Rank | Married-Couple Family Poverty |
| Immigrants | Western Europe | 97.9 /100 | #100 | Exceptional 4.6% |
| Yugoslavians | 97.8 /100 | #101 | Exceptional 4.6% |
| Asians | 97.6 /100 | #102 | Exceptional 4.7% |
| Immigrants | Romania | 97.3 /100 | #103 | Exceptional 4.7% |
| Immigrants | Moldova | 97.1 /100 | #104 | Exceptional 4.7% |
| Aleuts | 97.0 /100 | #105 | Exceptional 4.7% |
| Immigrants | France | 96.9 /100 | #106 | Exceptional 4.7% |
| Immigrants | Germany | 96.8 /100 | #107 | Exceptional 4.7% |
| Laotians | 96.6 /100 | #108 | Exceptional 4.7% |
| Immigrants | Hong Kong | 96.4 /100 | #109 | Exceptional 4.7% |
| Immigrants | Bolivia | 96.2 /100 | #110 | Exceptional 4.7% |
| Pakistanis | 96.2 /100 | #111 | Exceptional 4.7% |
| Tongans | 95.9 /100 | #112 | Exceptional 4.7% |
| Immigrants | Nepal | 95.9 /100 | #113 | Exceptional 4.7% |
| Immigrants | Indonesia | 95.1 /100 | #114 | Exceptional 4.8% |