Arab 1 or more Vehicles in Household
COMPARE
Arab
Select to Compare
1 or more Vehicles in Household
Arab 1 or more Vehicles in Household
89.6%
1+ VEHICLES AVAILABLE
43.3/ 100
METRIC RATING
180th/ 347
METRIC RANK
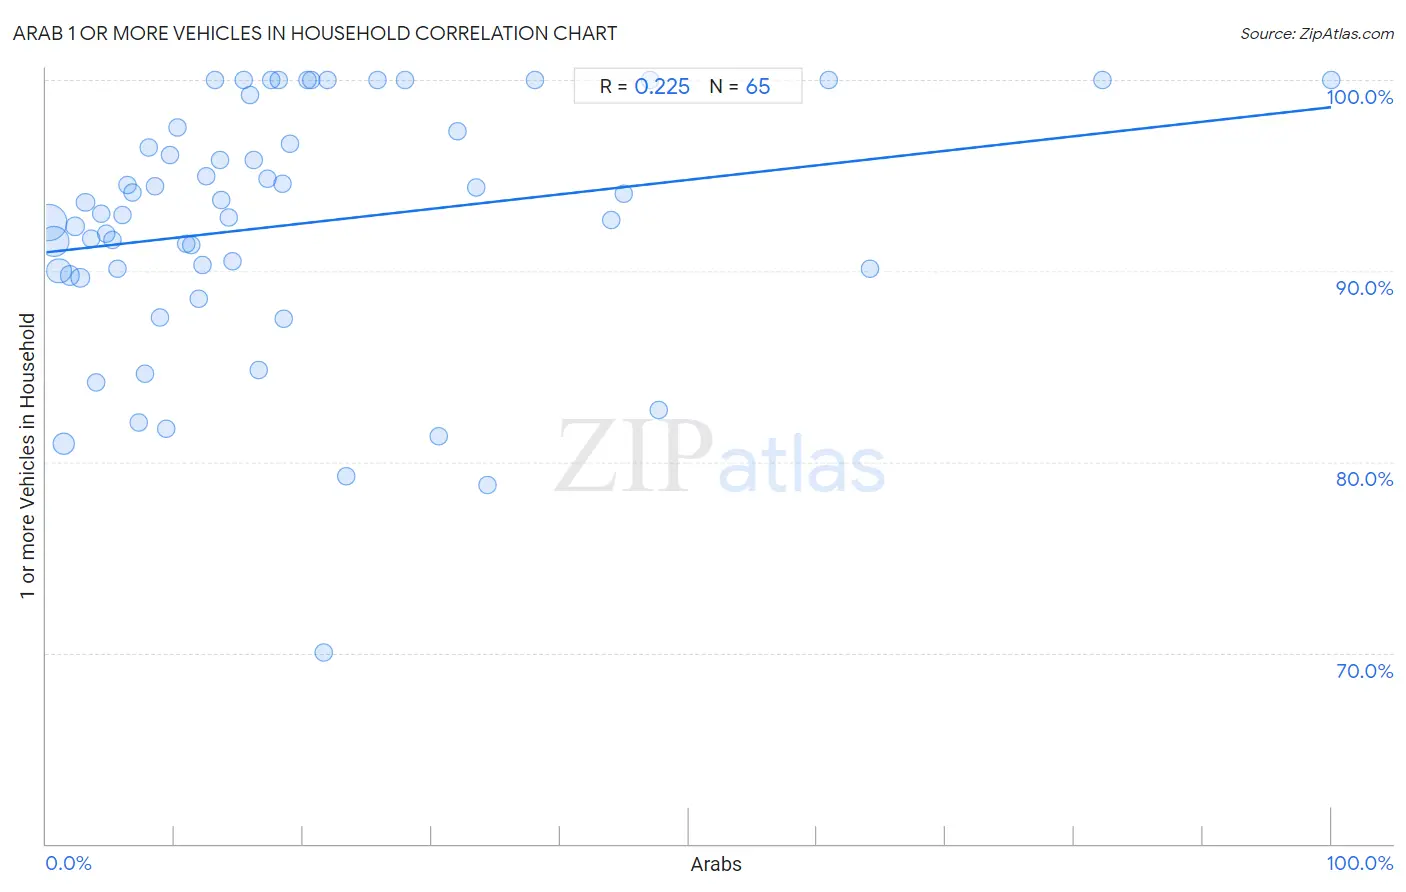
Arab 1 or more Vehicles in Household Correlation Chart
The statistical analysis conducted on geographies consisting of 486,370,240 people shows a weak positive correlation between the proportion of Arabs and percentage of households with 1 or more vehicles available in the United States with a correlation coefficient (R) of 0.225 and weighted average of 89.6%. On average, for every 1% (one percent) increase in Arabs within a typical geography, there is an increase of 0.076% in percentage of households with 1 or more vehicles available.
It is essential to understand that the correlation between the percentage of Arabs and percentage of households with 1 or more vehicles available does not imply a direct cause-and-effect relationship. It remains uncertain whether the presence of Arabs influences an upward or downward trend in the level of percentage of households with 1 or more vehicles available within an area, or if Arabs simply ended up residing in those areas with higher or lower levels of percentage of households with 1 or more vehicles available due to other factors.
Demographics Similar to Arabs by 1 or more Vehicles in Household
In terms of 1 or more vehicles in household, the demographic groups most similar to Arabs are Immigrants from El Salvador (89.6%, a difference of 0.010%), German Russian (89.6%, a difference of 0.010%), Immigrants from Ethiopia (89.6%, a difference of 0.010%), Ukrainian (89.6%, a difference of 0.010%), and Ethiopian (89.6%, a difference of 0.030%).
| Demographics | Rating | Rank | 1 or more Vehicles in Household |
| Lumbee | 52.8 /100 | #173 | Average 89.7% |
| Filipinos | 50.0 /100 | #174 | Average 89.7% |
| Immigrants from Burma/Myanmar | 47.6 /100 | #175 | Average 89.7% |
| Immigrants from Sudan | 47.1 /100 | #176 | Average 89.7% |
| Hmong | 45.8 /100 | #177 | Average 89.6% |
| Immigrants from El Salvador | 44.1 /100 | #178 | Average 89.6% |
| German Russians | 44.0 /100 | #179 | Average 89.6% |
| Arabs | 43.3 /100 | #180 | Average 89.6% |
| Immigrants from Ethiopia | 42.5 /100 | #181 | Average 89.6% |
| Ukrainians | 42.4 /100 | #182 | Average 89.6% |
| Ethiopians | 41.2 /100 | #183 | Average 89.6% |
| Immigrants from Bulgaria | 40.7 /100 | #184 | Average 89.6% |
| Immigrants from Brazil | 40.1 /100 | #185 | Average 89.6% |
| Pueblo | 39.9 /100 | #186 | Fair 89.6% |
| South Americans | 39.6 /100 | #187 | Fair 89.5% |
Arab 1 or more Vehicles in Household Correlation Summary
| Measurement | Arab Data | 1 or more Vehicles in Household Data |
| Minimum | 0.20% | 70.0% |
| Maximum | 100.0% | 100.0% |
| Range | 99.8% | 30.0% |
| Mean | 19.2% | 92.4% |
| Median | 13.6% | 93.0% |
| Interquartile 25% (IQ1) | 6.5% | 89.9% |
| Interquartile 75% (IQ3) | 22.6% | 97.4% |
| Interquartile Range (IQR) | 16.1% | 7.5% |
| Standard Deviation (Sample) | 19.4% | 6.5% |
| Standard Deviation (Population) | 19.2% | 6.5% |
Correlation Details
| Arab Percentile | Sample Size | 1 or more Vehicles in Household |
[ 0.0% - 0.5% ] 0.20% | 197,273,134 | 92.5% |
[ 0.5% - 1.0% ] 0.61% | 128,153,398 | 91.5% |
[ 0.5% - 1.0% ] 1.00% | 73,945,750 | 90.0% |
[ 1.0% - 1.5% ] 1.39% | 39,505,768 | 81.0% |
[ 1.5% - 2.0% ] 1.84% | 15,918,636 | 89.8% |
[ 2.0% - 2.5% ] 2.24% | 11,178,949 | 92.3% |
[ 2.5% - 3.0% ] 2.67% | 6,874,366 | 89.6% |
[ 3.0% - 3.5% ] 3.06% | 3,306,839 | 93.6% |
[ 3.0% - 3.5% ] 3.50% | 2,101,776 | 91.7% |
[ 3.5% - 4.0% ] 3.87% | 2,141,312 | 84.1% |
[ 4.0% - 4.5% ] 4.32% | 940,941 | 93.0% |
[ 4.5% - 5.0% ] 4.71% | 840,728 | 91.9% |
[ 5.0% - 5.5% ] 5.12% | 681,743 | 91.6% |
[ 5.5% - 6.0% ] 5.54% | 442,778 | 90.1% |
[ 5.5% - 6.0% ] 5.93% | 219,868 | 92.9% |
[ 6.0% - 6.5% ] 6.31% | 415,222 | 94.5% |
[ 6.5% - 7.0% ] 6.67% | 283,117 | 94.1% |
[ 7.0% - 7.5% ] 7.24% | 141,035 | 82.1% |
[ 7.5% - 8.0% ] 7.64% | 282,500 | 84.6% |
[ 7.5% - 8.0% ] 7.98% | 199,092 | 96.5% |
[ 8.0% - 8.5% ] 8.49% | 84,443 | 94.5% |
[ 8.5% - 9.0% ] 8.86% | 322,956 | 87.6% |
[ 9.0% - 9.5% ] 9.36% | 30,824 | 81.8% |
[ 9.5% - 10.0% ] 9.63% | 86,980 | 96.1% |
[ 10.0% - 10.5% ] 10.17% | 53,472 | 97.5% |
[ 10.5% - 11.0% ] 10.90% | 127,955 | 91.4% |
[ 11.0% - 11.5% ] 11.30% | 145,544 | 91.3% |
[ 11.5% - 12.0% ] 11.83% | 47,371 | 88.5% |
[ 12.0% - 12.5% ] 12.14% | 51,471 | 90.3% |
[ 12.0% - 12.5% ] 12.43% | 22,082 | 94.9% |
[ 13.0% - 13.5% ] 13.11% | 122 | 100.0% |
[ 13.5% - 14.0% ] 13.53% | 38,222 | 95.8% |
[ 13.5% - 14.0% ] 13.60% | 72,809 | 93.7% |
[ 14.0% - 14.5% ] 14.24% | 1,215 | 92.8% |
[ 14.0% - 14.5% ] 14.46% | 332 | 90.5% |
[ 15.0% - 15.5% ] 15.38% | 156 | 100.0% |
[ 15.5% - 16.0% ] 15.87% | 2,042 | 99.2% |
[ 16.0% - 16.5% ] 16.13% | 34,046 | 95.8% |
[ 16.5% - 17.0% ] 16.52% | 1,132 | 84.8% |
[ 17.0% - 17.5% ] 17.22% | 25,511 | 94.9% |
[ 17.0% - 17.5% ] 17.50% | 120 | 100.0% |
[ 18.0% - 18.5% ] 18.09% | 94 | 100.0% |
[ 18.0% - 18.5% ] 18.38% | 952 | 94.6% |
[ 18.5% - 19.0% ] 18.52% | 54 | 87.5% |
[ 19.0% - 19.5% ] 19.02% | 8,551 | 96.7% |
[ 20.0% - 20.5% ] 20.38% | 211 | 100.0% |
[ 20.5% - 21.0% ] 20.62% | 160 | 100.0% |
[ 21.5% - 22.0% ] 21.57% | 51 | 70.0% |
[ 21.5% - 22.0% ] 21.88% | 96 | 100.0% |
[ 23.0% - 23.5% ] 23.30% | 43,213 | 79.2% |
[ 25.5% - 26.0% ] 25.80% | 314 | 100.0% |
[ 27.5% - 28.0% ] 27.93% | 598 | 100.0% |
[ 30.5% - 31.0% ] 30.52% | 27,894 | 81.3% |
[ 31.5% - 32.0% ] 32.00% | 12,405 | 97.3% |
[ 33.0% - 33.5% ] 33.47% | 62,492 | 94.4% |
[ 34.0% - 34.5% ] 34.38% | 5,526 | 78.8% |
[ 38.0% - 38.5% ] 38.00% | 150 | 100.0% |
[ 44.0% - 44.5% ] 44.01% | 108,414 | 92.6% |
[ 44.5% - 45.0% ] 44.98% | 40,392 | 94.0% |
[ 47.0% - 47.5% ] 47.01% | 117 | 100.0% |
[ 47.5% - 48.0% ] 47.71% | 8,919 | 82.7% |
[ 60.5% - 61.0% ] 60.91% | 660 | 100.0% |
[ 64.0% - 64.5% ] 64.10% | 53,044 | 90.1% |
[ 82.0% - 82.5% ] 82.24% | 107 | 100.0% |
[ 99.5% - 100.0% ] 100.00% | 69 | 100.0% |