Kingston, OK Map & Demographics
Kingston Map
Kingston Overview
$26,909
PER CAPITA INCOME
$69,250
AVG FAMILY INCOME
$46,923
AVG HOUSEHOLD INCOME
33.6%
WAGE / INCOME GAP [ % ]
66.4¢/ $1
WAGE / INCOME GAP [ $ ]
$10,377
FAMILY INCOME DEFICIT
0.43
INEQUALITY / GINI INDEX
1,726
TOTAL POPULATION
831
MALE POPULATION
895
FEMALE POPULATION
92.85
MALES / 100 FEMALES
107.70
FEMALES / 100 MALES
38.1
MEDIAN AGE
3.6
AVG FAMILY SIZE
3.0
AVG HOUSEHOLD SIZE
735
LABOR FORCE [ PEOPLE ]
56.3%
PERCENT IN LABOR FORCE
4.2%
UNEMPLOYMENT RATE
Kingston Zip Codes
Kingston Area Codes
Income in Kingston
Income Overview in Kingston
Per Capita Income in Kingston is $26,909, while median incomes of families and households are $69,250 and $46,923 respectively.
| Characteristic | Number | Measure |
| Per Capita Income | 1,726 | $26,909 |
| Median Family Income | 362 | $69,250 |
| Mean Family Income | 362 | $80,368 |
| Median Household Income | 560 | $46,923 |
| Mean Household Income | 560 | $65,213 |
| Income Deficit | 362 | $10,377 |
| Wage / Income Gap (%) | 1,726 | 33.61% |
| Wage / Income Gap ($) | 1,726 | 66.39¢ per $1 |
| Gini / Inequality Index | 1,726 | 0.43 |
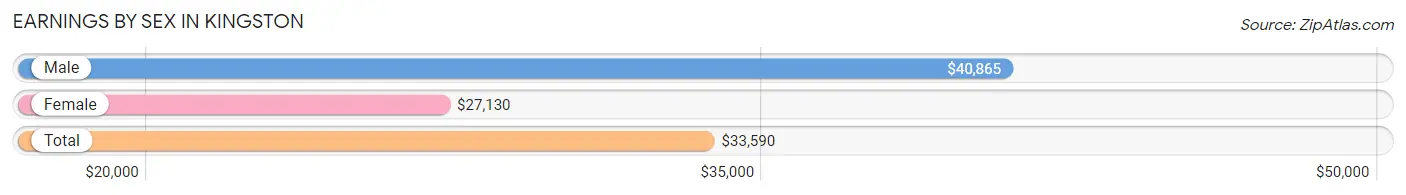
Earnings by Sex in Kingston
Average Earnings in Kingston are $33,590, $40,865 for men and $27,130 for women, a difference of 33.6%.
| Sex | Number | Average Earnings |
| Male | 388 (49.1%) | $40,865 |
| Female | 402 (50.9%) | $27,130 |
| Total | 790 (100.0%) | $33,590 |
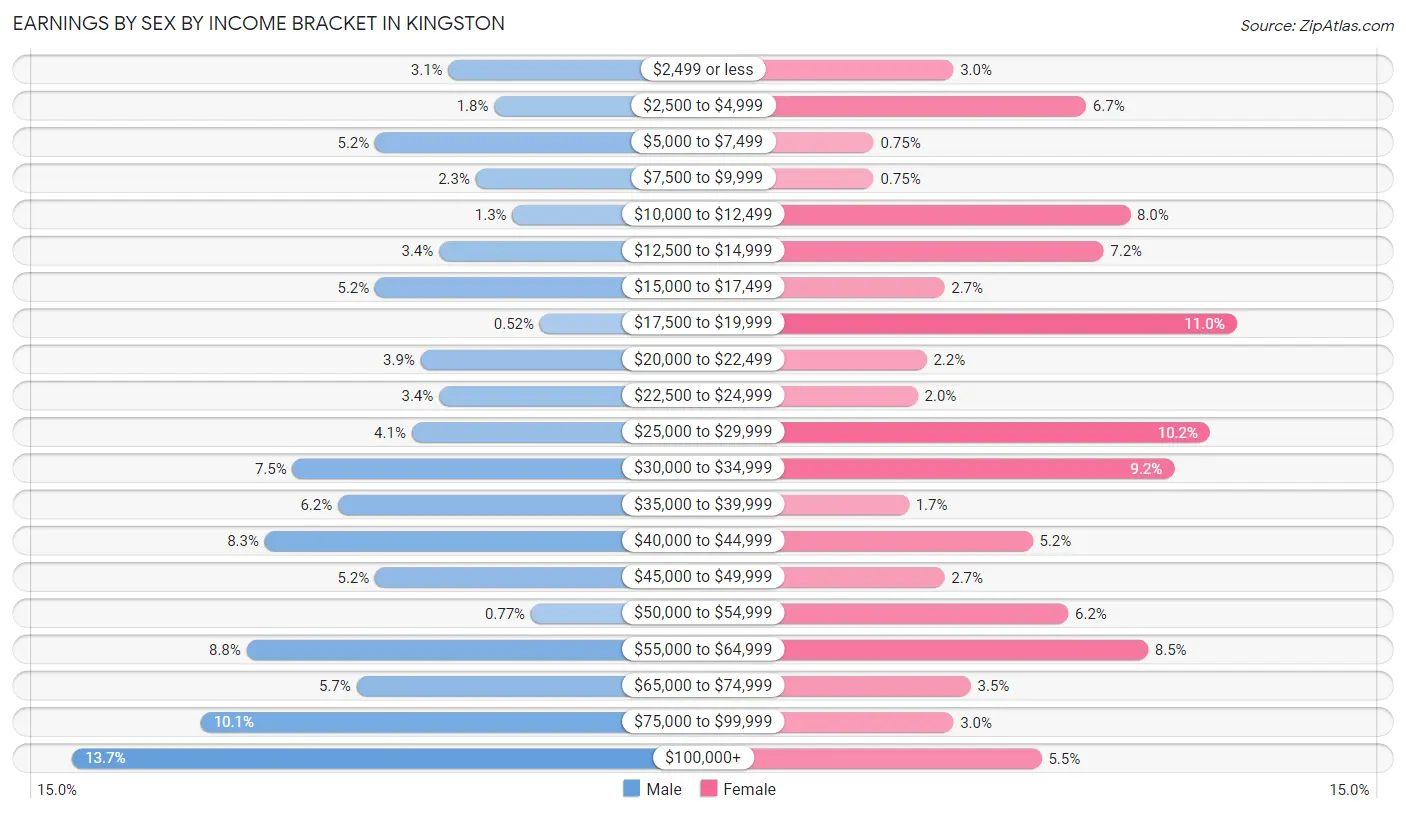
Earnings by Sex by Income Bracket in Kingston
The most common earnings brackets in Kingston are $100,000+ for men (53 | 13.7%) and $17,500 to $19,999 for women (44 | 11.0%).
| Income | Male | Female |
| $2,499 or less | 12 (3.1%) | 12 (3.0%) |
| $2,500 to $4,999 | 7 (1.8%) | 27 (6.7%) |
| $5,000 to $7,499 | 20 (5.1%) | 3 (0.7%) |
| $7,500 to $9,999 | 9 (2.3%) | 3 (0.7%) |
| $10,000 to $12,499 | 5 (1.3%) | 32 (8.0%) |
| $12,500 to $14,999 | 13 (3.4%) | 29 (7.2%) |
| $15,000 to $17,499 | 20 (5.1%) | 11 (2.7%) |
| $17,500 to $19,999 | 2 (0.5%) | 44 (11.0%) |
| $20,000 to $22,499 | 15 (3.9%) | 9 (2.2%) |
| $22,500 to $24,999 | 13 (3.4%) | 8 (2.0%) |
| $25,000 to $29,999 | 16 (4.1%) | 41 (10.2%) |
| $30,000 to $34,999 | 29 (7.5%) | 37 (9.2%) |
| $35,000 to $39,999 | 24 (6.2%) | 7 (1.7%) |
| $40,000 to $44,999 | 32 (8.3%) | 21 (5.2%) |
| $45,000 to $49,999 | 20 (5.1%) | 11 (2.7%) |
| $50,000 to $54,999 | 3 (0.8%) | 25 (6.2%) |
| $55,000 to $64,999 | 34 (8.8%) | 34 (8.5%) |
| $65,000 to $74,999 | 22 (5.7%) | 14 (3.5%) |
| $75,000 to $99,999 | 39 (10.1%) | 12 (3.0%) |
| $100,000+ | 53 (13.7%) | 22 (5.5%) |
| Total | 388 (100.0%) | 402 (100.0%) |
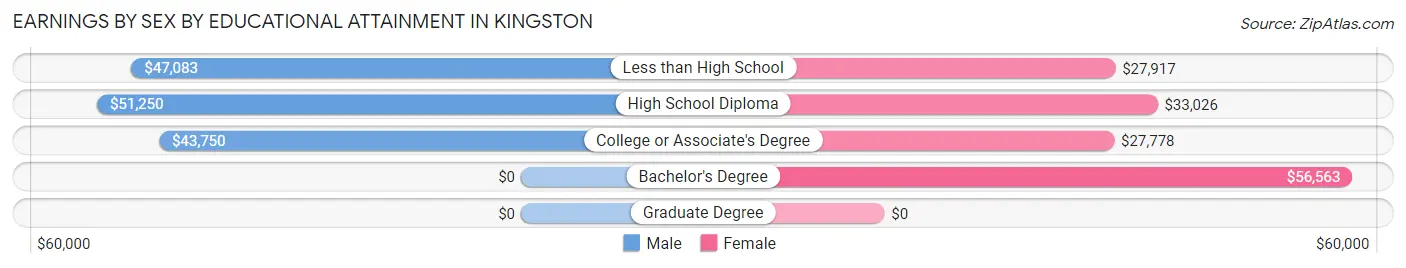
Earnings by Sex by Educational Attainment in Kingston
Average earnings in Kingston are $46,923 for men and $30,156 for women, a difference of 35.7%. Men with an educational attainment of high school diploma enjoy the highest average annual earnings of $51,250, while those with college or associate's degree education earn the least with $43,750. Women with an educational attainment of bachelor's degree earn the most with the average annual earnings of $56,563, while those with college or associate's degree education have the smallest earnings of $27,778.
| Educational Attainment | Male Income | Female Income |
| Less than High School | $47,083 | $27,917 |
| High School Diploma | $51,250 | $33,026 |
| College or Associate's Degree | $43,750 | $27,778 |
| Bachelor's Degree | - | - |
| Graduate Degree | - | - |
| Total | $46,923 | $30,156 |
Family Income in Kingston
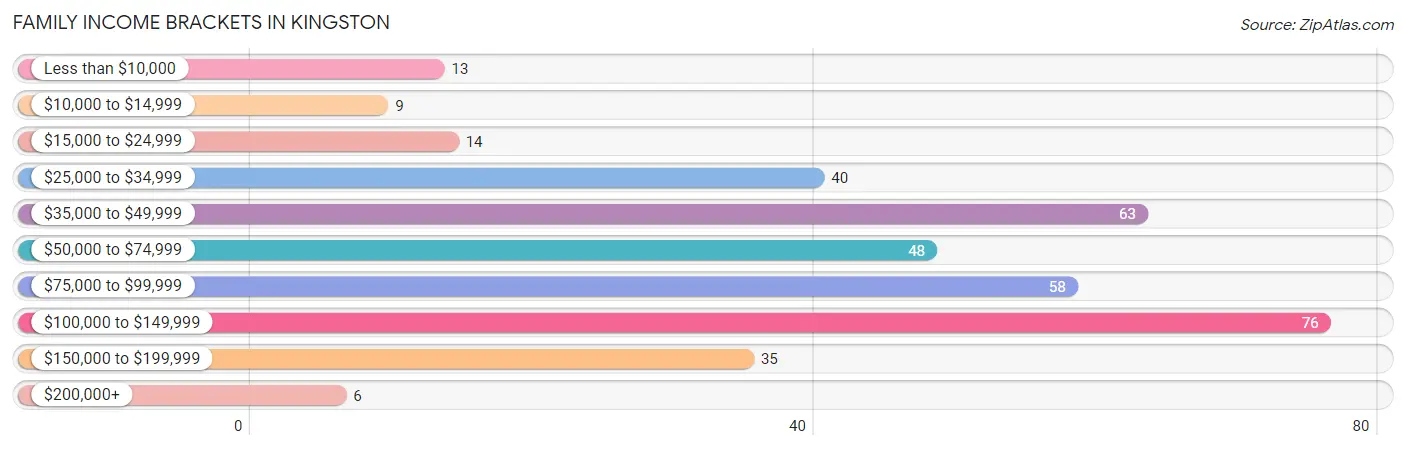
Family Income Brackets in Kingston
According to the Kingston family income data, there are 76 families falling into the $100,000 to $149,999 income range, which is the most common income bracket and makes up 21.0% of all families. Conversely, the $200,000+ income bracket is the least frequent group with only 6 families (1.7%) belonging to this category.
| Income Bracket | # Families | % Families |
| Less than $10,000 | 13 | 3.6% |
| $10,000 to $14,999 | 9 | 2.5% |
| $15,000 to $24,999 | 14 | 3.9% |
| $25,000 to $34,999 | 40 | 11.0% |
| $35,000 to $49,999 | 63 | 17.4% |
| $50,000 to $74,999 | 48 | 13.3% |
| $75,000 to $99,999 | 58 | 16.0% |
| $100,000 to $149,999 | 76 | 21.0% |
| $150,000 to $199,999 | 35 | 9.7% |
| $200,000+ | 6 | 1.7% |
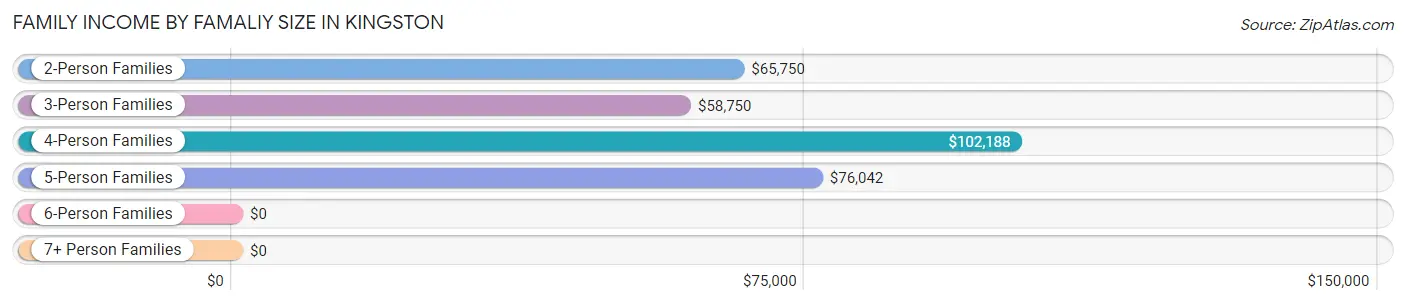
Family Income by Famaliy Size in Kingston
4-person families (93 | 25.7%) account for the highest median family income in Kingston with $102,188 per family, while 2-person families (141 | 39.0%) have the highest median income of $32,875 per family member.
| Income Bracket | # Families | Median Income |
| 2-Person Families | 141 (39.0%) | $65,750 |
| 3-Person Families | 86 (23.8%) | $58,750 |
| 4-Person Families | 93 (25.7%) | $102,188 |
| 5-Person Families | 35 (9.7%) | $76,042 |
| 6-Person Families | 2 (0.5%) | $0 |
| 7+ Person Families | 5 (1.4%) | $0 |
| Total | 362 (100.0%) | $69,250 |
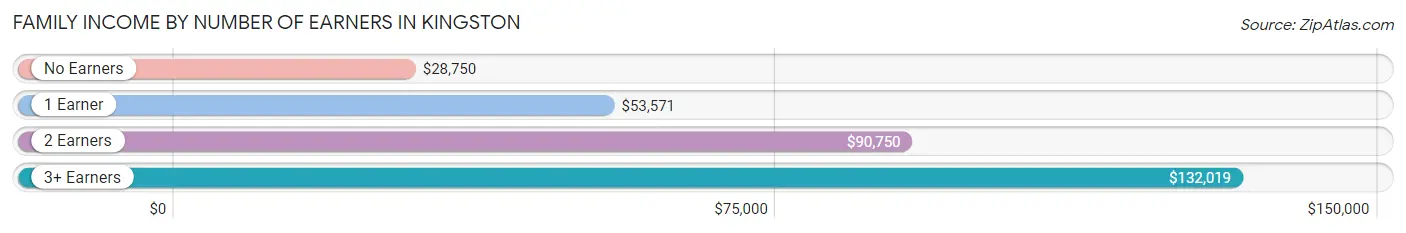
Family Income by Number of Earners in Kingston
The median family income in Kingston is $69,250, with families comprising 3+ earners (63) having the highest median family income of $132,019, while families with no earners (56) have the lowest median family income of $28,750, accounting for 17.4% and 15.5% of families, respectively.
| Number of Earners | # Families | Median Income |
| No Earners | 56 (15.5%) | $28,750 |
| 1 Earner | 134 (37.0%) | $53,571 |
| 2 Earners | 109 (30.1%) | $90,750 |
| 3+ Earners | 63 (17.4%) | $132,019 |
| Total | 362 (100.0%) | $69,250 |
Household Income in Kingston
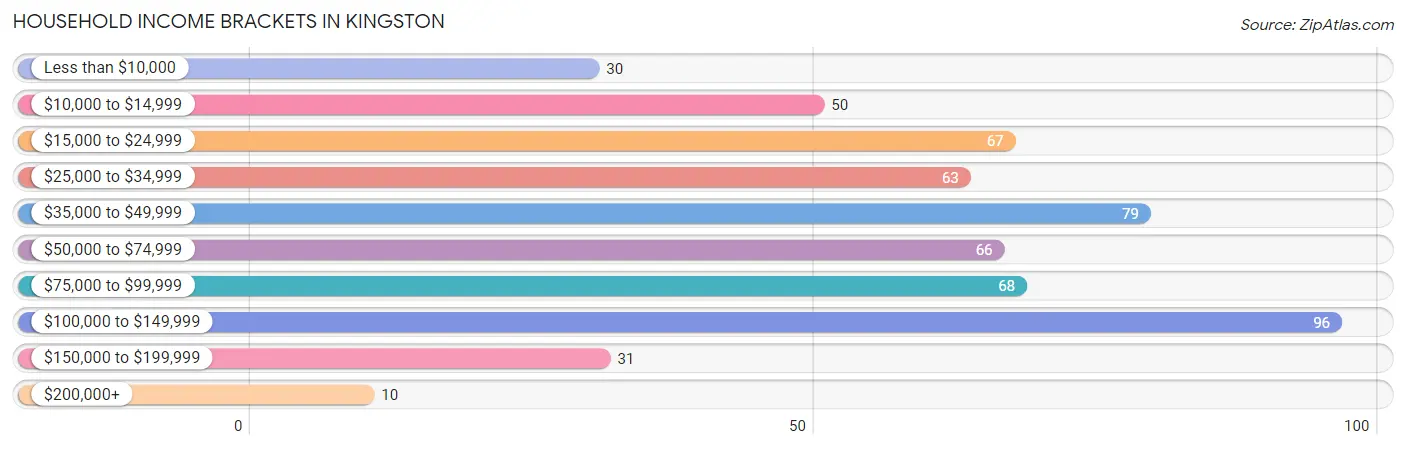
Household Income Brackets in Kingston
With 96 households falling in the category, the $100,000 to $149,999 income range is the most frequent in Kingston, accounting for 17.1% of all households. In contrast, only 10 households (1.8%) fall into the $200,000+ income bracket, making it the least populous group.
| Income Bracket | # Households | % Households |
| Less than $10,000 | 30 | 5.4% |
| $10,000 to $14,999 | 50 | 8.9% |
| $15,000 to $24,999 | 67 | 12.0% |
| $25,000 to $34,999 | 63 | 11.3% |
| $35,000 to $49,999 | 79 | 14.1% |
| $50,000 to $74,999 | 66 | 11.8% |
| $75,000 to $99,999 | 68 | 12.1% |
| $100,000 to $149,999 | 96 | 17.1% |
| $150,000 to $199,999 | 31 | 5.5% |
| $200,000+ | 10 | 1.8% |
Household Income by Householder Age in Kingston
The median household income in Kingston is $46,923, with the highest median household income of $74,167 found in the 45 to 64 years age bracket for the primary householder. A total of 206 households (36.8%) fall into this category. Meanwhile, the 65+ years age bracket for the primary householder has the lowest median household income of $30,000, with 146 households (26.1%) in this group.
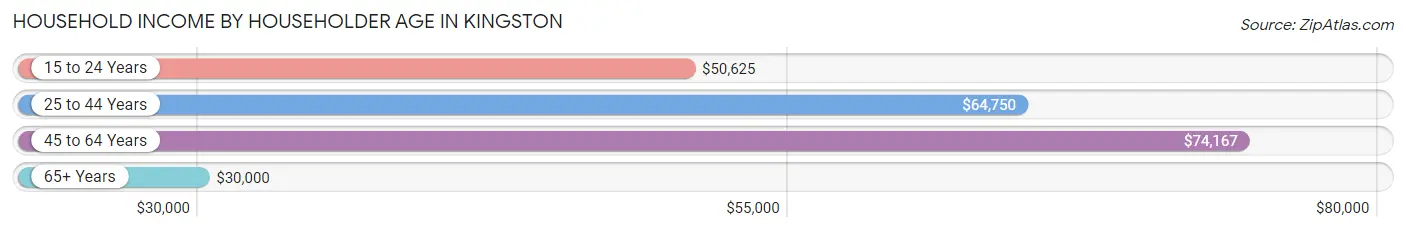
| Income Bracket | # Households | Median Income |
| 15 to 24 Years | 25 (4.5%) | $50,625 |
| 25 to 44 Years | 183 (32.7%) | $64,750 |
| 45 to 64 Years | 206 (36.8%) | $74,167 |
| 65+ Years | 146 (26.1%) | $30,000 |
| Total | 560 (100.0%) | $46,923 |
Poverty in Kingston
Income Below Poverty by Sex and Age in Kingston
With 17.2% poverty level for males and 20.9% for females among the residents of Kingston, 15 year old males and 5 year old females are the most vulnerable to poverty, with 6 males (54.5%) and 4 females (66.7%) in their respective age groups living below the poverty level.
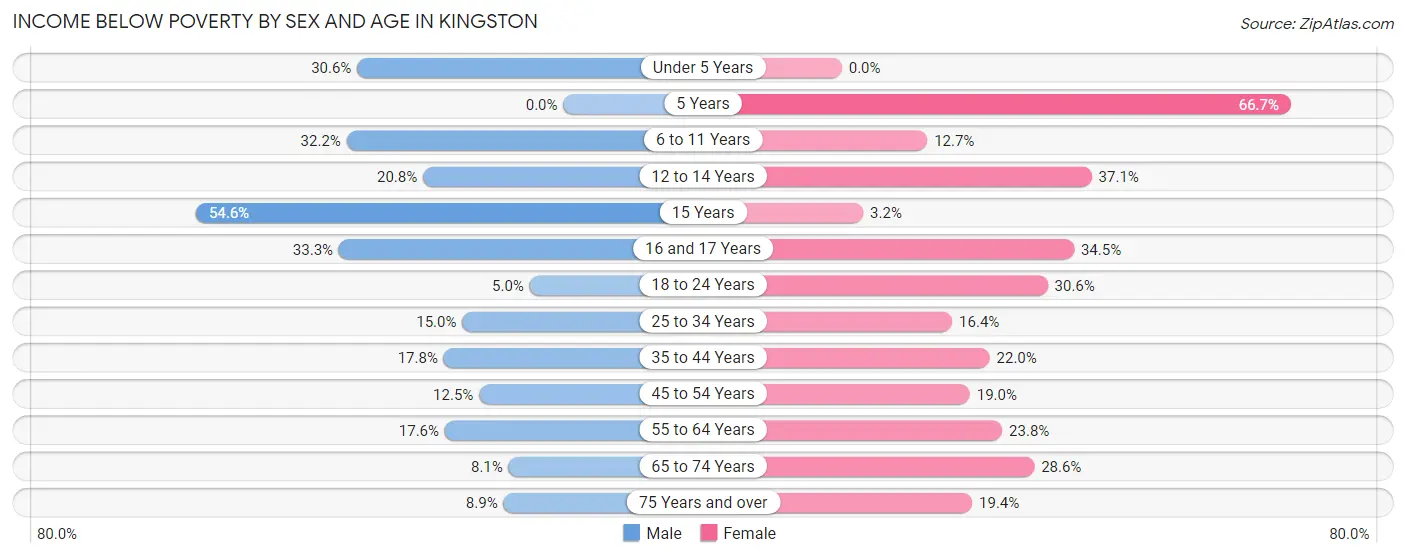
| Age Bracket | Male | Female |
| Under 5 Years | 15 (30.6%) | 0 (0.0%) |
| 5 Years | 0 (0.0%) | 4 (66.7%) |
| 6 to 11 Years | 28 (32.2%) | 9 (12.7%) |
| 12 to 14 Years | 5 (20.8%) | 23 (37.1%) |
| 15 Years | 6 (54.5%) | 2 (3.2%) |
| 16 and 17 Years | 11 (33.3%) | 10 (34.5%) |
| 18 to 24 Years | 4 (5.0%) | 11 (30.6%) |
| 25 to 34 Years | 9 (15.0%) | 20 (16.4%) |
| 35 to 44 Years | 19 (17.8%) | 27 (22.0%) |
| 45 to 54 Years | 11 (12.5%) | 23 (19.0%) |
| 55 to 64 Years | 19 (17.6%) | 20 (23.8%) |
| 65 to 74 Years | 10 (8.1%) | 24 (28.6%) |
| 75 Years and over | 4 (8.9%) | 6 (19.4%) |
| Total | 141 (17.2%) | 179 (20.9%) |
Income Above Poverty by Sex and Age in Kingston
According to the poverty statistics in Kingston, males aged 5 years and females aged under 5 years are the age groups that are most secure financially, with 100.0% of males and 100.0% of females in these age groups living above the poverty line.
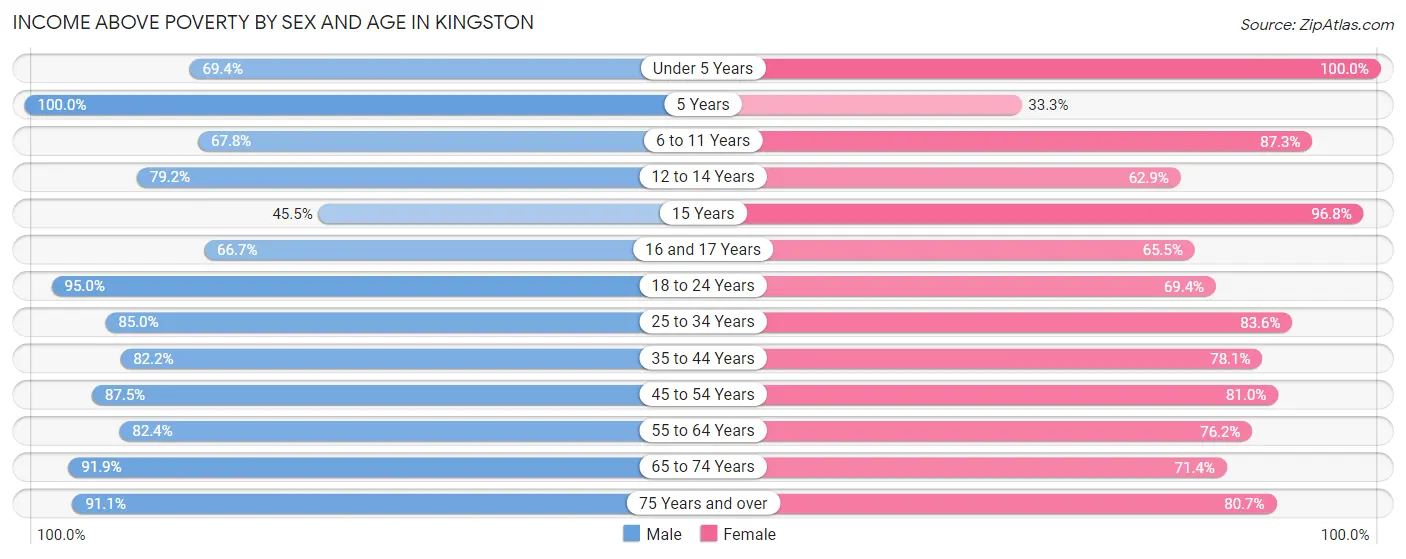
| Age Bracket | Male | Female |
| Under 5 Years | 34 (69.4%) | 25 (100.0%) |
| 5 Years | 4 (100.0%) | 2 (33.3%) |
| 6 to 11 Years | 59 (67.8%) | 62 (87.3%) |
| 12 to 14 Years | 19 (79.2%) | 39 (62.9%) |
| 15 Years | 5 (45.5%) | 61 (96.8%) |
| 16 and 17 Years | 22 (66.7%) | 19 (65.5%) |
| 18 to 24 Years | 76 (95.0%) | 25 (69.4%) |
| 25 to 34 Years | 51 (85.0%) | 102 (83.6%) |
| 35 to 44 Years | 88 (82.2%) | 96 (78.0%) |
| 45 to 54 Years | 77 (87.5%) | 98 (81.0%) |
| 55 to 64 Years | 89 (82.4%) | 64 (76.2%) |
| 65 to 74 Years | 113 (91.9%) | 60 (71.4%) |
| 75 Years and over | 41 (91.1%) | 25 (80.6%) |
| Total | 678 (82.8%) | 678 (79.1%) |
Income Below Poverty Among Married-Couple Families in Kingston
The poverty statistics for married-couple families in Kingston show that 8.8% or 22 of the total 251 families live below the poverty line. Families with 5 or more children have the highest poverty rate of 100.0%, comprising of 5 families. On the other hand, families with no children have the lowest poverty rate of 0.0%, which includes 0 families.
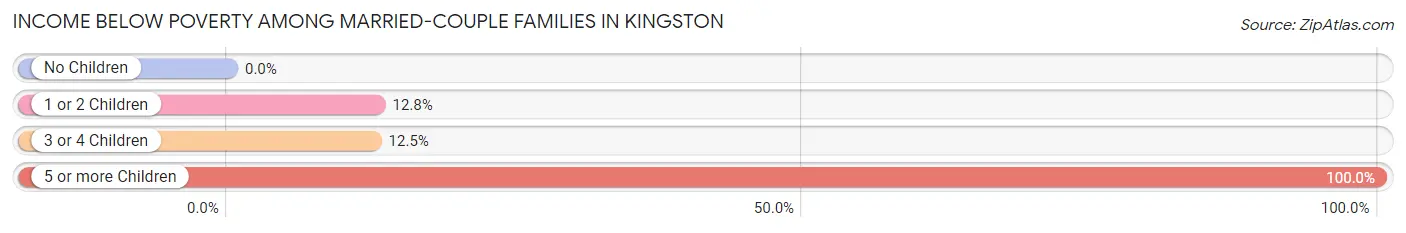
| Children | Above Poverty | Below Poverty |
| No Children | 113 (100.0%) | 0 (0.0%) |
| 1 or 2 Children | 95 (87.2%) | 14 (12.8%) |
| 3 or 4 Children | 21 (87.5%) | 3 (12.5%) |
| 5 or more Children | 0 (0.0%) | 5 (100.0%) |
| Total | 229 (91.2%) | 22 (8.8%) |
Income Below Poverty Among Single-Parent Households in Kingston
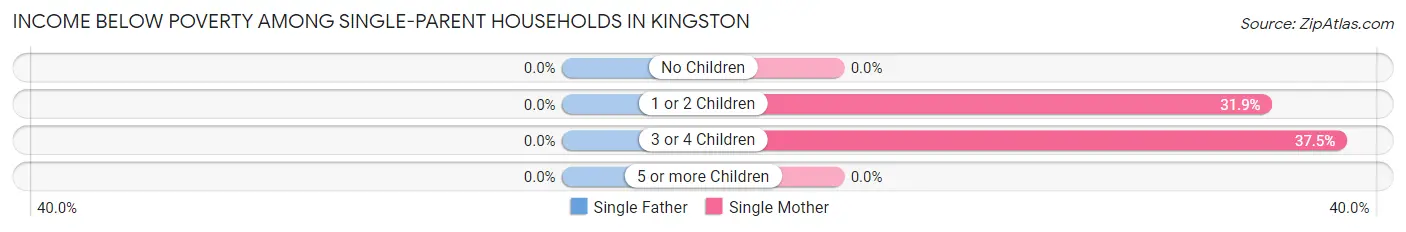
| Children | Single Father | Single Mother |
| No Children | 0 (0.0%) | 0 (0.0%) |
| 1 or 2 Children | 0 (0.0%) | 23 (31.9%) |
| 3 or 4 Children | 0 (0.0%) | 3 (37.5%) |
| 5 or more Children | 0 (0.0%) | 0 (0.0%) |
| Total | 0 (0.0%) | 26 (28.6%) |
Income Below Poverty Among Married-Couple vs Single-Parent Households in Kingston
The poverty data for Kingston shows that 22 of the married-couple family households (8.8%) and 26 of the single-parent households (23.4%) are living below the poverty level. Within the married-couple family households, those with 5 or more children have the highest poverty rate, with 5 households (100.0%) falling below the poverty line. Among the single-parent households, those with 1 or 2 children have the highest poverty rate, with 23 household (28.4%) living below poverty.
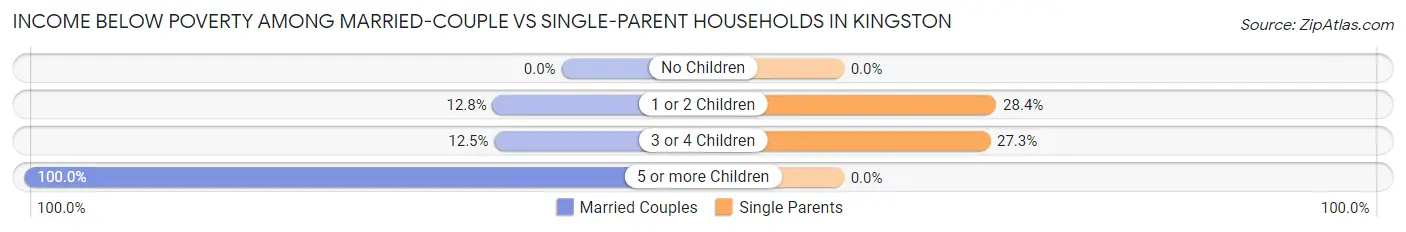
| Children | Married-Couple Families | Single-Parent Households |
| No Children | 0 (0.0%) | 0 (0.0%) |
| 1 or 2 Children | 14 (12.8%) | 23 (28.4%) |
| 3 or 4 Children | 3 (12.5%) | 3 (27.3%) |
| 5 or more Children | 5 (100.0%) | 0 (0.0%) |
| Total | 22 (8.8%) | 26 (23.4%) |
Race in Kingston
The most populous races in Kingston are White / Caucasian (1,367 | 79.2%), Two or more Races (202 | 11.7%), and Native / Alaskan (116 | 6.7%).
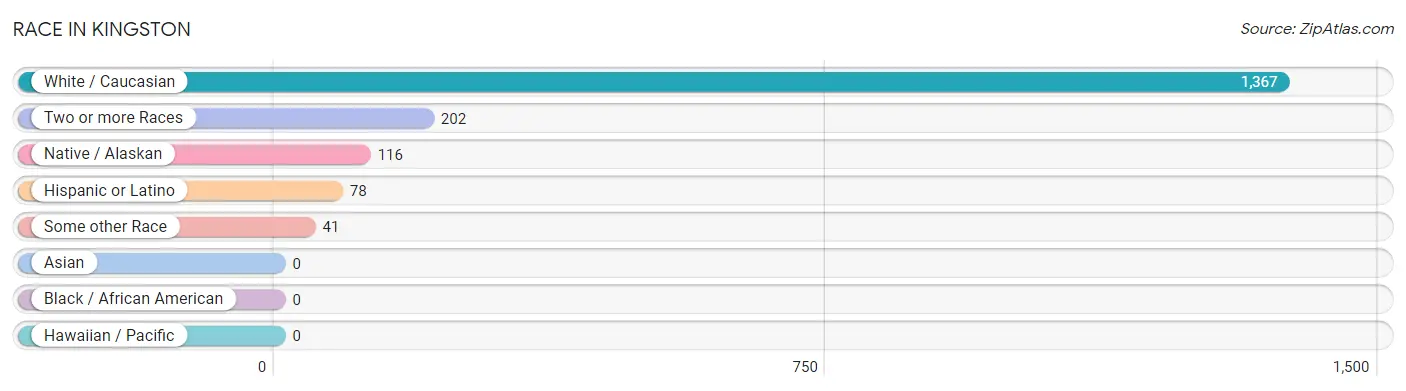
| Race | # Population | % Population |
| Asian | 0 | 0.0% |
| Black / African American | 0 | 0.0% |
| Hawaiian / Pacific | 0 | 0.0% |
| Hispanic or Latino | 78 | 4.5% |
| Native / Alaskan | 116 | 6.7% |
| White / Caucasian | 1,367 | 79.2% |
| Two or more Races | 202 | 11.7% |
| Some other Race | 41 | 2.4% |
| Total | 1,726 | 100.0% |
Ancestry in Kingston
The most populous ancestries reported in Kingston are Irish (293 | 17.0%), German (202 | 11.7%), English (133 | 7.7%), American (115 | 6.7%), and Chickasaw (110 | 6.4%), together accounting for 49.4% of all Kingston residents.
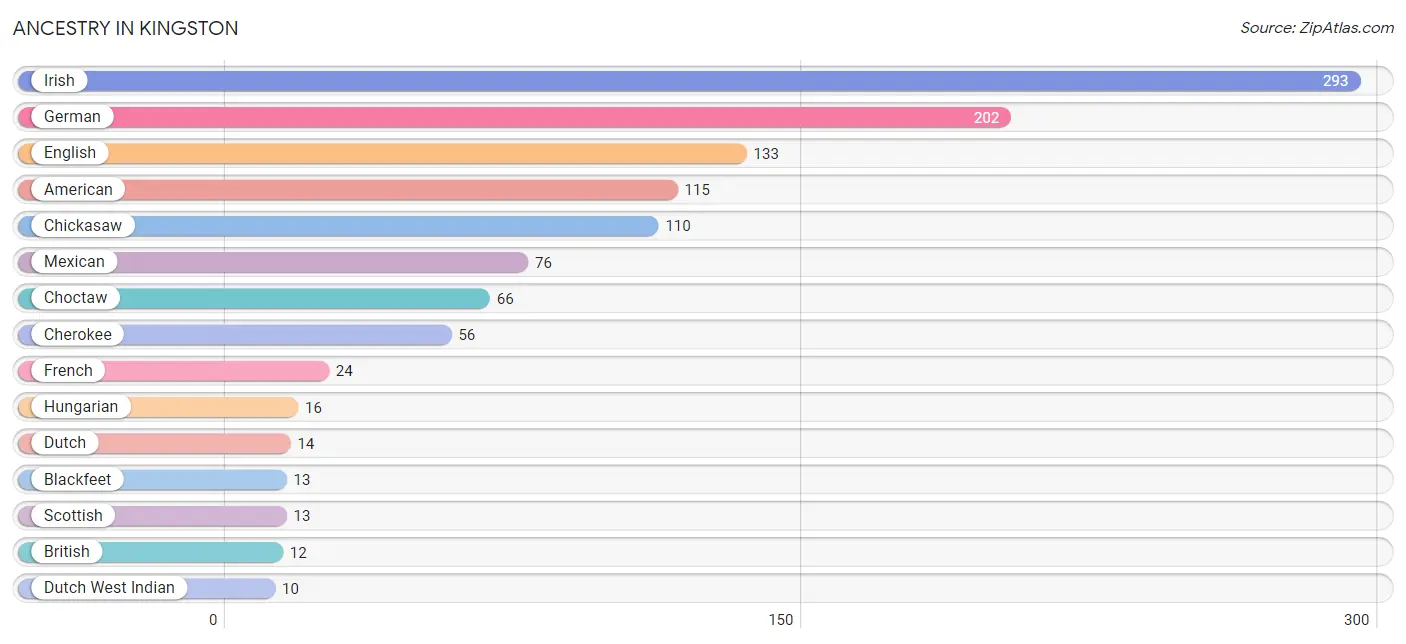
| Ancestry | # Population | % Population |
| American | 115 | 6.7% |
| Apache | 4 | 0.2% |
| Blackfeet | 13 | 0.7% |
| British | 12 | 0.7% |
| Cherokee | 56 | 3.2% |
| Chickasaw | 110 | 6.4% |
| Choctaw | 66 | 3.8% |
| Dutch | 14 | 0.8% |
| Dutch West Indian | 10 | 0.6% |
| English | 133 | 7.7% |
| European | 10 | 0.6% |
| French | 24 | 1.4% |
| German | 202 | 11.7% |
| Hungarian | 16 | 0.9% |
| Irish | 293 | 17.0% |
| Italian | 4 | 0.2% |
| Mexican | 76 | 4.4% |
| Paiute | 8 | 0.5% |
| Polish | 5 | 0.3% |
| Potawatomi | 7 | 0.4% |
| Puerto Rican | 2 | 0.1% |
| Scotch-Irish | 8 | 0.5% |
| Scottish | 13 | 0.7% |
| Shoshone | 8 | 0.5% |
| Sri Lankan | 3 | 0.2% | View All 25 Rows |
Immigrants in Kingston
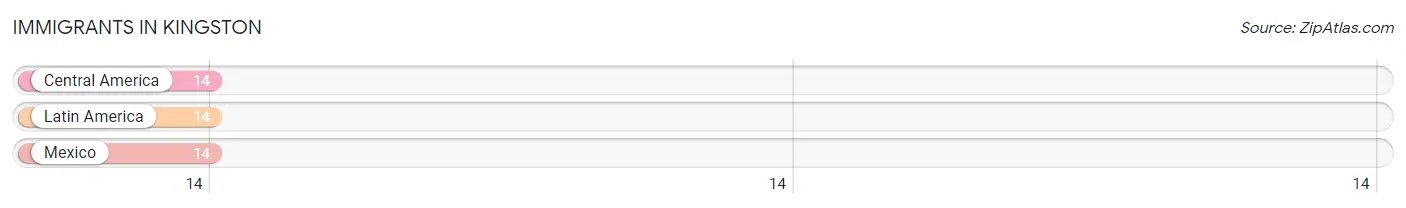
The most numerous immigrant groups reported in Kingston came from Central America (14 | 0.8%), Latin America (14 | 0.8%), and Mexico (14 | 0.8%), together accounting for 2.4% of all Kingston residents.
| Immigration Origin | # Population | % Population |
| Central America | 14 | 0.8% |
| Latin America | 14 | 0.8% |
| Mexico | 14 | 0.8% | View All 3 Rows |
Sex and Age in Kingston
Sex and Age in Kingston
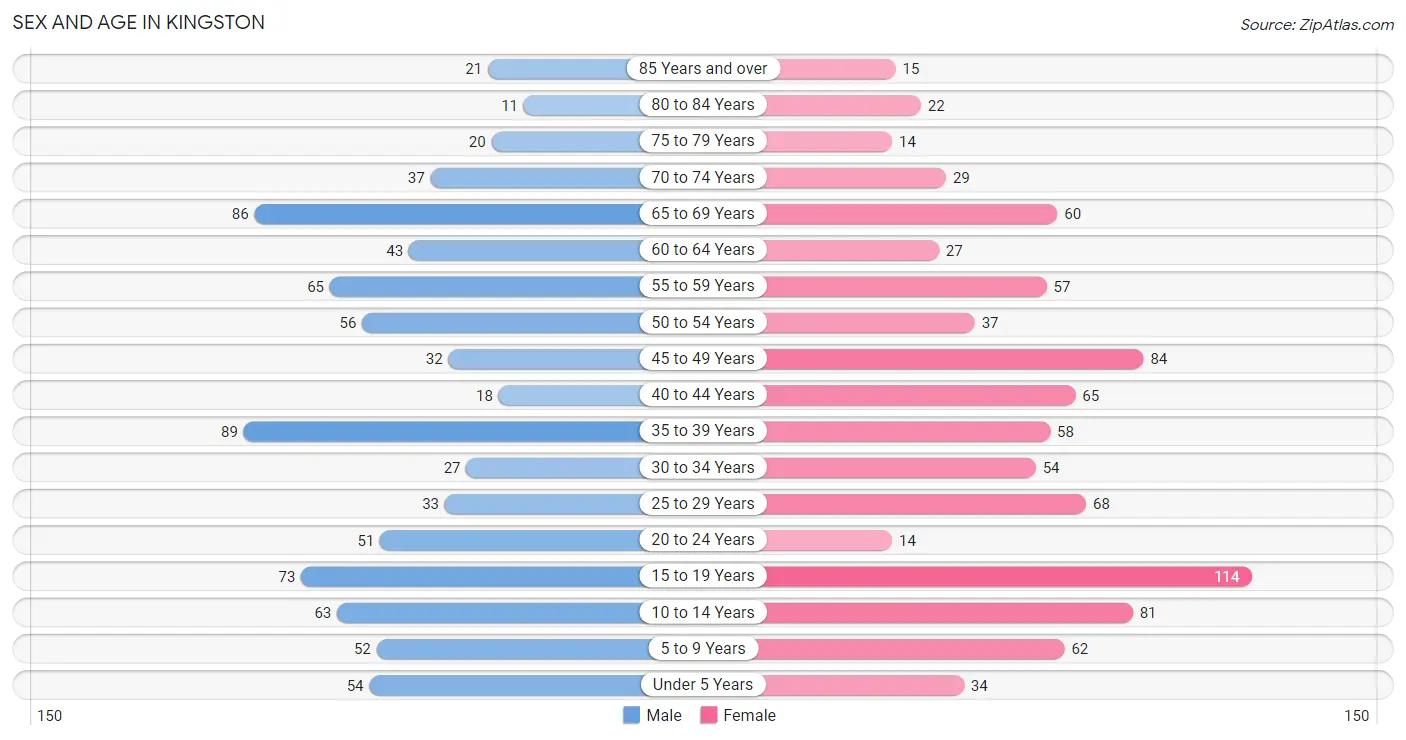
The most populous age groups in Kingston are 35 to 39 Years (89 | 10.7%) for men and 15 to 19 Years (114 | 12.7%) for women.
| Age Bracket | Male | Female |
| Under 5 Years | 54 (6.5%) | 34 (3.8%) |
| 5 to 9 Years | 52 (6.3%) | 62 (6.9%) |
| 10 to 14 Years | 63 (7.6%) | 81 (9.0%) |
| 15 to 19 Years | 73 (8.8%) | 114 (12.7%) |
| 20 to 24 Years | 51 (6.1%) | 14 (1.6%) |
| 25 to 29 Years | 33 (4.0%) | 68 (7.6%) |
| 30 to 34 Years | 27 (3.3%) | 54 (6.0%) |
| 35 to 39 Years | 89 (10.7%) | 58 (6.5%) |
| 40 to 44 Years | 18 (2.2%) | 65 (7.3%) |
| 45 to 49 Years | 32 (3.8%) | 84 (9.4%) |
| 50 to 54 Years | 56 (6.7%) | 37 (4.1%) |
| 55 to 59 Years | 65 (7.8%) | 57 (6.4%) |
| 60 to 64 Years | 43 (5.2%) | 27 (3.0%) |
| 65 to 69 Years | 86 (10.3%) | 60 (6.7%) |
| 70 to 74 Years | 37 (4.4%) | 29 (3.2%) |
| 75 to 79 Years | 20 (2.4%) | 14 (1.6%) |
| 80 to 84 Years | 11 (1.3%) | 22 (2.5%) |
| 85 Years and over | 21 (2.5%) | 15 (1.7%) |
| Total | 831 (100.0%) | 895 (100.0%) |
Families and Households in Kingston
Median Family Size in Kingston
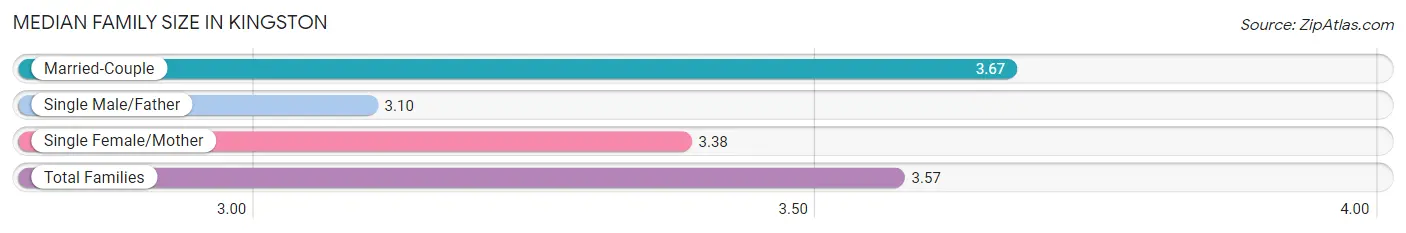
The median family size in Kingston is 3.57 persons per family, with married-couple families (251 | 69.3%) accounting for the largest median family size of 3.67 persons per family. On the other hand, single male/father families (20 | 5.5%) represent the smallest median family size with 3.10 persons per family.
| Family Type | # Families | Family Size |
| Married-Couple | 251 (69.3%) | 3.67 |
| Single Male/Father | 20 (5.5%) | 3.10 |
| Single Female/Mother | 91 (25.1%) | 3.38 |
| Total Families | 362 (100.0%) | 3.57 |
Median Household Size in Kingston
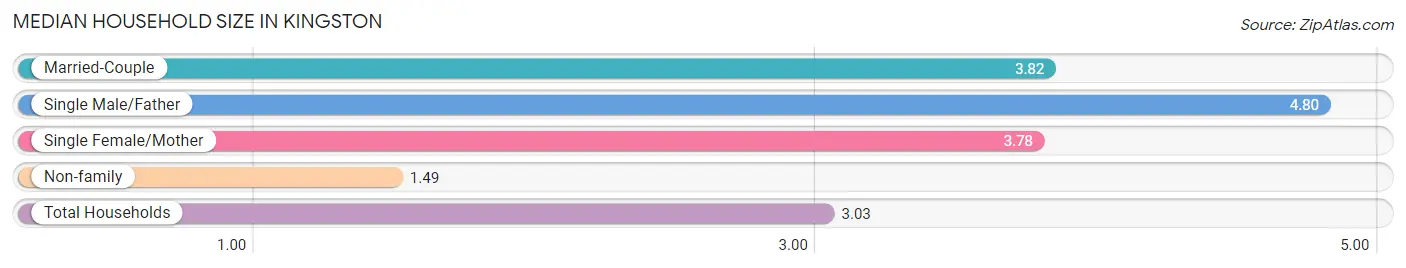
The median household size in Kingston is 3.03 persons per household, with single male/father households (20 | 3.6%) accounting for the largest median household size of 4.8 persons per household. non-family households (198 | 35.4%) represent the smallest median household size with 1.49 persons per household.
| Household Type | # Households | Household Size |
| Married-Couple | 251 (44.8%) | 3.82 |
| Single Male/Father | 20 (3.6%) | 4.80 |
| Single Female/Mother | 91 (16.3%) | 3.78 |
| Non-family | 198 (35.4%) | 1.49 |
| Total Households | 560 (100.0%) | 3.03 |
Household Size by Marriage Status in Kingston
Out of a total of 560 households in Kingston, 362 (64.6%) are family households, while 198 (35.4%) are nonfamily households. The most numerous type of family households are 2-person households, comprising 124, and the most common type of nonfamily households are 1-person households, comprising 172.
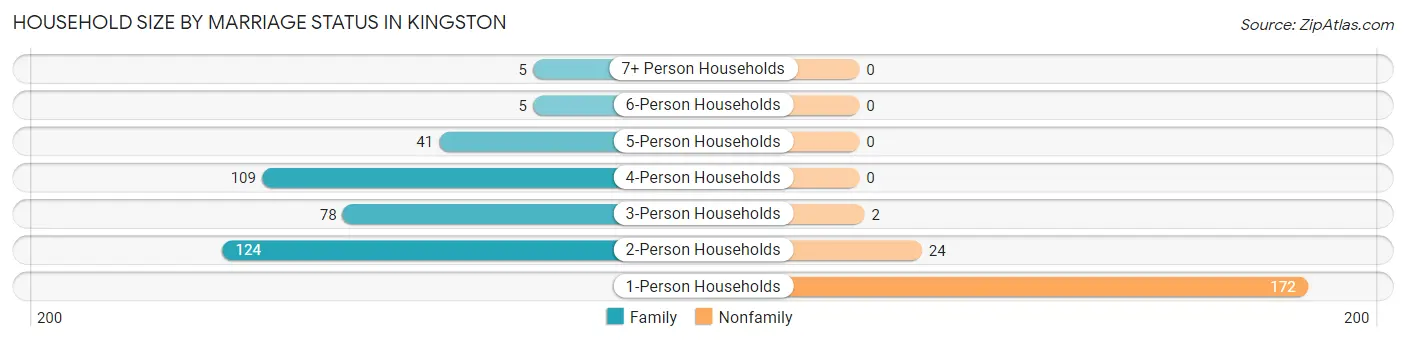
| Household Size | Family Households | Nonfamily Households |
| 1-Person Households | - | 172 (30.7%) |
| 2-Person Households | 124 (22.1%) | 24 (4.3%) |
| 3-Person Households | 78 (13.9%) | 2 (0.4%) |
| 4-Person Households | 109 (19.5%) | 0 (0.0%) |
| 5-Person Households | 41 (7.3%) | 0 (0.0%) |
| 6-Person Households | 5 (0.9%) | 0 (0.0%) |
| 7+ Person Households | 5 (0.9%) | 0 (0.0%) |
| Total | 362 (64.6%) | 198 (35.4%) |
Female Fertility in Kingston
Fertility by Age in Kingston
Average fertility rate in Kingston is 8.0 births per 1,000 women. Women in the age bracket of 20 to 34 years have the highest fertility rate with 29.0 births per 1,000 women. Women in the age bracket of 20 to 34 years acount for 100.0% of all women with births.
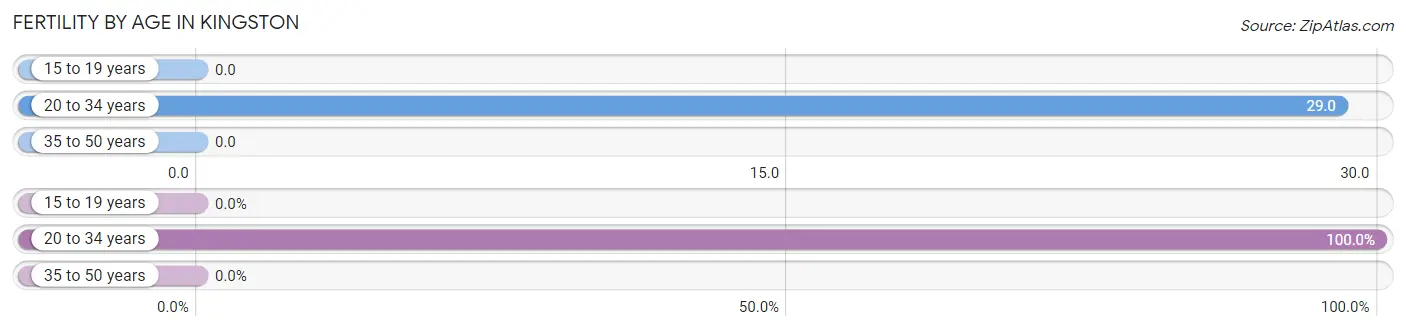
| Age Bracket | Women with Births | Births / 1,000 Women |
| 15 to 19 years | 0 (0.0%) | 0.0 |
| 20 to 34 years | 4 (100.0%) | 29.0 |
| 35 to 50 years | 0 (0.0%) | 0.0 |
| Total | 4 (100.0%) | 8.0 |
Fertility by Age by Marriage Status in Kingston
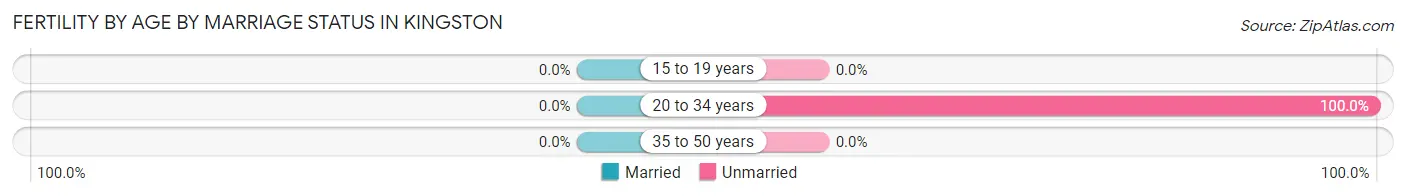
| Age Bracket | Married | Unmarried |
| 15 to 19 years | 0 (0.0%) | 0 (0.0%) |
| 20 to 34 years | 0 (0.0%) | 4 (100.0%) |
| 35 to 50 years | 0 (0.0%) | 0 (0.0%) |
| Total | 0 (0.0%) | 4 (100.0%) |
Fertility by Education in Kingston
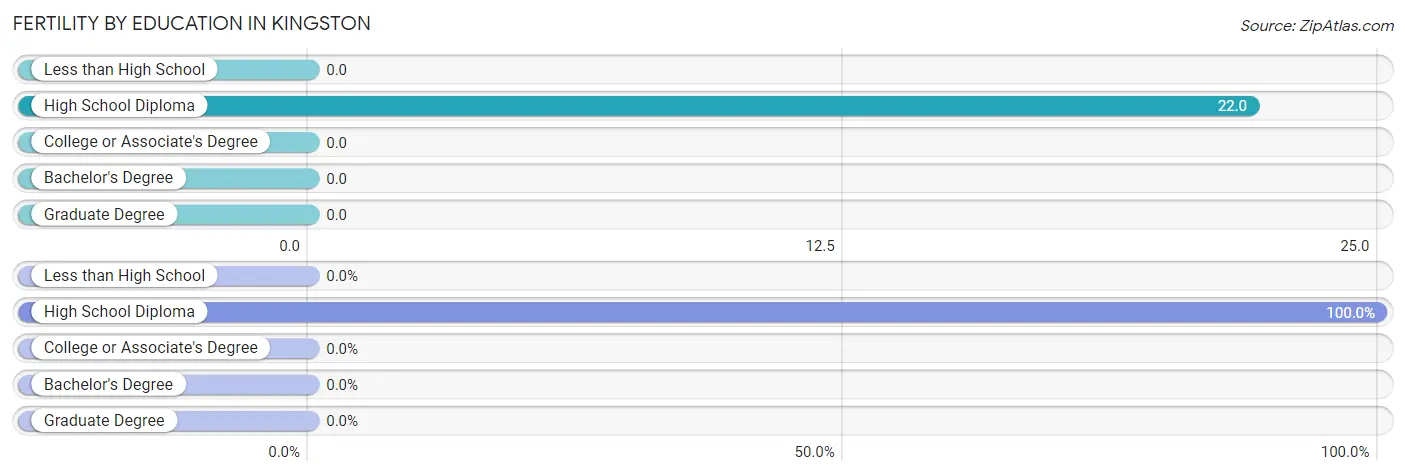
| Educational Attainment | Women with Births | Births / 1,000 Women |
| Less than High School | 0 (0.0%) | 0.0 |
| High School Diploma | 4 (100.0%) | 22.0 |
| College or Associate's Degree | 0 (0.0%) | 0.0 |
| Bachelor's Degree | 0 (0.0%) | 0.0 |
| Graduate Degree | 0 (0.0%) | 0.0 |
| Total | 4 (100.0%) | 8.0 |
Fertility by Education by Marriage Status in Kingston
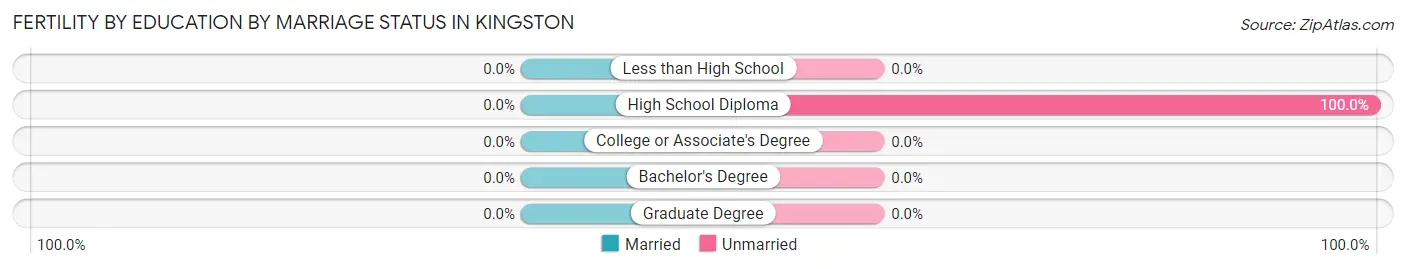
| Educational Attainment | Married | Unmarried |
| Less than High School | 0 (0.0%) | 0 (0.0%) |
| High School Diploma | 0 (0.0%) | 4 (100.0%) |
| College or Associate's Degree | 0 (0.0%) | 0 (0.0%) |
| Bachelor's Degree | 0 (0.0%) | 0 (0.0%) |
| Graduate Degree | 0 (0.0%) | 0 (0.0%) |
| Total | 0 (0.0%) | 4 (100.0%) |
Employment Characteristics in Kingston
Employment by Class of Employer in Kingston
Among the 695 employed individuals in Kingston, private company employees (490 | 70.5%), state government employees (106 | 15.2%), and federal government employees (33 | 4.8%) make up the most common classes of employment.
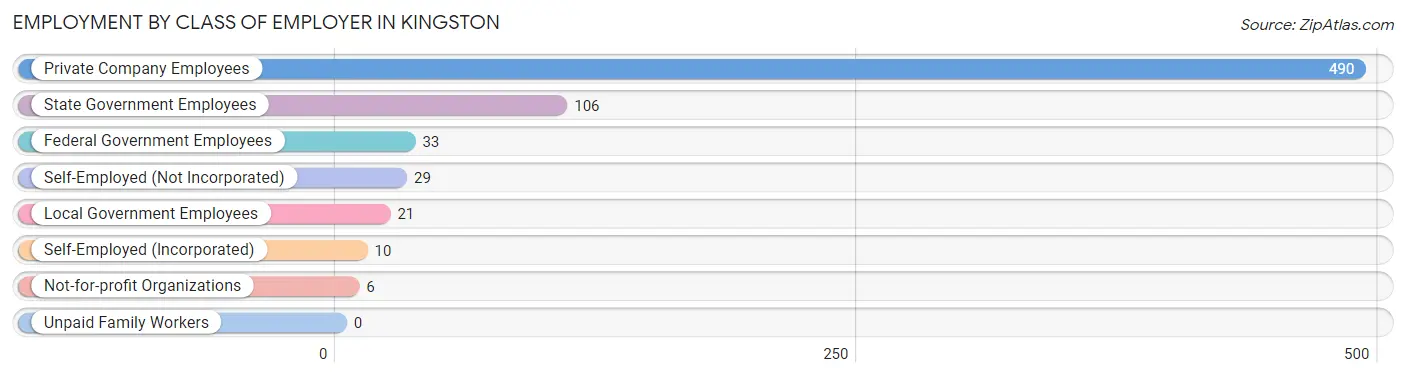
| Employer Class | # Employees | % Employees |
| Private Company Employees | 490 | 70.5% |
| Self-Employed (Incorporated) | 10 | 1.4% |
| Self-Employed (Not Incorporated) | 29 | 4.2% |
| Not-for-profit Organizations | 6 | 0.9% |
| Local Government Employees | 21 | 3.0% |
| State Government Employees | 106 | 15.2% |
| Federal Government Employees | 33 | 4.8% |
| Unpaid Family Workers | 0 | 0.0% |
| Total | 695 | 100.0% |
Employment Status by Age in Kingston
According to the labor force statistics for Kingston, out of the total population over 16 years of age (1,306), 56.3% or 735 individuals are in the labor force, with 4.2% or 31 of them unemployed. The age group with the highest labor force participation rate is 25 to 29 years, with 81.2% or 82 individuals in the labor force. Within the labor force, the 60 to 64 years age range has the highest percentage of unemployed individuals, with 33.3% or 9 of them being unemployed.
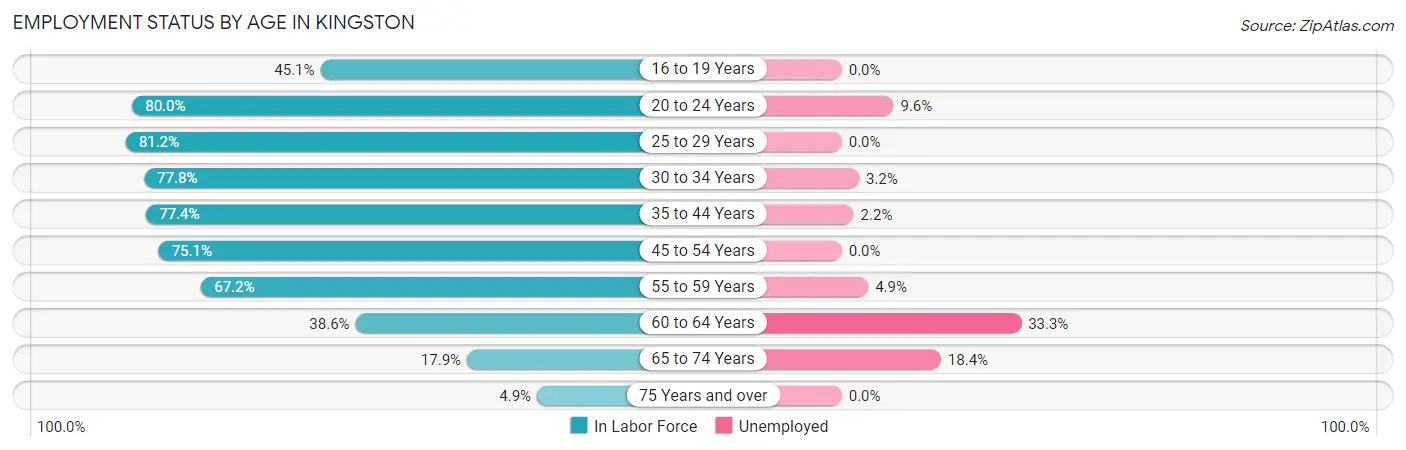
| Age Bracket | In Labor Force | Unemployed |
| 16 to 19 Years | 51 (45.1%) | 0 (0.0%) |
| 20 to 24 Years | 52 (80.0%) | 5 (9.6%) |
| 25 to 29 Years | 82 (81.2%) | 0 (0.0%) |
| 30 to 34 Years | 63 (77.8%) | 2 (3.2%) |
| 35 to 44 Years | 178 (77.4%) | 4 (2.2%) |
| 45 to 54 Years | 157 (75.1%) | 0 (0.0%) |
| 55 to 59 Years | 82 (67.2%) | 4 (4.9%) |
| 60 to 64 Years | 27 (38.6%) | 9 (33.3%) |
| 65 to 74 Years | 38 (17.9%) | 7 (18.4%) |
| 75 Years and over | 5 (4.9%) | 0 (0.0%) |
| Total | 735 (56.3%) | 31 (4.2%) |
Employment Status by Educational Attainment in Kingston
According to labor force statistics for Kingston, 72.4% of individuals (589) out of the total population between 25 and 64 years of age (813) are in the labor force, with 3.2% or 19 of them being unemployed. The group with the highest labor force participation rate are those with the educational attainment of bachelor's degree or higher, with 91.9% or 57 individuals in the labor force. Within the labor force, individuals with college / associate degree education have the highest percentage of unemployment, with 4.6% or 10 of them being unemployed.
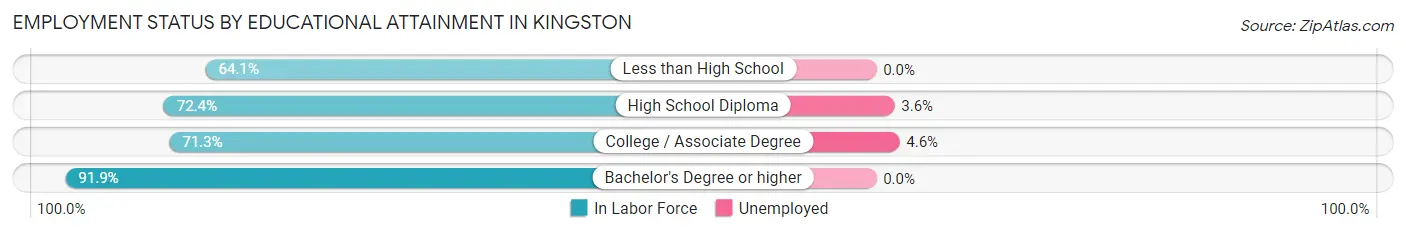
| Educational Attainment | In Labor Force | Unemployed |
| Less than High School | 66 (64.1%) | 0 (0.0%) |
| High School Diploma | 247 (72.4%) | 12 (3.6%) |
| College / Associate Degree | 219 (71.3%) | 14 (4.6%) |
| Bachelor's Degree or higher | 57 (91.9%) | 0 (0.0%) |
| Total | 589 (72.4%) | 26 (3.2%) |
Employment Occupations by Sex in Kingston
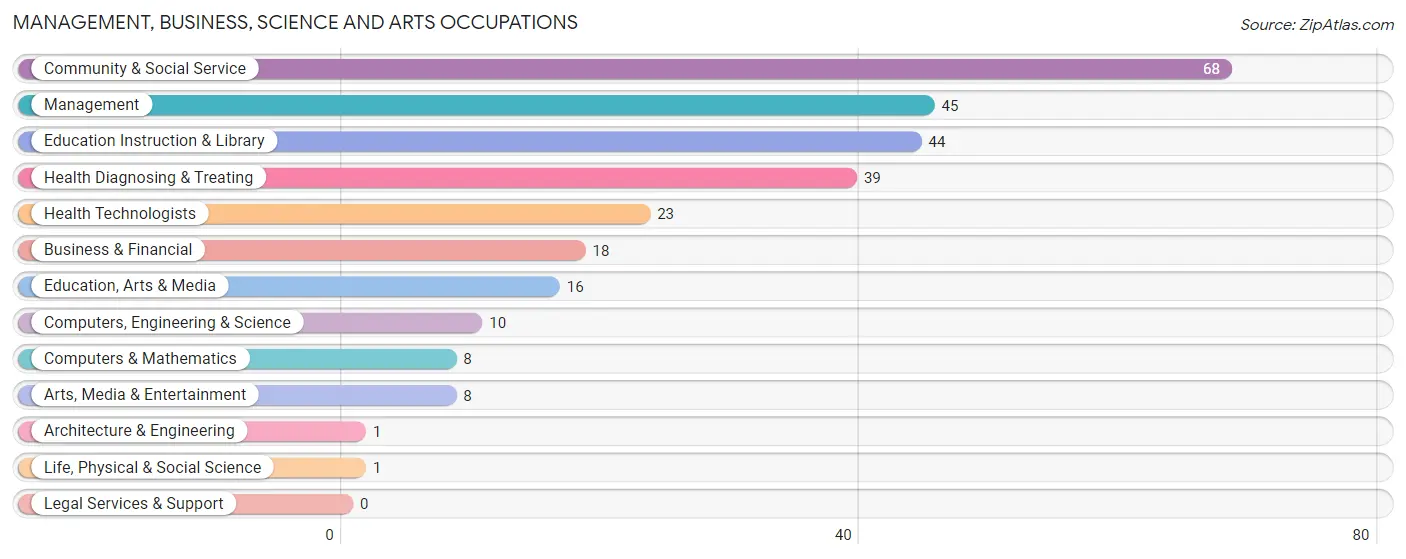
Management, Business, Science and Arts Occupations
The most common Management, Business, Science and Arts occupations in Kingston are Community & Social Service (68 | 9.7%), Management (45 | 6.4%), Education Instruction & Library (44 | 6.2%), Health Diagnosing & Treating (39 | 5.5%), and Health Technologists (23 | 3.3%).
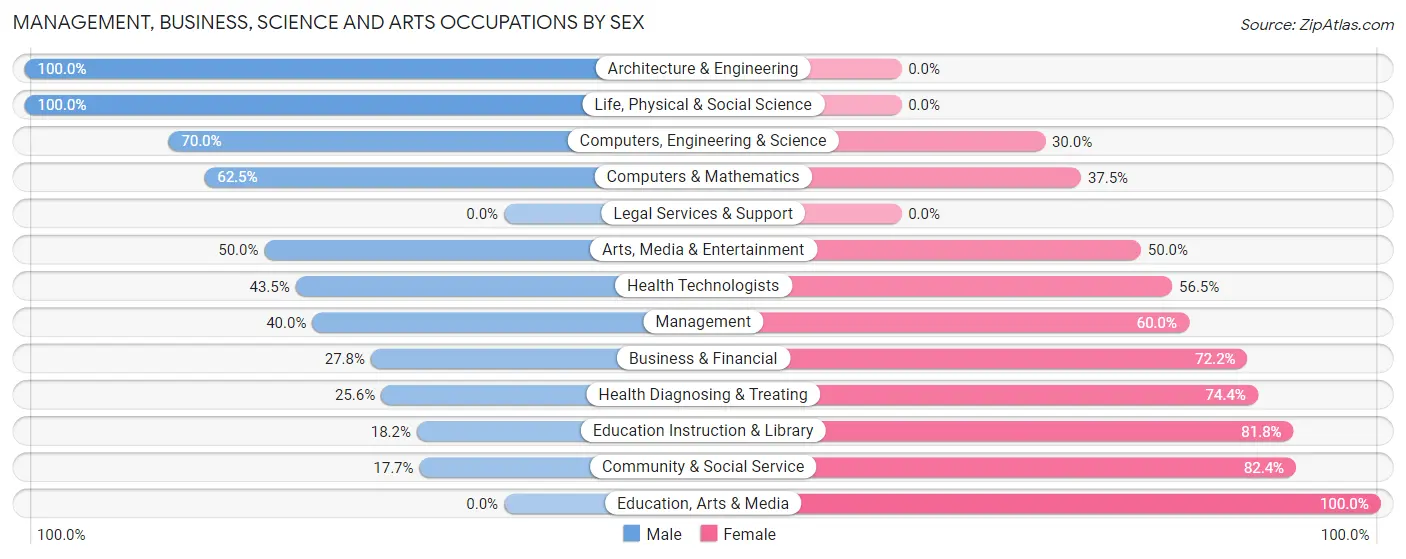
Management, Business, Science and Arts Occupations by Sex
Within the Management, Business, Science and Arts occupations in Kingston, the most male-oriented occupations are Architecture & Engineering (100.0%), Life, Physical & Social Science (100.0%), and Computers, Engineering & Science (70.0%), while the most female-oriented occupations are Education, Arts & Media (100.0%), Community & Social Service (82.4%), and Education Instruction & Library (81.8%).
| Occupation | Male | Female |
| Management | 18 (40.0%) | 27 (60.0%) |
| Business & Financial | 5 (27.8%) | 13 (72.2%) |
| Computers, Engineering & Science | 7 (70.0%) | 3 (30.0%) |
| Computers & Mathematics | 5 (62.5%) | 3 (37.5%) |
| Architecture & Engineering | 1 (100.0%) | 0 (0.0%) |
| Life, Physical & Social Science | 1 (100.0%) | 0 (0.0%) |
| Community & Social Service | 12 (17.6%) | 56 (82.4%) |
| Education, Arts & Media | 0 (0.0%) | 16 (100.0%) |
| Legal Services & Support | 0 (0.0%) | 0 (0.0%) |
| Education Instruction & Library | 8 (18.2%) | 36 (81.8%) |
| Arts, Media & Entertainment | 4 (50.0%) | 4 (50.0%) |
| Health Diagnosing & Treating | 10 (25.6%) | 29 (74.4%) |
| Health Technologists | 10 (43.5%) | 13 (56.5%) |
| Total (Category) | 52 (28.9%) | 128 (71.1%) |
| Total (Overall) | 357 (50.7%) | 347 (49.3%) |
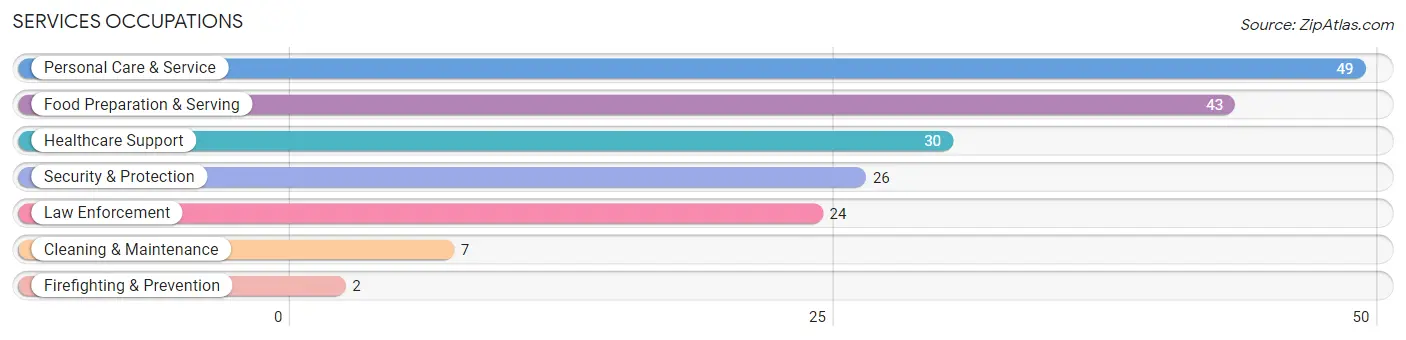
Services Occupations
The most common Services occupations in Kingston are Personal Care & Service (49 | 7.0%), Food Preparation & Serving (43 | 6.1%), Healthcare Support (30 | 4.3%), Security & Protection (26 | 3.7%), and Law Enforcement (24 | 3.4%).
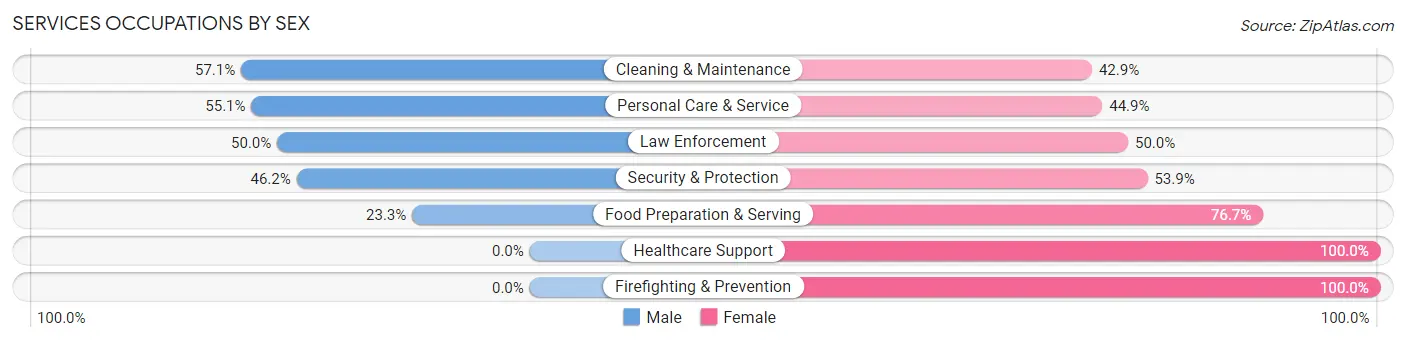
Services Occupations by Sex
Within the Services occupations in Kingston, the most male-oriented occupations are Cleaning & Maintenance (57.1%), Personal Care & Service (55.1%), and Law Enforcement (50.0%), while the most female-oriented occupations are Healthcare Support (100.0%), Firefighting & Prevention (100.0%), and Food Preparation & Serving (76.7%).
| Occupation | Male | Female |
| Healthcare Support | 0 (0.0%) | 30 (100.0%) |
| Security & Protection | 12 (46.2%) | 14 (53.8%) |
| Firefighting & Prevention | 0 (0.0%) | 2 (100.0%) |
| Law Enforcement | 12 (50.0%) | 12 (50.0%) |
| Food Preparation & Serving | 10 (23.3%) | 33 (76.7%) |
| Cleaning & Maintenance | 4 (57.1%) | 3 (42.9%) |
| Personal Care & Service | 27 (55.1%) | 22 (44.9%) |
| Total (Category) | 53 (34.2%) | 102 (65.8%) |
| Total (Overall) | 357 (50.7%) | 347 (49.3%) |
Sales and Office Occupations
The most common Sales and Office occupations in Kingston are Office & Administration (51 | 7.2%), and Sales & Related (46 | 6.5%).
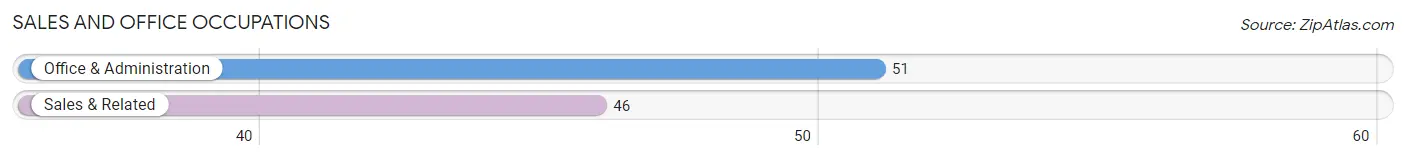
Sales and Office Occupations by Sex
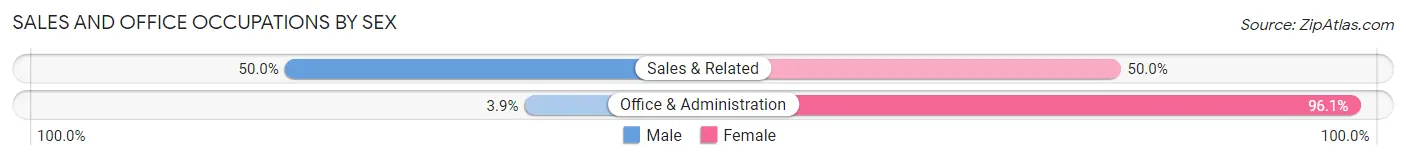
| Occupation | Male | Female |
| Sales & Related | 23 (50.0%) | 23 (50.0%) |
| Office & Administration | 2 (3.9%) | 49 (96.1%) |
| Total (Category) | 25 (25.8%) | 72 (74.2%) |
| Total (Overall) | 357 (50.7%) | 347 (49.3%) |
Natural Resources, Construction and Maintenance Occupations
The most common Natural Resources, Construction and Maintenance occupations in Kingston are Installation, Maintenance & Repair (47 | 6.7%), and Construction & Extraction (28 | 4.0%).
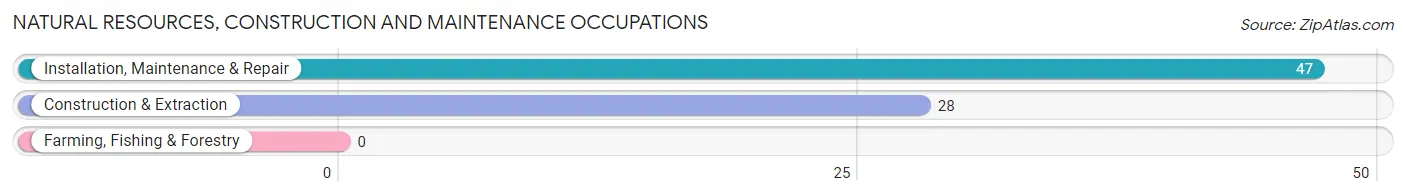
Natural Resources, Construction and Maintenance Occupations by Sex
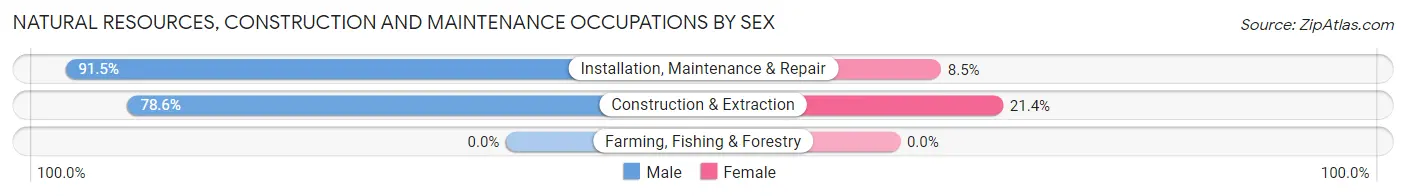
| Occupation | Male | Female |
| Farming, Fishing & Forestry | 0 (0.0%) | 0 (0.0%) |
| Construction & Extraction | 22 (78.6%) | 6 (21.4%) |
| Installation, Maintenance & Repair | 43 (91.5%) | 4 (8.5%) |
| Total (Category) | 65 (86.7%) | 10 (13.3%) |
| Total (Overall) | 357 (50.7%) | 347 (49.3%) |
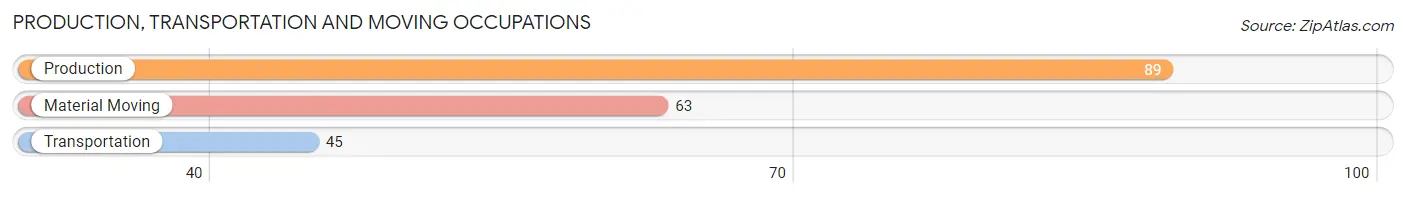
Production, Transportation and Moving Occupations
The most common Production, Transportation and Moving occupations in Kingston are Production (89 | 12.6%), Material Moving (63 | 8.9%), and Transportation (45 | 6.4%).
Production, Transportation and Moving Occupations by Sex
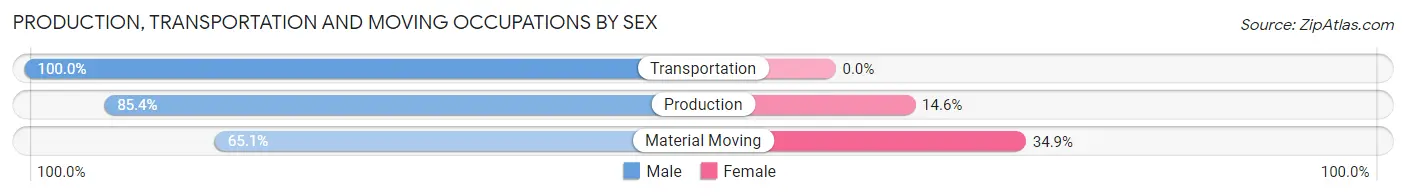
| Occupation | Male | Female |
| Production | 76 (85.4%) | 13 (14.6%) |
| Transportation | 45 (100.0%) | 0 (0.0%) |
| Material Moving | 41 (65.1%) | 22 (34.9%) |
| Total (Category) | 162 (82.2%) | 35 (17.8%) |
| Total (Overall) | 357 (50.7%) | 347 (49.3%) |
Employment Industries by Sex in Kingston
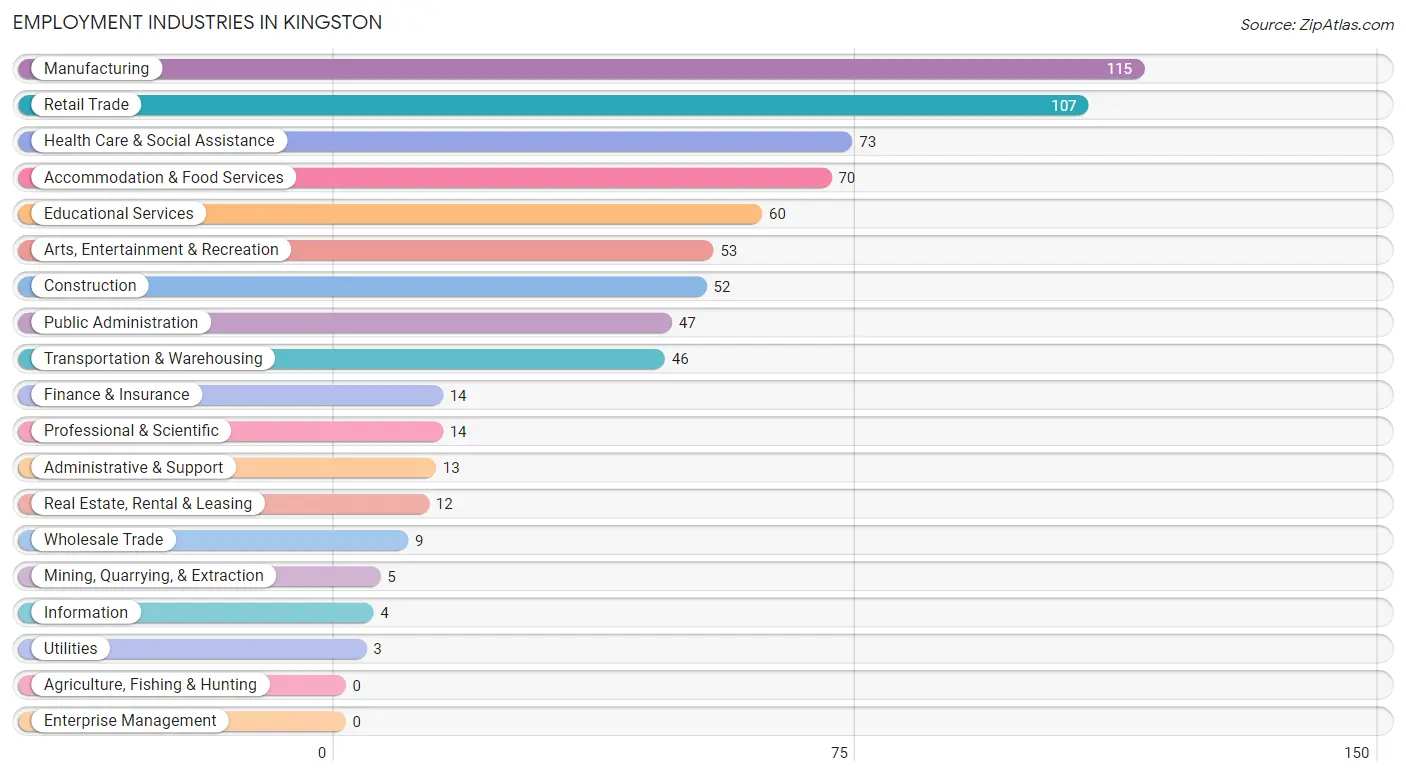
Employment Industries in Kingston
The major employment industries in Kingston include Manufacturing (115 | 16.3%), Retail Trade (107 | 15.2%), Health Care & Social Assistance (73 | 10.4%), Accommodation & Food Services (70 | 9.9%), and Educational Services (60 | 8.5%).
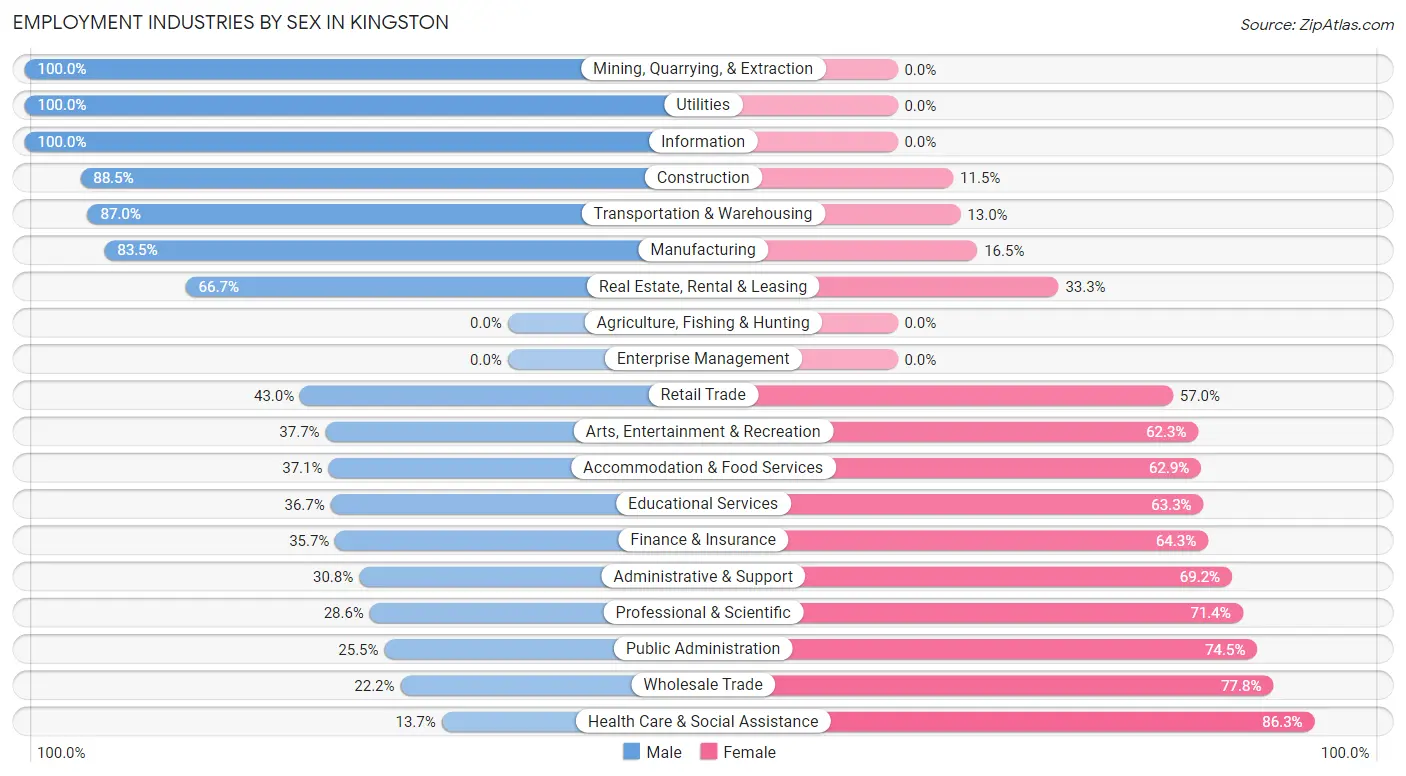
Employment Industries by Sex in Kingston
The Kingston industries that see more men than women are Mining, Quarrying, & Extraction (100.0%), Utilities (100.0%), and Information (100.0%), whereas the industries that tend to have a higher number of women are Health Care & Social Assistance (86.3%), Wholesale Trade (77.8%), and Public Administration (74.5%).
| Industry | Male | Female |
| Agriculture, Fishing & Hunting | 0 (0.0%) | 0 (0.0%) |
| Mining, Quarrying, & Extraction | 5 (100.0%) | 0 (0.0%) |
| Construction | 46 (88.5%) | 6 (11.5%) |
| Manufacturing | 96 (83.5%) | 19 (16.5%) |
| Wholesale Trade | 2 (22.2%) | 7 (77.8%) |
| Retail Trade | 46 (43.0%) | 61 (57.0%) |
| Transportation & Warehousing | 40 (87.0%) | 6 (13.0%) |
| Utilities | 3 (100.0%) | 0 (0.0%) |
| Information | 4 (100.0%) | 0 (0.0%) |
| Finance & Insurance | 5 (35.7%) | 9 (64.3%) |
| Real Estate, Rental & Leasing | 8 (66.7%) | 4 (33.3%) |
| Professional & Scientific | 4 (28.6%) | 10 (71.4%) |
| Enterprise Management | 0 (0.0%) | 0 (0.0%) |
| Administrative & Support | 4 (30.8%) | 9 (69.2%) |
| Educational Services | 22 (36.7%) | 38 (63.3%) |
| Health Care & Social Assistance | 10 (13.7%) | 63 (86.3%) |
| Arts, Entertainment & Recreation | 20 (37.7%) | 33 (62.3%) |
| Accommodation & Food Services | 26 (37.1%) | 44 (62.9%) |
| Public Administration | 12 (25.5%) | 35 (74.5%) |
| Total | 357 (50.7%) | 347 (49.3%) |
Education in Kingston
School Enrollment in Kingston
The most common levels of schooling among the 421 students in Kingston are high school (151 | 35.9%), elementary school (106 | 25.2%), and middle school (101 | 24.0%).
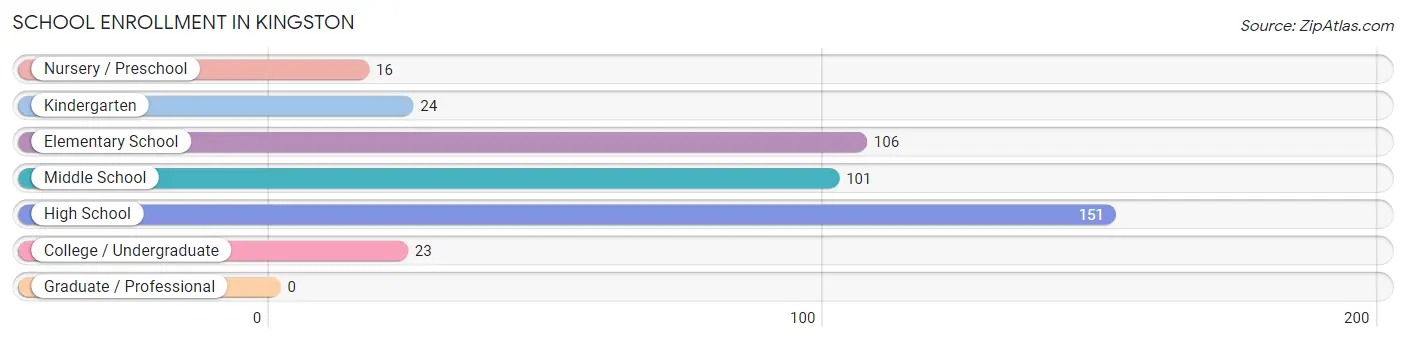
| School Level | # Students | % Students |
| Nursery / Preschool | 16 | 3.8% |
| Kindergarten | 24 | 5.7% |
| Elementary School | 106 | 25.2% |
| Middle School | 101 | 24.0% |
| High School | 151 | 35.9% |
| College / Undergraduate | 23 | 5.5% |
| Graduate / Professional | 0 | 0.0% |
| Total | 421 | 100.0% |
School Enrollment by Age by Funding Source in Kingston
Out of a total of 421 students who are enrolled in schools in Kingston, 12 (2.9%) attend a private institution, while the remaining 409 (97.1%) are enrolled in public schools. The age group of 15 to 17 year olds has the highest likelihood of being enrolled in private schools, with 6 (4.6% in the age bracket) enrolled. Conversely, the age group of 3 to 4 year olds has the lowest likelihood of being enrolled in a private school, with 13 (100.0% in the age bracket) attending a public institution.
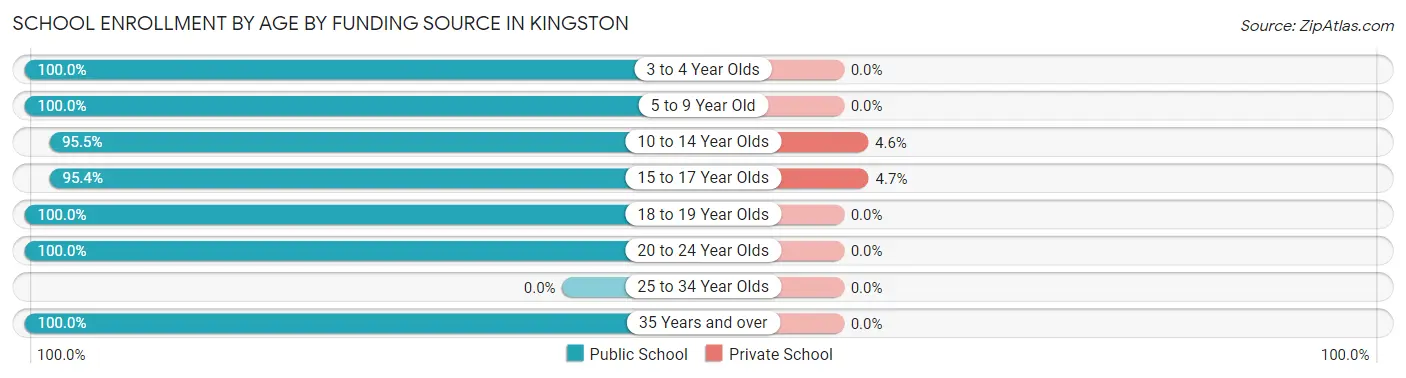
| Age Bracket | Public School | Private School |
| 3 to 4 Year Olds | 13 (100.0%) | 0 (0.0%) |
| 5 to 9 Year Old | 114 (100.0%) | 0 (0.0%) |
| 10 to 14 Year Olds | 126 (95.5%) | 6 (4.5%) |
| 15 to 17 Year Olds | 123 (95.4%) | 6 (4.6%) |
| 18 to 19 Year Olds | 22 (100.0%) | 0 (0.0%) |
| 20 to 24 Year Olds | 9 (100.0%) | 0 (0.0%) |
| 25 to 34 Year Olds | 0 (0.0%) | 0 (0.0%) |
| 35 Years and over | 2 (100.0%) | 0 (0.0%) |
| Total | 409 (97.1%) | 12 (2.9%) |
Educational Attainment by Field of Study in Kingston
Education (32 | 31.7%), science & technology (24 | 23.8%), physical & health sciences (13 | 12.9%), business (9 | 8.9%), and bio, nature & agricultural (5 | 5.0%) are the most common fields of study among 101 individuals in Kingston who have obtained a bachelor's degree or higher.
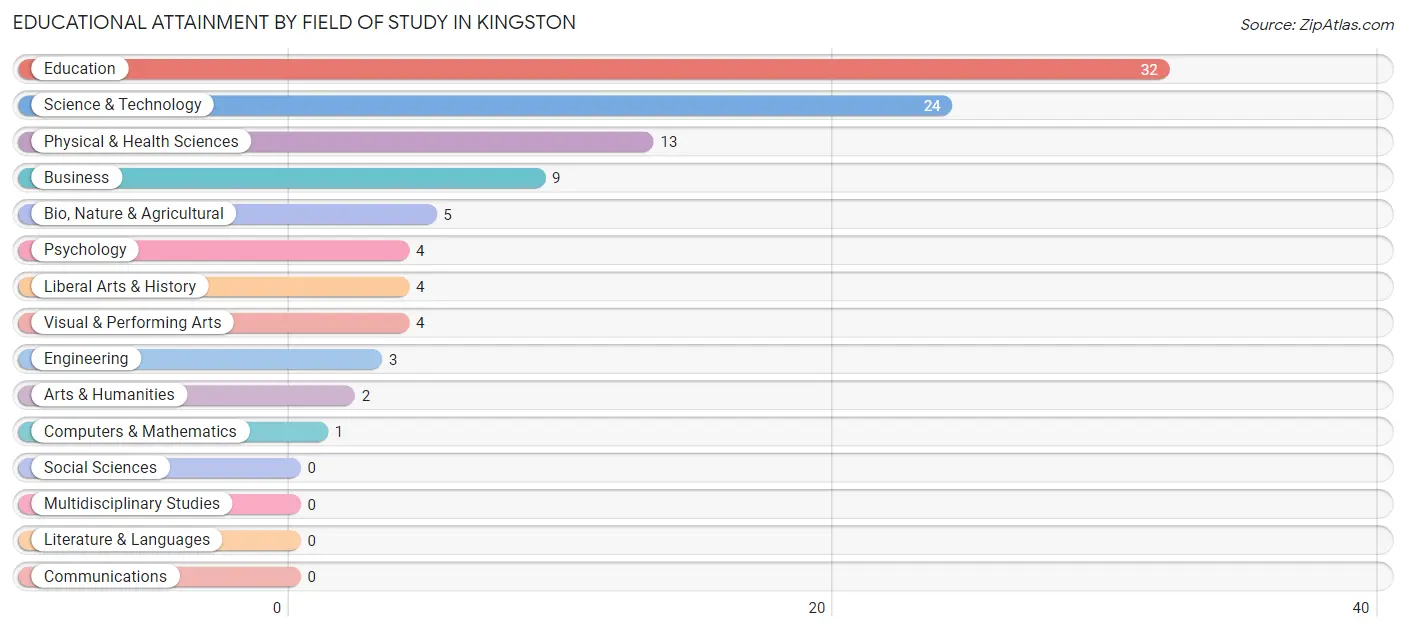
| Field of Study | # Graduates | % Graduates |
| Computers & Mathematics | 1 | 1.0% |
| Bio, Nature & Agricultural | 5 | 5.0% |
| Physical & Health Sciences | 13 | 12.9% |
| Psychology | 4 | 4.0% |
| Social Sciences | 0 | 0.0% |
| Engineering | 3 | 3.0% |
| Multidisciplinary Studies | 0 | 0.0% |
| Science & Technology | 24 | 23.8% |
| Business | 9 | 8.9% |
| Education | 32 | 31.7% |
| Literature & Languages | 0 | 0.0% |
| Liberal Arts & History | 4 | 4.0% |
| Visual & Performing Arts | 4 | 4.0% |
| Communications | 0 | 0.0% |
| Arts & Humanities | 2 | 2.0% |
| Total | 101 | 100.0% |
Transportation & Commute in Kingston
Vehicle Availability by Sex in Kingston
The most prevalent vehicle ownership categories in Kingston are males with 3 vehicles (126, accounting for 35.3%) and females with 3 vehicles (104, making up 37.3%).
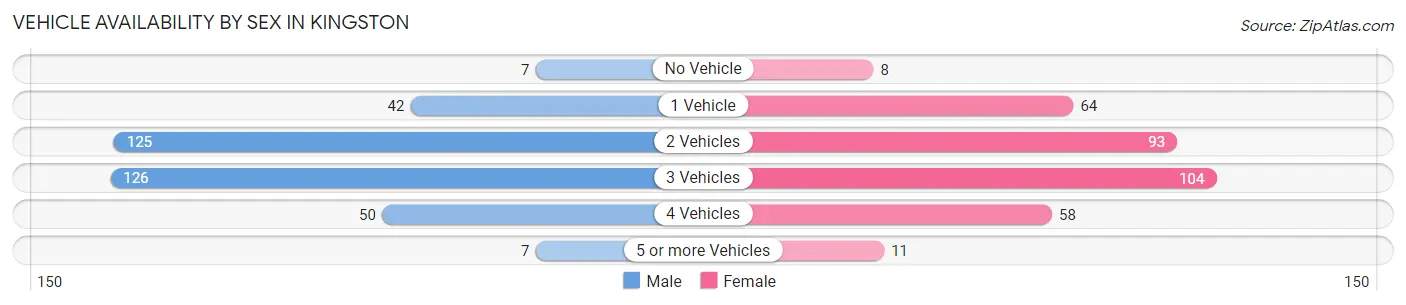
| Vehicles Available | Male | Female |
| No Vehicle | 7 (2.0%) | 8 (2.4%) |
| 1 Vehicle | 42 (11.8%) | 64 (18.9%) |
| 2 Vehicles | 125 (35.0%) | 93 (27.5%) |
| 3 Vehicles | 126 (35.3%) | 104 (30.8%) |
| 4 Vehicles | 50 (14.0%) | 58 (17.2%) |
| 5 or more Vehicles | 7 (2.0%) | 11 (3.3%) |
| Total | 357 (100.0%) | 338 (100.0%) |
Commute Time in Kingston
The most frequently occuring commute durations in Kingston are 5 to 9 minutes (129 commuters, 19.1%), 10 to 14 minutes (124 commuters, 18.4%), and 15 to 19 minutes (95 commuters, 14.1%).
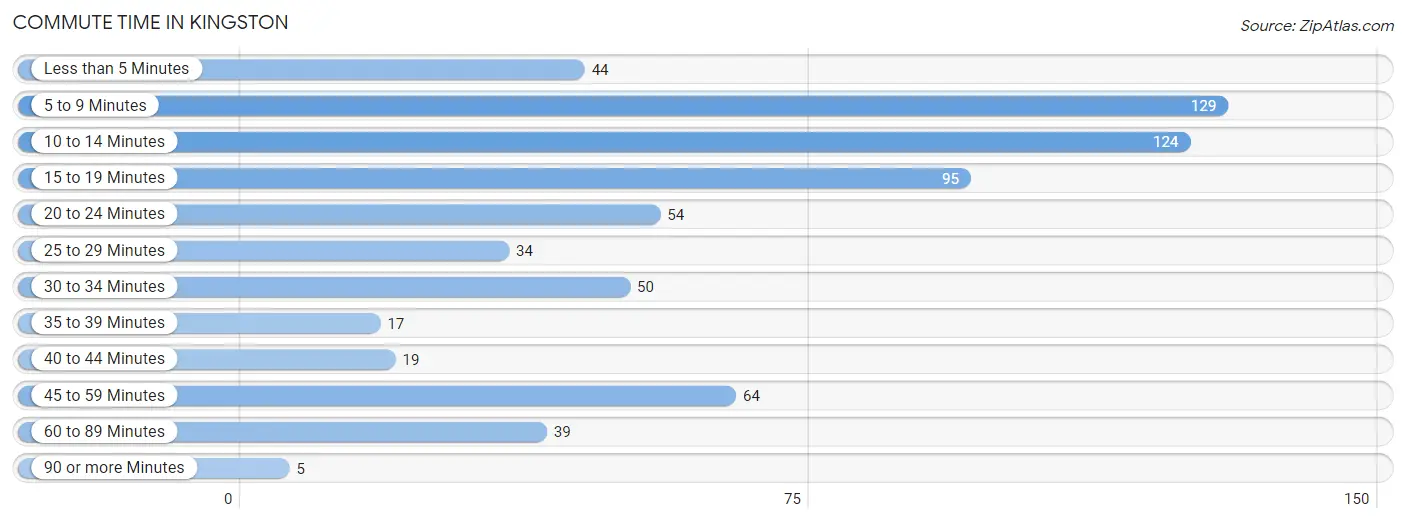
| Commute Time | # Commuters | % Commuters |
| Less than 5 Minutes | 44 | 6.5% |
| 5 to 9 Minutes | 129 | 19.1% |
| 10 to 14 Minutes | 124 | 18.4% |
| 15 to 19 Minutes | 95 | 14.1% |
| 20 to 24 Minutes | 54 | 8.0% |
| 25 to 29 Minutes | 34 | 5.0% |
| 30 to 34 Minutes | 50 | 7.4% |
| 35 to 39 Minutes | 17 | 2.5% |
| 40 to 44 Minutes | 19 | 2.8% |
| 45 to 59 Minutes | 64 | 9.5% |
| 60 to 89 Minutes | 39 | 5.8% |
| 90 or more Minutes | 5 | 0.7% |
Commute Time by Sex in Kingston
The most common commute times in Kingston are 5 to 9 minutes (62 commuters, 18.1%) for males and 5 to 9 minutes (67 commuters, 20.2%) for females.
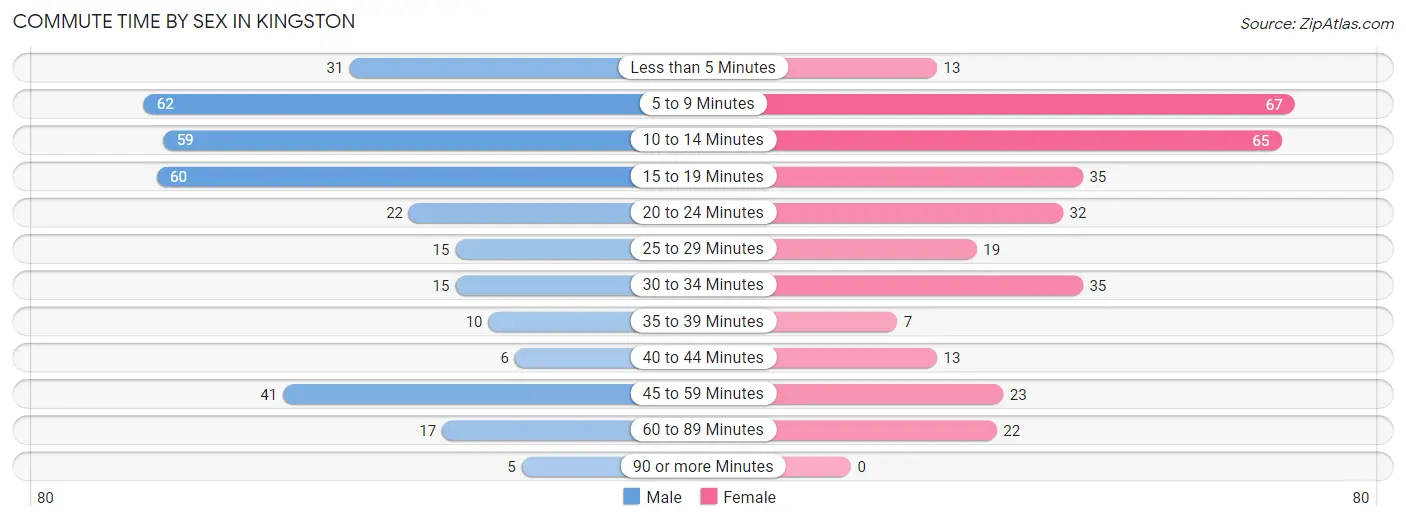
| Commute Time | Male | Female |
| Less than 5 Minutes | 31 (9.0%) | 13 (3.9%) |
| 5 to 9 Minutes | 62 (18.1%) | 67 (20.2%) |
| 10 to 14 Minutes | 59 (17.2%) | 65 (19.6%) |
| 15 to 19 Minutes | 60 (17.5%) | 35 (10.6%) |
| 20 to 24 Minutes | 22 (6.4%) | 32 (9.7%) |
| 25 to 29 Minutes | 15 (4.4%) | 19 (5.7%) |
| 30 to 34 Minutes | 15 (4.4%) | 35 (10.6%) |
| 35 to 39 Minutes | 10 (2.9%) | 7 (2.1%) |
| 40 to 44 Minutes | 6 (1.8%) | 13 (3.9%) |
| 45 to 59 Minutes | 41 (11.9%) | 23 (7.0%) |
| 60 to 89 Minutes | 17 (5.0%) | 22 (6.7%) |
| 90 or more Minutes | 5 (1.5%) | 0 (0.0%) |
Time of Departure to Work by Sex in Kingston
The most frequent times of departure to work in Kingston are 4:00 PM to 11:59 PM (53, 15.4%) for males and 7:00 AM to 7:29 AM (76, 23.0%) for females.
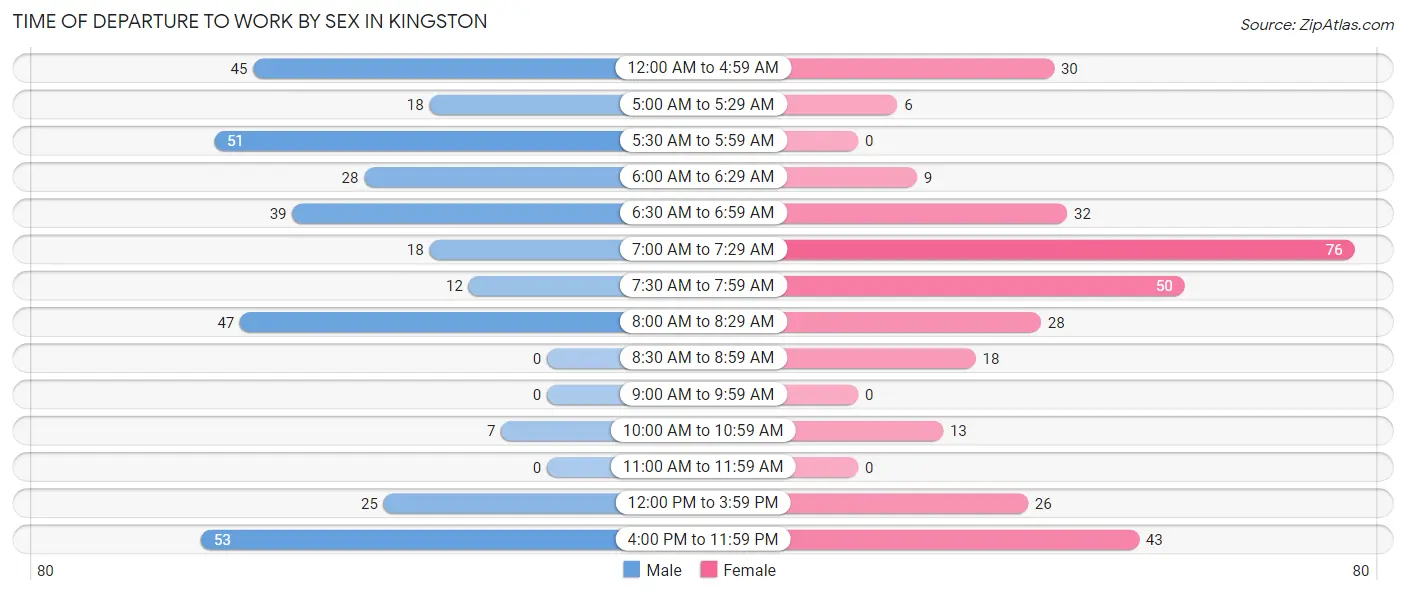
| Time of Departure | Male | Female |
| 12:00 AM to 4:59 AM | 45 (13.1%) | 30 (9.1%) |
| 5:00 AM to 5:29 AM | 18 (5.2%) | 6 (1.8%) |
| 5:30 AM to 5:59 AM | 51 (14.9%) | 0 (0.0%) |
| 6:00 AM to 6:29 AM | 28 (8.2%) | 9 (2.7%) |
| 6:30 AM to 6:59 AM | 39 (11.4%) | 32 (9.7%) |
| 7:00 AM to 7:29 AM | 18 (5.2%) | 76 (23.0%) |
| 7:30 AM to 7:59 AM | 12 (3.5%) | 50 (15.1%) |
| 8:00 AM to 8:29 AM | 47 (13.7%) | 28 (8.5%) |
| 8:30 AM to 8:59 AM | 0 (0.0%) | 18 (5.4%) |
| 9:00 AM to 9:59 AM | 0 (0.0%) | 0 (0.0%) |
| 10:00 AM to 10:59 AM | 7 (2.0%) | 13 (3.9%) |
| 11:00 AM to 11:59 AM | 0 (0.0%) | 0 (0.0%) |
| 12:00 PM to 3:59 PM | 25 (7.3%) | 26 (7.9%) |
| 4:00 PM to 11:59 PM | 53 (15.4%) | 43 (13.0%) |
| Total | 343 (100.0%) | 331 (100.0%) |
Housing Occupancy in Kingston
Occupancy by Ownership in Kingston
Of the total 560 dwellings in Kingston, owner-occupied units account for 341 (60.9%), while renter-occupied units make up 219 (39.1%).
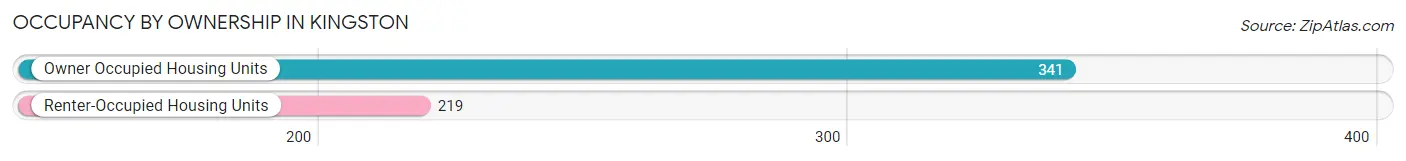
| Occupancy | # Housing Units | % Housing Units |
| Owner Occupied Housing Units | 341 | 60.9% |
| Renter-Occupied Housing Units | 219 | 39.1% |
| Total Occupied Housing Units | 560 | 100.0% |
Occupancy by Household Size in Kingston
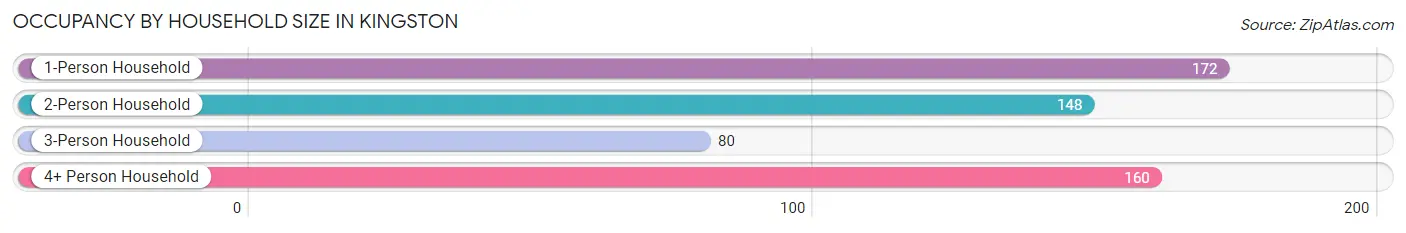
| Household Size | # Housing Units | % Housing Units |
| 1-Person Household | 172 | 30.7% |
| 2-Person Household | 148 | 26.4% |
| 3-Person Household | 80 | 14.3% |
| 4+ Person Household | 160 | 28.6% |
| Total Housing Units | 560 | 100.0% |
Occupancy by Ownership by Household Size in Kingston
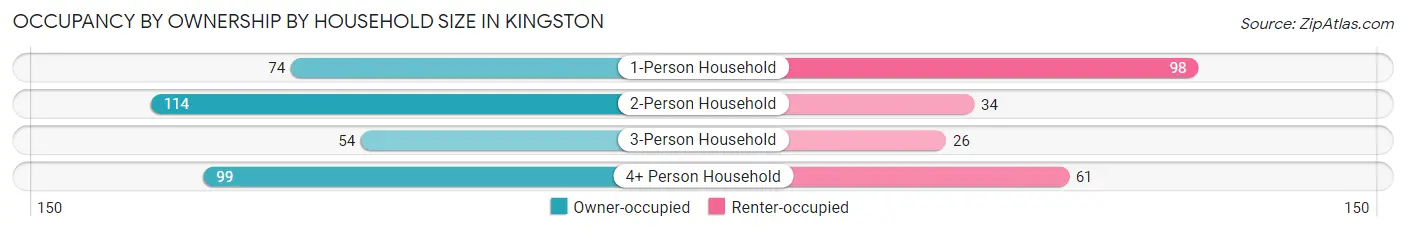
| Household Size | Owner-occupied | Renter-occupied |
| 1-Person Household | 74 (43.0%) | 98 (57.0%) |
| 2-Person Household | 114 (77.0%) | 34 (23.0%) |
| 3-Person Household | 54 (67.5%) | 26 (32.5%) |
| 4+ Person Household | 99 (61.9%) | 61 (38.1%) |
| Total Housing Units | 341 (60.9%) | 219 (39.1%) |
Occupancy by Educational Attainment in Kingston
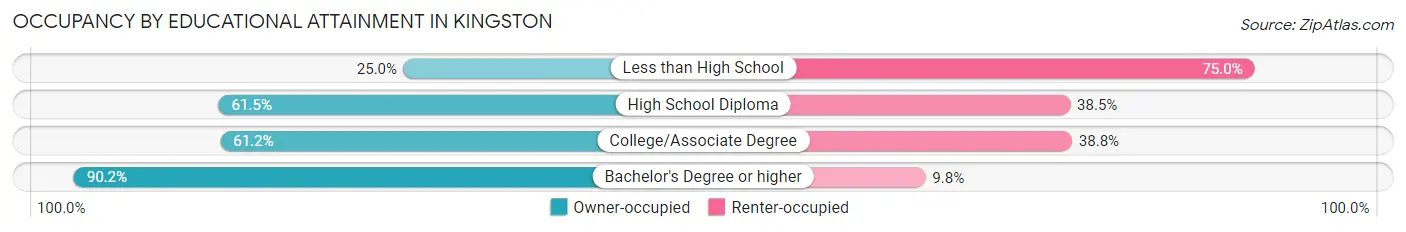
| Household Size | Owner-occupied | Renter-occupied |
| Less than High School | 10 (25.0%) | 30 (75.0%) |
| High School Diploma | 160 (61.5%) | 100 (38.5%) |
| College/Associate Degree | 134 (61.2%) | 85 (38.8%) |
| Bachelor's Degree or higher | 37 (90.2%) | 4 (9.8%) |
Occupancy by Age of Householder in Kingston
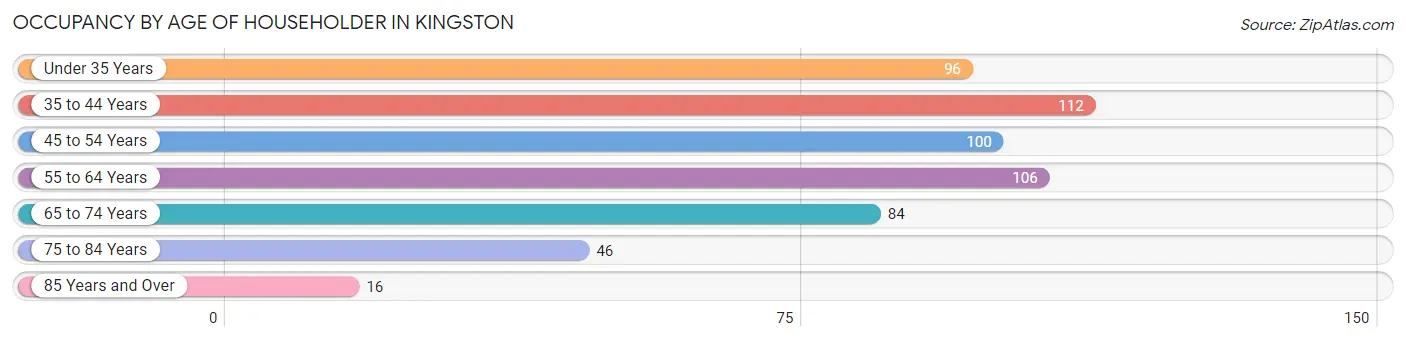
| Age Bracket | # Households | % Households |
| Under 35 Years | 96 | 17.1% |
| 35 to 44 Years | 112 | 20.0% |
| 45 to 54 Years | 100 | 17.9% |
| 55 to 64 Years | 106 | 18.9% |
| 65 to 74 Years | 84 | 15.0% |
| 75 to 84 Years | 46 | 8.2% |
| 85 Years and Over | 16 | 2.9% |
| Total | 560 | 100.0% |
Housing Finances in Kingston
Median Income by Occupancy in Kingston
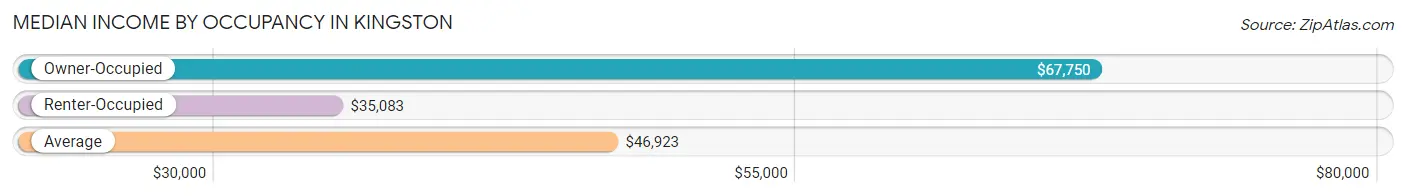
| Occupancy Type | # Households | Median Income |
| Owner-Occupied | 341 (60.9%) | $67,750 |
| Renter-Occupied | 219 (39.1%) | $35,083 |
| Average | 560 (100.0%) | $46,923 |
Occupancy by Householder Income Bracket in Kingston
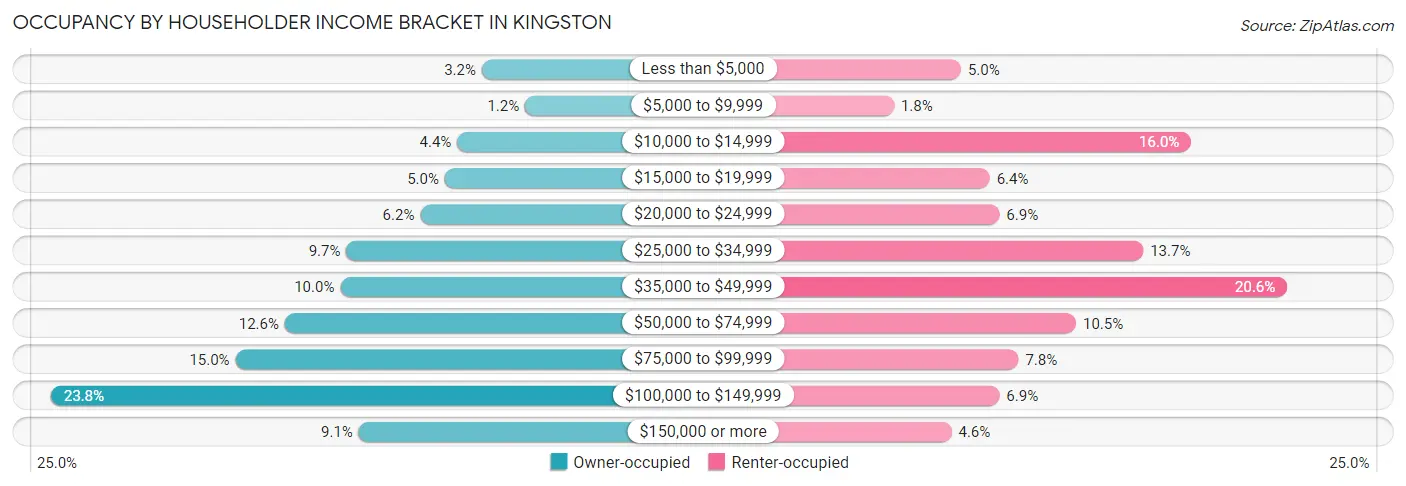
| Income Bracket | Owner-occupied | Renter-occupied |
| Less than $5,000 | 11 (3.2%) | 11 (5.0%) |
| $5,000 to $9,999 | 4 (1.2%) | 4 (1.8%) |
| $10,000 to $14,999 | 15 (4.4%) | 35 (16.0%) |
| $15,000 to $19,999 | 17 (5.0%) | 14 (6.4%) |
| $20,000 to $24,999 | 21 (6.2%) | 15 (6.9%) |
| $25,000 to $34,999 | 33 (9.7%) | 30 (13.7%) |
| $35,000 to $49,999 | 34 (10.0%) | 45 (20.5%) |
| $50,000 to $74,999 | 43 (12.6%) | 23 (10.5%) |
| $75,000 to $99,999 | 51 (15.0%) | 17 (7.8%) |
| $100,000 to $149,999 | 81 (23.7%) | 15 (6.9%) |
| $150,000 or more | 31 (9.1%) | 10 (4.6%) |
| Total | 341 (100.0%) | 219 (100.0%) |
Monthly Housing Cost Tiers in Kingston
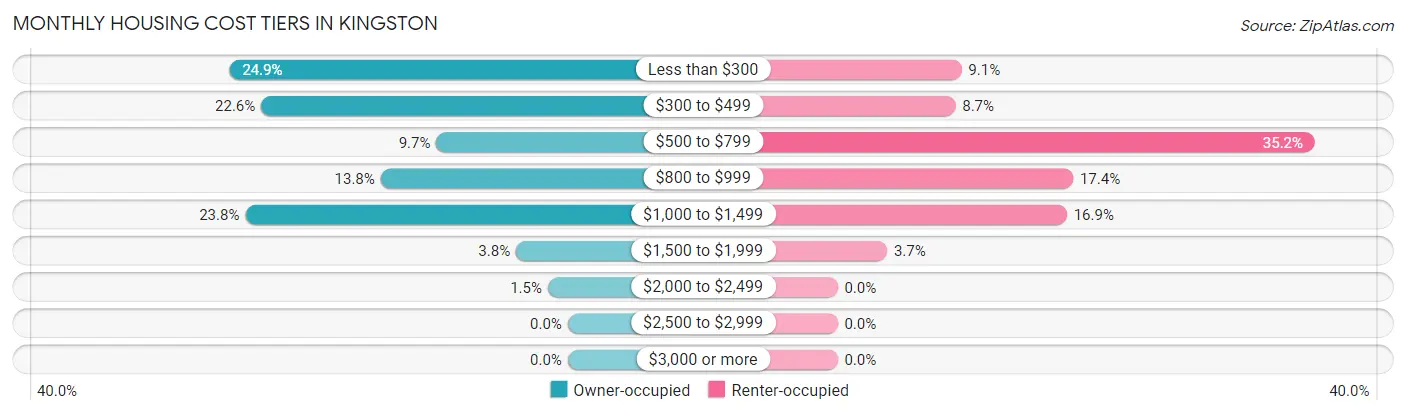
| Monthly Cost | Owner-occupied | Renter-occupied |
| Less than $300 | 85 (24.9%) | 20 (9.1%) |
| $300 to $499 | 77 (22.6%) | 19 (8.7%) |
| $500 to $799 | 33 (9.7%) | 77 (35.2%) |
| $800 to $999 | 47 (13.8%) | 38 (17.3%) |
| $1,000 to $1,499 | 81 (23.7%) | 37 (16.9%) |
| $1,500 to $1,999 | 13 (3.8%) | 8 (3.6%) |
| $2,000 to $2,499 | 5 (1.5%) | 0 (0.0%) |
| $2,500 to $2,999 | 0 (0.0%) | 0 (0.0%) |
| $3,000 or more | 0 (0.0%) | 0 (0.0%) |
| Total | 341 (100.0%) | 219 (100.0%) |
Physical Housing Characteristics in Kingston
Housing Structures in Kingston
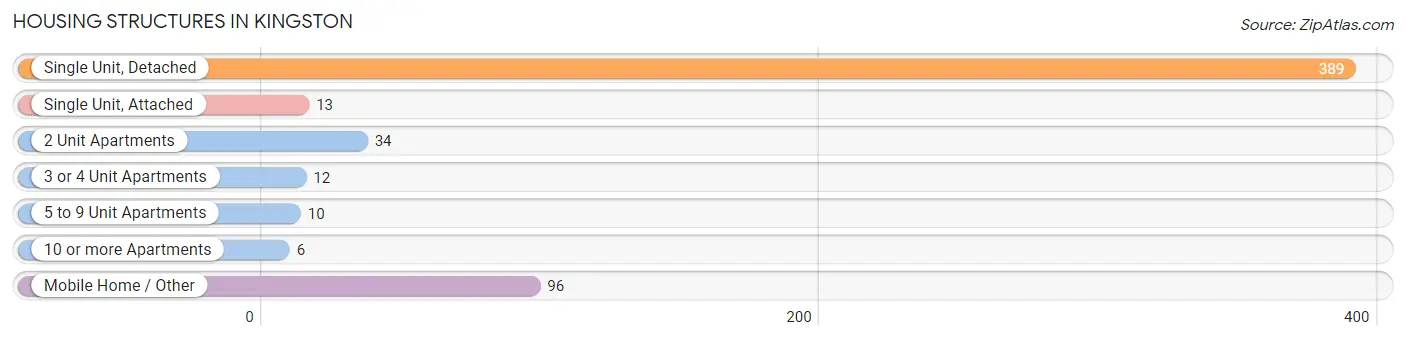
| Structure Type | # Housing Units | % Housing Units |
| Single Unit, Detached | 389 | 69.5% |
| Single Unit, Attached | 13 | 2.3% |
| 2 Unit Apartments | 34 | 6.1% |
| 3 or 4 Unit Apartments | 12 | 2.1% |
| 5 to 9 Unit Apartments | 10 | 1.8% |
| 10 or more Apartments | 6 | 1.1% |
| Mobile Home / Other | 96 | 17.1% |
| Total | 560 | 100.0% |
Housing Structures by Occupancy in Kingston
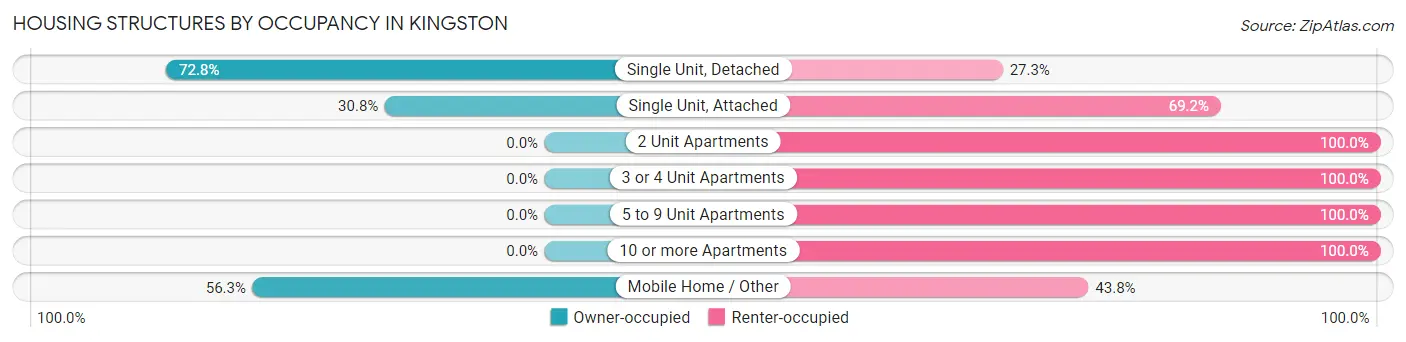
| Structure Type | Owner-occupied | Renter-occupied |
| Single Unit, Detached | 283 (72.8%) | 106 (27.3%) |
| Single Unit, Attached | 4 (30.8%) | 9 (69.2%) |
| 2 Unit Apartments | 0 (0.0%) | 34 (100.0%) |
| 3 or 4 Unit Apartments | 0 (0.0%) | 12 (100.0%) |
| 5 to 9 Unit Apartments | 0 (0.0%) | 10 (100.0%) |
| 10 or more Apartments | 0 (0.0%) | 6 (100.0%) |
| Mobile Home / Other | 54 (56.2%) | 42 (43.8%) |
| Total | 341 (60.9%) | 219 (39.1%) |
Housing Structures by Number of Rooms in Kingston
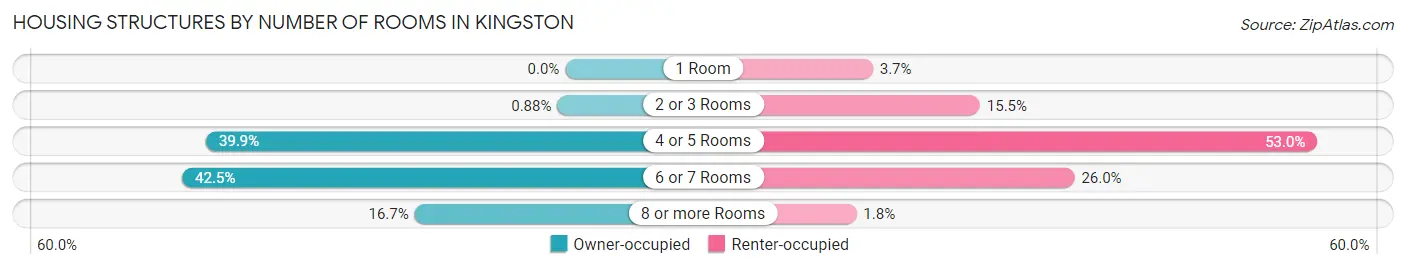
| Number of Rooms | Owner-occupied | Renter-occupied |
| 1 Room | 0 (0.0%) | 8 (3.6%) |
| 2 or 3 Rooms | 3 (0.9%) | 34 (15.5%) |
| 4 or 5 Rooms | 136 (39.9%) | 116 (53.0%) |
| 6 or 7 Rooms | 145 (42.5%) | 57 (26.0%) |
| 8 or more Rooms | 57 (16.7%) | 4 (1.8%) |
| Total | 341 (100.0%) | 219 (100.0%) |
Housing Structure by Heating Type in Kingston
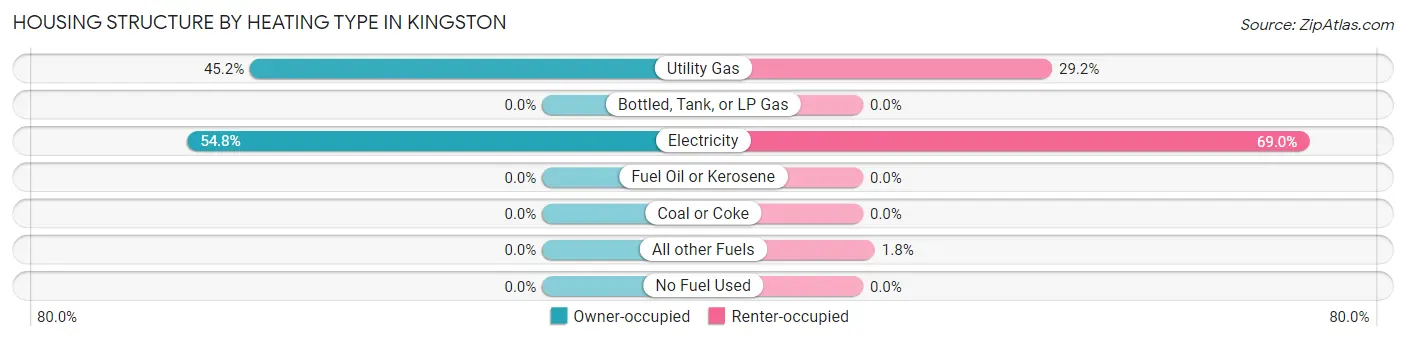
| Heating Type | Owner-occupied | Renter-occupied |
| Utility Gas | 154 (45.2%) | 64 (29.2%) |
| Bottled, Tank, or LP Gas | 0 (0.0%) | 0 (0.0%) |
| Electricity | 187 (54.8%) | 151 (69.0%) |
| Fuel Oil or Kerosene | 0 (0.0%) | 0 (0.0%) |
| Coal or Coke | 0 (0.0%) | 0 (0.0%) |
| All other Fuels | 0 (0.0%) | 4 (1.8%) |
| No Fuel Used | 0 (0.0%) | 0 (0.0%) |
| Total | 341 (100.0%) | 219 (100.0%) |
Household Vehicle Usage in Kingston
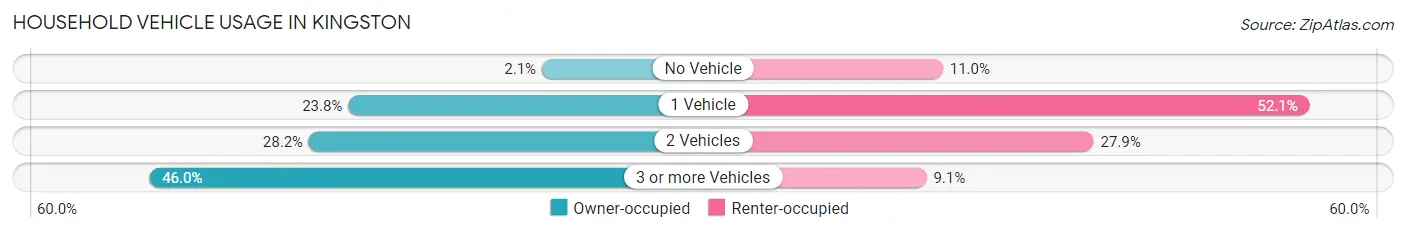
| Vehicles per Household | Owner-occupied | Renter-occupied |
| No Vehicle | 7 (2.1%) | 24 (11.0%) |
| 1 Vehicle | 81 (23.7%) | 114 (52.0%) |
| 2 Vehicles | 96 (28.1%) | 61 (27.9%) |
| 3 or more Vehicles | 157 (46.0%) | 20 (9.1%) |
| Total | 341 (100.0%) | 219 (100.0%) |
Real Estate & Mortgages in Kingston
Real Estate and Mortgage Overview in Kingston
| Characteristic | Without Mortgage | With Mortgage |
| Housing Units | 184 | 157 |
| Median Property Value | $79,200 | $127,900 |
| Median Household Income | $36,786 | $31 |
| Monthly Housing Costs | $319 | $0 |
| Real Estate Taxes | $408 | $5 |
Property Value by Mortgage Status in Kingston
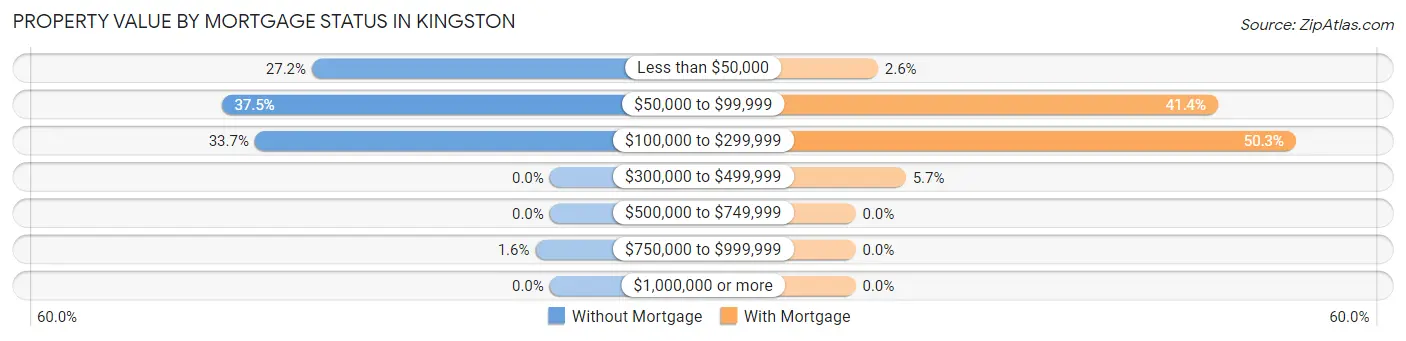
| Property Value | Without Mortgage | With Mortgage |
| Less than $50,000 | 50 (27.2%) | 4 (2.5%) |
| $50,000 to $99,999 | 69 (37.5%) | 65 (41.4%) |
| $100,000 to $299,999 | 62 (33.7%) | 79 (50.3%) |
| $300,000 to $499,999 | 0 (0.0%) | 9 (5.7%) |
| $500,000 to $749,999 | 0 (0.0%) | 0 (0.0%) |
| $750,000 to $999,999 | 3 (1.6%) | 0 (0.0%) |
| $1,000,000 or more | 0 (0.0%) | 0 (0.0%) |
| Total | 184 (100.0%) | 157 (100.0%) |
Household Income by Mortgage Status in Kingston
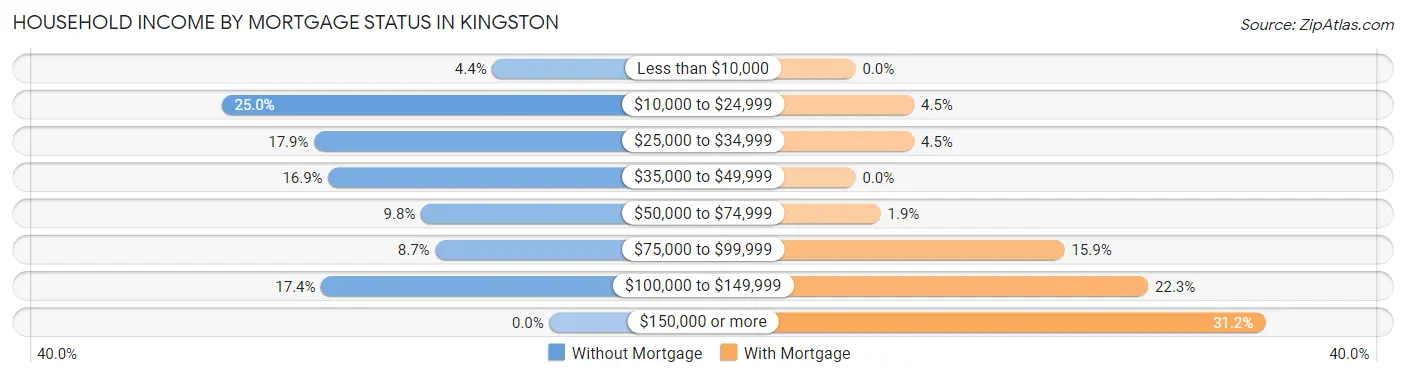
| Household Income | Without Mortgage | With Mortgage |
| Less than $10,000 | 8 (4.3%) | 0 (0.0%) |
| $10,000 to $24,999 | 46 (25.0%) | 7 (4.5%) |
| $25,000 to $34,999 | 33 (17.9%) | 7 (4.5%) |
| $35,000 to $49,999 | 31 (16.9%) | 0 (0.0%) |
| $50,000 to $74,999 | 18 (9.8%) | 3 (1.9%) |
| $75,000 to $99,999 | 16 (8.7%) | 25 (15.9%) |
| $100,000 to $149,999 | 32 (17.4%) | 35 (22.3%) |
| $150,000 or more | 0 (0.0%) | 49 (31.2%) |
| Total | 184 (100.0%) | 157 (100.0%) |
Property Value to Household Income Ratio in Kingston
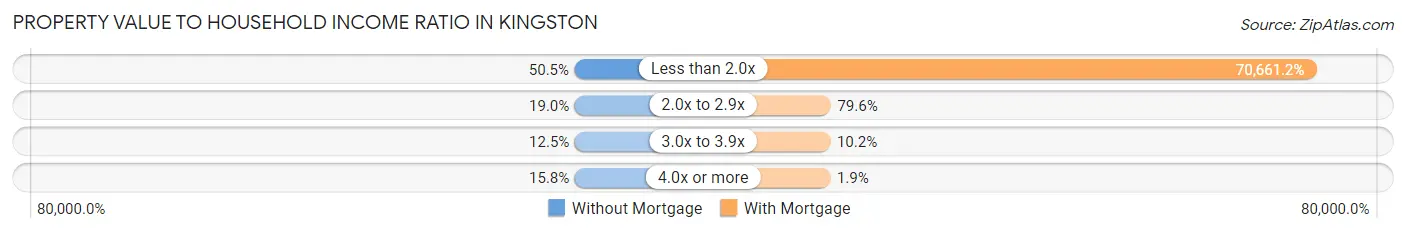
| Value-to-Income Ratio | Without Mortgage | With Mortgage |
| Less than 2.0x | 93 (50.5%) | 110,938 (70,661.1%) |
| 2.0x to 2.9x | 35 (19.0%) | 125 (79.6%) |
| 3.0x to 3.9x | 23 (12.5%) | 16 (10.2%) |
| 4.0x or more | 29 (15.8%) | 3 (1.9%) |
| Total | 184 (100.0%) | 157 (100.0%) |
Real Estate Taxes by Mortgage Status in Kingston
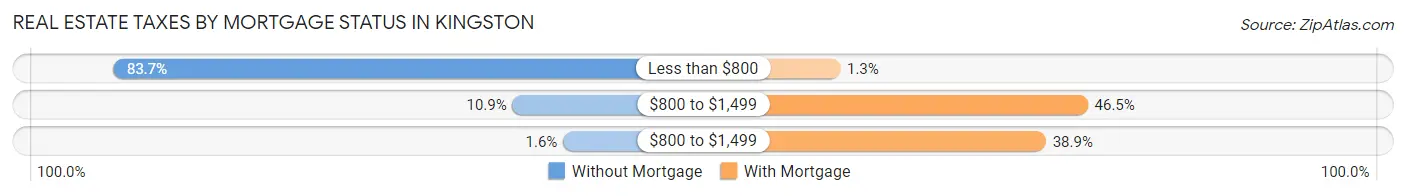
| Property Taxes | Without Mortgage | With Mortgage |
| Less than $800 | 154 (83.7%) | 2 (1.3%) |
| $800 to $1,499 | 20 (10.9%) | 73 (46.5%) |
| $800 to $1,499 | 3 (1.6%) | 61 (38.9%) |
| Total | 184 (100.0%) | 157 (100.0%) |
Health & Disability in Kingston
Health Insurance Coverage by Age in Kingston
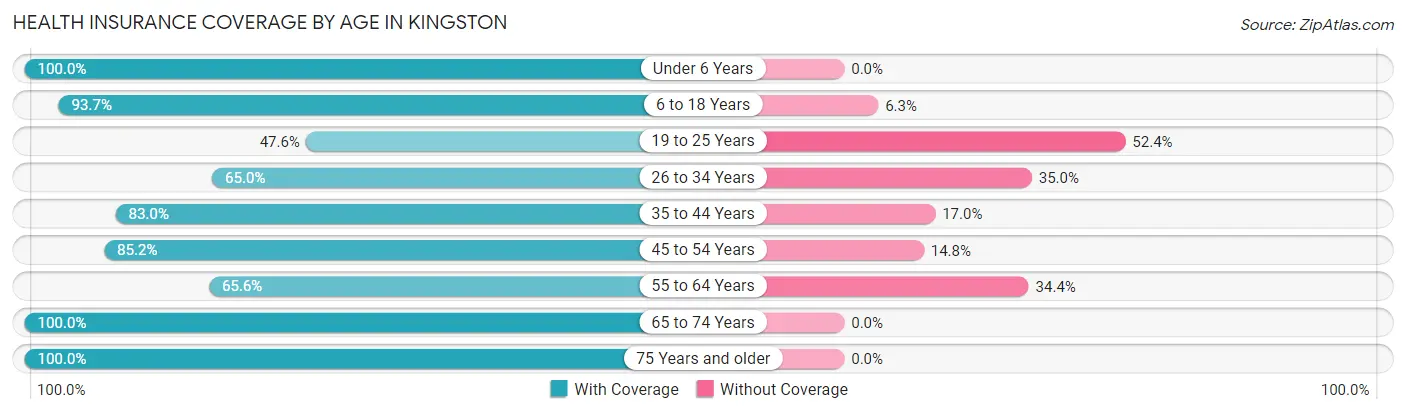
| Age Bracket | With Coverage | Without Coverage |
| Under 6 Years | 98 (100.0%) | 0 (0.0%) |
| 6 to 18 Years | 370 (93.7%) | 25 (6.3%) |
| 19 to 25 Years | 59 (47.6%) | 65 (52.4%) |
| 26 to 34 Years | 106 (65.0%) | 57 (35.0%) |
| 35 to 44 Years | 191 (83.0%) | 39 (17.0%) |
| 45 to 54 Years | 178 (85.2%) | 31 (14.8%) |
| 55 to 64 Years | 126 (65.6%) | 66 (34.4%) |
| 65 to 74 Years | 207 (100.0%) | 0 (0.0%) |
| 75 Years and older | 76 (100.0%) | 0 (0.0%) |
| Total | 1,411 (83.3%) | 283 (16.7%) |
Health Insurance Coverage by Citizenship Status in Kingston
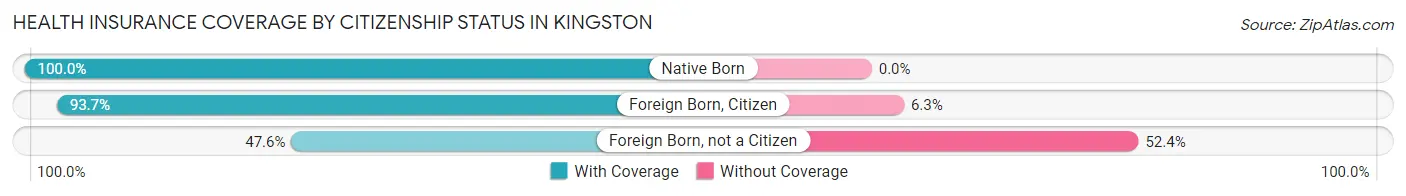
| Citizenship Status | With Coverage | Without Coverage |
| Native Born | 98 (100.0%) | 0 (0.0%) |
| Foreign Born, Citizen | 370 (93.7%) | 25 (6.3%) |
| Foreign Born, not a Citizen | 59 (47.6%) | 65 (52.4%) |
Health Insurance Coverage by Household Income in Kingston
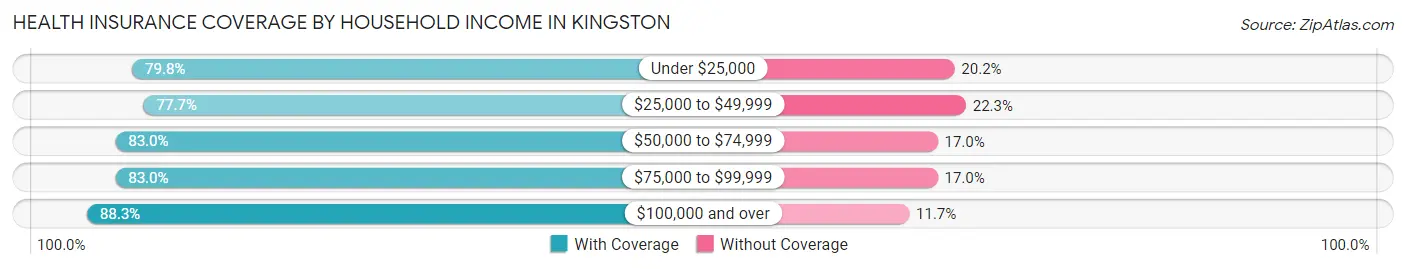
| Household Income | With Coverage | Without Coverage |
| Under $25,000 | 202 (79.8%) | 51 (20.2%) |
| $25,000 to $49,999 | 272 (77.7%) | 78 (22.3%) |
| $50,000 to $74,999 | 205 (83.0%) | 42 (17.0%) |
| $75,000 to $99,999 | 210 (83.0%) | 43 (17.0%) |
| $100,000 and over | 522 (88.3%) | 69 (11.7%) |
Public vs Private Health Insurance Coverage by Age in Kingston
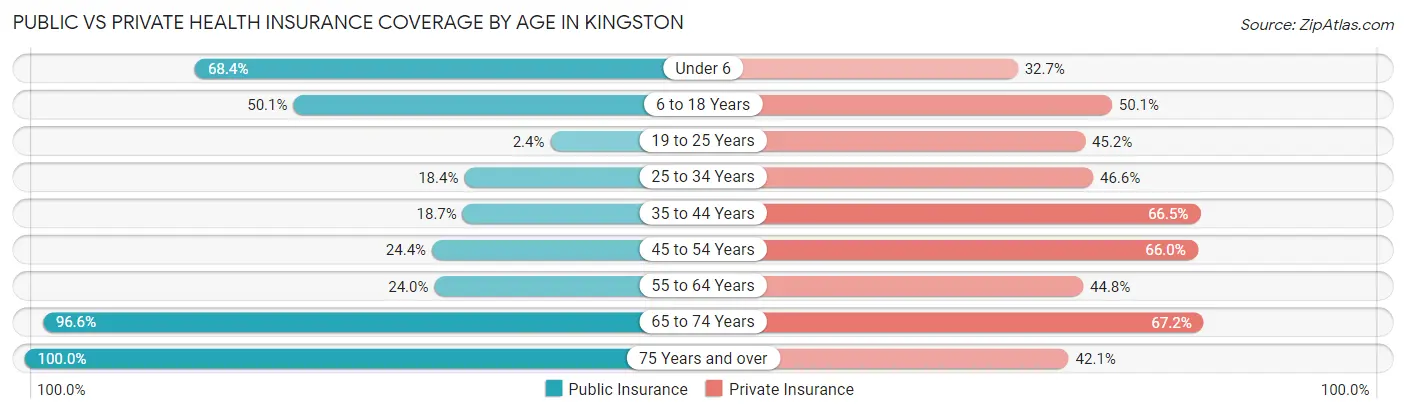
| Age Bracket | Public Insurance | Private Insurance |
| Under 6 | 67 (68.4%) | 32 (32.7%) |
| 6 to 18 Years | 198 (50.1%) | 198 (50.1%) |
| 19 to 25 Years | 3 (2.4%) | 56 (45.2%) |
| 25 to 34 Years | 30 (18.4%) | 76 (46.6%) |
| 35 to 44 Years | 43 (18.7%) | 153 (66.5%) |
| 45 to 54 Years | 51 (24.4%) | 138 (66.0%) |
| 55 to 64 Years | 46 (24.0%) | 86 (44.8%) |
| 65 to 74 Years | 200 (96.6%) | 139 (67.1%) |
| 75 Years and over | 76 (100.0%) | 32 (42.1%) |
| Total | 714 (42.1%) | 910 (53.7%) |
Disability Status by Sex by Age in Kingston
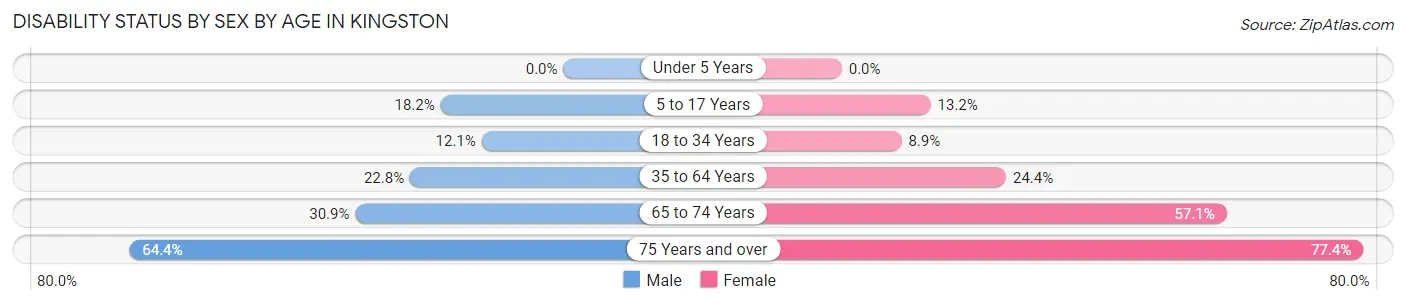
| Age Bracket | Male | Female |
| Under 5 Years | 0 (0.0%) | 0 (0.0%) |
| 5 to 17 Years | 29 (18.2%) | 31 (13.2%) |
| 18 to 34 Years | 17 (12.1%) | 14 (8.9%) |
| 35 to 64 Years | 69 (22.8%) | 80 (24.4%) |
| 65 to 74 Years | 38 (30.9%) | 48 (57.1%) |
| 75 Years and over | 29 (64.4%) | 24 (77.4%) |
Disability Class by Sex by Age in Kingston
Disability Class: Hearing Difficulty
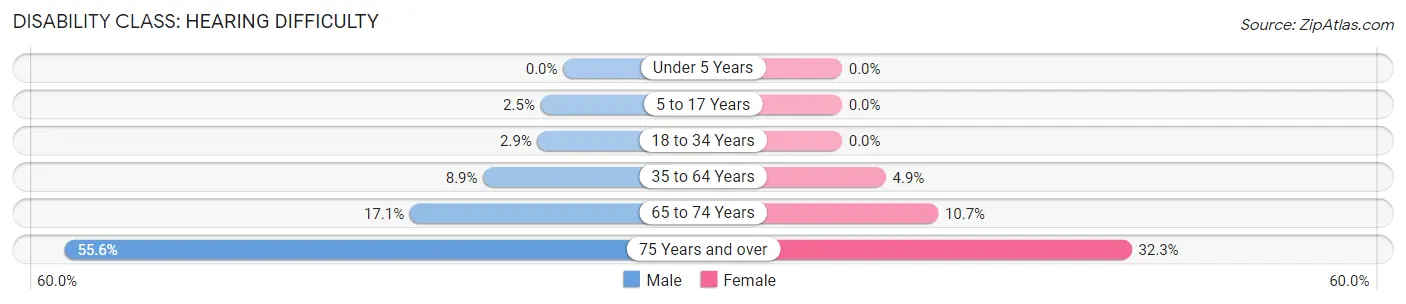
| Age Bracket | Male | Female |
| Under 5 Years | 0 (0.0%) | 0 (0.0%) |
| 5 to 17 Years | 4 (2.5%) | 0 (0.0%) |
| 18 to 34 Years | 4 (2.9%) | 0 (0.0%) |
| 35 to 64 Years | 27 (8.9%) | 16 (4.9%) |
| 65 to 74 Years | 21 (17.1%) | 9 (10.7%) |
| 75 Years and over | 25 (55.6%) | 10 (32.3%) |
Disability Class: Vision Difficulty
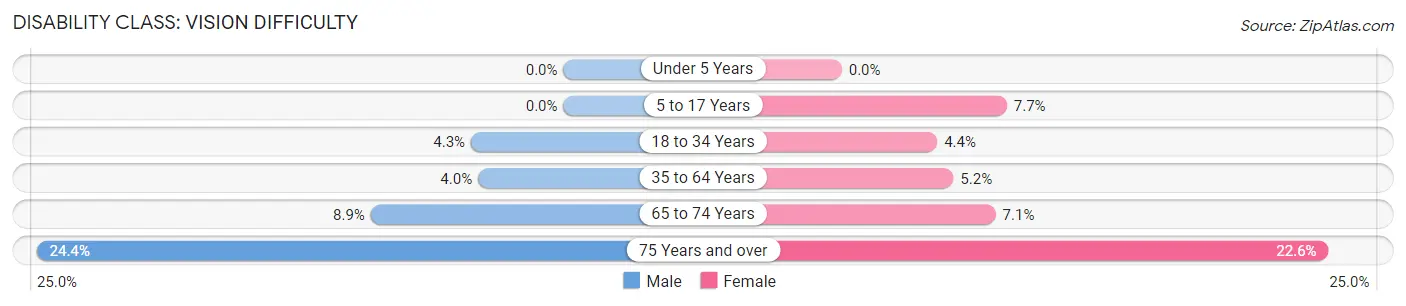
| Age Bracket | Male | Female |
| Under 5 Years | 0 (0.0%) | 0 (0.0%) |
| 5 to 17 Years | 0 (0.0%) | 18 (7.7%) |
| 18 to 34 Years | 6 (4.3%) | 7 (4.4%) |
| 35 to 64 Years | 12 (4.0%) | 17 (5.2%) |
| 65 to 74 Years | 11 (8.9%) | 6 (7.1%) |
| 75 Years and over | 11 (24.4%) | 7 (22.6%) |
Disability Class: Cognitive Difficulty
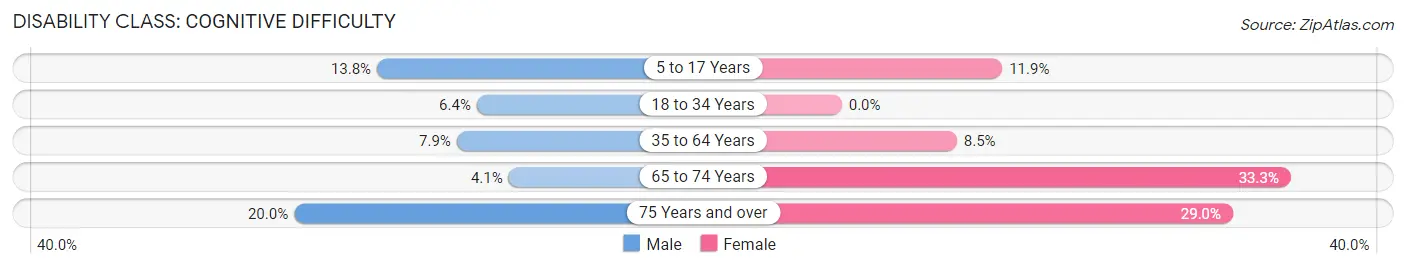
| Age Bracket | Male | Female |
| 5 to 17 Years | 22 (13.8%) | 28 (11.9%) |
| 18 to 34 Years | 9 (6.4%) | 0 (0.0%) |
| 35 to 64 Years | 24 (7.9%) | 28 (8.5%) |
| 65 to 74 Years | 5 (4.1%) | 28 (33.3%) |
| 75 Years and over | 9 (20.0%) | 9 (29.0%) |
Disability Class: Ambulatory Difficulty
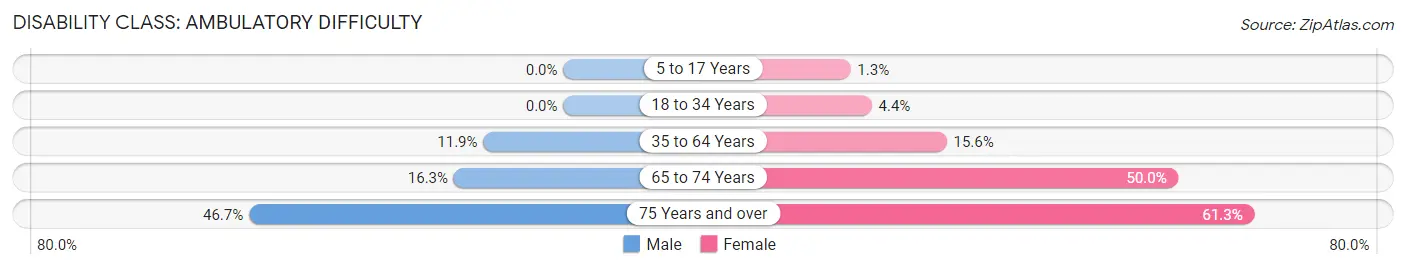
| Age Bracket | Male | Female |
| 5 to 17 Years | 0 (0.0%) | 3 (1.3%) |
| 18 to 34 Years | 0 (0.0%) | 7 (4.4%) |
| 35 to 64 Years | 36 (11.9%) | 51 (15.5%) |
| 65 to 74 Years | 20 (16.3%) | 42 (50.0%) |
| 75 Years and over | 21 (46.7%) | 19 (61.3%) |
Disability Class: Self-Care Difficulty
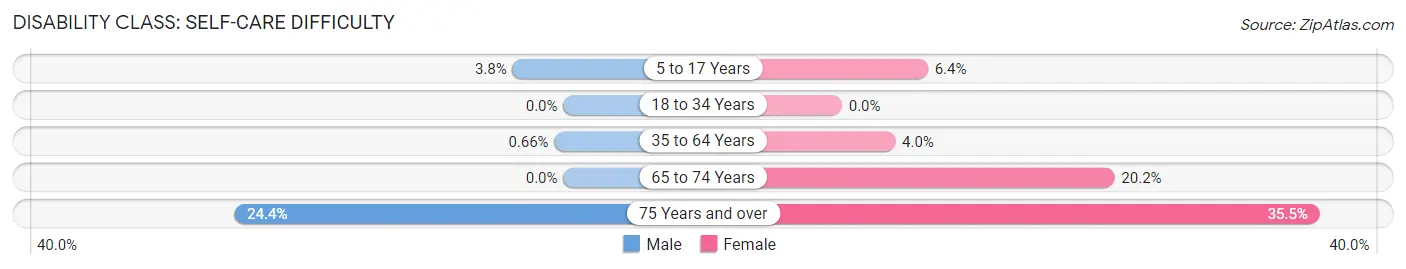
| Age Bracket | Male | Female |
| 5 to 17 Years | 6 (3.8%) | 15 (6.4%) |
| 18 to 34 Years | 0 (0.0%) | 0 (0.0%) |
| 35 to 64 Years | 2 (0.7%) | 13 (4.0%) |
| 65 to 74 Years | 0 (0.0%) | 17 (20.2%) |
| 75 Years and over | 11 (24.4%) | 11 (35.5%) |
Technology Access in Kingston
Computing Device Access in Kingston
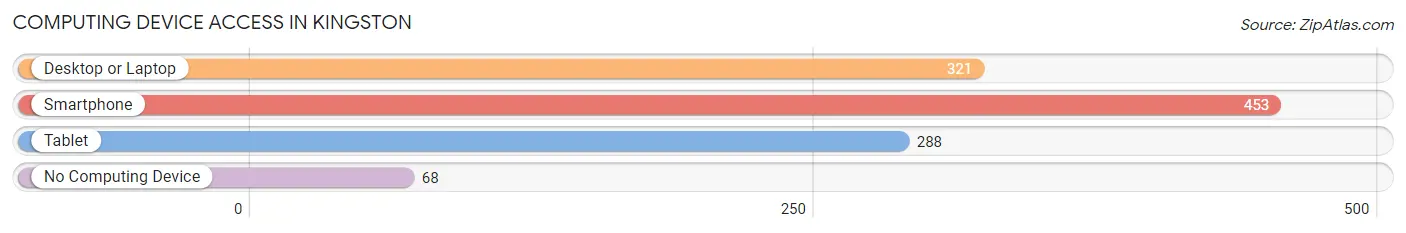
| Device Type | # Households | % Households |
| Desktop or Laptop | 321 | 57.3% |
| Smartphone | 453 | 80.9% |
| Tablet | 288 | 51.4% |
| No Computing Device | 68 | 12.1% |
| Total | 560 | 100.0% |
Internet Access in Kingston
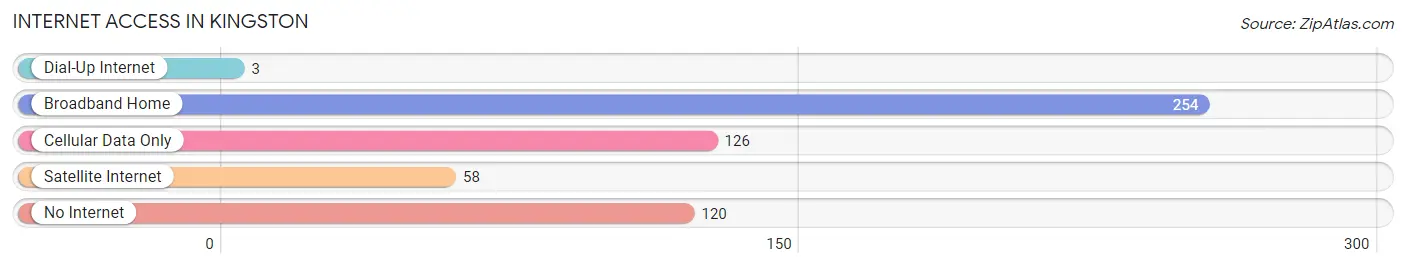
| Internet Type | # Households | % Households |
| Dial-Up Internet | 3 | 0.5% |
| Broadband Home | 254 | 45.4% |
| Cellular Data Only | 126 | 22.5% |
| Satellite Internet | 58 | 10.4% |
| No Internet | 120 | 21.4% |
| Total | 560 | 100.0% |
Kingston Summary
Kingston is a small town located in Marshall County, Oklahoma. It is situated on the banks of the Red River, approximately 20 miles south of the Oklahoma-Texas border. The town was founded in 1872 and was named after the nearby Kingston Creek. The population of Kingston was 1,845 at the 2010 census, making it the second-largest town in Marshall County.
Geography
Kingston is located at the intersection of U.S. Highway 70 and State Highway 32. It is situated on the banks of the Red River, approximately 20 miles south of the Oklahoma-Texas border. The town is located in the Red River Valley, which is a flat, alluvial plain. The elevation of Kingston is 645 feet above sea level. The town is located in a humid subtropical climate zone, with hot summers and mild winters.
Economy
The economy of Kingston is largely based on agriculture and manufacturing. The town is home to several large agricultural operations, including a cotton gin, a feed mill, and a grain elevator. The town is also home to several manufacturing companies, including a furniture factory, a plastics factory, and a metal fabrication plant.
Demographics
As of the 2010 census, the population of Kingston was 1,845. The racial makeup of the town was 79.2% White, 15.2% Native American, 0.7% Asian, 0.2% African American, 0.1% Pacific Islander, and 4.7% from two or more races. The median household income in Kingston was $31,250, and the median family income was $37,500. The per capita income in Kingston was $15,845.
History
Kingston was founded in 1872 and was named after the nearby Kingston Creek. The town was originally a trading post for the Choctaw and Chickasaw tribes. In 1891, the town was incorporated and a post office was established. The town grew rapidly in the early 20th century, and by the 1930s, it had become a major agricultural center. The town was also home to several manufacturing companies, including a furniture factory, a plastics factory, and a metal fabrication plant.
In the 1950s, Kingston experienced a period of rapid growth, as the town was connected to the nearby cities of Durant and Madill by a new highway. The town also benefited from the construction of a new bridge across the Red River. The town continued to grow throughout the 1960s and 1970s, and by the 1980s, it had become a major agricultural center.
Today, Kingston is a small, rural town with a population of 1,845. The town is home to several large agricultural operations, as well as several manufacturing companies. The town is also home to several churches, a library, and a museum. Kingston is a quiet, peaceful town, and it is a great place to live and raise a family.
Common Questions
What is Per Capita Income in Kingston?
Per Capita income in Kingston is $26,909.
What is the Median Family Income in Kingston?
Median Family Income in Kingston is $69,250.
What is the Median Household income in Kingston?
Median Household Income in Kingston is $46,923.
What is Income or Wage Gap in Kingston?
Income or Wage Gap in Kingston is 33.6%.
Women in Kingston earn 66.4 cents for every dollar earned by a man.
What is Family Income Deficit in Kingston?
Family Income Deficit in Kingston is $10,377.
Families that are below poverty line in Kingston earn $10,377 less on average than the poverty threshold level.
What is Inequality or Gini Index in Kingston?
Inequality or Gini Index in Kingston is 0.43.
What is the Total Population of Kingston?
Total Population of Kingston is 1,726.
What is the Total Male Population of Kingston?
Total Male Population of Kingston is 831.
What is the Total Female Population of Kingston?
Total Female Population of Kingston is 895.
What is the Ratio of Males per 100 Females in Kingston?
There are 92.85 Males per 100 Females in Kingston.
What is the Ratio of Females per 100 Males in Kingston?
There are 107.70 Females per 100 Males in Kingston.
What is the Median Population Age in Kingston?
Median Population Age in Kingston is 38.1 Years.
What is the Average Family Size in Kingston
Average Family Size in Kingston is 3.6 People.
What is the Average Household Size in Kingston
Average Household Size in Kingston is 3.0 People.
How Large is the Labor Force in Kingston?
There are 735 People in the Labor Forcein in Kingston.
What is the Percentage of People in the Labor Force in Kingston?
56.3% of People are in the Labor Force in Kingston.
What is the Unemployment Rate in Kingston?
Unemployment Rate in Kingston is 4.2%.