Claremore, OK Map & Demographics
Claremore Map
Claremore Overview
$29,048
PER CAPITA INCOME
$69,375
AVG FAMILY INCOME
$56,257
AVG HOUSEHOLD INCOME
29.2%
WAGE / INCOME GAP [ % ]
70.8¢/ $1
WAGE / INCOME GAP [ $ ]
$8,861
FAMILY INCOME DEFICIT
0.40
INEQUALITY / GINI INDEX
19,724
TOTAL POPULATION
9,593
MALE POPULATION
10,131
FEMALE POPULATION
94.69
MALES / 100 FEMALES
105.61
FEMALES / 100 MALES
36.3
MEDIAN AGE
3.1
AVG FAMILY SIZE
2.4
AVG HOUSEHOLD SIZE
9,524
LABOR FORCE [ PEOPLE ]
60.1%
PERCENT IN LABOR FORCE
5.8%
UNEMPLOYMENT RATE
Claremore Area Codes
Income in Claremore
Income Overview in Claremore
Per Capita Income in Claremore is $29,048, while median incomes of families and households are $69,375 and $56,257 respectively.
| Characteristic | Number | Measure |
| Per Capita Income | 19,724 | $29,048 |
| Median Family Income | 4,504 | $69,375 |
| Mean Family Income | 4,504 | $84,187 |
| Median Household Income | 7,742 | $56,257 |
| Mean Household Income | 7,742 | $68,880 |
| Income Deficit | 4,504 | $8,861 |
| Wage / Income Gap (%) | 19,724 | 29.20% |
| Wage / Income Gap ($) | 19,724 | 70.80¢ per $1 |
| Gini / Inequality Index | 19,724 | 0.40 |
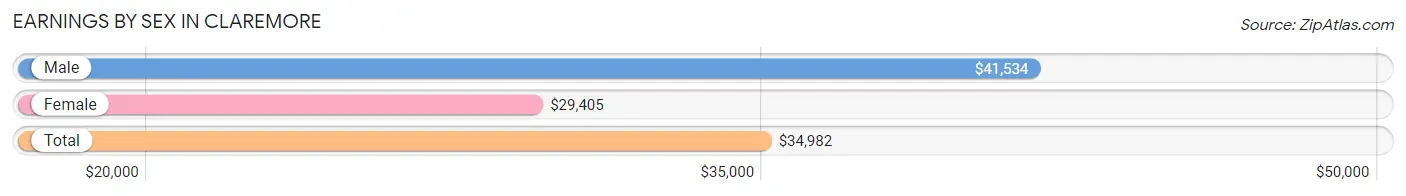
Earnings by Sex in Claremore
Average Earnings in Claremore are $34,982, $41,534 for men and $29,405 for women, a difference of 29.2%.
| Sex | Number | Average Earnings |
| Male | 5,193 (52.4%) | $41,534 |
| Female | 4,722 (47.6%) | $29,405 |
| Total | 9,915 (100.0%) | $34,982 |
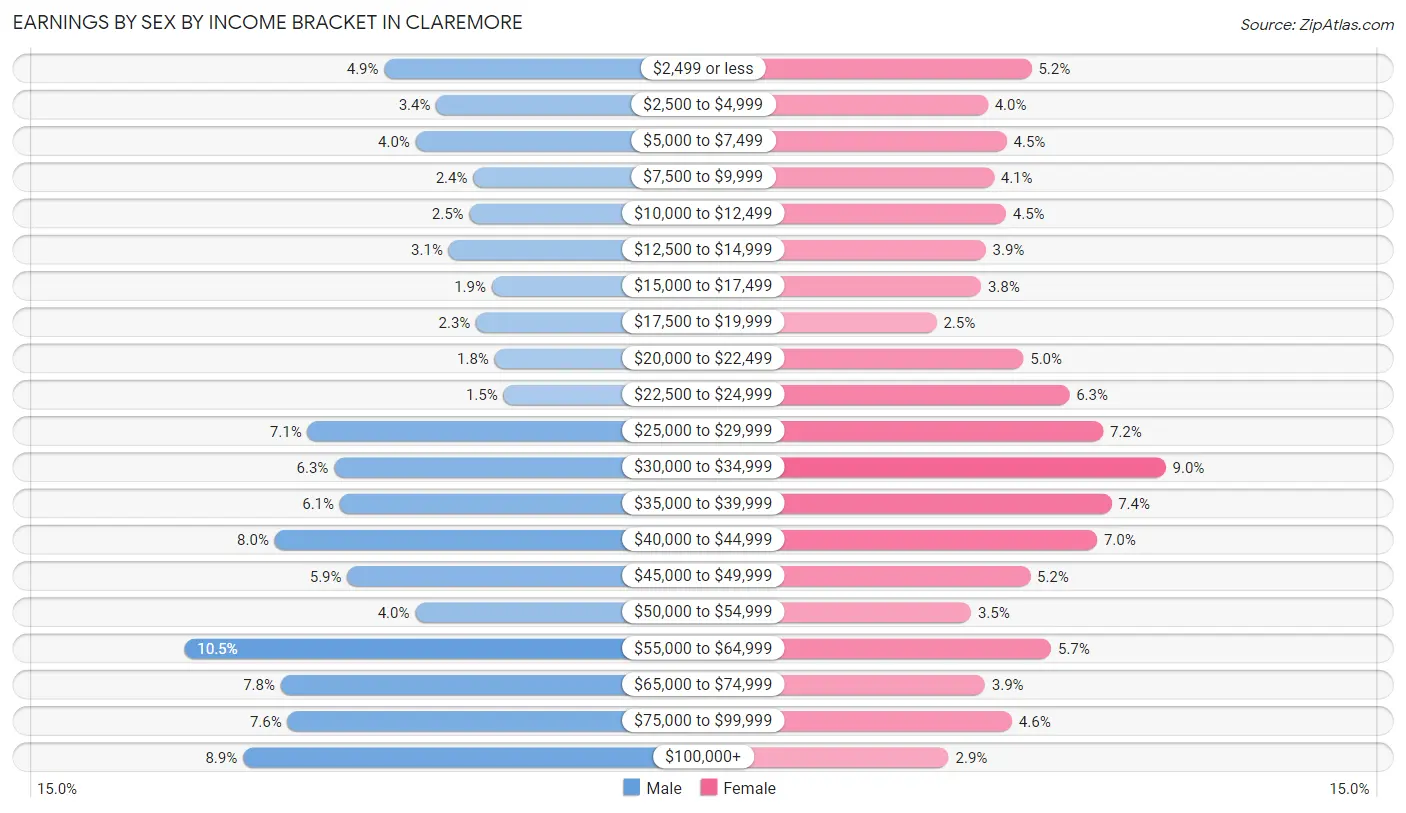
Earnings by Sex by Income Bracket in Claremore
The most common earnings brackets in Claremore are $55,000 to $64,999 for men (546 | 10.5%) and $30,000 to $34,999 for women (423 | 9.0%).
| Income | Male | Female |
| $2,499 or less | 254 (4.9%) | 245 (5.2%) |
| $2,500 to $4,999 | 178 (3.4%) | 187 (4.0%) |
| $5,000 to $7,499 | 208 (4.0%) | 212 (4.5%) |
| $7,500 to $9,999 | 124 (2.4%) | 195 (4.1%) |
| $10,000 to $12,499 | 130 (2.5%) | 211 (4.5%) |
| $12,500 to $14,999 | 160 (3.1%) | 184 (3.9%) |
| $15,000 to $17,499 | 97 (1.9%) | 178 (3.8%) |
| $17,500 to $19,999 | 120 (2.3%) | 119 (2.5%) |
| $20,000 to $22,499 | 93 (1.8%) | 234 (5.0%) |
| $22,500 to $24,999 | 80 (1.5%) | 295 (6.2%) |
| $25,000 to $29,999 | 366 (7.0%) | 340 (7.2%) |
| $30,000 to $34,999 | 327 (6.3%) | 423 (9.0%) |
| $35,000 to $39,999 | 319 (6.1%) | 351 (7.4%) |
| $40,000 to $44,999 | 414 (8.0%) | 332 (7.0%) |
| $45,000 to $49,999 | 308 (5.9%) | 243 (5.1%) |
| $50,000 to $54,999 | 209 (4.0%) | 165 (3.5%) |
| $55,000 to $64,999 | 546 (10.5%) | 271 (5.7%) |
| $65,000 to $74,999 | 405 (7.8%) | 183 (3.9%) |
| $75,000 to $99,999 | 395 (7.6%) | 219 (4.6%) |
| $100,000+ | 460 (8.9%) | 135 (2.9%) |
| Total | 5,193 (100.0%) | 4,722 (100.0%) |
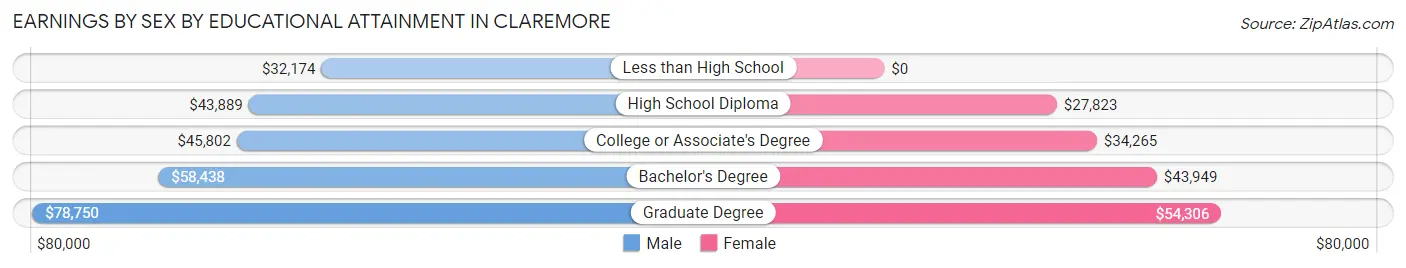
Earnings by Sex by Educational Attainment in Claremore
Average earnings in Claremore are $47,093 for men and $34,486 for women, a difference of 26.8%. Men with an educational attainment of graduate degree enjoy the highest average annual earnings of $78,750, while those with less than high school education earn the least with $32,174. Women with an educational attainment of graduate degree earn the most with the average annual earnings of $54,306, while those with high school diploma education have the smallest earnings of $27,823.
| Educational Attainment | Male Income | Female Income |
| Less than High School | $32,174 | $0 |
| High School Diploma | $43,889 | $27,823 |
| College or Associate's Degree | $45,802 | $34,265 |
| Bachelor's Degree | $58,438 | $43,949 |
| Graduate Degree | $78,750 | $54,306 |
| Total | $47,093 | $34,486 |
Family Income in Claremore
Family Income Brackets in Claremore
According to the Claremore family income data, there are 1,126 families falling into the $50,000 to $74,999 income range, which is the most common income bracket and makes up 25.0% of all families. Conversely, the less than $10,000 income bracket is the least frequent group with only 95 families (2.1%) belonging to this category.
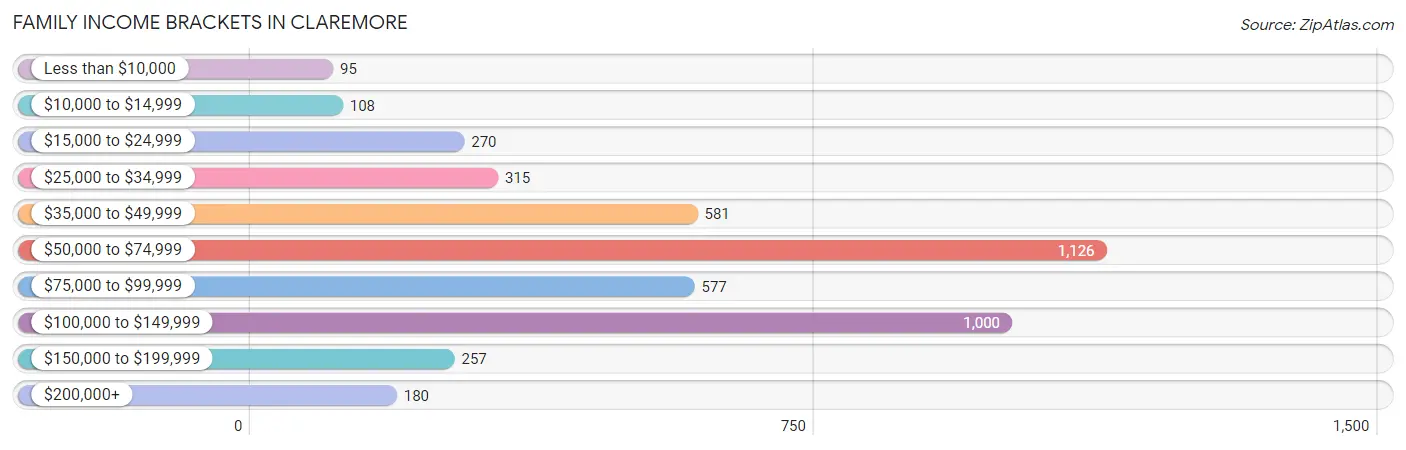
| Income Bracket | # Families | % Families |
| Less than $10,000 | 95 | 2.1% |
| $10,000 to $14,999 | 108 | 2.4% |
| $15,000 to $24,999 | 270 | 6.0% |
| $25,000 to $34,999 | 315 | 7.0% |
| $35,000 to $49,999 | 581 | 12.9% |
| $50,000 to $74,999 | 1,126 | 25.0% |
| $75,000 to $99,999 | 577 | 12.8% |
| $100,000 to $149,999 | 1,000 | 22.2% |
| $150,000 to $199,999 | 257 | 5.7% |
| $200,000+ | 180 | 4.0% |
Family Income by Famaliy Size in Claremore
4-person families (834 | 18.5%) account for the highest median family income in Claremore with $88,587 per family, while 2-person families (2,234 | 49.6%) have the highest median income of $32,054 per family member.
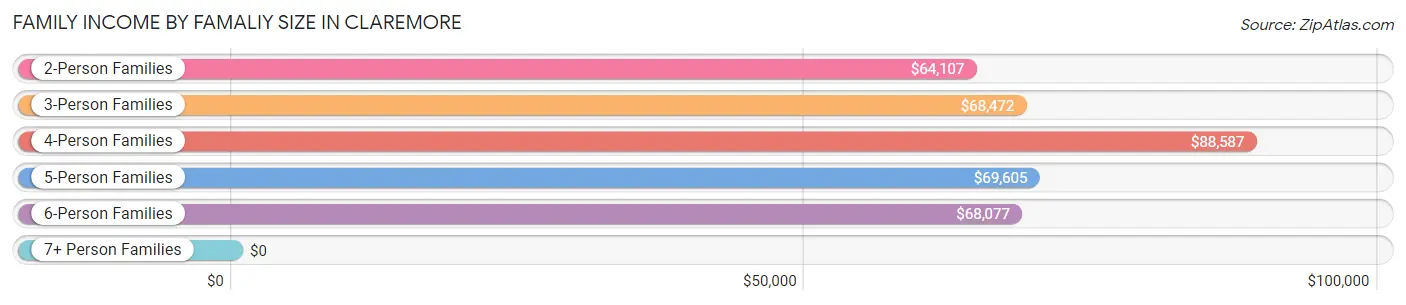
| Income Bracket | # Families | Median Income |
| 2-Person Families | 2,234 (49.6%) | $64,107 |
| 3-Person Families | 860 (19.1%) | $68,472 |
| 4-Person Families | 834 (18.5%) | $88,587 |
| 5-Person Families | 418 (9.3%) | $69,605 |
| 6-Person Families | 128 (2.8%) | $68,077 |
| 7+ Person Families | 30 (0.7%) | $0 |
| Total | 4,504 (100.0%) | $69,375 |
Family Income by Number of Earners in Claremore
The median family income in Claremore is $69,375, with families comprising 3+ earners (446) having the highest median family income of $120,000, while families with no earners (606) have the lowest median family income of $50,500, accounting for 9.9% and 13.5% of families, respectively.
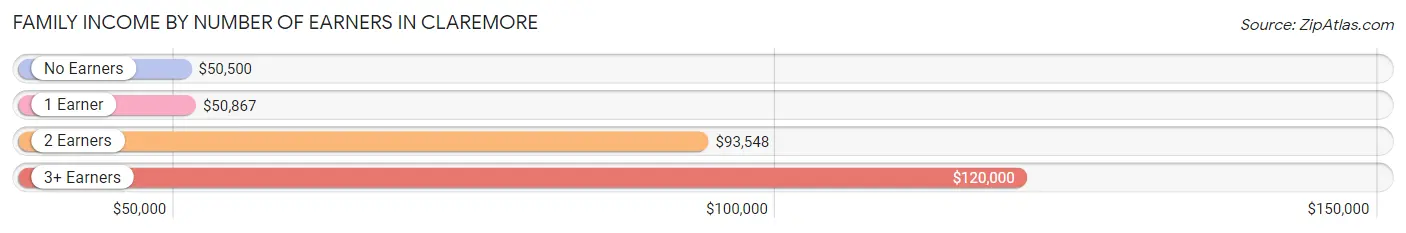
| Number of Earners | # Families | Median Income |
| No Earners | 606 (13.5%) | $50,500 |
| 1 Earner | 1,656 (36.8%) | $50,867 |
| 2 Earners | 1,796 (39.9%) | $93,548 |
| 3+ Earners | 446 (9.9%) | $120,000 |
| Total | 4,504 (100.0%) | $69,375 |
Household Income in Claremore
Household Income Brackets in Claremore
With 1,765 households falling in the category, the $50,000 to $74,999 income range is the most frequent in Claremore, accounting for 22.8% of all households. In contrast, only 209 households (2.7%) fall into the $200,000+ income bracket, making it the least populous group.
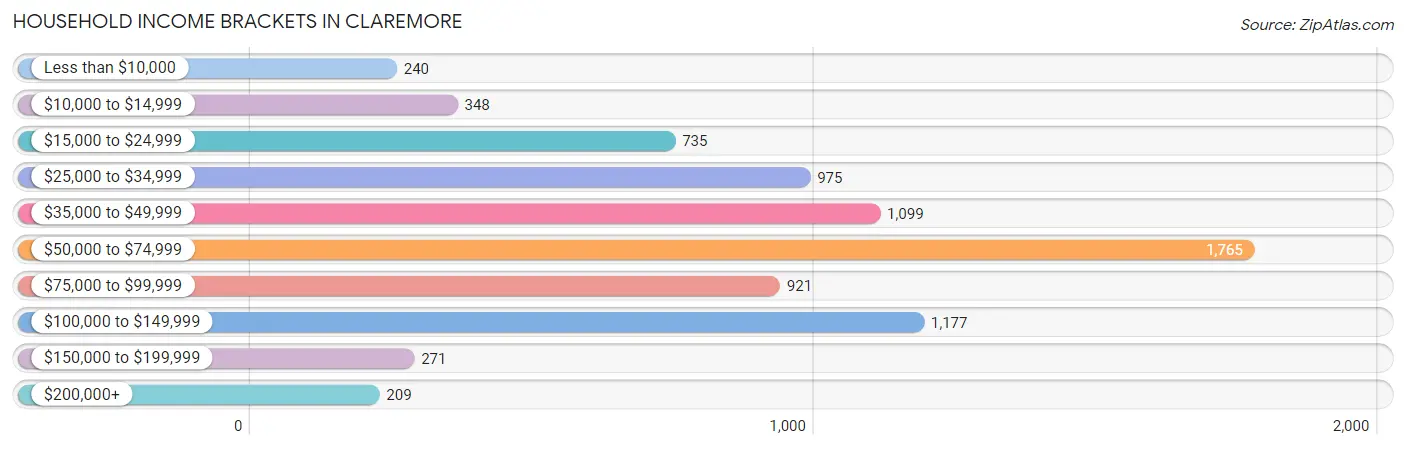
| Income Bracket | # Households | % Households |
| Less than $10,000 | 240 | 3.1% |
| $10,000 to $14,999 | 348 | 4.5% |
| $15,000 to $24,999 | 735 | 9.5% |
| $25,000 to $34,999 | 975 | 12.6% |
| $35,000 to $49,999 | 1,099 | 14.2% |
| $50,000 to $74,999 | 1,765 | 22.8% |
| $75,000 to $99,999 | 921 | 11.9% |
| $100,000 to $149,999 | 1,177 | 15.2% |
| $150,000 to $199,999 | 271 | 3.5% |
| $200,000+ | 209 | 2.7% |
Household Income by Householder Age in Claremore
The median household income in Claremore is $56,257, with the highest median household income of $70,333 found in the 45 to 64 years age bracket for the primary householder. A total of 2,346 households (30.3%) fall into this category. Meanwhile, the 65+ years age bracket for the primary householder has the lowest median household income of $40,093, with 2,443 households (31.6%) in this group.
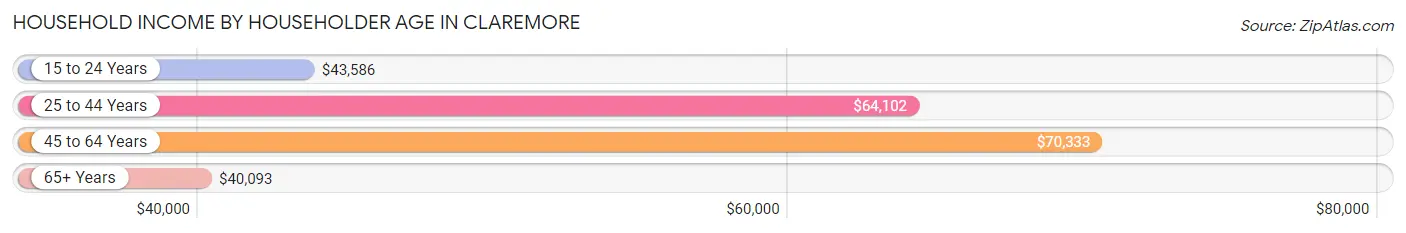
| Income Bracket | # Households | Median Income |
| 15 to 24 Years | 477 (6.2%) | $43,586 |
| 25 to 44 Years | 2,476 (32.0%) | $64,102 |
| 45 to 64 Years | 2,346 (30.3%) | $70,333 |
| 65+ Years | 2,443 (31.6%) | $40,093 |
| Total | 7,742 (100.0%) | $56,257 |
Poverty in Claremore
Income Below Poverty by Sex and Age in Claremore
With 11.7% poverty level for males and 13.6% for females among the residents of Claremore, 5 year old males and 5 year old females are the most vulnerable to poverty, with 29 males (25.4%) and 29 females (26.6%) in their respective age groups living below the poverty level.
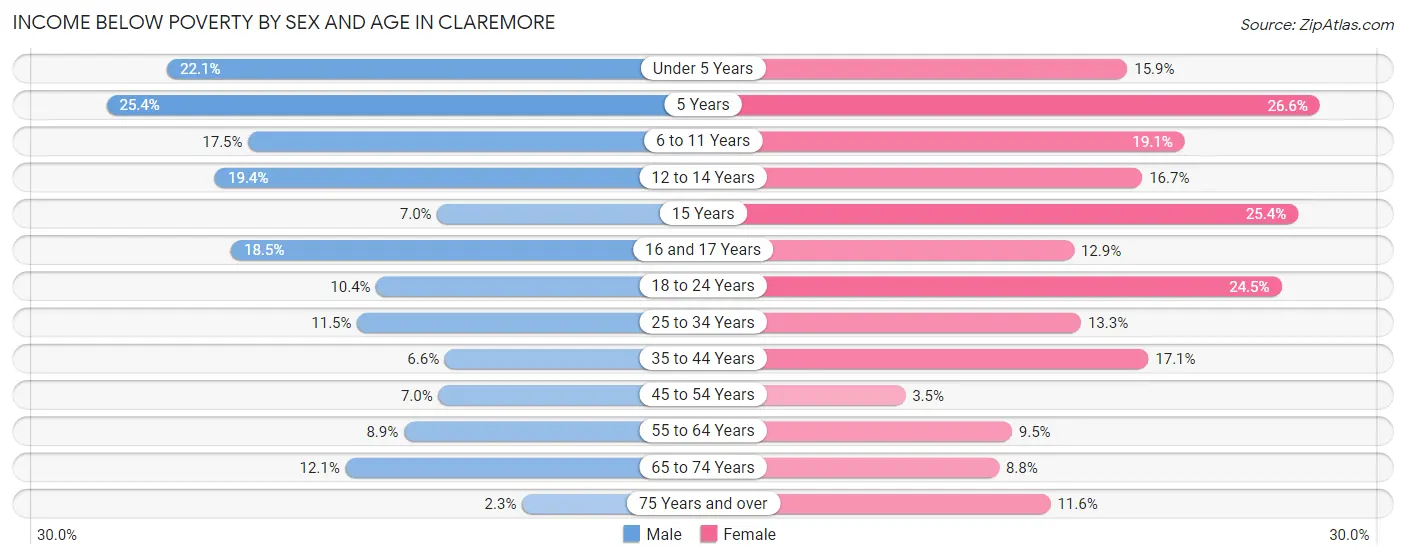
| Age Bracket | Male | Female |
| Under 5 Years | 152 (22.1%) | 86 (15.9%) |
| 5 Years | 29 (25.4%) | 29 (26.6%) |
| 6 to 11 Years | 121 (17.5%) | 138 (19.1%) |
| 12 to 14 Years | 83 (19.4%) | 46 (16.7%) |
| 15 Years | 11 (7.0%) | 16 (25.4%) |
| 16 and 17 Years | 42 (18.5%) | 30 (12.9%) |
| 18 to 24 Years | 94 (10.4%) | 241 (24.5%) |
| 25 to 34 Years | 168 (11.5%) | 194 (13.3%) |
| 35 to 44 Years | 74 (6.6%) | 191 (17.1%) |
| 45 to 54 Years | 63 (7.0%) | 39 (3.5%) |
| 55 to 64 Years | 80 (8.9%) | 91 (9.5%) |
| 65 to 74 Years | 87 (12.1%) | 97 (8.7%) |
| 75 Years and over | 8 (2.3%) | 134 (11.6%) |
| Total | 1,012 (11.7%) | 1,332 (13.6%) |
Income Above Poverty by Sex and Age in Claremore
According to the poverty statistics in Claremore, males aged 75 years and over and females aged 45 to 54 years are the age groups that are most secure financially, with 97.7% of males and 96.5% of females in these age groups living above the poverty line.
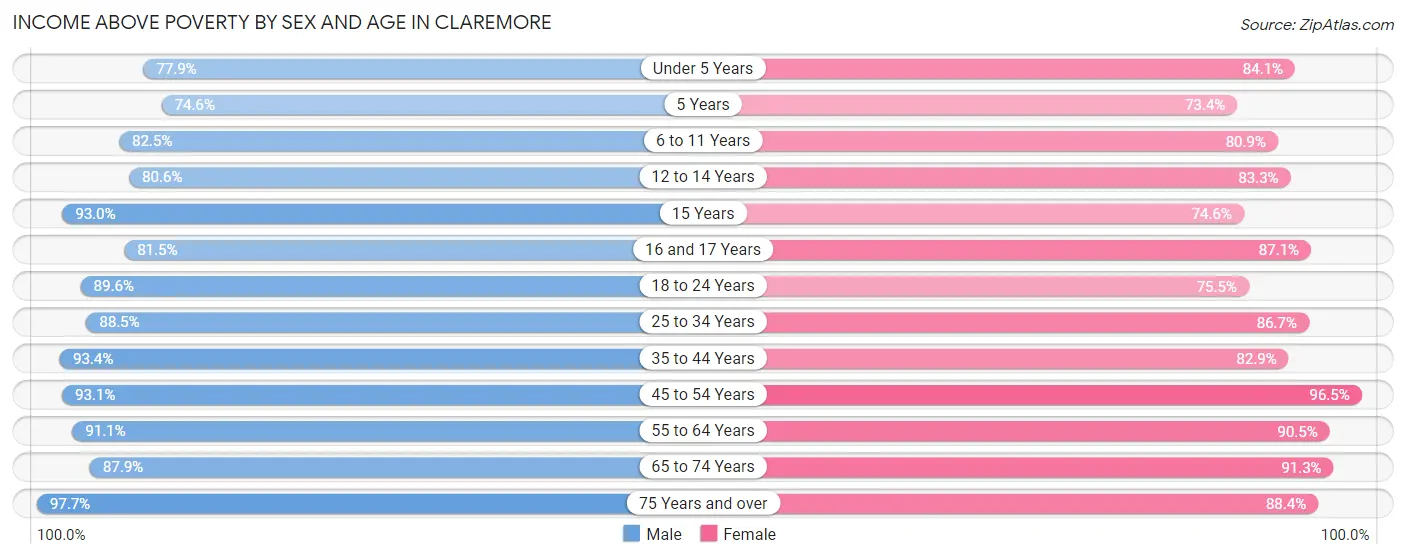
| Age Bracket | Male | Female |
| Under 5 Years | 537 (77.9%) | 455 (84.1%) |
| 5 Years | 85 (74.6%) | 80 (73.4%) |
| 6 to 11 Years | 569 (82.5%) | 585 (80.9%) |
| 12 to 14 Years | 345 (80.6%) | 229 (83.3%) |
| 15 Years | 146 (93.0%) | 47 (74.6%) |
| 16 and 17 Years | 185 (81.5%) | 202 (87.1%) |
| 18 to 24 Years | 809 (89.6%) | 744 (75.5%) |
| 25 to 34 Years | 1,297 (88.5%) | 1,262 (86.7%) |
| 35 to 44 Years | 1,049 (93.4%) | 928 (82.9%) |
| 45 to 54 Years | 844 (93.0%) | 1,067 (96.5%) |
| 55 to 64 Years | 822 (91.1%) | 870 (90.5%) |
| 65 to 74 Years | 630 (87.9%) | 1,012 (91.2%) |
| 75 Years and over | 342 (97.7%) | 1,019 (88.4%) |
| Total | 7,660 (88.3%) | 8,500 (86.5%) |
Income Below Poverty Among Married-Couple Families in Claremore
The poverty statistics for married-couple families in Claremore show that 3.5% or 104 of the total 3,013 families live below the poverty line. Families with 3 or 4 children have the highest poverty rate of 10.5%, comprising of 36 families. On the other hand, families with no children have the lowest poverty rate of 1.9%, which includes 30 families.
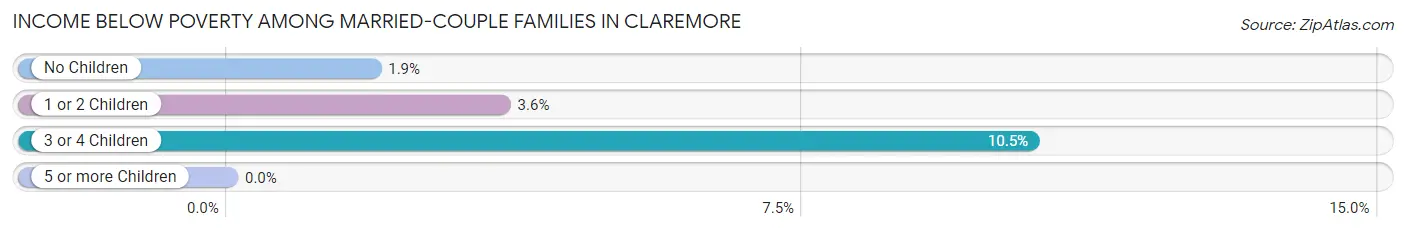
| Children | Above Poverty | Below Poverty |
| No Children | 1,573 (98.1%) | 30 (1.9%) |
| 1 or 2 Children | 1,028 (96.4%) | 38 (3.6%) |
| 3 or 4 Children | 308 (89.5%) | 36 (10.5%) |
| 5 or more Children | 0 (0.0%) | 0 (0.0%) |
| Total | 2,909 (96.6%) | 104 (3.5%) |
Income Below Poverty Among Single-Parent Households in Claremore
According to the poverty data in Claremore, 10.8% or 46 single-father households and 22.9% or 244 single-mother households are living below the poverty line. Among single-father households, those with 3 or 4 children have the highest poverty rate, with 21 households (87.5%) experiencing poverty. Likewise, among single-mother households, those with 5 or more children have the highest poverty rate, with 4 households (100.0%) falling below the poverty line.
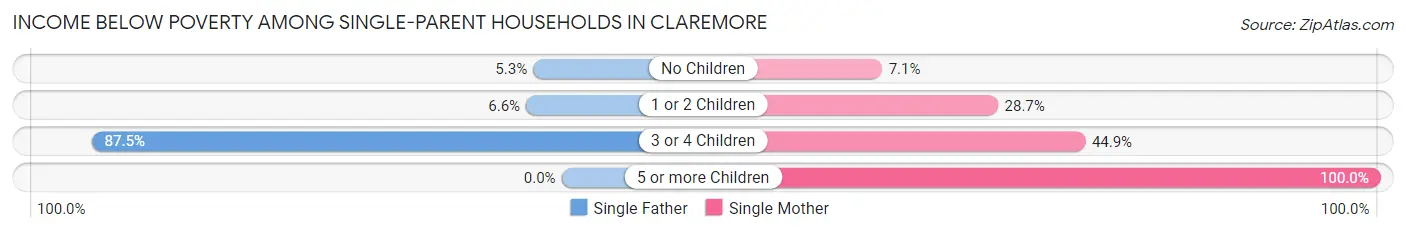
| Children | Single Father | Single Mother |
| No Children | 6 (5.3%) | 26 (7.1%) |
| 1 or 2 Children | 19 (6.6%) | 174 (28.7%) |
| 3 or 4 Children | 21 (87.5%) | 40 (44.9%) |
| 5 or more Children | 0 (0.0%) | 4 (100.0%) |
| Total | 46 (10.8%) | 244 (22.9%) |
Income Below Poverty Among Married-Couple vs Single-Parent Households in Claremore
The poverty data for Claremore shows that 104 of the married-couple family households (3.5%) and 290 of the single-parent households (19.5%) are living below the poverty level. Within the married-couple family households, those with 3 or 4 children have the highest poverty rate, with 36 households (10.5%) falling below the poverty line. Among the single-parent households, those with 5 or more children have the highest poverty rate, with 4 household (100.0%) living below poverty.
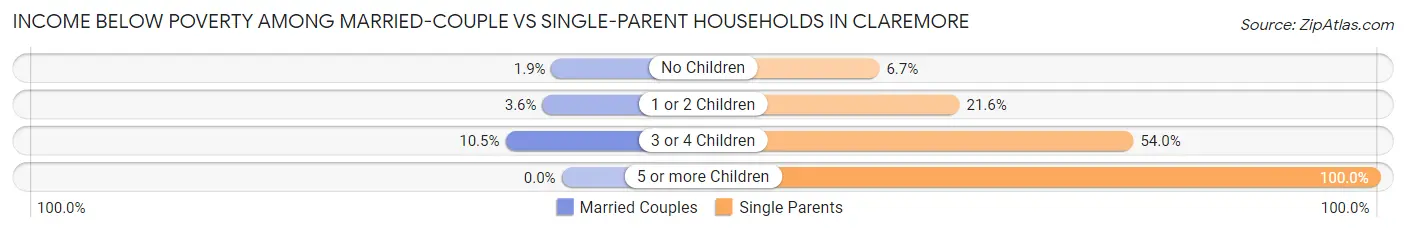
| Children | Married-Couple Families | Single-Parent Households |
| No Children | 30 (1.9%) | 32 (6.7%) |
| 1 or 2 Children | 38 (3.6%) | 193 (21.6%) |
| 3 or 4 Children | 36 (10.5%) | 61 (54.0%) |
| 5 or more Children | 0 (0.0%) | 4 (100.0%) |
| Total | 104 (3.5%) | 290 (19.5%) |
Race in Claremore
The most populous races in Claremore are White / Caucasian (13,161 | 66.7%), Native / Alaskan (3,363 | 17.1%), and Two or more Races (2,352 | 11.9%).
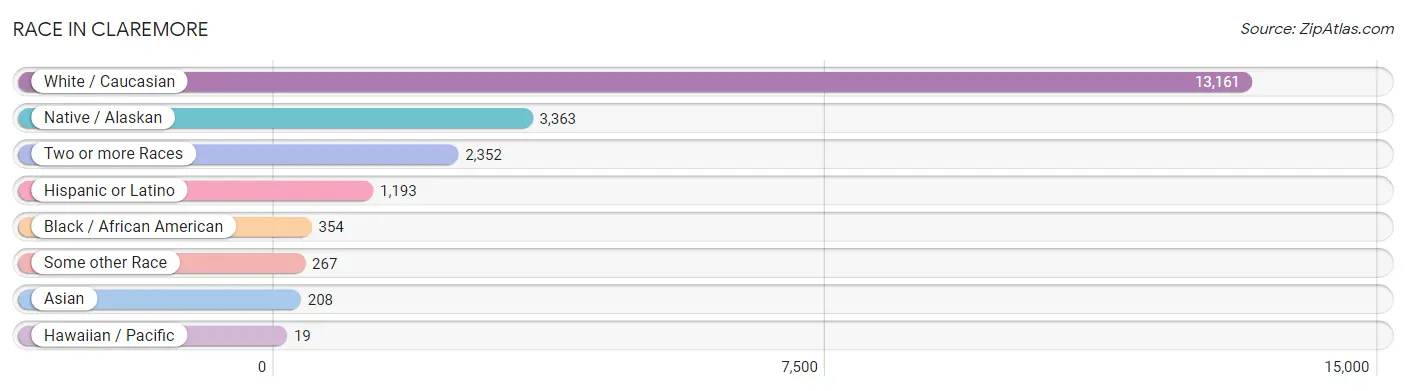
| Race | # Population | % Population |
| Asian | 208 | 1.1% |
| Black / African American | 354 | 1.8% |
| Hawaiian / Pacific | 19 | 0.1% |
| Hispanic or Latino | 1,193 | 6.0% |
| Native / Alaskan | 3,363 | 17.1% |
| White / Caucasian | 13,161 | 66.7% |
| Two or more Races | 2,352 | 11.9% |
| Some other Race | 267 | 1.3% |
| Total | 19,724 | 100.0% |
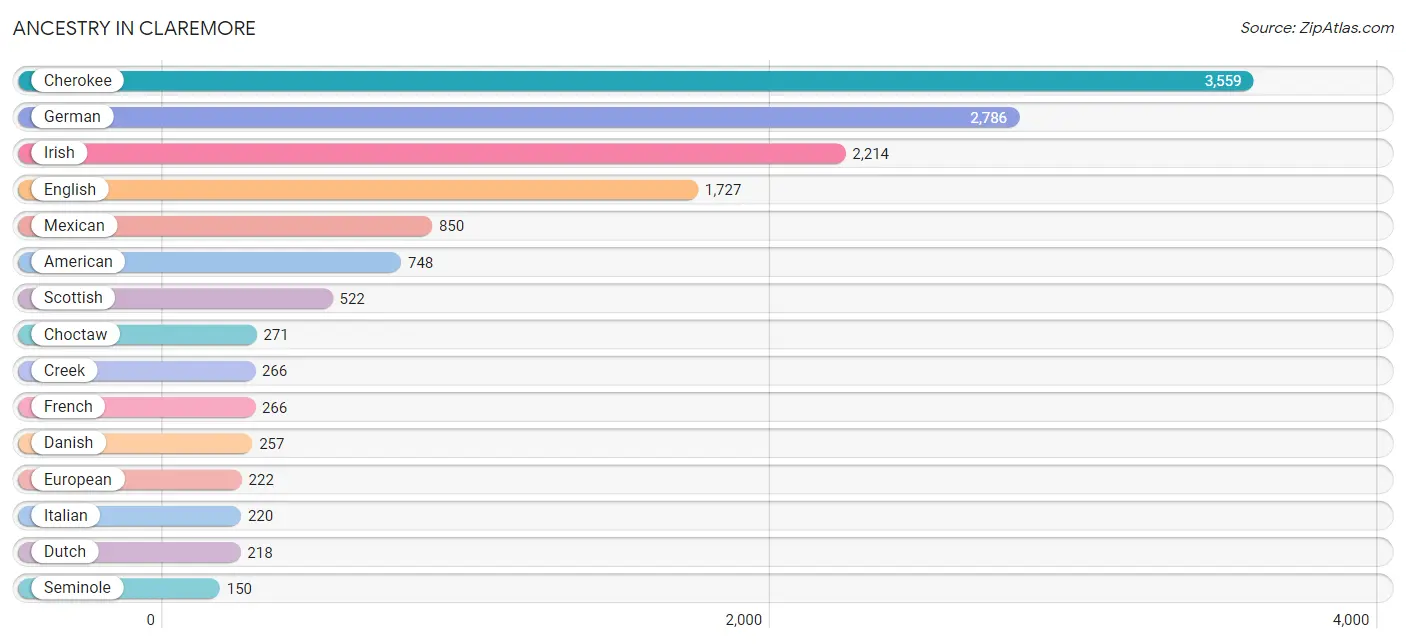
Ancestry in Claremore
The most populous ancestries reported in Claremore are Cherokee (3,559 | 18.0%), German (2,786 | 14.1%), Irish (2,214 | 11.2%), English (1,727 | 8.8%), and Mexican (850 | 4.3%), together accounting for 56.5% of all Claremore residents.
| Ancestry | # Population | % Population |
| African | 1 | 0.0% |
| Albanian | 25 | 0.1% |
| Alsatian | 10 | 0.1% |
| American | 748 | 3.8% |
| Apache | 10 | 0.1% |
| Arab | 53 | 0.3% |
| Bangladeshi | 15 | 0.1% |
| Bhutanese | 12 | 0.1% |
| Bolivian | 18 | 0.1% |
| British | 89 | 0.4% |
| Burmese | 10 | 0.1% |
| Cajun | 9 | 0.1% |
| Central American | 87 | 0.4% |
| Central American Indian | 99 | 0.5% |
| Cherokee | 3,559 | 18.0% |
| Chickasaw | 38 | 0.2% |
| Chippewa | 119 | 0.6% |
| Choctaw | 271 | 1.4% |
| Colombian | 2 | 0.0% |
| Comanche | 18 | 0.1% |
| Costa Rican | 5 | 0.0% |
| Creek | 266 | 1.3% |
| Czech | 39 | 0.2% |
| Czechoslovakian | 26 | 0.1% |
| Danish | 257 | 1.3% |
| Delaware | 54 | 0.3% |
| Dutch | 218 | 1.1% |
| Dutch West Indian | 15 | 0.1% |
| Eastern European | 22 | 0.1% |
| Ecuadorian | 7 | 0.0% |
| English | 1,727 | 8.8% |
| Estonian | 22 | 0.1% |
| European | 222 | 1.1% |
| Fijian | 13 | 0.1% |
| Finnish | 32 | 0.2% |
| French | 266 | 1.3% |
| German | 2,786 | 14.1% |
| Greek | 19 | 0.1% |
| Guatemalan | 12 | 0.1% |
| Haitian | 17 | 0.1% |
| Honduran | 43 | 0.2% |
| Hungarian | 18 | 0.1% |
| Icelander | 1 | 0.0% |
| Indian (Asian) | 8 | 0.0% |
| Inupiat | 12 | 0.1% |
| Irish | 2,214 | 11.2% |
| Italian | 220 | 1.1% |
| Jamaican | 7 | 0.0% |
| Kiowa | 7 | 0.0% |
| Korean | 95 | 0.5% |
| Lebanese | 35 | 0.2% |
| Lithuanian | 11 | 0.1% |
| Mexican | 850 | 4.3% |
| Northern European | 29 | 0.2% |
| Norwegian | 134 | 0.7% |
| Osage | 86 | 0.4% |
| Pakistani | 10 | 0.1% |
| Pennsylvania German | 26 | 0.1% |
| Peruvian | 27 | 0.1% |
| Polish | 93 | 0.5% |
| Portuguese | 76 | 0.4% |
| Potawatomi | 16 | 0.1% |
| Puerto Rican | 128 | 0.6% |
| Russian | 53 | 0.3% |
| Salvadoran | 27 | 0.1% |
| Samoan | 18 | 0.1% |
| Scandinavian | 127 | 0.6% |
| Scotch-Irish | 132 | 0.7% |
| Scottish | 522 | 2.6% |
| Seminole | 150 | 0.8% |
| Shoshone | 9 | 0.1% |
| Sierra Leonean | 33 | 0.2% |
| Sioux | 9 | 0.1% |
| Slavic | 9 | 0.1% |
| South American | 54 | 0.3% |
| Spaniard | 10 | 0.1% |
| Spanish | 4 | 0.0% |
| Sri Lankan | 123 | 0.6% |
| Subsaharan African | 45 | 0.2% |
| Swedish | 69 | 0.4% |
| Swiss | 13 | 0.1% |
| Thai | 24 | 0.1% |
| Vietnamese | 31 | 0.2% |
| Welsh | 103 | 0.5% |
| Yugoslavian | 29 | 0.2% | View All 85 Rows |
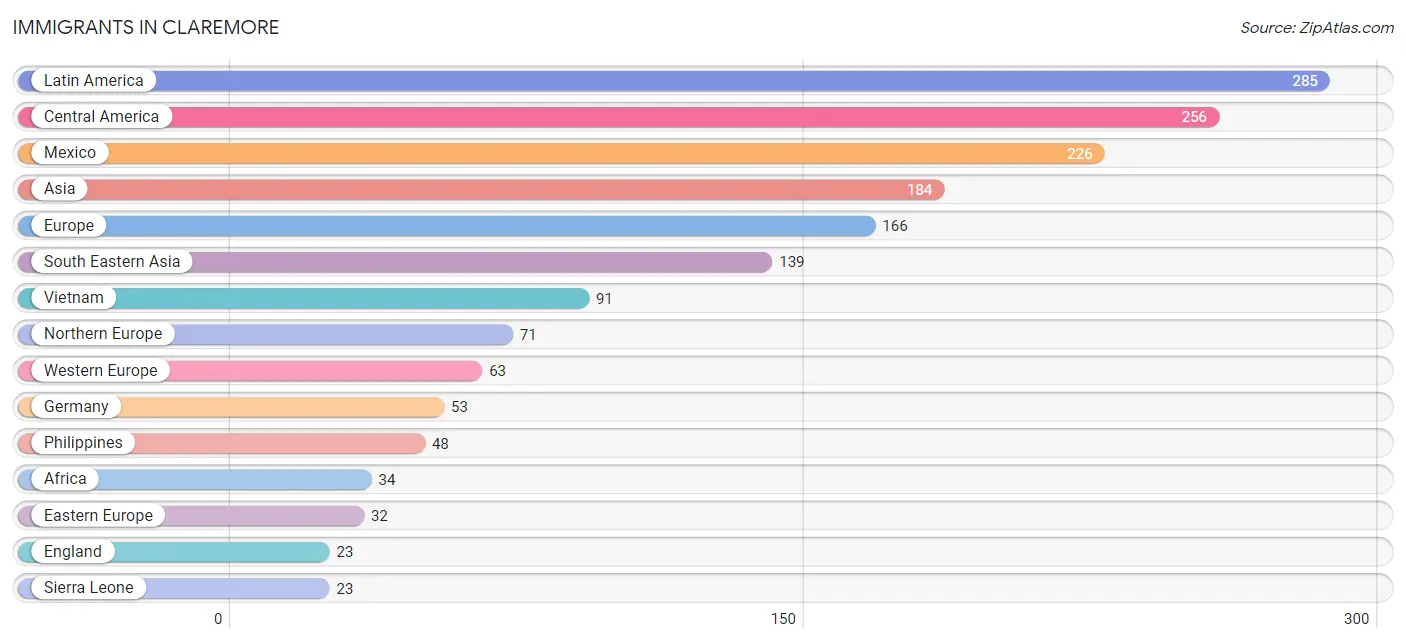
Immigrants in Claremore
The most numerous immigrant groups reported in Claremore came from Latin America (285 | 1.4%), Central America (256 | 1.3%), Mexico (226 | 1.1%), Asia (184 | 0.9%), and Europe (166 | 0.8%), together accounting for 5.7% of all Claremore residents.
| Immigration Origin | # Population | % Population |
| Africa | 34 | 0.2% |
| Argentina | 7 | 0.0% |
| Asia | 184 | 0.9% |
| Bangladesh | 12 | 0.1% |
| Bosnia and Herzegovina | 11 | 0.1% |
| Canada | 11 | 0.1% |
| Caribbean | 7 | 0.0% |
| Central America | 256 | 1.3% |
| China | 2 | 0.0% |
| Colombia | 2 | 0.0% |
| Czechoslovakia | 1 | 0.0% |
| Denmark | 8 | 0.0% |
| Eastern Africa | 11 | 0.1% |
| Eastern Asia | 20 | 0.1% |
| Eastern Europe | 32 | 0.2% |
| England | 23 | 0.1% |
| Europe | 166 | 0.8% |
| France | 10 | 0.1% |
| Germany | 53 | 0.3% |
| Guatemala | 12 | 0.1% |
| Haiti | 7 | 0.0% |
| Honduras | 18 | 0.1% |
| India | 2 | 0.0% |
| Ireland | 15 | 0.1% |
| Korea | 18 | 0.1% |
| Latin America | 285 | 1.4% |
| Mexico | 226 | 1.1% |
| Northern Europe | 71 | 0.4% |
| Peru | 13 | 0.1% |
| Philippines | 48 | 0.2% |
| Poland | 3 | 0.0% |
| Russia | 10 | 0.1% |
| Saudi Arabia | 11 | 0.1% |
| Scotland | 8 | 0.0% |
| Sierra Leone | 23 | 0.1% |
| South America | 22 | 0.1% |
| South Central Asia | 14 | 0.1% |
| South Eastern Asia | 139 | 0.7% |
| Vietnam | 91 | 0.5% |
| Western Africa | 23 | 0.1% |
| Western Asia | 11 | 0.1% |
| Western Europe | 63 | 0.3% | View All 42 Rows |
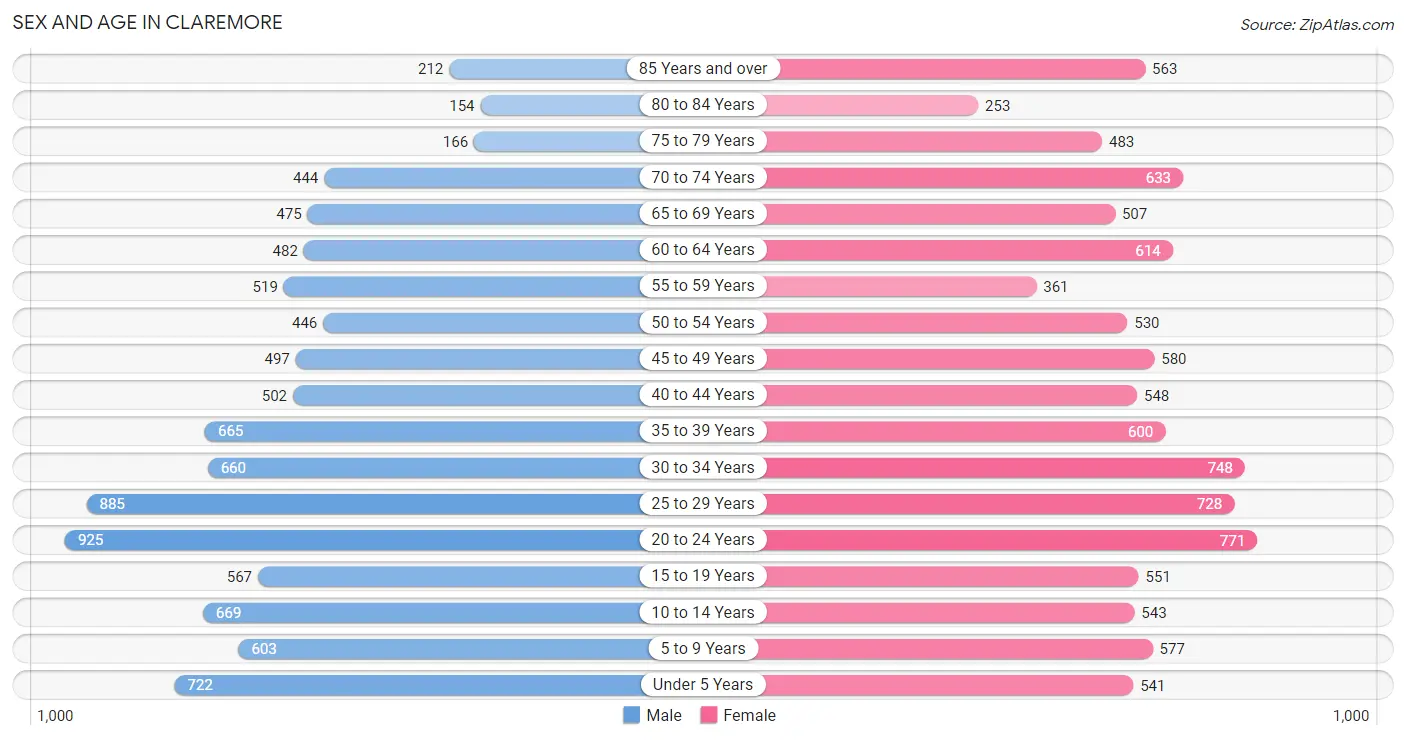
Sex and Age in Claremore
Sex and Age in Claremore
The most populous age groups in Claremore are 20 to 24 Years (925 | 9.6%) for men and 20 to 24 Years (771 | 7.6%) for women.
| Age Bracket | Male | Female |
| Under 5 Years | 722 (7.5%) | 541 (5.3%) |
| 5 to 9 Years | 603 (6.3%) | 577 (5.7%) |
| 10 to 14 Years | 669 (7.0%) | 543 (5.4%) |
| 15 to 19 Years | 567 (5.9%) | 551 (5.4%) |
| 20 to 24 Years | 925 (9.6%) | 771 (7.6%) |
| 25 to 29 Years | 885 (9.2%) | 728 (7.2%) |
| 30 to 34 Years | 660 (6.9%) | 748 (7.4%) |
| 35 to 39 Years | 665 (6.9%) | 600 (5.9%) |
| 40 to 44 Years | 502 (5.2%) | 548 (5.4%) |
| 45 to 49 Years | 497 (5.2%) | 580 (5.7%) |
| 50 to 54 Years | 446 (4.6%) | 530 (5.2%) |
| 55 to 59 Years | 519 (5.4%) | 361 (3.6%) |
| 60 to 64 Years | 482 (5.0%) | 614 (6.1%) |
| 65 to 69 Years | 475 (5.0%) | 507 (5.0%) |
| 70 to 74 Years | 444 (4.6%) | 633 (6.2%) |
| 75 to 79 Years | 166 (1.7%) | 483 (4.8%) |
| 80 to 84 Years | 154 (1.6%) | 253 (2.5%) |
| 85 Years and over | 212 (2.2%) | 563 (5.6%) |
| Total | 9,593 (100.0%) | 10,131 (100.0%) |
Families and Households in Claremore
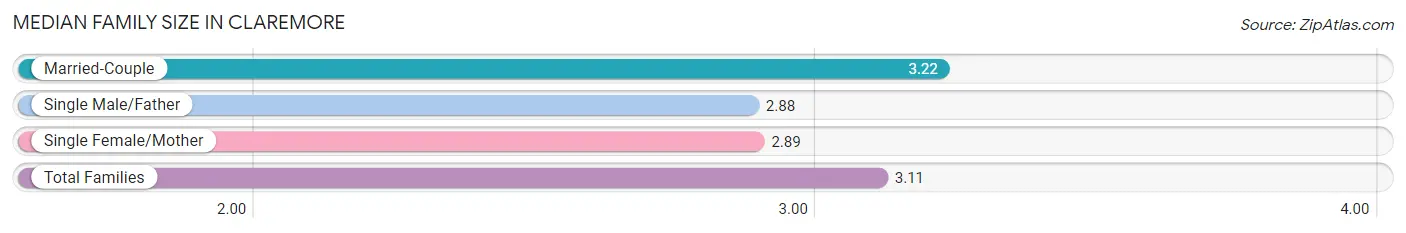
Median Family Size in Claremore
The median family size in Claremore is 3.11 persons per family, with married-couple families (3,013 | 66.9%) accounting for the largest median family size of 3.22 persons per family. On the other hand, single male/father families (424 | 9.4%) represent the smallest median family size with 2.88 persons per family.
| Family Type | # Families | Family Size |
| Married-Couple | 3,013 (66.9%) | 3.22 |
| Single Male/Father | 424 (9.4%) | 2.88 |
| Single Female/Mother | 1,067 (23.7%) | 2.89 |
| Total Families | 4,504 (100.0%) | 3.11 |
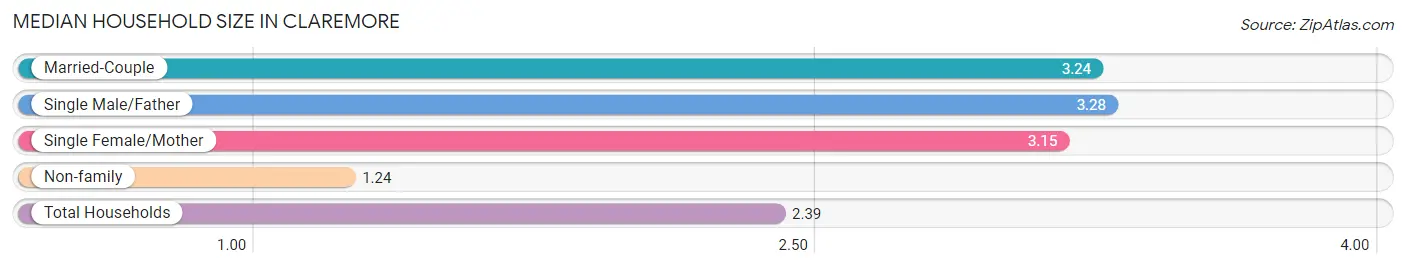
Median Household Size in Claremore
The median household size in Claremore is 2.39 persons per household, with single male/father households (424 | 5.5%) accounting for the largest median household size of 3.28 persons per household. non-family households (3,238 | 41.8%) represent the smallest median household size with 1.24 persons per household.
| Household Type | # Households | Household Size |
| Married-Couple | 3,013 (38.9%) | 3.24 |
| Single Male/Father | 424 (5.5%) | 3.28 |
| Single Female/Mother | 1,067 (13.8%) | 3.15 |
| Non-family | 3,238 (41.8%) | 1.24 |
| Total Households | 7,742 (100.0%) | 2.39 |
Household Size by Marriage Status in Claremore
Out of a total of 7,742 households in Claremore, 4,504 (58.2%) are family households, while 3,238 (41.8%) are nonfamily households. The most numerous type of family households are 2-person households, comprising 2,041, and the most common type of nonfamily households are 1-person households, comprising 2,672.
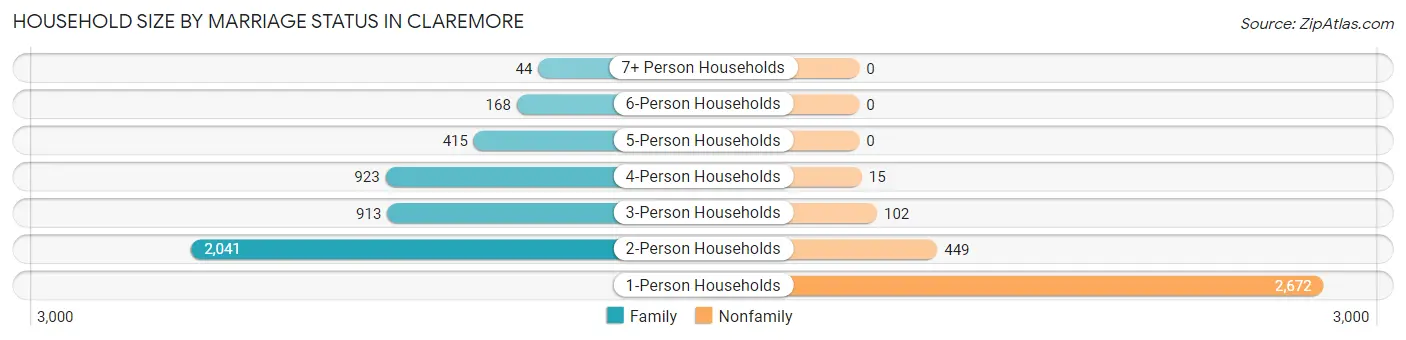
| Household Size | Family Households | Nonfamily Households |
| 1-Person Households | - | 2,672 (34.5%) |
| 2-Person Households | 2,041 (26.4%) | 449 (5.8%) |
| 3-Person Households | 913 (11.8%) | 102 (1.3%) |
| 4-Person Households | 923 (11.9%) | 15 (0.2%) |
| 5-Person Households | 415 (5.4%) | 0 (0.0%) |
| 6-Person Households | 168 (2.2%) | 0 (0.0%) |
| 7+ Person Households | 44 (0.6%) | 0 (0.0%) |
| Total | 4,504 (58.2%) | 3,238 (41.8%) |
Female Fertility in Claremore
Fertility by Age in Claremore
Average fertility rate in Claremore is 71.0 births per 1,000 women. Women in the age bracket of 20 to 34 years have the highest fertility rate with 122.0 births per 1,000 women. Women in the age bracket of 20 to 34 years acount for 84.8% of all women with births.
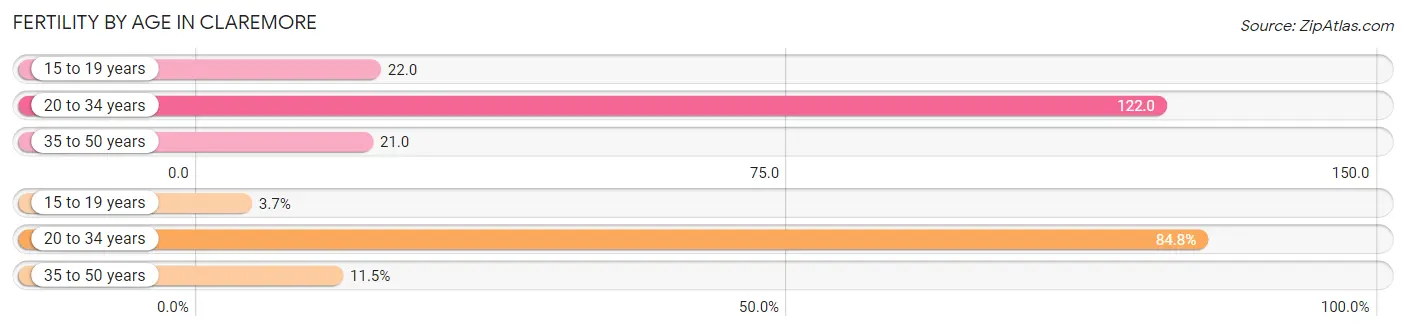
| Age Bracket | Women with Births | Births / 1,000 Women |
| 15 to 19 years | 12 (3.7%) | 22.0 |
| 20 to 34 years | 274 (84.8%) | 122.0 |
| 35 to 50 years | 37 (11.5%) | 21.0 |
| Total | 323 (100.0%) | 71.0 |
Fertility by Age by Marriage Status in Claremore
65.9% of women with births (323) in Claremore are married. The highest percentage of unmarried women with births falls into 15 to 19 years age bracket with 100.0% of them unmarried at the time of birth, while the lowest percentage of unmarried women with births belong to 35 to 50 years age bracket with 27.0% of them unmarried.
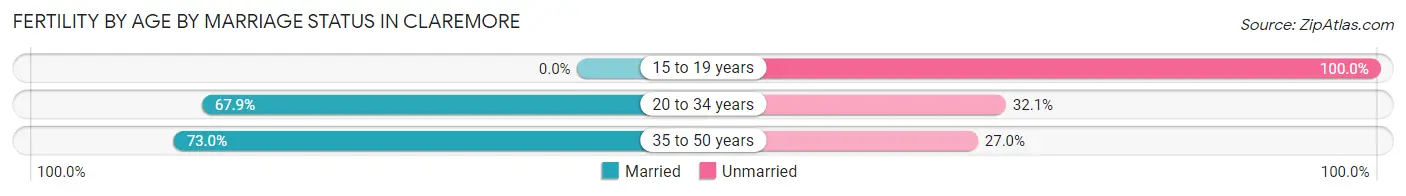
| Age Bracket | Married | Unmarried |
| 15 to 19 years | 0 (0.0%) | 12 (100.0%) |
| 20 to 34 years | 186 (67.9%) | 88 (32.1%) |
| 35 to 50 years | 27 (73.0%) | 10 (27.0%) |
| Total | 213 (65.9%) | 110 (34.1%) |
Fertility by Education in Claremore
Average fertility rate in Claremore is 71.0 births per 1,000 women. Women with the education attainment of graduate degree have the highest fertility rate of 156.0 births per 1,000 women, while women with the education attainment of less than high school have the lowest fertility at 41.0 births per 1,000 women. Women with the education attainment of high school diploma represent 39.6% of all women with births.
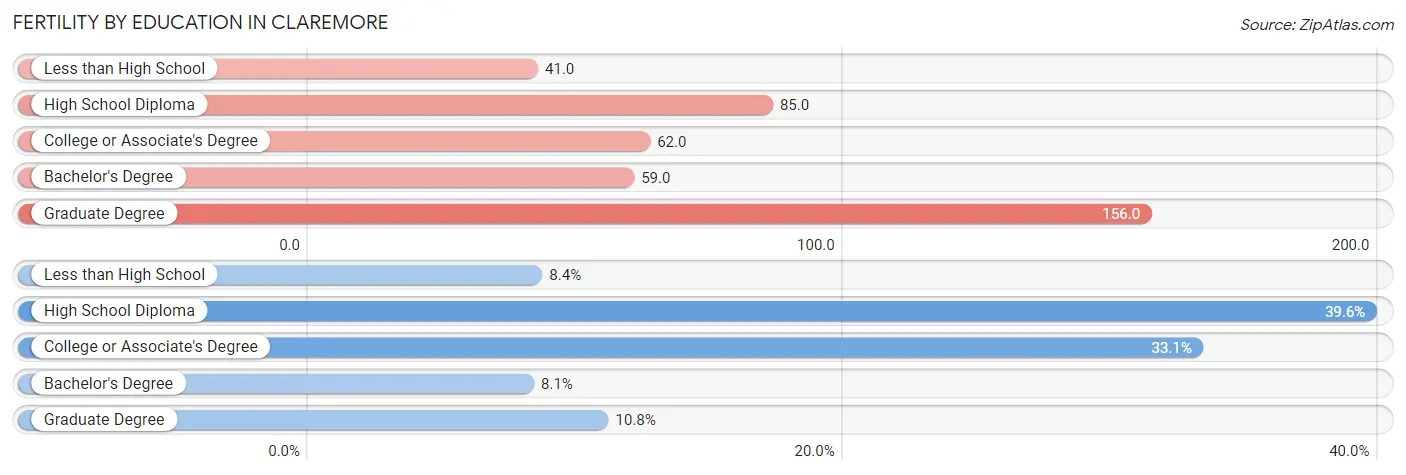
| Educational Attainment | Women with Births | Births / 1,000 Women |
| Less than High School | 27 (8.4%) | 41.0 |
| High School Diploma | 128 (39.6%) | 85.0 |
| College or Associate's Degree | 107 (33.1%) | 62.0 |
| Bachelor's Degree | 26 (8.1%) | 59.0 |
| Graduate Degree | 35 (10.8%) | 156.0 |
| Total | 323 (100.0%) | 71.0 |
Fertility by Education by Marriage Status in Claremore
34.1% of women with births in Claremore are unmarried. Women with the educational attainment of bachelor's degree are most likely to be married with 100.0% of them married at childbirth, while women with the educational attainment of less than high school are least likely to be married with 100.0% of them unmarried at childbirth.
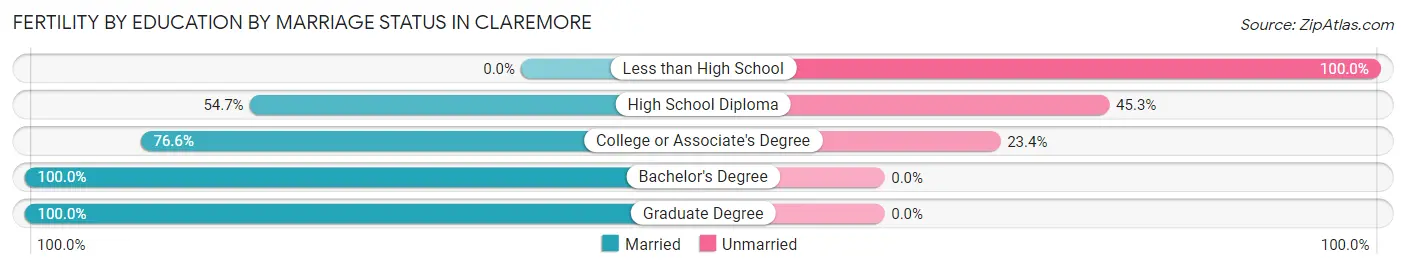
| Educational Attainment | Married | Unmarried |
| Less than High School | 0 (0.0%) | 27 (100.0%) |
| High School Diploma | 70 (54.7%) | 58 (45.3%) |
| College or Associate's Degree | 82 (76.6%) | 25 (23.4%) |
| Bachelor's Degree | 26 (100.0%) | 0 (0.0%) |
| Graduate Degree | 35 (100.0%) | 0 (0.0%) |
| Total | 213 (65.9%) | 110 (34.1%) |
Employment Characteristics in Claremore
Employment by Class of Employer in Claremore
Among the 8,833 employed individuals in Claremore, private company employees (6,608 | 74.8%), local government employees (548 | 6.2%), and state government employees (445 | 5.0%) make up the most common classes of employment.
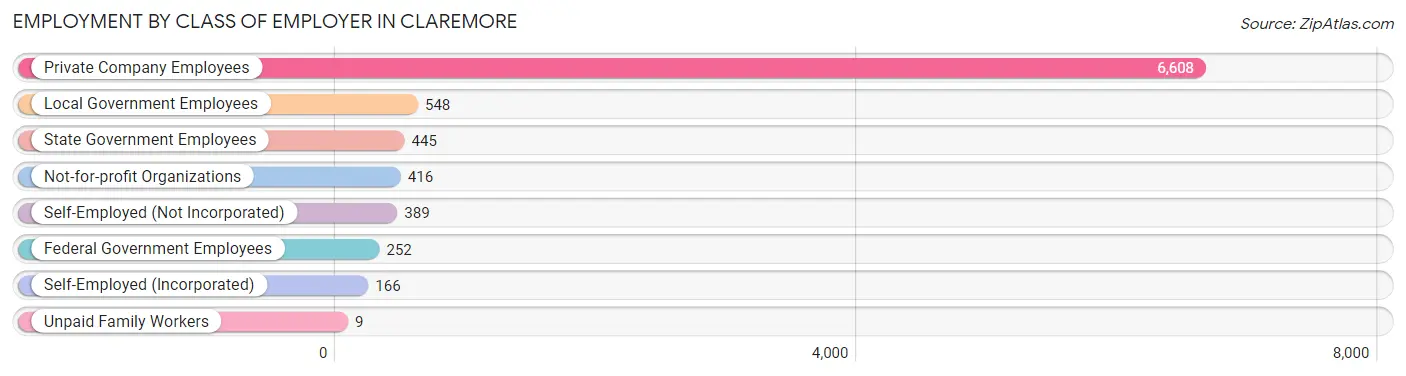
| Employer Class | # Employees | % Employees |
| Private Company Employees | 6,608 | 74.8% |
| Self-Employed (Incorporated) | 166 | 1.9% |
| Self-Employed (Not Incorporated) | 389 | 4.4% |
| Not-for-profit Organizations | 416 | 4.7% |
| Local Government Employees | 548 | 6.2% |
| State Government Employees | 445 | 5.0% |
| Federal Government Employees | 252 | 2.9% |
| Unpaid Family Workers | 9 | 0.1% |
| Total | 8,833 | 100.0% |
Employment Status by Age in Claremore
According to the labor force statistics for Claremore, out of the total population over 16 years of age (15,847), 60.1% or 9,524 individuals are in the labor force, with 5.8% or 552 of them unemployed. The age group with the highest labor force participation rate is 25 to 29 years, with 86.3% or 1,392 individuals in the labor force. Within the labor force, the 45 to 54 years age range has the highest percentage of unemployed individuals, with 8.9% or 154 of them being unemployed.
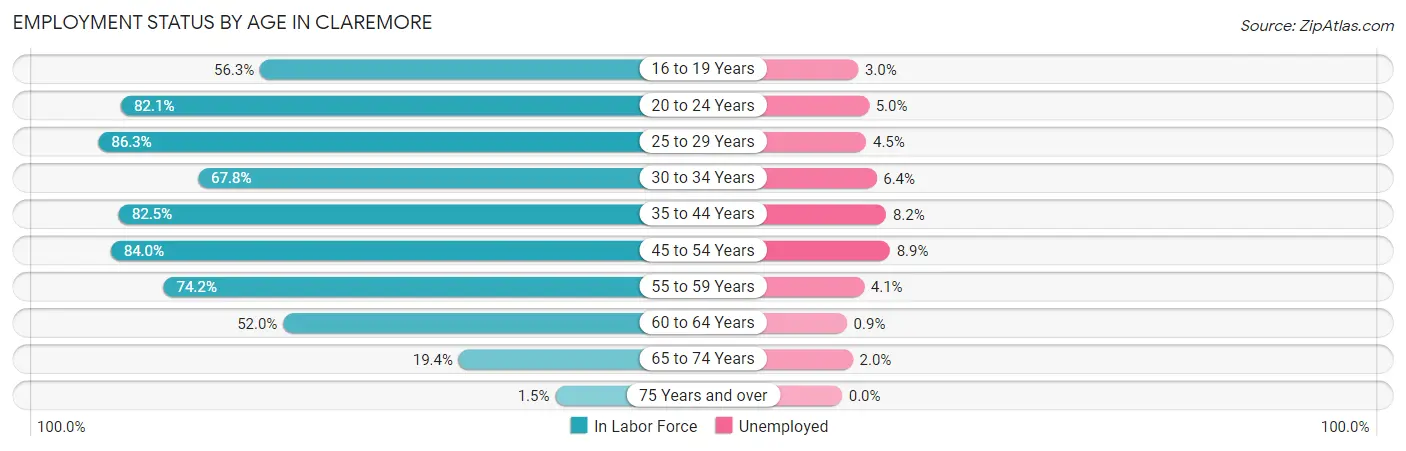
| Age Bracket | In Labor Force | Unemployed |
| 16 to 19 Years | 504 (56.3%) | 15 (3.0%) |
| 20 to 24 Years | 1,392 (82.1%) | 70 (5.0%) |
| 25 to 29 Years | 1,392 (86.3%) | 63 (4.5%) |
| 30 to 34 Years | 955 (67.8%) | 61 (6.4%) |
| 35 to 44 Years | 1,910 (82.5%) | 157 (8.2%) |
| 45 to 54 Years | 1,725 (84.0%) | 154 (8.9%) |
| 55 to 59 Years | 653 (74.2%) | 27 (4.1%) |
| 60 to 64 Years | 570 (52.0%) | 5 (0.9%) |
| 65 to 74 Years | 399 (19.4%) | 8 (2.0%) |
| 75 Years and over | 27 (1.5%) | 0 (0.0%) |
| Total | 9,524 (60.1%) | 552 (5.8%) |
Employment Status by Educational Attainment in Claremore
According to labor force statistics for Claremore, 76.9% of individuals (7,202) out of the total population between 25 and 64 years of age (9,365) are in the labor force, with 6.5% or 468 of them being unemployed. The group with the highest labor force participation rate are those with the educational attainment of bachelor's degree or higher, with 85.4% or 1,637 individuals in the labor force. Within the labor force, individuals with high school diploma education have the highest percentage of unemployment, with 11.7% or 323 of them being unemployed.
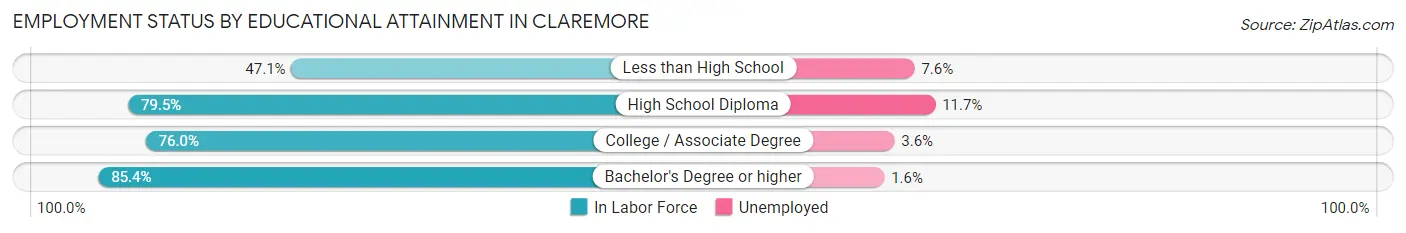
| Educational Attainment | In Labor Force | Unemployed |
| Less than High School | 357 (47.1%) | 58 (7.6%) |
| High School Diploma | 2,760 (79.5%) | 406 (11.7%) |
| College / Associate Degree | 2,446 (76.0%) | 116 (3.6%) |
| Bachelor's Degree or higher | 1,637 (85.4%) | 31 (1.6%) |
| Total | 7,202 (76.9%) | 609 (6.5%) |
Employment Occupations by Sex in Claremore
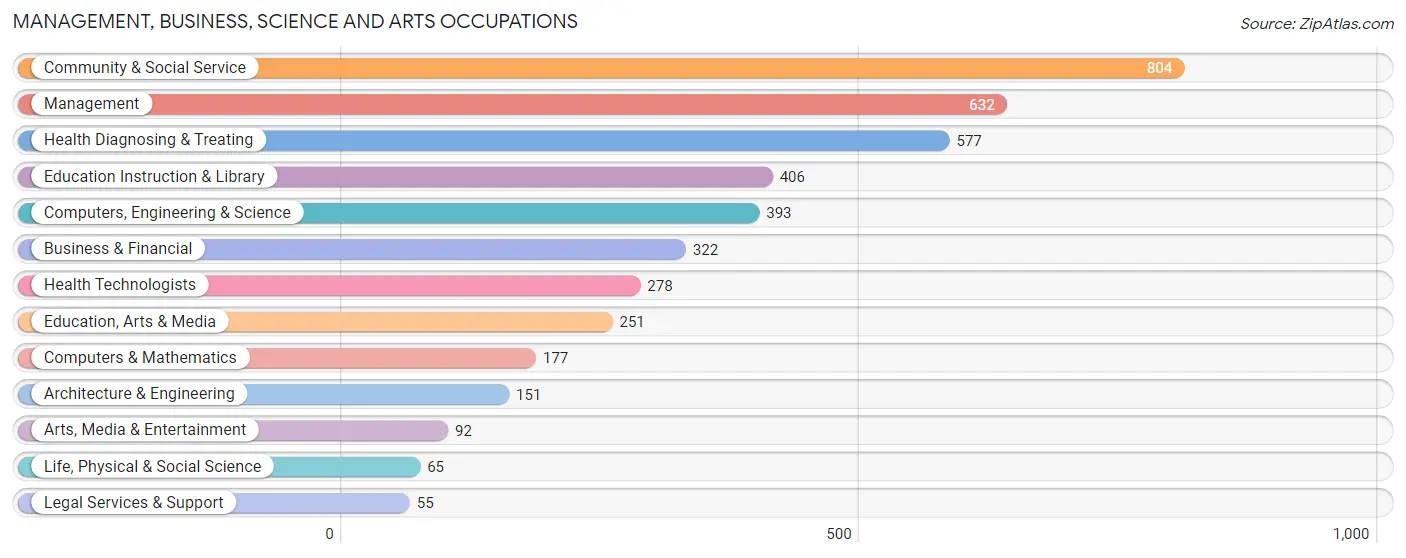
Management, Business, Science and Arts Occupations
The most common Management, Business, Science and Arts occupations in Claremore are Community & Social Service (804 | 9.0%), Management (632 | 7.1%), Health Diagnosing & Treating (577 | 6.4%), Education Instruction & Library (406 | 4.5%), and Computers, Engineering & Science (393 | 4.4%).
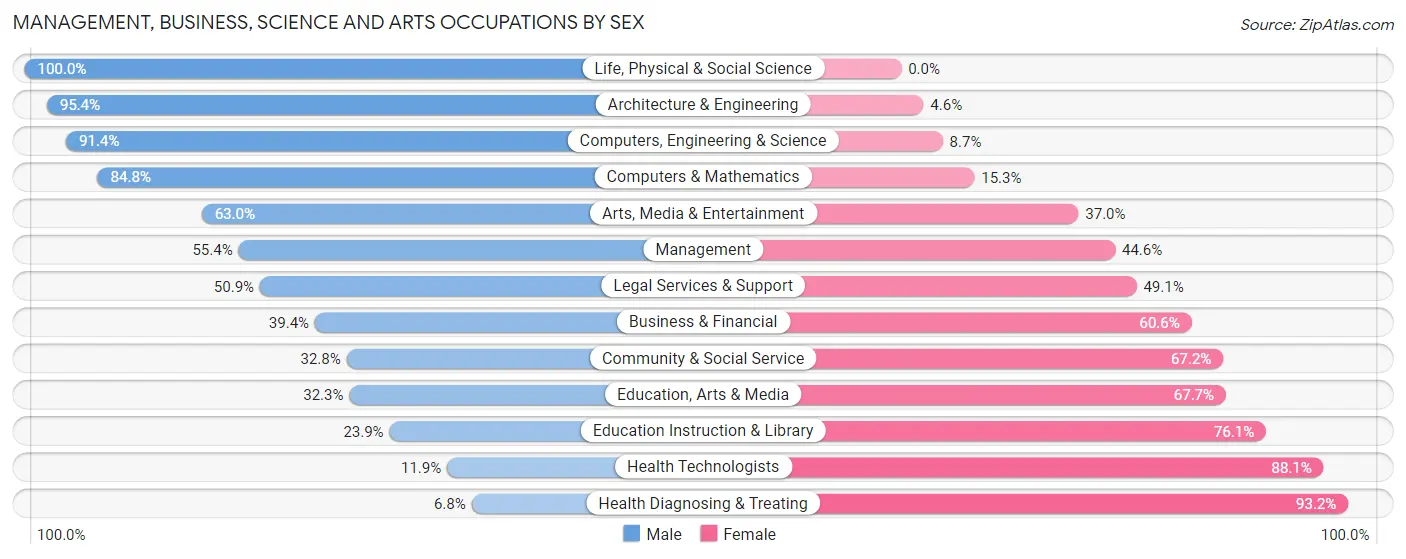
Management, Business, Science and Arts Occupations by Sex
Within the Management, Business, Science and Arts occupations in Claremore, the most male-oriented occupations are Life, Physical & Social Science (100.0%), Architecture & Engineering (95.4%), and Computers, Engineering & Science (91.3%), while the most female-oriented occupations are Health Diagnosing & Treating (93.2%), Health Technologists (88.1%), and Education Instruction & Library (76.1%).
| Occupation | Male | Female |
| Management | 350 (55.4%) | 282 (44.6%) |
| Business & Financial | 127 (39.4%) | 195 (60.6%) |
| Computers, Engineering & Science | 359 (91.3%) | 34 (8.6%) |
| Computers & Mathematics | 150 (84.8%) | 27 (15.2%) |
| Architecture & Engineering | 144 (95.4%) | 7 (4.6%) |
| Life, Physical & Social Science | 65 (100.0%) | 0 (0.0%) |
| Community & Social Service | 264 (32.8%) | 540 (67.2%) |
| Education, Arts & Media | 81 (32.3%) | 170 (67.7%) |
| Legal Services & Support | 28 (50.9%) | 27 (49.1%) |
| Education Instruction & Library | 97 (23.9%) | 309 (76.1%) |
| Arts, Media & Entertainment | 58 (63.0%) | 34 (37.0%) |
| Health Diagnosing & Treating | 39 (6.8%) | 538 (93.2%) |
| Health Technologists | 33 (11.9%) | 245 (88.1%) |
| Total (Category) | 1,139 (41.7%) | 1,589 (58.3%) |
| Total (Overall) | 4,683 (52.3%) | 4,275 (47.7%) |
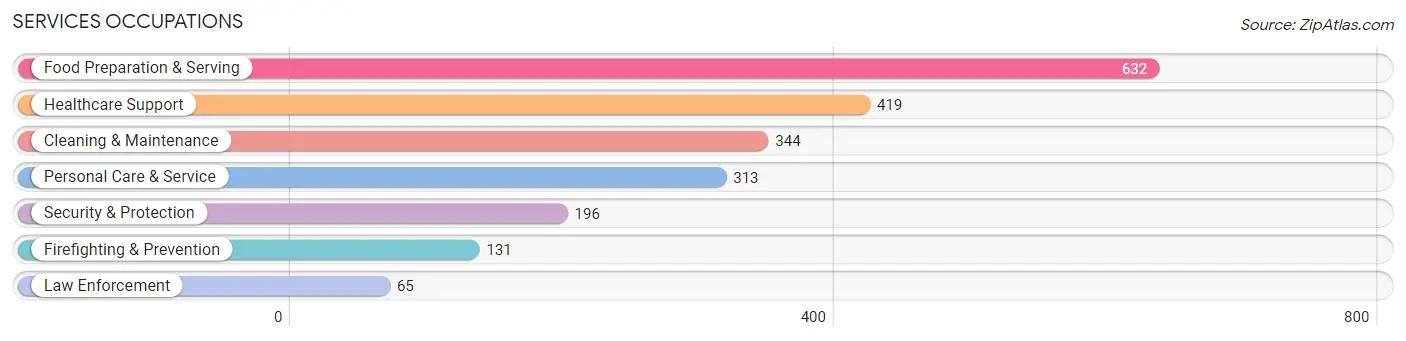
Services Occupations
The most common Services occupations in Claremore are Food Preparation & Serving (632 | 7.1%), Healthcare Support (419 | 4.7%), Cleaning & Maintenance (344 | 3.8%), Personal Care & Service (313 | 3.5%), and Security & Protection (196 | 2.2%).
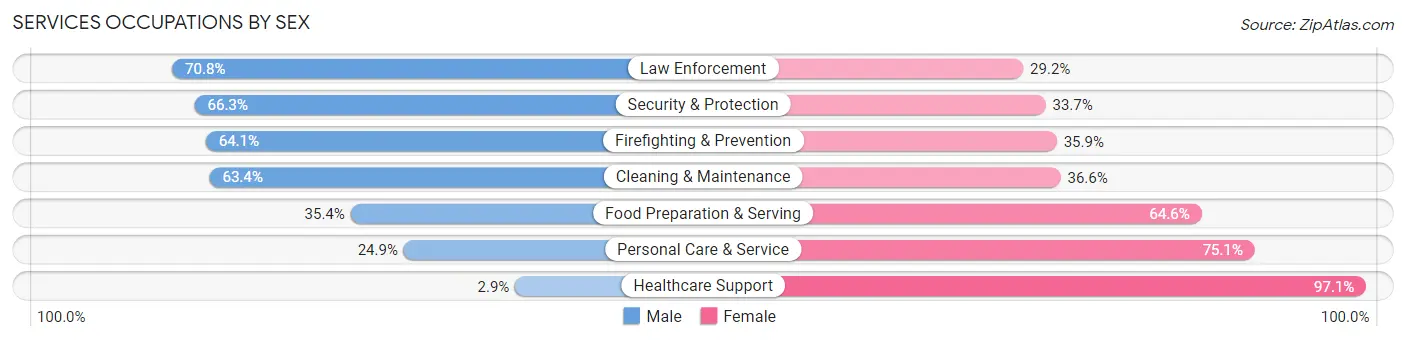
Services Occupations by Sex
Within the Services occupations in Claremore, the most male-oriented occupations are Law Enforcement (70.8%), Security & Protection (66.3%), and Firefighting & Prevention (64.1%), while the most female-oriented occupations are Healthcare Support (97.1%), Personal Care & Service (75.1%), and Food Preparation & Serving (64.6%).
| Occupation | Male | Female |
| Healthcare Support | 12 (2.9%) | 407 (97.1%) |
| Security & Protection | 130 (66.3%) | 66 (33.7%) |
| Firefighting & Prevention | 84 (64.1%) | 47 (35.9%) |
| Law Enforcement | 46 (70.8%) | 19 (29.2%) |
| Food Preparation & Serving | 224 (35.4%) | 408 (64.6%) |
| Cleaning & Maintenance | 218 (63.4%) | 126 (36.6%) |
| Personal Care & Service | 78 (24.9%) | 235 (75.1%) |
| Total (Category) | 662 (34.8%) | 1,242 (65.2%) |
| Total (Overall) | 4,683 (52.3%) | 4,275 (47.7%) |
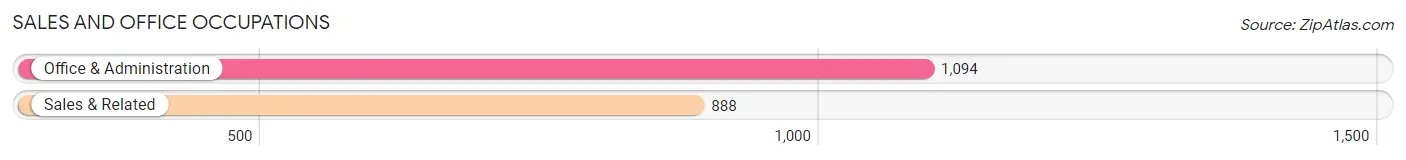
Sales and Office Occupations
The most common Sales and Office occupations in Claremore are Office & Administration (1,094 | 12.2%), and Sales & Related (888 | 9.9%).
Sales and Office Occupations by Sex
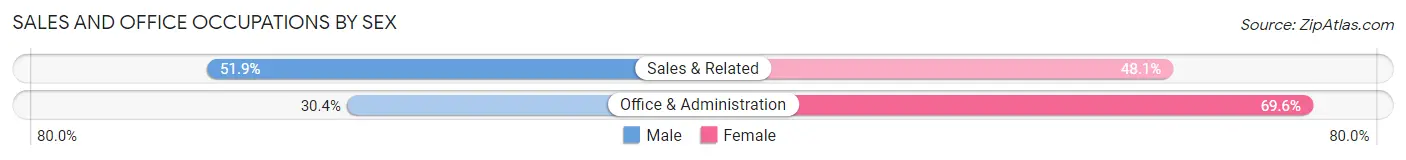
| Occupation | Male | Female |
| Sales & Related | 461 (51.9%) | 427 (48.1%) |
| Office & Administration | 333 (30.4%) | 761 (69.6%) |
| Total (Category) | 794 (40.1%) | 1,188 (59.9%) |
| Total (Overall) | 4,683 (52.3%) | 4,275 (47.7%) |
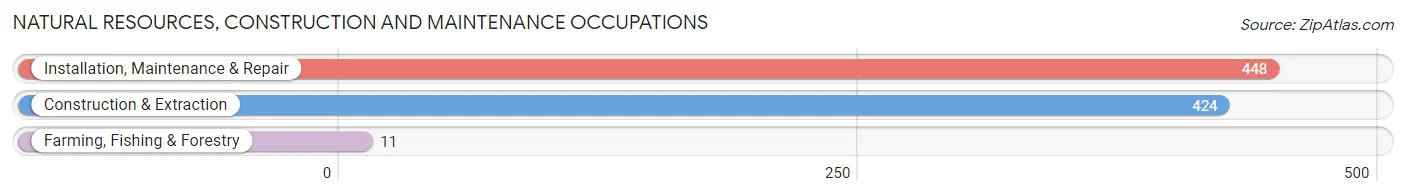
Natural Resources, Construction and Maintenance Occupations
The most common Natural Resources, Construction and Maintenance occupations in Claremore are Installation, Maintenance & Repair (448 | 5.0%), Construction & Extraction (424 | 4.7%), and Farming, Fishing & Forestry (11 | 0.1%).
Natural Resources, Construction and Maintenance Occupations by Sex
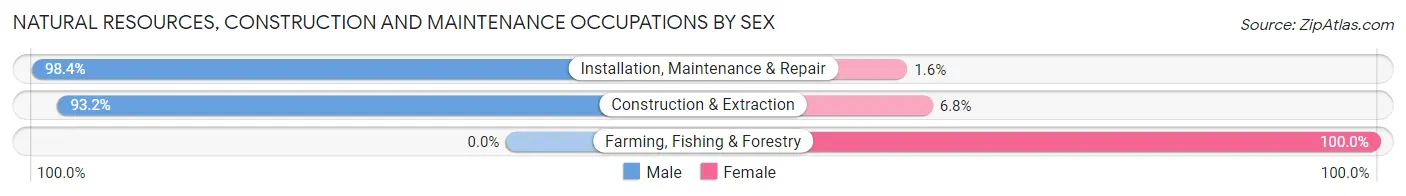
| Occupation | Male | Female |
| Farming, Fishing & Forestry | 0 (0.0%) | 11 (100.0%) |
| Construction & Extraction | 395 (93.2%) | 29 (6.8%) |
| Installation, Maintenance & Repair | 441 (98.4%) | 7 (1.6%) |
| Total (Category) | 836 (94.7%) | 47 (5.3%) |
| Total (Overall) | 4,683 (52.3%) | 4,275 (47.7%) |
Production, Transportation and Moving Occupations
The most common Production, Transportation and Moving occupations in Claremore are Production (858 | 9.6%), Material Moving (365 | 4.1%), and Transportation (238 | 2.7%).
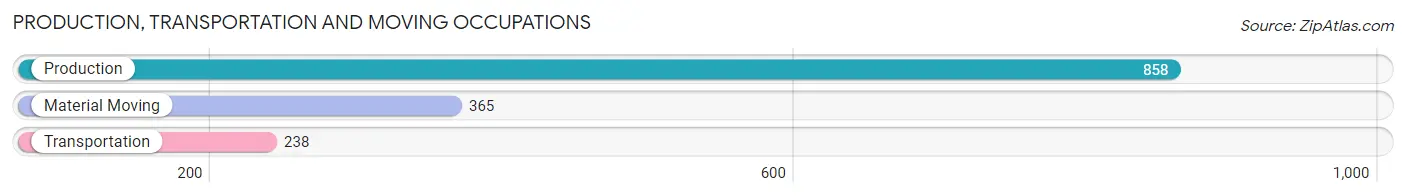
Production, Transportation and Moving Occupations by Sex

| Occupation | Male | Female |
| Production | 750 (87.4%) | 108 (12.6%) |
| Transportation | 210 (88.2%) | 28 (11.8%) |
| Material Moving | 292 (80.0%) | 73 (20.0%) |
| Total (Category) | 1,252 (85.7%) | 209 (14.3%) |
| Total (Overall) | 4,683 (52.3%) | 4,275 (47.7%) |
Employment Industries by Sex in Claremore
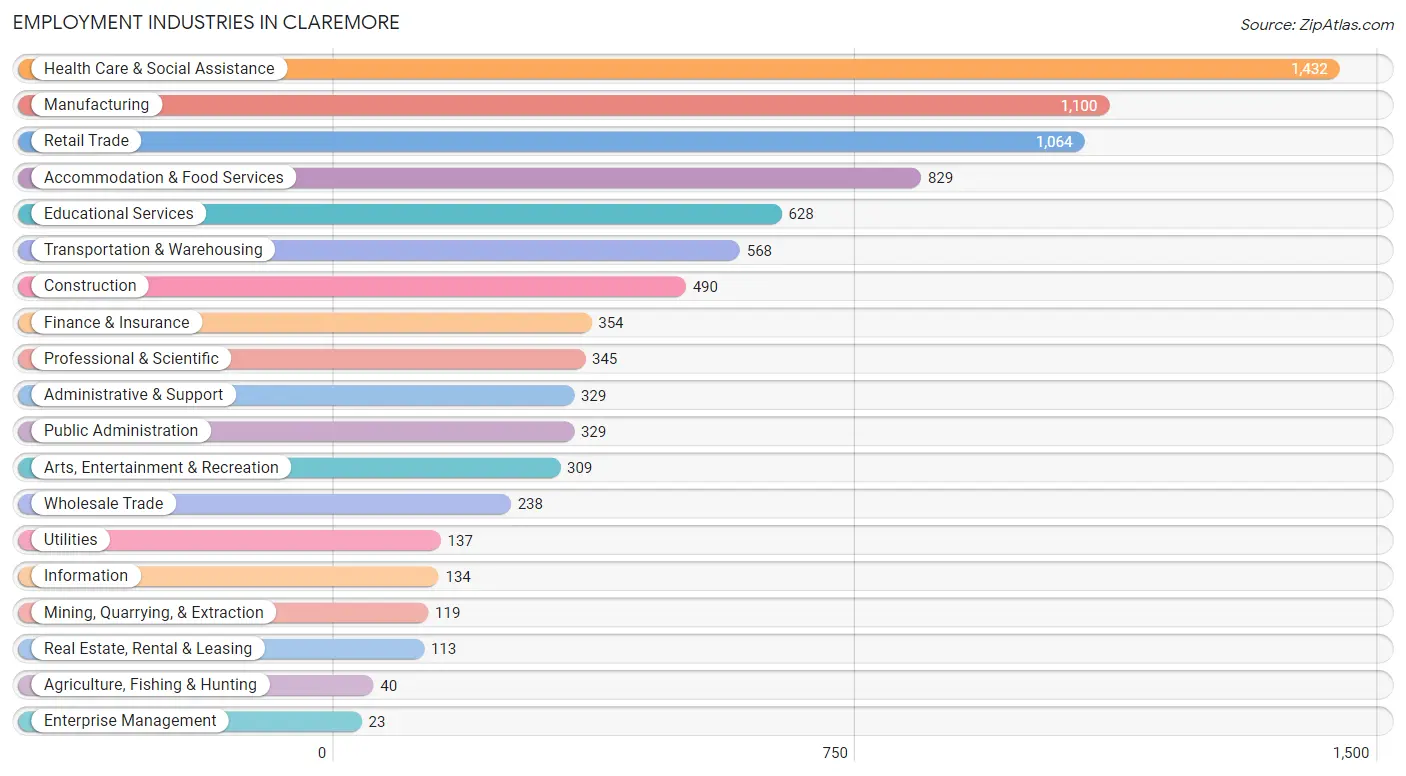
Employment Industries in Claremore
The major employment industries in Claremore include Health Care & Social Assistance (1,432 | 16.0%), Manufacturing (1,100 | 12.3%), Retail Trade (1,064 | 11.9%), Accommodation & Food Services (829 | 9.2%), and Educational Services (628 | 7.0%).
Employment Industries by Sex in Claremore
The Claremore industries that see more men than women are Construction (90.0%), Utilities (89.8%), and Manufacturing (86.4%), whereas the industries that tend to have a higher number of women are Health Care & Social Assistance (88.8%), Educational Services (64.3%), and Accommodation & Food Services (64.2%).
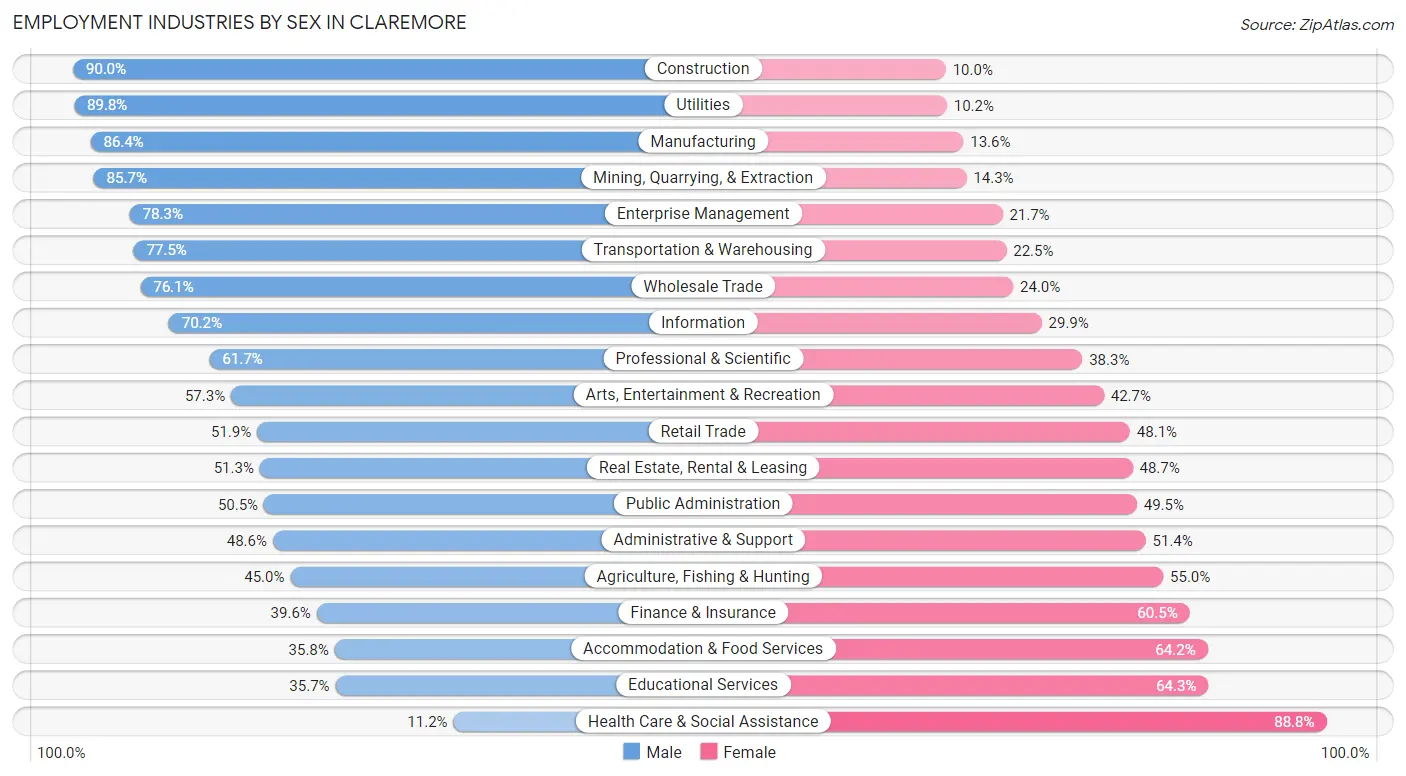
| Industry | Male | Female |
| Agriculture, Fishing & Hunting | 18 (45.0%) | 22 (55.0%) |
| Mining, Quarrying, & Extraction | 102 (85.7%) | 17 (14.3%) |
| Construction | 441 (90.0%) | 49 (10.0%) |
| Manufacturing | 950 (86.4%) | 150 (13.6%) |
| Wholesale Trade | 181 (76.0%) | 57 (23.9%) |
| Retail Trade | 552 (51.9%) | 512 (48.1%) |
| Transportation & Warehousing | 440 (77.5%) | 128 (22.5%) |
| Utilities | 123 (89.8%) | 14 (10.2%) |
| Information | 94 (70.2%) | 40 (29.8%) |
| Finance & Insurance | 140 (39.6%) | 214 (60.5%) |
| Real Estate, Rental & Leasing | 58 (51.3%) | 55 (48.7%) |
| Professional & Scientific | 213 (61.7%) | 132 (38.3%) |
| Enterprise Management | 18 (78.3%) | 5 (21.7%) |
| Administrative & Support | 160 (48.6%) | 169 (51.4%) |
| Educational Services | 224 (35.7%) | 404 (64.3%) |
| Health Care & Social Assistance | 161 (11.2%) | 1,271 (88.8%) |
| Arts, Entertainment & Recreation | 177 (57.3%) | 132 (42.7%) |
| Accommodation & Food Services | 297 (35.8%) | 532 (64.2%) |
| Public Administration | 166 (50.5%) | 163 (49.5%) |
| Total | 4,683 (52.3%) | 4,275 (47.7%) |
Education in Claremore
School Enrollment in Claremore
The most common levels of schooling among the 4,303 students in Claremore are middle school (1,036 | 24.1%), elementary school (959 | 22.3%), and college / undergraduate (877 | 20.4%).
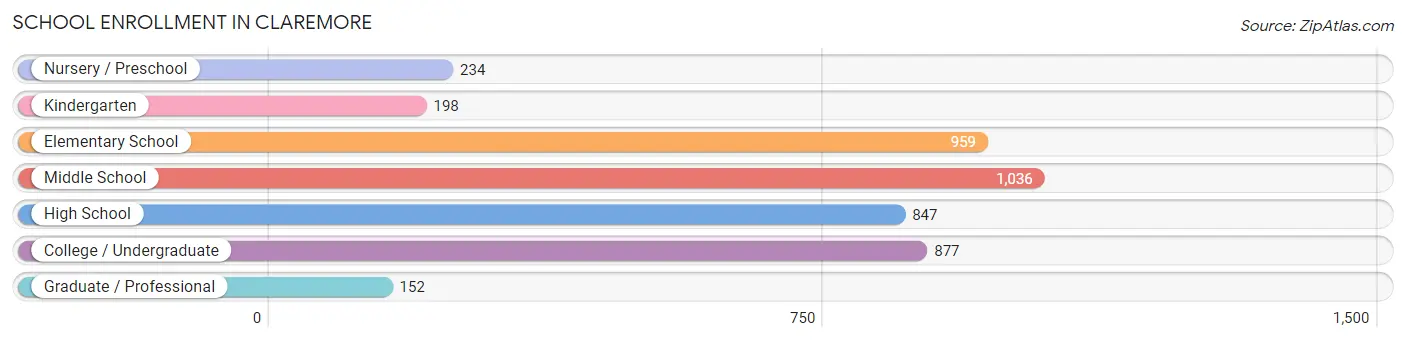
| School Level | # Students | % Students |
| Nursery / Preschool | 234 | 5.4% |
| Kindergarten | 198 | 4.6% |
| Elementary School | 959 | 22.3% |
| Middle School | 1,036 | 24.1% |
| High School | 847 | 19.7% |
| College / Undergraduate | 877 | 20.4% |
| Graduate / Professional | 152 | 3.5% |
| Total | 4,303 | 100.0% |
School Enrollment by Age by Funding Source in Claremore
Out of a total of 4,303 students who are enrolled in schools in Claremore, 482 (11.2%) attend a private institution, while the remaining 3,821 (88.8%) are enrolled in public schools. The age group of 3 to 4 year olds has the highest likelihood of being enrolled in private schools, with 68 (44.7% in the age bracket) enrolled. Conversely, the age group of 18 to 19 year olds has the lowest likelihood of being enrolled in a private school, with 279 (95.2% in the age bracket) attending a public institution.
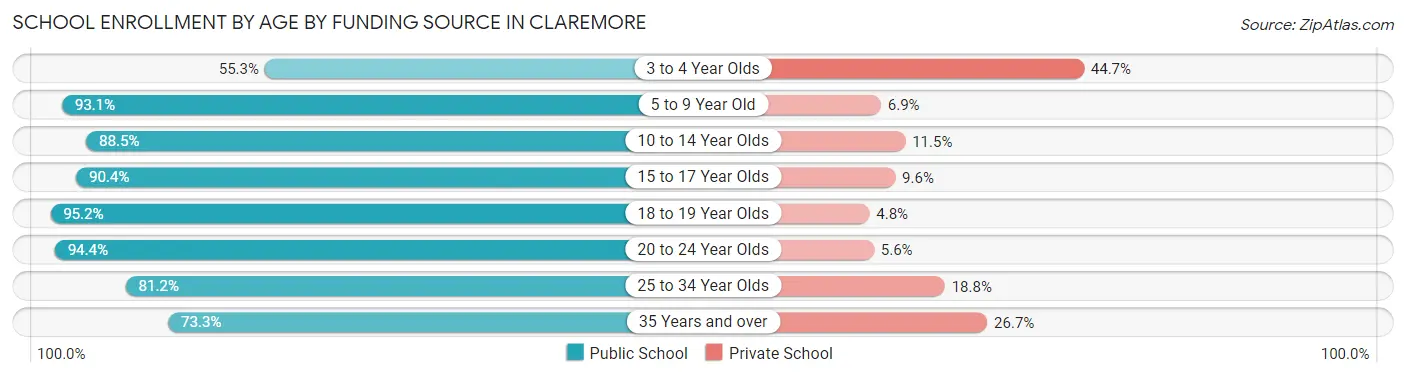
| Age Bracket | Public School | Private School |
| 3 to 4 Year Olds | 84 (55.3%) | 68 (44.7%) |
| 5 to 9 Year Old | 1,034 (93.1%) | 77 (6.9%) |
| 10 to 14 Year Olds | 1,050 (88.5%) | 136 (11.5%) |
| 15 to 17 Year Olds | 613 (90.4%) | 65 (9.6%) |
| 18 to 19 Year Olds | 279 (95.2%) | 14 (4.8%) |
| 20 to 24 Year Olds | 453 (94.4%) | 27 (5.6%) |
| 25 to 34 Year Olds | 151 (81.2%) | 35 (18.8%) |
| 35 Years and over | 159 (73.3%) | 58 (26.7%) |
| Total | 3,821 (88.8%) | 482 (11.2%) |
Educational Attainment by Field of Study in Claremore
Business (761 | 25.0%), education (537 | 17.6%), science & technology (262 | 8.6%), arts & humanities (255 | 8.4%), and liberal arts & history (196 | 6.4%) are the most common fields of study among 3,044 individuals in Claremore who have obtained a bachelor's degree or higher.
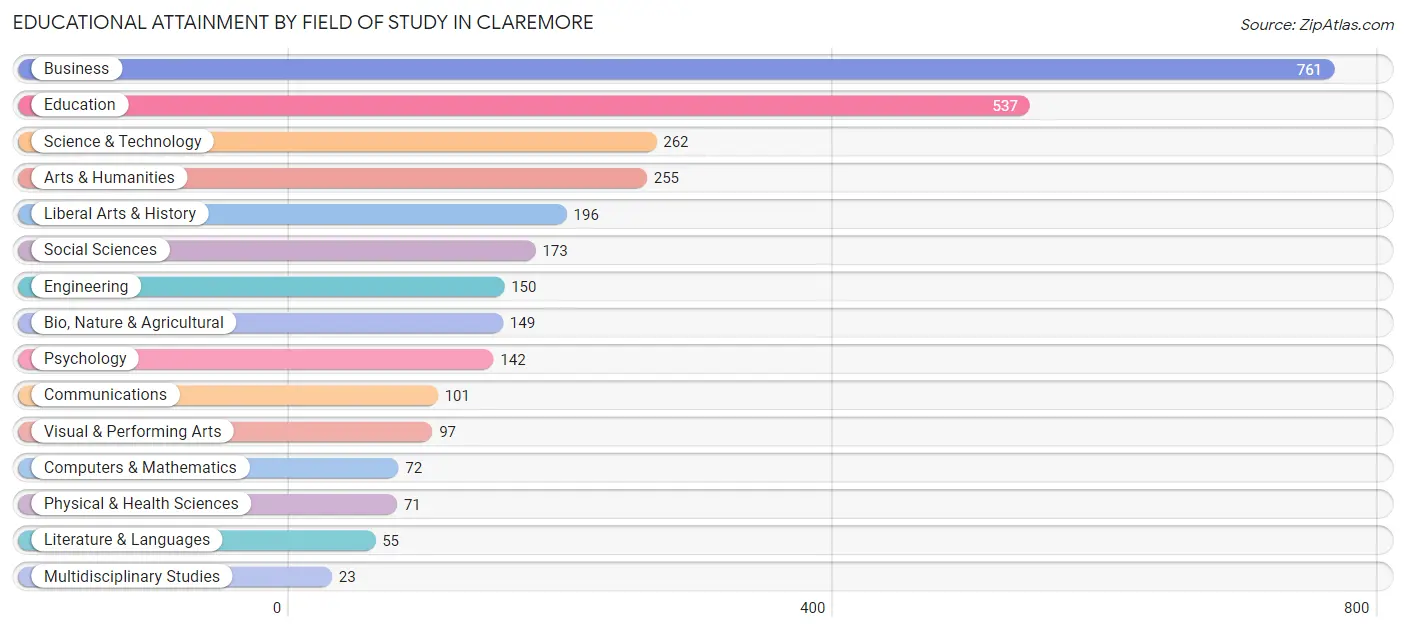
| Field of Study | # Graduates | % Graduates |
| Computers & Mathematics | 72 | 2.4% |
| Bio, Nature & Agricultural | 149 | 4.9% |
| Physical & Health Sciences | 71 | 2.3% |
| Psychology | 142 | 4.7% |
| Social Sciences | 173 | 5.7% |
| Engineering | 150 | 4.9% |
| Multidisciplinary Studies | 23 | 0.8% |
| Science & Technology | 262 | 8.6% |
| Business | 761 | 25.0% |
| Education | 537 | 17.6% |
| Literature & Languages | 55 | 1.8% |
| Liberal Arts & History | 196 | 6.4% |
| Visual & Performing Arts | 97 | 3.2% |
| Communications | 101 | 3.3% |
| Arts & Humanities | 255 | 8.4% |
| Total | 3,044 | 100.0% |
Transportation & Commute in Claremore
Vehicle Availability by Sex in Claremore
The most prevalent vehicle ownership categories in Claremore are males with 2 vehicles (2,284, accounting for 51.1%) and females with 2 vehicles (1,828, making up 54.8%).
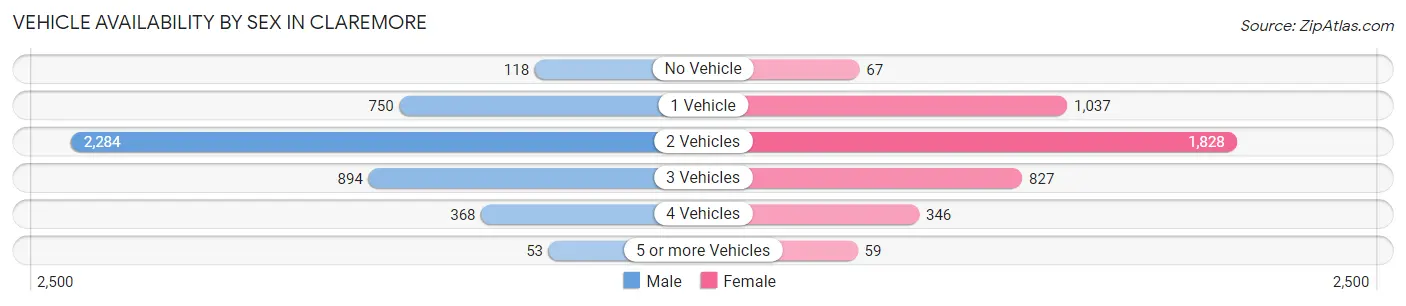
| Vehicles Available | Male | Female |
| No Vehicle | 118 (2.6%) | 67 (1.6%) |
| 1 Vehicle | 750 (16.8%) | 1,037 (24.9%) |
| 2 Vehicles | 2,284 (51.1%) | 1,828 (43.9%) |
| 3 Vehicles | 894 (20.0%) | 827 (19.9%) |
| 4 Vehicles | 368 (8.2%) | 346 (8.3%) |
| 5 or more Vehicles | 53 (1.2%) | 59 (1.4%) |
| Total | 4,467 (100.0%) | 4,164 (100.0%) |
Commute Time in Claremore
The most frequently occuring commute durations in Claremore are 5 to 9 minutes (1,635 commuters, 19.6%), 30 to 34 minutes (1,437 commuters, 17.3%), and 10 to 14 minutes (1,424 commuters, 17.1%).
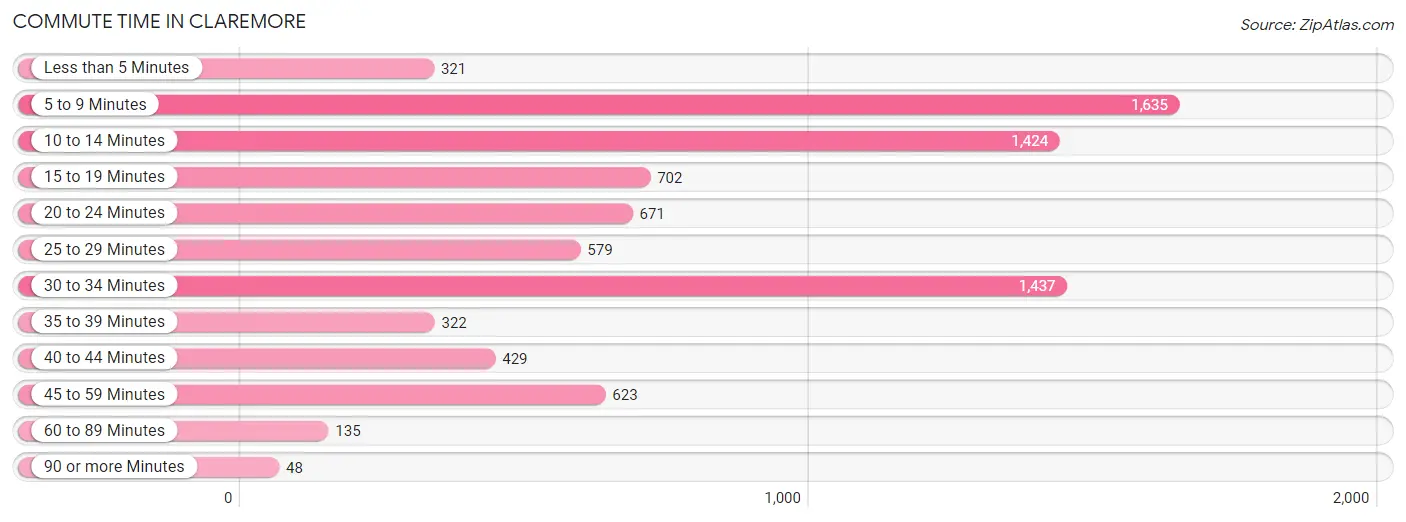
| Commute Time | # Commuters | % Commuters |
| Less than 5 Minutes | 321 | 3.9% |
| 5 to 9 Minutes | 1,635 | 19.6% |
| 10 to 14 Minutes | 1,424 | 17.1% |
| 15 to 19 Minutes | 702 | 8.4% |
| 20 to 24 Minutes | 671 | 8.1% |
| 25 to 29 Minutes | 579 | 7.0% |
| 30 to 34 Minutes | 1,437 | 17.3% |
| 35 to 39 Minutes | 322 | 3.9% |
| 40 to 44 Minutes | 429 | 5.1% |
| 45 to 59 Minutes | 623 | 7.5% |
| 60 to 89 Minutes | 135 | 1.6% |
| 90 or more Minutes | 48 | 0.6% |
Commute Time by Sex in Claremore
The most common commute times in Claremore are 30 to 34 minutes (890 commuters, 20.0%) for males and 5 to 9 minutes (845 commuters, 21.8%) for females.
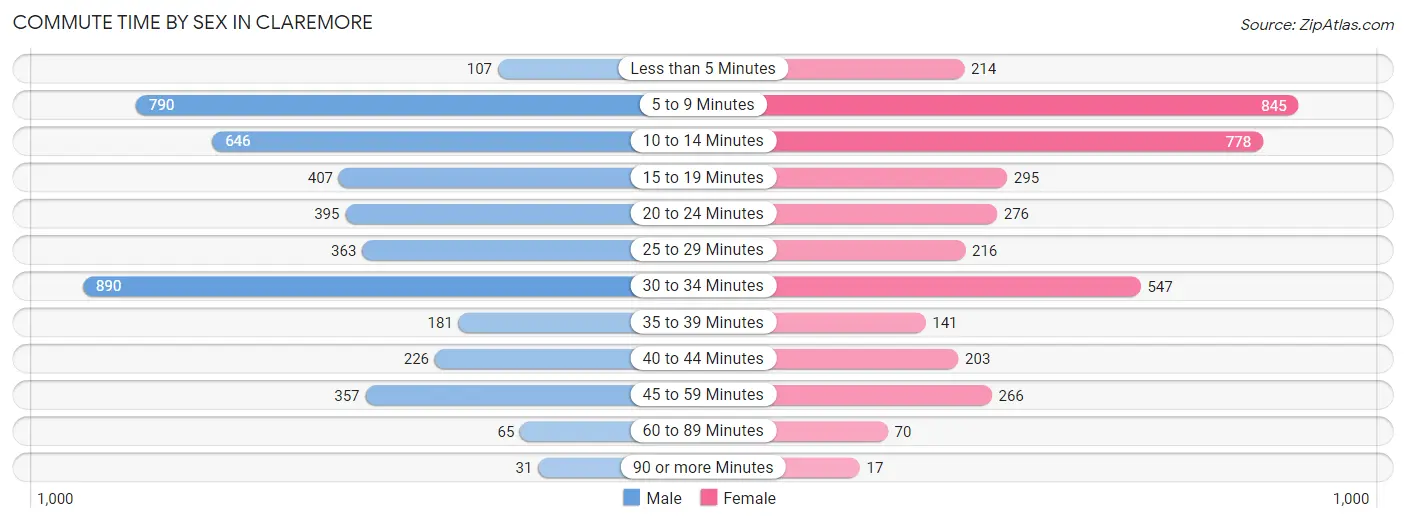
| Commute Time | Male | Female |
| Less than 5 Minutes | 107 (2.4%) | 214 (5.5%) |
| 5 to 9 Minutes | 790 (17.7%) | 845 (21.8%) |
| 10 to 14 Minutes | 646 (14.5%) | 778 (20.1%) |
| 15 to 19 Minutes | 407 (9.1%) | 295 (7.6%) |
| 20 to 24 Minutes | 395 (8.9%) | 276 (7.1%) |
| 25 to 29 Minutes | 363 (8.1%) | 216 (5.6%) |
| 30 to 34 Minutes | 890 (20.0%) | 547 (14.1%) |
| 35 to 39 Minutes | 181 (4.1%) | 141 (3.6%) |
| 40 to 44 Minutes | 226 (5.1%) | 203 (5.2%) |
| 45 to 59 Minutes | 357 (8.0%) | 266 (6.9%) |
| 60 to 89 Minutes | 65 (1.5%) | 70 (1.8%) |
| 90 or more Minutes | 31 (0.7%) | 17 (0.4%) |
Time of Departure to Work by Sex in Claremore
The most frequent times of departure to work in Claremore are 7:30 AM to 7:59 AM (632, 14.2%) for males and 7:30 AM to 7:59 AM (694, 17.9%) for females.
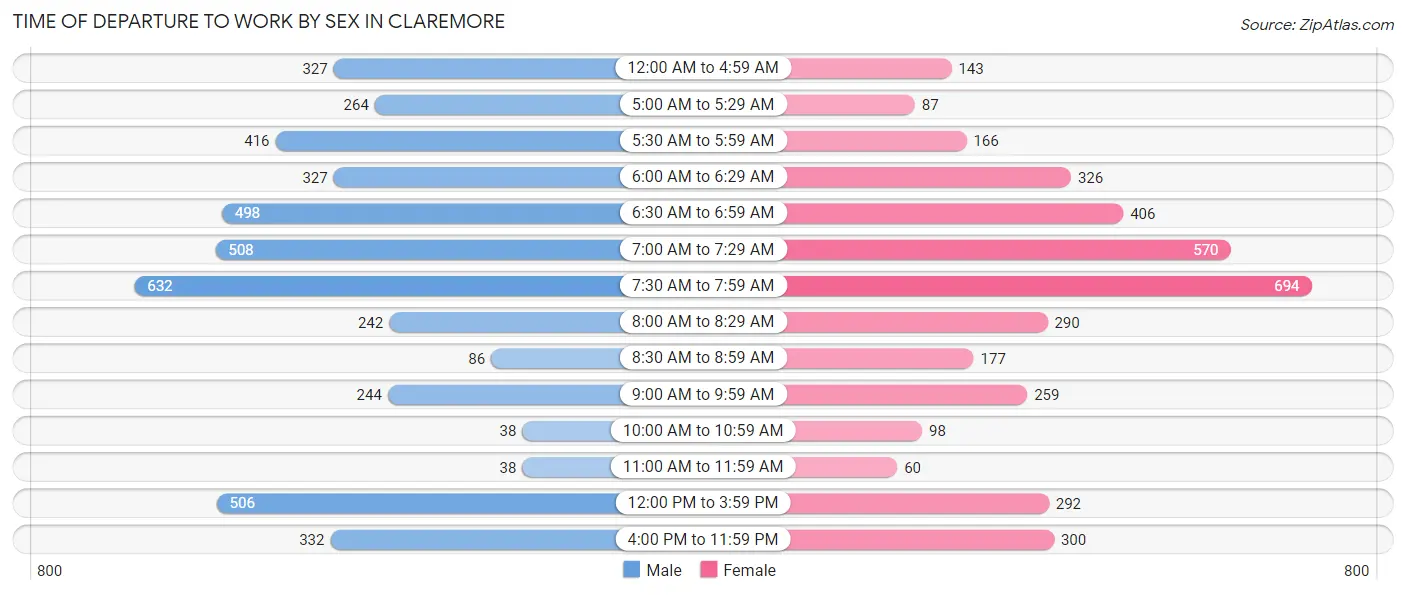
| Time of Departure | Male | Female |
| 12:00 AM to 4:59 AM | 327 (7.3%) | 143 (3.7%) |
| 5:00 AM to 5:29 AM | 264 (5.9%) | 87 (2.2%) |
| 5:30 AM to 5:59 AM | 416 (9.3%) | 166 (4.3%) |
| 6:00 AM to 6:29 AM | 327 (7.3%) | 326 (8.4%) |
| 6:30 AM to 6:59 AM | 498 (11.2%) | 406 (10.5%) |
| 7:00 AM to 7:29 AM | 508 (11.4%) | 570 (14.7%) |
| 7:30 AM to 7:59 AM | 632 (14.2%) | 694 (17.9%) |
| 8:00 AM to 8:29 AM | 242 (5.4%) | 290 (7.5%) |
| 8:30 AM to 8:59 AM | 86 (1.9%) | 177 (4.6%) |
| 9:00 AM to 9:59 AM | 244 (5.5%) | 259 (6.7%) |
| 10:00 AM to 10:59 AM | 38 (0.9%) | 98 (2.5%) |
| 11:00 AM to 11:59 AM | 38 (0.9%) | 60 (1.5%) |
| 12:00 PM to 3:59 PM | 506 (11.4%) | 292 (7.5%) |
| 4:00 PM to 11:59 PM | 332 (7.4%) | 300 (7.8%) |
| Total | 4,458 (100.0%) | 3,868 (100.0%) |
Housing Occupancy in Claremore
Occupancy by Ownership in Claremore
Of the total 7,742 dwellings in Claremore, owner-occupied units account for 4,182 (54.0%), while renter-occupied units make up 3,560 (46.0%).
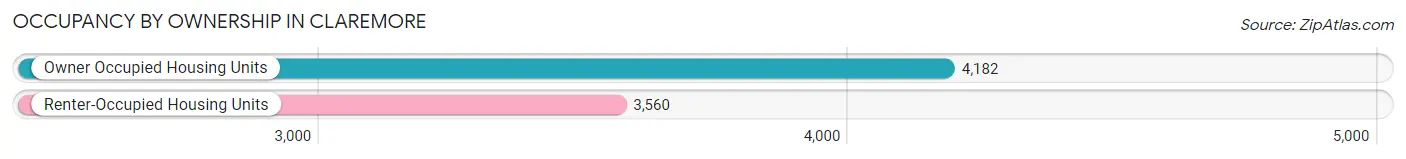
| Occupancy | # Housing Units | % Housing Units |
| Owner Occupied Housing Units | 4,182 | 54.0% |
| Renter-Occupied Housing Units | 3,560 | 46.0% |
| Total Occupied Housing Units | 7,742 | 100.0% |
Occupancy by Household Size in Claremore
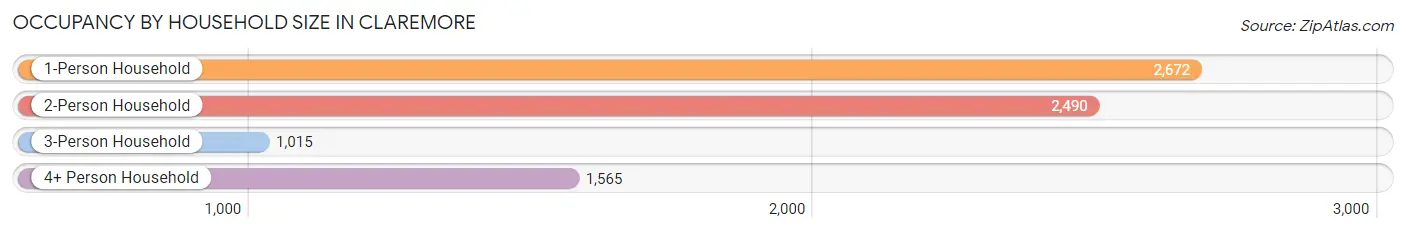
| Household Size | # Housing Units | % Housing Units |
| 1-Person Household | 2,672 | 34.5% |
| 2-Person Household | 2,490 | 32.2% |
| 3-Person Household | 1,015 | 13.1% |
| 4+ Person Household | 1,565 | 20.2% |
| Total Housing Units | 7,742 | 100.0% |
Occupancy by Ownership by Household Size in Claremore
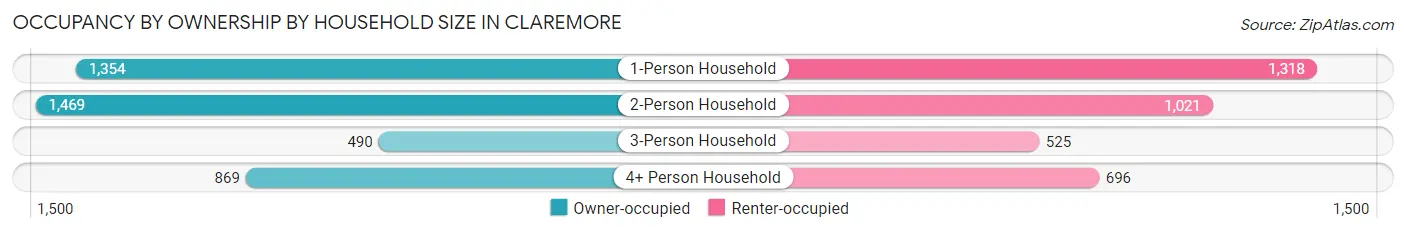
| Household Size | Owner-occupied | Renter-occupied |
| 1-Person Household | 1,354 (50.7%) | 1,318 (49.3%) |
| 2-Person Household | 1,469 (59.0%) | 1,021 (41.0%) |
| 3-Person Household | 490 (48.3%) | 525 (51.7%) |
| 4+ Person Household | 869 (55.5%) | 696 (44.5%) |
| Total Housing Units | 4,182 (54.0%) | 3,560 (46.0%) |
Occupancy by Educational Attainment in Claremore
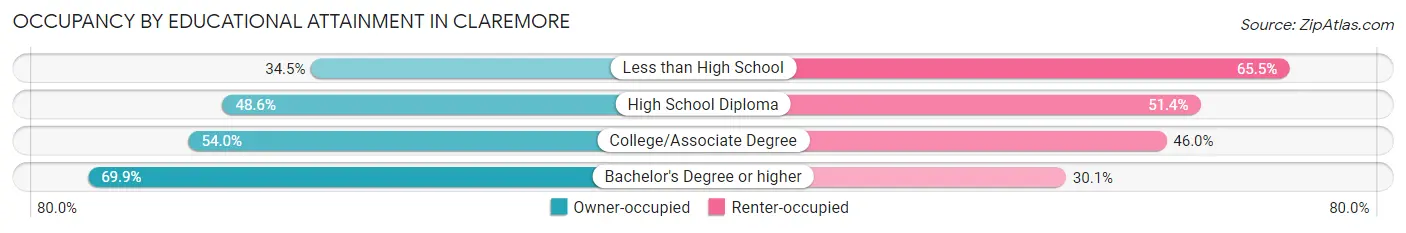
| Household Size | Owner-occupied | Renter-occupied |
| Less than High School | 193 (34.5%) | 366 (65.5%) |
| High School Diploma | 1,285 (48.6%) | 1,359 (51.4%) |
| College/Associate Degree | 1,589 (54.0%) | 1,355 (46.0%) |
| Bachelor's Degree or higher | 1,115 (69.9%) | 480 (30.1%) |
Occupancy by Age of Householder in Claremore
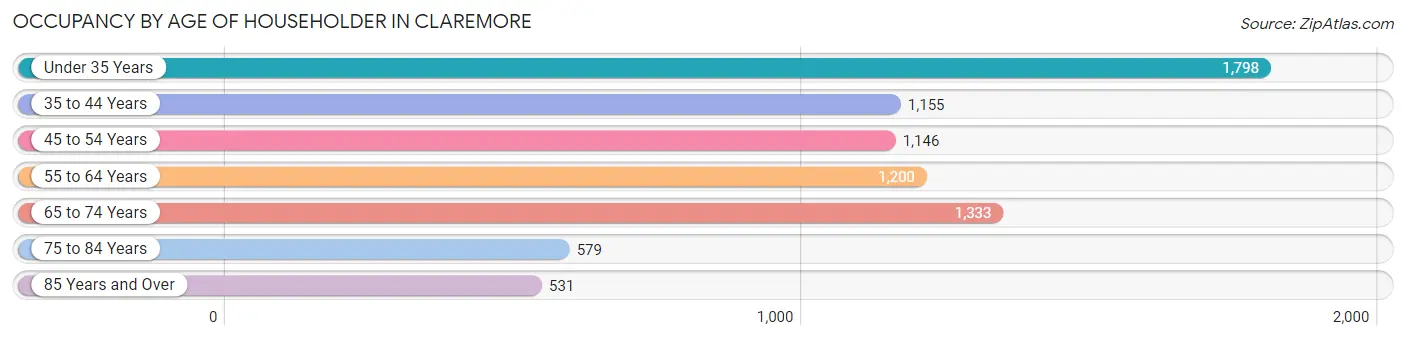
| Age Bracket | # Households | % Households |
| Under 35 Years | 1,798 | 23.2% |
| 35 to 44 Years | 1,155 | 14.9% |
| 45 to 54 Years | 1,146 | 14.8% |
| 55 to 64 Years | 1,200 | 15.5% |
| 65 to 74 Years | 1,333 | 17.2% |
| 75 to 84 Years | 579 | 7.5% |
| 85 Years and Over | 531 | 6.9% |
| Total | 7,742 | 100.0% |
Housing Finances in Claremore
Median Income by Occupancy in Claremore
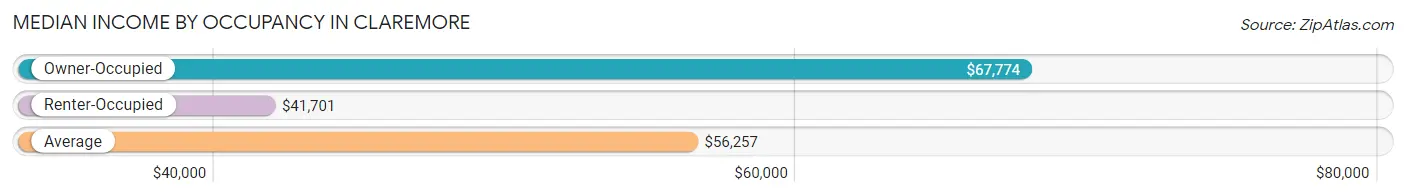
| Occupancy Type | # Households | Median Income |
| Owner-Occupied | 4,182 (54.0%) | $67,774 |
| Renter-Occupied | 3,560 (46.0%) | $41,701 |
| Average | 7,742 (100.0%) | $56,257 |
Occupancy by Householder Income Bracket in Claremore
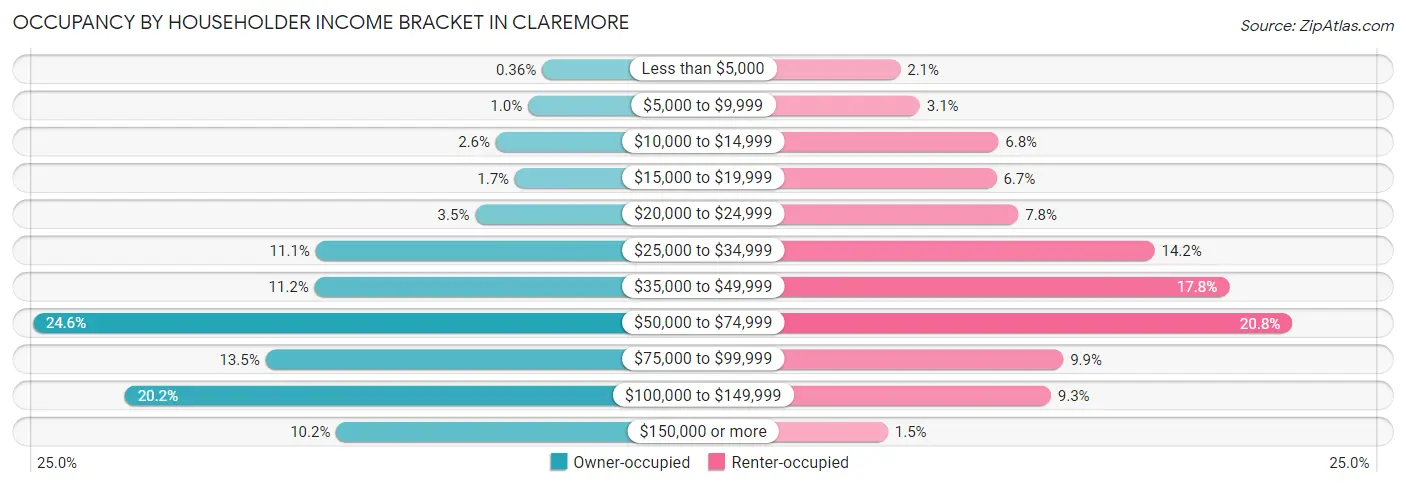
| Income Bracket | Owner-occupied | Renter-occupied |
| Less than $5,000 | 15 (0.4%) | 76 (2.1%) |
| $5,000 to $9,999 | 43 (1.0%) | 109 (3.1%) |
| $10,000 to $14,999 | 107 (2.6%) | 242 (6.8%) |
| $15,000 to $19,999 | 69 (1.7%) | 239 (6.7%) |
| $20,000 to $24,999 | 148 (3.5%) | 276 (7.7%) |
| $25,000 to $34,999 | 466 (11.1%) | 507 (14.2%) |
| $35,000 to $49,999 | 468 (11.2%) | 633 (17.8%) |
| $50,000 to $74,999 | 1,029 (24.6%) | 740 (20.8%) |
| $75,000 to $99,999 | 566 (13.5%) | 352 (9.9%) |
| $100,000 to $149,999 | 846 (20.2%) | 331 (9.3%) |
| $150,000 or more | 425 (10.2%) | 55 (1.5%) |
| Total | 4,182 (100.0%) | 3,560 (100.0%) |
Monthly Housing Cost Tiers in Claremore
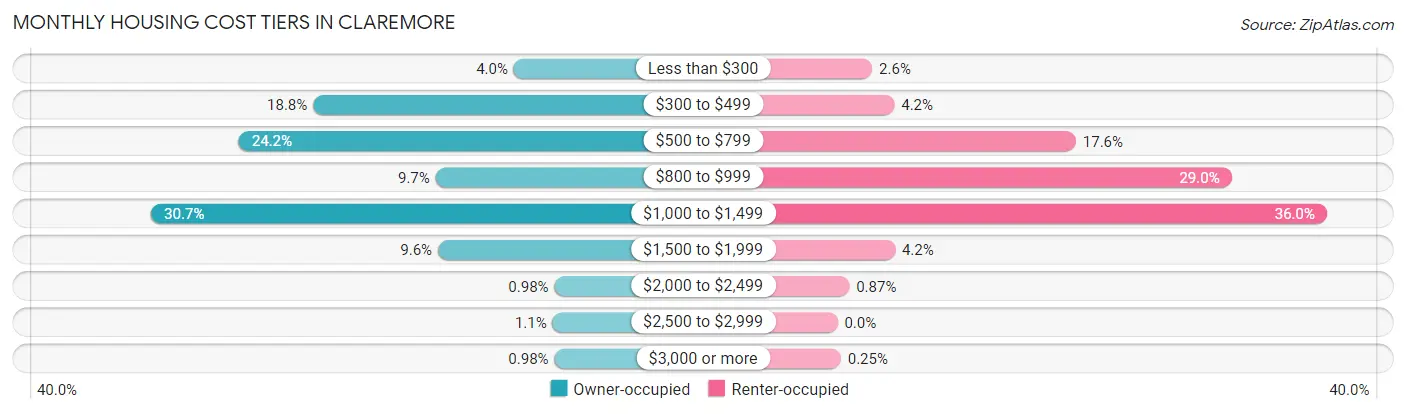
| Monthly Cost | Owner-occupied | Renter-occupied |
| Less than $300 | 166 (4.0%) | 91 (2.6%) |
| $300 to $499 | 784 (18.8%) | 149 (4.2%) |
| $500 to $799 | 1,013 (24.2%) | 625 (17.6%) |
| $800 to $999 | 407 (9.7%) | 1,033 (29.0%) |
| $1,000 to $1,499 | 1,283 (30.7%) | 1,283 (36.0%) |
| $1,500 to $1,999 | 400 (9.6%) | 151 (4.2%) |
| $2,000 to $2,499 | 41 (1.0%) | 31 (0.9%) |
| $2,500 to $2,999 | 47 (1.1%) | 0 (0.0%) |
| $3,000 or more | 41 (1.0%) | 9 (0.3%) |
| Total | 4,182 (100.0%) | 3,560 (100.0%) |
Physical Housing Characteristics in Claremore
Housing Structures in Claremore
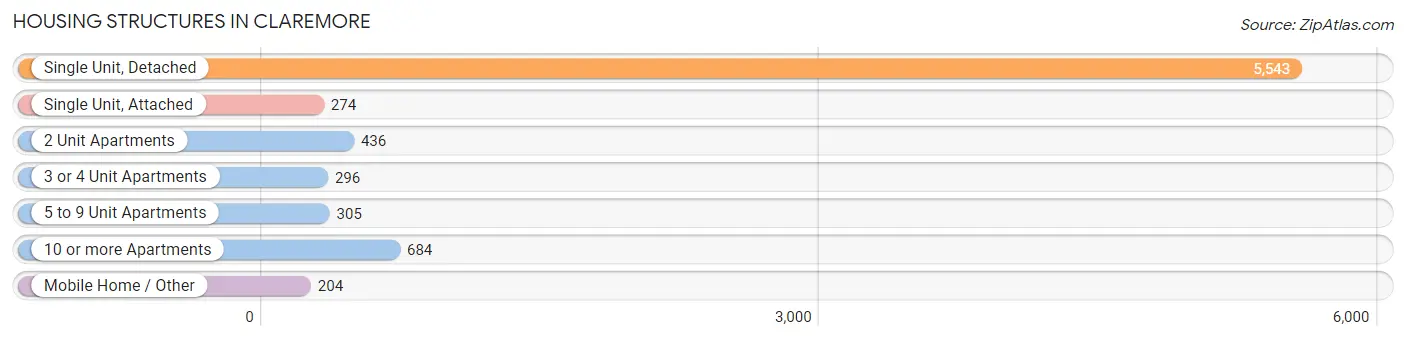
| Structure Type | # Housing Units | % Housing Units |
| Single Unit, Detached | 5,543 | 71.6% |
| Single Unit, Attached | 274 | 3.5% |
| 2 Unit Apartments | 436 | 5.6% |
| 3 or 4 Unit Apartments | 296 | 3.8% |
| 5 to 9 Unit Apartments | 305 | 3.9% |
| 10 or more Apartments | 684 | 8.8% |
| Mobile Home / Other | 204 | 2.6% |
| Total | 7,742 | 100.0% |
Housing Structures by Occupancy in Claremore
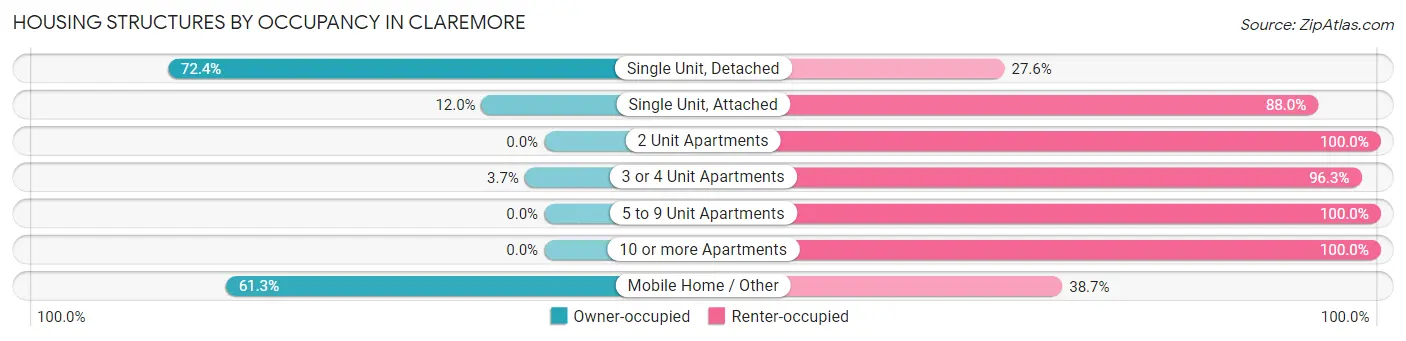
| Structure Type | Owner-occupied | Renter-occupied |
| Single Unit, Detached | 4,013 (72.4%) | 1,530 (27.6%) |
| Single Unit, Attached | 33 (12.0%) | 241 (88.0%) |
| 2 Unit Apartments | 0 (0.0%) | 436 (100.0%) |
| 3 or 4 Unit Apartments | 11 (3.7%) | 285 (96.3%) |
| 5 to 9 Unit Apartments | 0 (0.0%) | 305 (100.0%) |
| 10 or more Apartments | 0 (0.0%) | 684 (100.0%) |
| Mobile Home / Other | 125 (61.3%) | 79 (38.7%) |
| Total | 4,182 (54.0%) | 3,560 (46.0%) |
Housing Structures by Number of Rooms in Claremore
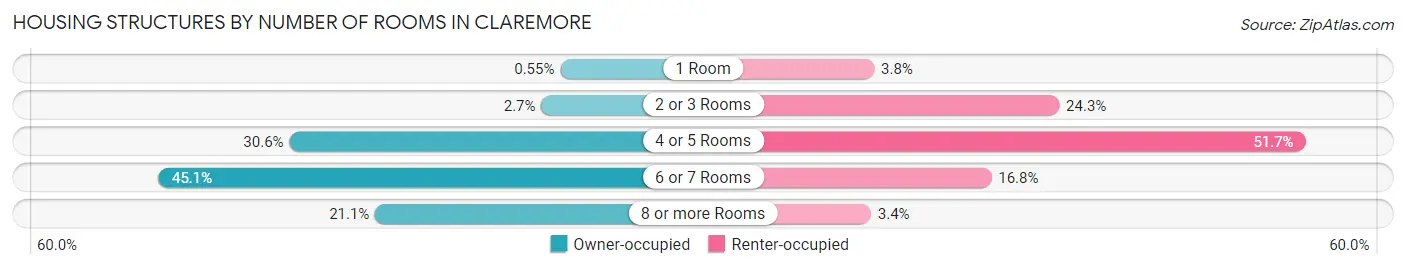
| Number of Rooms | Owner-occupied | Renter-occupied |
| 1 Room | 23 (0.5%) | 135 (3.8%) |
| 2 or 3 Rooms | 111 (2.6%) | 866 (24.3%) |
| 4 or 5 Rooms | 1,280 (30.6%) | 1,839 (51.7%) |
| 6 or 7 Rooms | 1,886 (45.1%) | 598 (16.8%) |
| 8 or more Rooms | 882 (21.1%) | 122 (3.4%) |
| Total | 4,182 (100.0%) | 3,560 (100.0%) |
Housing Structure by Heating Type in Claremore
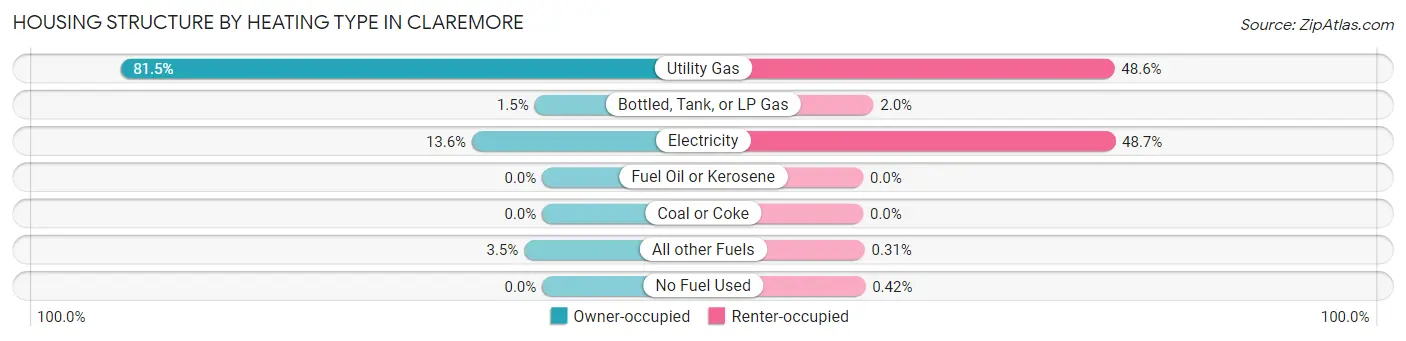
| Heating Type | Owner-occupied | Renter-occupied |
| Utility Gas | 3,409 (81.5%) | 1,729 (48.6%) |
| Bottled, Tank, or LP Gas | 61 (1.5%) | 71 (2.0%) |
| Electricity | 567 (13.6%) | 1,734 (48.7%) |
| Fuel Oil or Kerosene | 0 (0.0%) | 0 (0.0%) |
| Coal or Coke | 0 (0.0%) | 0 (0.0%) |
| All other Fuels | 145 (3.5%) | 11 (0.3%) |
| No Fuel Used | 0 (0.0%) | 15 (0.4%) |
| Total | 4,182 (100.0%) | 3,560 (100.0%) |
Household Vehicle Usage in Claremore
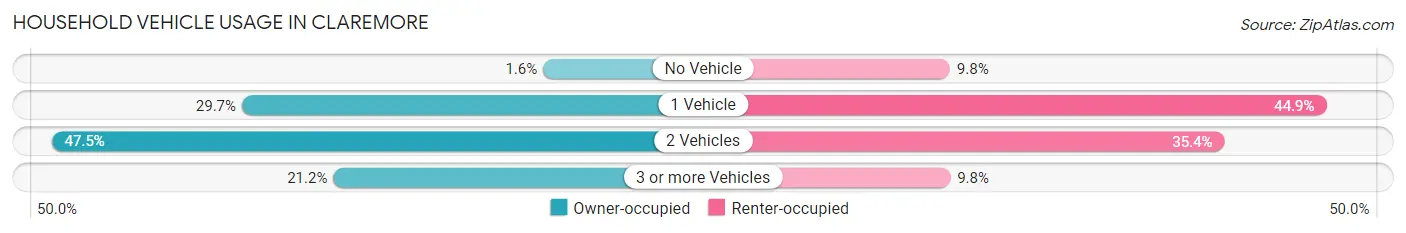
| Vehicles per Household | Owner-occupied | Renter-occupied |
| No Vehicle | 67 (1.6%) | 349 (9.8%) |
| 1 Vehicle | 1,243 (29.7%) | 1,600 (44.9%) |
| 2 Vehicles | 1,986 (47.5%) | 1,261 (35.4%) |
| 3 or more Vehicles | 886 (21.2%) | 350 (9.8%) |
| Total | 4,182 (100.0%) | 3,560 (100.0%) |
Real Estate & Mortgages in Claremore
Real Estate and Mortgage Overview in Claremore
| Characteristic | Without Mortgage | With Mortgage |
| Housing Units | 1,857 | 2,325 |
| Median Property Value | $162,400 | $154,300 |
| Median Household Income | $57,679 | $269 |
| Monthly Housing Costs | $502 | $41 |
| Real Estate Taxes | $1,261 | $106 |
Property Value by Mortgage Status in Claremore
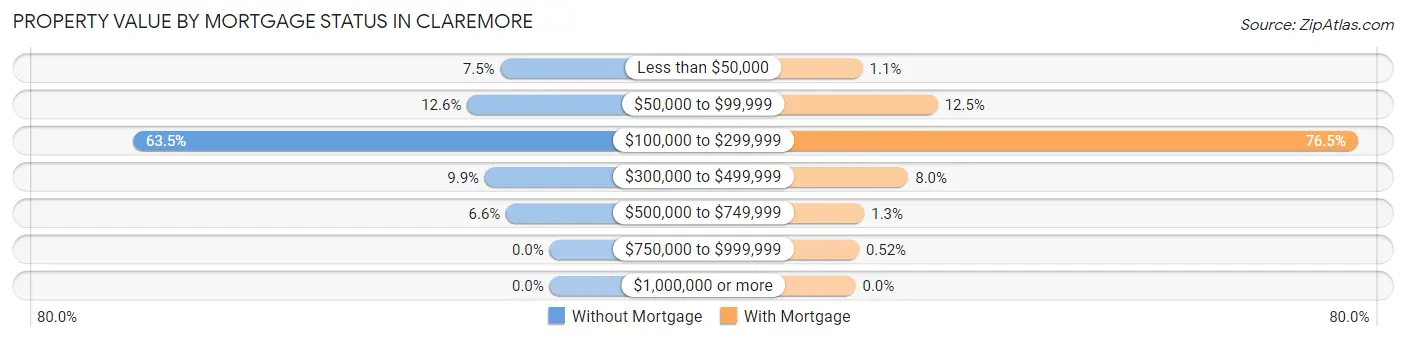
| Property Value | Without Mortgage | With Mortgage |
| Less than $50,000 | 139 (7.5%) | 25 (1.1%) |
| $50,000 to $99,999 | 233 (12.6%) | 291 (12.5%) |
| $100,000 to $299,999 | 1,179 (63.5%) | 1,779 (76.5%) |
| $300,000 to $499,999 | 183 (9.9%) | 187 (8.0%) |
| $500,000 to $749,999 | 123 (6.6%) | 31 (1.3%) |
| $750,000 to $999,999 | 0 (0.0%) | 12 (0.5%) |
| $1,000,000 or more | 0 (0.0%) | 0 (0.0%) |
| Total | 1,857 (100.0%) | 2,325 (100.0%) |
Household Income by Mortgage Status in Claremore
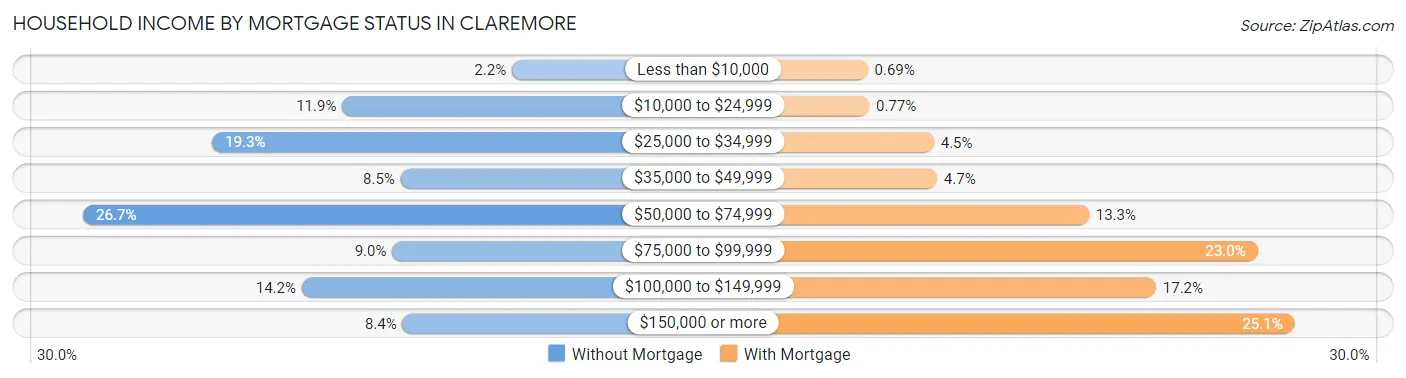
| Household Income | Without Mortgage | With Mortgage |
| Less than $10,000 | 40 (2.1%) | 16 (0.7%) |
| $10,000 to $24,999 | 220 (11.8%) | 18 (0.8%) |
| $25,000 to $34,999 | 358 (19.3%) | 104 (4.5%) |
| $35,000 to $49,999 | 158 (8.5%) | 108 (4.6%) |
| $50,000 to $74,999 | 495 (26.7%) | 310 (13.3%) |
| $75,000 to $99,999 | 167 (9.0%) | 534 (23.0%) |
| $100,000 to $149,999 | 263 (14.2%) | 399 (17.2%) |
| $150,000 or more | 156 (8.4%) | 583 (25.1%) |
| Total | 1,857 (100.0%) | 2,325 (100.0%) |
Property Value to Household Income Ratio in Claremore
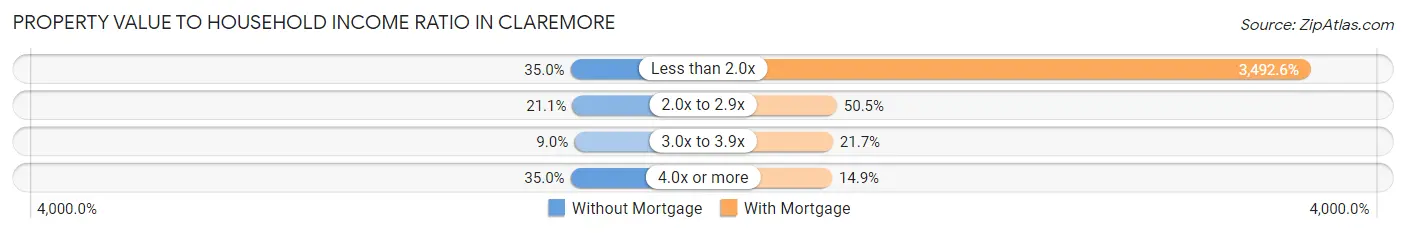
| Value-to-Income Ratio | Without Mortgage | With Mortgage |
| Less than 2.0x | 649 (34.9%) | 81,202 (3,492.6%) |
| 2.0x to 2.9x | 391 (21.1%) | 1,174 (50.5%) |
| 3.0x to 3.9x | 167 (9.0%) | 505 (21.7%) |
| 4.0x or more | 650 (35.0%) | 346 (14.9%) |
| Total | 1,857 (100.0%) | 2,325 (100.0%) |
Real Estate Taxes by Mortgage Status in Claremore
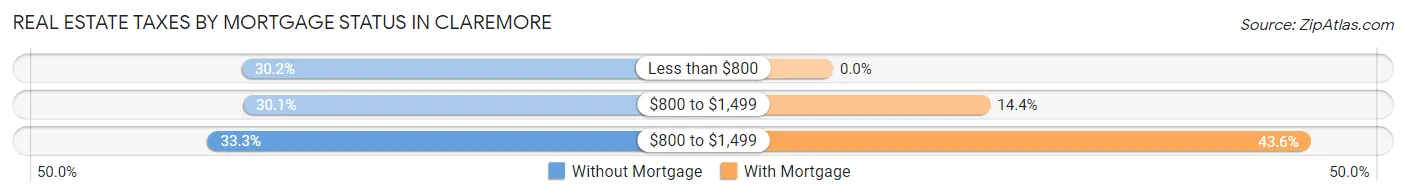
| Property Taxes | Without Mortgage | With Mortgage |
| Less than $800 | 560 (30.2%) | 0 (0.0%) |
| $800 to $1,499 | 558 (30.0%) | 334 (14.4%) |
| $800 to $1,499 | 618 (33.3%) | 1,014 (43.6%) |
| Total | 1,857 (100.0%) | 2,325 (100.0%) |
Health & Disability in Claremore
Health Insurance Coverage by Age in Claremore
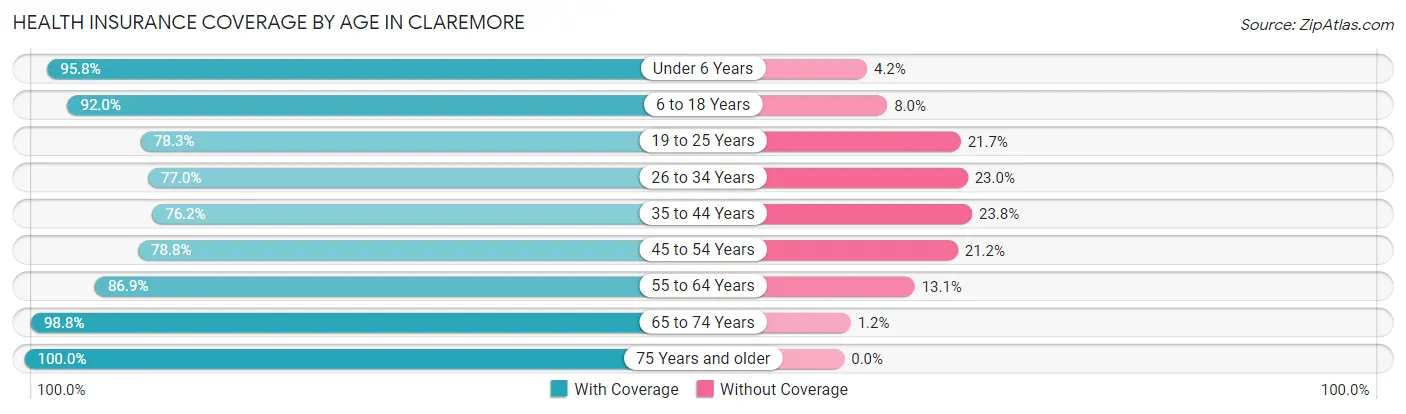
| Age Bracket | With Coverage | Without Coverage |
| Under 6 Years | 1,423 (95.8%) | 63 (4.2%) |
| 6 to 18 Years | 2,790 (92.0%) | 243 (8.0%) |
| 19 to 25 Years | 1,763 (78.3%) | 489 (21.7%) |
| 26 to 34 Years | 1,990 (77.0%) | 595 (23.0%) |
| 35 to 44 Years | 1,708 (76.2%) | 534 (23.8%) |
| 45 to 54 Years | 1,587 (78.8%) | 426 (21.2%) |
| 55 to 64 Years | 1,621 (86.9%) | 245 (13.1%) |
| 65 to 74 Years | 1,804 (98.8%) | 22 (1.2%) |
| 75 Years and older | 1,503 (100.0%) | 0 (0.0%) |
| Total | 16,189 (86.1%) | 2,617 (13.9%) |
Health Insurance Coverage by Citizenship Status in Claremore
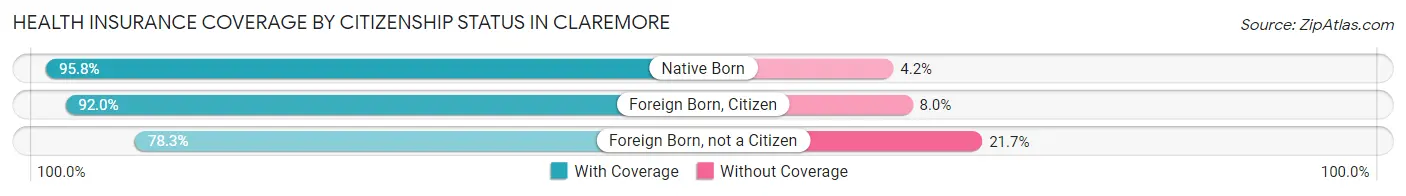
| Citizenship Status | With Coverage | Without Coverage |
| Native Born | 1,423 (95.8%) | 63 (4.2%) |
| Foreign Born, Citizen | 2,790 (92.0%) | 243 (8.0%) |
| Foreign Born, not a Citizen | 1,763 (78.3%) | 489 (21.7%) |
Health Insurance Coverage by Household Income in Claremore
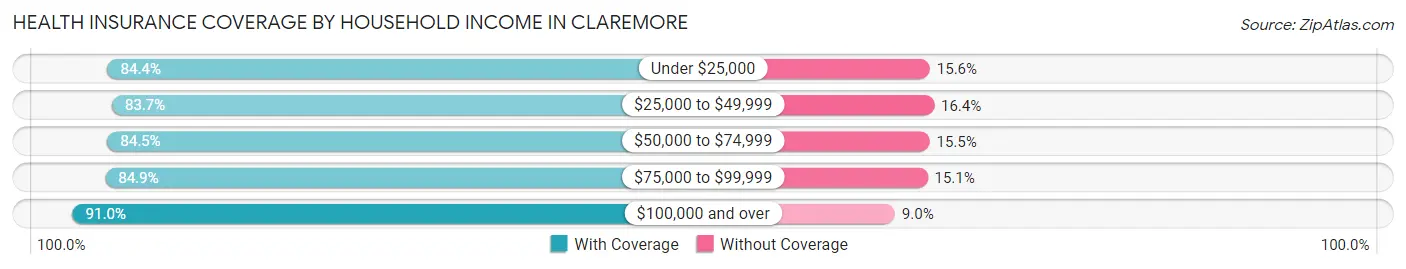
| Household Income | With Coverage | Without Coverage |
| Under $25,000 | 1,709 (84.4%) | 315 (15.6%) |
| $25,000 to $49,999 | 3,453 (83.7%) | 675 (16.4%) |
| $50,000 to $74,999 | 3,883 (84.5%) | 713 (15.5%) |
| $75,000 to $99,999 | 2,154 (84.9%) | 384 (15.1%) |
| $100,000 and over | 4,754 (91.0%) | 471 (9.0%) |
Public vs Private Health Insurance Coverage by Age in Claremore
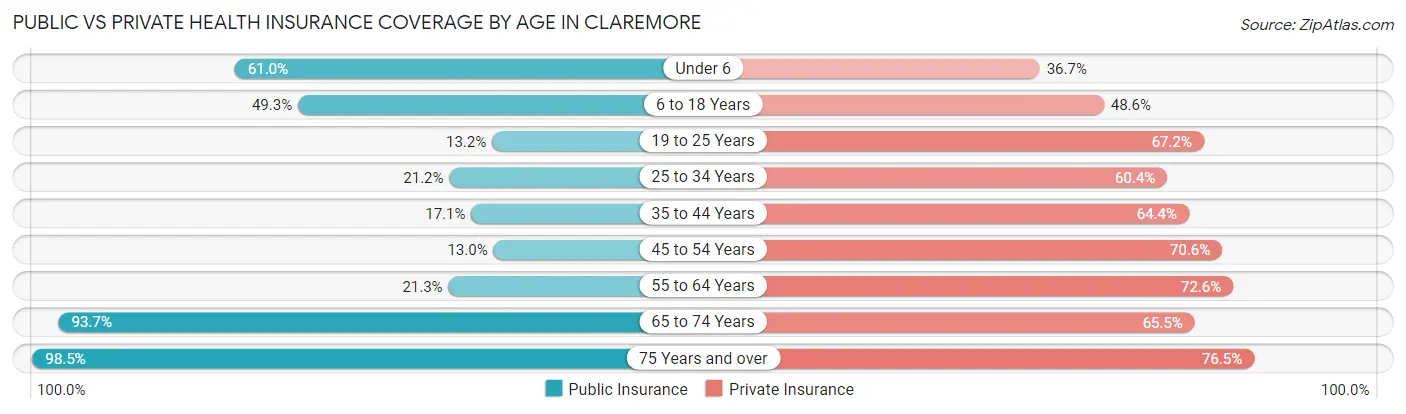
| Age Bracket | Public Insurance | Private Insurance |
| Under 6 | 906 (61.0%) | 546 (36.7%) |
| 6 to 18 Years | 1,494 (49.3%) | 1,475 (48.6%) |
| 19 to 25 Years | 298 (13.2%) | 1,513 (67.2%) |
| 25 to 34 Years | 547 (21.2%) | 1,561 (60.4%) |
| 35 to 44 Years | 383 (17.1%) | 1,444 (64.4%) |
| 45 to 54 Years | 261 (13.0%) | 1,421 (70.6%) |
| 55 to 64 Years | 398 (21.3%) | 1,355 (72.6%) |
| 65 to 74 Years | 1,711 (93.7%) | 1,196 (65.5%) |
| 75 Years and over | 1,481 (98.5%) | 1,150 (76.5%) |
| Total | 7,479 (39.8%) | 11,661 (62.0%) |
Disability Status by Sex by Age in Claremore
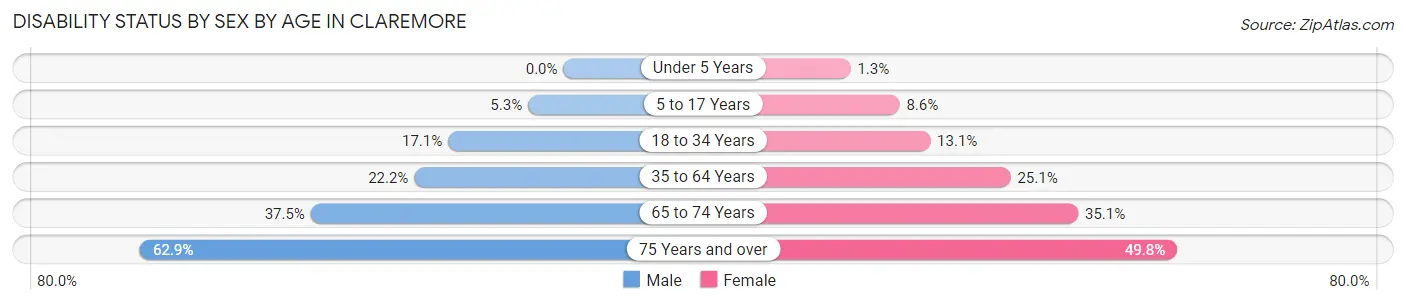
| Age Bracket | Male | Female |
| Under 5 Years | 0 (0.0%) | 7 (1.3%) |
| 5 to 17 Years | 87 (5.2%) | 121 (8.6%) |
| 18 to 34 Years | 436 (17.1%) | 325 (13.1%) |
| 35 to 64 Years | 650 (22.2%) | 798 (25.1%) |
| 65 to 74 Years | 269 (37.5%) | 389 (35.1%) |
| 75 Years and over | 220 (62.9%) | 574 (49.8%) |
Disability Class by Sex by Age in Claremore
Disability Class: Hearing Difficulty
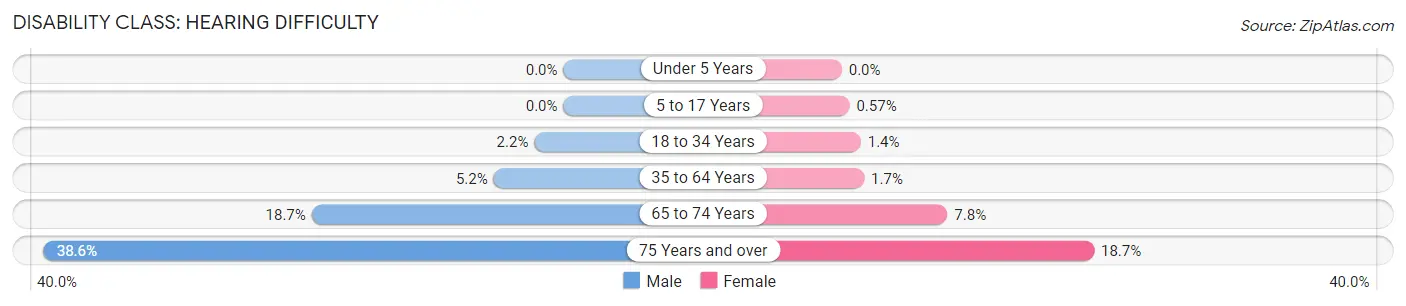
| Age Bracket | Male | Female |
| Under 5 Years | 0 (0.0%) | 0 (0.0%) |
| 5 to 17 Years | 0 (0.0%) | 8 (0.6%) |
| 18 to 34 Years | 55 (2.2%) | 35 (1.4%) |
| 35 to 64 Years | 152 (5.2%) | 53 (1.7%) |
| 65 to 74 Years | 134 (18.7%) | 87 (7.8%) |
| 75 Years and over | 135 (38.6%) | 216 (18.7%) |
Disability Class: Vision Difficulty
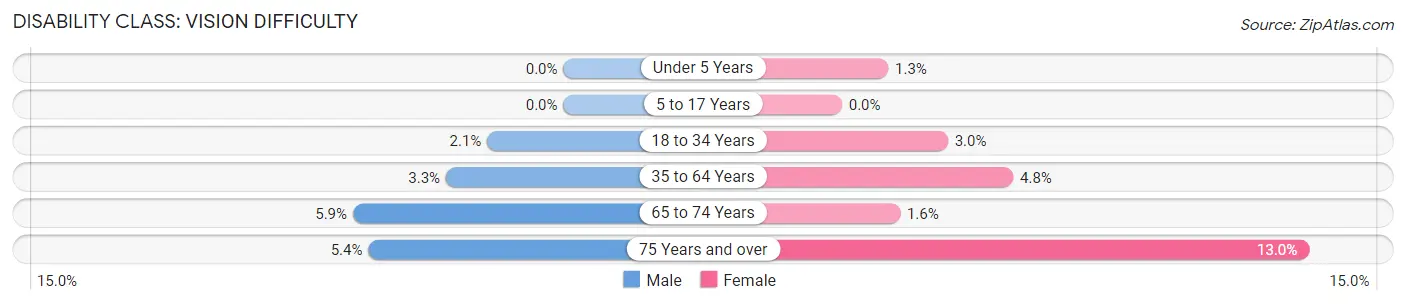
| Age Bracket | Male | Female |
| Under 5 Years | 0 (0.0%) | 7 (1.3%) |
| 5 to 17 Years | 0 (0.0%) | 0 (0.0%) |
| 18 to 34 Years | 54 (2.1%) | 73 (2.9%) |
| 35 to 64 Years | 96 (3.3%) | 152 (4.8%) |
| 65 to 74 Years | 42 (5.9%) | 18 (1.6%) |
| 75 Years and over | 19 (5.4%) | 150 (13.0%) |
Disability Class: Cognitive Difficulty
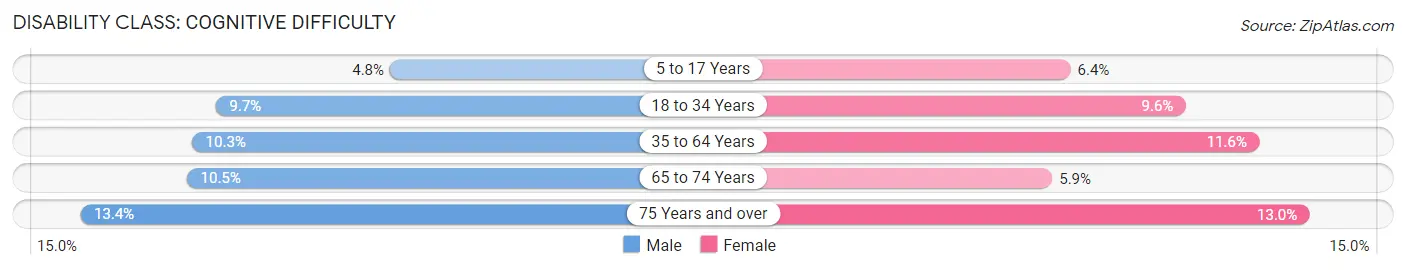
| Age Bracket | Male | Female |
| 5 to 17 Years | 80 (4.8%) | 90 (6.4%) |
| 18 to 34 Years | 246 (9.7%) | 237 (9.6%) |
| 35 to 64 Years | 303 (10.3%) | 370 (11.6%) |
| 65 to 74 Years | 75 (10.5%) | 65 (5.9%) |
| 75 Years and over | 47 (13.4%) | 150 (13.0%) |
Disability Class: Ambulatory Difficulty
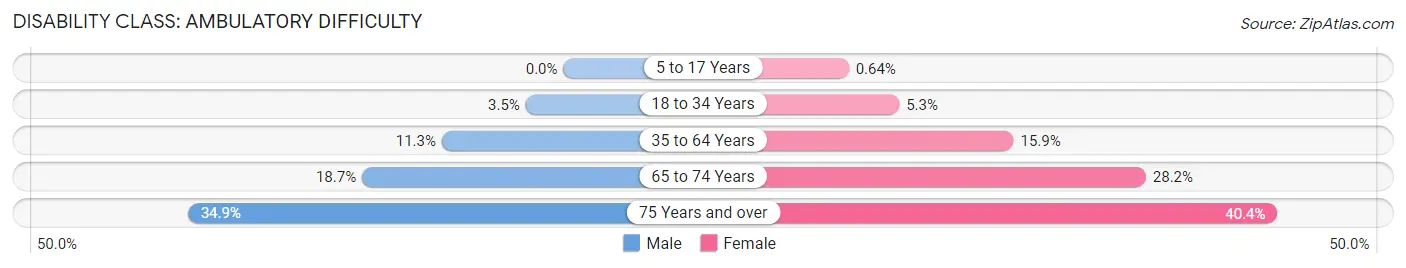
| Age Bracket | Male | Female |
| 5 to 17 Years | 0 (0.0%) | 9 (0.6%) |
| 18 to 34 Years | 89 (3.5%) | 132 (5.3%) |
| 35 to 64 Years | 331 (11.3%) | 508 (15.9%) |
| 65 to 74 Years | 134 (18.7%) | 313 (28.2%) |
| 75 Years and over | 122 (34.9%) | 466 (40.4%) |
Disability Class: Self-Care Difficulty
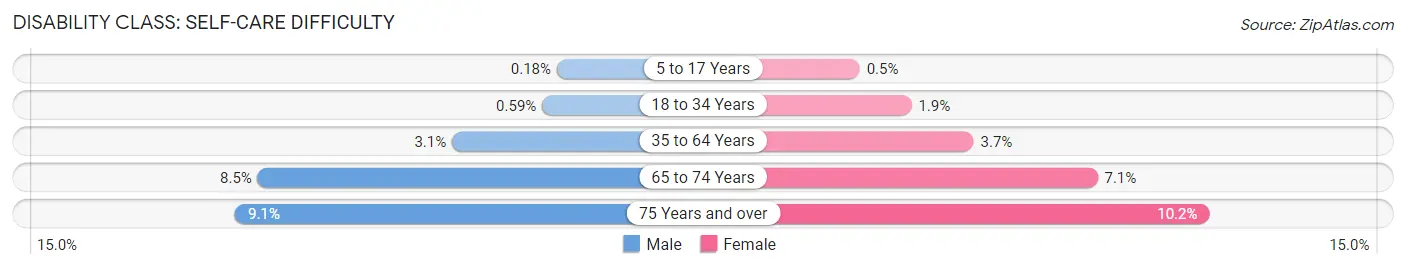
| Age Bracket | Male | Female |
| 5 to 17 Years | 3 (0.2%) | 7 (0.5%) |
| 18 to 34 Years | 15 (0.6%) | 48 (1.9%) |
| 35 to 64 Years | 91 (3.1%) | 117 (3.7%) |
| 65 to 74 Years | 61 (8.5%) | 79 (7.1%) |
| 75 Years and over | 32 (9.1%) | 118 (10.2%) |
Technology Access in Claremore
Computing Device Access in Claremore
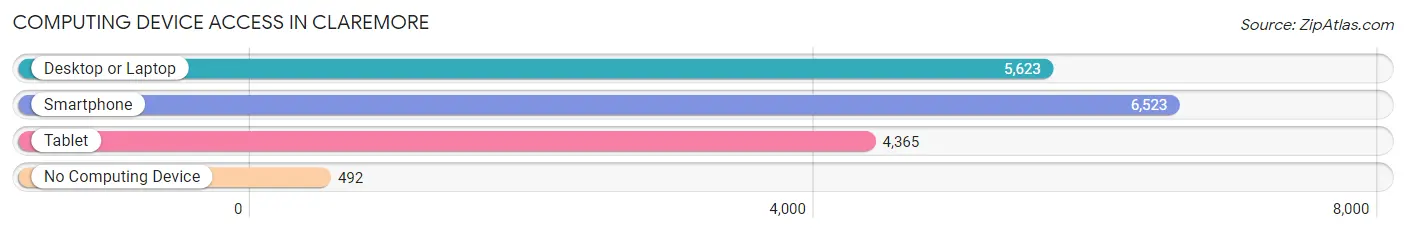
| Device Type | # Households | % Households |
| Desktop or Laptop | 5,623 | 72.6% |
| Smartphone | 6,523 | 84.3% |
| Tablet | 4,365 | 56.4% |
| No Computing Device | 492 | 6.4% |
| Total | 7,742 | 100.0% |
Internet Access in Claremore
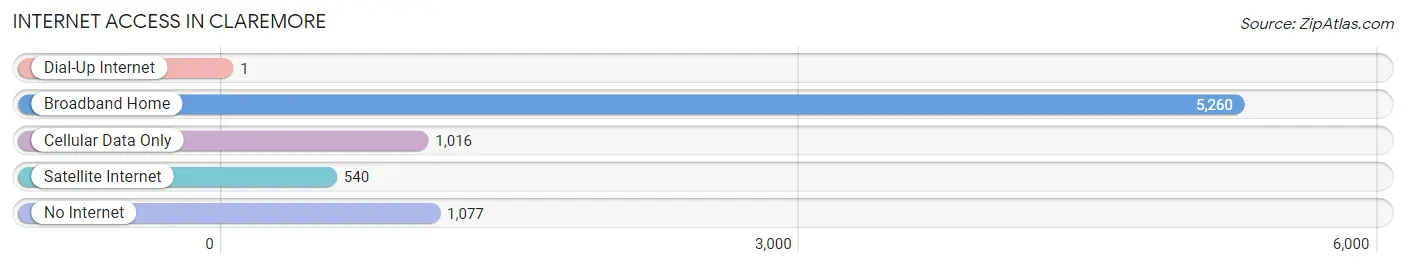
| Internet Type | # Households | % Households |
| Dial-Up Internet | 1 | 0.0% |
| Broadband Home | 5,260 | 67.9% |
| Cellular Data Only | 1,016 | 13.1% |
| Satellite Internet | 540 | 7.0% |
| No Internet | 1,077 | 13.9% |
| Total | 7,742 | 100.0% |
Claremore Summary
Claremore, Oklahoma is a city located in Rogers County, Oklahoma, United States. It is part of the Tulsa Metropolitan Statistical Area. The population was 18,581 at the 2010 census, an increase of 7.1 percent from 17,572 at the 2000 census.
History
Claremore was founded in 1802 by the Osage Indians. The city was named after the Osage Chief Claremore, who was a leader of the tribe. The city was incorporated in 1872 and was the first city in Rogers County.
Claremore was a major stop on the Atchison, Topeka and Santa Fe Railway, which ran through the city in the late 19th century. The city was also the site of the first oil well in Oklahoma, which was drilled in 1894.
Geography
Claremore is located in Rogers County, Oklahoma, at 36°19'25" North, 95°37'45" West (36.323, -95.629). It is situated in the Ozark Mountains, about 20 miles northeast of Tulsa.
The city has a total area of 16.2 square miles, of which 16.1 square miles is land and 0.1 square miles is water.
Economy
Claremore is home to several major employers, including the Claremore Industrial and Economic Development Authority, the Claremore Regional Airport, and the Claremore Regional Medical Center. The city is also home to several manufacturing companies, including the Claremore Manufacturing Company, which produces automotive parts, and the Claremore Industrial Park, which is home to several businesses.
The city is also home to several retail stores including Walmart Target and Lowe s
Demographics
As of the 2010 census, there were 18,581 people, 6,945 households, and 4,845 families residing in the city. The population density was 1,154.3 people per square mile. There were 7,717 housing units at an average density of 478.3 per square mile.
The racial makeup of the city was 75.2% White, 4.2% African American, 11.3% Native American, 0.7% Asian, 0.1% Pacific Islander, 5.2% from other races, and 3.3% from two or more races. Hispanic or Latino of any race were 11.3% of the population.
The median income for a household in the city was $37,945, and the median income for a family was $45,945. Males had a median income of $35,945 versus $25,945 for females. The per capita income for the city was $19,945. About 11.3% of families and 14.2% of the population were below the poverty line, including 19.3% of those under age 18 and 8.2% of those age 65 or over.
Common Questions
What is Per Capita Income in Claremore?
Per Capita income in Claremore is $29,048.
What is the Median Family Income in Claremore?
Median Family Income in Claremore is $69,375.
What is the Median Household income in Claremore?
Median Household Income in Claremore is $56,257.
What is Income or Wage Gap in Claremore?
Income or Wage Gap in Claremore is 29.2%.
Women in Claremore earn 70.8 cents for every dollar earned by a man.
What is Family Income Deficit in Claremore?
Family Income Deficit in Claremore is $8,861.
Families that are below poverty line in Claremore earn $8,861 less on average than the poverty threshold level.
What is Inequality or Gini Index in Claremore?
Inequality or Gini Index in Claremore is 0.40.
What is the Total Population of Claremore?
Total Population of Claremore is 19,724.
What is the Total Male Population of Claremore?
Total Male Population of Claremore is 9,593.
What is the Total Female Population of Claremore?
Total Female Population of Claremore is 10,131.
What is the Ratio of Males per 100 Females in Claremore?
There are 94.69 Males per 100 Females in Claremore.
What is the Ratio of Females per 100 Males in Claremore?
There are 105.61 Females per 100 Males in Claremore.
What is the Median Population Age in Claremore?
Median Population Age in Claremore is 36.3 Years.
What is the Average Family Size in Claremore
Average Family Size in Claremore is 3.1 People.
What is the Average Household Size in Claremore
Average Household Size in Claremore is 2.4 People.
How Large is the Labor Force in Claremore?
There are 9,524 People in the Labor Forcein in Claremore.
What is the Percentage of People in the Labor Force in Claremore?
60.1% of People are in the Labor Force in Claremore.
What is the Unemployment Rate in Claremore?
Unemployment Rate in Claremore is 5.8%.