Eakly, OK Map & Demographics
Eakly Map
Eakly Overview
$17,133
PER CAPITA INCOME
$61,750
AVG FAMILY INCOME
$52,500
AVG HOUSEHOLD INCOME
30.4%
WAGE / INCOME GAP [ % ]
69.6¢/ $1
WAGE / INCOME GAP [ $ ]
0.41
INEQUALITY / GINI INDEX
460
TOTAL POPULATION
225
MALE POPULATION
235
FEMALE POPULATION
95.74
MALES / 100 FEMALES
104.44
FEMALES / 100 MALES
21.7
MEDIAN AGE
5.3
AVG FAMILY SIZE
4.3
AVG HOUSEHOLD SIZE
193
LABOR FORCE [ PEOPLE ]
63.7%
PERCENT IN LABOR FORCE
2.1%
UNEMPLOYMENT RATE
Eakly Zip Codes
Income in Eakly
Income Overview in Eakly
Per Capita Income in Eakly is $17,133, while median incomes of families and households are $61,750 and $52,500 respectively.
| Characteristic | Number | Measure |
| Per Capita Income | 460 | $17,133 |
| Median Family Income | 79 | $61,750 |
| Mean Family Income | 79 | $67,070 |
| Median Household Income | 106 | $52,500 |
| Mean Household Income | 106 | $60,547 |
| Income Deficit | 79 | $0 |
| Wage / Income Gap (%) | 460 | 30.42% |
| Wage / Income Gap ($) | 460 | 69.58¢ per $1 |
| Gini / Inequality Index | 460 | 0.41 |
Earnings by Sex in Eakly
Average Earnings in Eakly are $30,962, $35,481 for men and $24,688 for women, a difference of 30.4%.
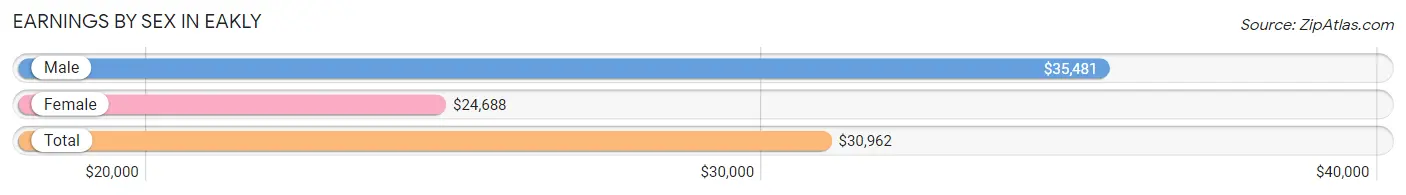
| Sex | Number | Average Earnings |
| Male | 123 (58.0%) | $35,481 |
| Female | 89 (42.0%) | $24,688 |
| Total | 212 (100.0%) | $30,962 |
Earnings by Sex by Income Bracket in Eakly
The most common earnings brackets in Eakly are $12,500 to $14,999 for men (21 | 17.1%) and $30,000 to $34,999 for women (13 | 14.6%).
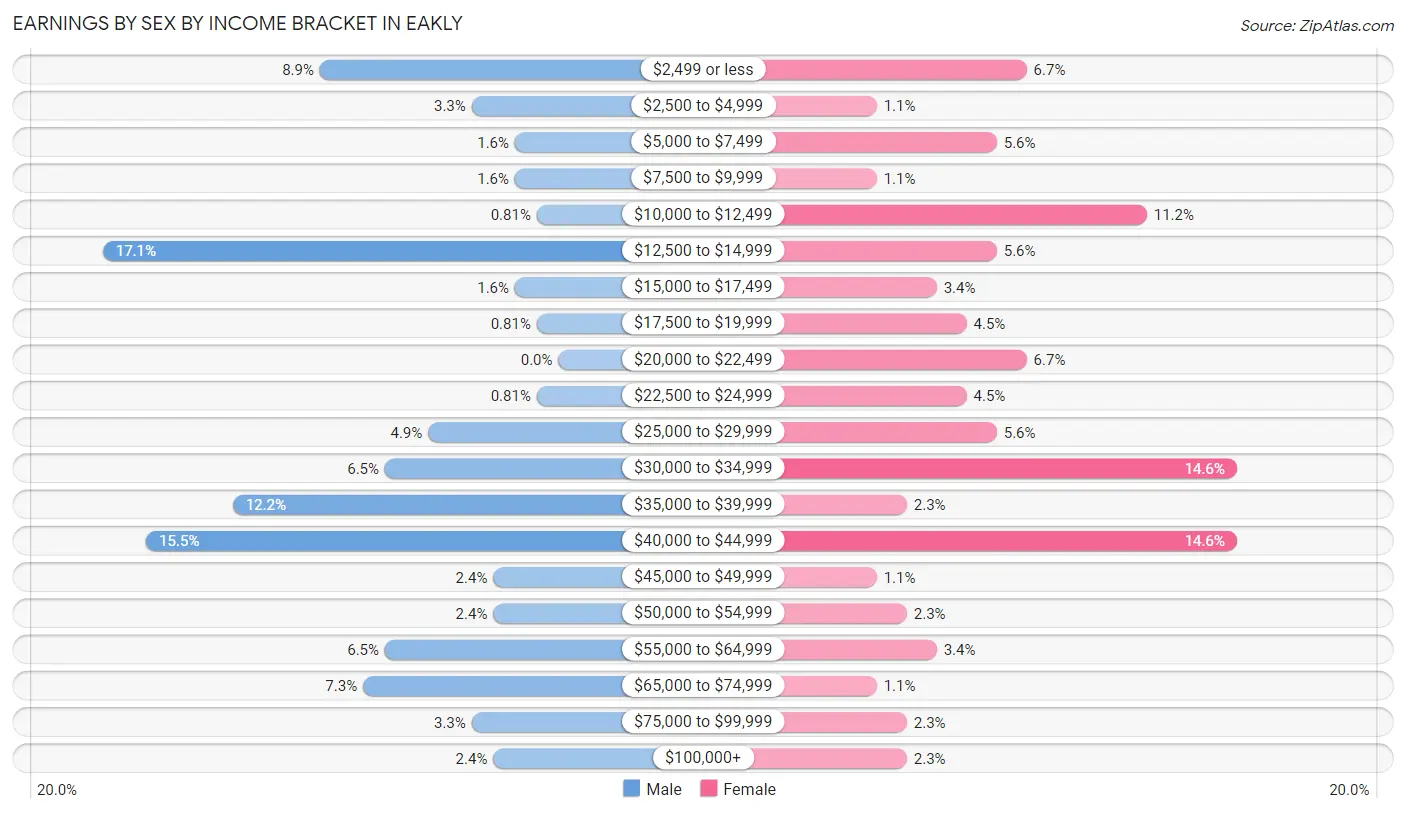
| Income | Male | Female |
| $2,499 or less | 11 (8.9%) | 6 (6.7%) |
| $2,500 to $4,999 | 4 (3.3%) | 1 (1.1%) |
| $5,000 to $7,499 | 2 (1.6%) | 5 (5.6%) |
| $7,500 to $9,999 | 2 (1.6%) | 1 (1.1%) |
| $10,000 to $12,499 | 1 (0.8%) | 10 (11.2%) |
| $12,500 to $14,999 | 21 (17.1%) | 5 (5.6%) |
| $15,000 to $17,499 | 2 (1.6%) | 3 (3.4%) |
| $17,500 to $19,999 | 1 (0.8%) | 4 (4.5%) |
| $20,000 to $22,499 | 0 (0.0%) | 6 (6.7%) |
| $22,500 to $24,999 | 1 (0.8%) | 4 (4.5%) |
| $25,000 to $29,999 | 6 (4.9%) | 5 (5.6%) |
| $30,000 to $34,999 | 8 (6.5%) | 13 (14.6%) |
| $35,000 to $39,999 | 15 (12.2%) | 2 (2.2%) |
| $40,000 to $44,999 | 19 (15.4%) | 13 (14.6%) |
| $45,000 to $49,999 | 3 (2.4%) | 1 (1.1%) |
| $50,000 to $54,999 | 3 (2.4%) | 2 (2.2%) |
| $55,000 to $64,999 | 8 (6.5%) | 3 (3.4%) |
| $65,000 to $74,999 | 9 (7.3%) | 1 (1.1%) |
| $75,000 to $99,999 | 4 (3.3%) | 2 (2.2%) |
| $100,000+ | 3 (2.4%) | 2 (2.2%) |
| Total | 123 (100.0%) | 89 (100.0%) |
Earnings by Sex by Educational Attainment in Eakly
Average earnings in Eakly are $37,308 for men and $25,938 for women, a difference of 30.5%. Men with an educational attainment of bachelor's degree enjoy the highest average annual earnings of $46,875, while those with less than high school education earn the least with $34,688. Women with an educational attainment of bachelor's degree earn the most with the average annual earnings of $43,750, while those with high school diploma education have the smallest earnings of $20,417.
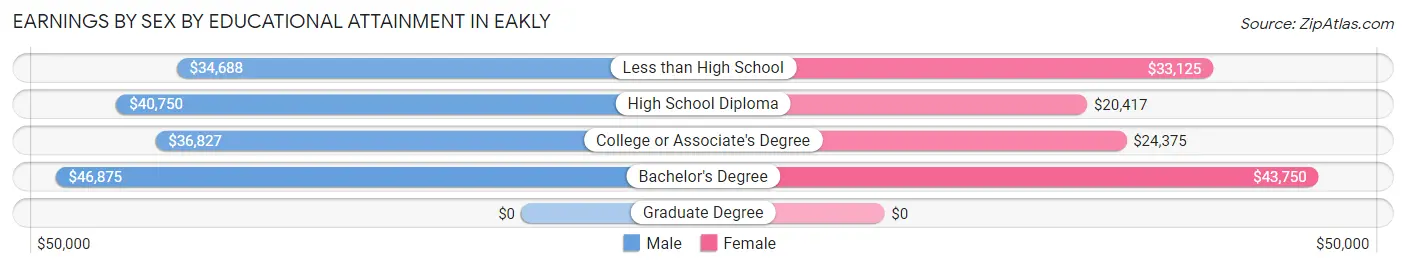
| Educational Attainment | Male Income | Female Income |
| Less than High School | $34,688 | $33,125 |
| High School Diploma | $40,750 | $20,417 |
| College or Associate's Degree | $36,827 | $24,375 |
| Bachelor's Degree | $46,875 | $43,750 |
| Graduate Degree | - | - |
| Total | $37,308 | $25,938 |
Family Income in Eakly
Family Income Brackets in Eakly
According to the Eakly family income data, there are 19 families falling into the $50,000 to $74,999 income range, which is the most common income bracket and makes up 24.0% of all families. Conversely, the $200,000+ income bracket is the least frequent group with only 1 families (1.3%) belonging to this category.
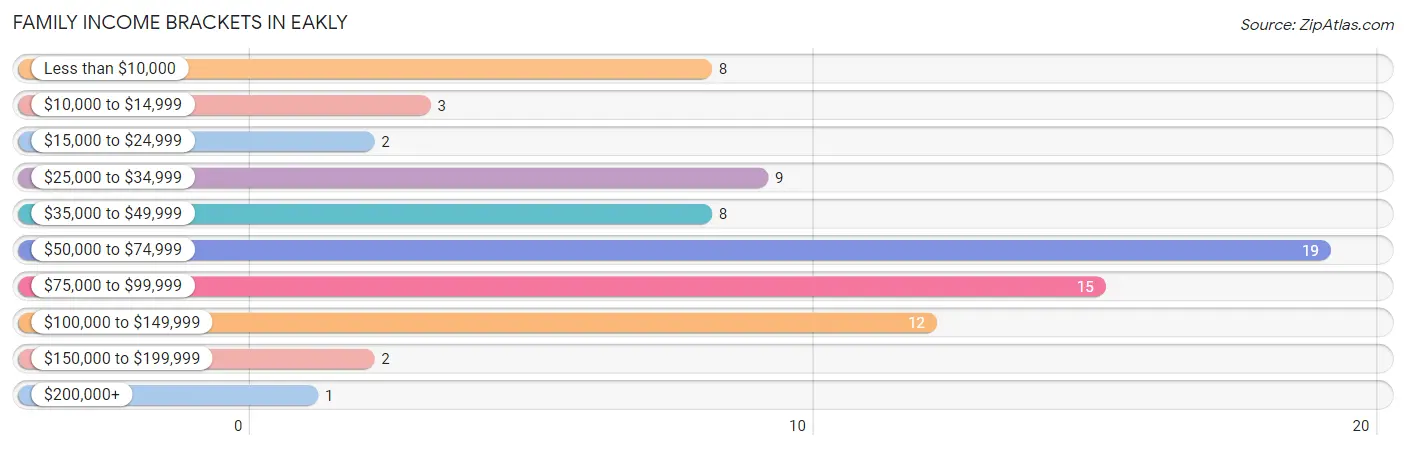
| Income Bracket | # Families | % Families |
| Less than $10,000 | 8 | 10.1% |
| $10,000 to $14,999 | 3 | 3.8% |
| $15,000 to $24,999 | 2 | 2.5% |
| $25,000 to $34,999 | 9 | 11.4% |
| $35,000 to $49,999 | 8 | 10.1% |
| $50,000 to $74,999 | 19 | 24.1% |
| $75,000 to $99,999 | 15 | 19.0% |
| $100,000 to $149,999 | 12 | 15.2% |
| $150,000 to $199,999 | 2 | 2.5% |
| $200,000+ | 1 | 1.3% |
Family Income by Famaliy Size in Eakly
2-person families (22 | 27.9%) account for the highest median family income in Eakly with $75,000 per family, while 2-person families (22 | 27.9%) have the highest median income of $37,500 per family member.
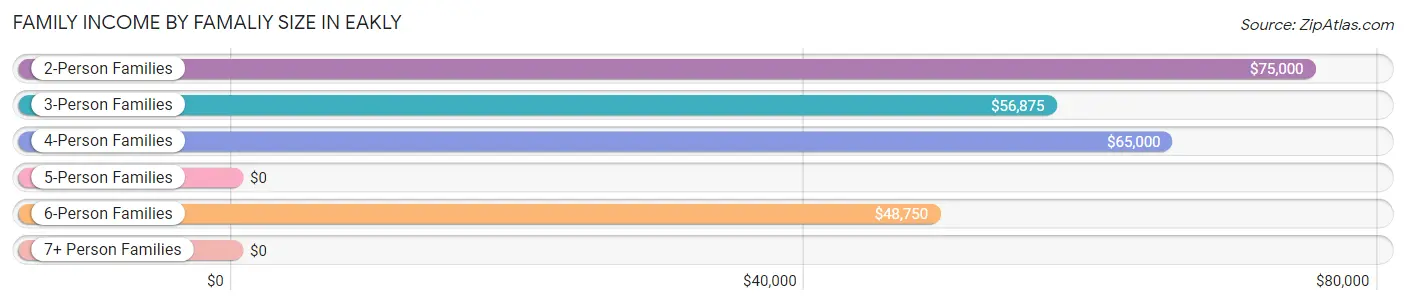
| Income Bracket | # Families | Median Income |
| 2-Person Families | 22 (27.9%) | $75,000 |
| 3-Person Families | 21 (26.6%) | $56,875 |
| 4-Person Families | 18 (22.8%) | $65,000 |
| 5-Person Families | 4 (5.1%) | $0 |
| 6-Person Families | 6 (7.6%) | $48,750 |
| 7+ Person Families | 8 (10.1%) | $0 |
| Total | 79 (100.0%) | $61,750 |
Family Income by Number of Earners in Eakly
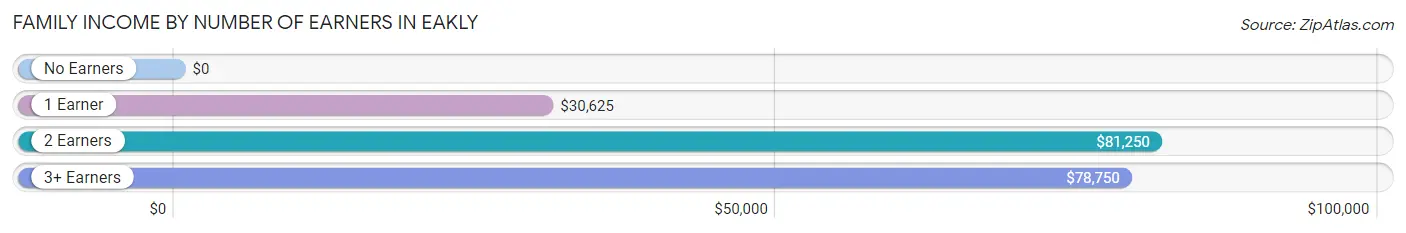
| Number of Earners | # Families | Median Income |
| No Earners | 9 (11.4%) | $0 |
| 1 Earner | 25 (31.7%) | $30,625 |
| 2 Earners | 29 (36.7%) | $81,250 |
| 3+ Earners | 16 (20.3%) | $78,750 |
| Total | 79 (100.0%) | $61,750 |
Household Income in Eakly
Household Income Brackets in Eakly
With 23 households falling in the category, the $50,000 to $74,999 income range is the most frequent in Eakly, accounting for 21.7% of all households. In contrast, only 1 households (0.9%) fall into the $200,000+ income bracket, making it the least populous group.
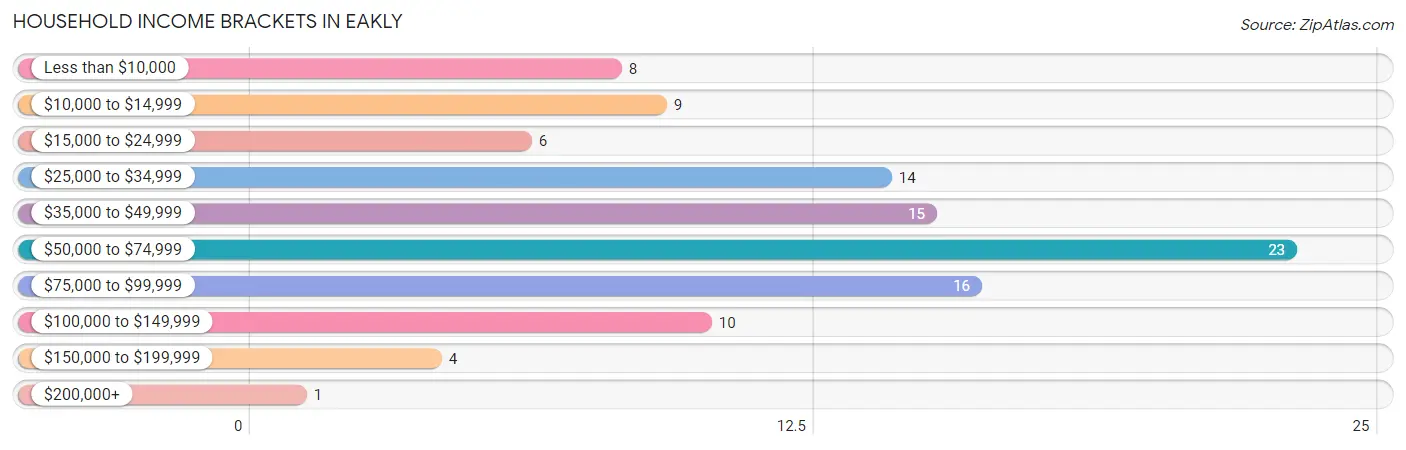
| Income Bracket | # Households | % Households |
| Less than $10,000 | 8 | 7.5% |
| $10,000 to $14,999 | 9 | 8.5% |
| $15,000 to $24,999 | 6 | 5.7% |
| $25,000 to $34,999 | 14 | 13.2% |
| $35,000 to $49,999 | 15 | 14.2% |
| $50,000 to $74,999 | 23 | 21.7% |
| $75,000 to $99,999 | 16 | 15.1% |
| $100,000 to $149,999 | 10 | 9.4% |
| $150,000 to $199,999 | 4 | 3.8% |
| $200,000+ | 1 | 0.9% |
Household Income by Householder Age in Eakly
The median household income in Eakly is $52,500, with the highest median household income of $61,667 found in the 25 to 44 years age bracket for the primary householder. A total of 44 households (41.5%) fall into this category. Meanwhile, the 45 to 64 years age bracket for the primary householder has the lowest median household income of $0, with 32 households (30.2%) in this group.
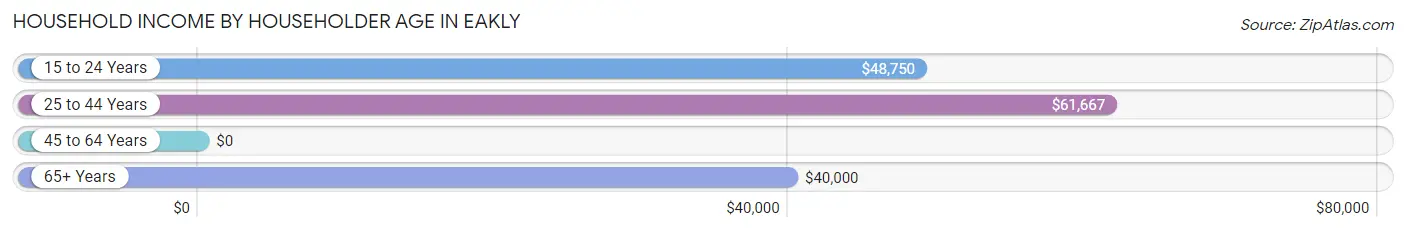
| Income Bracket | # Households | Median Income |
| 15 to 24 Years | 6 (5.7%) | $48,750 |
| 25 to 44 Years | 44 (41.5%) | $61,667 |
| 45 to 64 Years | 32 (30.2%) | $0 |
| 65+ Years | 24 (22.6%) | $40,000 |
| Total | 106 (100.0%) | $52,500 |
Poverty in Eakly
Income Below Poverty by Sex and Age in Eakly
With 18.2% poverty level for males and 37.0% for females among the residents of Eakly, 12 to 14 year old males and 5 year old females are the most vulnerable to poverty, with 8 males (72.7%) and 20 females (90.9%) in their respective age groups living below the poverty level.
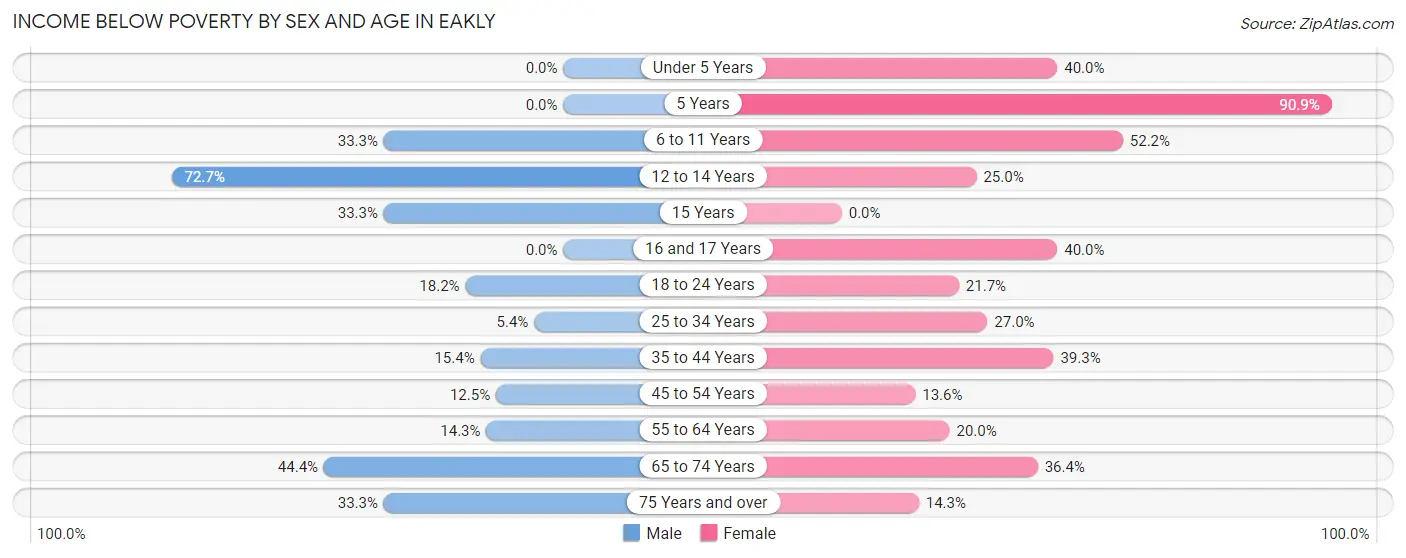
| Age Bracket | Male | Female |
| Under 5 Years | 0 (0.0%) | 12 (40.0%) |
| 5 Years | 0 (0.0%) | 20 (90.9%) |
| 6 to 11 Years | 6 (33.3%) | 12 (52.2%) |
| 12 to 14 Years | 8 (72.7%) | 3 (25.0%) |
| 15 Years | 2 (33.3%) | 0 (0.0%) |
| 16 and 17 Years | 0 (0.0%) | 4 (40.0%) |
| 18 to 24 Years | 10 (18.2%) | 5 (21.7%) |
| 25 to 34 Years | 2 (5.4%) | 10 (27.0%) |
| 35 to 44 Years | 4 (15.4%) | 11 (39.3%) |
| 45 to 54 Years | 2 (12.5%) | 3 (13.6%) |
| 55 to 64 Years | 1 (14.3%) | 2 (20.0%) |
| 65 to 74 Years | 4 (44.4%) | 4 (36.4%) |
| 75 Years and over | 1 (33.3%) | 1 (14.3%) |
| Total | 40 (18.2%) | 87 (37.0%) |
Income Above Poverty by Sex and Age in Eakly
According to the poverty statistics in Eakly, males aged under 5 years and females aged 45 to 54 years are the age groups that are most secure financially, with 100.0% of males and 86.4% of females in these age groups living above the poverty line.
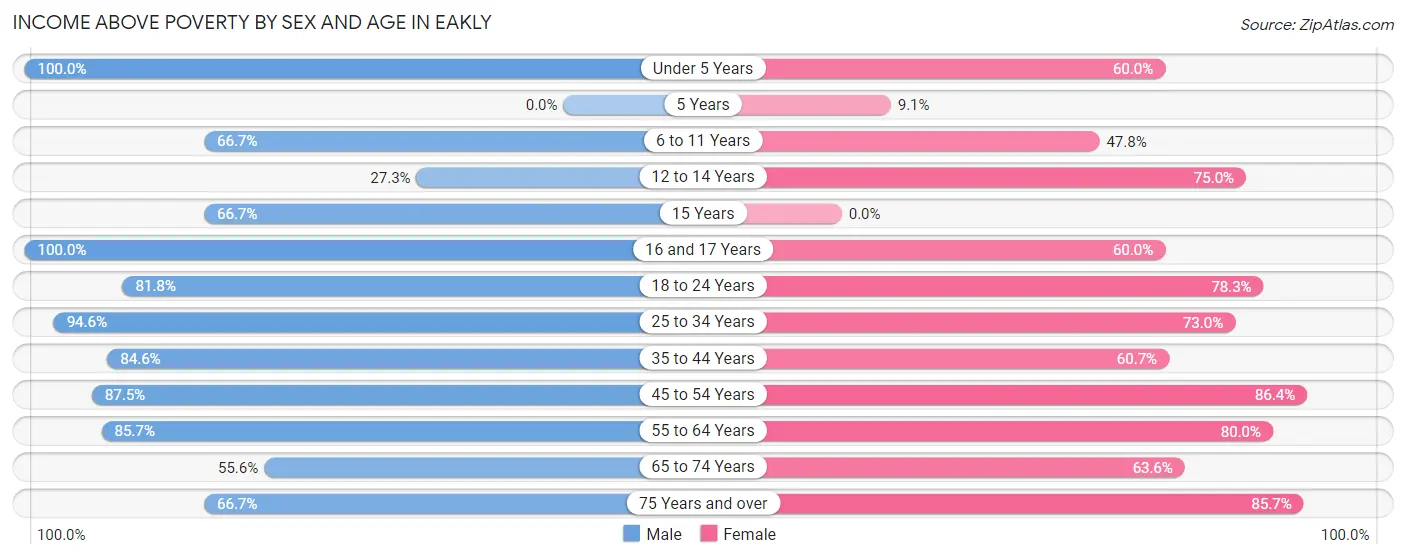
| Age Bracket | Male | Female |
| Under 5 Years | 30 (100.0%) | 18 (60.0%) |
| 5 Years | 0 (0.0%) | 2 (9.1%) |
| 6 to 11 Years | 12 (66.7%) | 11 (47.8%) |
| 12 to 14 Years | 3 (27.3%) | 9 (75.0%) |
| 15 Years | 4 (66.7%) | 0 (0.0%) |
| 16 and 17 Years | 2 (100.0%) | 6 (60.0%) |
| 18 to 24 Years | 45 (81.8%) | 18 (78.3%) |
| 25 to 34 Years | 35 (94.6%) | 27 (73.0%) |
| 35 to 44 Years | 22 (84.6%) | 17 (60.7%) |
| 45 to 54 Years | 14 (87.5%) | 19 (86.4%) |
| 55 to 64 Years | 6 (85.7%) | 8 (80.0%) |
| 65 to 74 Years | 5 (55.6%) | 7 (63.6%) |
| 75 Years and over | 2 (66.7%) | 6 (85.7%) |
| Total | 180 (81.8%) | 148 (63.0%) |
Income Below Poverty Among Married-Couple Families in Eakly
The poverty statistics for married-couple families in Eakly show that 22.8% or 13 of the total 57 families live below the poverty line. Families with 5 or more children have the highest poverty rate of 100.0%, comprising of 3 families. On the other hand, families with 1 or 2 children have the lowest poverty rate of 4.8%, which includes 1 families.
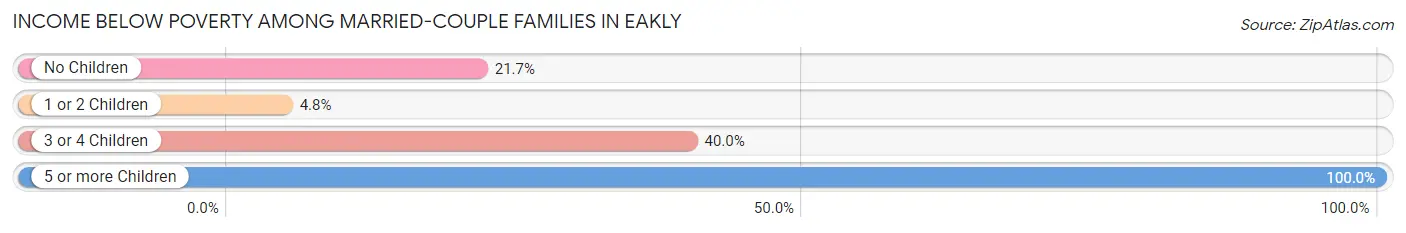
| Children | Above Poverty | Below Poverty |
| No Children | 18 (78.3%) | 5 (21.7%) |
| 1 or 2 Children | 20 (95.2%) | 1 (4.8%) |
| 3 or 4 Children | 6 (60.0%) | 4 (40.0%) |
| 5 or more Children | 0 (0.0%) | 3 (100.0%) |
| Total | 44 (77.2%) | 13 (22.8%) |
Income Below Poverty Among Single-Parent Households in Eakly
According to the poverty data in Eakly, 40.0% or 2 single-father households and 11.8% or 2 single-mother households are living below the poverty line. Among single-father households, those with 1 or 2 children have the highest poverty rate, with 2 households (40.0%) experiencing poverty. Likewise, among single-mother households, those with 3 or 4 children have the highest poverty rate, with 1 households (33.3%) falling below the poverty line.
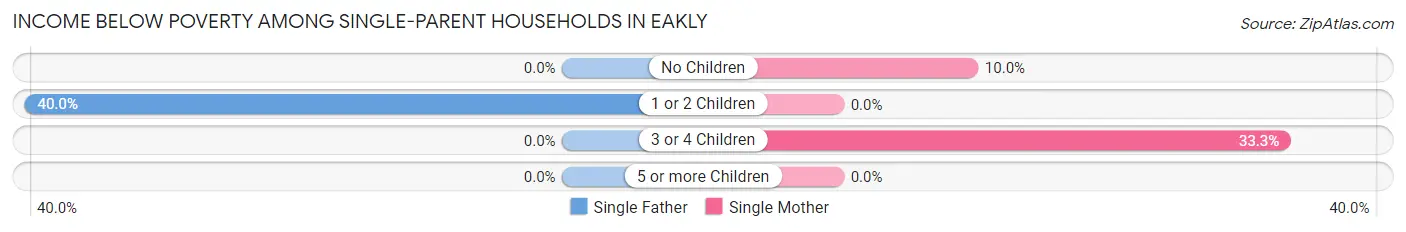
| Children | Single Father | Single Mother |
| No Children | 0 (0.0%) | 1 (10.0%) |
| 1 or 2 Children | 2 (40.0%) | 0 (0.0%) |
| 3 or 4 Children | 0 (0.0%) | 1 (33.3%) |
| 5 or more Children | 0 (0.0%) | 0 (0.0%) |
| Total | 2 (40.0%) | 2 (11.8%) |
Income Below Poverty Among Married-Couple vs Single-Parent Households in Eakly
The poverty data for Eakly shows that 13 of the married-couple family households (22.8%) and 4 of the single-parent households (18.2%) are living below the poverty level. Within the married-couple family households, those with 5 or more children have the highest poverty rate, with 3 households (100.0%) falling below the poverty line. Among the single-parent households, those with 3 or 4 children have the highest poverty rate, with 1 household (33.3%) living below poverty.
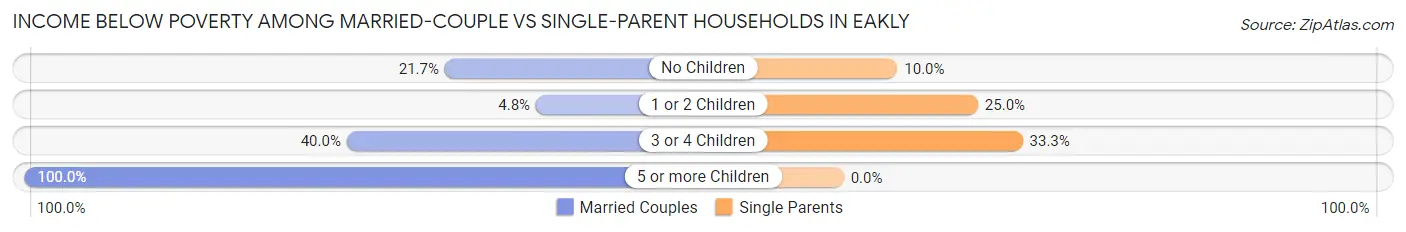
| Children | Married-Couple Families | Single-Parent Households |
| No Children | 5 (21.7%) | 1 (10.0%) |
| 1 or 2 Children | 1 (4.8%) | 2 (25.0%) |
| 3 or 4 Children | 4 (40.0%) | 1 (33.3%) |
| 5 or more Children | 3 (100.0%) | 0 (0.0%) |
| Total | 13 (22.8%) | 4 (18.2%) |
Race in Eakly
The most populous races in Eakly are Hispanic or Latino (314 | 68.3%), Some other Race (186 | 40.4%), and White / Caucasian (183 | 39.8%).
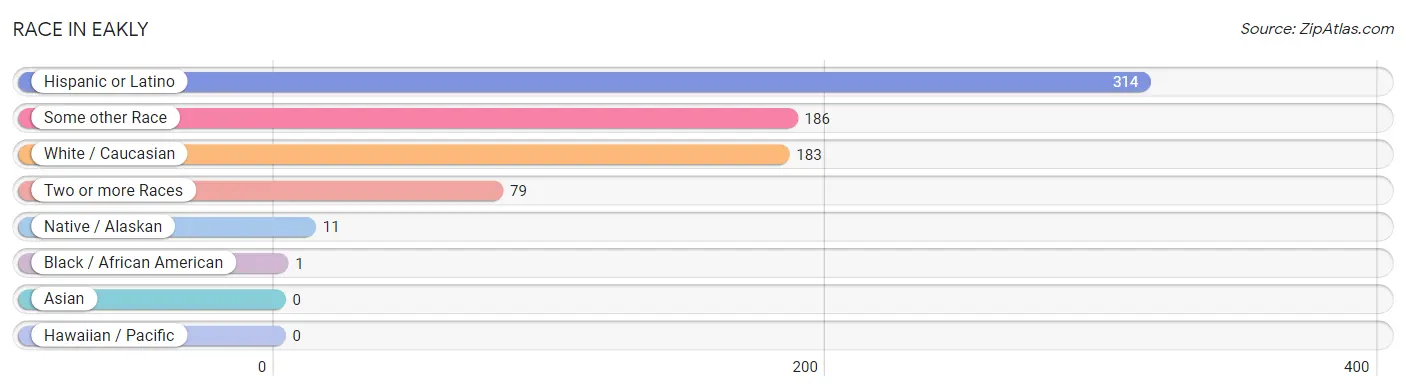
| Race | # Population | % Population |
| Asian | 0 | 0.0% |
| Black / African American | 1 | 0.2% |
| Hawaiian / Pacific | 0 | 0.0% |
| Hispanic or Latino | 314 | 68.3% |
| Native / Alaskan | 11 | 2.4% |
| White / Caucasian | 183 | 39.8% |
| Two or more Races | 79 | 17.2% |
| Some other Race | 186 | 40.4% |
| Total | 460 | 100.0% |
Ancestry in Eakly
The most populous ancestries reported in Eakly are Mexican (282 | 61.3%), Irish (62 | 13.5%), Spaniard (32 | 7.0%), German (27 | 5.9%), and American (21 | 4.6%), together accounting for 92.2% of all Eakly residents.
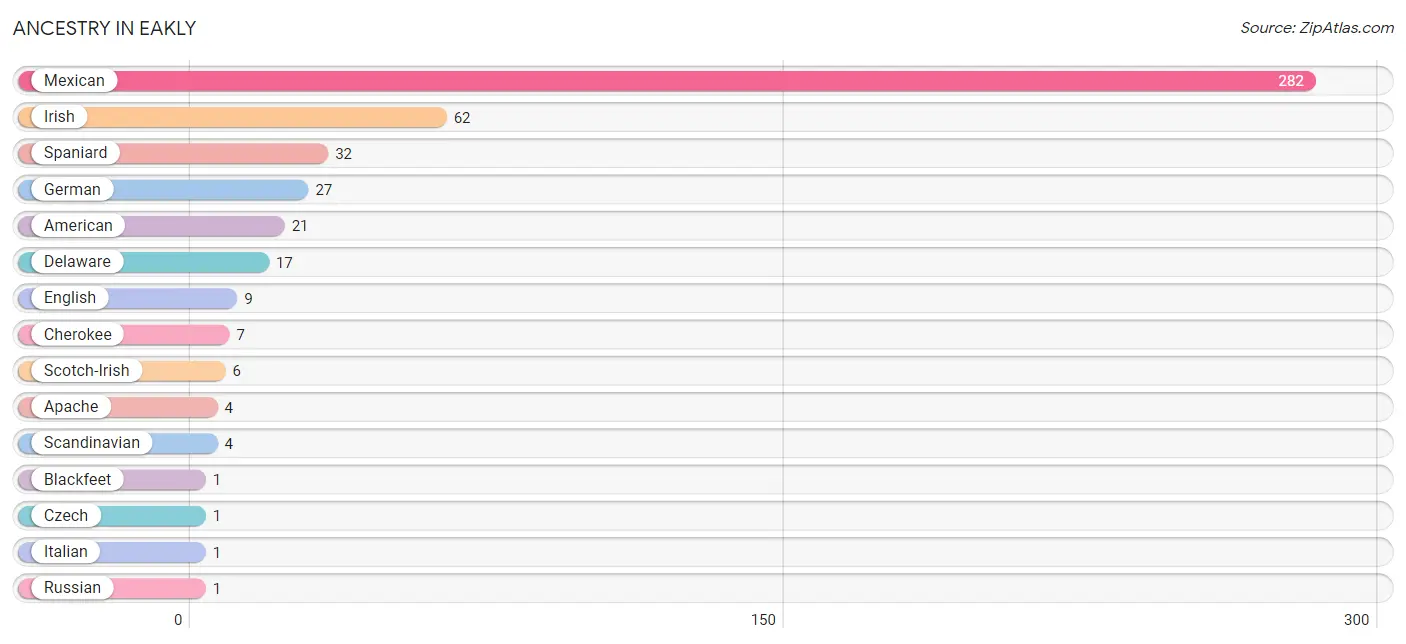
| Ancestry | # Population | % Population |
| American | 21 | 4.6% |
| Apache | 4 | 0.9% |
| Blackfeet | 1 | 0.2% |
| Cherokee | 7 | 1.5% |
| Czech | 1 | 0.2% |
| Delaware | 17 | 3.7% |
| English | 9 | 2.0% |
| German | 27 | 5.9% |
| Irish | 62 | 13.5% |
| Italian | 1 | 0.2% |
| Mexican | 282 | 61.3% |
| Russian | 1 | 0.2% |
| Scandinavian | 4 | 0.9% |
| Scotch-Irish | 6 | 1.3% |
| Spaniard | 32 | 7.0% | View All 15 Rows |
Immigrants in Eakly
The most numerous immigrant groups reported in Eakly came from Central America (159 | 34.6%), Latin America (159 | 34.6%), and Mexico (159 | 34.6%), together accounting for 103.7% of all Eakly residents.
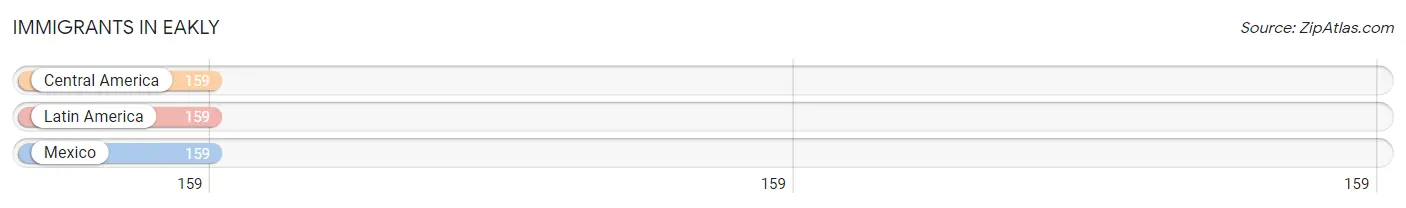
| Immigration Origin | # Population | % Population |
| Central America | 159 | 34.6% |
| Latin America | 159 | 34.6% |
| Mexico | 159 | 34.6% | View All 3 Rows |
Sex and Age in Eakly
Sex and Age in Eakly
The most populous age groups in Eakly are Under 5 Years (33 | 14.7%) for men and 5 to 9 Years (44 | 18.7%) for women.
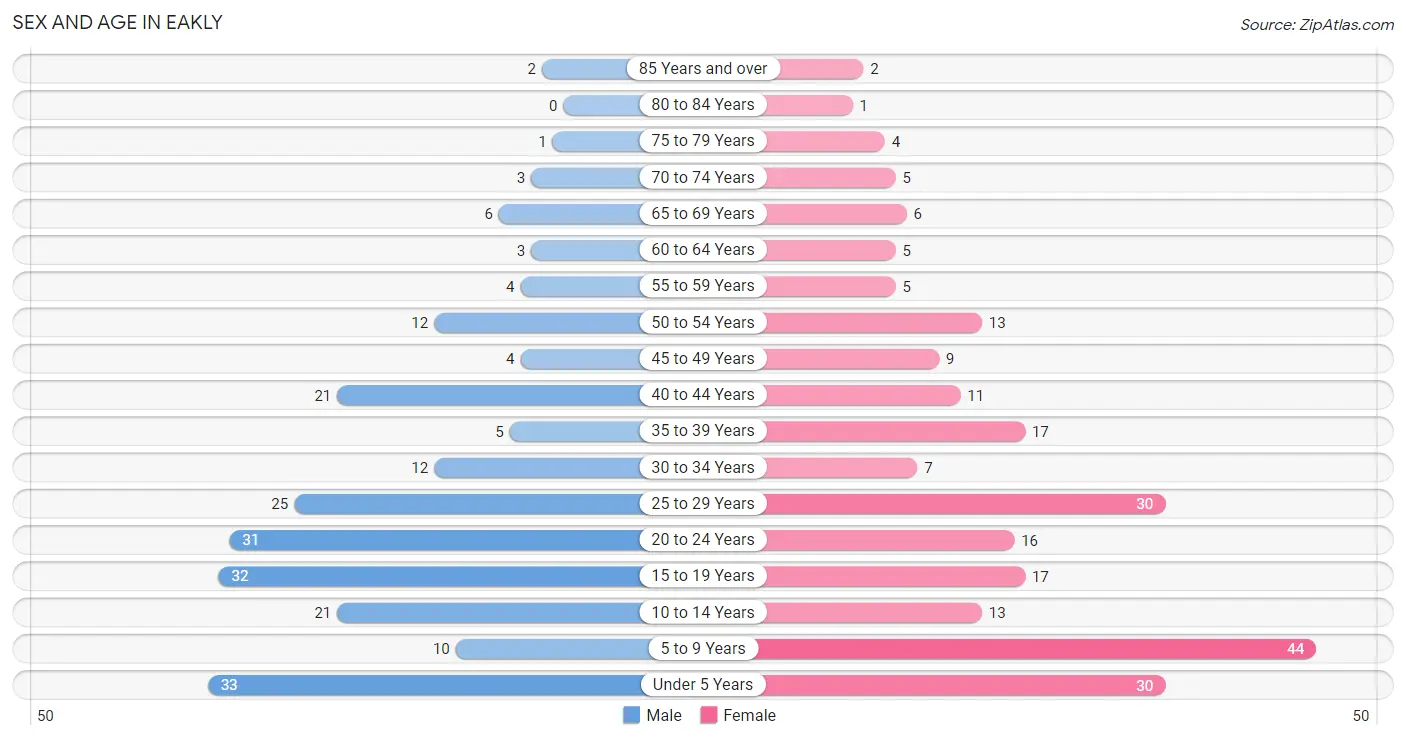
| Age Bracket | Male | Female |
| Under 5 Years | 33 (14.7%) | 30 (12.8%) |
| 5 to 9 Years | 10 (4.4%) | 44 (18.7%) |
| 10 to 14 Years | 21 (9.3%) | 13 (5.5%) |
| 15 to 19 Years | 32 (14.2%) | 17 (7.2%) |
| 20 to 24 Years | 31 (13.8%) | 16 (6.8%) |
| 25 to 29 Years | 25 (11.1%) | 30 (12.8%) |
| 30 to 34 Years | 12 (5.3%) | 7 (3.0%) |
| 35 to 39 Years | 5 (2.2%) | 17 (7.2%) |
| 40 to 44 Years | 21 (9.3%) | 11 (4.7%) |
| 45 to 49 Years | 4 (1.8%) | 9 (3.8%) |
| 50 to 54 Years | 12 (5.3%) | 13 (5.5%) |
| 55 to 59 Years | 4 (1.8%) | 5 (2.1%) |
| 60 to 64 Years | 3 (1.3%) | 5 (2.1%) |
| 65 to 69 Years | 6 (2.7%) | 6 (2.5%) |
| 70 to 74 Years | 3 (1.3%) | 5 (2.1%) |
| 75 to 79 Years | 1 (0.4%) | 4 (1.7%) |
| 80 to 84 Years | 0 (0.0%) | 1 (0.4%) |
| 85 Years and over | 2 (0.9%) | 2 (0.9%) |
| Total | 225 (100.0%) | 235 (100.0%) |
Families and Households in Eakly
Median Family Size in Eakly
The median family size in Eakly is 5.27 persons per family, with single female/mother families (17 | 21.5%) accounting for the largest median family size of 8 persons per family. On the other hand, married-couple families (57 | 72.2%) represent the smallest median family size with 4.37 persons per family.
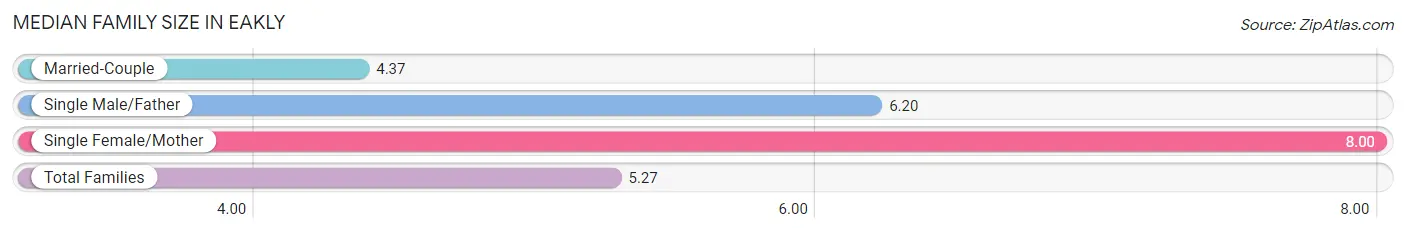
| Family Type | # Families | Family Size |
| Married-Couple | 57 (72.2%) | 4.37 |
| Single Male/Father | 5 (6.3%) | 6.20 |
| Single Female/Mother | 17 (21.5%) | 8.00 |
| Total Families | 79 (100.0%) | 5.27 |
Median Household Size in Eakly
The median household size in Eakly is 4.34 persons per household, with single female/mother households (17 | 16.0%) accounting for the largest median household size of 8.35 persons per household. non-family households (27 | 25.5%) represent the smallest median household size with 1.37 persons per household.
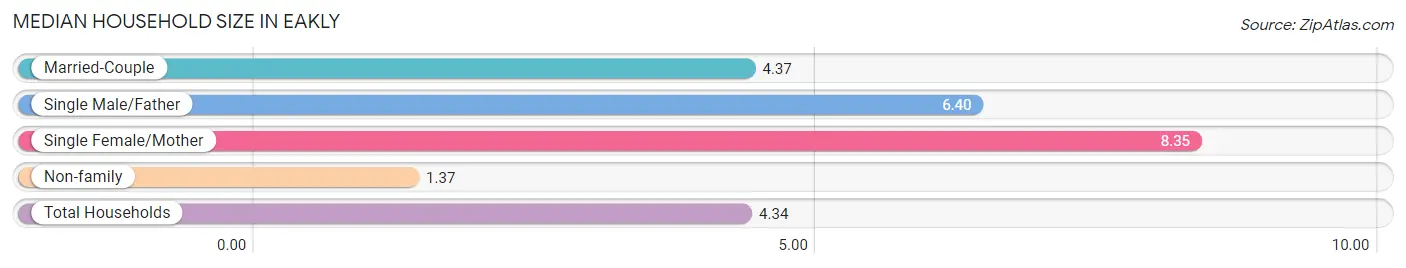
| Household Type | # Households | Household Size |
| Married-Couple | 57 (53.8%) | 4.37 |
| Single Male/Father | 5 (4.7%) | 6.40 |
| Single Female/Mother | 17 (16.0%) | 8.35 |
| Non-family | 27 (25.5%) | 1.37 |
| Total Households | 106 (100.0%) | 4.34 |
Household Size by Marriage Status in Eakly
Out of a total of 106 households in Eakly, 79 (74.5%) are family households, while 27 (25.5%) are nonfamily households. The most numerous type of family households are 2-person households, comprising 22, and the most common type of nonfamily households are 1-person households, comprising 22.
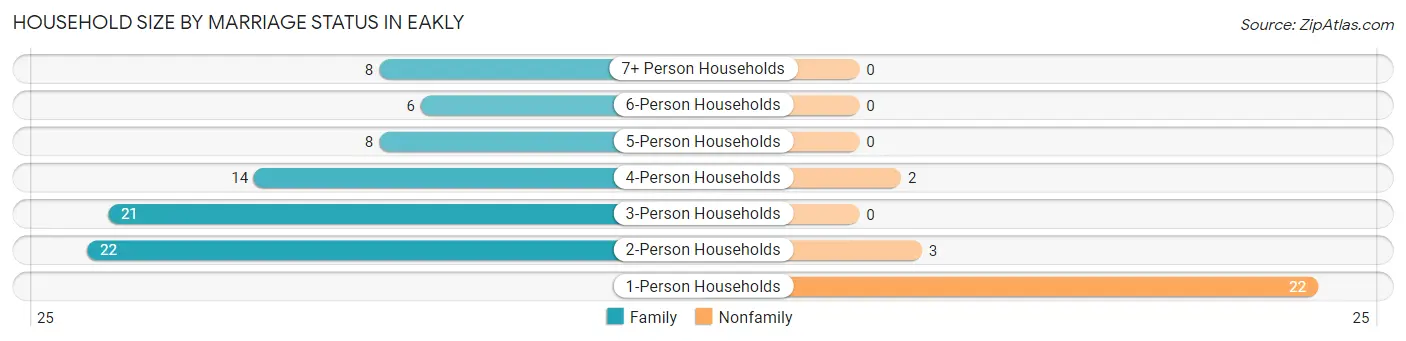
| Household Size | Family Households | Nonfamily Households |
| 1-Person Households | - | 22 (20.7%) |
| 2-Person Households | 22 (20.7%) | 3 (2.8%) |
| 3-Person Households | 21 (19.8%) | 0 (0.0%) |
| 4-Person Households | 14 (13.2%) | 2 (1.9%) |
| 5-Person Households | 8 (7.5%) | 0 (0.0%) |
| 6-Person Households | 6 (5.7%) | 0 (0.0%) |
| 7+ Person Households | 8 (7.5%) | 0 (0.0%) |
| Total | 79 (74.5%) | 27 (25.5%) |
Female Fertility in Eakly
Fertility by Age in Eakly
Average fertility rate in Eakly is 135.0 births per 1,000 women. Women in the age bracket of 20 to 34 years have the highest fertility rate with 283.0 births per 1,000 women. Women in the age bracket of 20 to 34 years acount for 100.0% of all women with births.
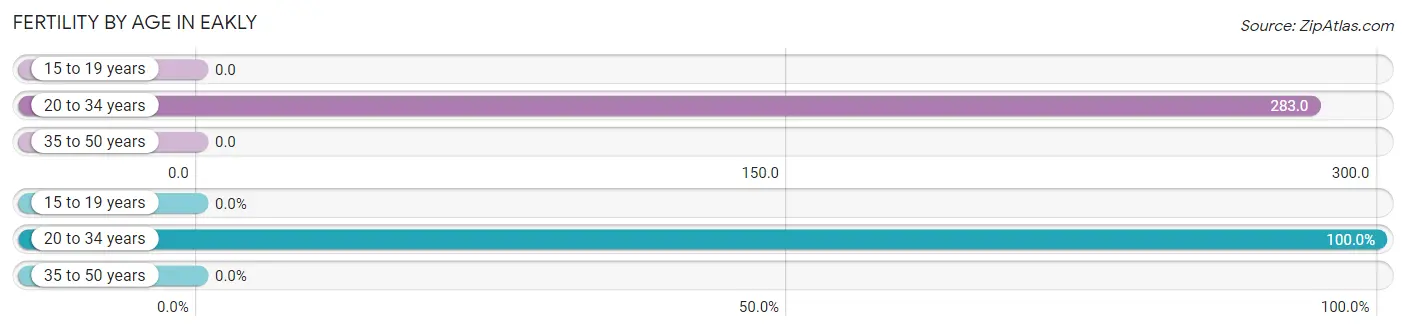
| Age Bracket | Women with Births | Births / 1,000 Women |
| 15 to 19 years | 0 (0.0%) | 0.0 |
| 20 to 34 years | 15 (100.0%) | 283.0 |
| 35 to 50 years | 0 (0.0%) | 0.0 |
| Total | 15 (100.0%) | 135.0 |
Fertility by Age by Marriage Status in Eakly
40.0% of women with births (15) in Eakly are married. The highest percentage of unmarried women with births falls into 20 to 34 years age bracket with 60.0% of them unmarried at the time of birth, while the lowest percentage of unmarried women with births belong to 20 to 34 years age bracket with 60.0% of them unmarried.
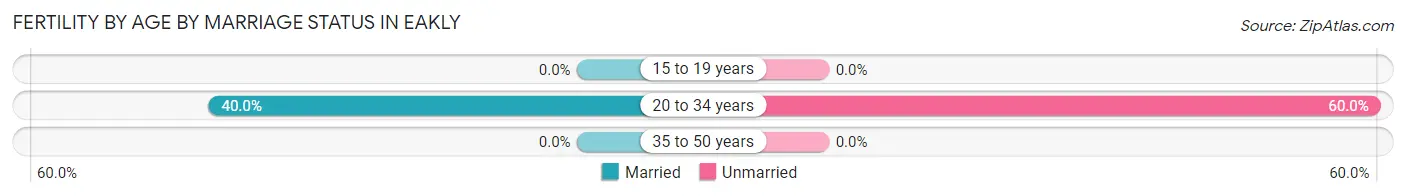
| Age Bracket | Married | Unmarried |
| 15 to 19 years | 0 (0.0%) | 0 (0.0%) |
| 20 to 34 years | 6 (40.0%) | 9 (60.0%) |
| 35 to 50 years | 0 (0.0%) | 0 (0.0%) |
| Total | 6 (40.0%) | 9 (60.0%) |
Fertility by Education in Eakly
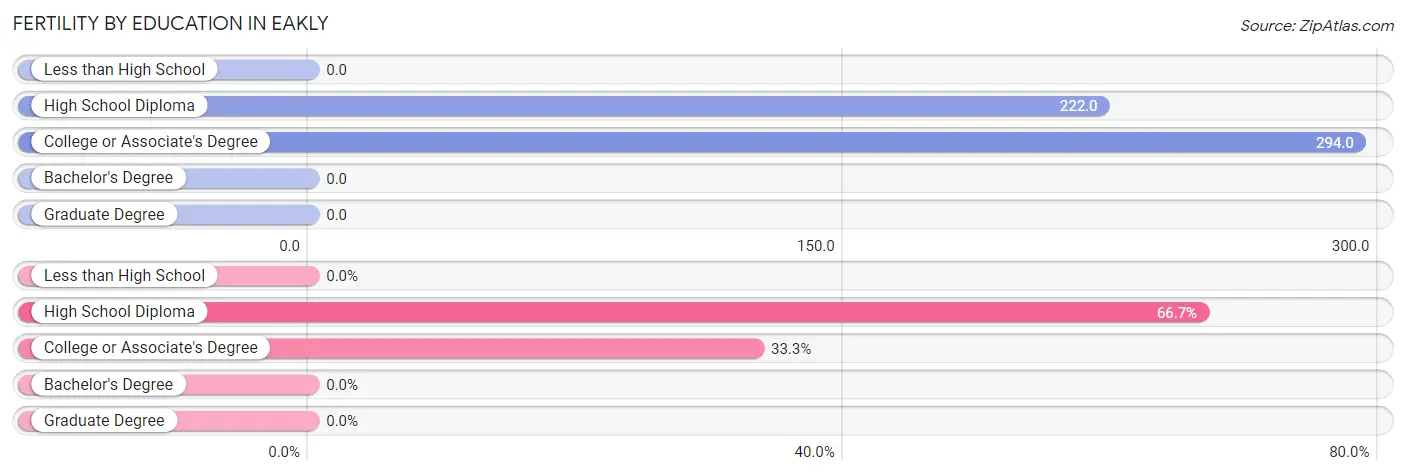
| Educational Attainment | Women with Births | Births / 1,000 Women |
| Less than High School | 0 (0.0%) | 0.0 |
| High School Diploma | 10 (66.7%) | 222.0 |
| College or Associate's Degree | 5 (33.3%) | 294.0 |
| Bachelor's Degree | 0 (0.0%) | 0.0 |
| Graduate Degree | 0 (0.0%) | 0.0 |
| Total | 15 (100.0%) | 135.0 |
Fertility by Education by Marriage Status in Eakly
60.0% of women with births in Eakly are unmarried. Women with the educational attainment of high school diploma are most likely to be married with 40.0% of them married at childbirth, while women with the educational attainment of high school diploma are least likely to be married with 60.0% of them unmarried at childbirth.
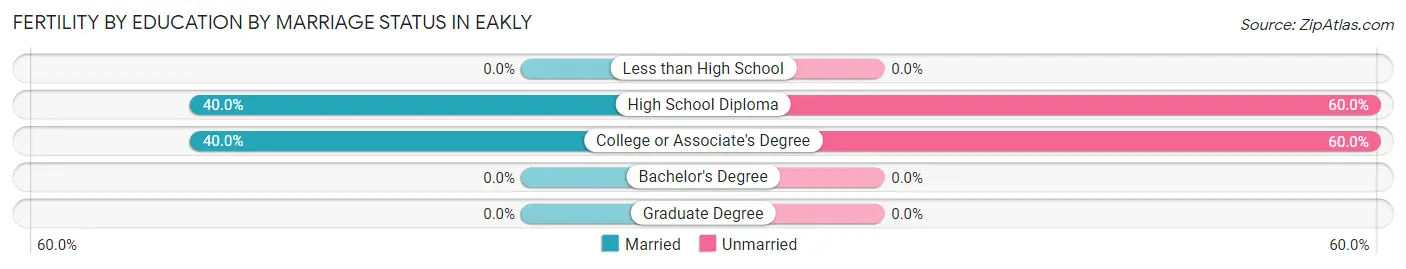
| Educational Attainment | Married | Unmarried |
| Less than High School | 0 (0.0%) | 0 (0.0%) |
| High School Diploma | 4 (40.0%) | 6 (60.0%) |
| College or Associate's Degree | 2 (40.0%) | 3 (60.0%) |
| Bachelor's Degree | 0 (0.0%) | 0 (0.0%) |
| Graduate Degree | 0 (0.0%) | 0 (0.0%) |
| Total | 6 (40.0%) | 9 (60.0%) |
Employment Characteristics in Eakly
Employment by Class of Employer in Eakly
Among the 165 employed individuals in Eakly, private company employees (121 | 73.3%), self-employed (not incorporated) (9 | 5.4%), and not-for-profit organizations (8 | 4.9%) make up the most common classes of employment.
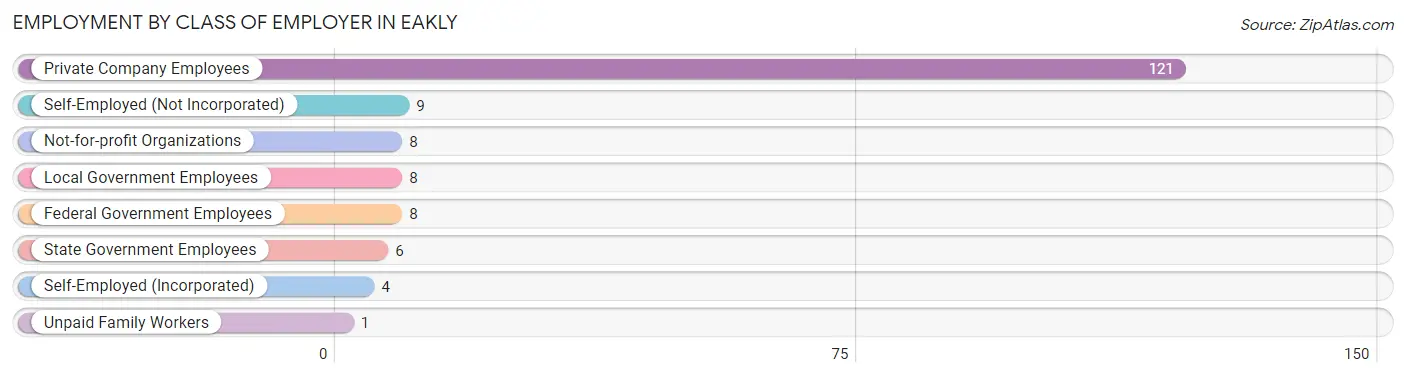
| Employer Class | # Employees | % Employees |
| Private Company Employees | 121 | 73.3% |
| Self-Employed (Incorporated) | 4 | 2.4% |
| Self-Employed (Not Incorporated) | 9 | 5.4% |
| Not-for-profit Organizations | 8 | 4.9% |
| Local Government Employees | 8 | 4.9% |
| State Government Employees | 6 | 3.6% |
| Federal Government Employees | 8 | 4.9% |
| Unpaid Family Workers | 1 | 0.6% |
| Total | 165 | 100.0% |
Employment Status by Age in Eakly
According to the labor force statistics for Eakly, out of the total population over 16 years of age (303), 63.7% or 193 individuals are in the labor force, with 2.1% or 4 of them unemployed. The age group with the highest labor force participation rate is 60 to 64 years, with 100.0% or 8 individuals in the labor force. Within the labor force, the 65 to 74 years age range has the highest percentage of unemployed individuals, with 14.3% or 1 of them being unemployed.
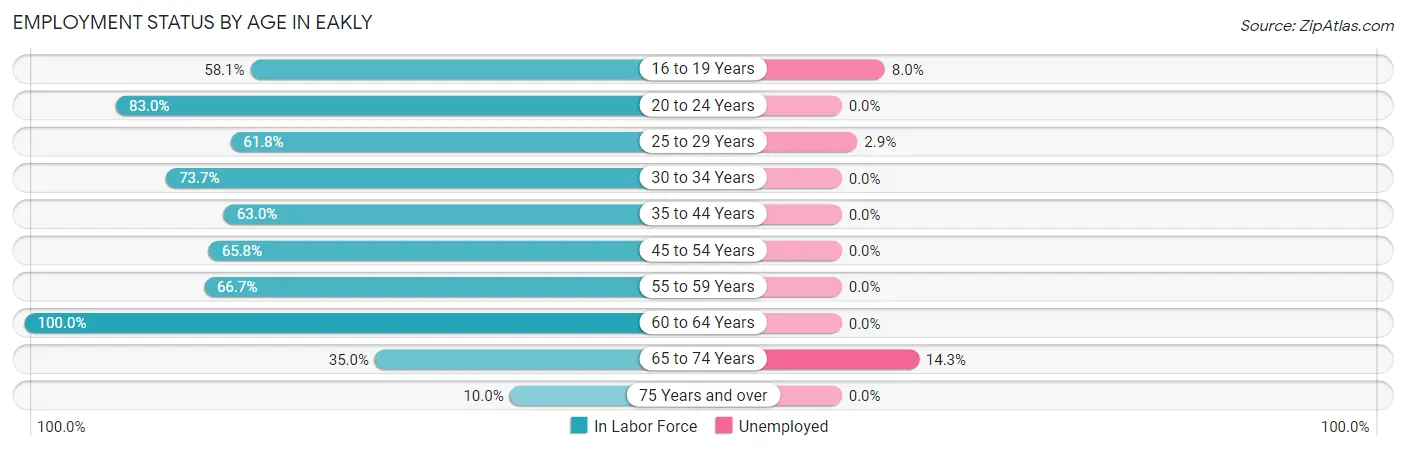
| Age Bracket | In Labor Force | Unemployed |
| 16 to 19 Years | 25 (58.1%) | 2 (8.0%) |
| 20 to 24 Years | 39 (83.0%) | 0 (0.0%) |
| 25 to 29 Years | 34 (61.8%) | 1 (2.9%) |
| 30 to 34 Years | 14 (73.7%) | 0 (0.0%) |
| 35 to 44 Years | 34 (63.0%) | 0 (0.0%) |
| 45 to 54 Years | 25 (65.8%) | 0 (0.0%) |
| 55 to 59 Years | 6 (66.7%) | 0 (0.0%) |
| 60 to 64 Years | 8 (100.0%) | 0 (0.0%) |
| 65 to 74 Years | 7 (35.0%) | 1 (14.3%) |
| 75 Years and over | 1 (10.0%) | 0 (0.0%) |
| Total | 193 (63.7%) | 4 (2.1%) |
Employment Status by Educational Attainment in Eakly
According to labor force statistics for Eakly, 66.1% of individuals (121) out of the total population between 25 and 64 years of age (183) are in the labor force, with 0.8% or 1 of them being unemployed. The group with the highest labor force participation rate are those with the educational attainment of college / associate degree, with 75.0% or 33 individuals in the labor force. Within the labor force, individuals with college / associate degree education have the highest percentage of unemployment, with 3.0% or 1 of them being unemployed.
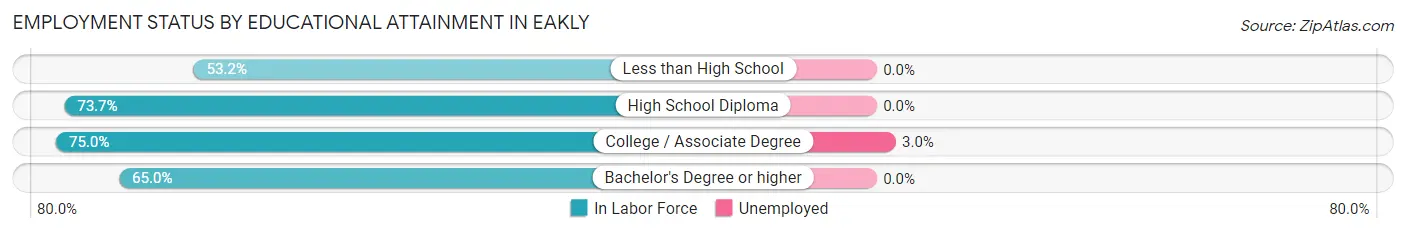
| Educational Attainment | In Labor Force | Unemployed |
| Less than High School | 33 (53.2%) | 0 (0.0%) |
| High School Diploma | 42 (73.7%) | 0 (0.0%) |
| College / Associate Degree | 33 (75.0%) | 1 (3.0%) |
| Bachelor's Degree or higher | 13 (65.0%) | 0 (0.0%) |
| Total | 121 (66.1%) | 1 (0.8%) |
Employment Occupations by Sex in Eakly
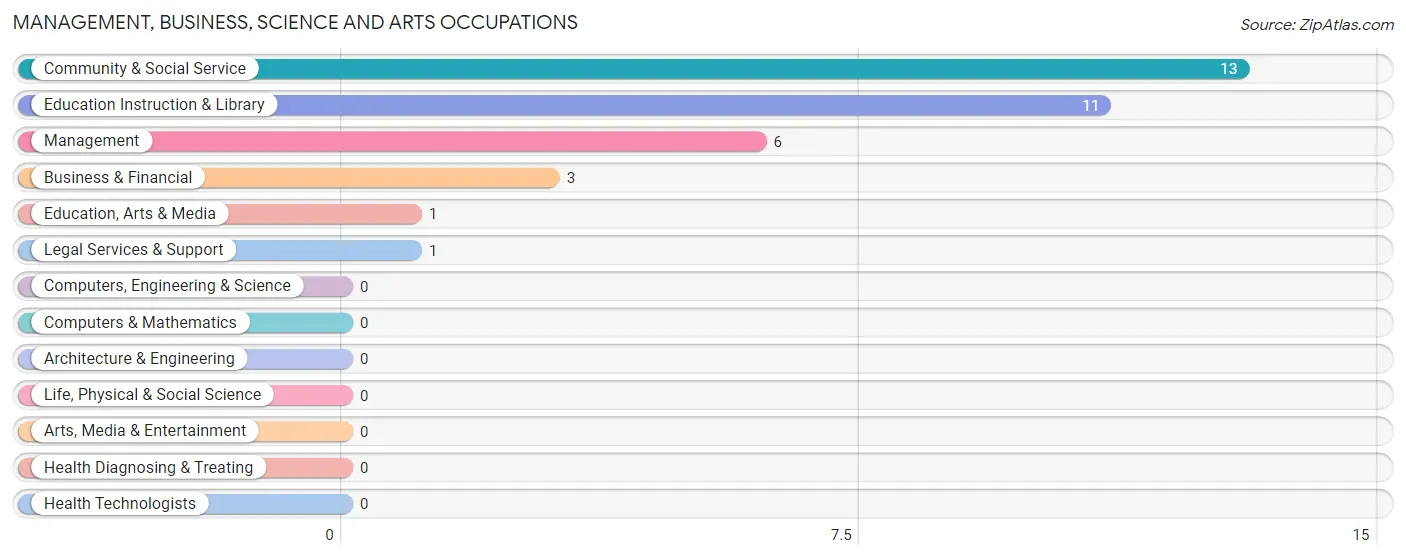
Management, Business, Science and Arts Occupations
The most common Management, Business, Science and Arts occupations in Eakly are Community & Social Service (13 | 6.9%), Education Instruction & Library (11 | 5.8%), Management (6 | 3.2%), Business & Financial (3 | 1.6%), and Education, Arts & Media (1 | 0.5%).
Management, Business, Science and Arts Occupations by Sex
Within the Management, Business, Science and Arts occupations in Eakly, the most male-oriented occupations are Education, Arts & Media (100.0%), Legal Services & Support (100.0%), and Management (66.7%), while the most female-oriented occupations are Education Instruction & Library (63.6%), Community & Social Service (53.8%), and Management (33.3%).
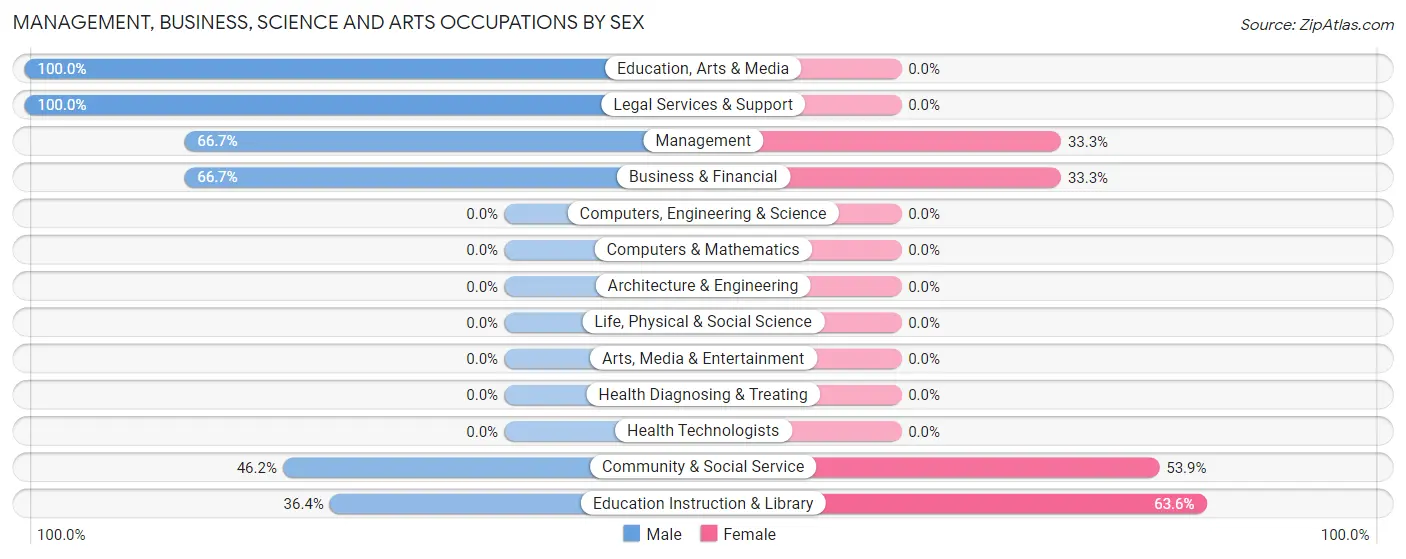
| Occupation | Male | Female |
| Management | 4 (66.7%) | 2 (33.3%) |
| Business & Financial | 2 (66.7%) | 1 (33.3%) |
| Computers, Engineering & Science | 0 (0.0%) | 0 (0.0%) |
| Computers & Mathematics | 0 (0.0%) | 0 (0.0%) |
| Architecture & Engineering | 0 (0.0%) | 0 (0.0%) |
| Life, Physical & Social Science | 0 (0.0%) | 0 (0.0%) |
| Community & Social Service | 6 (46.2%) | 7 (53.8%) |
| Education, Arts & Media | 1 (100.0%) | 0 (0.0%) |
| Legal Services & Support | 1 (100.0%) | 0 (0.0%) |
| Education Instruction & Library | 4 (36.4%) | 7 (63.6%) |
| Arts, Media & Entertainment | 0 (0.0%) | 0 (0.0%) |
| Health Diagnosing & Treating | 0 (0.0%) | 0 (0.0%) |
| Health Technologists | 0 (0.0%) | 0 (0.0%) |
| Total (Category) | 12 (54.5%) | 10 (45.5%) |
| Total (Overall) | 111 (58.7%) | 78 (41.3%) |
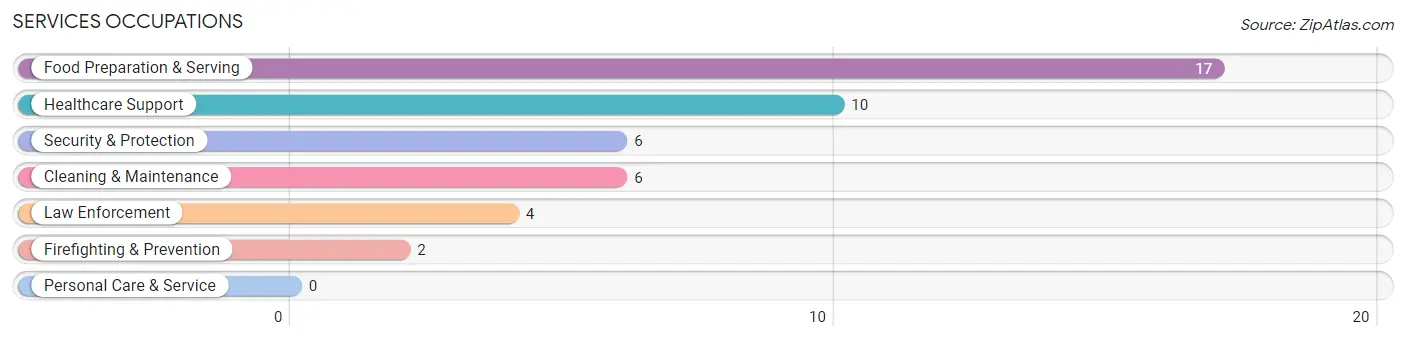
Services Occupations
The most common Services occupations in Eakly are Food Preparation & Serving (17 | 9.0%), Healthcare Support (10 | 5.3%), Security & Protection (6 | 3.2%), Cleaning & Maintenance (6 | 3.2%), and Law Enforcement (4 | 2.1%).
Services Occupations by Sex
Within the Services occupations in Eakly, the most male-oriented occupations are Firefighting & Prevention (100.0%), Security & Protection (66.7%), and Law Enforcement (50.0%), while the most female-oriented occupations are Healthcare Support (100.0%), Food Preparation & Serving (76.5%), and Cleaning & Maintenance (66.7%).
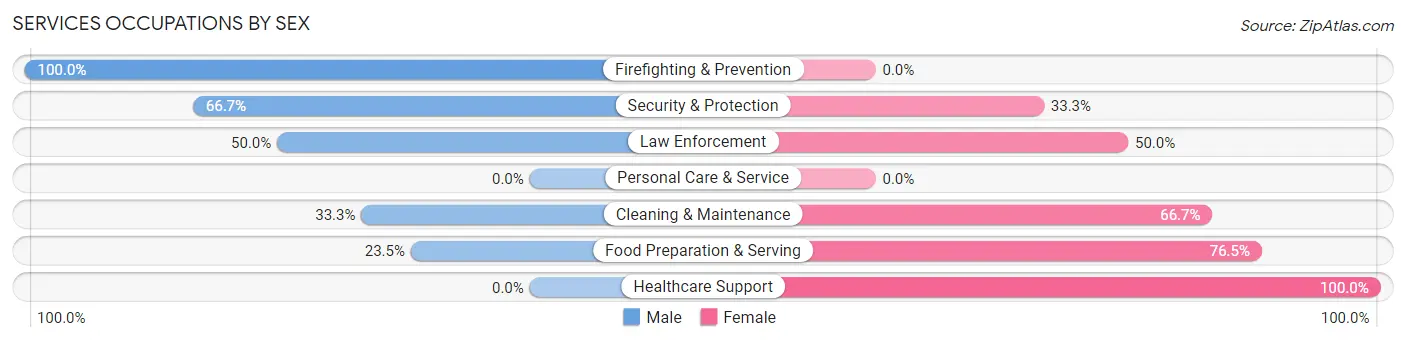
| Occupation | Male | Female |
| Healthcare Support | 0 (0.0%) | 10 (100.0%) |
| Security & Protection | 4 (66.7%) | 2 (33.3%) |
| Firefighting & Prevention | 2 (100.0%) | 0 (0.0%) |
| Law Enforcement | 2 (50.0%) | 2 (50.0%) |
| Food Preparation & Serving | 4 (23.5%) | 13 (76.5%) |
| Cleaning & Maintenance | 2 (33.3%) | 4 (66.7%) |
| Personal Care & Service | 0 (0.0%) | 0 (0.0%) |
| Total (Category) | 10 (25.6%) | 29 (74.4%) |
| Total (Overall) | 111 (58.7%) | 78 (41.3%) |
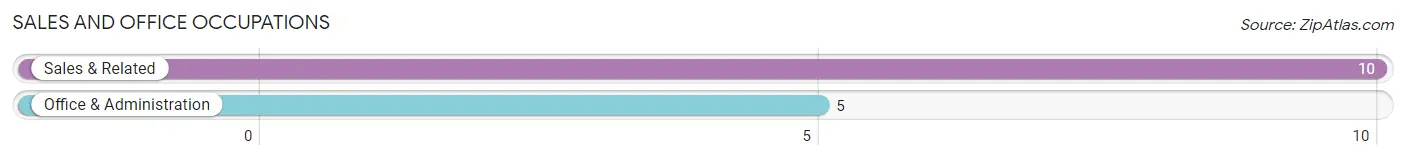
Sales and Office Occupations
The most common Sales and Office occupations in Eakly are Sales & Related (10 | 5.3%), and Office & Administration (5 | 2.6%).
Sales and Office Occupations by Sex
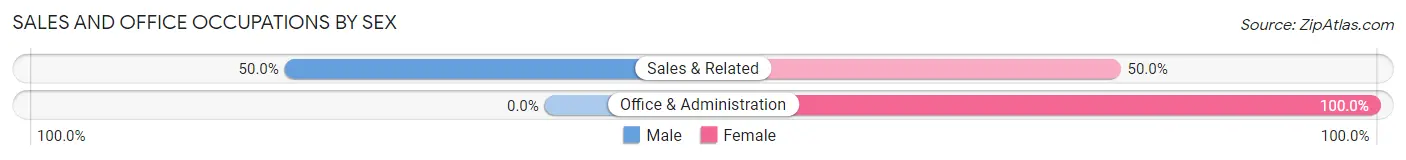
| Occupation | Male | Female |
| Sales & Related | 5 (50.0%) | 5 (50.0%) |
| Office & Administration | 0 (0.0%) | 5 (100.0%) |
| Total (Category) | 5 (33.3%) | 10 (66.7%) |
| Total (Overall) | 111 (58.7%) | 78 (41.3%) |
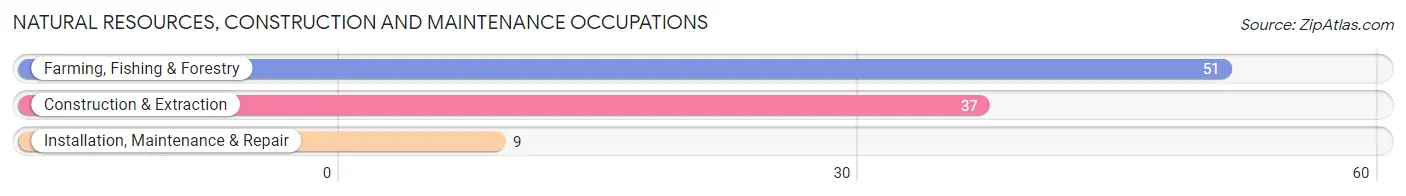
Natural Resources, Construction and Maintenance Occupations
The most common Natural Resources, Construction and Maintenance occupations in Eakly are Farming, Fishing & Forestry (51 | 27.0%), Construction & Extraction (37 | 19.6%), and Installation, Maintenance & Repair (9 | 4.8%).
Natural Resources, Construction and Maintenance Occupations by Sex
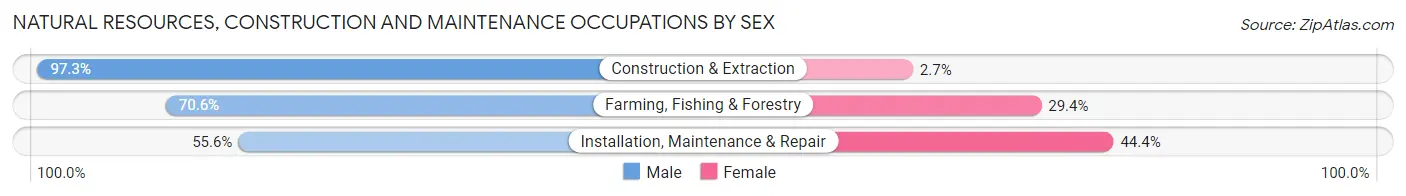
| Occupation | Male | Female |
| Farming, Fishing & Forestry | 36 (70.6%) | 15 (29.4%) |
| Construction & Extraction | 36 (97.3%) | 1 (2.7%) |
| Installation, Maintenance & Repair | 5 (55.6%) | 4 (44.4%) |
| Total (Category) | 77 (79.4%) | 20 (20.6%) |
| Total (Overall) | 111 (58.7%) | 78 (41.3%) |
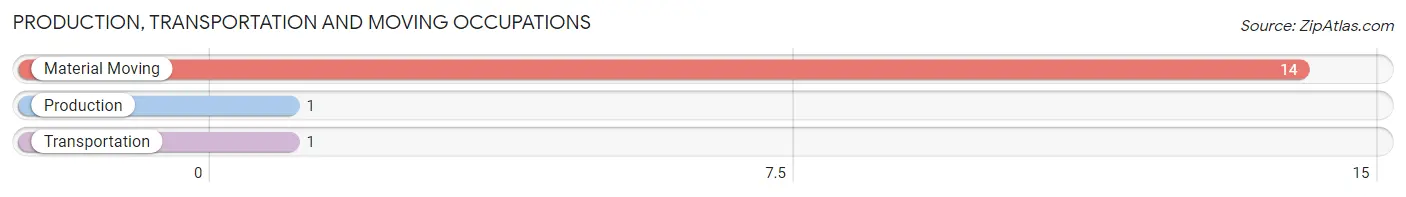
Production, Transportation and Moving Occupations
The most common Production, Transportation and Moving occupations in Eakly are Material Moving (14 | 7.4%), Production (1 | 0.5%), and Transportation (1 | 0.5%).
Production, Transportation and Moving Occupations by Sex
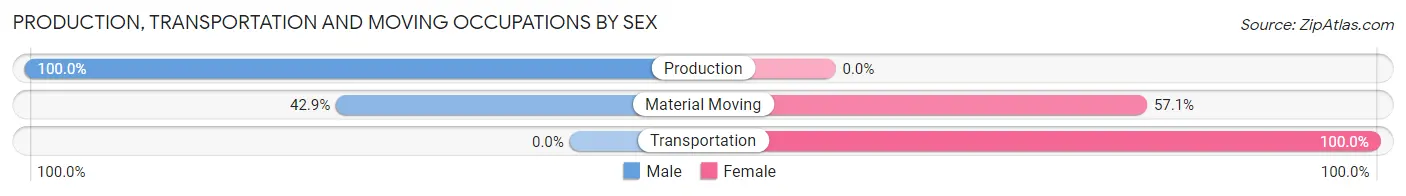
| Occupation | Male | Female |
| Production | 1 (100.0%) | 0 (0.0%) |
| Transportation | 0 (0.0%) | 1 (100.0%) |
| Material Moving | 6 (42.9%) | 8 (57.1%) |
| Total (Category) | 7 (43.8%) | 9 (56.2%) |
| Total (Overall) | 111 (58.7%) | 78 (41.3%) |
Employment Industries by Sex in Eakly
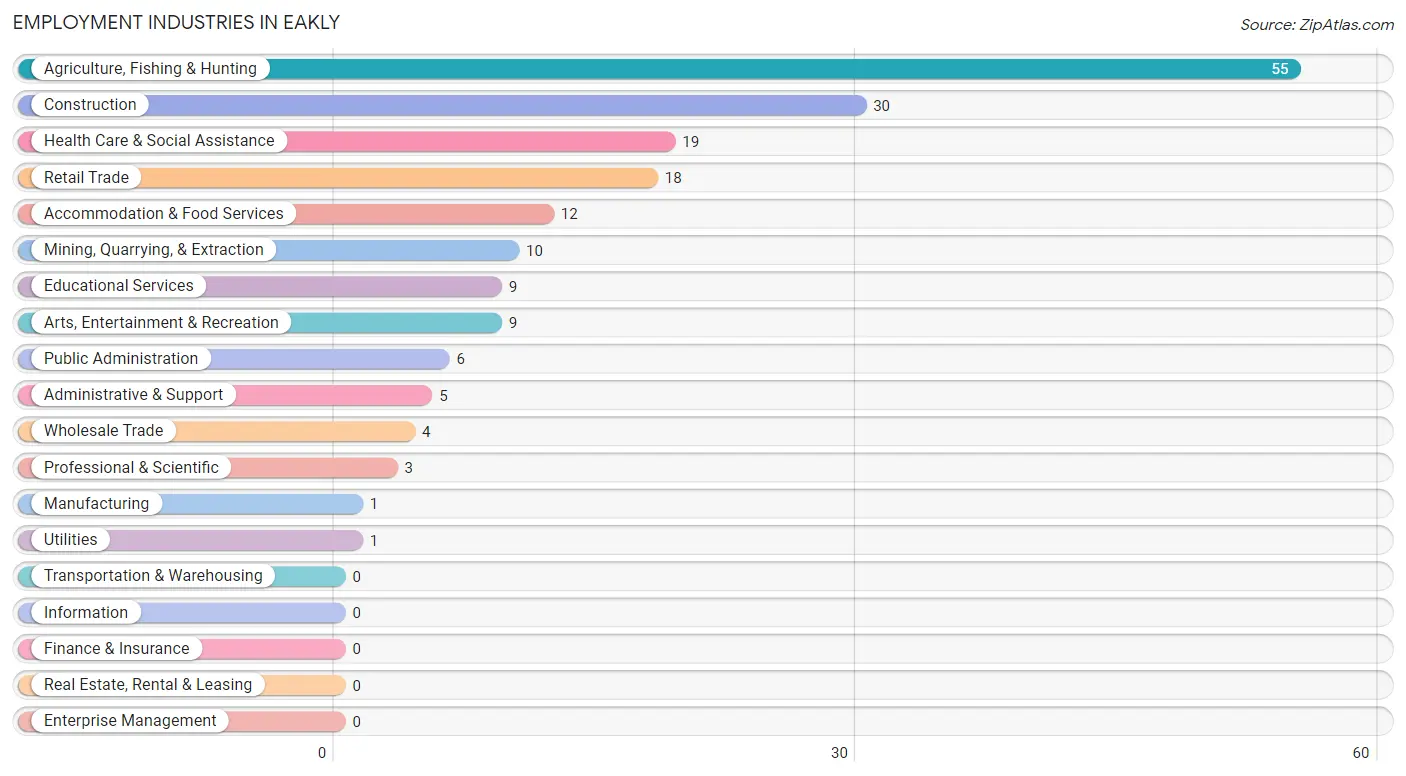
Employment Industries in Eakly
The major employment industries in Eakly include Agriculture, Fishing & Hunting (55 | 29.1%), Construction (30 | 15.9%), Health Care & Social Assistance (19 | 10.1%), Retail Trade (18 | 9.5%), and Accommodation & Food Services (12 | 6.4%).
Employment Industries by Sex in Eakly
The Eakly industries that see more men than women are Mining, Quarrying, & Extraction (100.0%), Manufacturing (100.0%), and Professional & Scientific (100.0%), whereas the industries that tend to have a higher number of women are Utilities (100.0%), Health Care & Social Assistance (100.0%), and Arts, Entertainment & Recreation (77.8%).
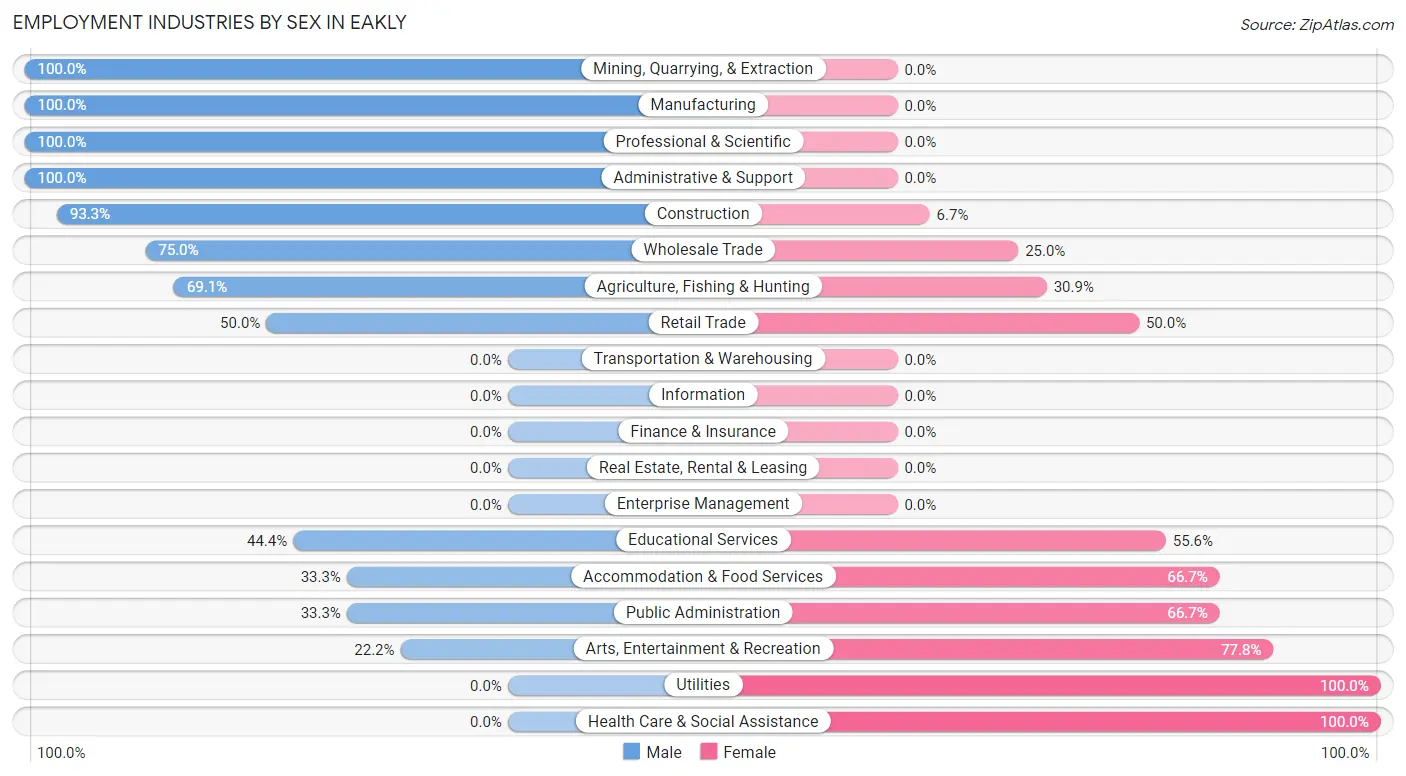
| Industry | Male | Female |
| Agriculture, Fishing & Hunting | 38 (69.1%) | 17 (30.9%) |
| Mining, Quarrying, & Extraction | 10 (100.0%) | 0 (0.0%) |
| Construction | 28 (93.3%) | 2 (6.7%) |
| Manufacturing | 1 (100.0%) | 0 (0.0%) |
| Wholesale Trade | 3 (75.0%) | 1 (25.0%) |
| Retail Trade | 9 (50.0%) | 9 (50.0%) |
| Transportation & Warehousing | 0 (0.0%) | 0 (0.0%) |
| Utilities | 0 (0.0%) | 1 (100.0%) |
| Information | 0 (0.0%) | 0 (0.0%) |
| Finance & Insurance | 0 (0.0%) | 0 (0.0%) |
| Real Estate, Rental & Leasing | 0 (0.0%) | 0 (0.0%) |
| Professional & Scientific | 3 (100.0%) | 0 (0.0%) |
| Enterprise Management | 0 (0.0%) | 0 (0.0%) |
| Administrative & Support | 5 (100.0%) | 0 (0.0%) |
| Educational Services | 4 (44.4%) | 5 (55.6%) |
| Health Care & Social Assistance | 0 (0.0%) | 19 (100.0%) |
| Arts, Entertainment & Recreation | 2 (22.2%) | 7 (77.8%) |
| Accommodation & Food Services | 4 (33.3%) | 8 (66.7%) |
| Public Administration | 2 (33.3%) | 4 (66.7%) |
| Total | 111 (58.7%) | 78 (41.3%) |
Education in Eakly
School Enrollment in Eakly
The most common levels of schooling among the 125 students in Eakly are elementary school (36 | 28.8%), high school (27 | 21.6%), and middle school (25 | 20.0%).
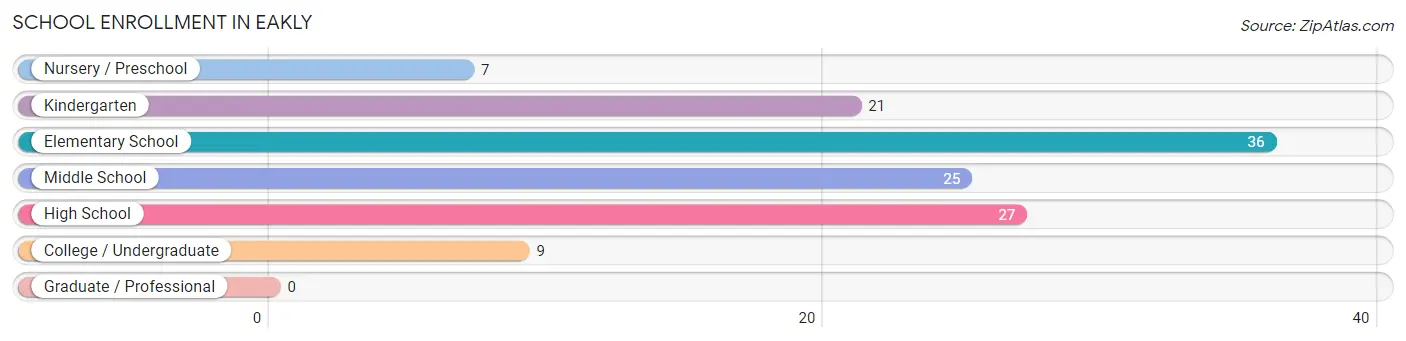
| School Level | # Students | % Students |
| Nursery / Preschool | 7 | 5.6% |
| Kindergarten | 21 | 16.8% |
| Elementary School | 36 | 28.8% |
| Middle School | 25 | 20.0% |
| High School | 27 | 21.6% |
| College / Undergraduate | 9 | 7.2% |
| Graduate / Professional | 0 | 0.0% |
| Total | 125 | 100.0% |
School Enrollment by Age by Funding Source in Eakly
Out of a total of 125 students who are enrolled in schools in Eakly, 8 (6.4%) attend a private institution, while the remaining 117 (93.6%) are enrolled in public schools. The age group of 20 to 24 year olds has the highest likelihood of being enrolled in private schools, with 8 (100.0% in the age bracket) enrolled. Conversely, the age group of 3 to 4 year olds has the lowest likelihood of being enrolled in a private school, with 6 (100.0% in the age bracket) attending a public institution.
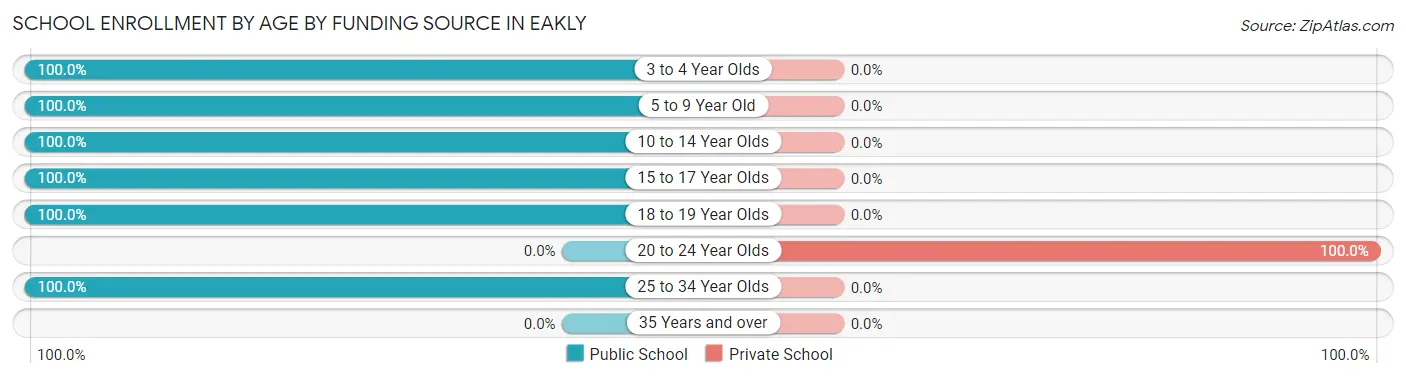
| Age Bracket | Public School | Private School |
| 3 to 4 Year Olds | 6 (100.0%) | 0 (0.0%) |
| 5 to 9 Year Old | 52 (100.0%) | 0 (0.0%) |
| 10 to 14 Year Olds | 33 (100.0%) | 0 (0.0%) |
| 15 to 17 Year Olds | 18 (100.0%) | 0 (0.0%) |
| 18 to 19 Year Olds | 7 (100.0%) | 0 (0.0%) |
| 20 to 24 Year Olds | 0 (0.0%) | 8 (100.0%) |
| 25 to 34 Year Olds | 1 (100.0%) | 0 (0.0%) |
| 35 Years and over | 0 (0.0%) | 0 (0.0%) |
| Total | 117 (93.6%) | 8 (6.4%) |
Educational Attainment by Field of Study in Eakly
Education (9 | 37.5%), science & technology (5 | 20.8%), business (4 | 16.7%), visual & performing arts (3 | 12.5%), and computers & mathematics (2 | 8.3%) are the most common fields of study among 24 individuals in Eakly who have obtained a bachelor's degree or higher.
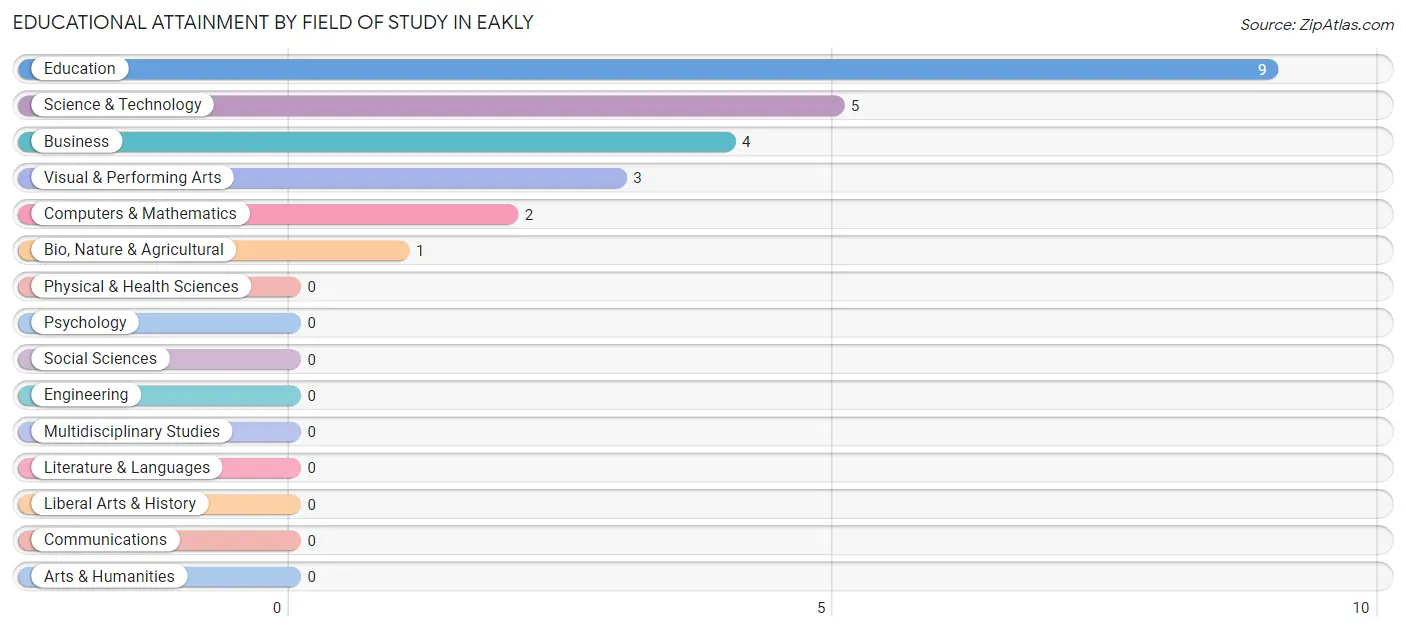
| Field of Study | # Graduates | % Graduates |
| Computers & Mathematics | 2 | 8.3% |
| Bio, Nature & Agricultural | 1 | 4.2% |
| Physical & Health Sciences | 0 | 0.0% |
| Psychology | 0 | 0.0% |
| Social Sciences | 0 | 0.0% |
| Engineering | 0 | 0.0% |
| Multidisciplinary Studies | 0 | 0.0% |
| Science & Technology | 5 | 20.8% |
| Business | 4 | 16.7% |
| Education | 9 | 37.5% |
| Literature & Languages | 0 | 0.0% |
| Liberal Arts & History | 0 | 0.0% |
| Visual & Performing Arts | 3 | 12.5% |
| Communications | 0 | 0.0% |
| Arts & Humanities | 0 | 0.0% |
| Total | 24 | 100.0% |
Transportation & Commute in Eakly
Vehicle Availability by Sex in Eakly
The most prevalent vehicle ownership categories in Eakly are males with 2 vehicles (44, accounting for 45.8%) and females with 2 vehicles (32, making up 63.8%).
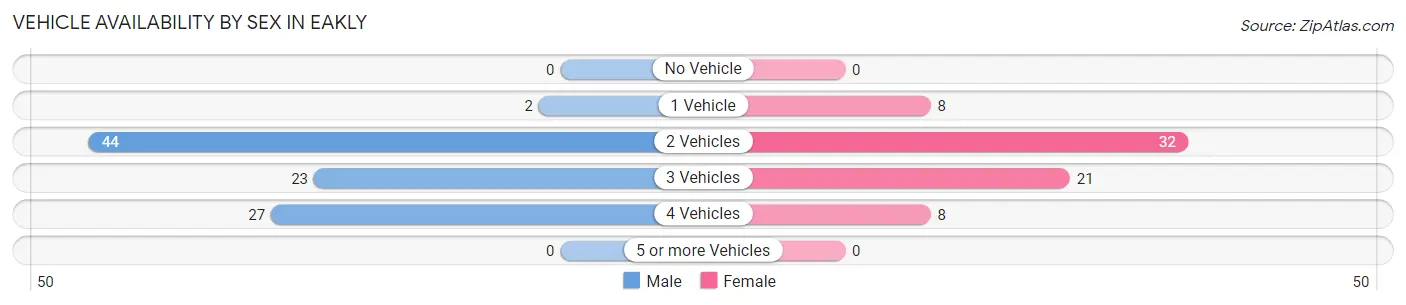
| Vehicles Available | Male | Female |
| No Vehicle | 0 (0.0%) | 0 (0.0%) |
| 1 Vehicle | 2 (2.1%) | 8 (11.6%) |
| 2 Vehicles | 44 (45.8%) | 32 (46.4%) |
| 3 Vehicles | 23 (24.0%) | 21 (30.4%) |
| 4 Vehicles | 27 (28.1%) | 8 (11.6%) |
| 5 or more Vehicles | 0 (0.0%) | 0 (0.0%) |
| Total | 96 (100.0%) | 69 (100.0%) |
Commute Time in Eakly
The most frequently occuring commute durations in Eakly are 30 to 34 minutes (64 commuters, 39.3%), 25 to 29 minutes (18 commuters, 11.0%), and 15 to 19 minutes (15 commuters, 9.2%).
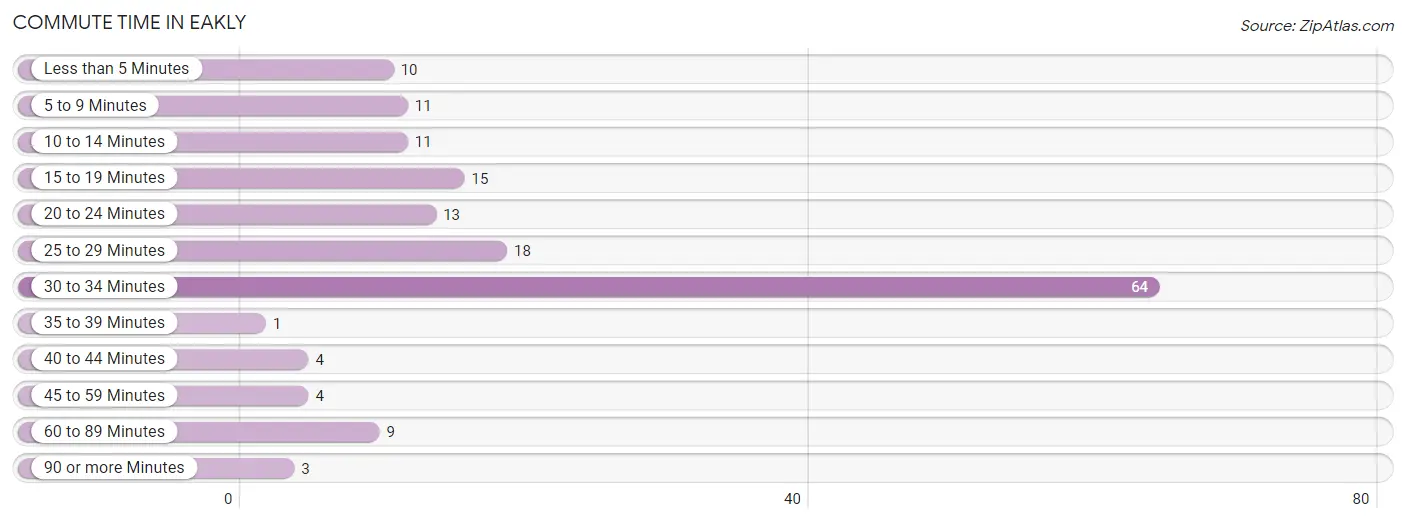
| Commute Time | # Commuters | % Commuters |
| Less than 5 Minutes | 10 | 6.1% |
| 5 to 9 Minutes | 11 | 6.8% |
| 10 to 14 Minutes | 11 | 6.8% |
| 15 to 19 Minutes | 15 | 9.2% |
| 20 to 24 Minutes | 13 | 8.0% |
| 25 to 29 Minutes | 18 | 11.0% |
| 30 to 34 Minutes | 64 | 39.3% |
| 35 to 39 Minutes | 1 | 0.6% |
| 40 to 44 Minutes | 4 | 2.5% |
| 45 to 59 Minutes | 4 | 2.5% |
| 60 to 89 Minutes | 9 | 5.5% |
| 90 or more Minutes | 3 | 1.8% |
Commute Time by Sex in Eakly
The most common commute times in Eakly are 30 to 34 minutes (50 commuters, 53.2%) for males and 30 to 34 minutes (14 commuters, 20.3%) for females.
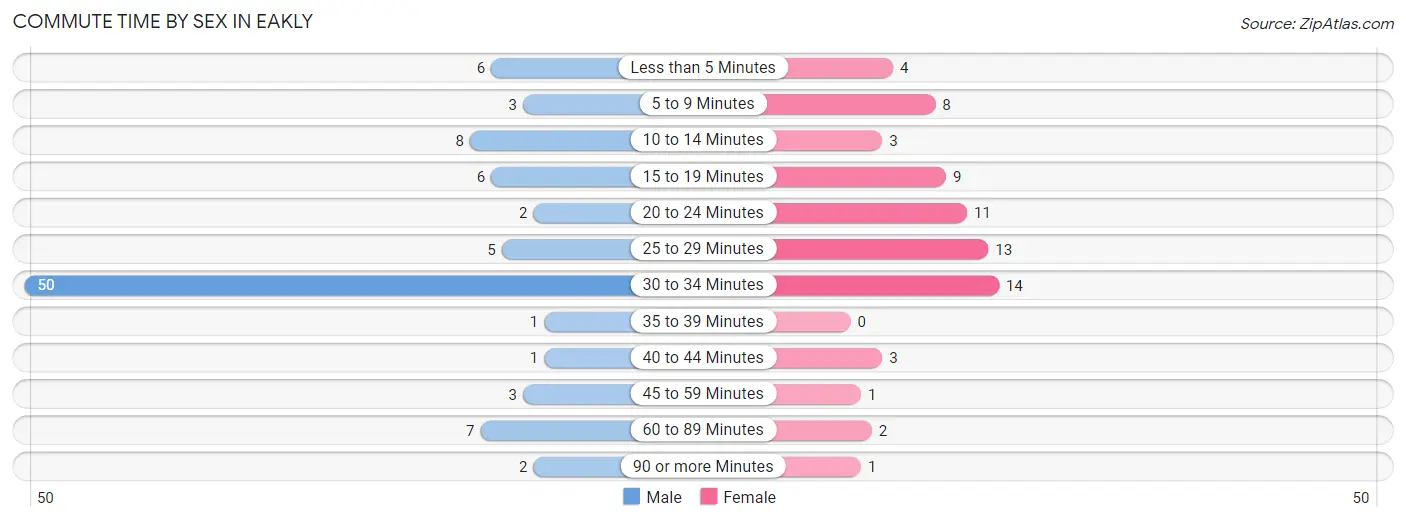
| Commute Time | Male | Female |
| Less than 5 Minutes | 6 (6.4%) | 4 (5.8%) |
| 5 to 9 Minutes | 3 (3.2%) | 8 (11.6%) |
| 10 to 14 Minutes | 8 (8.5%) | 3 (4.3%) |
| 15 to 19 Minutes | 6 (6.4%) | 9 (13.0%) |
| 20 to 24 Minutes | 2 (2.1%) | 11 (15.9%) |
| 25 to 29 Minutes | 5 (5.3%) | 13 (18.8%) |
| 30 to 34 Minutes | 50 (53.2%) | 14 (20.3%) |
| 35 to 39 Minutes | 1 (1.1%) | 0 (0.0%) |
| 40 to 44 Minutes | 1 (1.1%) | 3 (4.3%) |
| 45 to 59 Minutes | 3 (3.2%) | 1 (1.5%) |
| 60 to 89 Minutes | 7 (7.4%) | 2 (2.9%) |
| 90 or more Minutes | 2 (2.1%) | 1 (1.5%) |
Time of Departure to Work by Sex in Eakly
The most frequent times of departure to work in Eakly are 6:00 AM to 6:29 AM (28, 29.8%) for males and 12:00 AM to 4:59 AM (11, 15.9%) for females.
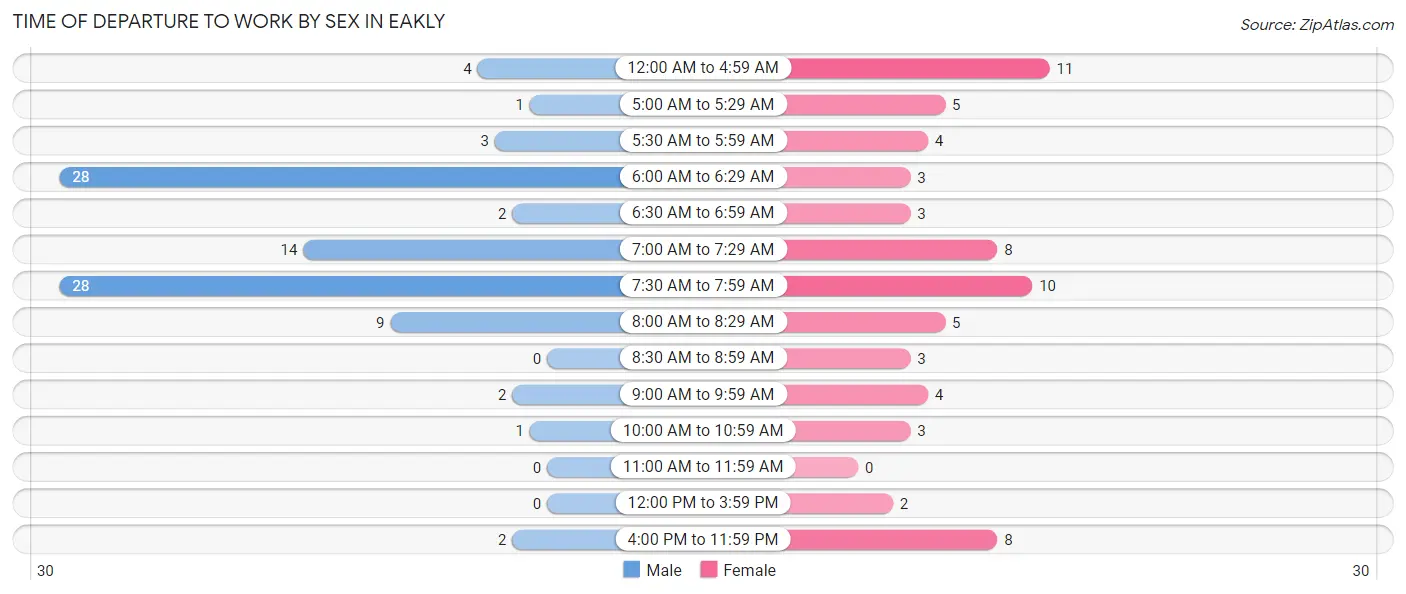
| Time of Departure | Male | Female |
| 12:00 AM to 4:59 AM | 4 (4.3%) | 11 (15.9%) |
| 5:00 AM to 5:29 AM | 1 (1.1%) | 5 (7.2%) |
| 5:30 AM to 5:59 AM | 3 (3.2%) | 4 (5.8%) |
| 6:00 AM to 6:29 AM | 28 (29.8%) | 3 (4.3%) |
| 6:30 AM to 6:59 AM | 2 (2.1%) | 3 (4.3%) |
| 7:00 AM to 7:29 AM | 14 (14.9%) | 8 (11.6%) |
| 7:30 AM to 7:59 AM | 28 (29.8%) | 10 (14.5%) |
| 8:00 AM to 8:29 AM | 9 (9.6%) | 5 (7.2%) |
| 8:30 AM to 8:59 AM | 0 (0.0%) | 3 (4.3%) |
| 9:00 AM to 9:59 AM | 2 (2.1%) | 4 (5.8%) |
| 10:00 AM to 10:59 AM | 1 (1.1%) | 3 (4.3%) |
| 11:00 AM to 11:59 AM | 0 (0.0%) | 0 (0.0%) |
| 12:00 PM to 3:59 PM | 0 (0.0%) | 2 (2.9%) |
| 4:00 PM to 11:59 PM | 2 (2.1%) | 8 (11.6%) |
| Total | 94 (100.0%) | 69 (100.0%) |
Housing Occupancy in Eakly
Occupancy by Ownership in Eakly
Of the total 106 dwellings in Eakly, owner-occupied units account for 68 (64.1%), while renter-occupied units make up 38 (35.8%).
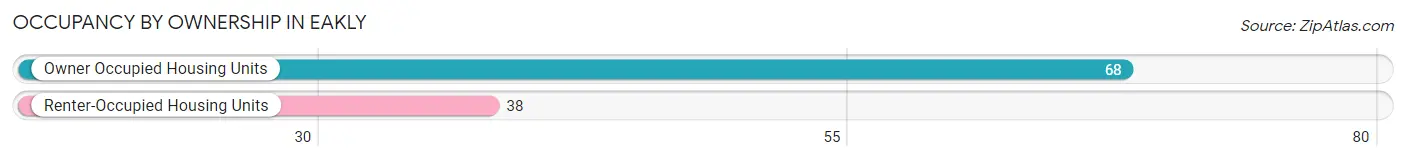
| Occupancy | # Housing Units | % Housing Units |
| Owner Occupied Housing Units | 68 | 64.1% |
| Renter-Occupied Housing Units | 38 | 35.8% |
| Total Occupied Housing Units | 106 | 100.0% |
Occupancy by Household Size in Eakly
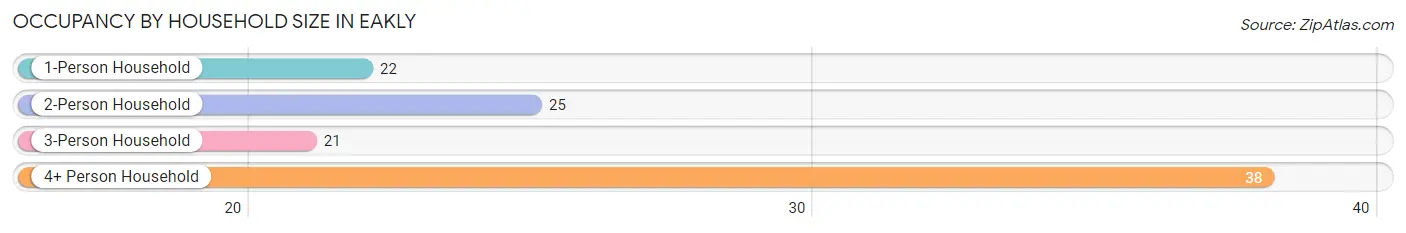
| Household Size | # Housing Units | % Housing Units |
| 1-Person Household | 22 | 20.7% |
| 2-Person Household | 25 | 23.6% |
| 3-Person Household | 21 | 19.8% |
| 4+ Person Household | 38 | 35.8% |
| Total Housing Units | 106 | 100.0% |
Occupancy by Ownership by Household Size in Eakly
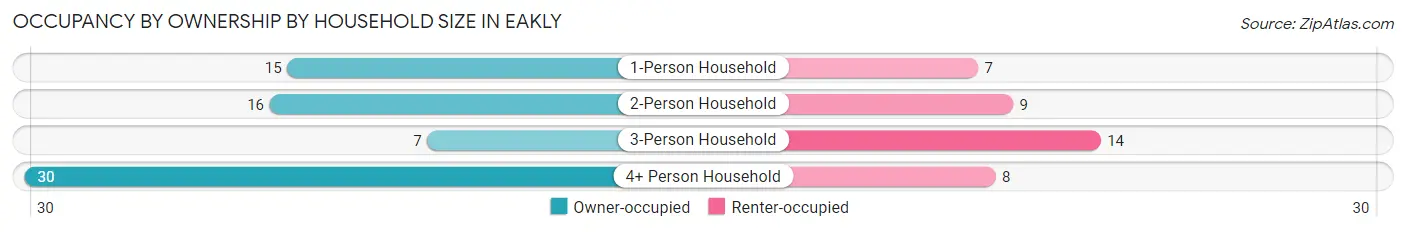
| Household Size | Owner-occupied | Renter-occupied |
| 1-Person Household | 15 (68.2%) | 7 (31.8%) |
| 2-Person Household | 16 (64.0%) | 9 (36.0%) |
| 3-Person Household | 7 (33.3%) | 14 (66.7%) |
| 4+ Person Household | 30 (78.9%) | 8 (21.0%) |
| Total Housing Units | 68 (64.1%) | 38 (35.8%) |
Occupancy by Educational Attainment in Eakly
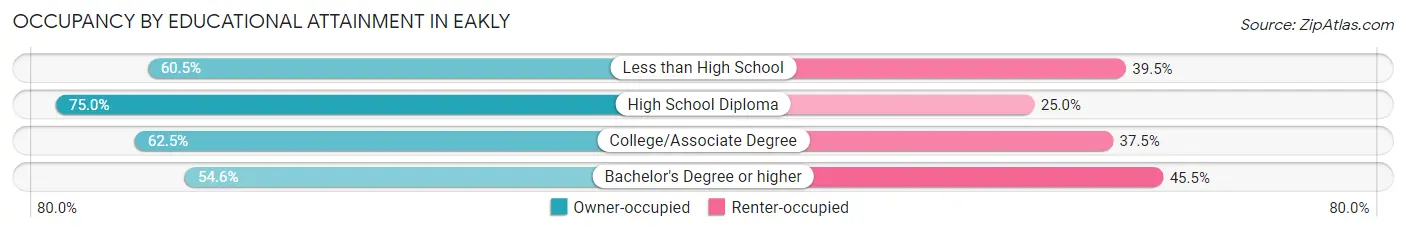
| Household Size | Owner-occupied | Renter-occupied |
| Less than High School | 26 (60.5%) | 17 (39.5%) |
| High School Diploma | 21 (75.0%) | 7 (25.0%) |
| College/Associate Degree | 15 (62.5%) | 9 (37.5%) |
| Bachelor's Degree or higher | 6 (54.5%) | 5 (45.5%) |
Occupancy by Age of Householder in Eakly
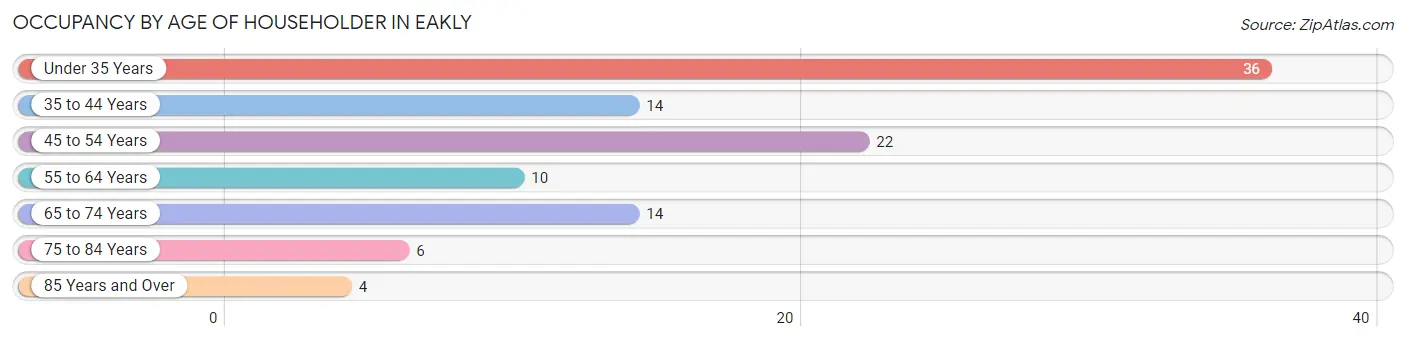
| Age Bracket | # Households | % Households |
| Under 35 Years | 36 | 34.0% |
| 35 to 44 Years | 14 | 13.2% |
| 45 to 54 Years | 22 | 20.7% |
| 55 to 64 Years | 10 | 9.4% |
| 65 to 74 Years | 14 | 13.2% |
| 75 to 84 Years | 6 | 5.7% |
| 85 Years and Over | 4 | 3.8% |
| Total | 106 | 100.0% |
Housing Finances in Eakly
Median Income by Occupancy in Eakly
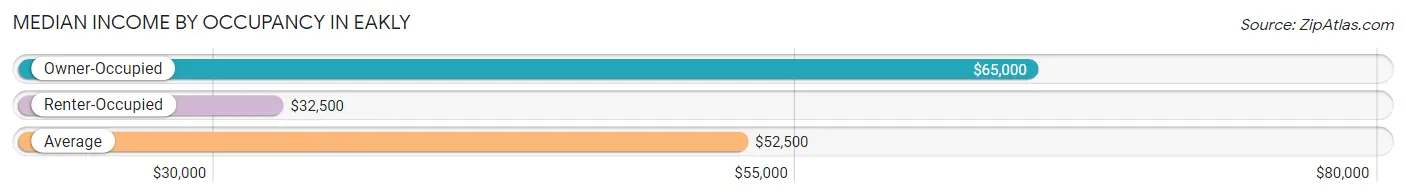
| Occupancy Type | # Households | Median Income |
| Owner-Occupied | 68 (64.1%) | $65,000 |
| Renter-Occupied | 38 (35.8%) | $32,500 |
| Average | 106 (100.0%) | $52,500 |
Occupancy by Householder Income Bracket in Eakly
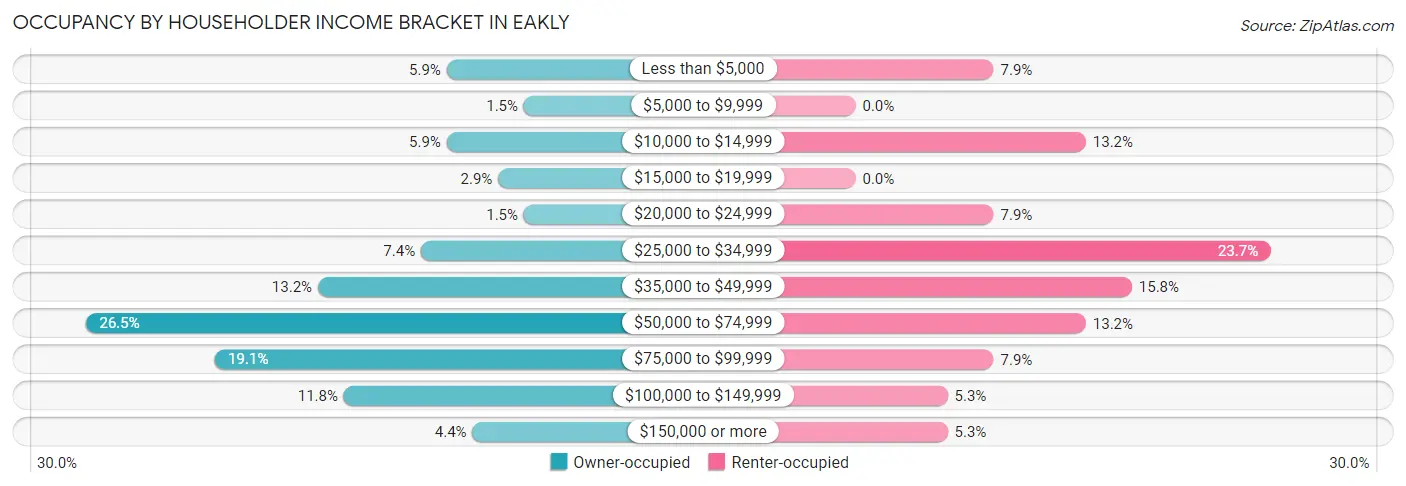
| Income Bracket | Owner-occupied | Renter-occupied |
| Less than $5,000 | 4 (5.9%) | 3 (7.9%) |
| $5,000 to $9,999 | 1 (1.5%) | 0 (0.0%) |
| $10,000 to $14,999 | 4 (5.9%) | 5 (13.2%) |
| $15,000 to $19,999 | 2 (2.9%) | 0 (0.0%) |
| $20,000 to $24,999 | 1 (1.5%) | 3 (7.9%) |
| $25,000 to $34,999 | 5 (7.3%) | 9 (23.7%) |
| $35,000 to $49,999 | 9 (13.2%) | 6 (15.8%) |
| $50,000 to $74,999 | 18 (26.5%) | 5 (13.2%) |
| $75,000 to $99,999 | 13 (19.1%) | 3 (7.9%) |
| $100,000 to $149,999 | 8 (11.8%) | 2 (5.3%) |
| $150,000 or more | 3 (4.4%) | 2 (5.3%) |
| Total | 68 (100.0%) | 38 (100.0%) |
Monthly Housing Cost Tiers in Eakly
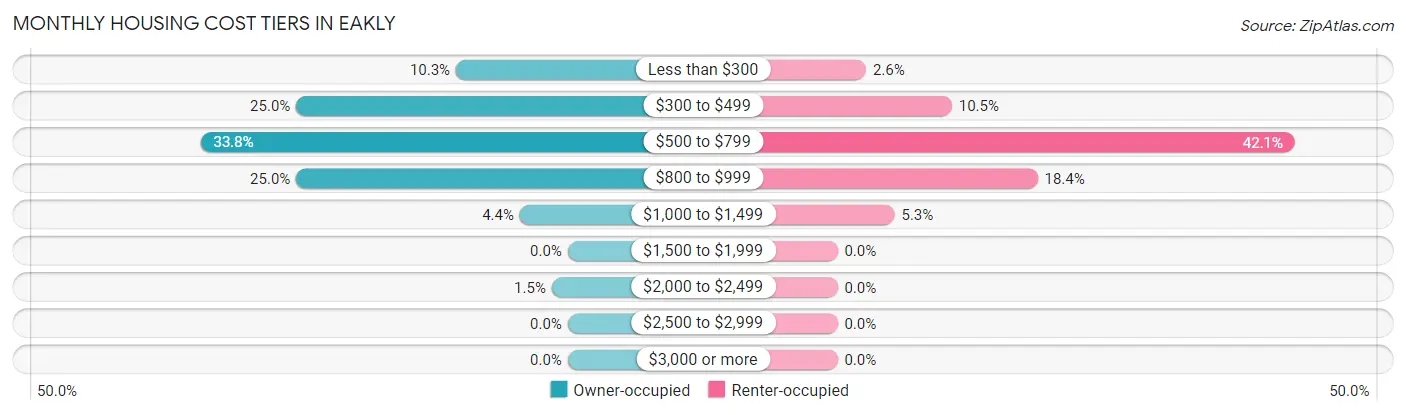
| Monthly Cost | Owner-occupied | Renter-occupied |
| Less than $300 | 7 (10.3%) | 1 (2.6%) |
| $300 to $499 | 17 (25.0%) | 4 (10.5%) |
| $500 to $799 | 23 (33.8%) | 16 (42.1%) |
| $800 to $999 | 17 (25.0%) | 7 (18.4%) |
| $1,000 to $1,499 | 3 (4.4%) | 2 (5.3%) |
| $1,500 to $1,999 | 0 (0.0%) | 0 (0.0%) |
| $2,000 to $2,499 | 1 (1.5%) | 0 (0.0%) |
| $2,500 to $2,999 | 0 (0.0%) | 0 (0.0%) |
| $3,000 or more | 0 (0.0%) | 0 (0.0%) |
| Total | 68 (100.0%) | 38 (100.0%) |
Physical Housing Characteristics in Eakly
Housing Structures in Eakly
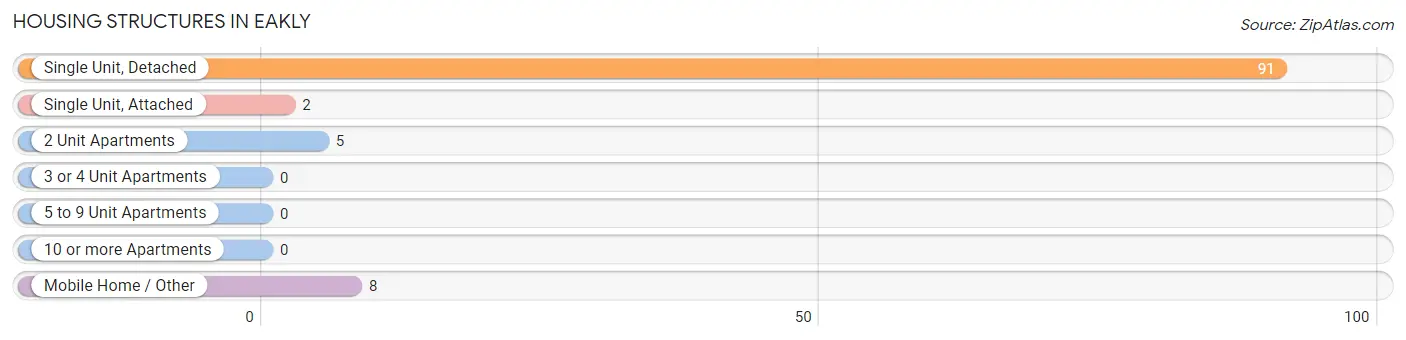
| Structure Type | # Housing Units | % Housing Units |
| Single Unit, Detached | 91 | 85.9% |
| Single Unit, Attached | 2 | 1.9% |
| 2 Unit Apartments | 5 | 4.7% |
| 3 or 4 Unit Apartments | 0 | 0.0% |
| 5 to 9 Unit Apartments | 0 | 0.0% |
| 10 or more Apartments | 0 | 0.0% |
| Mobile Home / Other | 8 | 7.5% |
| Total | 106 | 100.0% |
Housing Structures by Occupancy in Eakly
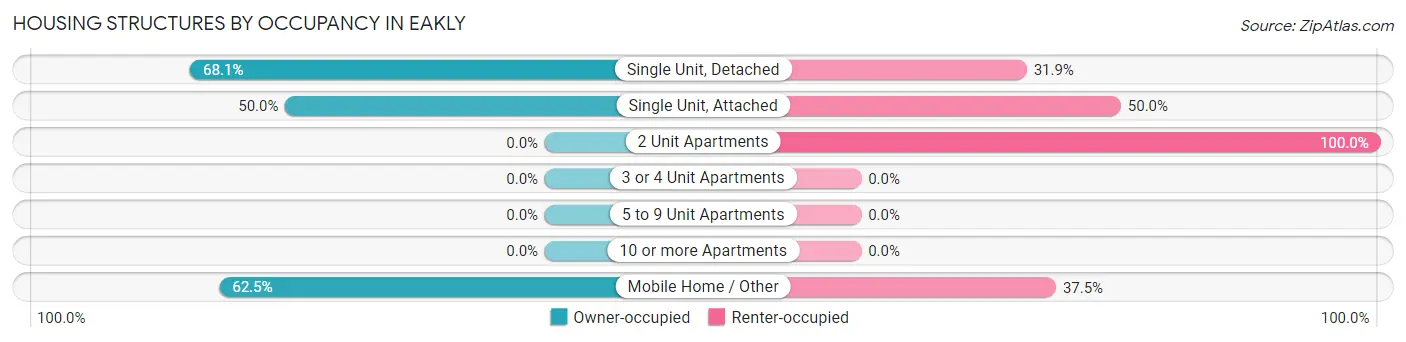
| Structure Type | Owner-occupied | Renter-occupied |
| Single Unit, Detached | 62 (68.1%) | 29 (31.9%) |
| Single Unit, Attached | 1 (50.0%) | 1 (50.0%) |
| 2 Unit Apartments | 0 (0.0%) | 5 (100.0%) |
| 3 or 4 Unit Apartments | 0 (0.0%) | 0 (0.0%) |
| 5 to 9 Unit Apartments | 0 (0.0%) | 0 (0.0%) |
| 10 or more Apartments | 0 (0.0%) | 0 (0.0%) |
| Mobile Home / Other | 5 (62.5%) | 3 (37.5%) |
| Total | 68 (64.1%) | 38 (35.8%) |
Housing Structures by Number of Rooms in Eakly
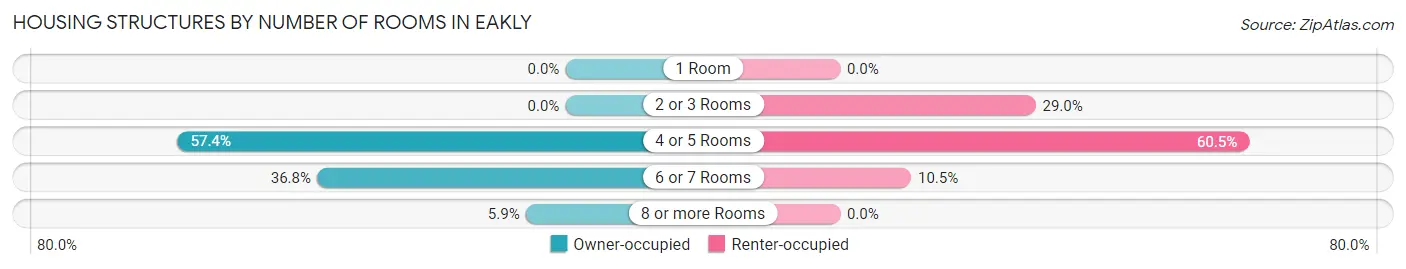
| Number of Rooms | Owner-occupied | Renter-occupied |
| 1 Room | 0 (0.0%) | 0 (0.0%) |
| 2 or 3 Rooms | 0 (0.0%) | 11 (28.9%) |
| 4 or 5 Rooms | 39 (57.4%) | 23 (60.5%) |
| 6 or 7 Rooms | 25 (36.8%) | 4 (10.5%) |
| 8 or more Rooms | 4 (5.9%) | 0 (0.0%) |
| Total | 68 (100.0%) | 38 (100.0%) |
Housing Structure by Heating Type in Eakly
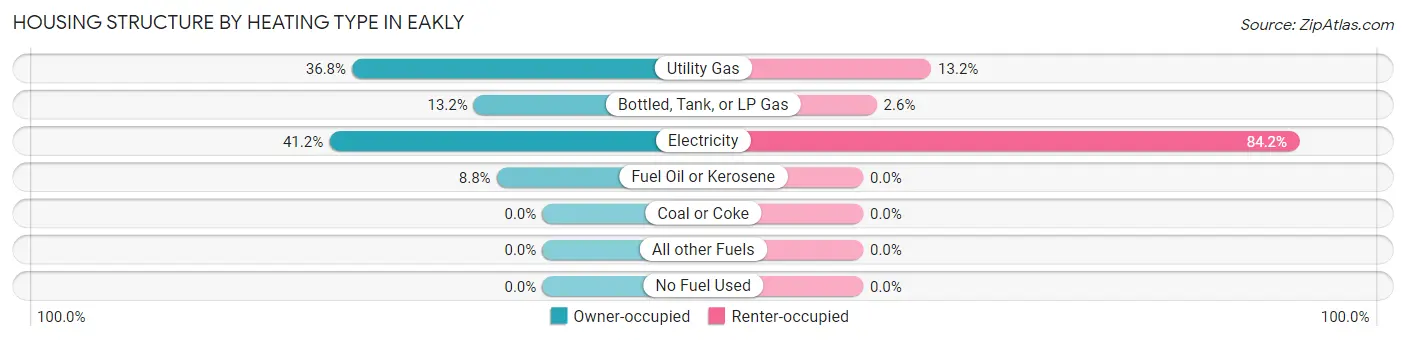
| Heating Type | Owner-occupied | Renter-occupied |
| Utility Gas | 25 (36.8%) | 5 (13.2%) |
| Bottled, Tank, or LP Gas | 9 (13.2%) | 1 (2.6%) |
| Electricity | 28 (41.2%) | 32 (84.2%) |
| Fuel Oil or Kerosene | 6 (8.8%) | 0 (0.0%) |
| Coal or Coke | 0 (0.0%) | 0 (0.0%) |
| All other Fuels | 0 (0.0%) | 0 (0.0%) |
| No Fuel Used | 0 (0.0%) | 0 (0.0%) |
| Total | 68 (100.0%) | 38 (100.0%) |
Household Vehicle Usage in Eakly
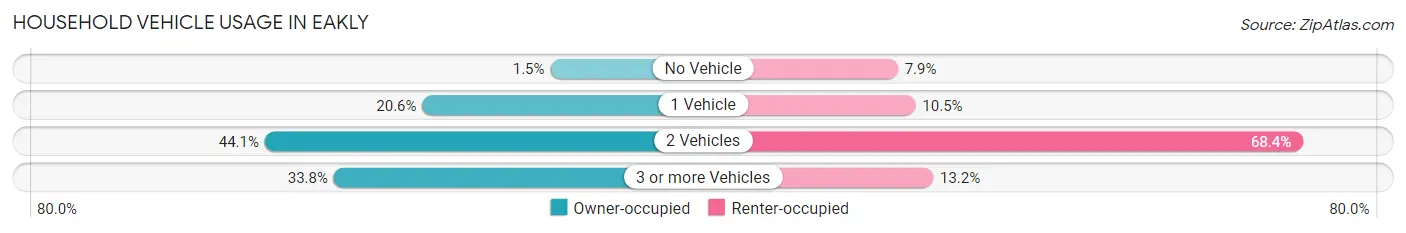
| Vehicles per Household | Owner-occupied | Renter-occupied |
| No Vehicle | 1 (1.5%) | 3 (7.9%) |
| 1 Vehicle | 14 (20.6%) | 4 (10.5%) |
| 2 Vehicles | 30 (44.1%) | 26 (68.4%) |
| 3 or more Vehicles | 23 (33.8%) | 5 (13.2%) |
| Total | 68 (100.0%) | 38 (100.0%) |
Real Estate & Mortgages in Eakly
Real Estate and Mortgage Overview in Eakly
| Characteristic | Without Mortgage | With Mortgage |
| Housing Units | 40 | 28 |
| Median Property Value | $85,000 | $73,000 |
| Median Household Income | $46,000 | $0 |
| Monthly Housing Costs | $488 | $0 |
| Real Estate Taxes | $457 | $0 |
Property Value by Mortgage Status in Eakly
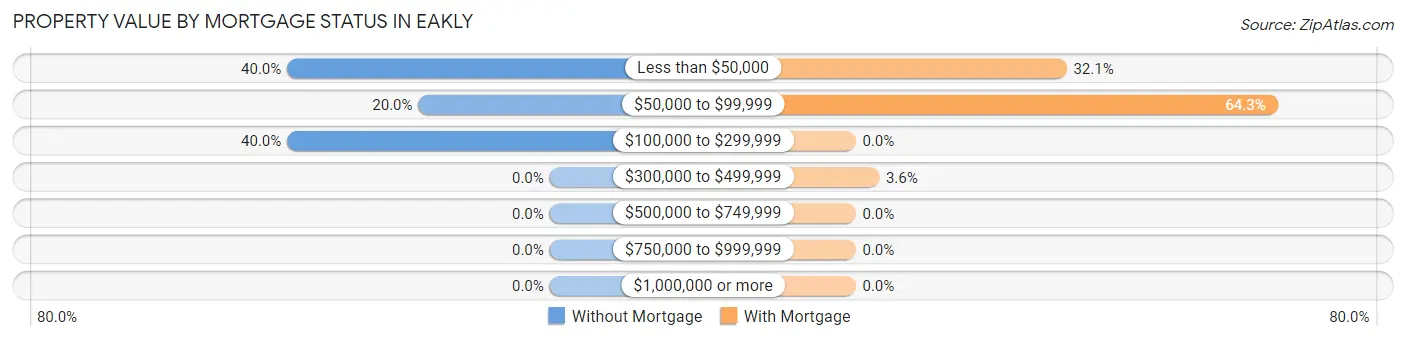
| Property Value | Without Mortgage | With Mortgage |
| Less than $50,000 | 16 (40.0%) | 9 (32.1%) |
| $50,000 to $99,999 | 8 (20.0%) | 18 (64.3%) |
| $100,000 to $299,999 | 16 (40.0%) | 0 (0.0%) |
| $300,000 to $499,999 | 0 (0.0%) | 1 (3.6%) |
| $500,000 to $749,999 | 0 (0.0%) | 0 (0.0%) |
| $750,000 to $999,999 | 0 (0.0%) | 0 (0.0%) |
| $1,000,000 or more | 0 (0.0%) | 0 (0.0%) |
| Total | 40 (100.0%) | 28 (100.0%) |
Household Income by Mortgage Status in Eakly
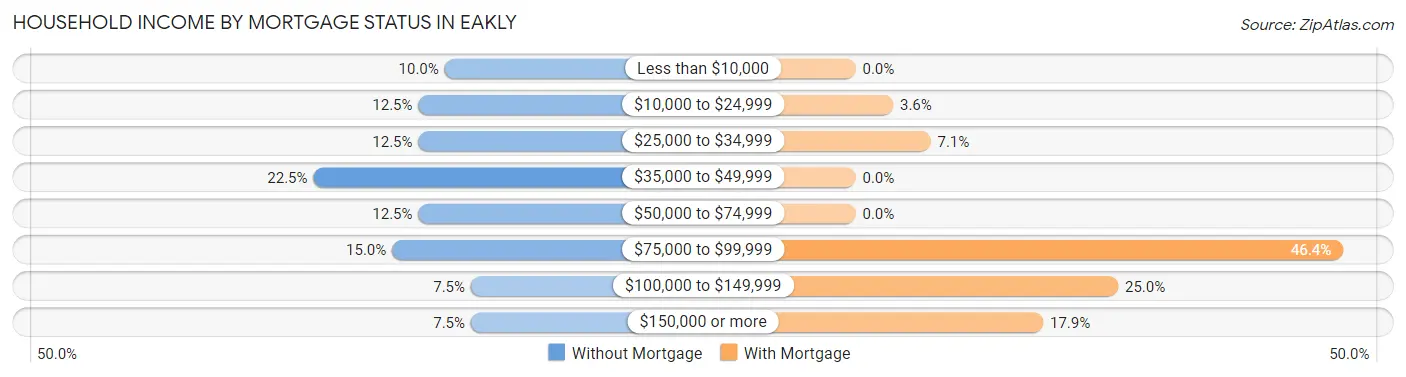
| Household Income | Without Mortgage | With Mortgage |
| Less than $10,000 | 4 (10.0%) | 0 (0.0%) |
| $10,000 to $24,999 | 5 (12.5%) | 1 (3.6%) |
| $25,000 to $34,999 | 5 (12.5%) | 2 (7.1%) |
| $35,000 to $49,999 | 9 (22.5%) | 0 (0.0%) |
| $50,000 to $74,999 | 5 (12.5%) | 0 (0.0%) |
| $75,000 to $99,999 | 6 (15.0%) | 13 (46.4%) |
| $100,000 to $149,999 | 3 (7.5%) | 7 (25.0%) |
| $150,000 or more | 3 (7.5%) | 5 (17.9%) |
| Total | 40 (100.0%) | 28 (100.0%) |
Property Value to Household Income Ratio in Eakly
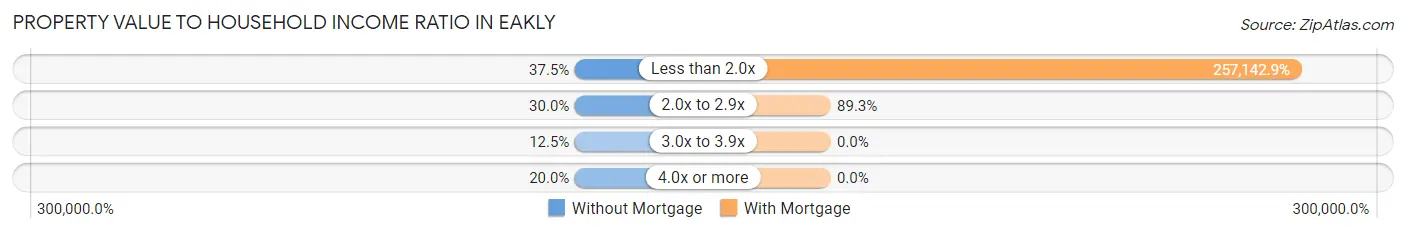
| Value-to-Income Ratio | Without Mortgage | With Mortgage |
| Less than 2.0x | 15 (37.5%) | 72,000 (257,142.9%) |
| 2.0x to 2.9x | 12 (30.0%) | 25 (89.3%) |
| 3.0x to 3.9x | 5 (12.5%) | 0 (0.0%) |
| 4.0x or more | 8 (20.0%) | 0 (0.0%) |
| Total | 40 (100.0%) | 28 (100.0%) |
Real Estate Taxes by Mortgage Status in Eakly
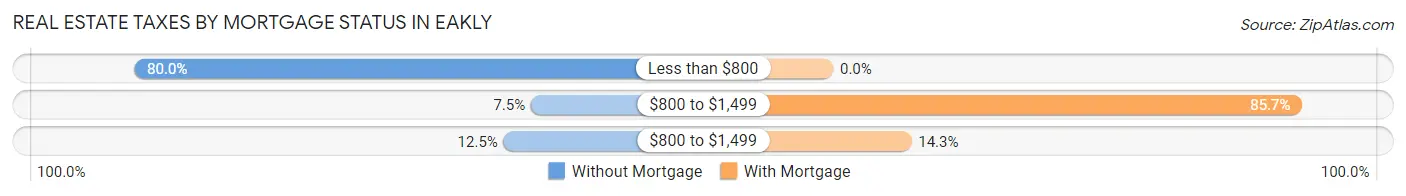
| Property Taxes | Without Mortgage | With Mortgage |
| Less than $800 | 32 (80.0%) | 0 (0.0%) |
| $800 to $1,499 | 3 (7.5%) | 24 (85.7%) |
| $800 to $1,499 | 5 (12.5%) | 4 (14.3%) |
| Total | 40 (100.0%) | 28 (100.0%) |
Health & Disability in Eakly
Health Insurance Coverage by Age in Eakly
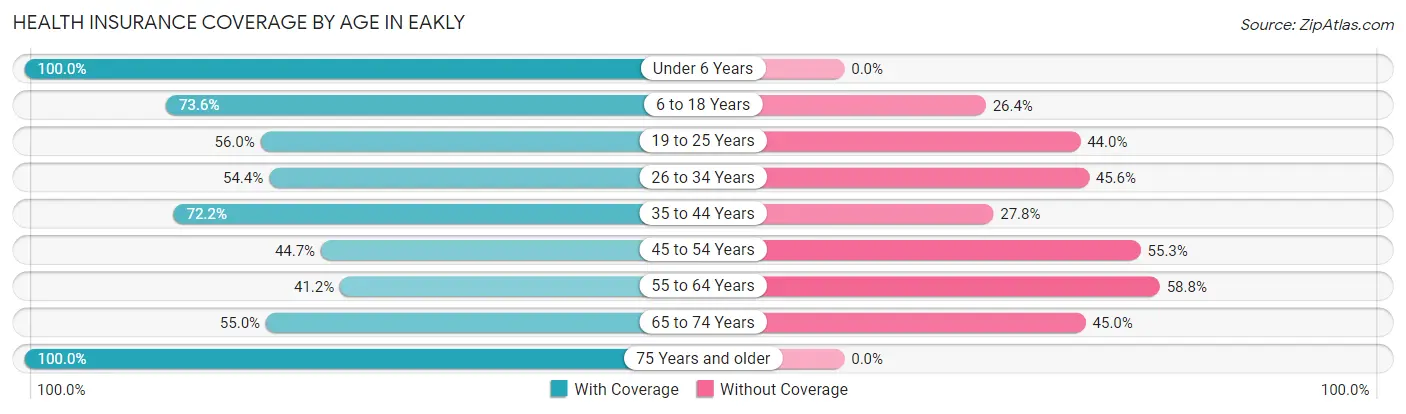
| Age Bracket | With Coverage | Without Coverage |
| Under 6 Years | 87 (100.0%) | 0 (0.0%) |
| 6 to 18 Years | 67 (73.6%) | 24 (26.4%) |
| 19 to 25 Years | 42 (56.0%) | 33 (44.0%) |
| 26 to 34 Years | 37 (54.4%) | 31 (45.6%) |
| 35 to 44 Years | 39 (72.2%) | 15 (27.8%) |
| 45 to 54 Years | 17 (44.7%) | 21 (55.3%) |
| 55 to 64 Years | 7 (41.2%) | 10 (58.8%) |
| 65 to 74 Years | 11 (55.0%) | 9 (45.0%) |
| 75 Years and older | 10 (100.0%) | 0 (0.0%) |
| Total | 317 (68.9%) | 143 (31.1%) |
Health Insurance Coverage by Citizenship Status in Eakly
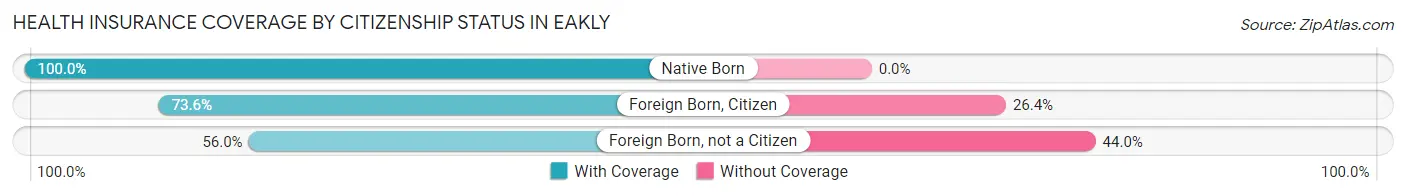
| Citizenship Status | With Coverage | Without Coverage |
| Native Born | 87 (100.0%) | 0 (0.0%) |
| Foreign Born, Citizen | 67 (73.6%) | 24 (26.4%) |
| Foreign Born, not a Citizen | 42 (56.0%) | 33 (44.0%) |
Health Insurance Coverage by Household Income in Eakly
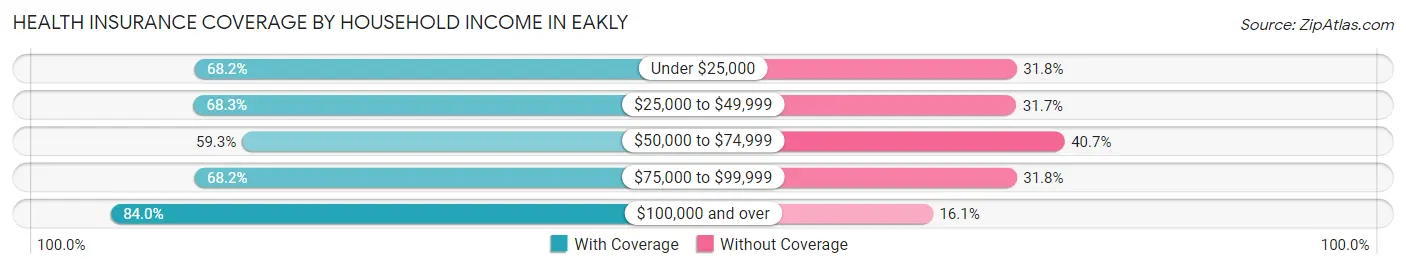
| Household Income | With Coverage | Without Coverage |
| Under $25,000 | 58 (68.2%) | 27 (31.8%) |
| $25,000 to $49,999 | 69 (68.3%) | 32 (31.7%) |
| $50,000 to $74,999 | 64 (59.3%) | 44 (40.7%) |
| $75,000 to $99,999 | 58 (68.2%) | 27 (31.8%) |
| $100,000 and over | 68 (84.0%) | 13 (16.1%) |
Public vs Private Health Insurance Coverage by Age in Eakly
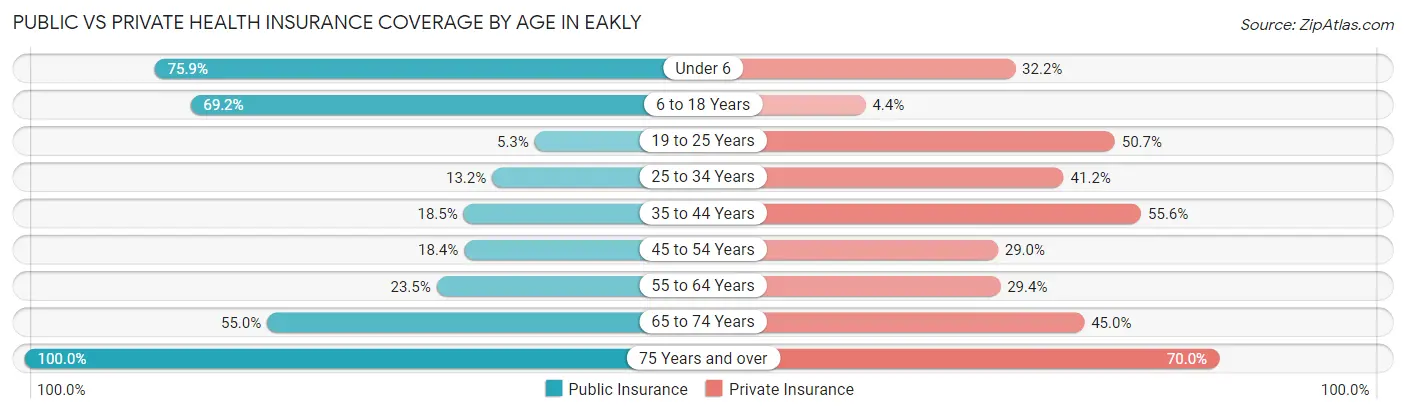
| Age Bracket | Public Insurance | Private Insurance |
| Under 6 | 66 (75.9%) | 28 (32.2%) |
| 6 to 18 Years | 63 (69.2%) | 4 (4.4%) |
| 19 to 25 Years | 4 (5.3%) | 38 (50.7%) |
| 25 to 34 Years | 9 (13.2%) | 28 (41.2%) |
| 35 to 44 Years | 10 (18.5%) | 30 (55.6%) |
| 45 to 54 Years | 7 (18.4%) | 11 (28.9%) |
| 55 to 64 Years | 4 (23.5%) | 5 (29.4%) |
| 65 to 74 Years | 11 (55.0%) | 9 (45.0%) |
| 75 Years and over | 10 (100.0%) | 7 (70.0%) |
| Total | 184 (40.0%) | 160 (34.8%) |
Disability Status by Sex by Age in Eakly
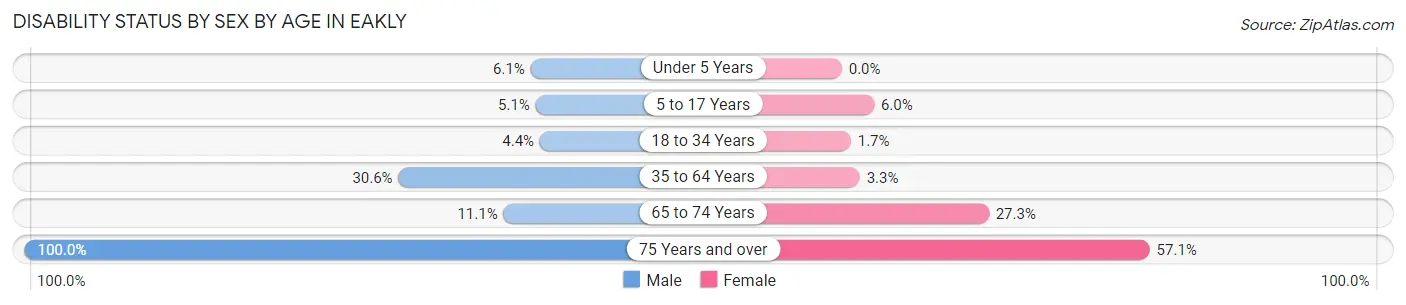
| Age Bracket | Male | Female |
| Under 5 Years | 2 (6.1%) | 0 (0.0%) |
| 5 to 17 Years | 2 (5.1%) | 4 (6.0%) |
| 18 to 34 Years | 4 (4.3%) | 1 (1.7%) |
| 35 to 64 Years | 15 (30.6%) | 2 (3.3%) |
| 65 to 74 Years | 1 (11.1%) | 3 (27.3%) |
| 75 Years and over | 3 (100.0%) | 4 (57.1%) |
Disability Class by Sex by Age in Eakly
Disability Class: Hearing Difficulty
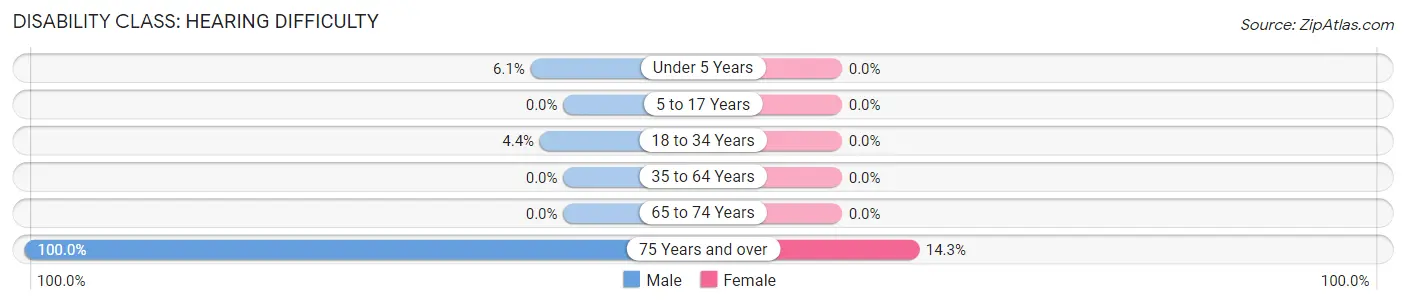
| Age Bracket | Male | Female |
| Under 5 Years | 2 (6.1%) | 0 (0.0%) |
| 5 to 17 Years | 0 (0.0%) | 0 (0.0%) |
| 18 to 34 Years | 4 (4.3%) | 0 (0.0%) |
| 35 to 64 Years | 0 (0.0%) | 0 (0.0%) |
| 65 to 74 Years | 0 (0.0%) | 0 (0.0%) |
| 75 Years and over | 3 (100.0%) | 1 (14.3%) |
Disability Class: Vision Difficulty
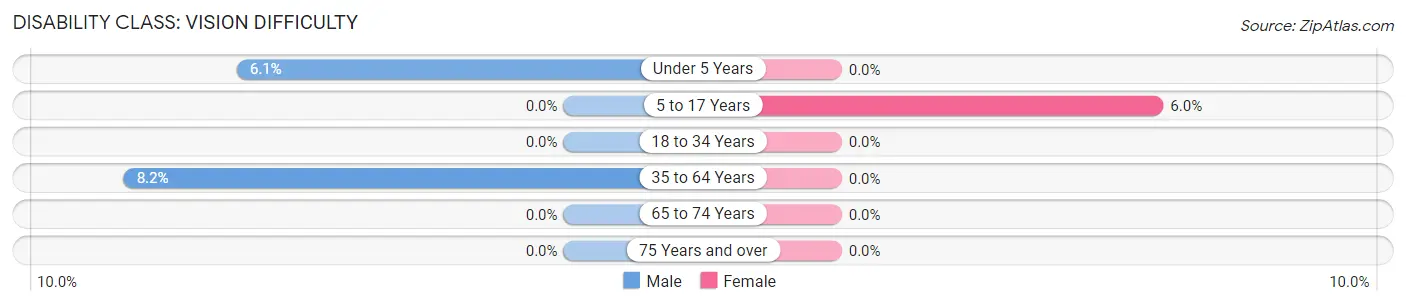
| Age Bracket | Male | Female |
| Under 5 Years | 2 (6.1%) | 0 (0.0%) |
| 5 to 17 Years | 0 (0.0%) | 4 (6.0%) |
| 18 to 34 Years | 0 (0.0%) | 0 (0.0%) |
| 35 to 64 Years | 4 (8.2%) | 0 (0.0%) |
| 65 to 74 Years | 0 (0.0%) | 0 (0.0%) |
| 75 Years and over | 0 (0.0%) | 0 (0.0%) |
Disability Class: Cognitive Difficulty
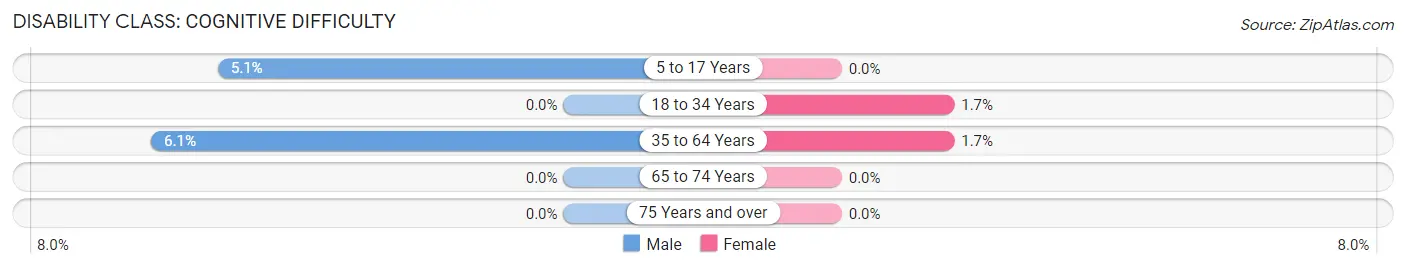
| Age Bracket | Male | Female |
| 5 to 17 Years | 2 (5.1%) | 0 (0.0%) |
| 18 to 34 Years | 0 (0.0%) | 1 (1.7%) |
| 35 to 64 Years | 3 (6.1%) | 1 (1.7%) |
| 65 to 74 Years | 0 (0.0%) | 0 (0.0%) |
| 75 Years and over | 0 (0.0%) | 0 (0.0%) |
Disability Class: Ambulatory Difficulty
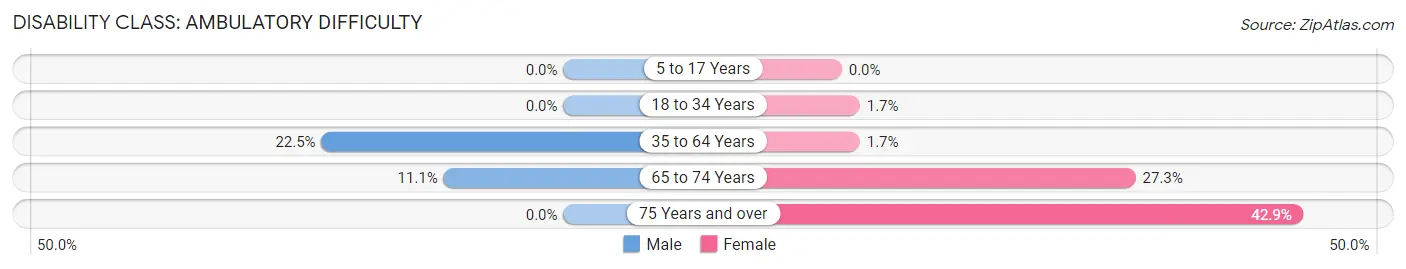
| Age Bracket | Male | Female |
| 5 to 17 Years | 0 (0.0%) | 0 (0.0%) |
| 18 to 34 Years | 0 (0.0%) | 1 (1.7%) |
| 35 to 64 Years | 11 (22.5%) | 1 (1.7%) |
| 65 to 74 Years | 1 (11.1%) | 3 (27.3%) |
| 75 Years and over | 0 (0.0%) | 3 (42.9%) |
Disability Class: Self-Care Difficulty
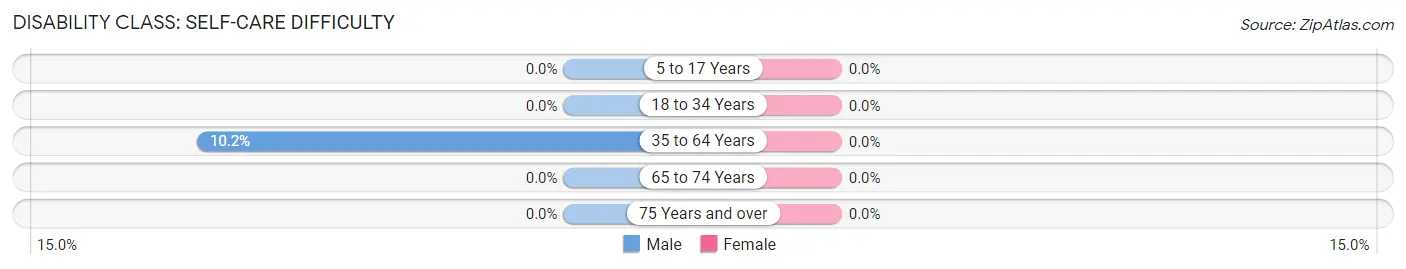
| Age Bracket | Male | Female |
| 5 to 17 Years | 0 (0.0%) | 0 (0.0%) |
| 18 to 34 Years | 0 (0.0%) | 0 (0.0%) |
| 35 to 64 Years | 5 (10.2%) | 0 (0.0%) |
| 65 to 74 Years | 0 (0.0%) | 0 (0.0%) |
| 75 Years and over | 0 (0.0%) | 0 (0.0%) |
Technology Access in Eakly
Computing Device Access in Eakly
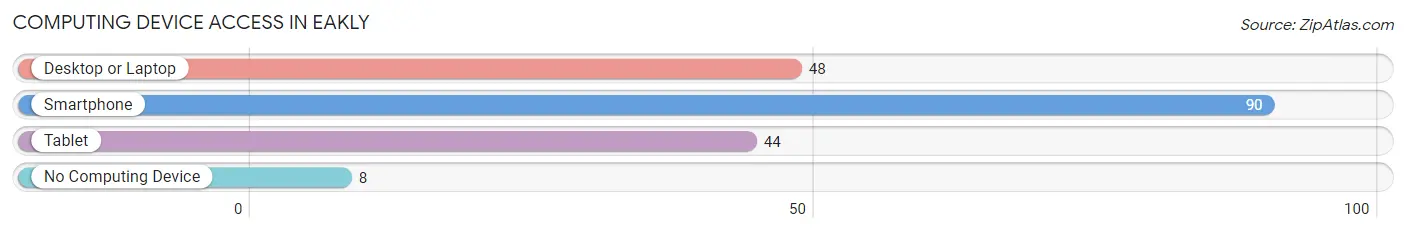
| Device Type | # Households | % Households |
| Desktop or Laptop | 48 | 45.3% |
| Smartphone | 90 | 84.9% |
| Tablet | 44 | 41.5% |
| No Computing Device | 8 | 7.5% |
| Total | 106 | 100.0% |
Internet Access in Eakly
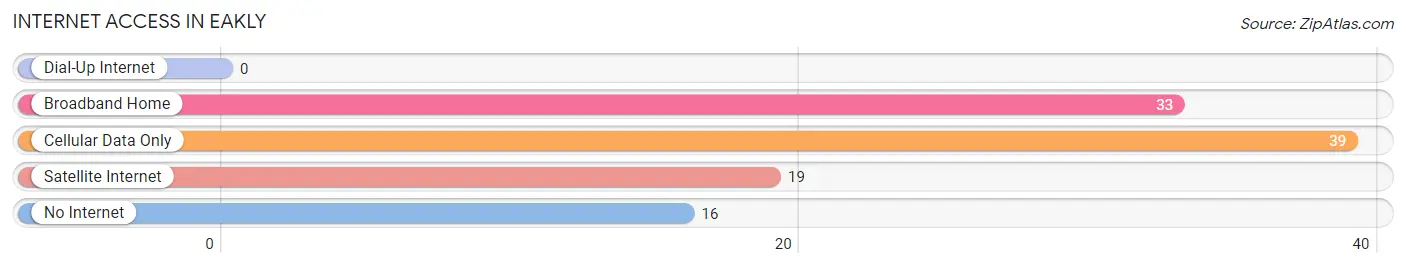
| Internet Type | # Households | % Households |
| Dial-Up Internet | 0 | 0.0% |
| Broadband Home | 33 | 31.1% |
| Cellular Data Only | 39 | 36.8% |
| Satellite Internet | 19 | 17.9% |
| No Internet | 16 | 15.1% |
| Total | 106 | 100.0% |
Eakly Summary
Eakly is a small town located in Caddo County, Oklahoma. It is situated in the western part of the state, approximately 30 miles west of Oklahoma City. The town was founded in 1901 and has a population of approximately 500 people.
Geography
Eakly is located in the western part of Caddo County, Oklahoma. It is situated in the Red Bed Plains region of the state, which is characterized by flat terrain and red-colored soil. The town is located at an elevation of 1,068 feet above sea level. The nearest major city is Oklahoma City, which is located approximately 30 miles to the east.
Economy
The economy of Eakly is largely based on agriculture. The town is home to several farms, which produce a variety of crops, including wheat, corn, and soybeans. The town also has a few small businesses, including a grocery store, a hardware store, and a restaurant.
Demographics
As of the 2010 census, the population of Eakly was 498. The racial makeup of the town was 95.2% White, 0.2% African American, 0.4% Native American, 0.2% Asian, 0.2% from other races, and 3.8% from two or more races. The median household income was $35,625, and the median family income was $41,250.
The town is served by the Eakly Public School District, which consists of one elementary school, one middle school, and one high school. The town is also home to a branch of the Caddo County Library System.
Conclusion
Eakly is a small town located in Caddo County, Oklahoma. It is situated in the western part of the state, approximately 30 miles west of Oklahoma City. The town was founded in 1901 and has a population of approximately 500 people. The economy of Eakly is largely based on agriculture, and the town is served by the Eakly Public School District. The racial makeup of the town is predominantly White, with a small percentage of African American, Native American, and Asian residents. The median household income is $35,625, and the median family income is $41,250.
Common Questions
What is Per Capita Income in Eakly?
Per Capita income in Eakly is $17,133.
What is the Median Family Income in Eakly?
Median Family Income in Eakly is $61,750.
What is the Median Household income in Eakly?
Median Household Income in Eakly is $52,500.
What is Income or Wage Gap in Eakly?
Income or Wage Gap in Eakly is 30.4%.
Women in Eakly earn 69.6 cents for every dollar earned by a man.
What is Inequality or Gini Index in Eakly?
Inequality or Gini Index in Eakly is 0.41.
What is the Total Population of Eakly?
Total Population of Eakly is 460.
What is the Total Male Population of Eakly?
Total Male Population of Eakly is 225.
What is the Total Female Population of Eakly?
Total Female Population of Eakly is 235.
What is the Ratio of Males per 100 Females in Eakly?
There are 95.74 Males per 100 Females in Eakly.
What is the Ratio of Females per 100 Males in Eakly?
There are 104.44 Females per 100 Males in Eakly.
What is the Median Population Age in Eakly?
Median Population Age in Eakly is 21.7 Years.
What is the Average Family Size in Eakly
Average Family Size in Eakly is 5.3 People.
What is the Average Household Size in Eakly
Average Household Size in Eakly is 4.3 People.
How Large is the Labor Force in Eakly?
There are 193 People in the Labor Forcein in Eakly.
What is the Percentage of People in the Labor Force in Eakly?
63.7% of People are in the Labor Force in Eakly.
What is the Unemployment Rate in Eakly?
Unemployment Rate in Eakly is 2.1%.