Calera, OK Map & Demographics
Calera Map
Calera Overview
$26,273
PER CAPITA INCOME
$59,632
AVG FAMILY INCOME
$54,813
AVG HOUSEHOLD INCOME
27.6%
WAGE / INCOME GAP [ % ]
72.4¢/ $1
WAGE / INCOME GAP [ $ ]
0.36
INEQUALITY / GINI INDEX
2,896
TOTAL POPULATION
1,364
MALE POPULATION
1,532
FEMALE POPULATION
89.03
MALES / 100 FEMALES
112.32
FEMALES / 100 MALES
31.7
MEDIAN AGE
2.9
AVG FAMILY SIZE
2.5
AVG HOUSEHOLD SIZE
1,448
LABOR FORCE [ PEOPLE ]
67.8%
PERCENT IN LABOR FORCE
1.9%
UNEMPLOYMENT RATE
Calera Zip Codes
Calera Area Codes
Income in Calera
Income Overview in Calera
Per Capita Income in Calera is $26,273, while median incomes of families and households are $59,632 and $54,813 respectively.
| Characteristic | Number | Measure |
| Per Capita Income | 2,896 | $26,273 |
| Median Family Income | 745 | $59,632 |
| Mean Family Income | 745 | $67,599 |
| Median Household Income | 1,121 | $54,813 |
| Mean Household Income | 1,121 | $65,579 |
| Income Deficit | 745 | $0 |
| Wage / Income Gap (%) | 2,896 | 27.63% |
| Wage / Income Gap ($) | 2,896 | 72.37¢ per $1 |
| Gini / Inequality Index | 2,896 | 0.36 |
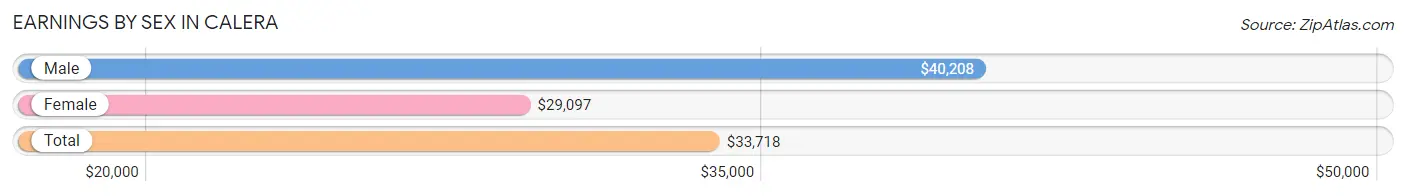
Earnings by Sex in Calera
Average Earnings in Calera are $33,718, $40,208 for men and $29,097 for women, a difference of 27.6%.
| Sex | Number | Average Earnings |
| Male | 754 (49.4%) | $40,208 |
| Female | 773 (50.6%) | $29,097 |
| Total | 1,527 (100.0%) | $33,718 |
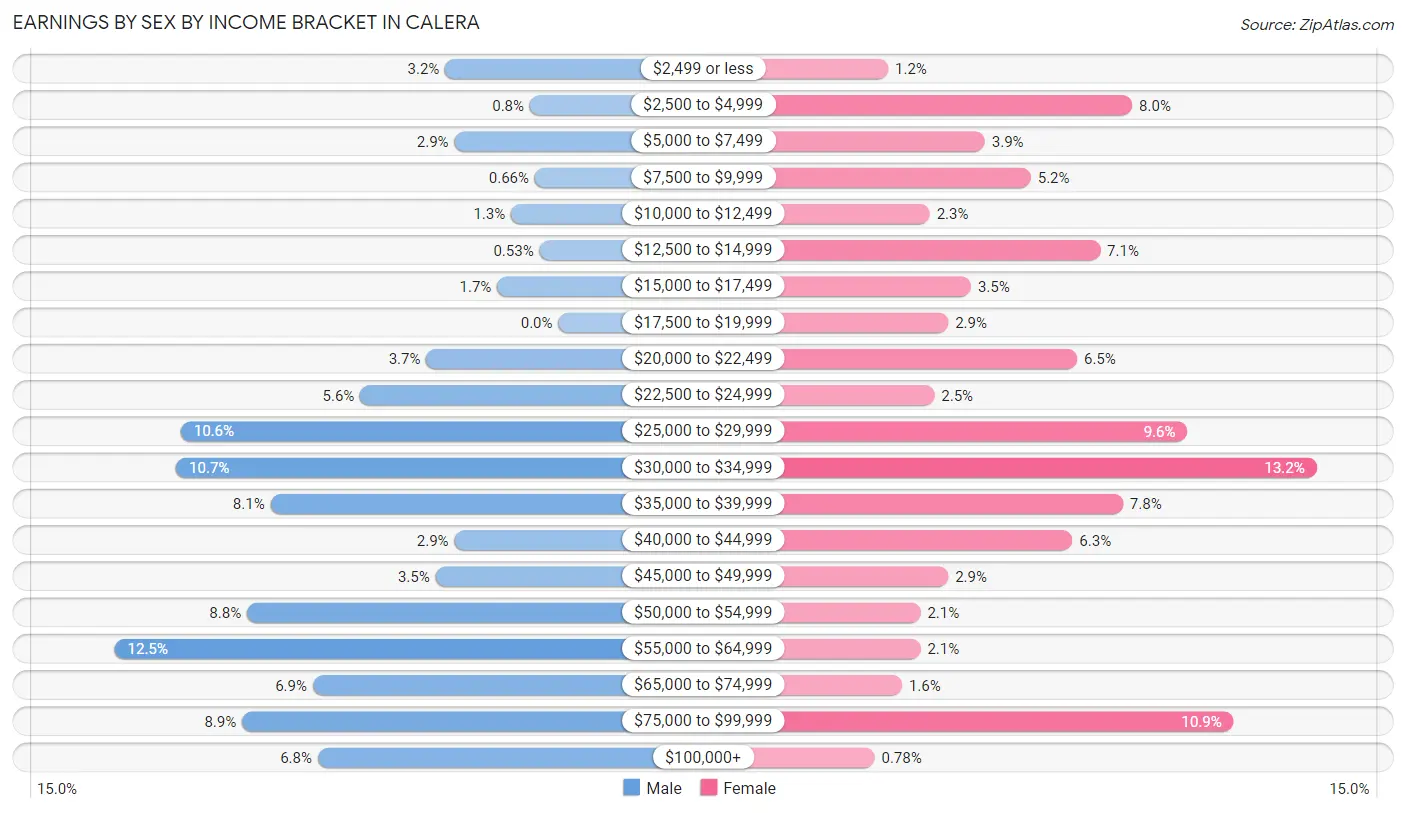
Earnings by Sex by Income Bracket in Calera
The most common earnings brackets in Calera are $55,000 to $64,999 for men (94 | 12.5%) and $30,000 to $34,999 for women (102 | 13.2%).
| Income | Male | Female |
| $2,499 or less | 24 (3.2%) | 9 (1.2%) |
| $2,500 to $4,999 | 6 (0.8%) | 62 (8.0%) |
| $5,000 to $7,499 | 22 (2.9%) | 30 (3.9%) |
| $7,500 to $9,999 | 5 (0.7%) | 40 (5.2%) |
| $10,000 to $12,499 | 10 (1.3%) | 18 (2.3%) |
| $12,500 to $14,999 | 4 (0.5%) | 55 (7.1%) |
| $15,000 to $17,499 | 13 (1.7%) | 27 (3.5%) |
| $17,500 to $19,999 | 0 (0.0%) | 22 (2.9%) |
| $20,000 to $22,499 | 28 (3.7%) | 50 (6.5%) |
| $22,500 to $24,999 | 42 (5.6%) | 19 (2.5%) |
| $25,000 to $29,999 | 80 (10.6%) | 74 (9.6%) |
| $30,000 to $34,999 | 81 (10.7%) | 102 (13.2%) |
| $35,000 to $39,999 | 61 (8.1%) | 60 (7.8%) |
| $40,000 to $44,999 | 22 (2.9%) | 49 (6.3%) |
| $45,000 to $49,999 | 26 (3.5%) | 22 (2.9%) |
| $50,000 to $54,999 | 66 (8.7%) | 16 (2.1%) |
| $55,000 to $64,999 | 94 (12.5%) | 16 (2.1%) |
| $65,000 to $74,999 | 52 (6.9%) | 12 (1.5%) |
| $75,000 to $99,999 | 67 (8.9%) | 84 (10.9%) |
| $100,000+ | 51 (6.8%) | 6 (0.8%) |
| Total | 754 (100.0%) | 773 (100.0%) |
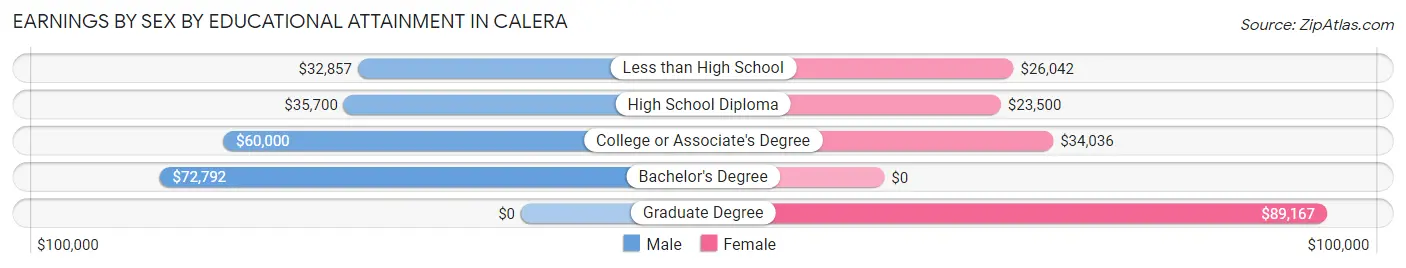
Earnings by Sex by Educational Attainment in Calera
Average earnings in Calera are $50,179 for men and $29,907 for women, a difference of 40.4%. Men with an educational attainment of bachelor's degree enjoy the highest average annual earnings of $72,792, while those with less than high school education earn the least with $32,857. Women with an educational attainment of graduate degree earn the most with the average annual earnings of $89,167, while those with high school diploma education have the smallest earnings of $23,500.
| Educational Attainment | Male Income | Female Income |
| Less than High School | $32,857 | $26,042 |
| High School Diploma | $35,700 | $23,500 |
| College or Associate's Degree | $60,000 | $34,036 |
| Bachelor's Degree | $72,792 | $0 |
| Graduate Degree | - | - |
| Total | $50,179 | $29,907 |
Family Income in Calera
Family Income Brackets in Calera
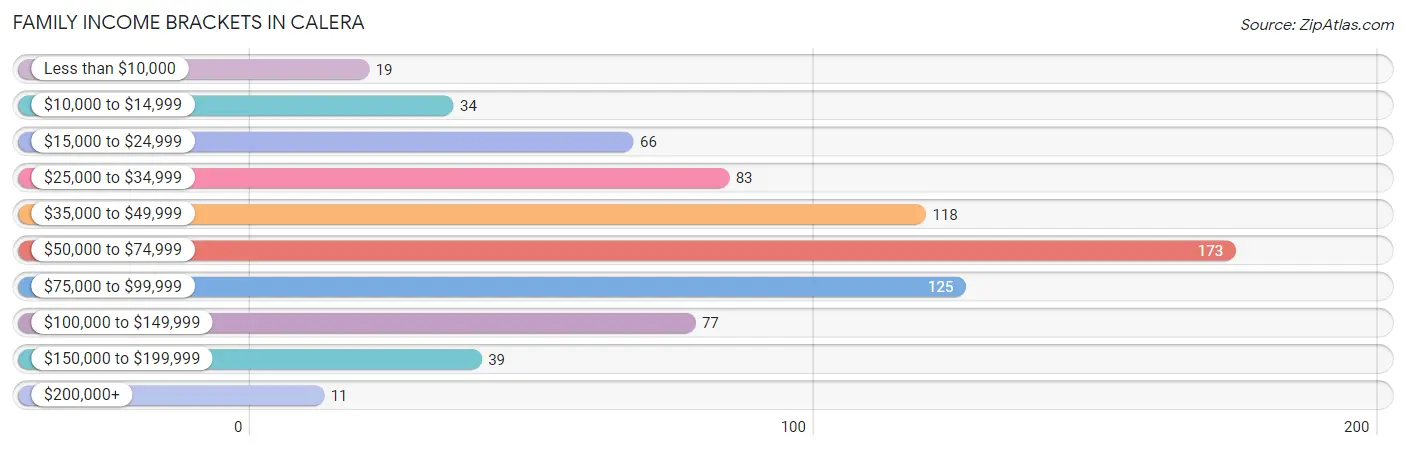
According to the Calera family income data, there are 173 families falling into the $50,000 to $74,999 income range, which is the most common income bracket and makes up 23.2% of all families. Conversely, the $200,000+ income bracket is the least frequent group with only 11 families (1.5%) belonging to this category.
| Income Bracket | # Families | % Families |
| Less than $10,000 | 19 | 2.6% |
| $10,000 to $14,999 | 34 | 4.6% |
| $15,000 to $24,999 | 66 | 8.9% |
| $25,000 to $34,999 | 83 | 11.1% |
| $35,000 to $49,999 | 118 | 15.8% |
| $50,000 to $74,999 | 173 | 23.2% |
| $75,000 to $99,999 | 125 | 16.8% |
| $100,000 to $149,999 | 77 | 10.3% |
| $150,000 to $199,999 | 39 | 5.2% |
| $200,000+ | 11 | 1.5% |
Family Income by Famaliy Size in Calera
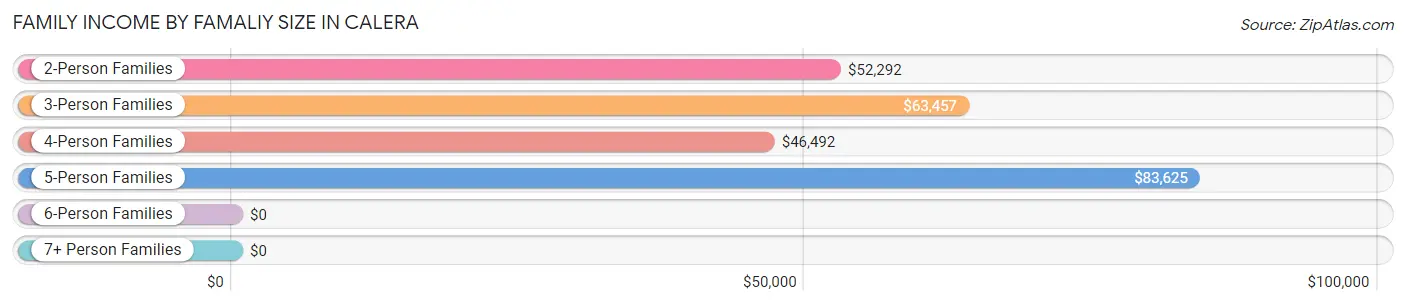
5-person families (47 | 6.3%) account for the highest median family income in Calera with $83,625 per family, while 2-person families (313 | 42.0%) have the highest median income of $26,146 per family member.
| Income Bracket | # Families | Median Income |
| 2-Person Families | 313 (42.0%) | $52,292 |
| 3-Person Families | 256 (34.4%) | $63,457 |
| 4-Person Families | 113 (15.2%) | $46,492 |
| 5-Person Families | 47 (6.3%) | $83,625 |
| 6-Person Families | 8 (1.1%) | $0 |
| 7+ Person Families | 8 (1.1%) | $0 |
| Total | 745 (100.0%) | $59,632 |
Family Income by Number of Earners in Calera
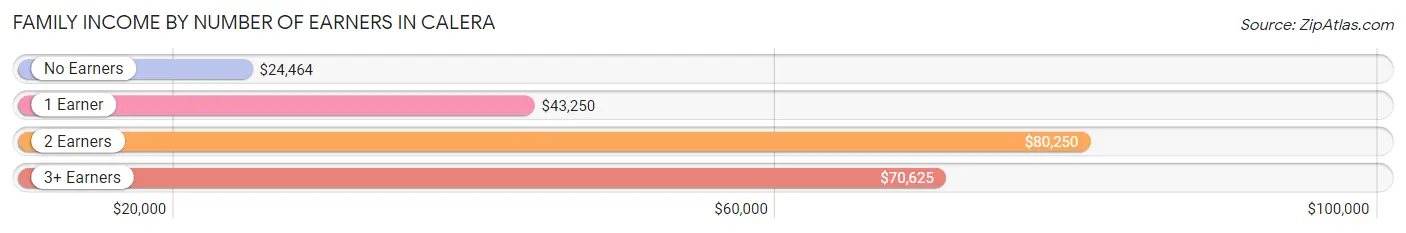
The median family income in Calera is $59,632, with families comprising 2 earners (303) having the highest median family income of $80,250, while families with no earners (71) have the lowest median family income of $24,464, accounting for 40.7% and 9.5% of families, respectively.
| Number of Earners | # Families | Median Income |
| No Earners | 71 (9.5%) | $24,464 |
| 1 Earner | 345 (46.3%) | $43,250 |
| 2 Earners | 303 (40.7%) | $80,250 |
| 3+ Earners | 26 (3.5%) | $70,625 |
| Total | 745 (100.0%) | $59,632 |
Household Income in Calera
Household Income Brackets in Calera
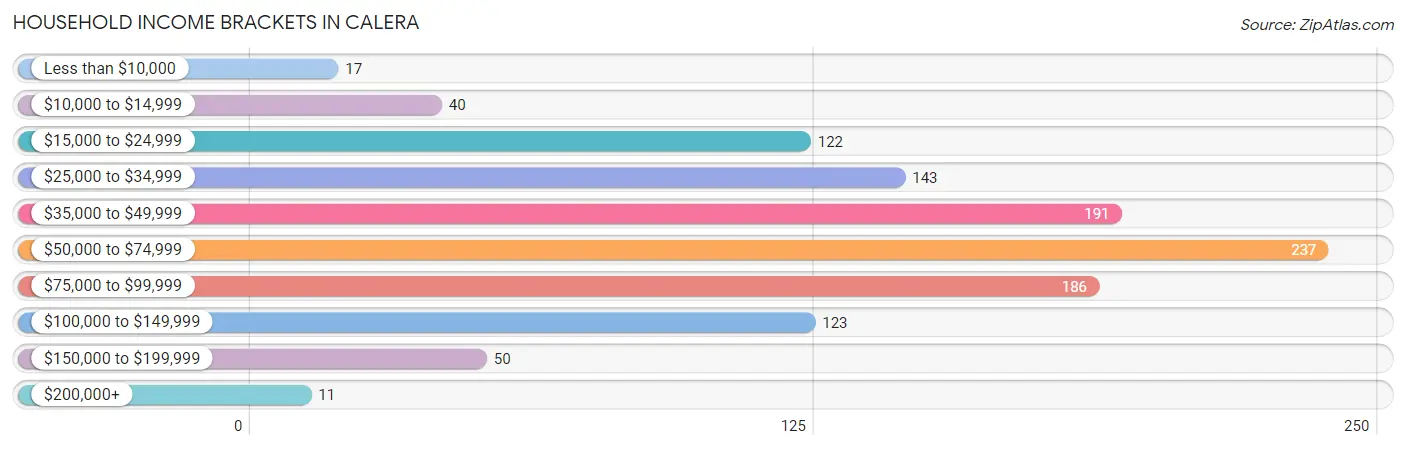
With 237 households falling in the category, the $50,000 to $74,999 income range is the most frequent in Calera, accounting for 21.1% of all households. In contrast, only 11 households (1.0%) fall into the $200,000+ income bracket, making it the least populous group.
| Income Bracket | # Households | % Households |
| Less than $10,000 | 17 | 1.5% |
| $10,000 to $14,999 | 40 | 3.6% |
| $15,000 to $24,999 | 122 | 10.9% |
| $25,000 to $34,999 | 143 | 12.8% |
| $35,000 to $49,999 | 191 | 17.0% |
| $50,000 to $74,999 | 237 | 21.1% |
| $75,000 to $99,999 | 186 | 16.6% |
| $100,000 to $149,999 | 123 | 11.0% |
| $150,000 to $199,999 | 50 | 4.5% |
| $200,000+ | 11 | 1.0% |
Household Income by Householder Age in Calera
The median household income in Calera is $54,813, with the highest median household income of $68,125 found in the 45 to 64 years age bracket for the primary householder. A total of 386 households (34.4%) fall into this category. Meanwhile, the 65+ years age bracket for the primary householder has the lowest median household income of $31,000, with 148 households (13.2%) in this group.
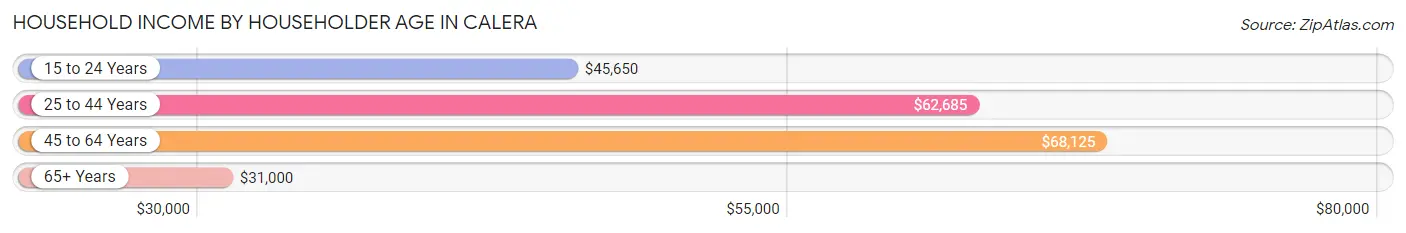
| Income Bracket | # Households | Median Income |
| 15 to 24 Years | 99 (8.8%) | $45,650 |
| 25 to 44 Years | 488 (43.5%) | $62,685 |
| 45 to 64 Years | 386 (34.4%) | $68,125 |
| 65+ Years | 148 (13.2%) | $31,000 |
| Total | 1,121 (100.0%) | $54,813 |
Poverty in Calera
Income Below Poverty by Sex and Age in Calera
With 12.0% poverty level for males and 15.2% for females among the residents of Calera, 15 year old males and 16 and 17 year old females are the most vulnerable to poverty, with 6 males (60.0%) and 13 females (100.0%) in their respective age groups living below the poverty level.
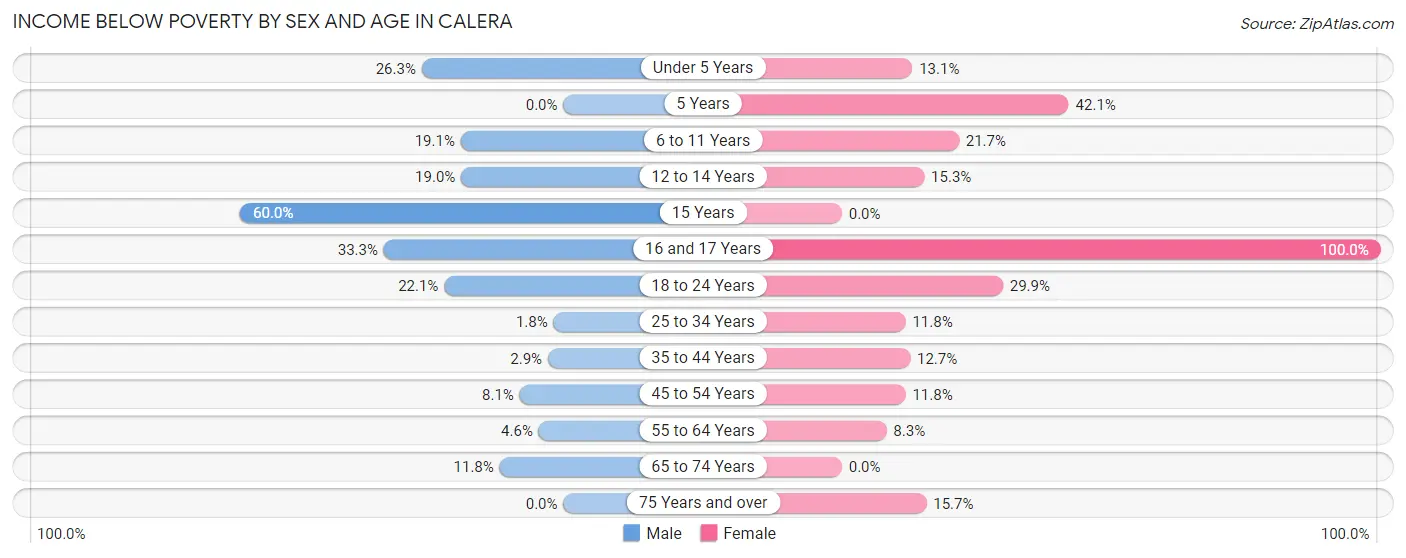
| Age Bracket | Male | Female |
| Under 5 Years | 51 (26.3%) | 14 (13.1%) |
| 5 Years | 0 (0.0%) | 8 (42.1%) |
| 6 to 11 Years | 20 (19.1%) | 28 (21.7%) |
| 12 to 14 Years | 11 (19.0%) | 13 (15.3%) |
| 15 Years | 6 (60.0%) | 0 (0.0%) |
| 16 and 17 Years | 12 (33.3%) | 13 (100.0%) |
| 18 to 24 Years | 23 (22.1%) | 49 (29.9%) |
| 25 to 34 Years | 5 (1.8%) | 37 (11.8%) |
| 35 to 44 Years | 4 (2.9%) | 20 (12.7%) |
| 45 to 54 Years | 9 (8.1%) | 24 (11.8%) |
| 55 to 64 Years | 8 (4.6%) | 12 (8.3%) |
| 65 to 74 Years | 11 (11.8%) | 0 (0.0%) |
| 75 Years and over | 0 (0.0%) | 8 (15.7%) |
| Total | 160 (12.0%) | 226 (15.2%) |
Income Above Poverty by Sex and Age in Calera
According to the poverty statistics in Calera, males aged 5 years and females aged 15 years are the age groups that are most secure financially, with 100.0% of males and 100.0% of females in these age groups living above the poverty line.
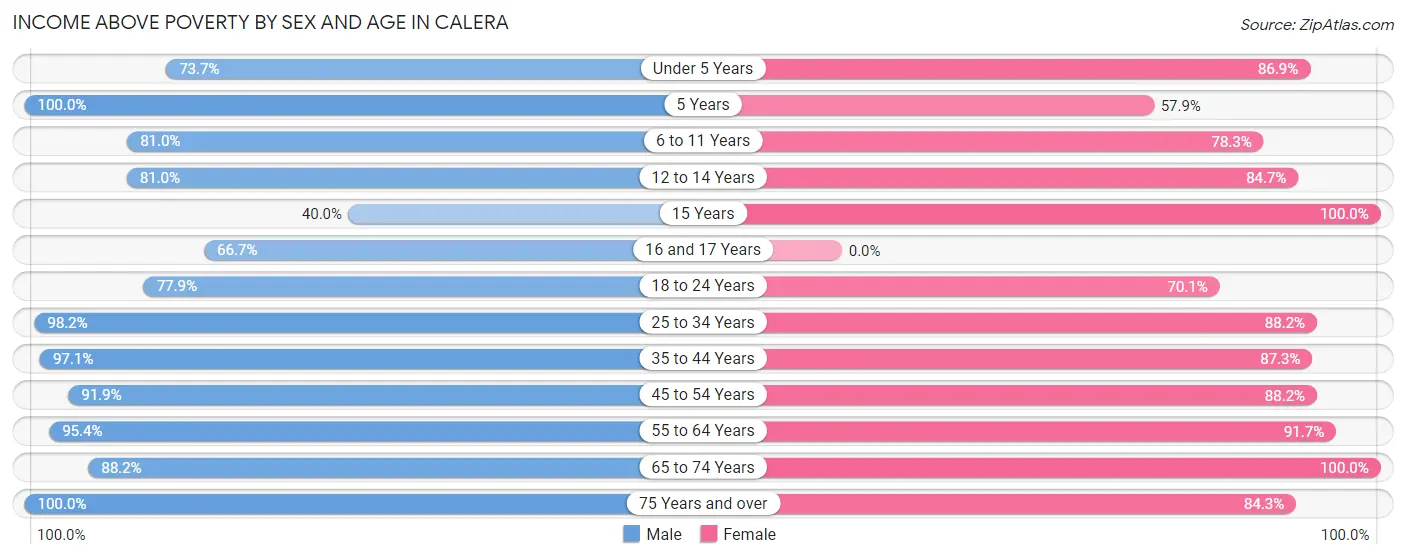
| Age Bracket | Male | Female |
| Under 5 Years | 143 (73.7%) | 93 (86.9%) |
| 5 Years | 13 (100.0%) | 11 (57.9%) |
| 6 to 11 Years | 85 (80.9%) | 101 (78.3%) |
| 12 to 14 Years | 47 (81.0%) | 72 (84.7%) |
| 15 Years | 4 (40.0%) | 27 (100.0%) |
| 16 and 17 Years | 24 (66.7%) | 0 (0.0%) |
| 18 to 24 Years | 81 (77.9%) | 115 (70.1%) |
| 25 to 34 Years | 269 (98.2%) | 276 (88.2%) |
| 35 to 44 Years | 136 (97.1%) | 138 (87.3%) |
| 45 to 54 Years | 102 (91.9%) | 179 (88.2%) |
| 55 to 64 Years | 167 (95.4%) | 133 (91.7%) |
| 65 to 74 Years | 82 (88.2%) | 70 (100.0%) |
| 75 Years and over | 23 (100.0%) | 43 (84.3%) |
| Total | 1,176 (88.0%) | 1,258 (84.8%) |
Income Below Poverty Among Married-Couple Families in Calera
The poverty statistics for married-couple families in Calera show that 3.3% or 13 of the total 393 families live below the poverty line. Families with 3 or 4 children have the highest poverty rate of 11.1%, comprising of 4 families. On the other hand, families with no children have the lowest poverty rate of 0.0%, which includes 0 families.
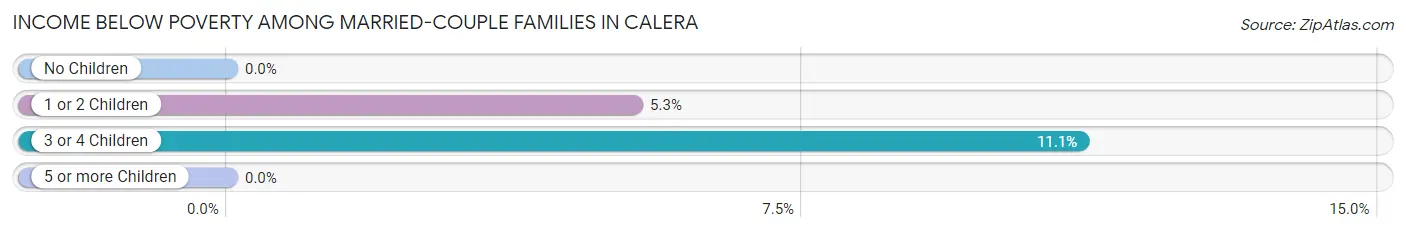
| Children | Above Poverty | Below Poverty |
| No Children | 183 (100.0%) | 0 (0.0%) |
| 1 or 2 Children | 161 (94.7%) | 9 (5.3%) |
| 3 or 4 Children | 32 (88.9%) | 4 (11.1%) |
| 5 or more Children | 4 (100.0%) | 0 (0.0%) |
| Total | 380 (96.7%) | 13 (3.3%) |
Income Below Poverty Among Single-Parent Households in Calera
According to the poverty data in Calera, 12.7% or 16 single-father households and 27.9% or 63 single-mother households are living below the poverty line. Among single-father households, those with 1 or 2 children have the highest poverty rate, with 16 households (16.7%) experiencing poverty. Likewise, among single-mother households, those with 3 or 4 children have the highest poverty rate, with 12 households (80.0%) falling below the poverty line.
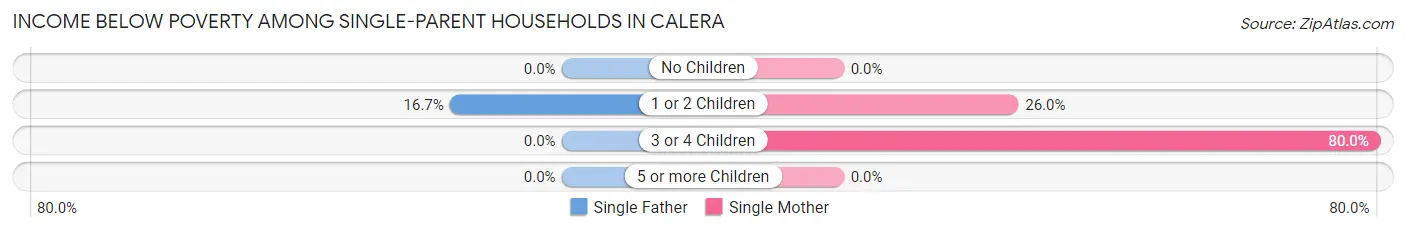
| Children | Single Father | Single Mother |
| No Children | 0 (0.0%) | 0 (0.0%) |
| 1 or 2 Children | 16 (16.7%) | 51 (26.0%) |
| 3 or 4 Children | 0 (0.0%) | 12 (80.0%) |
| 5 or more Children | 0 (0.0%) | 0 (0.0%) |
| Total | 16 (12.7%) | 63 (27.9%) |
Income Below Poverty Among Married-Couple vs Single-Parent Households in Calera
The poverty data for Calera shows that 13 of the married-couple family households (3.3%) and 79 of the single-parent households (22.4%) are living below the poverty level. Within the married-couple family households, those with 3 or 4 children have the highest poverty rate, with 4 households (11.1%) falling below the poverty line. Among the single-parent households, those with 3 or 4 children have the highest poverty rate, with 12 household (48.0%) living below poverty.
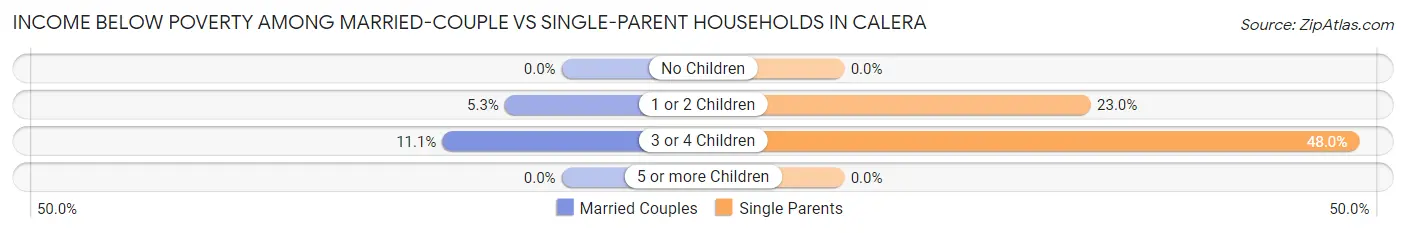
| Children | Married-Couple Families | Single-Parent Households |
| No Children | 0 (0.0%) | 0 (0.0%) |
| 1 or 2 Children | 9 (5.3%) | 67 (23.0%) |
| 3 or 4 Children | 4 (11.1%) | 12 (48.0%) |
| 5 or more Children | 0 (0.0%) | 0 (0.0%) |
| Total | 13 (3.3%) | 79 (22.4%) |
Race in Calera
The most populous races in Calera are White / Caucasian (1,978 | 68.3%), Native / Alaskan (439 | 15.2%), and Two or more Races (412 | 14.2%).
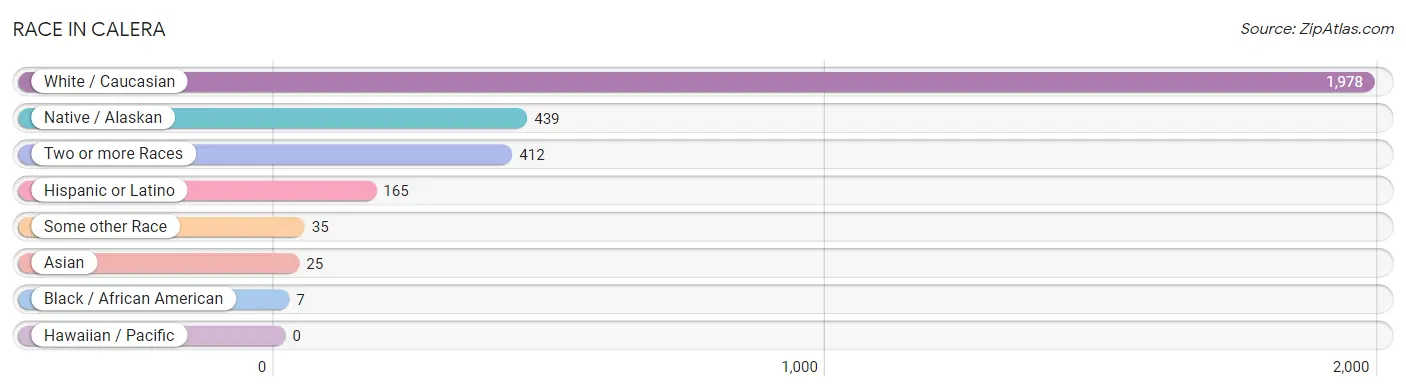
| Race | # Population | % Population |
| Asian | 25 | 0.9% |
| Black / African American | 7 | 0.2% |
| Hawaiian / Pacific | 0 | 0.0% |
| Hispanic or Latino | 165 | 5.7% |
| Native / Alaskan | 439 | 15.2% |
| White / Caucasian | 1,978 | 68.3% |
| Two or more Races | 412 | 14.2% |
| Some other Race | 35 | 1.2% |
| Total | 2,896 | 100.0% |
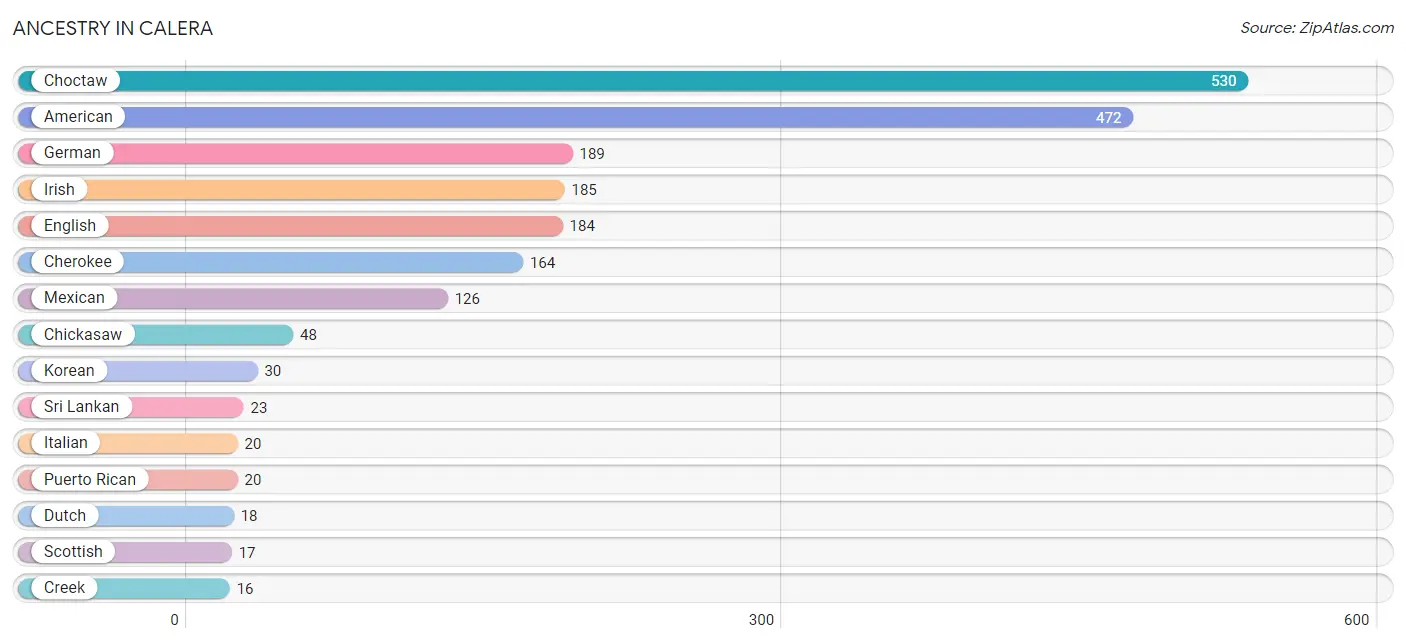
Ancestry in Calera
The most populous ancestries reported in Calera are Choctaw (530 | 18.3%), American (472 | 16.3%), German (189 | 6.5%), Irish (185 | 6.4%), and English (184 | 6.4%), together accounting for 53.9% of all Calera residents.
| Ancestry | # Population | % Population |
| American | 472 | 16.3% |
| Bhutanese | 4 | 0.1% |
| British | 15 | 0.5% |
| Burmese | 5 | 0.2% |
| Central American | 11 | 0.4% |
| Cherokee | 164 | 5.7% |
| Chickasaw | 48 | 1.7% |
| Choctaw | 530 | 18.3% |
| Creek | 16 | 0.5% |
| Dutch | 18 | 0.6% |
| Eastern European | 5 | 0.2% |
| English | 184 | 6.4% |
| European | 10 | 0.4% |
| French Canadian | 9 | 0.3% |
| German | 189 | 6.5% |
| Guatemalan | 5 | 0.2% |
| Hungarian | 7 | 0.2% |
| Indian (Asian) | 4 | 0.1% |
| Irish | 185 | 6.4% |
| Italian | 20 | 0.7% |
| Korean | 30 | 1.0% |
| Mexican | 126 | 4.3% |
| Northern European | 6 | 0.2% |
| Norwegian | 6 | 0.2% |
| Ottawa | 7 | 0.2% |
| Potawatomi | 11 | 0.4% |
| Puerto Rican | 20 | 0.7% |
| Russian | 8 | 0.3% |
| Salvadoran | 6 | 0.2% |
| Scotch-Irish | 16 | 0.5% |
| Scottish | 17 | 0.6% |
| Sioux | 9 | 0.3% |
| Spanish | 8 | 0.3% |
| Sri Lankan | 23 | 0.8% |
| Swedish | 10 | 0.4% | View All 35 Rows |
Immigrants in Calera
The most numerous immigrant groups reported in Calera came from Asia (23 | 0.8%), Central America (20 | 0.7%), Latin America (20 | 0.7%), Mexico (20 | 0.7%), and South Eastern Asia (18 | 0.6%), together accounting for 3.5% of all Calera residents.
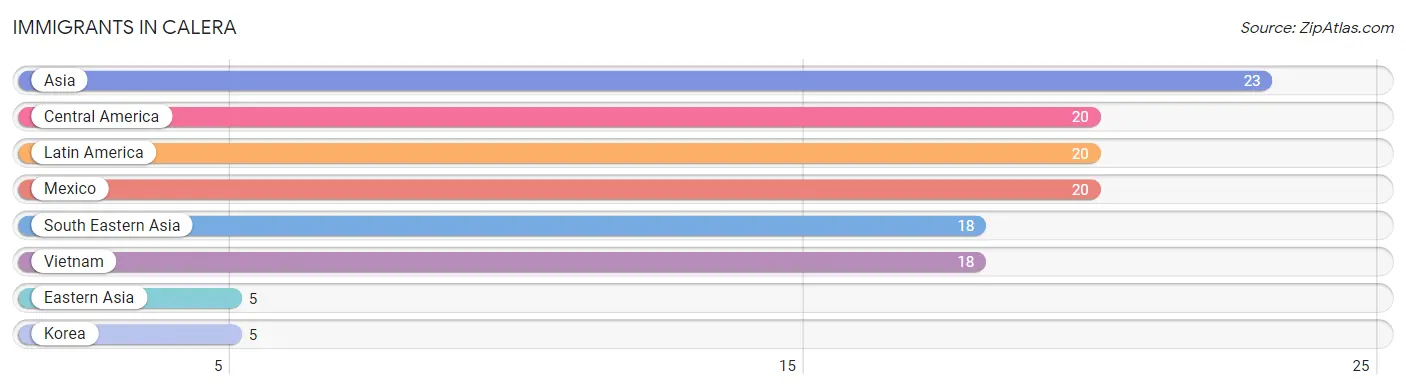
| Immigration Origin | # Population | % Population |
| Asia | 23 | 0.8% |
| Central America | 20 | 0.7% |
| Eastern Asia | 5 | 0.2% |
| Korea | 5 | 0.2% |
| Latin America | 20 | 0.7% |
| Mexico | 20 | 0.7% |
| South Eastern Asia | 18 | 0.6% |
| Vietnam | 18 | 0.6% | View All 8 Rows |
Sex and Age in Calera
Sex and Age in Calera
The most populous age groups in Calera are Under 5 Years (194 | 14.2%) for men and 25 to 29 Years (157 | 10.2%) for women.
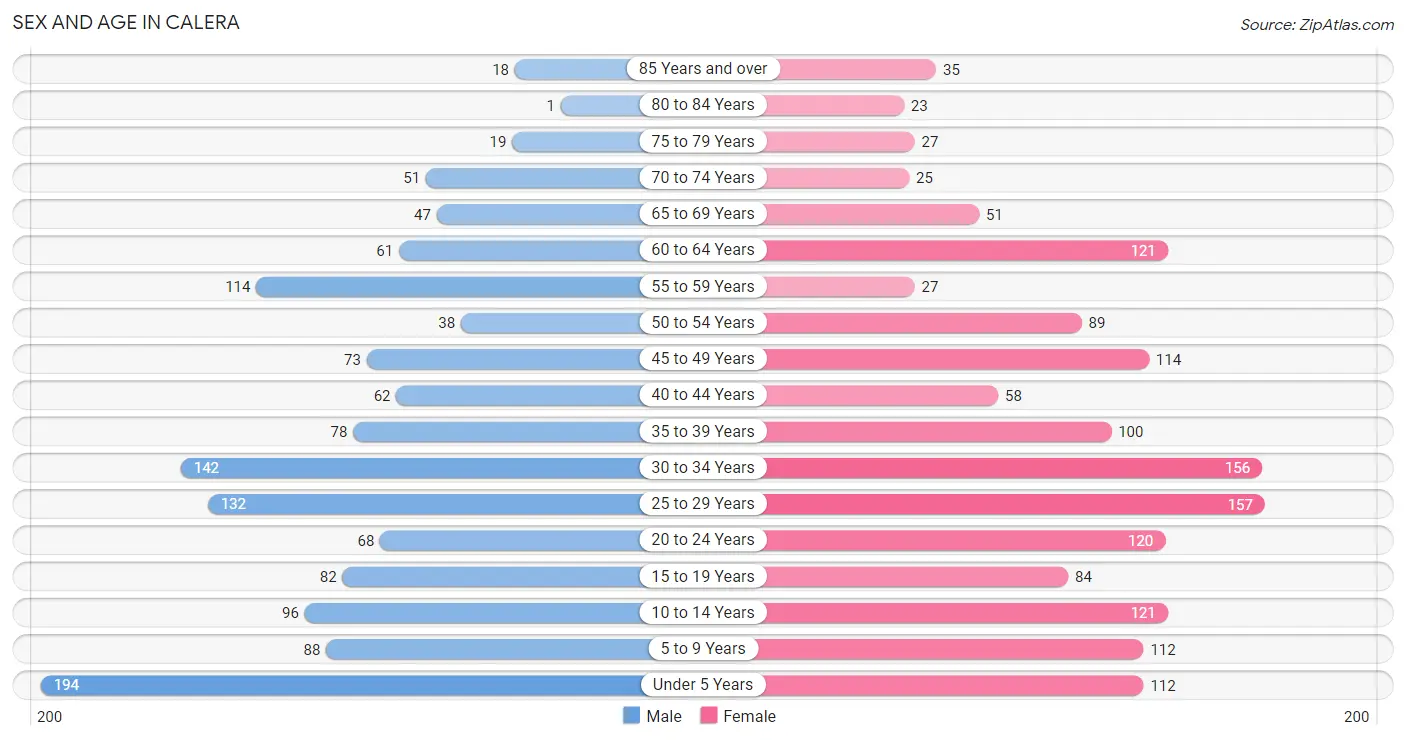
| Age Bracket | Male | Female |
| Under 5 Years | 194 (14.2%) | 112 (7.3%) |
| 5 to 9 Years | 88 (6.5%) | 112 (7.3%) |
| 10 to 14 Years | 96 (7.0%) | 121 (7.9%) |
| 15 to 19 Years | 82 (6.0%) | 84 (5.5%) |
| 20 to 24 Years | 68 (5.0%) | 120 (7.8%) |
| 25 to 29 Years | 132 (9.7%) | 157 (10.2%) |
| 30 to 34 Years | 142 (10.4%) | 156 (10.2%) |
| 35 to 39 Years | 78 (5.7%) | 100 (6.5%) |
| 40 to 44 Years | 62 (4.5%) | 58 (3.8%) |
| 45 to 49 Years | 73 (5.3%) | 114 (7.4%) |
| 50 to 54 Years | 38 (2.8%) | 89 (5.8%) |
| 55 to 59 Years | 114 (8.4%) | 27 (1.8%) |
| 60 to 64 Years | 61 (4.5%) | 121 (7.9%) |
| 65 to 69 Years | 47 (3.5%) | 51 (3.3%) |
| 70 to 74 Years | 51 (3.7%) | 25 (1.6%) |
| 75 to 79 Years | 19 (1.4%) | 27 (1.8%) |
| 80 to 84 Years | 1 (0.1%) | 23 (1.5%) |
| 85 Years and over | 18 (1.3%) | 35 (2.3%) |
| Total | 1,364 (100.0%) | 1,532 (100.0%) |
Families and Households in Calera
Median Family Size in Calera
The median family size in Calera is 2.93 persons per family, with married-couple families (393 | 52.7%) accounting for the largest median family size of 3.07 persons per family. On the other hand, single female/mother families (226 | 30.3%) represent the smallest median family size with 2.68 persons per family.
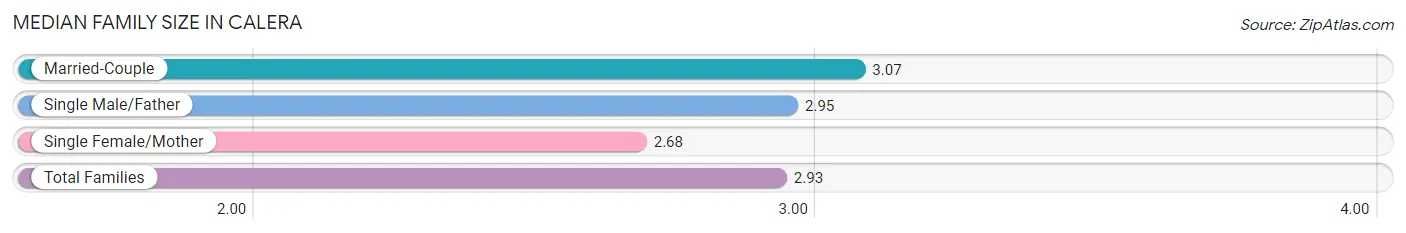
| Family Type | # Families | Family Size |
| Married-Couple | 393 (52.7%) | 3.07 |
| Single Male/Father | 126 (16.9%) | 2.95 |
| Single Female/Mother | 226 (30.3%) | 2.68 |
| Total Families | 745 (100.0%) | 2.93 |
Median Household Size in Calera
The median household size in Calera is 2.53 persons per household, with single male/father households (126 | 11.2%) accounting for the largest median household size of 3.38 persons per household. non-family households (376 | 33.5%) represent the smallest median household size with 1.36 persons per household.
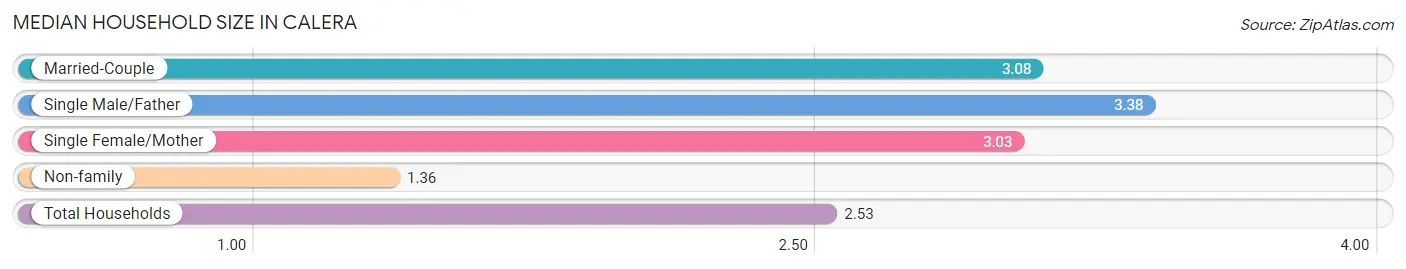
| Household Type | # Households | Household Size |
| Married-Couple | 393 (35.1%) | 3.08 |
| Single Male/Father | 126 (11.2%) | 3.38 |
| Single Female/Mother | 226 (20.2%) | 3.03 |
| Non-family | 376 (33.5%) | 1.36 |
| Total Households | 1,121 (100.0%) | 2.53 |
Household Size by Marriage Status in Calera
Out of a total of 1,121 households in Calera, 745 (66.5%) are family households, while 376 (33.5%) are nonfamily households. The most numerous type of family households are 2-person households, comprising 249, and the most common type of nonfamily households are 1-person households, comprising 294.
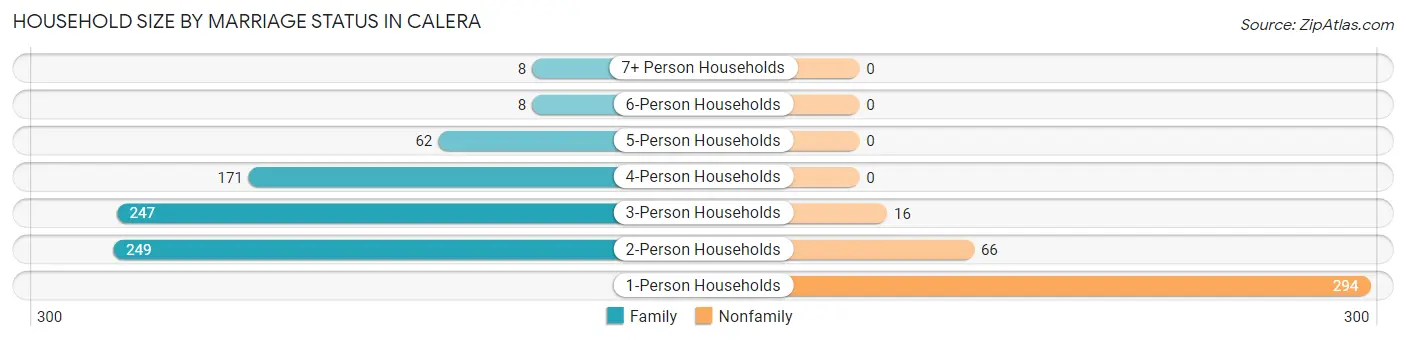
| Household Size | Family Households | Nonfamily Households |
| 1-Person Households | - | 294 (26.2%) |
| 2-Person Households | 249 (22.2%) | 66 (5.9%) |
| 3-Person Households | 247 (22.0%) | 16 (1.4%) |
| 4-Person Households | 171 (15.2%) | 0 (0.0%) |
| 5-Person Households | 62 (5.5%) | 0 (0.0%) |
| 6-Person Households | 8 (0.7%) | 0 (0.0%) |
| 7+ Person Households | 8 (0.7%) | 0 (0.0%) |
| Total | 745 (66.5%) | 376 (33.5%) |
Female Fertility in Calera
Fertility by Age in Calera
Average fertility rate in Calera is 81.0 births per 1,000 women. Women in the age bracket of 20 to 34 years have the highest fertility rate with 141.0 births per 1,000 women. Women in the age bracket of 20 to 34 years acount for 92.4% of all women with births.
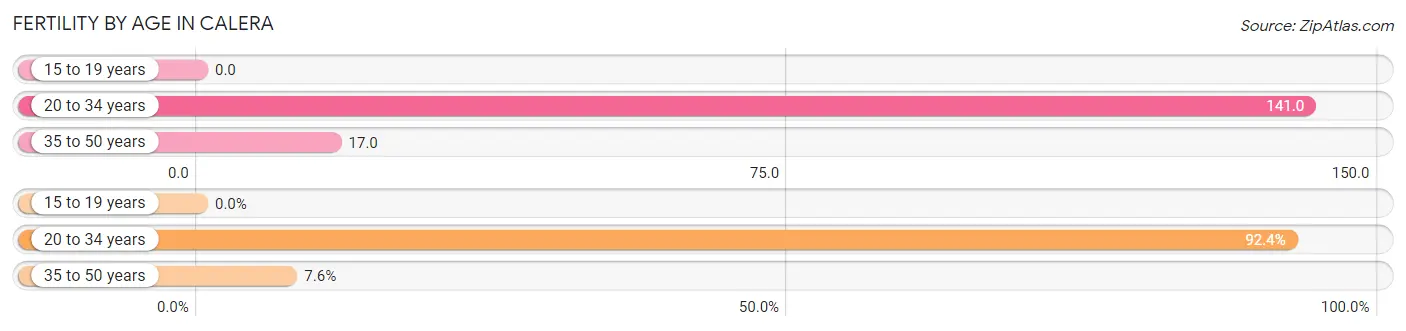
| Age Bracket | Women with Births | Births / 1,000 Women |
| 15 to 19 years | 0 (0.0%) | 0.0 |
| 20 to 34 years | 61 (92.4%) | 141.0 |
| 35 to 50 years | 5 (7.6%) | 17.0 |
| Total | 66 (100.0%) | 81.0 |
Fertility by Age by Marriage Status in Calera
24.2% of women with births (66) in Calera are married. The highest percentage of unmarried women with births falls into 35 to 50 years age bracket with 100.0% of them unmarried at the time of birth, while the lowest percentage of unmarried women with births belong to 20 to 34 years age bracket with 73.8% of them unmarried.
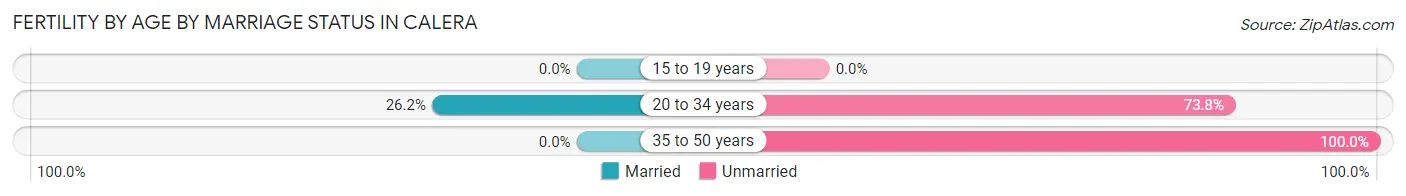
| Age Bracket | Married | Unmarried |
| 15 to 19 years | 0 (0.0%) | 0 (0.0%) |
| 20 to 34 years | 16 (26.2%) | 45 (73.8%) |
| 35 to 50 years | 0 (0.0%) | 5 (100.0%) |
| Total | 16 (24.2%) | 50 (75.8%) |
Fertility by Education in Calera
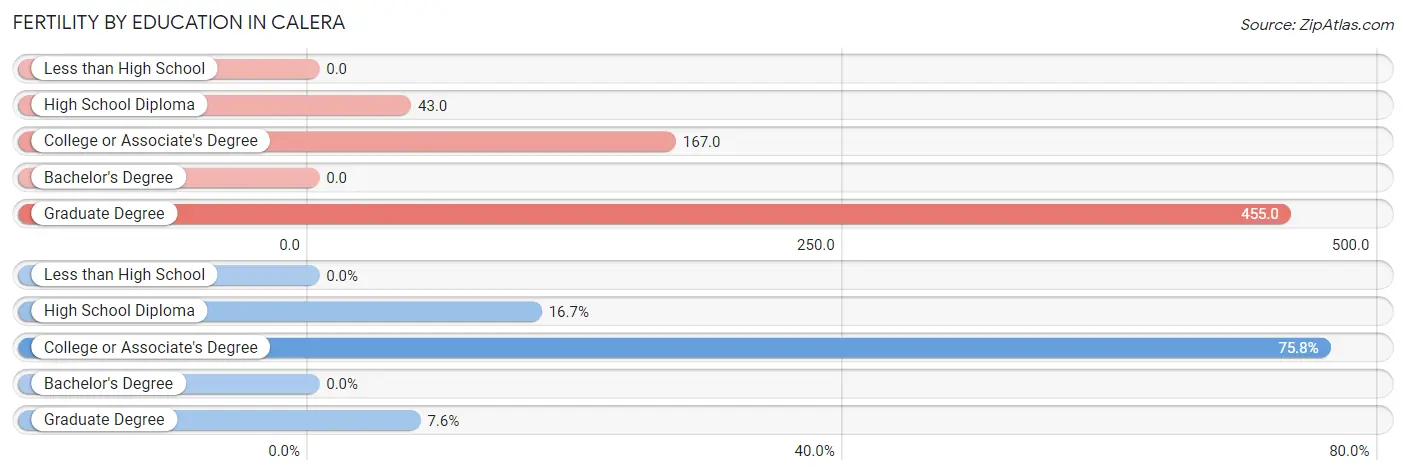
| Educational Attainment | Women with Births | Births / 1,000 Women |
| Less than High School | 0 (0.0%) | 0.0 |
| High School Diploma | 11 (16.7%) | 43.0 |
| College or Associate's Degree | 50 (75.8%) | 167.0 |
| Bachelor's Degree | 0 (0.0%) | 0.0 |
| Graduate Degree | 5 (7.6%) | 455.0 |
| Total | 66 (100.0%) | 81.0 |
Fertility by Education by Marriage Status in Calera
75.8% of women with births in Calera are unmarried. Women with the educational attainment of high school diploma are most likely to be married with 63.6% of them married at childbirth, while women with the educational attainment of graduate degree are least likely to be married with 100.0% of them unmarried at childbirth.
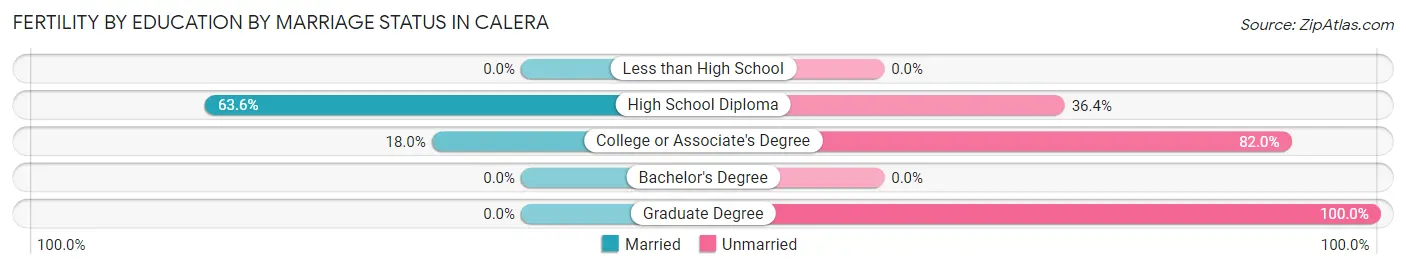
| Educational Attainment | Married | Unmarried |
| Less than High School | 0 (0.0%) | 0 (0.0%) |
| High School Diploma | 7 (63.6%) | 4 (36.4%) |
| College or Associate's Degree | 9 (18.0%) | 41 (82.0%) |
| Bachelor's Degree | 0 (0.0%) | 0 (0.0%) |
| Graduate Degree | 0 (0.0%) | 5 (100.0%) |
| Total | 16 (24.2%) | 50 (75.8%) |
Employment Characteristics in Calera
Employment by Class of Employer in Calera
Among the 1,374 employed individuals in Calera, private company employees (935 | 68.0%), federal government employees (121 | 8.8%), and state government employees (111 | 8.1%) make up the most common classes of employment.
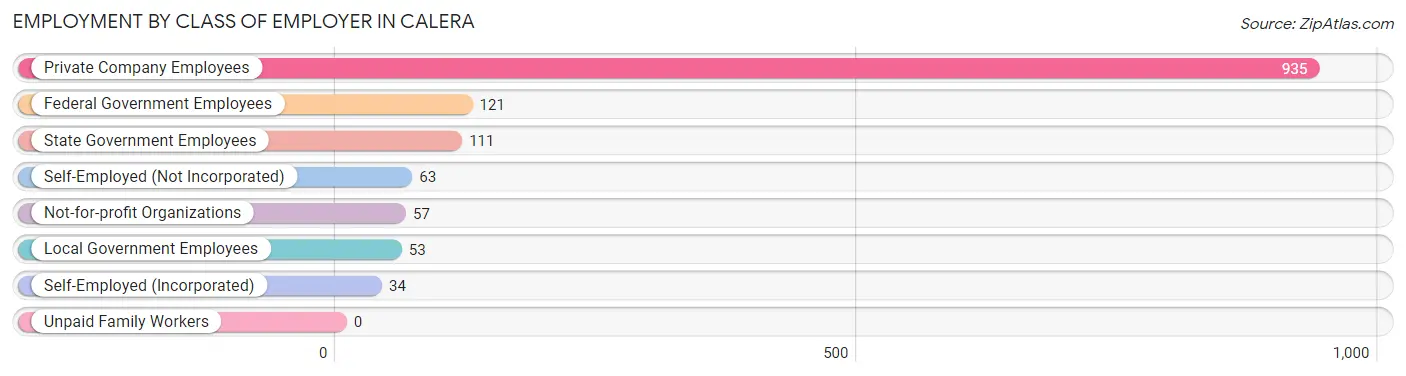
| Employer Class | # Employees | % Employees |
| Private Company Employees | 935 | 68.0% |
| Self-Employed (Incorporated) | 34 | 2.5% |
| Self-Employed (Not Incorporated) | 63 | 4.6% |
| Not-for-profit Organizations | 57 | 4.2% |
| Local Government Employees | 53 | 3.9% |
| State Government Employees | 111 | 8.1% |
| Federal Government Employees | 121 | 8.8% |
| Unpaid Family Workers | 0 | 0.0% |
| Total | 1,374 | 100.0% |
Employment Status by Age in Calera
According to the labor force statistics for Calera, out of the total population over 16 years of age (2,136), 67.8% or 1,448 individuals are in the labor force, with 1.9% or 28 of them unemployed. The age group with the highest labor force participation rate is 20 to 24 years, with 96.3% or 181 individuals in the labor force. Within the labor force, the 65 to 74 years age range has the highest percentage of unemployed individuals, with 16.7% or 5 of them being unemployed.
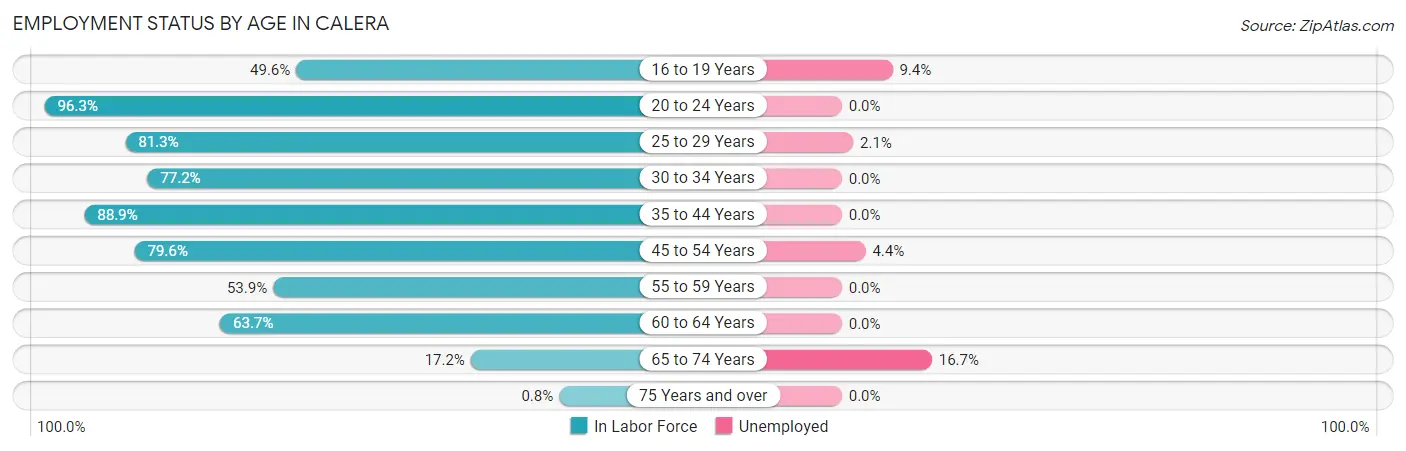
| Age Bracket | In Labor Force | Unemployed |
| 16 to 19 Years | 64 (49.6%) | 6 (9.4%) |
| 20 to 24 Years | 181 (96.3%) | 0 (0.0%) |
| 25 to 29 Years | 235 (81.3%) | 5 (2.1%) |
| 30 to 34 Years | 230 (77.2%) | 0 (0.0%) |
| 35 to 44 Years | 265 (88.9%) | 0 (0.0%) |
| 45 to 54 Years | 250 (79.6%) | 11 (4.4%) |
| 55 to 59 Years | 76 (53.9%) | 0 (0.0%) |
| 60 to 64 Years | 116 (63.7%) | 0 (0.0%) |
| 65 to 74 Years | 30 (17.2%) | 5 (16.7%) |
| 75 Years and over | 1 (0.8%) | 0 (0.0%) |
| Total | 1,448 (67.8%) | 28 (1.9%) |
Employment Status by Educational Attainment in Calera
According to labor force statistics for Calera, 77.0% of individuals (1,172) out of the total population between 25 and 64 years of age (1,522) are in the labor force, with 1.4% or 16 of them being unemployed. The group with the highest labor force participation rate are those with the educational attainment of college / associate degree, with 82.0% or 382 individuals in the labor force. Within the labor force, individuals with less than high school education have the highest percentage of unemployment, with 7.4% or 7 of them being unemployed.
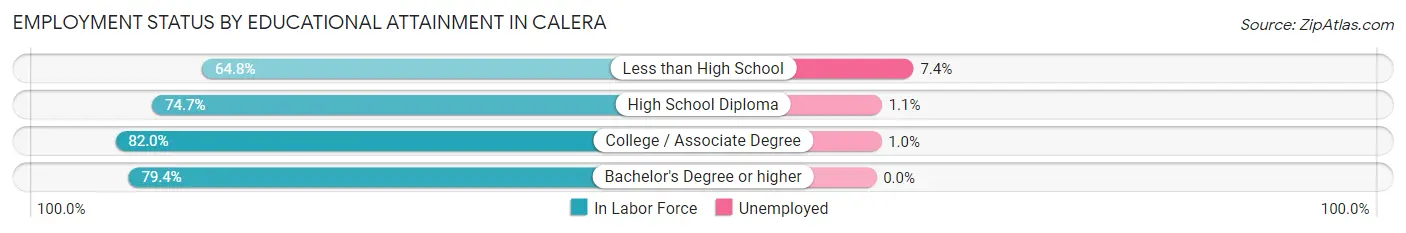
| Educational Attainment | In Labor Force | Unemployed |
| Less than High School | 94 (64.8%) | 11 (7.4%) |
| High School Diploma | 438 (74.7%) | 6 (1.1%) |
| College / Associate Degree | 382 (82.0%) | 5 (1.0%) |
| Bachelor's Degree or higher | 258 (79.4%) | 0 (0.0%) |
| Total | 1,172 (77.0%) | 21 (1.4%) |
Employment Occupations by Sex in Calera
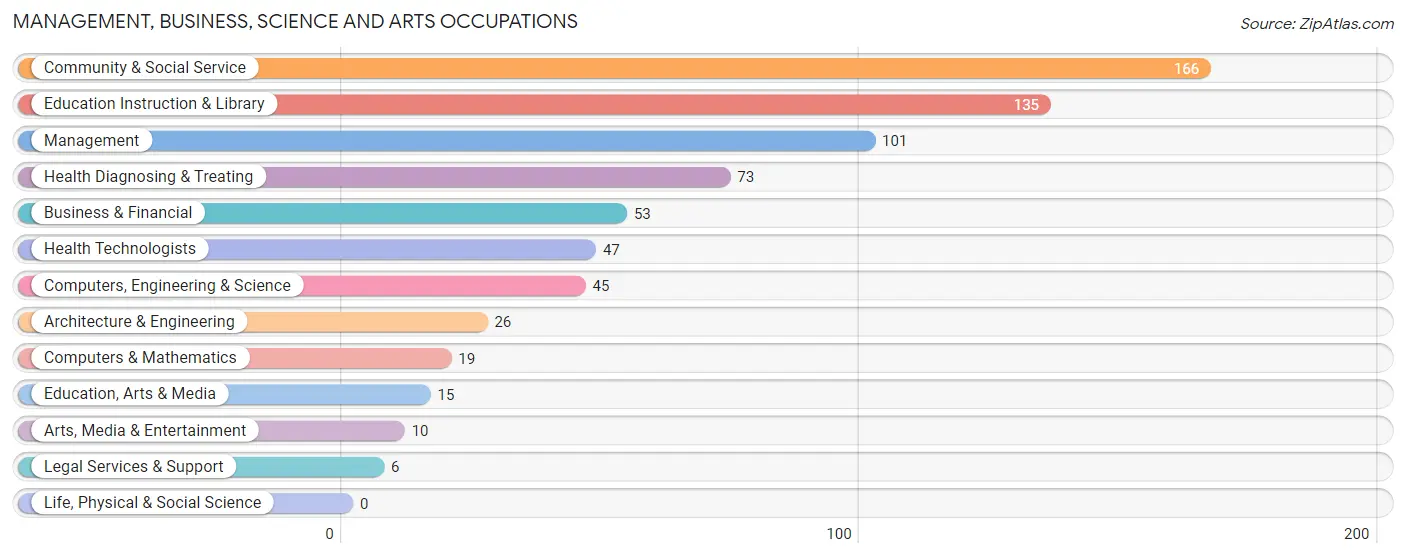
Management, Business, Science and Arts Occupations
The most common Management, Business, Science and Arts occupations in Calera are Community & Social Service (166 | 11.7%), Education Instruction & Library (135 | 9.5%), Management (101 | 7.1%), Health Diagnosing & Treating (73 | 5.1%), and Business & Financial (53 | 3.7%).
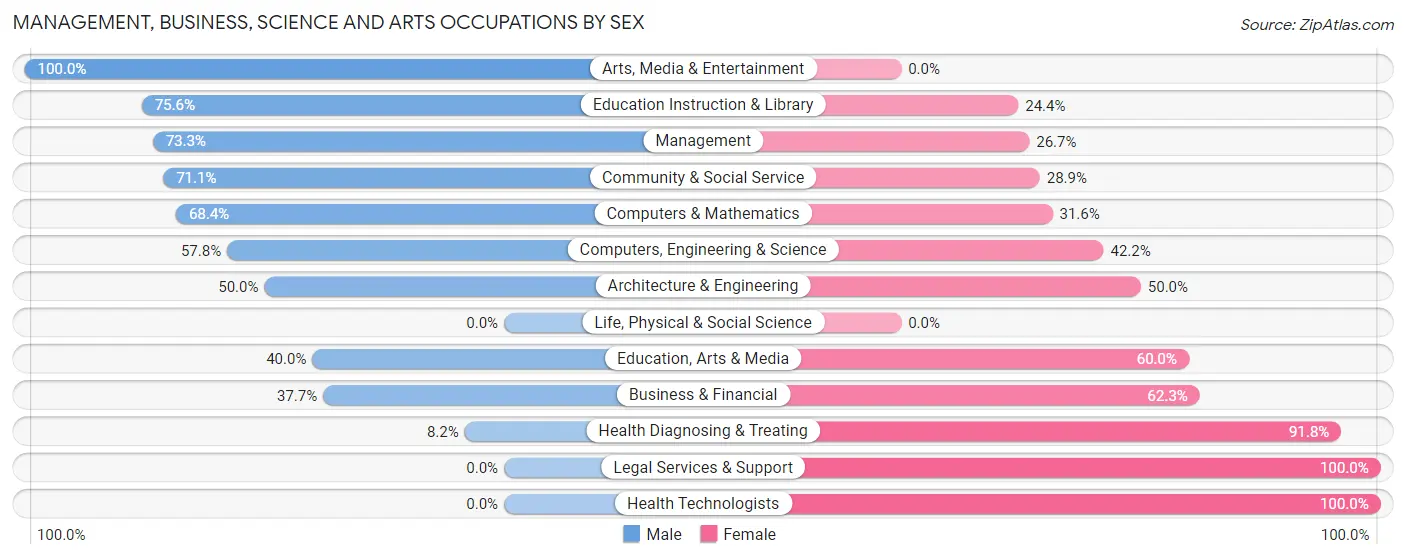
Management, Business, Science and Arts Occupations by Sex
Within the Management, Business, Science and Arts occupations in Calera, the most male-oriented occupations are Arts, Media & Entertainment (100.0%), Education Instruction & Library (75.6%), and Management (73.3%), while the most female-oriented occupations are Legal Services & Support (100.0%), Health Technologists (100.0%), and Health Diagnosing & Treating (91.8%).
| Occupation | Male | Female |
| Management | 74 (73.3%) | 27 (26.7%) |
| Business & Financial | 20 (37.7%) | 33 (62.3%) |
| Computers, Engineering & Science | 26 (57.8%) | 19 (42.2%) |
| Computers & Mathematics | 13 (68.4%) | 6 (31.6%) |
| Architecture & Engineering | 13 (50.0%) | 13 (50.0%) |
| Life, Physical & Social Science | 0 (0.0%) | 0 (0.0%) |
| Community & Social Service | 118 (71.1%) | 48 (28.9%) |
| Education, Arts & Media | 6 (40.0%) | 9 (60.0%) |
| Legal Services & Support | 0 (0.0%) | 6 (100.0%) |
| Education Instruction & Library | 102 (75.6%) | 33 (24.4%) |
| Arts, Media & Entertainment | 10 (100.0%) | 0 (0.0%) |
| Health Diagnosing & Treating | 6 (8.2%) | 67 (91.8%) |
| Health Technologists | 0 (0.0%) | 47 (100.0%) |
| Total (Category) | 244 (55.7%) | 194 (44.3%) |
| Total (Overall) | 722 (50.8%) | 699 (49.2%) |
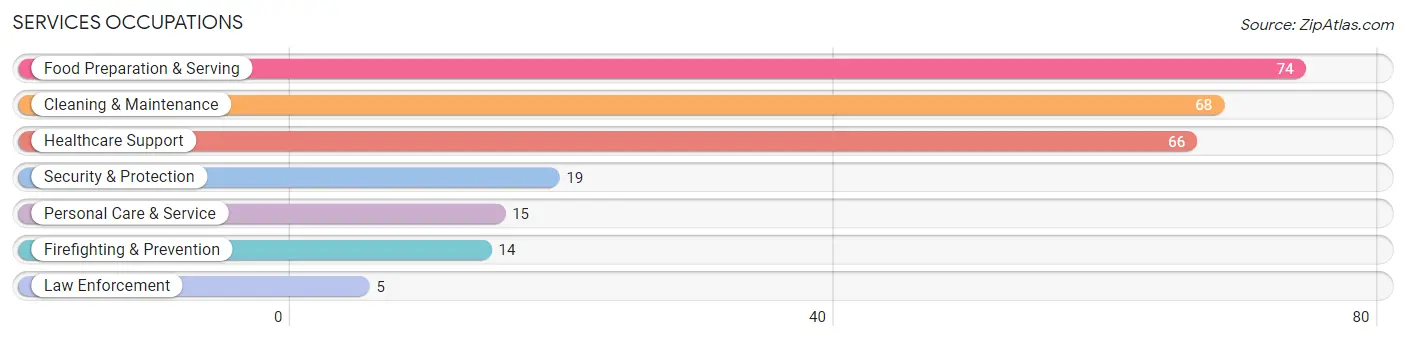
Services Occupations
The most common Services occupations in Calera are Food Preparation & Serving (74 | 5.2%), Cleaning & Maintenance (68 | 4.8%), Healthcare Support (66 | 4.6%), Security & Protection (19 | 1.3%), and Personal Care & Service (15 | 1.1%).
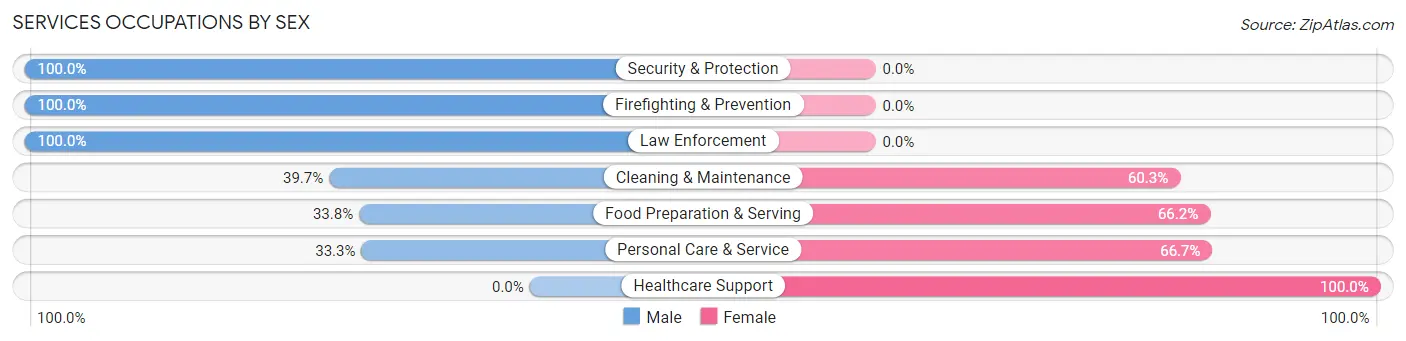
Services Occupations by Sex
Within the Services occupations in Calera, the most male-oriented occupations are Security & Protection (100.0%), Firefighting & Prevention (100.0%), and Law Enforcement (100.0%), while the most female-oriented occupations are Healthcare Support (100.0%), Personal Care & Service (66.7%), and Food Preparation & Serving (66.2%).
| Occupation | Male | Female |
| Healthcare Support | 0 (0.0%) | 66 (100.0%) |
| Security & Protection | 19 (100.0%) | 0 (0.0%) |
| Firefighting & Prevention | 14 (100.0%) | 0 (0.0%) |
| Law Enforcement | 5 (100.0%) | 0 (0.0%) |
| Food Preparation & Serving | 25 (33.8%) | 49 (66.2%) |
| Cleaning & Maintenance | 27 (39.7%) | 41 (60.3%) |
| Personal Care & Service | 5 (33.3%) | 10 (66.7%) |
| Total (Category) | 76 (31.4%) | 166 (68.6%) |
| Total (Overall) | 722 (50.8%) | 699 (49.2%) |
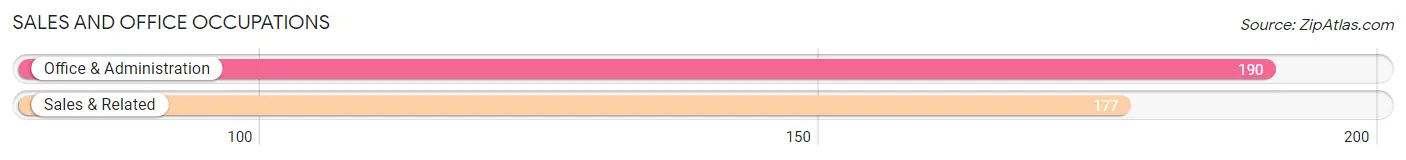
Sales and Office Occupations
The most common Sales and Office occupations in Calera are Office & Administration (190 | 13.4%), and Sales & Related (177 | 12.5%).
Sales and Office Occupations by Sex
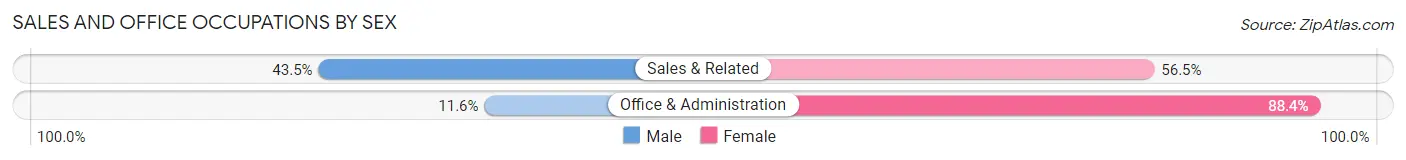
| Occupation | Male | Female |
| Sales & Related | 77 (43.5%) | 100 (56.5%) |
| Office & Administration | 22 (11.6%) | 168 (88.4%) |
| Total (Category) | 99 (27.0%) | 268 (73.0%) |
| Total (Overall) | 722 (50.8%) | 699 (49.2%) |
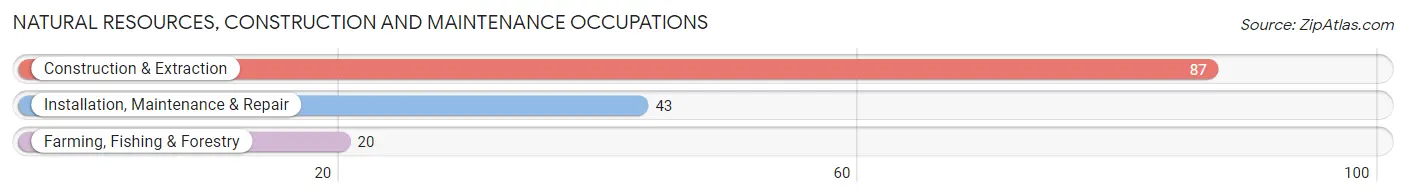
Natural Resources, Construction and Maintenance Occupations
The most common Natural Resources, Construction and Maintenance occupations in Calera are Construction & Extraction (87 | 6.1%), Installation, Maintenance & Repair (43 | 3.0%), and Farming, Fishing & Forestry (20 | 1.4%).
Natural Resources, Construction and Maintenance Occupations by Sex
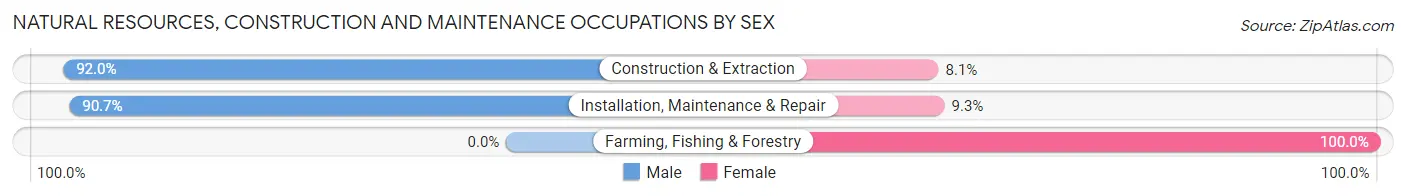
| Occupation | Male | Female |
| Farming, Fishing & Forestry | 0 (0.0%) | 20 (100.0%) |
| Construction & Extraction | 80 (91.9%) | 7 (8.1%) |
| Installation, Maintenance & Repair | 39 (90.7%) | 4 (9.3%) |
| Total (Category) | 119 (79.3%) | 31 (20.7%) |
| Total (Overall) | 722 (50.8%) | 699 (49.2%) |
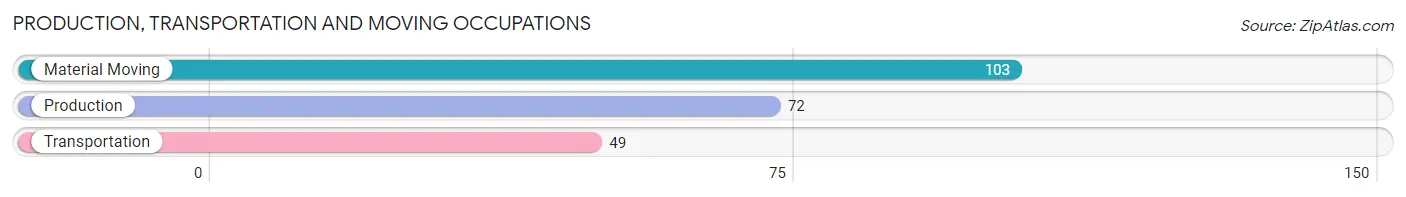
Production, Transportation and Moving Occupations
The most common Production, Transportation and Moving occupations in Calera are Material Moving (103 | 7.2%), Production (72 | 5.1%), and Transportation (49 | 3.5%).
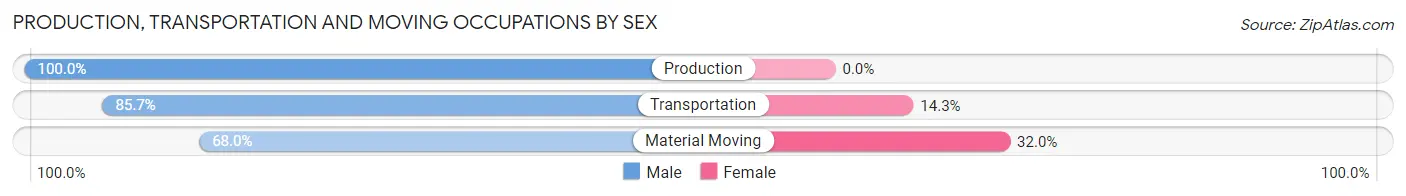
Production, Transportation and Moving Occupations by Sex
| Occupation | Male | Female |
| Production | 72 (100.0%) | 0 (0.0%) |
| Transportation | 42 (85.7%) | 7 (14.3%) |
| Material Moving | 70 (68.0%) | 33 (32.0%) |
| Total (Category) | 184 (82.1%) | 40 (17.9%) |
| Total (Overall) | 722 (50.8%) | 699 (49.2%) |
Employment Industries by Sex in Calera
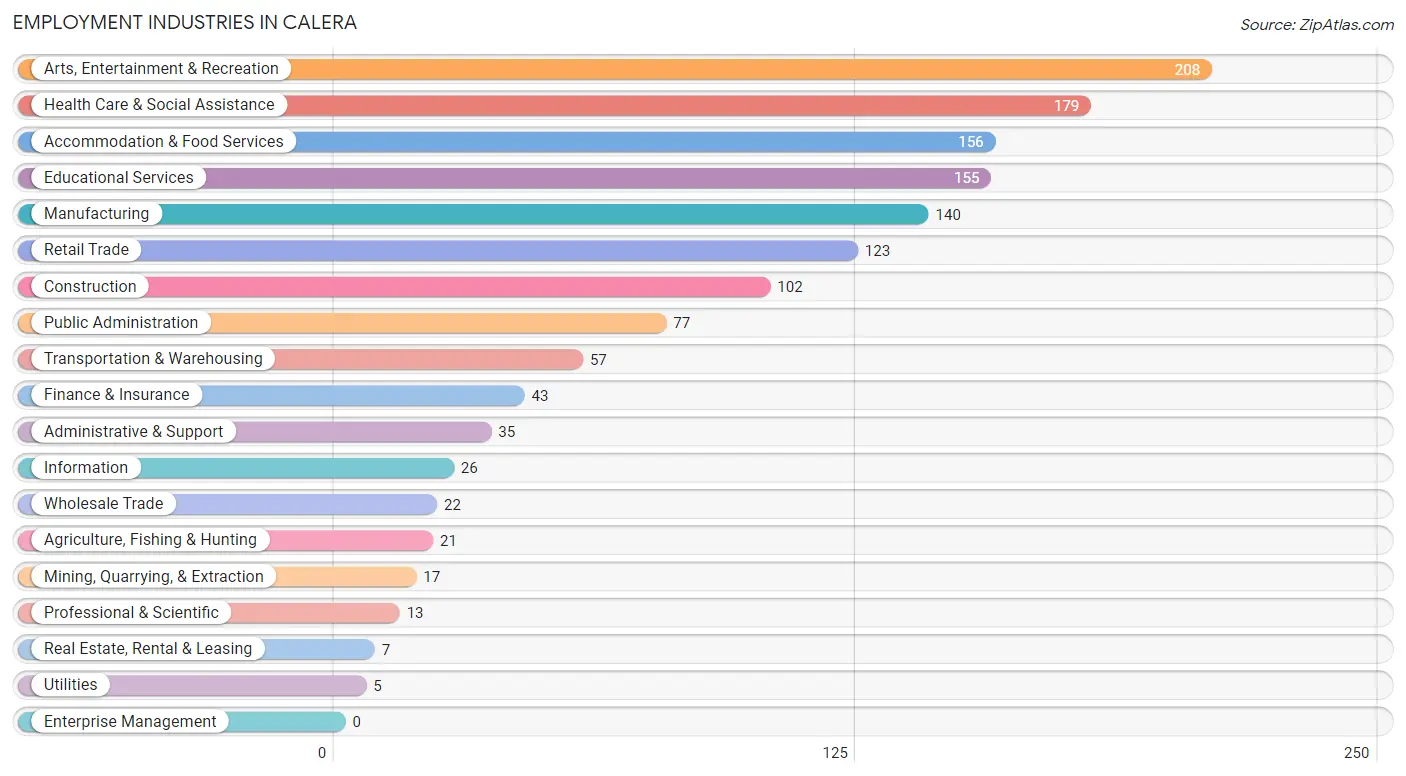
Employment Industries in Calera
The major employment industries in Calera include Arts, Entertainment & Recreation (208 | 14.6%), Health Care & Social Assistance (179 | 12.6%), Accommodation & Food Services (156 | 11.0%), Educational Services (155 | 10.9%), and Manufacturing (140 | 9.9%).
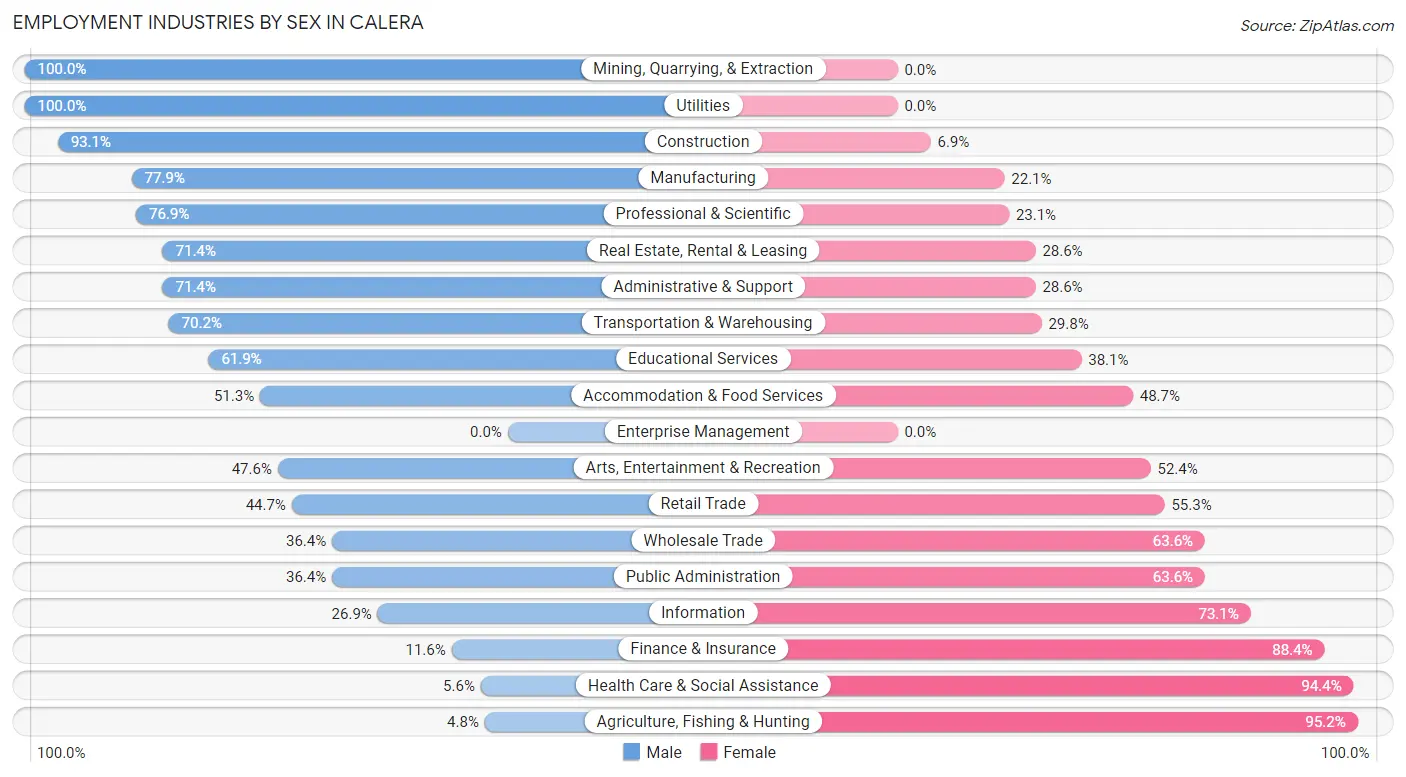
Employment Industries by Sex in Calera
The Calera industries that see more men than women are Mining, Quarrying, & Extraction (100.0%), Utilities (100.0%), and Construction (93.1%), whereas the industries that tend to have a higher number of women are Agriculture, Fishing & Hunting (95.2%), Health Care & Social Assistance (94.4%), and Finance & Insurance (88.4%).
| Industry | Male | Female |
| Agriculture, Fishing & Hunting | 1 (4.8%) | 20 (95.2%) |
| Mining, Quarrying, & Extraction | 17 (100.0%) | 0 (0.0%) |
| Construction | 95 (93.1%) | 7 (6.9%) |
| Manufacturing | 109 (77.9%) | 31 (22.1%) |
| Wholesale Trade | 8 (36.4%) | 14 (63.6%) |
| Retail Trade | 55 (44.7%) | 68 (55.3%) |
| Transportation & Warehousing | 40 (70.2%) | 17 (29.8%) |
| Utilities | 5 (100.0%) | 0 (0.0%) |
| Information | 7 (26.9%) | 19 (73.1%) |
| Finance & Insurance | 5 (11.6%) | 38 (88.4%) |
| Real Estate, Rental & Leasing | 5 (71.4%) | 2 (28.6%) |
| Professional & Scientific | 10 (76.9%) | 3 (23.1%) |
| Enterprise Management | 0 (0.0%) | 0 (0.0%) |
| Administrative & Support | 25 (71.4%) | 10 (28.6%) |
| Educational Services | 96 (61.9%) | 59 (38.1%) |
| Health Care & Social Assistance | 10 (5.6%) | 169 (94.4%) |
| Arts, Entertainment & Recreation | 99 (47.6%) | 109 (52.4%) |
| Accommodation & Food Services | 80 (51.3%) | 76 (48.7%) |
| Public Administration | 28 (36.4%) | 49 (63.6%) |
| Total | 722 (50.8%) | 699 (49.2%) |
Education in Calera
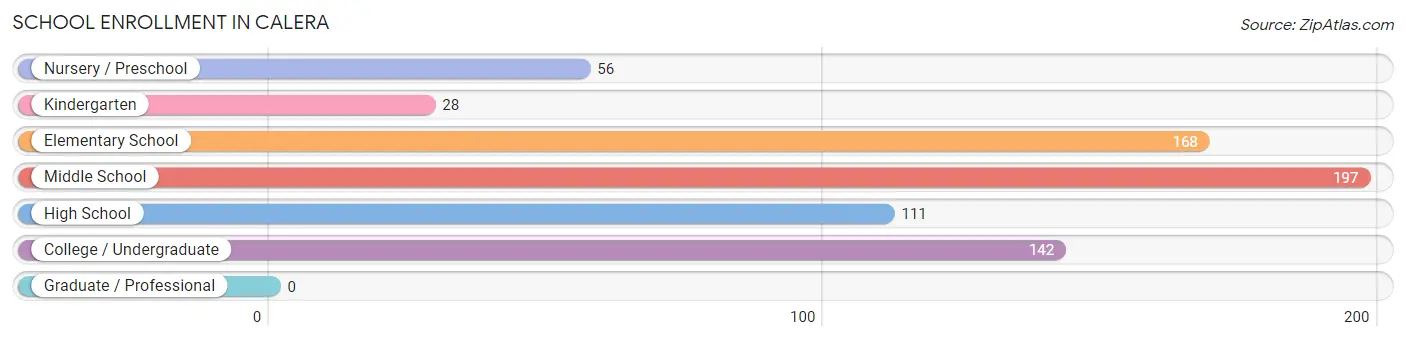
School Enrollment in Calera
The most common levels of schooling among the 702 students in Calera are middle school (197 | 28.1%), elementary school (168 | 23.9%), and college / undergraduate (142 | 20.2%).
| School Level | # Students | % Students |
| Nursery / Preschool | 56 | 8.0% |
| Kindergarten | 28 | 4.0% |
| Elementary School | 168 | 23.9% |
| Middle School | 197 | 28.1% |
| High School | 111 | 15.8% |
| College / Undergraduate | 142 | 20.2% |
| Graduate / Professional | 0 | 0.0% |
| Total | 702 | 100.0% |
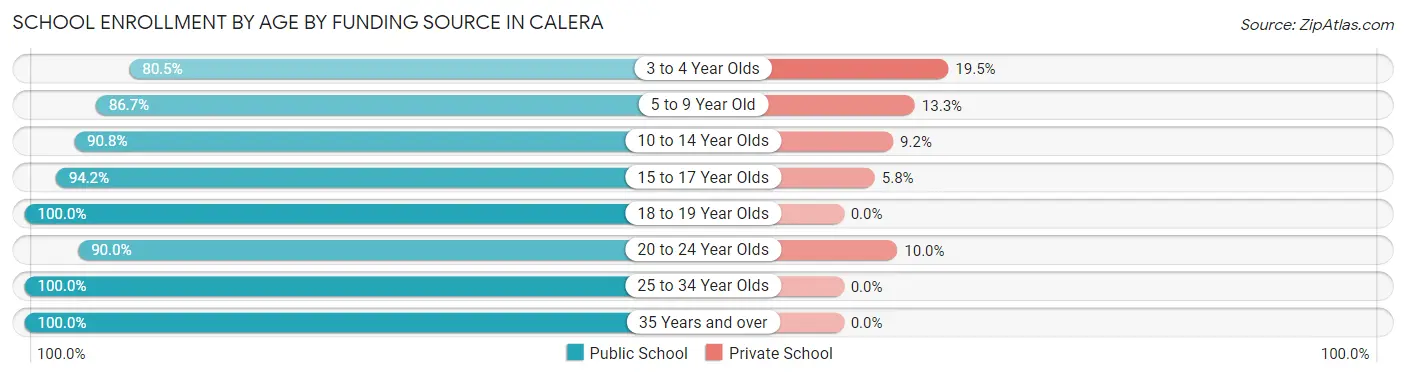
School Enrollment by Age by Funding Source in Calera
Out of a total of 702 students who are enrolled in schools in Calera, 63 (9.0%) attend a private institution, while the remaining 639 (91.0%) are enrolled in public schools. The age group of 3 to 4 year olds has the highest likelihood of being enrolled in private schools, with 8 (19.5% in the age bracket) enrolled. Conversely, the age group of 18 to 19 year olds has the lowest likelihood of being enrolled in a private school, with 55 (100.0% in the age bracket) attending a public institution.
| Age Bracket | Public School | Private School |
| 3 to 4 Year Olds | 33 (80.5%) | 8 (19.5%) |
| 5 to 9 Year Old | 170 (86.7%) | 26 (13.3%) |
| 10 to 14 Year Olds | 197 (90.8%) | 20 (9.2%) |
| 15 to 17 Year Olds | 81 (94.2%) | 5 (5.8%) |
| 18 to 19 Year Olds | 55 (100.0%) | 0 (0.0%) |
| 20 to 24 Year Olds | 36 (90.0%) | 4 (10.0%) |
| 25 to 34 Year Olds | 26 (100.0%) | 0 (0.0%) |
| 35 Years and over | 41 (100.0%) | 0 (0.0%) |
| Total | 639 (91.0%) | 63 (9.0%) |
Educational Attainment by Field of Study in Calera
Education (118 | 31.4%), science & technology (71 | 18.9%), arts & humanities (51 | 13.6%), business (40 | 10.6%), and visual & performing arts (23 | 6.1%) are the most common fields of study among 376 individuals in Calera who have obtained a bachelor's degree or higher.
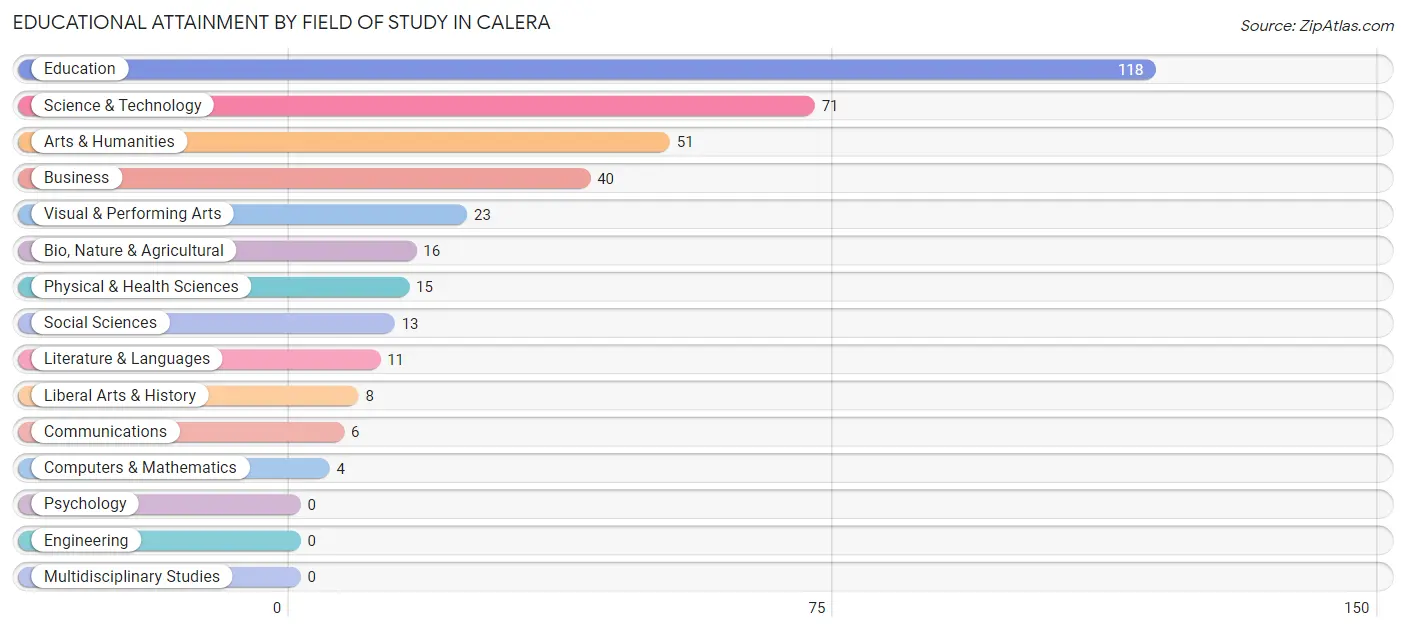
| Field of Study | # Graduates | % Graduates |
| Computers & Mathematics | 4 | 1.1% |
| Bio, Nature & Agricultural | 16 | 4.3% |
| Physical & Health Sciences | 15 | 4.0% |
| Psychology | 0 | 0.0% |
| Social Sciences | 13 | 3.5% |
| Engineering | 0 | 0.0% |
| Multidisciplinary Studies | 0 | 0.0% |
| Science & Technology | 71 | 18.9% |
| Business | 40 | 10.6% |
| Education | 118 | 31.4% |
| Literature & Languages | 11 | 2.9% |
| Liberal Arts & History | 8 | 2.1% |
| Visual & Performing Arts | 23 | 6.1% |
| Communications | 6 | 1.6% |
| Arts & Humanities | 51 | 13.6% |
| Total | 376 | 100.0% |
Transportation & Commute in Calera
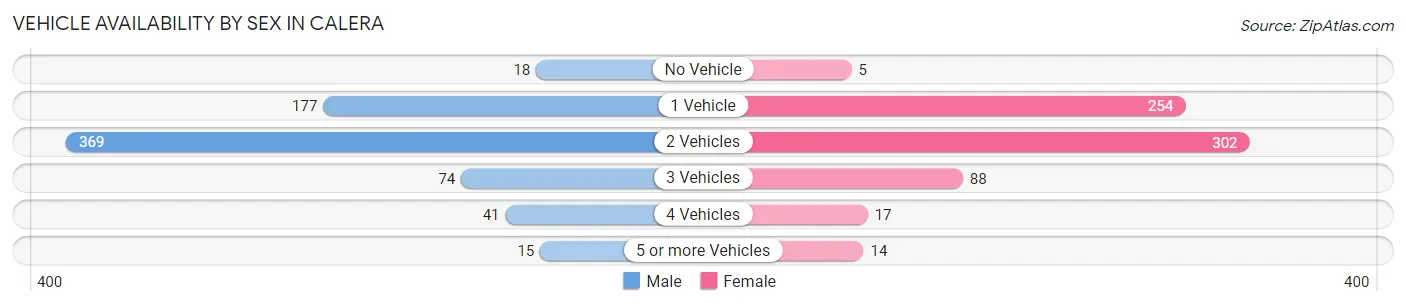
Vehicle Availability by Sex in Calera
The most prevalent vehicle ownership categories in Calera are males with 2 vehicles (369, accounting for 53.2%) and females with 2 vehicles (302, making up 54.3%).
| Vehicles Available | Male | Female |
| No Vehicle | 18 (2.6%) | 5 (0.7%) |
| 1 Vehicle | 177 (25.5%) | 254 (37.3%) |
| 2 Vehicles | 369 (53.2%) | 302 (44.4%) |
| 3 Vehicles | 74 (10.7%) | 88 (12.9%) |
| 4 Vehicles | 41 (5.9%) | 17 (2.5%) |
| 5 or more Vehicles | 15 (2.2%) | 14 (2.1%) |
| Total | 694 (100.0%) | 680 (100.0%) |
Commute Time in Calera
The most frequently occuring commute durations in Calera are 10 to 14 minutes (355 commuters, 26.9%), 5 to 9 minutes (300 commuters, 22.7%), and 15 to 19 minutes (281 commuters, 21.3%).
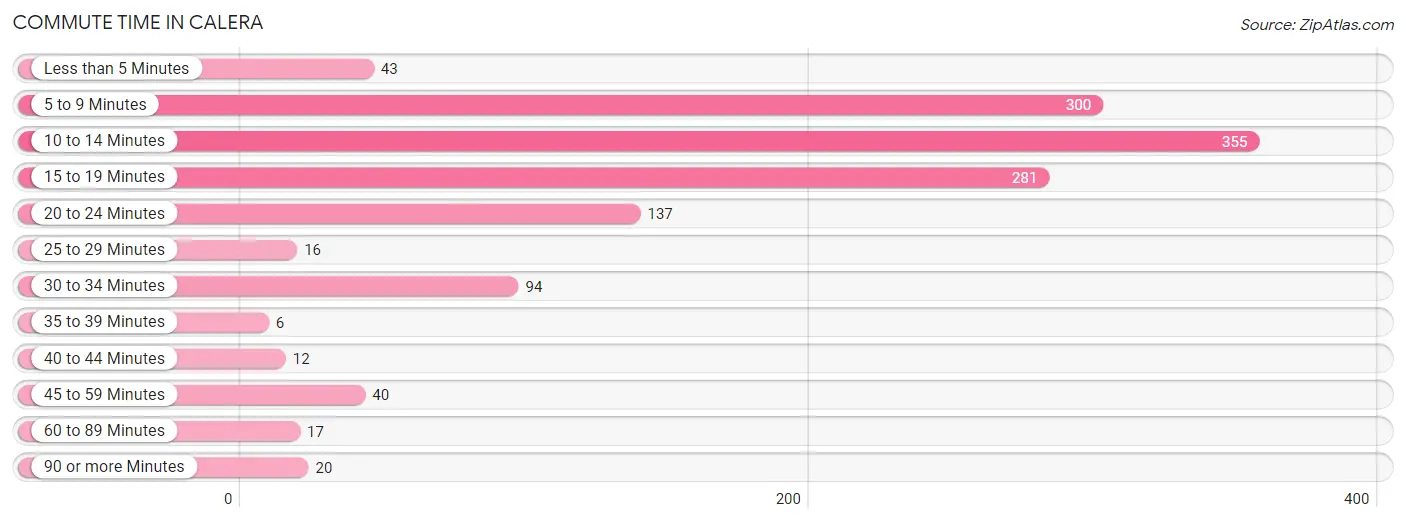
| Commute Time | # Commuters | % Commuters |
| Less than 5 Minutes | 43 | 3.3% |
| 5 to 9 Minutes | 300 | 22.7% |
| 10 to 14 Minutes | 355 | 26.9% |
| 15 to 19 Minutes | 281 | 21.3% |
| 20 to 24 Minutes | 137 | 10.4% |
| 25 to 29 Minutes | 16 | 1.2% |
| 30 to 34 Minutes | 94 | 7.1% |
| 35 to 39 Minutes | 6 | 0.4% |
| 40 to 44 Minutes | 12 | 0.9% |
| 45 to 59 Minutes | 40 | 3.0% |
| 60 to 89 Minutes | 17 | 1.3% |
| 90 or more Minutes | 20 | 1.5% |
Commute Time by Sex in Calera
The most common commute times in Calera are 10 to 14 minutes (164 commuters, 24.8%) for males and 10 to 14 minutes (191 commuters, 28.9%) for females.
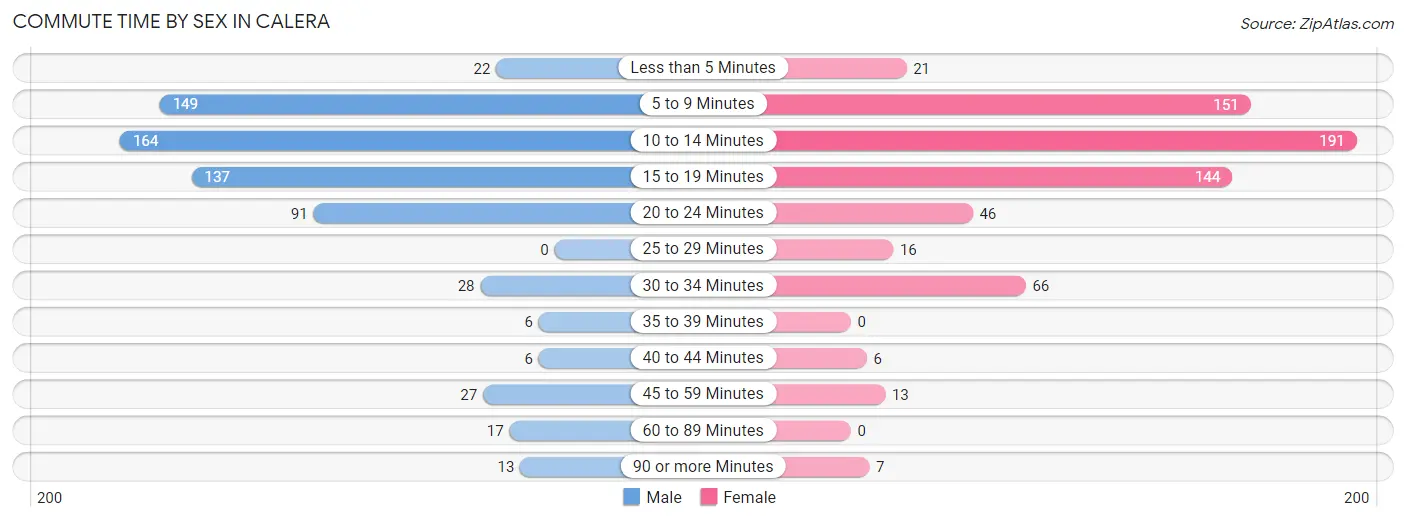
| Commute Time | Male | Female |
| Less than 5 Minutes | 22 (3.3%) | 21 (3.2%) |
| 5 to 9 Minutes | 149 (22.6%) | 151 (22.8%) |
| 10 to 14 Minutes | 164 (24.8%) | 191 (28.9%) |
| 15 to 19 Minutes | 137 (20.8%) | 144 (21.8%) |
| 20 to 24 Minutes | 91 (13.8%) | 46 (7.0%) |
| 25 to 29 Minutes | 0 (0.0%) | 16 (2.4%) |
| 30 to 34 Minutes | 28 (4.2%) | 66 (10.0%) |
| 35 to 39 Minutes | 6 (0.9%) | 0 (0.0%) |
| 40 to 44 Minutes | 6 (0.9%) | 6 (0.9%) |
| 45 to 59 Minutes | 27 (4.1%) | 13 (2.0%) |
| 60 to 89 Minutes | 17 (2.6%) | 0 (0.0%) |
| 90 or more Minutes | 13 (2.0%) | 7 (1.1%) |
Time of Departure to Work by Sex in Calera
The most frequent times of departure to work in Calera are 4:00 PM to 11:59 PM (115, 17.4%) for males and 7:30 AM to 7:59 AM (108, 16.3%) for females.
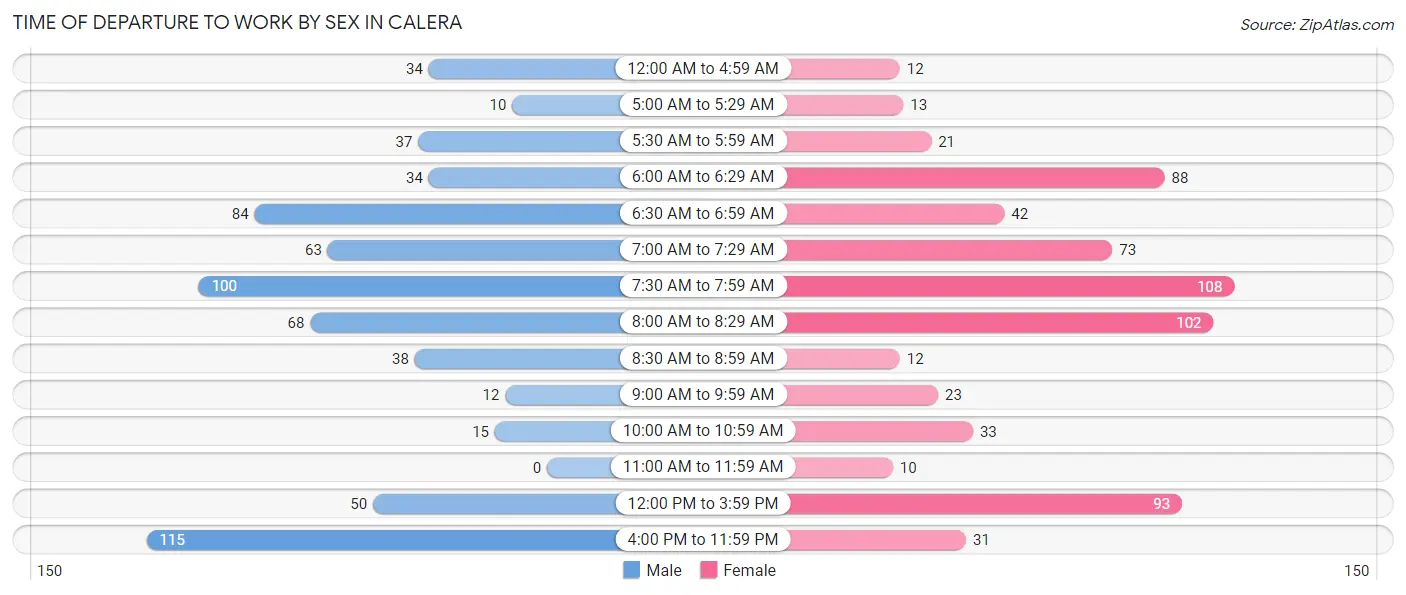
| Time of Departure | Male | Female |
| 12:00 AM to 4:59 AM | 34 (5.1%) | 12 (1.8%) |
| 5:00 AM to 5:29 AM | 10 (1.5%) | 13 (2.0%) |
| 5:30 AM to 5:59 AM | 37 (5.6%) | 21 (3.2%) |
| 6:00 AM to 6:29 AM | 34 (5.1%) | 88 (13.3%) |
| 6:30 AM to 6:59 AM | 84 (12.7%) | 42 (6.4%) |
| 7:00 AM to 7:29 AM | 63 (9.6%) | 73 (11.0%) |
| 7:30 AM to 7:59 AM | 100 (15.1%) | 108 (16.3%) |
| 8:00 AM to 8:29 AM | 68 (10.3%) | 102 (15.4%) |
| 8:30 AM to 8:59 AM | 38 (5.8%) | 12 (1.8%) |
| 9:00 AM to 9:59 AM | 12 (1.8%) | 23 (3.5%) |
| 10:00 AM to 10:59 AM | 15 (2.3%) | 33 (5.0%) |
| 11:00 AM to 11:59 AM | 0 (0.0%) | 10 (1.5%) |
| 12:00 PM to 3:59 PM | 50 (7.6%) | 93 (14.1%) |
| 4:00 PM to 11:59 PM | 115 (17.4%) | 31 (4.7%) |
| Total | 660 (100.0%) | 661 (100.0%) |
Housing Occupancy in Calera
Occupancy by Ownership in Calera
Of the total 1,121 dwellings in Calera, owner-occupied units account for 546 (48.7%), while renter-occupied units make up 575 (51.3%).
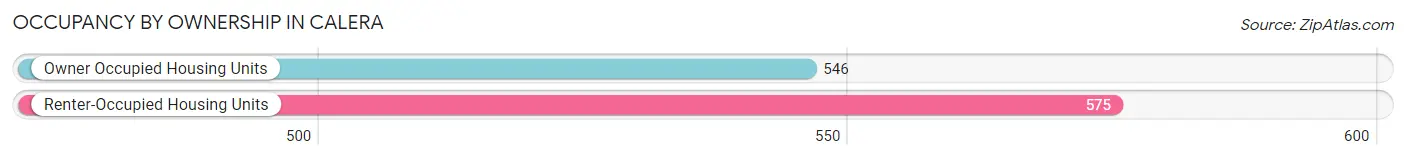
| Occupancy | # Housing Units | % Housing Units |
| Owner Occupied Housing Units | 546 | 48.7% |
| Renter-Occupied Housing Units | 575 | 51.3% |
| Total Occupied Housing Units | 1,121 | 100.0% |
Occupancy by Household Size in Calera
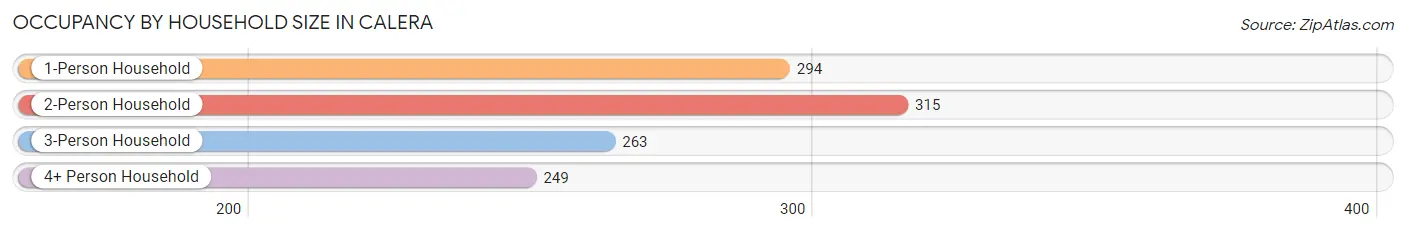
| Household Size | # Housing Units | % Housing Units |
| 1-Person Household | 294 | 26.2% |
| 2-Person Household | 315 | 28.1% |
| 3-Person Household | 263 | 23.5% |
| 4+ Person Household | 249 | 22.2% |
| Total Housing Units | 1,121 | 100.0% |
Occupancy by Ownership by Household Size in Calera
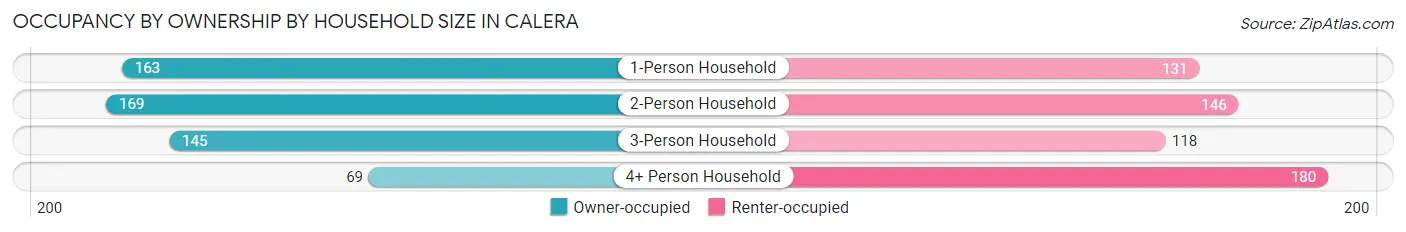
| Household Size | Owner-occupied | Renter-occupied |
| 1-Person Household | 163 (55.4%) | 131 (44.6%) |
| 2-Person Household | 169 (53.6%) | 146 (46.4%) |
| 3-Person Household | 145 (55.1%) | 118 (44.9%) |
| 4+ Person Household | 69 (27.7%) | 180 (72.3%) |
| Total Housing Units | 546 (48.7%) | 575 (51.3%) |
Occupancy by Educational Attainment in Calera
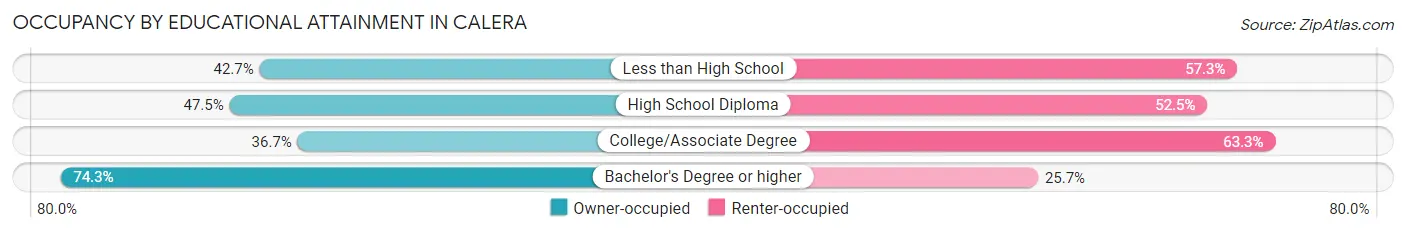
| Household Size | Owner-occupied | Renter-occupied |
| Less than High School | 47 (42.7%) | 63 (57.3%) |
| High School Diploma | 189 (47.5%) | 209 (52.5%) |
| College/Associate Degree | 142 (36.7%) | 245 (63.3%) |
| Bachelor's Degree or higher | 168 (74.3%) | 58 (25.7%) |
Occupancy by Age of Householder in Calera
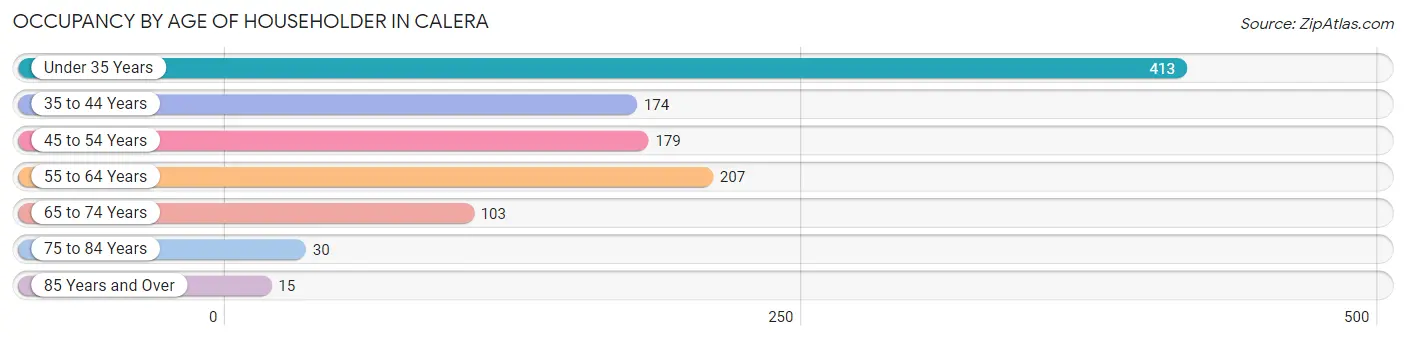
| Age Bracket | # Households | % Households |
| Under 35 Years | 413 | 36.8% |
| 35 to 44 Years | 174 | 15.5% |
| 45 to 54 Years | 179 | 16.0% |
| 55 to 64 Years | 207 | 18.5% |
| 65 to 74 Years | 103 | 9.2% |
| 75 to 84 Years | 30 | 2.7% |
| 85 Years and Over | 15 | 1.3% |
| Total | 1,121 | 100.0% |
Housing Finances in Calera
Median Income by Occupancy in Calera
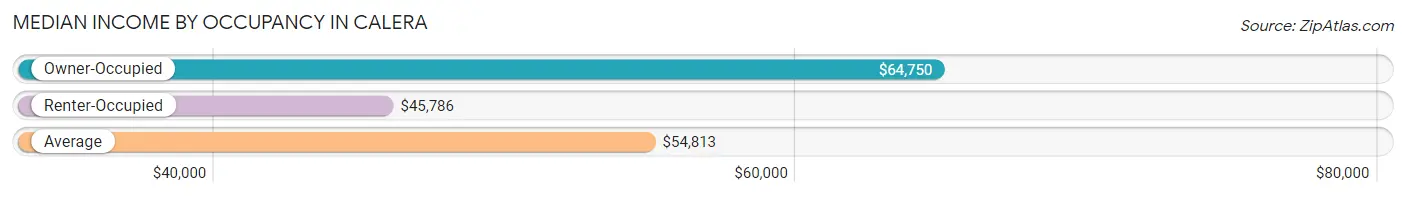
| Occupancy Type | # Households | Median Income |
| Owner-Occupied | 546 (48.7%) | $64,750 |
| Renter-Occupied | 575 (51.3%) | $45,786 |
| Average | 1,121 (100.0%) | $54,813 |
Occupancy by Householder Income Bracket in Calera
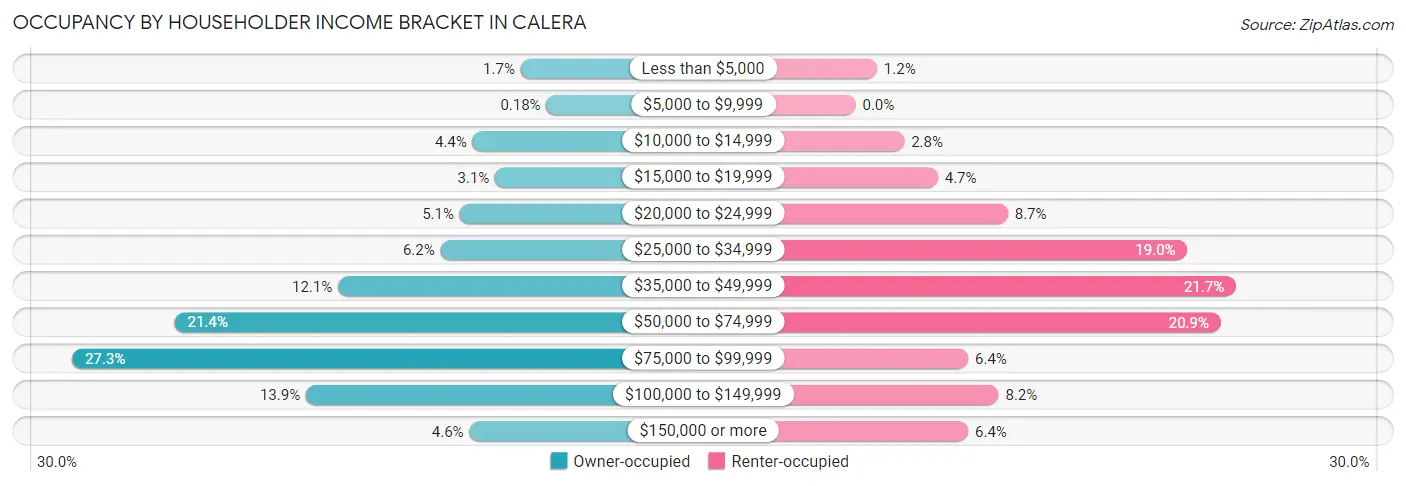
| Income Bracket | Owner-occupied | Renter-occupied |
| Less than $5,000 | 9 (1.7%) | 7 (1.2%) |
| $5,000 to $9,999 | 1 (0.2%) | 0 (0.0%) |
| $10,000 to $14,999 | 24 (4.4%) | 16 (2.8%) |
| $15,000 to $19,999 | 17 (3.1%) | 27 (4.7%) |
| $20,000 to $24,999 | 28 (5.1%) | 50 (8.7%) |
| $25,000 to $34,999 | 34 (6.2%) | 109 (19.0%) |
| $35,000 to $49,999 | 66 (12.1%) | 125 (21.7%) |
| $50,000 to $74,999 | 117 (21.4%) | 120 (20.9%) |
| $75,000 to $99,999 | 149 (27.3%) | 37 (6.4%) |
| $100,000 to $149,999 | 76 (13.9%) | 47 (8.2%) |
| $150,000 or more | 25 (4.6%) | 37 (6.4%) |
| Total | 546 (100.0%) | 575 (100.0%) |
Monthly Housing Cost Tiers in Calera
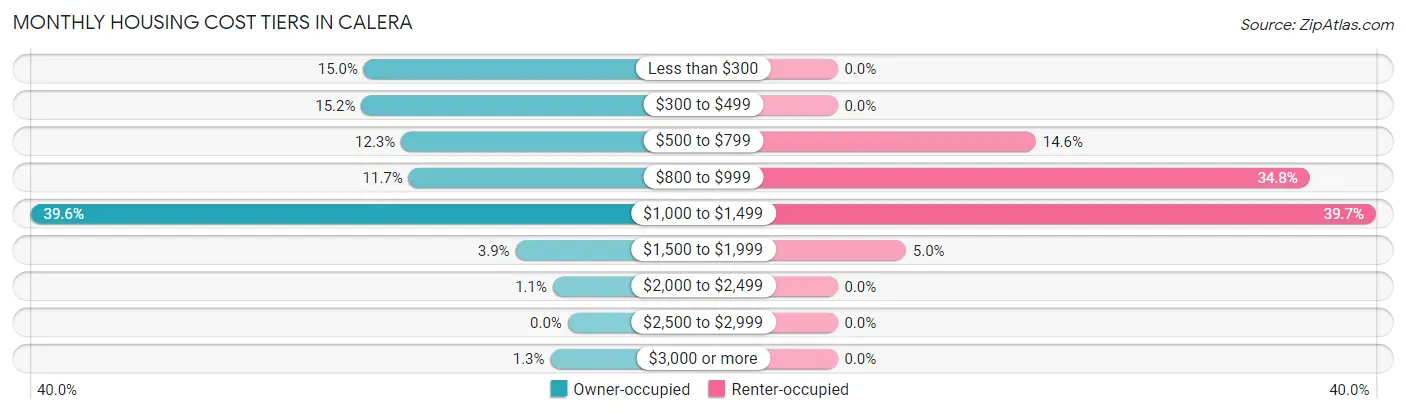
| Monthly Cost | Owner-occupied | Renter-occupied |
| Less than $300 | 82 (15.0%) | 0 (0.0%) |
| $300 to $499 | 83 (15.2%) | 0 (0.0%) |
| $500 to $799 | 67 (12.3%) | 84 (14.6%) |
| $800 to $999 | 64 (11.7%) | 200 (34.8%) |
| $1,000 to $1,499 | 216 (39.6%) | 228 (39.7%) |
| $1,500 to $1,999 | 21 (3.8%) | 29 (5.0%) |
| $2,000 to $2,499 | 6 (1.1%) | 0 (0.0%) |
| $2,500 to $2,999 | 0 (0.0%) | 0 (0.0%) |
| $3,000 or more | 7 (1.3%) | 0 (0.0%) |
| Total | 546 (100.0%) | 575 (100.0%) |
Physical Housing Characteristics in Calera
Housing Structures in Calera
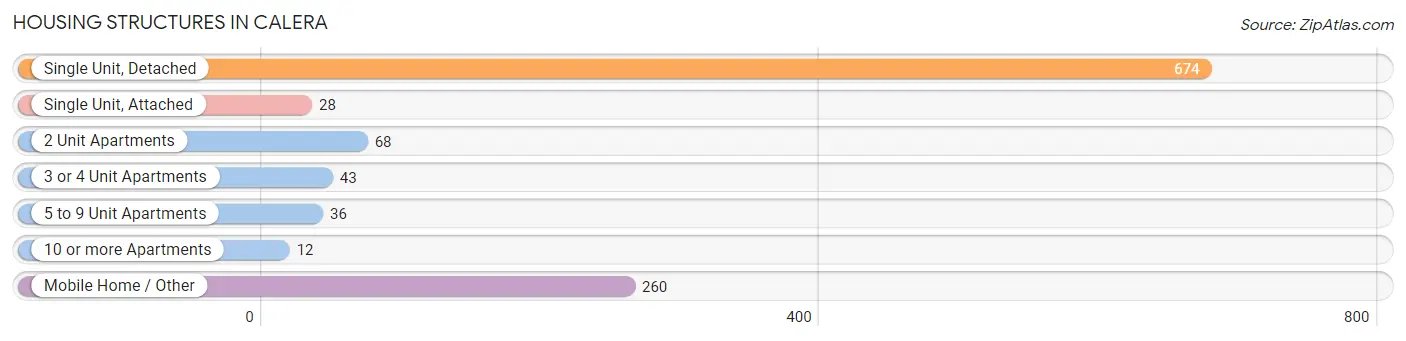
| Structure Type | # Housing Units | % Housing Units |
| Single Unit, Detached | 674 | 60.1% |
| Single Unit, Attached | 28 | 2.5% |
| 2 Unit Apartments | 68 | 6.1% |
| 3 or 4 Unit Apartments | 43 | 3.8% |
| 5 to 9 Unit Apartments | 36 | 3.2% |
| 10 or more Apartments | 12 | 1.1% |
| Mobile Home / Other | 260 | 23.2% |
| Total | 1,121 | 100.0% |
Housing Structures by Occupancy in Calera
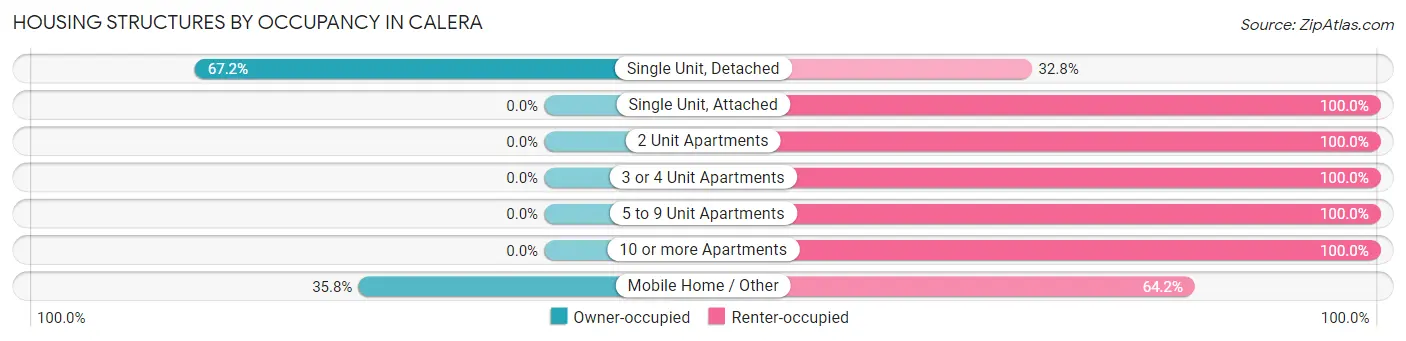
| Structure Type | Owner-occupied | Renter-occupied |
| Single Unit, Detached | 453 (67.2%) | 221 (32.8%) |
| Single Unit, Attached | 0 (0.0%) | 28 (100.0%) |
| 2 Unit Apartments | 0 (0.0%) | 68 (100.0%) |
| 3 or 4 Unit Apartments | 0 (0.0%) | 43 (100.0%) |
| 5 to 9 Unit Apartments | 0 (0.0%) | 36 (100.0%) |
| 10 or more Apartments | 0 (0.0%) | 12 (100.0%) |
| Mobile Home / Other | 93 (35.8%) | 167 (64.2%) |
| Total | 546 (48.7%) | 575 (51.3%) |
Housing Structures by Number of Rooms in Calera
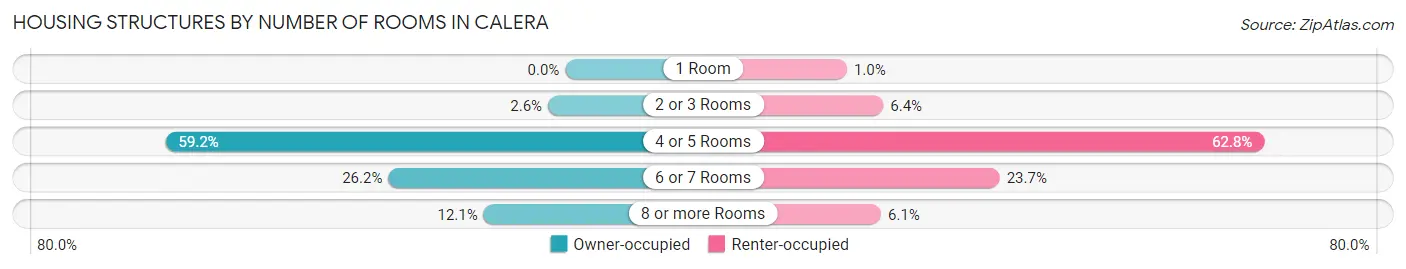
| Number of Rooms | Owner-occupied | Renter-occupied |
| 1 Room | 0 (0.0%) | 6 (1.0%) |
| 2 or 3 Rooms | 14 (2.6%) | 37 (6.4%) |
| 4 or 5 Rooms | 323 (59.2%) | 361 (62.8%) |
| 6 or 7 Rooms | 143 (26.2%) | 136 (23.6%) |
| 8 or more Rooms | 66 (12.1%) | 35 (6.1%) |
| Total | 546 (100.0%) | 575 (100.0%) |
Housing Structure by Heating Type in Calera
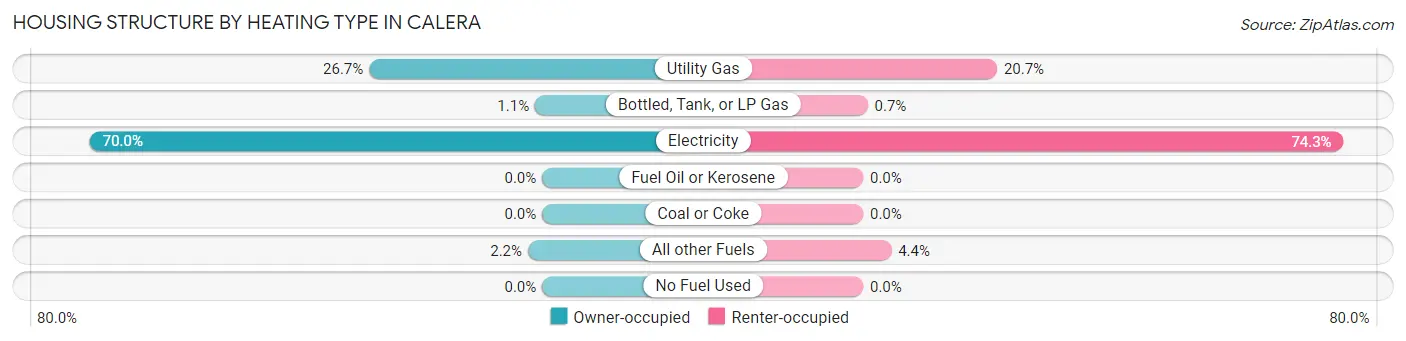
| Heating Type | Owner-occupied | Renter-occupied |
| Utility Gas | 146 (26.7%) | 119 (20.7%) |
| Bottled, Tank, or LP Gas | 6 (1.1%) | 4 (0.7%) |
| Electricity | 382 (70.0%) | 427 (74.3%) |
| Fuel Oil or Kerosene | 0 (0.0%) | 0 (0.0%) |
| Coal or Coke | 0 (0.0%) | 0 (0.0%) |
| All other Fuels | 12 (2.2%) | 25 (4.3%) |
| No Fuel Used | 0 (0.0%) | 0 (0.0%) |
| Total | 546 (100.0%) | 575 (100.0%) |
Household Vehicle Usage in Calera
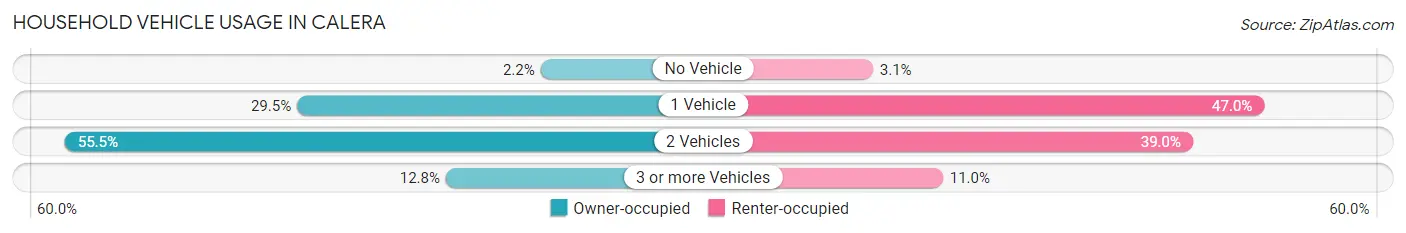
| Vehicles per Household | Owner-occupied | Renter-occupied |
| No Vehicle | 12 (2.2%) | 18 (3.1%) |
| 1 Vehicle | 161 (29.5%) | 270 (47.0%) |
| 2 Vehicles | 303 (55.5%) | 224 (39.0%) |
| 3 or more Vehicles | 70 (12.8%) | 63 (11.0%) |
| Total | 546 (100.0%) | 575 (100.0%) |
Real Estate & Mortgages in Calera
Real Estate and Mortgage Overview in Calera
| Characteristic | Without Mortgage | With Mortgage |
| Housing Units | 187 | 359 |
| Median Property Value | $83,200 | $160,500 |
| Median Household Income | $58,125 | $15 |
| Monthly Housing Costs | $355 | $0 |
| Real Estate Taxes | $431 | $76 |
Property Value by Mortgage Status in Calera
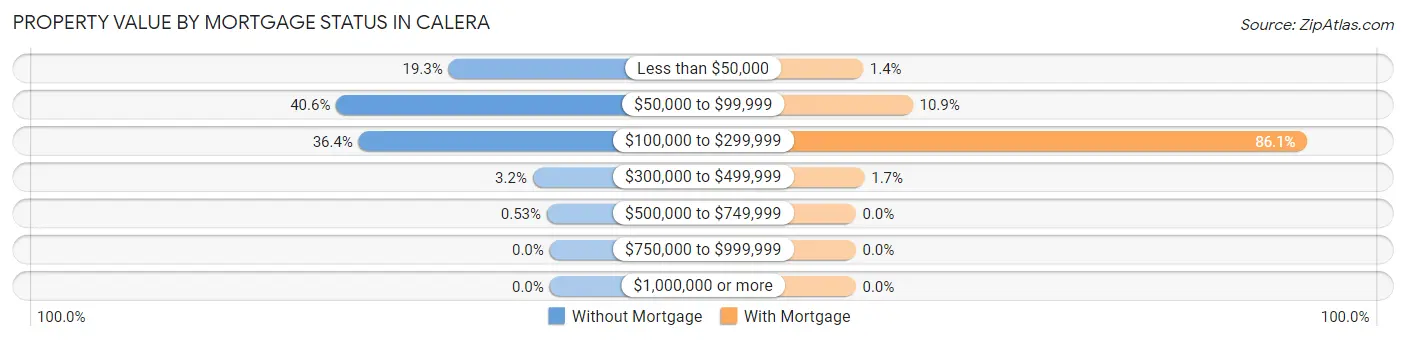
| Property Value | Without Mortgage | With Mortgage |
| Less than $50,000 | 36 (19.3%) | 5 (1.4%) |
| $50,000 to $99,999 | 76 (40.6%) | 39 (10.9%) |
| $100,000 to $299,999 | 68 (36.4%) | 309 (86.1%) |
| $300,000 to $499,999 | 6 (3.2%) | 6 (1.7%) |
| $500,000 to $749,999 | 1 (0.5%) | 0 (0.0%) |
| $750,000 to $999,999 | 0 (0.0%) | 0 (0.0%) |
| $1,000,000 or more | 0 (0.0%) | 0 (0.0%) |
| Total | 187 (100.0%) | 359 (100.0%) |
Household Income by Mortgage Status in Calera
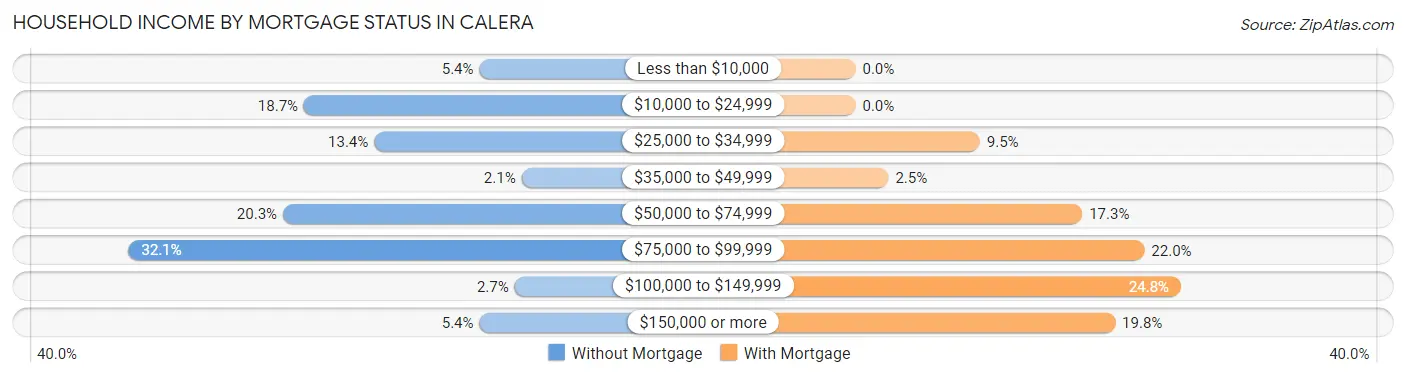
| Household Income | Without Mortgage | With Mortgage |
| Less than $10,000 | 10 (5.3%) | 0 (0.0%) |
| $10,000 to $24,999 | 35 (18.7%) | 0 (0.0%) |
| $25,000 to $34,999 | 25 (13.4%) | 34 (9.5%) |
| $35,000 to $49,999 | 4 (2.1%) | 9 (2.5%) |
| $50,000 to $74,999 | 38 (20.3%) | 62 (17.3%) |
| $75,000 to $99,999 | 60 (32.1%) | 79 (22.0%) |
| $100,000 to $149,999 | 5 (2.7%) | 89 (24.8%) |
| $150,000 or more | 10 (5.3%) | 71 (19.8%) |
| Total | 187 (100.0%) | 359 (100.0%) |
Property Value to Household Income Ratio in Calera
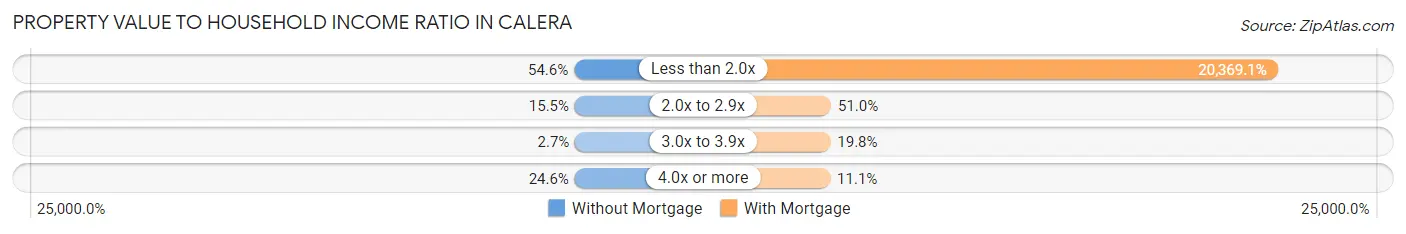
| Value-to-Income Ratio | Without Mortgage | With Mortgage |
| Less than 2.0x | 102 (54.5%) | 73,125 (20,369.1%) |
| 2.0x to 2.9x | 29 (15.5%) | 183 (51.0%) |
| 3.0x to 3.9x | 5 (2.7%) | 71 (19.8%) |
| 4.0x or more | 46 (24.6%) | 40 (11.1%) |
| Total | 187 (100.0%) | 359 (100.0%) |
Real Estate Taxes by Mortgage Status in Calera
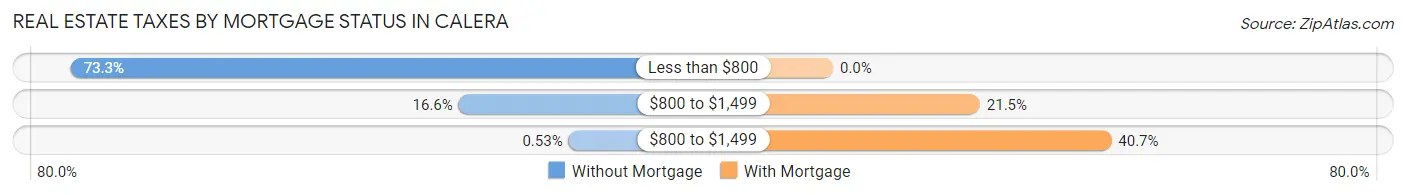
| Property Taxes | Without Mortgage | With Mortgage |
| Less than $800 | 137 (73.3%) | 0 (0.0%) |
| $800 to $1,499 | 31 (16.6%) | 77 (21.4%) |
| $800 to $1,499 | 1 (0.5%) | 146 (40.7%) |
| Total | 187 (100.0%) | 359 (100.0%) |
Health & Disability in Calera
Health Insurance Coverage by Age in Calera
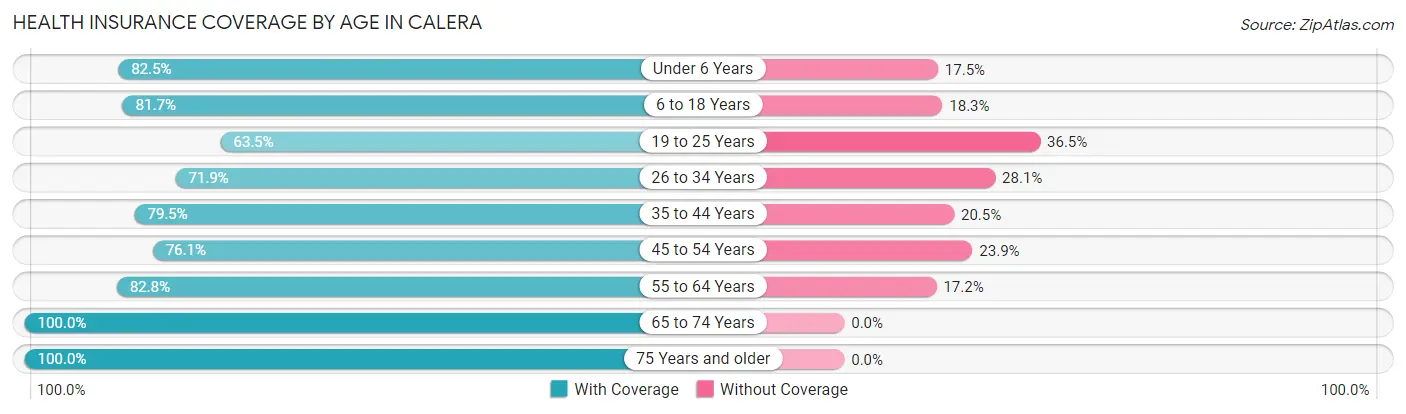
| Age Bracket | With Coverage | Without Coverage |
| Under 6 Years | 279 (82.5%) | 59 (17.5%) |
| 6 to 18 Years | 411 (81.7%) | 92 (18.3%) |
| 19 to 25 Years | 193 (63.5%) | 111 (36.5%) |
| 26 to 34 Years | 373 (71.9%) | 146 (28.1%) |
| 35 to 44 Years | 237 (79.5%) | 61 (20.5%) |
| 45 to 54 Years | 239 (76.1%) | 75 (23.9%) |
| 55 to 64 Years | 265 (82.8%) | 55 (17.2%) |
| 65 to 74 Years | 163 (100.0%) | 0 (0.0%) |
| 75 Years and older | 74 (100.0%) | 0 (0.0%) |
| Total | 2,234 (78.9%) | 599 (21.1%) |
Health Insurance Coverage by Citizenship Status in Calera
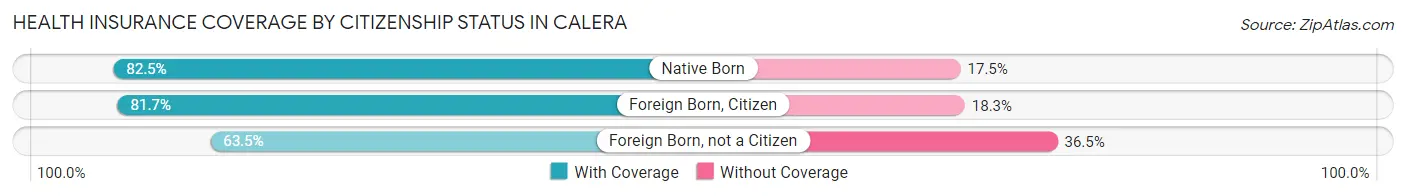
| Citizenship Status | With Coverage | Without Coverage |
| Native Born | 279 (82.5%) | 59 (17.5%) |
| Foreign Born, Citizen | 411 (81.7%) | 92 (18.3%) |
| Foreign Born, not a Citizen | 193 (63.5%) | 111 (36.5%) |
Health Insurance Coverage by Household Income in Calera
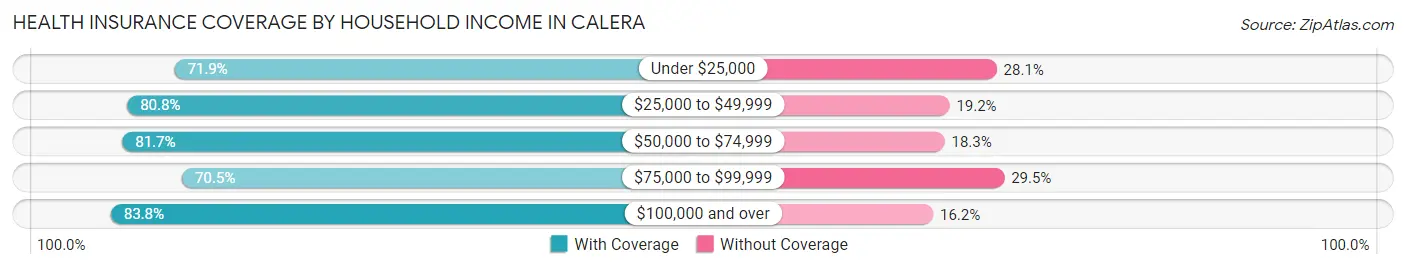
| Household Income | With Coverage | Without Coverage |
| Under $25,000 | 251 (71.9%) | 98 (28.1%) |
| $25,000 to $49,999 | 584 (80.8%) | 139 (19.2%) |
| $50,000 to $74,999 | 571 (81.7%) | 128 (18.3%) |
| $75,000 to $99,999 | 330 (70.5%) | 138 (29.5%) |
| $100,000 and over | 498 (83.8%) | 96 (16.2%) |
Public vs Private Health Insurance Coverage by Age in Calera
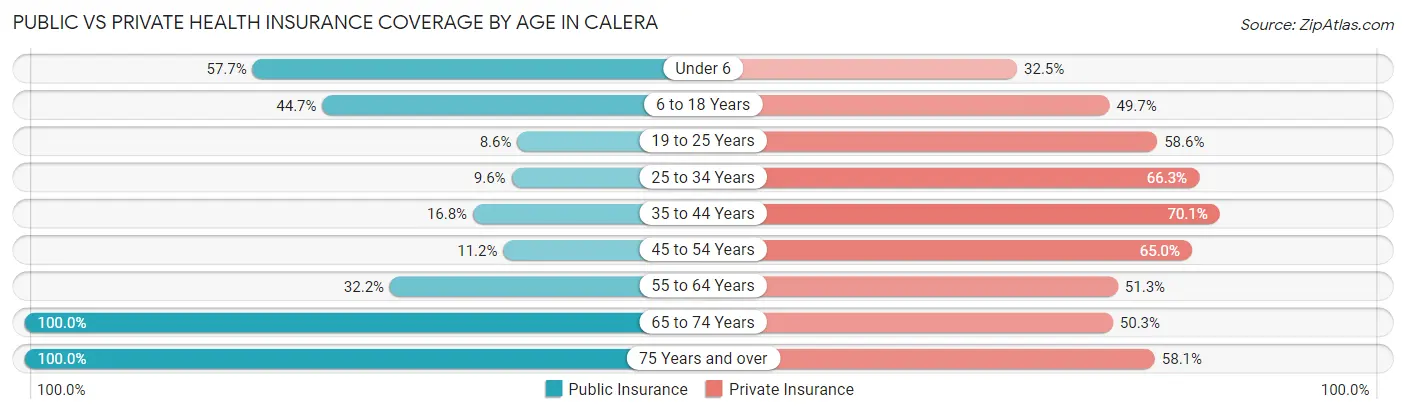
| Age Bracket | Public Insurance | Private Insurance |
| Under 6 | 195 (57.7%) | 110 (32.5%) |
| 6 to 18 Years | 225 (44.7%) | 250 (49.7%) |
| 19 to 25 Years | 26 (8.6%) | 178 (58.6%) |
| 25 to 34 Years | 50 (9.6%) | 344 (66.3%) |
| 35 to 44 Years | 50 (16.8%) | 209 (70.1%) |
| 45 to 54 Years | 35 (11.2%) | 204 (65.0%) |
| 55 to 64 Years | 103 (32.2%) | 164 (51.2%) |
| 65 to 74 Years | 163 (100.0%) | 82 (50.3%) |
| 75 Years and over | 74 (100.0%) | 43 (58.1%) |
| Total | 921 (32.5%) | 1,584 (55.9%) |
Disability Status by Sex by Age in Calera
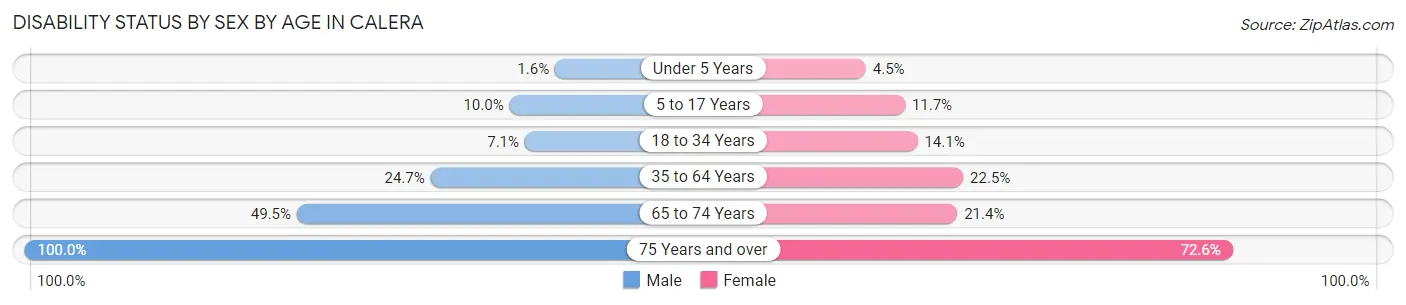
| Age Bracket | Male | Female |
| Under 5 Years | 3 (1.5%) | 5 (4.5%) |
| 5 to 17 Years | 23 (10.0%) | 32 (11.7%) |
| 18 to 34 Years | 27 (7.1%) | 67 (14.1%) |
| 35 to 64 Years | 105 (24.6%) | 114 (22.5%) |
| 65 to 74 Years | 46 (49.5%) | 15 (21.4%) |
| 75 Years and over | 23 (100.0%) | 37 (72.6%) |
Disability Class by Sex by Age in Calera
Disability Class: Hearing Difficulty
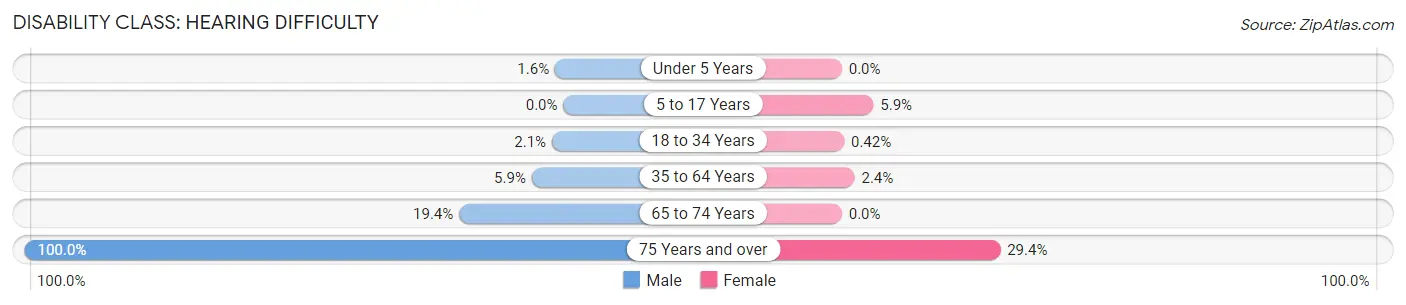
| Age Bracket | Male | Female |
| Under 5 Years | 3 (1.5%) | 0 (0.0%) |
| 5 to 17 Years | 0 (0.0%) | 16 (5.9%) |
| 18 to 34 Years | 8 (2.1%) | 2 (0.4%) |
| 35 to 64 Years | 25 (5.9%) | 12 (2.4%) |
| 65 to 74 Years | 18 (19.4%) | 0 (0.0%) |
| 75 Years and over | 23 (100.0%) | 15 (29.4%) |
Disability Class: Vision Difficulty
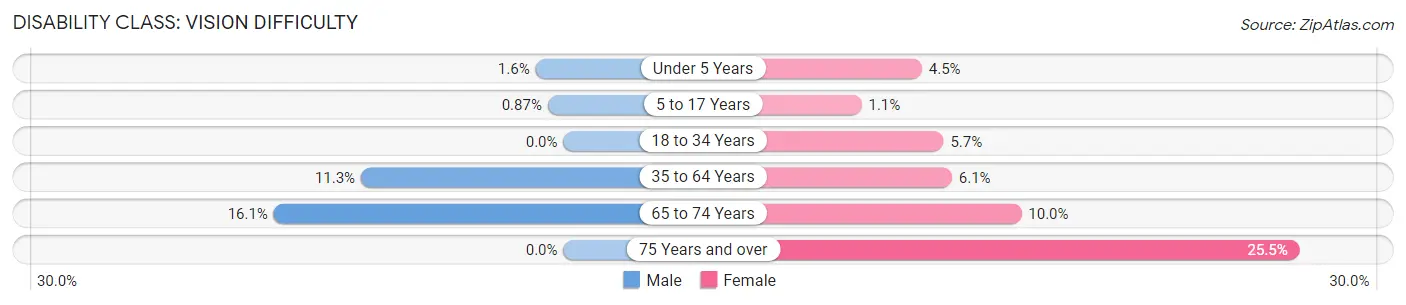
| Age Bracket | Male | Female |
| Under 5 Years | 3 (1.5%) | 5 (4.5%) |
| 5 to 17 Years | 2 (0.9%) | 3 (1.1%) |
| 18 to 34 Years | 0 (0.0%) | 27 (5.7%) |
| 35 to 64 Years | 48 (11.3%) | 31 (6.1%) |
| 65 to 74 Years | 15 (16.1%) | 7 (10.0%) |
| 75 Years and over | 0 (0.0%) | 13 (25.5%) |
Disability Class: Cognitive Difficulty
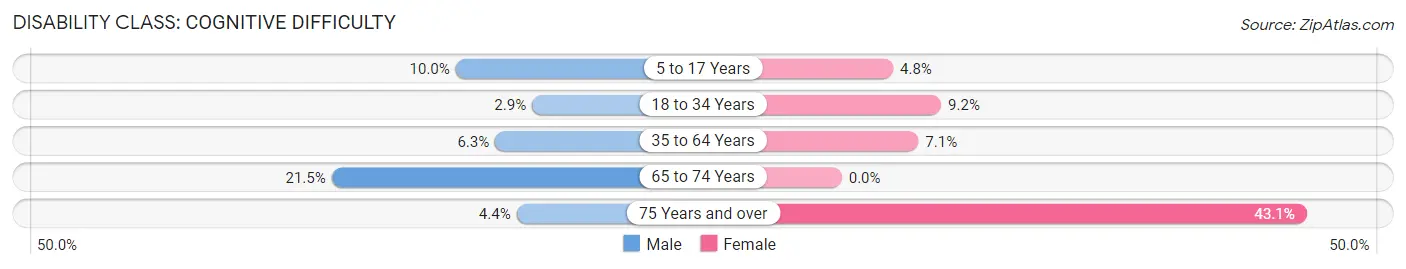
| Age Bracket | Male | Female |
| 5 to 17 Years | 23 (10.0%) | 13 (4.8%) |
| 18 to 34 Years | 11 (2.9%) | 44 (9.2%) |
| 35 to 64 Years | 27 (6.3%) | 36 (7.1%) |
| 65 to 74 Years | 20 (21.5%) | 0 (0.0%) |
| 75 Years and over | 1 (4.3%) | 22 (43.1%) |
Disability Class: Ambulatory Difficulty
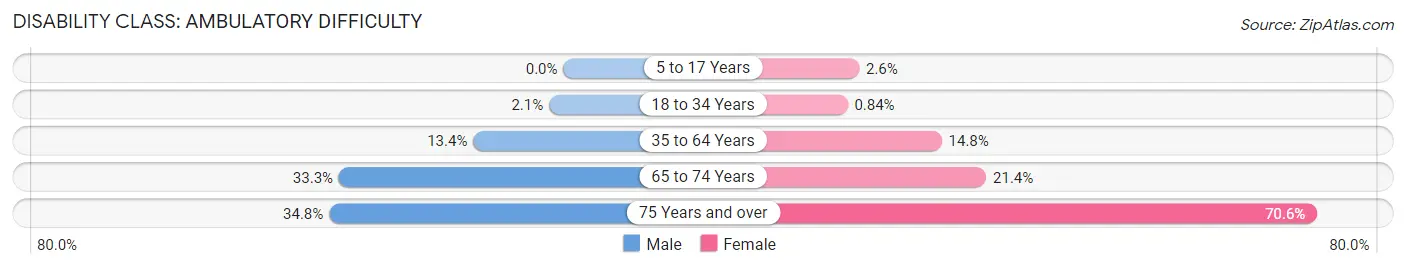
| Age Bracket | Male | Female |
| 5 to 17 Years | 0 (0.0%) | 7 (2.6%) |
| 18 to 34 Years | 8 (2.1%) | 4 (0.8%) |
| 35 to 64 Years | 57 (13.4%) | 75 (14.8%) |
| 65 to 74 Years | 31 (33.3%) | 15 (21.4%) |
| 75 Years and over | 8 (34.8%) | 36 (70.6%) |
Disability Class: Self-Care Difficulty
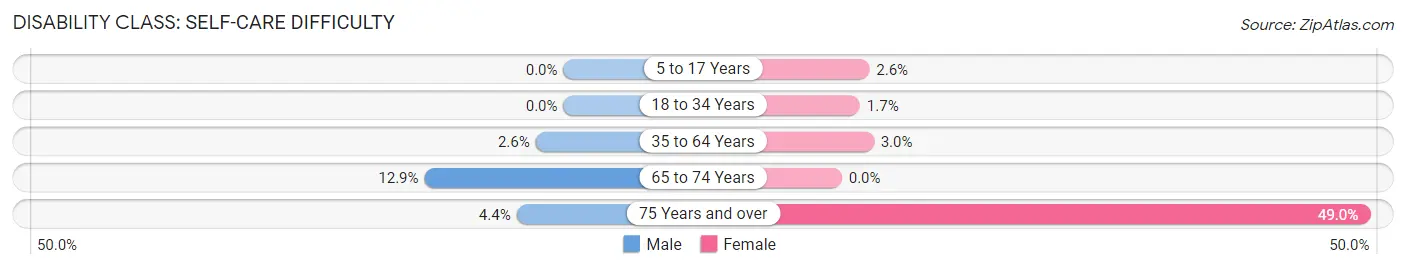
| Age Bracket | Male | Female |
| 5 to 17 Years | 0 (0.0%) | 7 (2.6%) |
| 18 to 34 Years | 0 (0.0%) | 8 (1.7%) |
| 35 to 64 Years | 11 (2.6%) | 15 (3.0%) |
| 65 to 74 Years | 12 (12.9%) | 0 (0.0%) |
| 75 Years and over | 1 (4.3%) | 25 (49.0%) |
Technology Access in Calera
Computing Device Access in Calera
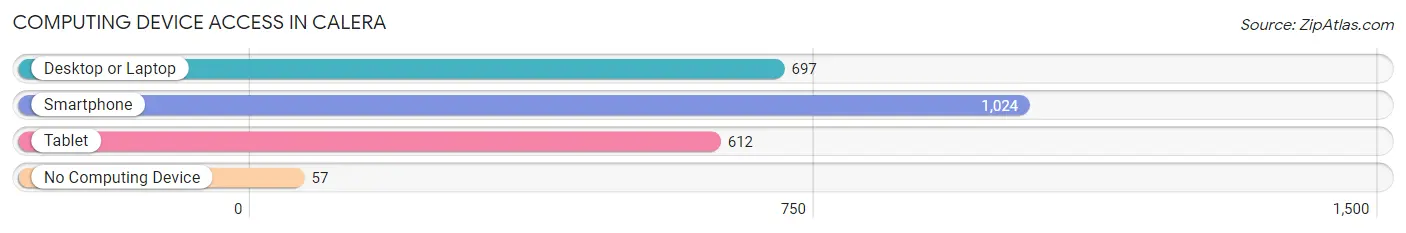
| Device Type | # Households | % Households |
| Desktop or Laptop | 697 | 62.2% |
| Smartphone | 1,024 | 91.3% |
| Tablet | 612 | 54.6% |
| No Computing Device | 57 | 5.1% |
| Total | 1,121 | 100.0% |
Internet Access in Calera
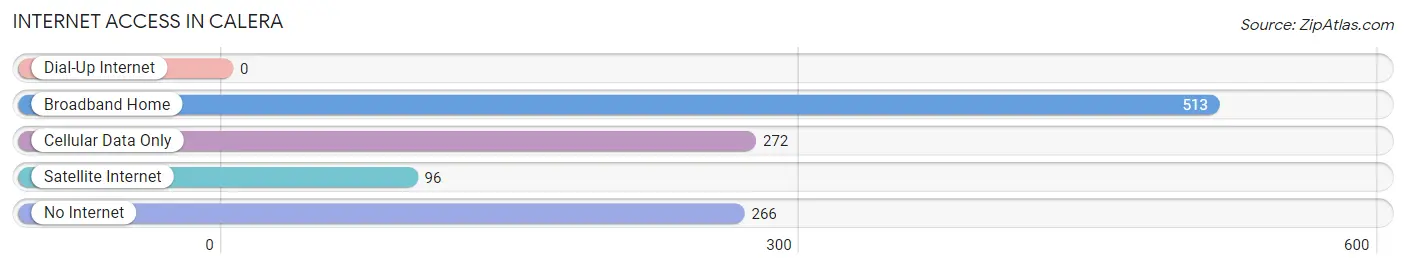
| Internet Type | # Households | % Households |
| Dial-Up Internet | 0 | 0.0% |
| Broadband Home | 513 | 45.8% |
| Cellular Data Only | 272 | 24.3% |
| Satellite Internet | 96 | 8.6% |
| No Internet | 266 | 23.7% |
| Total | 1,121 | 100.0% |
Calera Summary
Calera, Oklahoma is a small town located in Bryan County, Oklahoma. It is situated approximately 10 miles south of Durant, Oklahoma and is part of the Durant Micropolitan Statistical Area. The town was founded in 1894 and was named after the Spanish word for “lime” due to the abundance of limestone in the area. As of the 2010 census, the population of Calera was 1,845.
Geography
Calera is located at the intersection of U.S. Highway 69 and State Highway 78. It is situated in the Red River Valley, which is part of the larger Great Plains region. The town is located on the western edge of the Cross Timbers region, which is characterized by rolling hills and woodlands. The town is located in a humid subtropical climate zone, with hot summers and mild winters. The average annual temperature is around 64°F (18°C).
Economy
Calera’s economy is largely based on agriculture and manufacturing. The town is home to several large agricultural operations, including a cotton gin, a feed mill, and a poultry processing plant. The town is also home to several manufacturing companies, including a furniture factory, a plastics factory, and a metal fabrication plant.
Demographics
As of the 2010 census, the population of Calera was 1,845. The racial makeup of the town was 79.2% White, 15.2% African American, 0.7% Native American, 0.3% Asian, 0.1% Pacific Islander, and 4.5% from other races. The median household income was $31,250, and the median family income was $37,500. The per capita income was $15,845.
Conclusion
Calera, Oklahoma is a small town located in Bryan County, Oklahoma. It is situated approximately 10 miles south of Durant, Oklahoma and is part of the Durant Micropolitan Statistical Area. The town was founded in 1894 and was named after the Spanish word for “lime” due to the abundance of limestone in the area. As of the 2010 census, the population of Calera was 1,845. The town’s economy is largely based on agriculture and manufacturing, and the racial makeup of the town is 79.2% White, 15.2% African American, 0.7% Native American, 0.3% Asian, 0.1% Pacific Islander, and 4.5% from other races. The median household income was $31,250, and the median family income was $37,500. The per capita income was $15,845.
Common Questions
What is Per Capita Income in Calera?
Per Capita income in Calera is $26,273.
What is the Median Family Income in Calera?
Median Family Income in Calera is $59,632.
What is the Median Household income in Calera?
Median Household Income in Calera is $54,813.
What is Income or Wage Gap in Calera?
Income or Wage Gap in Calera is 27.6%.
Women in Calera earn 72.4 cents for every dollar earned by a man.
What is Inequality or Gini Index in Calera?
Inequality or Gini Index in Calera is 0.36.
What is the Total Population of Calera?
Total Population of Calera is 2,896.
What is the Total Male Population of Calera?
Total Male Population of Calera is 1,364.
What is the Total Female Population of Calera?
Total Female Population of Calera is 1,532.
What is the Ratio of Males per 100 Females in Calera?
There are 89.03 Males per 100 Females in Calera.
What is the Ratio of Females per 100 Males in Calera?
There are 112.32 Females per 100 Males in Calera.
What is the Median Population Age in Calera?
Median Population Age in Calera is 31.7 Years.
What is the Average Family Size in Calera
Average Family Size in Calera is 2.9 People.
What is the Average Household Size in Calera
Average Household Size in Calera is 2.5 People.
How Large is the Labor Force in Calera?
There are 1,448 People in the Labor Forcein in Calera.
What is the Percentage of People in the Labor Force in Calera?
67.8% of People are in the Labor Force in Calera.
What is the Unemployment Rate in Calera?
Unemployment Rate in Calera is 1.9%.