Gotebo, OK Map & Demographics
Gotebo Map
Gotebo Overview
$45,727
PER CAPITA INCOME
$102,708
AVG FAMILY INCOME
$88,558
AVG HOUSEHOLD INCOME
0.47
INEQUALITY / GINI INDEX
278
TOTAL POPULATION
110
MALE POPULATION
168
FEMALE POPULATION
65.48
MALES / 100 FEMALES
152.73
FEMALES / 100 MALES
59.7
MEDIAN AGE
2.7
AVG FAMILY SIZE
2.3
AVG HOUSEHOLD SIZE
167
LABOR FORCE [ PEOPLE ]
66.5%
PERCENT IN LABOR FORCE
0.6%
UNEMPLOYMENT RATE
Gotebo Zip Codes
Gotebo Area Codes
Income in Gotebo
Income Overview in Gotebo
Per Capita Income in Gotebo is $45,727, while median incomes of families and households are $102,708 and $88,558 respectively.
| Characteristic | Number | Measure |
| Per Capita Income | 278 | $45,727 |
| Median Family Income | 89 | $102,708 |
| Mean Family Income | 89 | $134,280 |
| Median Household Income | 119 | $88,558 |
| Mean Household Income | 119 | $109,181 |
| Income Deficit | 89 | $0 |
| Wage / Income Gap (%) | 278 | 0.00% |
| Wage / Income Gap ($) | 278 | 100.00¢ per $1 |
| Gini / Inequality Index | 278 | 0.47 |
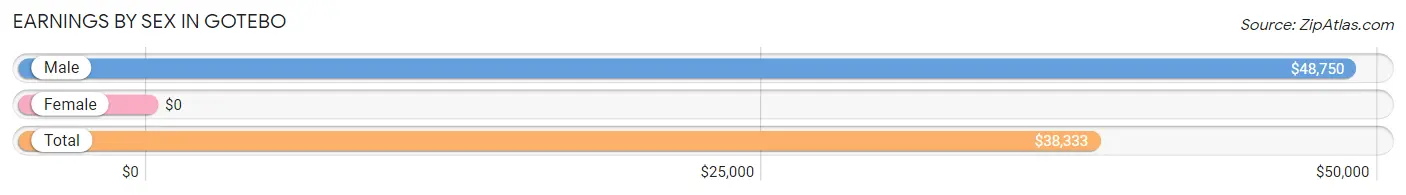
Earnings by Sex in Gotebo
| Sex | Number | Average Earnings |
| Male | 46 (26.4%) | $48,750 |
| Female | 128 (73.6%) | $0 |
| Total | 174 (100.0%) | $38,333 |
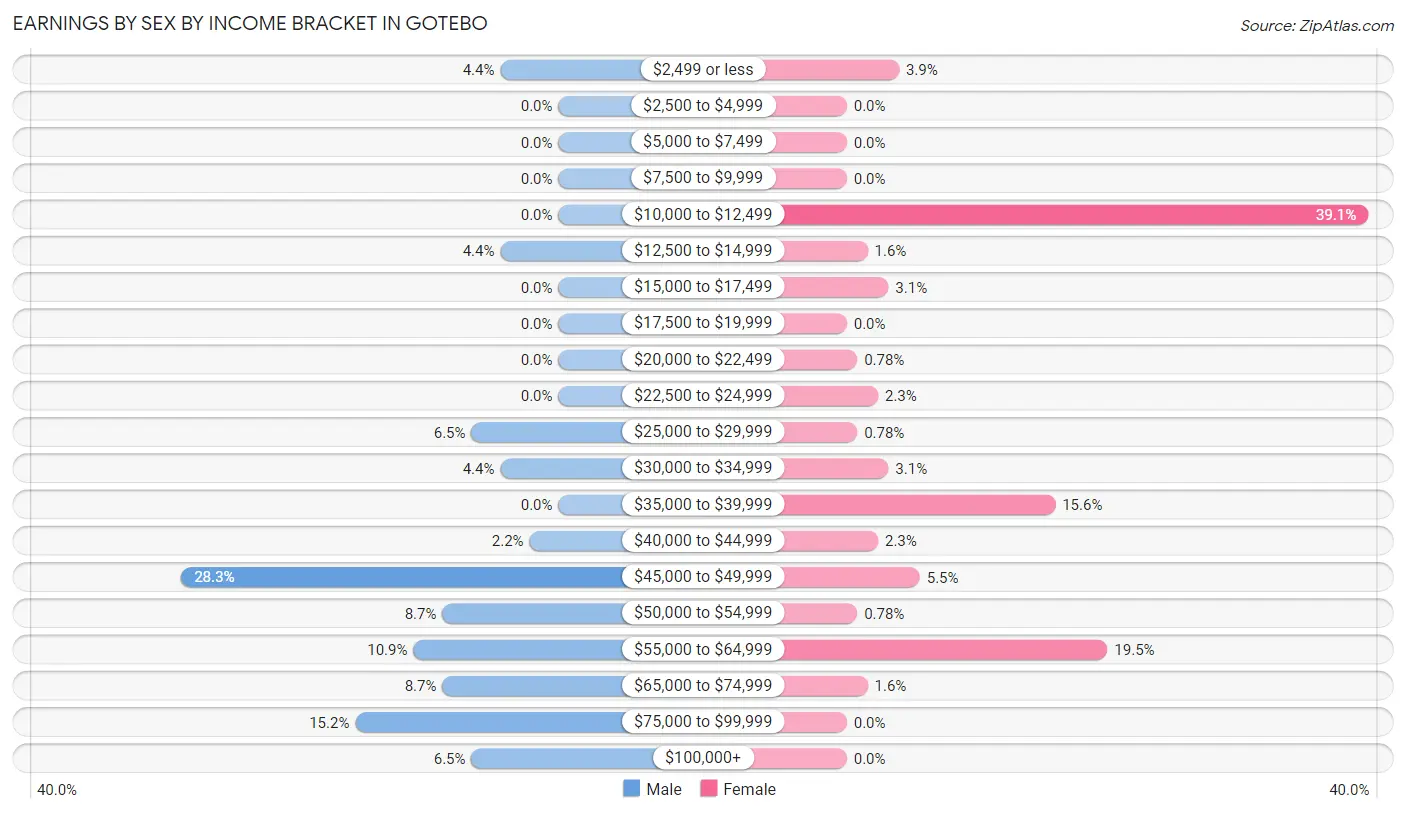
Earnings by Sex by Income Bracket in Gotebo
The most common earnings brackets in Gotebo are $45,000 to $49,999 for men (13 | 28.3%) and $10,000 to $12,499 for women (50 | 39.1%).
| Income | Male | Female |
| $2,499 or less | 2 (4.3%) | 5 (3.9%) |
| $2,500 to $4,999 | 0 (0.0%) | 0 (0.0%) |
| $5,000 to $7,499 | 0 (0.0%) | 0 (0.0%) |
| $7,500 to $9,999 | 0 (0.0%) | 0 (0.0%) |
| $10,000 to $12,499 | 0 (0.0%) | 50 (39.1%) |
| $12,500 to $14,999 | 2 (4.3%) | 2 (1.6%) |
| $15,000 to $17,499 | 0 (0.0%) | 4 (3.1%) |
| $17,500 to $19,999 | 0 (0.0%) | 0 (0.0%) |
| $20,000 to $22,499 | 0 (0.0%) | 1 (0.8%) |
| $22,500 to $24,999 | 0 (0.0%) | 3 (2.3%) |
| $25,000 to $29,999 | 3 (6.5%) | 1 (0.8%) |
| $30,000 to $34,999 | 2 (4.3%) | 4 (3.1%) |
| $35,000 to $39,999 | 0 (0.0%) | 20 (15.6%) |
| $40,000 to $44,999 | 1 (2.2%) | 3 (2.3%) |
| $45,000 to $49,999 | 13 (28.3%) | 7 (5.5%) |
| $50,000 to $54,999 | 4 (8.7%) | 1 (0.8%) |
| $55,000 to $64,999 | 5 (10.9%) | 25 (19.5%) |
| $65,000 to $74,999 | 4 (8.7%) | 2 (1.6%) |
| $75,000 to $99,999 | 7 (15.2%) | 0 (0.0%) |
| $100,000+ | 3 (6.5%) | 0 (0.0%) |
| Total | 46 (100.0%) | 128 (100.0%) |
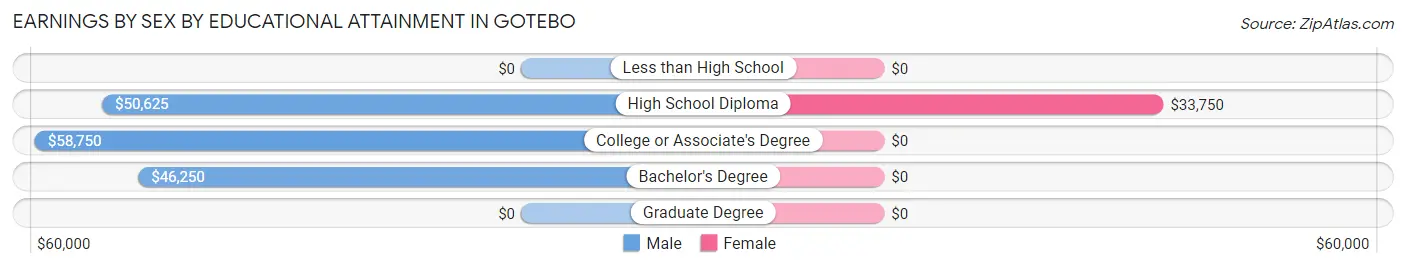
Earnings by Sex by Educational Attainment in Gotebo
Average earnings in Gotebo are $47,115 for men and $28,750 for women, a difference of 39.0%. Men with an educational attainment of college or associate's degree enjoy the highest average annual earnings of $58,750, while those with bachelor's degree education earn the least with $46,250. Women with an educational attainment of high school diploma earn the most with the average annual earnings of $33,750, while those with high school diploma education have the smallest earnings of $33,750.
| Educational Attainment | Male Income | Female Income |
| Less than High School | - | - |
| High School Diploma | $50,625 | $33,750 |
| College or Associate's Degree | $58,750 | $0 |
| Bachelor's Degree | $46,250 | $0 |
| Graduate Degree | - | - |
| Total | $47,115 | $28,750 |
Family Income in Gotebo
Family Income Brackets in Gotebo
According to the Gotebo family income data, there are 33 families falling into the $150,000 to $199,999 income range, which is the most common income bracket and makes up 37.1% of all families.
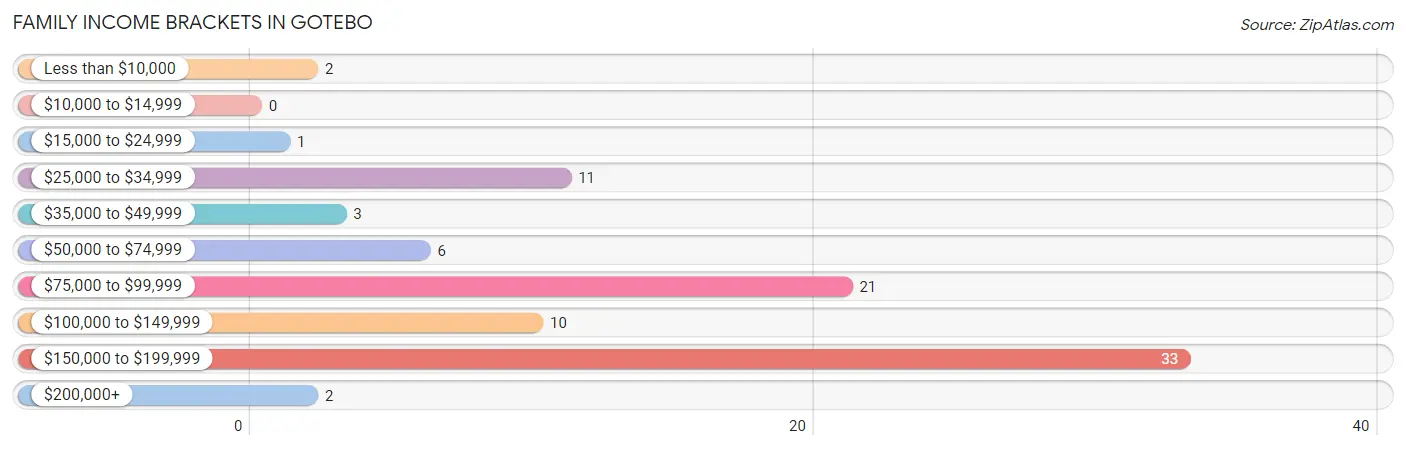
| Income Bracket | # Families | % Families |
| Less than $10,000 | 2 | 2.2% |
| $10,000 to $14,999 | 0 | 0.0% |
| $15,000 to $24,999 | 1 | 1.1% |
| $25,000 to $34,999 | 11 | 12.4% |
| $35,000 to $49,999 | 3 | 3.4% |
| $50,000 to $74,999 | 6 | 6.7% |
| $75,000 to $99,999 | 21 | 23.6% |
| $100,000 to $149,999 | 10 | 11.2% |
| $150,000 to $199,999 | 33 | 37.1% |
| $200,000+ | 2 | 2.2% |
Family Income by Famaliy Size in Gotebo
3-person families (48 | 53.9%) account for the highest median family income in Gotebo with $175,500 per family, while 3-person families (48 | 53.9%) have the highest median income of $58,500 per family member.
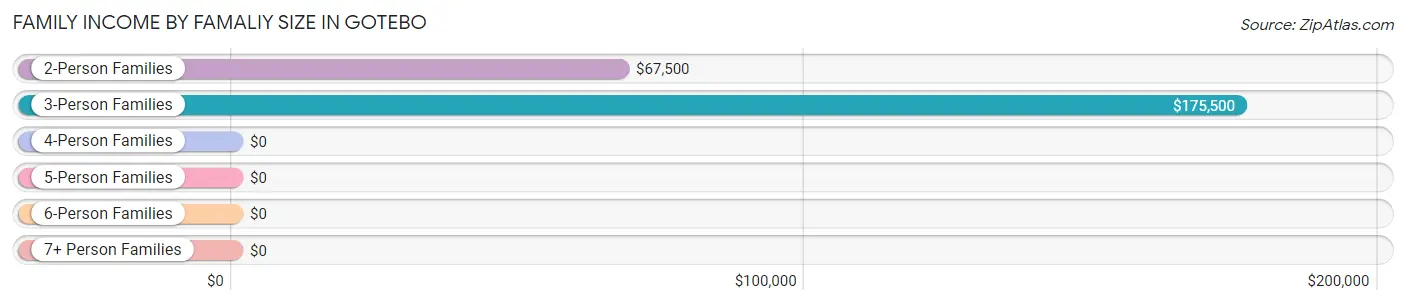
| Income Bracket | # Families | Median Income |
| 2-Person Families | 38 (42.7%) | $67,500 |
| 3-Person Families | 48 (53.9%) | $175,500 |
| 4-Person Families | 3 (3.4%) | $0 |
| 5-Person Families | 0 (0.0%) | $0 |
| 6-Person Families | 0 (0.0%) | $0 |
| 7+ Person Families | 0 (0.0%) | $0 |
| Total | 89 (100.0%) | $102,708 |
Family Income by Number of Earners in Gotebo
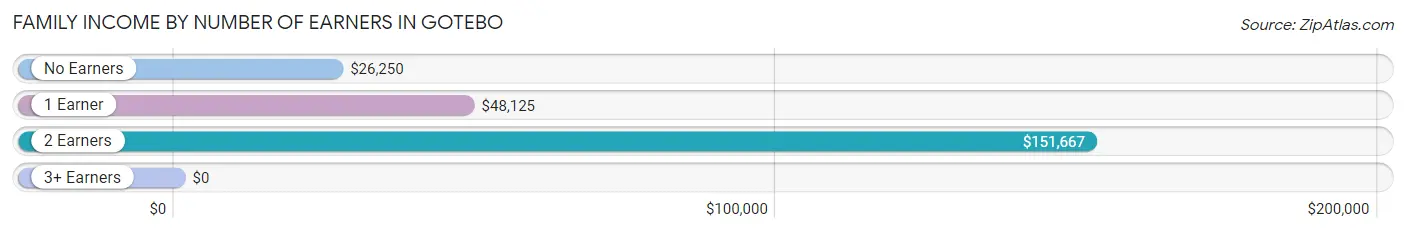
| Number of Earners | # Families | Median Income |
| No Earners | 10 (11.2%) | $26,250 |
| 1 Earner | 13 (14.6%) | $48,125 |
| 2 Earners | 66 (74.2%) | $151,667 |
| 3+ Earners | 0 (0.0%) | $0 |
| Total | 89 (100.0%) | $102,708 |
Household Income in Gotebo
Household Income Brackets in Gotebo
With 33 households falling in the category, the $150,000 to $199,999 income range is the most frequent in Gotebo, accounting for 27.7% of all households. In contrast, only 2 households (1.7%) fall into the $200,000+ income bracket, making it the least populous group.
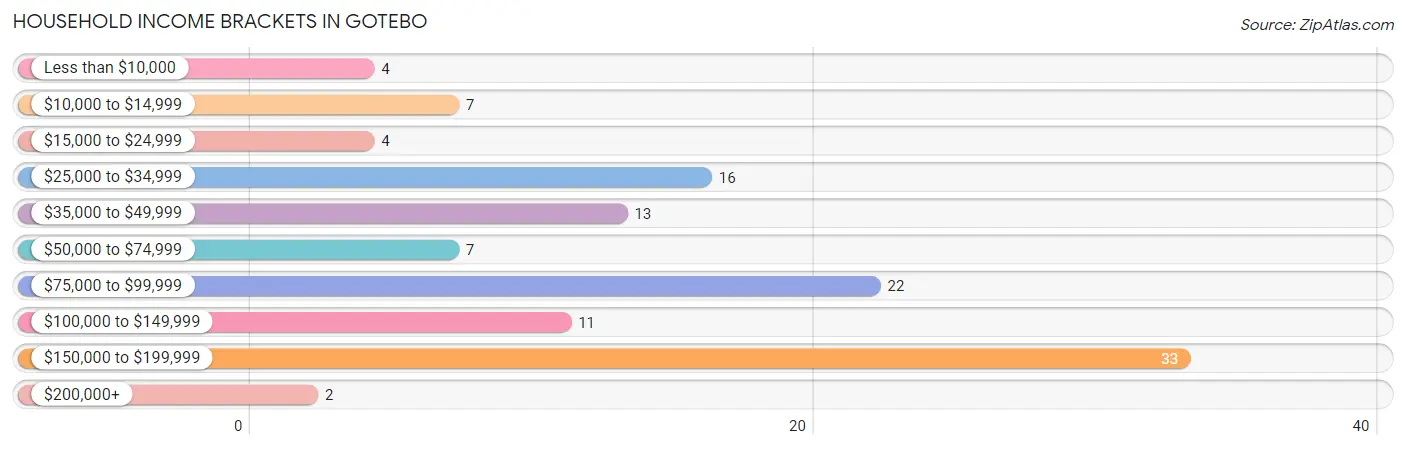
| Income Bracket | # Households | % Households |
| Less than $10,000 | 4 | 3.4% |
| $10,000 to $14,999 | 7 | 5.9% |
| $15,000 to $24,999 | 4 | 3.4% |
| $25,000 to $34,999 | 16 | 13.4% |
| $35,000 to $49,999 | 13 | 10.9% |
| $50,000 to $74,999 | 7 | 5.9% |
| $75,000 to $99,999 | 22 | 18.5% |
| $100,000 to $149,999 | 11 | 9.2% |
| $150,000 to $199,999 | 33 | 27.7% |
| $200,000+ | 2 | 1.7% |
Household Income by Householder Age in Gotebo
The median household income in Gotebo is $88,558, with the highest median household income of $89,135 found in the 25 to 44 years age bracket for the primary householder. A total of 23 households (19.3%) fall into this category. Meanwhile, the 15 to 24 years age bracket for the primary householder has the lowest median household income of $0, with 4 households (3.4%) in this group.
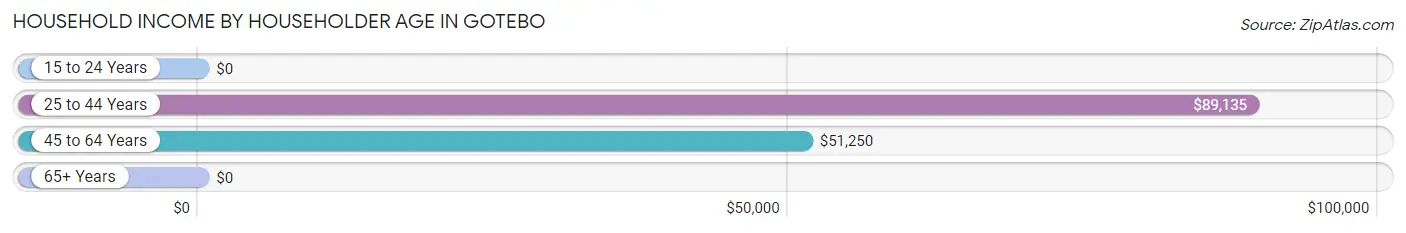
| Income Bracket | # Households | Median Income |
| 15 to 24 Years | 4 (3.4%) | $0 |
| 25 to 44 Years | 23 (19.3%) | $89,135 |
| 45 to 64 Years | 22 (18.5%) | $51,250 |
| 65+ Years | 70 (58.8%) | $0 |
| Total | 119 (100.0%) | $88,558 |
Poverty in Gotebo
Income Below Poverty by Sex and Age in Gotebo
With 5.4% poverty level for males and 10.1% for females among the residents of Gotebo, under 5 year old males and under 5 year old females are the most vulnerable to poverty, with 4 males (66.7%) and 2 females (100.0%) in their respective age groups living below the poverty level.
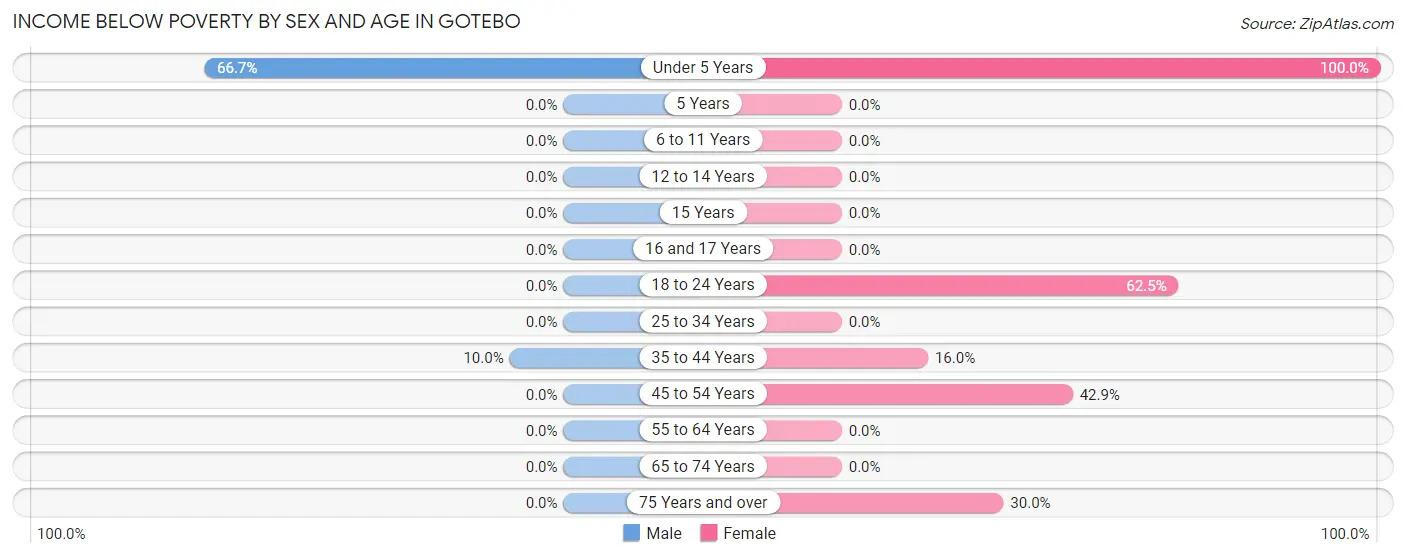
| Age Bracket | Male | Female |
| Under 5 Years | 4 (66.7%) | 2 (100.0%) |
| 5 Years | 0 (0.0%) | 0 (0.0%) |
| 6 to 11 Years | 0 (0.0%) | 0 (0.0%) |
| 12 to 14 Years | 0 (0.0%) | 0 (0.0%) |
| 15 Years | 0 (0.0%) | 0 (0.0%) |
| 16 and 17 Years | 0 (0.0%) | 0 (0.0%) |
| 18 to 24 Years | 0 (0.0%) | 5 (62.5%) |
| 25 to 34 Years | 0 (0.0%) | 0 (0.0%) |
| 35 to 44 Years | 2 (10.0%) | 4 (16.0%) |
| 45 to 54 Years | 0 (0.0%) | 3 (42.9%) |
| 55 to 64 Years | 0 (0.0%) | 0 (0.0%) |
| 65 to 74 Years | 0 (0.0%) | 0 (0.0%) |
| 75 Years and over | 0 (0.0%) | 3 (30.0%) |
| Total | 6 (5.4%) | 17 (10.1%) |
Income Above Poverty by Sex and Age in Gotebo
According to the poverty statistics in Gotebo, males aged 6 to 11 years and females aged 12 to 14 years are the age groups that are most secure financially, with 100.0% of males and 100.0% of females in these age groups living above the poverty line.
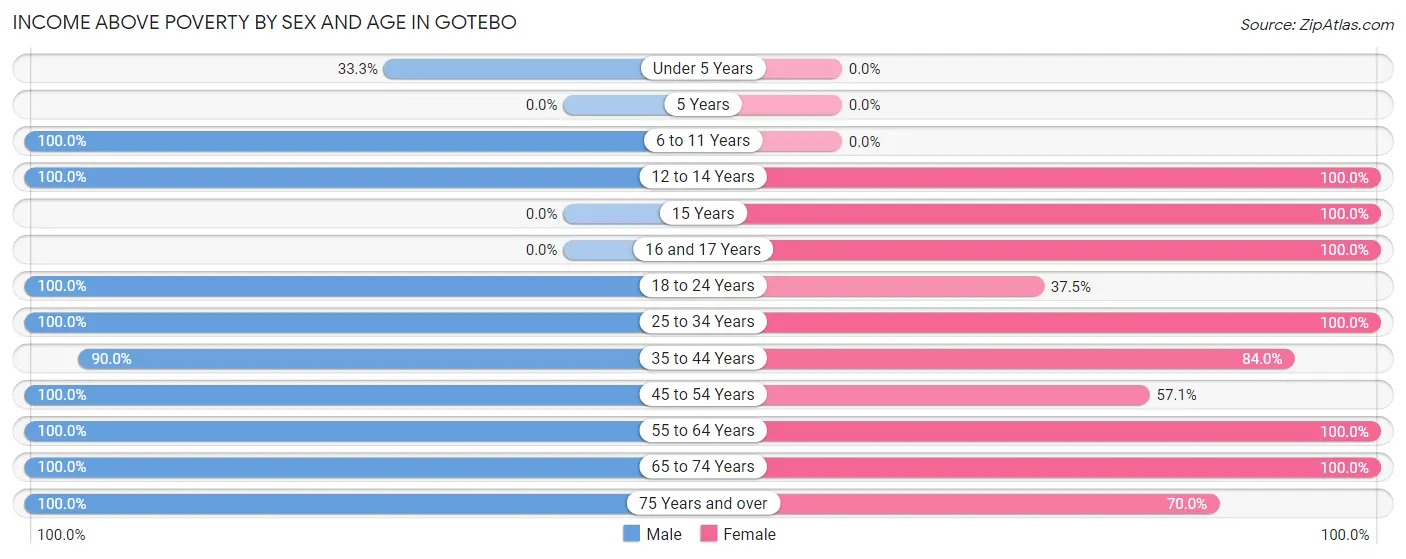
| Age Bracket | Male | Female |
| Under 5 Years | 2 (33.3%) | 0 (0.0%) |
| 5 Years | 0 (0.0%) | 0 (0.0%) |
| 6 to 11 Years | 12 (100.0%) | 0 (0.0%) |
| 12 to 14 Years | 2 (100.0%) | 3 (100.0%) |
| 15 Years | 0 (0.0%) | 2 (100.0%) |
| 16 and 17 Years | 0 (0.0%) | 1 (100.0%) |
| 18 to 24 Years | 4 (100.0%) | 3 (37.5%) |
| 25 to 34 Years | 3 (100.0%) | 6 (100.0%) |
| 35 to 44 Years | 18 (90.0%) | 21 (84.0%) |
| 45 to 54 Years | 5 (100.0%) | 4 (57.1%) |
| 55 to 64 Years | 8 (100.0%) | 85 (100.0%) |
| 65 to 74 Years | 49 (100.0%) | 19 (100.0%) |
| 75 Years and over | 1 (100.0%) | 7 (70.0%) |
| Total | 104 (94.6%) | 151 (89.9%) |
Income Below Poverty Among Married-Couple Families in Gotebo
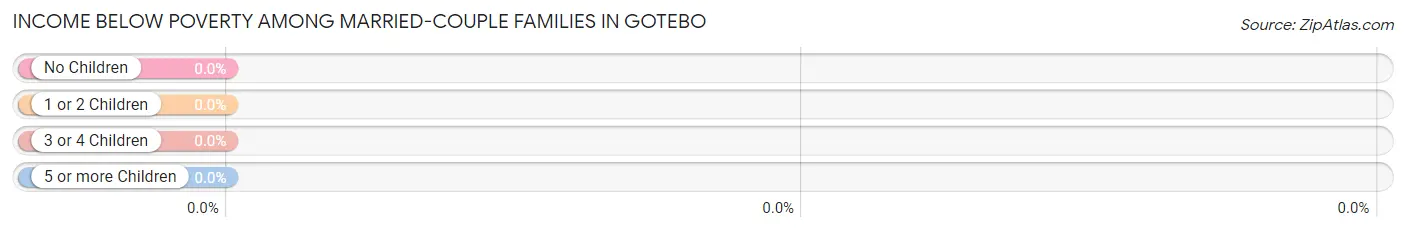
| Children | Above Poverty | Below Poverty |
| No Children | 62 (100.0%) | 0 (0.0%) |
| 1 or 2 Children | 18 (100.0%) | 0 (0.0%) |
| 3 or 4 Children | 0 (0.0%) | 0 (0.0%) |
| 5 or more Children | 0 (0.0%) | 0 (0.0%) |
| Total | 80 (100.0%) | 0 (0.0%) |
Income Below Poverty Among Single-Parent Households in Gotebo
According to the poverty data in Gotebo, 40.0% or 2 single-father households and 25.0% or 1 single-mother households are living below the poverty line. Among single-father households, those with 1 or 2 children have the highest poverty rate, with 2 households (66.7%) experiencing poverty. Likewise, among single-mother households, those with 1 or 2 children have the highest poverty rate, with 1 households (100.0%) falling below the poverty line.
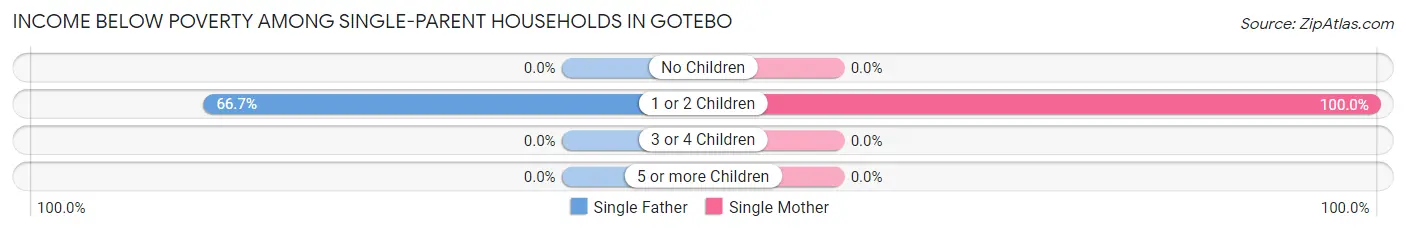
| Children | Single Father | Single Mother |
| No Children | 0 (0.0%) | 0 (0.0%) |
| 1 or 2 Children | 2 (66.7%) | 1 (100.0%) |
| 3 or 4 Children | 0 (0.0%) | 0 (0.0%) |
| 5 or more Children | 0 (0.0%) | 0 (0.0%) |
| Total | 2 (40.0%) | 1 (25.0%) |
Income Below Poverty Among Married-Couple vs Single-Parent Households in Gotebo
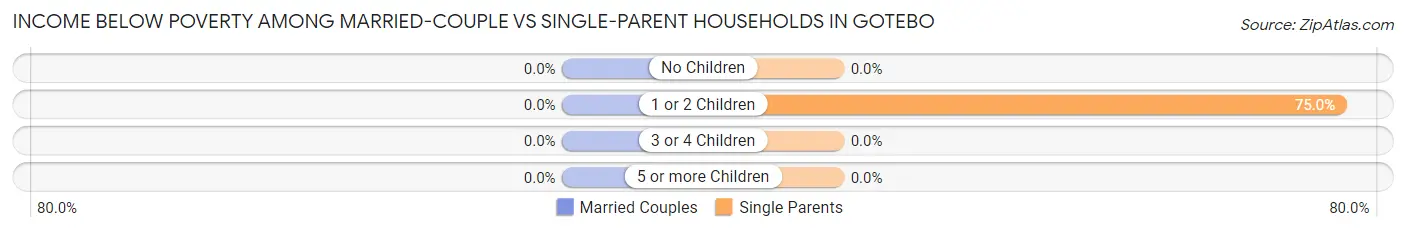
| Children | Married-Couple Families | Single-Parent Households |
| No Children | 0 (0.0%) | 0 (0.0%) |
| 1 or 2 Children | 0 (0.0%) | 3 (75.0%) |
| 3 or 4 Children | 0 (0.0%) | 0 (0.0%) |
| 5 or more Children | 0 (0.0%) | 0 (0.0%) |
| Total | 0 (0.0%) | 3 (33.3%) |
Race in Gotebo
The most populous races in Gotebo are White / Caucasian (246 | 88.5%), Native / Alaskan (29 | 10.4%), and Asian (2 | 0.7%).
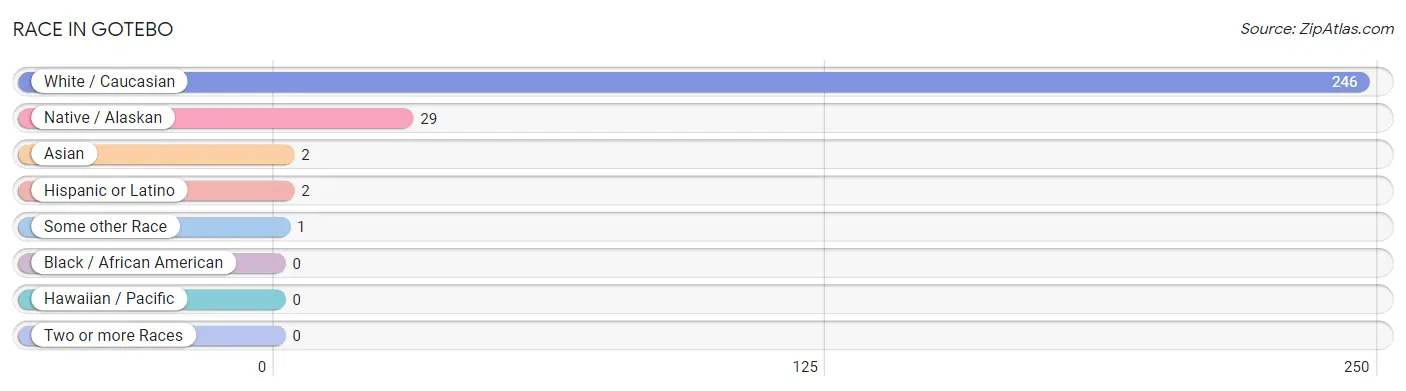
| Race | # Population | % Population |
| Asian | 2 | 0.7% |
| Black / African American | 0 | 0.0% |
| Hawaiian / Pacific | 0 | 0.0% |
| Hispanic or Latino | 2 | 0.7% |
| Native / Alaskan | 29 | 10.4% |
| White / Caucasian | 246 | 88.5% |
| Two or more Races | 0 | 0.0% |
| Some other Race | 1 | 0.4% |
| Total | 278 | 100.0% |
Ancestry in Gotebo
The most populous ancestries reported in Gotebo are Irish (97 | 34.9%), English (60 | 21.6%), German (55 | 19.8%), Hungarian (13 | 4.7%), and Kiowa (13 | 4.7%), together accounting for 85.6% of all Gotebo residents.
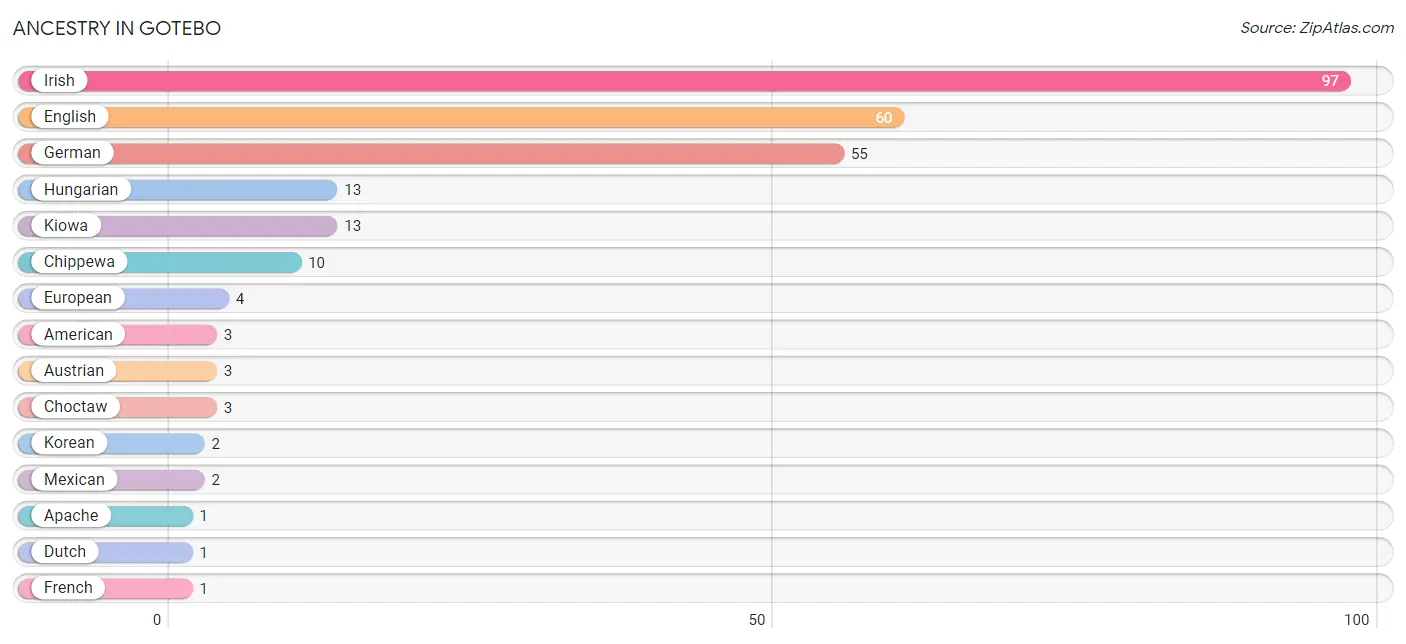
| Ancestry | # Population | % Population |
| American | 3 | 1.1% |
| Apache | 1 | 0.4% |
| Austrian | 3 | 1.1% |
| Chippewa | 10 | 3.6% |
| Choctaw | 3 | 1.1% |
| Dutch | 1 | 0.4% |
| English | 60 | 21.6% |
| European | 4 | 1.4% |
| French | 1 | 0.4% |
| German | 55 | 19.8% |
| Hungarian | 13 | 4.7% |
| Irish | 97 | 34.9% |
| Kiowa | 13 | 4.7% |
| Korean | 2 | 0.7% |
| Mexican | 2 | 0.7% |
| Scottish | 1 | 0.4% | View All 16 Rows |
Immigrants in Gotebo
The most numerous immigrant groups reported in Gotebo came from Asia (2 | 0.7%), Eastern Asia (2 | 0.7%), and Japan (2 | 0.7%), together accounting for 2.2% of all Gotebo residents.
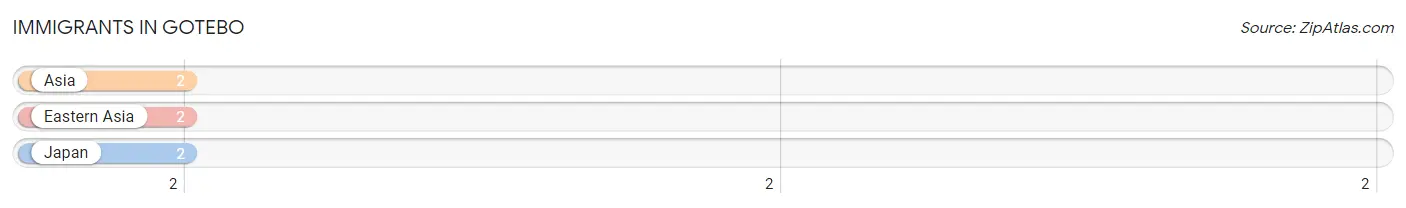
| Immigration Origin | # Population | % Population |
| Asia | 2 | 0.7% |
| Eastern Asia | 2 | 0.7% |
| Japan | 2 | 0.7% | View All 3 Rows |
Sex and Age in Gotebo
Sex and Age in Gotebo
The most populous age groups in Gotebo are 65 to 69 Years (46 | 41.8%) for men and 60 to 64 Years (48 | 28.6%) for women.
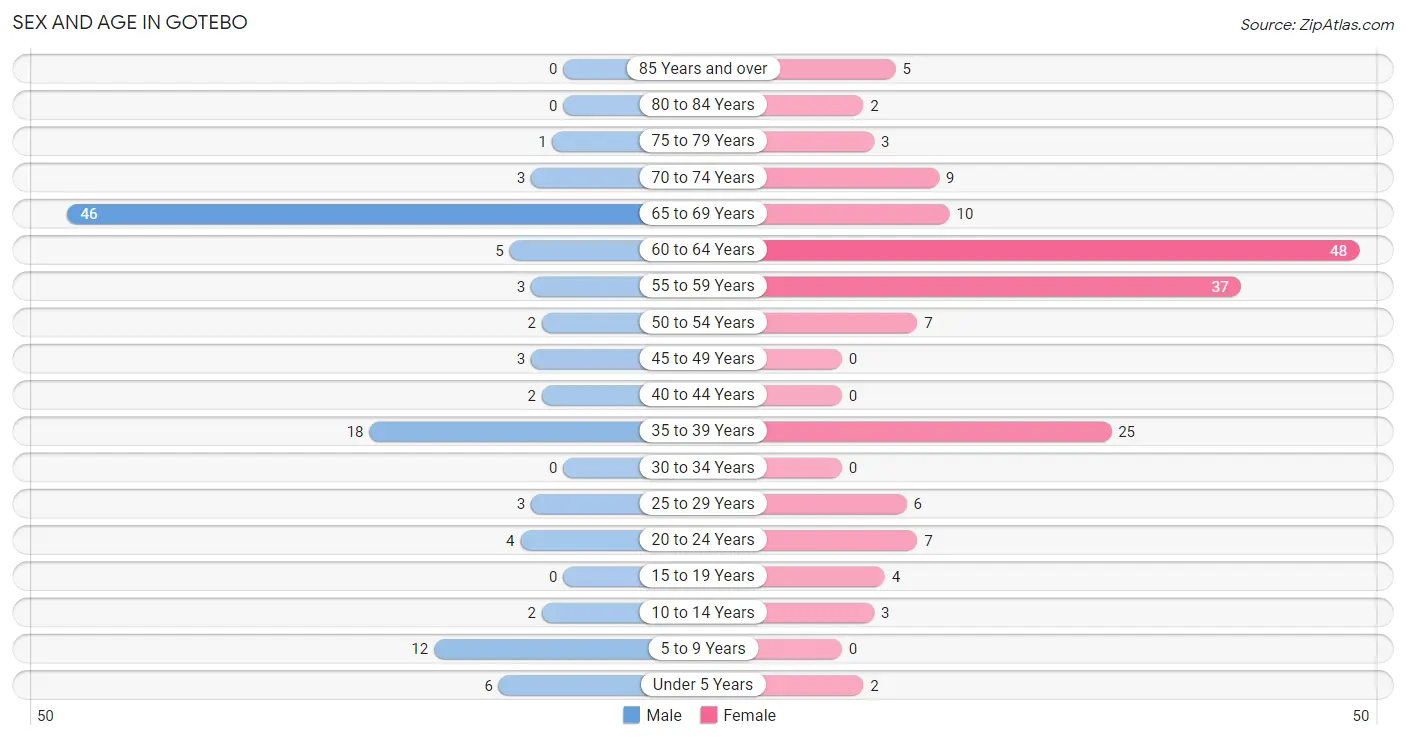
| Age Bracket | Male | Female |
| Under 5 Years | 6 (5.4%) | 2 (1.2%) |
| 5 to 9 Years | 12 (10.9%) | 0 (0.0%) |
| 10 to 14 Years | 2 (1.8%) | 3 (1.8%) |
| 15 to 19 Years | 0 (0.0%) | 4 (2.4%) |
| 20 to 24 Years | 4 (3.6%) | 7 (4.2%) |
| 25 to 29 Years | 3 (2.7%) | 6 (3.6%) |
| 30 to 34 Years | 0 (0.0%) | 0 (0.0%) |
| 35 to 39 Years | 18 (16.4%) | 25 (14.9%) |
| 40 to 44 Years | 2 (1.8%) | 0 (0.0%) |
| 45 to 49 Years | 3 (2.7%) | 0 (0.0%) |
| 50 to 54 Years | 2 (1.8%) | 7 (4.2%) |
| 55 to 59 Years | 3 (2.7%) | 37 (22.0%) |
| 60 to 64 Years | 5 (4.5%) | 48 (28.6%) |
| 65 to 69 Years | 46 (41.8%) | 10 (5.9%) |
| 70 to 74 Years | 3 (2.7%) | 9 (5.4%) |
| 75 to 79 Years | 1 (0.9%) | 3 (1.8%) |
| 80 to 84 Years | 0 (0.0%) | 2 (1.2%) |
| 85 Years and over | 0 (0.0%) | 5 (3.0%) |
| Total | 110 (100.0%) | 168 (100.0%) |
Families and Households in Gotebo
Median Family Size in Gotebo
The median family size in Gotebo is 2.72 persons per family, with single male/father families (5 | 5.6%) accounting for the largest median family size of 4 persons per family. On the other hand, single female/mother families (4 | 4.5%) represent the smallest median family size with 2.25 persons per family.
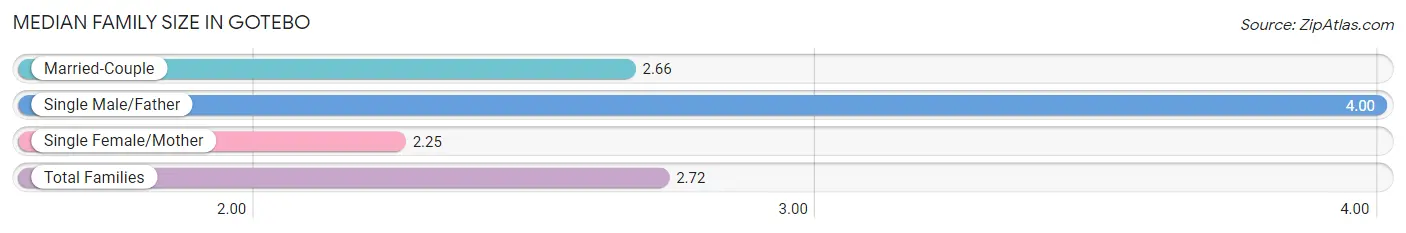
| Family Type | # Families | Family Size |
| Married-Couple | 80 (89.9%) | 2.66 |
| Single Male/Father | 5 (5.6%) | 4.00 |
| Single Female/Mother | 4 (4.5%) | 2.25 |
| Total Families | 89 (100.0%) | 2.72 |
Median Household Size in Gotebo
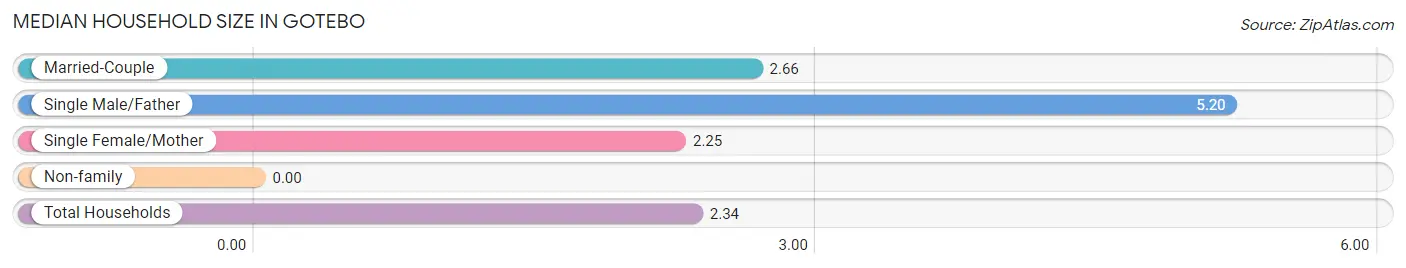
| Household Type | # Households | Household Size |
| Married-Couple | 80 (67.2%) | 2.66 |
| Single Male/Father | 5 (4.2%) | 5.20 |
| Single Female/Mother | 4 (3.4%) | 2.25 |
| Non-family | 30 (25.2%) | - |
| Total Households | 119 (100.0%) | 2.34 |
Household Size by Marriage Status in Gotebo
Out of a total of 119 households in Gotebo, 89 (74.8%) are family households, while 30 (25.2%) are nonfamily households. The most numerous type of family households are 3-person households, comprising 47, and the most common type of nonfamily households are 1-person households, comprising 30.
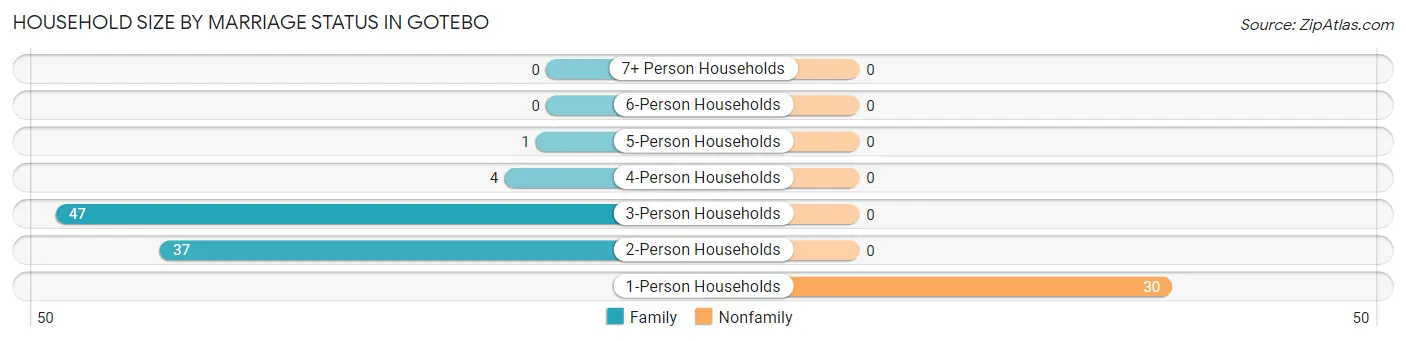
| Household Size | Family Households | Nonfamily Households |
| 1-Person Households | - | 30 (25.2%) |
| 2-Person Households | 37 (31.1%) | 0 (0.0%) |
| 3-Person Households | 47 (39.5%) | 0 (0.0%) |
| 4-Person Households | 4 (3.4%) | 0 (0.0%) |
| 5-Person Households | 1 (0.8%) | 0 (0.0%) |
| 6-Person Households | 0 (0.0%) | 0 (0.0%) |
| 7+ Person Households | 0 (0.0%) | 0 (0.0%) |
| Total | 89 (74.8%) | 30 (25.2%) |
Female Fertility in Gotebo
Fertility by Age in Gotebo
| Age Bracket | Women with Births | Births / 1,000 Women |
| 15 to 19 years | 0 (0.0%) | 0.0 |
| 20 to 34 years | 0 (0.0%) | 0.0 |
| 35 to 50 years | 0 (0.0%) | 0.0 |
| Total | 0 (0.0%) | 0.0 |
Fertility by Age by Marriage Status in Gotebo
| Age Bracket | Married | Unmarried |
| 15 to 19 years | 0 (0.0%) | 0 (0.0%) |
| 20 to 34 years | 0 (0.0%) | 0 (0.0%) |
| 35 to 50 years | 0 (0.0%) | 0 (0.0%) |
| Total | 0 (0.0%) | 0 (0.0%) |
Fertility by Education in Gotebo
| Educational Attainment | Women with Births | Births / 1,000 Women |
| Less than High School | 0 (0.0%) | 0.0 |
| High School Diploma | 0 (0.0%) | 0.0 |
| College or Associate's Degree | 0 (0.0%) | 0.0 |
| Bachelor's Degree | 0 (0.0%) | 0.0 |
| Graduate Degree | 0 (0.0%) | 0.0 |
| Total | 0 (0.0%) | 0.0 |
Fertility by Education by Marriage Status in Gotebo
| Educational Attainment | Married | Unmarried |
| Less than High School | 0 (0.0%) | 0 (0.0%) |
| High School Diploma | 0 (0.0%) | 0 (0.0%) |
| College or Associate's Degree | 0 (0.0%) | 0 (0.0%) |
| Bachelor's Degree | 0 (0.0%) | 0 (0.0%) |
| Graduate Degree | 0 (0.0%) | 0 (0.0%) |
| Total | 0 (0.0%) | 0 (0.0%) |
Employment Characteristics in Gotebo
Employment by Class of Employer in Gotebo
Among the 163 employed individuals in Gotebo, private company employees (118 | 72.4%), state government employees (20 | 12.3%), and self-employed (incorporated) (13 | 8.0%) make up the most common classes of employment.
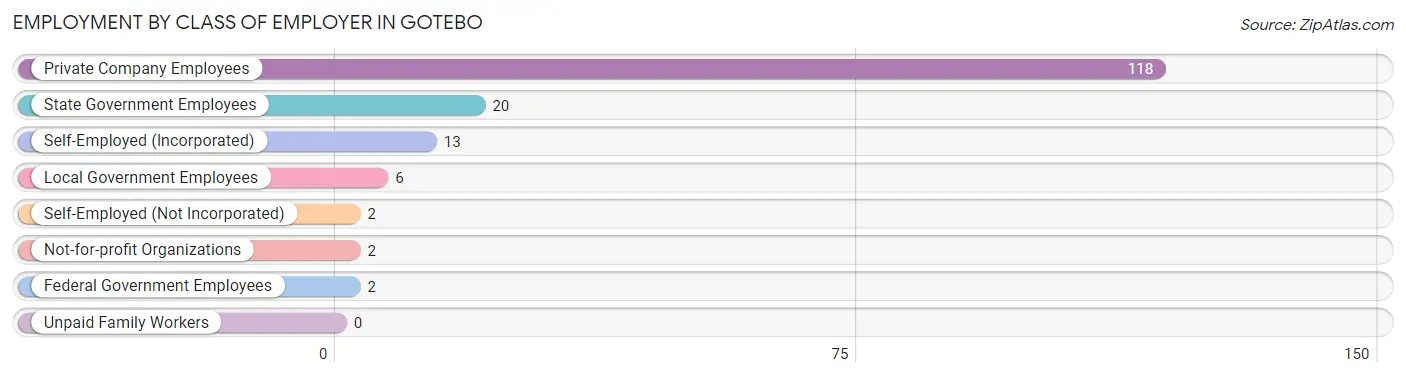
| Employer Class | # Employees | % Employees |
| Private Company Employees | 118 | 72.4% |
| Self-Employed (Incorporated) | 13 | 8.0% |
| Self-Employed (Not Incorporated) | 2 | 1.2% |
| Not-for-profit Organizations | 2 | 1.2% |
| Local Government Employees | 6 | 3.7% |
| State Government Employees | 20 | 12.3% |
| Federal Government Employees | 2 | 1.2% |
| Unpaid Family Workers | 0 | 0.0% |
| Total | 163 | 100.0% |
Employment Status by Age in Gotebo
According to the labor force statistics for Gotebo, out of the total population over 16 years of age (251), 66.5% or 167 individuals are in the labor force, with 0.6% or 1 of them unemployed. The age group with the highest labor force participation rate is 25 to 29 years, with 100.0% or 9 individuals in the labor force. Within the labor force, the 55 to 59 years age range has the highest percentage of unemployed individuals, with 2.7% or 1 of them being unemployed.
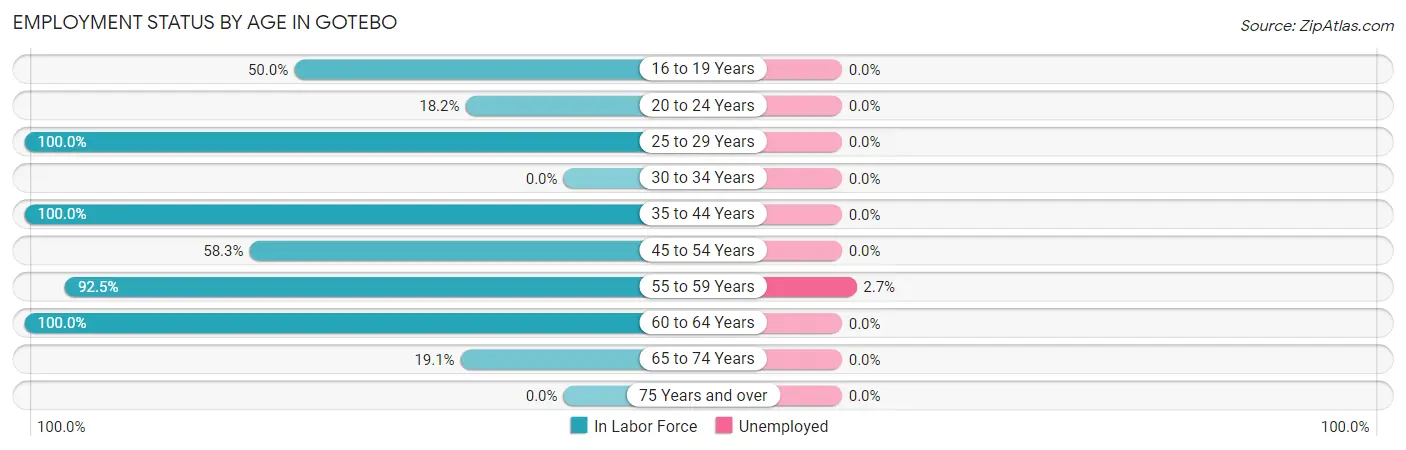
| Age Bracket | In Labor Force | Unemployed |
| 16 to 19 Years | 1 (50.0%) | 0 (0.0%) |
| 20 to 24 Years | 2 (18.2%) | 0 (0.0%) |
| 25 to 29 Years | 9 (100.0%) | 0 (0.0%) |
| 30 to 34 Years | 0 (0.0%) | 0 (0.0%) |
| 35 to 44 Years | 45 (100.0%) | 0 (0.0%) |
| 45 to 54 Years | 7 (58.3%) | 0 (0.0%) |
| 55 to 59 Years | 37 (92.5%) | 1 (2.7%) |
| 60 to 64 Years | 53 (100.0%) | 0 (0.0%) |
| 65 to 74 Years | 13 (19.1%) | 0 (0.0%) |
| 75 Years and over | 0 (0.0%) | 0 (0.0%) |
| Total | 167 (66.5%) | 1 (0.6%) |
Employment Status by Educational Attainment in Gotebo
According to labor force statistics for Gotebo, 95.0% of individuals (151) out of the total population between 25 and 64 years of age (159) are in the labor force, with 0.7% or 1 of them being unemployed. The group with the highest labor force participation rate are those with the educational attainment of college / associate degree, with 100.0% or 85 individuals in the labor force. Within the labor force, individuals with high school diploma education have the highest percentage of unemployment, with 3.0% or 1 of them being unemployed.
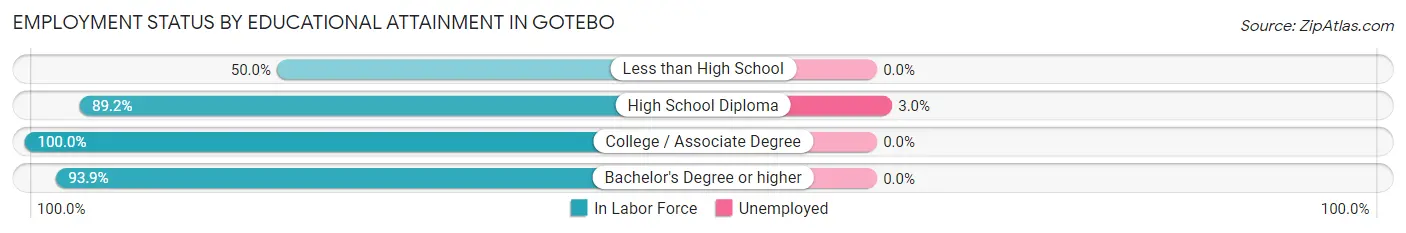
| Educational Attainment | In Labor Force | Unemployed |
| Less than High School | 2 (50.0%) | 0 (0.0%) |
| High School Diploma | 33 (89.2%) | 1 (3.0%) |
| College / Associate Degree | 85 (100.0%) | 0 (0.0%) |
| Bachelor's Degree or higher | 31 (93.9%) | 0 (0.0%) |
| Total | 151 (95.0%) | 1 (0.7%) |
Employment Occupations by Sex in Gotebo
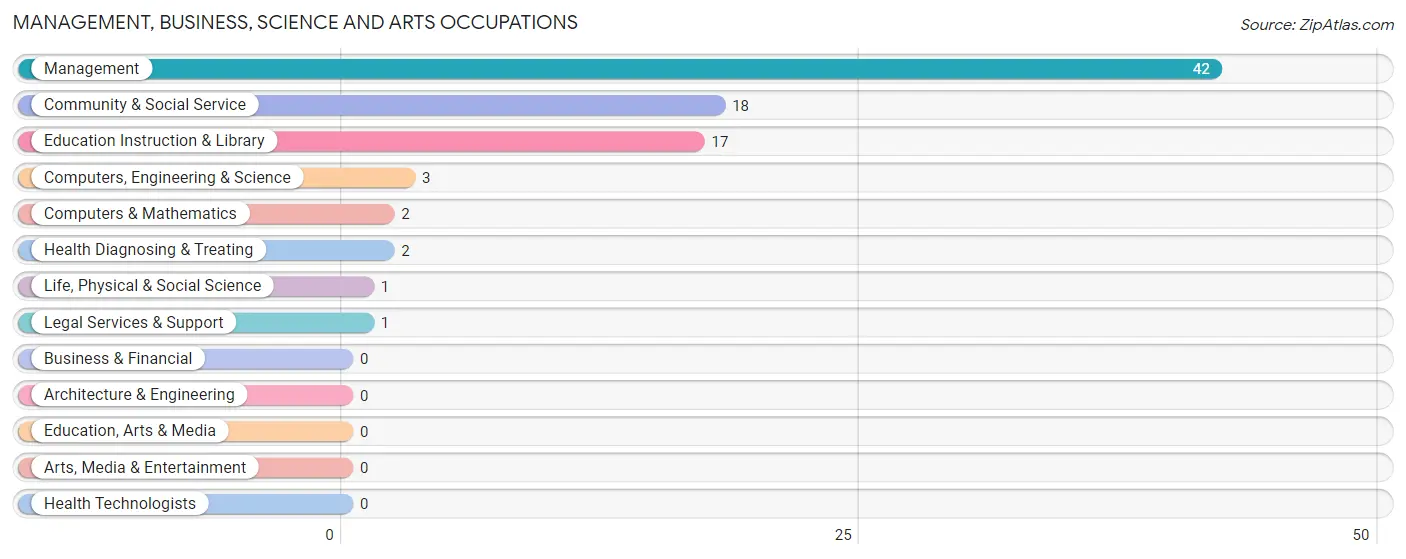
Management, Business, Science and Arts Occupations
The most common Management, Business, Science and Arts occupations in Gotebo are Management (42 | 25.3%), Community & Social Service (18 | 10.8%), Education Instruction & Library (17 | 10.2%), Computers, Engineering & Science (3 | 1.8%), and Computers & Mathematics (2 | 1.2%).
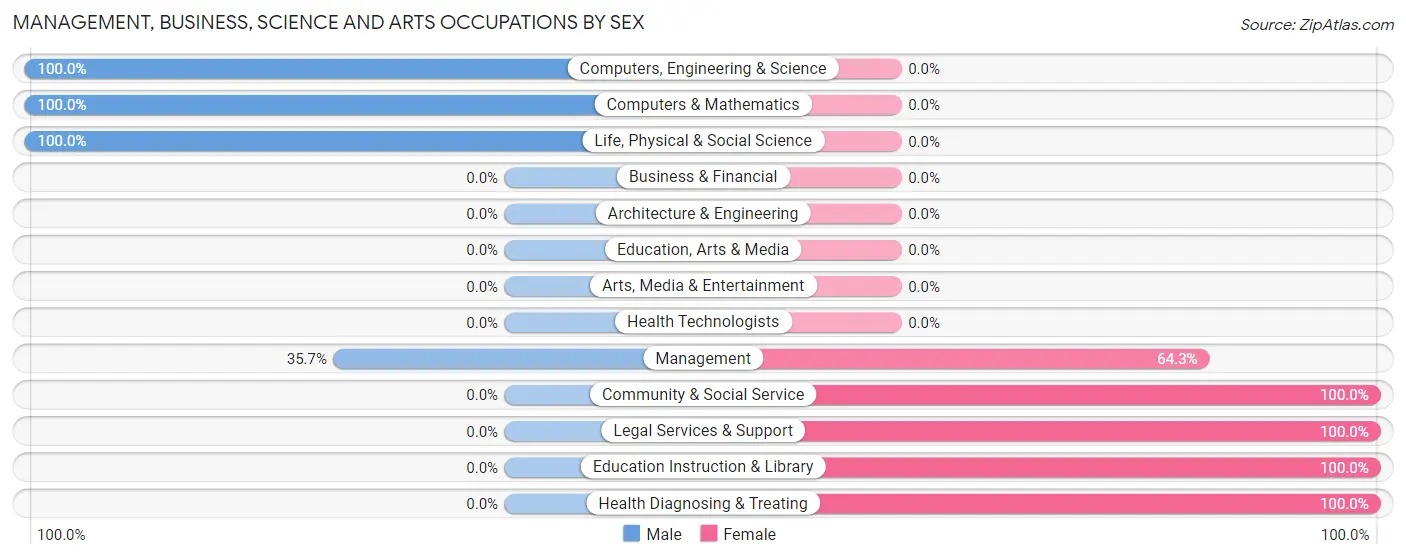
Management, Business, Science and Arts Occupations by Sex
Within the Management, Business, Science and Arts occupations in Gotebo, the most male-oriented occupations are Computers, Engineering & Science (100.0%), Computers & Mathematics (100.0%), and Life, Physical & Social Science (100.0%), while the most female-oriented occupations are Community & Social Service (100.0%), Legal Services & Support (100.0%), and Education Instruction & Library (100.0%).
| Occupation | Male | Female |
| Management | 15 (35.7%) | 27 (64.3%) |
| Business & Financial | 0 (0.0%) | 0 (0.0%) |
| Computers, Engineering & Science | 3 (100.0%) | 0 (0.0%) |
| Computers & Mathematics | 2 (100.0%) | 0 (0.0%) |
| Architecture & Engineering | 0 (0.0%) | 0 (0.0%) |
| Life, Physical & Social Science | 1 (100.0%) | 0 (0.0%) |
| Community & Social Service | 0 (0.0%) | 18 (100.0%) |
| Education, Arts & Media | 0 (0.0%) | 0 (0.0%) |
| Legal Services & Support | 0 (0.0%) | 1 (100.0%) |
| Education Instruction & Library | 0 (0.0%) | 17 (100.0%) |
| Arts, Media & Entertainment | 0 (0.0%) | 0 (0.0%) |
| Health Diagnosing & Treating | 0 (0.0%) | 2 (100.0%) |
| Health Technologists | 0 (0.0%) | 0 (0.0%) |
| Total (Category) | 18 (27.7%) | 47 (72.3%) |
| Total (Overall) | 38 (22.9%) | 128 (77.1%) |
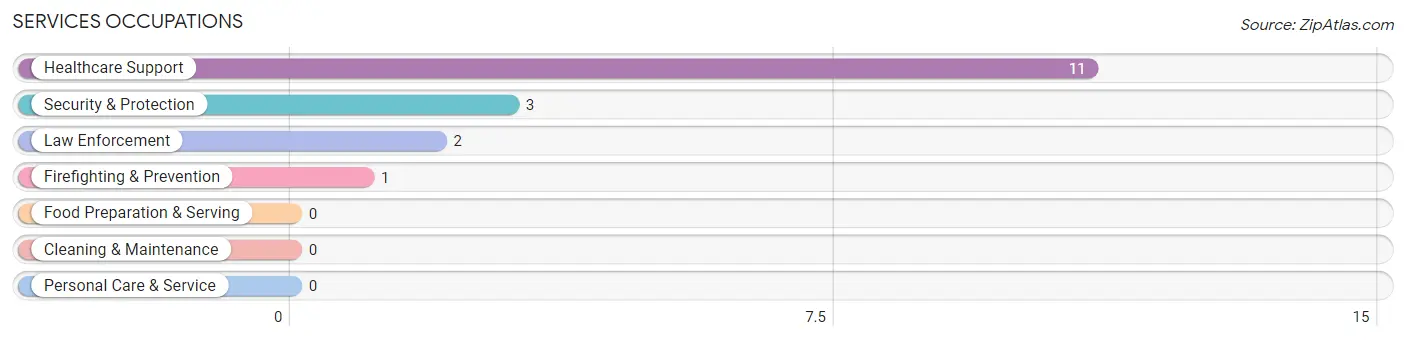
Services Occupations
The most common Services occupations in Gotebo are Healthcare Support (11 | 6.6%), Security & Protection (3 | 1.8%), Law Enforcement (2 | 1.2%), and Firefighting & Prevention (1 | 0.6%).
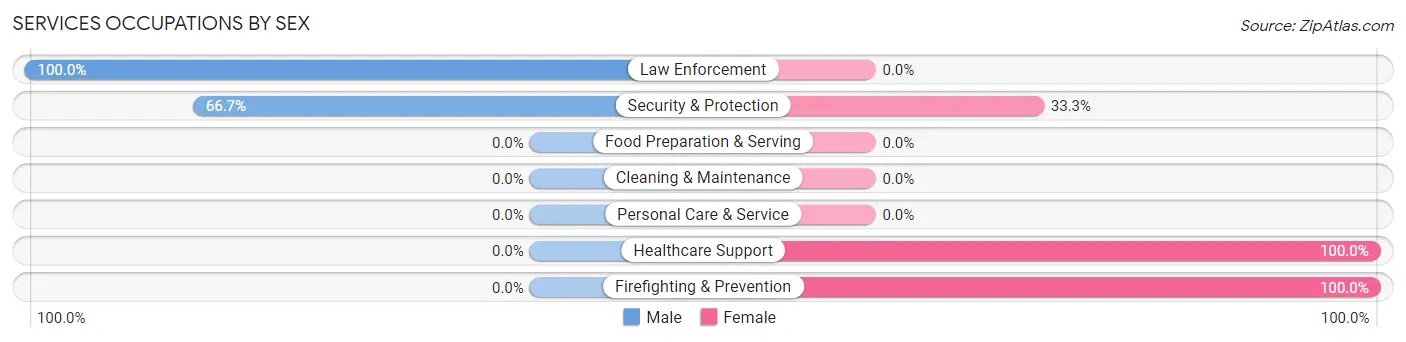
Services Occupations by Sex
Within the Services occupations in Gotebo, the most male-oriented occupations are Law Enforcement (100.0%), and Security & Protection (66.7%), while the most female-oriented occupations are Healthcare Support (100.0%), Firefighting & Prevention (100.0%), and Security & Protection (33.3%).
| Occupation | Male | Female |
| Healthcare Support | 0 (0.0%) | 11 (100.0%) |
| Security & Protection | 2 (66.7%) | 1 (33.3%) |
| Firefighting & Prevention | 0 (0.0%) | 1 (100.0%) |
| Law Enforcement | 2 (100.0%) | 0 (0.0%) |
| Food Preparation & Serving | 0 (0.0%) | 0 (0.0%) |
| Cleaning & Maintenance | 0 (0.0%) | 0 (0.0%) |
| Personal Care & Service | 0 (0.0%) | 0 (0.0%) |
| Total (Category) | 2 (14.3%) | 12 (85.7%) |
| Total (Overall) | 38 (22.9%) | 128 (77.1%) |
Sales and Office Occupations
The most common Sales and Office occupations in Gotebo are Office & Administration (59 | 35.5%), and Sales & Related (2 | 1.2%).
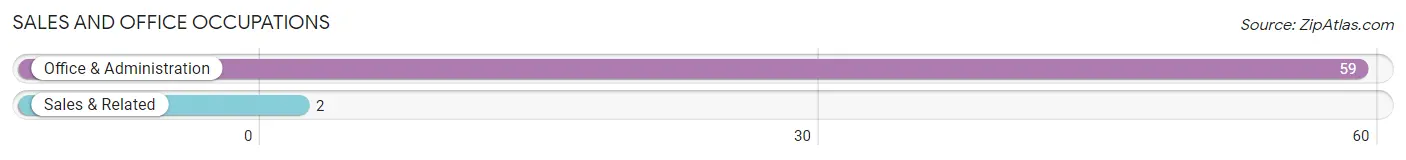
Sales and Office Occupations by Sex
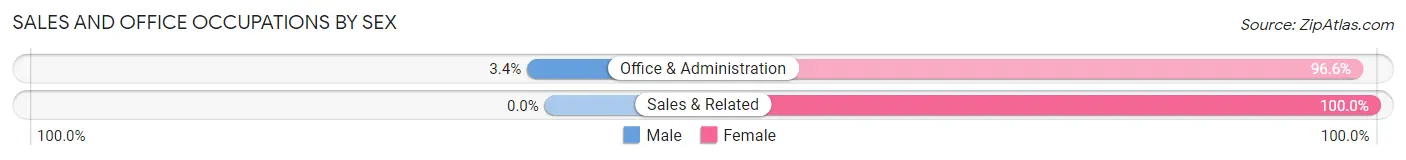
| Occupation | Male | Female |
| Sales & Related | 0 (0.0%) | 2 (100.0%) |
| Office & Administration | 2 (3.4%) | 57 (96.6%) |
| Total (Category) | 2 (3.3%) | 59 (96.7%) |
| Total (Overall) | 38 (22.9%) | 128 (77.1%) |
Natural Resources, Construction and Maintenance Occupations
The most common Natural Resources, Construction and Maintenance occupations in Gotebo are Construction & Extraction (7 | 4.2%), and Installation, Maintenance & Repair (2 | 1.2%).
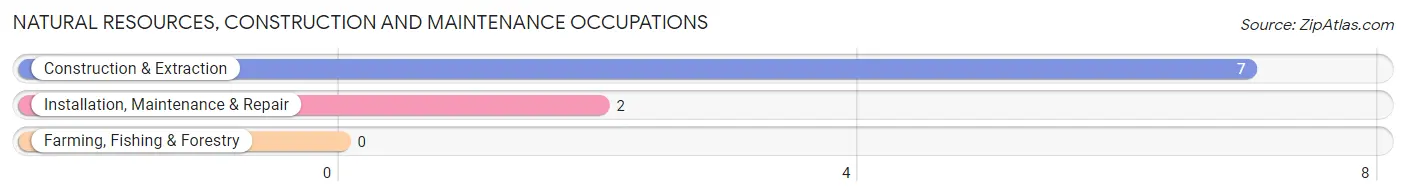
Natural Resources, Construction and Maintenance Occupations by Sex
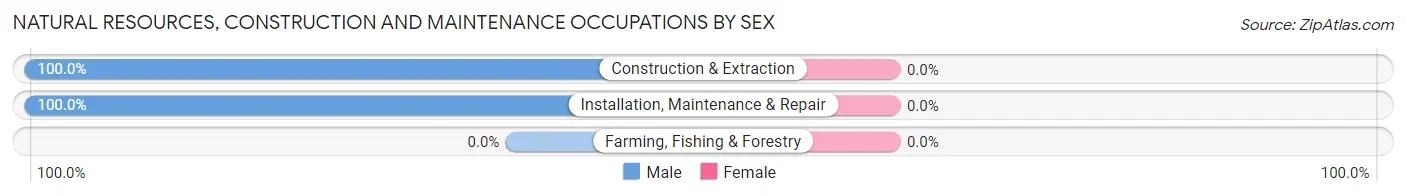
| Occupation | Male | Female |
| Farming, Fishing & Forestry | 0 (0.0%) | 0 (0.0%) |
| Construction & Extraction | 7 (100.0%) | 0 (0.0%) |
| Installation, Maintenance & Repair | 2 (100.0%) | 0 (0.0%) |
| Total (Category) | 9 (100.0%) | 0 (0.0%) |
| Total (Overall) | 38 (22.9%) | 128 (77.1%) |
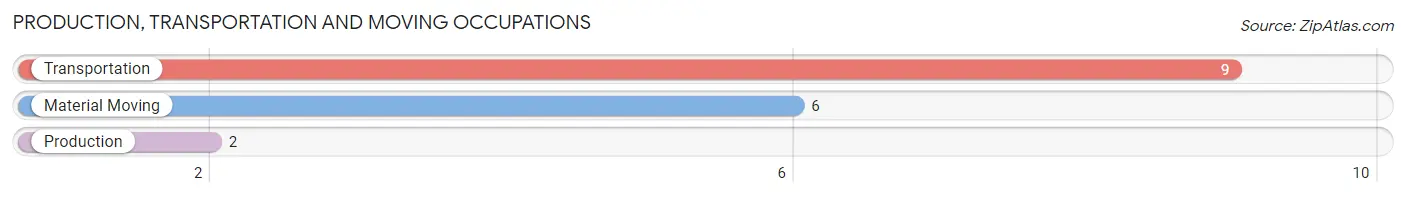
Production, Transportation and Moving Occupations
The most common Production, Transportation and Moving occupations in Gotebo are Transportation (9 | 5.4%), Material Moving (6 | 3.6%), and Production (2 | 1.2%).
Production, Transportation and Moving Occupations by Sex
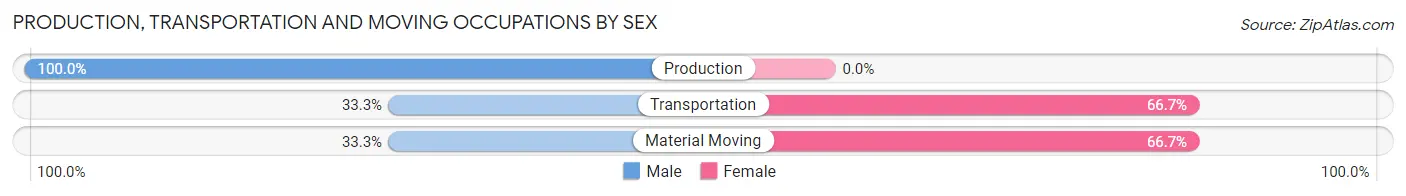
| Occupation | Male | Female |
| Production | 2 (100.0%) | 0 (0.0%) |
| Transportation | 3 (33.3%) | 6 (66.7%) |
| Material Moving | 2 (33.3%) | 4 (66.7%) |
| Total (Category) | 7 (41.2%) | 10 (58.8%) |
| Total (Overall) | 38 (22.9%) | 128 (77.1%) |
Employment Industries by Sex in Gotebo
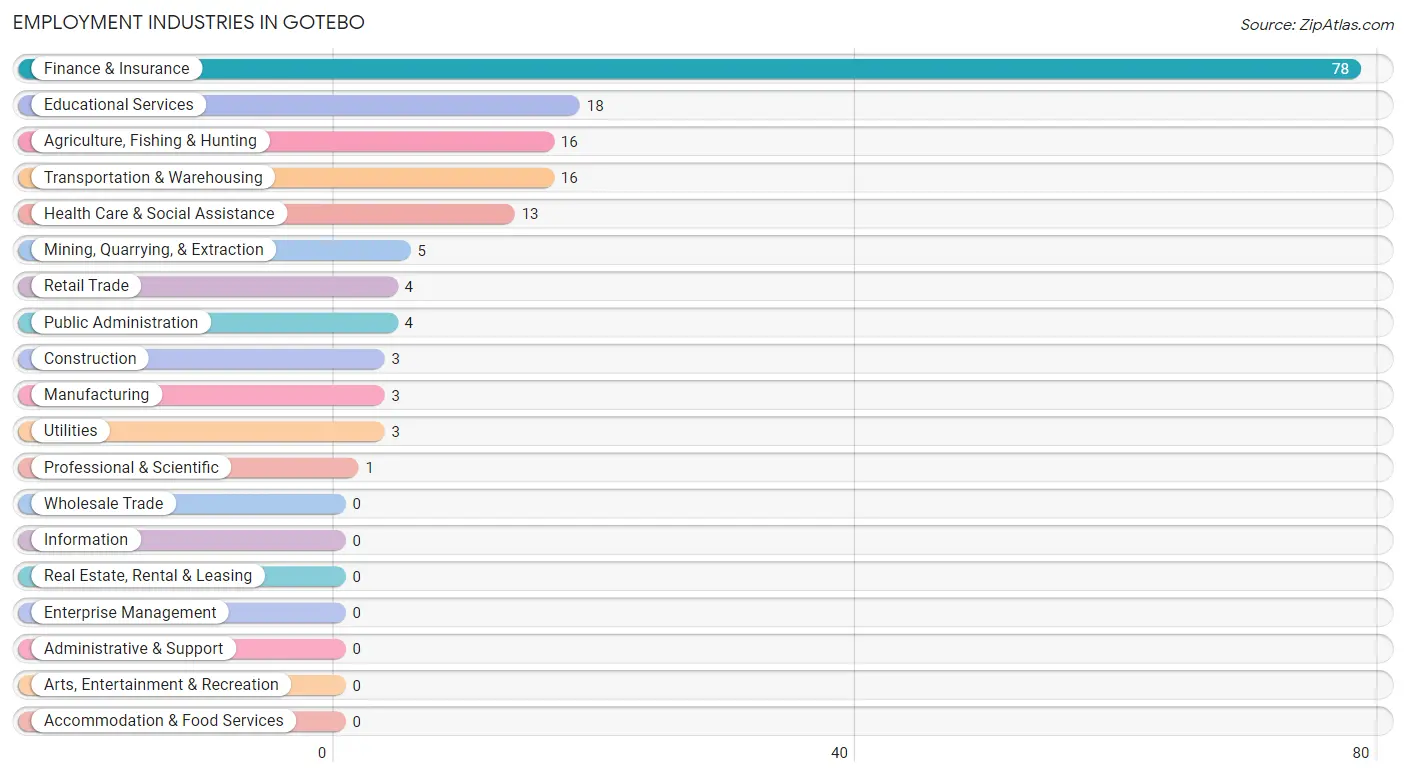
Employment Industries in Gotebo
The major employment industries in Gotebo include Finance & Insurance (78 | 47.0%), Educational Services (18 | 10.8%), Agriculture, Fishing & Hunting (16 | 9.6%), Transportation & Warehousing (16 | 9.6%), and Health Care & Social Assistance (13 | 7.8%).
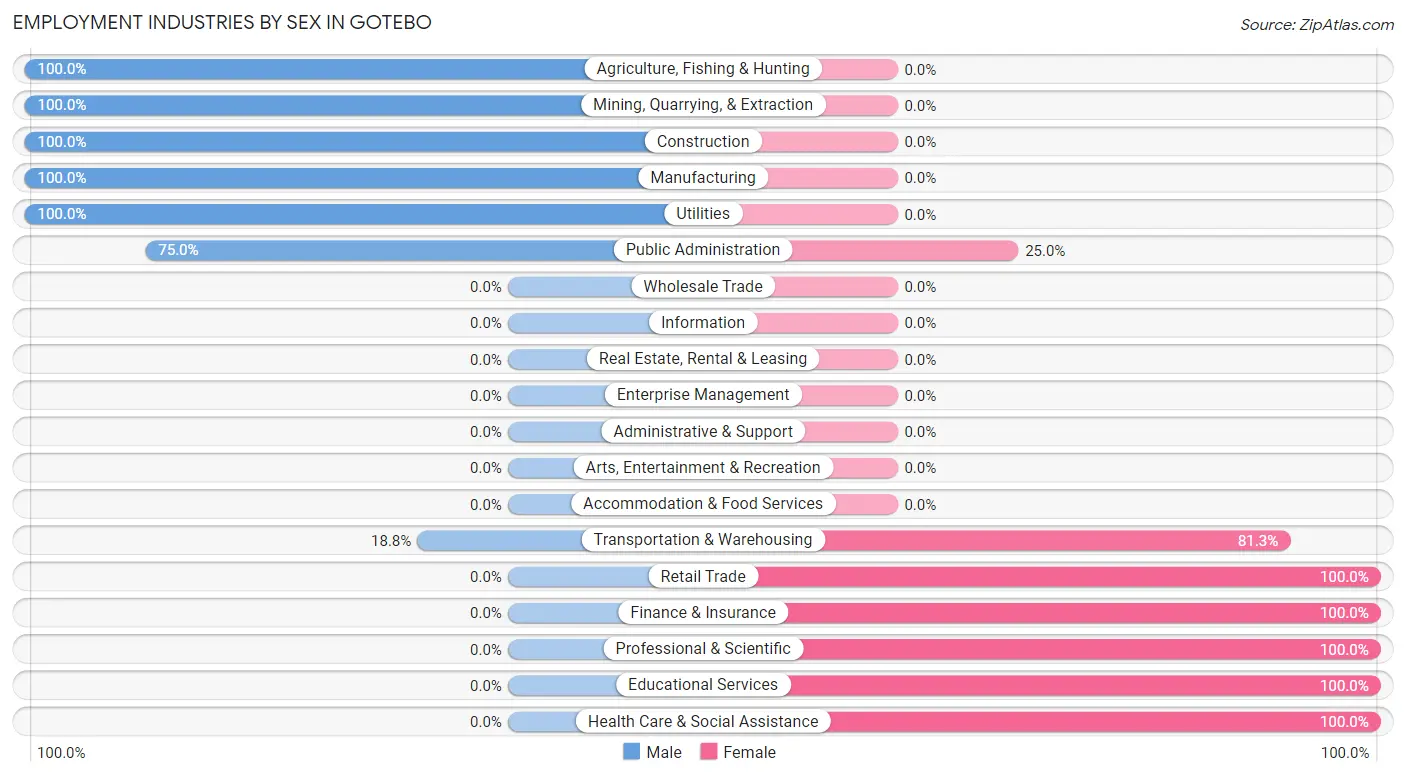
Employment Industries by Sex in Gotebo
The Gotebo industries that see more men than women are Agriculture, Fishing & Hunting (100.0%), Mining, Quarrying, & Extraction (100.0%), and Construction (100.0%), whereas the industries that tend to have a higher number of women are Retail Trade (100.0%), Finance & Insurance (100.0%), and Professional & Scientific (100.0%).
| Industry | Male | Female |
| Agriculture, Fishing & Hunting | 16 (100.0%) | 0 (0.0%) |
| Mining, Quarrying, & Extraction | 5 (100.0%) | 0 (0.0%) |
| Construction | 3 (100.0%) | 0 (0.0%) |
| Manufacturing | 3 (100.0%) | 0 (0.0%) |
| Wholesale Trade | 0 (0.0%) | 0 (0.0%) |
| Retail Trade | 0 (0.0%) | 4 (100.0%) |
| Transportation & Warehousing | 3 (18.8%) | 13 (81.2%) |
| Utilities | 3 (100.0%) | 0 (0.0%) |
| Information | 0 (0.0%) | 0 (0.0%) |
| Finance & Insurance | 0 (0.0%) | 78 (100.0%) |
| Real Estate, Rental & Leasing | 0 (0.0%) | 0 (0.0%) |
| Professional & Scientific | 0 (0.0%) | 1 (100.0%) |
| Enterprise Management | 0 (0.0%) | 0 (0.0%) |
| Administrative & Support | 0 (0.0%) | 0 (0.0%) |
| Educational Services | 0 (0.0%) | 18 (100.0%) |
| Health Care & Social Assistance | 0 (0.0%) | 13 (100.0%) |
| Arts, Entertainment & Recreation | 0 (0.0%) | 0 (0.0%) |
| Accommodation & Food Services | 0 (0.0%) | 0 (0.0%) |
| Public Administration | 3 (75.0%) | 1 (25.0%) |
| Total | 38 (22.9%) | 128 (77.1%) |
Education in Gotebo
School Enrollment in Gotebo
The most common levels of schooling among the 25 students in Gotebo are elementary school (12 | 48.0%), middle school (5 | 20.0%), and graduate / professional (4 | 16.0%).
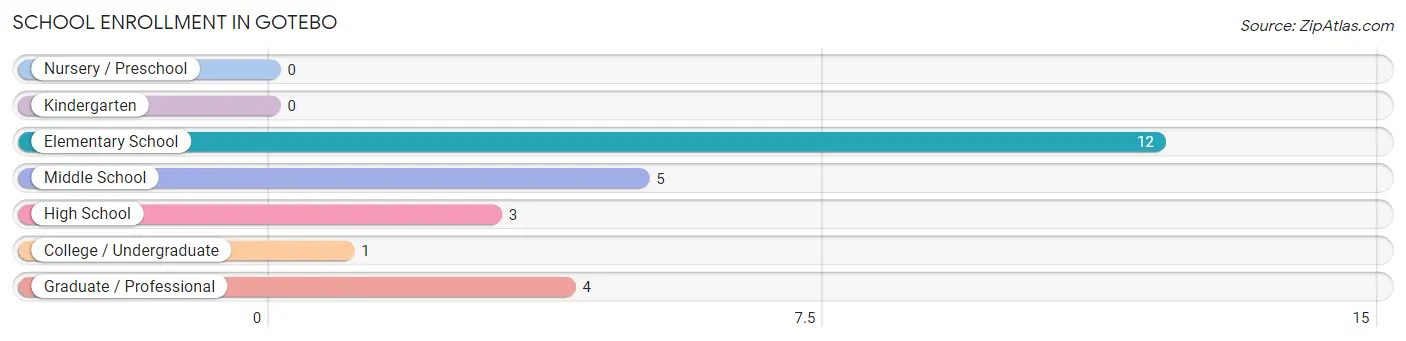
| School Level | # Students | % Students |
| Nursery / Preschool | 0 | 0.0% |
| Kindergarten | 0 | 0.0% |
| Elementary School | 12 | 48.0% |
| Middle School | 5 | 20.0% |
| High School | 3 | 12.0% |
| College / Undergraduate | 1 | 4.0% |
| Graduate / Professional | 4 | 16.0% |
| Total | 25 | 100.0% |
School Enrollment by Age by Funding Source in Gotebo
Out of a total of 25 students who are enrolled in schools in Gotebo, 1 (4.0%) attend a private institution, while the remaining 24 (96.0%) are enrolled in public schools. The age group of 10 to 14 year olds has the highest likelihood of being enrolled in private schools, with 1 (20.0% in the age bracket) enrolled. Conversely, the age group of 5 to 9 year old has the lowest likelihood of being enrolled in a private school, with 12 (100.0% in the age bracket) attending a public institution.
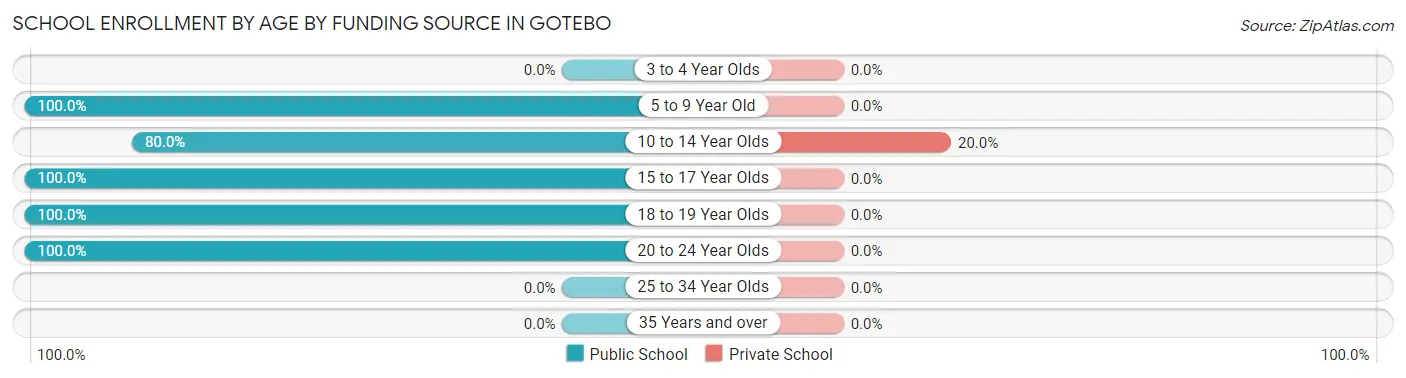
| Age Bracket | Public School | Private School |
| 3 to 4 Year Olds | 0 (0.0%) | 0 (0.0%) |
| 5 to 9 Year Old | 12 (100.0%) | 0 (0.0%) |
| 10 to 14 Year Olds | 4 (80.0%) | 1 (20.0%) |
| 15 to 17 Year Olds | 3 (100.0%) | 0 (0.0%) |
| 18 to 19 Year Olds | 1 (100.0%) | 0 (0.0%) |
| 20 to 24 Year Olds | 4 (100.0%) | 0 (0.0%) |
| 25 to 34 Year Olds | 0 (0.0%) | 0 (0.0%) |
| 35 Years and over | 0 (0.0%) | 0 (0.0%) |
| Total | 24 (96.0%) | 1 (4.0%) |
Educational Attainment by Field of Study in Gotebo
Education (15 | 42.9%), bio, nature & agricultural (14 | 40.0%), psychology (2 | 5.7%), arts & humanities (2 | 5.7%), and science & technology (1 | 2.9%) are the most common fields of study among 35 individuals in Gotebo who have obtained a bachelor's degree or higher.
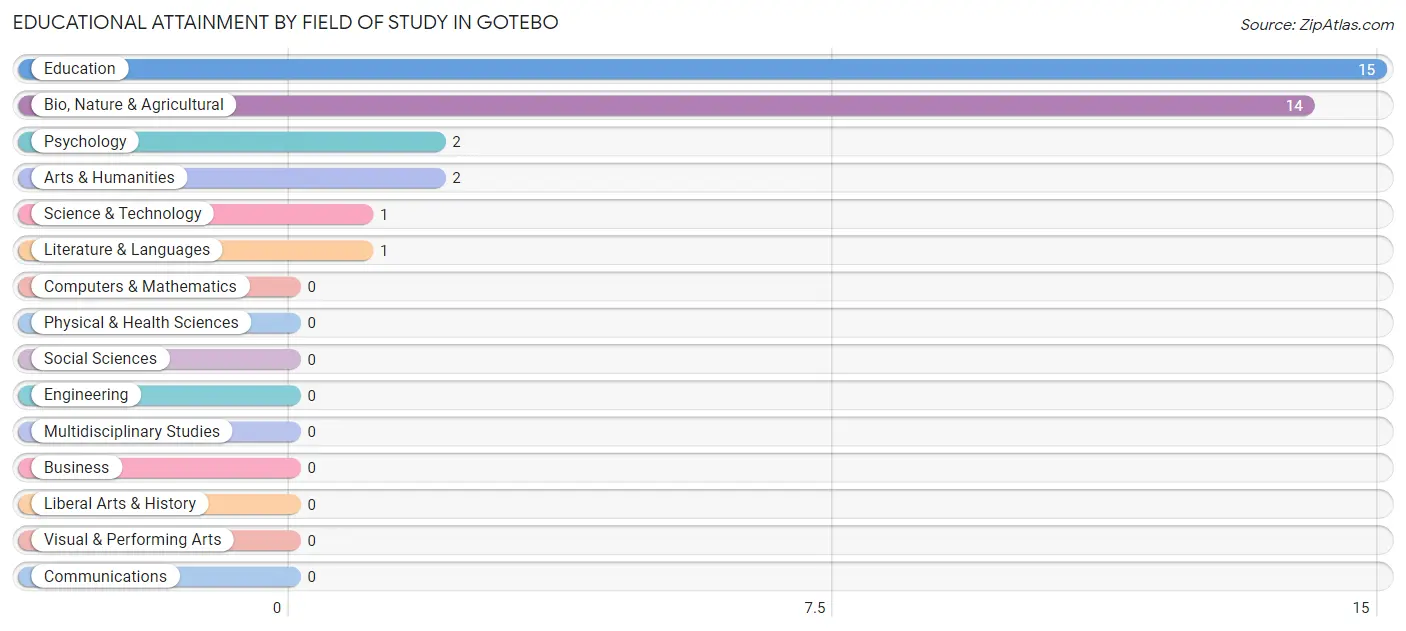
| Field of Study | # Graduates | % Graduates |
| Computers & Mathematics | 0 | 0.0% |
| Bio, Nature & Agricultural | 14 | 40.0% |
| Physical & Health Sciences | 0 | 0.0% |
| Psychology | 2 | 5.7% |
| Social Sciences | 0 | 0.0% |
| Engineering | 0 | 0.0% |
| Multidisciplinary Studies | 0 | 0.0% |
| Science & Technology | 1 | 2.9% |
| Business | 0 | 0.0% |
| Education | 15 | 42.9% |
| Literature & Languages | 1 | 2.9% |
| Liberal Arts & History | 0 | 0.0% |
| Visual & Performing Arts | 0 | 0.0% |
| Communications | 0 | 0.0% |
| Arts & Humanities | 2 | 5.7% |
| Total | 35 | 100.0% |
Transportation & Commute in Gotebo
Vehicle Availability by Sex in Gotebo
The most prevalent vehicle ownership categories in Gotebo are males with 3 vehicles (17, accounting for 44.7%) and females with 3 vehicles (17, making up 13.6%).
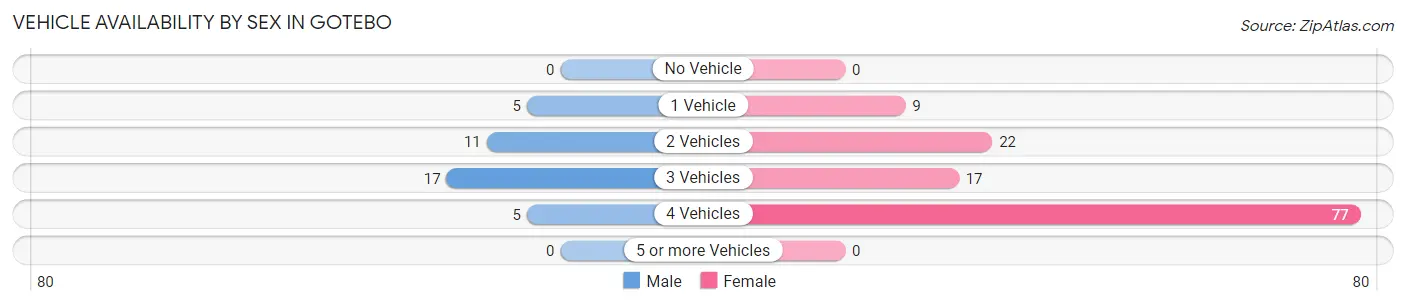
| Vehicles Available | Male | Female |
| No Vehicle | 0 (0.0%) | 0 (0.0%) |
| 1 Vehicle | 5 (13.2%) | 9 (7.2%) |
| 2 Vehicles | 11 (28.9%) | 22 (17.6%) |
| 3 Vehicles | 17 (44.7%) | 17 (13.6%) |
| 4 Vehicles | 5 (13.2%) | 77 (61.6%) |
| 5 or more Vehicles | 0 (0.0%) | 0 (0.0%) |
| Total | 38 (100.0%) | 125 (100.0%) |
Commute Time in Gotebo
The most frequently occuring commute durations in Gotebo are 30 to 34 minutes (72 commuters, 44.2%), 20 to 24 minutes (37 commuters, 22.7%), and less than 5 minutes (19 commuters, 11.7%).
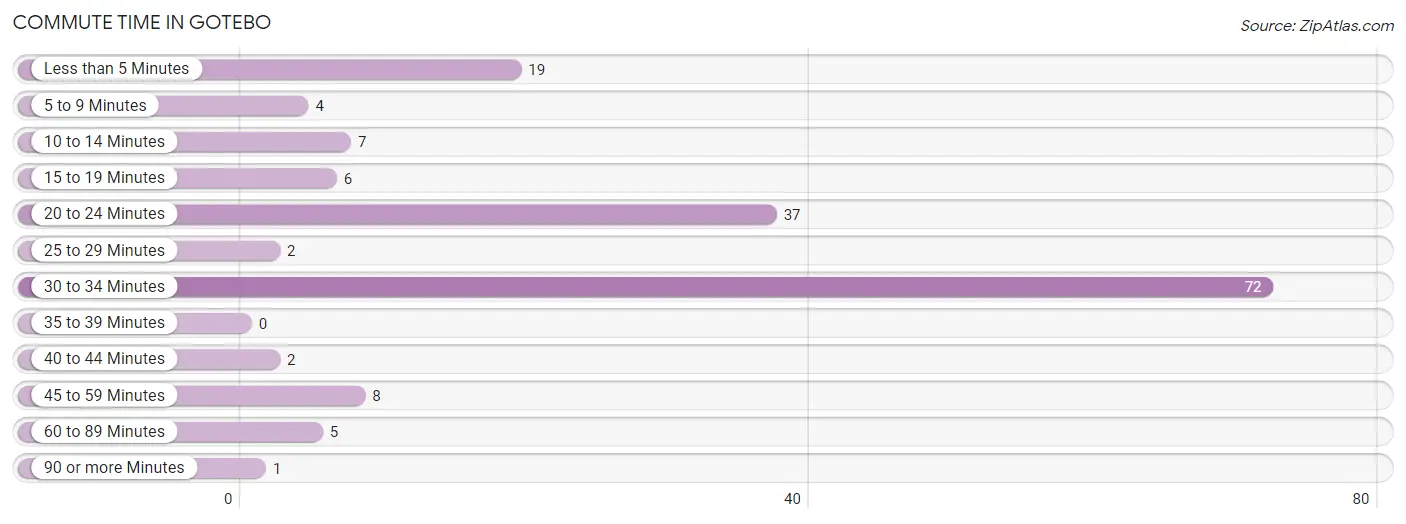
| Commute Time | # Commuters | % Commuters |
| Less than 5 Minutes | 19 | 11.7% |
| 5 to 9 Minutes | 4 | 2.5% |
| 10 to 14 Minutes | 7 | 4.3% |
| 15 to 19 Minutes | 6 | 3.7% |
| 20 to 24 Minutes | 37 | 22.7% |
| 25 to 29 Minutes | 2 | 1.2% |
| 30 to 34 Minutes | 72 | 44.2% |
| 35 to 39 Minutes | 0 | 0.0% |
| 40 to 44 Minutes | 2 | 1.2% |
| 45 to 59 Minutes | 8 | 4.9% |
| 60 to 89 Minutes | 5 | 3.1% |
| 90 or more Minutes | 1 | 0.6% |
Commute Time by Sex in Gotebo
The most common commute times in Gotebo are less than 5 minutes (14 commuters, 36.8%) for males and 30 to 34 minutes (72 commuters, 57.6%) for females.
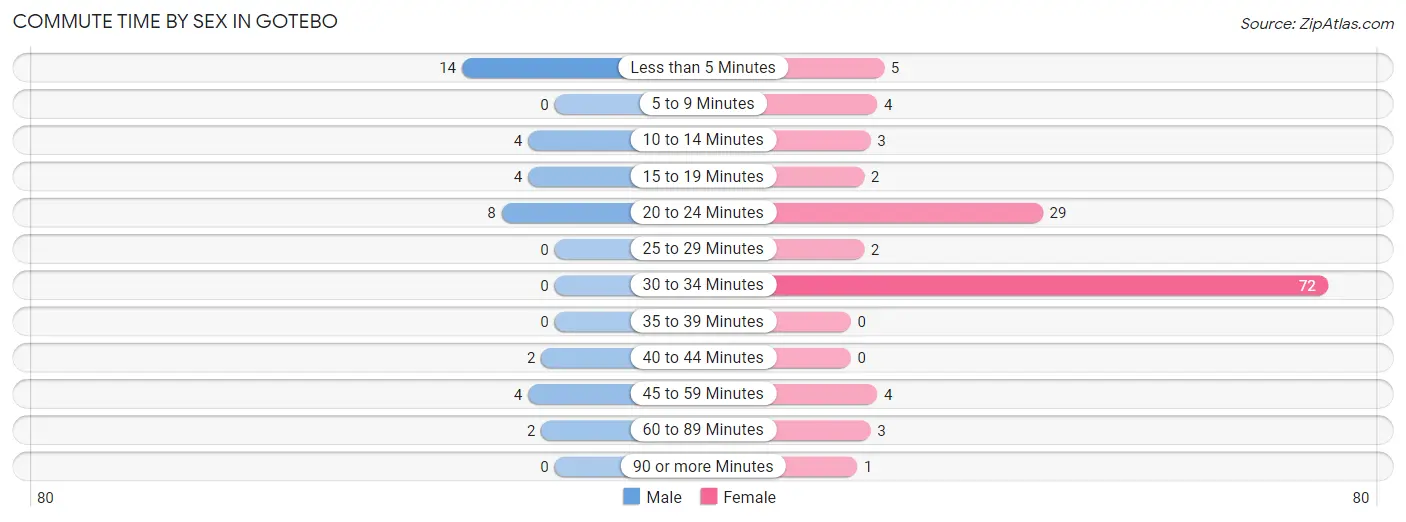
| Commute Time | Male | Female |
| Less than 5 Minutes | 14 (36.8%) | 5 (4.0%) |
| 5 to 9 Minutes | 0 (0.0%) | 4 (3.2%) |
| 10 to 14 Minutes | 4 (10.5%) | 3 (2.4%) |
| 15 to 19 Minutes | 4 (10.5%) | 2 (1.6%) |
| 20 to 24 Minutes | 8 (21.0%) | 29 (23.2%) |
| 25 to 29 Minutes | 0 (0.0%) | 2 (1.6%) |
| 30 to 34 Minutes | 0 (0.0%) | 72 (57.6%) |
| 35 to 39 Minutes | 0 (0.0%) | 0 (0.0%) |
| 40 to 44 Minutes | 2 (5.3%) | 0 (0.0%) |
| 45 to 59 Minutes | 4 (10.5%) | 4 (3.2%) |
| 60 to 89 Minutes | 2 (5.3%) | 3 (2.4%) |
| 90 or more Minutes | 0 (0.0%) | 1 (0.8%) |
Time of Departure to Work by Sex in Gotebo
The most frequent times of departure to work in Gotebo are 6:30 AM to 6:59 AM (21, 55.3%) for males and 7:00 AM to 7:29 AM (98, 78.4%) for females.
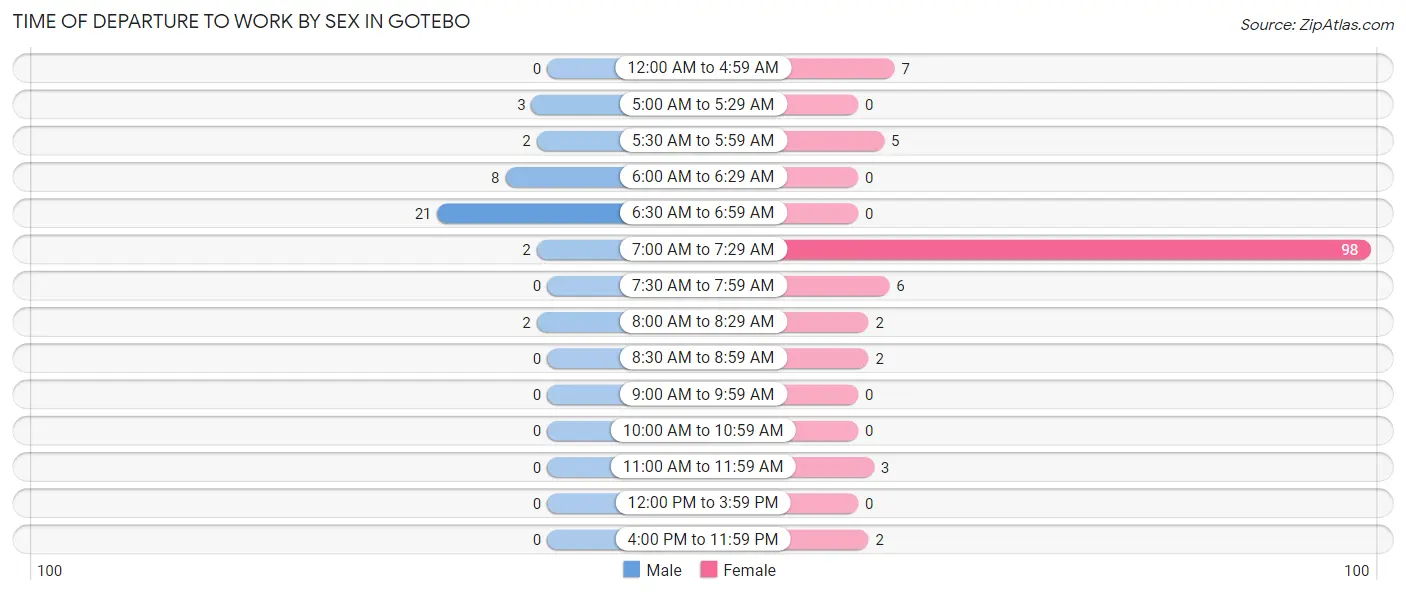
| Time of Departure | Male | Female |
| 12:00 AM to 4:59 AM | 0 (0.0%) | 7 (5.6%) |
| 5:00 AM to 5:29 AM | 3 (7.9%) | 0 (0.0%) |
| 5:30 AM to 5:59 AM | 2 (5.3%) | 5 (4.0%) |
| 6:00 AM to 6:29 AM | 8 (21.0%) | 0 (0.0%) |
| 6:30 AM to 6:59 AM | 21 (55.3%) | 0 (0.0%) |
| 7:00 AM to 7:29 AM | 2 (5.3%) | 98 (78.4%) |
| 7:30 AM to 7:59 AM | 0 (0.0%) | 6 (4.8%) |
| 8:00 AM to 8:29 AM | 2 (5.3%) | 2 (1.6%) |
| 8:30 AM to 8:59 AM | 0 (0.0%) | 2 (1.6%) |
| 9:00 AM to 9:59 AM | 0 (0.0%) | 0 (0.0%) |
| 10:00 AM to 10:59 AM | 0 (0.0%) | 0 (0.0%) |
| 11:00 AM to 11:59 AM | 0 (0.0%) | 3 (2.4%) |
| 12:00 PM to 3:59 PM | 0 (0.0%) | 0 (0.0%) |
| 4:00 PM to 11:59 PM | 0 (0.0%) | 2 (1.6%) |
| Total | 38 (100.0%) | 125 (100.0%) |
Housing Occupancy in Gotebo
Occupancy by Ownership in Gotebo
Of the total 119 dwellings in Gotebo, owner-occupied units account for 91 (76.5%), while renter-occupied units make up 28 (23.5%).
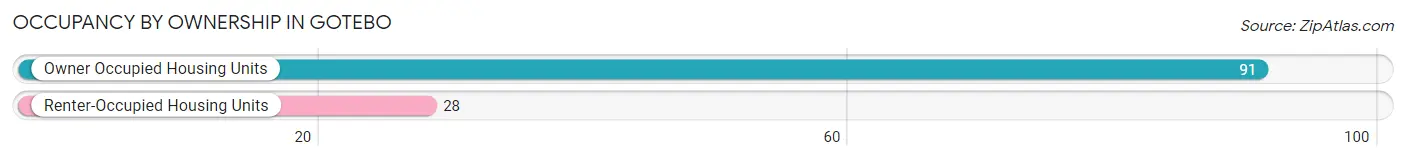
| Occupancy | # Housing Units | % Housing Units |
| Owner Occupied Housing Units | 91 | 76.5% |
| Renter-Occupied Housing Units | 28 | 23.5% |
| Total Occupied Housing Units | 119 | 100.0% |
Occupancy by Household Size in Gotebo
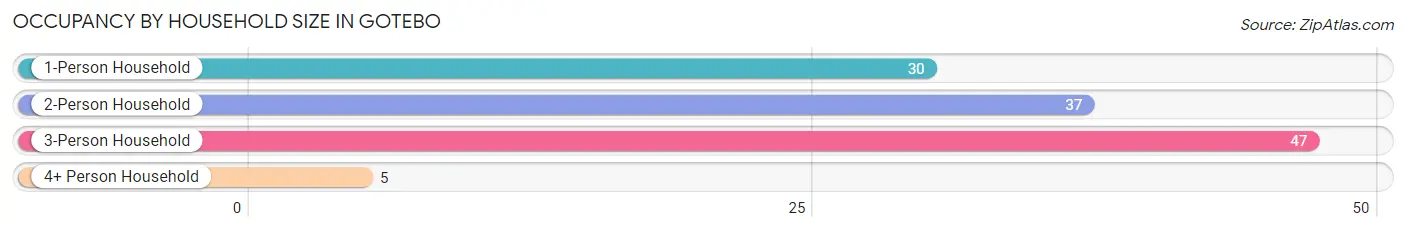
| Household Size | # Housing Units | % Housing Units |
| 1-Person Household | 30 | 25.2% |
| 2-Person Household | 37 | 31.1% |
| 3-Person Household | 47 | 39.5% |
| 4+ Person Household | 5 | 4.2% |
| Total Housing Units | 119 | 100.0% |
Occupancy by Ownership by Household Size in Gotebo
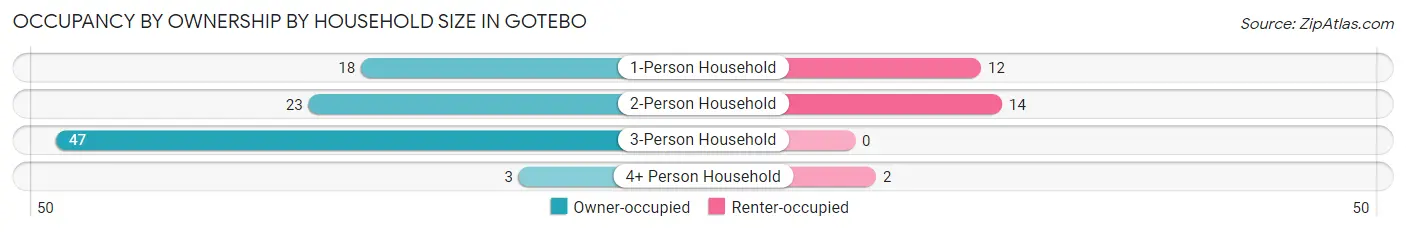
| Household Size | Owner-occupied | Renter-occupied |
| 1-Person Household | 18 (60.0%) | 12 (40.0%) |
| 2-Person Household | 23 (62.2%) | 14 (37.8%) |
| 3-Person Household | 47 (100.0%) | 0 (0.0%) |
| 4+ Person Household | 3 (60.0%) | 2 (40.0%) |
| Total Housing Units | 91 (76.5%) | 28 (23.5%) |
Occupancy by Educational Attainment in Gotebo
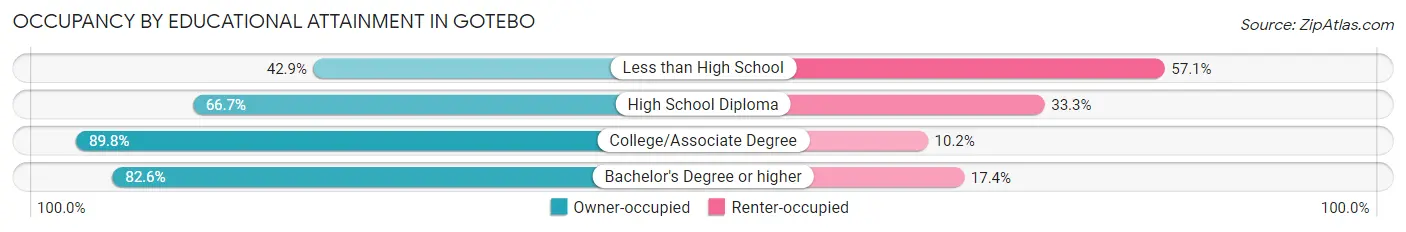
| Household Size | Owner-occupied | Renter-occupied |
| Less than High School | 6 (42.9%) | 8 (57.1%) |
| High School Diploma | 22 (66.7%) | 11 (33.3%) |
| College/Associate Degree | 44 (89.8%) | 5 (10.2%) |
| Bachelor's Degree or higher | 19 (82.6%) | 4 (17.4%) |
Occupancy by Age of Householder in Gotebo
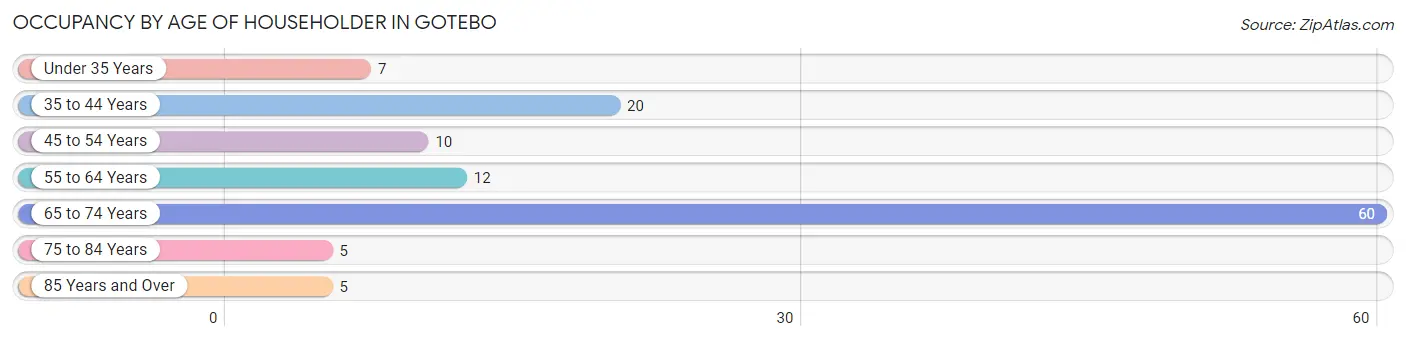
| Age Bracket | # Households | % Households |
| Under 35 Years | 7 | 5.9% |
| 35 to 44 Years | 20 | 16.8% |
| 45 to 54 Years | 10 | 8.4% |
| 55 to 64 Years | 12 | 10.1% |
| 65 to 74 Years | 60 | 50.4% |
| 75 to 84 Years | 5 | 4.2% |
| 85 Years and Over | 5 | 4.2% |
| Total | 119 | 100.0% |
Housing Finances in Gotebo
Median Income by Occupancy in Gotebo
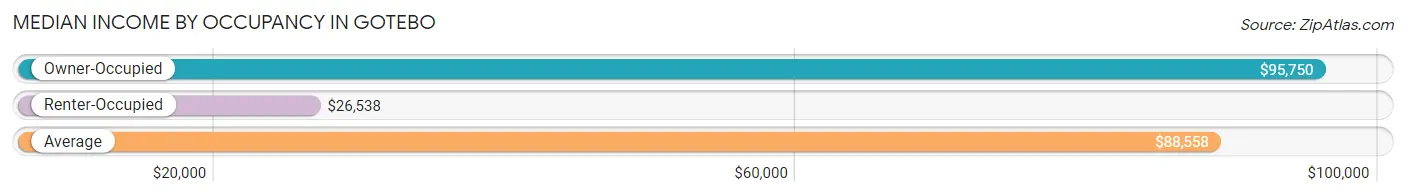
| Occupancy Type | # Households | Median Income |
| Owner-Occupied | 91 (76.5%) | $95,750 |
| Renter-Occupied | 28 (23.5%) | $26,538 |
| Average | 119 (100.0%) | $88,558 |
Occupancy by Householder Income Bracket in Gotebo
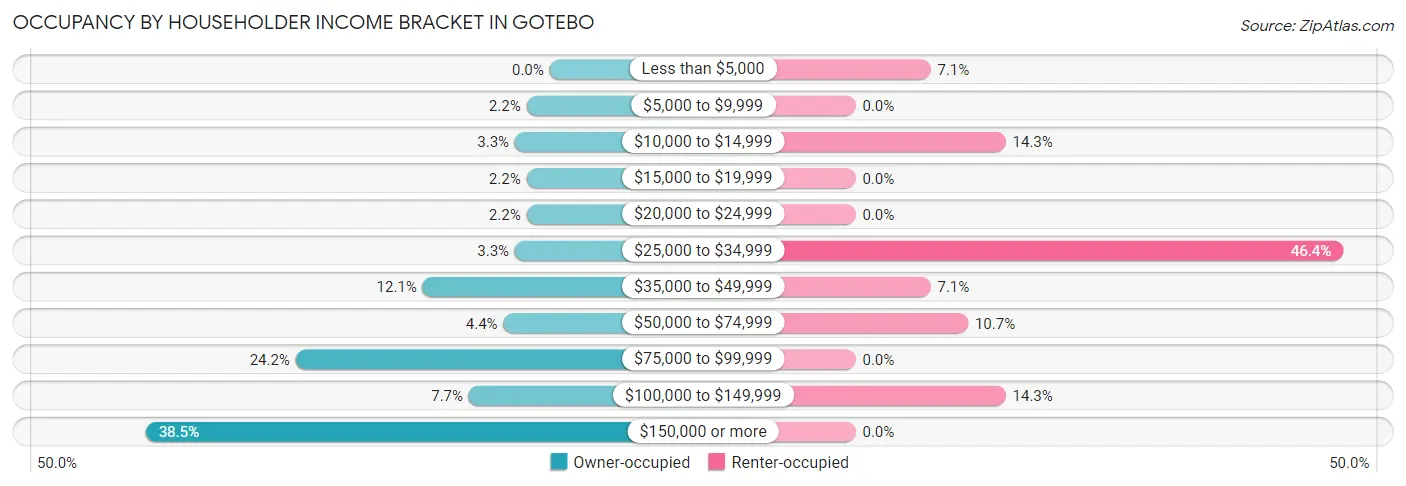
| Income Bracket | Owner-occupied | Renter-occupied |
| Less than $5,000 | 0 (0.0%) | 2 (7.1%) |
| $5,000 to $9,999 | 2 (2.2%) | 0 (0.0%) |
| $10,000 to $14,999 | 3 (3.3%) | 4 (14.3%) |
| $15,000 to $19,999 | 2 (2.2%) | 0 (0.0%) |
| $20,000 to $24,999 | 2 (2.2%) | 0 (0.0%) |
| $25,000 to $34,999 | 3 (3.3%) | 13 (46.4%) |
| $35,000 to $49,999 | 11 (12.1%) | 2 (7.1%) |
| $50,000 to $74,999 | 4 (4.4%) | 3 (10.7%) |
| $75,000 to $99,999 | 22 (24.2%) | 0 (0.0%) |
| $100,000 to $149,999 | 7 (7.7%) | 4 (14.3%) |
| $150,000 or more | 35 (38.5%) | 0 (0.0%) |
| Total | 91 (100.0%) | 28 (100.0%) |
Monthly Housing Cost Tiers in Gotebo
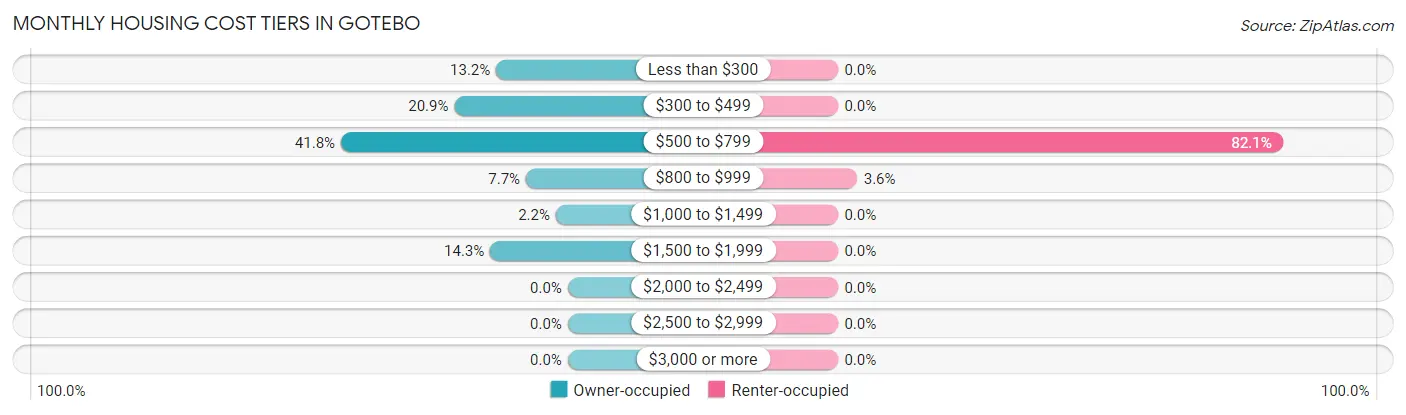
| Monthly Cost | Owner-occupied | Renter-occupied |
| Less than $300 | 12 (13.2%) | 0 (0.0%) |
| $300 to $499 | 19 (20.9%) | 0 (0.0%) |
| $500 to $799 | 38 (41.8%) | 23 (82.1%) |
| $800 to $999 | 7 (7.7%) | 1 (3.6%) |
| $1,000 to $1,499 | 2 (2.2%) | 0 (0.0%) |
| $1,500 to $1,999 | 13 (14.3%) | 0 (0.0%) |
| $2,000 to $2,499 | 0 (0.0%) | 0 (0.0%) |
| $2,500 to $2,999 | 0 (0.0%) | 0 (0.0%) |
| $3,000 or more | 0 (0.0%) | 0 (0.0%) |
| Total | 91 (100.0%) | 28 (100.0%) |
Physical Housing Characteristics in Gotebo
Housing Structures in Gotebo
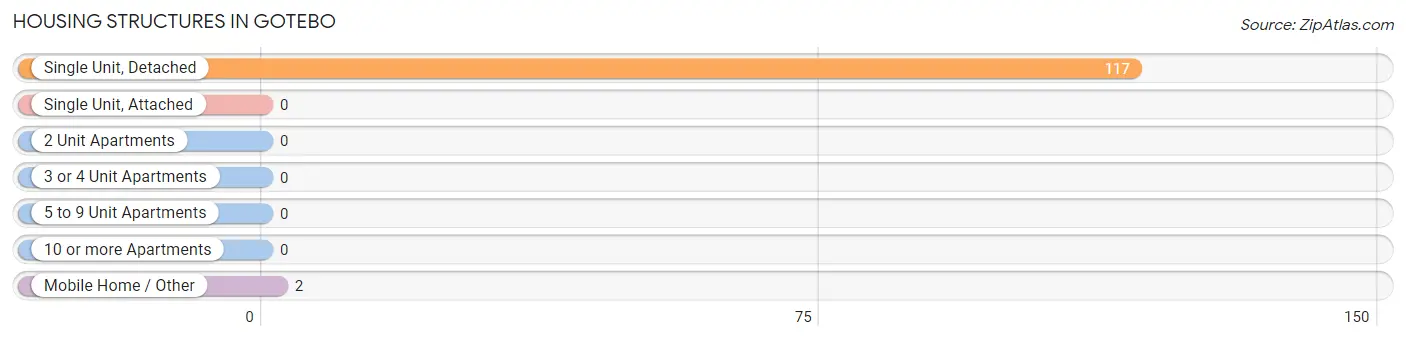
| Structure Type | # Housing Units | % Housing Units |
| Single Unit, Detached | 117 | 98.3% |
| Single Unit, Attached | 0 | 0.0% |
| 2 Unit Apartments | 0 | 0.0% |
| 3 or 4 Unit Apartments | 0 | 0.0% |
| 5 to 9 Unit Apartments | 0 | 0.0% |
| 10 or more Apartments | 0 | 0.0% |
| Mobile Home / Other | 2 | 1.7% |
| Total | 119 | 100.0% |
Housing Structures by Occupancy in Gotebo
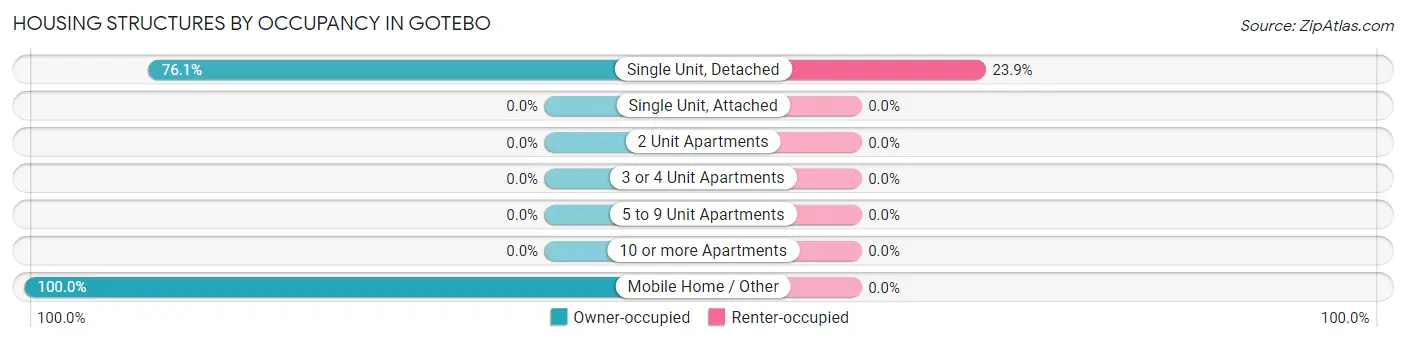
| Structure Type | Owner-occupied | Renter-occupied |
| Single Unit, Detached | 89 (76.1%) | 28 (23.9%) |
| Single Unit, Attached | 0 (0.0%) | 0 (0.0%) |
| 2 Unit Apartments | 0 (0.0%) | 0 (0.0%) |
| 3 or 4 Unit Apartments | 0 (0.0%) | 0 (0.0%) |
| 5 to 9 Unit Apartments | 0 (0.0%) | 0 (0.0%) |
| 10 or more Apartments | 0 (0.0%) | 0 (0.0%) |
| Mobile Home / Other | 2 (100.0%) | 0 (0.0%) |
| Total | 91 (76.5%) | 28 (23.5%) |
Housing Structures by Number of Rooms in Gotebo
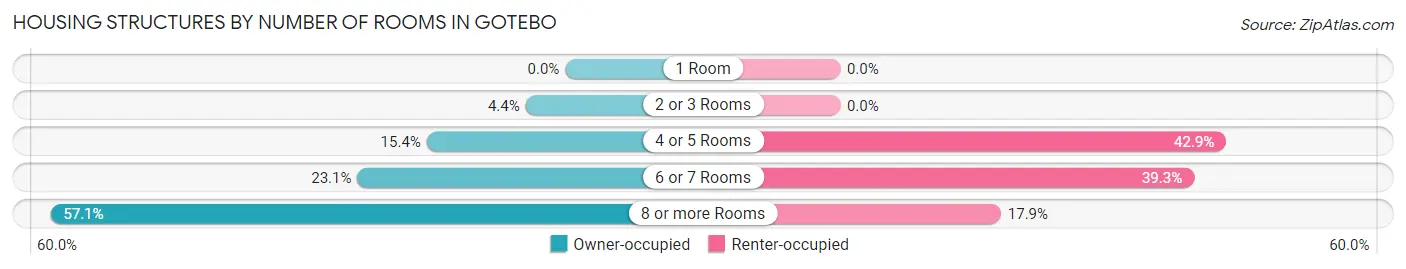
| Number of Rooms | Owner-occupied | Renter-occupied |
| 1 Room | 0 (0.0%) | 0 (0.0%) |
| 2 or 3 Rooms | 4 (4.4%) | 0 (0.0%) |
| 4 or 5 Rooms | 14 (15.4%) | 12 (42.9%) |
| 6 or 7 Rooms | 21 (23.1%) | 11 (39.3%) |
| 8 or more Rooms | 52 (57.1%) | 5 (17.9%) |
| Total | 91 (100.0%) | 28 (100.0%) |
Housing Structure by Heating Type in Gotebo
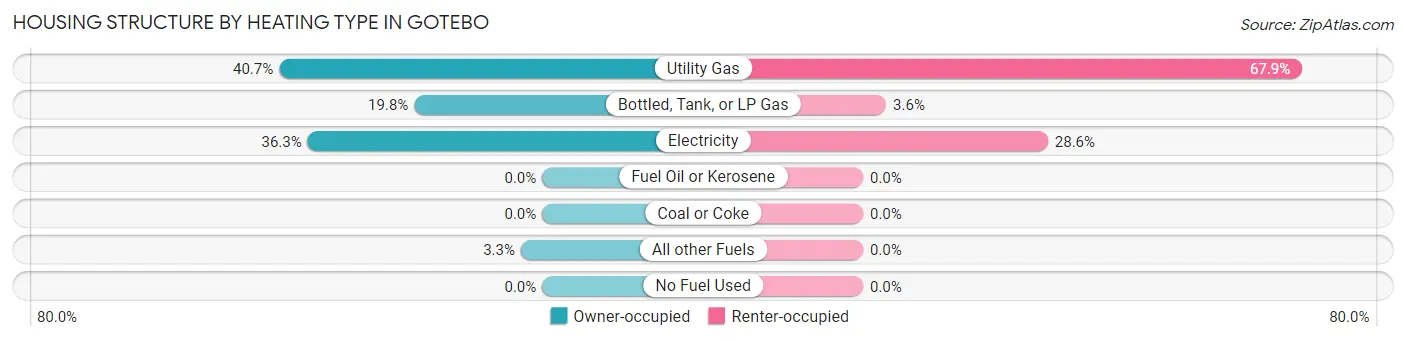
| Heating Type | Owner-occupied | Renter-occupied |
| Utility Gas | 37 (40.7%) | 19 (67.9%) |
| Bottled, Tank, or LP Gas | 18 (19.8%) | 1 (3.6%) |
| Electricity | 33 (36.3%) | 8 (28.6%) |
| Fuel Oil or Kerosene | 0 (0.0%) | 0 (0.0%) |
| Coal or Coke | 0 (0.0%) | 0 (0.0%) |
| All other Fuels | 3 (3.3%) | 0 (0.0%) |
| No Fuel Used | 0 (0.0%) | 0 (0.0%) |
| Total | 91 (100.0%) | 28 (100.0%) |
Household Vehicle Usage in Gotebo
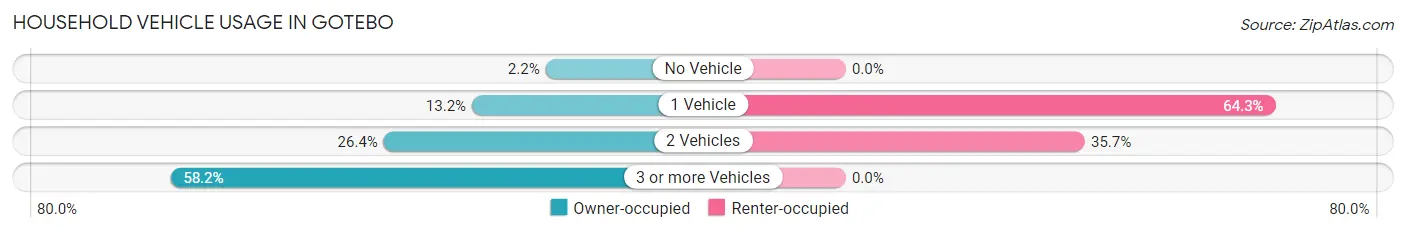
| Vehicles per Household | Owner-occupied | Renter-occupied |
| No Vehicle | 2 (2.2%) | 0 (0.0%) |
| 1 Vehicle | 12 (13.2%) | 18 (64.3%) |
| 2 Vehicles | 24 (26.4%) | 10 (35.7%) |
| 3 or more Vehicles | 53 (58.2%) | 0 (0.0%) |
| Total | 91 (100.0%) | 28 (100.0%) |
Real Estate & Mortgages in Gotebo
Real Estate and Mortgage Overview in Gotebo
| Characteristic | Without Mortgage | With Mortgage |
| Housing Units | 62 | 29 |
| Median Property Value | $150,800 | $0 |
| Median Household Income | - | - |
| Monthly Housing Costs | $509 | $0 |
| Real Estate Taxes | - | - |
Property Value by Mortgage Status in Gotebo
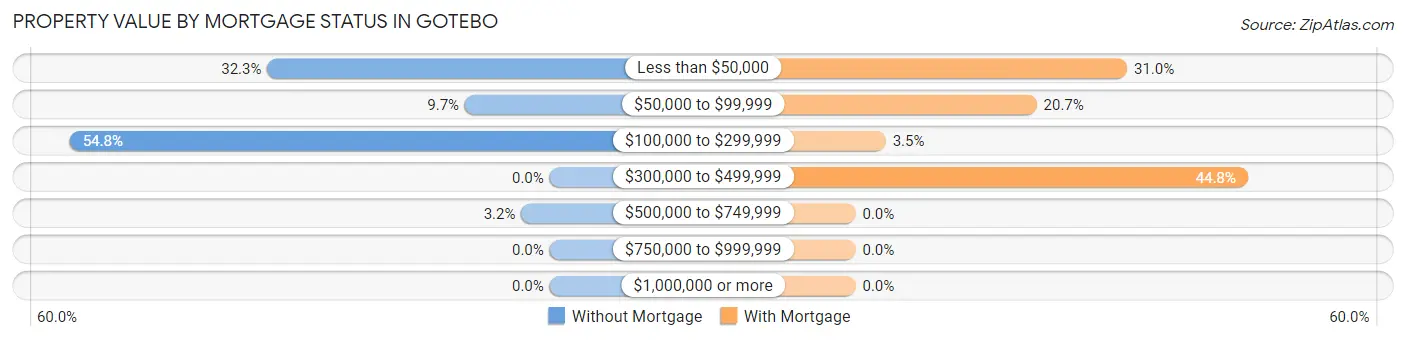
| Property Value | Without Mortgage | With Mortgage |
| Less than $50,000 | 20 (32.3%) | 9 (31.0%) |
| $50,000 to $99,999 | 6 (9.7%) | 6 (20.7%) |
| $100,000 to $299,999 | 34 (54.8%) | 1 (3.5%) |
| $300,000 to $499,999 | 0 (0.0%) | 13 (44.8%) |
| $500,000 to $749,999 | 2 (3.2%) | 0 (0.0%) |
| $750,000 to $999,999 | 0 (0.0%) | 0 (0.0%) |
| $1,000,000 or more | 0 (0.0%) | 0 (0.0%) |
| Total | 62 (100.0%) | 29 (100.0%) |
Household Income by Mortgage Status in Gotebo
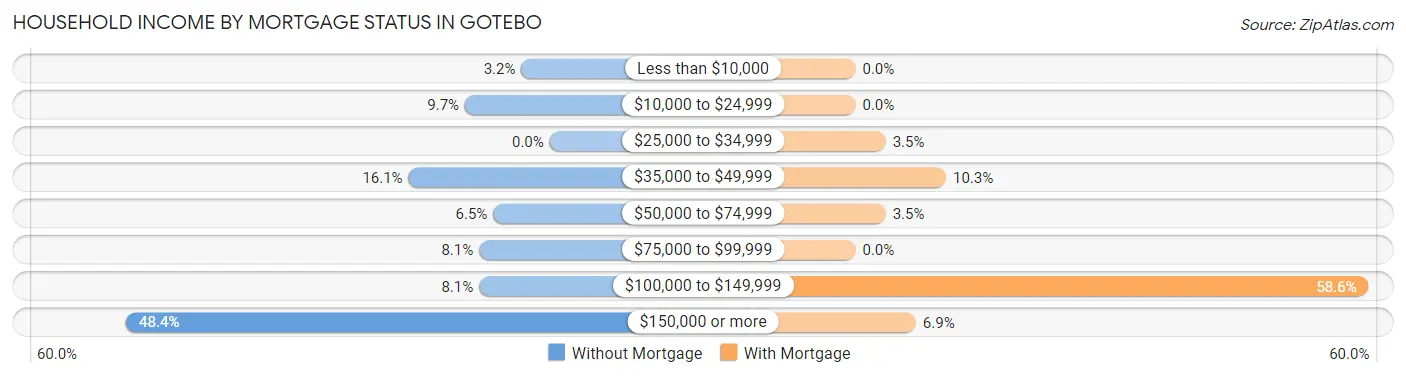
| Household Income | Without Mortgage | With Mortgage |
| Less than $10,000 | 2 (3.2%) | 0 (0.0%) |
| $10,000 to $24,999 | 6 (9.7%) | 0 (0.0%) |
| $25,000 to $34,999 | 0 (0.0%) | 1 (3.5%) |
| $35,000 to $49,999 | 10 (16.1%) | 3 (10.3%) |
| $50,000 to $74,999 | 4 (6.5%) | 1 (3.5%) |
| $75,000 to $99,999 | 5 (8.1%) | 0 (0.0%) |
| $100,000 to $149,999 | 5 (8.1%) | 17 (58.6%) |
| $150,000 or more | 30 (48.4%) | 2 (6.9%) |
| Total | 62 (100.0%) | 29 (100.0%) |
Property Value to Household Income Ratio in Gotebo
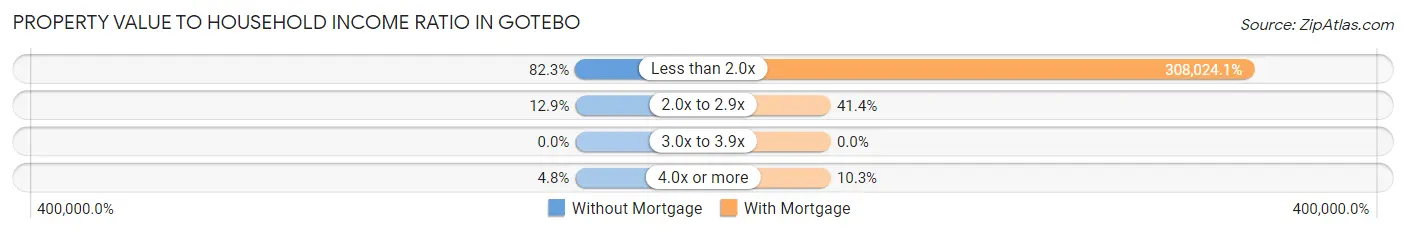
| Value-to-Income Ratio | Without Mortgage | With Mortgage |
| Less than 2.0x | 51 (82.3%) | 89,327 (308,024.1%) |
| 2.0x to 2.9x | 8 (12.9%) | 12 (41.4%) |
| 3.0x to 3.9x | 0 (0.0%) | 0 (0.0%) |
| 4.0x or more | 3 (4.8%) | 3 (10.3%) |
| Total | 62 (100.0%) | 29 (100.0%) |
Real Estate Taxes by Mortgage Status in Gotebo
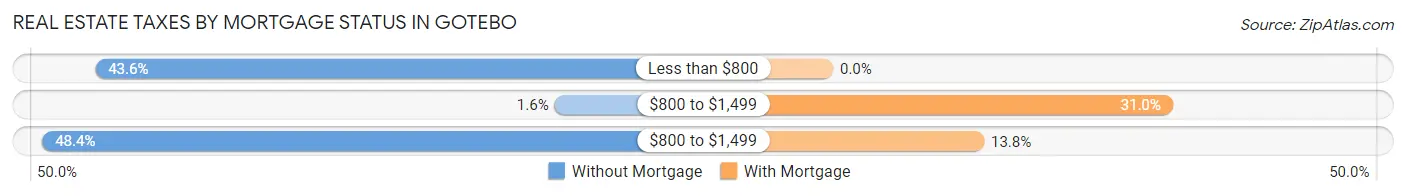
| Property Taxes | Without Mortgage | With Mortgage |
| Less than $800 | 27 (43.5%) | 0 (0.0%) |
| $800 to $1,499 | 1 (1.6%) | 9 (31.0%) |
| $800 to $1,499 | 30 (48.4%) | 4 (13.8%) |
| Total | 62 (100.0%) | 29 (100.0%) |
Health & Disability in Gotebo
Health Insurance Coverage by Age in Gotebo
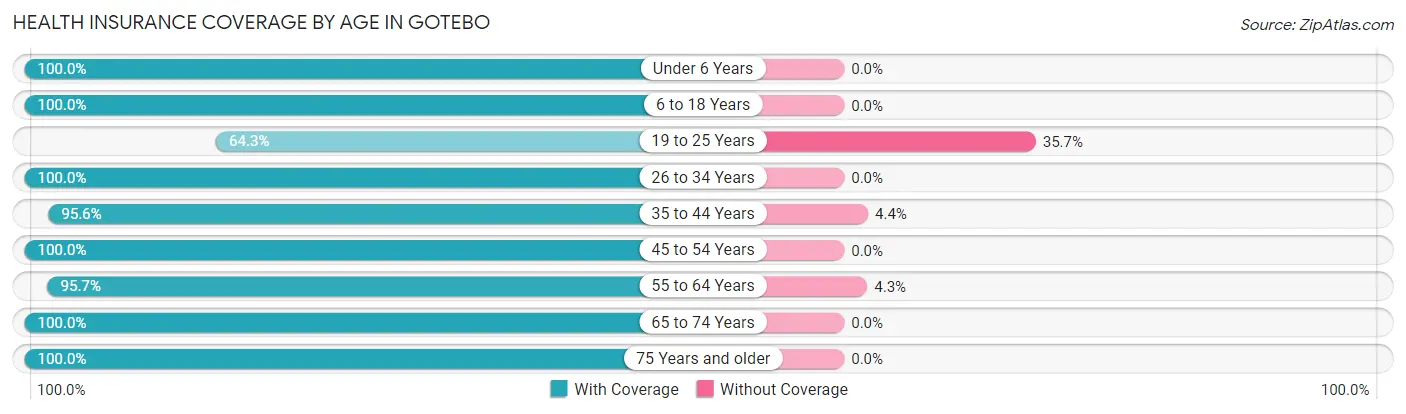
| Age Bracket | With Coverage | Without Coverage |
| Under 6 Years | 8 (100.0%) | 0 (0.0%) |
| 6 to 18 Years | 21 (100.0%) | 0 (0.0%) |
| 19 to 25 Years | 9 (64.3%) | 5 (35.7%) |
| 26 to 34 Years | 6 (100.0%) | 0 (0.0%) |
| 35 to 44 Years | 43 (95.6%) | 2 (4.4%) |
| 45 to 54 Years | 12 (100.0%) | 0 (0.0%) |
| 55 to 64 Years | 89 (95.7%) | 4 (4.3%) |
| 65 to 74 Years | 68 (100.0%) | 0 (0.0%) |
| 75 Years and older | 11 (100.0%) | 0 (0.0%) |
| Total | 267 (96.0%) | 11 (4.0%) |
Health Insurance Coverage by Citizenship Status in Gotebo
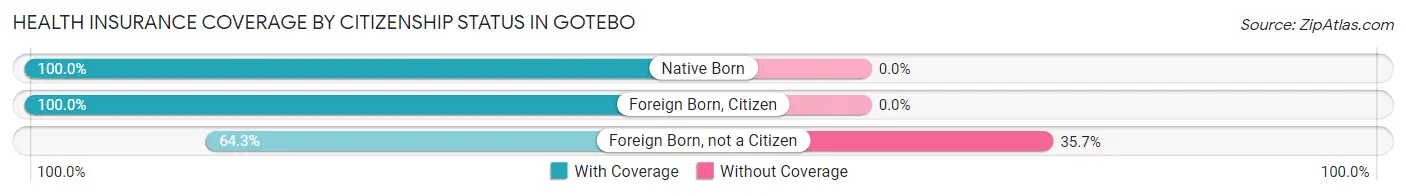
| Citizenship Status | With Coverage | Without Coverage |
| Native Born | 8 (100.0%) | 0 (0.0%) |
| Foreign Born, Citizen | 21 (100.0%) | 0 (0.0%) |
| Foreign Born, not a Citizen | 9 (64.3%) | 5 (35.7%) |
Health Insurance Coverage by Household Income in Gotebo
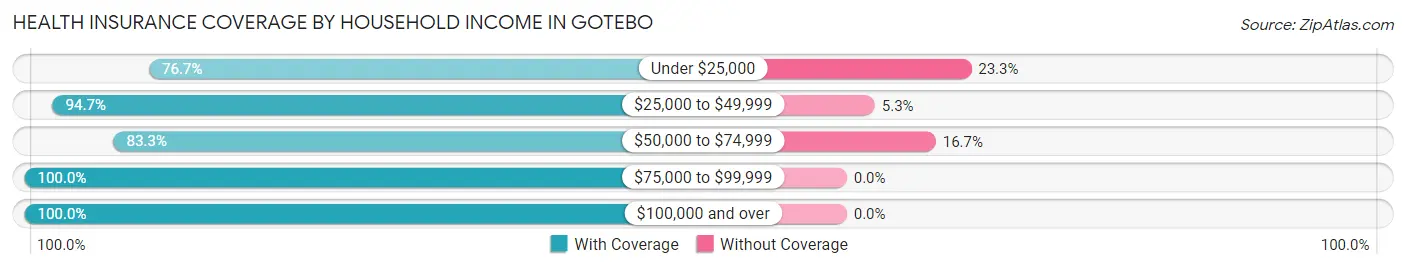
| Household Income | With Coverage | Without Coverage |
| Under $25,000 | 23 (76.7%) | 7 (23.3%) |
| $25,000 to $49,999 | 36 (94.7%) | 2 (5.3%) |
| $50,000 to $74,999 | 10 (83.3%) | 2 (16.7%) |
| $75,000 to $99,999 | 62 (100.0%) | 0 (0.0%) |
| $100,000 and over | 136 (100.0%) | 0 (0.0%) |
Public vs Private Health Insurance Coverage by Age in Gotebo
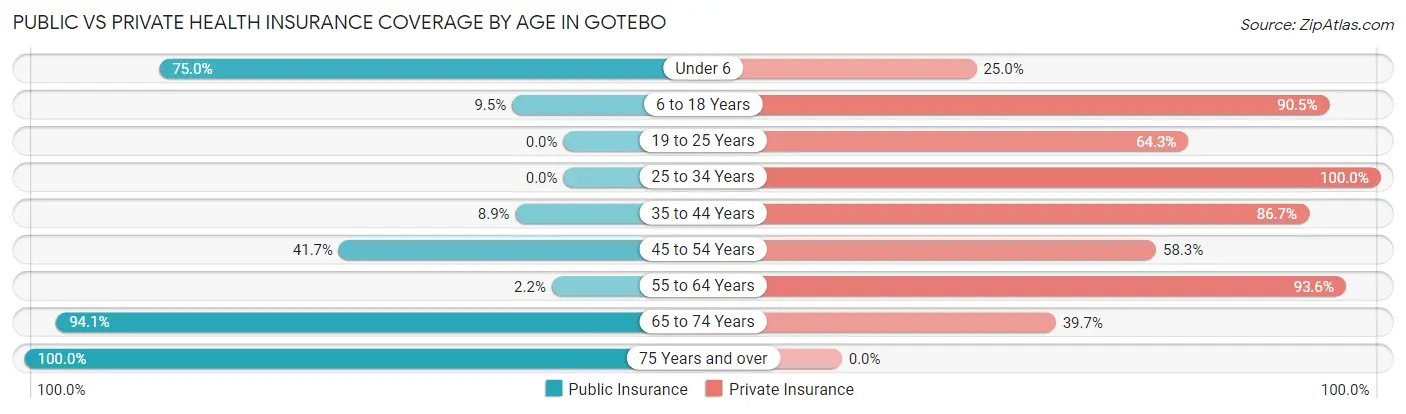
| Age Bracket | Public Insurance | Private Insurance |
| Under 6 | 6 (75.0%) | 2 (25.0%) |
| 6 to 18 Years | 2 (9.5%) | 19 (90.5%) |
| 19 to 25 Years | 0 (0.0%) | 9 (64.3%) |
| 25 to 34 Years | 0 (0.0%) | 6 (100.0%) |
| 35 to 44 Years | 4 (8.9%) | 39 (86.7%) |
| 45 to 54 Years | 5 (41.7%) | 7 (58.3%) |
| 55 to 64 Years | 2 (2.1%) | 87 (93.5%) |
| 65 to 74 Years | 64 (94.1%) | 27 (39.7%) |
| 75 Years and over | 11 (100.0%) | 0 (0.0%) |
| Total | 94 (33.8%) | 196 (70.5%) |
Disability Status by Sex by Age in Gotebo
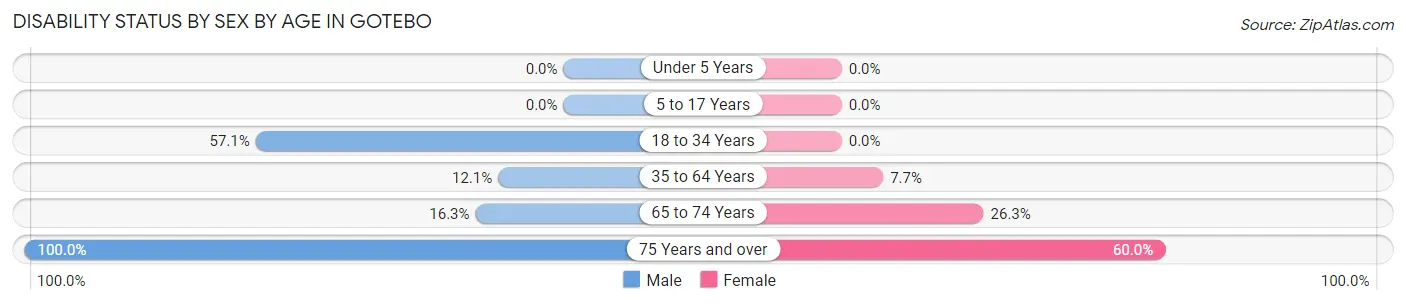
| Age Bracket | Male | Female |
| Under 5 Years | 0 (0.0%) | 0 (0.0%) |
| 5 to 17 Years | 0 (0.0%) | 0 (0.0%) |
| 18 to 34 Years | 4 (57.1%) | 0 (0.0%) |
| 35 to 64 Years | 4 (12.1%) | 9 (7.7%) |
| 65 to 74 Years | 8 (16.3%) | 5 (26.3%) |
| 75 Years and over | 1 (100.0%) | 6 (60.0%) |
Disability Class by Sex by Age in Gotebo
Disability Class: Hearing Difficulty
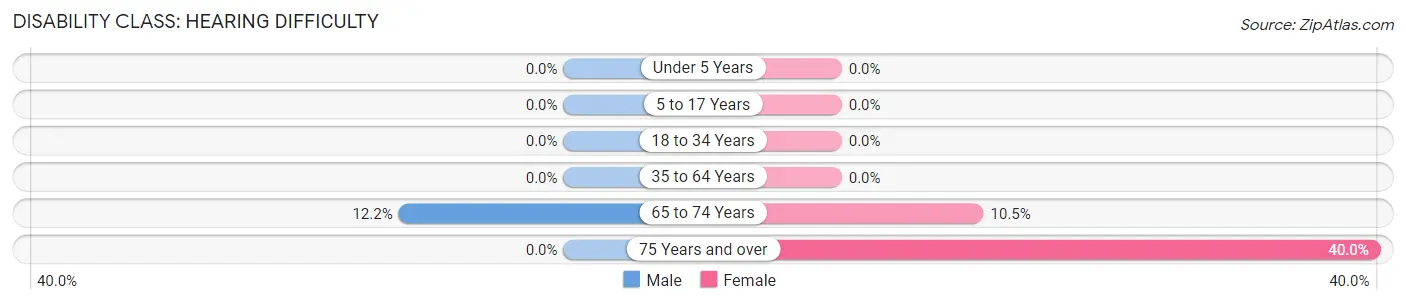
| Age Bracket | Male | Female |
| Under 5 Years | 0 (0.0%) | 0 (0.0%) |
| 5 to 17 Years | 0 (0.0%) | 0 (0.0%) |
| 18 to 34 Years | 0 (0.0%) | 0 (0.0%) |
| 35 to 64 Years | 0 (0.0%) | 0 (0.0%) |
| 65 to 74 Years | 6 (12.2%) | 2 (10.5%) |
| 75 Years and over | 0 (0.0%) | 4 (40.0%) |
Disability Class: Vision Difficulty
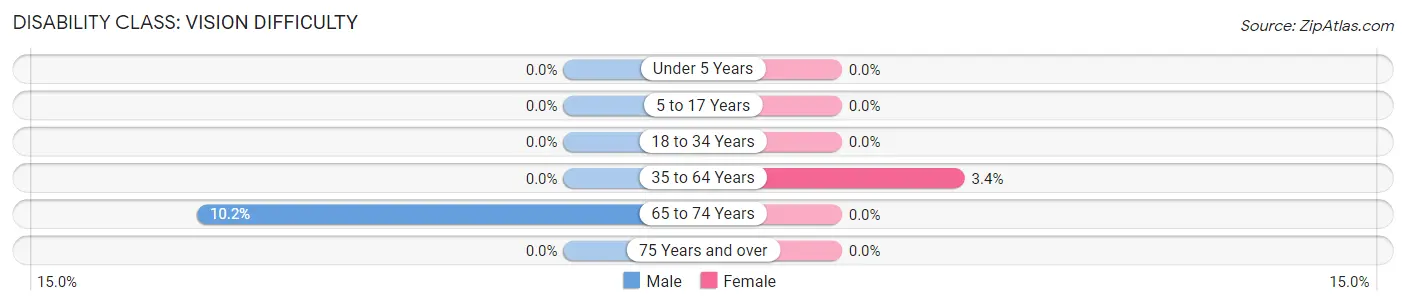
| Age Bracket | Male | Female |
| Under 5 Years | 0 (0.0%) | 0 (0.0%) |
| 5 to 17 Years | 0 (0.0%) | 0 (0.0%) |
| 18 to 34 Years | 0 (0.0%) | 0 (0.0%) |
| 35 to 64 Years | 0 (0.0%) | 4 (3.4%) |
| 65 to 74 Years | 5 (10.2%) | 0 (0.0%) |
| 75 Years and over | 0 (0.0%) | 0 (0.0%) |
Disability Class: Cognitive Difficulty
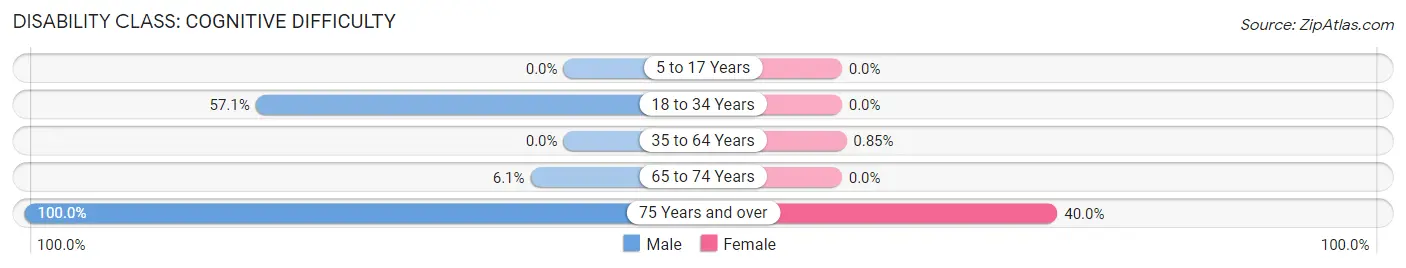
| Age Bracket | Male | Female |
| 5 to 17 Years | 0 (0.0%) | 0 (0.0%) |
| 18 to 34 Years | 4 (57.1%) | 0 (0.0%) |
| 35 to 64 Years | 0 (0.0%) | 1 (0.9%) |
| 65 to 74 Years | 3 (6.1%) | 0 (0.0%) |
| 75 Years and over | 1 (100.0%) | 4 (40.0%) |
Disability Class: Ambulatory Difficulty
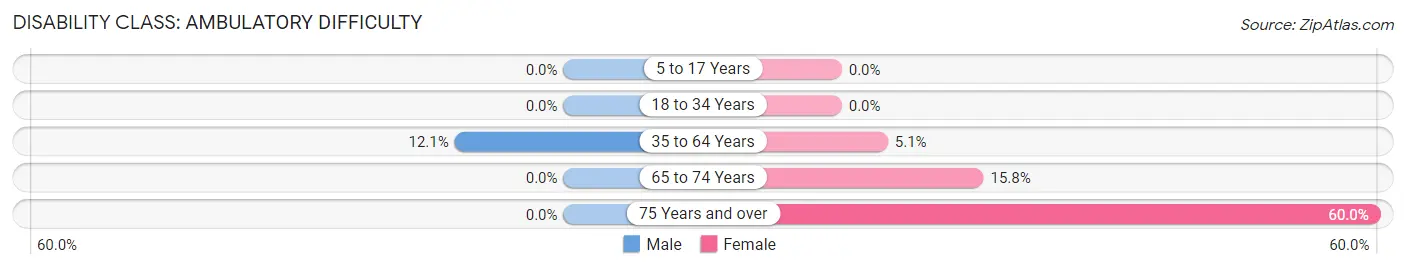
| Age Bracket | Male | Female |
| 5 to 17 Years | 0 (0.0%) | 0 (0.0%) |
| 18 to 34 Years | 0 (0.0%) | 0 (0.0%) |
| 35 to 64 Years | 4 (12.1%) | 6 (5.1%) |
| 65 to 74 Years | 0 (0.0%) | 3 (15.8%) |
| 75 Years and over | 0 (0.0%) | 6 (60.0%) |
Disability Class: Self-Care Difficulty
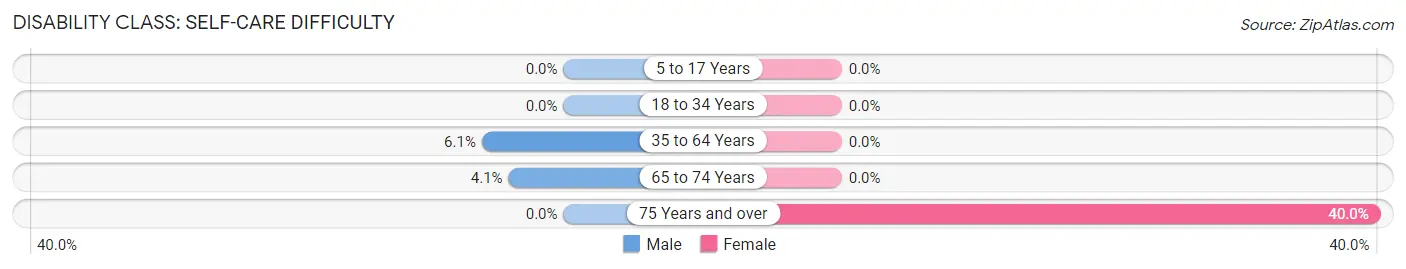
| Age Bracket | Male | Female |
| 5 to 17 Years | 0 (0.0%) | 0 (0.0%) |
| 18 to 34 Years | 0 (0.0%) | 0 (0.0%) |
| 35 to 64 Years | 2 (6.1%) | 0 (0.0%) |
| 65 to 74 Years | 2 (4.1%) | 0 (0.0%) |
| 75 Years and over | 0 (0.0%) | 4 (40.0%) |
Technology Access in Gotebo
Computing Device Access in Gotebo
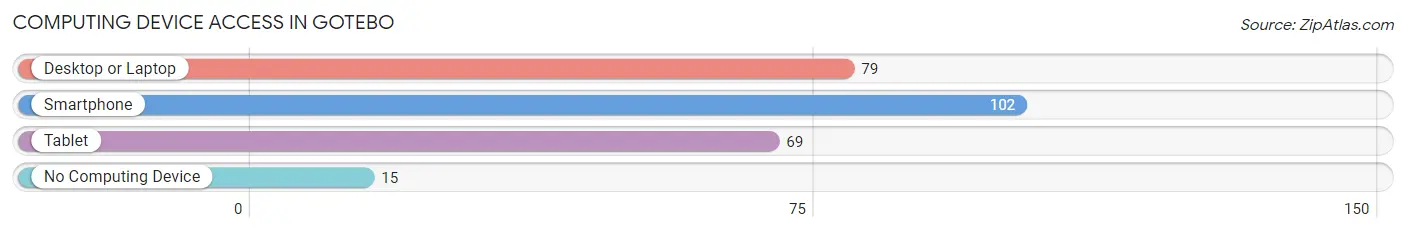
| Device Type | # Households | % Households |
| Desktop or Laptop | 79 | 66.4% |
| Smartphone | 102 | 85.7% |
| Tablet | 69 | 58.0% |
| No Computing Device | 15 | 12.6% |
| Total | 119 | 100.0% |
Internet Access in Gotebo
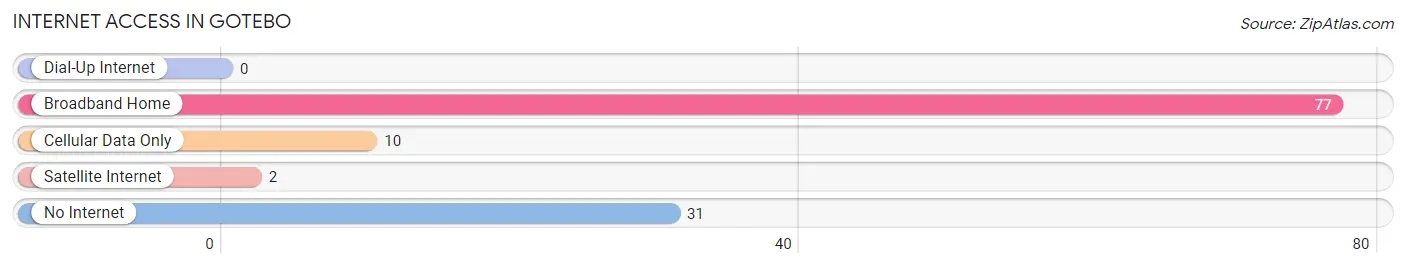
| Internet Type | # Households | % Households |
| Dial-Up Internet | 0 | 0.0% |
| Broadband Home | 77 | 64.7% |
| Cellular Data Only | 10 | 8.4% |
| Satellite Internet | 2 | 1.7% |
| No Internet | 31 | 26.1% |
| Total | 119 | 100.0% |
Gotebo Summary
Gotebo is a small town located in Kiowa County, Oklahoma. It is situated in the southwestern part of the state, approximately 40 miles south of the city of Lawton. The town was founded in 1901 and was named after the Kiowa chief, Gotebo. The population of Gotebo was estimated to be around 300 people in 2020.
History
Gotebo was founded in 1901 by the Kiowa chief, Gotebo. The town was originally known as Gotebo Station, as it was a stop on the Atchison, Topeka and Santa Fe Railway. The town was officially incorporated in 1906.
In the early 1900s, Gotebo was a thriving agricultural community. The town was home to several cotton gins, a flour mill, and a cottonseed oil mill. The town also had a bank, a hotel, and several stores.
In the 1920s, Gotebo experienced a period of growth and prosperity. The town was home to several businesses, including a movie theater, a drug store, and a hardware store. The town also had a school, a post office, and a library.
In the 1930s, the Great Depression hit Gotebo hard. Many of the businesses in town closed, and the population of the town decreased significantly.
In the 1940s, Gotebo experienced a period of recovery. The town was home to several businesses, including a grocery store, a cafe, and a gas station. The town also had a school, a post office, and a library.
In the 1950s, Gotebo experienced a period of growth and prosperity. The town was home to several businesses, including a movie theater, a drug store, and a hardware store. The town also had a school, a post office, and a library.
In the 1960s, Gotebo experienced a period of decline. Many of the businesses in town closed, and the population of the town decreased significantly.
In the 1970s, Gotebo experienced a period of recovery. The town was home to several businesses, including a grocery store, a cafe, and a gas station. The town also had a school, a post office, and a library.
Geography
Gotebo is located in southwestern Oklahoma, approximately 40 miles south of the city of Lawton. The town is situated in Kiowa County, and is surrounded by rolling hills and prairies. The town is located near the Washita River, which provides a source of water for the town.
Economy
Gotebo is a small, rural town with a limited economy. The town is home to several small businesses, including a grocery store, a cafe, and a gas station. The town also has a post office and a library.
The town is also home to several agricultural businesses, including a cotton gin, a flour mill, and a cottonseed oil mill. The town is also home to several ranches, which raise cattle and horses.
Demographics
As of 2020, the population of Gotebo was estimated to be around 300 people. The town is predominantly white, with a small Hispanic population. The median household income in Gotebo is $35,000, and the median home value is $90,000. The town has a poverty rate of 16.7%.
Conclusion
Gotebo is a small town located in southwestern Oklahoma. The town was founded in 1901 and was named after the Kiowa chief, Gotebo. The town has a population of around 300 people, and is predominantly white, with a small Hispanic population. The town is home to several small businesses, as well as several agricultural businesses. The median household income in Gotebo is $35,000, and the median home value is $90,000. The town has a poverty rate of 16.7%.
Common Questions
What is Per Capita Income in Gotebo?
Per Capita income in Gotebo is $45,727.
What is the Median Family Income in Gotebo?
Median Family Income in Gotebo is $102,708.
What is the Median Household income in Gotebo?
Median Household Income in Gotebo is $88,558.
What is Inequality or Gini Index in Gotebo?
Inequality or Gini Index in Gotebo is 0.47.
What is the Total Population of Gotebo?
Total Population of Gotebo is 278.
What is the Total Male Population of Gotebo?
Total Male Population of Gotebo is 110.
What is the Total Female Population of Gotebo?
Total Female Population of Gotebo is 168.
What is the Ratio of Males per 100 Females in Gotebo?
There are 65.48 Males per 100 Females in Gotebo.
What is the Ratio of Females per 100 Males in Gotebo?
There are 152.73 Females per 100 Males in Gotebo.
What is the Median Population Age in Gotebo?
Median Population Age in Gotebo is 59.7 Years.
What is the Average Family Size in Gotebo
Average Family Size in Gotebo is 2.7 People.
What is the Average Household Size in Gotebo
Average Household Size in Gotebo is 2.3 People.
How Large is the Labor Force in Gotebo?
There are 167 People in the Labor Forcein in Gotebo.
What is the Percentage of People in the Labor Force in Gotebo?
66.5% of People are in the Labor Force in Gotebo.
What is the Unemployment Rate in Gotebo?
Unemployment Rate in Gotebo is 0.6%.