River Bottom, OK Map & Demographics
River Bottom Map
River Bottom Overview
$25,663
PER CAPITA INCOME
$62,188
AVG FAMILY INCOME
$65,000
AVG HOUSEHOLD INCOME
28.3%
WAGE / INCOME GAP [ % ]
71.7¢/ $1
WAGE / INCOME GAP [ $ ]
0.33
INEQUALITY / GINI INDEX
242
TOTAL POPULATION
140
MALE POPULATION
102
FEMALE POPULATION
137.25
MALES / 100 FEMALES
72.86
FEMALES / 100 MALES
43.2
MEDIAN AGE
2.9
AVG FAMILY SIZE
2.8
AVG HOUSEHOLD SIZE
92
LABOR FORCE [ PEOPLE ]
48.4%
PERCENT IN LABOR FORCE
4.3%
UNEMPLOYMENT RATE
Income in River Bottom
Income Overview in River Bottom
Per Capita Income in River Bottom is $25,663, while median incomes of families and households are $62,188 and $65,000 respectively.
| Characteristic | Number | Measure |
| Per Capita Income | 242 | $25,663 |
| Median Family Income | 75 | $62,188 |
| Mean Family Income | 75 | $71,792 |
| Median Household Income | 88 | $65,000 |
| Mean Household Income | 88 | $69,159 |
| Income Deficit | 75 | $0 |
| Wage / Income Gap (%) | 242 | 28.32% |
| Wage / Income Gap ($) | 242 | 71.68¢ per $1 |
| Gini / Inequality Index | 242 | 0.33 |
Earnings by Sex in River Bottom
Average Earnings in River Bottom are $33,472, $34,444 for men and $24,688 for women, a difference of 28.3%.
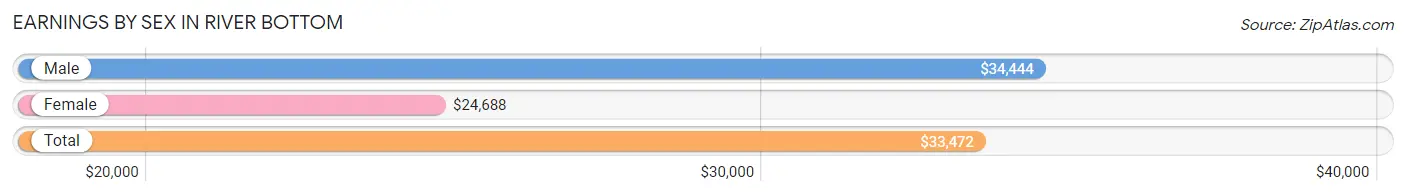
| Sex | Number | Average Earnings |
| Male | 62 (62.6%) | $34,444 |
| Female | 37 (37.4%) | $24,688 |
| Total | 99 (100.0%) | $33,472 |
Earnings by Sex by Income Bracket in River Bottom
The most common earnings brackets in River Bottom are $75,000 to $99,999 for men (14 | 22.6%) and $15,000 to $17,499 for women (10 | 27.0%).
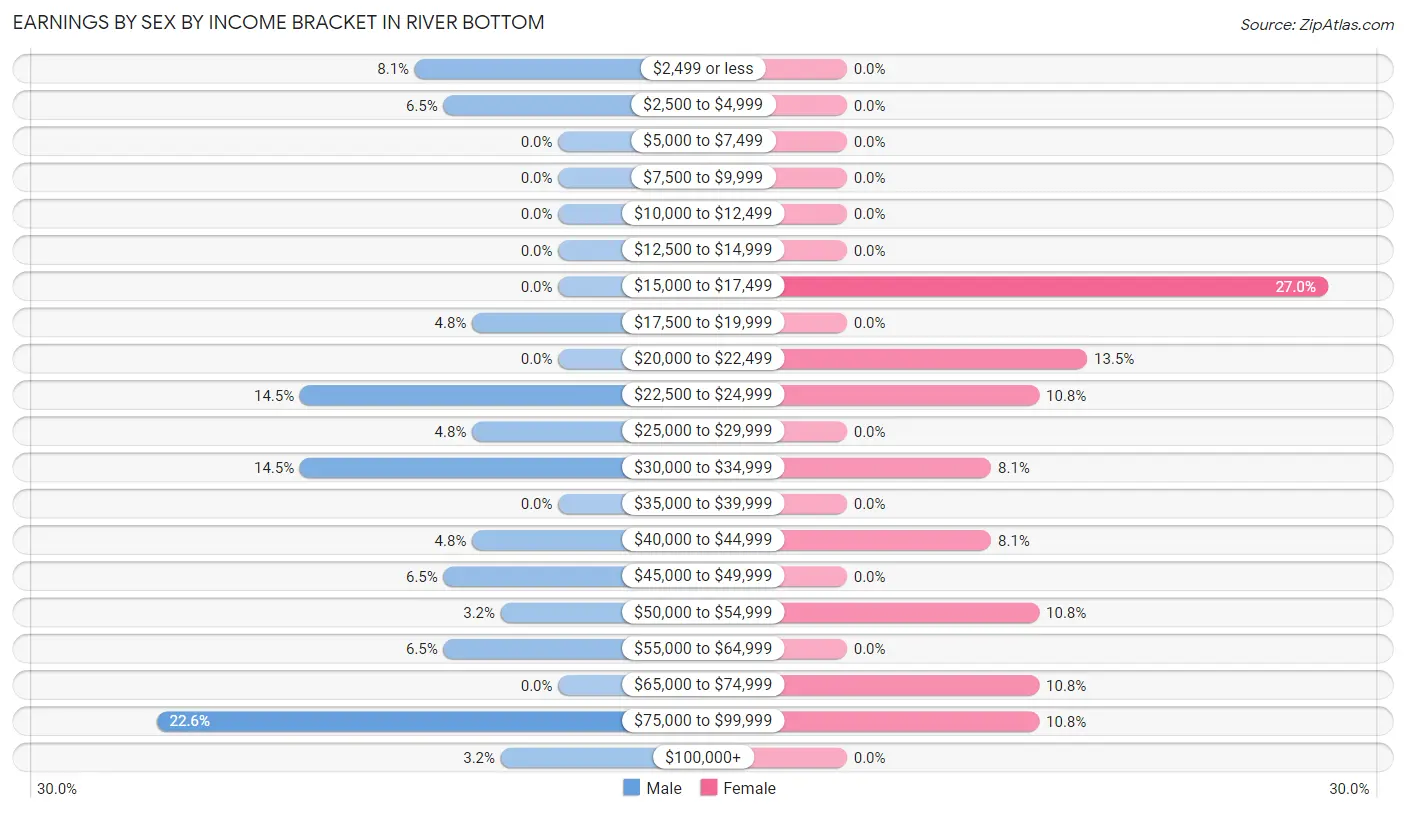
| Income | Male | Female |
| $2,499 or less | 5 (8.1%) | 0 (0.0%) |
| $2,500 to $4,999 | 4 (6.5%) | 0 (0.0%) |
| $5,000 to $7,499 | 0 (0.0%) | 0 (0.0%) |
| $7,500 to $9,999 | 0 (0.0%) | 0 (0.0%) |
| $10,000 to $12,499 | 0 (0.0%) | 0 (0.0%) |
| $12,500 to $14,999 | 0 (0.0%) | 0 (0.0%) |
| $15,000 to $17,499 | 0 (0.0%) | 10 (27.0%) |
| $17,500 to $19,999 | 3 (4.8%) | 0 (0.0%) |
| $20,000 to $22,499 | 0 (0.0%) | 5 (13.5%) |
| $22,500 to $24,999 | 9 (14.5%) | 4 (10.8%) |
| $25,000 to $29,999 | 3 (4.8%) | 0 (0.0%) |
| $30,000 to $34,999 | 9 (14.5%) | 3 (8.1%) |
| $35,000 to $39,999 | 0 (0.0%) | 0 (0.0%) |
| $40,000 to $44,999 | 3 (4.8%) | 3 (8.1%) |
| $45,000 to $49,999 | 4 (6.5%) | 0 (0.0%) |
| $50,000 to $54,999 | 2 (3.2%) | 4 (10.8%) |
| $55,000 to $64,999 | 4 (6.5%) | 0 (0.0%) |
| $65,000 to $74,999 | 0 (0.0%) | 4 (10.8%) |
| $75,000 to $99,999 | 14 (22.6%) | 4 (10.8%) |
| $100,000+ | 2 (3.2%) | 0 (0.0%) |
| Total | 62 (100.0%) | 37 (100.0%) |
Earnings by Sex by Educational Attainment in River Bottom
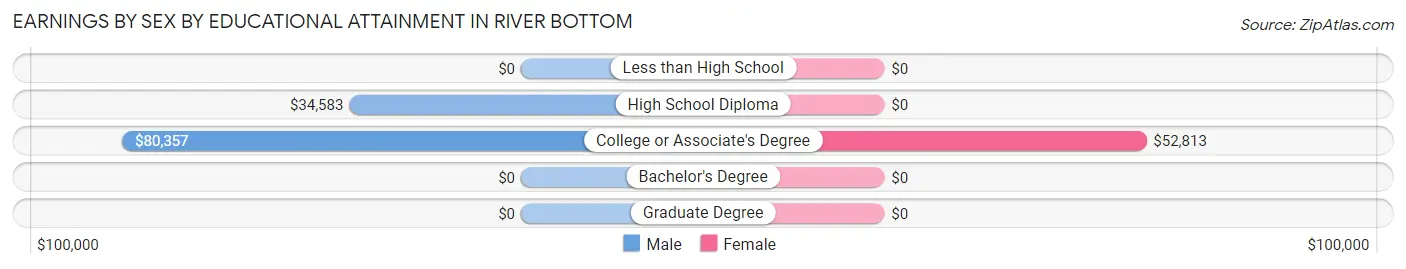
| Educational Attainment | Male Income | Female Income |
| Less than High School | - | - |
| High School Diploma | $34,583 | $0 |
| College or Associate's Degree | $80,357 | $52,813 |
| Bachelor's Degree | - | - |
| Graduate Degree | - | - |
| Total | $45,938 | $0 |
Family Income in River Bottom
Family Income Brackets in River Bottom
According to the River Bottom family income data, there are 20 families falling into the $50,000 to $74,999 income range, which is the most common income bracket and makes up 26.7% of all families.
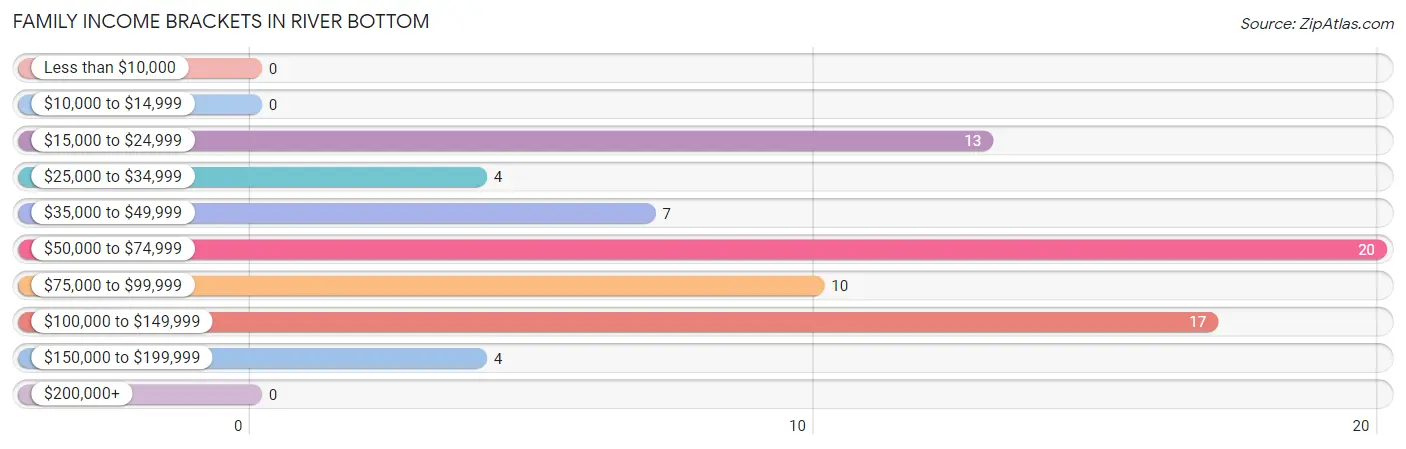
| Income Bracket | # Families | % Families |
| Less than $10,000 | 0 | 0.0% |
| $10,000 to $14,999 | 0 | 0.0% |
| $15,000 to $24,999 | 13 | 17.3% |
| $25,000 to $34,999 | 4 | 5.3% |
| $35,000 to $49,999 | 7 | 9.3% |
| $50,000 to $74,999 | 20 | 26.7% |
| $75,000 to $99,999 | 10 | 13.3% |
| $100,000 to $149,999 | 17 | 22.7% |
| $150,000 to $199,999 | 4 | 5.3% |
| $200,000+ | 0 | 0.0% |
Family Income by Famaliy Size in River Bottom
3-person families (14 | 18.7%) account for the highest median family income in River Bottom with $66,250 per family, while 2-person families (46 | 61.3%) have the highest median income of $30,625 per family member.
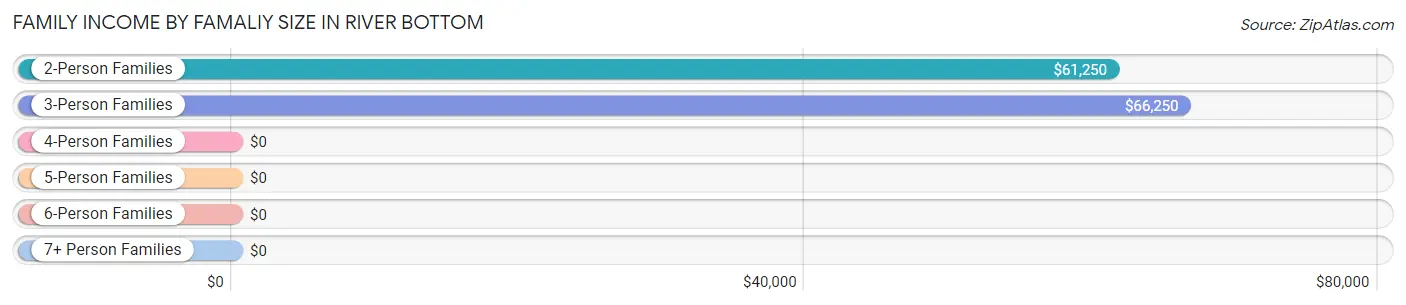
| Income Bracket | # Families | Median Income |
| 2-Person Families | 46 (61.3%) | $61,250 |
| 3-Person Families | 14 (18.7%) | $66,250 |
| 4-Person Families | 7 (9.3%) | $0 |
| 5-Person Families | 8 (10.7%) | $0 |
| 6-Person Families | 0 (0.0%) | $0 |
| 7+ Person Families | 0 (0.0%) | $0 |
| Total | 75 (100.0%) | $62,188 |
Family Income by Number of Earners in River Bottom
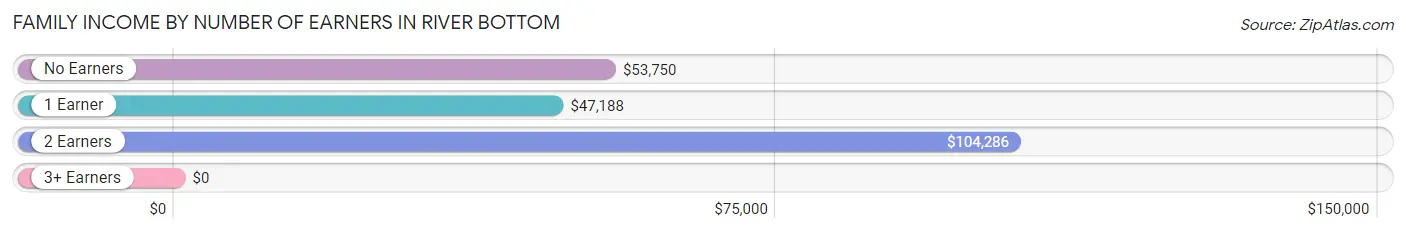
| Number of Earners | # Families | Median Income |
| No Earners | 26 (34.7%) | $53,750 |
| 1 Earner | 27 (36.0%) | $47,188 |
| 2 Earners | 18 (24.0%) | $104,286 |
| 3+ Earners | 4 (5.3%) | $0 |
| Total | 75 (100.0%) | $62,188 |
Household Income in River Bottom
Household Income Brackets in River Bottom
With 20 households falling in the category, the $50,000 to $74,999 income range is the most frequent in River Bottom, accounting for 22.7% of all households.
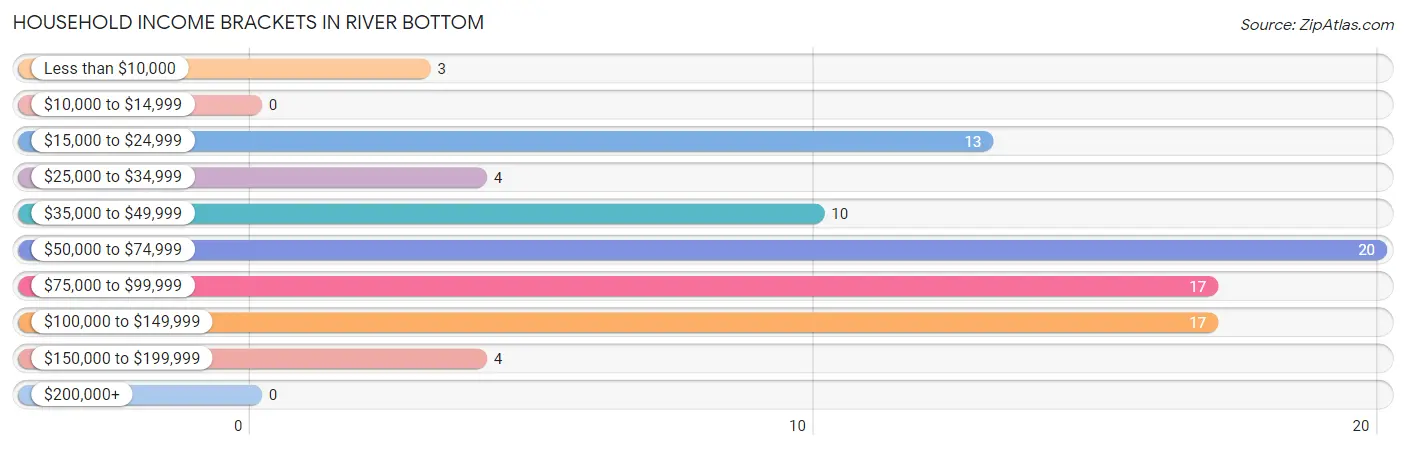
| Income Bracket | # Households | % Households |
| Less than $10,000 | 3 | 3.4% |
| $10,000 to $14,999 | 0 | 0.0% |
| $15,000 to $24,999 | 13 | 14.8% |
| $25,000 to $34,999 | 4 | 4.5% |
| $35,000 to $49,999 | 10 | 11.4% |
| $50,000 to $74,999 | 20 | 22.7% |
| $75,000 to $99,999 | 17 | 19.3% |
| $100,000 to $149,999 | 17 | 19.3% |
| $150,000 to $199,999 | 4 | 4.5% |
| $200,000+ | 0 | 0.0% |
Household Income by Householder Age in River Bottom
The median household income in River Bottom is $65,000, with the highest median household income of $63,750 found in the 25 to 44 years age bracket for the primary householder. A total of 22 households (25.0%) fall into this category.
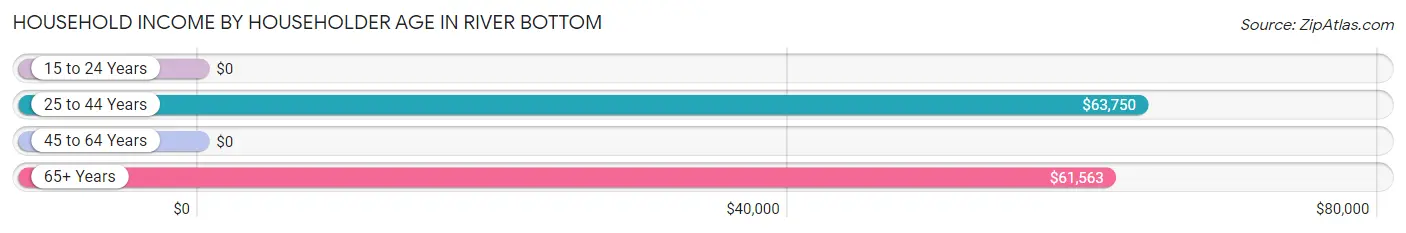
| Income Bracket | # Households | Median Income |
| 15 to 24 Years | 0 (0.0%) | $0 |
| 25 to 44 Years | 22 (25.0%) | $63,750 |
| 45 to 64 Years | 31 (35.2%) | $0 |
| 65+ Years | 35 (39.8%) | $61,563 |
| Total | 88 (100.0%) | $65,000 |
Poverty in River Bottom
Income Below Poverty by Sex and Age in River Bottom
With 30.7% poverty level for males and 9.8% for females among the residents of River Bottom, under 5 year old males and 6 to 11 year old females are the most vulnerable to poverty, with 22 males (100.0%) and 6 females (42.9%) in their respective age groups living below the poverty level.
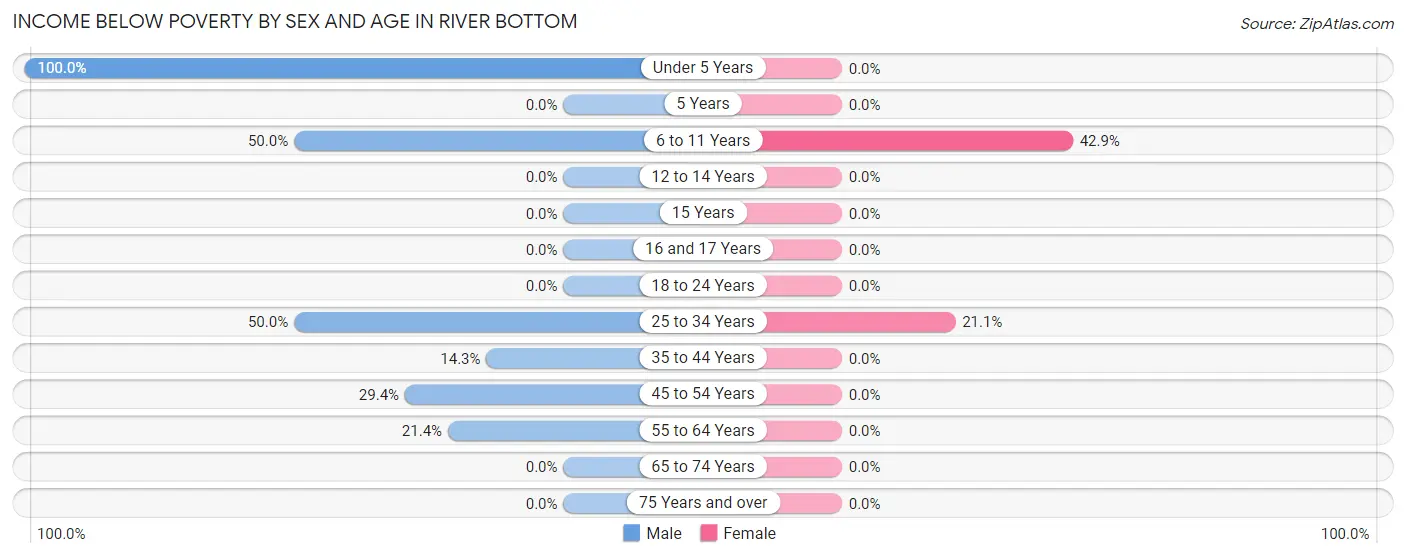
| Age Bracket | Male | Female |
| Under 5 Years | 22 (100.0%) | 0 (0.0%) |
| 5 Years | 0 (0.0%) | 0 (0.0%) |
| 6 to 11 Years | 6 (50.0%) | 6 (42.9%) |
| 12 to 14 Years | 0 (0.0%) | 0 (0.0%) |
| 15 Years | 0 (0.0%) | 0 (0.0%) |
| 16 and 17 Years | 0 (0.0%) | 0 (0.0%) |
| 18 to 24 Years | 0 (0.0%) | 0 (0.0%) |
| 25 to 34 Years | 4 (50.0%) | 4 (21.0%) |
| 35 to 44 Years | 3 (14.3%) | 0 (0.0%) |
| 45 to 54 Years | 5 (29.4%) | 0 (0.0%) |
| 55 to 64 Years | 3 (21.4%) | 0 (0.0%) |
| 65 to 74 Years | 0 (0.0%) | 0 (0.0%) |
| 75 Years and over | 0 (0.0%) | 0 (0.0%) |
| Total | 43 (30.7%) | 10 (9.8%) |
Income Above Poverty by Sex and Age in River Bottom
According to the poverty statistics in River Bottom, males aged 12 to 14 years and females aged 18 to 24 years are the age groups that are most secure financially, with 100.0% of males and 100.0% of females in these age groups living above the poverty line.
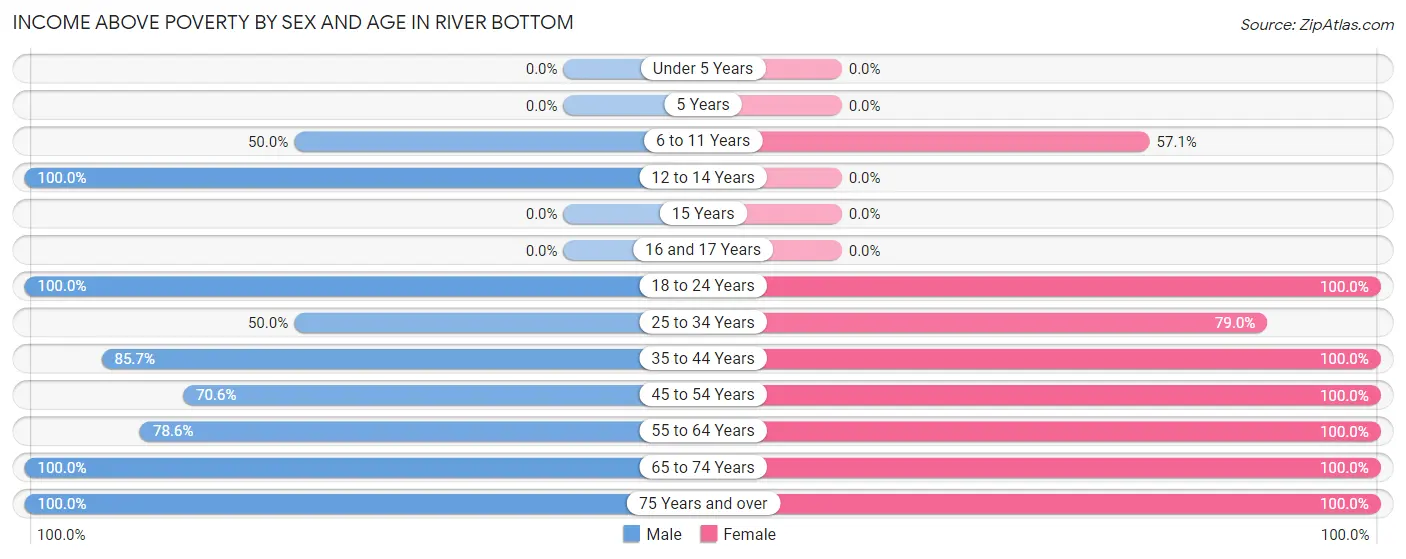
| Age Bracket | Male | Female |
| Under 5 Years | 0 (0.0%) | 0 (0.0%) |
| 5 Years | 0 (0.0%) | 0 (0.0%) |
| 6 to 11 Years | 6 (50.0%) | 8 (57.1%) |
| 12 to 14 Years | 4 (100.0%) | 0 (0.0%) |
| 15 Years | 0 (0.0%) | 0 (0.0%) |
| 16 and 17 Years | 0 (0.0%) | 0 (0.0%) |
| 18 to 24 Years | 13 (100.0%) | 5 (100.0%) |
| 25 to 34 Years | 4 (50.0%) | 15 (78.9%) |
| 35 to 44 Years | 18 (85.7%) | 8 (100.0%) |
| 45 to 54 Years | 12 (70.6%) | 11 (100.0%) |
| 55 to 64 Years | 11 (78.6%) | 13 (100.0%) |
| 65 to 74 Years | 24 (100.0%) | 23 (100.0%) |
| 75 Years and over | 5 (100.0%) | 9 (100.0%) |
| Total | 97 (69.3%) | 92 (90.2%) |
Income Below Poverty Among Married-Couple Families in River Bottom
The poverty statistics for married-couple families in River Bottom show that 6.2% or 4 of the total 64 families live below the poverty line. Families with 3 or 4 children have the highest poverty rate of 50.0%, comprising of 4 families. On the other hand, families with no children have the lowest poverty rate of 0.0%, which includes 0 families.
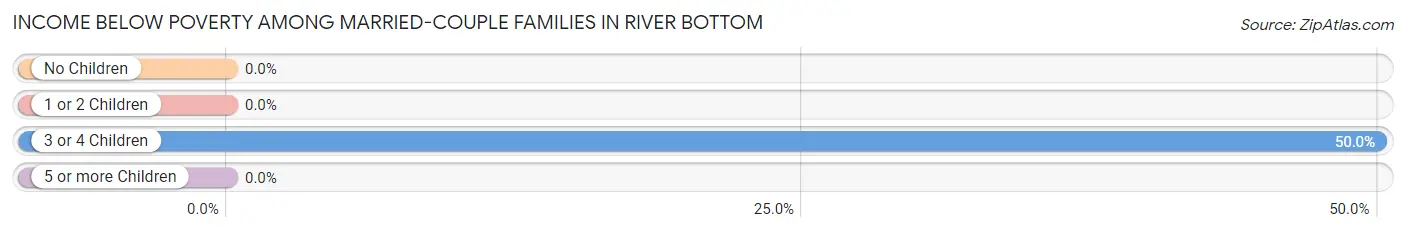
| Children | Above Poverty | Below Poverty |
| No Children | 53 (100.0%) | 0 (0.0%) |
| 1 or 2 Children | 3 (100.0%) | 0 (0.0%) |
| 3 or 4 Children | 4 (50.0%) | 4 (50.0%) |
| 5 or more Children | 0 (0.0%) | 0 (0.0%) |
| Total | 60 (93.8%) | 4 (6.2%) |
Income Below Poverty Among Single-Parent Households in River Bottom
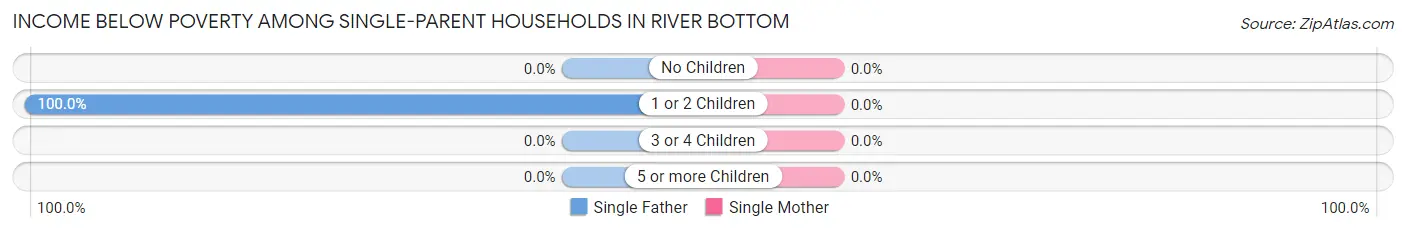
| Children | Single Father | Single Mother |
| No Children | 0 (0.0%) | 0 (0.0%) |
| 1 or 2 Children | 8 (100.0%) | 0 (0.0%) |
| 3 or 4 Children | 0 (0.0%) | 0 (0.0%) |
| 5 or more Children | 0 (0.0%) | 0 (0.0%) |
| Total | 8 (100.0%) | 0 (0.0%) |
Income Below Poverty Among Married-Couple vs Single-Parent Households in River Bottom
The poverty data for River Bottom shows that 4 of the married-couple family households (6.2%) and 8 of the single-parent households (72.7%) are living below the poverty level. Within the married-couple family households, those with 3 or 4 children have the highest poverty rate, with 4 households (50.0%) falling below the poverty line. Among the single-parent households, those with 1 or 2 children have the highest poverty rate, with 8 household (100.0%) living below poverty.
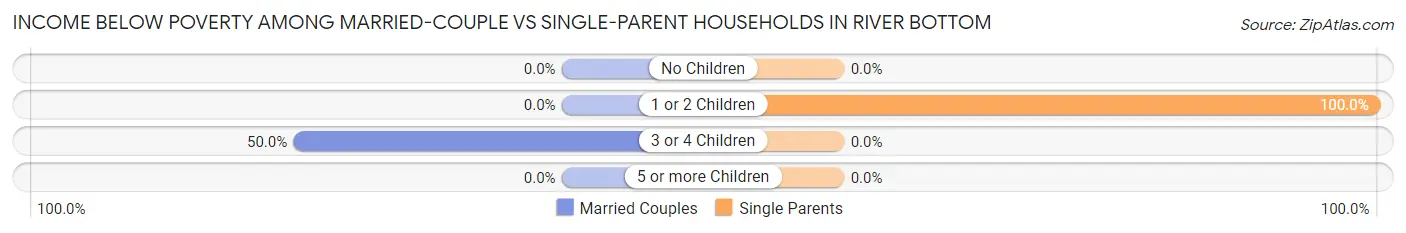
| Children | Married-Couple Families | Single-Parent Households |
| No Children | 0 (0.0%) | 0 (0.0%) |
| 1 or 2 Children | 0 (0.0%) | 8 (100.0%) |
| 3 or 4 Children | 4 (50.0%) | 0 (0.0%) |
| 5 or more Children | 0 (0.0%) | 0 (0.0%) |
| Total | 4 (6.2%) | 8 (72.7%) |
Race in River Bottom
The most populous races in River Bottom are White / Caucasian (167 | 69.0%), Native / Alaskan (45 | 18.6%), and Two or more Races (30 | 12.4%).
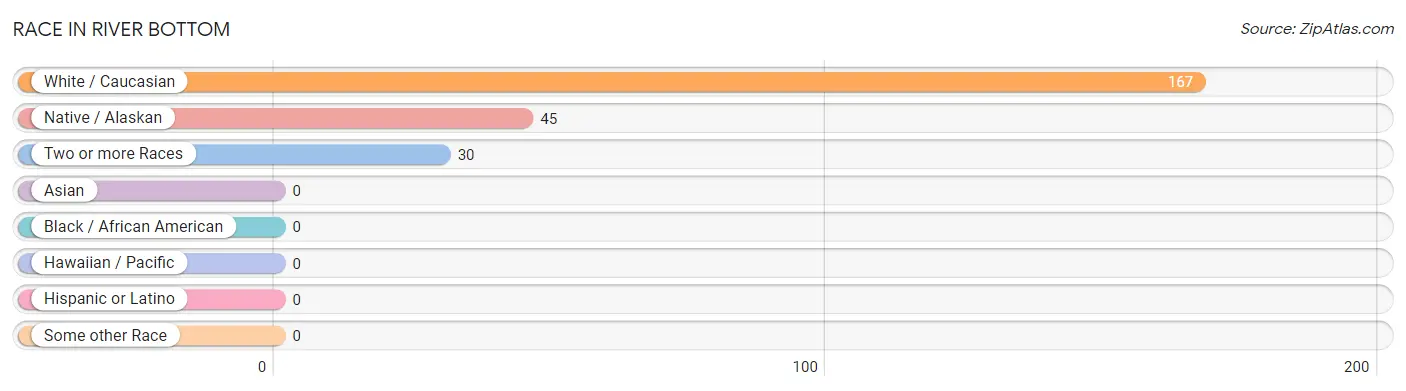
| Race | # Population | % Population |
| Asian | 0 | 0.0% |
| Black / African American | 0 | 0.0% |
| Hawaiian / Pacific | 0 | 0.0% |
| Hispanic or Latino | 0 | 0.0% |
| Native / Alaskan | 45 | 18.6% |
| White / Caucasian | 167 | 69.0% |
| Two or more Races | 30 | 12.4% |
| Some other Race | 0 | 0.0% |
| Total | 242 | 100.0% |
Ancestry in River Bottom
The most populous ancestries reported in River Bottom are American (87 | 35.9%), Cherokee (70 | 28.9%), English (26 | 10.7%), Irish (26 | 10.7%), and German (24 | 9.9%), together accounting for 96.3% of all River Bottom residents.
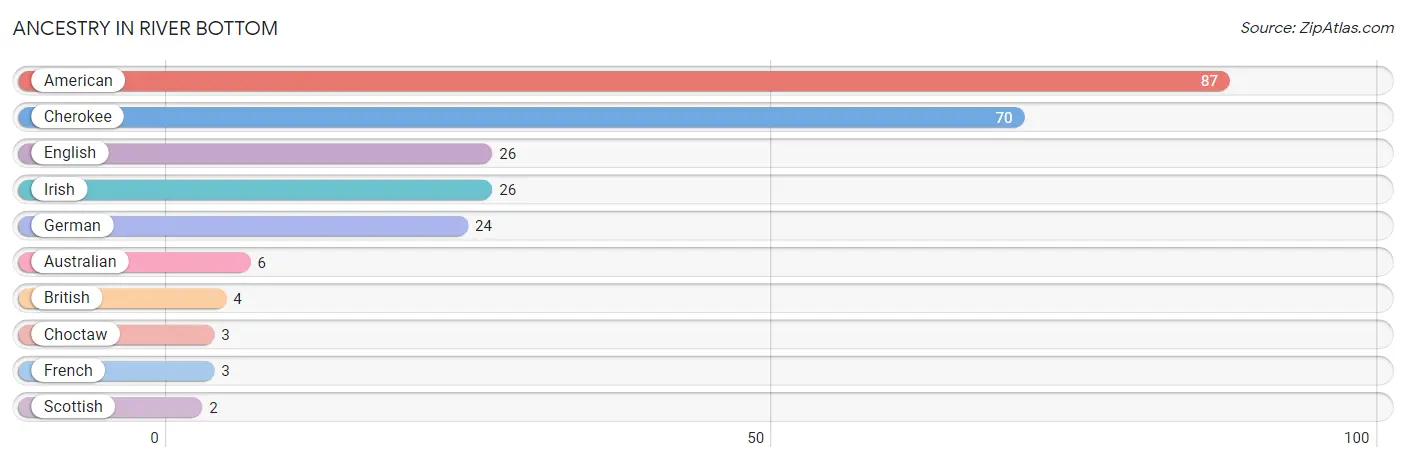
| Ancestry | # Population | % Population |
| American | 87 | 35.9% |
| Australian | 6 | 2.5% |
| British | 4 | 1.7% |
| Cherokee | 70 | 28.9% |
| Choctaw | 3 | 1.2% |
| English | 26 | 10.7% |
| French | 3 | 1.2% |
| German | 24 | 9.9% |
| Irish | 26 | 10.7% |
| Scottish | 2 | 0.8% | View All 10 Rows |
Immigrants in River Bottom

| Immigration Origin | # Population | % Population | View All 0 Rows |
Sex and Age in River Bottom
Sex and Age in River Bottom
The most populous age groups in River Bottom are Under 5 Years (22 | 15.7%) for men and 30 to 34 Years (19 | 18.6%) for women.
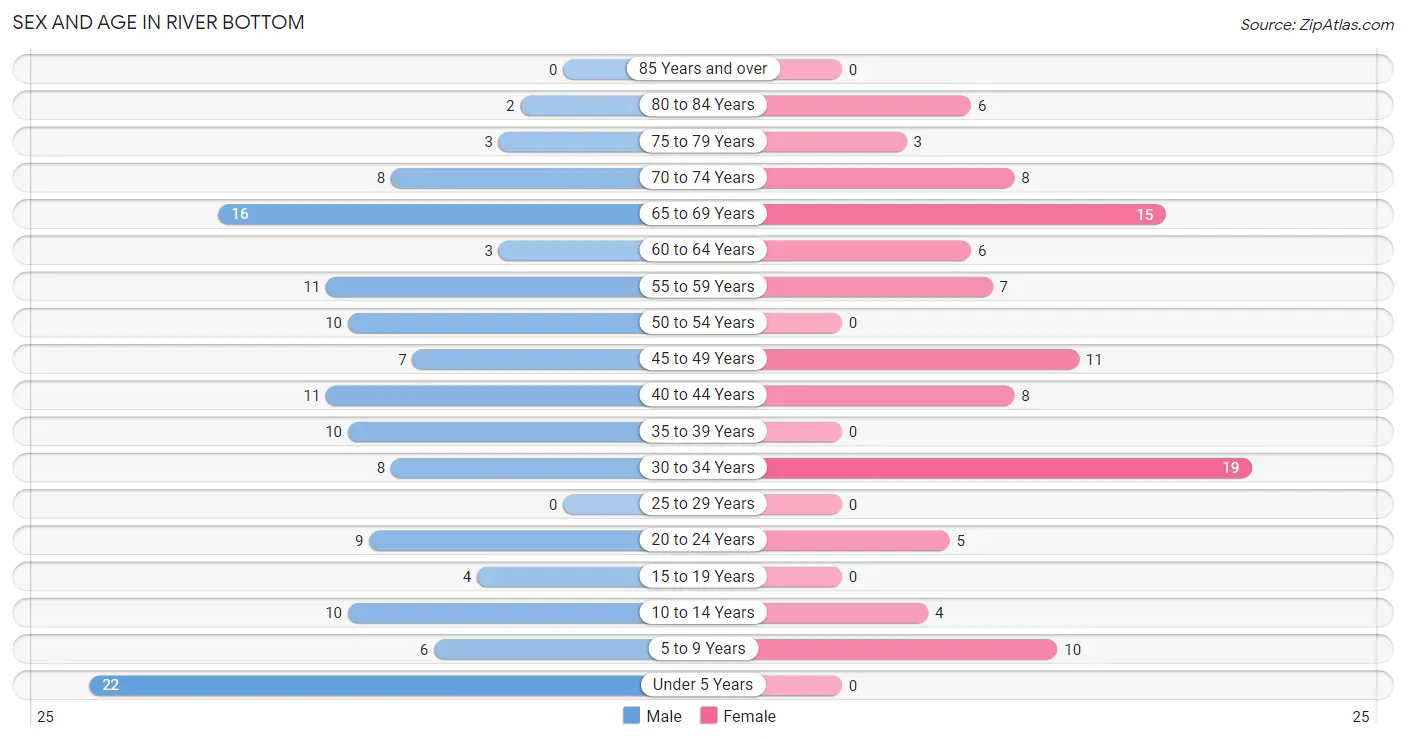
| Age Bracket | Male | Female |
| Under 5 Years | 22 (15.7%) | 0 (0.0%) |
| 5 to 9 Years | 6 (4.3%) | 10 (9.8%) |
| 10 to 14 Years | 10 (7.1%) | 4 (3.9%) |
| 15 to 19 Years | 4 (2.9%) | 0 (0.0%) |
| 20 to 24 Years | 9 (6.4%) | 5 (4.9%) |
| 25 to 29 Years | 0 (0.0%) | 0 (0.0%) |
| 30 to 34 Years | 8 (5.7%) | 19 (18.6%) |
| 35 to 39 Years | 10 (7.1%) | 0 (0.0%) |
| 40 to 44 Years | 11 (7.9%) | 8 (7.8%) |
| 45 to 49 Years | 7 (5.0%) | 11 (10.8%) |
| 50 to 54 Years | 10 (7.1%) | 0 (0.0%) |
| 55 to 59 Years | 11 (7.9%) | 7 (6.9%) |
| 60 to 64 Years | 3 (2.1%) | 6 (5.9%) |
| 65 to 69 Years | 16 (11.4%) | 15 (14.7%) |
| 70 to 74 Years | 8 (5.7%) | 8 (7.8%) |
| 75 to 79 Years | 3 (2.1%) | 3 (2.9%) |
| 80 to 84 Years | 2 (1.4%) | 6 (5.9%) |
| 85 Years and over | 0 (0.0%) | 0 (0.0%) |
| Total | 140 (100.0%) | 102 (100.0%) |
Families and Households in River Bottom
Median Family Size in River Bottom
The median family size in River Bottom is 2.92 persons per family, with single male/father families (8 | 10.7%) accounting for the largest median family size of 4.13 persons per family. On the other hand, married-couple families (64 | 85.3%) represent the smallest median family size with 2.77 persons per family.
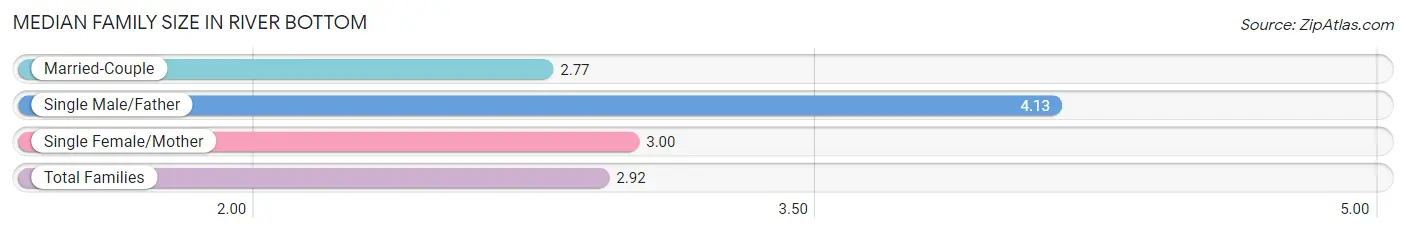
| Family Type | # Families | Family Size |
| Married-Couple | 64 (85.3%) | 2.77 |
| Single Male/Father | 8 (10.7%) | 4.13 |
| Single Female/Mother | 3 (4.0%) | 3.00 |
| Total Families | 75 (100.0%) | 2.92 |
Median Household Size in River Bottom
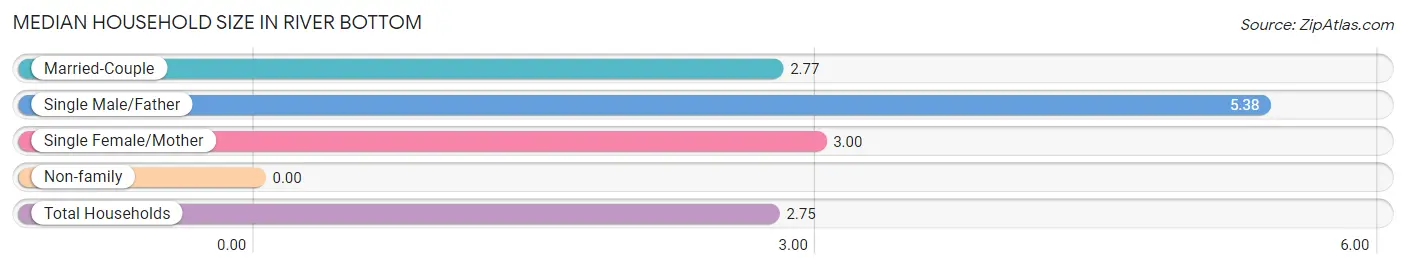
| Household Type | # Households | Household Size |
| Married-Couple | 64 (72.7%) | 2.77 |
| Single Male/Father | 8 (9.1%) | 5.38 |
| Single Female/Mother | 3 (3.4%) | 3.00 |
| Non-family | 13 (14.8%) | - |
| Total Households | 88 (100.0%) | 2.75 |
Household Size by Marriage Status in River Bottom
Out of a total of 88 households in River Bottom, 75 (85.2%) are family households, while 13 (14.8%) are nonfamily households. The most numerous type of family households are 2-person households, comprising 46, and the most common type of nonfamily households are 1-person households, comprising 13.
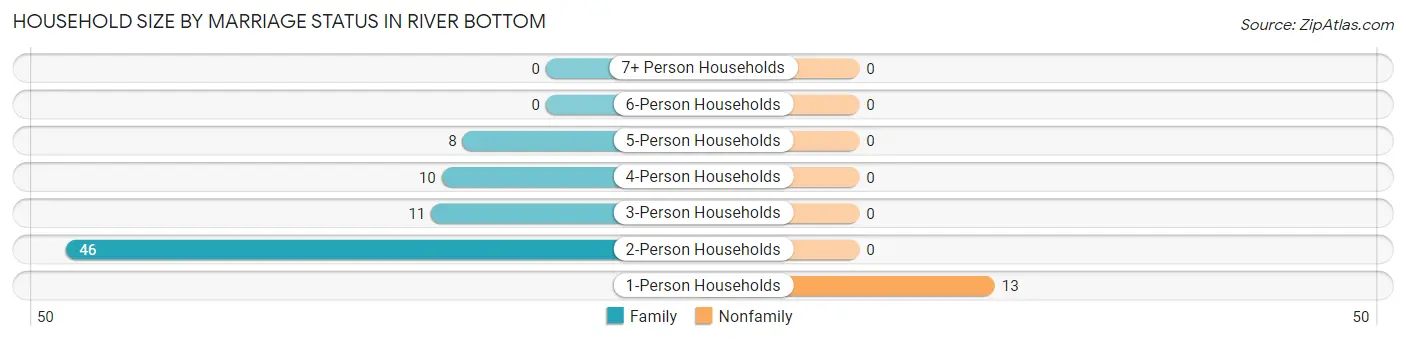
| Household Size | Family Households | Nonfamily Households |
| 1-Person Households | - | 13 (14.8%) |
| 2-Person Households | 46 (52.3%) | 0 (0.0%) |
| 3-Person Households | 11 (12.5%) | 0 (0.0%) |
| 4-Person Households | 10 (11.4%) | 0 (0.0%) |
| 5-Person Households | 8 (9.1%) | 0 (0.0%) |
| 6-Person Households | 0 (0.0%) | 0 (0.0%) |
| 7+ Person Households | 0 (0.0%) | 0 (0.0%) |
| Total | 75 (85.2%) | 13 (14.8%) |
Female Fertility in River Bottom
Fertility by Age in River Bottom
| Age Bracket | Women with Births | Births / 1,000 Women |
| 15 to 19 years | 0 (0.0%) | 0.0 |
| 20 to 34 years | 0 (0.0%) | 0.0 |
| 35 to 50 years | 0 (0.0%) | 0.0 |
| Total | 0 (0.0%) | 0.0 |
Fertility by Age by Marriage Status in River Bottom
| Age Bracket | Married | Unmarried |
| 15 to 19 years | 0 (0.0%) | 0 (0.0%) |
| 20 to 34 years | 0 (0.0%) | 0 (0.0%) |
| 35 to 50 years | 0 (0.0%) | 0 (0.0%) |
| Total | 0 (0.0%) | 0 (0.0%) |
Fertility by Education in River Bottom
| Educational Attainment | Women with Births | Births / 1,000 Women |
| Less than High School | 0 (0.0%) | 0.0 |
| High School Diploma | 0 (0.0%) | 0.0 |
| College or Associate's Degree | 0 (0.0%) | 0.0 |
| Bachelor's Degree | 0 (0.0%) | 0.0 |
| Graduate Degree | 0 (0.0%) | 0.0 |
| Total | 0 (0.0%) | 0.0 |
Fertility by Education by Marriage Status in River Bottom
| Educational Attainment | Married | Unmarried |
| Less than High School | 0 (0.0%) | 0 (0.0%) |
| High School Diploma | 0 (0.0%) | 0 (0.0%) |
| College or Associate's Degree | 0 (0.0%) | 0 (0.0%) |
| Bachelor's Degree | 0 (0.0%) | 0 (0.0%) |
| Graduate Degree | 0 (0.0%) | 0 (0.0%) |
| Total | 0 (0.0%) | 0 (0.0%) |
Employment Characteristics in River Bottom
Employment by Class of Employer in River Bottom
Among the 88 employed individuals in River Bottom, private company employees (61 | 69.3%), self-employed (incorporated) (7 | 8.0%), and self-employed (not incorporated) (5 | 5.7%) make up the most common classes of employment.
| Employer Class | # Employees | % Employees |
| Private Company Employees | 61 | 69.3% |
| Self-Employed (Incorporated) | 7 | 8.0% |
| Self-Employed (Not Incorporated) | 5 | 5.7% |
| Not-for-profit Organizations | 4 | 4.5% |
| Local Government Employees | 4 | 4.5% |
| State Government Employees | 3 | 3.4% |
| Federal Government Employees | 4 | 4.5% |
| Unpaid Family Workers | 0 | 0.0% |
| Total | 88 | 100.0% |
Employment Status by Age in River Bottom
According to the labor force statistics for River Bottom, out of the total population over 16 years of age (190), 48.4% or 92 individuals are in the labor force, with 4.3% or 4 of them unemployed. The age group with the highest labor force participation rate is 16 to 19 years, with 100.0% or 4 individuals in the labor force. Within the labor force, the 30 to 34 years age range has the highest percentage of unemployed individuals, with 22.2% or 4 of them being unemployed.
| Age Bracket | In Labor Force | Unemployed |
| 16 to 19 Years | 4 (100.0%) | 0 (0.0%) |
| 20 to 24 Years | 14 (100.0%) | 0 (0.0%) |
| 25 to 29 Years | 0 (0.0%) | 0 (0.0%) |
| 30 to 34 Years | 18 (66.7%) | 4 (22.2%) |
| 35 to 44 Years | 25 (86.2%) | 0 (0.0%) |
| 45 to 54 Years | 16 (57.1%) | 0 (0.0%) |
| 55 to 59 Years | 9 (50.0%) | 0 (0.0%) |
| 60 to 64 Years | 3 (33.3%) | 0 (0.0%) |
| 65 to 74 Years | 3 (6.4%) | 0 (0.0%) |
| 75 Years and over | 0 (0.0%) | 0 (0.0%) |
| Total | 92 (48.4%) | 4 (4.3%) |
Employment Status by Educational Attainment in River Bottom
According to labor force statistics for River Bottom, 64.0% of individuals (71) out of the total population between 25 and 64 years of age (111) are in the labor force, with 5.6% or 4 of them being unemployed. The group with the highest labor force participation rate are those with the educational attainment of college / associate degree, with 71.9% or 23 individuals in the labor force. Within the labor force, individuals with high school diploma education have the highest percentage of unemployment, with 10.5% or 4 of them being unemployed.
| Educational Attainment | In Labor Force | Unemployed |
| Less than High School | 3 (50.0%) | 0 (0.0%) |
| High School Diploma | 38 (60.3%) | 7 (10.5%) |
| College / Associate Degree | 23 (71.9%) | 0 (0.0%) |
| Bachelor's Degree or higher | 7 (70.0%) | 0 (0.0%) |
| Total | 71 (64.0%) | 6 (5.6%) |
Employment Occupations by Sex in River Bottom
Management, Business, Science and Arts Occupations
The most common Management, Business, Science and Arts occupations in River Bottom are Management (7 | 8.0%), Business & Financial (7 | 8.0%), Health Diagnosing & Treating (4 | 4.5%), Health Technologists (4 | 4.5%), and Community & Social Service (3 | 3.4%).
Management, Business, Science and Arts Occupations by Sex
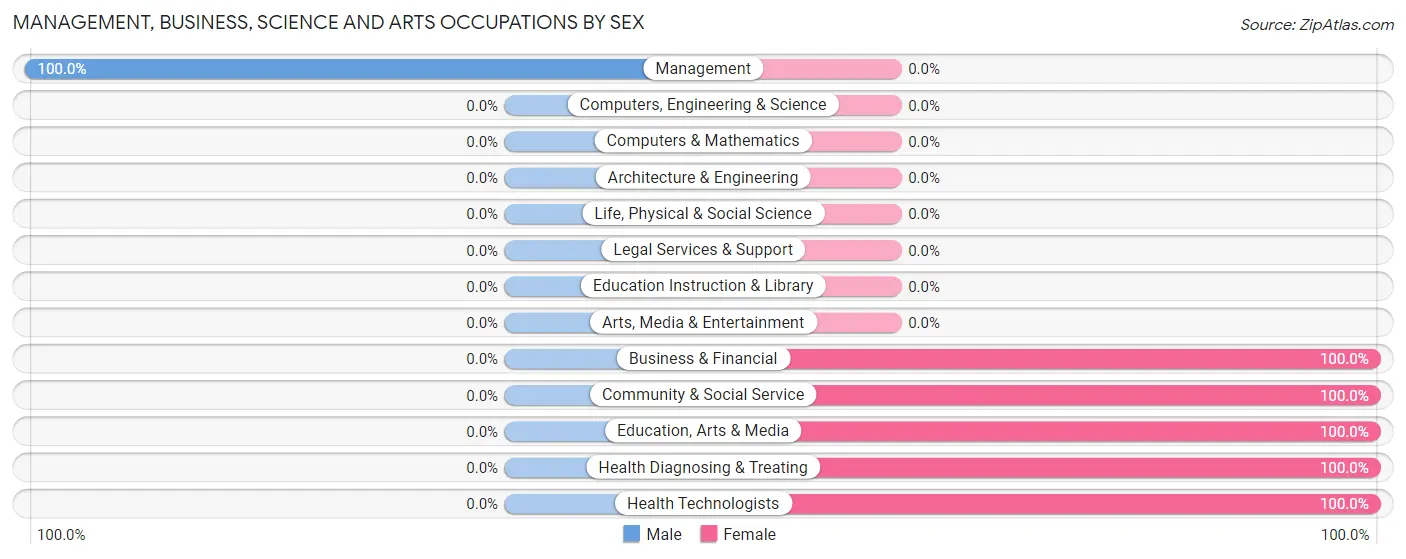
| Occupation | Male | Female |
| Management | 7 (100.0%) | 0 (0.0%) |
| Business & Financial | 0 (0.0%) | 7 (100.0%) |
| Computers, Engineering & Science | 0 (0.0%) | 0 (0.0%) |
| Computers & Mathematics | 0 (0.0%) | 0 (0.0%) |
| Architecture & Engineering | 0 (0.0%) | 0 (0.0%) |
| Life, Physical & Social Science | 0 (0.0%) | 0 (0.0%) |
| Community & Social Service | 0 (0.0%) | 3 (100.0%) |
| Education, Arts & Media | 0 (0.0%) | 3 (100.0%) |
| Legal Services & Support | 0 (0.0%) | 0 (0.0%) |
| Education Instruction & Library | 0 (0.0%) | 0 (0.0%) |
| Arts, Media & Entertainment | 0 (0.0%) | 0 (0.0%) |
| Health Diagnosing & Treating | 0 (0.0%) | 4 (100.0%) |
| Health Technologists | 0 (0.0%) | 4 (100.0%) |
| Total (Category) | 7 (33.3%) | 14 (66.7%) |
| Total (Overall) | 55 (62.5%) | 33 (37.5%) |
Services Occupations
The most common Services occupations in River Bottom are Cleaning & Maintenance (10 | 11.4%), and Healthcare Support (5 | 5.7%).
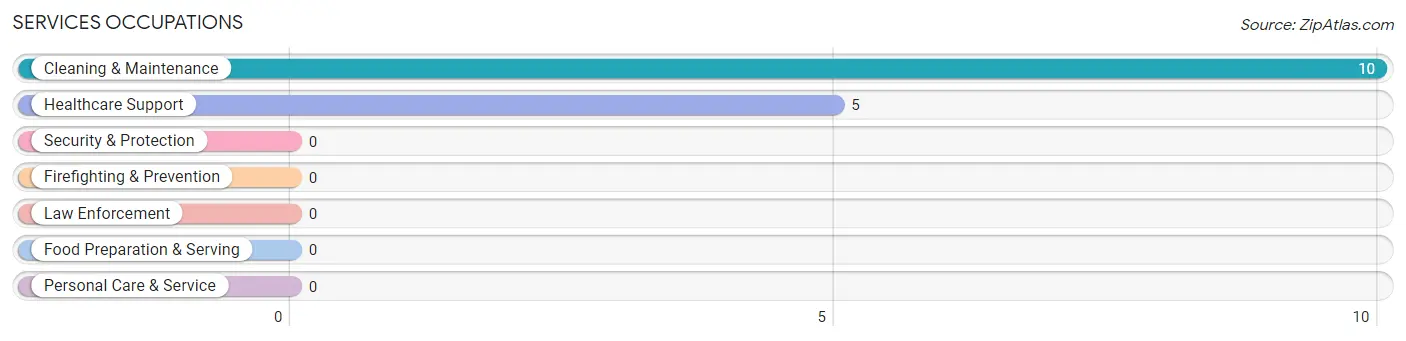
Services Occupations by Sex
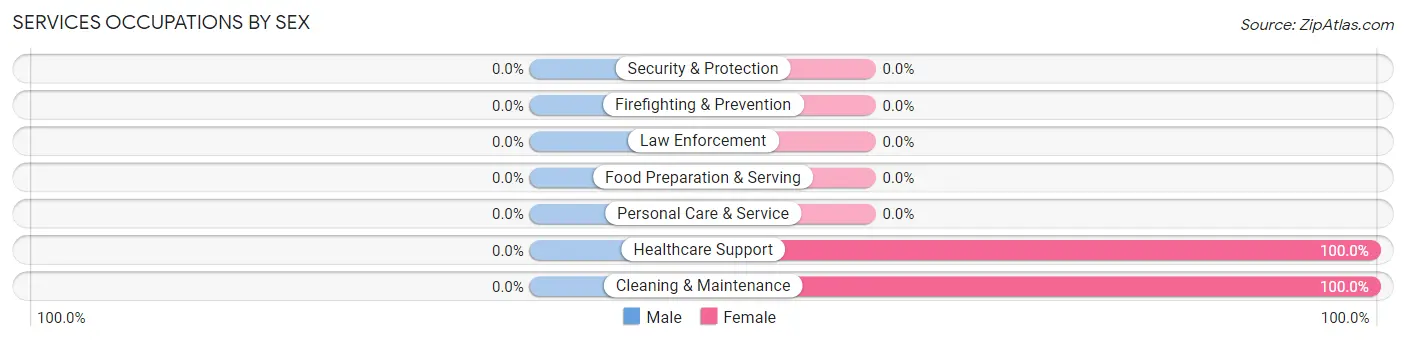
| Occupation | Male | Female |
| Healthcare Support | 0 (0.0%) | 5 (100.0%) |
| Security & Protection | 0 (0.0%) | 0 (0.0%) |
| Firefighting & Prevention | 0 (0.0%) | 0 (0.0%) |
| Law Enforcement | 0 (0.0%) | 0 (0.0%) |
| Food Preparation & Serving | 0 (0.0%) | 0 (0.0%) |
| Cleaning & Maintenance | 0 (0.0%) | 10 (100.0%) |
| Personal Care & Service | 0 (0.0%) | 0 (0.0%) |
| Total (Category) | 0 (0.0%) | 15 (100.0%) |
| Total (Overall) | 55 (62.5%) | 33 (37.5%) |
Sales and Office Occupations
The most common Sales and Office occupations in River Bottom are , and Office & Administration (4 | 4.5%).
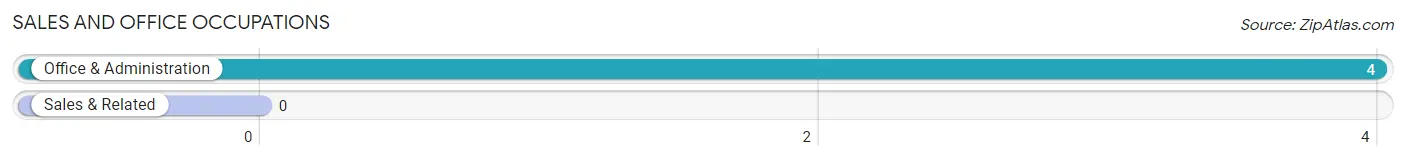
Sales and Office Occupations by Sex
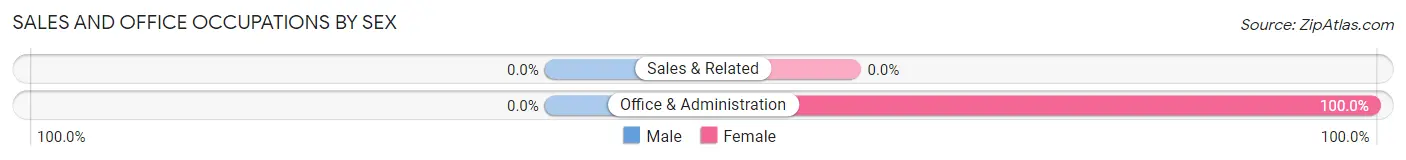
| Occupation | Male | Female |
| Sales & Related | 0 (0.0%) | 0 (0.0%) |
| Office & Administration | 0 (0.0%) | 4 (100.0%) |
| Total (Category) | 0 (0.0%) | 4 (100.0%) |
| Total (Overall) | 55 (62.5%) | 33 (37.5%) |
Natural Resources, Construction and Maintenance Occupations
The most common Natural Resources, Construction and Maintenance occupations in River Bottom are Installation, Maintenance & Repair (4 | 4.5%), and Construction & Extraction (3 | 3.4%).
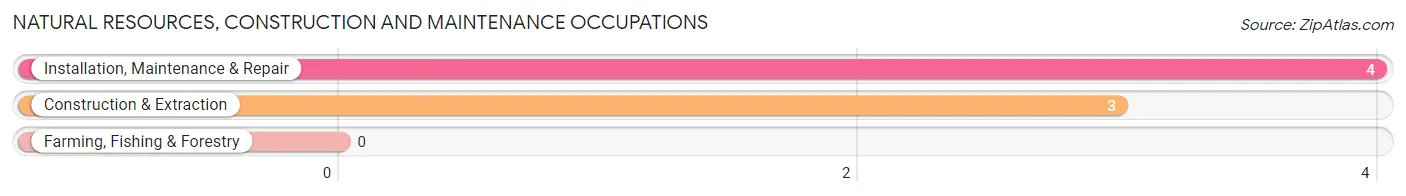
Natural Resources, Construction and Maintenance Occupations by Sex
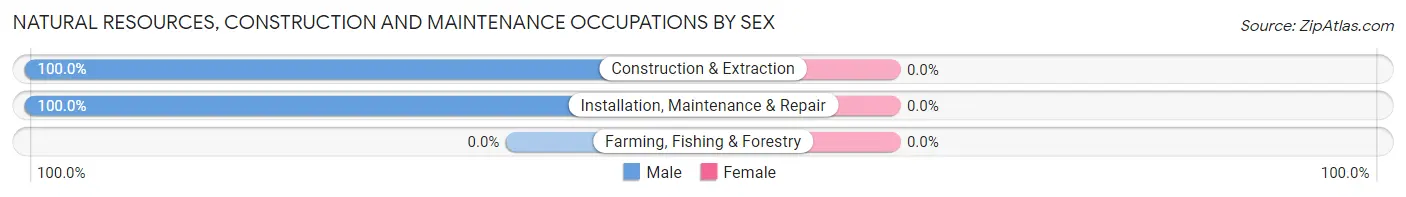
| Occupation | Male | Female |
| Farming, Fishing & Forestry | 0 (0.0%) | 0 (0.0%) |
| Construction & Extraction | 3 (100.0%) | 0 (0.0%) |
| Installation, Maintenance & Repair | 4 (100.0%) | 0 (0.0%) |
| Total (Category) | 7 (100.0%) | 0 (0.0%) |
| Total (Overall) | 55 (62.5%) | 33 (37.5%) |
Production, Transportation and Moving Occupations
The most common Production, Transportation and Moving occupations in River Bottom are Production (25 | 28.4%), Transportation (12 | 13.6%), and Material Moving (4 | 4.5%).
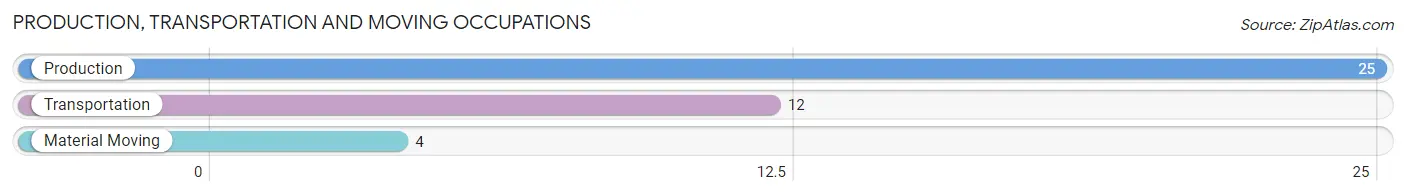
Production, Transportation and Moving Occupations by Sex
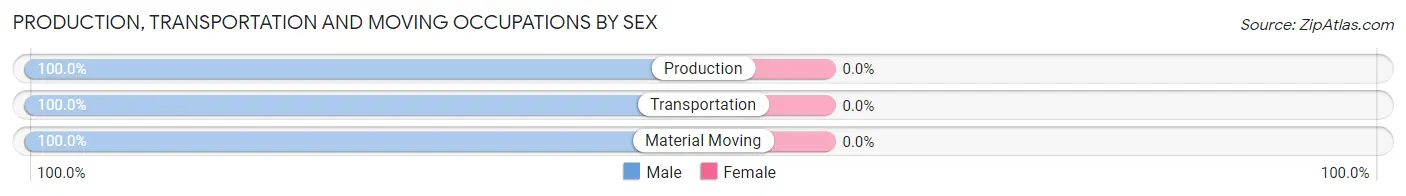
| Occupation | Male | Female |
| Production | 25 (100.0%) | 0 (0.0%) |
| Transportation | 12 (100.0%) | 0 (0.0%) |
| Material Moving | 4 (100.0%) | 0 (0.0%) |
| Total (Category) | 41 (100.0%) | 0 (0.0%) |
| Total (Overall) | 55 (62.5%) | 33 (37.5%) |
Employment Industries by Sex in River Bottom
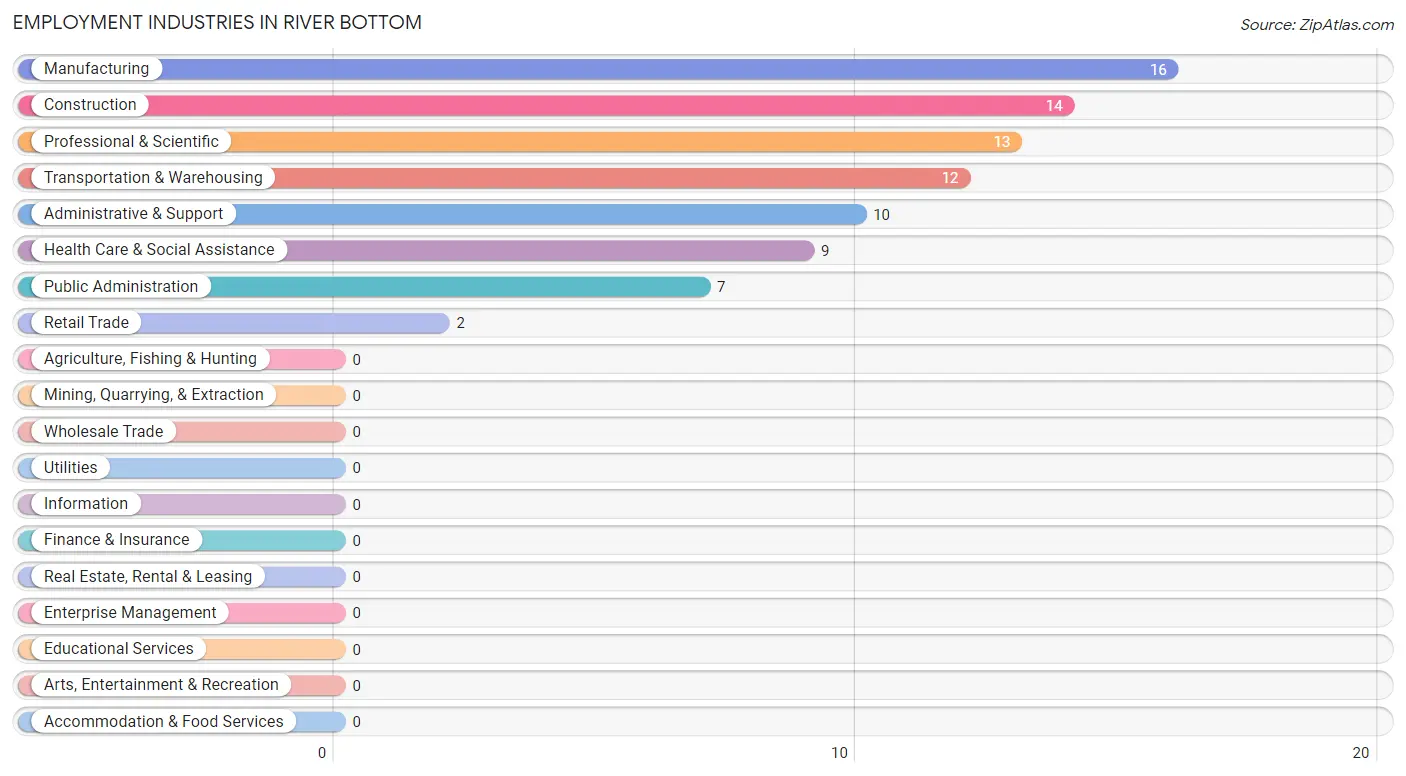
Employment Industries in River Bottom
The major employment industries in River Bottom include Manufacturing (16 | 18.2%), Construction (14 | 15.9%), Professional & Scientific (13 | 14.8%), Transportation & Warehousing (12 | 13.6%), and Administrative & Support (10 | 11.4%).
Employment Industries by Sex in River Bottom
The River Bottom industries that see more men than women are Construction (100.0%), Manufacturing (100.0%), and Retail Trade (100.0%), whereas the industries that tend to have a higher number of women are Administrative & Support (100.0%), Health Care & Social Assistance (100.0%), and Professional & Scientific (84.6%).
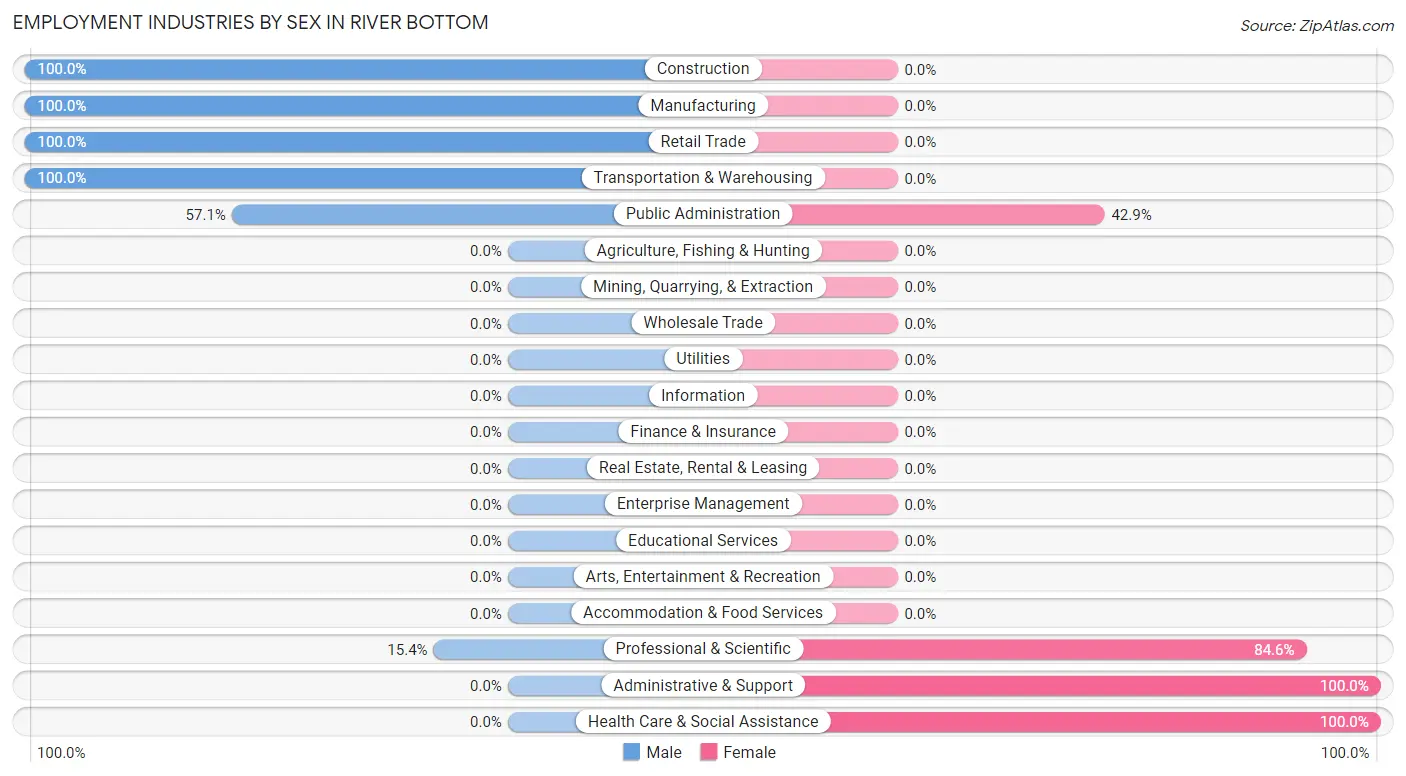
| Industry | Male | Female |
| Agriculture, Fishing & Hunting | 0 (0.0%) | 0 (0.0%) |
| Mining, Quarrying, & Extraction | 0 (0.0%) | 0 (0.0%) |
| Construction | 14 (100.0%) | 0 (0.0%) |
| Manufacturing | 16 (100.0%) | 0 (0.0%) |
| Wholesale Trade | 0 (0.0%) | 0 (0.0%) |
| Retail Trade | 2 (100.0%) | 0 (0.0%) |
| Transportation & Warehousing | 12 (100.0%) | 0 (0.0%) |
| Utilities | 0 (0.0%) | 0 (0.0%) |
| Information | 0 (0.0%) | 0 (0.0%) |
| Finance & Insurance | 0 (0.0%) | 0 (0.0%) |
| Real Estate, Rental & Leasing | 0 (0.0%) | 0 (0.0%) |
| Professional & Scientific | 2 (15.4%) | 11 (84.6%) |
| Enterprise Management | 0 (0.0%) | 0 (0.0%) |
| Administrative & Support | 0 (0.0%) | 10 (100.0%) |
| Educational Services | 0 (0.0%) | 0 (0.0%) |
| Health Care & Social Assistance | 0 (0.0%) | 9 (100.0%) |
| Arts, Entertainment & Recreation | 0 (0.0%) | 0 (0.0%) |
| Accommodation & Food Services | 0 (0.0%) | 0 (0.0%) |
| Public Administration | 4 (57.1%) | 3 (42.9%) |
| Total | 55 (62.5%) | 33 (37.5%) |
Education in River Bottom
School Enrollment in River Bottom
The most common levels of schooling among the 43 students in River Bottom are elementary school (19 | 44.2%), college / undergraduate (9 | 20.9%), and middle school (7 | 16.3%).
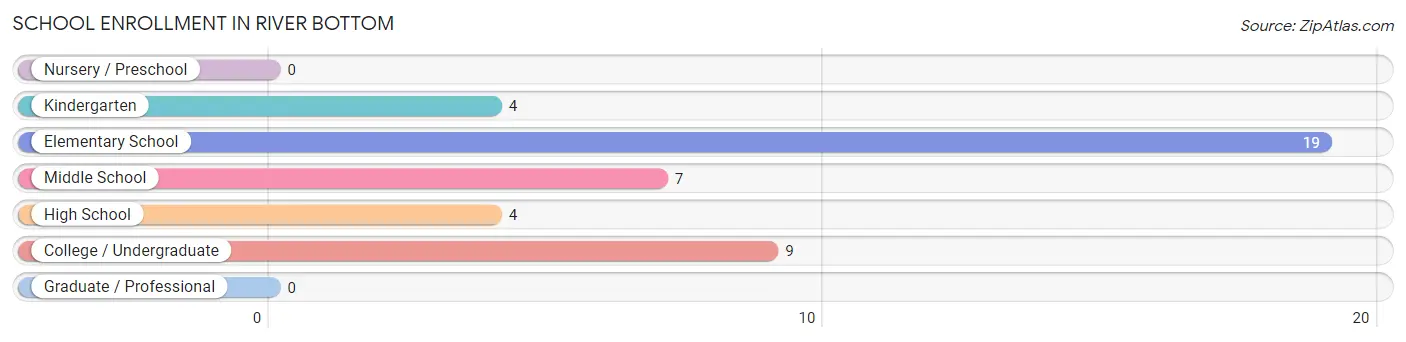
| School Level | # Students | % Students |
| Nursery / Preschool | 0 | 0.0% |
| Kindergarten | 4 | 9.3% |
| Elementary School | 19 | 44.2% |
| Middle School | 7 | 16.3% |
| High School | 4 | 9.3% |
| College / Undergraduate | 9 | 20.9% |
| Graduate / Professional | 0 | 0.0% |
| Total | 43 | 100.0% |
School Enrollment by Age by Funding Source in River Bottom
Out of a total of 43 students who are enrolled in schools in River Bottom, 15 (34.9%) attend a private institution, while the remaining 28 (65.1%) are enrolled in public schools. The age group of 20 to 24 year olds has the highest likelihood of being enrolled in private schools, with 9 (100.0% in the age bracket) enrolled. Conversely, the age group of 18 to 19 year olds has the lowest likelihood of being enrolled in a private school, with 4 (100.0% in the age bracket) attending a public institution.
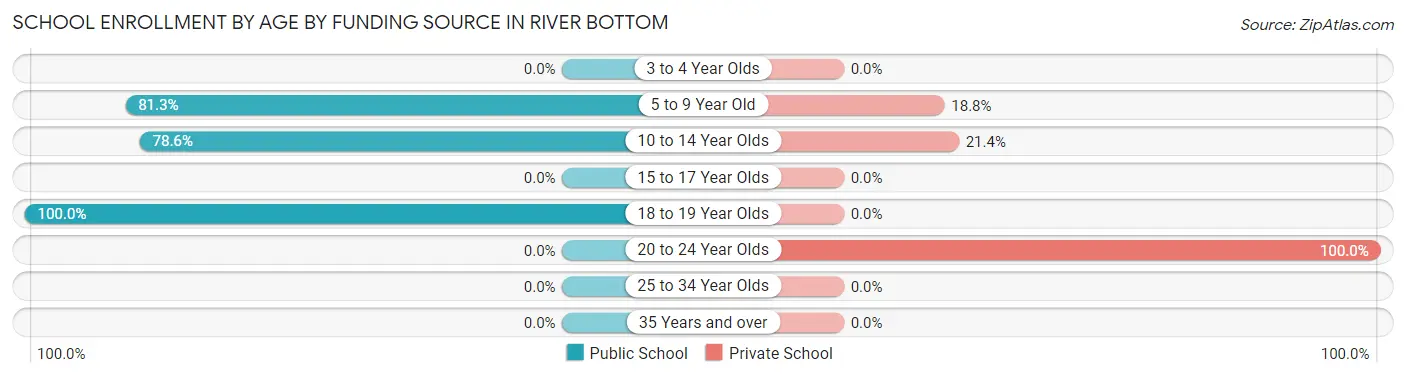
| Age Bracket | Public School | Private School |
| 3 to 4 Year Olds | 0 (0.0%) | 0 (0.0%) |
| 5 to 9 Year Old | 13 (81.2%) | 3 (18.8%) |
| 10 to 14 Year Olds | 11 (78.6%) | 3 (21.4%) |
| 15 to 17 Year Olds | 0 (0.0%) | 0 (0.0%) |
| 18 to 19 Year Olds | 4 (100.0%) | 0 (0.0%) |
| 20 to 24 Year Olds | 0 (0.0%) | 9 (100.0%) |
| 25 to 34 Year Olds | 0 (0.0%) | 0 (0.0%) |
| 35 Years and over | 0 (0.0%) | 0 (0.0%) |
| Total | 28 (65.1%) | 15 (34.9%) |
Educational Attainment by Field of Study in River Bottom
Business (4 | 40.0%), science & technology (3 | 30.0%), and education (3 | 30.0%) are the most common fields of study among 10 individuals in River Bottom who have obtained a bachelor's degree or higher.
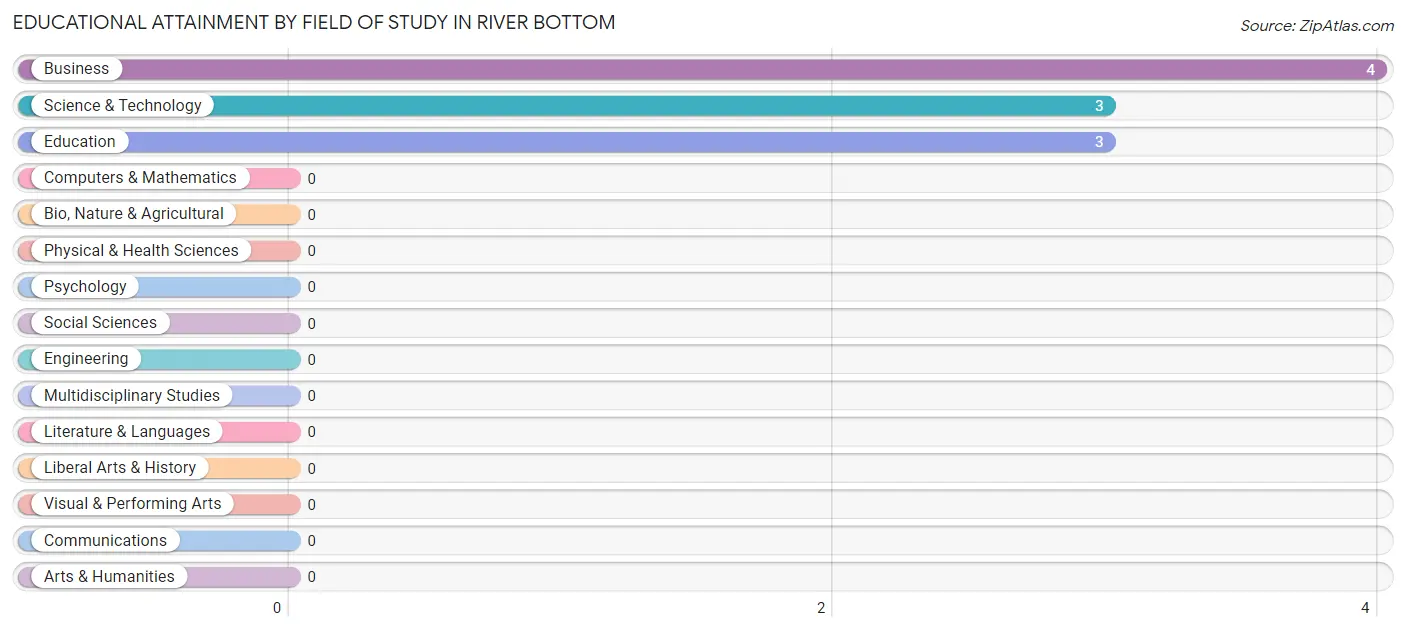
| Field of Study | # Graduates | % Graduates |
| Computers & Mathematics | 0 | 0.0% |
| Bio, Nature & Agricultural | 0 | 0.0% |
| Physical & Health Sciences | 0 | 0.0% |
| Psychology | 0 | 0.0% |
| Social Sciences | 0 | 0.0% |
| Engineering | 0 | 0.0% |
| Multidisciplinary Studies | 0 | 0.0% |
| Science & Technology | 3 | 30.0% |
| Business | 4 | 40.0% |
| Education | 3 | 30.0% |
| Literature & Languages | 0 | 0.0% |
| Liberal Arts & History | 0 | 0.0% |
| Visual & Performing Arts | 0 | 0.0% |
| Communications | 0 | 0.0% |
| Arts & Humanities | 0 | 0.0% |
| Total | 10 | 100.0% |
Transportation & Commute in River Bottom
Vehicle Availability by Sex in River Bottom
The most prevalent vehicle ownership categories in River Bottom are males with 3 vehicles (18, accounting for 32.7%) and females with 3 vehicles (25, making up 54.5%).
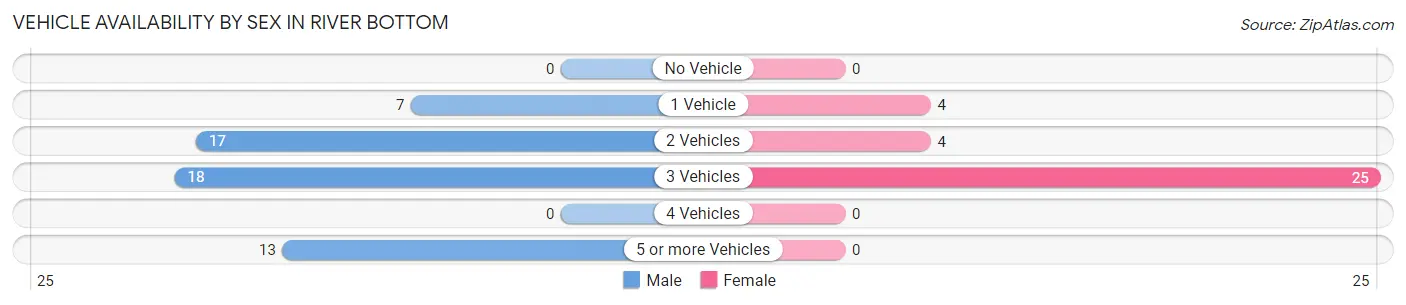
| Vehicles Available | Male | Female |
| No Vehicle | 0 (0.0%) | 0 (0.0%) |
| 1 Vehicle | 7 (12.7%) | 4 (12.1%) |
| 2 Vehicles | 17 (30.9%) | 4 (12.1%) |
| 3 Vehicles | 18 (32.7%) | 25 (75.8%) |
| 4 Vehicles | 0 (0.0%) | 0 (0.0%) |
| 5 or more Vehicles | 13 (23.6%) | 0 (0.0%) |
| Total | 55 (100.0%) | 33 (100.0%) |
Commute Time in River Bottom
The most frequently occuring commute durations in River Bottom are 45 to 59 minutes (19 commuters, 26.4%), 10 to 14 minutes (13 commuters, 18.1%), and 30 to 34 minutes (12 commuters, 16.7%).
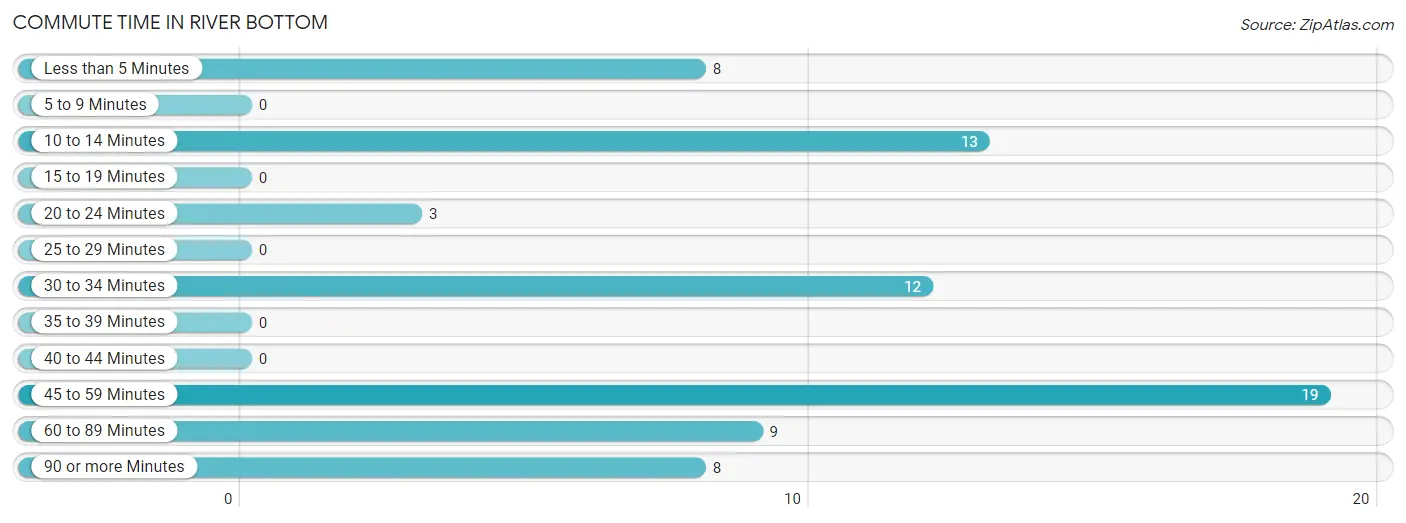
| Commute Time | # Commuters | % Commuters |
| Less than 5 Minutes | 8 | 11.1% |
| 5 to 9 Minutes | 0 | 0.0% |
| 10 to 14 Minutes | 13 | 18.1% |
| 15 to 19 Minutes | 0 | 0.0% |
| 20 to 24 Minutes | 3 | 4.2% |
| 25 to 29 Minutes | 0 | 0.0% |
| 30 to 34 Minutes | 12 | 16.7% |
| 35 to 39 Minutes | 0 | 0.0% |
| 40 to 44 Minutes | 0 | 0.0% |
| 45 to 59 Minutes | 19 | 26.4% |
| 60 to 89 Minutes | 9 | 12.5% |
| 90 or more Minutes | 8 | 11.1% |
Commute Time by Sex in River Bottom
The most common commute times in River Bottom are 45 to 59 minutes (10 commuters, 21.7%) for males and 10 to 14 minutes (10 commuters, 38.5%) for females.
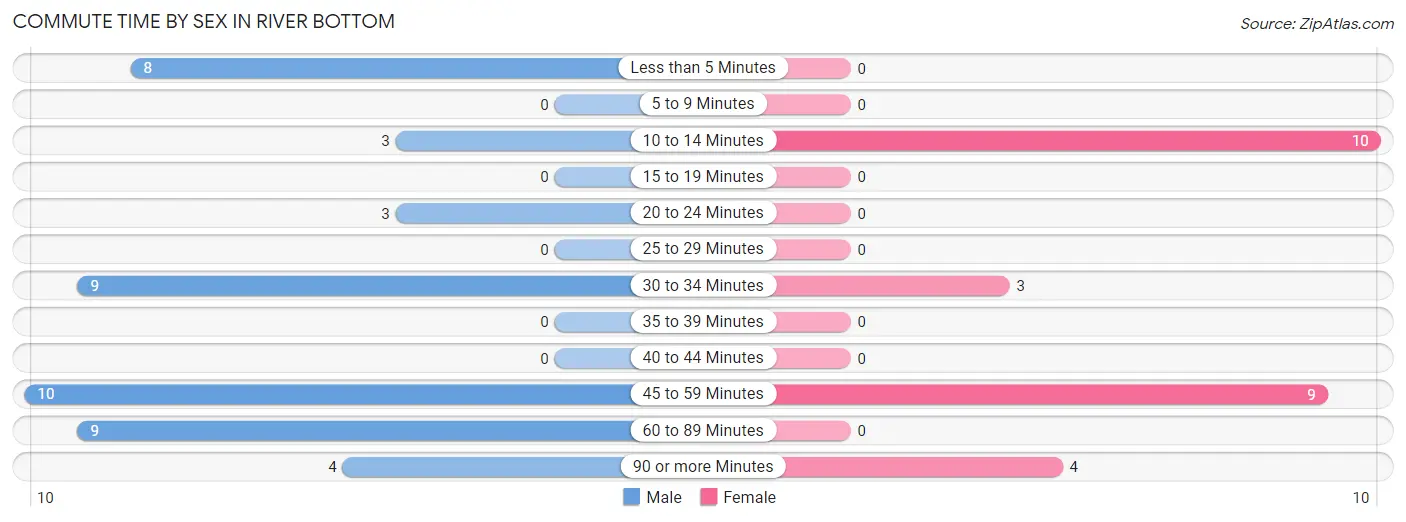
| Commute Time | Male | Female |
| Less than 5 Minutes | 8 (17.4%) | 0 (0.0%) |
| 5 to 9 Minutes | 0 (0.0%) | 0 (0.0%) |
| 10 to 14 Minutes | 3 (6.5%) | 10 (38.5%) |
| 15 to 19 Minutes | 0 (0.0%) | 0 (0.0%) |
| 20 to 24 Minutes | 3 (6.5%) | 0 (0.0%) |
| 25 to 29 Minutes | 0 (0.0%) | 0 (0.0%) |
| 30 to 34 Minutes | 9 (19.6%) | 3 (11.5%) |
| 35 to 39 Minutes | 0 (0.0%) | 0 (0.0%) |
| 40 to 44 Minutes | 0 (0.0%) | 0 (0.0%) |
| 45 to 59 Minutes | 10 (21.7%) | 9 (34.6%) |
| 60 to 89 Minutes | 9 (19.6%) | 0 (0.0%) |
| 90 or more Minutes | 4 (8.7%) | 4 (15.4%) |
Time of Departure to Work by Sex in River Bottom
The most frequent times of departure to work in River Bottom are 6:30 AM to 6:59 AM (10, 21.7%) for males and 7:00 AM to 7:29 AM (12, 46.2%) for females.
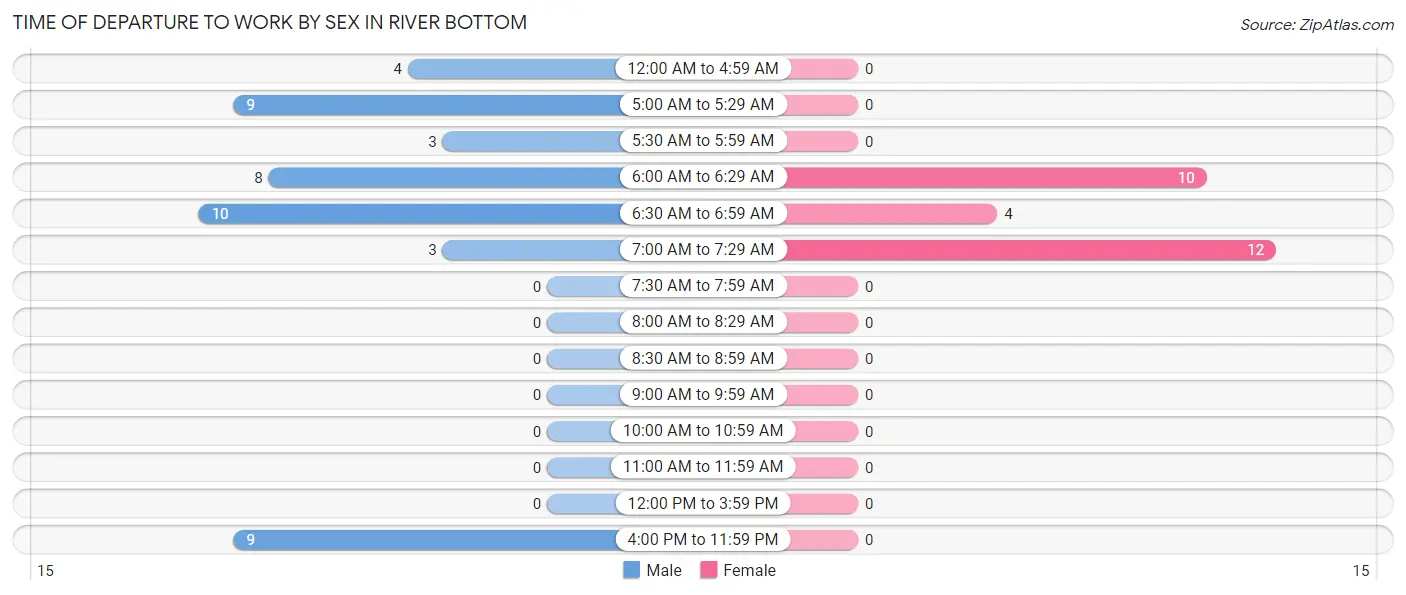
| Time of Departure | Male | Female |
| 12:00 AM to 4:59 AM | 4 (8.7%) | 0 (0.0%) |
| 5:00 AM to 5:29 AM | 9 (19.6%) | 0 (0.0%) |
| 5:30 AM to 5:59 AM | 3 (6.5%) | 0 (0.0%) |
| 6:00 AM to 6:29 AM | 8 (17.4%) | 10 (38.5%) |
| 6:30 AM to 6:59 AM | 10 (21.7%) | 4 (15.4%) |
| 7:00 AM to 7:29 AM | 3 (6.5%) | 12 (46.2%) |
| 7:30 AM to 7:59 AM | 0 (0.0%) | 0 (0.0%) |
| 8:00 AM to 8:29 AM | 0 (0.0%) | 0 (0.0%) |
| 8:30 AM to 8:59 AM | 0 (0.0%) | 0 (0.0%) |
| 9:00 AM to 9:59 AM | 0 (0.0%) | 0 (0.0%) |
| 10:00 AM to 10:59 AM | 0 (0.0%) | 0 (0.0%) |
| 11:00 AM to 11:59 AM | 0 (0.0%) | 0 (0.0%) |
| 12:00 PM to 3:59 PM | 0 (0.0%) | 0 (0.0%) |
| 4:00 PM to 11:59 PM | 9 (19.6%) | 0 (0.0%) |
| Total | 46 (100.0%) | 26 (100.0%) |
Housing Occupancy in River Bottom
Occupancy by Ownership in River Bottom
Of the total 88 dwellings in River Bottom, owner-occupied units account for 81 (92.0%), while renter-occupied units make up 7 (8.0%).
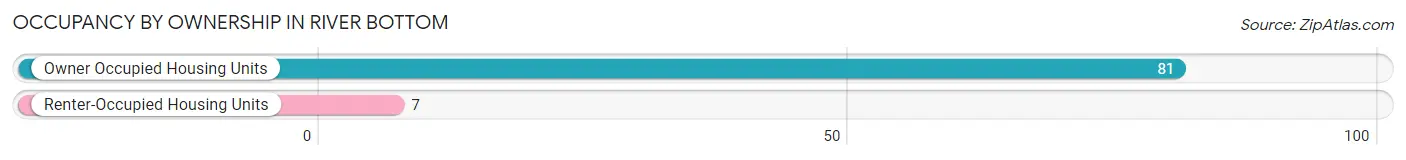
| Occupancy | # Housing Units | % Housing Units |
| Owner Occupied Housing Units | 81 | 92.0% |
| Renter-Occupied Housing Units | 7 | 8.0% |
| Total Occupied Housing Units | 88 | 100.0% |
Occupancy by Household Size in River Bottom
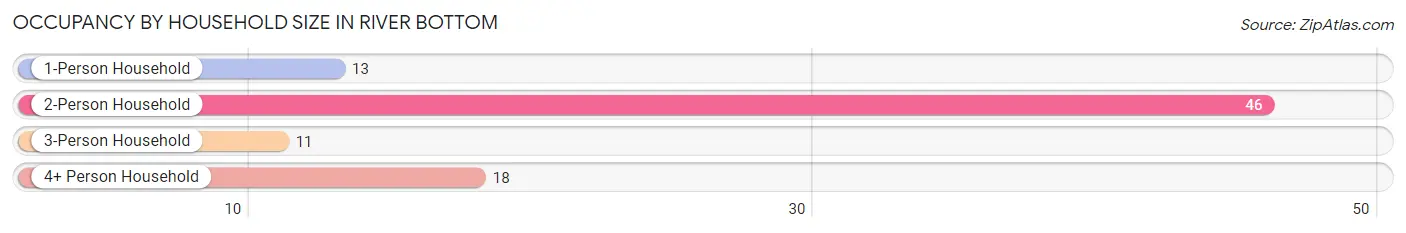
| Household Size | # Housing Units | % Housing Units |
| 1-Person Household | 13 | 14.8% |
| 2-Person Household | 46 | 52.3% |
| 3-Person Household | 11 | 12.5% |
| 4+ Person Household | 18 | 20.4% |
| Total Housing Units | 88 | 100.0% |
Occupancy by Ownership by Household Size in River Bottom
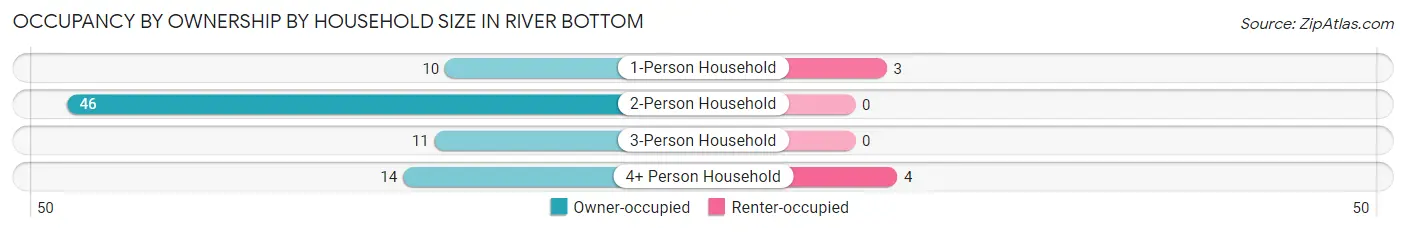
| Household Size | Owner-occupied | Renter-occupied |
| 1-Person Household | 10 (76.9%) | 3 (23.1%) |
| 2-Person Household | 46 (100.0%) | 0 (0.0%) |
| 3-Person Household | 11 (100.0%) | 0 (0.0%) |
| 4+ Person Household | 14 (77.8%) | 4 (22.2%) |
| Total Housing Units | 81 (92.0%) | 7 (8.0%) |
Occupancy by Educational Attainment in River Bottom
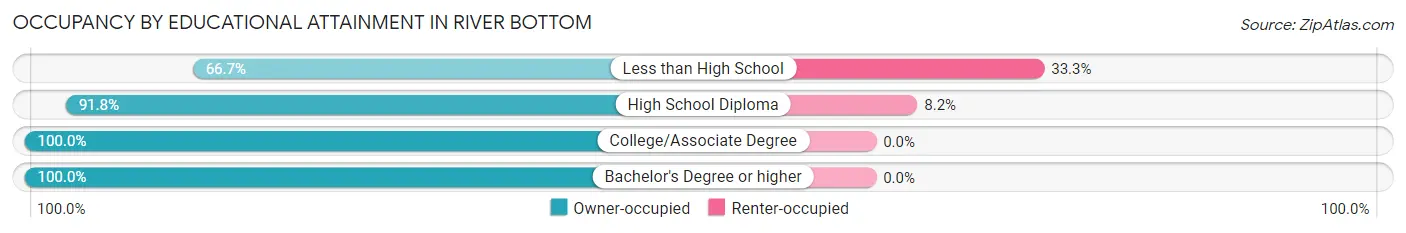
| Household Size | Owner-occupied | Renter-occupied |
| Less than High School | 6 (66.7%) | 3 (33.3%) |
| High School Diploma | 45 (91.8%) | 4 (8.2%) |
| College/Associate Degree | 23 (100.0%) | 0 (0.0%) |
| Bachelor's Degree or higher | 7 (100.0%) | 0 (0.0%) |
Occupancy by Age of Householder in River Bottom
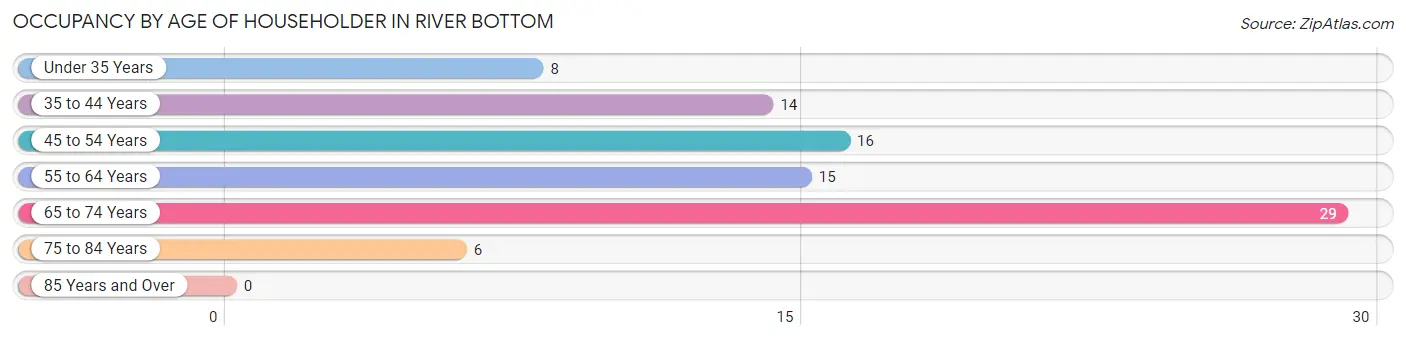
| Age Bracket | # Households | % Households |
| Under 35 Years | 8 | 9.1% |
| 35 to 44 Years | 14 | 15.9% |
| 45 to 54 Years | 16 | 18.2% |
| 55 to 64 Years | 15 | 17.1% |
| 65 to 74 Years | 29 | 33.0% |
| 75 to 84 Years | 6 | 6.8% |
| 85 Years and Over | 0 | 0.0% |
| Total | 88 | 100.0% |
Housing Finances in River Bottom
Median Income by Occupancy in River Bottom
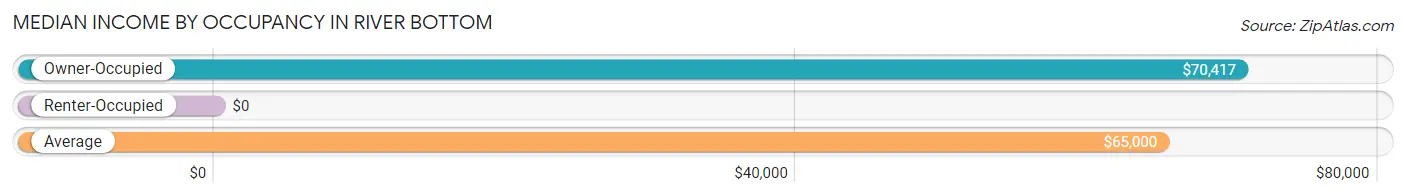
| Occupancy Type | # Households | Median Income |
| Owner-Occupied | 81 (92.0%) | $70,417 |
| Renter-Occupied | 7 (8.0%) | $0 |
| Average | 88 (100.0%) | $65,000 |
Occupancy by Householder Income Bracket in River Bottom
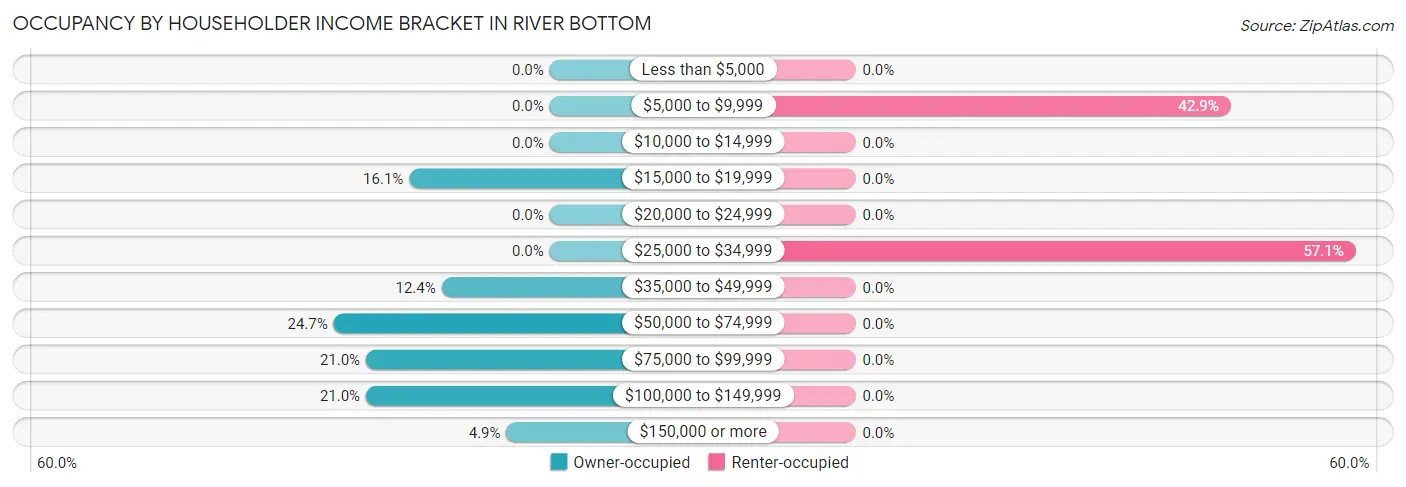
| Income Bracket | Owner-occupied | Renter-occupied |
| Less than $5,000 | 0 (0.0%) | 0 (0.0%) |
| $5,000 to $9,999 | 0 (0.0%) | 3 (42.9%) |
| $10,000 to $14,999 | 0 (0.0%) | 0 (0.0%) |
| $15,000 to $19,999 | 13 (16.1%) | 0 (0.0%) |
| $20,000 to $24,999 | 0 (0.0%) | 0 (0.0%) |
| $25,000 to $34,999 | 0 (0.0%) | 4 (57.1%) |
| $35,000 to $49,999 | 10 (12.3%) | 0 (0.0%) |
| $50,000 to $74,999 | 20 (24.7%) | 0 (0.0%) |
| $75,000 to $99,999 | 17 (21.0%) | 0 (0.0%) |
| $100,000 to $149,999 | 17 (21.0%) | 0 (0.0%) |
| $150,000 or more | 4 (4.9%) | 0 (0.0%) |
| Total | 81 (100.0%) | 7 (100.0%) |
Monthly Housing Cost Tiers in River Bottom
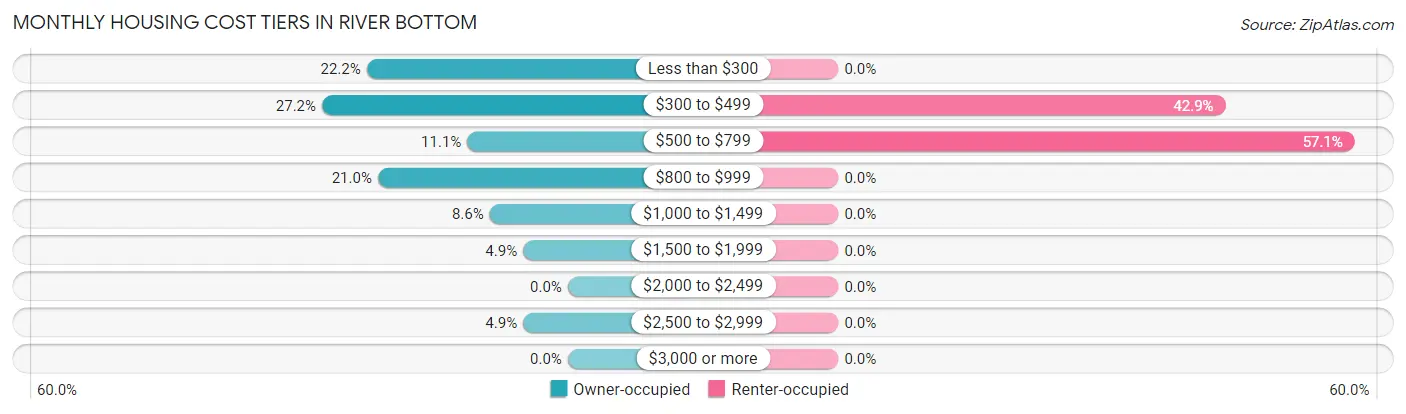
| Monthly Cost | Owner-occupied | Renter-occupied |
| Less than $300 | 18 (22.2%) | 0 (0.0%) |
| $300 to $499 | 22 (27.2%) | 3 (42.9%) |
| $500 to $799 | 9 (11.1%) | 4 (57.1%) |
| $800 to $999 | 17 (21.0%) | 0 (0.0%) |
| $1,000 to $1,499 | 7 (8.6%) | 0 (0.0%) |
| $1,500 to $1,999 | 4 (4.9%) | 0 (0.0%) |
| $2,000 to $2,499 | 0 (0.0%) | 0 (0.0%) |
| $2,500 to $2,999 | 4 (4.9%) | 0 (0.0%) |
| $3,000 or more | 0 (0.0%) | 0 (0.0%) |
| Total | 81 (100.0%) | 7 (100.0%) |
Physical Housing Characteristics in River Bottom
Housing Structures in River Bottom
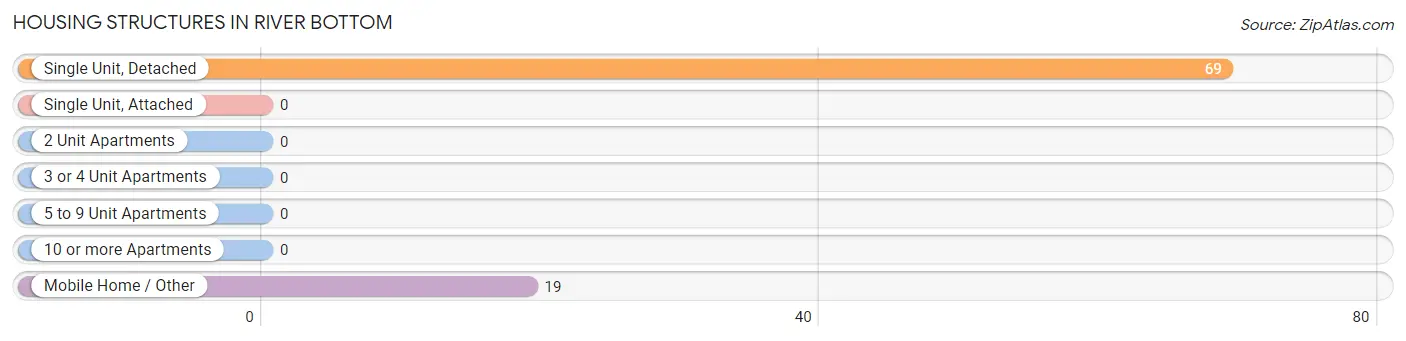
| Structure Type | # Housing Units | % Housing Units |
| Single Unit, Detached | 69 | 78.4% |
| Single Unit, Attached | 0 | 0.0% |
| 2 Unit Apartments | 0 | 0.0% |
| 3 or 4 Unit Apartments | 0 | 0.0% |
| 5 to 9 Unit Apartments | 0 | 0.0% |
| 10 or more Apartments | 0 | 0.0% |
| Mobile Home / Other | 19 | 21.6% |
| Total | 88 | 100.0% |
Housing Structures by Occupancy in River Bottom
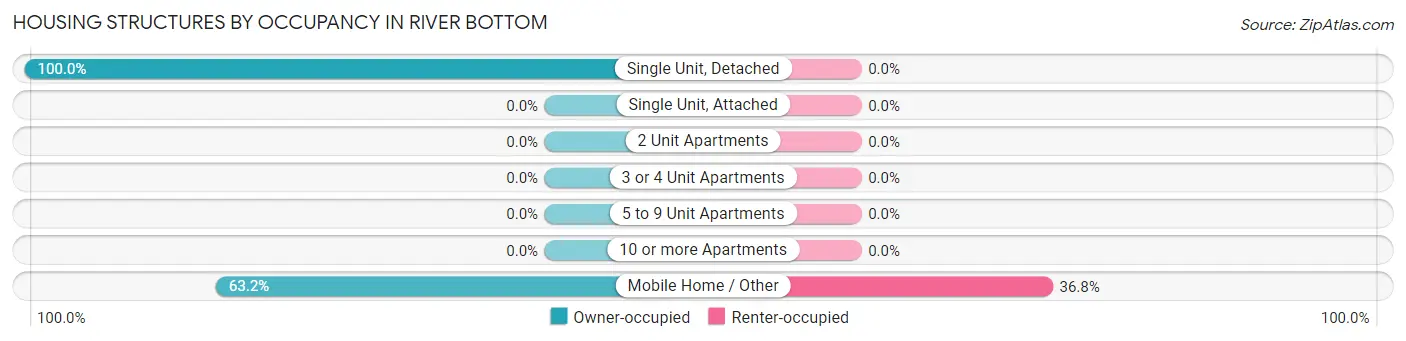
| Structure Type | Owner-occupied | Renter-occupied |
| Single Unit, Detached | 69 (100.0%) | 0 (0.0%) |
| Single Unit, Attached | 0 (0.0%) | 0 (0.0%) |
| 2 Unit Apartments | 0 (0.0%) | 0 (0.0%) |
| 3 or 4 Unit Apartments | 0 (0.0%) | 0 (0.0%) |
| 5 to 9 Unit Apartments | 0 (0.0%) | 0 (0.0%) |
| 10 or more Apartments | 0 (0.0%) | 0 (0.0%) |
| Mobile Home / Other | 12 (63.2%) | 7 (36.8%) |
| Total | 81 (92.0%) | 7 (8.0%) |
Housing Structures by Number of Rooms in River Bottom
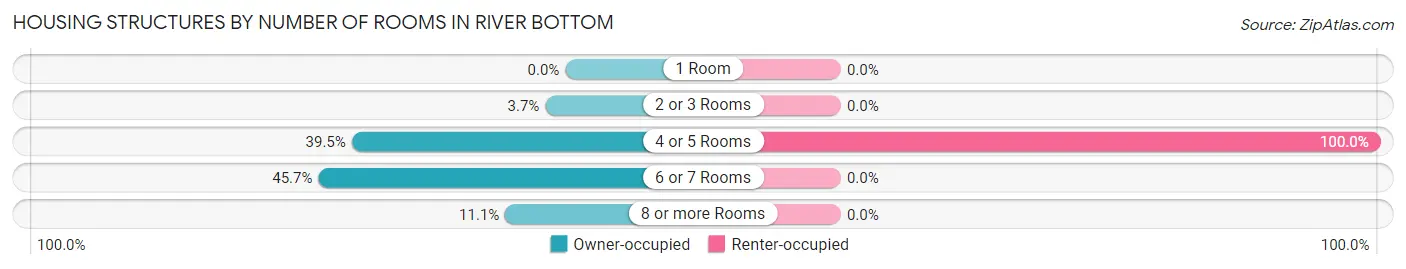
| Number of Rooms | Owner-occupied | Renter-occupied |
| 1 Room | 0 (0.0%) | 0 (0.0%) |
| 2 or 3 Rooms | 3 (3.7%) | 0 (0.0%) |
| 4 or 5 Rooms | 32 (39.5%) | 7 (100.0%) |
| 6 or 7 Rooms | 37 (45.7%) | 0 (0.0%) |
| 8 or more Rooms | 9 (11.1%) | 0 (0.0%) |
| Total | 81 (100.0%) | 7 (100.0%) |
Housing Structure by Heating Type in River Bottom
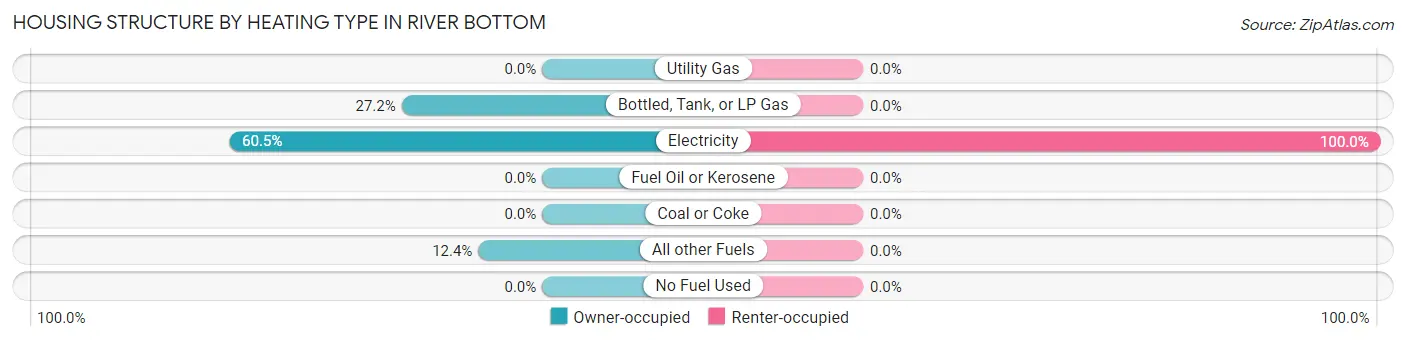
| Heating Type | Owner-occupied | Renter-occupied |
| Utility Gas | 0 (0.0%) | 0 (0.0%) |
| Bottled, Tank, or LP Gas | 22 (27.2%) | 0 (0.0%) |
| Electricity | 49 (60.5%) | 7 (100.0%) |
| Fuel Oil or Kerosene | 0 (0.0%) | 0 (0.0%) |
| Coal or Coke | 0 (0.0%) | 0 (0.0%) |
| All other Fuels | 10 (12.3%) | 0 (0.0%) |
| No Fuel Used | 0 (0.0%) | 0 (0.0%) |
| Total | 81 (100.0%) | 7 (100.0%) |
Household Vehicle Usage in River Bottom
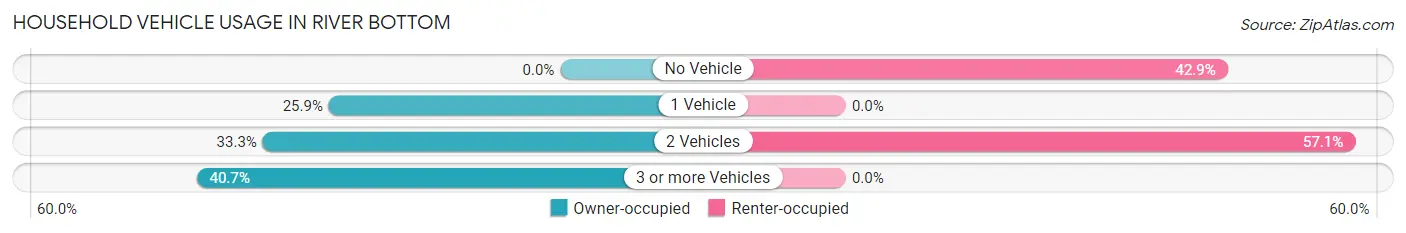
| Vehicles per Household | Owner-occupied | Renter-occupied |
| No Vehicle | 0 (0.0%) | 3 (42.9%) |
| 1 Vehicle | 21 (25.9%) | 0 (0.0%) |
| 2 Vehicles | 27 (33.3%) | 4 (57.1%) |
| 3 or more Vehicles | 33 (40.7%) | 0 (0.0%) |
| Total | 81 (100.0%) | 7 (100.0%) |
Real Estate & Mortgages in River Bottom
Real Estate and Mortgage Overview in River Bottom
| Characteristic | Without Mortgage | With Mortgage |
| Housing Units | 46 | 35 |
| Median Property Value | $133,300 | $139,600 |
| Median Household Income | $57,500 | $4 |
| Monthly Housing Costs | $359 | $0 |
| Real Estate Taxes | $525 | $0 |
Property Value by Mortgage Status in River Bottom
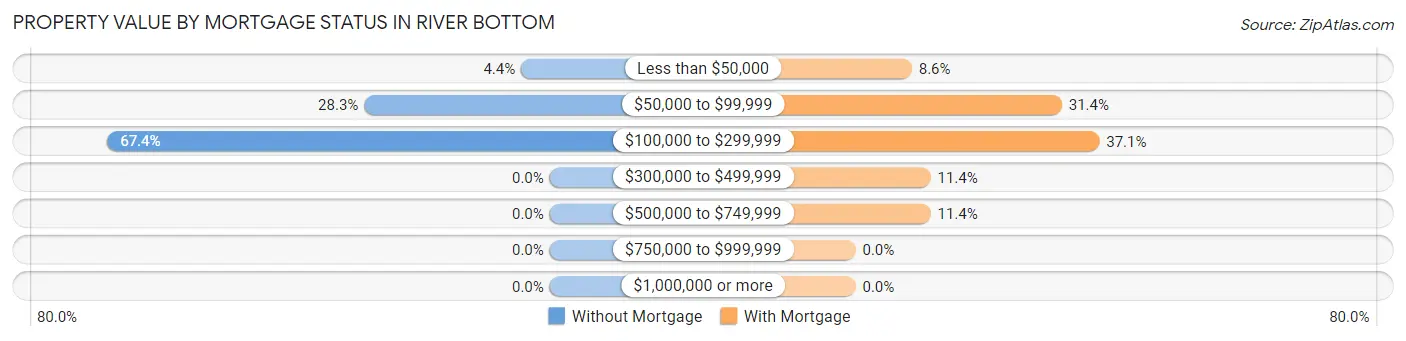
| Property Value | Without Mortgage | With Mortgage |
| Less than $50,000 | 2 (4.3%) | 3 (8.6%) |
| $50,000 to $99,999 | 13 (28.3%) | 11 (31.4%) |
| $100,000 to $299,999 | 31 (67.4%) | 13 (37.1%) |
| $300,000 to $499,999 | 0 (0.0%) | 4 (11.4%) |
| $500,000 to $749,999 | 0 (0.0%) | 4 (11.4%) |
| $750,000 to $999,999 | 0 (0.0%) | 0 (0.0%) |
| $1,000,000 or more | 0 (0.0%) | 0 (0.0%) |
| Total | 46 (100.0%) | 35 (100.0%) |
Household Income by Mortgage Status in River Bottom
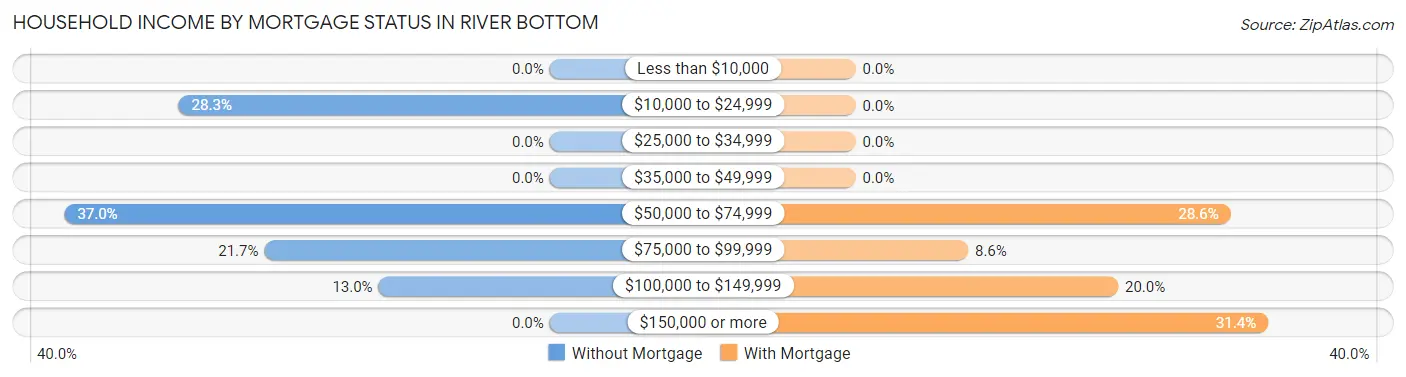
| Household Income | Without Mortgage | With Mortgage |
| Less than $10,000 | 0 (0.0%) | 0 (0.0%) |
| $10,000 to $24,999 | 13 (28.3%) | 0 (0.0%) |
| $25,000 to $34,999 | 0 (0.0%) | 0 (0.0%) |
| $35,000 to $49,999 | 0 (0.0%) | 0 (0.0%) |
| $50,000 to $74,999 | 17 (37.0%) | 10 (28.6%) |
| $75,000 to $99,999 | 10 (21.7%) | 3 (8.6%) |
| $100,000 to $149,999 | 6 (13.0%) | 7 (20.0%) |
| $150,000 or more | 0 (0.0%) | 11 (31.4%) |
| Total | 46 (100.0%) | 35 (100.0%) |
Property Value to Household Income Ratio in River Bottom
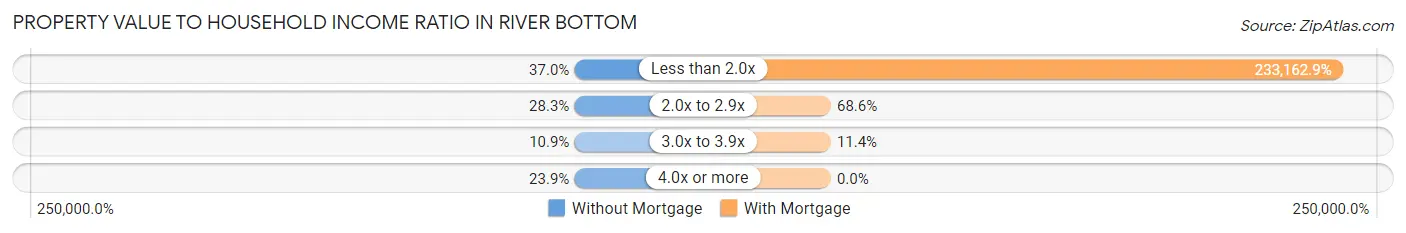
| Value-to-Income Ratio | Without Mortgage | With Mortgage |
| Less than 2.0x | 17 (37.0%) | 81,607 (233,162.9%) |
| 2.0x to 2.9x | 13 (28.3%) | 24 (68.6%) |
| 3.0x to 3.9x | 5 (10.9%) | 4 (11.4%) |
| 4.0x or more | 11 (23.9%) | 0 (0.0%) |
| Total | 46 (100.0%) | 35 (100.0%) |
Real Estate Taxes by Mortgage Status in River Bottom
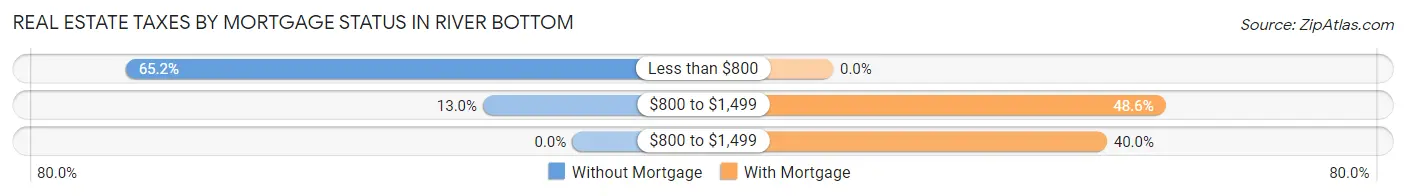
| Property Taxes | Without Mortgage | With Mortgage |
| Less than $800 | 30 (65.2%) | 0 (0.0%) |
| $800 to $1,499 | 6 (13.0%) | 17 (48.6%) |
| $800 to $1,499 | 0 (0.0%) | 14 (40.0%) |
| Total | 46 (100.0%) | 35 (100.0%) |
Health & Disability in River Bottom
Health Insurance Coverage by Age in River Bottom
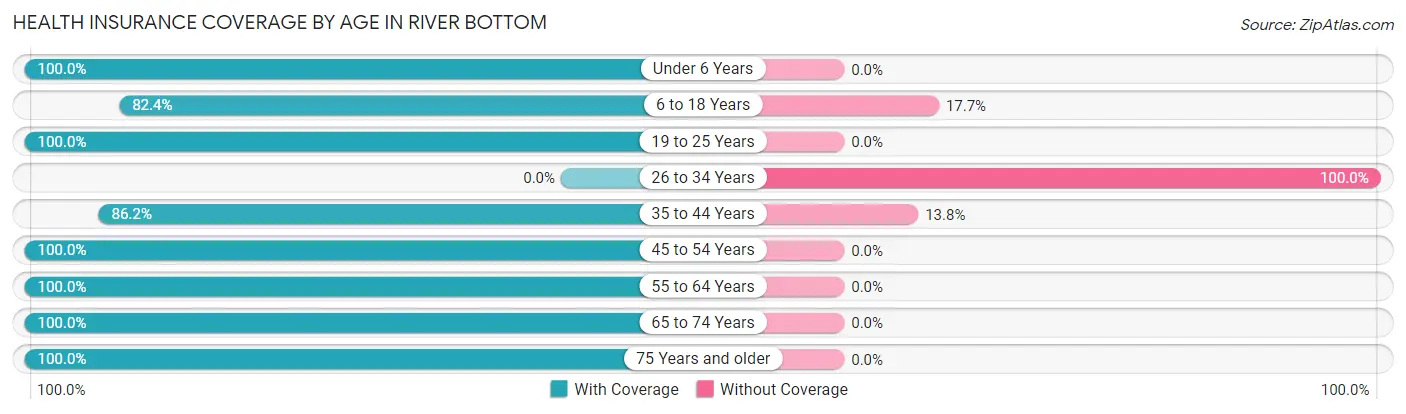
| Age Bracket | With Coverage | Without Coverage |
| Under 6 Years | 22 (100.0%) | 0 (0.0%) |
| 6 to 18 Years | 28 (82.4%) | 6 (17.6%) |
| 19 to 25 Years | 14 (100.0%) | 0 (0.0%) |
| 26 to 34 Years | 0 (0.0%) | 27 (100.0%) |
| 35 to 44 Years | 25 (86.2%) | 4 (13.8%) |
| 45 to 54 Years | 28 (100.0%) | 0 (0.0%) |
| 55 to 64 Years | 27 (100.0%) | 0 (0.0%) |
| 65 to 74 Years | 47 (100.0%) | 0 (0.0%) |
| 75 Years and older | 14 (100.0%) | 0 (0.0%) |
| Total | 205 (84.7%) | 37 (15.3%) |
Health Insurance Coverage by Citizenship Status in River Bottom
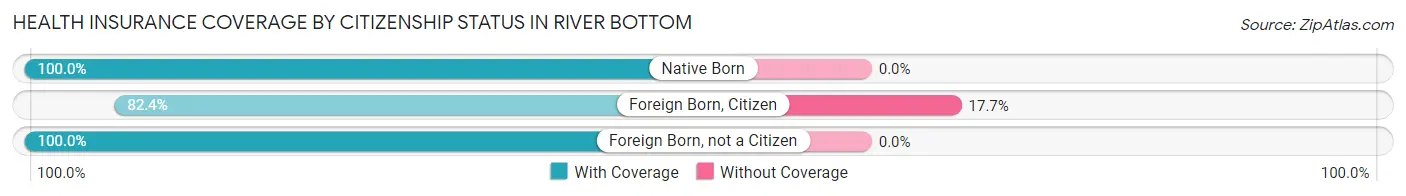
| Citizenship Status | With Coverage | Without Coverage |
| Native Born | 22 (100.0%) | 0 (0.0%) |
| Foreign Born, Citizen | 28 (82.4%) | 6 (17.6%) |
| Foreign Born, not a Citizen | 14 (100.0%) | 0 (0.0%) |
Health Insurance Coverage by Household Income in River Bottom
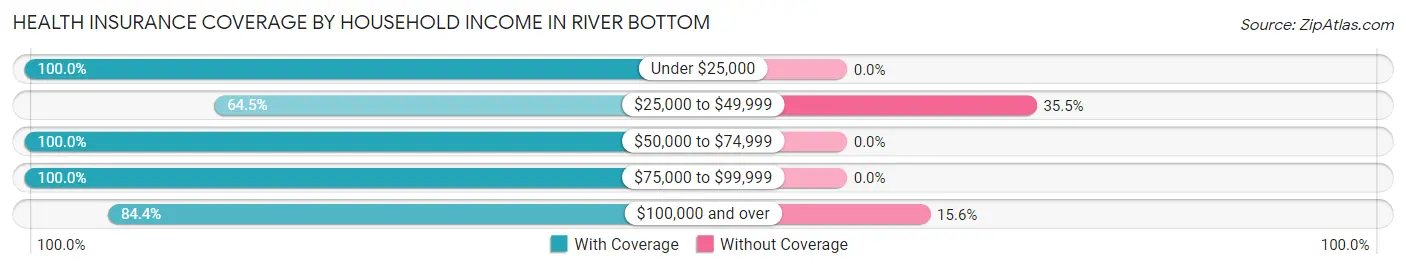
| Household Income | With Coverage | Without Coverage |
| Under $25,000 | 27 (100.0%) | 0 (0.0%) |
| $25,000 to $49,999 | 49 (64.5%) | 27 (35.5%) |
| $50,000 to $74,999 | 47 (100.0%) | 0 (0.0%) |
| $75,000 to $99,999 | 28 (100.0%) | 0 (0.0%) |
| $100,000 and over | 54 (84.4%) | 10 (15.6%) |
Public vs Private Health Insurance Coverage by Age in River Bottom
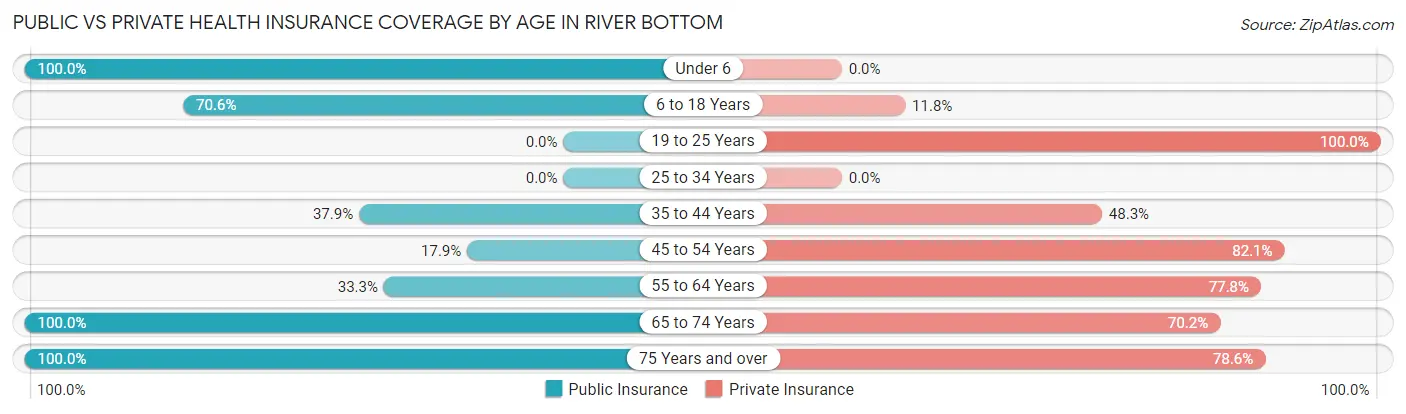
| Age Bracket | Public Insurance | Private Insurance |
| Under 6 | 22 (100.0%) | 0 (0.0%) |
| 6 to 18 Years | 24 (70.6%) | 4 (11.8%) |
| 19 to 25 Years | 0 (0.0%) | 14 (100.0%) |
| 25 to 34 Years | 0 (0.0%) | 0 (0.0%) |
| 35 to 44 Years | 11 (37.9%) | 14 (48.3%) |
| 45 to 54 Years | 5 (17.9%) | 23 (82.1%) |
| 55 to 64 Years | 9 (33.3%) | 21 (77.8%) |
| 65 to 74 Years | 47 (100.0%) | 33 (70.2%) |
| 75 Years and over | 14 (100.0%) | 11 (78.6%) |
| Total | 132 (54.5%) | 120 (49.6%) |
Disability Status by Sex by Age in River Bottom
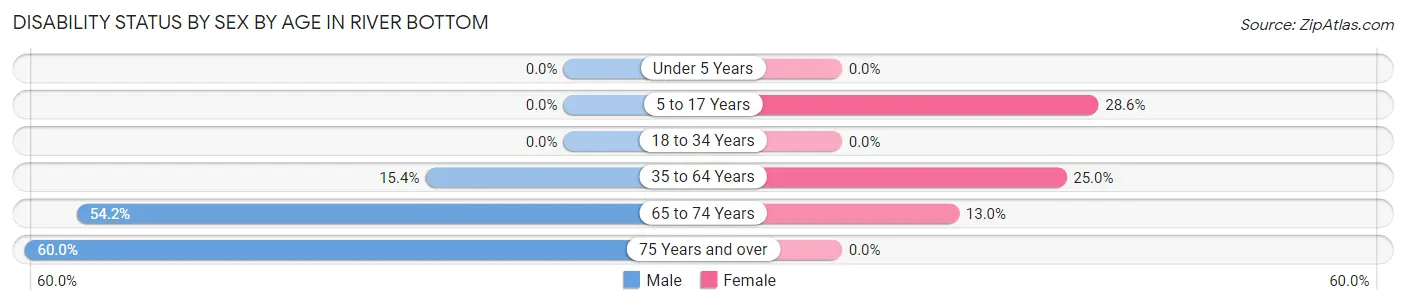
| Age Bracket | Male | Female |
| Under 5 Years | 0 (0.0%) | 0 (0.0%) |
| 5 to 17 Years | 0 (0.0%) | 4 (28.6%) |
| 18 to 34 Years | 0 (0.0%) | 0 (0.0%) |
| 35 to 64 Years | 8 (15.4%) | 8 (25.0%) |
| 65 to 74 Years | 13 (54.2%) | 3 (13.0%) |
| 75 Years and over | 3 (60.0%) | 0 (0.0%) |
Disability Class by Sex by Age in River Bottom
Disability Class: Hearing Difficulty
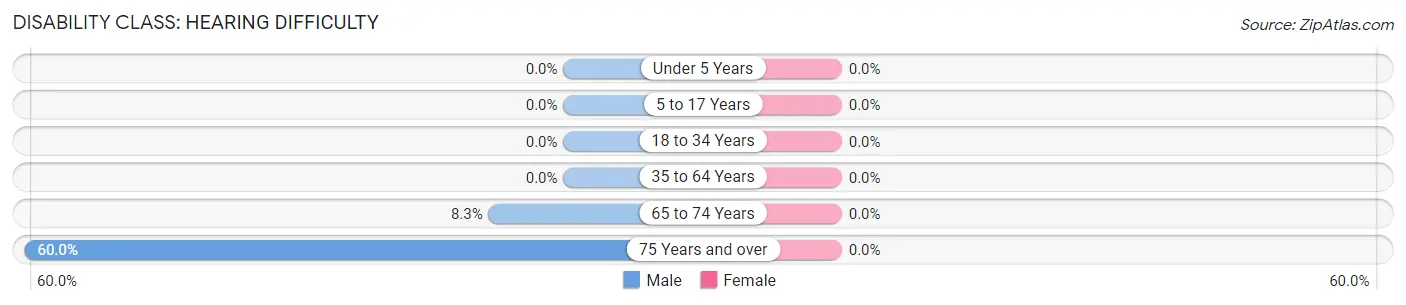
| Age Bracket | Male | Female |
| Under 5 Years | 0 (0.0%) | 0 (0.0%) |
| 5 to 17 Years | 0 (0.0%) | 0 (0.0%) |
| 18 to 34 Years | 0 (0.0%) | 0 (0.0%) |
| 35 to 64 Years | 0 (0.0%) | 0 (0.0%) |
| 65 to 74 Years | 2 (8.3%) | 0 (0.0%) |
| 75 Years and over | 3 (60.0%) | 0 (0.0%) |
Disability Class: Vision Difficulty
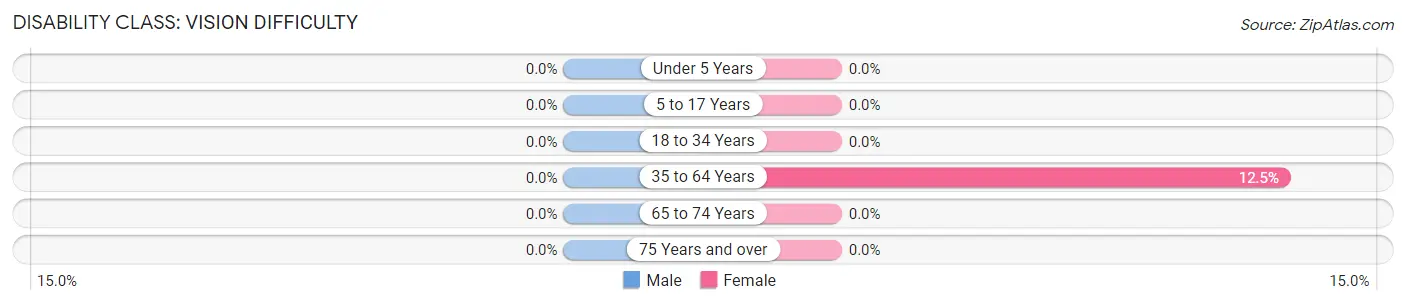
| Age Bracket | Male | Female |
| Under 5 Years | 0 (0.0%) | 0 (0.0%) |
| 5 to 17 Years | 0 (0.0%) | 0 (0.0%) |
| 18 to 34 Years | 0 (0.0%) | 0 (0.0%) |
| 35 to 64 Years | 0 (0.0%) | 4 (12.5%) |
| 65 to 74 Years | 0 (0.0%) | 0 (0.0%) |
| 75 Years and over | 0 (0.0%) | 0 (0.0%) |
Disability Class: Cognitive Difficulty
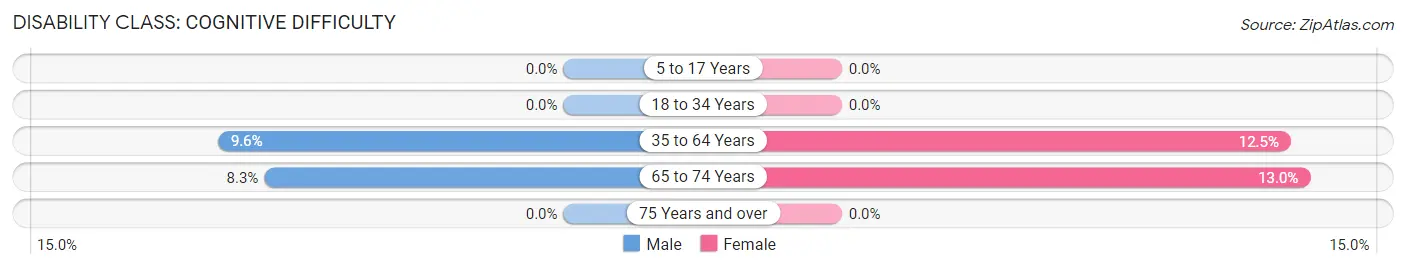
| Age Bracket | Male | Female |
| 5 to 17 Years | 0 (0.0%) | 0 (0.0%) |
| 18 to 34 Years | 0 (0.0%) | 0 (0.0%) |
| 35 to 64 Years | 5 (9.6%) | 4 (12.5%) |
| 65 to 74 Years | 2 (8.3%) | 3 (13.0%) |
| 75 Years and over | 0 (0.0%) | 0 (0.0%) |
Disability Class: Ambulatory Difficulty
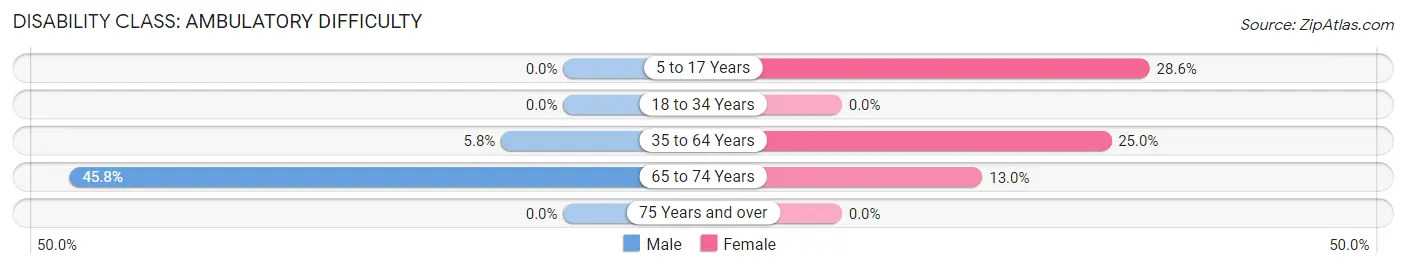
| Age Bracket | Male | Female |
| 5 to 17 Years | 0 (0.0%) | 4 (28.6%) |
| 18 to 34 Years | 0 (0.0%) | 0 (0.0%) |
| 35 to 64 Years | 3 (5.8%) | 8 (25.0%) |
| 65 to 74 Years | 11 (45.8%) | 3 (13.0%) |
| 75 Years and over | 0 (0.0%) | 0 (0.0%) |
Disability Class: Self-Care Difficulty
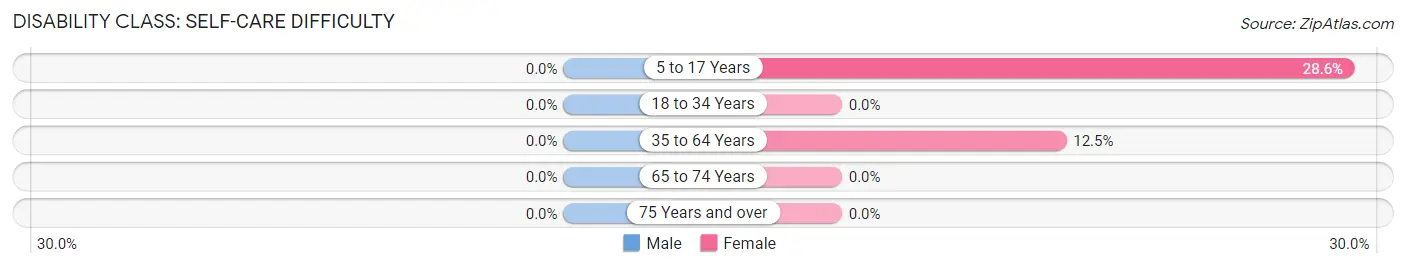
| Age Bracket | Male | Female |
| 5 to 17 Years | 0 (0.0%) | 4 (28.6%) |
| 18 to 34 Years | 0 (0.0%) | 0 (0.0%) |
| 35 to 64 Years | 0 (0.0%) | 4 (12.5%) |
| 65 to 74 Years | 0 (0.0%) | 0 (0.0%) |
| 75 Years and over | 0 (0.0%) | 0 (0.0%) |
Technology Access in River Bottom
Computing Device Access in River Bottom
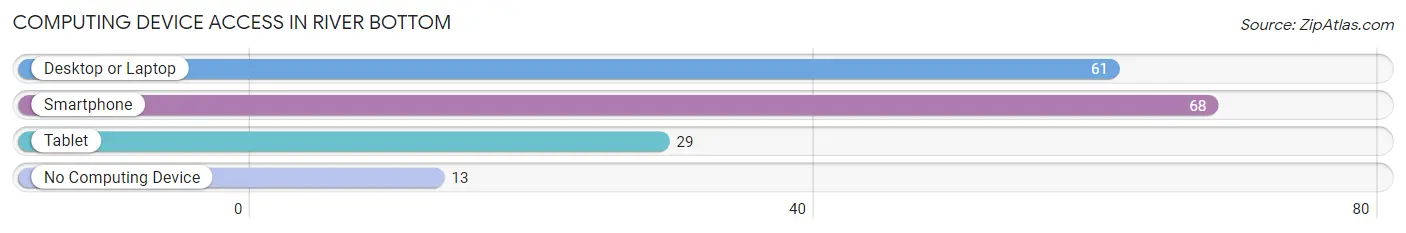
| Device Type | # Households | % Households |
| Desktop or Laptop | 61 | 69.3% |
| Smartphone | 68 | 77.3% |
| Tablet | 29 | 33.0% |
| No Computing Device | 13 | 14.8% |
| Total | 88 | 100.0% |
Internet Access in River Bottom
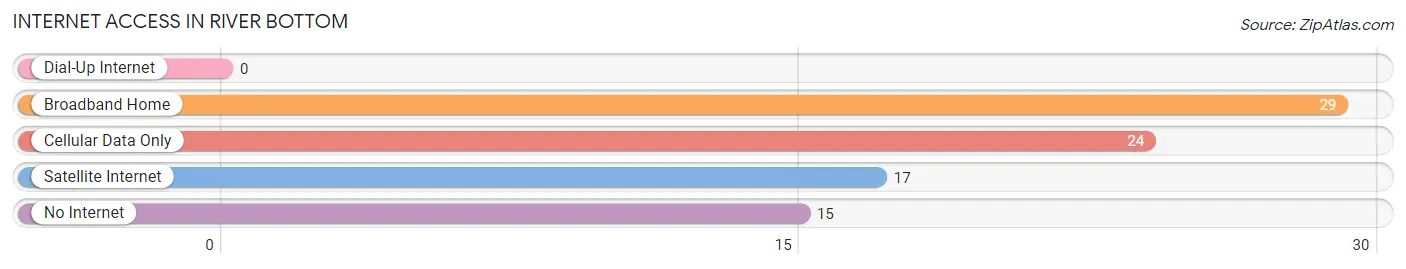
| Internet Type | # Households | % Households |
| Dial-Up Internet | 0 | 0.0% |
| Broadband Home | 29 | 33.0% |
| Cellular Data Only | 24 | 27.3% |
| Satellite Internet | 17 | 19.3% |
| No Internet | 15 | 17.1% |
| Total | 88 | 100.0% |
River Bottom Summary
History
River Bottom, Oklahoma is a small town located in the southeastern part of the state. It was founded in the late 1800s by settlers who were looking for a place to settle and start a new life. The town was originally called “River Bottom” because of its location near the bottom of the Arkansas River. The town was officially incorporated in 1901 and has since grown to a population of around 500 people.
The town has a rich history that dates back to the early days of the American West. In the late 1800s, the area was home to a number of Native American tribes, including the Cherokee, Choctaw, and Creek. These tribes were displaced by the US government in the 1830s as part of the Indian Removal Act. The area was then opened up to white settlers, who began to move in and establish farms and ranches.
The town of River Bottom was founded in the late 1800s by a group of settlers who were looking for a place to settle and start a new life. The town was originally called “River Bottom” because of its location near the bottom of the Arkansas River. The town was officially incorporated in 1901 and has since grown to a population of around 500 people.
Geography
River Bottom is located in southeastern Oklahoma, in the Arkansas River Valley. The town is situated on the banks of the Arkansas River, which is the main source of water for the town. The town is surrounded by rolling hills and wooded areas, and is located about 30 miles from the nearest major city, Tulsa.
The climate in River Bottom is generally mild, with temperatures ranging from the mid-50s in the winter to the mid-80s in the summer. The town receives an average of 40 inches of rain per year, and is located in a region that is prone to severe weather, including tornadoes and thunderstorms.
Economy
The economy of River Bottom is largely based on agriculture. The town is home to several farms and ranches, which produce a variety of crops, including corn, soybeans, wheat, and hay. The town also has a number of small businesses, including a grocery store, a hardware store, and a few restaurants.
The town is also home to a number of manufacturing companies, which produce a variety of products, including furniture, clothing, and automotive parts. The town is also home to a number of oil and gas companies, which are responsible for much of the town’s economic activity.
Demographics
As of the 2010 census, the population of River Bottom was 498 people. The town is predominantly white, with a small minority population of African Americans, Hispanics, and Native Americans. The median household income in the town is $35,000, and the median age is 38 years old.
Conclusion
River Bottom, Oklahoma is a small town located in the southeastern part of the state. It was founded in the late 1800s by settlers who were looking for a place to settle and start a new life. The town has a rich history that dates back to the early days of the American West, and is home to a variety of businesses and industries. The town is predominantly white, with a small minority population of African Americans, Hispanics, and Native Americans. The economy of River Bottom is largely based on agriculture, and the town is home to several farms and ranches, as well as a number of manufacturing companies.
Common Questions
What is Per Capita Income in River Bottom?
Per Capita income in River Bottom is $25,663.
What is the Median Family Income in River Bottom?
Median Family Income in River Bottom is $62,188.
What is the Median Household income in River Bottom?
Median Household Income in River Bottom is $65,000.
What is Income or Wage Gap in River Bottom?
Income or Wage Gap in River Bottom is 28.3%.
Women in River Bottom earn 71.7 cents for every dollar earned by a man.
What is Inequality or Gini Index in River Bottom?
Inequality or Gini Index in River Bottom is 0.33.
What is the Total Population of River Bottom?
Total Population of River Bottom is 242.
What is the Total Male Population of River Bottom?
Total Male Population of River Bottom is 140.
What is the Total Female Population of River Bottom?
Total Female Population of River Bottom is 102.
What is the Ratio of Males per 100 Females in River Bottom?
There are 137.25 Males per 100 Females in River Bottom.
What is the Ratio of Females per 100 Males in River Bottom?
There are 72.86 Females per 100 Males in River Bottom.
What is the Median Population Age in River Bottom?
Median Population Age in River Bottom is 43.2 Years.
What is the Average Family Size in River Bottom
Average Family Size in River Bottom is 2.9 People.
What is the Average Household Size in River Bottom
Average Household Size in River Bottom is 2.8 People.
How Large is the Labor Force in River Bottom?
There are 92 People in the Labor Forcein in River Bottom.
What is the Percentage of People in the Labor Force in River Bottom?
48.4% of People are in the Labor Force in River Bottom.
What is the Unemployment Rate in River Bottom?
Unemployment Rate in River Bottom is 4.3%.