Earnings by Sex by Educational Attainment in Piney
Educational Attainment
Male Income
Female Income
Less than High School
-
-
High School Diploma
-
-
College or Associate's Degree
-
-
Bachelor's Degree
-
-
Graduate Degree
-
-
Total
-
-
Family Income in Piney
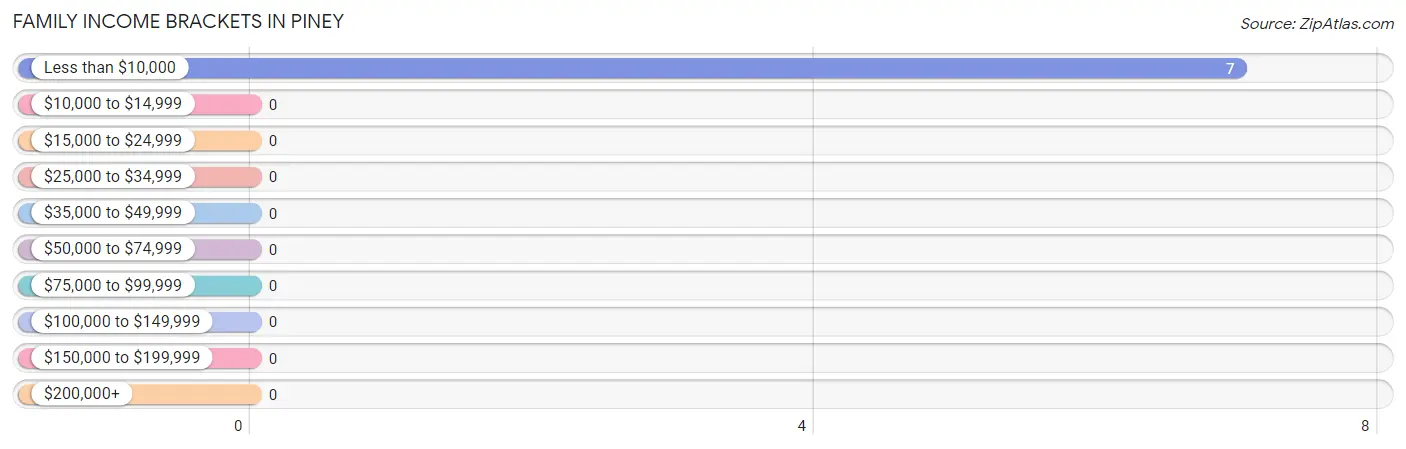
Family Income Brackets in Piney
According to the Piney family income data, there are 7 families falling into the less than $10,000 income range, which is the most common income bracket and makes up 100.0% of all families.
Income Bracket
# Families
% Families
Less than $10,000
7
100.0%
$10,000 to $14,999
0
0.0%
$15,000 to $24,999
0
0.0%
$25,000 to $34,999
0
0.0%
$35,000 to $49,999
0
0.0%
$50,000 to $74,999
0
0.0%
$75,000 to $99,999
0
0.0%
$100,000 to $149,999
0
0.0%
$150,000 to $199,999
0
0.0%
$200,000+
0
0.0%
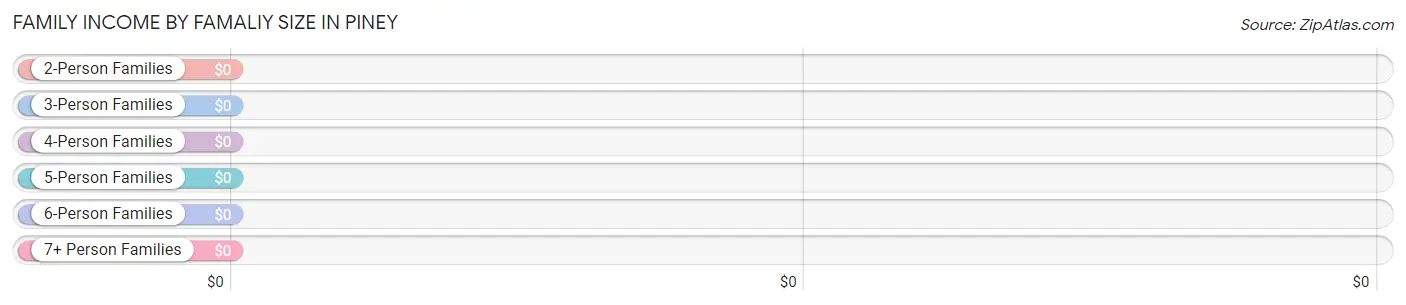
Family Income by Famaliy Size in Piney
Income Bracket
# Families
Median Income
2-Person Families
7 (100.0%)
$0
3-Person Families
0 (0.0%)
$0
4-Person Families
0 (0.0%)
$0
5-Person Families
0 (0.0%)
$0
6-Person Families
0 (0.0%)
$0
7+ Person Families
0 (0.0%)
$0
Total
7 (100.0%)
$0
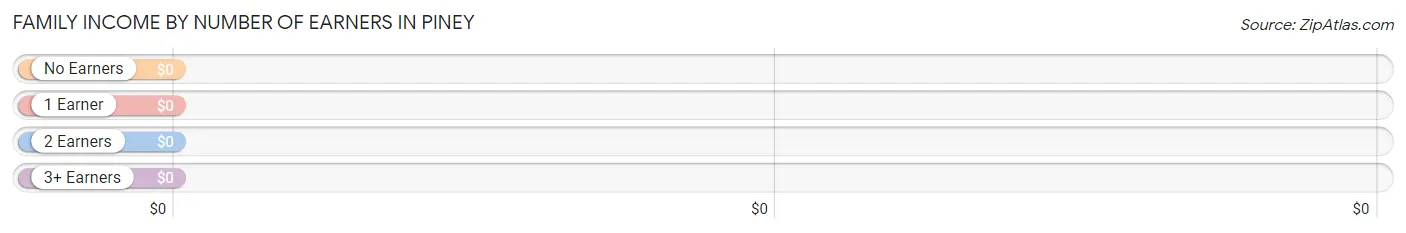
Family Income by Number of Earners in Piney
Number of Earners
# Families
Median Income
No Earners
7 (100.0%)
$0
1 Earner
0 (0.0%)
$0
2 Earners
0 (0.0%)
$0
3+ Earners
0 (0.0%)
$0
Total
7 (100.0%)
$0
Household Income in Piney
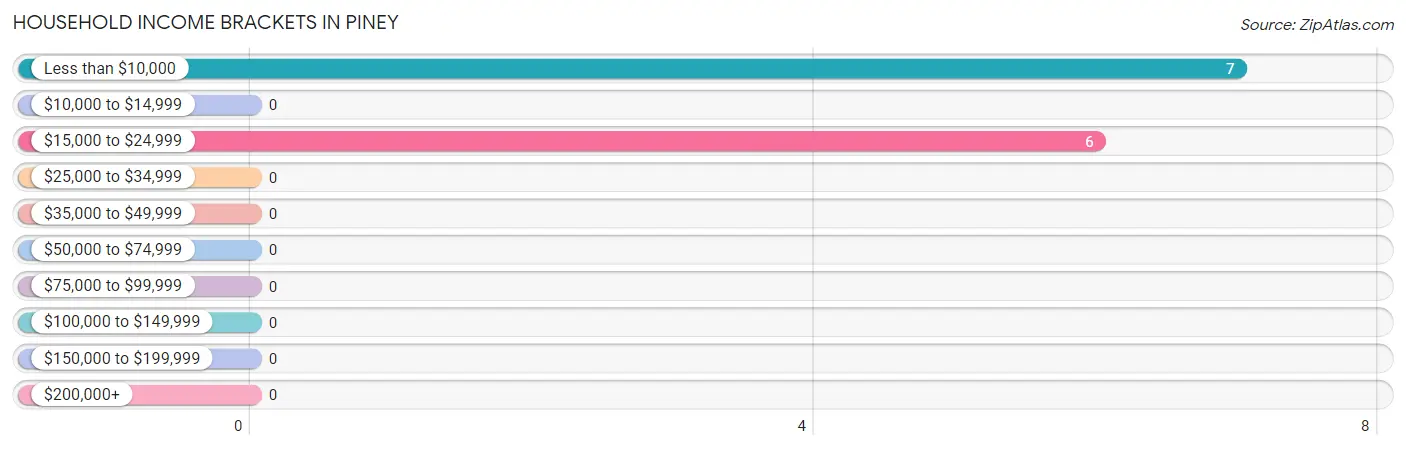
Household Income Brackets in Piney
With 7 households falling in the category, the less than $10,000 income range is the most frequent in Piney, accounting for 53.8% of all households.
Income Bracket
# Households
% Households
Less than $10,000
7
53.8%
$10,000 to $14,999
0
0.0%
$15,000 to $24,999
6
46.2%
$25,000 to $34,999
0
0.0%
$35,000 to $49,999
0
0.0%
$50,000 to $74,999
0
0.0%
$75,000 to $99,999
0
0.0%
$100,000 to $149,999
0
0.0%
$150,000 to $199,999
0
0.0%
$200,000+
0
0.0%
Household Income by Householder Age in Piney
Income Bracket
# Households
Median Income
15 to 24 Years
0 (0.0%)
$0
25 to 44 Years
0 (0.0%)
$0
45 to 64 Years
0 (0.0%)
$0
65+ Years
13 (100.0%)
$0
Total
13 (100.0%)
$0
Poverty in Piney
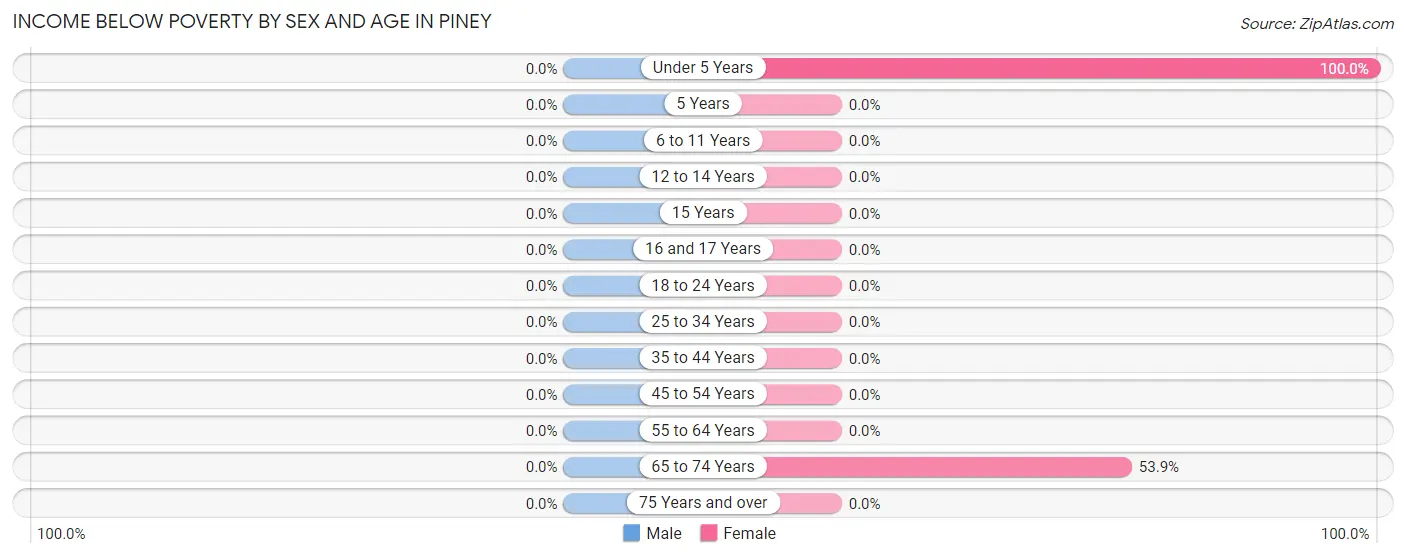
Income Below Poverty by Sex and Age in Piney
Age Bracket
Male
Female
Under 5 Years
0 (0.0%)
10 (100.0%)
5 Years
0 (0.0%)
0 (0.0%)
6 to 11 Years
0 (0.0%)
0 (0.0%)
12 to 14 Years
0 (0.0%)
0 (0.0%)
15 Years
0 (0.0%)
0 (0.0%)
16 and 17 Years
0 (0.0%)
0 (0.0%)
18 to 24 Years
0 (0.0%)
0 (0.0%)
25 to 34 Years
0 (0.0%)
0 (0.0%)
35 to 44 Years
0 (0.0%)
0 (0.0%)
45 to 54 Years
0 (0.0%)
0 (0.0%)
55 to 64 Years
0 (0.0%)
0 (0.0%)
65 to 74 Years
0 (0.0%)
7 (53.8%)
75 Years and over
0 (0.0%)
0 (0.0%)
Total
0 (0.0%)
17 (73.9%)
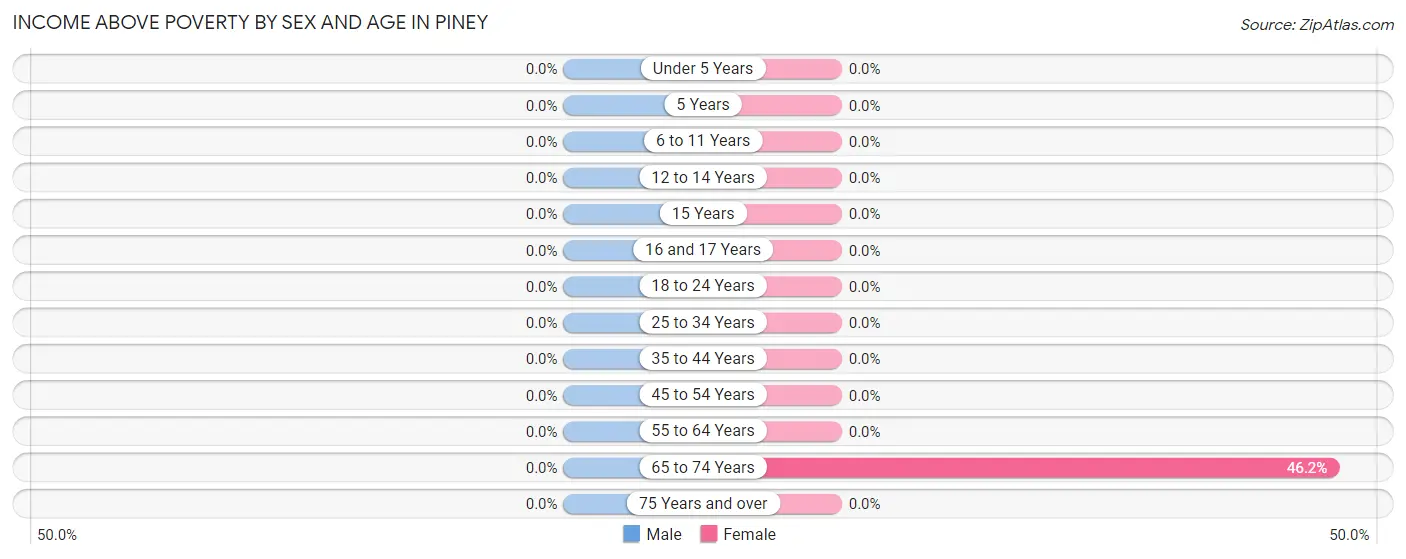
Income Above Poverty by Sex and Age in Piney
Age Bracket
Male
Female
Under 5 Years
0 (0.0%)
0 (0.0%)
5 Years
0 (0.0%)
0 (0.0%)
6 to 11 Years
0 (0.0%)
0 (0.0%)
12 to 14 Years
0 (0.0%)
0 (0.0%)
15 Years
0 (0.0%)
0 (0.0%)
16 and 17 Years
0 (0.0%)
0 (0.0%)
18 to 24 Years
0 (0.0%)
0 (0.0%)
25 to 34 Years
0 (0.0%)
0 (0.0%)
35 to 44 Years
0 (0.0%)
0 (0.0%)
45 to 54 Years
0 (0.0%)
0 (0.0%)
55 to 64 Years
0 (0.0%)
0 (0.0%)
65 to 74 Years
0 (0.0%)
6 (46.2%)
75 Years and over
0 (0.0%)
0 (0.0%)
Total
0 (0.0%)
6 (26.1%)
Income Below Poverty Among Married-Couple Families in Piney
Children
Above Poverty
Below Poverty
No Children
0 (0.0%)
0 (0.0%)
1 or 2 Children
0 (0.0%)
0 (0.0%)
3 or 4 Children
0 (0.0%)
0 (0.0%)
5 or more Children
0 (0.0%)
0 (0.0%)
Total
0 (0.0%)
0 (0.0%)
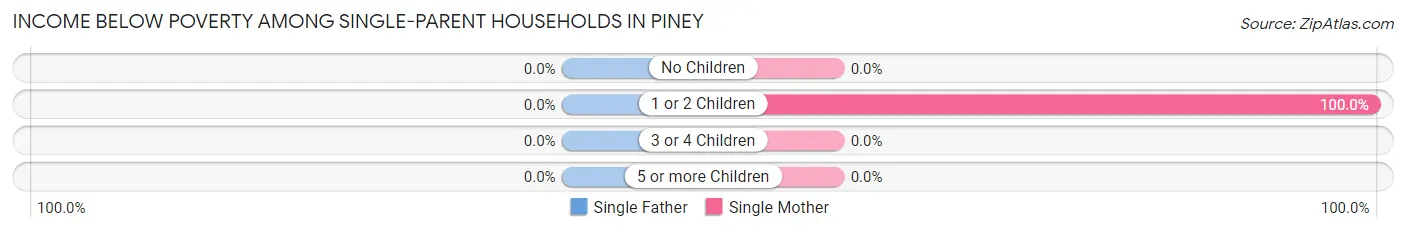
Income Below Poverty Among Single-Parent Households in Piney
Children
Single Father
Single Mother
No Children
0 (0.0%)
0 (0.0%)
1 or 2 Children
0 (0.0%)
7 (100.0%)
3 or 4 Children
0 (0.0%)
0 (0.0%)
5 or more Children
0 (0.0%)
0 (0.0%)
Total
0 (0.0%)
7 (100.0%)
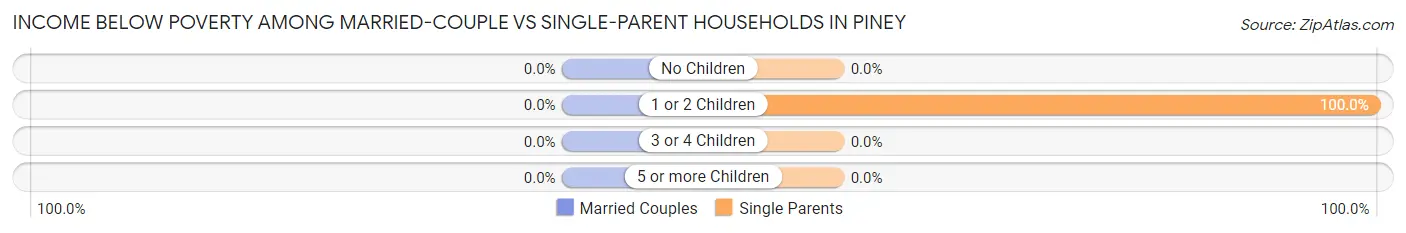
Income Below Poverty Among Married-Couple vs Single-Parent Households in Piney
Children
Married-Couple Families
Single-Parent Households
No Children
0 (0.0%)
0 (0.0%)
1 or 2 Children
0 (0.0%)
7 (100.0%)
3 or 4 Children
0 (0.0%)
0 (0.0%)
5 or more Children
0 (0.0%)
0 (0.0%)
Total
0 (0.0%)
7 (100.0%)
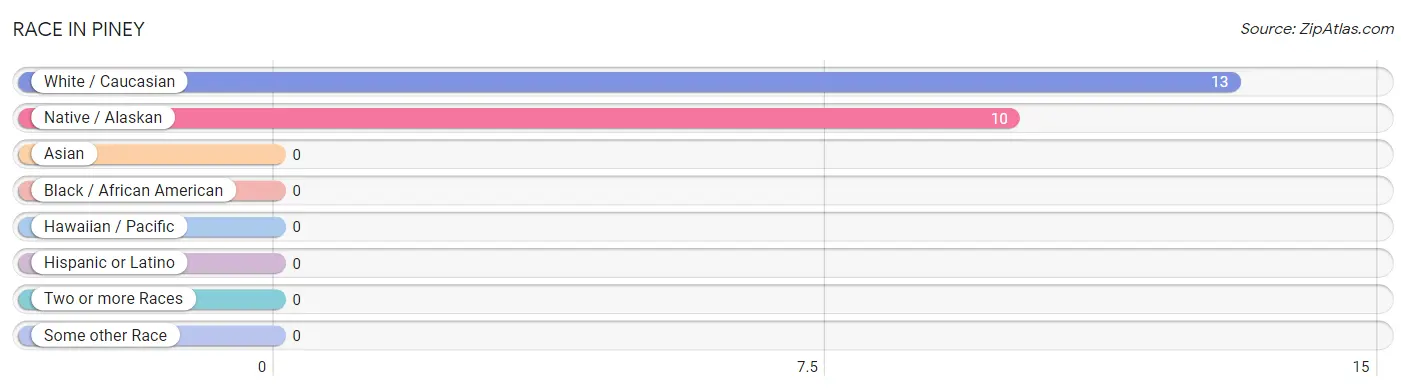
Race in Piney
The most populous races in Piney are White / Caucasian (13 | 56.5%), and Native / Alaskan (10 | 43.5%).
Race
# Population
% Population
Asian
0
0.0%
Black / African American
0
0.0%
Hawaiian / Pacific
0
0.0%
Hispanic or Latino
0
0.0%
Native / Alaskan
10
43.5%
White / Caucasian
13
56.5%
Two or more Races
0
0.0%
Some other Race
0
0.0%
Total
23
100.0%
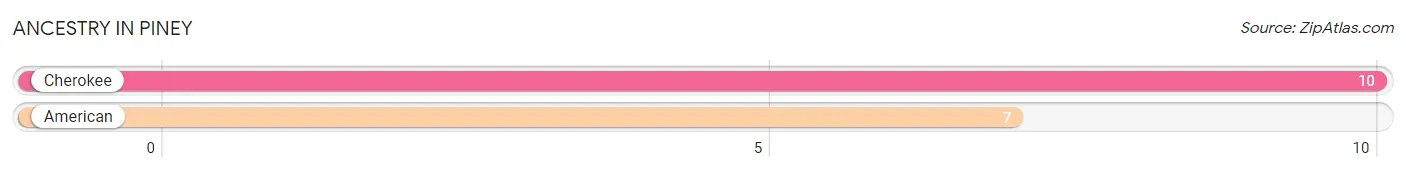
Ancestry in Piney
The most populous ancestries reported in Piney are Cherokee (10 | 43.5%), and American (7 | 30.4%), together accounting for 73.9% of all Piney residents.
Ancestry
# Population
% Population
American
7
30.4%
Cherokee
10
43.5%
View All 2 Rows
Immigrants in Piney
Immigration Origin
# Population
% Population
View All 0 Rows
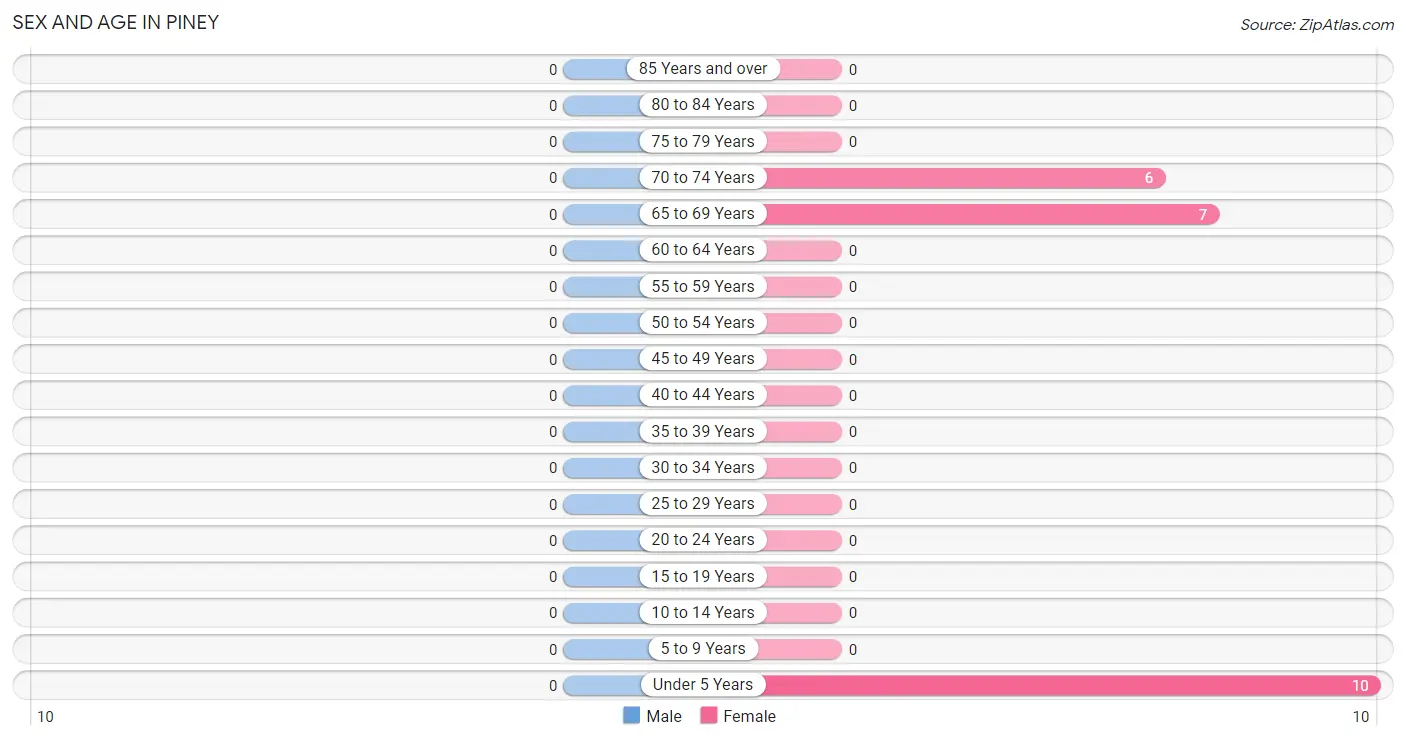
Sex and Age in Piney
Sex and Age in Piney
Age Bracket
Male
Female
Under 5 Years
0 (0.0%)
10 (43.5%)
5 to 9 Years
0 (0.0%)
0 (0.0%)
10 to 14 Years
0 (0.0%)
0 (0.0%)
15 to 19 Years
0 (0.0%)
0 (0.0%)
20 to 24 Years
0 (0.0%)
0 (0.0%)
25 to 29 Years
0 (0.0%)
0 (0.0%)
30 to 34 Years
0 (0.0%)
0 (0.0%)
35 to 39 Years
0 (0.0%)
0 (0.0%)
40 to 44 Years
0 (0.0%)
0 (0.0%)
45 to 49 Years
0 (0.0%)
0 (0.0%)
50 to 54 Years
0 (0.0%)
0 (0.0%)
55 to 59 Years
0 (0.0%)
0 (0.0%)
60 to 64 Years
0 (0.0%)
0 (0.0%)
65 to 69 Years
0 (0.0%)
7 (30.4%)
70 to 74 Years
0 (0.0%)
6 (26.1%)
75 to 79 Years
0 (0.0%)
0 (0.0%)
80 to 84 Years
0 (0.0%)
0 (0.0%)
85 Years and over
0 (0.0%)
0 (0.0%)
Total
0 (0.0%)
23 (100.0%)
Families and Households in Piney
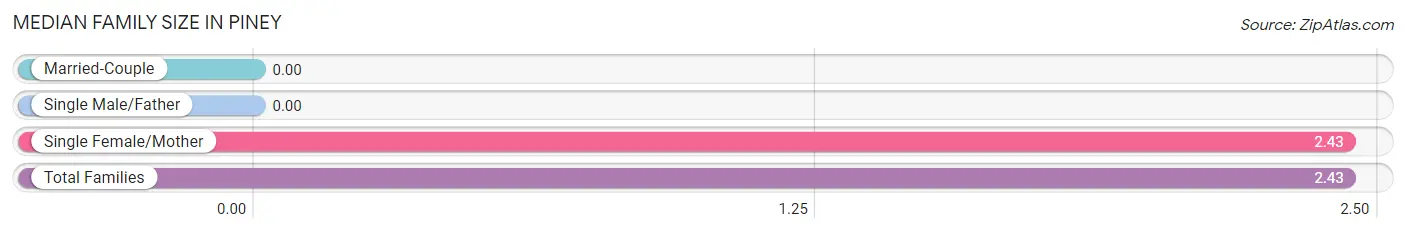
Median Family Size in Piney
Family Type
# Families
Family Size
Married-Couple
0 (0.0%)
-
Single Male/Father
0 (0.0%)
-
Single Female/Mother
7 (100.0%)
2.43
Total Families
7 (100.0%)
2.43
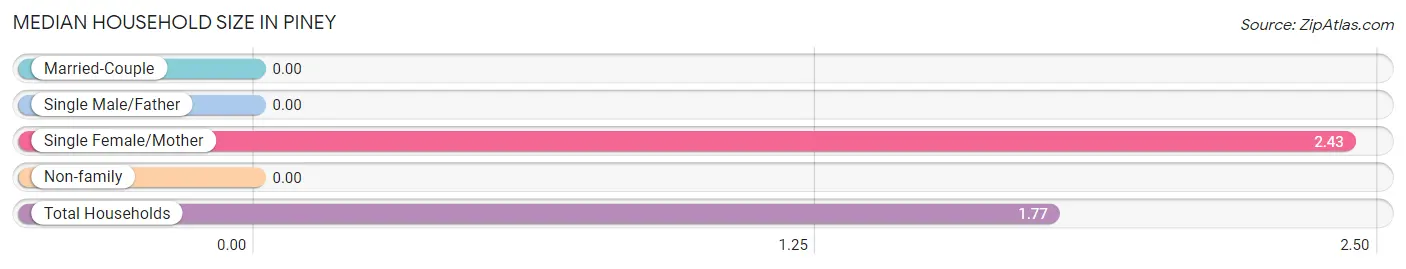
Median Household Size in Piney
Household Type
# Households
Household Size
Married-Couple
0 (0.0%)
-
Single Male/Father
0 (0.0%)
-
Single Female/Mother
7 (53.8%)
2.43
Non-family
6 (46.2%)
-
Total Households
13 (100.0%)
1.77
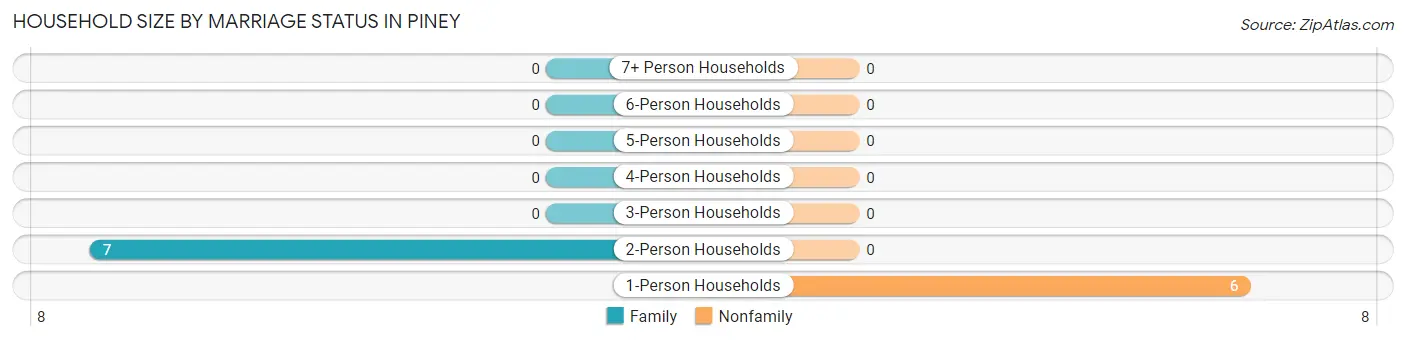
Household Size by Marriage Status in Piney
Out of a total of 13 households in Piney, 7 (53.8%) are family households, while 6 (46.2%) are nonfamily households. The most numerous type of family households are 2-person households, comprising 7, and the most common type of nonfamily households are 1-person households, comprising 6.
Household Size
Family Households
Nonfamily Households
1-Person Households
-
6 (46.2%)
2-Person Households
7 (53.8%)
0 (0.0%)
3-Person Households
0 (0.0%)
0 (0.0%)
4-Person Households
0 (0.0%)
0 (0.0%)
5-Person Households
0 (0.0%)
0 (0.0%)
6-Person Households
0 (0.0%)
0 (0.0%)
7+ Person Households
0 (0.0%)
0 (0.0%)
Total
7 (53.8%)
6 (46.2%)
Female Fertility in Piney
Fertility by Age in Piney
Age Bracket
Women with Births
Births / 1,000 Women
15 to 19 years
0 (0.0%)
0.0
20 to 34 years
0 (0.0%)
0.0
35 to 50 years
0 (0.0%)
0.0
Total
0 (0.0%)
0.0
Fertility by Age by Marriage Status in Piney
Age Bracket
Married
Unmarried
15 to 19 years
0 (0.0%)
0 (0.0%)
20 to 34 years
0 (0.0%)
0 (0.0%)
35 to 50 years
0 (0.0%)
0 (0.0%)
Total
0 (0.0%)
0 (0.0%)
Fertility by Education in Piney
Educational Attainment
Women with Births
Births / 1,000 Women
Less than High School
0 (0.0%)
0.0
High School Diploma
0 (0.0%)
0.0
College or Associate's Degree
0 (0.0%)
0.0
Bachelor's Degree
0 (0.0%)
0.0
Graduate Degree
0 (0.0%)
0.0
Total
0 (0.0%)
0.0
Fertility by Education by Marriage Status in Piney
Educational Attainment
Married
Unmarried
Less than High School
0 (0.0%)
0 (0.0%)
High School Diploma
0 (0.0%)
0 (0.0%)
College or Associate's Degree
0 (0.0%)
0 (0.0%)
Bachelor's Degree
0 (0.0%)
0 (0.0%)
Graduate Degree
0 (0.0%)
0 (0.0%)
Total
0 (0.0%)
0 (0.0%)
Employment Characteristics in Piney
Employment by Class of Employer in Piney
Employer Class
# Employees
% Employees
Private Company Employees
0
0.0%
Self-Employed (Incorporated)
0
0.0%
Self-Employed (Not Incorporated)
0
0.0%
Not-for-profit Organizations
0
0.0%
Local Government Employees
0
0.0%
State Government Employees
0
0.0%
Federal Government Employees
0
0.0%
Unpaid Family Workers
0
0.0%
Total
0
0.0%
Employment Status by Age in Piney
Age Bracket
In Labor Force
Unemployed
16 to 19 Years
0 (0.0%)
0 (0.0%)
20 to 24 Years
0 (0.0%)
0 (0.0%)
25 to 29 Years
0 (0.0%)
0 (0.0%)
30 to 34 Years
0 (0.0%)
0 (0.0%)
35 to 44 Years
0 (0.0%)
0 (0.0%)
45 to 54 Years
0 (0.0%)
0 (0.0%)
55 to 59 Years
0 (0.0%)
0 (0.0%)
60 to 64 Years
0 (0.0%)
0 (0.0%)
65 to 74 Years
0 (0.0%)
0 (0.0%)
75 Years and over
0 (0.0%)
0 (0.0%)
Total
0 (0.0%)
0 (0.0%)
Employment Status by Educational Attainment in Piney
Educational Attainment
In Labor Force
Unemployed
Less than High School
0 (0.0%)
0 (0.0%)
High School Diploma
0 (0.0%)
0 (0.0%)
College / Associate Degree
0 (0.0%)
0 (0.0%)
Bachelor's Degree or higher
0 (0.0%)
0 (0.0%)
Total
0 (0.0%)
0 (0.0%)
Employment Occupations by Sex in Piney
Management, Business, Science and Arts Occupations
Management, Business, Science and Arts Occupations by Sex
Occupation
Male
Female
Management
0 (0.0%)
0 (0.0%)
Business & Financial
0 (0.0%)
0 (0.0%)
Computers, Engineering & Science
0 (0.0%)
0 (0.0%)
Computers & Mathematics
0 (0.0%)
0 (0.0%)
Architecture & Engineering
0 (0.0%)
0 (0.0%)
Life, Physical & Social Science
0 (0.0%)
0 (0.0%)
Community & Social Service
0 (0.0%)
0 (0.0%)
Education, Arts & Media
0 (0.0%)
0 (0.0%)
Legal Services & Support
0 (0.0%)
0 (0.0%)
Education Instruction & Library
0 (0.0%)
0 (0.0%)
Arts, Media & Entertainment
0 (0.0%)
0 (0.0%)
Health Diagnosing & Treating
0 (0.0%)
0 (0.0%)
Health Technologists
0 (0.0%)
0 (0.0%)
Total (Category)
0 (0.0%)
0 (0.0%)
Total (Overall)
0 (0.0%)
0 (0.0%)
Services Occupations
Services Occupations by Sex
Occupation
Male
Female
Healthcare Support
0 (0.0%)
0 (0.0%)
Security & Protection
0 (0.0%)
0 (0.0%)
Firefighting & Prevention
0 (0.0%)
0 (0.0%)
Law Enforcement
0 (0.0%)
0 (0.0%)
Food Preparation & Serving
0 (0.0%)
0 (0.0%)
Cleaning & Maintenance
0 (0.0%)
0 (0.0%)
Personal Care & Service
0 (0.0%)
0 (0.0%)
Total (Category)
0 (0.0%)
0 (0.0%)
Total (Overall)
0 (0.0%)
0 (0.0%)
Sales and Office Occupations
Sales and Office Occupations by Sex
Occupation
Male
Female
Sales & Related
0 (0.0%)
0 (0.0%)
Office & Administration
0 (0.0%)
0 (0.0%)
Total (Category)
0 (0.0%)
0 (0.0%)
Total (Overall)
0 (0.0%)
0 (0.0%)
Natural Resources, Construction and Maintenance Occupations
Natural Resources, Construction and Maintenance Occupations by Sex
Occupation
Male
Female
Farming, Fishing & Forestry
0 (0.0%)
0 (0.0%)
Construction & Extraction
0 (0.0%)
0 (0.0%)
Installation, Maintenance & Repair
0 (0.0%)
0 (0.0%)
Total (Category)
0 (0.0%)
0 (0.0%)
Total (Overall)
0 (0.0%)
0 (0.0%)
Production, Transportation and Moving Occupations
Production, Transportation and Moving Occupations by Sex
Occupation
Male
Female
Production
0 (0.0%)
0 (0.0%)
Transportation
0 (0.0%)
0 (0.0%)
Material Moving
0 (0.0%)
0 (0.0%)
Total (Category)
0 (0.0%)
0 (0.0%)
Total (Overall)
0 (0.0%)
0 (0.0%)
Employment Industries by Sex in Piney
Employment Industries in Piney
Employment Industries by Sex in Piney
Industry
Male
Female
Agriculture, Fishing & Hunting
0 (0.0%)
0 (0.0%)
Mining, Quarrying, & Extraction
0 (0.0%)
0 (0.0%)
Construction
0 (0.0%)
0 (0.0%)
Manufacturing
0 (0.0%)
0 (0.0%)
Wholesale Trade
0 (0.0%)
0 (0.0%)
Retail Trade
0 (0.0%)
0 (0.0%)
Transportation & Warehousing
0 (0.0%)
0 (0.0%)
Utilities
0 (0.0%)
0 (0.0%)
Information
0 (0.0%)
0 (0.0%)
Finance & Insurance
0 (0.0%)
0 (0.0%)
Real Estate, Rental & Leasing
0 (0.0%)
0 (0.0%)
Professional & Scientific
0 (0.0%)
0 (0.0%)
Enterprise Management
0 (0.0%)
0 (0.0%)
Administrative & Support
0 (0.0%)
0 (0.0%)
Educational Services
0 (0.0%)
0 (0.0%)
Health Care & Social Assistance
0 (0.0%)
0 (0.0%)
Arts, Entertainment & Recreation
0 (0.0%)
0 (0.0%)
Accommodation & Food Services
0 (0.0%)
0 (0.0%)
Public Administration
0 (0.0%)
0 (0.0%)
Total
0 (0.0%)
0 (0.0%)
Education in Piney
School Enrollment in Piney
School Level
# Students
% Students
Nursery / Preschool
0
0.0%
Kindergarten
0
0.0%
Elementary School
0
0.0%
Middle School
0
0.0%
High School
0
0.0%
College / Undergraduate
0
0.0%
Graduate / Professional
0
0.0%
Total
0
0.0%
School Enrollment by Age by Funding Source in Piney
Age Bracket
Public School
Private School
3 to 4 Year Olds
0 (0.0%)
0 (0.0%)
5 to 9 Year Old
0 (0.0%)
0 (0.0%)
10 to 14 Year Olds
0 (0.0%)
0 (0.0%)
15 to 17 Year Olds
0 (0.0%)
0 (0.0%)
18 to 19 Year Olds
0 (0.0%)
0 (0.0%)
20 to 24 Year Olds
0 (0.0%)
0 (0.0%)
25 to 34 Year Olds
0 (0.0%)
0 (0.0%)
35 Years and over
0 (0.0%)
0 (0.0%)
Total
0 (0.0%)
0 (0.0%)
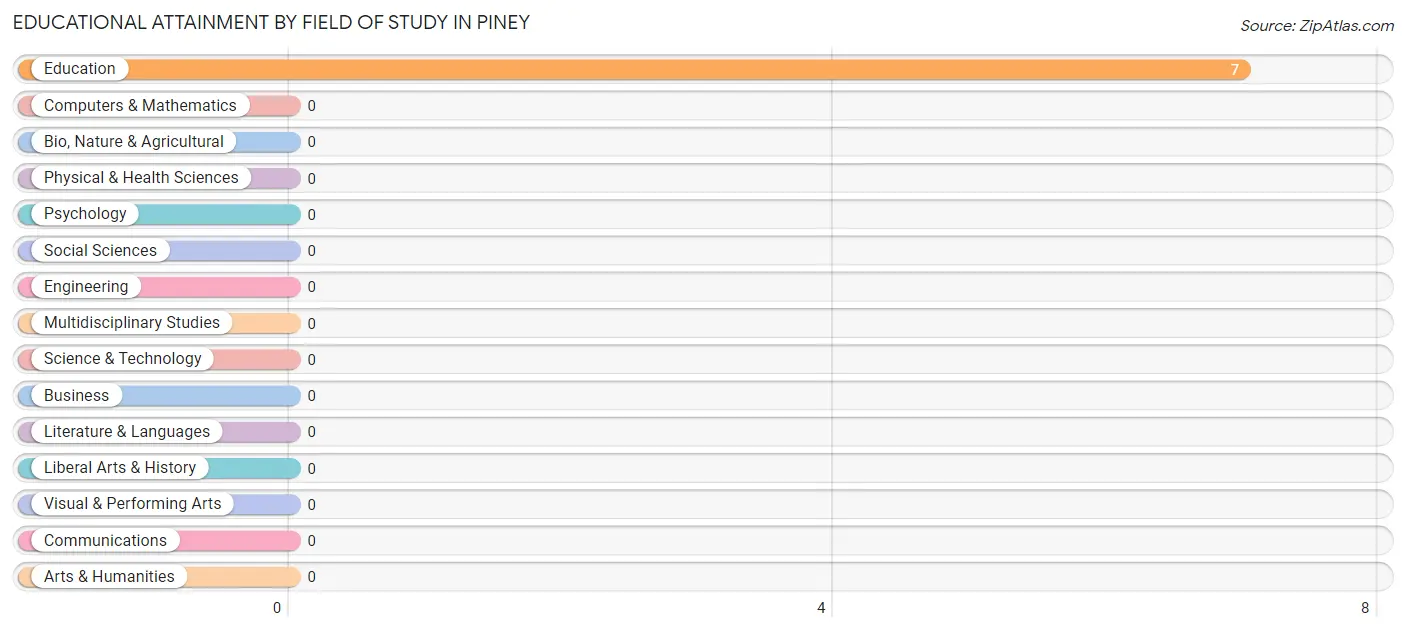
Educational Attainment by Field of Study in Piney
, and education (7 | 100.0%) are the most common fields of study among 7 individuals in Piney who have obtained a bachelor's degree or higher.
Field of Study
# Graduates
% Graduates
Computers & Mathematics
0
0.0%
Bio, Nature & Agricultural
0
0.0%
Physical & Health Sciences
0
0.0%
Psychology
0
0.0%
Social Sciences
0
0.0%
Engineering
0
0.0%
Multidisciplinary Studies
0
0.0%
Science & Technology
0
0.0%
Business
0
0.0%
Education
7
100.0%
Literature & Languages
0
0.0%
Liberal Arts & History
0
0.0%
Visual & Performing Arts
0
0.0%
Communications
0
0.0%
Arts & Humanities
0
0.0%
Total
7
100.0%
Transportation & Commute in Piney
Vehicle Availability by Sex in Piney
Vehicles Available
Male
Female
No Vehicle
0 (0.0%)
0 (0.0%)
1 Vehicle
0 (0.0%)
0 (0.0%)
2 Vehicles
0 (0.0%)
0 (0.0%)
3 Vehicles
0 (0.0%)
0 (0.0%)
4 Vehicles
0 (0.0%)
0 (0.0%)
5 or more Vehicles
0 (0.0%)
0 (0.0%)
Total
0 (0.0%)
0 (0.0%)
Commute Time in Piney
Commute Time
# Commuters
% Commuters
Less than 5 Minutes
0
0.0%
5 to 9 Minutes
0
0.0%
10 to 14 Minutes
0
0.0%
15 to 19 Minutes
0
0.0%
20 to 24 Minutes
0
0.0%
25 to 29 Minutes
0
0.0%
30 to 34 Minutes
0
0.0%
35 to 39 Minutes
0
0.0%
40 to 44 Minutes
0
0.0%
45 to 59 Minutes
0
0.0%
60 to 89 Minutes
0
0.0%
90 or more Minutes
0
0.0%
Commute Time by Sex in Piney
Commute Time
Male
Female
Less than 5 Minutes
0 (0.0%)
0 (0.0%)
5 to 9 Minutes
0 (0.0%)
0 (0.0%)
10 to 14 Minutes
0 (0.0%)
0 (0.0%)
15 to 19 Minutes
0 (0.0%)
0 (0.0%)
20 to 24 Minutes
0 (0.0%)
0 (0.0%)
25 to 29 Minutes
0 (0.0%)
0 (0.0%)
30 to 34 Minutes
0 (0.0%)
0 (0.0%)
35 to 39 Minutes
0 (0.0%)
0 (0.0%)
40 to 44 Minutes
0 (0.0%)
0 (0.0%)
45 to 59 Minutes
0 (0.0%)
0 (0.0%)
60 to 89 Minutes
0 (0.0%)
0 (0.0%)
90 or more Minutes
0 (0.0%)
0 (0.0%)
Time of Departure to Work by Sex in Piney
Time of Departure
Male
Female
12:00 AM to 4:59 AM
0 (0.0%)
0 (0.0%)
5:00 AM to 5:29 AM
0 (0.0%)
0 (0.0%)
5:30 AM to 5:59 AM
0 (0.0%)
0 (0.0%)
6:00 AM to 6:29 AM
0 (0.0%)
0 (0.0%)
6:30 AM to 6:59 AM
0 (0.0%)
0 (0.0%)
7:00 AM to 7:29 AM
0 (0.0%)
0 (0.0%)
7:30 AM to 7:59 AM
0 (0.0%)
0 (0.0%)
8:00 AM to 8:29 AM
0 (0.0%)
0 (0.0%)
8:30 AM to 8:59 AM
0 (0.0%)
0 (0.0%)
9:00 AM to 9:59 AM
0 (0.0%)
0 (0.0%)
10:00 AM to 10:59 AM
0 (0.0%)
0 (0.0%)
11:00 AM to 11:59 AM
0 (0.0%)
0 (0.0%)
12:00 PM to 3:59 PM
0 (0.0%)
0 (0.0%)
4:00 PM to 11:59 PM
0 (0.0%)
0 (0.0%)
Total
0 (0.0%)
0 (0.0%)
Housing Occupancy in Piney
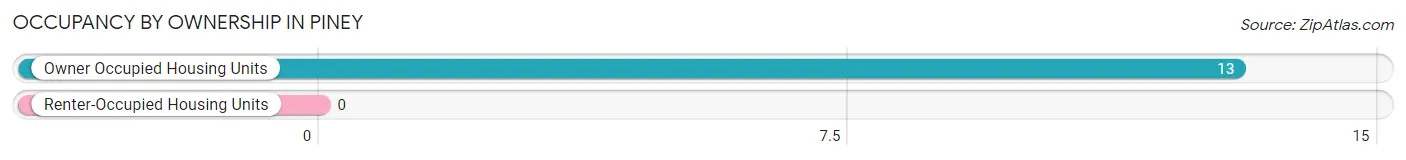
Occupancy by Ownership in Piney
Of the total 13 dwellings in Piney, owner-occupied units account for 13 (100.0%), while renter-occupied units make up 0 (0.0%).
Occupancy
# Housing Units
% Housing Units
Owner Occupied Housing Units
13
100.0%
Renter-Occupied Housing Units
0
0.0%
Total Occupied Housing Units
13
100.0%
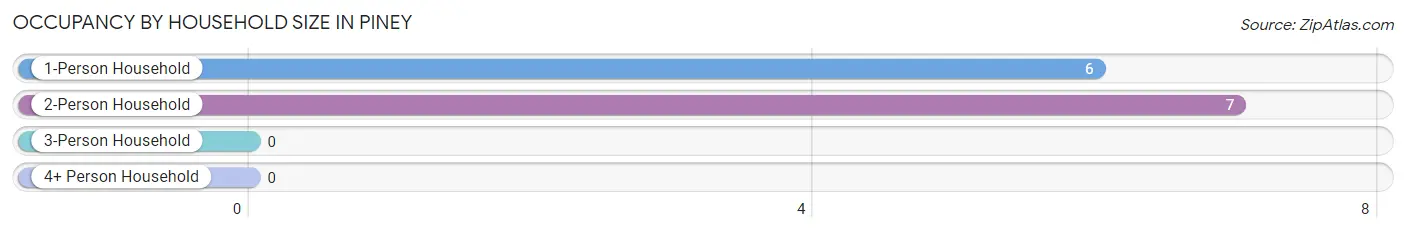
Occupancy by Household Size in Piney
Household Size
# Housing Units
% Housing Units
1-Person Household
6
46.2%
2-Person Household
7
53.8%
3-Person Household
0
0.0%
4+ Person Household
0
0.0%
Total Housing Units
13
100.0%
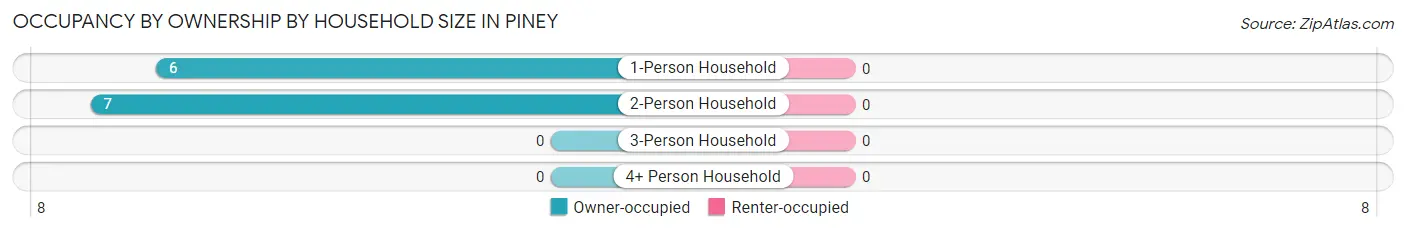
Occupancy by Ownership by Household Size in Piney
Household Size
Owner-occupied
Renter-occupied
1-Person Household
6 (100.0%)
0 (0.0%)
2-Person Household
7 (100.0%)
0 (0.0%)
3-Person Household
0 (0.0%)
0 (0.0%)
4+ Person Household
0 (0.0%)
0 (0.0%)
Total Housing Units
13 (100.0%)
0 (0.0%)
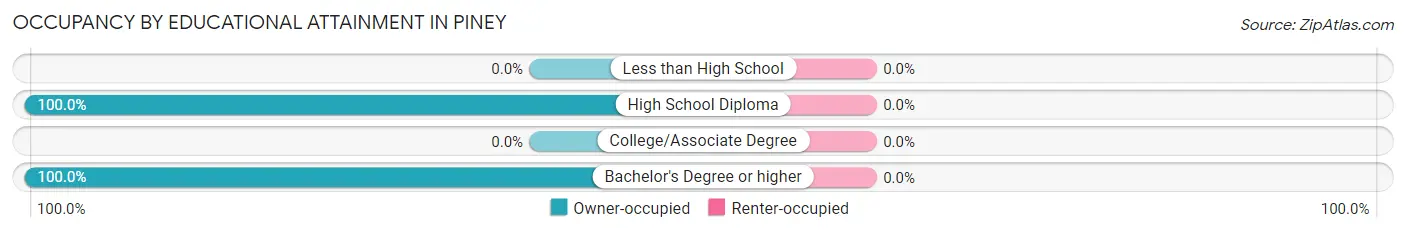
Occupancy by Educational Attainment in Piney
Household Size
Owner-occupied
Renter-occupied
Less than High School
0 (0.0%)
0 (0.0%)
High School Diploma
6 (100.0%)
0 (0.0%)
College/Associate Degree
0 (0.0%)
0 (0.0%)
Bachelor's Degree or higher
7 (100.0%)
0 (0.0%)
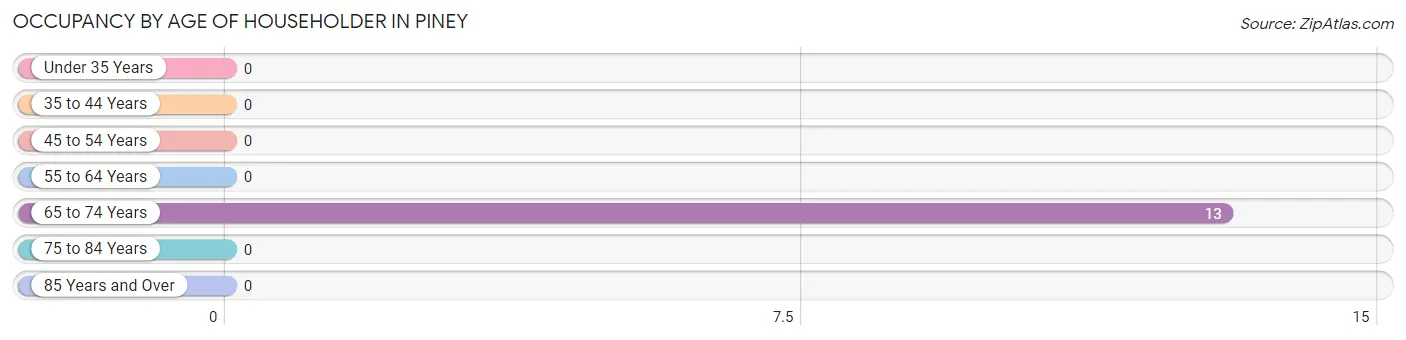
Occupancy by Age of Householder in Piney
Age Bracket
# Households
% Households
Under 35 Years
0
0.0%
35 to 44 Years
0
0.0%
45 to 54 Years
0
0.0%
55 to 64 Years
0
0.0%
65 to 74 Years
13
100.0%
75 to 84 Years
0
0.0%
85 Years and Over
0
0.0%
Total
13
100.0%
Housing Finances in Piney
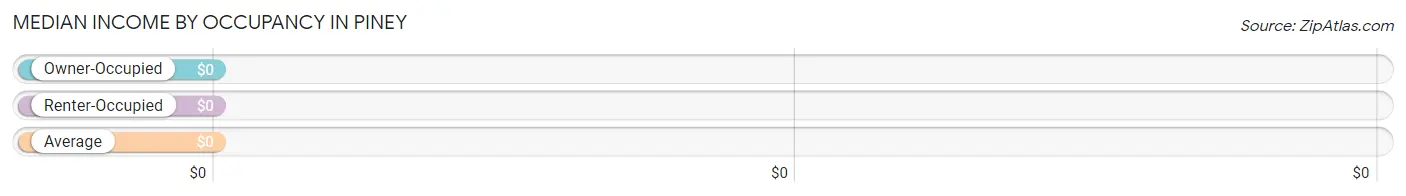
Median Income by Occupancy in Piney
Occupancy Type
# Households
Median Income
Owner-Occupied
13 (100.0%)
$0
Renter-Occupied
0 (0.0%)
$0
Average
13 (100.0%)
$0
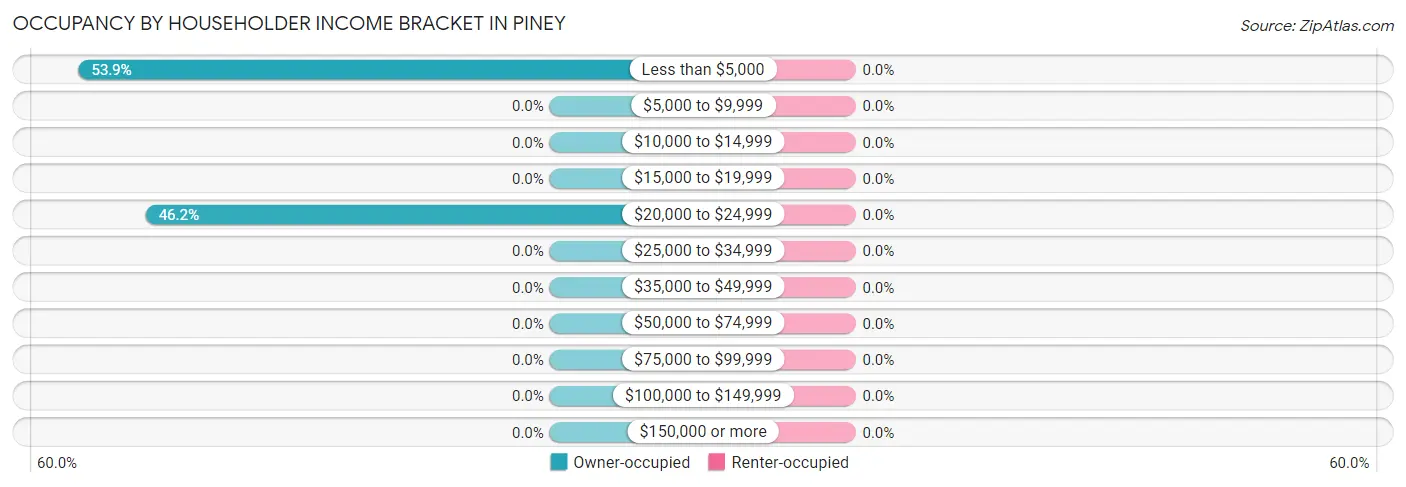
Occupancy by Householder Income Bracket in Piney
Income Bracket
Owner-occupied
Renter-occupied
Less than $5,000
7 (53.8%)
0 (0.0%)
$5,000 to $9,999
0 (0.0%)
0 (0.0%)
$10,000 to $14,999
0 (0.0%)
0 (0.0%)
$15,000 to $19,999
0 (0.0%)
0 (0.0%)
$20,000 to $24,999
6 (46.2%)
0 (0.0%)
$25,000 to $34,999
0 (0.0%)
0 (0.0%)
$35,000 to $49,999
0 (0.0%)
0 (0.0%)
$50,000 to $74,999
0 (0.0%)
0 (0.0%)
$75,000 to $99,999
0 (0.0%)
0 (0.0%)
$100,000 to $149,999
0 (0.0%)
0 (0.0%)
$150,000 or more
0 (0.0%)
0 (0.0%)
Total
13 (100.0%)
0 (0.0%)
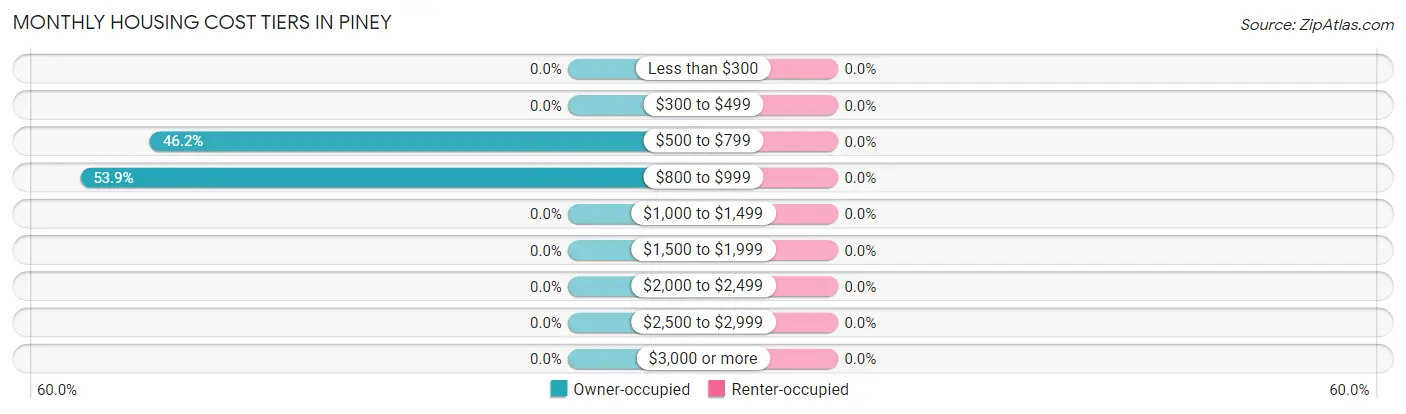
Monthly Housing Cost Tiers in Piney
Monthly Cost
Owner-occupied
Renter-occupied
Less than $300
0 (0.0%)
0 (0.0%)
$300 to $499
0 (0.0%)
0 (0.0%)
$500 to $799
6 (46.2%)
0 (0.0%)
$800 to $999
7 (53.8%)
0 (0.0%)
$1,000 to $1,499
0 (0.0%)
0 (0.0%)
$1,500 to $1,999
0 (0.0%)
0 (0.0%)
$2,000 to $2,499
0 (0.0%)
0 (0.0%)
$2,500 to $2,999
0 (0.0%)
0 (0.0%)
$3,000 or more
0 (0.0%)
0 (0.0%)
Total
13 (100.0%)
0 (0.0%)
Physical Housing Characteristics in Piney
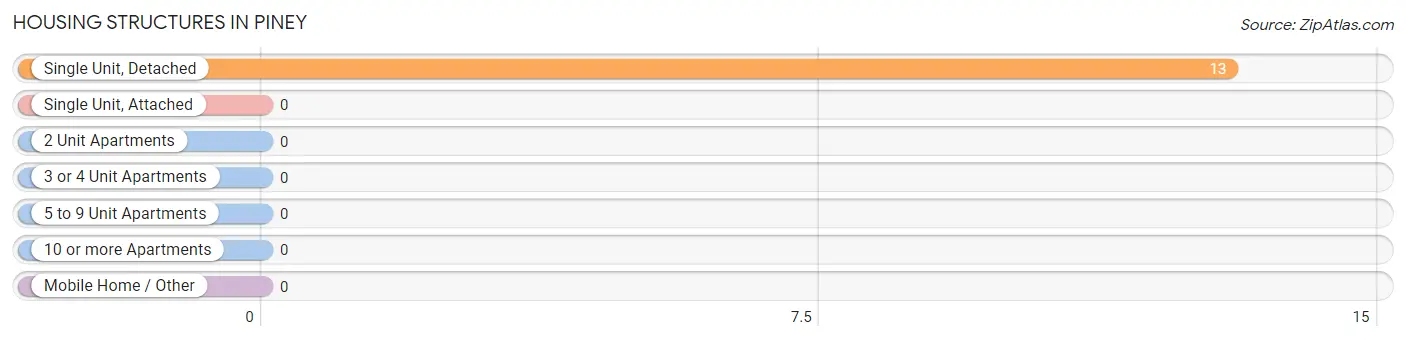
Housing Structures in Piney
Structure Type
# Housing Units
% Housing Units
Single Unit, Detached
13
100.0%
Single Unit, Attached
0
0.0%
2 Unit Apartments
0
0.0%
3 or 4 Unit Apartments
0
0.0%
5 to 9 Unit Apartments
0
0.0%
10 or more Apartments
0
0.0%
Mobile Home / Other
0
0.0%
Total
13
100.0%
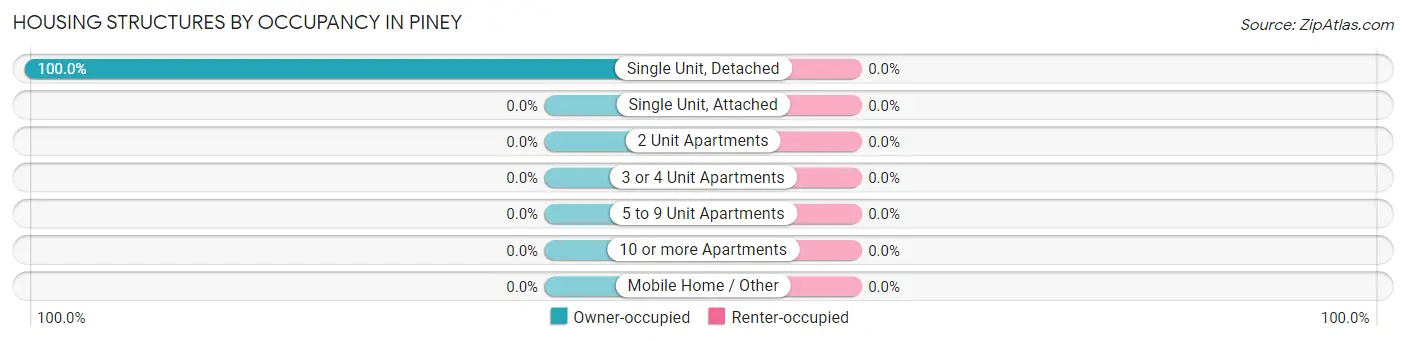
Housing Structures by Occupancy in Piney
Structure Type
Owner-occupied
Renter-occupied
Single Unit, Detached
13 (100.0%)
0 (0.0%)
Single Unit, Attached
0 (0.0%)
0 (0.0%)
2 Unit Apartments
0 (0.0%)
0 (0.0%)
3 or 4 Unit Apartments
0 (0.0%)
0 (0.0%)
5 to 9 Unit Apartments
0 (0.0%)
0 (0.0%)
10 or more Apartments
0 (0.0%)
0 (0.0%)
Mobile Home / Other
0 (0.0%)
0 (0.0%)
Total
13 (100.0%)
0 (0.0%)
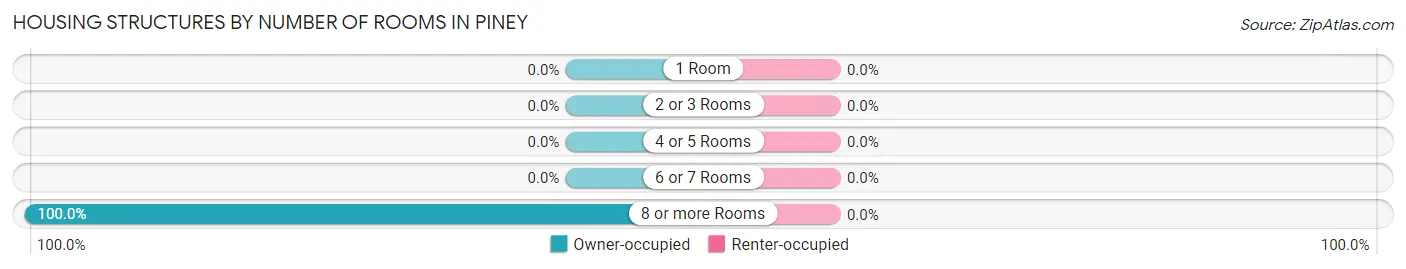
Housing Structures by Number of Rooms in Piney
Number of Rooms
Owner-occupied
Renter-occupied
1 Room
0 (0.0%)
0 (0.0%)
2 or 3 Rooms
0 (0.0%)
0 (0.0%)
4 or 5 Rooms
0 (0.0%)
0 (0.0%)
6 or 7 Rooms
0 (0.0%)
0 (0.0%)
8 or more Rooms
13 (100.0%)
0 (0.0%)
Total
13 (100.0%)
0 (0.0%)
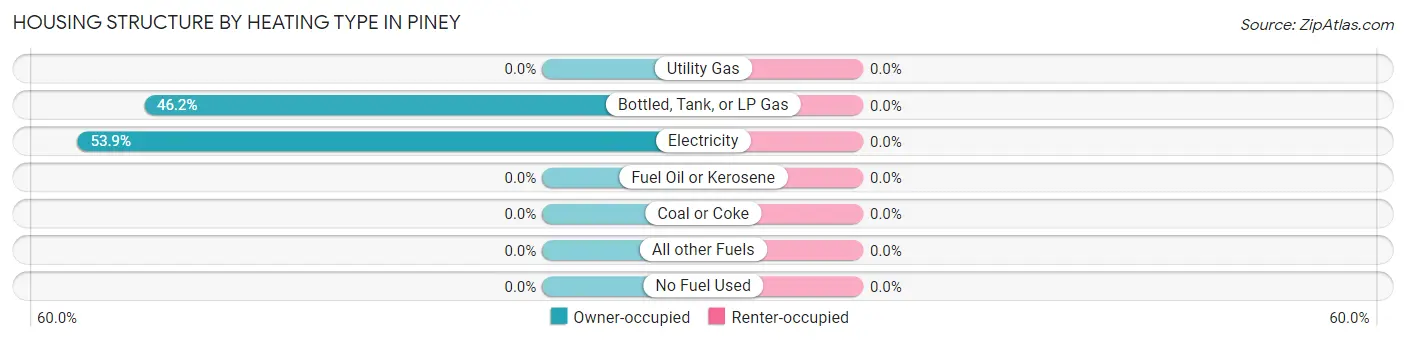
Housing Structure by Heating Type in Piney
Heating Type
Owner-occupied
Renter-occupied
Utility Gas
0 (0.0%)
0 (0.0%)
Bottled, Tank, or LP Gas
6 (46.2%)
0 (0.0%)
Electricity
7 (53.8%)
0 (0.0%)
Fuel Oil or Kerosene
0 (0.0%)
0 (0.0%)
Coal or Coke
0 (0.0%)
0 (0.0%)
All other Fuels
0 (0.0%)
0 (0.0%)
No Fuel Used
0 (0.0%)
0 (0.0%)
Total
13 (100.0%)
0 (0.0%)
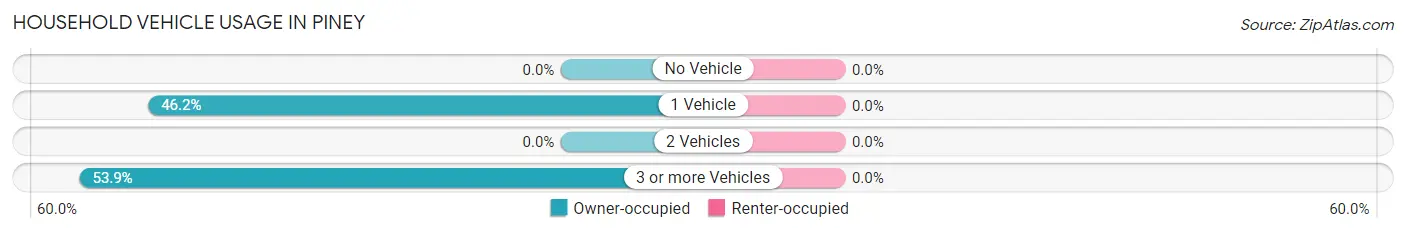
Household Vehicle Usage in Piney
Vehicles per Household
Owner-occupied
Renter-occupied
No Vehicle
0 (0.0%)
0 (0.0%)
1 Vehicle
6 (46.2%)
0 (0.0%)
2 Vehicles
0 (0.0%)
0 (0.0%)
3 or more Vehicles
7 (53.8%)
0 (0.0%)
Total
13 (100.0%)
0 (0.0%)
Real Estate & Mortgages in Piney
Real Estate and Mortgage Overview in Piney
Characteristic
Without Mortgage
With Mortgage
Housing Units
13
0
Median Property Value
-
-
Median Household Income
-
-
Monthly Housing Costs
-
-
Real Estate Taxes
-
-
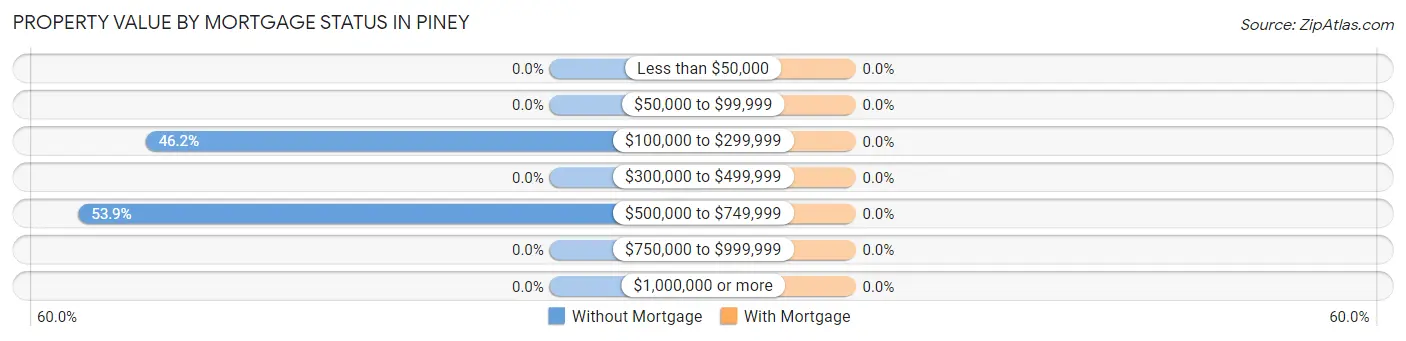
Property Value by Mortgage Status in Piney
Property Value
Without Mortgage
With Mortgage
Less than $50,000
0 (0.0%)
0 (0.0%)
$50,000 to $99,999
0 (0.0%)
0 (0.0%)
$100,000 to $299,999
6 (46.2%)
0 (0.0%)
$300,000 to $499,999
0 (0.0%)
0 (0.0%)
$500,000 to $749,999
7 (53.8%)
0 (0.0%)
$750,000 to $999,999
0 (0.0%)
0 (0.0%)
$1,000,000 or more
0 (0.0%)
0 (0.0%)
Total
13 (100.0%)
0 (0.0%)
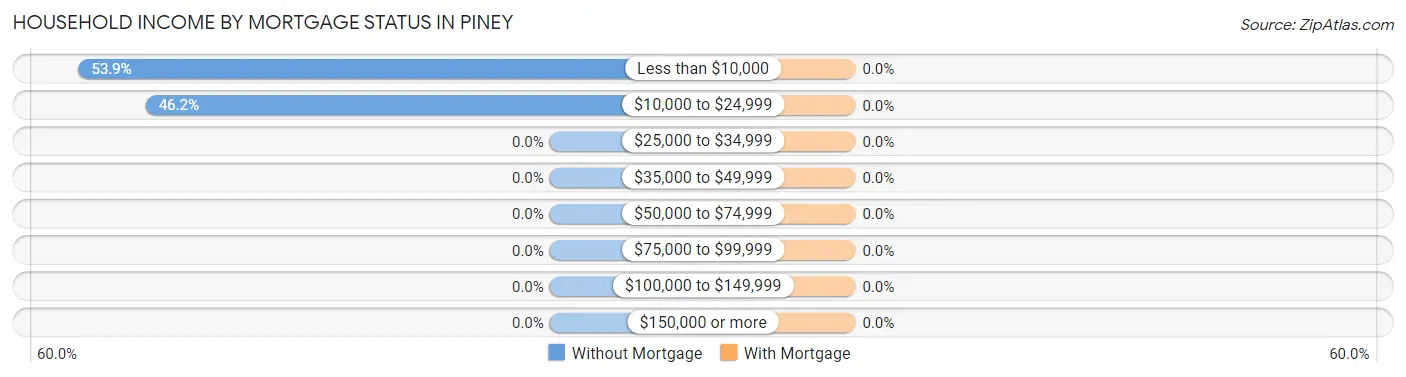
Household Income by Mortgage Status in Piney
Household Income
Without Mortgage
With Mortgage
Less than $10,000
7 (53.8%)
0 (0.0%)
$10,000 to $24,999
6 (46.2%)
0 (0.0%)
$25,000 to $34,999
0 (0.0%)
0 (0.0%)
$35,000 to $49,999
0 (0.0%)
0 (0.0%)
$50,000 to $74,999
0 (0.0%)
0 (0.0%)
$75,000 to $99,999
0 (0.0%)
0 (0.0%)
$100,000 to $149,999
0 (0.0%)
0 (0.0%)
$150,000 or more
0 (0.0%)
0 (0.0%)
Total
13 (100.0%)
0 (0.0%)
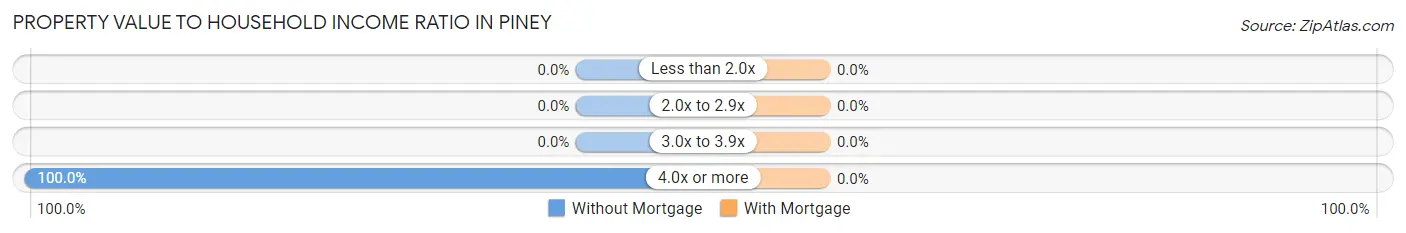
Property Value to Household Income Ratio in Piney
Value-to-Income Ratio
Without Mortgage
With Mortgage
Less than 2.0x
0 (0.0%)
0 (0.0%)
2.0x to 2.9x
0 (0.0%)
0 (0.0%)
3.0x to 3.9x
0 (0.0%)
0 (0.0%)
4.0x or more
13 (100.0%)
0 (0.0%)
Total
13 (100.0%)
0 (0.0%)
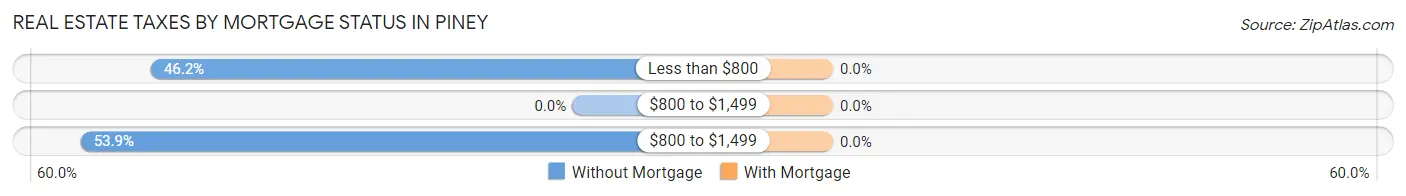
Real Estate Taxes by Mortgage Status in Piney
Property Taxes
Without Mortgage
With Mortgage
Less than $800
6 (46.2%)
0 (0.0%)
$800 to $1,499
0 (0.0%)
0 (0.0%)
$800 to $1,499
7 (53.8%)
0 (0.0%)
Total
13 (100.0%)
0 (0.0%)
Health & Disability in Piney
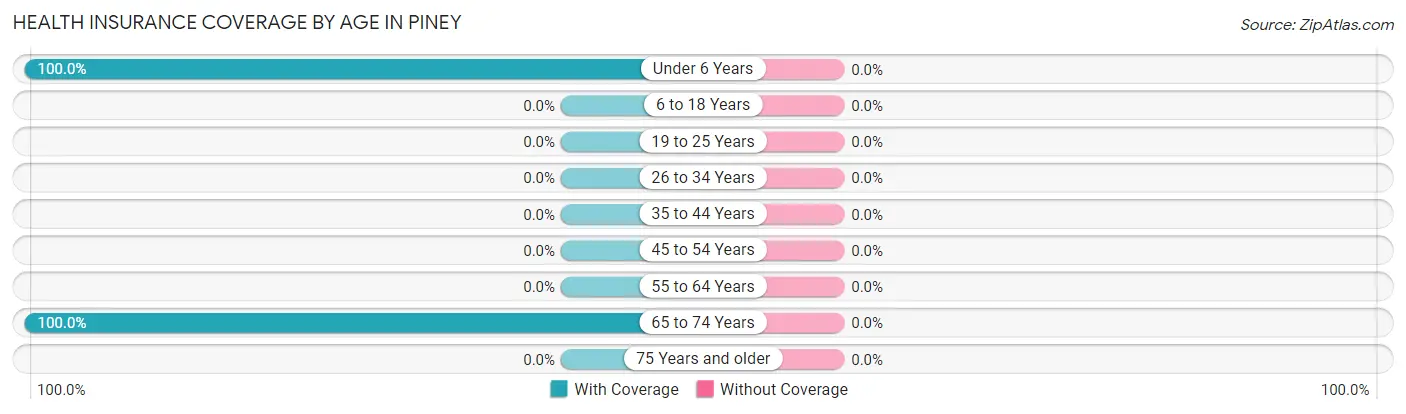
Health Insurance Coverage by Age in Piney
Age Bracket
With Coverage
Without Coverage
Under 6 Years
10 (100.0%)
0 (0.0%)
6 to 18 Years
0 (0.0%)
0 (0.0%)
19 to 25 Years
0 (0.0%)
0 (0.0%)
26 to 34 Years
0 (0.0%)
0 (0.0%)
35 to 44 Years
0 (0.0%)
0 (0.0%)
45 to 54 Years
0 (0.0%)
0 (0.0%)
55 to 64 Years
0 (0.0%)
0 (0.0%)
65 to 74 Years
13 (100.0%)
0 (0.0%)
75 Years and older
0 (0.0%)
0 (0.0%)
Total
23 (100.0%)
0 (0.0%)
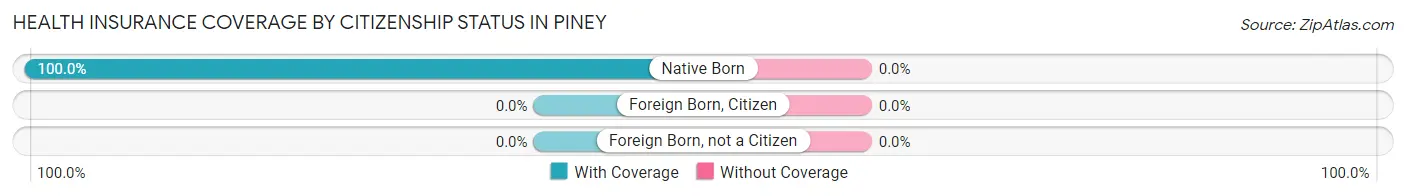
Health Insurance Coverage by Citizenship Status in Piney
Citizenship Status
With Coverage
Without Coverage
Native Born
10 (100.0%)
0 (0.0%)
Foreign Born, Citizen
0 (0.0%)
0 (0.0%)
Foreign Born, not a Citizen
0 (0.0%)
0 (0.0%)
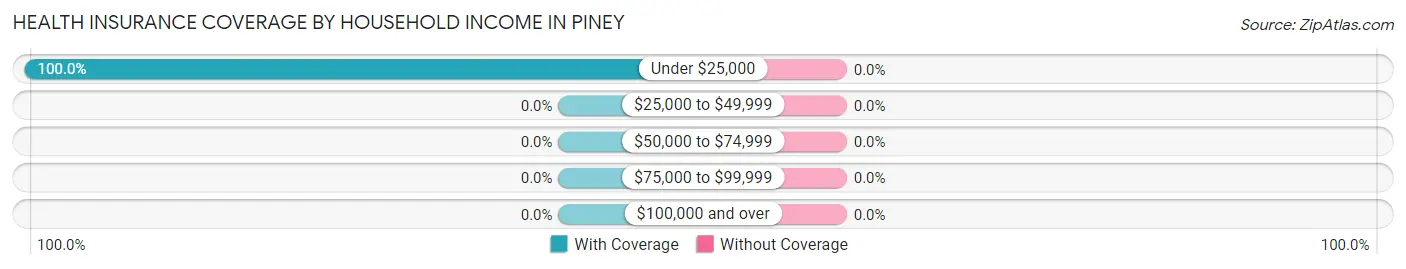
Health Insurance Coverage by Household Income in Piney
Household Income
With Coverage
Without Coverage
Under $25,000
23 (100.0%)
0 (0.0%)
$25,000 to $49,999
0 (0.0%)
0 (0.0%)
$50,000 to $74,999
0 (0.0%)
0 (0.0%)
$75,000 to $99,999
0 (0.0%)
0 (0.0%)
$100,000 and over
0 (0.0%)
0 (0.0%)
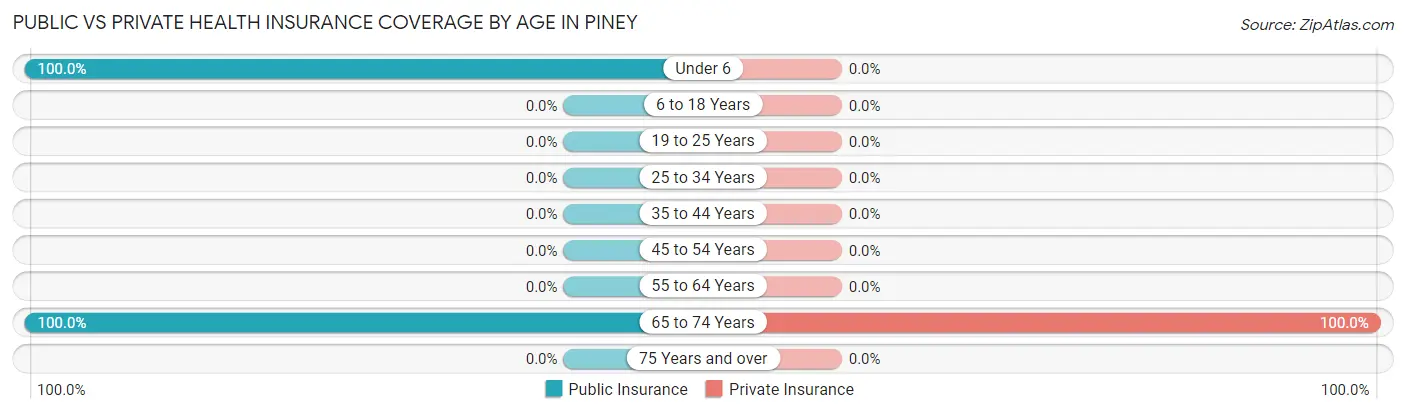
Public vs Private Health Insurance Coverage by Age in Piney
Age Bracket
Public Insurance
Private Insurance
Under 6
10 (100.0%)
0 (0.0%)
6 to 18 Years
0 (0.0%)
0 (0.0%)
19 to 25 Years
0 (0.0%)
0 (0.0%)
25 to 34 Years
0 (0.0%)
0 (0.0%)
35 to 44 Years
0 (0.0%)
0 (0.0%)
45 to 54 Years
0 (0.0%)
0 (0.0%)
55 to 64 Years
0 (0.0%)
0 (0.0%)
65 to 74 Years
13 (100.0%)
13 (100.0%)
75 Years and over
0 (0.0%)
0 (0.0%)
Total
23 (100.0%)
13 (56.5%)
Disability Status by Sex by Age in Piney
Age Bracket
Male
Female
Under 5 Years
0 (0.0%)
0 (0.0%)
5 to 17 Years
0 (0.0%)
0 (0.0%)
18 to 34 Years
0 (0.0%)
0 (0.0%)
35 to 64 Years
0 (0.0%)
0 (0.0%)
65 to 74 Years
0 (0.0%)
0 (0.0%)
75 Years and over
0 (0.0%)
0 (0.0%)
Disability Class by Sex by Age in Piney
Disability Class: Hearing Difficulty
Age Bracket
Male
Female
Under 5 Years
0 (0.0%)
0 (0.0%)
5 to 17 Years
0 (0.0%)
0 (0.0%)
18 to 34 Years
0 (0.0%)
0 (0.0%)
35 to 64 Years
0 (0.0%)
0 (0.0%)
65 to 74 Years
0 (0.0%)
0 (0.0%)
75 Years and over
0 (0.0%)
0 (0.0%)
Disability Class: Vision Difficulty
Age Bracket
Male
Female
Under 5 Years
0 (0.0%)
0 (0.0%)
5 to 17 Years
0 (0.0%)
0 (0.0%)
18 to 34 Years
0 (0.0%)
0 (0.0%)
35 to 64 Years
0 (0.0%)
0 (0.0%)
65 to 74 Years
0 (0.0%)
0 (0.0%)
75 Years and over
0 (0.0%)
0 (0.0%)
Disability Class: Cognitive Difficulty
Age Bracket
Male
Female
5 to 17 Years
0 (0.0%)
0 (0.0%)
18 to 34 Years
0 (0.0%)
0 (0.0%)
35 to 64 Years
0 (0.0%)
0 (0.0%)
65 to 74 Years
0 (0.0%)
0 (0.0%)
75 Years and over
0 (0.0%)
0 (0.0%)
Disability Class: Ambulatory Difficulty
Age Bracket
Male
Female
5 to 17 Years
0 (0.0%)
0 (0.0%)
18 to 34 Years
0 (0.0%)
0 (0.0%)
35 to 64 Years
0 (0.0%)
0 (0.0%)
65 to 74 Years
0 (0.0%)
0 (0.0%)
75 Years and over
0 (0.0%)
0 (0.0%)
Disability Class: Self-Care Difficulty
Age Bracket
Male
Female
5 to 17 Years
0 (0.0%)
0 (0.0%)
18 to 34 Years
0 (0.0%)
0 (0.0%)
35 to 64 Years
0 (0.0%)
0 (0.0%)
65 to 74 Years
0 (0.0%)
0 (0.0%)
75 Years and over
0 (0.0%)
0 (0.0%)
Technology Access in Piney
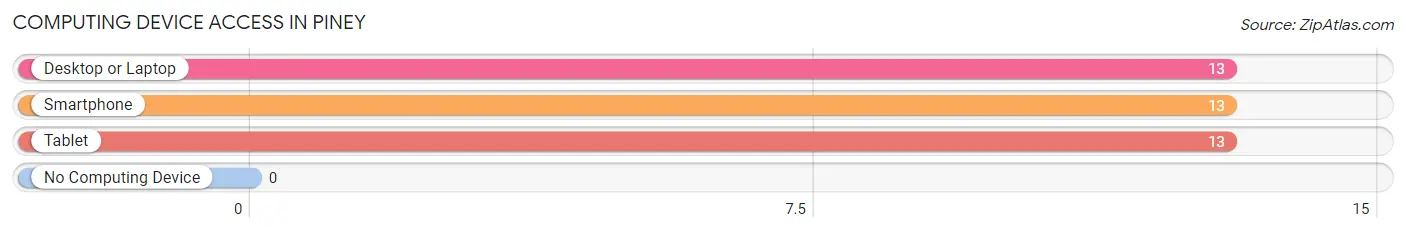
Computing Device Access in Piney
Device Type
# Households
% Households
Desktop or Laptop
13
100.0%
Smartphone
13
100.0%
Tablet
13
100.0%
No Computing Device
0
0.0%
Total
13
100.0%
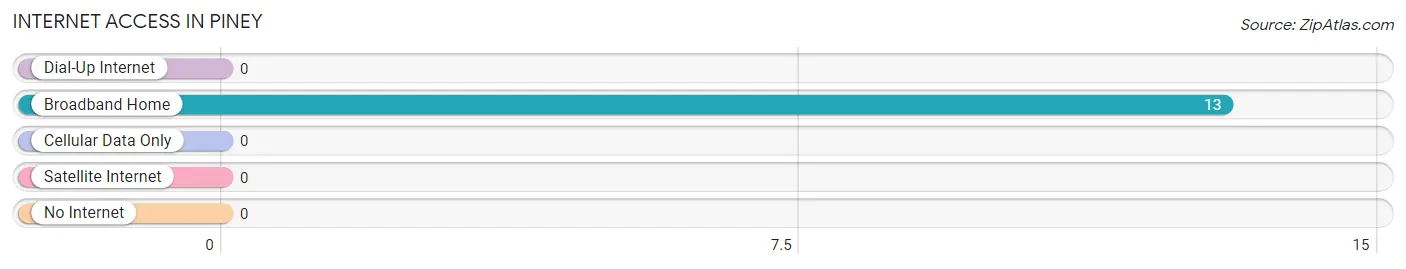
Internet Access in Piney
Internet Type
# Households
% Households
Dial-Up Internet
0
0.0%
Broadband Home
13
100.0%
Cellular Data Only
0
0.0%
Satellite Internet
0
0.0%
No Internet
0
0.0%
Total
13
100.0%
Piney Summary
Piney, Oklahoma is a small town located in Pushmataha County, Oklahoma. It is situated in the foothills of the Ouachita Mountains, approximately 20 miles south of Antlers, Oklahoma. The town was founded in 1891 and was named after the pine trees that grew in the area. The population of Piney was estimated to be around 200 people in 2000.
Geography
Piney is located in the foothills of the Ouachita Mountains, approximately 20 miles south of Antlers, Oklahoma. The town is situated on the banks of the Kiamichi River, which flows through the area. The town is surrounded by rolling hills and forests, providing a picturesque backdrop for the town. The climate in Piney is mild, with temperatures ranging from the mid-50s in the winter to the mid-80s in the summer.
Economy
The economy of Piney is largely based on agriculture and forestry. The town is home to several farms and ranches, which produce a variety of crops, including corn, soybeans, wheat, and hay. The town is also home to several sawmills, which produce lumber for the local market. In addition, the town is home to several small businesses, including a grocery store, a hardware store, and a restaurant.
Demographics
The population of Piney was estimated to be around 200 people in 2000. The town is predominantly white, with a small minority population. The median household income in Piney is $25,000, and the median home value is $50,000. The town has a low unemployment rate, and the majority of the population is employed in the agricultural and forestry industries.
Conclusion
Piney, Oklahoma is a small town located in Pushmataha County, Oklahoma. It is situated in the foothills of the Ouachita Mountains, approximately 20 miles south of Antlers, Oklahoma. The town was founded in 1891 and was named after the pine trees that grew in the area. The population of Piney was estimated to be around 200 people in 2000. The economy of Piney is largely based on agriculture and forestry, and the town is predominantly white, with a small minority population. The median household income in Piney is $25,000, and the median home value is $50,000. The town has a low unemployment rate, and the majority of the population is employed in the agricultural and forestry industries.
Common Questions
What is Inequality or Gini Index in Piney?
Inequality or Gini Index in Piney is 0.37.
What is the Total Population of Piney?
Total Population of Piney is 23.
What is the Total Female Population of Piney?
Total Female Population of Piney is 23.
What is the Median Population Age in Piney?
Median Population Age in Piney is 69.2 Years.
What is the Average Family Size in Piney
Average Family Size in Piney is 2.4 People.
What is the Average Household Size in Piney
Average Household Size in Piney is 1.8 People.
Report Title
Report Link
HTML Copy & Paste Link
Social Media
Copy and paste the folowing code into any webpage where you would like this interactive chart to display