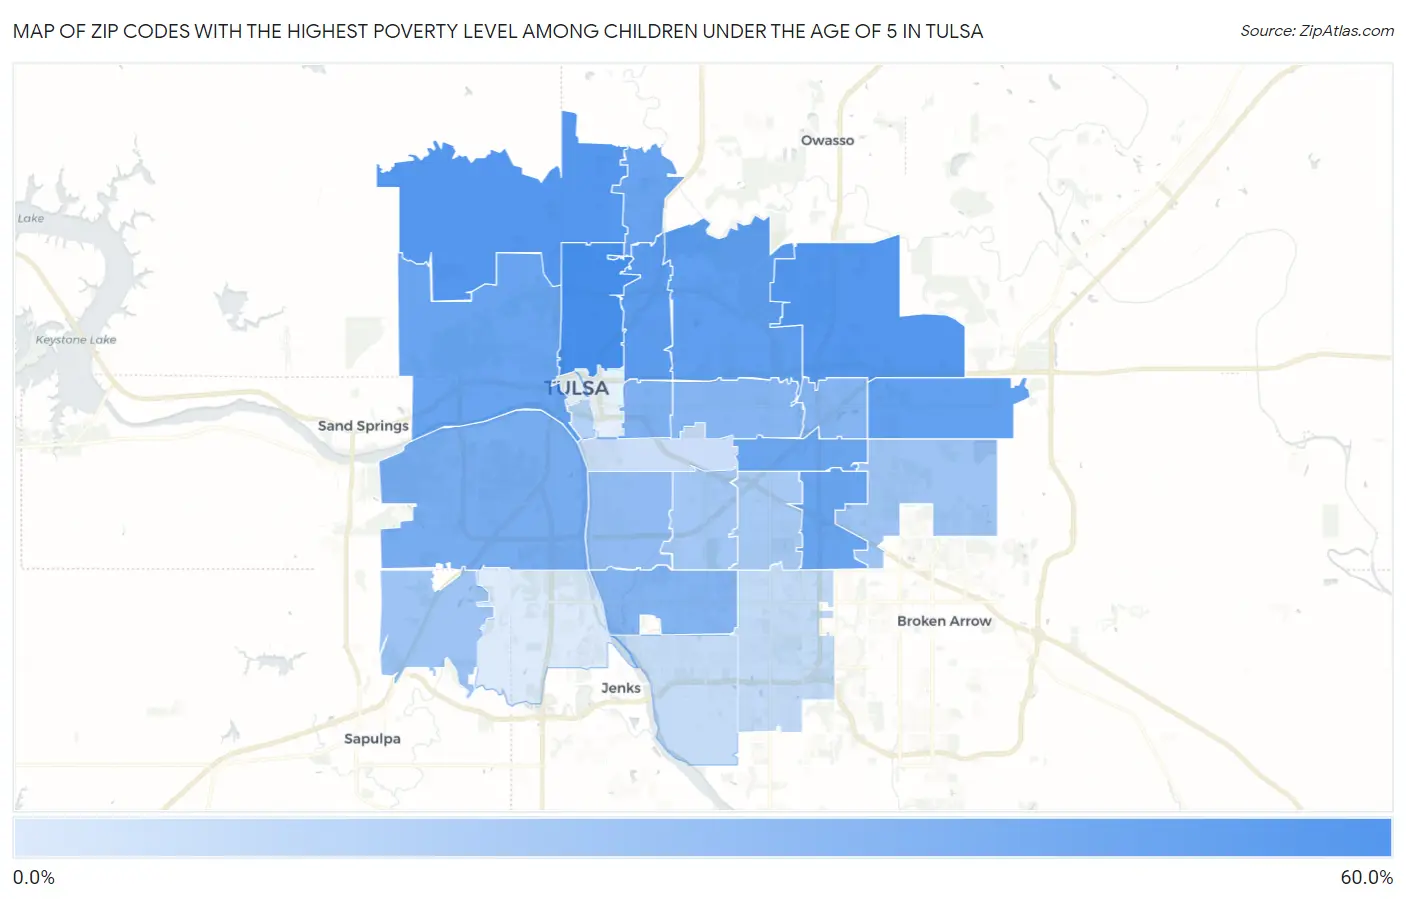
Zip Codes with the Highest Poverty Level Among Children Under the Age of 5 in Tulsa, OK
RELATED REPORTS & OPTIONS
Highest Poverty | Child 0-5
Tulsa
Compare Zip Codes
Map of Zip Codes with the Highest Poverty Level Among Children Under the Age of 5 in Tulsa
2.5%
59.0%
Zip Codes with the Highest Poverty Level Among Children Under the Age of 5 in Tulsa, OK
| Zip Code | Child Poverty | vs State | vs National | |
| 1. | 74106 | 59.0% | 23.3%(+35.7)#41 | 18.1%(+41.0)#1,765 |
| 2. | 74116 | 52.7% | 23.3%(+29.4)#60 | 18.1%(+34.6)#2,278 |
| 3. | 74126 | 52.4% | 23.3%(+29.0)#61 | 18.1%(+34.3)#2,309 |
| 4. | 74110 | 50.7% | 23.3%(+27.4)#64 | 18.1%(+32.7)#2,448 |
| 5. | 74115 | 47.9% | 23.3%(+24.5)#78 | 18.1%(+29.8)#2,821 |
| 6. | 74108 | 46.4% | 23.3%(+23.0)#83 | 18.1%(+28.3)#2,997 |
| 7. | 74130 | 44.3% | 23.3%(+21.0)#96 | 18.1%(+26.3)#3,294 |
| 8. | 74127 | 43.9% | 23.3%(+20.6)#100 | 18.1%(+25.8)#3,349 |
| 9. | 74146 | 43.3% | 23.3%(+20.0)#102 | 18.1%(+25.3)#3,436 |
| 10. | 74129 | 43.0% | 23.3%(+19.7)#103 | 18.1%(+24.9)#3,481 |
| 11. | 74107 | 38.3% | 23.3%(+14.9)#130 | 18.1%(+20.2)#4,346 |
| 12. | 74104 | 35.3% | 23.3%(+12.0)#154 | 18.1%(+17.3)#4,991 |
| 13. | 74136 | 33.1% | 23.3%(+9.79)#176 | 18.1%(+15.1)#5,562 |
| 14. | 74112 | 33.0% | 23.3%(+9.61)#178 | 18.1%(+14.9)#5,597 |
| 15. | 74128 | 32.8% | 23.3%(+9.42)#184 | 18.1%(+14.7)#5,649 |
| 16. | 74105 | 28.4% | 23.3%(+5.09)#222 | 18.1%(+10.4)#6,842 |
| 17. | 74131 | 22.6% | 23.3%(-0.705)#284 | 18.1%(+4.58)#8,902 |
| 18. | 74134 | 22.6% | 23.3%(-0.714)#285 | 18.1%(+4.57)#8,904 |
| 19. | 74135 | 21.3% | 23.3%(-2.04)#306 | 18.1%(+3.24)#9,483 |
| 20. | 74145 | 19.9% | 23.3%(-3.44)#324 | 18.1%(+1.84)#10,102 |
| 21. | 74119 | 15.7% | 23.3%(-7.68)#362 | 18.1%(-2.40)#12,091 |
| 22. | 74133 | 10.1% | 23.3%(-13.2)#425 | 18.1%(-7.94)#15,333 |
| 23. | 74137 | 10.0% | 23.3%(-13.3)#427 | 18.1%(-8.06)#15,388 |
| 24. | 74114 | 8.0% | 23.3%(-15.4)#456 | 18.1%(-10.1)#16,775 |
| 25. | 74132 | 2.5% | 23.3%(-20.8)#507 | 18.1%(-15.5)#20,489 |
1
Common Questions
What are the Top 10 Zip Codes with the Highest Poverty Level Among Children Under the Age of 5 in Tulsa, OK?
Top 10 Zip Codes with the Highest Poverty Level Among Children Under the Age of 5 in Tulsa, OK are:
What zip code has the Highest Poverty Level Among Children Under the Age of 5 in Tulsa, OK?
74106 has the Highest Poverty Level Among Children Under the Age of 5 in Tulsa, OK with 59.0%.
What is the Poverty Level Among Children Under the Age of 5 in Tulsa, OK?
Poverty Level Among Children Under the Age of 5 in Tulsa is 31.7%.
What is the Poverty Level Among Children Under the Age of 5 in Oklahoma?
Poverty Level Among Children Under the Age of 5 in Oklahoma is 23.3%.
What is the Poverty Level Among Children Under the Age of 5 in the United States?
Poverty Level Among Children Under the Age of 5 in the United States is 18.1%.