Grandview, OK Map & Demographics
Grandview Map
Grandview Overview
$38,800
PER CAPITA INCOME
$68,676
AVG FAMILY INCOME
$70,189
AVG HOUSEHOLD INCOME
11.0%
WAGE / INCOME GAP [ % ]
89.0¢/ $1
WAGE / INCOME GAP [ $ ]
0.45
INEQUALITY / GINI INDEX
1,012
TOTAL POPULATION
446
MALE POPULATION
566
FEMALE POPULATION
78.80
MALES / 100 FEMALES
126.91
FEMALES / 100 MALES
52.0
MEDIAN AGE
2.7
AVG FAMILY SIZE
2.4
AVG HOUSEHOLD SIZE
434
LABOR FORCE [ PEOPLE ]
56.3%
PERCENT IN LABOR FORCE
Income in Grandview
Income Overview in Grandview
Per Capita Income in Grandview is $38,800, while median incomes of families and households are $68,676 and $70,189 respectively.
| Characteristic | Number | Measure |
| Per Capita Income | 1,012 | $38,800 |
| Median Family Income | 328 | $68,676 |
| Mean Family Income | 328 | $84,291 |
| Median Household Income | 431 | $70,189 |
| Mean Household Income | 431 | $88,315 |
| Income Deficit | 328 | $0 |
| Wage / Income Gap (%) | 1,012 | 11.03% |
| Wage / Income Gap ($) | 1,012 | 88.97¢ per $1 |
| Gini / Inequality Index | 1,012 | 0.45 |
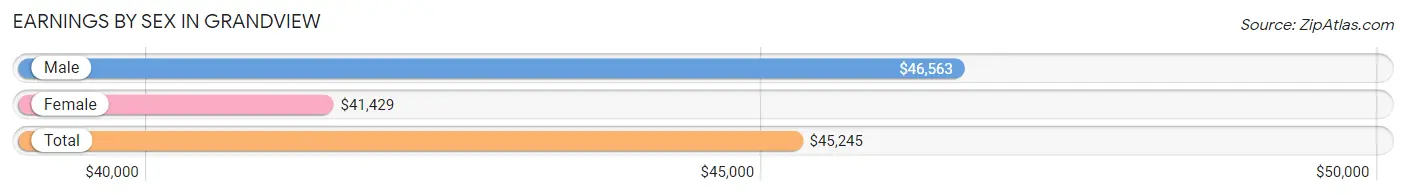
Earnings by Sex in Grandview
Average Earnings in Grandview are $45,245, $46,563 for men and $41,429 for women, a difference of 11.0%.
| Sex | Number | Average Earnings |
| Male | 157 (34.5%) | $46,563 |
| Female | 298 (65.5%) | $41,429 |
| Total | 455 (100.0%) | $45,245 |
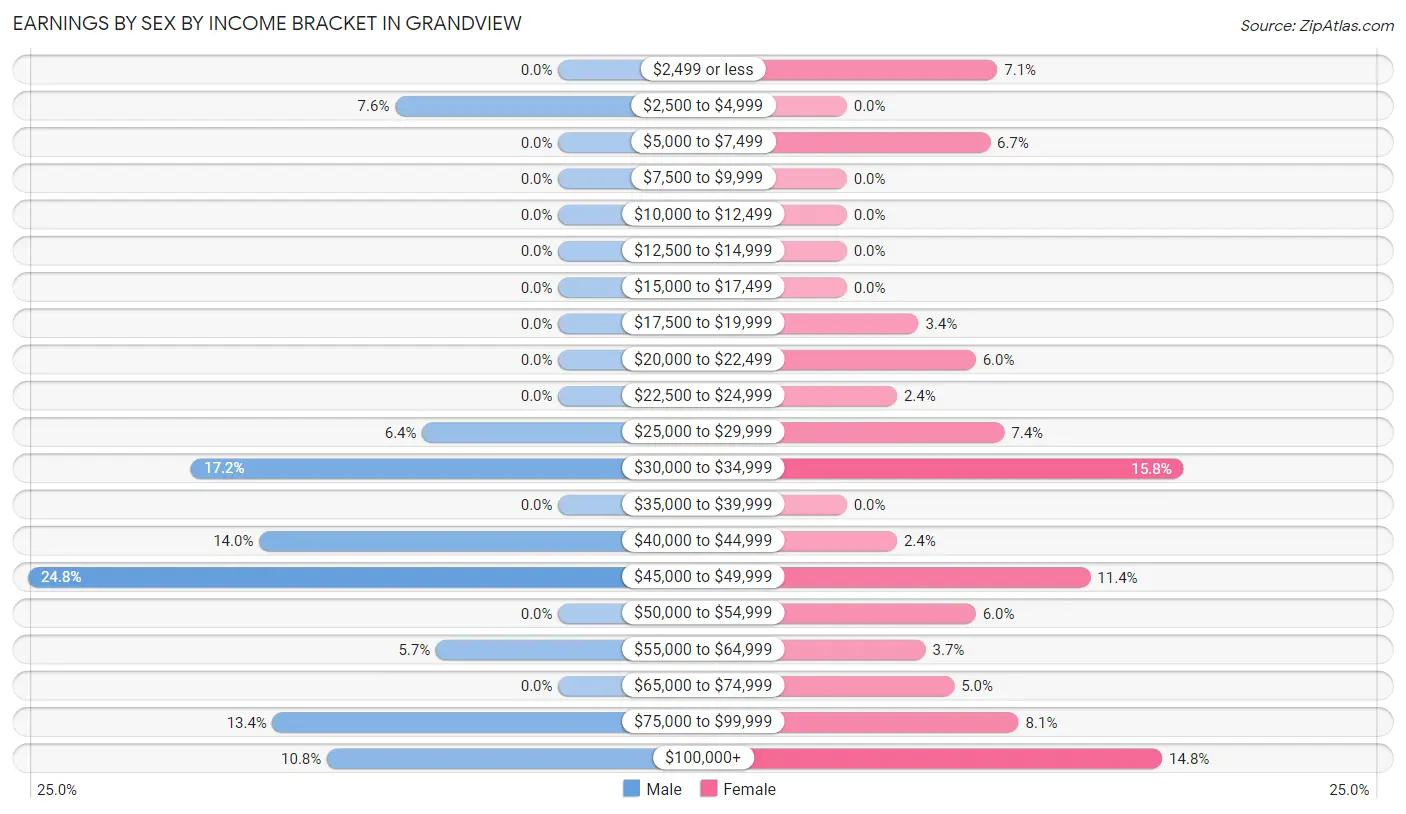
Earnings by Sex by Income Bracket in Grandview
The most common earnings brackets in Grandview are $45,000 to $49,999 for men (39 | 24.8%) and $30,000 to $34,999 for women (47 | 15.8%).
| Income | Male | Female |
| $2,499 or less | 0 (0.0%) | 21 (7.0%) |
| $2,500 to $4,999 | 12 (7.6%) | 0 (0.0%) |
| $5,000 to $7,499 | 0 (0.0%) | 20 (6.7%) |
| $7,500 to $9,999 | 0 (0.0%) | 0 (0.0%) |
| $10,000 to $12,499 | 0 (0.0%) | 0 (0.0%) |
| $12,500 to $14,999 | 0 (0.0%) | 0 (0.0%) |
| $15,000 to $17,499 | 0 (0.0%) | 0 (0.0%) |
| $17,500 to $19,999 | 0 (0.0%) | 10 (3.4%) |
| $20,000 to $22,499 | 0 (0.0%) | 18 (6.0%) |
| $22,500 to $24,999 | 0 (0.0%) | 7 (2.4%) |
| $25,000 to $29,999 | 10 (6.4%) | 22 (7.4%) |
| $30,000 to $34,999 | 27 (17.2%) | 47 (15.8%) |
| $35,000 to $39,999 | 0 (0.0%) | 0 (0.0%) |
| $40,000 to $44,999 | 22 (14.0%) | 7 (2.4%) |
| $45,000 to $49,999 | 39 (24.8%) | 34 (11.4%) |
| $50,000 to $54,999 | 0 (0.0%) | 18 (6.0%) |
| $55,000 to $64,999 | 9 (5.7%) | 11 (3.7%) |
| $65,000 to $74,999 | 0 (0.0%) | 15 (5.0%) |
| $75,000 to $99,999 | 21 (13.4%) | 24 (8.1%) |
| $100,000+ | 17 (10.8%) | 44 (14.8%) |
| Total | 157 (100.0%) | 298 (100.0%) |
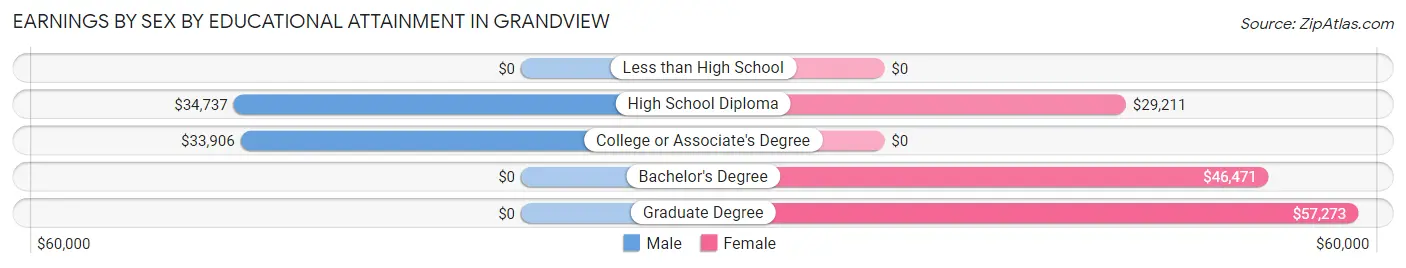
Earnings by Sex by Educational Attainment in Grandview
Average earnings in Grandview are $47,639 for men and $41,429 for women, a difference of 13.0%. Men with an educational attainment of high school diploma enjoy the highest average annual earnings of $34,737, while those with college or associate's degree education earn the least with $33,906. Women with an educational attainment of graduate degree earn the most with the average annual earnings of $57,273, while those with high school diploma education have the smallest earnings of $29,211.
| Educational Attainment | Male Income | Female Income |
| Less than High School | - | - |
| High School Diploma | $34,737 | $29,211 |
| College or Associate's Degree | $33,906 | $0 |
| Bachelor's Degree | - | - |
| Graduate Degree | - | - |
| Total | $47,639 | $41,429 |
Family Income in Grandview
Family Income Brackets in Grandview
According to the Grandview family income data, there are 77 families falling into the $50,000 to $74,999 income range, which is the most common income bracket and makes up 23.5% of all families.
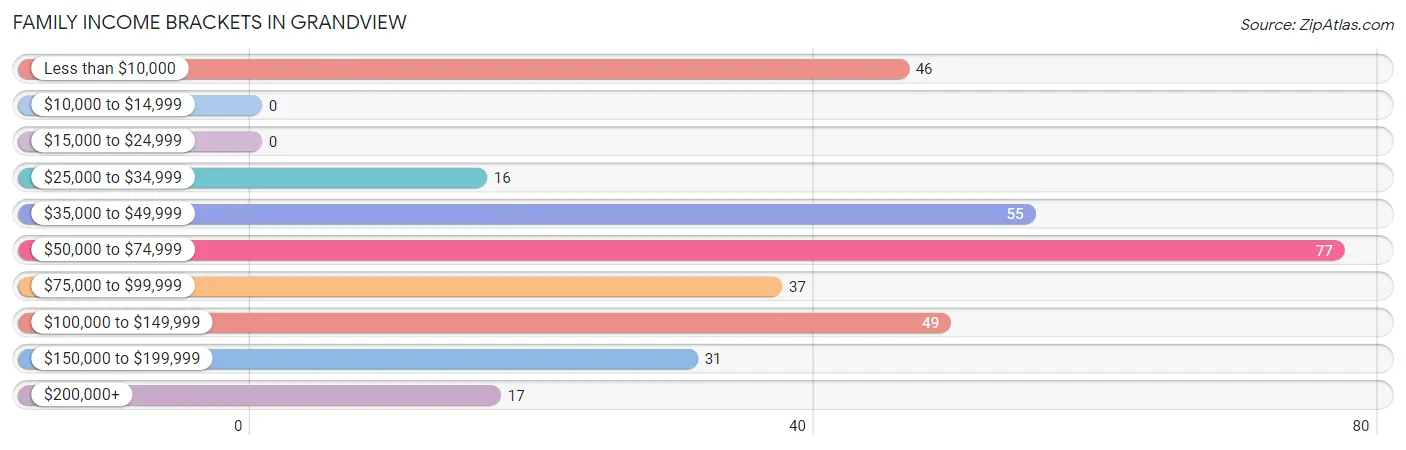
| Income Bracket | # Families | % Families |
| Less than $10,000 | 46 | 14.0% |
| $10,000 to $14,999 | 0 | 0.0% |
| $15,000 to $24,999 | 0 | 0.0% |
| $25,000 to $34,999 | 16 | 4.9% |
| $35,000 to $49,999 | 55 | 16.8% |
| $50,000 to $74,999 | 77 | 23.5% |
| $75,000 to $99,999 | 37 | 11.3% |
| $100,000 to $149,999 | 49 | 14.9% |
| $150,000 to $199,999 | 31 | 9.5% |
| $200,000+ | 17 | 5.2% |
Family Income by Famaliy Size in Grandview
2-person families (204 | 62.2%) account for the highest median family income in Grandview with $69,265 per family, while 2-person families (204 | 62.2%) have the highest median income of $34,632 per family member.
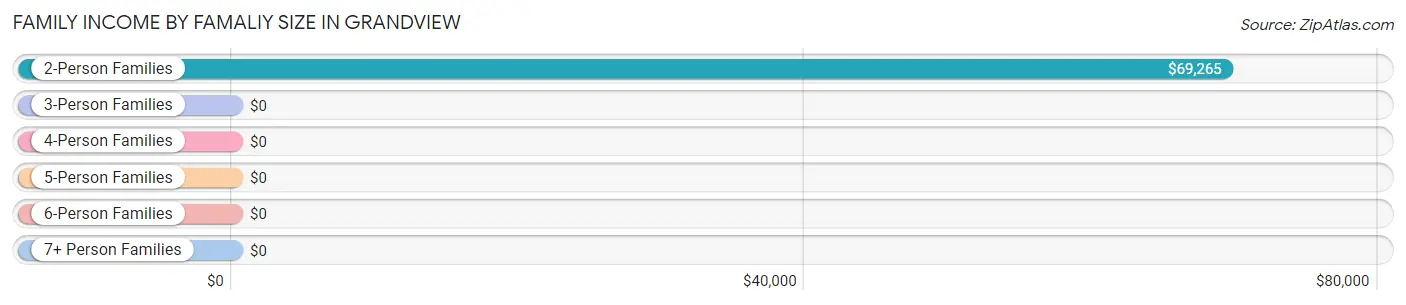
| Income Bracket | # Families | Median Income |
| 2-Person Families | 204 (62.2%) | $69,265 |
| 3-Person Families | 85 (25.9%) | $0 |
| 4-Person Families | 25 (7.6%) | $0 |
| 5-Person Families | 12 (3.7%) | $0 |
| 6-Person Families | 2 (0.6%) | $0 |
| 7+ Person Families | 0 (0.0%) | $0 |
| Total | 328 (100.0%) | $68,676 |
Family Income by Number of Earners in Grandview
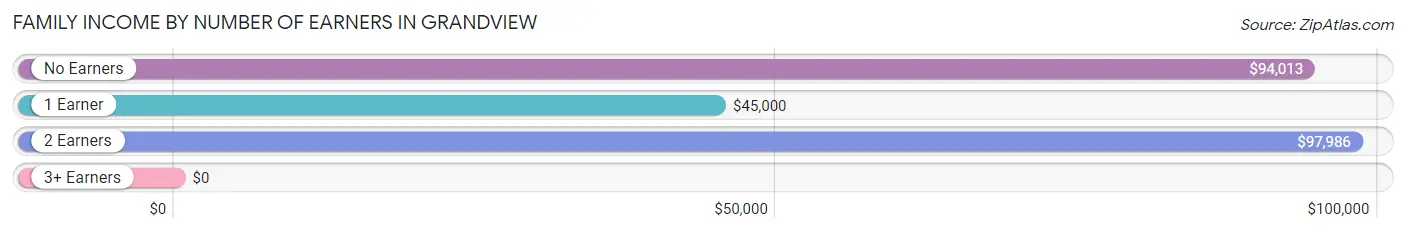
| Number of Earners | # Families | Median Income |
| No Earners | 95 (29.0%) | $94,013 |
| 1 Earner | 108 (32.9%) | $45,000 |
| 2 Earners | 123 (37.5%) | $97,986 |
| 3+ Earners | 2 (0.6%) | $0 |
| Total | 328 (100.0%) | $68,676 |
Household Income in Grandview
Household Income Brackets in Grandview
With 89 households falling in the category, the $50,000 to $74,999 income range is the most frequent in Grandview, accounting for 20.6% of all households.
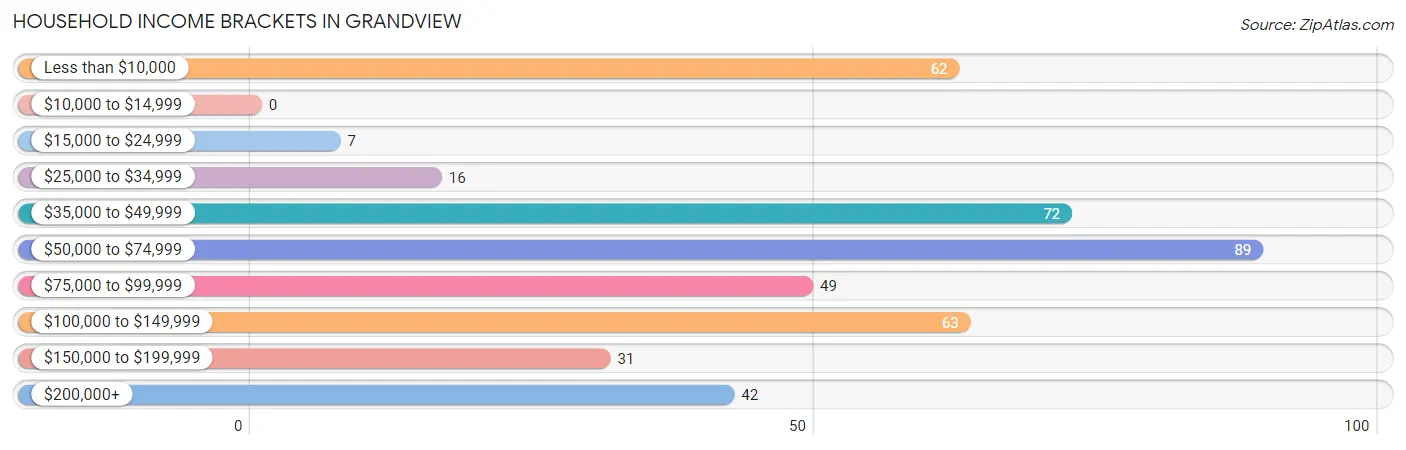
| Income Bracket | # Households | % Households |
| Less than $10,000 | 62 | 14.4% |
| $10,000 to $14,999 | 0 | 0.0% |
| $15,000 to $24,999 | 7 | 1.6% |
| $25,000 to $34,999 | 16 | 3.7% |
| $35,000 to $49,999 | 72 | 16.7% |
| $50,000 to $74,999 | 89 | 20.6% |
| $75,000 to $99,999 | 49 | 11.4% |
| $100,000 to $149,999 | 63 | 14.6% |
| $150,000 to $199,999 | 31 | 7.2% |
| $200,000+ | 42 | 9.7% |
Household Income by Householder Age in Grandview
The median household income in Grandview is $70,189, with the highest median household income of $93,684 found in the 65+ years age bracket for the primary householder. A total of 150 households (34.8%) fall into this category.
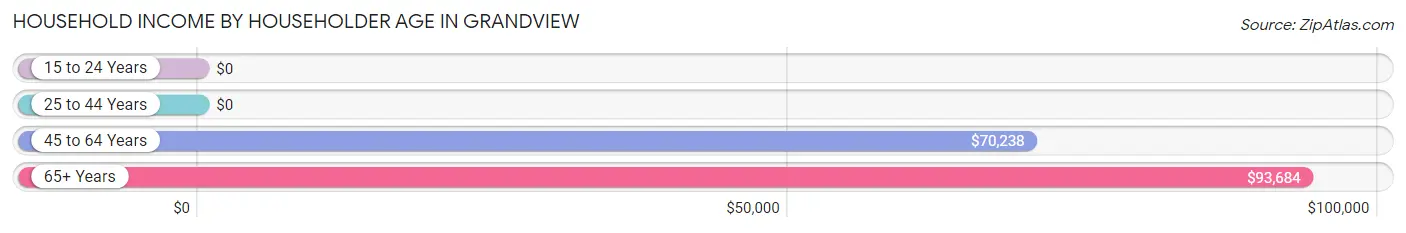
| Income Bracket | # Households | Median Income |
| 15 to 24 Years | 0 (0.0%) | $0 |
| 25 to 44 Years | 65 (15.1%) | $0 |
| 45 to 64 Years | 216 (50.1%) | $70,238 |
| 65+ Years | 150 (34.8%) | $93,684 |
| Total | 431 (100.0%) | $70,189 |
Poverty in Grandview
Income Below Poverty by Sex and Age in Grandview
With 22.2% poverty level for males and 15.5% for females among the residents of Grandview, 12 to 14 year old males and 12 to 14 year old females are the most vulnerable to poverty, with 75 males (84.3%) and 26 females (92.9%) in their respective age groups living below the poverty level.
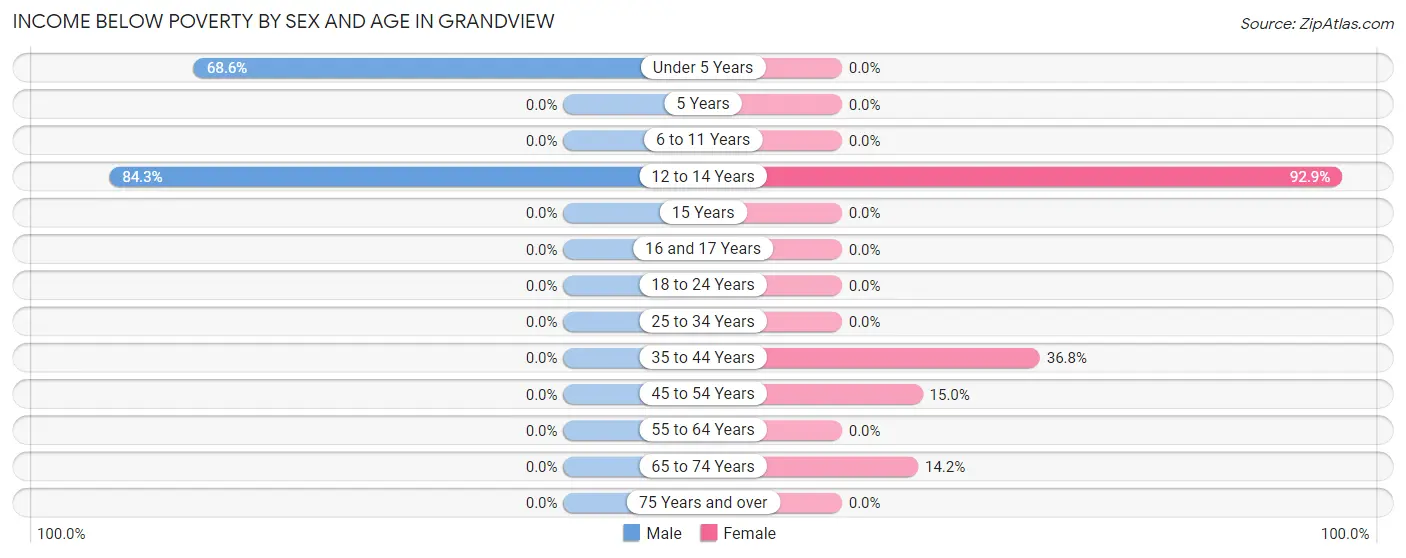
| Age Bracket | Male | Female |
| Under 5 Years | 24 (68.6%) | 0 (0.0%) |
| 5 Years | 0 (0.0%) | 0 (0.0%) |
| 6 to 11 Years | 0 (0.0%) | 0 (0.0%) |
| 12 to 14 Years | 75 (84.3%) | 26 (92.9%) |
| 15 Years | 0 (0.0%) | 0 (0.0%) |
| 16 and 17 Years | 0 (0.0%) | 0 (0.0%) |
| 18 to 24 Years | 0 (0.0%) | 0 (0.0%) |
| 25 to 34 Years | 0 (0.0%) | 0 (0.0%) |
| 35 to 44 Years | 0 (0.0%) | 25 (36.8%) |
| 45 to 54 Years | 0 (0.0%) | 21 (15.0%) |
| 55 to 64 Years | 0 (0.0%) | 0 (0.0%) |
| 65 to 74 Years | 0 (0.0%) | 16 (14.2%) |
| 75 Years and over | 0 (0.0%) | 0 (0.0%) |
| Total | 99 (22.2%) | 88 (15.5%) |
Income Above Poverty by Sex and Age in Grandview
According to the poverty statistics in Grandview, males aged 5 years and females aged under 5 years are the age groups that are most secure financially, with 100.0% of males and 100.0% of females in these age groups living above the poverty line.
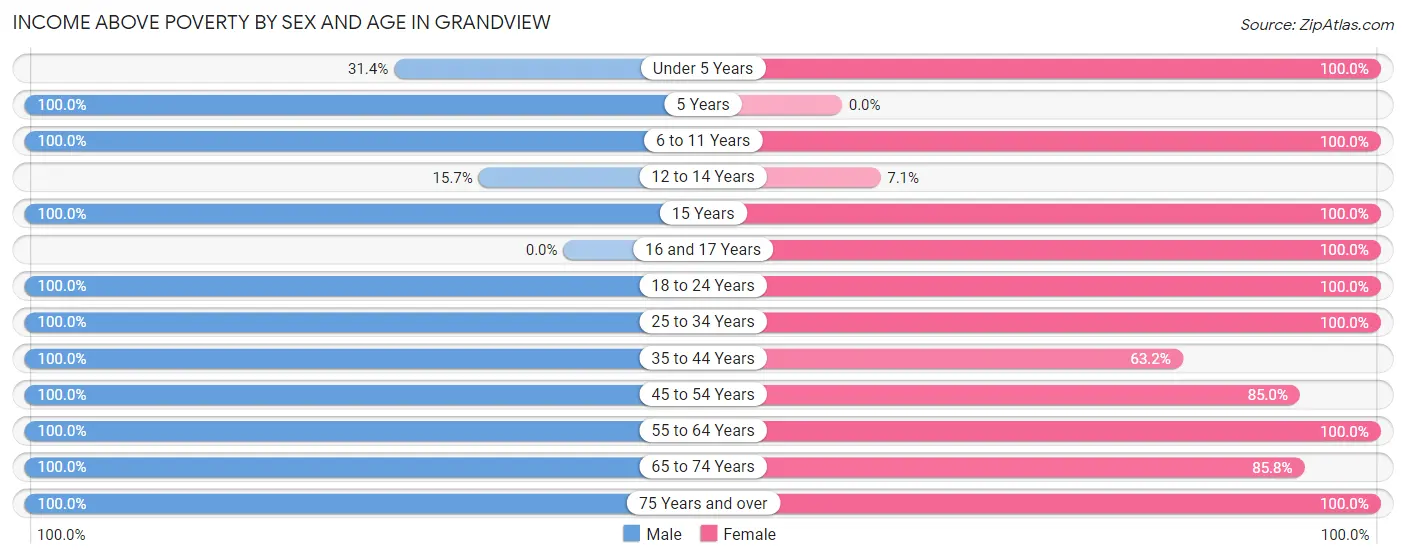
| Age Bracket | Male | Female |
| Under 5 Years | 11 (31.4%) | 1 (100.0%) |
| 5 Years | 13 (100.0%) | 0 (0.0%) |
| 6 to 11 Years | 23 (100.0%) | 21 (100.0%) |
| 12 to 14 Years | 14 (15.7%) | 2 (7.1%) |
| 15 Years | 12 (100.0%) | 19 (100.0%) |
| 16 and 17 Years | 0 (0.0%) | 22 (100.0%) |
| 18 to 24 Years | 12 (100.0%) | 20 (100.0%) |
| 25 to 34 Years | 10 (100.0%) | 12 (100.0%) |
| 35 to 44 Years | 12 (100.0%) | 43 (63.2%) |
| 45 to 54 Years | 59 (100.0%) | 119 (85.0%) |
| 55 to 64 Years | 83 (100.0%) | 59 (100.0%) |
| 65 to 74 Years | 79 (100.0%) | 97 (85.8%) |
| 75 Years and over | 19 (100.0%) | 63 (100.0%) |
| Total | 347 (77.8%) | 478 (84.5%) |
Income Below Poverty Among Married-Couple Families in Grandview
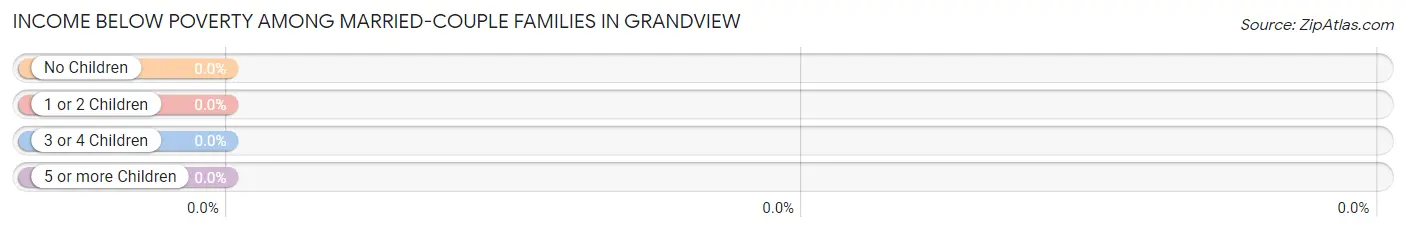
| Children | Above Poverty | Below Poverty |
| No Children | 179 (100.0%) | 0 (0.0%) |
| 1 or 2 Children | 30 (100.0%) | 0 (0.0%) |
| 3 or 4 Children | 2 (100.0%) | 0 (0.0%) |
| 5 or more Children | 0 (0.0%) | 0 (0.0%) |
| Total | 211 (100.0%) | 0 (0.0%) |
Income Below Poverty Among Single-Parent Households in Grandview
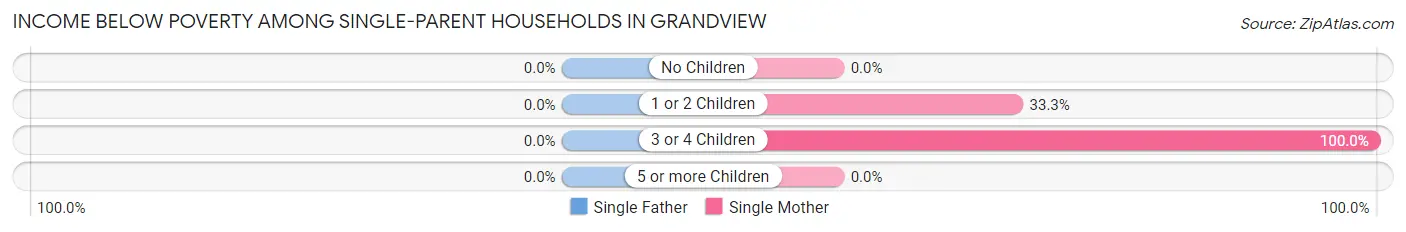
| Children | Single Father | Single Mother |
| No Children | 0 (0.0%) | 0 (0.0%) |
| 1 or 2 Children | 0 (0.0%) | 21 (33.3%) |
| 3 or 4 Children | 0 (0.0%) | 25 (100.0%) |
| 5 or more Children | 0 (0.0%) | 0 (0.0%) |
| Total | 0 (0.0%) | 46 (52.3%) |
Income Below Poverty Among Married-Couple vs Single-Parent Households in Grandview
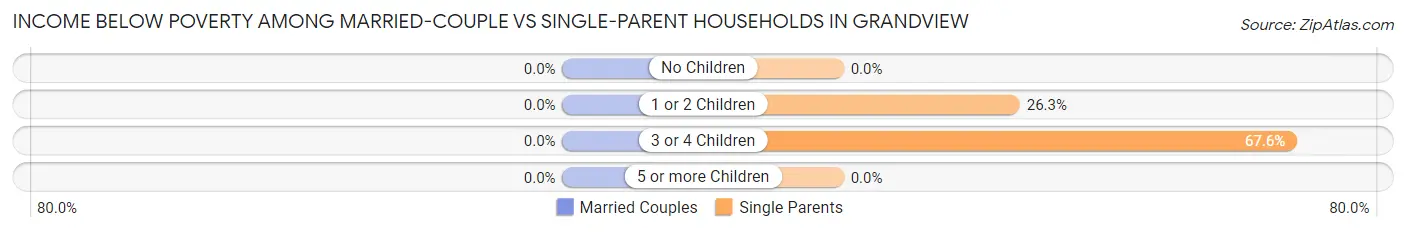
| Children | Married-Couple Families | Single-Parent Households |
| No Children | 0 (0.0%) | 0 (0.0%) |
| 1 or 2 Children | 0 (0.0%) | 21 (26.3%) |
| 3 or 4 Children | 0 (0.0%) | 25 (67.6%) |
| 5 or more Children | 0 (0.0%) | 0 (0.0%) |
| Total | 0 (0.0%) | 46 (39.3%) |
Race in Grandview
The most populous races in Grandview are White / Caucasian (501 | 49.5%), Native / Alaskan (312 | 30.8%), and Two or more Races (131 | 12.9%).
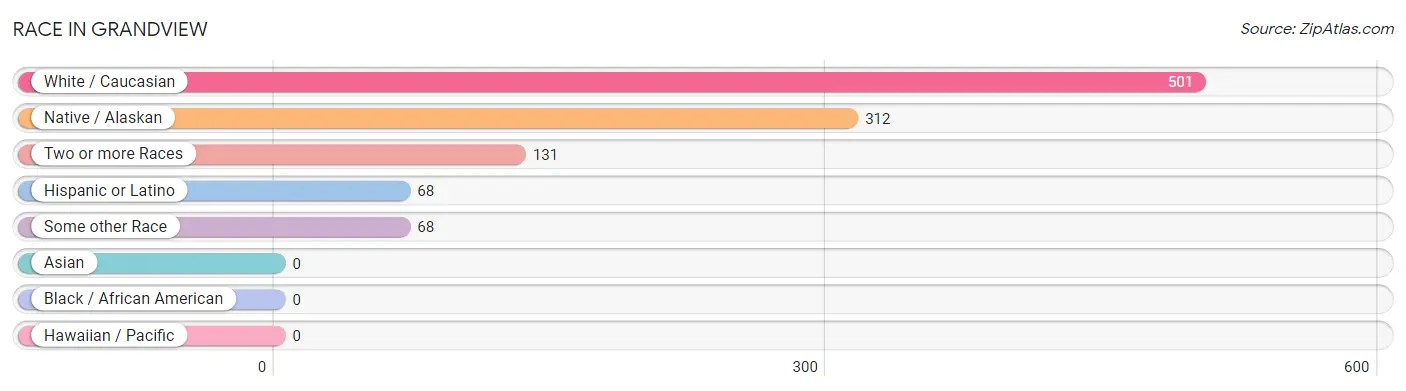
| Race | # Population | % Population |
| Asian | 0 | 0.0% |
| Black / African American | 0 | 0.0% |
| Hawaiian / Pacific | 0 | 0.0% |
| Hispanic or Latino | 68 | 6.7% |
| Native / Alaskan | 312 | 30.8% |
| White / Caucasian | 501 | 49.5% |
| Two or more Races | 131 | 12.9% |
| Some other Race | 68 | 6.7% |
| Total | 1,012 | 100.0% |
Ancestry in Grandview
The most populous ancestries reported in Grandview are Cherokee (312 | 30.8%), English (91 | 9.0%), Norwegian (85 | 8.4%), Mexican (68 | 6.7%), and Irish (47 | 4.6%), together accounting for 59.6% of all Grandview residents.
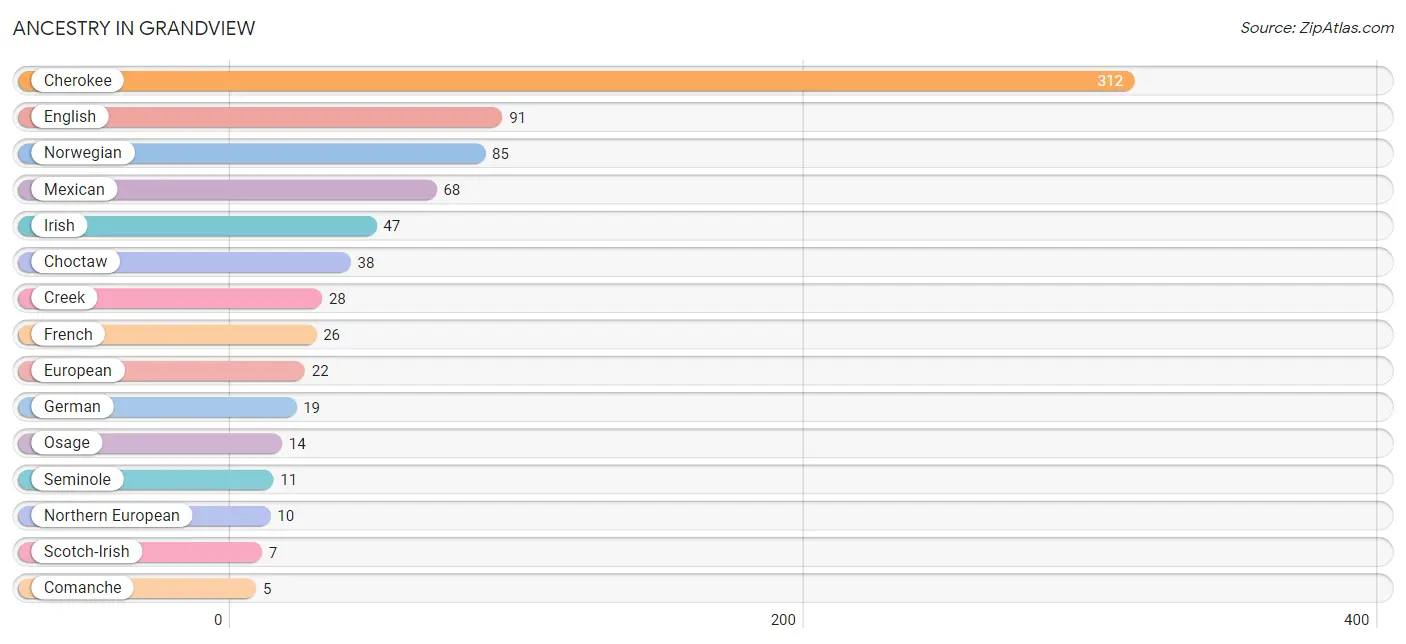
| Ancestry | # Population | % Population |
| Cherokee | 312 | 30.8% |
| Choctaw | 38 | 3.7% |
| Comanche | 5 | 0.5% |
| Creek | 28 | 2.8% |
| Dutch | 2 | 0.2% |
| English | 91 | 9.0% |
| European | 22 | 2.2% |
| French | 26 | 2.6% |
| German | 19 | 1.9% |
| Irish | 47 | 4.6% |
| Mexican | 68 | 6.7% |
| Northern European | 10 | 1.0% |
| Norwegian | 85 | 8.4% |
| Osage | 14 | 1.4% |
| Scotch-Irish | 7 | 0.7% |
| Scottish | 1 | 0.1% |
| Seminole | 11 | 1.1% | View All 17 Rows |
Immigrants in Grandview
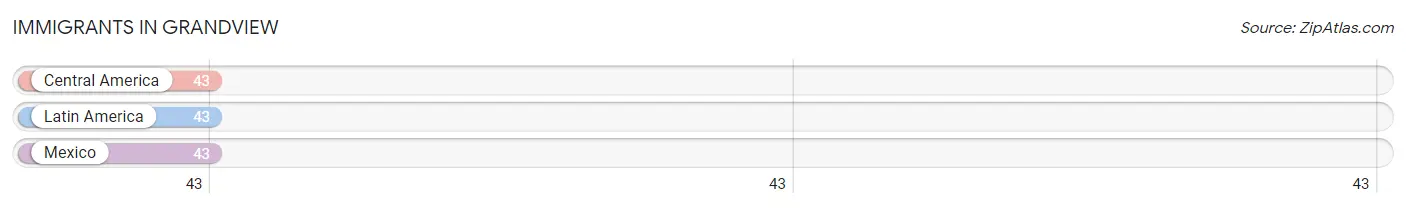
The most numerous immigrant groups reported in Grandview came from Central America (43 | 4.3%), Latin America (43 | 4.3%), and Mexico (43 | 4.3%), together accounting for 12.8% of all Grandview residents.
| Immigration Origin | # Population | % Population |
| Central America | 43 | 4.3% |
| Latin America | 43 | 4.3% |
| Mexico | 43 | 4.3% | View All 3 Rows |
Sex and Age in Grandview
Sex and Age in Grandview
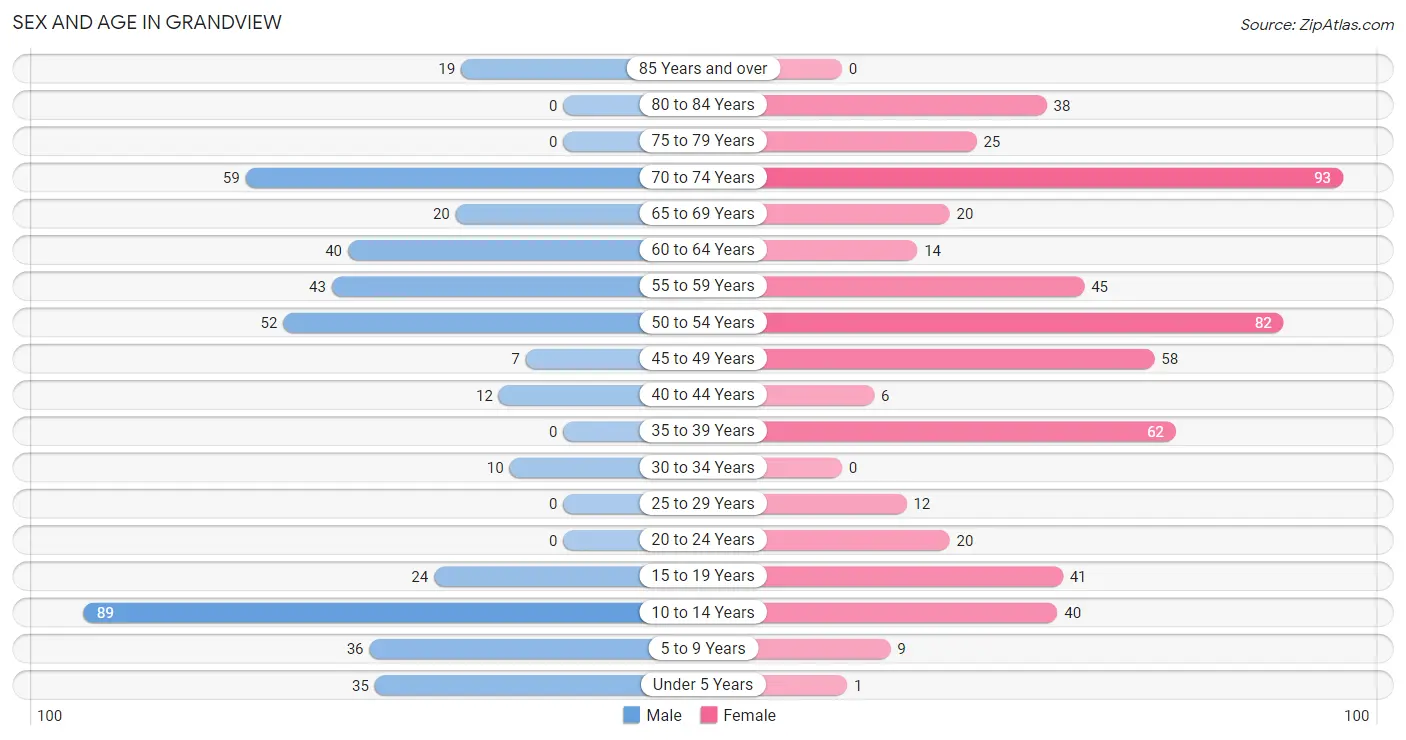
The most populous age groups in Grandview are 10 to 14 Years (89 | 20.0%) for men and 70 to 74 Years (93 | 16.4%) for women.
| Age Bracket | Male | Female |
| Under 5 Years | 35 (7.9%) | 1 (0.2%) |
| 5 to 9 Years | 36 (8.1%) | 9 (1.6%) |
| 10 to 14 Years | 89 (20.0%) | 40 (7.1%) |
| 15 to 19 Years | 24 (5.4%) | 41 (7.2%) |
| 20 to 24 Years | 0 (0.0%) | 20 (3.5%) |
| 25 to 29 Years | 0 (0.0%) | 12 (2.1%) |
| 30 to 34 Years | 10 (2.2%) | 0 (0.0%) |
| 35 to 39 Years | 0 (0.0%) | 62 (11.0%) |
| 40 to 44 Years | 12 (2.7%) | 6 (1.1%) |
| 45 to 49 Years | 7 (1.6%) | 58 (10.2%) |
| 50 to 54 Years | 52 (11.7%) | 82 (14.5%) |
| 55 to 59 Years | 43 (9.6%) | 45 (8.0%) |
| 60 to 64 Years | 40 (9.0%) | 14 (2.5%) |
| 65 to 69 Years | 20 (4.5%) | 20 (3.5%) |
| 70 to 74 Years | 59 (13.2%) | 93 (16.4%) |
| 75 to 79 Years | 0 (0.0%) | 25 (4.4%) |
| 80 to 84 Years | 0 (0.0%) | 38 (6.7%) |
| 85 Years and over | 19 (4.3%) | 0 (0.0%) |
| Total | 446 (100.0%) | 566 (100.0%) |
Families and Households in Grandview
Median Family Size in Grandview
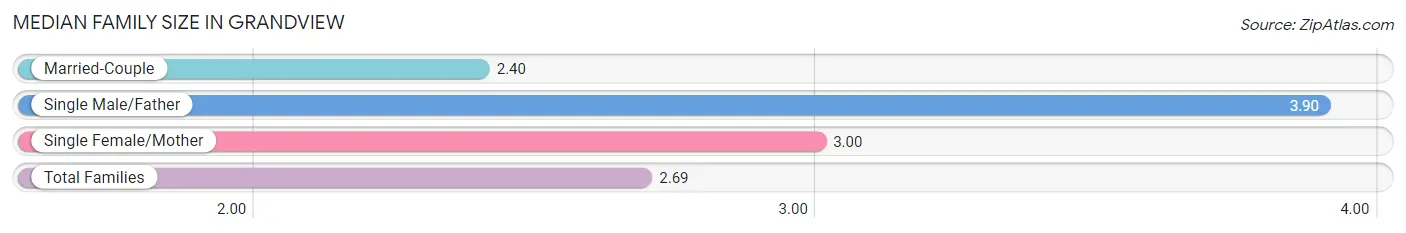
The median family size in Grandview is 2.69 persons per family, with single male/father families (29 | 8.8%) accounting for the largest median family size of 3.9 persons per family. On the other hand, married-couple families (211 | 64.3%) represent the smallest median family size with 2.40 persons per family.
| Family Type | # Families | Family Size |
| Married-Couple | 211 (64.3%) | 2.40 |
| Single Male/Father | 29 (8.8%) | 3.90 |
| Single Female/Mother | 88 (26.8%) | 3.00 |
| Total Families | 328 (100.0%) | 2.69 |
Median Household Size in Grandview
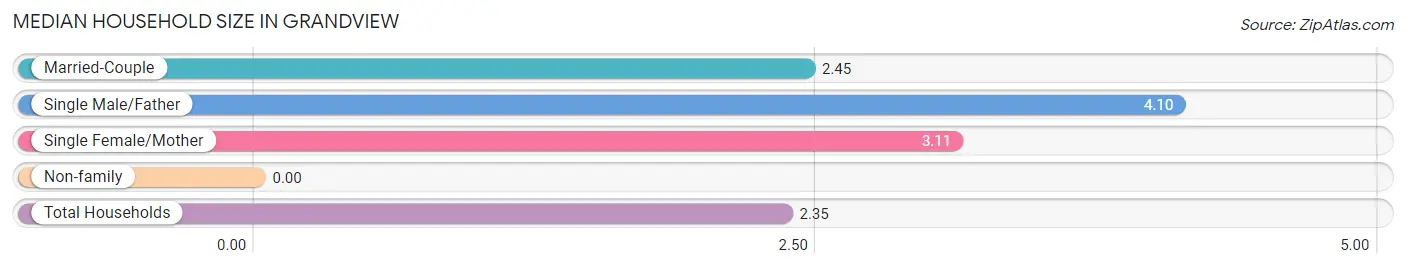
| Household Type | # Households | Household Size |
| Married-Couple | 211 (49.0%) | 2.45 |
| Single Male/Father | 29 (6.7%) | 4.10 |
| Single Female/Mother | 88 (20.4%) | 3.11 |
| Non-family | 103 (23.9%) | - |
| Total Households | 431 (100.0%) | 2.35 |
Household Size by Marriage Status in Grandview
Out of a total of 431 households in Grandview, 328 (76.1%) are family households, while 103 (23.9%) are nonfamily households. The most numerous type of family households are 2-person households, comprising 204, and the most common type of nonfamily households are 1-person households, comprising 103.
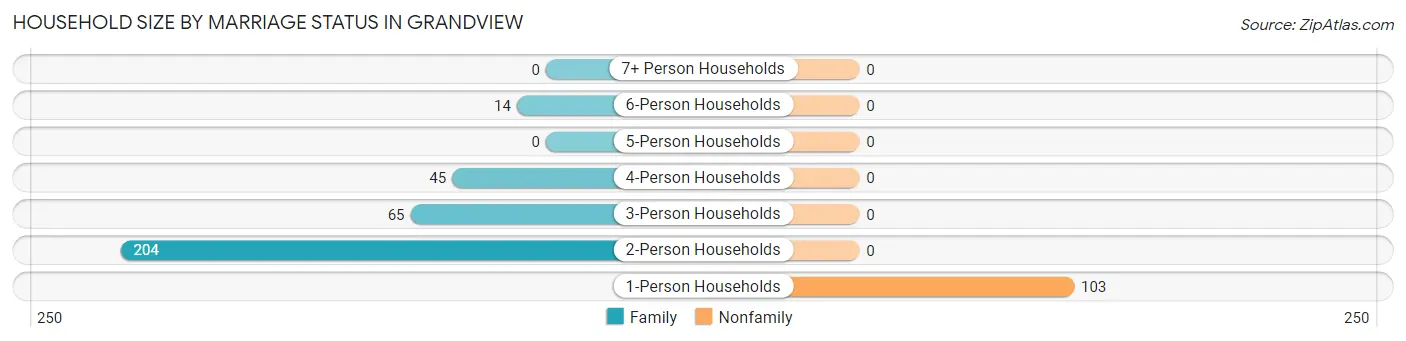
| Household Size | Family Households | Nonfamily Households |
| 1-Person Households | - | 103 (23.9%) |
| 2-Person Households | 204 (47.3%) | 0 (0.0%) |
| 3-Person Households | 65 (15.1%) | 0 (0.0%) |
| 4-Person Households | 45 (10.4%) | 0 (0.0%) |
| 5-Person Households | 0 (0.0%) | 0 (0.0%) |
| 6-Person Households | 14 (3.3%) | 0 (0.0%) |
| 7+ Person Households | 0 (0.0%) | 0 (0.0%) |
| Total | 328 (76.1%) | 103 (23.9%) |
Female Fertility in Grandview
Fertility by Age in Grandview
| Age Bracket | Women with Births | Births / 1,000 Women |
| 15 to 19 years | 0 (0.0%) | 0.0 |
| 20 to 34 years | 0 (0.0%) | 0.0 |
| 35 to 50 years | 0 (0.0%) | 0.0 |
| Total | 0 (0.0%) | 0.0 |
Fertility by Age by Marriage Status in Grandview
| Age Bracket | Married | Unmarried |
| 15 to 19 years | 0 (0.0%) | 0 (0.0%) |
| 20 to 34 years | 0 (0.0%) | 0 (0.0%) |
| 35 to 50 years | 0 (0.0%) | 0 (0.0%) |
| Total | 0 (0.0%) | 0 (0.0%) |
Fertility by Education in Grandview
| Educational Attainment | Women with Births | Births / 1,000 Women |
| Less than High School | 0 (0.0%) | 0.0 |
| High School Diploma | 0 (0.0%) | 0.0 |
| College or Associate's Degree | 0 (0.0%) | 0.0 |
| Bachelor's Degree | 0 (0.0%) | 0.0 |
| Graduate Degree | 0 (0.0%) | 0.0 |
| Total | 0 (0.0%) | 0.0 |
Fertility by Education by Marriage Status in Grandview
| Educational Attainment | Married | Unmarried |
| Less than High School | 0 (0.0%) | 0 (0.0%) |
| High School Diploma | 0 (0.0%) | 0 (0.0%) |
| College or Associate's Degree | 0 (0.0%) | 0 (0.0%) |
| Bachelor's Degree | 0 (0.0%) | 0 (0.0%) |
| Graduate Degree | 0 (0.0%) | 0 (0.0%) |
| Total | 0 (0.0%) | 0 (0.0%) |
Employment Characteristics in Grandview
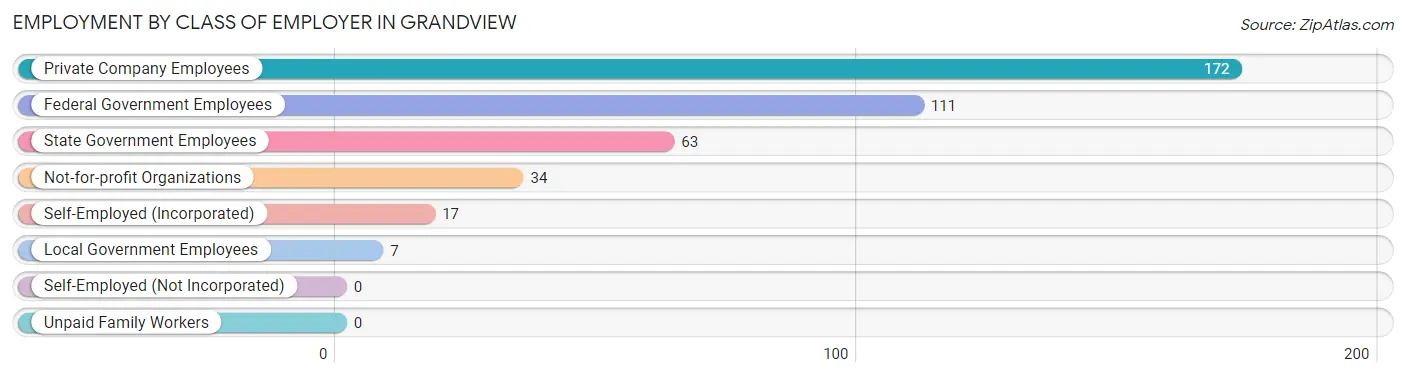
Employment by Class of Employer in Grandview
Among the 404 employed individuals in Grandview, private company employees (172 | 42.6%), federal government employees (111 | 27.5%), and state government employees (63 | 15.6%) make up the most common classes of employment.
| Employer Class | # Employees | % Employees |
| Private Company Employees | 172 | 42.6% |
| Self-Employed (Incorporated) | 17 | 4.2% |
| Self-Employed (Not Incorporated) | 0 | 0.0% |
| Not-for-profit Organizations | 34 | 8.4% |
| Local Government Employees | 7 | 1.7% |
| State Government Employees | 63 | 15.6% |
| Federal Government Employees | 111 | 27.5% |
| Unpaid Family Workers | 0 | 0.0% |
| Total | 404 | 100.0% |
Employment Status by Age in Grandview
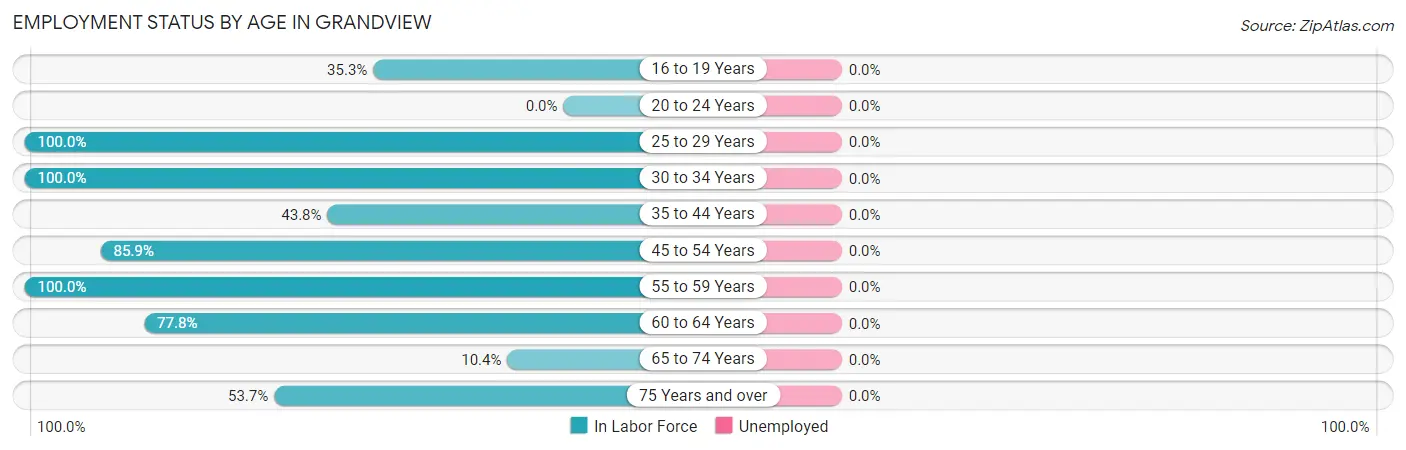
| Age Bracket | In Labor Force | Unemployed |
| 16 to 19 Years | 12 (35.3%) | 0 (0.0%) |
| 20 to 24 Years | 0 (0.0%) | 0 (0.0%) |
| 25 to 29 Years | 12 (100.0%) | 0 (0.0%) |
| 30 to 34 Years | 10 (100.0%) | 0 (0.0%) |
| 35 to 44 Years | 35 (43.8%) | 0 (0.0%) |
| 45 to 54 Years | 171 (85.9%) | 0 (0.0%) |
| 55 to 59 Years | 88 (100.0%) | 0 (0.0%) |
| 60 to 64 Years | 42 (77.8%) | 0 (0.0%) |
| 65 to 74 Years | 20 (10.4%) | 0 (0.0%) |
| 75 Years and over | 44 (53.7%) | 0 (0.0%) |
| Total | 434 (56.3%) | 0 (0.0%) |
Employment Status by Educational Attainment in Grandview
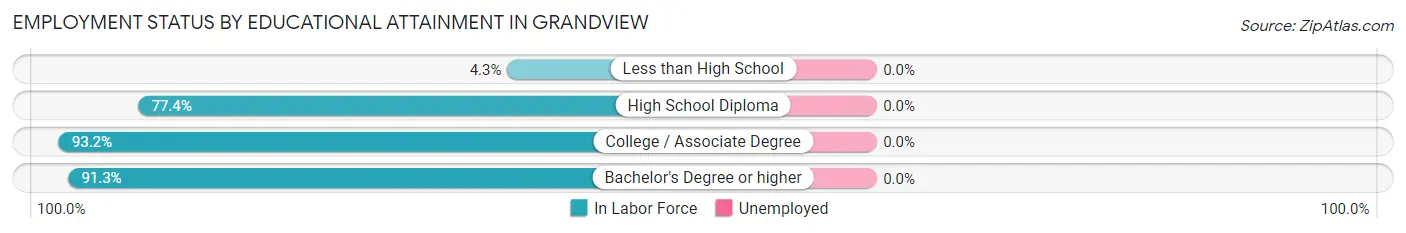
| Educational Attainment | In Labor Force | Unemployed |
| Less than High School | 2 (4.3%) | 0 (0.0%) |
| High School Diploma | 41 (77.4%) | 0 (0.0%) |
| College / Associate Degree | 96 (93.2%) | 0 (0.0%) |
| Bachelor's Degree or higher | 219 (91.3%) | 0 (0.0%) |
| Total | 358 (80.8%) | 0 (0.0%) |
Employment Occupations by Sex in Grandview
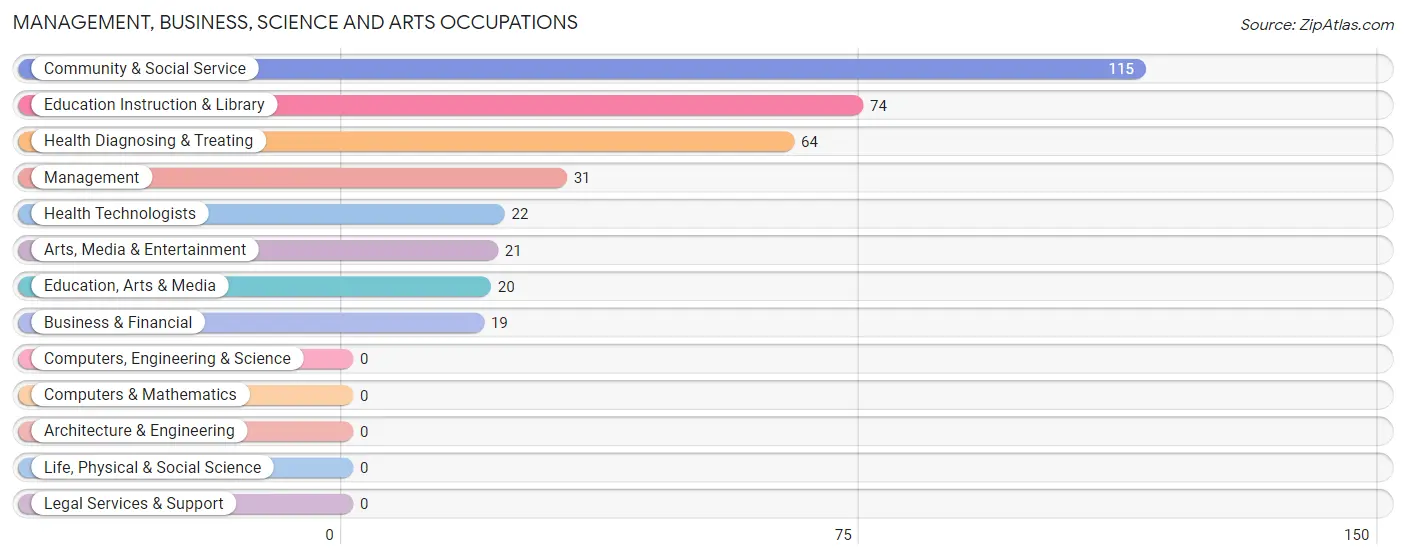
Management, Business, Science and Arts Occupations
The most common Management, Business, Science and Arts occupations in Grandview are Community & Social Service (115 | 26.5%), Education Instruction & Library (74 | 17.1%), Health Diagnosing & Treating (64 | 14.7%), Management (31 | 7.1%), and Health Technologists (22 | 5.1%).
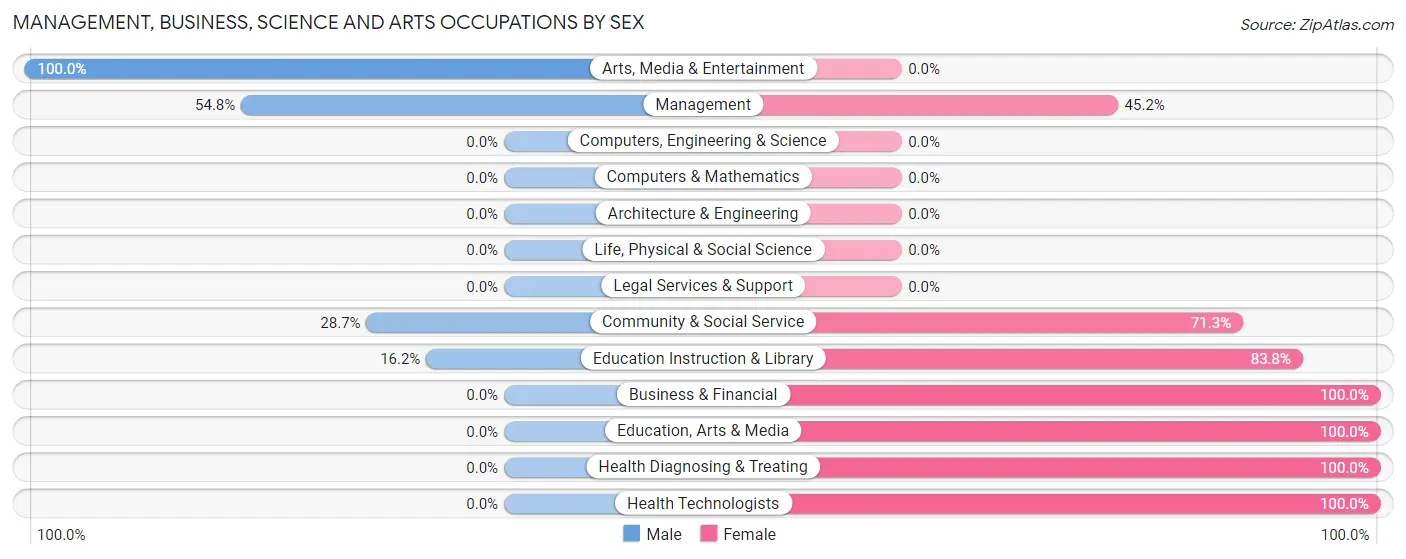
Management, Business, Science and Arts Occupations by Sex
Within the Management, Business, Science and Arts occupations in Grandview, the most male-oriented occupations are Arts, Media & Entertainment (100.0%), Management (54.8%), and Community & Social Service (28.7%), while the most female-oriented occupations are Business & Financial (100.0%), Education, Arts & Media (100.0%), and Health Diagnosing & Treating (100.0%).
| Occupation | Male | Female |
| Management | 17 (54.8%) | 14 (45.2%) |
| Business & Financial | 0 (0.0%) | 19 (100.0%) |
| Computers, Engineering & Science | 0 (0.0%) | 0 (0.0%) |
| Computers & Mathematics | 0 (0.0%) | 0 (0.0%) |
| Architecture & Engineering | 0 (0.0%) | 0 (0.0%) |
| Life, Physical & Social Science | 0 (0.0%) | 0 (0.0%) |
| Community & Social Service | 33 (28.7%) | 82 (71.3%) |
| Education, Arts & Media | 0 (0.0%) | 20 (100.0%) |
| Legal Services & Support | 0 (0.0%) | 0 (0.0%) |
| Education Instruction & Library | 12 (16.2%) | 62 (83.8%) |
| Arts, Media & Entertainment | 21 (100.0%) | 0 (0.0%) |
| Health Diagnosing & Treating | 0 (0.0%) | 64 (100.0%) |
| Health Technologists | 0 (0.0%) | 22 (100.0%) |
| Total (Category) | 50 (21.8%) | 179 (78.2%) |
| Total (Overall) | 157 (36.2%) | 277 (63.8%) |
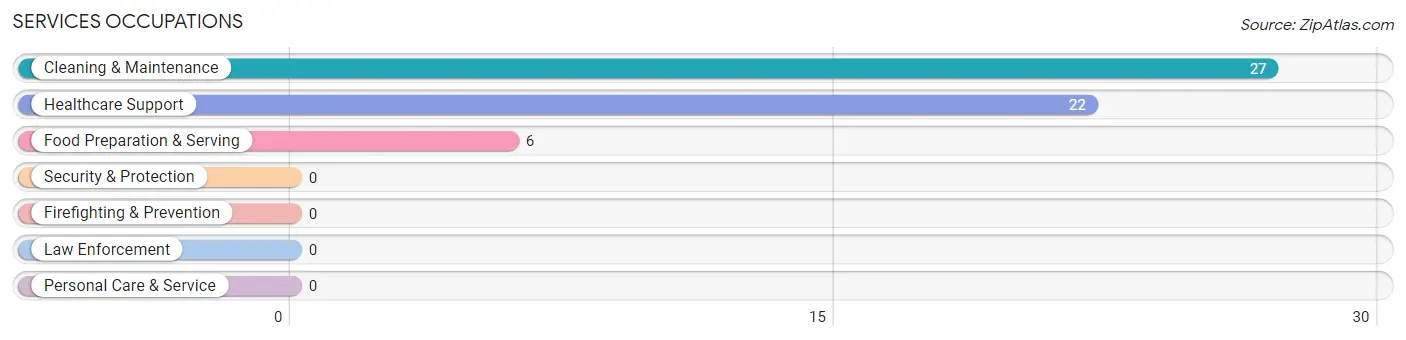
Services Occupations
The most common Services occupations in Grandview are Cleaning & Maintenance (27 | 6.2%), Healthcare Support (22 | 5.1%), and Food Preparation & Serving (6 | 1.4%).
Services Occupations by Sex
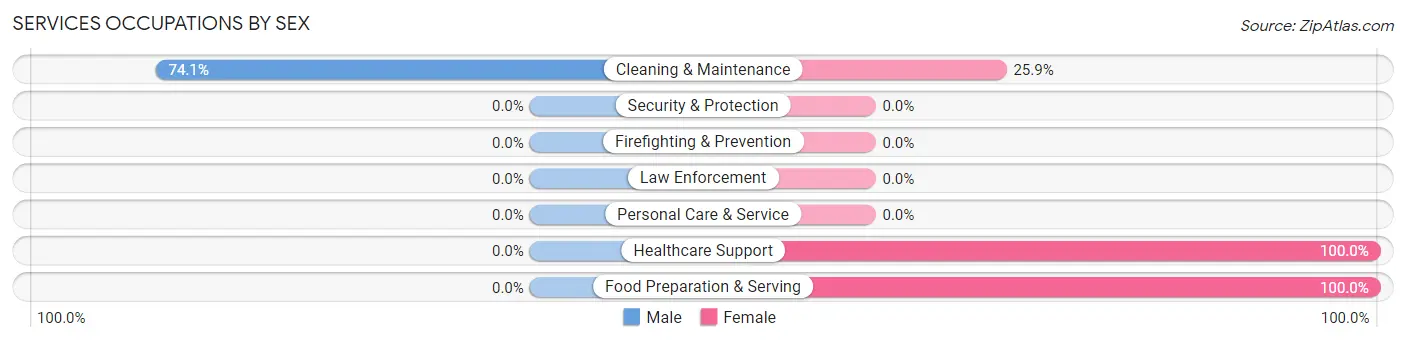
| Occupation | Male | Female |
| Healthcare Support | 0 (0.0%) | 22 (100.0%) |
| Security & Protection | 0 (0.0%) | 0 (0.0%) |
| Firefighting & Prevention | 0 (0.0%) | 0 (0.0%) |
| Law Enforcement | 0 (0.0%) | 0 (0.0%) |
| Food Preparation & Serving | 0 (0.0%) | 6 (100.0%) |
| Cleaning & Maintenance | 20 (74.1%) | 7 (25.9%) |
| Personal Care & Service | 0 (0.0%) | 0 (0.0%) |
| Total (Category) | 20 (36.4%) | 35 (63.6%) |
| Total (Overall) | 157 (36.2%) | 277 (63.8%) |
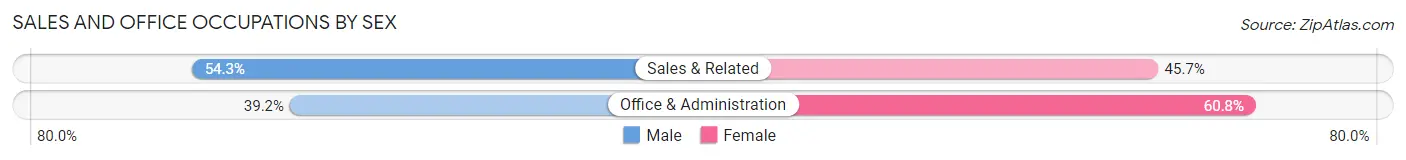
Sales and Office Occupations
The most common Sales and Office occupations in Grandview are Office & Administration (74 | 17.1%), and Sales & Related (35 | 8.1%).

Sales and Office Occupations by Sex
| Occupation | Male | Female |
| Sales & Related | 19 (54.3%) | 16 (45.7%) |
| Office & Administration | 29 (39.2%) | 45 (60.8%) |
| Total (Category) | 48 (44.0%) | 61 (56.0%) |
| Total (Overall) | 157 (36.2%) | 277 (63.8%) |
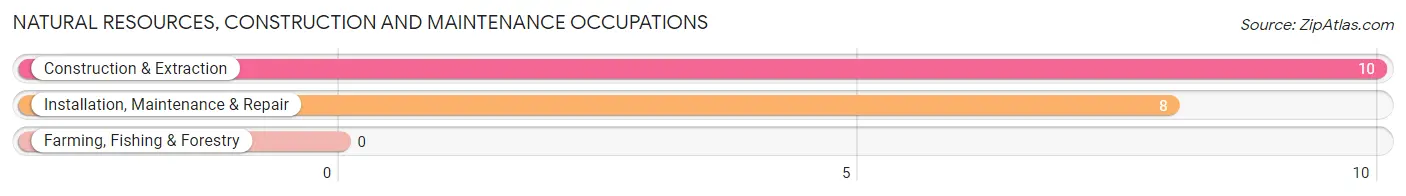
Natural Resources, Construction and Maintenance Occupations
The most common Natural Resources, Construction and Maintenance occupations in Grandview are Construction & Extraction (10 | 2.3%), and Installation, Maintenance & Repair (8 | 1.8%).
Natural Resources, Construction and Maintenance Occupations by Sex
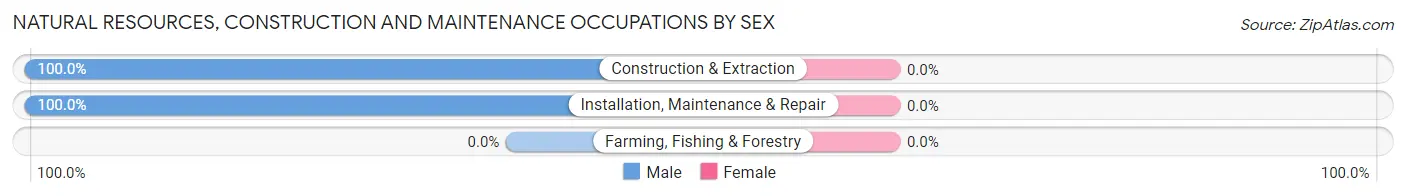
| Occupation | Male | Female |
| Farming, Fishing & Forestry | 0 (0.0%) | 0 (0.0%) |
| Construction & Extraction | 10 (100.0%) | 0 (0.0%) |
| Installation, Maintenance & Repair | 8 (100.0%) | 0 (0.0%) |
| Total (Category) | 18 (100.0%) | 0 (0.0%) |
| Total (Overall) | 157 (36.2%) | 277 (63.8%) |
Production, Transportation and Moving Occupations
The most common Production, Transportation and Moving occupations in Grandview are Production (21 | 4.8%), and Transportation (2 | 0.5%).
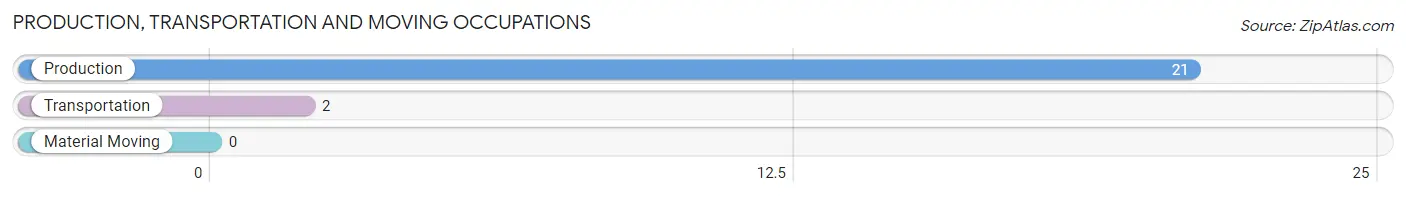
Production, Transportation and Moving Occupations by Sex
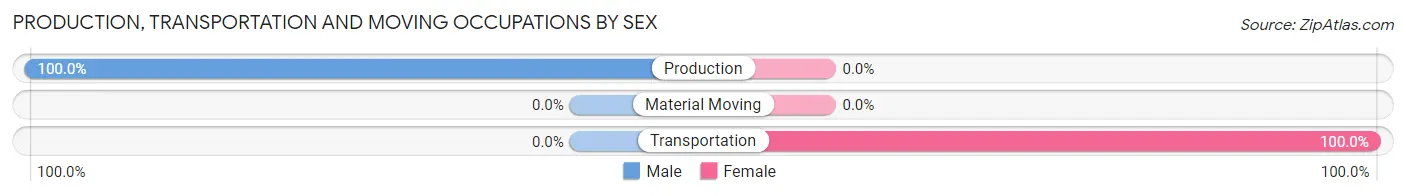
| Occupation | Male | Female |
| Production | 21 (100.0%) | 0 (0.0%) |
| Transportation | 0 (0.0%) | 2 (100.0%) |
| Material Moving | 0 (0.0%) | 0 (0.0%) |
| Total (Category) | 21 (91.3%) | 2 (8.7%) |
| Total (Overall) | 157 (36.2%) | 277 (63.8%) |
Employment Industries by Sex in Grandview
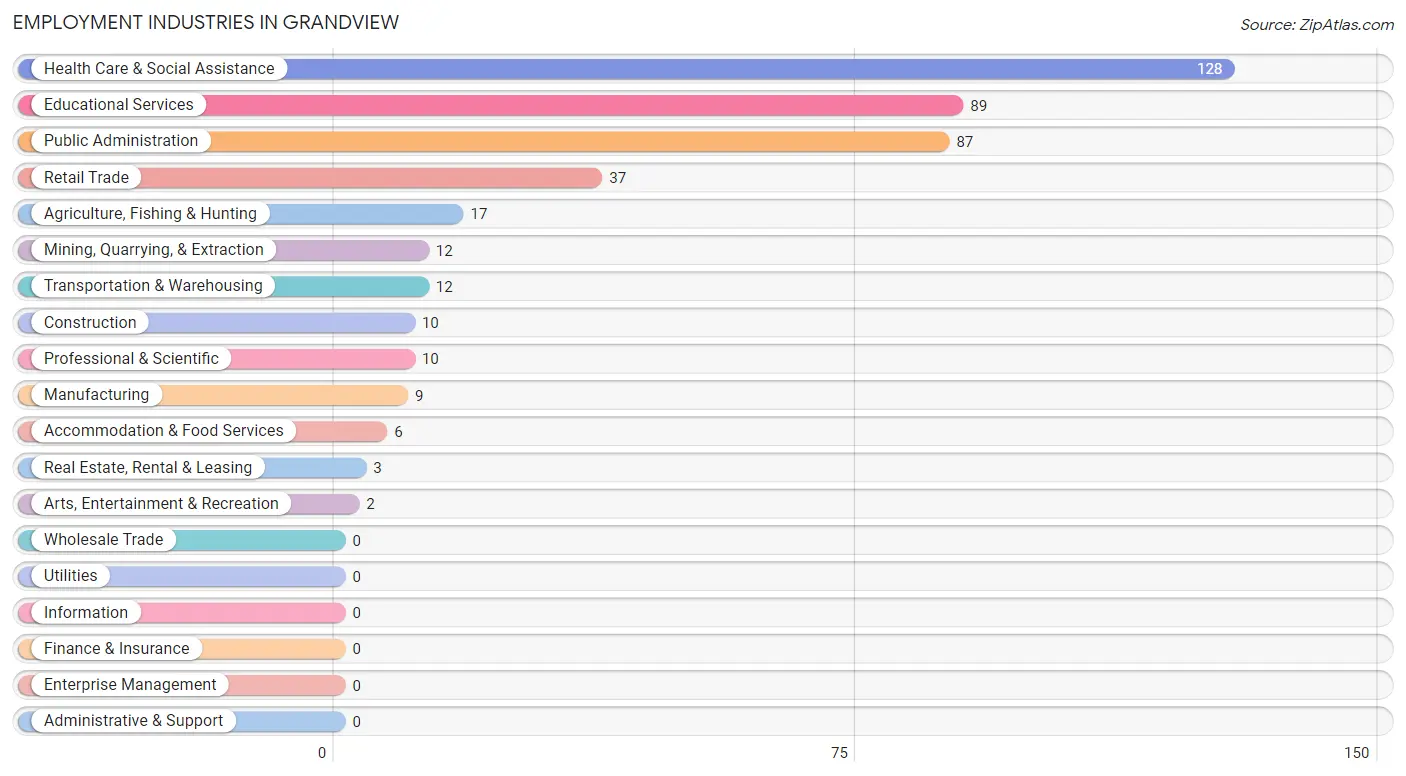
Employment Industries in Grandview
The major employment industries in Grandview include Health Care & Social Assistance (128 | 29.5%), Educational Services (89 | 20.5%), Public Administration (87 | 20.1%), Retail Trade (37 | 8.5%), and Agriculture, Fishing & Hunting (17 | 3.9%).
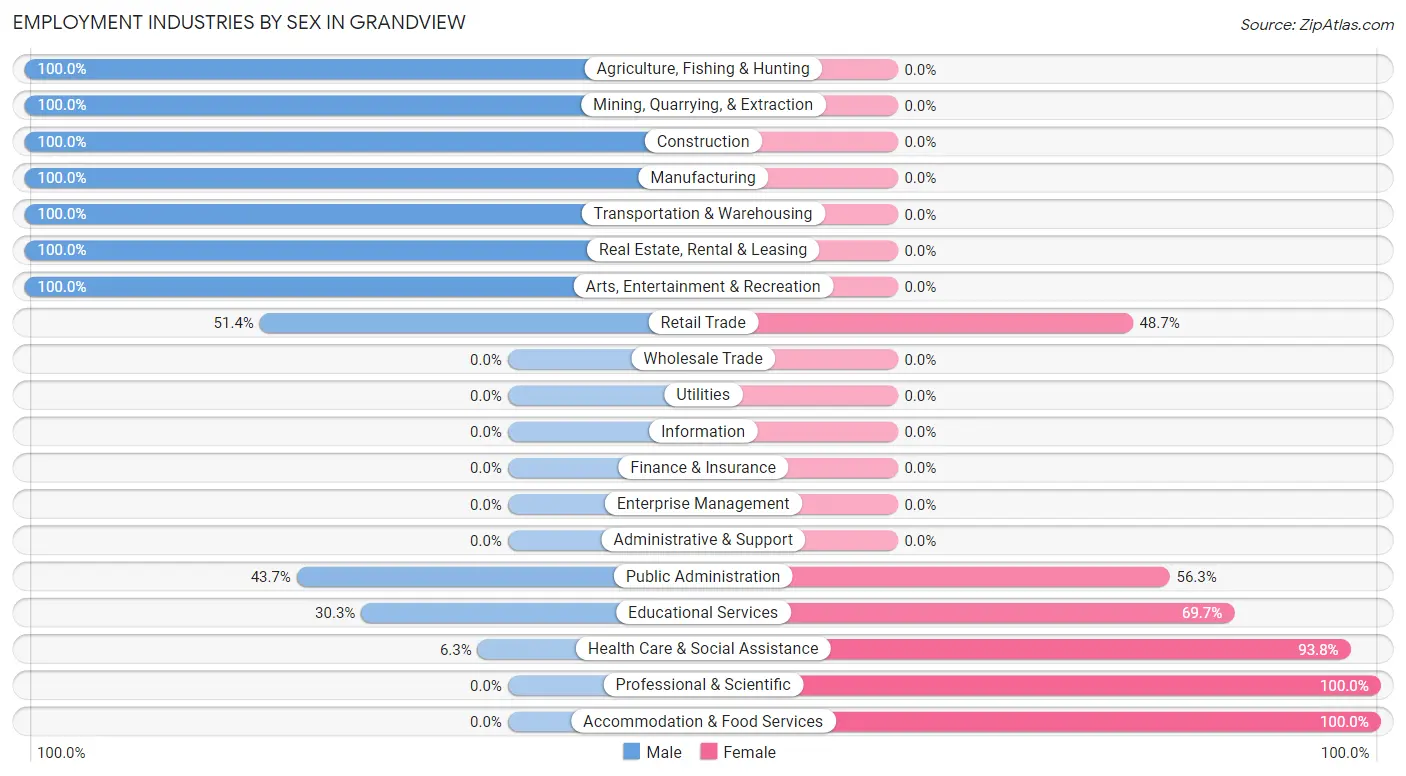
Employment Industries by Sex in Grandview
The Grandview industries that see more men than women are Agriculture, Fishing & Hunting (100.0%), Mining, Quarrying, & Extraction (100.0%), and Construction (100.0%), whereas the industries that tend to have a higher number of women are Professional & Scientific (100.0%), Accommodation & Food Services (100.0%), and Health Care & Social Assistance (93.8%).
| Industry | Male | Female |
| Agriculture, Fishing & Hunting | 17 (100.0%) | 0 (0.0%) |
| Mining, Quarrying, & Extraction | 12 (100.0%) | 0 (0.0%) |
| Construction | 10 (100.0%) | 0 (0.0%) |
| Manufacturing | 9 (100.0%) | 0 (0.0%) |
| Wholesale Trade | 0 (0.0%) | 0 (0.0%) |
| Retail Trade | 19 (51.3%) | 18 (48.6%) |
| Transportation & Warehousing | 12 (100.0%) | 0 (0.0%) |
| Utilities | 0 (0.0%) | 0 (0.0%) |
| Information | 0 (0.0%) | 0 (0.0%) |
| Finance & Insurance | 0 (0.0%) | 0 (0.0%) |
| Real Estate, Rental & Leasing | 3 (100.0%) | 0 (0.0%) |
| Professional & Scientific | 0 (0.0%) | 10 (100.0%) |
| Enterprise Management | 0 (0.0%) | 0 (0.0%) |
| Administrative & Support | 0 (0.0%) | 0 (0.0%) |
| Educational Services | 27 (30.3%) | 62 (69.7%) |
| Health Care & Social Assistance | 8 (6.2%) | 120 (93.8%) |
| Arts, Entertainment & Recreation | 2 (100.0%) | 0 (0.0%) |
| Accommodation & Food Services | 0 (0.0%) | 6 (100.0%) |
| Public Administration | 38 (43.7%) | 49 (56.3%) |
| Total | 157 (36.2%) | 277 (63.8%) |
Education in Grandview
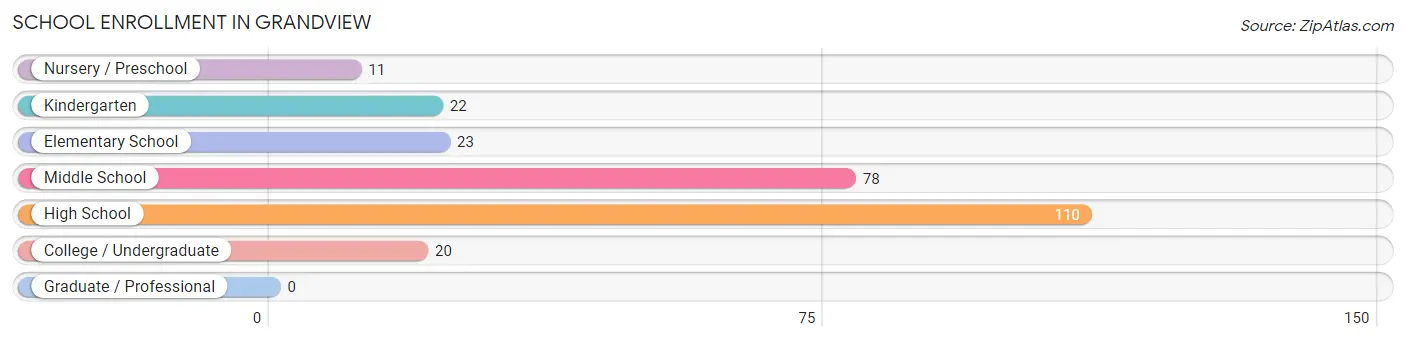
School Enrollment in Grandview
The most common levels of schooling among the 264 students in Grandview are high school (110 | 41.7%), middle school (78 | 29.5%), and elementary school (23 | 8.7%).
| School Level | # Students | % Students |
| Nursery / Preschool | 11 | 4.2% |
| Kindergarten | 22 | 8.3% |
| Elementary School | 23 | 8.7% |
| Middle School | 78 | 29.5% |
| High School | 110 | 41.7% |
| College / Undergraduate | 20 | 7.6% |
| Graduate / Professional | 0 | 0.0% |
| Total | 264 | 100.0% |
School Enrollment by Age by Funding Source in Grandview
Out of a total of 264 students who are enrolled in schools in Grandview, 19 (7.2%) attend a private institution, while the remaining 245 (92.8%) are enrolled in public schools. The age group of 15 to 17 year olds has the highest likelihood of being enrolled in private schools, with 19 (46.3% in the age bracket) enrolled. Conversely, the age group of 3 to 4 year olds has the lowest likelihood of being enrolled in a private school, with 11 (100.0% in the age bracket) attending a public institution.
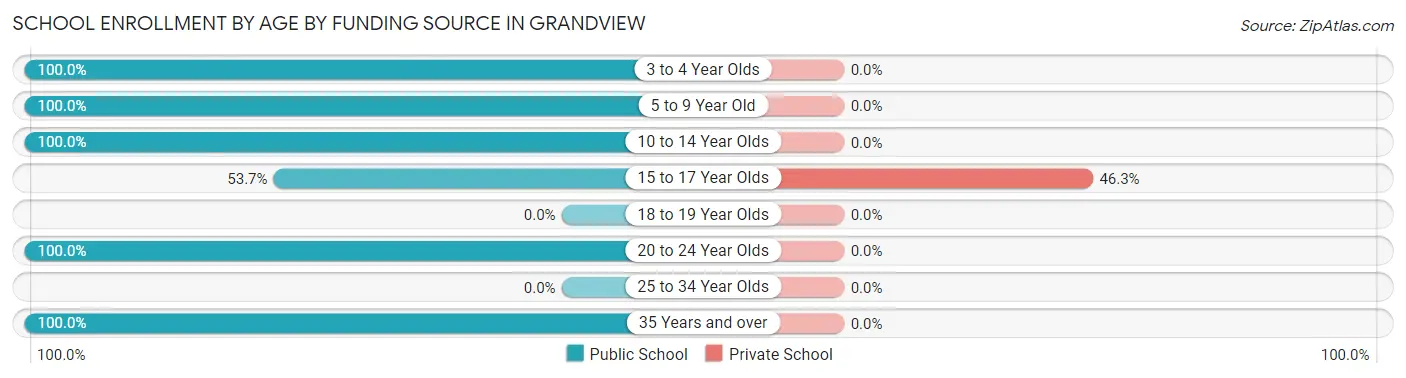
| Age Bracket | Public School | Private School |
| 3 to 4 Year Olds | 11 (100.0%) | 0 (0.0%) |
| 5 to 9 Year Old | 45 (100.0%) | 0 (0.0%) |
| 10 to 14 Year Olds | 127 (100.0%) | 0 (0.0%) |
| 15 to 17 Year Olds | 22 (53.7%) | 19 (46.3%) |
| 18 to 19 Year Olds | 0 (0.0%) | 0 (0.0%) |
| 20 to 24 Year Olds | 20 (100.0%) | 0 (0.0%) |
| 25 to 34 Year Olds | 0 (0.0%) | 0 (0.0%) |
| 35 Years and over | 20 (100.0%) | 0 (0.0%) |
| Total | 245 (92.8%) | 19 (7.2%) |
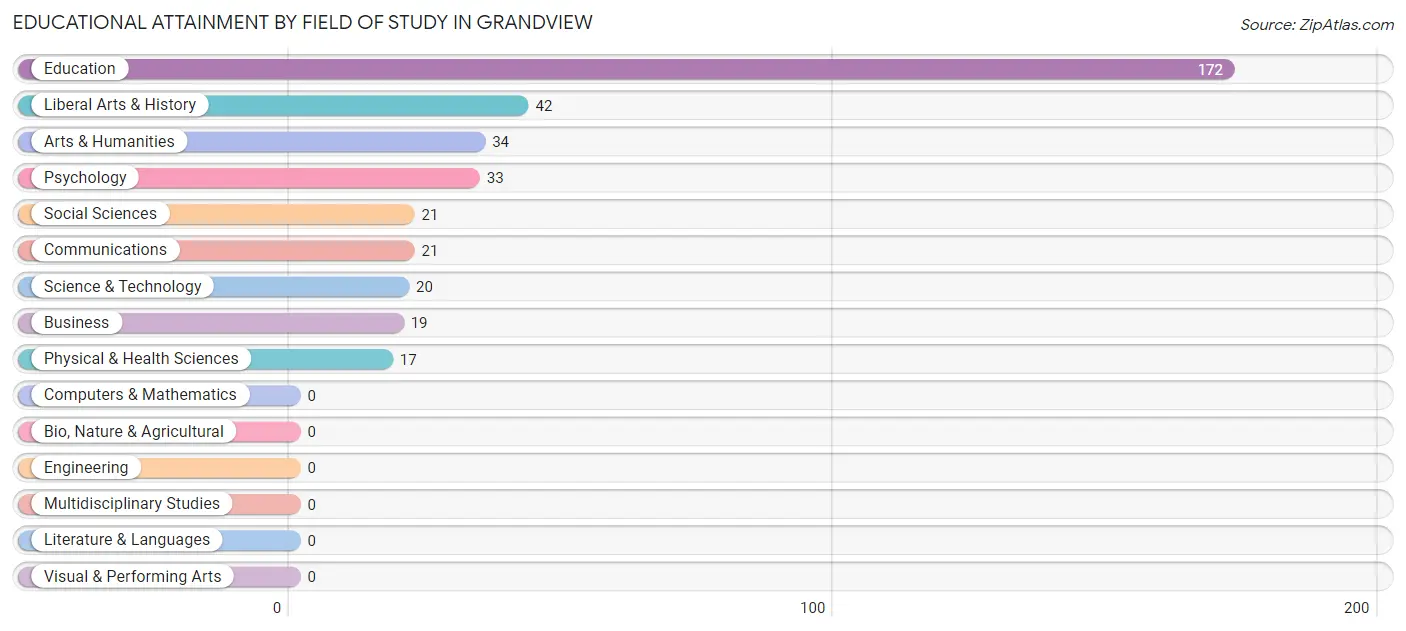
Educational Attainment by Field of Study in Grandview
Education (172 | 45.4%), liberal arts & history (42 | 11.1%), arts & humanities (34 | 9.0%), psychology (33 | 8.7%), and social sciences (21 | 5.5%) are the most common fields of study among 379 individuals in Grandview who have obtained a bachelor's degree or higher.
| Field of Study | # Graduates | % Graduates |
| Computers & Mathematics | 0 | 0.0% |
| Bio, Nature & Agricultural | 0 | 0.0% |
| Physical & Health Sciences | 17 | 4.5% |
| Psychology | 33 | 8.7% |
| Social Sciences | 21 | 5.5% |
| Engineering | 0 | 0.0% |
| Multidisciplinary Studies | 0 | 0.0% |
| Science & Technology | 20 | 5.3% |
| Business | 19 | 5.0% |
| Education | 172 | 45.4% |
| Literature & Languages | 0 | 0.0% |
| Liberal Arts & History | 42 | 11.1% |
| Visual & Performing Arts | 0 | 0.0% |
| Communications | 21 | 5.5% |
| Arts & Humanities | 34 | 9.0% |
| Total | 379 | 100.0% |
Transportation & Commute in Grandview
Vehicle Availability by Sex in Grandview
The most prevalent vehicle ownership categories in Grandview are males with 3 vehicles (60, accounting for 41.4%) and females with 3 vehicles (39, making up 23.2%).
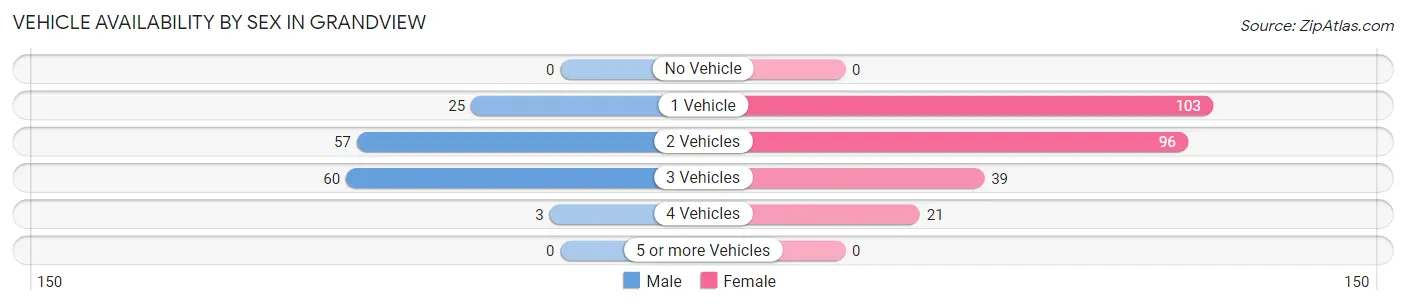
| Vehicles Available | Male | Female |
| No Vehicle | 0 (0.0%) | 0 (0.0%) |
| 1 Vehicle | 25 (17.2%) | 103 (39.8%) |
| 2 Vehicles | 57 (39.3%) | 96 (37.1%) |
| 3 Vehicles | 60 (41.4%) | 39 (15.1%) |
| 4 Vehicles | 3 (2.1%) | 21 (8.1%) |
| 5 or more Vehicles | 0 (0.0%) | 0 (0.0%) |
| Total | 145 (100.0%) | 259 (100.0%) |
Commute Time in Grandview
The most frequently occuring commute durations in Grandview are 15 to 19 minutes (133 commuters, 34.2%), 10 to 14 minutes (106 commuters, 27.3%), and 20 to 24 minutes (66 commuters, 17.0%).
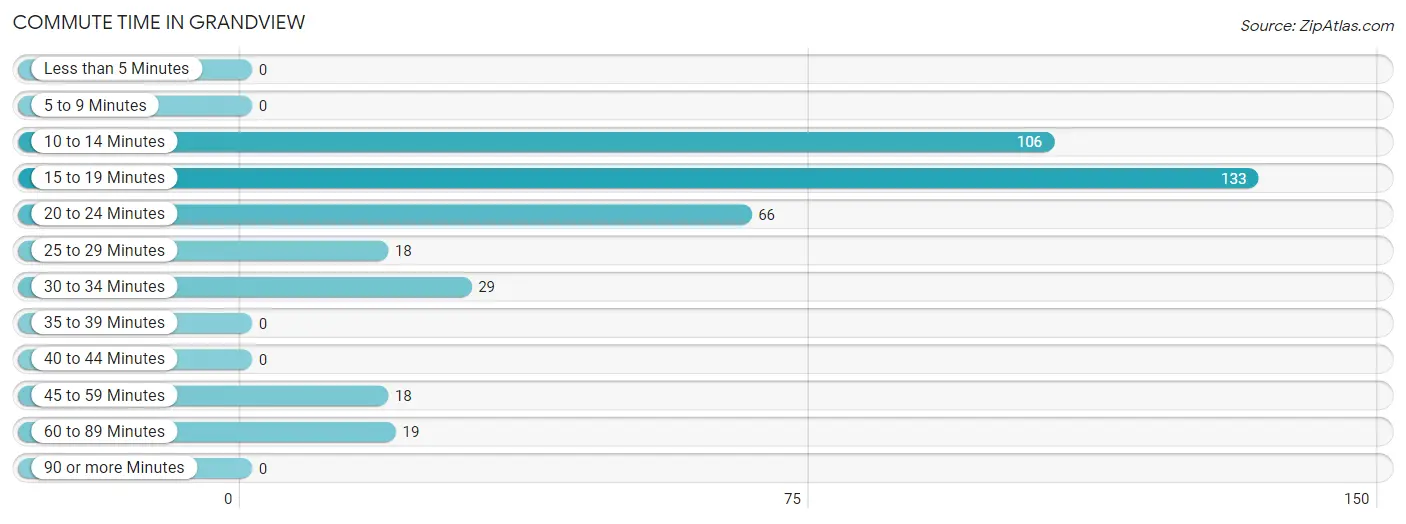
| Commute Time | # Commuters | % Commuters |
| Less than 5 Minutes | 0 | 0.0% |
| 5 to 9 Minutes | 0 | 0.0% |
| 10 to 14 Minutes | 106 | 27.3% |
| 15 to 19 Minutes | 133 | 34.2% |
| 20 to 24 Minutes | 66 | 17.0% |
| 25 to 29 Minutes | 18 | 4.6% |
| 30 to 34 Minutes | 29 | 7.5% |
| 35 to 39 Minutes | 0 | 0.0% |
| 40 to 44 Minutes | 0 | 0.0% |
| 45 to 59 Minutes | 18 | 4.6% |
| 60 to 89 Minutes | 19 | 4.9% |
| 90 or more Minutes | 0 | 0.0% |
Commute Time by Sex in Grandview
The most common commute times in Grandview are 10 to 14 minutes (73 commuters, 50.3%) for males and 15 to 19 minutes (124 commuters, 50.8%) for females.
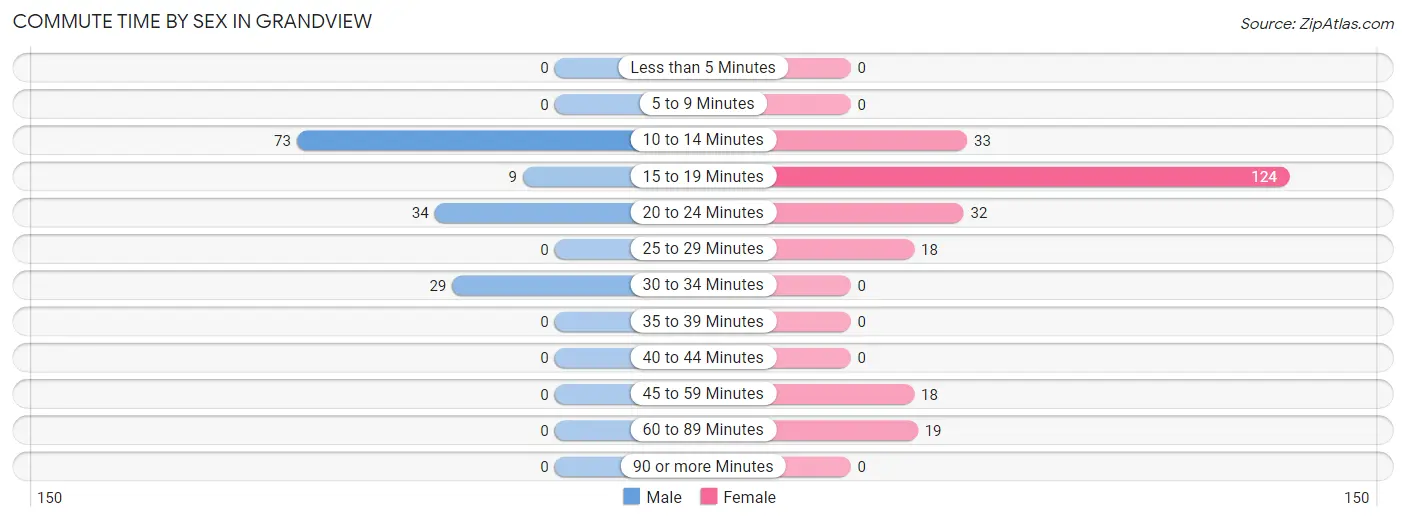
| Commute Time | Male | Female |
| Less than 5 Minutes | 0 (0.0%) | 0 (0.0%) |
| 5 to 9 Minutes | 0 (0.0%) | 0 (0.0%) |
| 10 to 14 Minutes | 73 (50.3%) | 33 (13.5%) |
| 15 to 19 Minutes | 9 (6.2%) | 124 (50.8%) |
| 20 to 24 Minutes | 34 (23.4%) | 32 (13.1%) |
| 25 to 29 Minutes | 0 (0.0%) | 18 (7.4%) |
| 30 to 34 Minutes | 29 (20.0%) | 0 (0.0%) |
| 35 to 39 Minutes | 0 (0.0%) | 0 (0.0%) |
| 40 to 44 Minutes | 0 (0.0%) | 0 (0.0%) |
| 45 to 59 Minutes | 0 (0.0%) | 18 (7.4%) |
| 60 to 89 Minutes | 0 (0.0%) | 19 (7.8%) |
| 90 or more Minutes | 0 (0.0%) | 0 (0.0%) |
Time of Departure to Work by Sex in Grandview
The most frequent times of departure to work in Grandview are 6:00 AM to 6:29 AM (40, 27.6%) for males and 7:00 AM to 7:29 AM (73, 29.9%) for females.
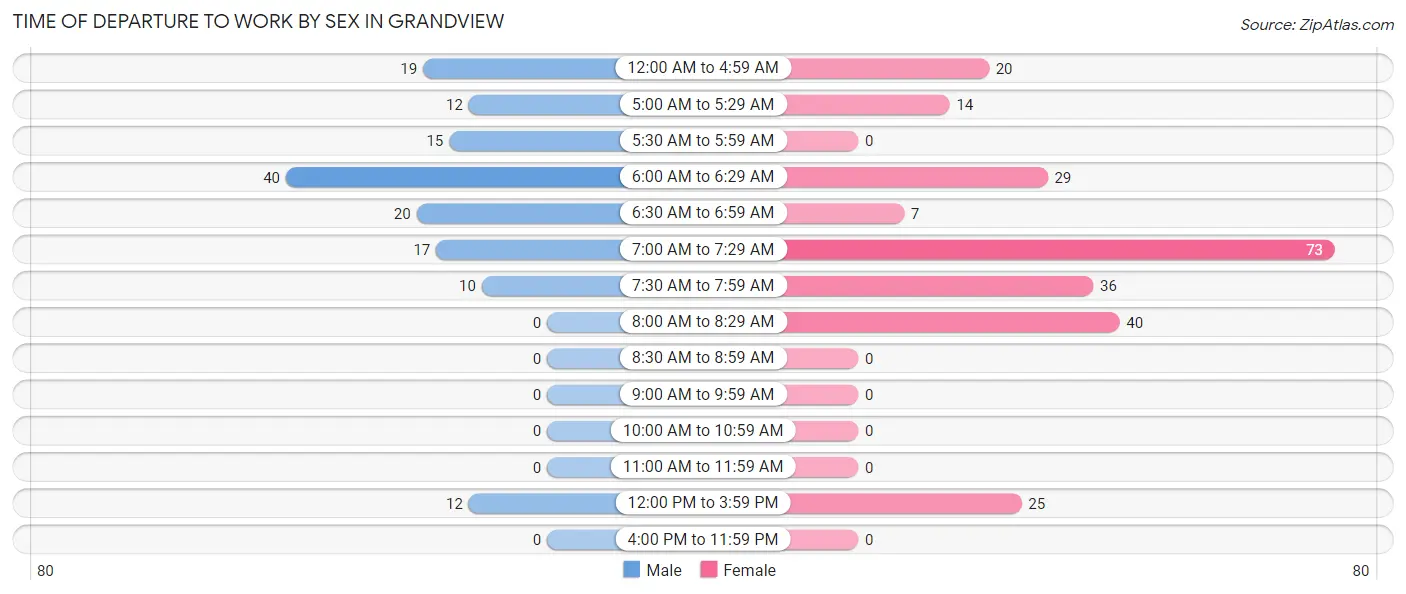
| Time of Departure | Male | Female |
| 12:00 AM to 4:59 AM | 19 (13.1%) | 20 (8.2%) |
| 5:00 AM to 5:29 AM | 12 (8.3%) | 14 (5.7%) |
| 5:30 AM to 5:59 AM | 15 (10.3%) | 0 (0.0%) |
| 6:00 AM to 6:29 AM | 40 (27.6%) | 29 (11.9%) |
| 6:30 AM to 6:59 AM | 20 (13.8%) | 7 (2.9%) |
| 7:00 AM to 7:29 AM | 17 (11.7%) | 73 (29.9%) |
| 7:30 AM to 7:59 AM | 10 (6.9%) | 36 (14.7%) |
| 8:00 AM to 8:29 AM | 0 (0.0%) | 40 (16.4%) |
| 8:30 AM to 8:59 AM | 0 (0.0%) | 0 (0.0%) |
| 9:00 AM to 9:59 AM | 0 (0.0%) | 0 (0.0%) |
| 10:00 AM to 10:59 AM | 0 (0.0%) | 0 (0.0%) |
| 11:00 AM to 11:59 AM | 0 (0.0%) | 0 (0.0%) |
| 12:00 PM to 3:59 PM | 12 (8.3%) | 25 (10.2%) |
| 4:00 PM to 11:59 PM | 0 (0.0%) | 0 (0.0%) |
| Total | 145 (100.0%) | 244 (100.0%) |
Housing Occupancy in Grandview
Occupancy by Ownership in Grandview
Of the total 431 dwellings in Grandview, owner-occupied units account for 377 (87.5%), while renter-occupied units make up 54 (12.5%).
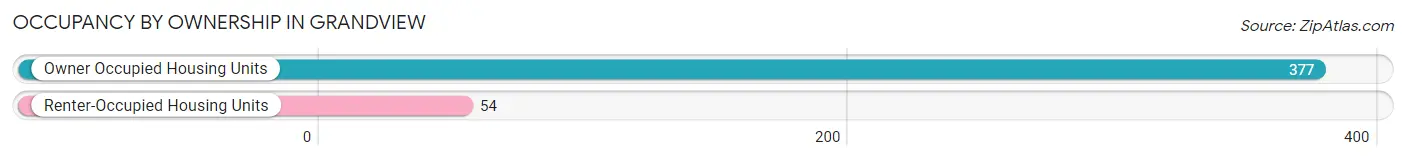
| Occupancy | # Housing Units | % Housing Units |
| Owner Occupied Housing Units | 377 | 87.5% |
| Renter-Occupied Housing Units | 54 | 12.5% |
| Total Occupied Housing Units | 431 | 100.0% |
Occupancy by Household Size in Grandview
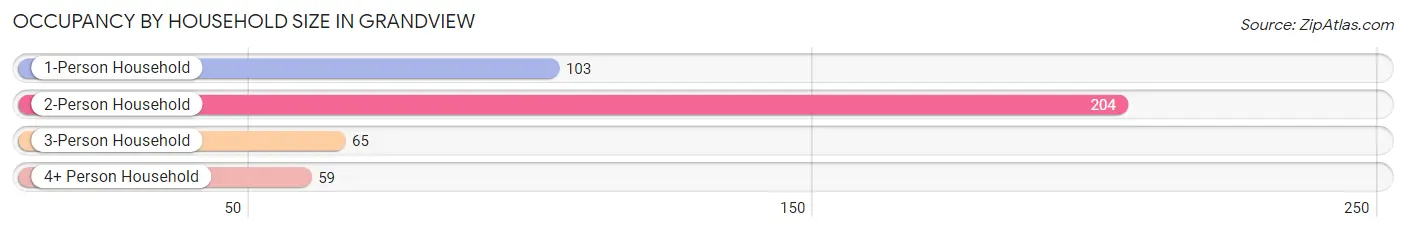
| Household Size | # Housing Units | % Housing Units |
| 1-Person Household | 103 | 23.9% |
| 2-Person Household | 204 | 47.3% |
| 3-Person Household | 65 | 15.1% |
| 4+ Person Household | 59 | 13.7% |
| Total Housing Units | 431 | 100.0% |
Occupancy by Ownership by Household Size in Grandview
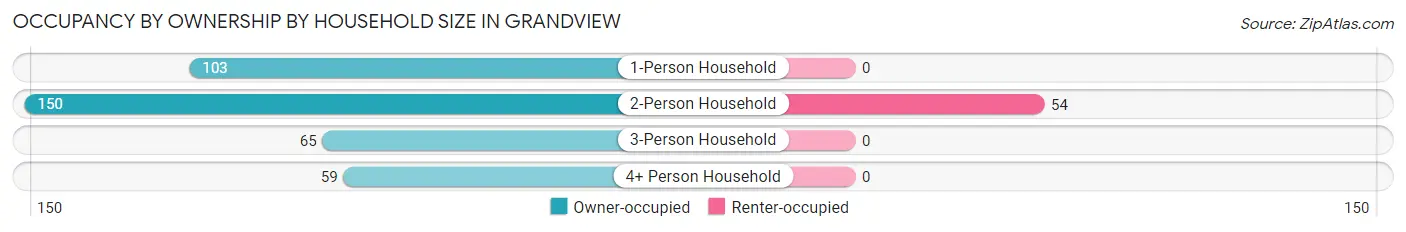
| Household Size | Owner-occupied | Renter-occupied |
| 1-Person Household | 103 (100.0%) | 0 (0.0%) |
| 2-Person Household | 150 (73.5%) | 54 (26.5%) |
| 3-Person Household | 65 (100.0%) | 0 (0.0%) |
| 4+ Person Household | 59 (100.0%) | 0 (0.0%) |
| Total Housing Units | 377 (87.5%) | 54 (12.5%) |
Occupancy by Educational Attainment in Grandview
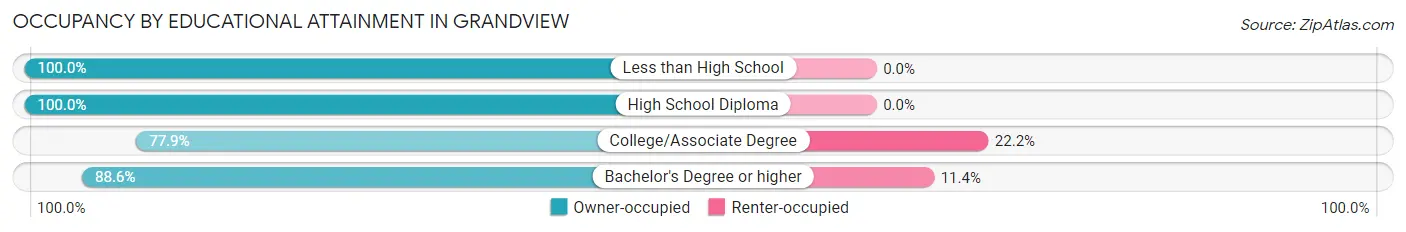
| Household Size | Owner-occupied | Renter-occupied |
| Less than High School | 25 (100.0%) | 0 (0.0%) |
| High School Diploma | 73 (100.0%) | 0 (0.0%) |
| College/Associate Degree | 116 (77.8%) | 33 (22.2%) |
| Bachelor's Degree or higher | 163 (88.6%) | 21 (11.4%) |
Occupancy by Age of Householder in Grandview
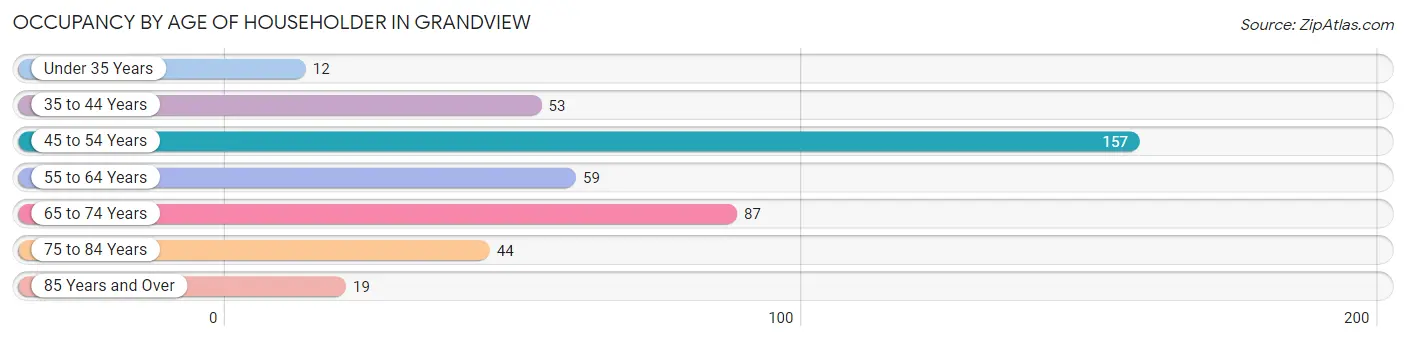
| Age Bracket | # Households | % Households |
| Under 35 Years | 12 | 2.8% |
| 35 to 44 Years | 53 | 12.3% |
| 45 to 54 Years | 157 | 36.4% |
| 55 to 64 Years | 59 | 13.7% |
| 65 to 74 Years | 87 | 20.2% |
| 75 to 84 Years | 44 | 10.2% |
| 85 Years and Over | 19 | 4.4% |
| Total | 431 | 100.0% |
Housing Finances in Grandview
Median Income by Occupancy in Grandview
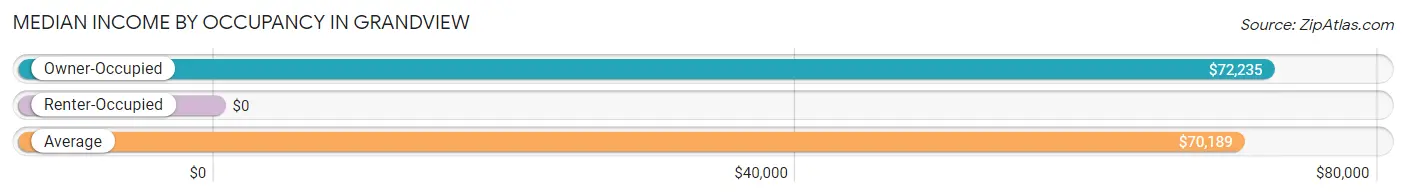
| Occupancy Type | # Households | Median Income |
| Owner-Occupied | 377 (87.5%) | $72,235 |
| Renter-Occupied | 54 (12.5%) | $0 |
| Average | 431 (100.0%) | $70,189 |
Occupancy by Householder Income Bracket in Grandview
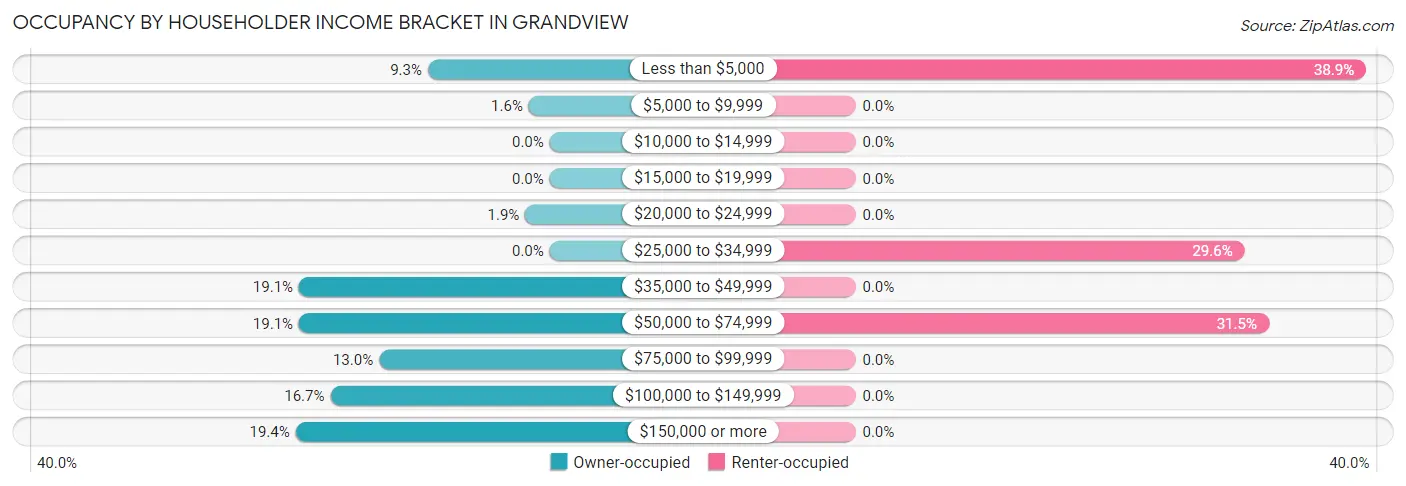
| Income Bracket | Owner-occupied | Renter-occupied |
| Less than $5,000 | 35 (9.3%) | 21 (38.9%) |
| $5,000 to $9,999 | 6 (1.6%) | 0 (0.0%) |
| $10,000 to $14,999 | 0 (0.0%) | 0 (0.0%) |
| $15,000 to $19,999 | 0 (0.0%) | 0 (0.0%) |
| $20,000 to $24,999 | 7 (1.9%) | 0 (0.0%) |
| $25,000 to $34,999 | 0 (0.0%) | 16 (29.6%) |
| $35,000 to $49,999 | 72 (19.1%) | 0 (0.0%) |
| $50,000 to $74,999 | 72 (19.1%) | 17 (31.5%) |
| $75,000 to $99,999 | 49 (13.0%) | 0 (0.0%) |
| $100,000 to $149,999 | 63 (16.7%) | 0 (0.0%) |
| $150,000 or more | 73 (19.4%) | 0 (0.0%) |
| Total | 377 (100.0%) | 54 (100.0%) |
Monthly Housing Cost Tiers in Grandview
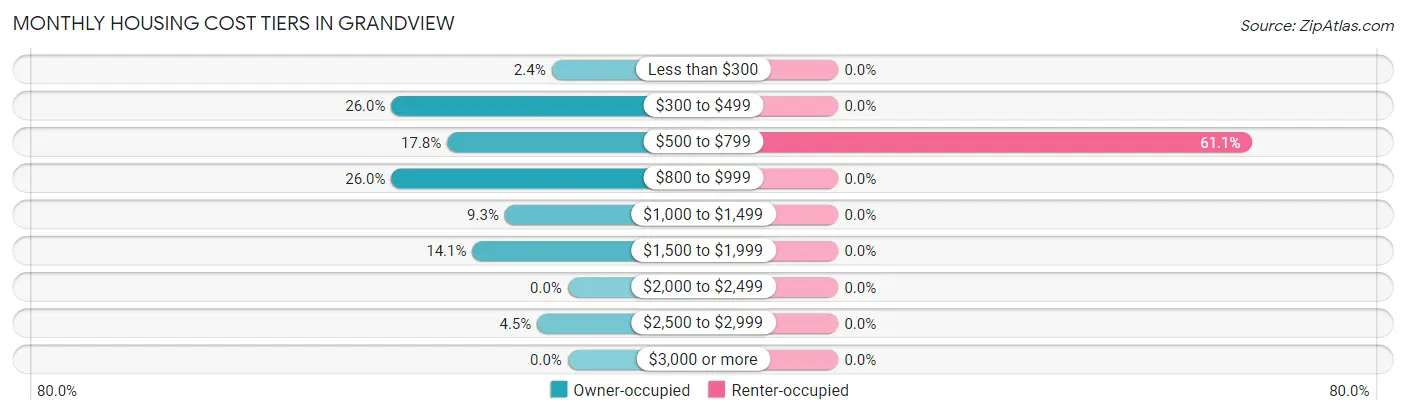
| Monthly Cost | Owner-occupied | Renter-occupied |
| Less than $300 | 9 (2.4%) | 0 (0.0%) |
| $300 to $499 | 98 (26.0%) | 0 (0.0%) |
| $500 to $799 | 67 (17.8%) | 33 (61.1%) |
| $800 to $999 | 98 (26.0%) | 0 (0.0%) |
| $1,000 to $1,499 | 35 (9.3%) | 0 (0.0%) |
| $1,500 to $1,999 | 53 (14.1%) | 0 (0.0%) |
| $2,000 to $2,499 | 0 (0.0%) | 0 (0.0%) |
| $2,500 to $2,999 | 17 (4.5%) | 0 (0.0%) |
| $3,000 or more | 0 (0.0%) | 0 (0.0%) |
| Total | 377 (100.0%) | 54 (100.0%) |
Physical Housing Characteristics in Grandview
Housing Structures in Grandview
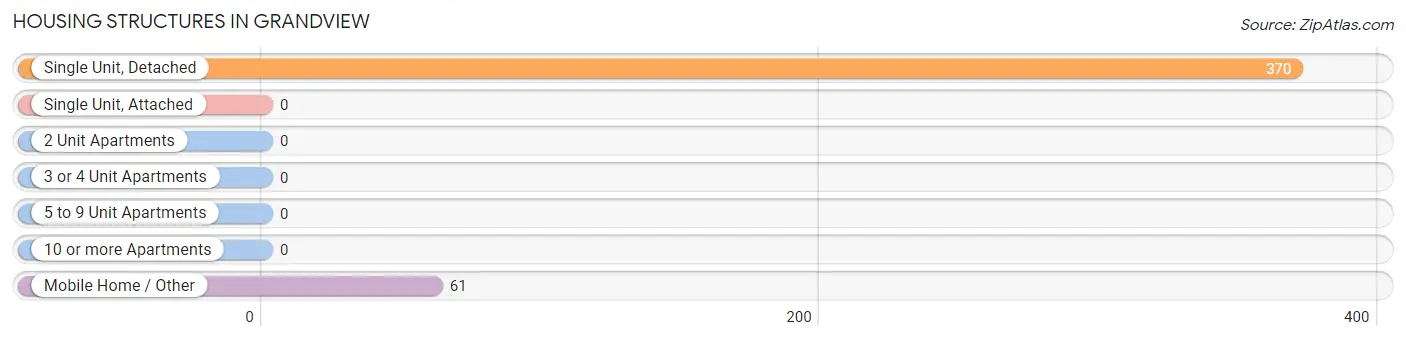
| Structure Type | # Housing Units | % Housing Units |
| Single Unit, Detached | 370 | 85.9% |
| Single Unit, Attached | 0 | 0.0% |
| 2 Unit Apartments | 0 | 0.0% |
| 3 or 4 Unit Apartments | 0 | 0.0% |
| 5 to 9 Unit Apartments | 0 | 0.0% |
| 10 or more Apartments | 0 | 0.0% |
| Mobile Home / Other | 61 | 14.1% |
| Total | 431 | 100.0% |
Housing Structures by Occupancy in Grandview
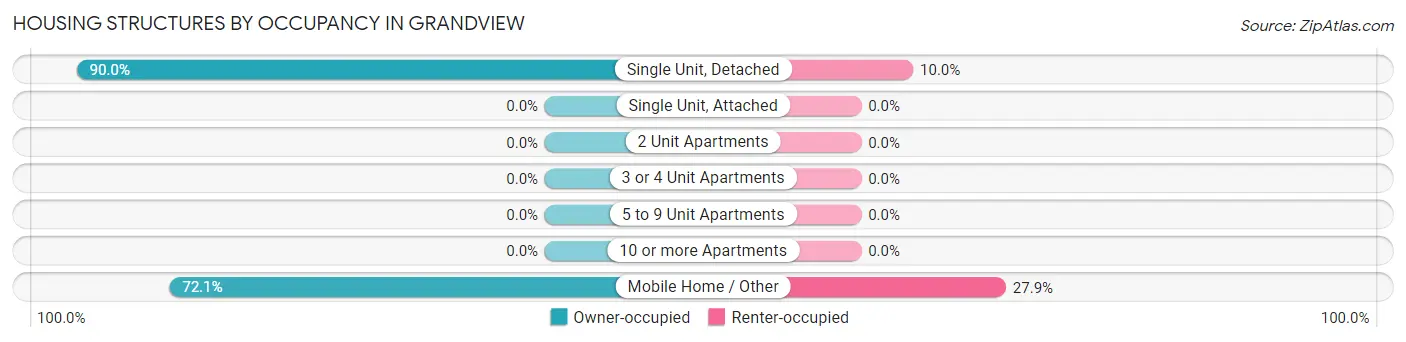
| Structure Type | Owner-occupied | Renter-occupied |
| Single Unit, Detached | 333 (90.0%) | 37 (10.0%) |
| Single Unit, Attached | 0 (0.0%) | 0 (0.0%) |
| 2 Unit Apartments | 0 (0.0%) | 0 (0.0%) |
| 3 or 4 Unit Apartments | 0 (0.0%) | 0 (0.0%) |
| 5 to 9 Unit Apartments | 0 (0.0%) | 0 (0.0%) |
| 10 or more Apartments | 0 (0.0%) | 0 (0.0%) |
| Mobile Home / Other | 44 (72.1%) | 17 (27.9%) |
| Total | 377 (87.5%) | 54 (12.5%) |
Housing Structures by Number of Rooms in Grandview
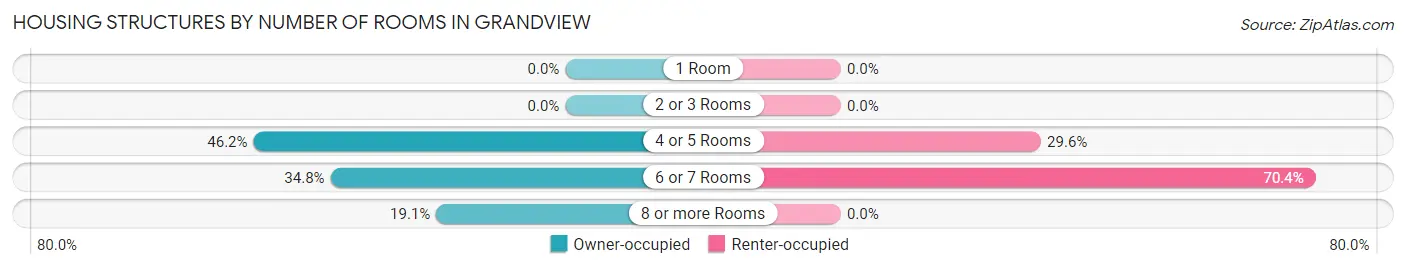
| Number of Rooms | Owner-occupied | Renter-occupied |
| 1 Room | 0 (0.0%) | 0 (0.0%) |
| 2 or 3 Rooms | 0 (0.0%) | 0 (0.0%) |
| 4 or 5 Rooms | 174 (46.2%) | 16 (29.6%) |
| 6 or 7 Rooms | 131 (34.7%) | 38 (70.4%) |
| 8 or more Rooms | 72 (19.1%) | 0 (0.0%) |
| Total | 377 (100.0%) | 54 (100.0%) |
Housing Structure by Heating Type in Grandview
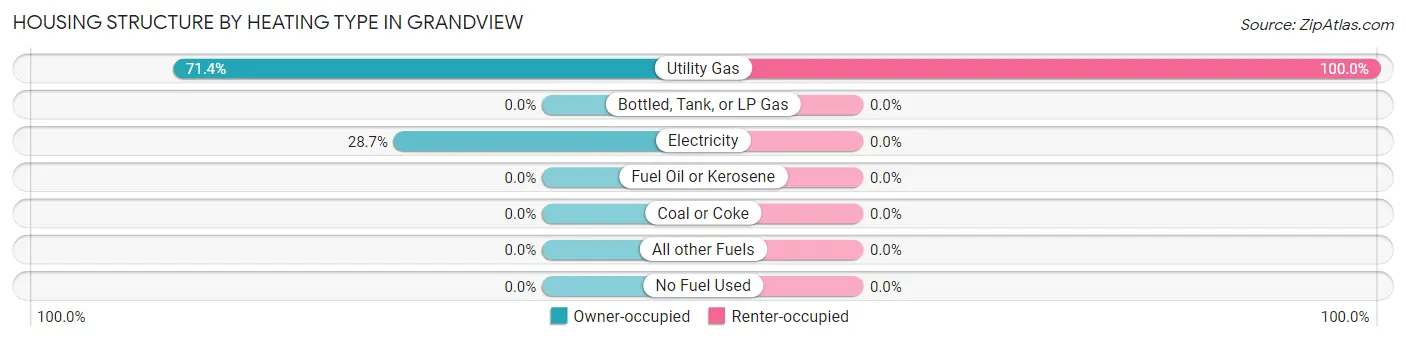
| Heating Type | Owner-occupied | Renter-occupied |
| Utility Gas | 269 (71.4%) | 54 (100.0%) |
| Bottled, Tank, or LP Gas | 0 (0.0%) | 0 (0.0%) |
| Electricity | 108 (28.6%) | 0 (0.0%) |
| Fuel Oil or Kerosene | 0 (0.0%) | 0 (0.0%) |
| Coal or Coke | 0 (0.0%) | 0 (0.0%) |
| All other Fuels | 0 (0.0%) | 0 (0.0%) |
| No Fuel Used | 0 (0.0%) | 0 (0.0%) |
| Total | 377 (100.0%) | 54 (100.0%) |
Household Vehicle Usage in Grandview
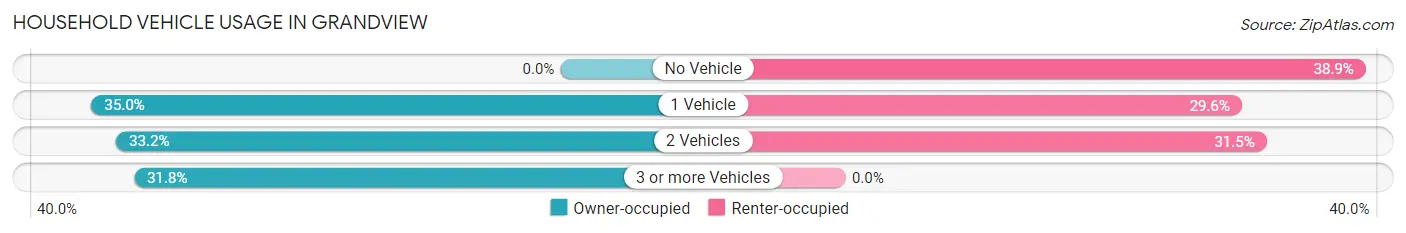
| Vehicles per Household | Owner-occupied | Renter-occupied |
| No Vehicle | 0 (0.0%) | 21 (38.9%) |
| 1 Vehicle | 132 (35.0%) | 16 (29.6%) |
| 2 Vehicles | 125 (33.2%) | 17 (31.5%) |
| 3 or more Vehicles | 120 (31.8%) | 0 (0.0%) |
| Total | 377 (100.0%) | 54 (100.0%) |
Real Estate & Mortgages in Grandview
Real Estate and Mortgage Overview in Grandview
| Characteristic | Without Mortgage | With Mortgage |
| Housing Units | 174 | 203 |
| Median Property Value | $131,500 | $144,900 |
| Median Household Income | - | - |
| Monthly Housing Costs | $446 | $0 |
| Real Estate Taxes | $540 | $16 |
Property Value by Mortgage Status in Grandview
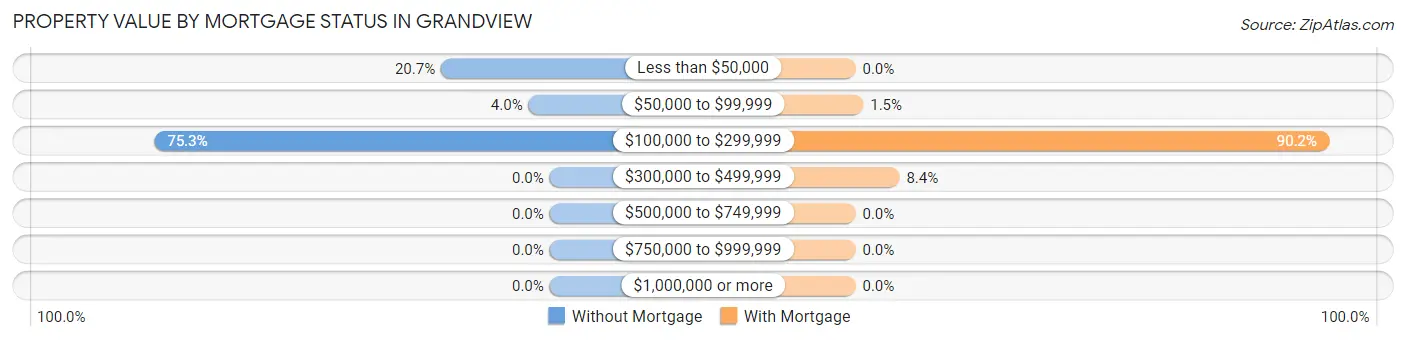
| Property Value | Without Mortgage | With Mortgage |
| Less than $50,000 | 36 (20.7%) | 0 (0.0%) |
| $50,000 to $99,999 | 7 (4.0%) | 3 (1.5%) |
| $100,000 to $299,999 | 131 (75.3%) | 183 (90.1%) |
| $300,000 to $499,999 | 0 (0.0%) | 17 (8.4%) |
| $500,000 to $749,999 | 0 (0.0%) | 0 (0.0%) |
| $750,000 to $999,999 | 0 (0.0%) | 0 (0.0%) |
| $1,000,000 or more | 0 (0.0%) | 0 (0.0%) |
| Total | 174 (100.0%) | 203 (100.0%) |
Household Income by Mortgage Status in Grandview
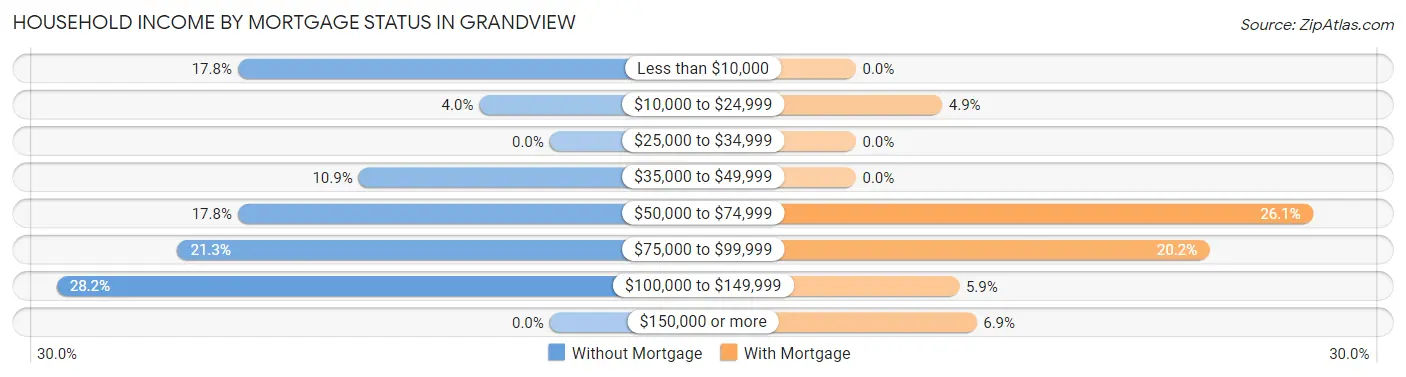
| Household Income | Without Mortgage | With Mortgage |
| Less than $10,000 | 31 (17.8%) | 0 (0.0%) |
| $10,000 to $24,999 | 7 (4.0%) | 10 (4.9%) |
| $25,000 to $34,999 | 0 (0.0%) | 0 (0.0%) |
| $35,000 to $49,999 | 19 (10.9%) | 0 (0.0%) |
| $50,000 to $74,999 | 31 (17.8%) | 53 (26.1%) |
| $75,000 to $99,999 | 37 (21.3%) | 41 (20.2%) |
| $100,000 to $149,999 | 49 (28.2%) | 12 (5.9%) |
| $150,000 or more | 0 (0.0%) | 14 (6.9%) |
| Total | 174 (100.0%) | 203 (100.0%) |
Property Value to Household Income Ratio in Grandview
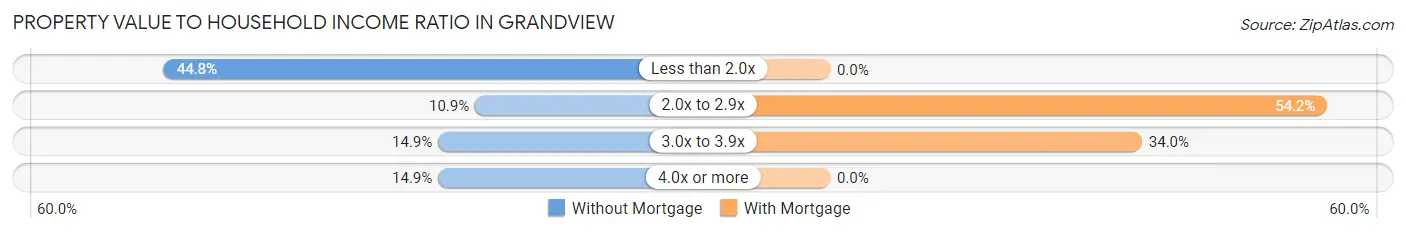
| Value-to-Income Ratio | Without Mortgage | With Mortgage |
| Less than 2.0x | 78 (44.8%) | 0 (0.0%) |
| 2.0x to 2.9x | 19 (10.9%) | 110 (54.2%) |
| 3.0x to 3.9x | 26 (14.9%) | 69 (34.0%) |
| 4.0x or more | 26 (14.9%) | 0 (0.0%) |
| Total | 174 (100.0%) | 203 (100.0%) |
Real Estate Taxes by Mortgage Status in Grandview
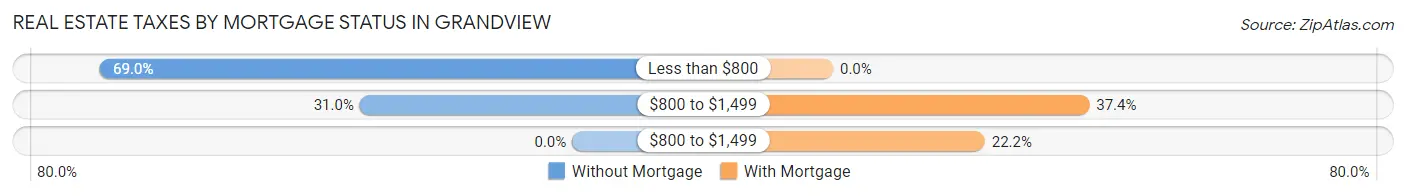
| Property Taxes | Without Mortgage | With Mortgage |
| Less than $800 | 120 (69.0%) | 0 (0.0%) |
| $800 to $1,499 | 54 (31.0%) | 76 (37.4%) |
| $800 to $1,499 | 0 (0.0%) | 45 (22.2%) |
| Total | 174 (100.0%) | 203 (100.0%) |
Health & Disability in Grandview
Health Insurance Coverage by Age in Grandview
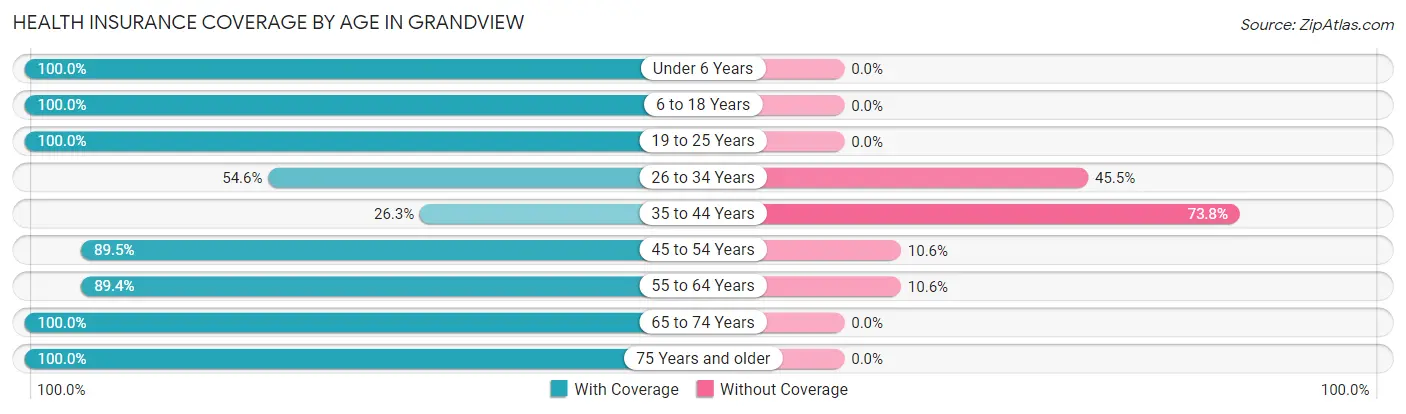
| Age Bracket | With Coverage | Without Coverage |
| Under 6 Years | 49 (100.0%) | 0 (0.0%) |
| 6 to 18 Years | 226 (100.0%) | 0 (0.0%) |
| 19 to 25 Years | 20 (100.0%) | 0 (0.0%) |
| 26 to 34 Years | 12 (54.5%) | 10 (45.5%) |
| 35 to 44 Years | 21 (26.3%) | 59 (73.8%) |
| 45 to 54 Years | 178 (89.4%) | 21 (10.5%) |
| 55 to 64 Years | 127 (89.4%) | 15 (10.6%) |
| 65 to 74 Years | 192 (100.0%) | 0 (0.0%) |
| 75 Years and older | 82 (100.0%) | 0 (0.0%) |
| Total | 907 (89.6%) | 105 (10.4%) |
Health Insurance Coverage by Citizenship Status in Grandview

| Citizenship Status | With Coverage | Without Coverage |
| Native Born | 49 (100.0%) | 0 (0.0%) |
| Foreign Born, Citizen | 226 (100.0%) | 0 (0.0%) |
| Foreign Born, not a Citizen | 20 (100.0%) | 0 (0.0%) |
Health Insurance Coverage by Household Income in Grandview
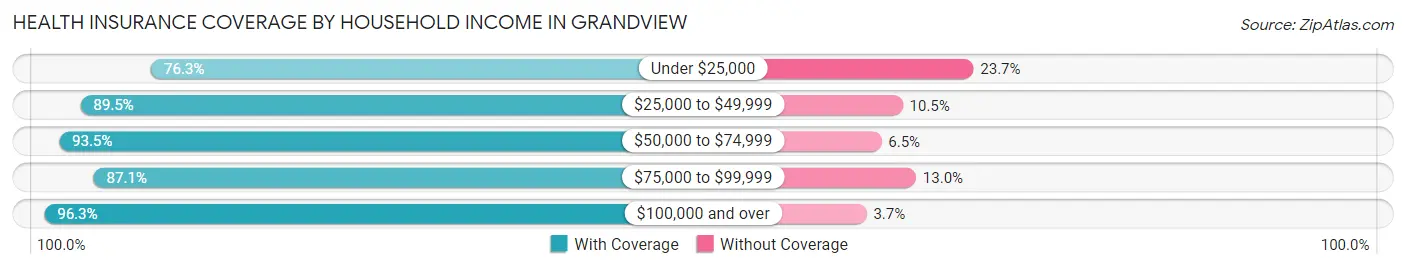
| Household Income | With Coverage | Without Coverage |
| Under $25,000 | 148 (76.3%) | 46 (23.7%) |
| $25,000 to $49,999 | 137 (89.5%) | 16 (10.5%) |
| $50,000 to $74,999 | 188 (93.5%) | 13 (6.5%) |
| $75,000 to $99,999 | 121 (87.1%) | 18 (13.0%) |
| $100,000 and over | 313 (96.3%) | 12 (3.7%) |
Public vs Private Health Insurance Coverage by Age in Grandview
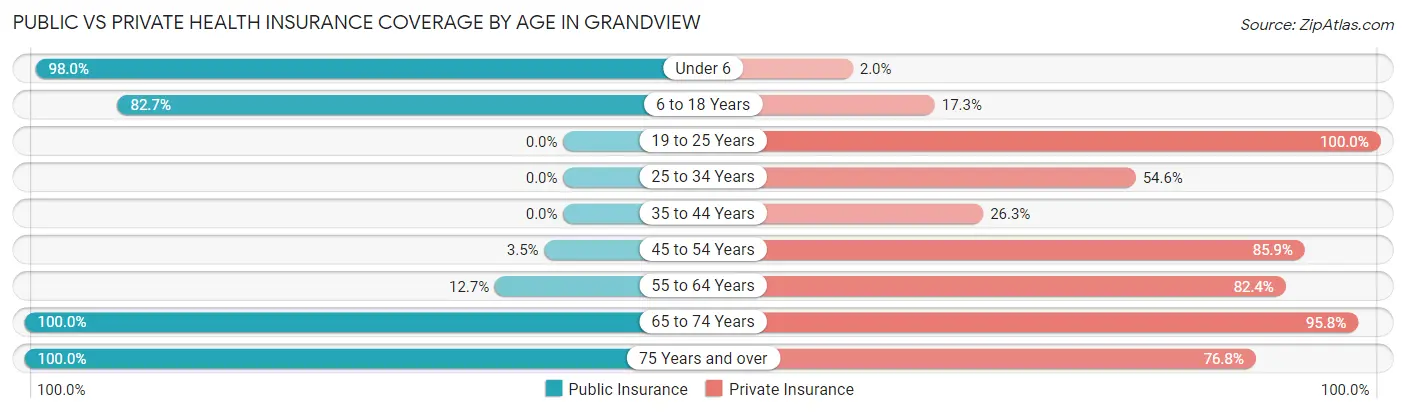
| Age Bracket | Public Insurance | Private Insurance |
| Under 6 | 48 (98.0%) | 1 (2.0%) |
| 6 to 18 Years | 187 (82.7%) | 39 (17.3%) |
| 19 to 25 Years | 0 (0.0%) | 20 (100.0%) |
| 25 to 34 Years | 0 (0.0%) | 12 (54.5%) |
| 35 to 44 Years | 0 (0.0%) | 21 (26.3%) |
| 45 to 54 Years | 7 (3.5%) | 171 (85.9%) |
| 55 to 64 Years | 18 (12.7%) | 117 (82.4%) |
| 65 to 74 Years | 192 (100.0%) | 184 (95.8%) |
| 75 Years and over | 82 (100.0%) | 63 (76.8%) |
| Total | 534 (52.8%) | 628 (62.1%) |
Disability Status by Sex by Age in Grandview
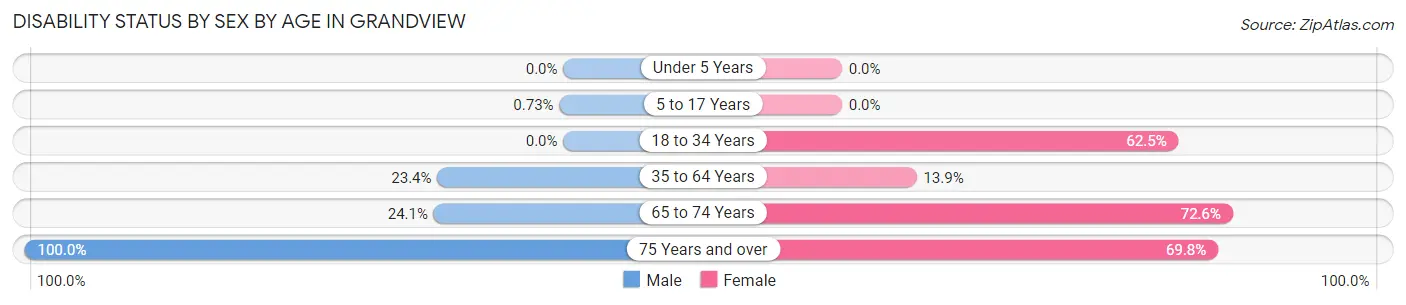
| Age Bracket | Male | Female |
| Under 5 Years | 0 (0.0%) | 0 (0.0%) |
| 5 to 17 Years | 1 (0.7%) | 0 (0.0%) |
| 18 to 34 Years | 0 (0.0%) | 20 (62.5%) |
| 35 to 64 Years | 36 (23.4%) | 37 (13.9%) |
| 65 to 74 Years | 19 (24.0%) | 82 (72.6%) |
| 75 Years and over | 19 (100.0%) | 44 (69.8%) |
Disability Class by Sex by Age in Grandview
Disability Class: Hearing Difficulty
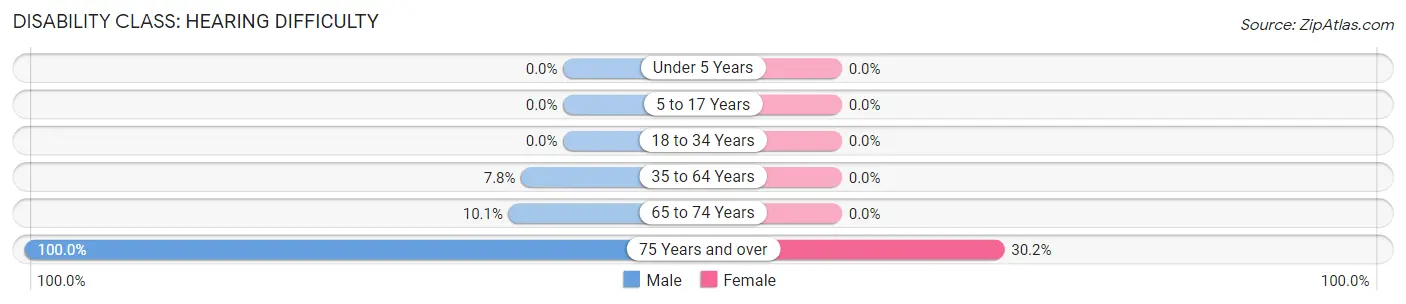
| Age Bracket | Male | Female |
| Under 5 Years | 0 (0.0%) | 0 (0.0%) |
| 5 to 17 Years | 0 (0.0%) | 0 (0.0%) |
| 18 to 34 Years | 0 (0.0%) | 0 (0.0%) |
| 35 to 64 Years | 12 (7.8%) | 0 (0.0%) |
| 65 to 74 Years | 8 (10.1%) | 0 (0.0%) |
| 75 Years and over | 19 (100.0%) | 19 (30.2%) |
Disability Class: Vision Difficulty
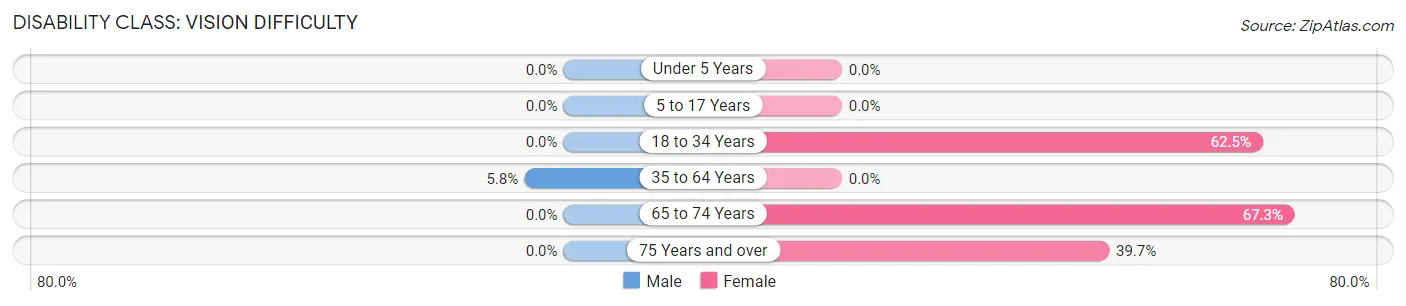
| Age Bracket | Male | Female |
| Under 5 Years | 0 (0.0%) | 0 (0.0%) |
| 5 to 17 Years | 0 (0.0%) | 0 (0.0%) |
| 18 to 34 Years | 0 (0.0%) | 20 (62.5%) |
| 35 to 64 Years | 9 (5.8%) | 0 (0.0%) |
| 65 to 74 Years | 0 (0.0%) | 76 (67.3%) |
| 75 Years and over | 0 (0.0%) | 25 (39.7%) |
Disability Class: Cognitive Difficulty
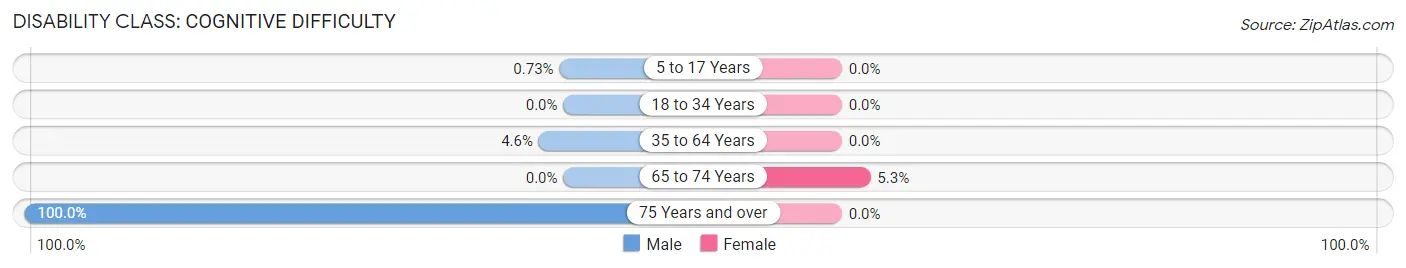
| Age Bracket | Male | Female |
| 5 to 17 Years | 1 (0.7%) | 0 (0.0%) |
| 18 to 34 Years | 0 (0.0%) | 0 (0.0%) |
| 35 to 64 Years | 7 (4.5%) | 0 (0.0%) |
| 65 to 74 Years | 0 (0.0%) | 6 (5.3%) |
| 75 Years and over | 19 (100.0%) | 0 (0.0%) |
Disability Class: Ambulatory Difficulty
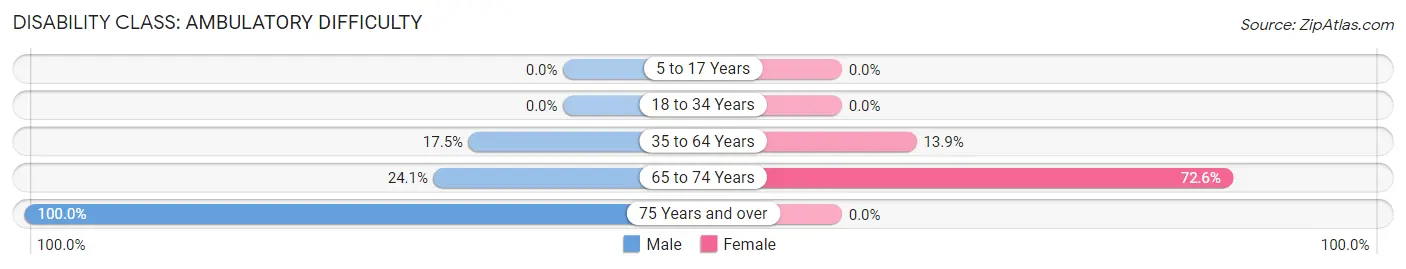
| Age Bracket | Male | Female |
| 5 to 17 Years | 0 (0.0%) | 0 (0.0%) |
| 18 to 34 Years | 0 (0.0%) | 0 (0.0%) |
| 35 to 64 Years | 27 (17.5%) | 37 (13.9%) |
| 65 to 74 Years | 19 (24.0%) | 82 (72.6%) |
| 75 Years and over | 19 (100.0%) | 0 (0.0%) |
Disability Class: Self-Care Difficulty
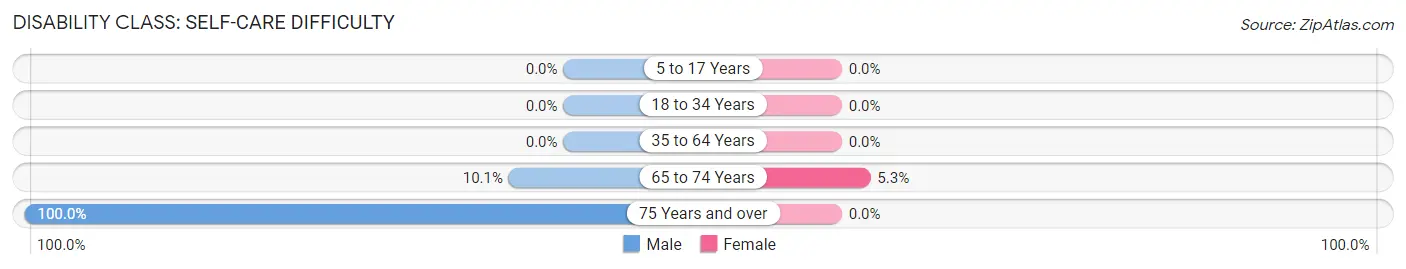
| Age Bracket | Male | Female |
| 5 to 17 Years | 0 (0.0%) | 0 (0.0%) |
| 18 to 34 Years | 0 (0.0%) | 0 (0.0%) |
| 35 to 64 Years | 0 (0.0%) | 0 (0.0%) |
| 65 to 74 Years | 8 (10.1%) | 6 (5.3%) |
| 75 Years and over | 19 (100.0%) | 0 (0.0%) |
Technology Access in Grandview
Computing Device Access in Grandview
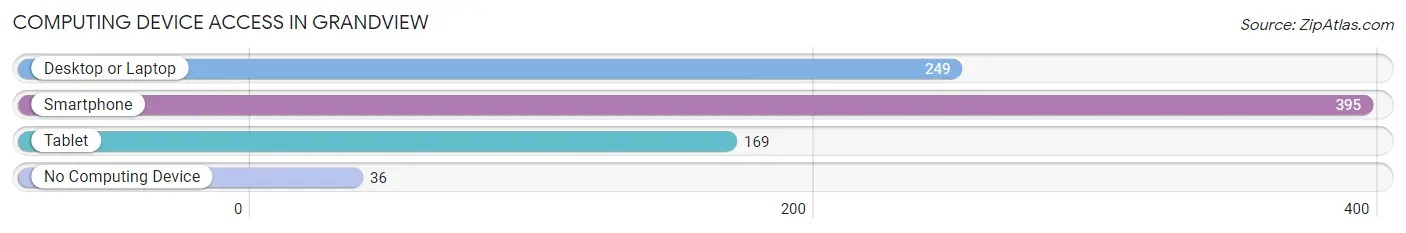
| Device Type | # Households | % Households |
| Desktop or Laptop | 249 | 57.8% |
| Smartphone | 395 | 91.6% |
| Tablet | 169 | 39.2% |
| No Computing Device | 36 | 8.4% |
| Total | 431 | 100.0% |
Internet Access in Grandview
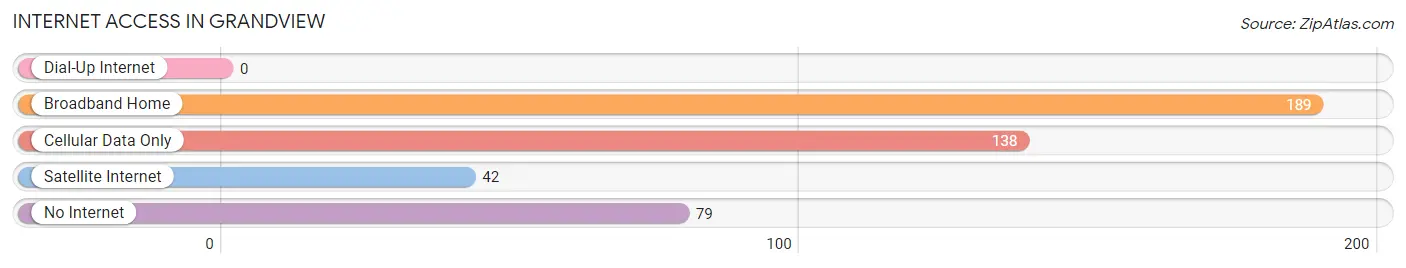
| Internet Type | # Households | % Households |
| Dial-Up Internet | 0 | 0.0% |
| Broadband Home | 189 | 43.9% |
| Cellular Data Only | 138 | 32.0% |
| Satellite Internet | 42 | 9.7% |
| No Internet | 79 | 18.3% |
| Total | 431 | 100.0% |
Grandview Summary
Geography
Grandview is a small town located in the southeastern corner of Oklahoma, in the foothills of the Ozark Mountains. It is situated in the northeastern part of Adair County, approximately 10 miles south of the Arkansas border. The town is located on the banks of the Illinois River, which is a tributary of the Arkansas River. Grandview is surrounded by rolling hills and wooded areas, and is home to a variety of wildlife, including deer, turkey, and other small game.
The town is located at an elevation of 890 feet above sea level, and has a total area of 1.2 square miles. The climate in Grandview is characterized by hot, humid summers and mild winters. The average annual temperature is around 65 degrees Fahrenheit, with an average high of around 90 degrees in the summer and an average low of around 40 degrees in the winter.
History
Grandview was founded in 1887 by a group of settlers from Arkansas. The town was originally known as “Grandview Station”, and was named after the nearby Grandview Mountain. The town was incorporated in 1895, and the first post office was established in 1896.
The town grew rapidly in the early 1900s, and by 1910, the population had grown to over 500 people. The town was home to several businesses, including a general store, a blacksmith shop, a hotel, and a sawmill.
In the 1920s, Grandview experienced a period of economic growth, as the town became a center for the timber industry. The town was also home to several oil wells, which provided jobs for many of the town’s residents.
In the 1950s, Grandview experienced a period of decline, as the timber industry began to decline and the oil wells began to dry up. The population of the town decreased significantly, and by the 1970s, the population had dropped to less than 200 people.
Economy
Today, Grandview is a small, rural town with a population of around 500 people. The town’s economy is largely based on agriculture, with the main crops being corn, soybeans, and hay. The town is also home to several small businesses, including a grocery store, a hardware store, and a few restaurants.
The town is also home to a few tourist attractions, including the Grandview Mountain Wildlife Refuge, which is home to a variety of wildlife, including deer, turkey, and other small game. The town is also home to the Grandview Museum, which houses a variety of artifacts from the town’s history.
Demographics
As of the 2010 census, the population of Grandview was 498 people, with a median age of 41.7 years. The racial makeup of the town was 95.2% White, 0.2% African American, 0.4% Native American, 0.2% Asian, 0.2% from other races, and 3.8% from two or more races.
The median household income in Grandview was $31,250, and the median family income was $37,500. The per capita income was $17,818. Approximately 16.2% of the population was below the poverty line.
Conclusion
Grandview is a small, rural town located in the southeastern corner of Oklahoma. The town has a long history, and was once a center for the timber industry. Today, the town’s economy is largely based on agriculture, and the town is home to a few tourist attractions. The population of Grandview is around 500 people, with a median age of 41.7 years. The town has a median household income of $31,250, and a per capita income of $17,818.
Common Questions
What is Per Capita Income in Grandview?
Per Capita income in Grandview is $38,800.
What is the Median Family Income in Grandview?
Median Family Income in Grandview is $68,676.
What is the Median Household income in Grandview?
Median Household Income in Grandview is $70,189.
What is Income or Wage Gap in Grandview?
Income or Wage Gap in Grandview is 11.0%.
Women in Grandview earn 89.0 cents for every dollar earned by a man.
What is Inequality or Gini Index in Grandview?
Inequality or Gini Index in Grandview is 0.45.
What is the Total Population of Grandview?
Total Population of Grandview is 1,012.
What is the Total Male Population of Grandview?
Total Male Population of Grandview is 446.
What is the Total Female Population of Grandview?
Total Female Population of Grandview is 566.
What is the Ratio of Males per 100 Females in Grandview?
There are 78.80 Males per 100 Females in Grandview.
What is the Ratio of Females per 100 Males in Grandview?
There are 126.91 Females per 100 Males in Grandview.
What is the Median Population Age in Grandview?
Median Population Age in Grandview is 52.0 Years.
What is the Average Family Size in Grandview
Average Family Size in Grandview is 2.7 People.
What is the Average Household Size in Grandview
Average Household Size in Grandview is 2.4 People.
How Large is the Labor Force in Grandview?
There are 434 People in the Labor Forcein in Grandview.
What is the Percentage of People in the Labor Force in Grandview?
56.3% of People are in the Labor Force in Grandview.