Hazen, ND Map & Demographics
Hazen Map
Hazen Overview
$42,795
PER CAPITA INCOME
$105,750
AVG FAMILY INCOME
$79,231
AVG HOUSEHOLD INCOME
50.3%
WAGE / INCOME GAP [ % ]
49.7¢/ $1
WAGE / INCOME GAP [ $ ]
0.39
INEQUALITY / GINI INDEX
2,569
TOTAL POPULATION
1,368
MALE POPULATION
1,201
FEMALE POPULATION
113.91
MALES / 100 FEMALES
87.79
FEMALES / 100 MALES
44.8
MEDIAN AGE
2.9
AVG FAMILY SIZE
2.3
AVG HOUSEHOLD SIZE
1,209
LABOR FORCE [ PEOPLE ]
60.9%
PERCENT IN LABOR FORCE
4.1%
UNEMPLOYMENT RATE
Hazen Zip Codes
Hazen Area Codes
Income in Hazen
Income Overview in Hazen
Per Capita Income in Hazen is $42,795, while median incomes of families and households are $105,750 and $79,231 respectively.
| Characteristic | Number | Measure |
| Per Capita Income | 2,569 | $42,795 |
| Median Family Income | 712 | $105,750 |
| Mean Family Income | 712 | $117,698 |
| Median Household Income | 1,092 | $79,231 |
| Mean Household Income | 1,092 | $98,673 |
| Income Deficit | 712 | $0 |
| Wage / Income Gap (%) | 2,569 | 50.34% |
| Wage / Income Gap ($) | 2,569 | 49.66¢ per $1 |
| Gini / Inequality Index | 2,569 | 0.39 |
Earnings by Sex in Hazen
Average Earnings in Hazen are $52,515, $72,708 for men and $36,106 for women, a difference of 50.3%.
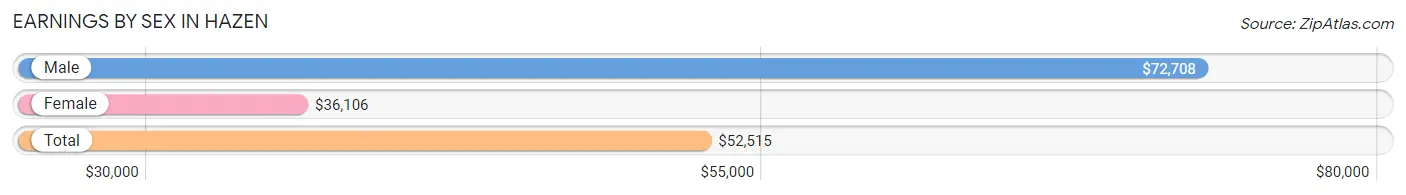
| Sex | Number | Average Earnings |
| Male | 758 (58.2%) | $72,708 |
| Female | 545 (41.8%) | $36,106 |
| Total | 1,303 (100.0%) | $52,515 |
Earnings by Sex by Income Bracket in Hazen
The most common earnings brackets in Hazen are $100,000+ for men (295 | 38.9%) and $22,500 to $24,999 for women (77 | 14.1%).
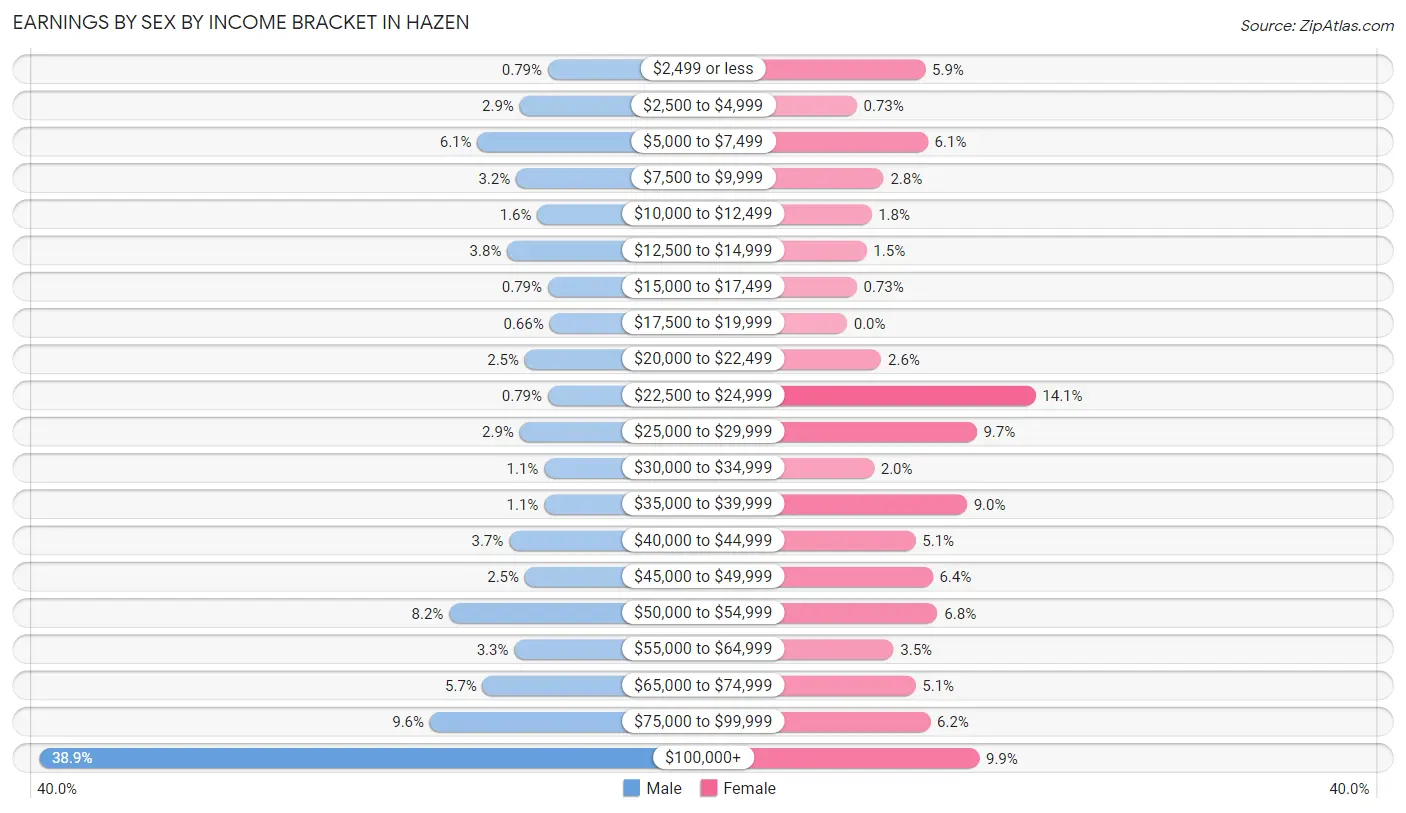
| Income | Male | Female |
| $2,499 or less | 6 (0.8%) | 32 (5.9%) |
| $2,500 to $4,999 | 22 (2.9%) | 4 (0.7%) |
| $5,000 to $7,499 | 46 (6.1%) | 33 (6.1%) |
| $7,500 to $9,999 | 24 (3.2%) | 15 (2.8%) |
| $10,000 to $12,499 | 12 (1.6%) | 10 (1.8%) |
| $12,500 to $14,999 | 29 (3.8%) | 8 (1.5%) |
| $15,000 to $17,499 | 6 (0.8%) | 4 (0.7%) |
| $17,500 to $19,999 | 5 (0.7%) | 0 (0.0%) |
| $20,000 to $22,499 | 19 (2.5%) | 14 (2.6%) |
| $22,500 to $24,999 | 6 (0.8%) | 77 (14.1%) |
| $25,000 to $29,999 | 22 (2.9%) | 53 (9.7%) |
| $30,000 to $34,999 | 8 (1.1%) | 11 (2.0%) |
| $35,000 to $39,999 | 8 (1.1%) | 49 (9.0%) |
| $40,000 to $44,999 | 28 (3.7%) | 28 (5.1%) |
| $45,000 to $49,999 | 19 (2.5%) | 35 (6.4%) |
| $50,000 to $54,999 | 62 (8.2%) | 37 (6.8%) |
| $55,000 to $64,999 | 25 (3.3%) | 19 (3.5%) |
| $65,000 to $74,999 | 43 (5.7%) | 28 (5.1%) |
| $75,000 to $99,999 | 73 (9.6%) | 34 (6.2%) |
| $100,000+ | 295 (38.9%) | 54 (9.9%) |
| Total | 758 (100.0%) | 545 (100.0%) |
Earnings by Sex by Educational Attainment in Hazen
Average earnings in Hazen are $84,886 for men and $39,293 for women, a difference of 53.7%. Men with an educational attainment of bachelor's degree enjoy the highest average annual earnings of $104,773, while those with college or associate's degree education earn the least with $54,783. Women with an educational attainment of graduate degree earn the most with the average annual earnings of $61,563, while those with bachelor's degree education have the smallest earnings of $26,587.
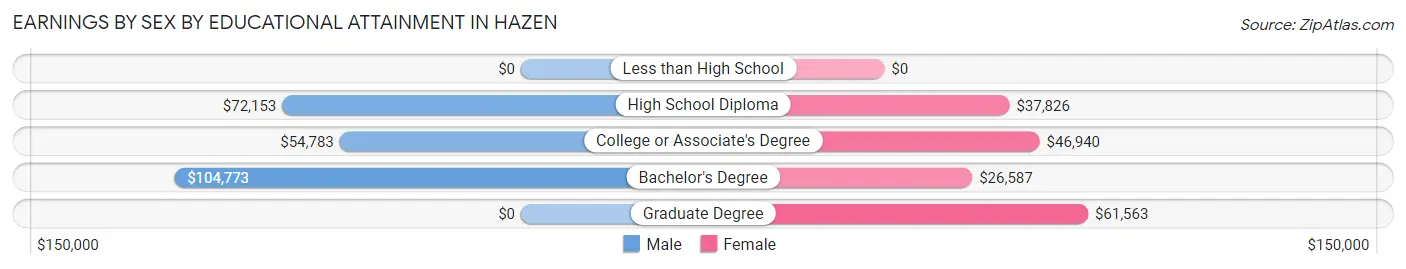
| Educational Attainment | Male Income | Female Income |
| Less than High School | - | - |
| High School Diploma | $72,153 | $37,826 |
| College or Associate's Degree | $54,783 | $46,940 |
| Bachelor's Degree | $104,773 | $26,587 |
| Graduate Degree | - | - |
| Total | $84,886 | $39,293 |
Family Income in Hazen
Family Income Brackets in Hazen
According to the Hazen family income data, there are 154 families falling into the $100,000 to $149,999 income range, which is the most common income bracket and makes up 21.6% of all families.
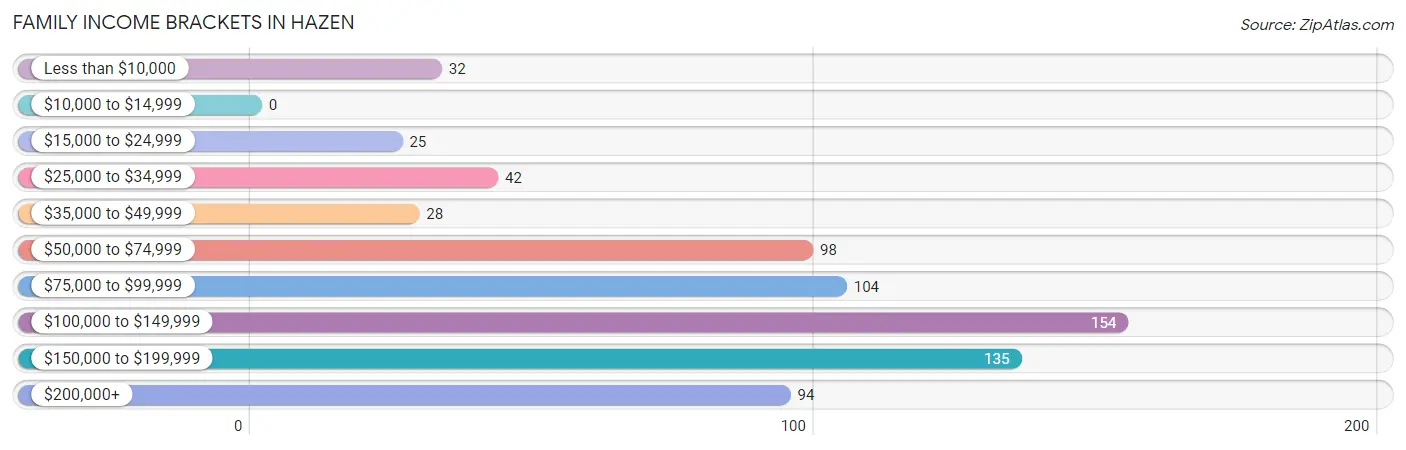
| Income Bracket | # Families | % Families |
| Less than $10,000 | 32 | 4.5% |
| $10,000 to $14,999 | 0 | 0.0% |
| $15,000 to $24,999 | 25 | 3.5% |
| $25,000 to $34,999 | 42 | 5.9% |
| $35,000 to $49,999 | 28 | 3.9% |
| $50,000 to $74,999 | 98 | 13.8% |
| $75,000 to $99,999 | 104 | 14.6% |
| $100,000 to $149,999 | 154 | 21.6% |
| $150,000 to $199,999 | 135 | 19.0% |
| $200,000+ | 94 | 13.2% |
Family Income by Famaliy Size in Hazen
4-person families (124 | 17.4%) account for the highest median family income in Hazen with $157,500 per family, while 2-person families (437 | 61.4%) have the highest median income of $48,229 per family member.
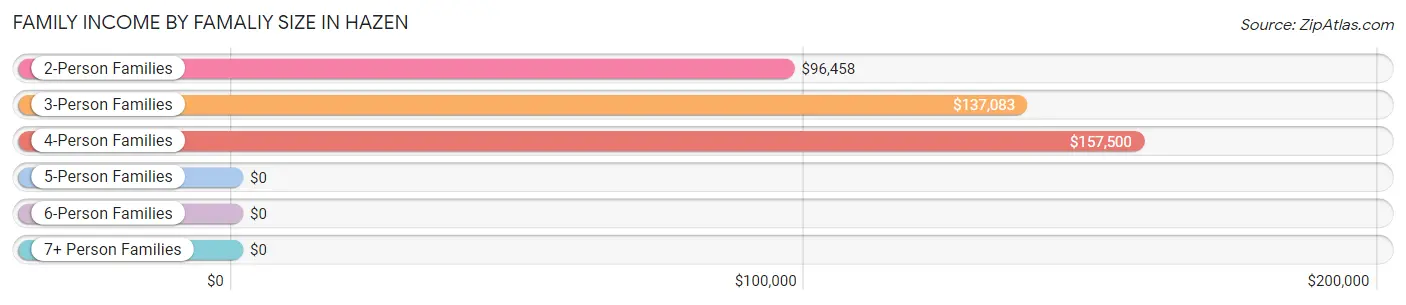
| Income Bracket | # Families | Median Income |
| 2-Person Families | 437 (61.4%) | $96,458 |
| 3-Person Families | 76 (10.7%) | $137,083 |
| 4-Person Families | 124 (17.4%) | $157,500 |
| 5-Person Families | 64 (9.0%) | $0 |
| 6-Person Families | 11 (1.5%) | $0 |
| 7+ Person Families | 0 (0.0%) | $0 |
| Total | 712 (100.0%) | $105,750 |
Family Income by Number of Earners in Hazen
The median family income in Hazen is $105,750, with families comprising 3+ earners (57) having the highest median family income of $169,563, while families with no earners (172) have the lowest median family income of $68,269, accounting for 8.0% and 24.2% of families, respectively.
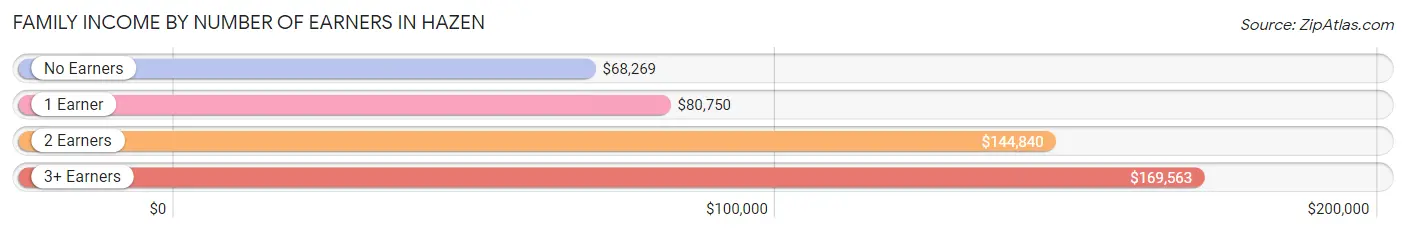
| Number of Earners | # Families | Median Income |
| No Earners | 172 (24.2%) | $68,269 |
| 1 Earner | 168 (23.6%) | $80,750 |
| 2 Earners | 315 (44.2%) | $144,840 |
| 3+ Earners | 57 (8.0%) | $169,563 |
| Total | 712 (100.0%) | $105,750 |
Household Income in Hazen
Household Income Brackets in Hazen
With 232 households falling in the category, the $50,000 to $74,999 income range is the most frequent in Hazen, accounting for 21.2% of all households. In contrast, only 25 households (2.3%) fall into the $10,000 to $14,999 income bracket, making it the least populous group.
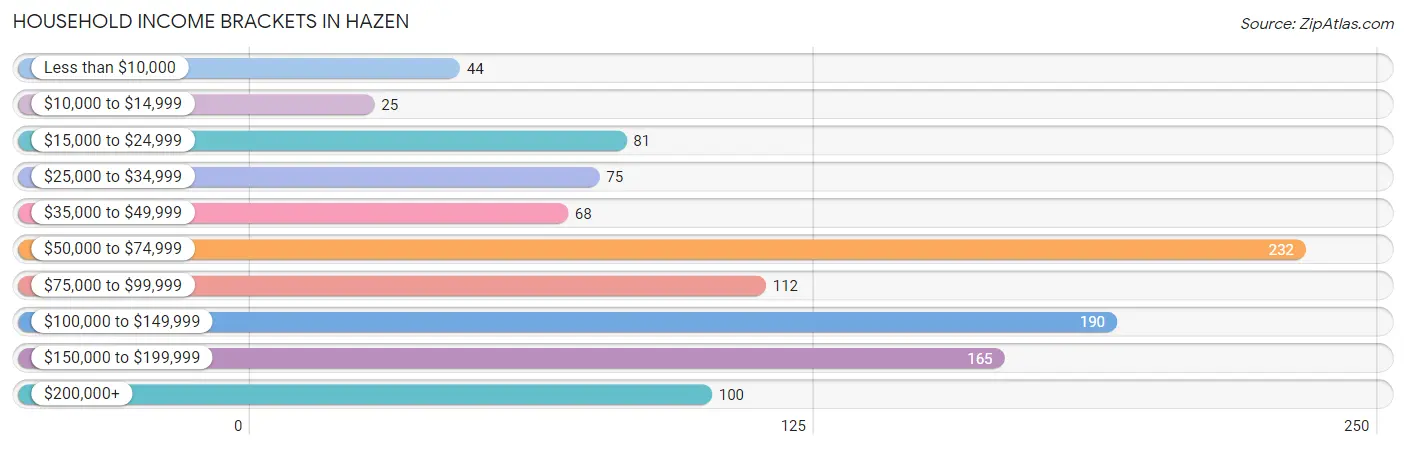
| Income Bracket | # Households | % Households |
| Less than $10,000 | 44 | 4.0% |
| $10,000 to $14,999 | 25 | 2.3% |
| $15,000 to $24,999 | 81 | 7.4% |
| $25,000 to $34,999 | 75 | 6.9% |
| $35,000 to $49,999 | 68 | 6.2% |
| $50,000 to $74,999 | 232 | 21.2% |
| $75,000 to $99,999 | 112 | 10.3% |
| $100,000 to $149,999 | 190 | 17.4% |
| $150,000 to $199,999 | 165 | 15.1% |
| $200,000+ | 100 | 9.2% |
Household Income by Householder Age in Hazen
The median household income in Hazen is $79,231, with the highest median household income of $133,250 found in the 25 to 44 years age bracket for the primary householder. A total of 306 households (28.0%) fall into this category. Meanwhile, the 15 to 24 years age bracket for the primary householder has the lowest median household income of $0, with 37 households (3.4%) in this group.
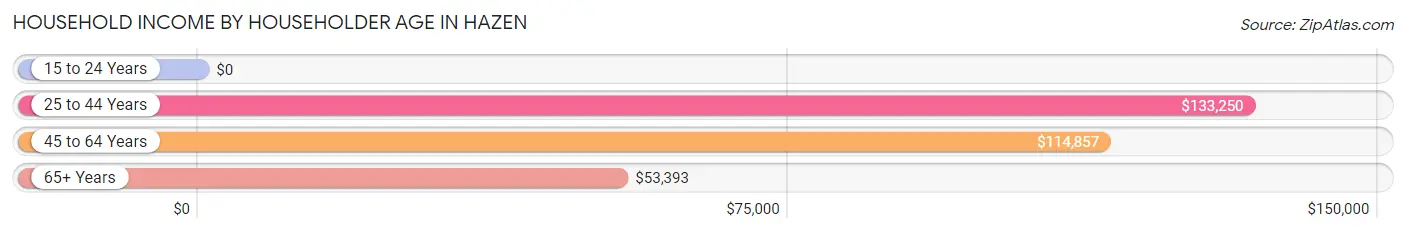
| Income Bracket | # Households | Median Income |
| 15 to 24 Years | 37 (3.4%) | $0 |
| 25 to 44 Years | 306 (28.0%) | $133,250 |
| 45 to 64 Years | 386 (35.3%) | $114,857 |
| 65+ Years | 363 (33.2%) | $53,393 |
| Total | 1,092 (100.0%) | $79,231 |
Poverty in Hazen
Income Below Poverty by Sex and Age in Hazen
With 7.3% poverty level for males and 16.8% for females among the residents of Hazen, 5 year old males and 5 year old females are the most vulnerable to poverty, with 32 males (52.5%) and 22 females (100.0%) in their respective age groups living below the poverty level.
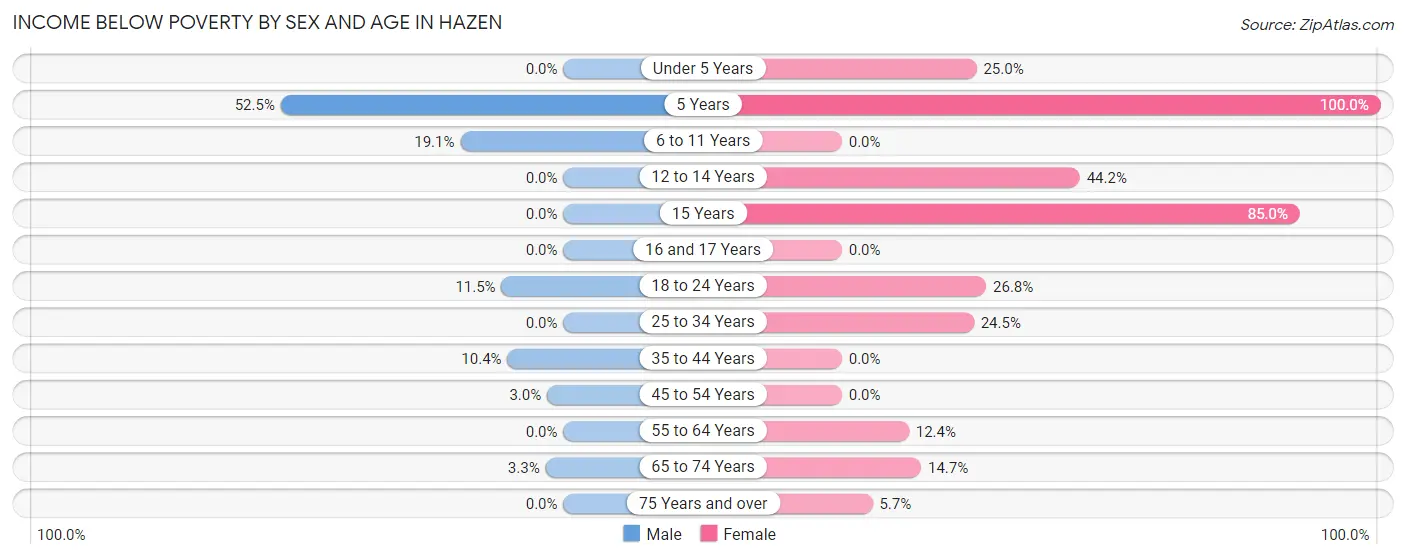
| Age Bracket | Male | Female |
| Under 5 Years | 0 (0.0%) | 19 (25.0%) |
| 5 Years | 32 (52.5%) | 22 (100.0%) |
| 6 to 11 Years | 26 (19.1%) | 0 (0.0%) |
| 12 to 14 Years | 0 (0.0%) | 34 (44.2%) |
| 15 Years | 0 (0.0%) | 17 (85.0%) |
| 16 and 17 Years | 0 (0.0%) | 0 (0.0%) |
| 18 to 24 Years | 10 (11.5%) | 15 (26.8%) |
| 25 to 34 Years | 0 (0.0%) | 36 (24.5%) |
| 35 to 44 Years | 19 (10.4%) | 0 (0.0%) |
| 45 to 54 Years | 6 (3.0%) | 0 (0.0%) |
| 55 to 64 Years | 0 (0.0%) | 27 (12.4%) |
| 65 to 74 Years | 6 (3.3%) | 20 (14.7%) |
| 75 Years and over | 0 (0.0%) | 7 (5.7%) |
| Total | 99 (7.3%) | 197 (16.8%) |
Income Above Poverty by Sex and Age in Hazen
According to the poverty statistics in Hazen, males aged under 5 years and females aged 6 to 11 years are the age groups that are most secure financially, with 100.0% of males and 100.0% of females in these age groups living above the poverty line.
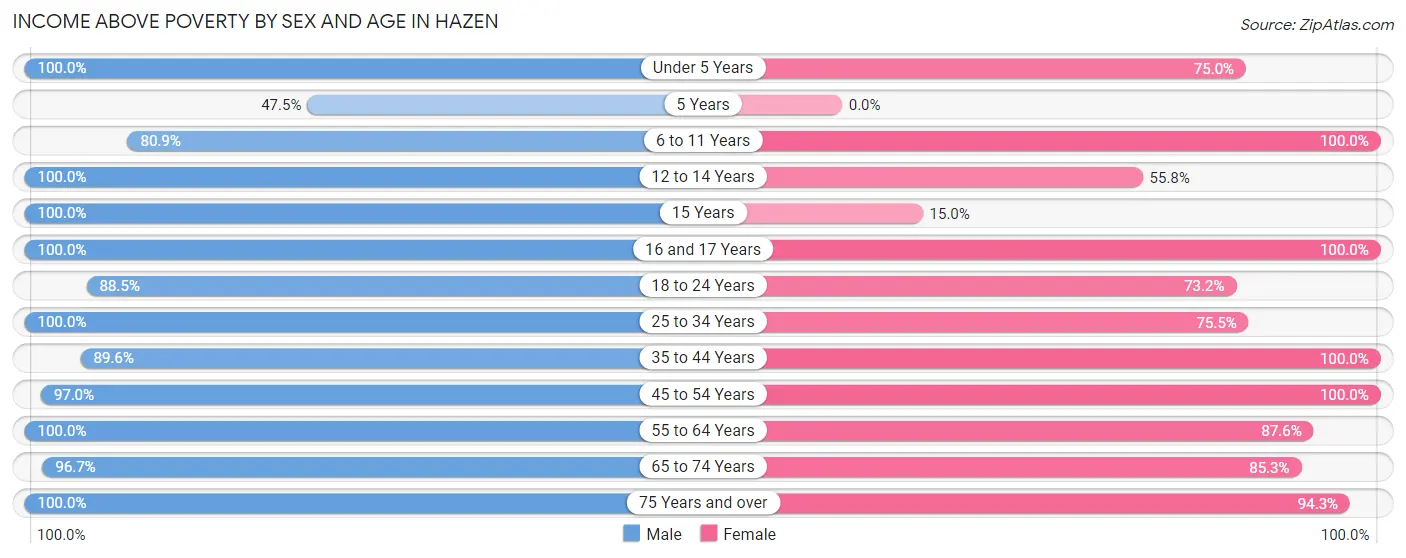
| Age Bracket | Male | Female |
| Under 5 Years | 97 (100.0%) | 57 (75.0%) |
| 5 Years | 29 (47.5%) | 0 (0.0%) |
| 6 to 11 Years | 110 (80.9%) | 52 (100.0%) |
| 12 to 14 Years | 39 (100.0%) | 43 (55.8%) |
| 15 Years | 3 (100.0%) | 3 (15.0%) |
| 16 and 17 Years | 16 (100.0%) | 6 (100.0%) |
| 18 to 24 Years | 77 (88.5%) | 41 (73.2%) |
| 25 to 34 Years | 80 (100.0%) | 111 (75.5%) |
| 35 to 44 Years | 164 (89.6%) | 136 (100.0%) |
| 45 to 54 Years | 192 (97.0%) | 107 (100.0%) |
| 55 to 64 Years | 187 (100.0%) | 190 (87.6%) |
| 65 to 74 Years | 175 (96.7%) | 116 (85.3%) |
| 75 Years and over | 96 (100.0%) | 116 (94.3%) |
| Total | 1,265 (92.7%) | 978 (83.2%) |
Income Below Poverty Among Married-Couple Families in Hazen
The poverty statistics for married-couple families in Hazen show that 1.6% or 10 of the total 629 families live below the poverty line. Families with no children have the highest poverty rate of 2.2%, comprising of 10 families. On the other hand, families with 1 or 2 children have the lowest poverty rate of 0.0%, which includes 0 families.
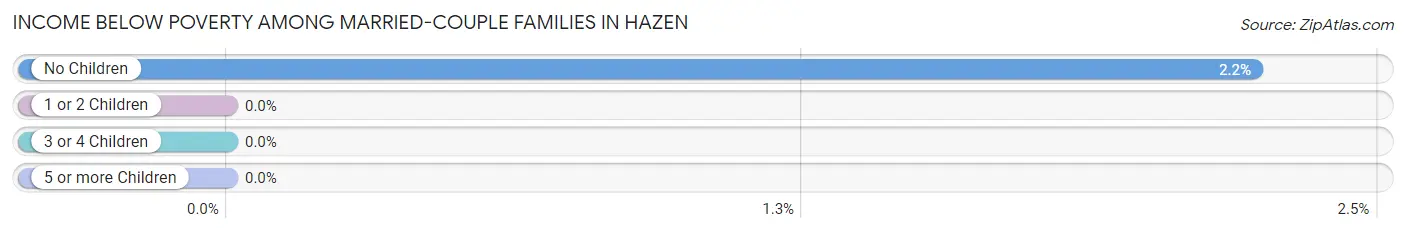
| Children | Above Poverty | Below Poverty |
| No Children | 438 (97.8%) | 10 (2.2%) |
| 1 or 2 Children | 136 (100.0%) | 0 (0.0%) |
| 3 or 4 Children | 45 (100.0%) | 0 (0.0%) |
| 5 or more Children | 0 (0.0%) | 0 (0.0%) |
| Total | 619 (98.4%) | 10 (1.6%) |
Income Below Poverty Among Single-Parent Households in Hazen
According to the poverty data in Hazen, 45.2% or 19 single-father households and 53.7% or 22 single-mother households are living below the poverty line. Among single-father households, those with 3 or 4 children have the highest poverty rate, with 19 households (86.4%) experiencing poverty. Likewise, among single-mother households, those with 3 or 4 children have the highest poverty rate, with 22 households (88.0%) falling below the poverty line.
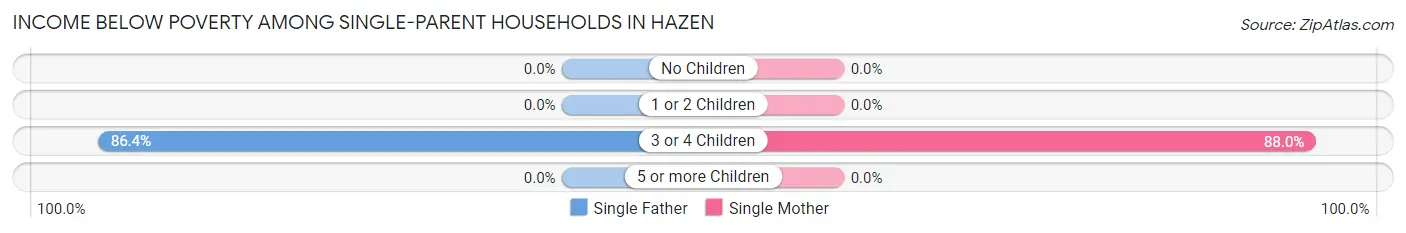
| Children | Single Father | Single Mother |
| No Children | 0 (0.0%) | 0 (0.0%) |
| 1 or 2 Children | 0 (0.0%) | 0 (0.0%) |
| 3 or 4 Children | 19 (86.4%) | 22 (88.0%) |
| 5 or more Children | 0 (0.0%) | 0 (0.0%) |
| Total | 19 (45.2%) | 22 (53.7%) |
Income Below Poverty Among Married-Couple vs Single-Parent Households in Hazen
The poverty data for Hazen shows that 10 of the married-couple family households (1.6%) and 41 of the single-parent households (49.4%) are living below the poverty level. Within the married-couple family households, those with no children have the highest poverty rate, with 10 households (2.2%) falling below the poverty line. Among the single-parent households, those with 3 or 4 children have the highest poverty rate, with 41 household (87.2%) living below poverty.
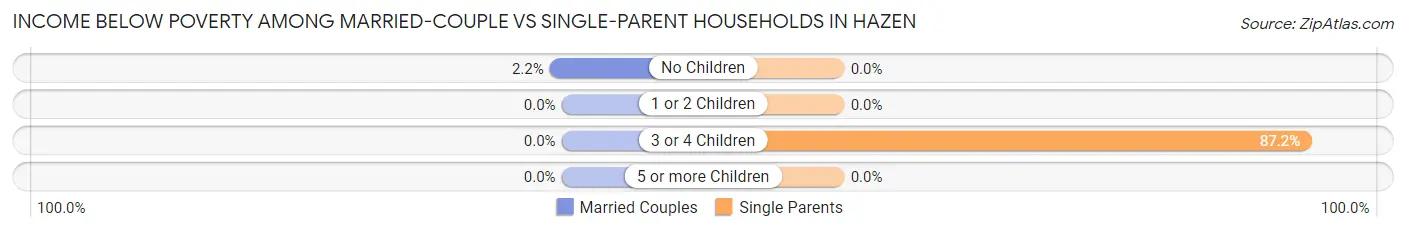
| Children | Married-Couple Families | Single-Parent Households |
| No Children | 10 (2.2%) | 0 (0.0%) |
| 1 or 2 Children | 0 (0.0%) | 0 (0.0%) |
| 3 or 4 Children | 0 (0.0%) | 41 (87.2%) |
| 5 or more Children | 0 (0.0%) | 0 (0.0%) |
| Total | 10 (1.6%) | 41 (49.4%) |
Race in Hazen
The most populous races in Hazen are White / Caucasian (2,308 | 89.8%), Some other Race (130 | 5.1%), and Hispanic or Latino (122 | 4.8%).
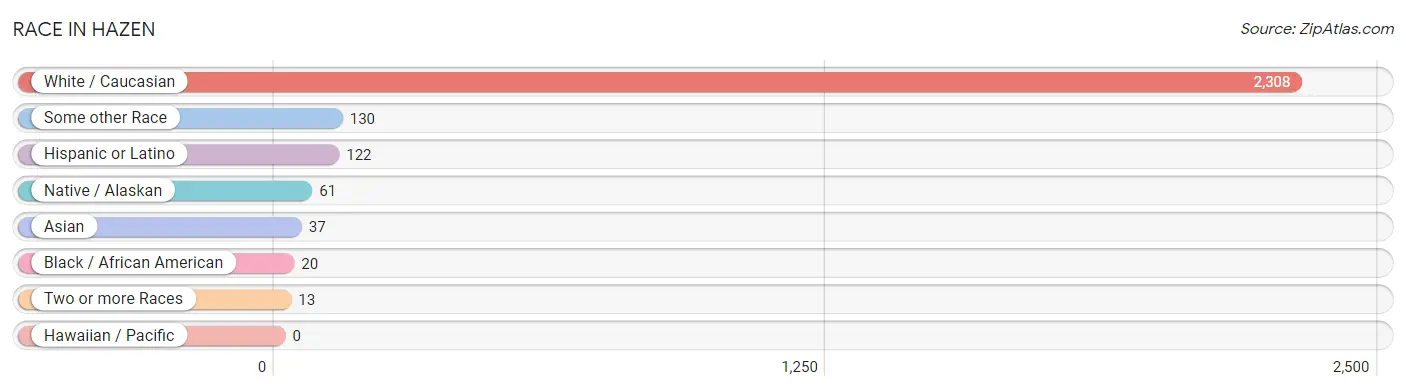
| Race | # Population | % Population |
| Asian | 37 | 1.4% |
| Black / African American | 20 | 0.8% |
| Hawaiian / Pacific | 0 | 0.0% |
| Hispanic or Latino | 122 | 4.8% |
| Native / Alaskan | 61 | 2.4% |
| White / Caucasian | 2,308 | 89.8% |
| Two or more Races | 13 | 0.5% |
| Some other Race | 130 | 5.1% |
| Total | 2,569 | 100.0% |
Ancestry in Hazen
The most populous ancestries reported in Hazen are German (1,263 | 49.2%), Norwegian (472 | 18.4%), Russian (189 | 7.4%), English (152 | 5.9%), and Irish (126 | 4.9%), together accounting for 85.7% of all Hazen residents.
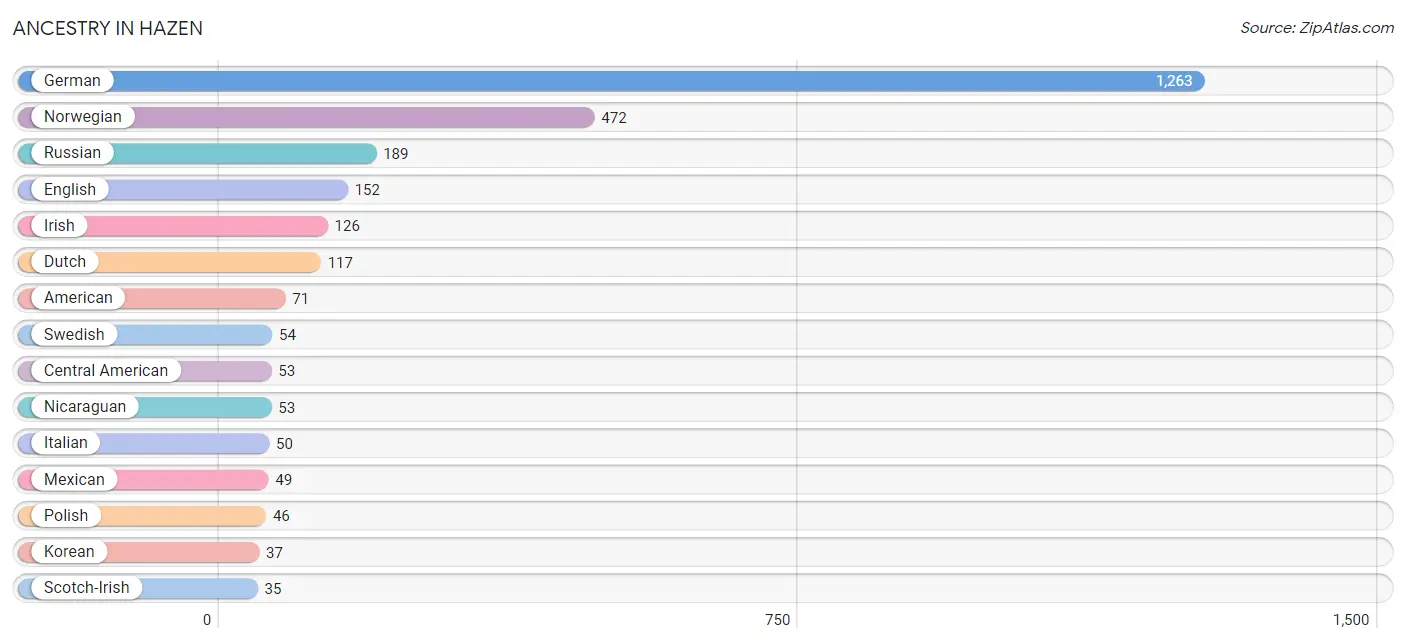
| Ancestry | # Population | % Population |
| American | 71 | 2.8% |
| Central American | 53 | 2.1% |
| Cherokee | 5 | 0.2% |
| Chippewa | 8 | 0.3% |
| Creek | 33 | 1.3% |
| Czech | 11 | 0.4% |
| Danish | 10 | 0.4% |
| Dutch | 117 | 4.5% |
| English | 152 | 5.9% |
| European | 11 | 0.4% |
| Finnish | 7 | 0.3% |
| French | 34 | 1.3% |
| French Canadian | 12 | 0.5% |
| German | 1,263 | 49.2% |
| German Russian | 12 | 0.5% |
| Hungarian | 26 | 1.0% |
| Icelander | 3 | 0.1% |
| Irish | 126 | 4.9% |
| Italian | 50 | 1.9% |
| Korean | 37 | 1.4% |
| Mexican | 49 | 1.9% |
| Nicaraguan | 53 | 2.1% |
| Norwegian | 472 | 18.4% |
| Polish | 46 | 1.8% |
| Russian | 189 | 7.4% |
| Scandinavian | 18 | 0.7% |
| Scotch-Irish | 35 | 1.4% |
| Scottish | 5 | 0.2% |
| Swedish | 54 | 2.1% |
| Welsh | 19 | 0.7% | View All 30 Rows |
Immigrants in Hazen
The most numerous immigrant groups reported in Hazen came from Africa (26 | 1.0%), Eastern Africa (26 | 1.0%), Zimbabwe (26 | 1.0%), Asia (24 | 0.9%), and Philippines (24 | 0.9%), together accounting for 4.9% of all Hazen residents.
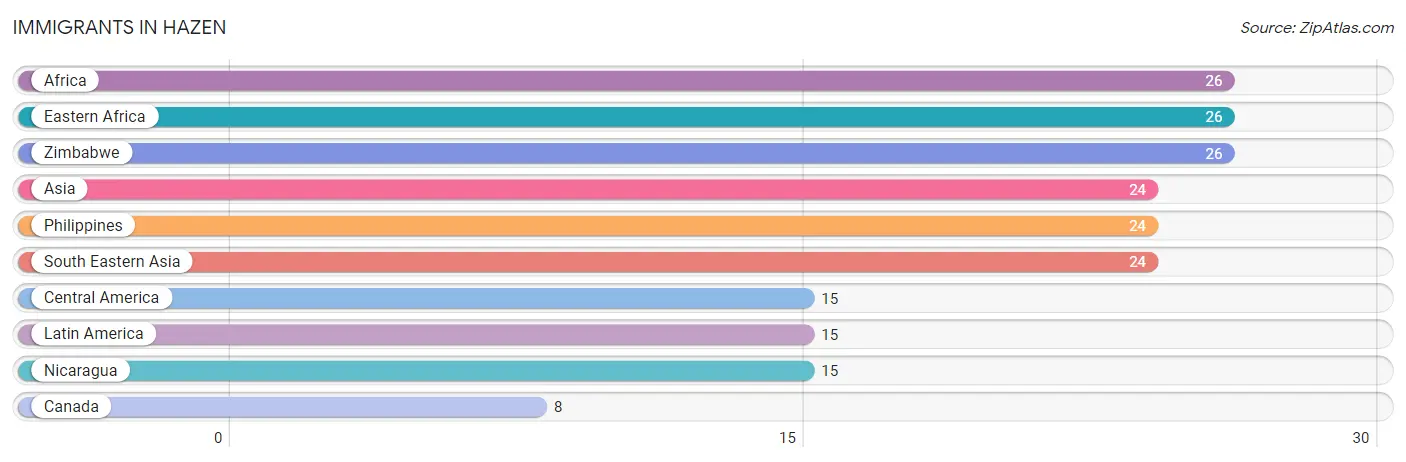
| Immigration Origin | # Population | % Population |
| Africa | 26 | 1.0% |
| Asia | 24 | 0.9% |
| Canada | 8 | 0.3% |
| Central America | 15 | 0.6% |
| Eastern Africa | 26 | 1.0% |
| Latin America | 15 | 0.6% |
| Nicaragua | 15 | 0.6% |
| Philippines | 24 | 0.9% |
| South Eastern Asia | 24 | 0.9% |
| Zimbabwe | 26 | 1.0% | View All 10 Rows |
Sex and Age in Hazen
Sex and Age in Hazen
The most populous age groups in Hazen are 5 to 9 Years (148 | 10.8%) for men and 60 to 64 Years (121 | 10.1%) for women.
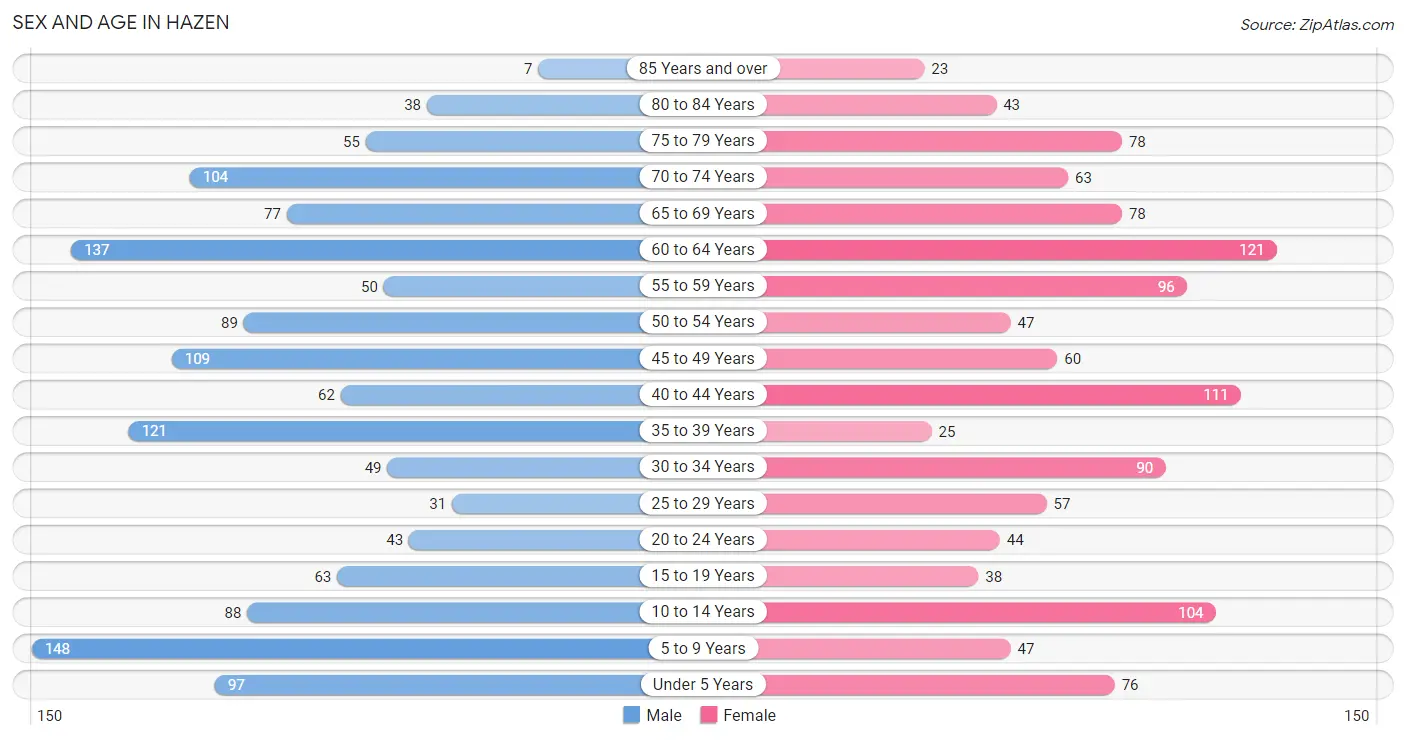
| Age Bracket | Male | Female |
| Under 5 Years | 97 (7.1%) | 76 (6.3%) |
| 5 to 9 Years | 148 (10.8%) | 47 (3.9%) |
| 10 to 14 Years | 88 (6.4%) | 104 (8.7%) |
| 15 to 19 Years | 63 (4.6%) | 38 (3.2%) |
| 20 to 24 Years | 43 (3.1%) | 44 (3.7%) |
| 25 to 29 Years | 31 (2.3%) | 57 (4.8%) |
| 30 to 34 Years | 49 (3.6%) | 90 (7.5%) |
| 35 to 39 Years | 121 (8.8%) | 25 (2.1%) |
| 40 to 44 Years | 62 (4.5%) | 111 (9.2%) |
| 45 to 49 Years | 109 (8.0%) | 60 (5.0%) |
| 50 to 54 Years | 89 (6.5%) | 47 (3.9%) |
| 55 to 59 Years | 50 (3.6%) | 96 (8.0%) |
| 60 to 64 Years | 137 (10.0%) | 121 (10.1%) |
| 65 to 69 Years | 77 (5.6%) | 78 (6.5%) |
| 70 to 74 Years | 104 (7.6%) | 63 (5.2%) |
| 75 to 79 Years | 55 (4.0%) | 78 (6.5%) |
| 80 to 84 Years | 38 (2.8%) | 43 (3.6%) |
| 85 Years and over | 7 (0.5%) | 23 (1.9%) |
| Total | 1,368 (100.0%) | 1,201 (100.0%) |
Families and Households in Hazen
Median Family Size in Hazen
The median family size in Hazen is 2.85 persons per family, with single male/father families (42 | 5.9%) accounting for the largest median family size of 3.81 persons per family. On the other hand, married-couple families (629 | 88.3%) represent the smallest median family size with 2.73 persons per family.
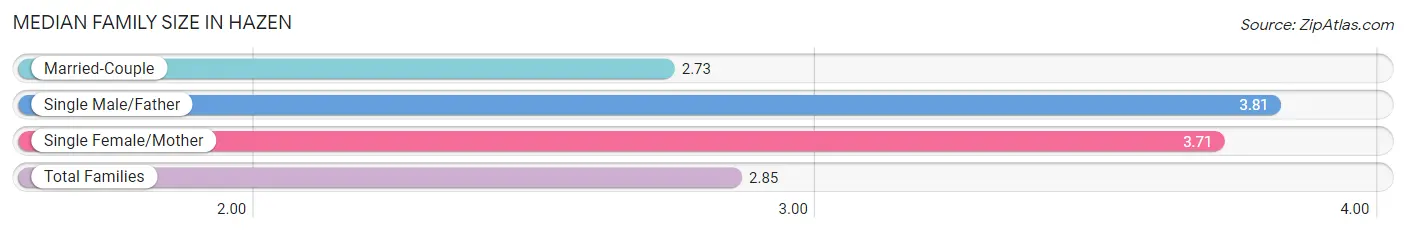
| Family Type | # Families | Family Size |
| Married-Couple | 629 (88.3%) | 2.73 |
| Single Male/Father | 42 (5.9%) | 3.81 |
| Single Female/Mother | 41 (5.8%) | 3.71 |
| Total Families | 712 (100.0%) | 2.85 |
Median Household Size in Hazen
The median household size in Hazen is 2.32 persons per household, with single male/father households (42 | 3.8%) accounting for the largest median household size of 4.02 persons per household. non-family households (380 | 34.8%) represent the smallest median household size with 1.26 persons per household.
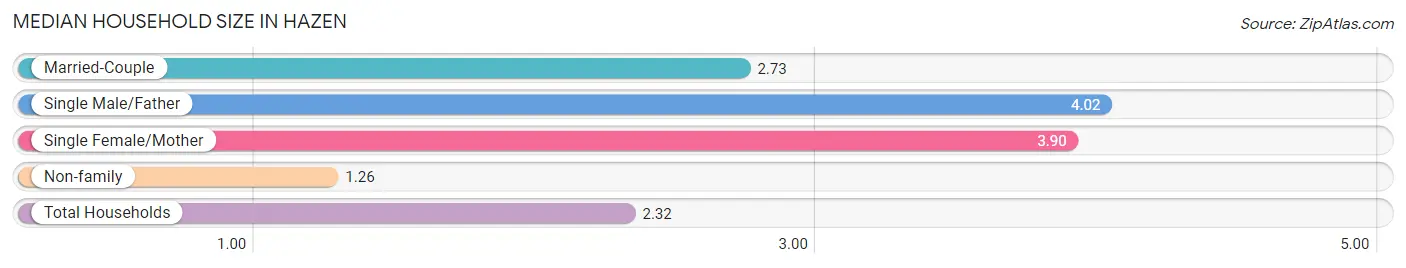
| Household Type | # Households | Household Size |
| Married-Couple | 629 (57.6%) | 2.73 |
| Single Male/Father | 42 (3.8%) | 4.02 |
| Single Female/Mother | 41 (3.7%) | 3.90 |
| Non-family | 380 (34.8%) | 1.26 |
| Total Households | 1,092 (100.0%) | 2.32 |
Household Size by Marriage Status in Hazen
Out of a total of 1,092 households in Hazen, 712 (65.2%) are family households, while 380 (34.8%) are nonfamily households. The most numerous type of family households are 2-person households, comprising 427, and the most common type of nonfamily households are 1-person households, comprising 300.
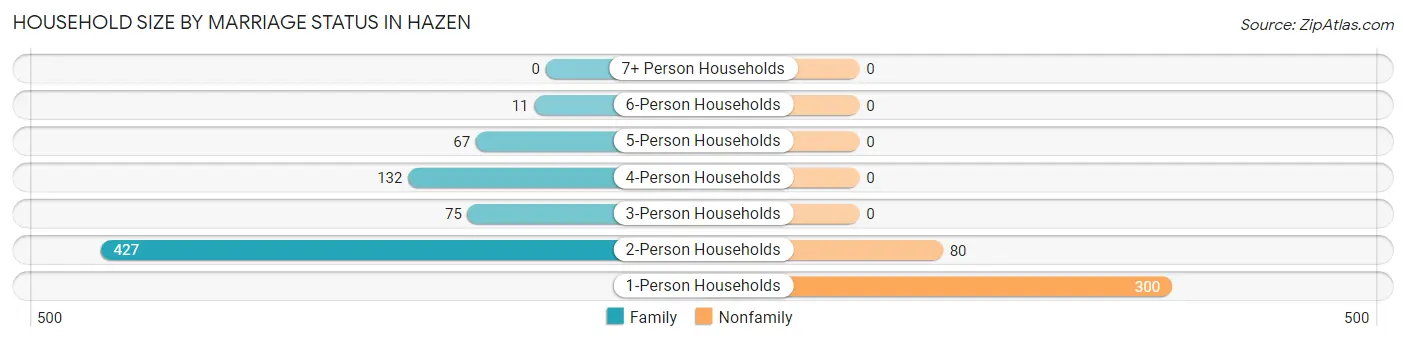
| Household Size | Family Households | Nonfamily Households |
| 1-Person Households | - | 300 (27.5%) |
| 2-Person Households | 427 (39.1%) | 80 (7.3%) |
| 3-Person Households | 75 (6.9%) | 0 (0.0%) |
| 4-Person Households | 132 (12.1%) | 0 (0.0%) |
| 5-Person Households | 67 (6.1%) | 0 (0.0%) |
| 6-Person Households | 11 (1.0%) | 0 (0.0%) |
| 7+ Person Households | 0 (0.0%) | 0 (0.0%) |
| Total | 712 (65.2%) | 380 (34.8%) |
Female Fertility in Hazen
Fertility by Age in Hazen
Average fertility rate in Hazen is 32.0 births per 1,000 women. Women in the age bracket of 20 to 34 years have the highest fertility rate with 73.0 births per 1,000 women. Women in the age bracket of 20 to 34 years acount for 100.0% of all women with births.
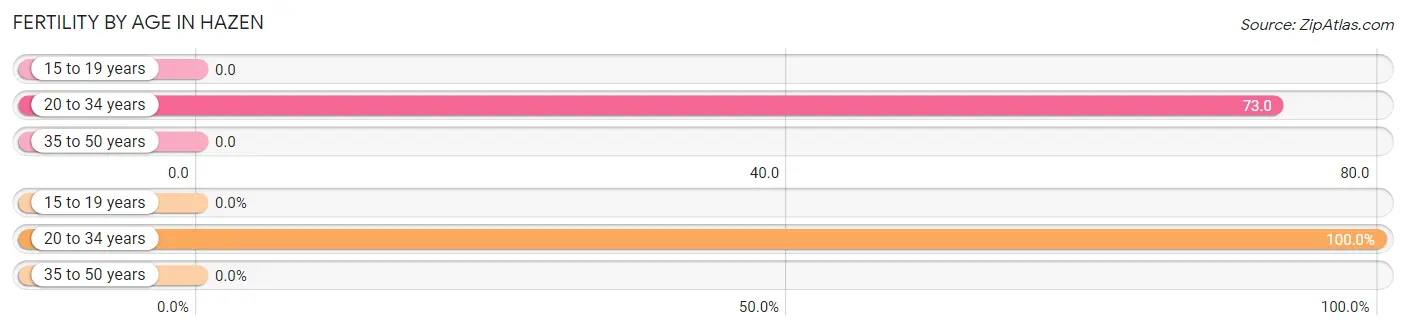
| Age Bracket | Women with Births | Births / 1,000 Women |
| 15 to 19 years | 0 (0.0%) | 0.0 |
| 20 to 34 years | 14 (100.0%) | 73.0 |
| 35 to 50 years | 0 (0.0%) | 0.0 |
| Total | 14 (100.0%) | 32.0 |
Fertility by Age by Marriage Status in Hazen
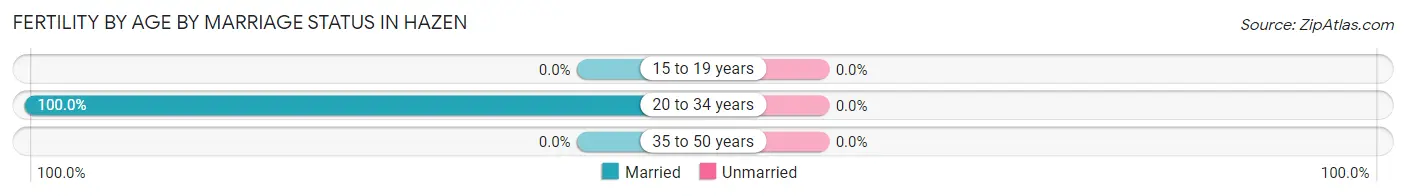
| Age Bracket | Married | Unmarried |
| 15 to 19 years | 0 (0.0%) | 0 (0.0%) |
| 20 to 34 years | 14 (100.0%) | 0 (0.0%) |
| 35 to 50 years | 0 (0.0%) | 0 (0.0%) |
| Total | 14 (100.0%) | 0 (0.0%) |
Fertility by Education in Hazen
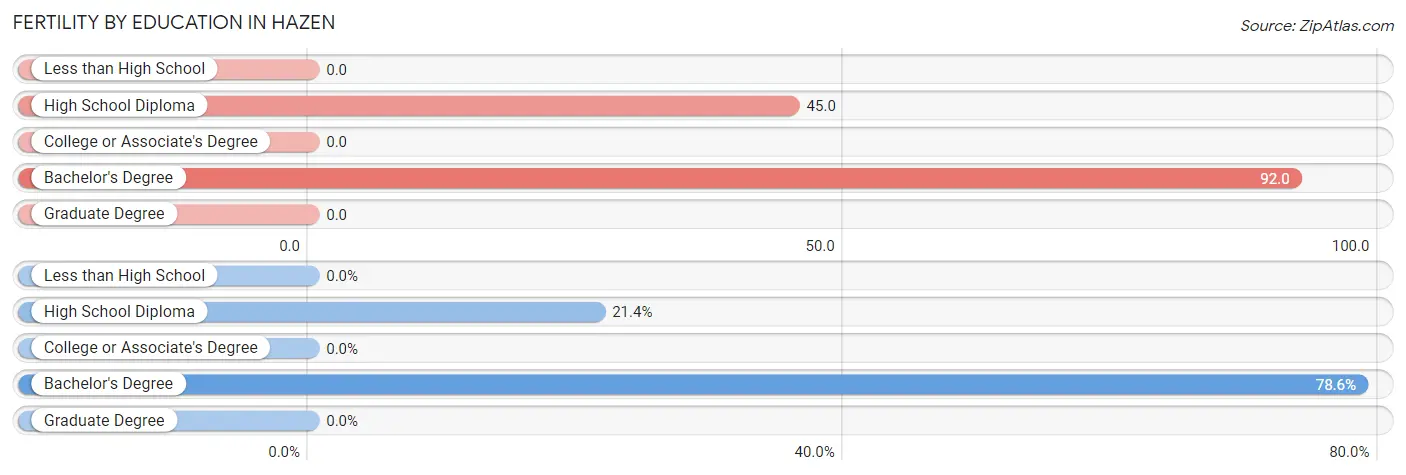
| Educational Attainment | Women with Births | Births / 1,000 Women |
| Less than High School | 0 (0.0%) | 0.0 |
| High School Diploma | 3 (21.4%) | 45.0 |
| College or Associate's Degree | 0 (0.0%) | 0.0 |
| Bachelor's Degree | 11 (78.6%) | 92.0 |
| Graduate Degree | 0 (0.0%) | 0.0 |
| Total | 14 (100.0%) | 32.0 |
Fertility by Education by Marriage Status in Hazen
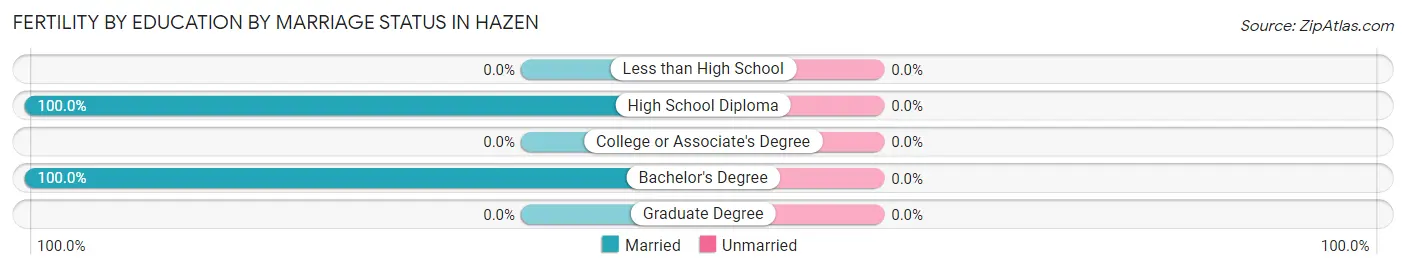
| Educational Attainment | Married | Unmarried |
| Less than High School | 0 (0.0%) | 0 (0.0%) |
| High School Diploma | 3 (100.0%) | 0 (0.0%) |
| College or Associate's Degree | 0 (0.0%) | 0 (0.0%) |
| Bachelor's Degree | 11 (100.0%) | 0 (0.0%) |
| Graduate Degree | 0 (0.0%) | 0 (0.0%) |
| Total | 14 (100.0%) | 0 (0.0%) |
Employment Characteristics in Hazen
Employment by Class of Employer in Hazen
Among the 1,156 employed individuals in Hazen, private company employees (957 | 82.8%), not-for-profit organizations (56 | 4.8%), and local government employees (54 | 4.7%) make up the most common classes of employment.
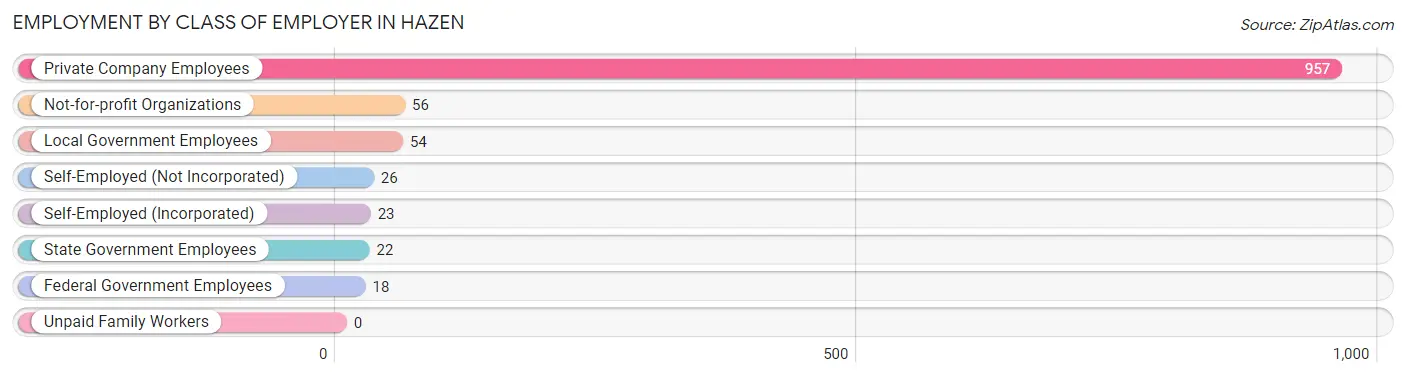
| Employer Class | # Employees | % Employees |
| Private Company Employees | 957 | 82.8% |
| Self-Employed (Incorporated) | 23 | 2.0% |
| Self-Employed (Not Incorporated) | 26 | 2.2% |
| Not-for-profit Organizations | 56 | 4.8% |
| Local Government Employees | 54 | 4.7% |
| State Government Employees | 22 | 1.9% |
| Federal Government Employees | 18 | 1.6% |
| Unpaid Family Workers | 0 | 0.0% |
| Total | 1,156 | 100.0% |
Employment Status by Age in Hazen
According to the labor force statistics for Hazen, out of the total population over 16 years of age (1,986), 60.9% or 1,209 individuals are in the labor force, with 4.1% or 50 of them unemployed. The age group with the highest labor force participation rate is 35 to 44 years, with 95.0% or 303 individuals in the labor force. Within the labor force, the 65 to 74 years age range has the highest percentage of unemployed individuals, with 47.5% or 19 of them being unemployed.
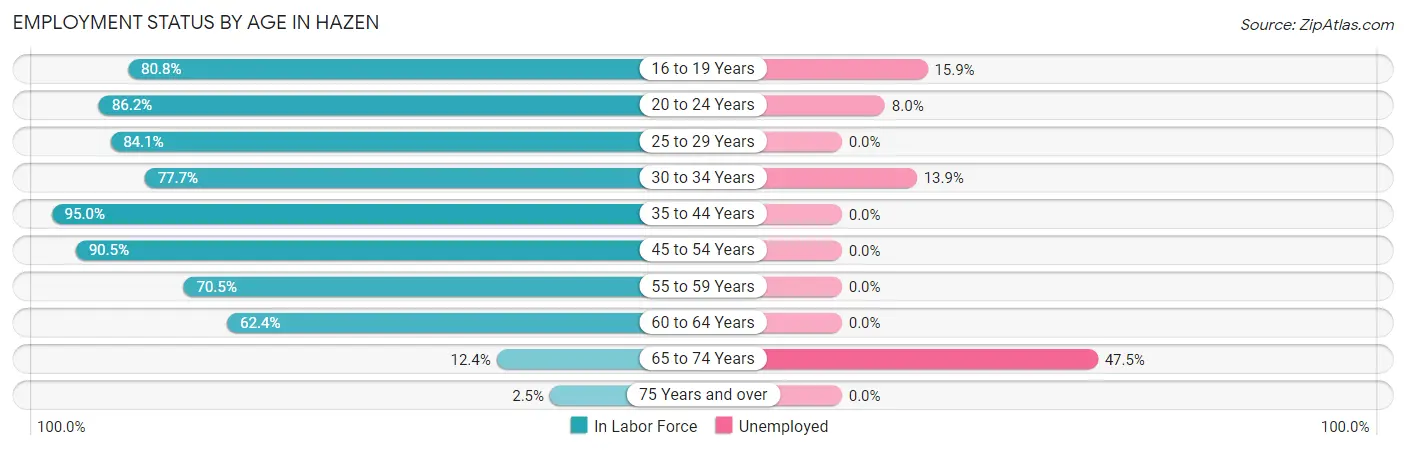
| Age Bracket | In Labor Force | Unemployed |
| 16 to 19 Years | 63 (80.8%) | 10 (15.9%) |
| 20 to 24 Years | 75 (86.2%) | 6 (8.0%) |
| 25 to 29 Years | 74 (84.1%) | 0 (0.0%) |
| 30 to 34 Years | 108 (77.7%) | 15 (13.9%) |
| 35 to 44 Years | 303 (95.0%) | 0 (0.0%) |
| 45 to 54 Years | 276 (90.5%) | 0 (0.0%) |
| 55 to 59 Years | 103 (70.5%) | 0 (0.0%) |
| 60 to 64 Years | 161 (62.4%) | 0 (0.0%) |
| 65 to 74 Years | 40 (12.4%) | 19 (47.5%) |
| 75 Years and over | 6 (2.5%) | 0 (0.0%) |
| Total | 1,209 (60.9%) | 50 (4.1%) |
Employment Status by Educational Attainment in Hazen
According to labor force statistics for Hazen, 81.7% of individuals (1,025) out of the total population between 25 and 64 years of age (1,255) are in the labor force, with 1.5% or 15 of them being unemployed. The group with the highest labor force participation rate are those with the educational attainment of bachelor's degree or higher, with 95.0% or 363 individuals in the labor force. Within the labor force, individuals with bachelor's degree or higher education have the highest percentage of unemployment, with 4.1% or 15 of them being unemployed.
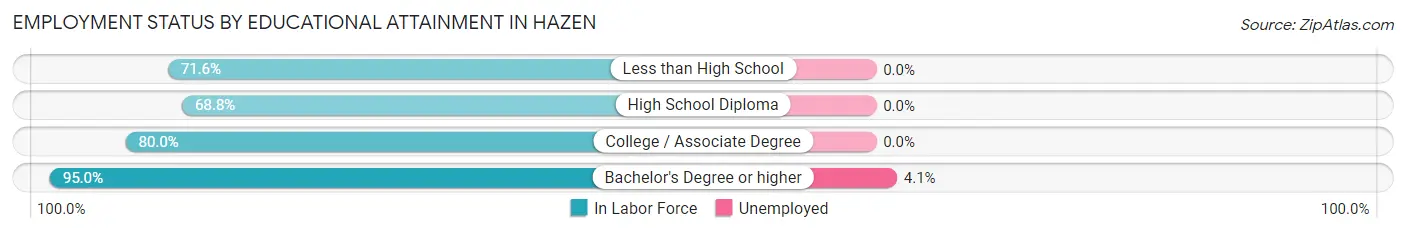
| Educational Attainment | In Labor Force | Unemployed |
| Less than High School | 58 (71.6%) | 0 (0.0%) |
| High School Diploma | 181 (68.8%) | 0 (0.0%) |
| College / Associate Degree | 423 (80.0%) | 0 (0.0%) |
| Bachelor's Degree or higher | 363 (95.0%) | 16 (4.1%) |
| Total | 1,025 (81.7%) | 19 (1.5%) |
Employment Occupations by Sex in Hazen
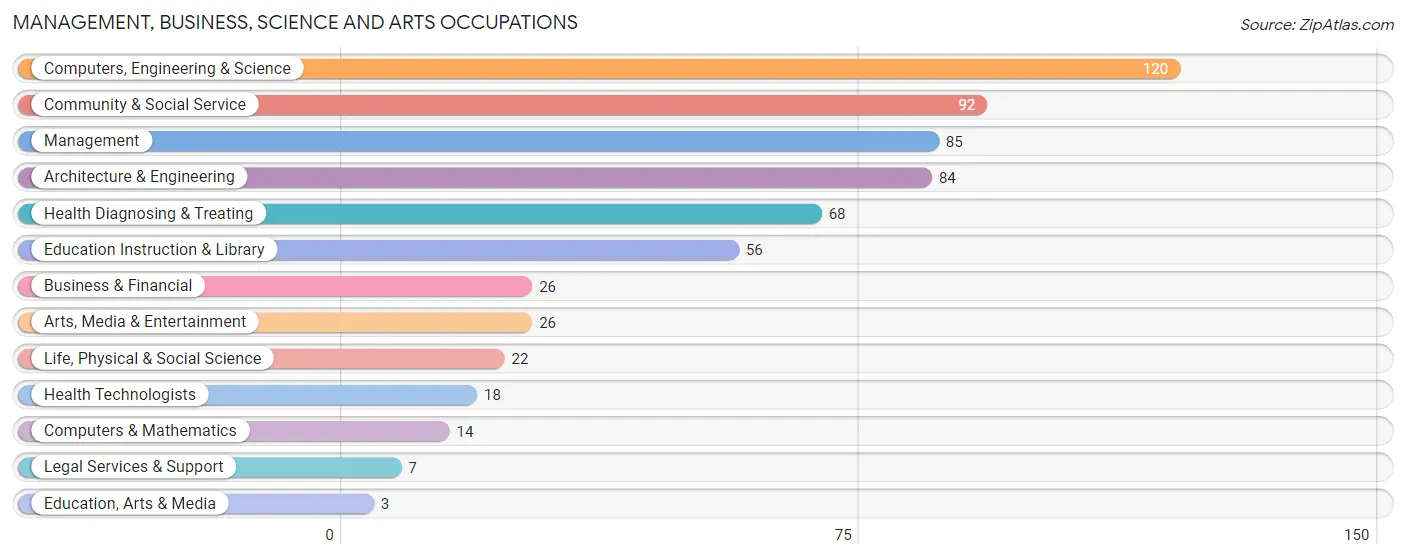
Management, Business, Science and Arts Occupations
The most common Management, Business, Science and Arts occupations in Hazen are Computers, Engineering & Science (120 | 10.3%), Community & Social Service (92 | 7.9%), Management (85 | 7.3%), Architecture & Engineering (84 | 7.2%), and Health Diagnosing & Treating (68 | 5.9%).
Management, Business, Science and Arts Occupations by Sex
Within the Management, Business, Science and Arts occupations in Hazen, the most male-oriented occupations are Architecture & Engineering (100.0%), Life, Physical & Social Science (100.0%), and Computers, Engineering & Science (95.0%), while the most female-oriented occupations are Community & Social Service (100.0%), Education, Arts & Media (100.0%), and Legal Services & Support (100.0%).
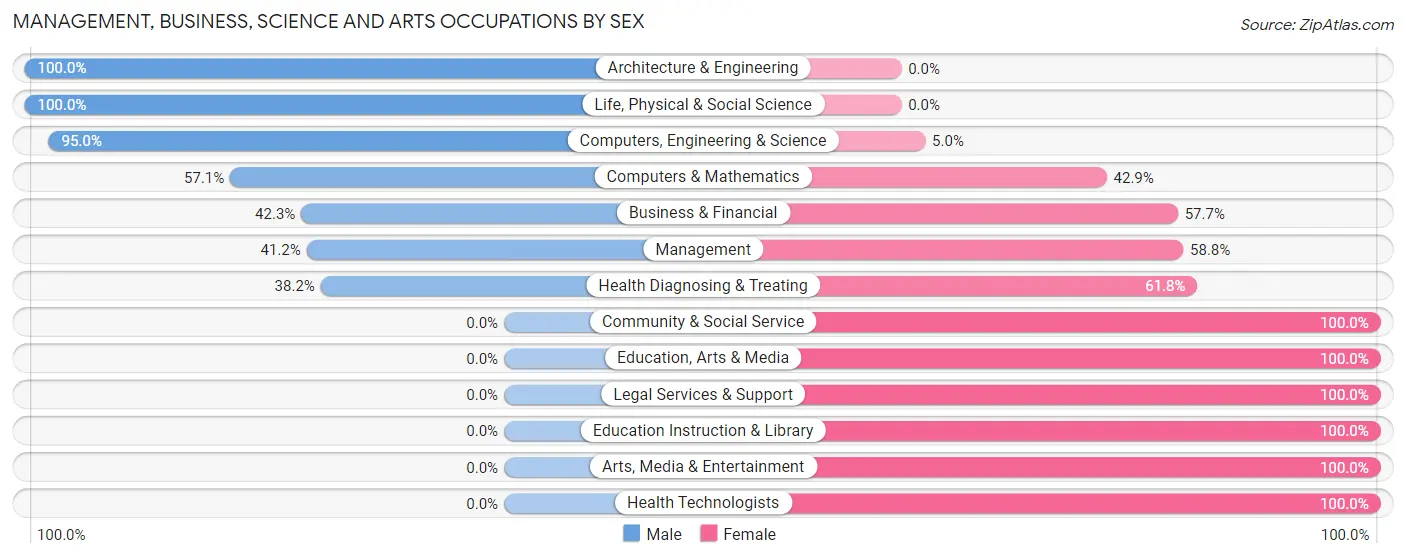
| Occupation | Male | Female |
| Management | 35 (41.2%) | 50 (58.8%) |
| Business & Financial | 11 (42.3%) | 15 (57.7%) |
| Computers, Engineering & Science | 114 (95.0%) | 6 (5.0%) |
| Computers & Mathematics | 8 (57.1%) | 6 (42.9%) |
| Architecture & Engineering | 84 (100.0%) | 0 (0.0%) |
| Life, Physical & Social Science | 22 (100.0%) | 0 (0.0%) |
| Community & Social Service | 0 (0.0%) | 92 (100.0%) |
| Education, Arts & Media | 0 (0.0%) | 3 (100.0%) |
| Legal Services & Support | 0 (0.0%) | 7 (100.0%) |
| Education Instruction & Library | 0 (0.0%) | 56 (100.0%) |
| Arts, Media & Entertainment | 0 (0.0%) | 26 (100.0%) |
| Health Diagnosing & Treating | 26 (38.2%) | 42 (61.8%) |
| Health Technologists | 0 (0.0%) | 18 (100.0%) |
| Total (Category) | 186 (47.6%) | 205 (52.4%) |
| Total (Overall) | 673 (58.1%) | 486 (41.9%) |
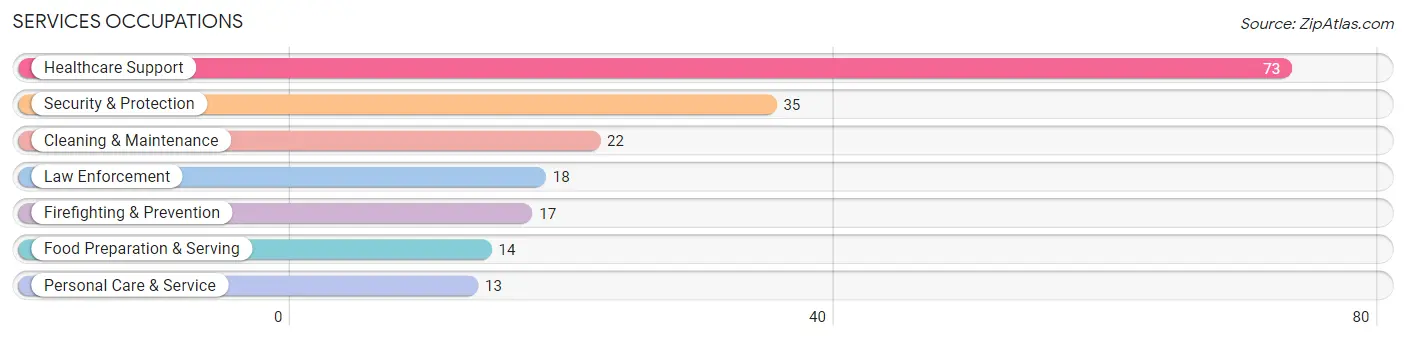
Services Occupations
The most common Services occupations in Hazen are Healthcare Support (73 | 6.3%), Security & Protection (35 | 3.0%), Cleaning & Maintenance (22 | 1.9%), Law Enforcement (18 | 1.5%), and Firefighting & Prevention (17 | 1.5%).
Services Occupations by Sex
Within the Services occupations in Hazen, the most male-oriented occupations are Security & Protection (100.0%), Firefighting & Prevention (100.0%), and Law Enforcement (100.0%), while the most female-oriented occupations are Healthcare Support (100.0%), Food Preparation & Serving (100.0%), and Personal Care & Service (100.0%).
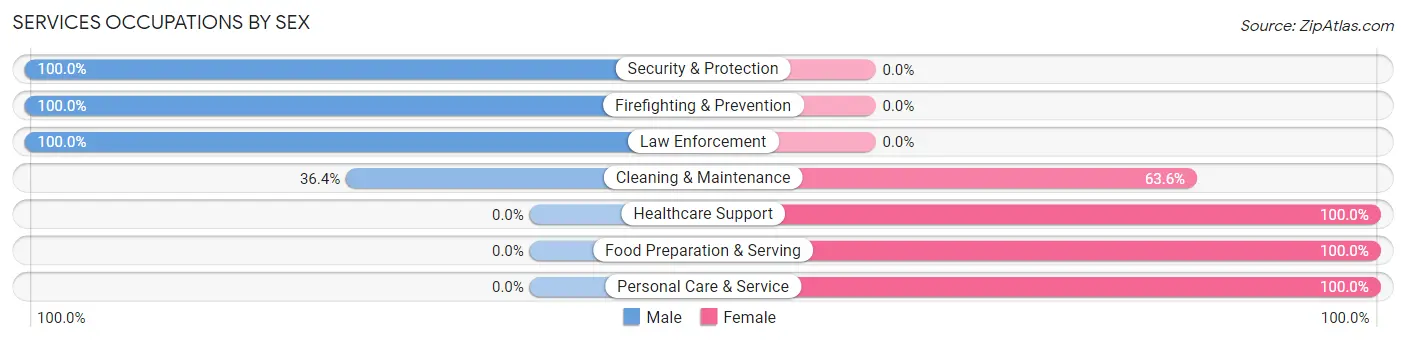
| Occupation | Male | Female |
| Healthcare Support | 0 (0.0%) | 73 (100.0%) |
| Security & Protection | 35 (100.0%) | 0 (0.0%) |
| Firefighting & Prevention | 17 (100.0%) | 0 (0.0%) |
| Law Enforcement | 18 (100.0%) | 0 (0.0%) |
| Food Preparation & Serving | 0 (0.0%) | 14 (100.0%) |
| Cleaning & Maintenance | 8 (36.4%) | 14 (63.6%) |
| Personal Care & Service | 0 (0.0%) | 13 (100.0%) |
| Total (Category) | 43 (27.4%) | 114 (72.6%) |
| Total (Overall) | 673 (58.1%) | 486 (41.9%) |
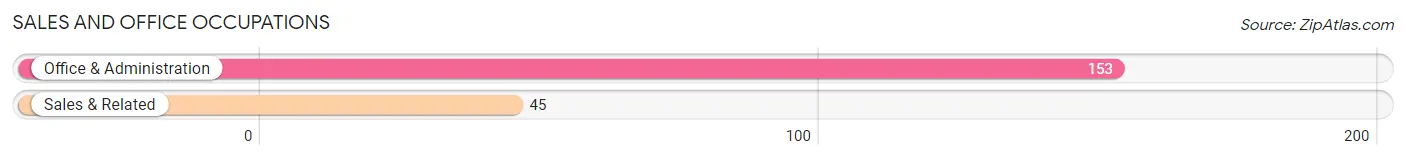
Sales and Office Occupations
The most common Sales and Office occupations in Hazen are Office & Administration (153 | 13.2%), and Sales & Related (45 | 3.9%).
Sales and Office Occupations by Sex
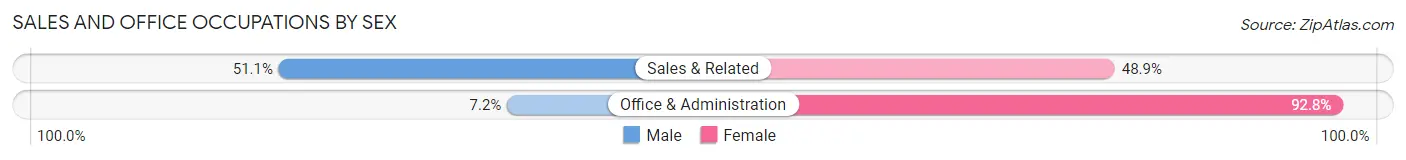
| Occupation | Male | Female |
| Sales & Related | 23 (51.1%) | 22 (48.9%) |
| Office & Administration | 11 (7.2%) | 142 (92.8%) |
| Total (Category) | 34 (17.2%) | 164 (82.8%) |
| Total (Overall) | 673 (58.1%) | 486 (41.9%) |
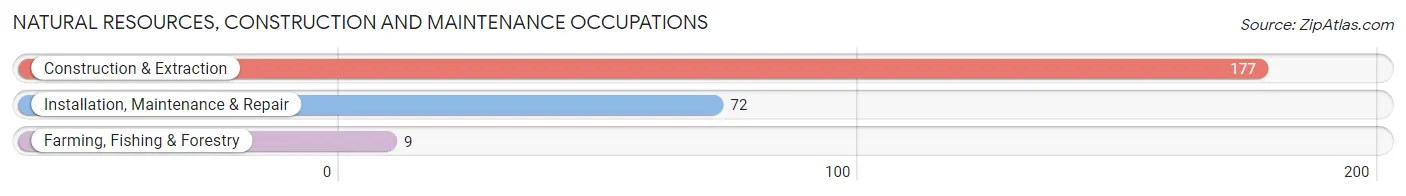
Natural Resources, Construction and Maintenance Occupations
The most common Natural Resources, Construction and Maintenance occupations in Hazen are Construction & Extraction (177 | 15.3%), Installation, Maintenance & Repair (72 | 6.2%), and Farming, Fishing & Forestry (9 | 0.8%).
Natural Resources, Construction and Maintenance Occupations by Sex
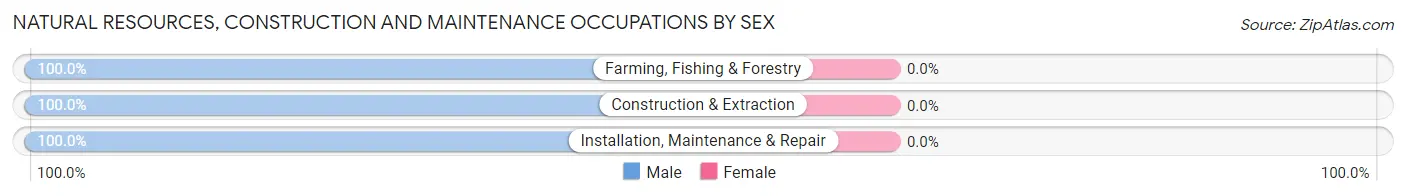
| Occupation | Male | Female |
| Farming, Fishing & Forestry | 9 (100.0%) | 0 (0.0%) |
| Construction & Extraction | 177 (100.0%) | 0 (0.0%) |
| Installation, Maintenance & Repair | 72 (100.0%) | 0 (0.0%) |
| Total (Category) | 258 (100.0%) | 0 (0.0%) |
| Total (Overall) | 673 (58.1%) | 486 (41.9%) |
Production, Transportation and Moving Occupations
The most common Production, Transportation and Moving occupations in Hazen are Production (78 | 6.7%), Material Moving (44 | 3.8%), and Transportation (33 | 2.9%).
Production, Transportation and Moving Occupations by Sex
| Occupation | Male | Female |
| Production | 78 (100.0%) | 0 (0.0%) |
| Transportation | 33 (100.0%) | 0 (0.0%) |
| Material Moving | 41 (93.2%) | 3 (6.8%) |
| Total (Category) | 152 (98.1%) | 3 (1.9%) |
| Total (Overall) | 673 (58.1%) | 486 (41.9%) |
Employment Industries by Sex in Hazen
Employment Industries in Hazen
The major employment industries in Hazen include Health Care & Social Assistance (168 | 14.5%), Utilities (145 | 12.5%), Mining, Quarrying, & Extraction (142 | 12.2%), Construction (96 | 8.3%), and Retail Trade (89 | 7.7%).
Employment Industries by Sex in Hazen
The Hazen industries that see more men than women are Agriculture, Fishing & Hunting (100.0%), Construction (100.0%), and Administrative & Support (100.0%), whereas the industries that tend to have a higher number of women are Health Care & Social Assistance (100.0%), Accommodation & Food Services (100.0%), and Educational Services (97.5%).
| Industry | Male | Female |
| Agriculture, Fishing & Hunting | 30 (100.0%) | 0 (0.0%) |
| Mining, Quarrying, & Extraction | 133 (93.7%) | 9 (6.3%) |
| Construction | 96 (100.0%) | 0 (0.0%) |
| Manufacturing | 47 (94.0%) | 3 (6.0%) |
| Wholesale Trade | 10 (83.3%) | 2 (16.7%) |
| Retail Trade | 59 (66.3%) | 30 (33.7%) |
| Transportation & Warehousing | 11 (18.6%) | 48 (81.4%) |
| Utilities | 140 (96.6%) | 5 (3.5%) |
| Information | 28 (96.6%) | 1 (3.5%) |
| Finance & Insurance | 2 (3.9%) | 49 (96.1%) |
| Real Estate, Rental & Leasing | 15 (62.5%) | 9 (37.5%) |
| Professional & Scientific | 6 (12.5%) | 42 (87.5%) |
| Enterprise Management | 0 (0.0%) | 0 (0.0%) |
| Administrative & Support | 8 (100.0%) | 0 (0.0%) |
| Educational Services | 2 (2.5%) | 79 (97.5%) |
| Health Care & Social Assistance | 0 (0.0%) | 168 (100.0%) |
| Arts, Entertainment & Recreation | 6 (66.7%) | 3 (33.3%) |
| Accommodation & Food Services | 0 (0.0%) | 5 (100.0%) |
| Public Administration | 30 (90.9%) | 3 (9.1%) |
| Total | 673 (58.1%) | 486 (41.9%) |
Education in Hazen
School Enrollment in Hazen
The most common levels of schooling among the 504 students in Hazen are middle school (147 | 29.2%), elementary school (84 | 16.7%), and high school (84 | 16.7%).
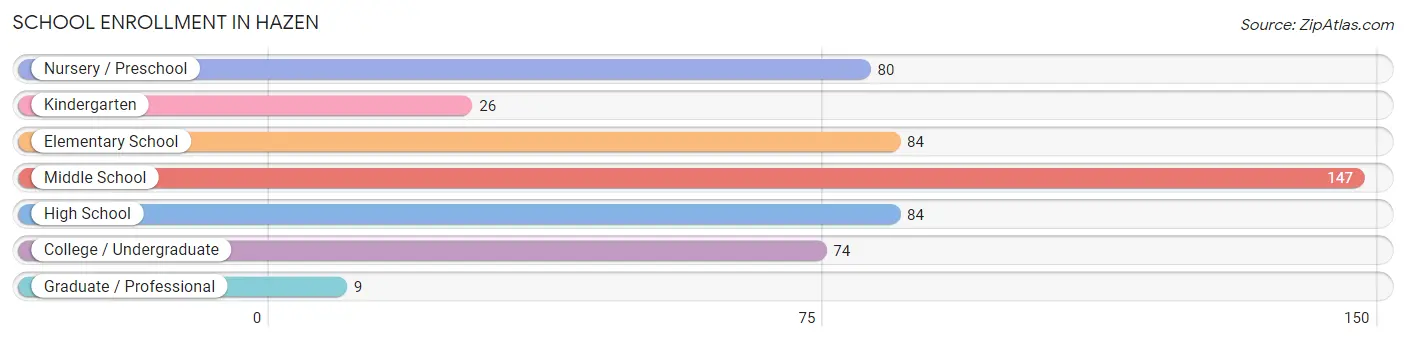
| School Level | # Students | % Students |
| Nursery / Preschool | 80 | 15.9% |
| Kindergarten | 26 | 5.2% |
| Elementary School | 84 | 16.7% |
| Middle School | 147 | 29.2% |
| High School | 84 | 16.7% |
| College / Undergraduate | 74 | 14.7% |
| Graduate / Professional | 9 | 1.8% |
| Total | 504 | 100.0% |
School Enrollment by Age by Funding Source in Hazen
Out of a total of 504 students who are enrolled in schools in Hazen, 50 (9.9%) attend a private institution, while the remaining 454 (90.1%) are enrolled in public schools. The age group of 5 to 9 year old has the highest likelihood of being enrolled in private schools, with 22 (17.5% in the age bracket) enrolled. Conversely, the age group of 15 to 17 year olds has the lowest likelihood of being enrolled in a private school, with 45 (100.0% in the age bracket) attending a public institution.
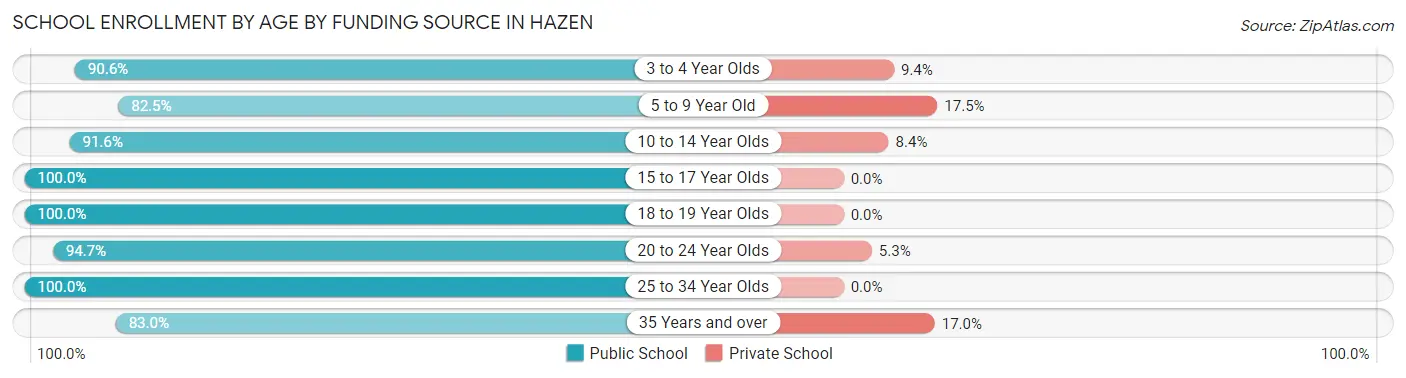
| Age Bracket | Public School | Private School |
| 3 to 4 Year Olds | 29 (90.6%) | 3 (9.4%) |
| 5 to 9 Year Old | 104 (82.5%) | 22 (17.5%) |
| 10 to 14 Year Olds | 164 (91.6%) | 15 (8.4%) |
| 15 to 17 Year Olds | 45 (100.0%) | 0 (0.0%) |
| 18 to 19 Year Olds | 48 (100.0%) | 0 (0.0%) |
| 20 to 24 Year Olds | 18 (94.7%) | 1 (5.3%) |
| 25 to 34 Year Olds | 2 (100.0%) | 0 (0.0%) |
| 35 Years and over | 44 (83.0%) | 9 (17.0%) |
| Total | 454 (90.1%) | 50 (9.9%) |
Educational Attainment by Field of Study in Hazen
Education (144 | 28.9%), business (72 | 14.5%), science & technology (68 | 13.7%), engineering (65 | 13.1%), and psychology (51 | 10.2%) are the most common fields of study among 498 individuals in Hazen who have obtained a bachelor's degree or higher.
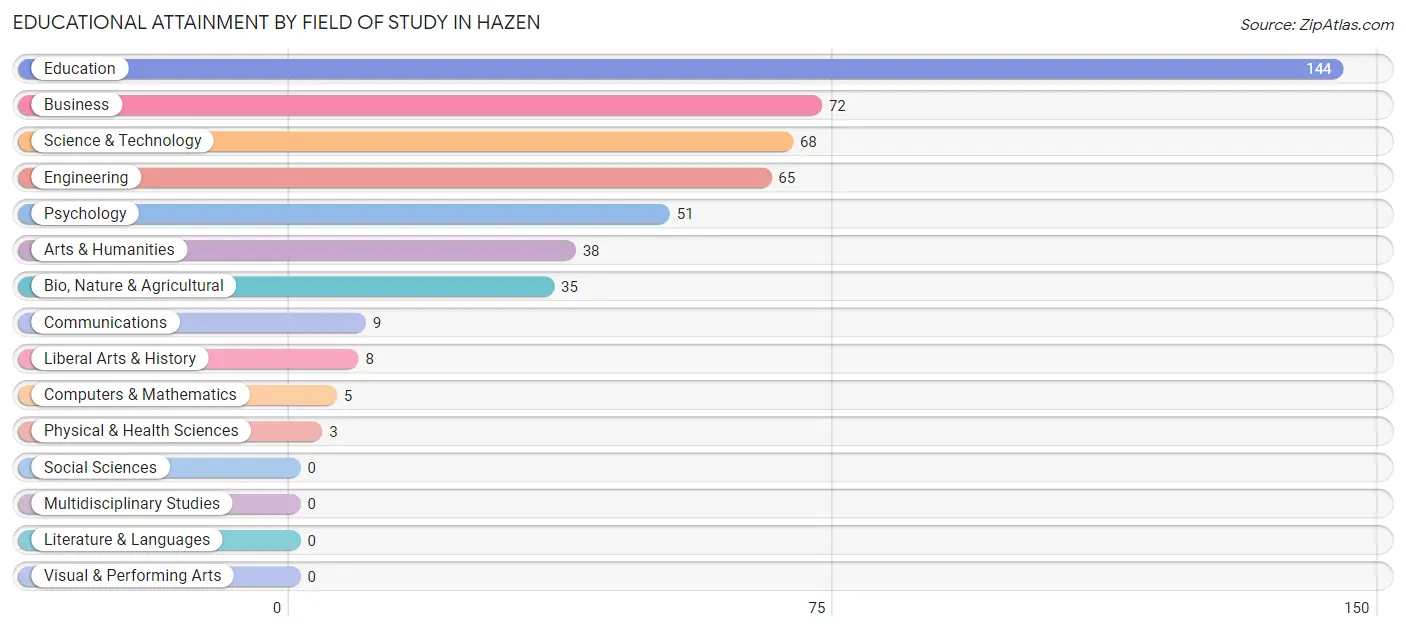
| Field of Study | # Graduates | % Graduates |
| Computers & Mathematics | 5 | 1.0% |
| Bio, Nature & Agricultural | 35 | 7.0% |
| Physical & Health Sciences | 3 | 0.6% |
| Psychology | 51 | 10.2% |
| Social Sciences | 0 | 0.0% |
| Engineering | 65 | 13.1% |
| Multidisciplinary Studies | 0 | 0.0% |
| Science & Technology | 68 | 13.7% |
| Business | 72 | 14.5% |
| Education | 144 | 28.9% |
| Literature & Languages | 0 | 0.0% |
| Liberal Arts & History | 8 | 1.6% |
| Visual & Performing Arts | 0 | 0.0% |
| Communications | 9 | 1.8% |
| Arts & Humanities | 38 | 7.6% |
| Total | 498 | 100.0% |
Transportation & Commute in Hazen
Vehicle Availability by Sex in Hazen
The most prevalent vehicle ownership categories in Hazen are males with 2 vehicles (180, accounting for 26.8%) and females with 2 vehicles (121, making up 37.5%).
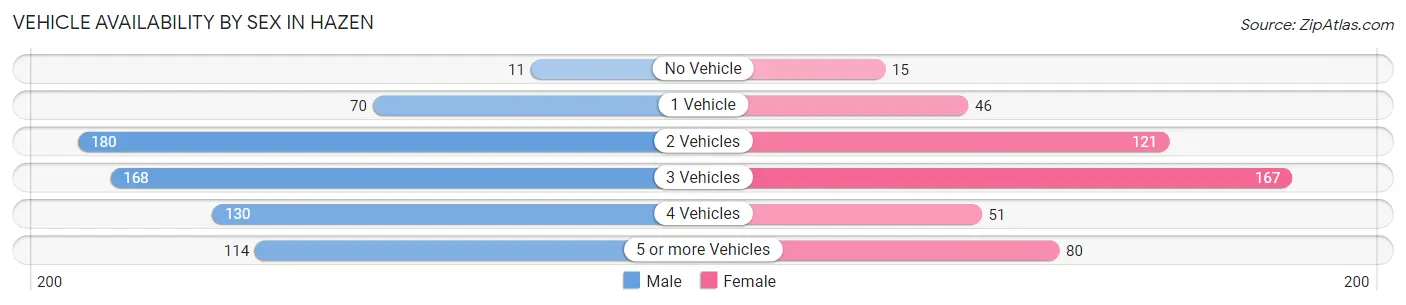
| Vehicles Available | Male | Female |
| No Vehicle | 11 (1.6%) | 15 (3.1%) |
| 1 Vehicle | 70 (10.4%) | 46 (9.6%) |
| 2 Vehicles | 180 (26.8%) | 121 (25.2%) |
| 3 Vehicles | 168 (25.0%) | 167 (34.8%) |
| 4 Vehicles | 130 (19.3%) | 51 (10.6%) |
| 5 or more Vehicles | 114 (16.9%) | 80 (16.7%) |
| Total | 673 (100.0%) | 480 (100.0%) |
Commute Time in Hazen
The most frequently occuring commute durations in Hazen are 5 to 9 minutes (308 commuters, 28.8%), less than 5 minutes (196 commuters, 18.3%), and 15 to 19 minutes (174 commuters, 16.3%).
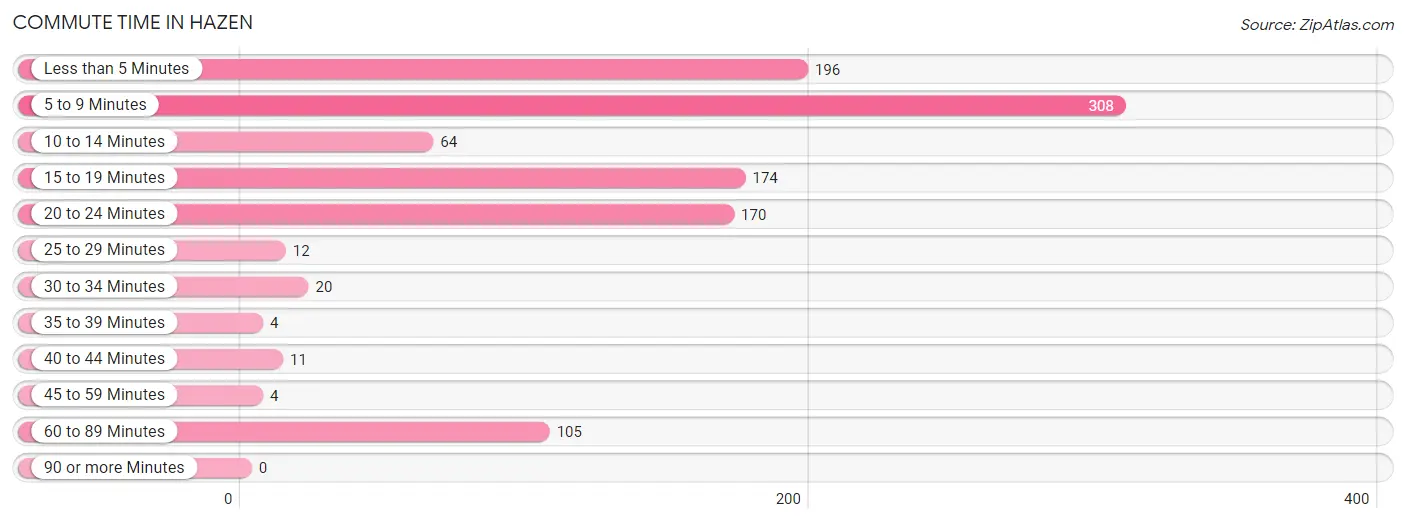
| Commute Time | # Commuters | % Commuters |
| Less than 5 Minutes | 196 | 18.3% |
| 5 to 9 Minutes | 308 | 28.8% |
| 10 to 14 Minutes | 64 | 6.0% |
| 15 to 19 Minutes | 174 | 16.3% |
| 20 to 24 Minutes | 170 | 15.9% |
| 25 to 29 Minutes | 12 | 1.1% |
| 30 to 34 Minutes | 20 | 1.9% |
| 35 to 39 Minutes | 4 | 0.4% |
| 40 to 44 Minutes | 11 | 1.0% |
| 45 to 59 Minutes | 4 | 0.4% |
| 60 to 89 Minutes | 105 | 9.8% |
| 90 or more Minutes | 0 | 0.0% |
Commute Time by Sex in Hazen
The most common commute times in Hazen are 15 to 19 minutes (166 commuters, 25.0%) for males and 5 to 9 minutes (178 commuters, 44.1%) for females.
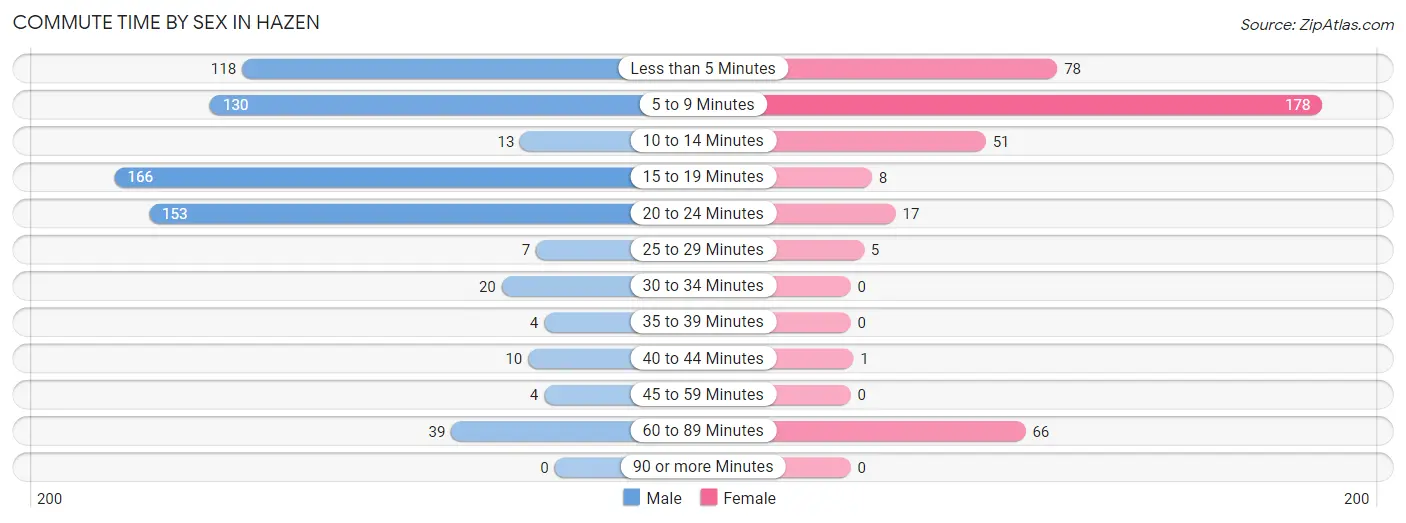
| Commute Time | Male | Female |
| Less than 5 Minutes | 118 (17.8%) | 78 (19.3%) |
| 5 to 9 Minutes | 130 (19.6%) | 178 (44.1%) |
| 10 to 14 Minutes | 13 (2.0%) | 51 (12.6%) |
| 15 to 19 Minutes | 166 (25.0%) | 8 (2.0%) |
| 20 to 24 Minutes | 153 (23.0%) | 17 (4.2%) |
| 25 to 29 Minutes | 7 (1.1%) | 5 (1.2%) |
| 30 to 34 Minutes | 20 (3.0%) | 0 (0.0%) |
| 35 to 39 Minutes | 4 (0.6%) | 0 (0.0%) |
| 40 to 44 Minutes | 10 (1.5%) | 1 (0.3%) |
| 45 to 59 Minutes | 4 (0.6%) | 0 (0.0%) |
| 60 to 89 Minutes | 39 (5.9%) | 66 (16.3%) |
| 90 or more Minutes | 0 (0.0%) | 0 (0.0%) |
Time of Departure to Work by Sex in Hazen
The most frequent times of departure to work in Hazen are 6:30 AM to 6:59 AM (116, 17.5%) for males and 7:00 AM to 7:29 AM (102, 25.3%) for females.
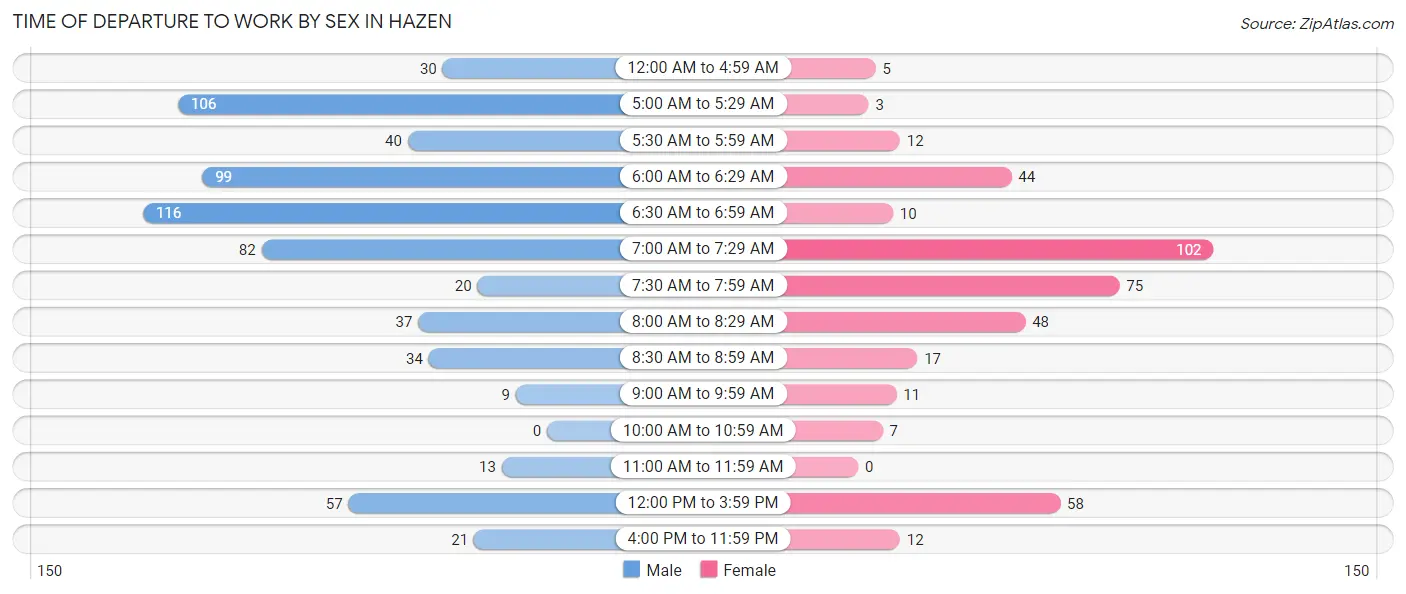
| Time of Departure | Male | Female |
| 12:00 AM to 4:59 AM | 30 (4.5%) | 5 (1.2%) |
| 5:00 AM to 5:29 AM | 106 (16.0%) | 3 (0.7%) |
| 5:30 AM to 5:59 AM | 40 (6.0%) | 12 (3.0%) |
| 6:00 AM to 6:29 AM | 99 (14.9%) | 44 (10.9%) |
| 6:30 AM to 6:59 AM | 116 (17.5%) | 10 (2.5%) |
| 7:00 AM to 7:29 AM | 82 (12.3%) | 102 (25.3%) |
| 7:30 AM to 7:59 AM | 20 (3.0%) | 75 (18.6%) |
| 8:00 AM to 8:29 AM | 37 (5.6%) | 48 (11.9%) |
| 8:30 AM to 8:59 AM | 34 (5.1%) | 17 (4.2%) |
| 9:00 AM to 9:59 AM | 9 (1.4%) | 11 (2.7%) |
| 10:00 AM to 10:59 AM | 0 (0.0%) | 7 (1.7%) |
| 11:00 AM to 11:59 AM | 13 (2.0%) | 0 (0.0%) |
| 12:00 PM to 3:59 PM | 57 (8.6%) | 58 (14.4%) |
| 4:00 PM to 11:59 PM | 21 (3.2%) | 12 (3.0%) |
| Total | 664 (100.0%) | 404 (100.0%) |
Housing Occupancy in Hazen
Occupancy by Ownership in Hazen
Of the total 1,092 dwellings in Hazen, owner-occupied units account for 838 (76.7%), while renter-occupied units make up 254 (23.3%).
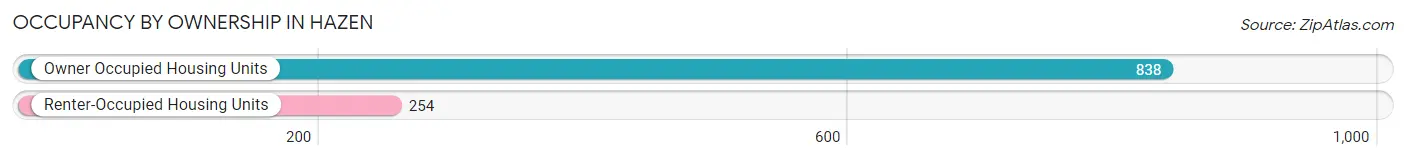
| Occupancy | # Housing Units | % Housing Units |
| Owner Occupied Housing Units | 838 | 76.7% |
| Renter-Occupied Housing Units | 254 | 23.3% |
| Total Occupied Housing Units | 1,092 | 100.0% |
Occupancy by Household Size in Hazen
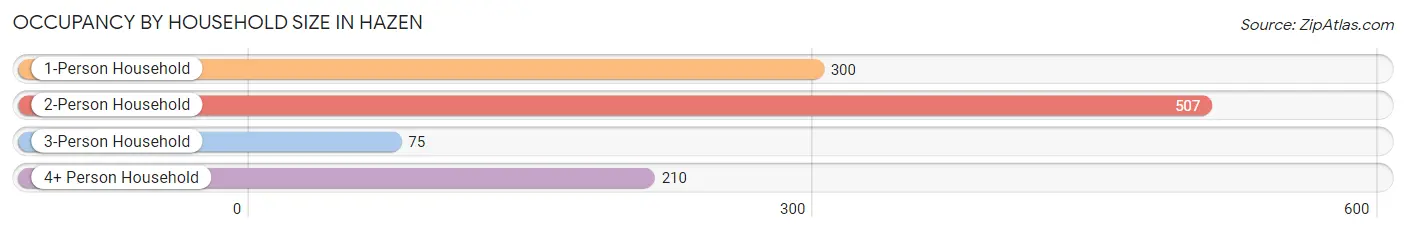
| Household Size | # Housing Units | % Housing Units |
| 1-Person Household | 300 | 27.5% |
| 2-Person Household | 507 | 46.4% |
| 3-Person Household | 75 | 6.9% |
| 4+ Person Household | 210 | 19.2% |
| Total Housing Units | 1,092 | 100.0% |
Occupancy by Ownership by Household Size in Hazen
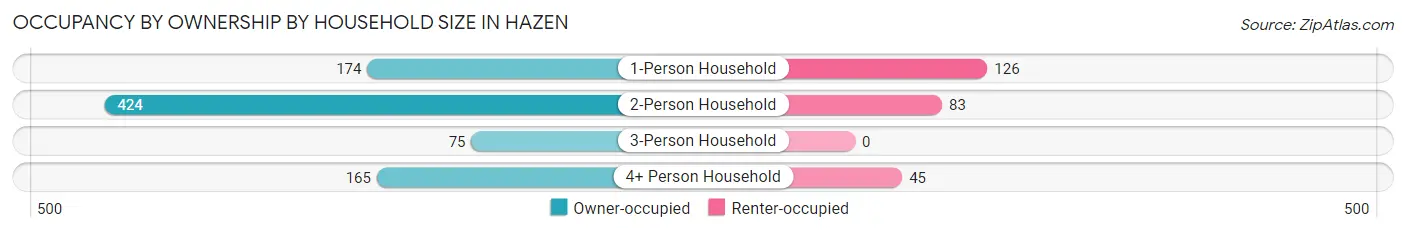
| Household Size | Owner-occupied | Renter-occupied |
| 1-Person Household | 174 (58.0%) | 126 (42.0%) |
| 2-Person Household | 424 (83.6%) | 83 (16.4%) |
| 3-Person Household | 75 (100.0%) | 0 (0.0%) |
| 4+ Person Household | 165 (78.6%) | 45 (21.4%) |
| Total Housing Units | 838 (76.7%) | 254 (23.3%) |
Occupancy by Educational Attainment in Hazen
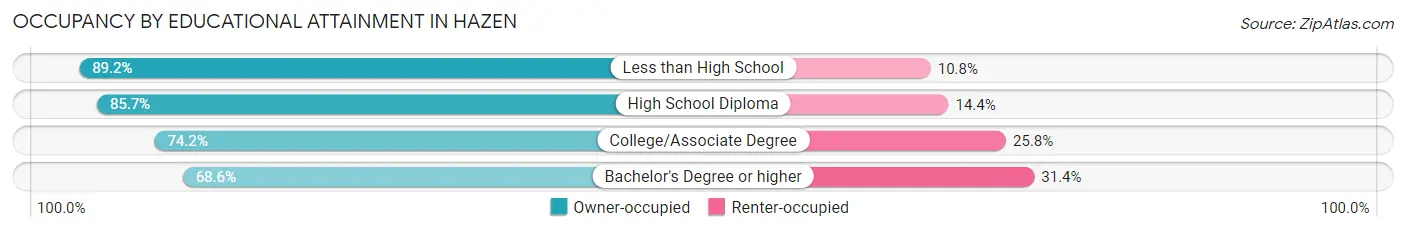
| Household Size | Owner-occupied | Renter-occupied |
| Less than High School | 107 (89.2%) | 13 (10.8%) |
| High School Diploma | 191 (85.7%) | 32 (14.3%) |
| College/Associate Degree | 343 (74.2%) | 119 (25.8%) |
| Bachelor's Degree or higher | 197 (68.6%) | 90 (31.4%) |
Occupancy by Age of Householder in Hazen
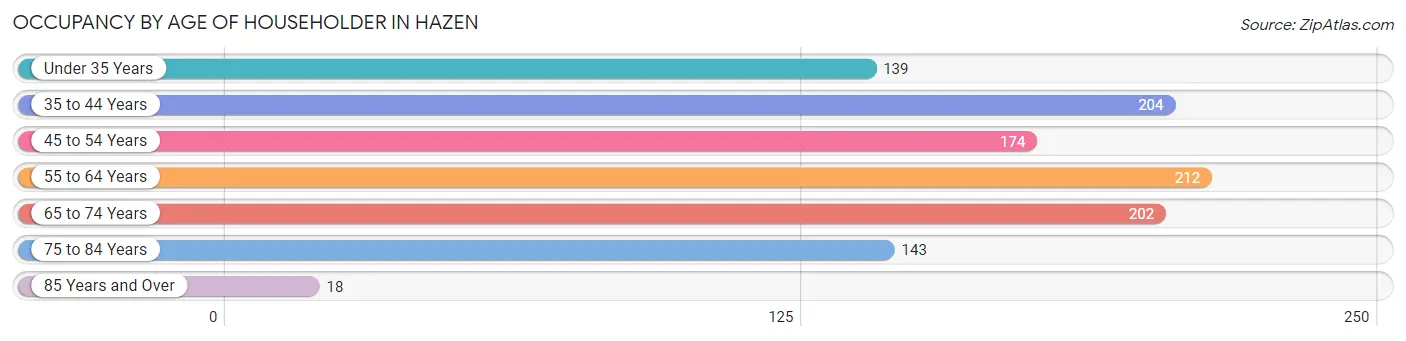
| Age Bracket | # Households | % Households |
| Under 35 Years | 139 | 12.7% |
| 35 to 44 Years | 204 | 18.7% |
| 45 to 54 Years | 174 | 15.9% |
| 55 to 64 Years | 212 | 19.4% |
| 65 to 74 Years | 202 | 18.5% |
| 75 to 84 Years | 143 | 13.1% |
| 85 Years and Over | 18 | 1.7% |
| Total | 1,092 | 100.0% |
Housing Finances in Hazen
Median Income by Occupancy in Hazen
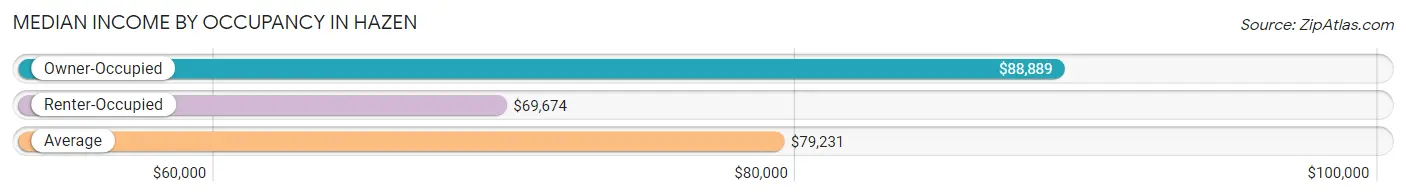
| Occupancy Type | # Households | Median Income |
| Owner-Occupied | 838 (76.7%) | $88,889 |
| Renter-Occupied | 254 (23.3%) | $69,674 |
| Average | 1,092 (100.0%) | $79,231 |
Occupancy by Householder Income Bracket in Hazen
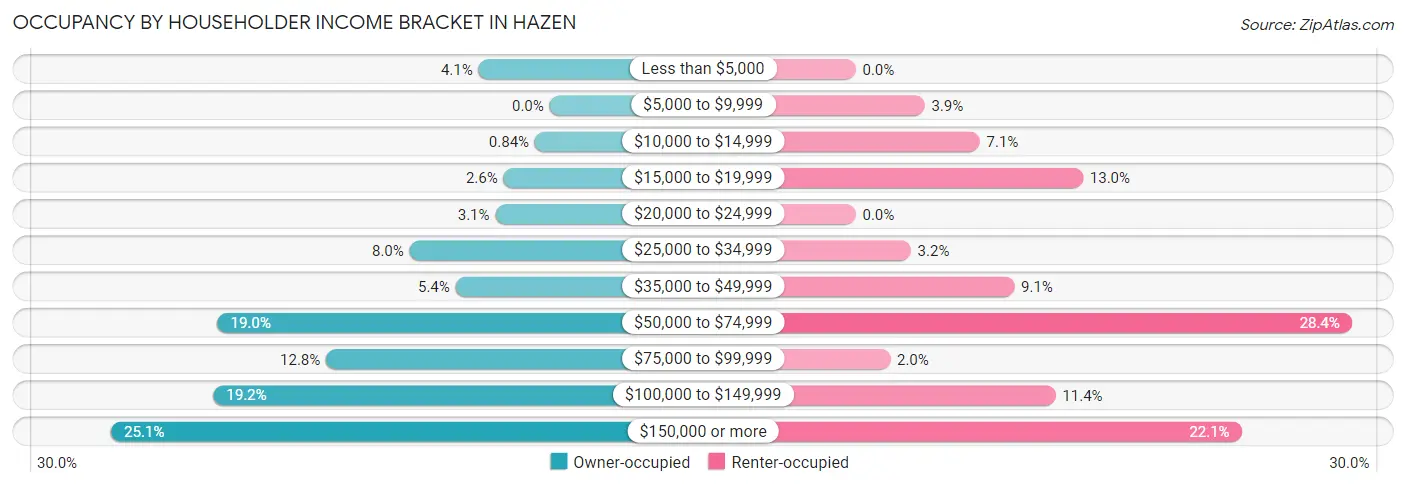
| Income Bracket | Owner-occupied | Renter-occupied |
| Less than $5,000 | 34 (4.1%) | 0 (0.0%) |
| $5,000 to $9,999 | 0 (0.0%) | 10 (3.9%) |
| $10,000 to $14,999 | 7 (0.8%) | 18 (7.1%) |
| $15,000 to $19,999 | 22 (2.6%) | 33 (13.0%) |
| $20,000 to $24,999 | 26 (3.1%) | 0 (0.0%) |
| $25,000 to $34,999 | 67 (8.0%) | 8 (3.2%) |
| $35,000 to $49,999 | 45 (5.4%) | 23 (9.1%) |
| $50,000 to $74,999 | 159 (19.0%) | 72 (28.3%) |
| $75,000 to $99,999 | 107 (12.8%) | 5 (2.0%) |
| $100,000 to $149,999 | 161 (19.2%) | 29 (11.4%) |
| $150,000 or more | 210 (25.1%) | 56 (22.1%) |
| Total | 838 (100.0%) | 254 (100.0%) |
Monthly Housing Cost Tiers in Hazen
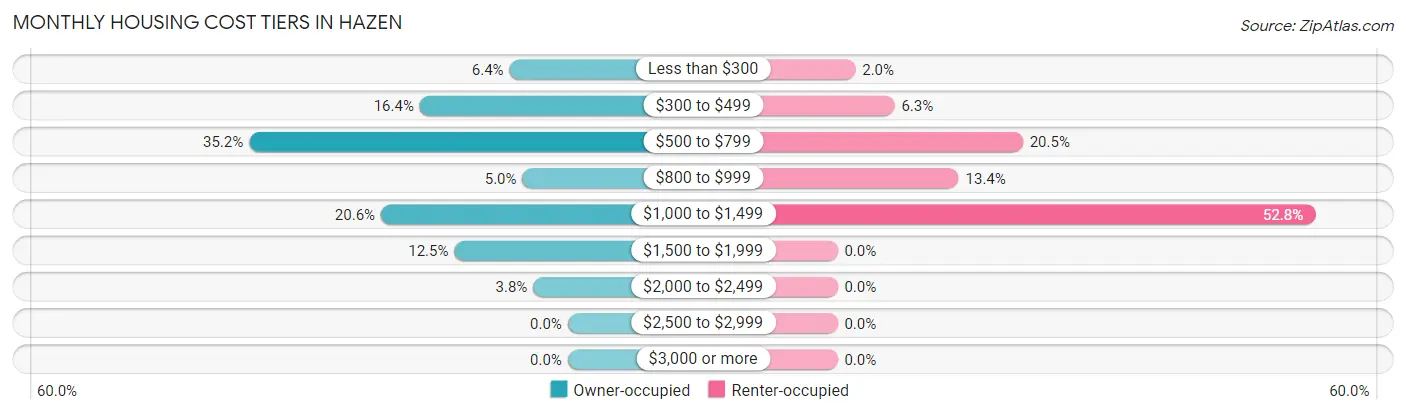
| Monthly Cost | Owner-occupied | Renter-occupied |
| Less than $300 | 54 (6.4%) | 5 (2.0%) |
| $300 to $499 | 137 (16.4%) | 16 (6.3%) |
| $500 to $799 | 295 (35.2%) | 52 (20.5%) |
| $800 to $999 | 42 (5.0%) | 34 (13.4%) |
| $1,000 to $1,499 | 173 (20.6%) | 134 (52.8%) |
| $1,500 to $1,999 | 105 (12.5%) | 0 (0.0%) |
| $2,000 to $2,499 | 32 (3.8%) | 0 (0.0%) |
| $2,500 to $2,999 | 0 (0.0%) | 0 (0.0%) |
| $3,000 or more | 0 (0.0%) | 0 (0.0%) |
| Total | 838 (100.0%) | 254 (100.0%) |
Physical Housing Characteristics in Hazen
Housing Structures in Hazen
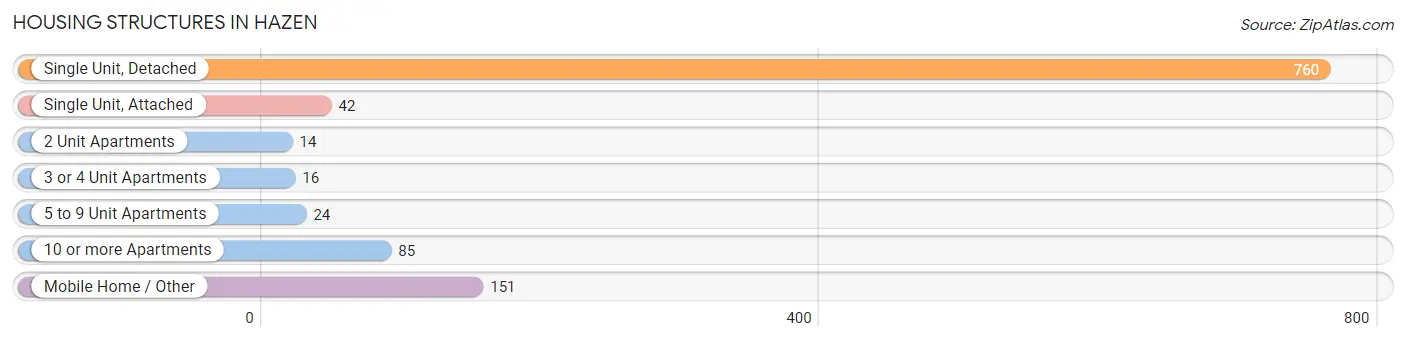
| Structure Type | # Housing Units | % Housing Units |
| Single Unit, Detached | 760 | 69.6% |
| Single Unit, Attached | 42 | 3.8% |
| 2 Unit Apartments | 14 | 1.3% |
| 3 or 4 Unit Apartments | 16 | 1.5% |
| 5 to 9 Unit Apartments | 24 | 2.2% |
| 10 or more Apartments | 85 | 7.8% |
| Mobile Home / Other | 151 | 13.8% |
| Total | 1,092 | 100.0% |
Housing Structures by Occupancy in Hazen
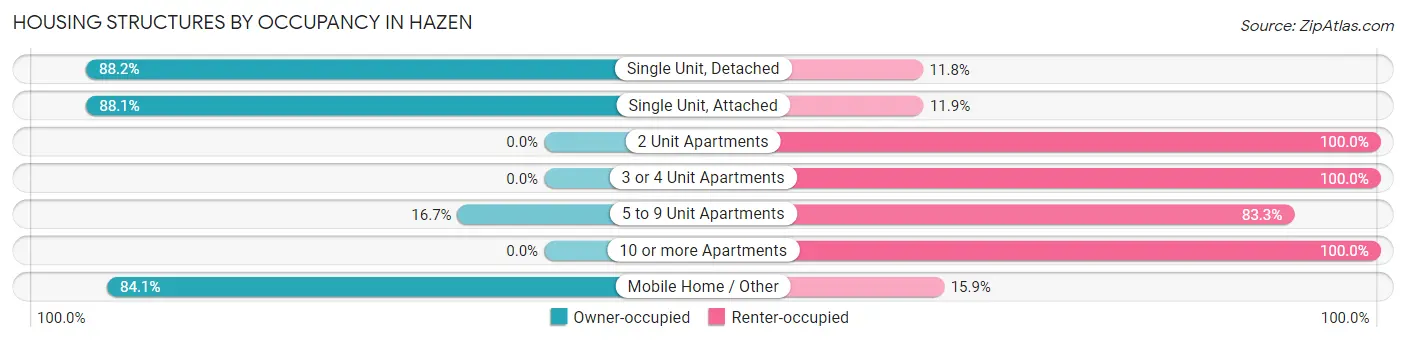
| Structure Type | Owner-occupied | Renter-occupied |
| Single Unit, Detached | 670 (88.2%) | 90 (11.8%) |
| Single Unit, Attached | 37 (88.1%) | 5 (11.9%) |
| 2 Unit Apartments | 0 (0.0%) | 14 (100.0%) |
| 3 or 4 Unit Apartments | 0 (0.0%) | 16 (100.0%) |
| 5 to 9 Unit Apartments | 4 (16.7%) | 20 (83.3%) |
| 10 or more Apartments | 0 (0.0%) | 85 (100.0%) |
| Mobile Home / Other | 127 (84.1%) | 24 (15.9%) |
| Total | 838 (76.7%) | 254 (23.3%) |
Housing Structures by Number of Rooms in Hazen
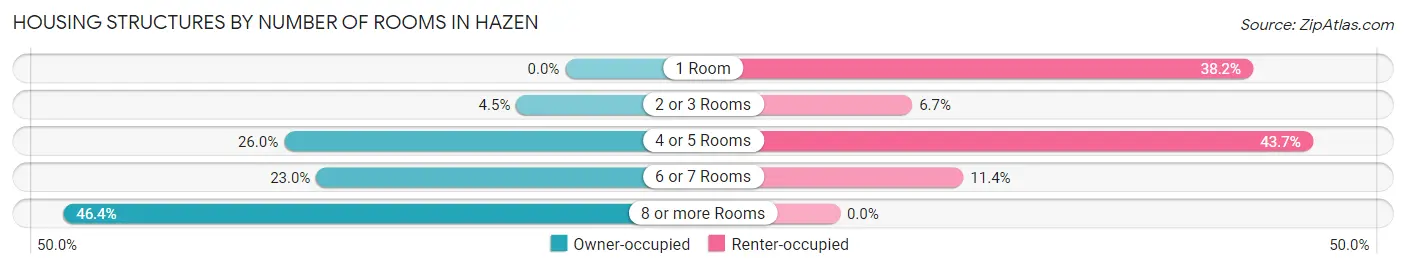
| Number of Rooms | Owner-occupied | Renter-occupied |
| 1 Room | 0 (0.0%) | 97 (38.2%) |
| 2 or 3 Rooms | 38 (4.5%) | 17 (6.7%) |
| 4 or 5 Rooms | 218 (26.0%) | 111 (43.7%) |
| 6 or 7 Rooms | 193 (23.0%) | 29 (11.4%) |
| 8 or more Rooms | 389 (46.4%) | 0 (0.0%) |
| Total | 838 (100.0%) | 254 (100.0%) |
Housing Structure by Heating Type in Hazen
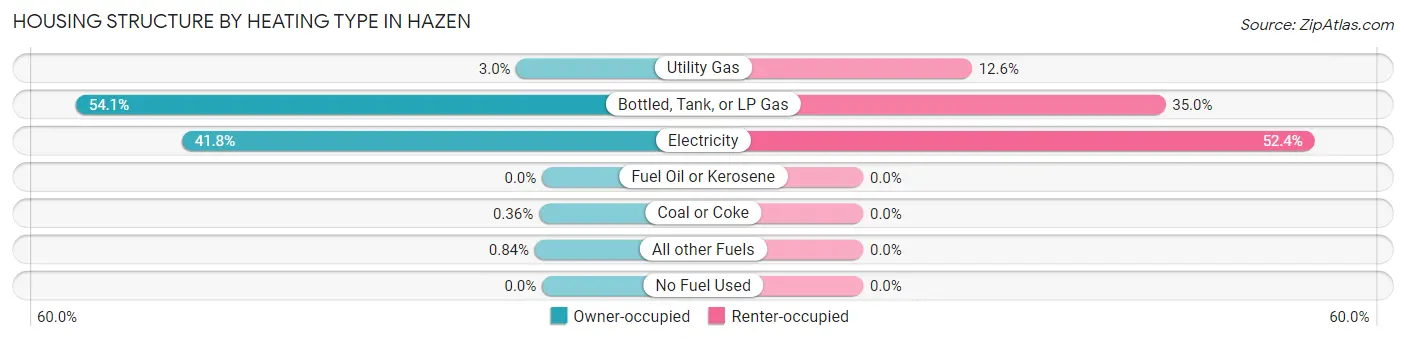
| Heating Type | Owner-occupied | Renter-occupied |
| Utility Gas | 25 (3.0%) | 32 (12.6%) |
| Bottled, Tank, or LP Gas | 453 (54.1%) | 89 (35.0%) |
| Electricity | 350 (41.8%) | 133 (52.4%) |
| Fuel Oil or Kerosene | 0 (0.0%) | 0 (0.0%) |
| Coal or Coke | 3 (0.4%) | 0 (0.0%) |
| All other Fuels | 7 (0.8%) | 0 (0.0%) |
| No Fuel Used | 0 (0.0%) | 0 (0.0%) |
| Total | 838 (100.0%) | 254 (100.0%) |
Household Vehicle Usage in Hazen
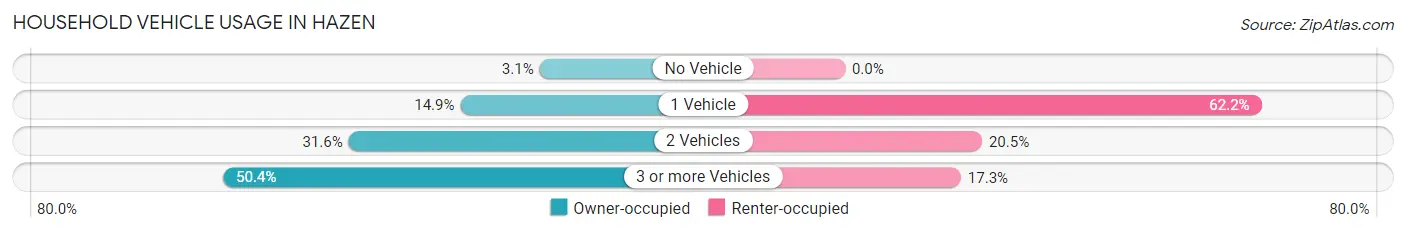
| Vehicles per Household | Owner-occupied | Renter-occupied |
| No Vehicle | 26 (3.1%) | 0 (0.0%) |
| 1 Vehicle | 125 (14.9%) | 158 (62.2%) |
| 2 Vehicles | 265 (31.6%) | 52 (20.5%) |
| 3 or more Vehicles | 422 (50.4%) | 44 (17.3%) |
| Total | 838 (100.0%) | 254 (100.0%) |
Real Estate & Mortgages in Hazen
Real Estate and Mortgage Overview in Hazen
| Characteristic | Without Mortgage | With Mortgage |
| Housing Units | 453 | 385 |
| Median Property Value | $167,700 | $180,800 |
| Median Household Income | $68,702 | $146 |
| Monthly Housing Costs | $570 | $0 |
| Real Estate Taxes | $2,085 | $2 |
Property Value by Mortgage Status in Hazen
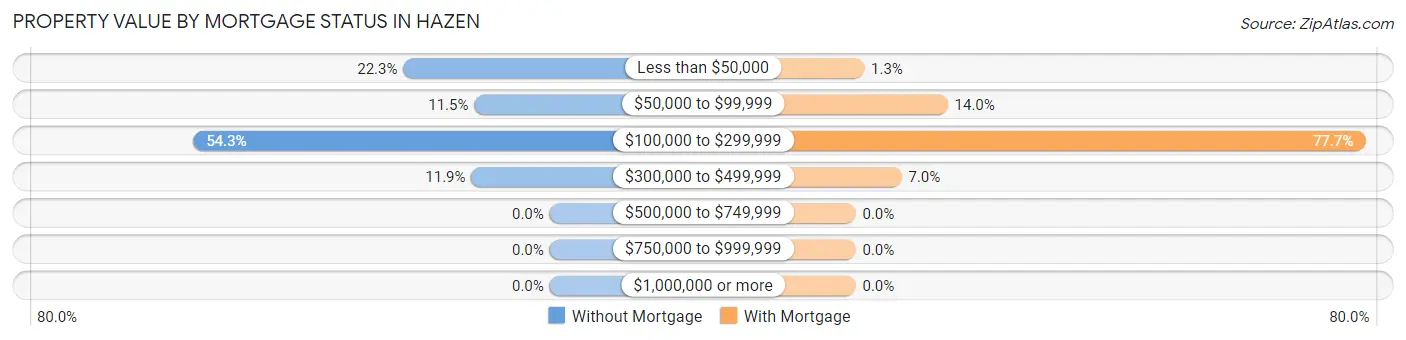
| Property Value | Without Mortgage | With Mortgage |
| Less than $50,000 | 101 (22.3%) | 5 (1.3%) |
| $50,000 to $99,999 | 52 (11.5%) | 54 (14.0%) |
| $100,000 to $299,999 | 246 (54.3%) | 299 (77.7%) |
| $300,000 to $499,999 | 54 (11.9%) | 27 (7.0%) |
| $500,000 to $749,999 | 0 (0.0%) | 0 (0.0%) |
| $750,000 to $999,999 | 0 (0.0%) | 0 (0.0%) |
| $1,000,000 or more | 0 (0.0%) | 0 (0.0%) |
| Total | 453 (100.0%) | 385 (100.0%) |
Household Income by Mortgage Status in Hazen
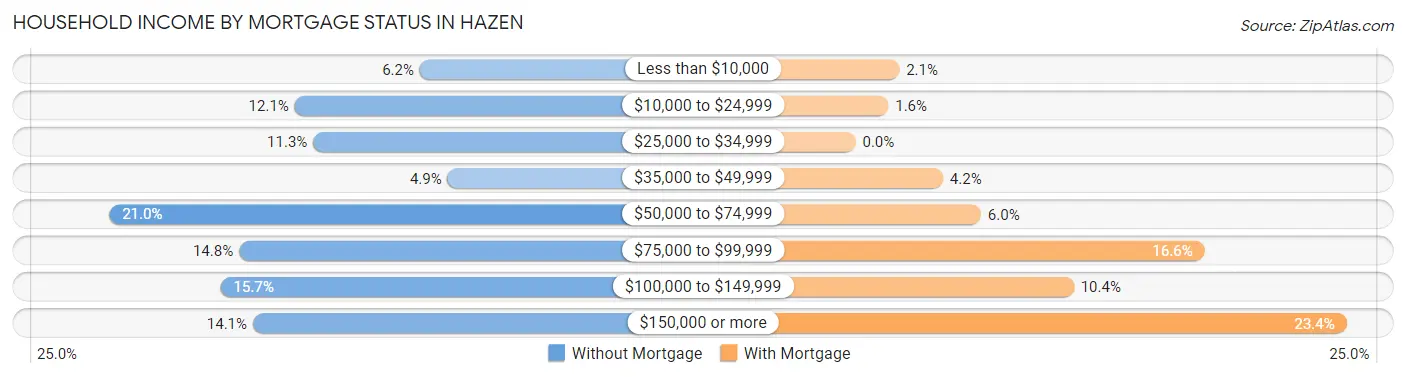
| Household Income | Without Mortgage | With Mortgage |
| Less than $10,000 | 28 (6.2%) | 8 (2.1%) |
| $10,000 to $24,999 | 55 (12.1%) | 6 (1.6%) |
| $25,000 to $34,999 | 51 (11.3%) | 0 (0.0%) |
| $35,000 to $49,999 | 22 (4.9%) | 16 (4.2%) |
| $50,000 to $74,999 | 95 (21.0%) | 23 (6.0%) |
| $75,000 to $99,999 | 67 (14.8%) | 64 (16.6%) |
| $100,000 to $149,999 | 71 (15.7%) | 40 (10.4%) |
| $150,000 or more | 64 (14.1%) | 90 (23.4%) |
| Total | 453 (100.0%) | 385 (100.0%) |
Property Value to Household Income Ratio in Hazen
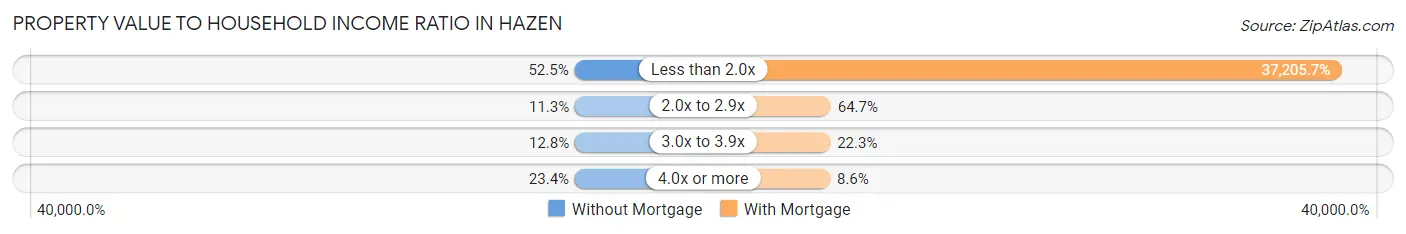
| Value-to-Income Ratio | Without Mortgage | With Mortgage |
| Less than 2.0x | 238 (52.5%) | 143,242 (37,205.7%) |
| 2.0x to 2.9x | 51 (11.3%) | 249 (64.7%) |
| 3.0x to 3.9x | 58 (12.8%) | 86 (22.3%) |
| 4.0x or more | 106 (23.4%) | 33 (8.6%) |
| Total | 453 (100.0%) | 385 (100.0%) |
Real Estate Taxes by Mortgage Status in Hazen
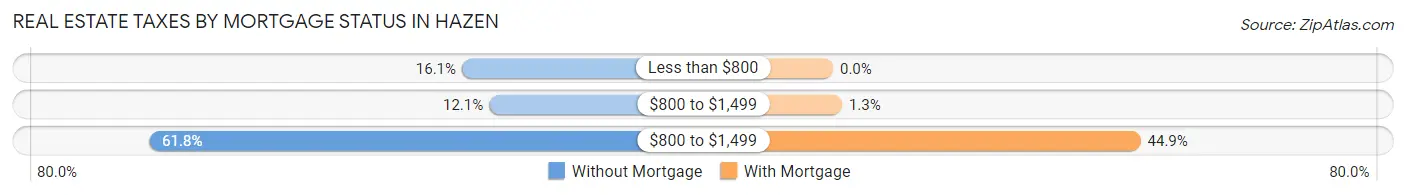
| Property Taxes | Without Mortgage | With Mortgage |
| Less than $800 | 73 (16.1%) | 0 (0.0%) |
| $800 to $1,499 | 55 (12.1%) | 5 (1.3%) |
| $800 to $1,499 | 280 (61.8%) | 173 (44.9%) |
| Total | 453 (100.0%) | 385 (100.0%) |
Health & Disability in Hazen
Health Insurance Coverage by Age in Hazen
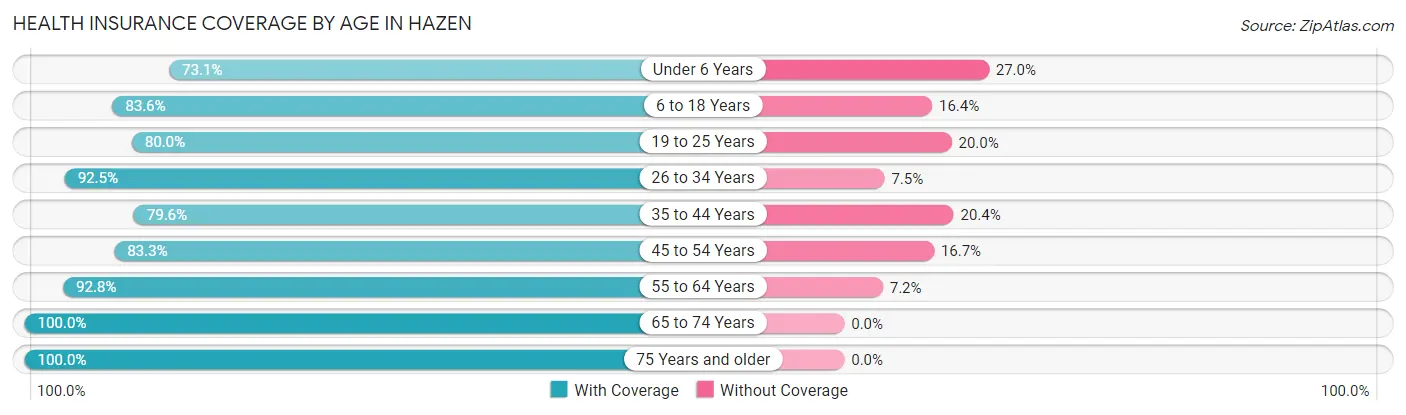
| Age Bracket | With Coverage | Without Coverage |
| Under 6 Years | 187 (73.1%) | 69 (27.0%) |
| 6 to 18 Years | 332 (83.6%) | 65 (16.4%) |
| 19 to 25 Years | 76 (80.0%) | 19 (20.0%) |
| 26 to 34 Years | 210 (92.5%) | 17 (7.5%) |
| 35 to 44 Years | 254 (79.6%) | 65 (20.4%) |
| 45 to 54 Years | 254 (83.3%) | 51 (16.7%) |
| 55 to 64 Years | 375 (92.8%) | 29 (7.2%) |
| 65 to 74 Years | 317 (100.0%) | 0 (0.0%) |
| 75 Years and older | 219 (100.0%) | 0 (0.0%) |
| Total | 2,224 (87.6%) | 315 (12.4%) |
Health Insurance Coverage by Citizenship Status in Hazen
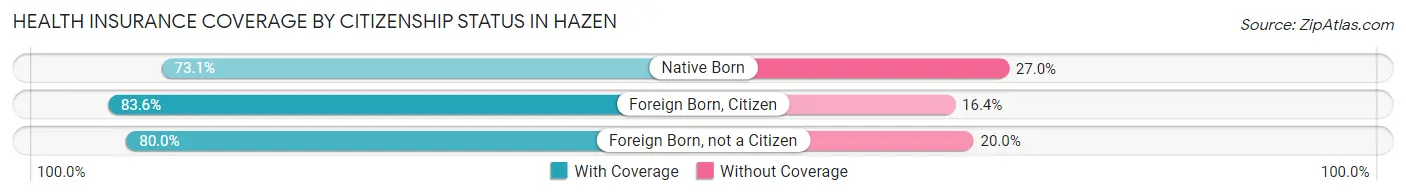
| Citizenship Status | With Coverage | Without Coverage |
| Native Born | 187 (73.1%) | 69 (27.0%) |
| Foreign Born, Citizen | 332 (83.6%) | 65 (16.4%) |
| Foreign Born, not a Citizen | 76 (80.0%) | 19 (20.0%) |
Health Insurance Coverage by Household Income in Hazen
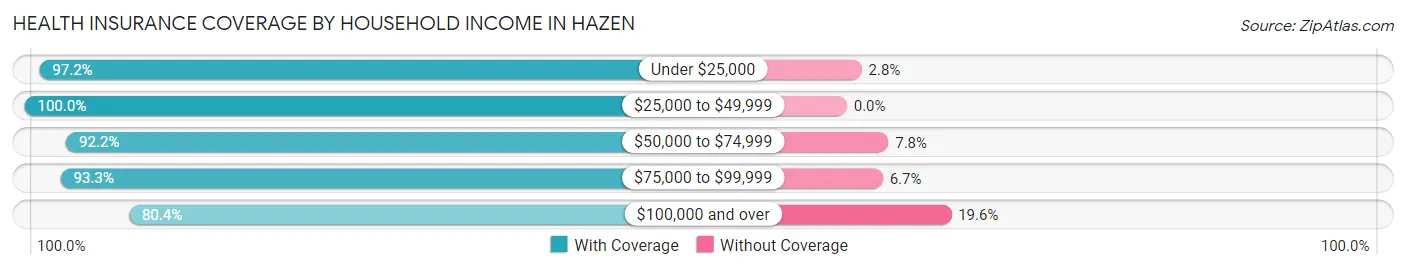
| Household Income | With Coverage | Without Coverage |
| Under $25,000 | 315 (97.2%) | 9 (2.8%) |
| $25,000 to $49,999 | 211 (100.0%) | 0 (0.0%) |
| $50,000 to $74,999 | 344 (92.2%) | 29 (7.8%) |
| $75,000 to $99,999 | 291 (93.3%) | 21 (6.7%) |
| $100,000 and over | 1,053 (80.4%) | 256 (19.6%) |
Public vs Private Health Insurance Coverage by Age in Hazen
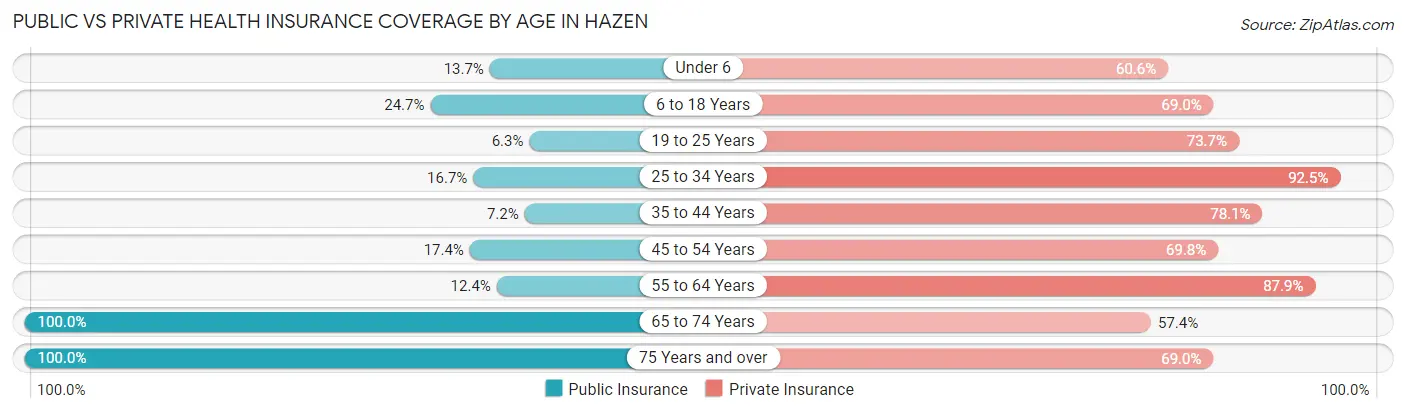
| Age Bracket | Public Insurance | Private Insurance |
| Under 6 | 35 (13.7%) | 155 (60.6%) |
| 6 to 18 Years | 98 (24.7%) | 274 (69.0%) |
| 19 to 25 Years | 6 (6.3%) | 70 (73.7%) |
| 25 to 34 Years | 38 (16.7%) | 210 (92.5%) |
| 35 to 44 Years | 23 (7.2%) | 249 (78.1%) |
| 45 to 54 Years | 53 (17.4%) | 213 (69.8%) |
| 55 to 64 Years | 50 (12.4%) | 355 (87.9%) |
| 65 to 74 Years | 317 (100.0%) | 182 (57.4%) |
| 75 Years and over | 219 (100.0%) | 151 (69.0%) |
| Total | 839 (33.0%) | 1,859 (73.2%) |
Disability Status by Sex by Age in Hazen
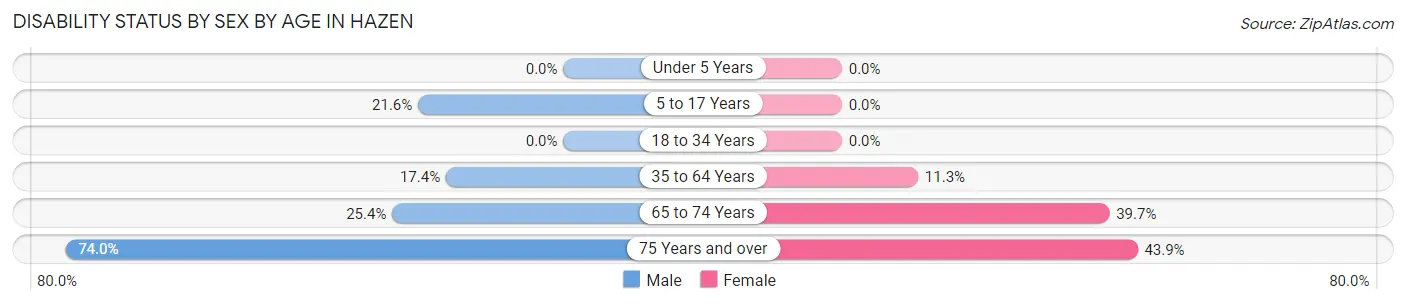
| Age Bracket | Male | Female |
| Under 5 Years | 0 (0.0%) | 0 (0.0%) |
| 5 to 17 Years | 55 (21.6%) | 0 (0.0%) |
| 18 to 34 Years | 0 (0.0%) | 0 (0.0%) |
| 35 to 64 Years | 99 (17.4%) | 52 (11.3%) |
| 65 to 74 Years | 46 (25.4%) | 54 (39.7%) |
| 75 Years and over | 71 (74.0%) | 54 (43.9%) |
Disability Class by Sex by Age in Hazen
Disability Class: Hearing Difficulty
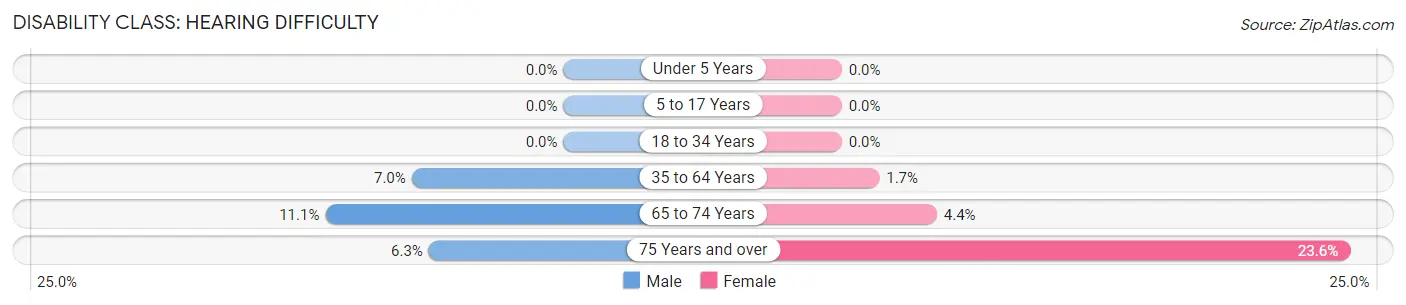
| Age Bracket | Male | Female |
| Under 5 Years | 0 (0.0%) | 0 (0.0%) |
| 5 to 17 Years | 0 (0.0%) | 0 (0.0%) |
| 18 to 34 Years | 0 (0.0%) | 0 (0.0%) |
| 35 to 64 Years | 40 (7.0%) | 8 (1.7%) |
| 65 to 74 Years | 20 (11.1%) | 6 (4.4%) |
| 75 Years and over | 6 (6.2%) | 29 (23.6%) |
Disability Class: Vision Difficulty
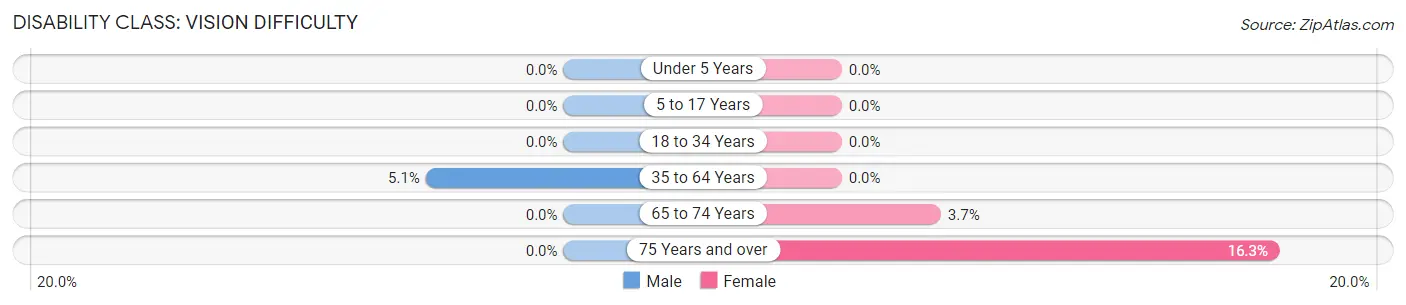
| Age Bracket | Male | Female |
| Under 5 Years | 0 (0.0%) | 0 (0.0%) |
| 5 to 17 Years | 0 (0.0%) | 0 (0.0%) |
| 18 to 34 Years | 0 (0.0%) | 0 (0.0%) |
| 35 to 64 Years | 29 (5.1%) | 0 (0.0%) |
| 65 to 74 Years | 0 (0.0%) | 5 (3.7%) |
| 75 Years and over | 0 (0.0%) | 20 (16.3%) |
Disability Class: Cognitive Difficulty
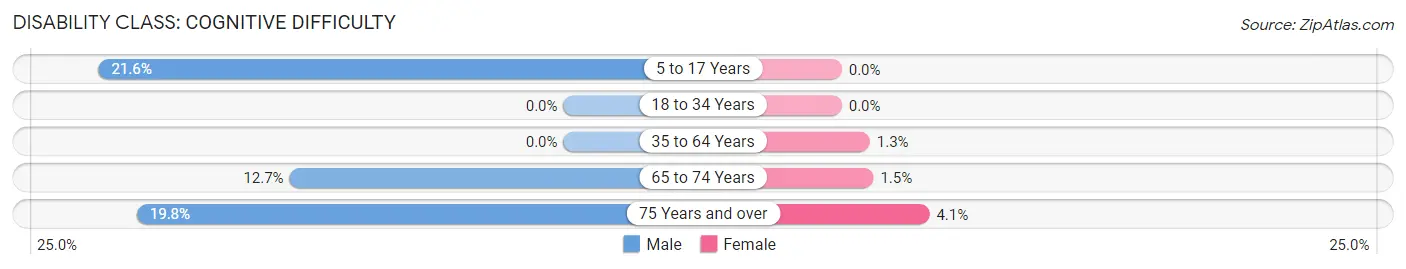
| Age Bracket | Male | Female |
| 5 to 17 Years | 55 (21.6%) | 0 (0.0%) |
| 18 to 34 Years | 0 (0.0%) | 0 (0.0%) |
| 35 to 64 Years | 0 (0.0%) | 6 (1.3%) |
| 65 to 74 Years | 23 (12.7%) | 2 (1.5%) |
| 75 Years and over | 19 (19.8%) | 5 (4.1%) |
Disability Class: Ambulatory Difficulty
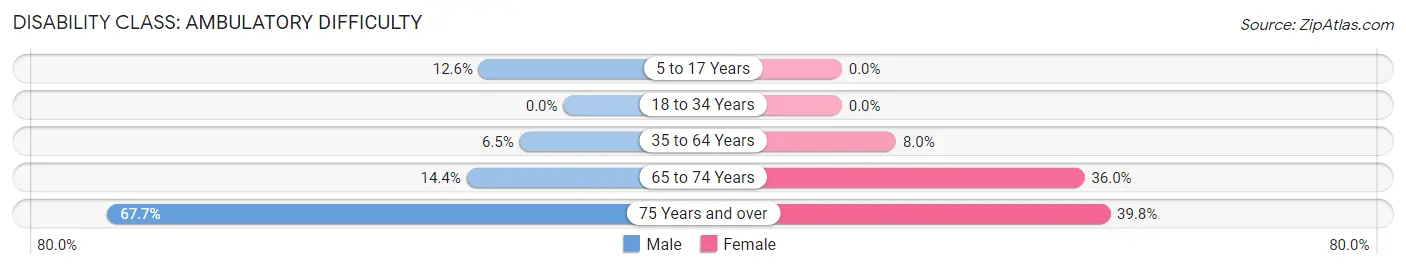
| Age Bracket | Male | Female |
| 5 to 17 Years | 32 (12.6%) | 0 (0.0%) |
| 18 to 34 Years | 0 (0.0%) | 0 (0.0%) |
| 35 to 64 Years | 37 (6.5%) | 37 (8.0%) |
| 65 to 74 Years | 26 (14.4%) | 49 (36.0%) |
| 75 Years and over | 65 (67.7%) | 49 (39.8%) |
Disability Class: Self-Care Difficulty
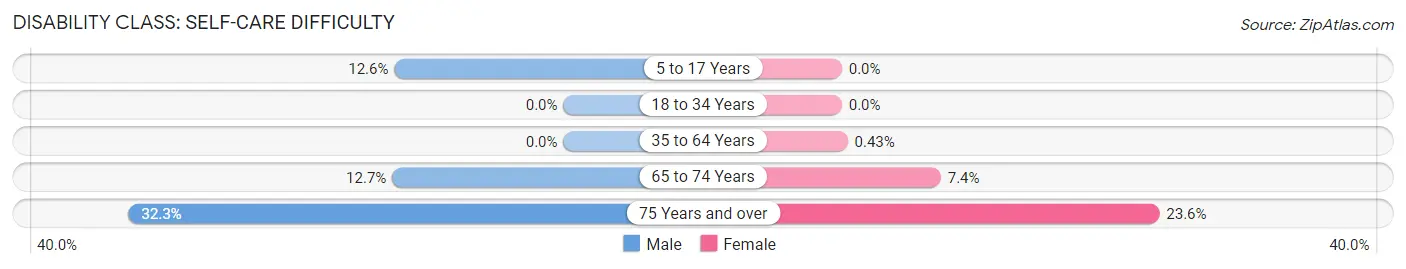
| Age Bracket | Male | Female |
| 5 to 17 Years | 32 (12.6%) | 0 (0.0%) |
| 18 to 34 Years | 0 (0.0%) | 0 (0.0%) |
| 35 to 64 Years | 0 (0.0%) | 2 (0.4%) |
| 65 to 74 Years | 23 (12.7%) | 10 (7.3%) |
| 75 Years and over | 31 (32.3%) | 29 (23.6%) |
Technology Access in Hazen
Computing Device Access in Hazen
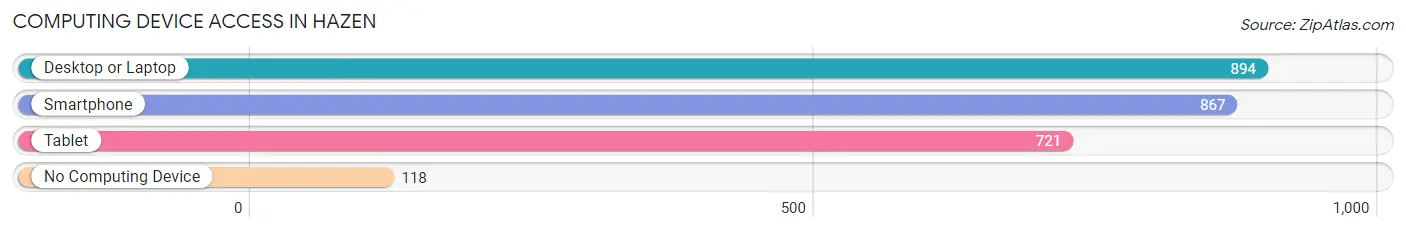
| Device Type | # Households | % Households |
| Desktop or Laptop | 894 | 81.9% |
| Smartphone | 867 | 79.4% |
| Tablet | 721 | 66.0% |
| No Computing Device | 118 | 10.8% |
| Total | 1,092 | 100.0% |
Internet Access in Hazen
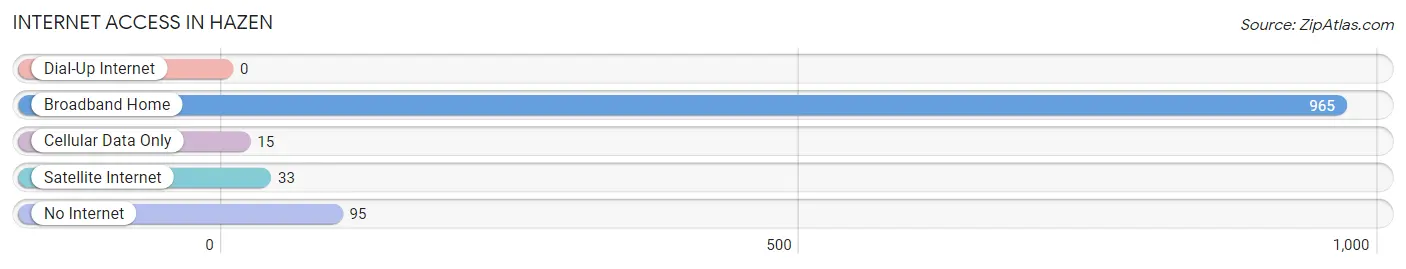
| Internet Type | # Households | % Households |
| Dial-Up Internet | 0 | 0.0% |
| Broadband Home | 965 | 88.4% |
| Cellular Data Only | 15 | 1.4% |
| Satellite Internet | 33 | 3.0% |
| No Internet | 95 | 8.7% |
| Total | 1,092 | 100.0% |
Hazen Summary
Hazen, North Dakota is a small city located in Mercer County, in the heart of the state. It is situated on the banks of the Missouri River, and is the county seat of Mercer County. The city has a population of 2,717, according to the 2010 census.
Hazen was founded in 1883, when the Northern Pacific Railroad was built through the area. The city was named after William Hazen, a Civil War general and the first Chief of Engineers of the United States Army. The city was incorporated in 1887, and has since grown to become a major agricultural center in the region.
Geographically, Hazen is located in the Central Plains region of North Dakota. The city is situated on the banks of the Missouri River, and is surrounded by rolling hills and prairies. The city is located in the heart of the state, and is about an hour’s drive from both Bismarck and Minot.
The economy of Hazen is largely based on agriculture. The city is home to several large farms, and is a major producer of wheat, corn, and other grains. The city is also home to several manufacturing companies, including a large meat processing plant. The city is also home to several retail stores, restaurants, and other businesses.
Hazen has a diverse population, with a mix of Native American, European, and African American residents. The city has a median household income of $41,945, and a poverty rate of 13.3%. The city is served by the Hazen Public School District, which includes two elementary schools, one middle school, and one high school.
Hazen is a small city with a rich history and a bright future. The city is home to a diverse population, and is a major agricultural center in the region. The city is also home to several businesses, and is a great place to live and work.
Common Questions
What is Per Capita Income in Hazen?
Per Capita income in Hazen is $42,795.
What is the Median Family Income in Hazen?
Median Family Income in Hazen is $105,750.
What is the Median Household income in Hazen?
Median Household Income in Hazen is $79,231.
What is Income or Wage Gap in Hazen?
Income or Wage Gap in Hazen is 50.3%.
Women in Hazen earn 49.7 cents for every dollar earned by a man.
What is Inequality or Gini Index in Hazen?
Inequality or Gini Index in Hazen is 0.39.
What is the Total Population of Hazen?
Total Population of Hazen is 2,569.
What is the Total Male Population of Hazen?
Total Male Population of Hazen is 1,368.
What is the Total Female Population of Hazen?
Total Female Population of Hazen is 1,201.
What is the Ratio of Males per 100 Females in Hazen?
There are 113.91 Males per 100 Females in Hazen.
What is the Ratio of Females per 100 Males in Hazen?
There are 87.79 Females per 100 Males in Hazen.
What is the Median Population Age in Hazen?
Median Population Age in Hazen is 44.8 Years.
What is the Average Family Size in Hazen
Average Family Size in Hazen is 2.9 People.
What is the Average Household Size in Hazen
Average Household Size in Hazen is 2.3 People.
How Large is the Labor Force in Hazen?
There are 1,209 People in the Labor Forcein in Hazen.
What is the Percentage of People in the Labor Force in Hazen?
60.9% of People are in the Labor Force in Hazen.
What is the Unemployment Rate in Hazen?
Unemployment Rate in Hazen is 4.1%.