Carrington, ND Map & Demographics
Carrington Map
Carrington Overview
$36,141
PER CAPITA INCOME
$91,042
AVG FAMILY INCOME
$62,240
AVG HOUSEHOLD INCOME
39.0%
WAGE / INCOME GAP [ % ]
61.0¢/ $1
WAGE / INCOME GAP [ $ ]
$9,635
FAMILY INCOME DEFICIT
0.42
INEQUALITY / GINI INDEX
2,161
TOTAL POPULATION
1,061
MALE POPULATION
1,100
FEMALE POPULATION
96.45
MALES / 100 FEMALES
103.68
FEMALES / 100 MALES
44.0
MEDIAN AGE
3.0
AVG FAMILY SIZE
2.2
AVG HOUSEHOLD SIZE
1,152
LABOR FORCE [ PEOPLE ]
66.5%
PERCENT IN LABOR FORCE
Carrington Zip Codes
Carrington Area Codes
Income in Carrington
Income Overview in Carrington
Per Capita Income in Carrington is $36,141, while median incomes of families and households are $91,042 and $62,240 respectively.
| Characteristic | Number | Measure |
| Per Capita Income | 2,161 | $36,141 |
| Median Family Income | 527 | $91,042 |
| Mean Family Income | 527 | $96,437 |
| Median Household Income | 920 | $62,240 |
| Mean Household Income | 920 | $77,149 |
| Income Deficit | 527 | $9,635 |
| Wage / Income Gap (%) | 2,161 | 38.95% |
| Wage / Income Gap ($) | 2,161 | 61.05¢ per $1 |
| Gini / Inequality Index | 2,161 | 0.42 |
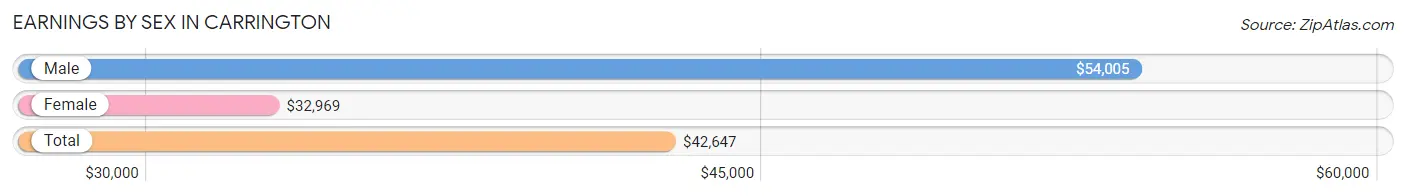
Earnings by Sex in Carrington
Average Earnings in Carrington are $42,647, $54,005 for men and $32,969 for women, a difference of 39.0%.
| Sex | Number | Average Earnings |
| Male | 627 (51.7%) | $54,005 |
| Female | 585 (48.3%) | $32,969 |
| Total | 1,212 (100.0%) | $42,647 |
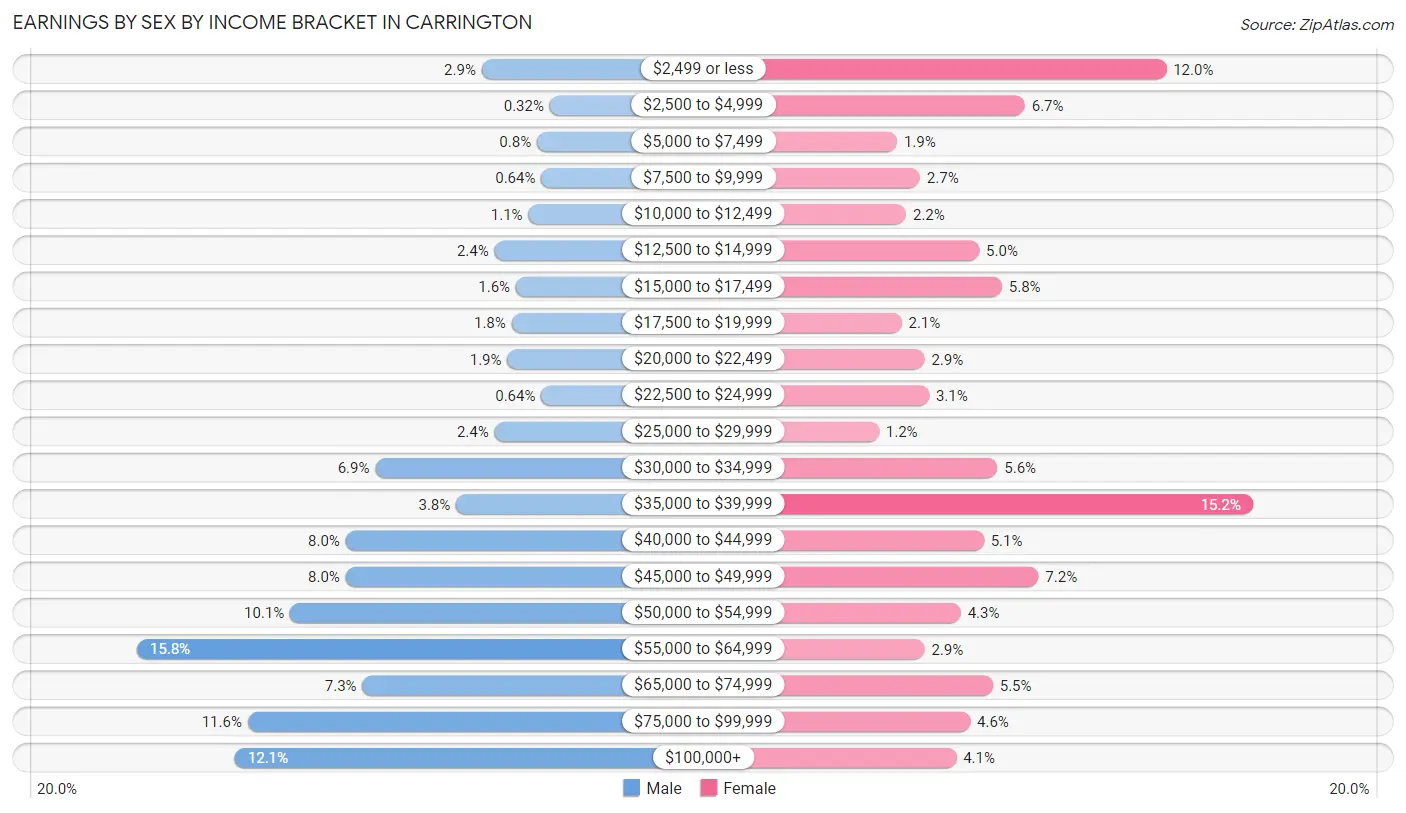
Earnings by Sex by Income Bracket in Carrington
The most common earnings brackets in Carrington are $55,000 to $64,999 for men (99 | 15.8%) and $35,000 to $39,999 for women (89 | 15.2%).
| Income | Male | Female |
| $2,499 or less | 18 (2.9%) | 70 (12.0%) |
| $2,500 to $4,999 | 2 (0.3%) | 39 (6.7%) |
| $5,000 to $7,499 | 5 (0.8%) | 11 (1.9%) |
| $7,500 to $9,999 | 4 (0.6%) | 16 (2.7%) |
| $10,000 to $12,499 | 7 (1.1%) | 13 (2.2%) |
| $12,500 to $14,999 | 15 (2.4%) | 29 (5.0%) |
| $15,000 to $17,499 | 10 (1.6%) | 34 (5.8%) |
| $17,500 to $19,999 | 11 (1.8%) | 12 (2.1%) |
| $20,000 to $22,499 | 12 (1.9%) | 17 (2.9%) |
| $22,500 to $24,999 | 4 (0.6%) | 18 (3.1%) |
| $25,000 to $29,999 | 15 (2.4%) | 7 (1.2%) |
| $30,000 to $34,999 | 43 (6.9%) | 33 (5.6%) |
| $35,000 to $39,999 | 24 (3.8%) | 89 (15.2%) |
| $40,000 to $44,999 | 50 (8.0%) | 30 (5.1%) |
| $45,000 to $49,999 | 50 (8.0%) | 42 (7.2%) |
| $50,000 to $54,999 | 63 (10.1%) | 25 (4.3%) |
| $55,000 to $64,999 | 99 (15.8%) | 17 (2.9%) |
| $65,000 to $74,999 | 46 (7.3%) | 32 (5.5%) |
| $75,000 to $99,999 | 73 (11.6%) | 27 (4.6%) |
| $100,000+ | 76 (12.1%) | 24 (4.1%) |
| Total | 627 (100.0%) | 585 (100.0%) |
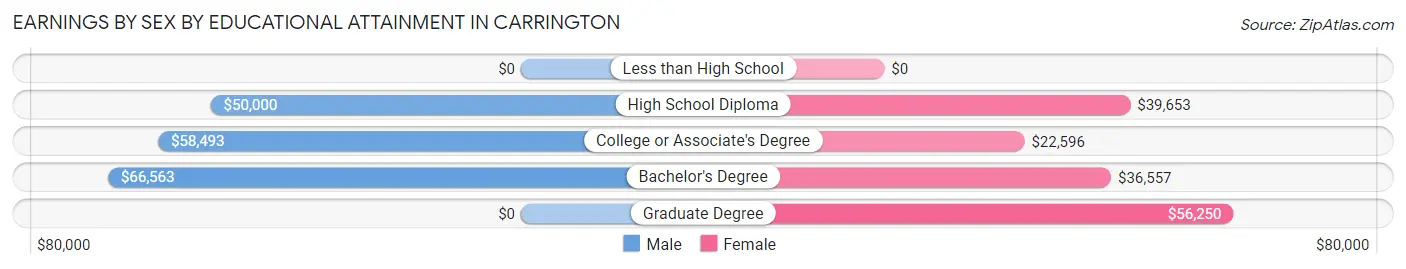
Earnings by Sex by Educational Attainment in Carrington
Average earnings in Carrington are $54,295 for men and $36,452 for women, a difference of 32.9%. Men with an educational attainment of bachelor's degree enjoy the highest average annual earnings of $66,563, while those with high school diploma education earn the least with $50,000. Women with an educational attainment of graduate degree earn the most with the average annual earnings of $56,250, while those with college or associate's degree education have the smallest earnings of $22,596.
| Educational Attainment | Male Income | Female Income |
| Less than High School | - | - |
| High School Diploma | $50,000 | $39,653 |
| College or Associate's Degree | $58,493 | $22,596 |
| Bachelor's Degree | $66,563 | $36,557 |
| Graduate Degree | - | - |
| Total | $54,295 | $36,452 |
Family Income in Carrington
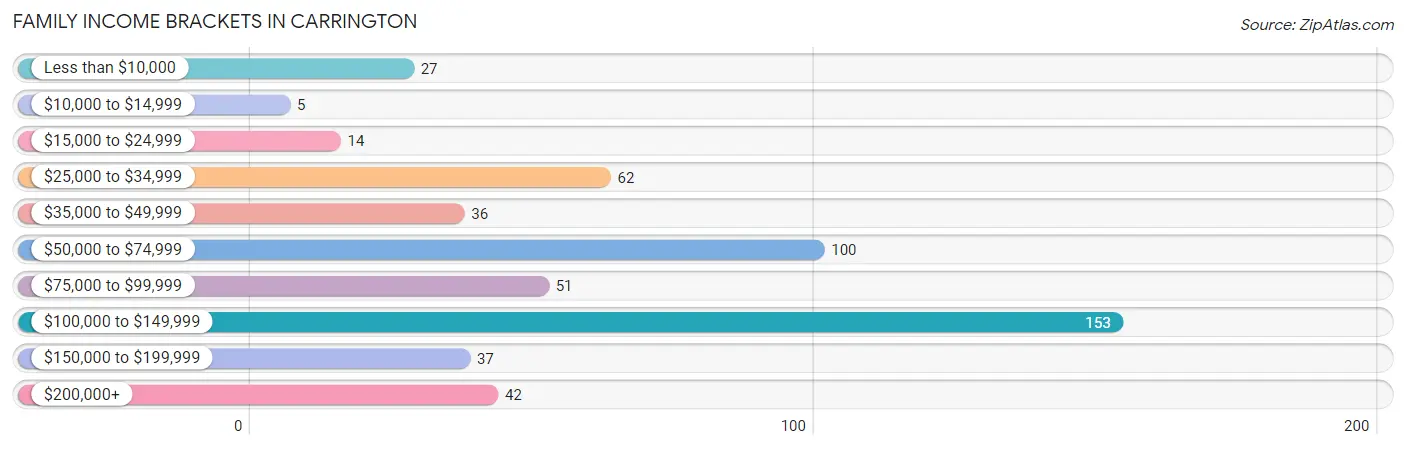
Family Income Brackets in Carrington
According to the Carrington family income data, there are 153 families falling into the $100,000 to $149,999 income range, which is the most common income bracket and makes up 29.0% of all families. Conversely, the $10,000 to $14,999 income bracket is the least frequent group with only 5 families (0.9%) belonging to this category.
| Income Bracket | # Families | % Families |
| Less than $10,000 | 27 | 5.1% |
| $10,000 to $14,999 | 5 | 0.9% |
| $15,000 to $24,999 | 14 | 2.7% |
| $25,000 to $34,999 | 62 | 11.8% |
| $35,000 to $49,999 | 36 | 6.8% |
| $50,000 to $74,999 | 100 | 19.0% |
| $75,000 to $99,999 | 51 | 9.7% |
| $100,000 to $149,999 | 153 | 29.0% |
| $150,000 to $199,999 | 37 | 7.0% |
| $200,000+ | 42 | 8.0% |
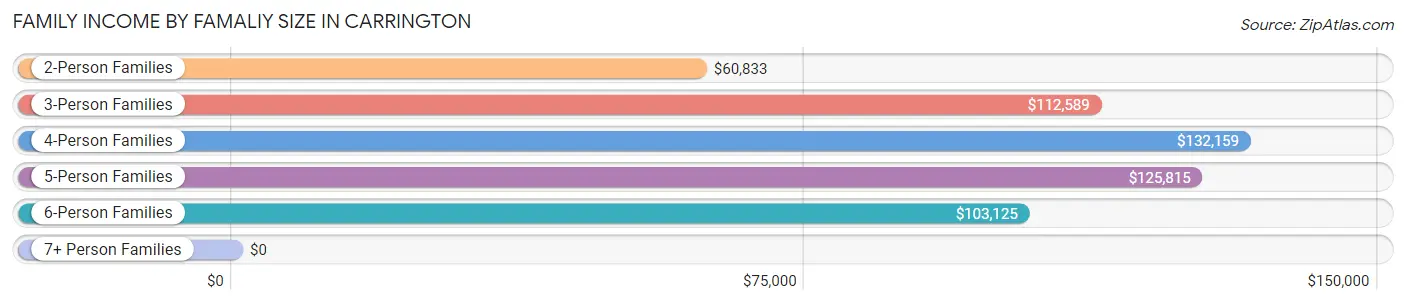
Family Income by Famaliy Size in Carrington
4-person families (61 | 11.6%) account for the highest median family income in Carrington with $132,159 per family, while 3-person families (57 | 10.8%) have the highest median income of $37,530 per family member.
| Income Bracket | # Families | Median Income |
| 2-Person Families | 322 (61.1%) | $60,833 |
| 3-Person Families | 57 (10.8%) | $112,589 |
| 4-Person Families | 61 (11.6%) | $132,159 |
| 5-Person Families | 55 (10.4%) | $125,815 |
| 6-Person Families | 32 (6.1%) | $103,125 |
| 7+ Person Families | 0 (0.0%) | $0 |
| Total | 527 (100.0%) | $91,042 |
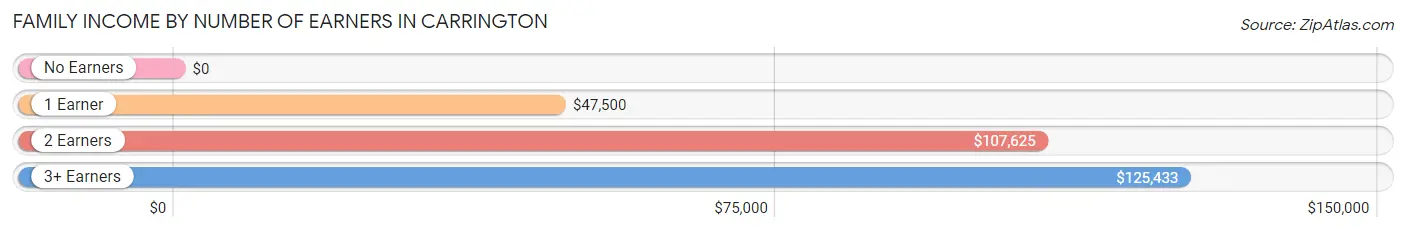
Family Income by Number of Earners in Carrington
| Number of Earners | # Families | Median Income |
| No Earners | 93 (17.6%) | $0 |
| 1 Earner | 110 (20.9%) | $47,500 |
| 2 Earners | 273 (51.8%) | $107,625 |
| 3+ Earners | 51 (9.7%) | $125,433 |
| Total | 527 (100.0%) | $91,042 |
Household Income in Carrington
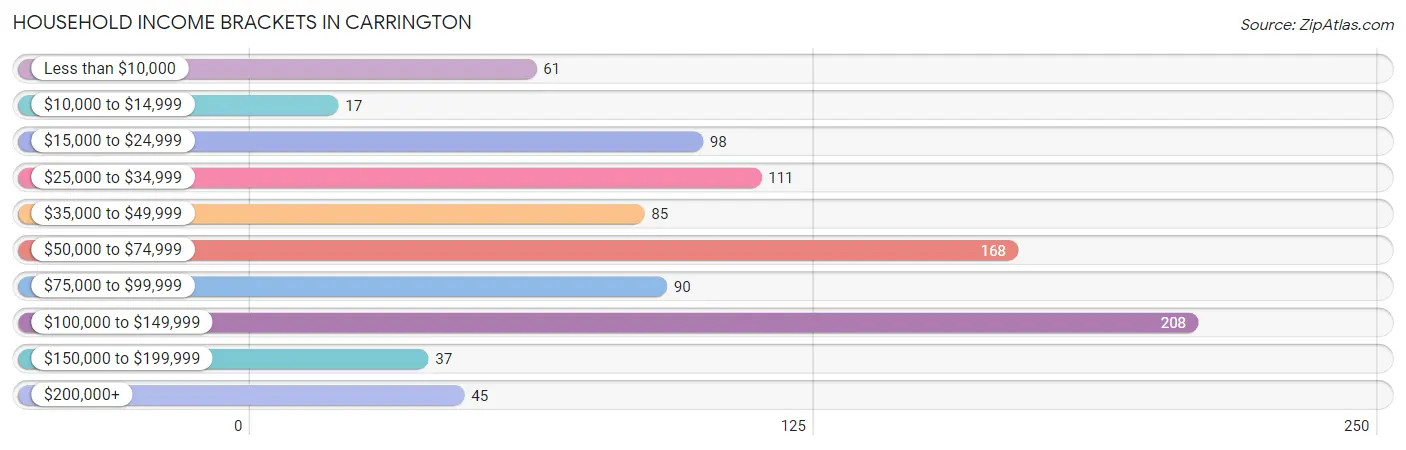
Household Income Brackets in Carrington
With 208 households falling in the category, the $100,000 to $149,999 income range is the most frequent in Carrington, accounting for 22.6% of all households. In contrast, only 17 households (1.8%) fall into the $10,000 to $14,999 income bracket, making it the least populous group.
| Income Bracket | # Households | % Households |
| Less than $10,000 | 61 | 6.6% |
| $10,000 to $14,999 | 17 | 1.8% |
| $15,000 to $24,999 | 98 | 10.7% |
| $25,000 to $34,999 | 111 | 12.1% |
| $35,000 to $49,999 | 85 | 9.2% |
| $50,000 to $74,999 | 168 | 18.3% |
| $75,000 to $99,999 | 90 | 9.8% |
| $100,000 to $149,999 | 208 | 22.6% |
| $150,000 to $199,999 | 37 | 4.0% |
| $200,000+ | 45 | 4.9% |
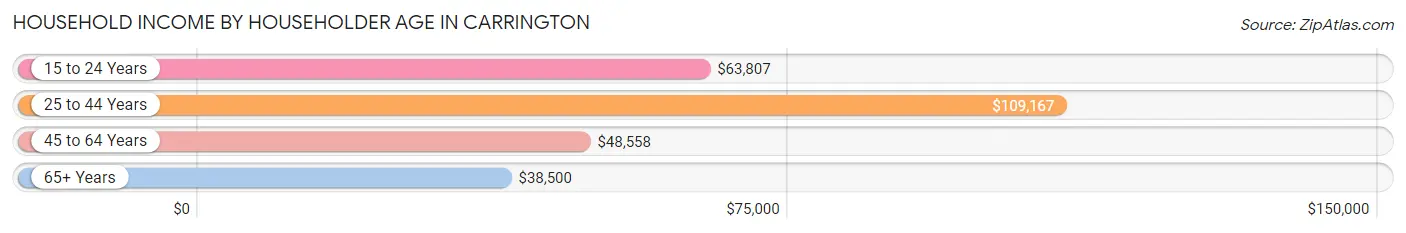
Household Income by Householder Age in Carrington
The median household income in Carrington is $62,240, with the highest median household income of $109,167 found in the 25 to 44 years age bracket for the primary householder. A total of 250 households (27.2%) fall into this category. Meanwhile, the 65+ years age bracket for the primary householder has the lowest median household income of $38,500, with 276 households (30.0%) in this group.
| Income Bracket | # Households | Median Income |
| 15 to 24 Years | 67 (7.3%) | $63,807 |
| 25 to 44 Years | 250 (27.2%) | $109,167 |
| 45 to 64 Years | 327 (35.5%) | $48,558 |
| 65+ Years | 276 (30.0%) | $38,500 |
| Total | 920 (100.0%) | $62,240 |
Poverty in Carrington
Income Below Poverty by Sex and Age in Carrington
With 6.6% poverty level for males and 11.4% for females among the residents of Carrington, 15 year old males and 45 to 54 year old females are the most vulnerable to poverty, with 4 males (100.0%) and 34 females (29.3%) in their respective age groups living below the poverty level.
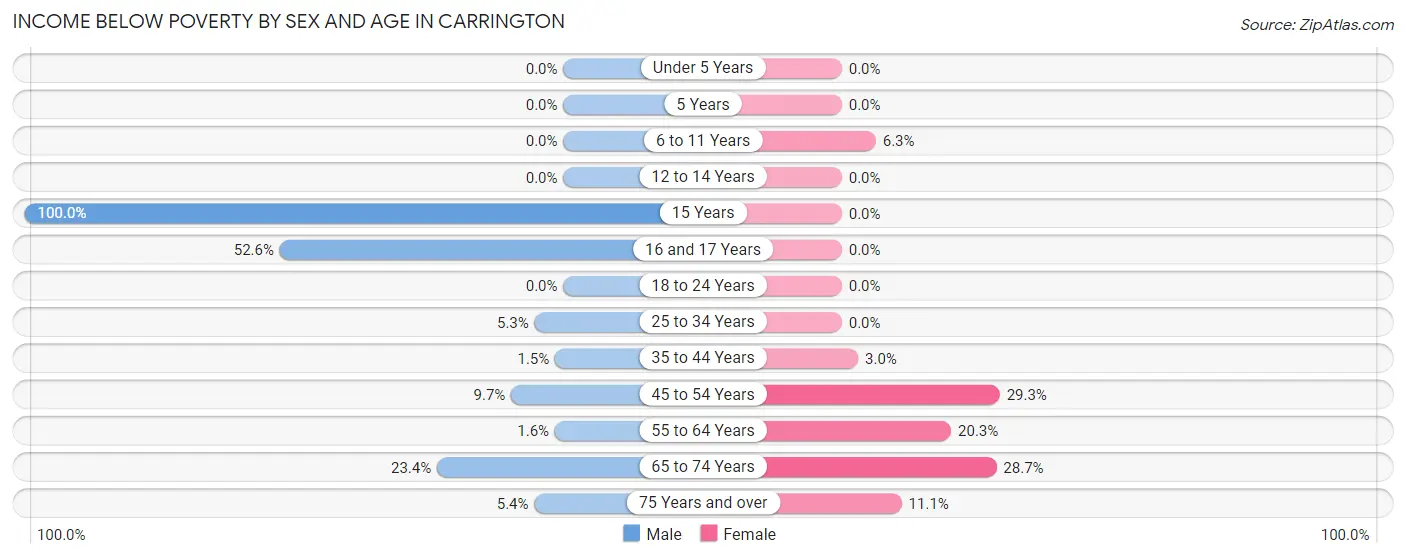
| Age Bracket | Male | Female |
| Under 5 Years | 0 (0.0%) | 0 (0.0%) |
| 5 Years | 0 (0.0%) | 0 (0.0%) |
| 6 to 11 Years | 0 (0.0%) | 7 (6.3%) |
| 12 to 14 Years | 0 (0.0%) | 0 (0.0%) |
| 15 Years | 4 (100.0%) | 0 (0.0%) |
| 16 and 17 Years | 20 (52.6%) | 0 (0.0%) |
| 18 to 24 Years | 0 (0.0%) | 0 (0.0%) |
| 25 to 34 Years | 8 (5.3%) | 0 (0.0%) |
| 35 to 44 Years | 2 (1.5%) | 4 (3.0%) |
| 45 to 54 Years | 12 (9.7%) | 34 (29.3%) |
| 55 to 64 Years | 3 (1.6%) | 28 (20.3%) |
| 65 to 74 Years | 15 (23.4%) | 31 (28.7%) |
| 75 Years and over | 5 (5.4%) | 11 (11.1%) |
| Total | 69 (6.6%) | 115 (11.4%) |
Income Above Poverty by Sex and Age in Carrington
According to the poverty statistics in Carrington, males aged under 5 years and females aged under 5 years are the age groups that are most secure financially, with 100.0% of males and 100.0% of females in these age groups living above the poverty line.
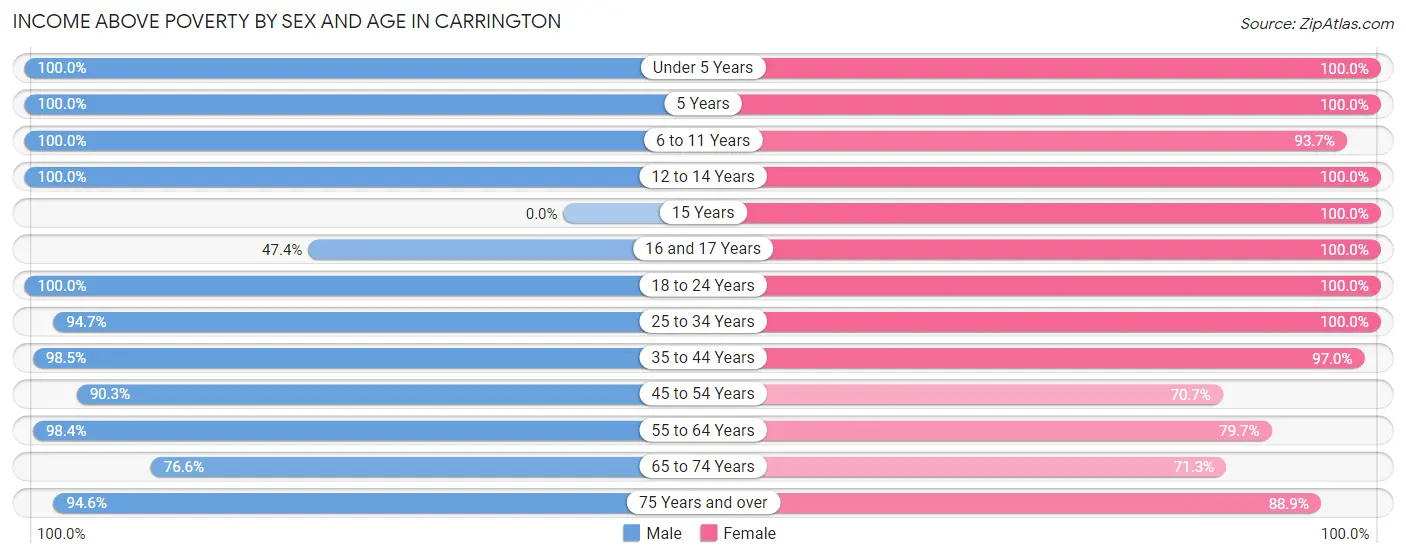
| Age Bracket | Male | Female |
| Under 5 Years | 48 (100.0%) | 61 (100.0%) |
| 5 Years | 29 (100.0%) | 8 (100.0%) |
| 6 to 11 Years | 106 (100.0%) | 104 (93.7%) |
| 12 to 14 Years | 12 (100.0%) | 11 (100.0%) |
| 15 Years | 0 (0.0%) | 38 (100.0%) |
| 16 and 17 Years | 18 (47.4%) | 5 (100.0%) |
| 18 to 24 Years | 55 (100.0%) | 105 (100.0%) |
| 25 to 34 Years | 142 (94.7%) | 78 (100.0%) |
| 35 to 44 Years | 129 (98.5%) | 128 (97.0%) |
| 45 to 54 Years | 112 (90.3%) | 82 (70.7%) |
| 55 to 64 Years | 189 (98.4%) | 110 (79.7%) |
| 65 to 74 Years | 49 (76.6%) | 77 (71.3%) |
| 75 Years and over | 88 (94.6%) | 88 (88.9%) |
| Total | 977 (93.4%) | 895 (88.6%) |
Income Below Poverty Among Married-Couple Families in Carrington
The poverty statistics for married-couple families in Carrington show that 3.3% or 15 of the total 454 families live below the poverty line. Families with no children have the highest poverty rate of 5.8%, comprising of 15 families. On the other hand, families with 1 or 2 children have the lowest poverty rate of 0.0%, which includes 0 families.
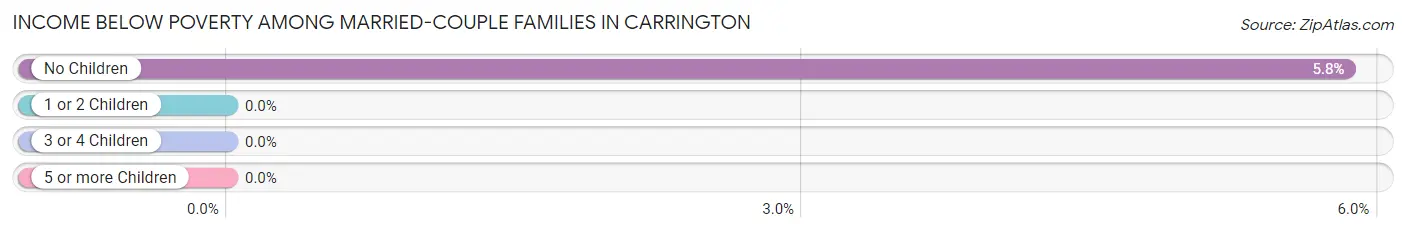
| Children | Above Poverty | Below Poverty |
| No Children | 242 (94.2%) | 15 (5.8%) |
| 1 or 2 Children | 140 (100.0%) | 0 (0.0%) |
| 3 or 4 Children | 57 (100.0%) | 0 (0.0%) |
| 5 or more Children | 0 (0.0%) | 0 (0.0%) |
| Total | 439 (96.7%) | 15 (3.3%) |
Income Below Poverty Among Single-Parent Households in Carrington
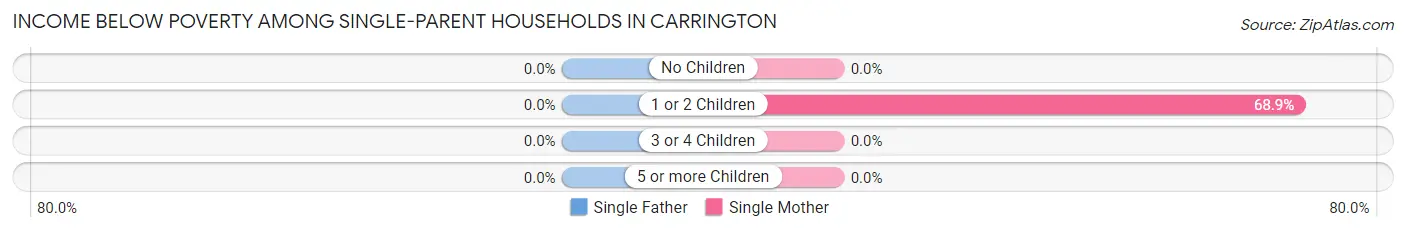
| Children | Single Father | Single Mother |
| No Children | 0 (0.0%) | 0 (0.0%) |
| 1 or 2 Children | 0 (0.0%) | 31 (68.9%) |
| 3 or 4 Children | 0 (0.0%) | 0 (0.0%) |
| 5 or more Children | 0 (0.0%) | 0 (0.0%) |
| Total | 0 (0.0%) | 31 (44.9%) |
Income Below Poverty Among Married-Couple vs Single-Parent Households in Carrington
The poverty data for Carrington shows that 15 of the married-couple family households (3.3%) and 31 of the single-parent households (42.5%) are living below the poverty level. Within the married-couple family households, those with no children have the highest poverty rate, with 15 households (5.8%) falling below the poverty line. Among the single-parent households, those with 1 or 2 children have the highest poverty rate, with 31 household (68.9%) living below poverty.
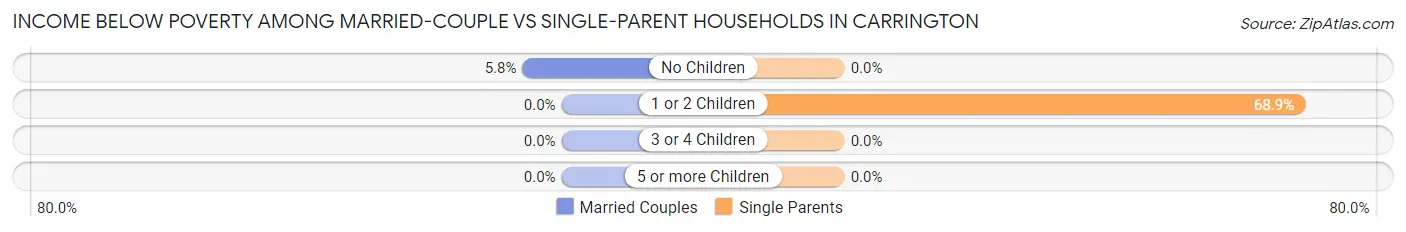
| Children | Married-Couple Families | Single-Parent Households |
| No Children | 15 (5.8%) | 0 (0.0%) |
| 1 or 2 Children | 0 (0.0%) | 31 (68.9%) |
| 3 or 4 Children | 0 (0.0%) | 0 (0.0%) |
| 5 or more Children | 0 (0.0%) | 0 (0.0%) |
| Total | 15 (3.3%) | 31 (42.5%) |
Race in Carrington
The most populous races in Carrington are White / Caucasian (1,999 | 92.5%), Two or more Races (93 | 4.3%), and Native / Alaskan (33 | 1.5%).
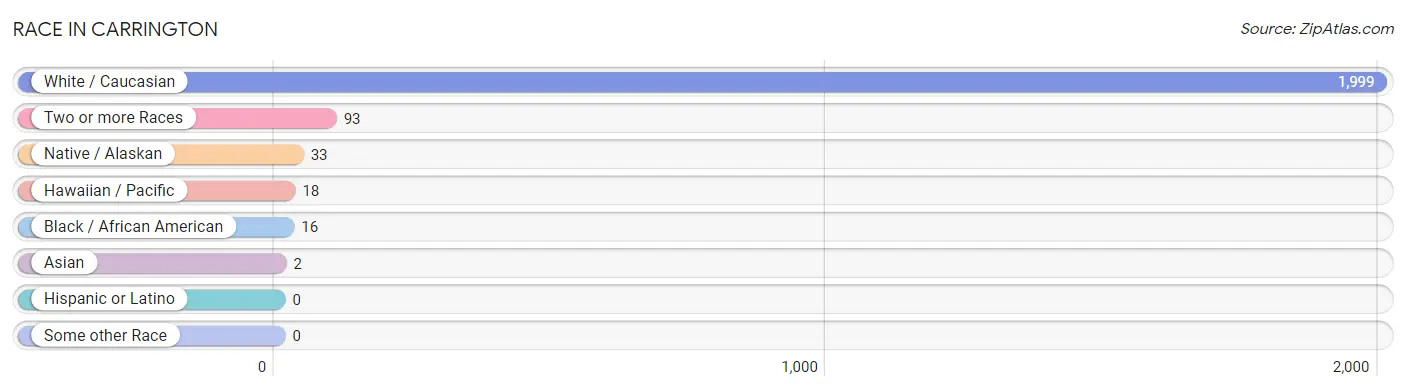
| Race | # Population | % Population |
| Asian | 2 | 0.1% |
| Black / African American | 16 | 0.7% |
| Hawaiian / Pacific | 18 | 0.8% |
| Hispanic or Latino | 0 | 0.0% |
| Native / Alaskan | 33 | 1.5% |
| White / Caucasian | 1,999 | 92.5% |
| Two or more Races | 93 | 4.3% |
| Some other Race | 0 | 0.0% |
| Total | 2,161 | 100.0% |
Ancestry in Carrington
The most populous ancestries reported in Carrington are German (986 | 45.6%), Norwegian (567 | 26.2%), Irish (224 | 10.4%), English (134 | 6.2%), and Polish (125 | 5.8%), together accounting for 94.2% of all Carrington residents.
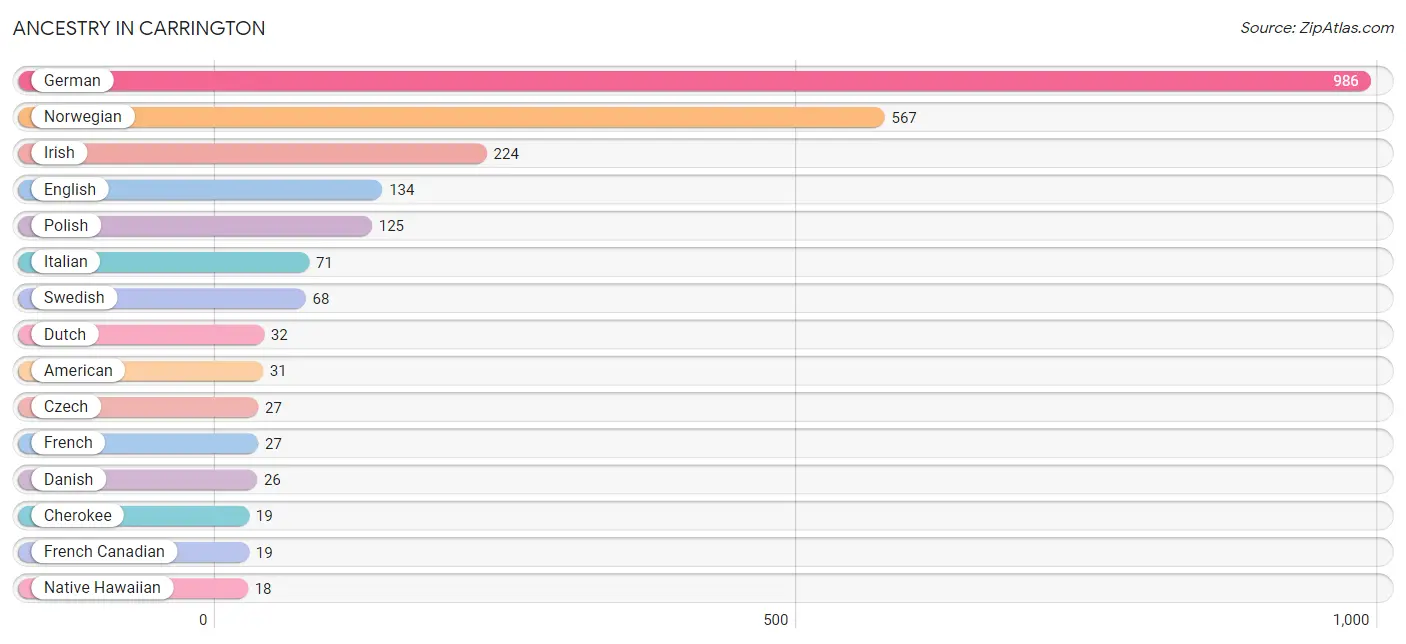
| Ancestry | # Population | % Population |
| American | 31 | 1.4% |
| Blackfeet | 17 | 0.8% |
| Cherokee | 19 | 0.9% |
| Chickasaw | 17 | 0.8% |
| Chippewa | 16 | 0.7% |
| Czech | 27 | 1.3% |
| Danish | 26 | 1.2% |
| Dutch | 32 | 1.5% |
| English | 134 | 6.2% |
| Finnish | 9 | 0.4% |
| French | 27 | 1.3% |
| French Canadian | 19 | 0.9% |
| German | 986 | 45.6% |
| German Russian | 17 | 0.8% |
| Icelander | 5 | 0.2% |
| Irish | 224 | 10.4% |
| Italian | 71 | 3.3% |
| Korean | 2 | 0.1% |
| Native Hawaiian | 18 | 0.8% |
| Norwegian | 567 | 26.2% |
| Polish | 125 | 5.8% |
| Russian | 17 | 0.8% |
| Scandinavian | 5 | 0.2% |
| Scottish | 14 | 0.6% |
| Swedish | 68 | 3.2% |
| Welsh | 7 | 0.3% | View All 26 Rows |
Immigrants in Carrington

| Immigration Origin | # Population | % Population | View All 0 Rows |
Sex and Age in Carrington
Sex and Age in Carrington
The most populous age groups in Carrington are 60 to 64 Years (126 | 11.9%) for men and 85 Years and over (112 | 10.2%) for women.
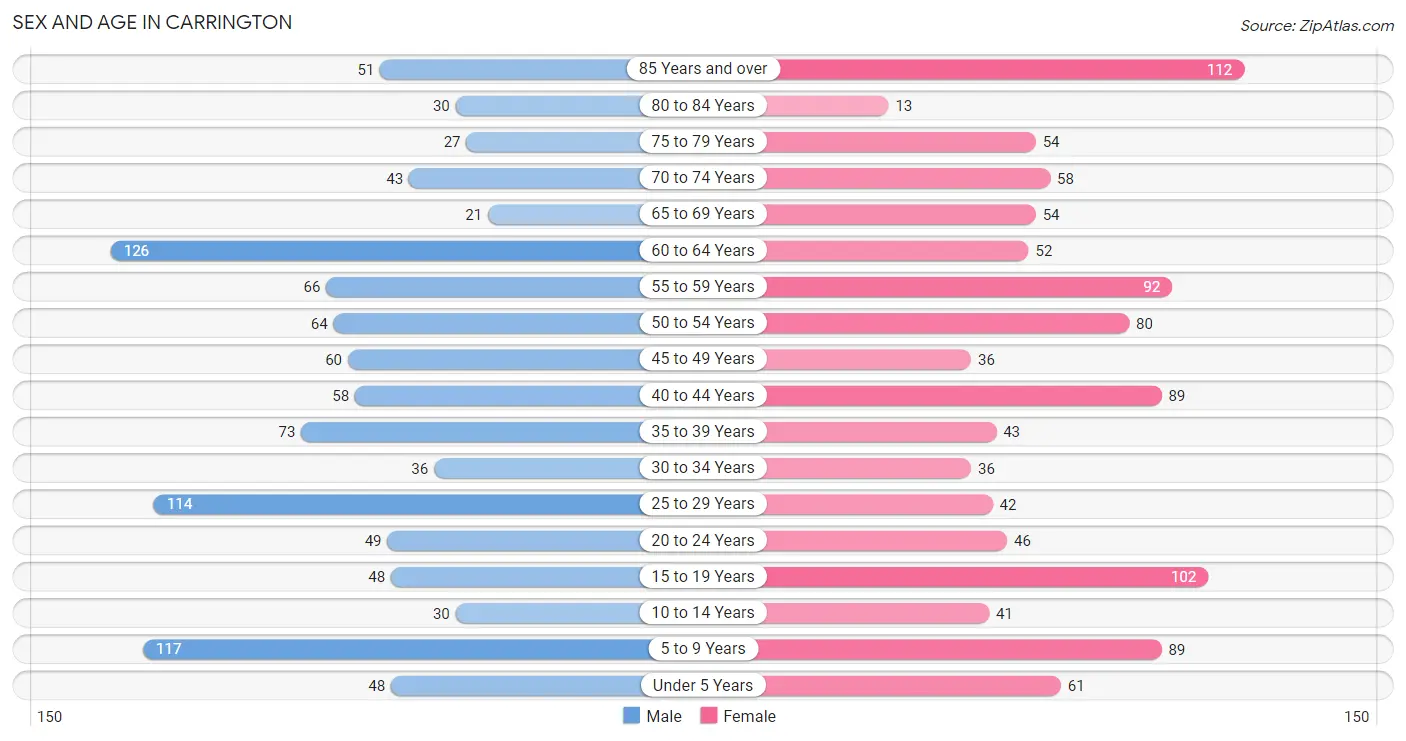
| Age Bracket | Male | Female |
| Under 5 Years | 48 (4.5%) | 61 (5.6%) |
| 5 to 9 Years | 117 (11.0%) | 89 (8.1%) |
| 10 to 14 Years | 30 (2.8%) | 41 (3.7%) |
| 15 to 19 Years | 48 (4.5%) | 102 (9.3%) |
| 20 to 24 Years | 49 (4.6%) | 46 (4.2%) |
| 25 to 29 Years | 114 (10.7%) | 42 (3.8%) |
| 30 to 34 Years | 36 (3.4%) | 36 (3.3%) |
| 35 to 39 Years | 73 (6.9%) | 43 (3.9%) |
| 40 to 44 Years | 58 (5.5%) | 89 (8.1%) |
| 45 to 49 Years | 60 (5.7%) | 36 (3.3%) |
| 50 to 54 Years | 64 (6.0%) | 80 (7.3%) |
| 55 to 59 Years | 66 (6.2%) | 92 (8.4%) |
| 60 to 64 Years | 126 (11.9%) | 52 (4.7%) |
| 65 to 69 Years | 21 (2.0%) | 54 (4.9%) |
| 70 to 74 Years | 43 (4.1%) | 58 (5.3%) |
| 75 to 79 Years | 27 (2.5%) | 54 (4.9%) |
| 80 to 84 Years | 30 (2.8%) | 13 (1.2%) |
| 85 Years and over | 51 (4.8%) | 112 (10.2%) |
| Total | 1,061 (100.0%) | 1,100 (100.0%) |
Families and Households in Carrington
Median Family Size in Carrington
The median family size in Carrington is 3.00 persons per family, with single male/father families (4 | 0.8%) accounting for the largest median family size of 3.75 persons per family. On the other hand, single female/mother families (69 | 13.1%) represent the smallest median family size with 2.30 persons per family.
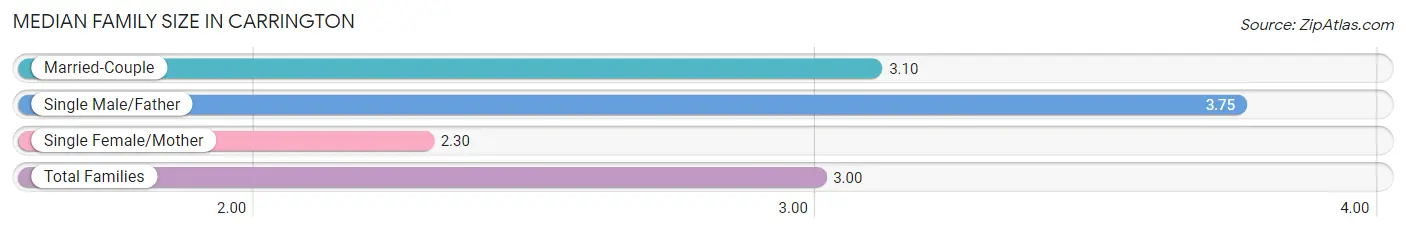
| Family Type | # Families | Family Size |
| Married-Couple | 454 (86.2%) | 3.10 |
| Single Male/Father | 4 (0.8%) | 3.75 |
| Single Female/Mother | 69 (13.1%) | 2.30 |
| Total Families | 527 (100.0%) | 3.00 |
Median Household Size in Carrington
The median household size in Carrington is 2.23 persons per household, with single male/father households (4 | 0.4%) accounting for the largest median household size of 4.5 persons per household. non-family households (393 | 42.7%) represent the smallest median household size with 1.13 persons per household.
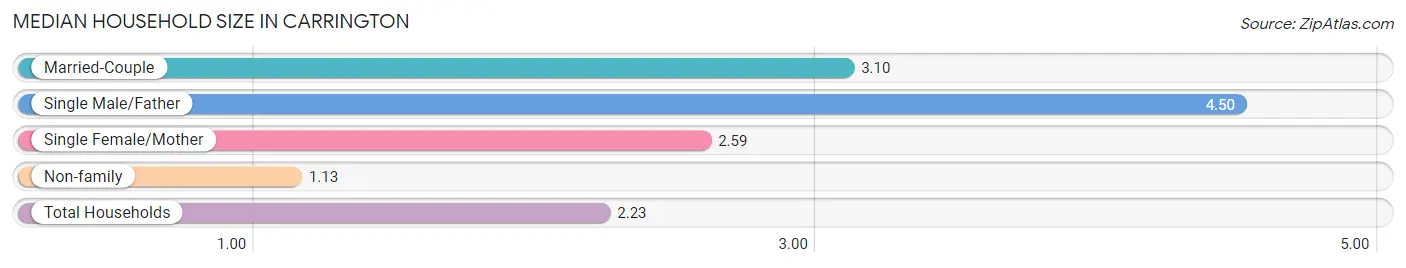
| Household Type | # Households | Household Size |
| Married-Couple | 454 (49.3%) | 3.10 |
| Single Male/Father | 4 (0.4%) | 4.50 |
| Single Female/Mother | 69 (7.5%) | 2.59 |
| Non-family | 393 (42.7%) | 1.13 |
| Total Households | 920 (100.0%) | 2.23 |
Household Size by Marriage Status in Carrington
Out of a total of 920 households in Carrington, 527 (57.3%) are family households, while 393 (42.7%) are nonfamily households. The most numerous type of family households are 2-person households, comprising 314, and the most common type of nonfamily households are 1-person households, comprising 347.
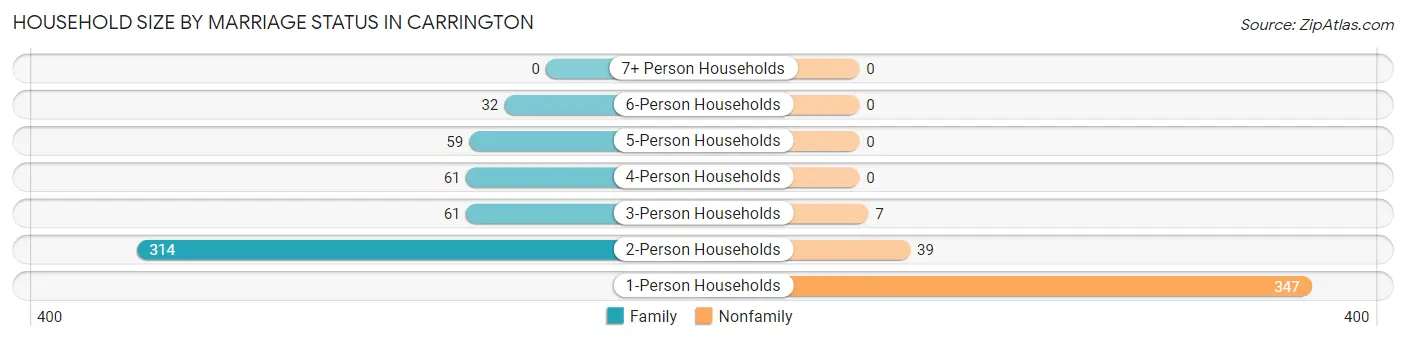
| Household Size | Family Households | Nonfamily Households |
| 1-Person Households | - | 347 (37.7%) |
| 2-Person Households | 314 (34.1%) | 39 (4.2%) |
| 3-Person Households | 61 (6.6%) | 7 (0.8%) |
| 4-Person Households | 61 (6.6%) | 0 (0.0%) |
| 5-Person Households | 59 (6.4%) | 0 (0.0%) |
| 6-Person Households | 32 (3.5%) | 0 (0.0%) |
| 7+ Person Households | 0 (0.0%) | 0 (0.0%) |
| Total | 527 (57.3%) | 393 (42.7%) |
Female Fertility in Carrington
Fertility by Age in Carrington
Average fertility rate in Carrington is 53.0 births per 1,000 women. Women in the age bracket of 20 to 34 years have the highest fertility rate with 185.0 births per 1,000 women. Women in the age bracket of 20 to 34 years acount for 100.0% of all women with births.
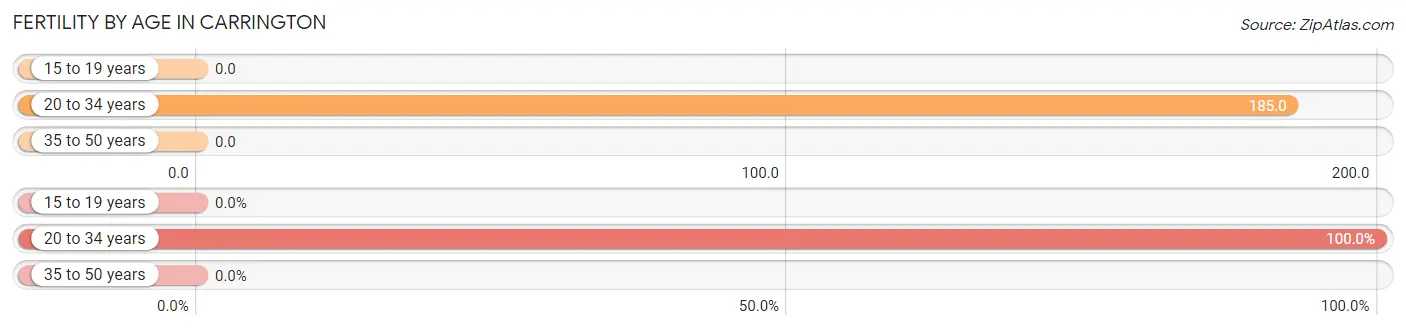
| Age Bracket | Women with Births | Births / 1,000 Women |
| 15 to 19 years | 0 (0.0%) | 0.0 |
| 20 to 34 years | 23 (100.0%) | 185.0 |
| 35 to 50 years | 0 (0.0%) | 0.0 |
| Total | 23 (100.0%) | 53.0 |
Fertility by Age by Marriage Status in Carrington
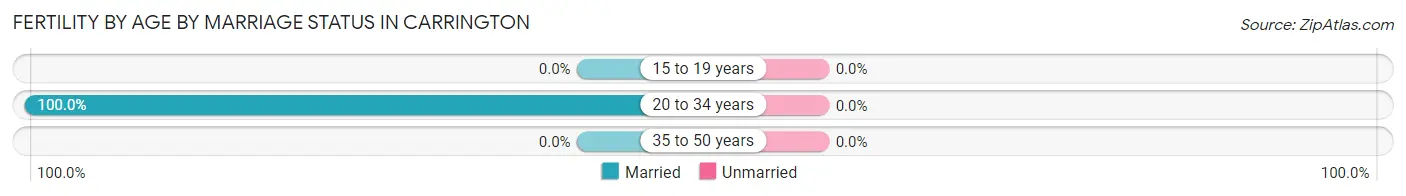
| Age Bracket | Married | Unmarried |
| 15 to 19 years | 0 (0.0%) | 0 (0.0%) |
| 20 to 34 years | 23 (100.0%) | 0 (0.0%) |
| 35 to 50 years | 0 (0.0%) | 0 (0.0%) |
| Total | 23 (100.0%) | 0 (0.0%) |
Fertility by Education in Carrington
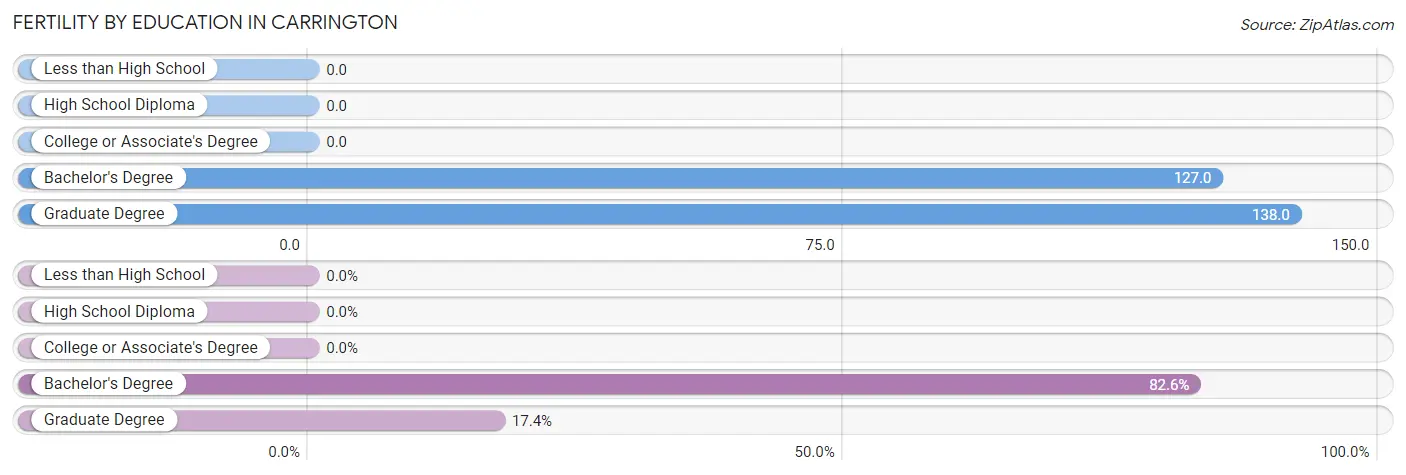
| Educational Attainment | Women with Births | Births / 1,000 Women |
| Less than High School | 0 (0.0%) | 0.0 |
| High School Diploma | 0 (0.0%) | 0.0 |
| College or Associate's Degree | 0 (0.0%) | 0.0 |
| Bachelor's Degree | 19 (82.6%) | 127.0 |
| Graduate Degree | 4 (17.4%) | 138.0 |
| Total | 23 (100.0%) | 53.0 |
Fertility by Education by Marriage Status in Carrington
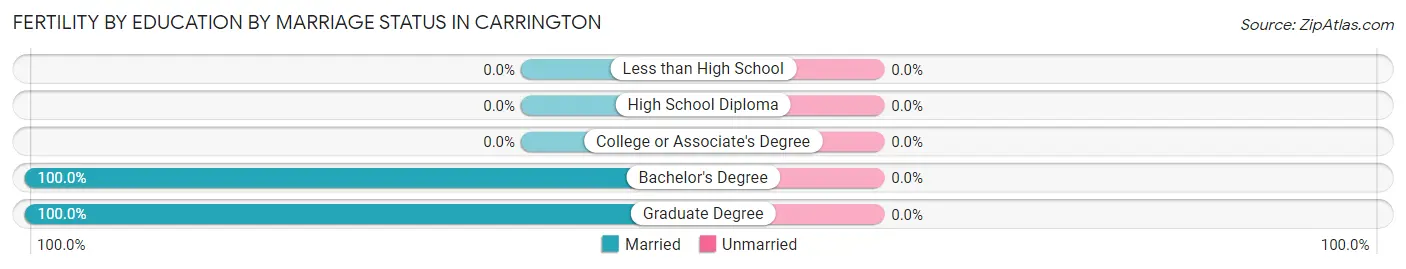
| Educational Attainment | Married | Unmarried |
| Less than High School | 0 (0.0%) | 0 (0.0%) |
| High School Diploma | 0 (0.0%) | 0 (0.0%) |
| College or Associate's Degree | 0 (0.0%) | 0 (0.0%) |
| Bachelor's Degree | 19 (100.0%) | 0 (0.0%) |
| Graduate Degree | 4 (100.0%) | 0 (0.0%) |
| Total | 23 (100.0%) | 0 (0.0%) |
Employment Characteristics in Carrington
Employment by Class of Employer in Carrington
Among the 1,136 employed individuals in Carrington, private company employees (569 | 50.1%), not-for-profit organizations (204 | 18.0%), and self-employed (not incorporated) (175 | 15.4%) make up the most common classes of employment.
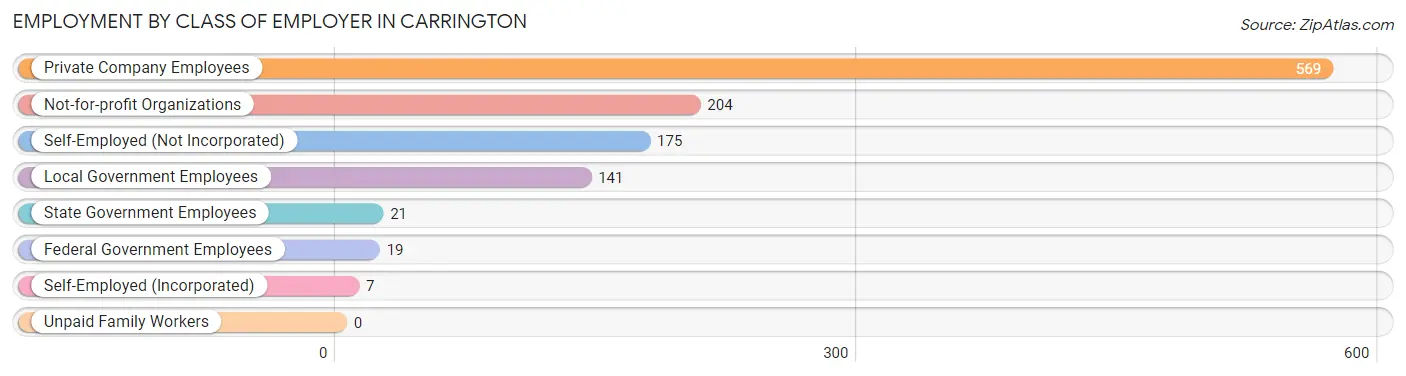
| Employer Class | # Employees | % Employees |
| Private Company Employees | 569 | 50.1% |
| Self-Employed (Incorporated) | 7 | 0.6% |
| Self-Employed (Not Incorporated) | 175 | 15.4% |
| Not-for-profit Organizations | 204 | 18.0% |
| Local Government Employees | 141 | 12.4% |
| State Government Employees | 21 | 1.8% |
| Federal Government Employees | 19 | 1.7% |
| Unpaid Family Workers | 0 | 0.0% |
| Total | 1,136 | 100.0% |
Employment Status by Age in Carrington
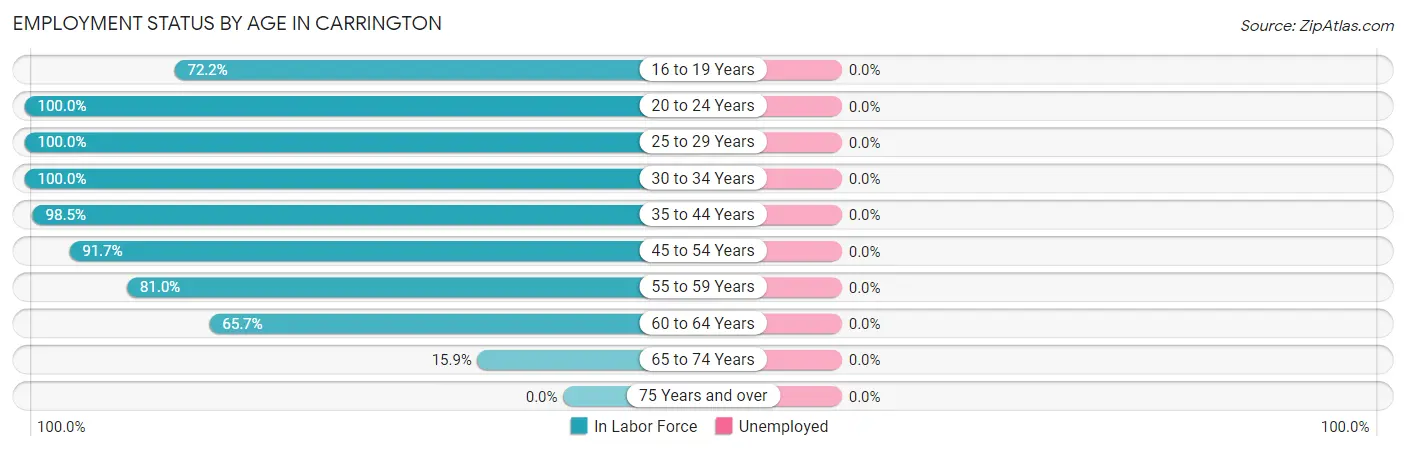
| Age Bracket | In Labor Force | Unemployed |
| 16 to 19 Years | 78 (72.2%) | 0 (0.0%) |
| 20 to 24 Years | 95 (100.0%) | 0 (0.0%) |
| 25 to 29 Years | 156 (100.0%) | 0 (0.0%) |
| 30 to 34 Years | 72 (100.0%) | 0 (0.0%) |
| 35 to 44 Years | 259 (98.5%) | 0 (0.0%) |
| 45 to 54 Years | 220 (91.7%) | 0 (0.0%) |
| 55 to 59 Years | 128 (81.0%) | 0 (0.0%) |
| 60 to 64 Years | 117 (65.7%) | 0 (0.0%) |
| 65 to 74 Years | 28 (15.9%) | 0 (0.0%) |
| 75 Years and over | 0 (0.0%) | 0 (0.0%) |
| Total | 1,152 (66.5%) | 0 (0.0%) |
Employment Status by Educational Attainment in Carrington
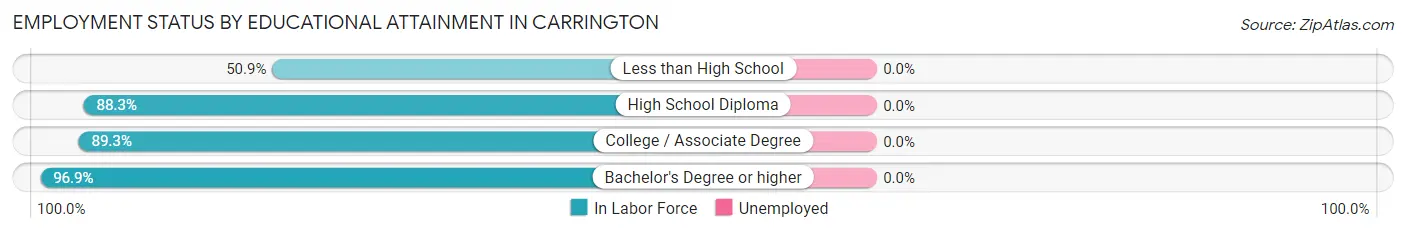
| Educational Attainment | In Labor Force | Unemployed |
| Less than High School | 27 (50.9%) | 0 (0.0%) |
| High School Diploma | 279 (88.3%) | 0 (0.0%) |
| College / Associate Degree | 360 (89.3%) | 0 (0.0%) |
| Bachelor's Degree or higher | 286 (96.9%) | 0 (0.0%) |
| Total | 952 (89.2%) | 0 (0.0%) |
Employment Occupations by Sex in Carrington
Management, Business, Science and Arts Occupations
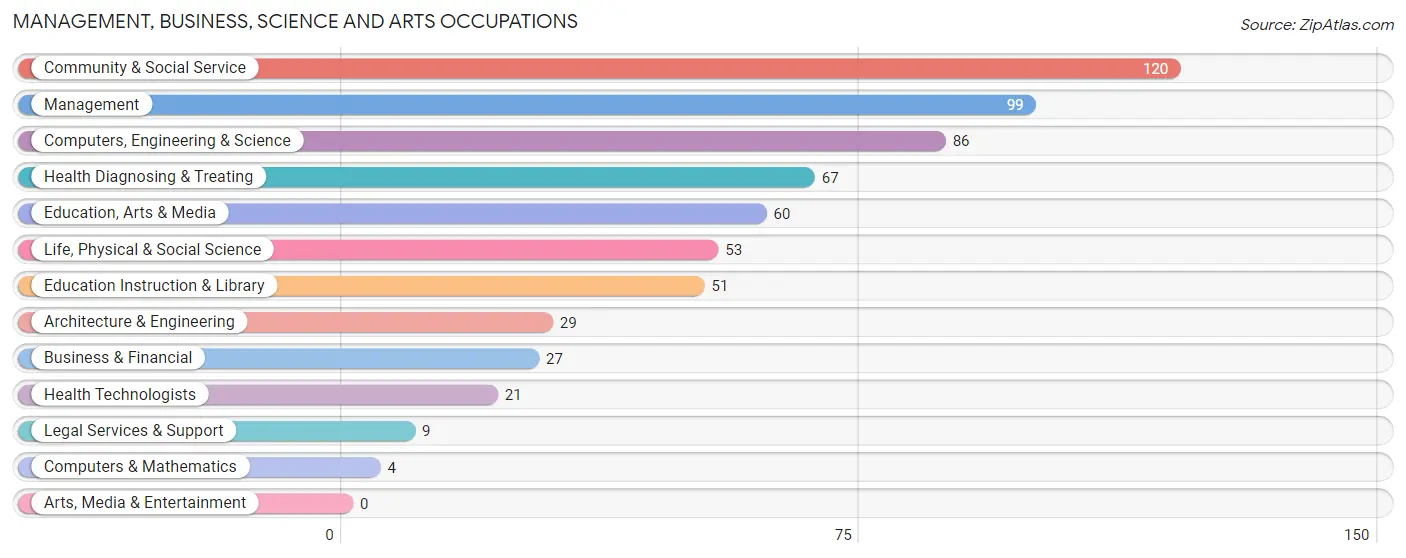
The most common Management, Business, Science and Arts occupations in Carrington are Community & Social Service (120 | 10.4%), Management (99 | 8.6%), Computers, Engineering & Science (86 | 7.5%), Health Diagnosing & Treating (67 | 5.8%), and Education, Arts & Media (60 | 5.2%).
Management, Business, Science and Arts Occupations by Sex
Within the Management, Business, Science and Arts occupations in Carrington, the most male-oriented occupations are Computers & Mathematics (100.0%), Architecture & Engineering (100.0%), and Management (66.7%), while the most female-oriented occupations are Business & Financial (100.0%), Legal Services & Support (100.0%), and Education Instruction & Library (100.0%).
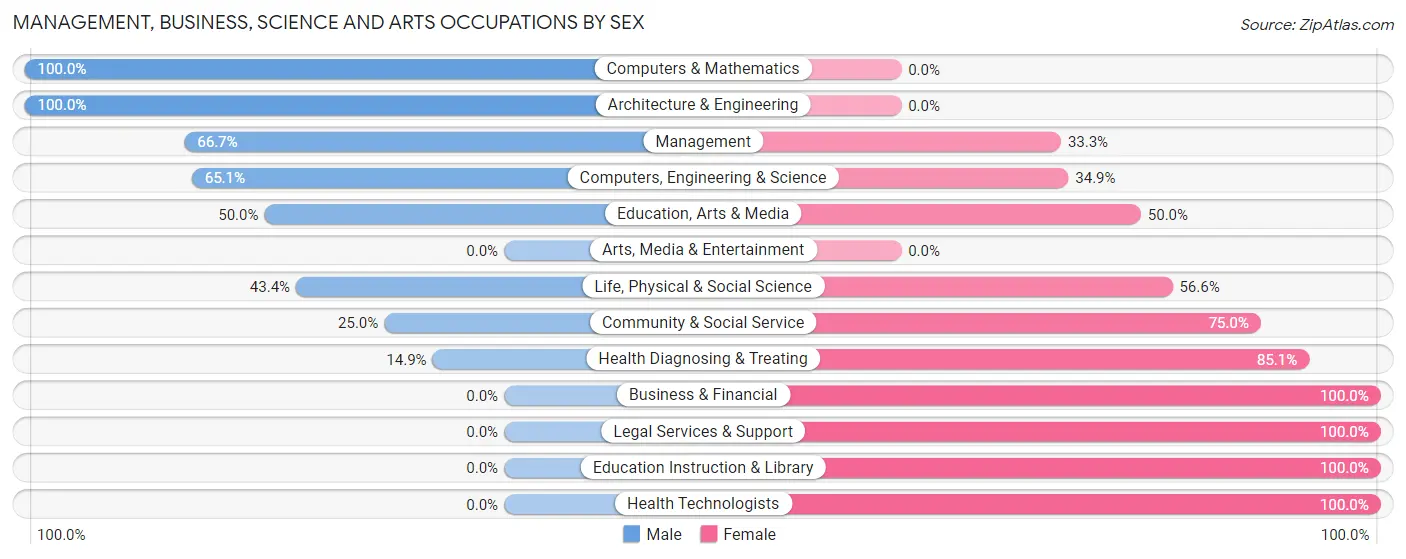
| Occupation | Male | Female |
| Management | 66 (66.7%) | 33 (33.3%) |
| Business & Financial | 0 (0.0%) | 27 (100.0%) |
| Computers, Engineering & Science | 56 (65.1%) | 30 (34.9%) |
| Computers & Mathematics | 4 (100.0%) | 0 (0.0%) |
| Architecture & Engineering | 29 (100.0%) | 0 (0.0%) |
| Life, Physical & Social Science | 23 (43.4%) | 30 (56.6%) |
| Community & Social Service | 30 (25.0%) | 90 (75.0%) |
| Education, Arts & Media | 30 (50.0%) | 30 (50.0%) |
| Legal Services & Support | 0 (0.0%) | 9 (100.0%) |
| Education Instruction & Library | 0 (0.0%) | 51 (100.0%) |
| Arts, Media & Entertainment | 0 (0.0%) | 0 (0.0%) |
| Health Diagnosing & Treating | 10 (14.9%) | 57 (85.1%) |
| Health Technologists | 0 (0.0%) | 21 (100.0%) |
| Total (Category) | 162 (40.6%) | 237 (59.4%) |
| Total (Overall) | 596 (51.8%) | 554 (48.2%) |
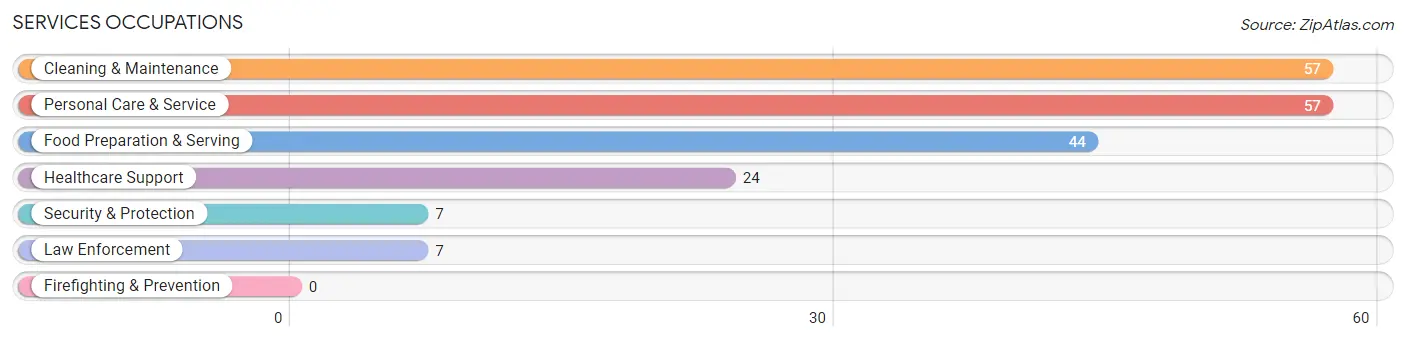
Services Occupations
The most common Services occupations in Carrington are Cleaning & Maintenance (57 | 5.0%), Personal Care & Service (57 | 5.0%), Food Preparation & Serving (44 | 3.8%), Healthcare Support (24 | 2.1%), and Security & Protection (7 | 0.6%).
Services Occupations by Sex
Within the Services occupations in Carrington, the most male-oriented occupations are Security & Protection (100.0%), Law Enforcement (100.0%), and Cleaning & Maintenance (71.9%), while the most female-oriented occupations are Healthcare Support (100.0%), Personal Care & Service (100.0%), and Food Preparation & Serving (63.6%).
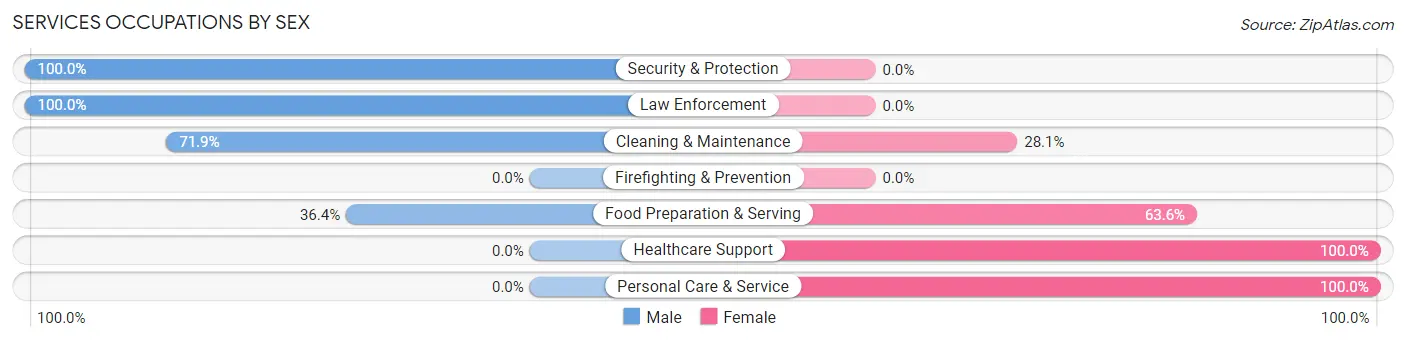
| Occupation | Male | Female |
| Healthcare Support | 0 (0.0%) | 24 (100.0%) |
| Security & Protection | 7 (100.0%) | 0 (0.0%) |
| Firefighting & Prevention | 0 (0.0%) | 0 (0.0%) |
| Law Enforcement | 7 (100.0%) | 0 (0.0%) |
| Food Preparation & Serving | 16 (36.4%) | 28 (63.6%) |
| Cleaning & Maintenance | 41 (71.9%) | 16 (28.1%) |
| Personal Care & Service | 0 (0.0%) | 57 (100.0%) |
| Total (Category) | 64 (33.9%) | 125 (66.1%) |
| Total (Overall) | 596 (51.8%) | 554 (48.2%) |
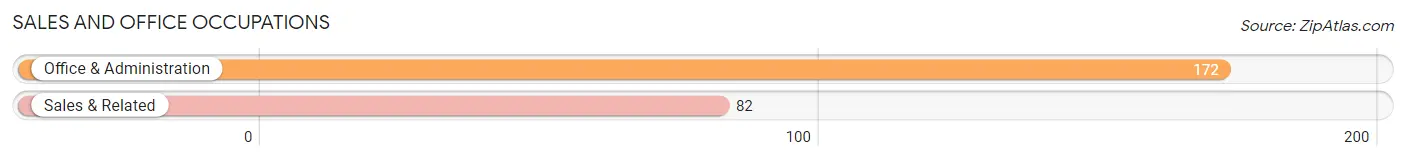
Sales and Office Occupations
The most common Sales and Office occupations in Carrington are Office & Administration (172 | 15.0%), and Sales & Related (82 | 7.1%).
Sales and Office Occupations by Sex
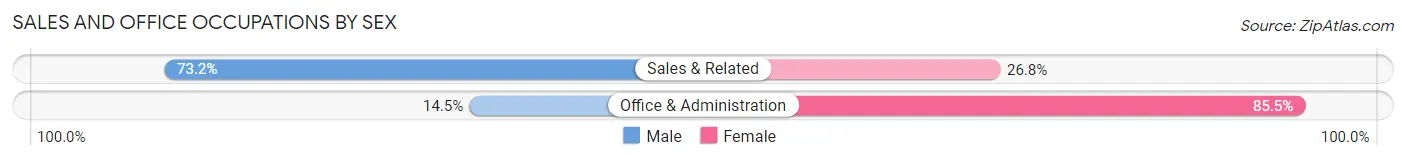
| Occupation | Male | Female |
| Sales & Related | 60 (73.2%) | 22 (26.8%) |
| Office & Administration | 25 (14.5%) | 147 (85.5%) |
| Total (Category) | 85 (33.5%) | 169 (66.5%) |
| Total (Overall) | 596 (51.8%) | 554 (48.2%) |
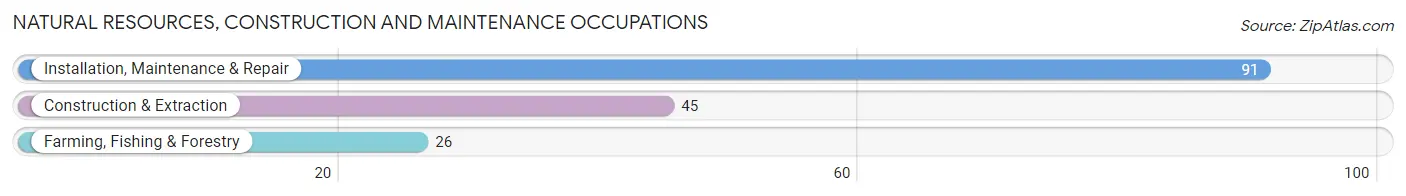
Natural Resources, Construction and Maintenance Occupations
The most common Natural Resources, Construction and Maintenance occupations in Carrington are Installation, Maintenance & Repair (91 | 7.9%), Construction & Extraction (45 | 3.9%), and Farming, Fishing & Forestry (26 | 2.3%).
Natural Resources, Construction and Maintenance Occupations by Sex
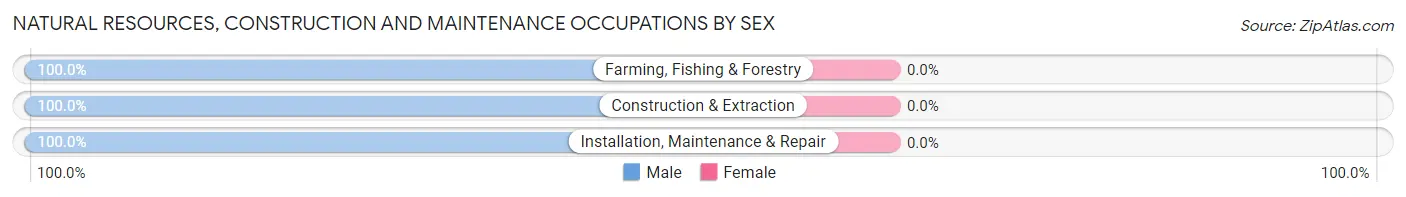
| Occupation | Male | Female |
| Farming, Fishing & Forestry | 26 (100.0%) | 0 (0.0%) |
| Construction & Extraction | 45 (100.0%) | 0 (0.0%) |
| Installation, Maintenance & Repair | 91 (100.0%) | 0 (0.0%) |
| Total (Category) | 162 (100.0%) | 0 (0.0%) |
| Total (Overall) | 596 (51.8%) | 554 (48.2%) |
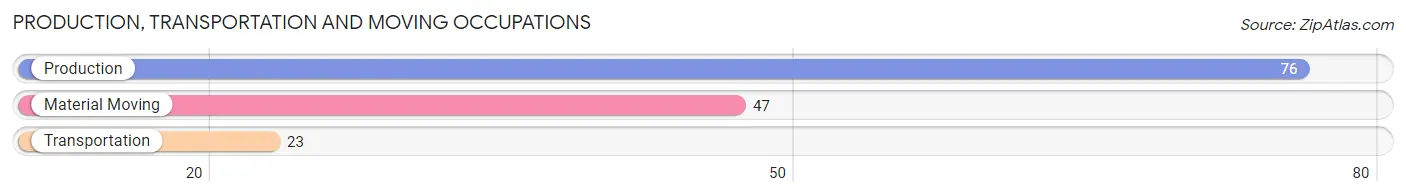
Production, Transportation and Moving Occupations
The most common Production, Transportation and Moving occupations in Carrington are Production (76 | 6.6%), Material Moving (47 | 4.1%), and Transportation (23 | 2.0%).
Production, Transportation and Moving Occupations by Sex
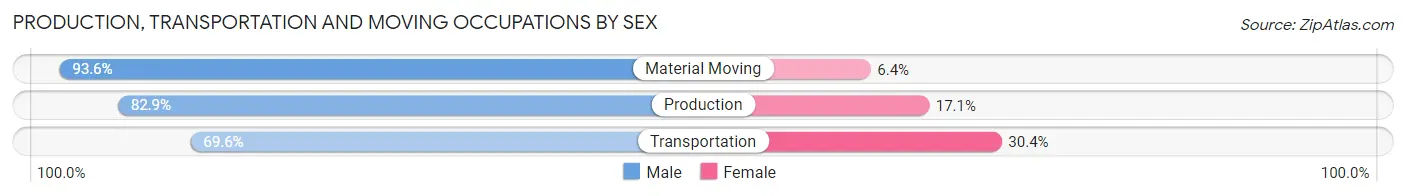
| Occupation | Male | Female |
| Production | 63 (82.9%) | 13 (17.1%) |
| Transportation | 16 (69.6%) | 7 (30.4%) |
| Material Moving | 44 (93.6%) | 3 (6.4%) |
| Total (Category) | 123 (84.3%) | 23 (15.8%) |
| Total (Overall) | 596 (51.8%) | 554 (48.2%) |
Employment Industries by Sex in Carrington
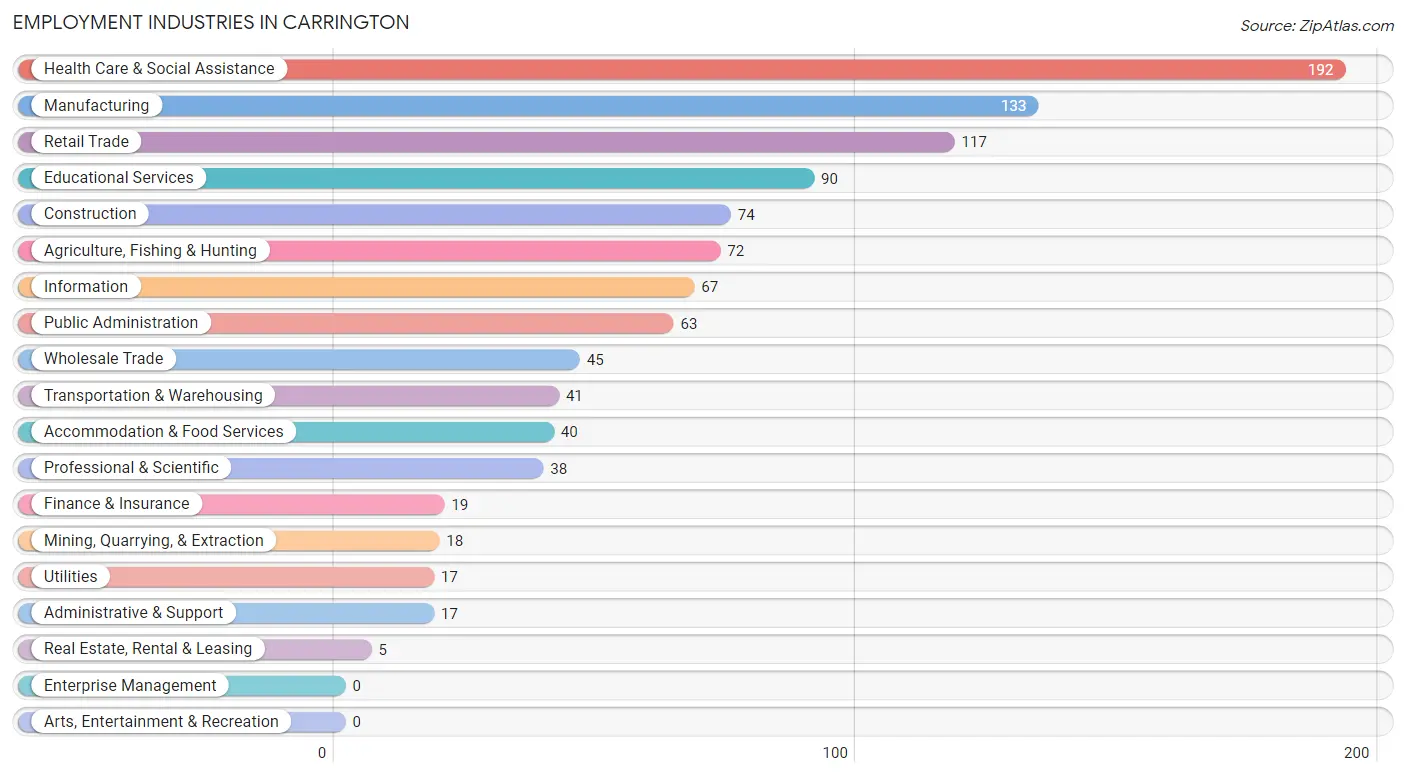
Employment Industries in Carrington
The major employment industries in Carrington include Health Care & Social Assistance (192 | 16.7%), Manufacturing (133 | 11.6%), Retail Trade (117 | 10.2%), Educational Services (90 | 7.8%), and Construction (74 | 6.4%).
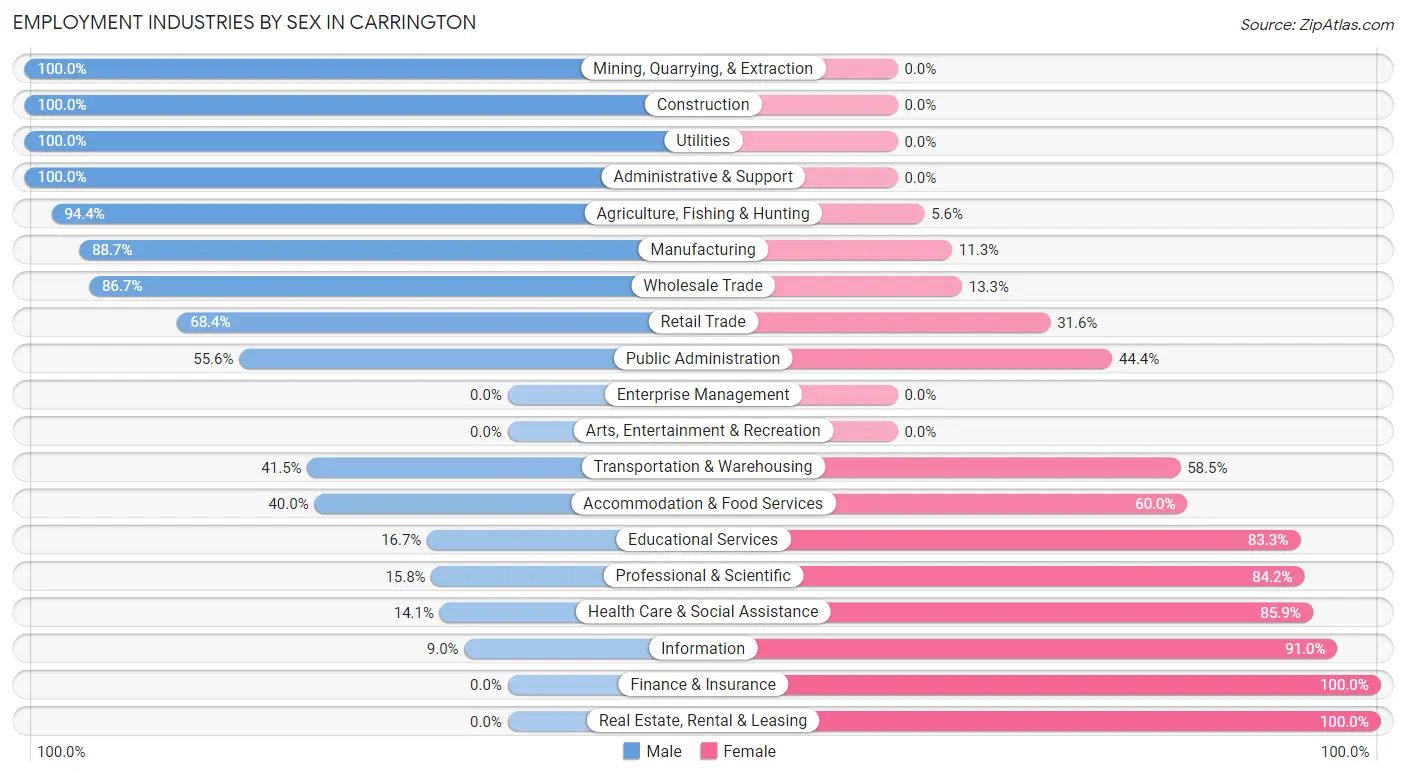
Employment Industries by Sex in Carrington
The Carrington industries that see more men than women are Mining, Quarrying, & Extraction (100.0%), Construction (100.0%), and Utilities (100.0%), whereas the industries that tend to have a higher number of women are Finance & Insurance (100.0%), Real Estate, Rental & Leasing (100.0%), and Information (91.0%).
| Industry | Male | Female |
| Agriculture, Fishing & Hunting | 68 (94.4%) | 4 (5.6%) |
| Mining, Quarrying, & Extraction | 18 (100.0%) | 0 (0.0%) |
| Construction | 74 (100.0%) | 0 (0.0%) |
| Manufacturing | 118 (88.7%) | 15 (11.3%) |
| Wholesale Trade | 39 (86.7%) | 6 (13.3%) |
| Retail Trade | 80 (68.4%) | 37 (31.6%) |
| Transportation & Warehousing | 17 (41.5%) | 24 (58.5%) |
| Utilities | 17 (100.0%) | 0 (0.0%) |
| Information | 6 (9.0%) | 61 (91.0%) |
| Finance & Insurance | 0 (0.0%) | 19 (100.0%) |
| Real Estate, Rental & Leasing | 0 (0.0%) | 5 (100.0%) |
| Professional & Scientific | 6 (15.8%) | 32 (84.2%) |
| Enterprise Management | 0 (0.0%) | 0 (0.0%) |
| Administrative & Support | 17 (100.0%) | 0 (0.0%) |
| Educational Services | 15 (16.7%) | 75 (83.3%) |
| Health Care & Social Assistance | 27 (14.1%) | 165 (85.9%) |
| Arts, Entertainment & Recreation | 0 (0.0%) | 0 (0.0%) |
| Accommodation & Food Services | 16 (40.0%) | 24 (60.0%) |
| Public Administration | 35 (55.6%) | 28 (44.4%) |
| Total | 596 (51.8%) | 554 (48.2%) |
Education in Carrington
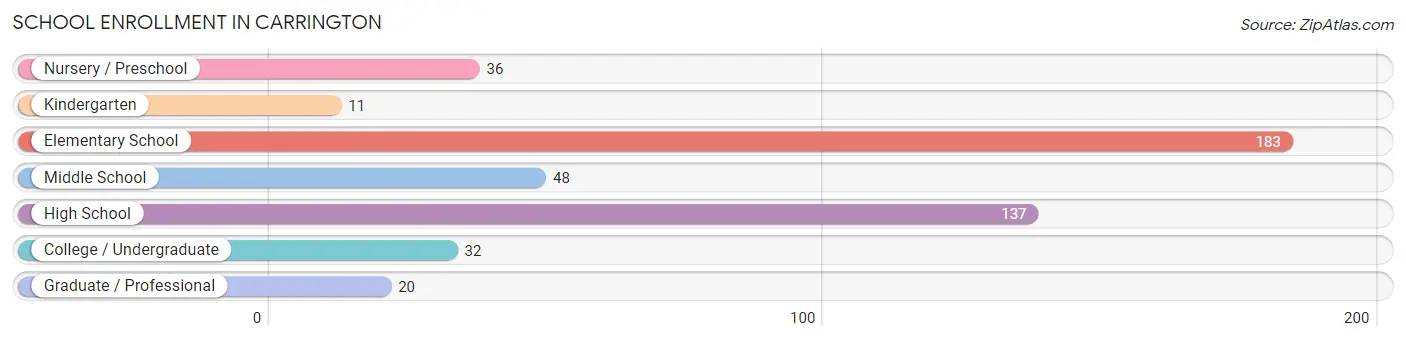
School Enrollment in Carrington
The most common levels of schooling among the 467 students in Carrington are elementary school (183 | 39.2%), high school (137 | 29.3%), and middle school (48 | 10.3%).
| School Level | # Students | % Students |
| Nursery / Preschool | 36 | 7.7% |
| Kindergarten | 11 | 2.4% |
| Elementary School | 183 | 39.2% |
| Middle School | 48 | 10.3% |
| High School | 137 | 29.3% |
| College / Undergraduate | 32 | 6.9% |
| Graduate / Professional | 20 | 4.3% |
| Total | 467 | 100.0% |
School Enrollment by Age by Funding Source in Carrington
Out of a total of 467 students who are enrolled in schools in Carrington, 13 (2.8%) attend a private institution, while the remaining 454 (97.2%) are enrolled in public schools. The age group of 18 to 19 year olds has the highest likelihood of being enrolled in private schools, with 9 (13.9% in the age bracket) enrolled. Conversely, the age group of 3 to 4 year olds has the lowest likelihood of being enrolled in a private school, with 28 (100.0% in the age bracket) attending a public institution.
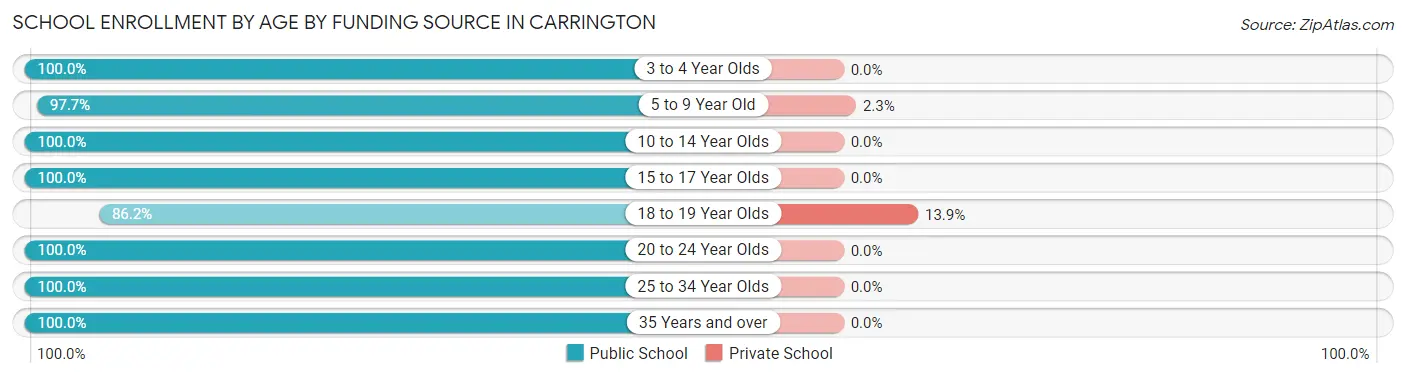
| Age Bracket | Public School | Private School |
| 3 to 4 Year Olds | 28 (100.0%) | 0 (0.0%) |
| 5 to 9 Year Old | 171 (97.7%) | 4 (2.3%) |
| 10 to 14 Year Olds | 71 (100.0%) | 0 (0.0%) |
| 15 to 17 Year Olds | 85 (100.0%) | 0 (0.0%) |
| 18 to 19 Year Olds | 56 (86.2%) | 9 (13.9%) |
| 20 to 24 Year Olds | 28 (100.0%) | 0 (0.0%) |
| 25 to 34 Year Olds | 2 (100.0%) | 0 (0.0%) |
| 35 Years and over | 13 (100.0%) | 0 (0.0%) |
| Total | 454 (97.2%) | 13 (2.8%) |
Educational Attainment by Field of Study in Carrington
Business (112 | 27.7%), bio, nature & agricultural (52 | 12.9%), education (51 | 12.6%), science & technology (49 | 12.1%), and arts & humanities (29 | 7.2%) are the most common fields of study among 404 individuals in Carrington who have obtained a bachelor's degree or higher.
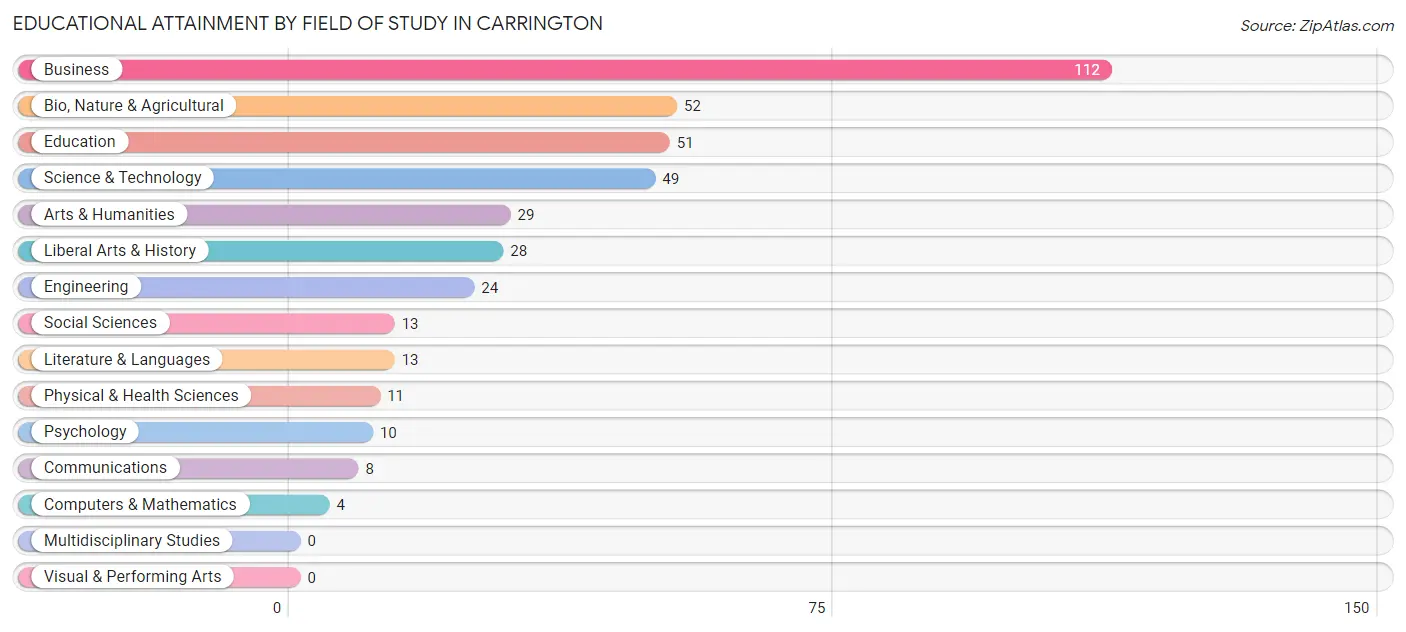
| Field of Study | # Graduates | % Graduates |
| Computers & Mathematics | 4 | 1.0% |
| Bio, Nature & Agricultural | 52 | 12.9% |
| Physical & Health Sciences | 11 | 2.7% |
| Psychology | 10 | 2.5% |
| Social Sciences | 13 | 3.2% |
| Engineering | 24 | 5.9% |
| Multidisciplinary Studies | 0 | 0.0% |
| Science & Technology | 49 | 12.1% |
| Business | 112 | 27.7% |
| Education | 51 | 12.6% |
| Literature & Languages | 13 | 3.2% |
| Liberal Arts & History | 28 | 6.9% |
| Visual & Performing Arts | 0 | 0.0% |
| Communications | 8 | 2.0% |
| Arts & Humanities | 29 | 7.2% |
| Total | 404 | 100.0% |
Transportation & Commute in Carrington
Vehicle Availability by Sex in Carrington
The most prevalent vehicle ownership categories in Carrington are males with 2 vehicles (266, accounting for 45.6%) and females with 2 vehicles (211, making up 48.7%).
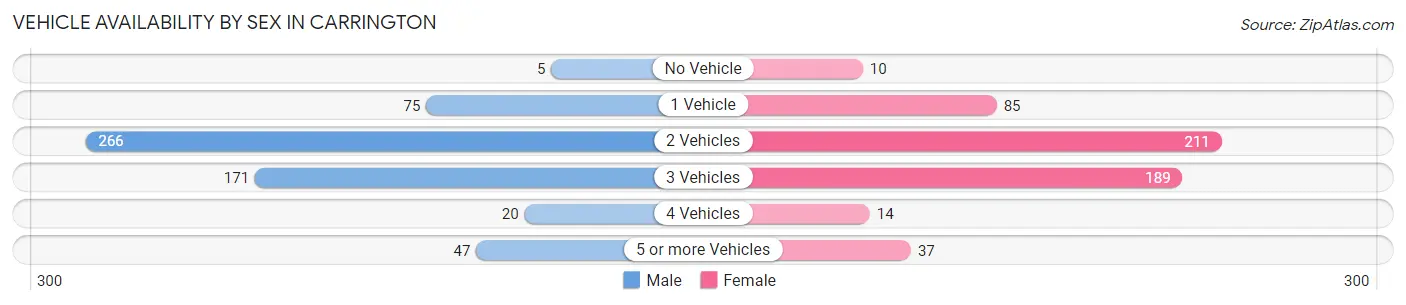
| Vehicles Available | Male | Female |
| No Vehicle | 5 (0.9%) | 10 (1.8%) |
| 1 Vehicle | 75 (12.8%) | 85 (15.6%) |
| 2 Vehicles | 266 (45.6%) | 211 (38.6%) |
| 3 Vehicles | 171 (29.3%) | 189 (34.6%) |
| 4 Vehicles | 20 (3.4%) | 14 (2.6%) |
| 5 or more Vehicles | 47 (8.1%) | 37 (6.8%) |
| Total | 584 (100.0%) | 546 (100.0%) |
Commute Time in Carrington
The most frequently occuring commute durations in Carrington are 5 to 9 minutes (377 commuters, 35.3%), less than 5 minutes (284 commuters, 26.6%), and 10 to 14 minutes (124 commuters, 11.6%).
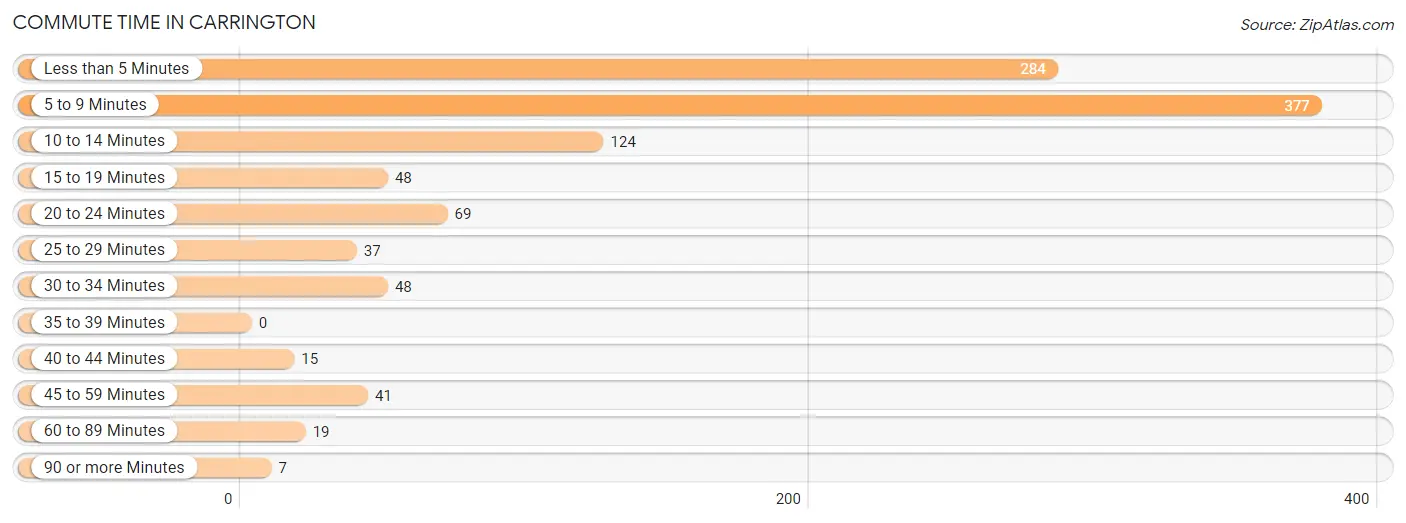
| Commute Time | # Commuters | % Commuters |
| Less than 5 Minutes | 284 | 26.6% |
| 5 to 9 Minutes | 377 | 35.3% |
| 10 to 14 Minutes | 124 | 11.6% |
| 15 to 19 Minutes | 48 | 4.5% |
| 20 to 24 Minutes | 69 | 6.5% |
| 25 to 29 Minutes | 37 | 3.5% |
| 30 to 34 Minutes | 48 | 4.5% |
| 35 to 39 Minutes | 0 | 0.0% |
| 40 to 44 Minutes | 15 | 1.4% |
| 45 to 59 Minutes | 41 | 3.8% |
| 60 to 89 Minutes | 19 | 1.8% |
| 90 or more Minutes | 7 | 0.6% |
Commute Time by Sex in Carrington
The most common commute times in Carrington are 5 to 9 minutes (178 commuters, 31.8%) for males and 5 to 9 minutes (199 commuters, 39.1%) for females.
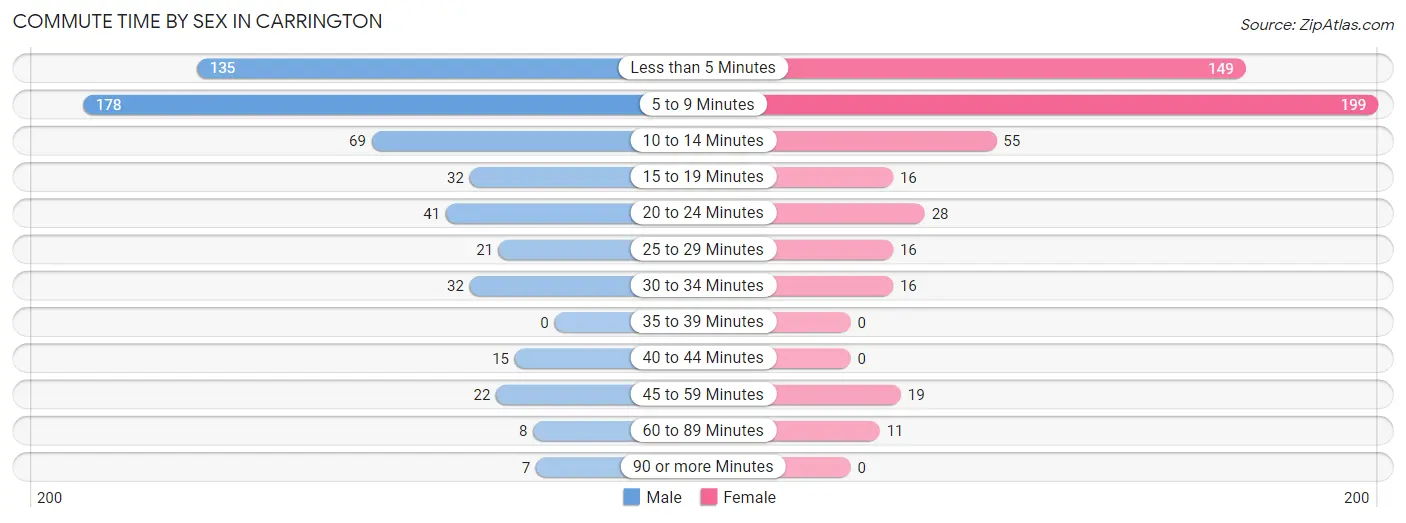
| Commute Time | Male | Female |
| Less than 5 Minutes | 135 (24.1%) | 149 (29.3%) |
| 5 to 9 Minutes | 178 (31.8%) | 199 (39.1%) |
| 10 to 14 Minutes | 69 (12.3%) | 55 (10.8%) |
| 15 to 19 Minutes | 32 (5.7%) | 16 (3.1%) |
| 20 to 24 Minutes | 41 (7.3%) | 28 (5.5%) |
| 25 to 29 Minutes | 21 (3.7%) | 16 (3.1%) |
| 30 to 34 Minutes | 32 (5.7%) | 16 (3.1%) |
| 35 to 39 Minutes | 0 (0.0%) | 0 (0.0%) |
| 40 to 44 Minutes | 15 (2.7%) | 0 (0.0%) |
| 45 to 59 Minutes | 22 (3.9%) | 19 (3.7%) |
| 60 to 89 Minutes | 8 (1.4%) | 11 (2.2%) |
| 90 or more Minutes | 7 (1.3%) | 0 (0.0%) |
Time of Departure to Work by Sex in Carrington
The most frequent times of departure to work in Carrington are 7:30 AM to 7:59 AM (204, 36.4%) for males and 7:30 AM to 7:59 AM (127, 24.9%) for females.
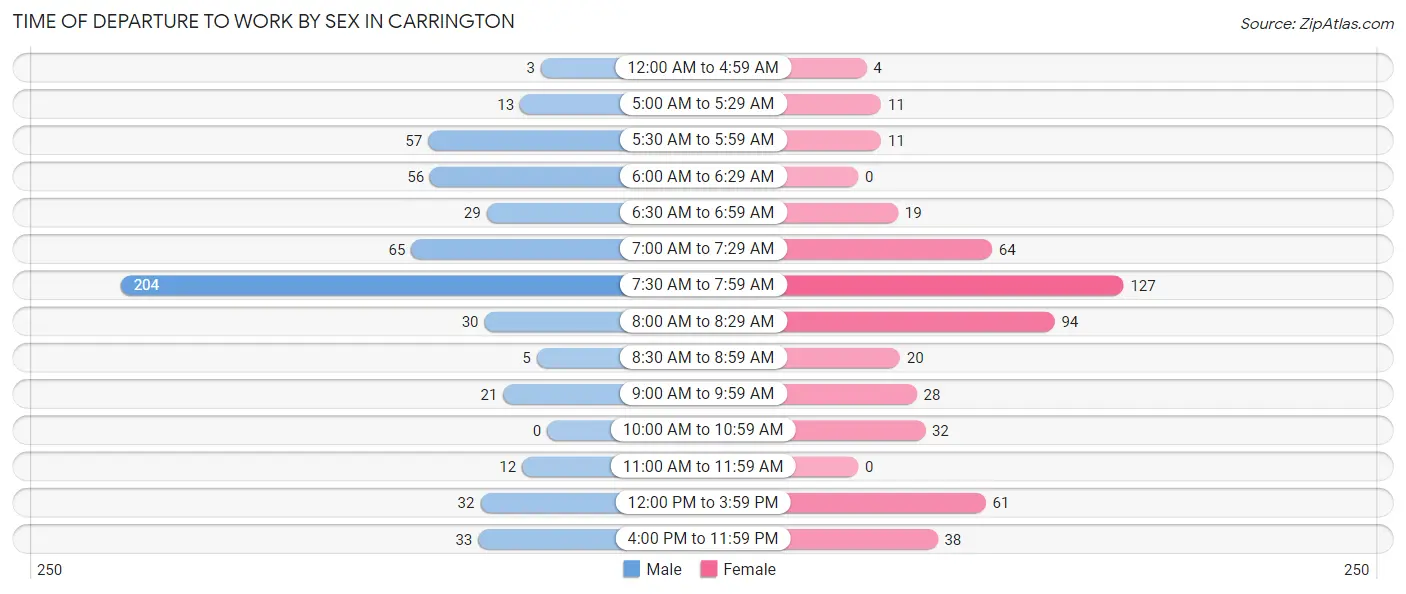
| Time of Departure | Male | Female |
| 12:00 AM to 4:59 AM | 3 (0.5%) | 4 (0.8%) |
| 5:00 AM to 5:29 AM | 13 (2.3%) | 11 (2.2%) |
| 5:30 AM to 5:59 AM | 57 (10.2%) | 11 (2.2%) |
| 6:00 AM to 6:29 AM | 56 (10.0%) | 0 (0.0%) |
| 6:30 AM to 6:59 AM | 29 (5.2%) | 19 (3.7%) |
| 7:00 AM to 7:29 AM | 65 (11.6%) | 64 (12.6%) |
| 7:30 AM to 7:59 AM | 204 (36.4%) | 127 (24.9%) |
| 8:00 AM to 8:29 AM | 30 (5.4%) | 94 (18.5%) |
| 8:30 AM to 8:59 AM | 5 (0.9%) | 20 (3.9%) |
| 9:00 AM to 9:59 AM | 21 (3.7%) | 28 (5.5%) |
| 10:00 AM to 10:59 AM | 0 (0.0%) | 32 (6.3%) |
| 11:00 AM to 11:59 AM | 12 (2.1%) | 0 (0.0%) |
| 12:00 PM to 3:59 PM | 32 (5.7%) | 61 (12.0%) |
| 4:00 PM to 11:59 PM | 33 (5.9%) | 38 (7.5%) |
| Total | 560 (100.0%) | 509 (100.0%) |
Housing Occupancy in Carrington
Occupancy by Ownership in Carrington
Of the total 920 dwellings in Carrington, owner-occupied units account for 643 (69.9%), while renter-occupied units make up 277 (30.1%).
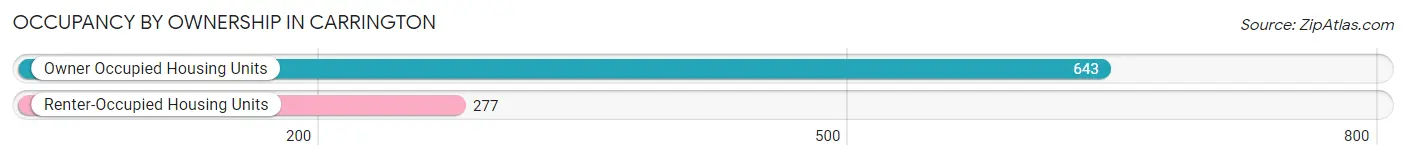
| Occupancy | # Housing Units | % Housing Units |
| Owner Occupied Housing Units | 643 | 69.9% |
| Renter-Occupied Housing Units | 277 | 30.1% |
| Total Occupied Housing Units | 920 | 100.0% |
Occupancy by Household Size in Carrington
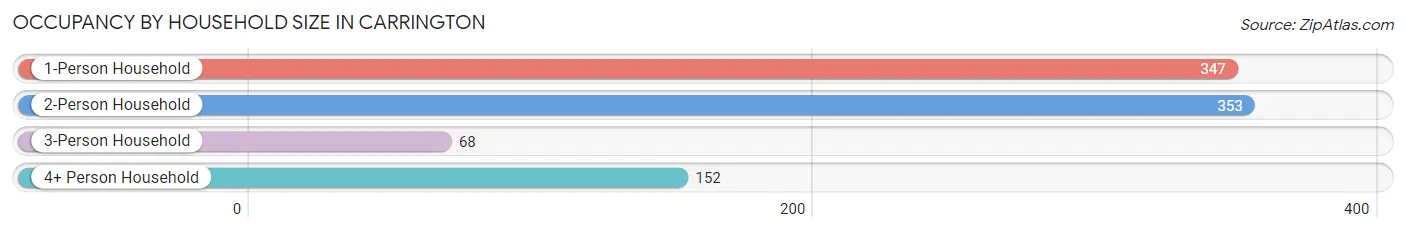
| Household Size | # Housing Units | % Housing Units |
| 1-Person Household | 347 | 37.7% |
| 2-Person Household | 353 | 38.4% |
| 3-Person Household | 68 | 7.4% |
| 4+ Person Household | 152 | 16.5% |
| Total Housing Units | 920 | 100.0% |
Occupancy by Ownership by Household Size in Carrington
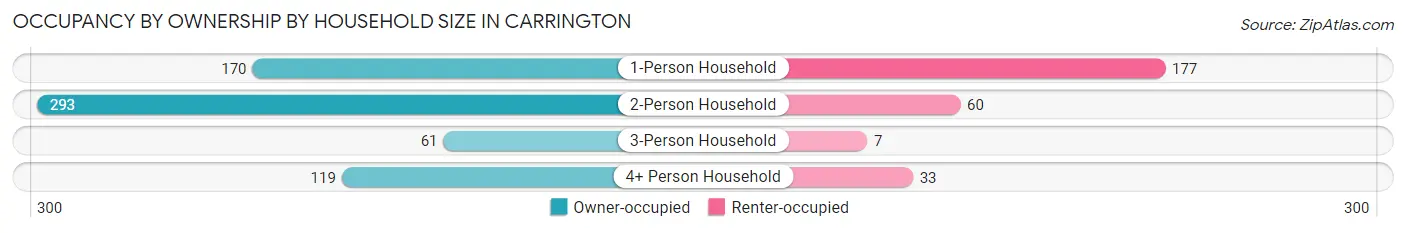
| Household Size | Owner-occupied | Renter-occupied |
| 1-Person Household | 170 (49.0%) | 177 (51.0%) |
| 2-Person Household | 293 (83.0%) | 60 (17.0%) |
| 3-Person Household | 61 (89.7%) | 7 (10.3%) |
| 4+ Person Household | 119 (78.3%) | 33 (21.7%) |
| Total Housing Units | 643 (69.9%) | 277 (30.1%) |
Occupancy by Educational Attainment in Carrington
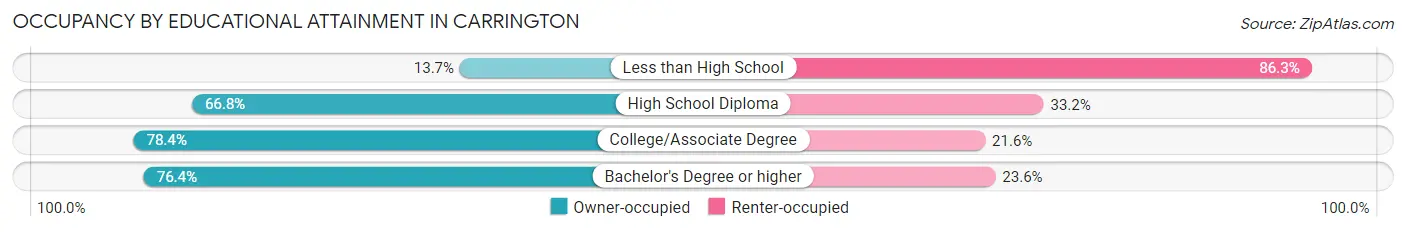
| Household Size | Owner-occupied | Renter-occupied |
| Less than High School | 10 (13.7%) | 63 (86.3%) |
| High School Diploma | 153 (66.8%) | 76 (33.2%) |
| College/Associate Degree | 312 (78.4%) | 86 (21.6%) |
| Bachelor's Degree or higher | 168 (76.4%) | 52 (23.6%) |
Occupancy by Age of Householder in Carrington
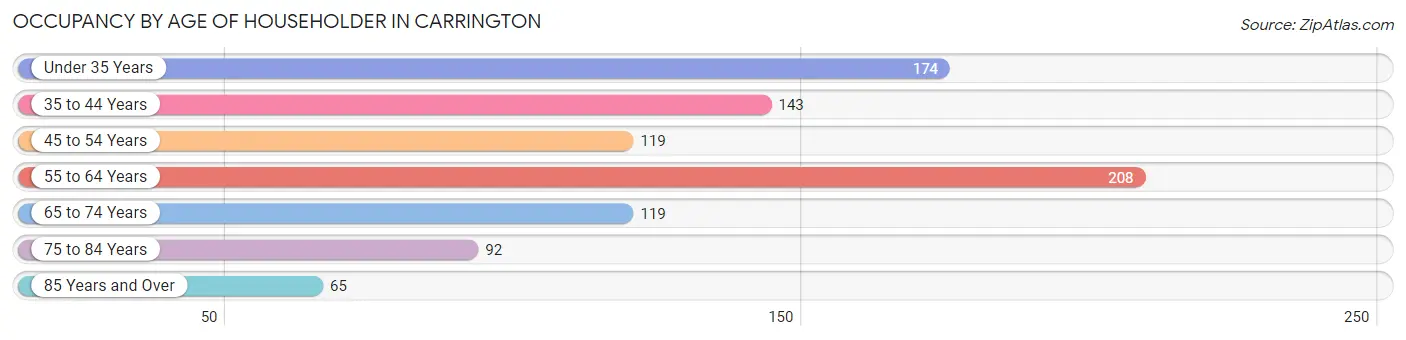
| Age Bracket | # Households | % Households |
| Under 35 Years | 174 | 18.9% |
| 35 to 44 Years | 143 | 15.5% |
| 45 to 54 Years | 119 | 12.9% |
| 55 to 64 Years | 208 | 22.6% |
| 65 to 74 Years | 119 | 12.9% |
| 75 to 84 Years | 92 | 10.0% |
| 85 Years and Over | 65 | 7.1% |
| Total | 920 | 100.0% |
Housing Finances in Carrington
Median Income by Occupancy in Carrington
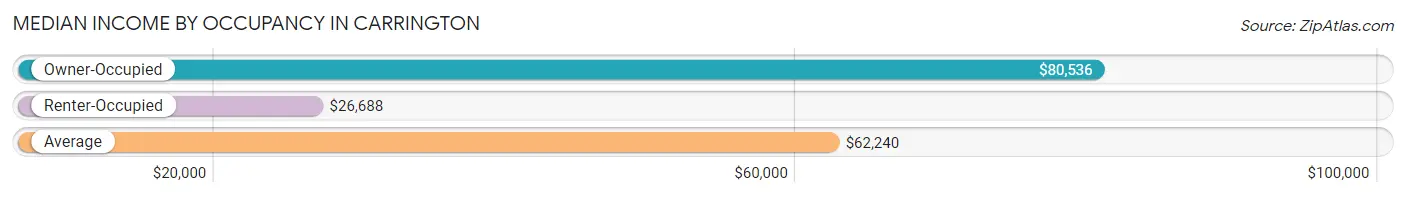
| Occupancy Type | # Households | Median Income |
| Owner-Occupied | 643 (69.9%) | $80,536 |
| Renter-Occupied | 277 (30.1%) | $26,688 |
| Average | 920 (100.0%) | $62,240 |
Occupancy by Householder Income Bracket in Carrington
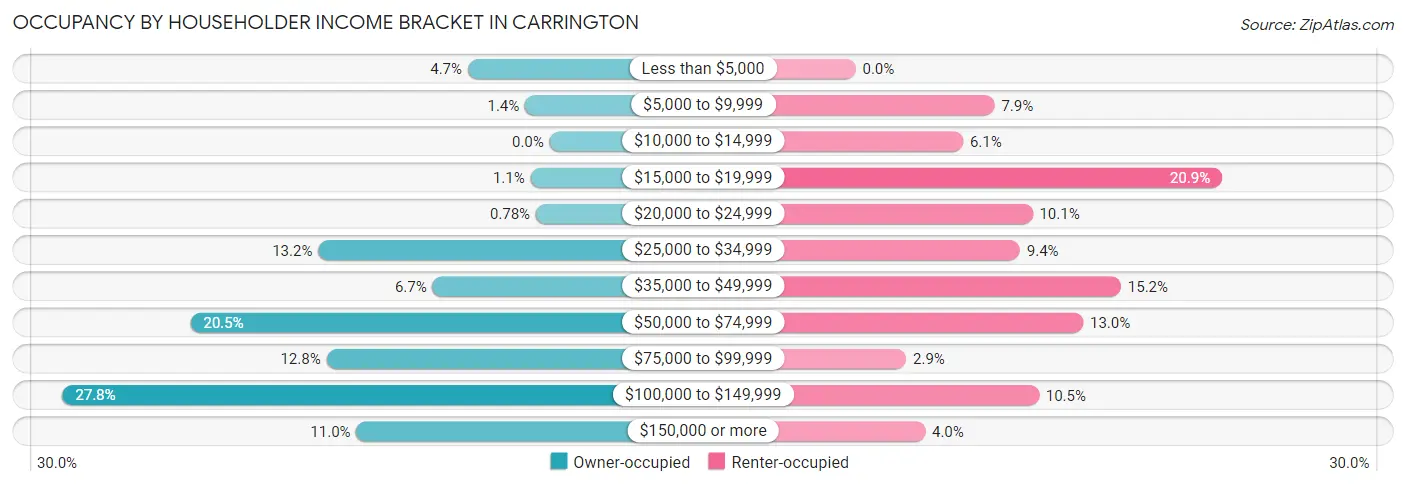
| Income Bracket | Owner-occupied | Renter-occupied |
| Less than $5,000 | 30 (4.7%) | 0 (0.0%) |
| $5,000 to $9,999 | 9 (1.4%) | 22 (7.9%) |
| $10,000 to $14,999 | 0 (0.0%) | 17 (6.1%) |
| $15,000 to $19,999 | 7 (1.1%) | 58 (20.9%) |
| $20,000 to $24,999 | 5 (0.8%) | 28 (10.1%) |
| $25,000 to $34,999 | 85 (13.2%) | 26 (9.4%) |
| $35,000 to $49,999 | 43 (6.7%) | 42 (15.2%) |
| $50,000 to $74,999 | 132 (20.5%) | 36 (13.0%) |
| $75,000 to $99,999 | 82 (12.8%) | 8 (2.9%) |
| $100,000 to $149,999 | 179 (27.8%) | 29 (10.5%) |
| $150,000 or more | 71 (11.0%) | 11 (4.0%) |
| Total | 643 (100.0%) | 277 (100.0%) |
Monthly Housing Cost Tiers in Carrington
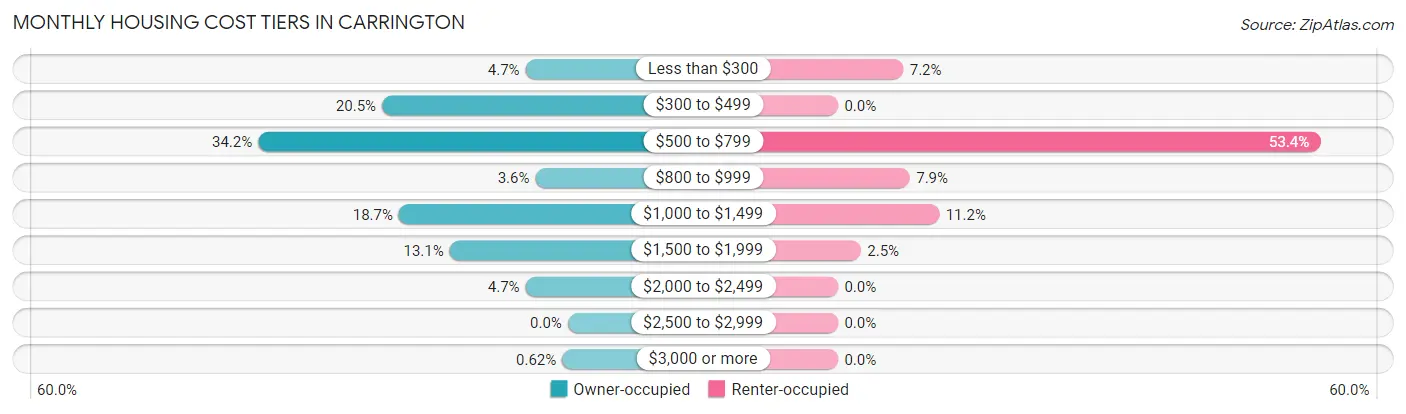
| Monthly Cost | Owner-occupied | Renter-occupied |
| Less than $300 | 30 (4.7%) | 20 (7.2%) |
| $300 to $499 | 132 (20.5%) | 0 (0.0%) |
| $500 to $799 | 220 (34.2%) | 148 (53.4%) |
| $800 to $999 | 23 (3.6%) | 22 (7.9%) |
| $1,000 to $1,499 | 120 (18.7%) | 31 (11.2%) |
| $1,500 to $1,999 | 84 (13.1%) | 7 (2.5%) |
| $2,000 to $2,499 | 30 (4.7%) | 0 (0.0%) |
| $2,500 to $2,999 | 0 (0.0%) | 0 (0.0%) |
| $3,000 or more | 4 (0.6%) | 0 (0.0%) |
| Total | 643 (100.0%) | 277 (100.0%) |
Physical Housing Characteristics in Carrington
Housing Structures in Carrington
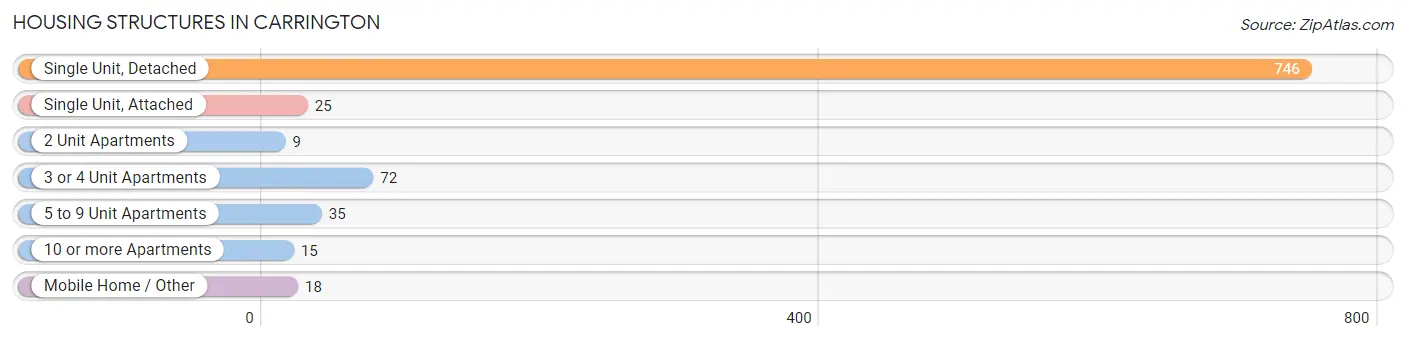
| Structure Type | # Housing Units | % Housing Units |
| Single Unit, Detached | 746 | 81.1% |
| Single Unit, Attached | 25 | 2.7% |
| 2 Unit Apartments | 9 | 1.0% |
| 3 or 4 Unit Apartments | 72 | 7.8% |
| 5 to 9 Unit Apartments | 35 | 3.8% |
| 10 or more Apartments | 15 | 1.6% |
| Mobile Home / Other | 18 | 2.0% |
| Total | 920 | 100.0% |
Housing Structures by Occupancy in Carrington
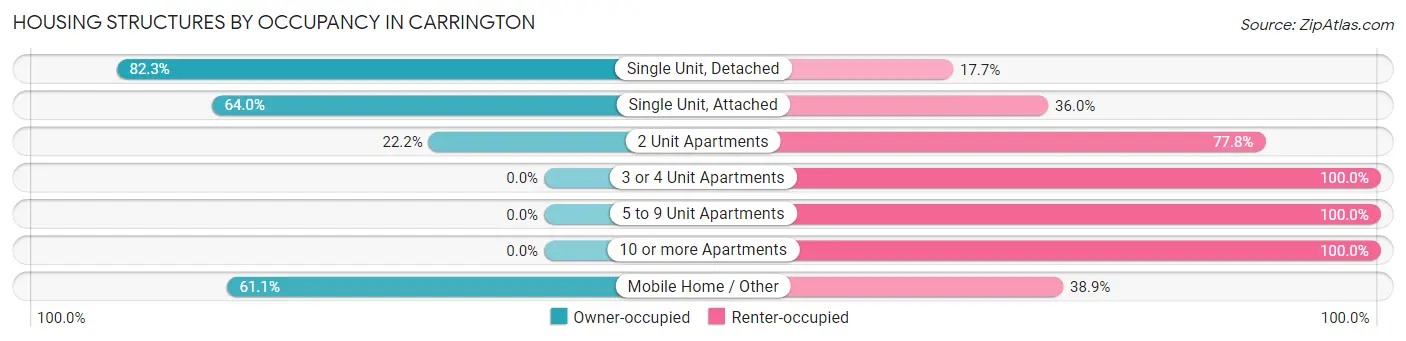
| Structure Type | Owner-occupied | Renter-occupied |
| Single Unit, Detached | 614 (82.3%) | 132 (17.7%) |
| Single Unit, Attached | 16 (64.0%) | 9 (36.0%) |
| 2 Unit Apartments | 2 (22.2%) | 7 (77.8%) |
| 3 or 4 Unit Apartments | 0 (0.0%) | 72 (100.0%) |
| 5 to 9 Unit Apartments | 0 (0.0%) | 35 (100.0%) |
| 10 or more Apartments | 0 (0.0%) | 15 (100.0%) |
| Mobile Home / Other | 11 (61.1%) | 7 (38.9%) |
| Total | 643 (69.9%) | 277 (30.1%) |
Housing Structures by Number of Rooms in Carrington
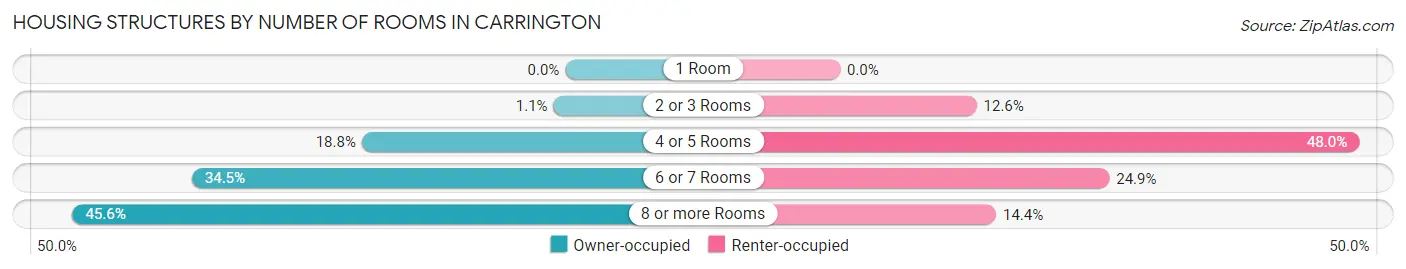
| Number of Rooms | Owner-occupied | Renter-occupied |
| 1 Room | 0 (0.0%) | 0 (0.0%) |
| 2 or 3 Rooms | 7 (1.1%) | 35 (12.6%) |
| 4 or 5 Rooms | 121 (18.8%) | 133 (48.0%) |
| 6 or 7 Rooms | 222 (34.5%) | 69 (24.9%) |
| 8 or more Rooms | 293 (45.6%) | 40 (14.4%) |
| Total | 643 (100.0%) | 277 (100.0%) |
Housing Structure by Heating Type in Carrington
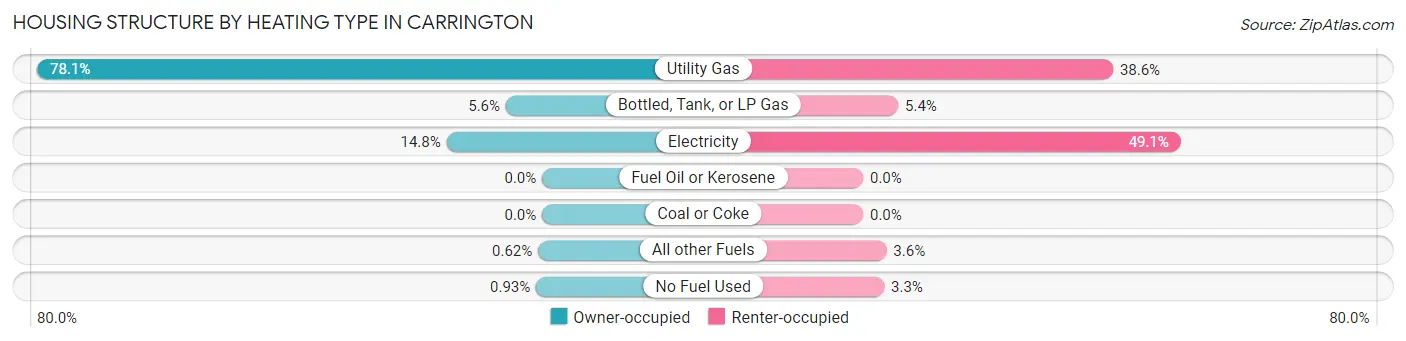
| Heating Type | Owner-occupied | Renter-occupied |
| Utility Gas | 502 (78.1%) | 107 (38.6%) |
| Bottled, Tank, or LP Gas | 36 (5.6%) | 15 (5.4%) |
| Electricity | 95 (14.8%) | 136 (49.1%) |
| Fuel Oil or Kerosene | 0 (0.0%) | 0 (0.0%) |
| Coal or Coke | 0 (0.0%) | 0 (0.0%) |
| All other Fuels | 4 (0.6%) | 10 (3.6%) |
| No Fuel Used | 6 (0.9%) | 9 (3.3%) |
| Total | 643 (100.0%) | 277 (100.0%) |
Household Vehicle Usage in Carrington
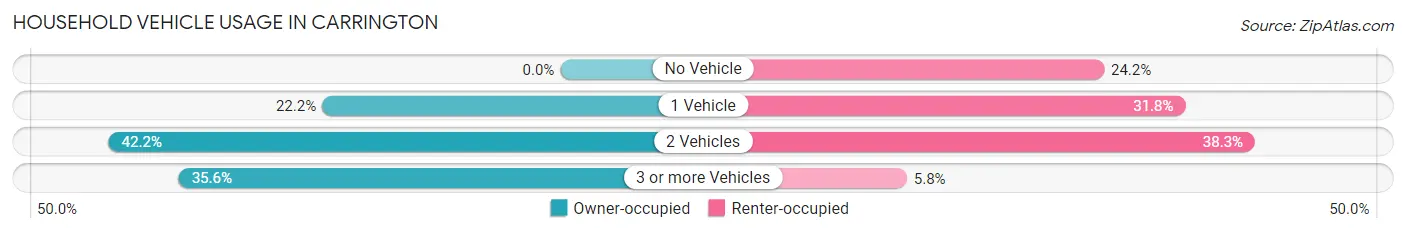
| Vehicles per Household | Owner-occupied | Renter-occupied |
| No Vehicle | 0 (0.0%) | 67 (24.2%) |
| 1 Vehicle | 143 (22.2%) | 88 (31.8%) |
| 2 Vehicles | 271 (42.1%) | 106 (38.3%) |
| 3 or more Vehicles | 229 (35.6%) | 16 (5.8%) |
| Total | 643 (100.0%) | 277 (100.0%) |
Real Estate & Mortgages in Carrington
Real Estate and Mortgage Overview in Carrington
| Characteristic | Without Mortgage | With Mortgage |
| Housing Units | 335 | 308 |
| Median Property Value | $133,200 | $163,800 |
| Median Household Income | $60,885 | $40 |
| Monthly Housing Costs | $520 | $4 |
| Real Estate Taxes | $1,848 | $22 |
Property Value by Mortgage Status in Carrington
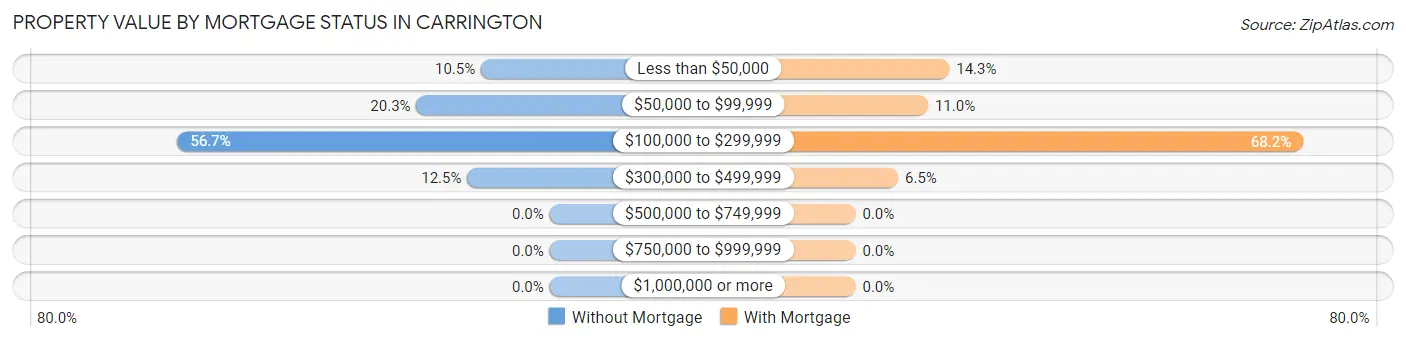
| Property Value | Without Mortgage | With Mortgage |
| Less than $50,000 | 35 (10.4%) | 44 (14.3%) |
| $50,000 to $99,999 | 68 (20.3%) | 34 (11.0%) |
| $100,000 to $299,999 | 190 (56.7%) | 210 (68.2%) |
| $300,000 to $499,999 | 42 (12.5%) | 20 (6.5%) |
| $500,000 to $749,999 | 0 (0.0%) | 0 (0.0%) |
| $750,000 to $999,999 | 0 (0.0%) | 0 (0.0%) |
| $1,000,000 or more | 0 (0.0%) | 0 (0.0%) |
| Total | 335 (100.0%) | 308 (100.0%) |
Household Income by Mortgage Status in Carrington
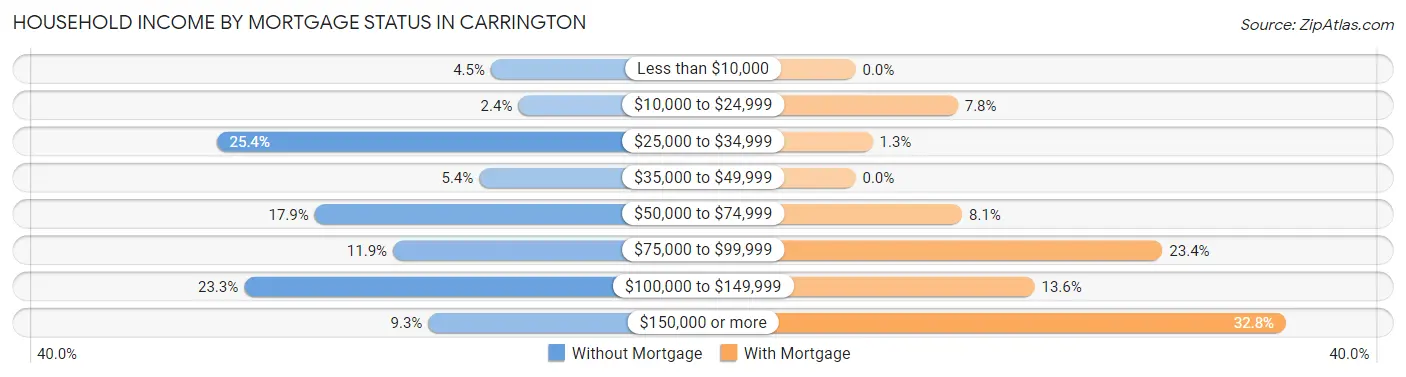
| Household Income | Without Mortgage | With Mortgage |
| Less than $10,000 | 15 (4.5%) | 0 (0.0%) |
| $10,000 to $24,999 | 8 (2.4%) | 24 (7.8%) |
| $25,000 to $34,999 | 85 (25.4%) | 4 (1.3%) |
| $35,000 to $49,999 | 18 (5.4%) | 0 (0.0%) |
| $50,000 to $74,999 | 60 (17.9%) | 25 (8.1%) |
| $75,000 to $99,999 | 40 (11.9%) | 72 (23.4%) |
| $100,000 to $149,999 | 78 (23.3%) | 42 (13.6%) |
| $150,000 or more | 31 (9.2%) | 101 (32.8%) |
| Total | 335 (100.0%) | 308 (100.0%) |
Property Value to Household Income Ratio in Carrington
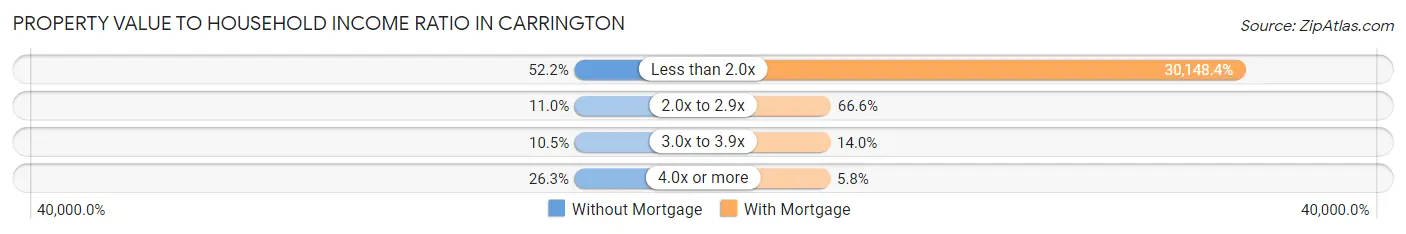
| Value-to-Income Ratio | Without Mortgage | With Mortgage |
| Less than 2.0x | 175 (52.2%) | 92,857 (30,148.4%) |
| 2.0x to 2.9x | 37 (11.0%) | 205 (66.6%) |
| 3.0x to 3.9x | 35 (10.4%) | 43 (14.0%) |
| 4.0x or more | 88 (26.3%) | 18 (5.8%) |
| Total | 335 (100.0%) | 308 (100.0%) |
Real Estate Taxes by Mortgage Status in Carrington
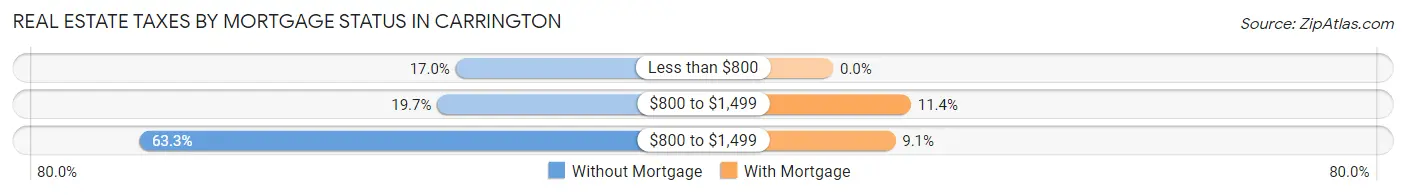
| Property Taxes | Without Mortgage | With Mortgage |
| Less than $800 | 57 (17.0%) | 0 (0.0%) |
| $800 to $1,499 | 66 (19.7%) | 35 (11.4%) |
| $800 to $1,499 | 212 (63.3%) | 28 (9.1%) |
| Total | 335 (100.0%) | 308 (100.0%) |
Health & Disability in Carrington
Health Insurance Coverage by Age in Carrington
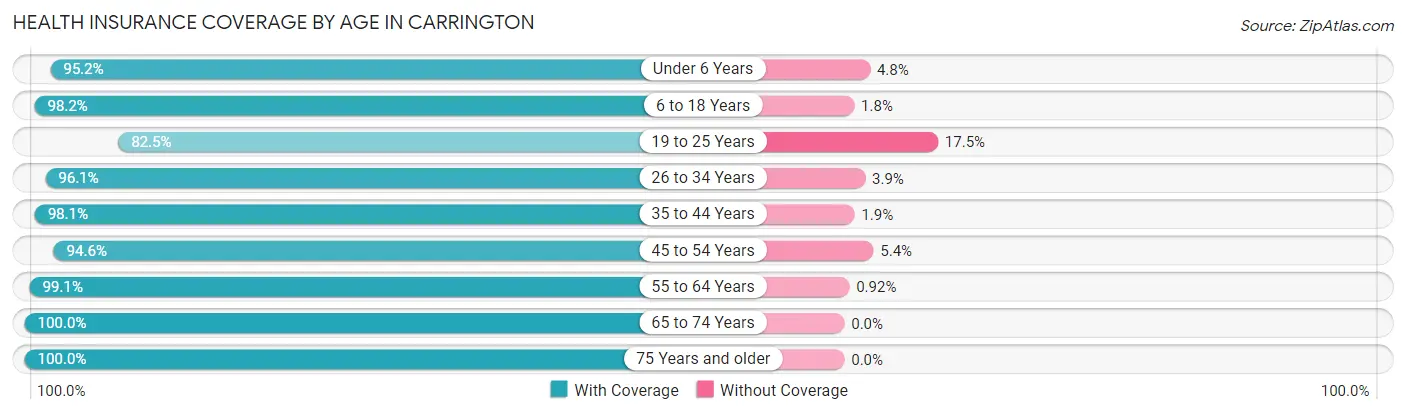
| Age Bracket | With Coverage | Without Coverage |
| Under 6 Years | 139 (95.2%) | 7 (4.8%) |
| 6 to 18 Years | 374 (98.2%) | 7 (1.8%) |
| 19 to 25 Years | 104 (82.5%) | 22 (17.5%) |
| 26 to 34 Years | 198 (96.1%) | 8 (3.9%) |
| 35 to 44 Years | 258 (98.1%) | 5 (1.9%) |
| 45 to 54 Years | 227 (94.6%) | 13 (5.4%) |
| 55 to 64 Years | 324 (99.1%) | 3 (0.9%) |
| 65 to 74 Years | 172 (100.0%) | 0 (0.0%) |
| 75 Years and older | 192 (100.0%) | 0 (0.0%) |
| Total | 1,988 (96.8%) | 65 (3.2%) |
Health Insurance Coverage by Citizenship Status in Carrington
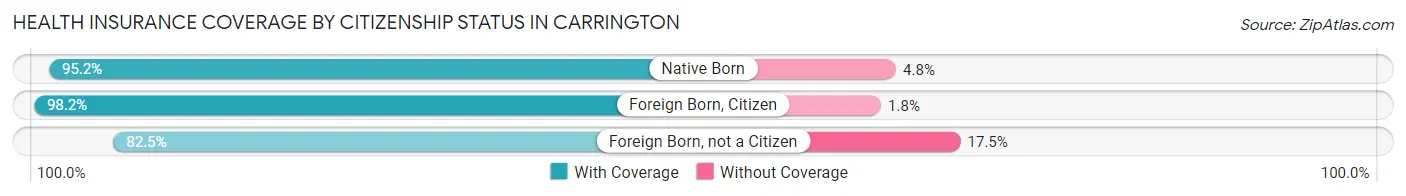
| Citizenship Status | With Coverage | Without Coverage |
| Native Born | 139 (95.2%) | 7 (4.8%) |
| Foreign Born, Citizen | 374 (98.2%) | 7 (1.8%) |
| Foreign Born, not a Citizen | 104 (82.5%) | 22 (17.5%) |
Health Insurance Coverage by Household Income in Carrington
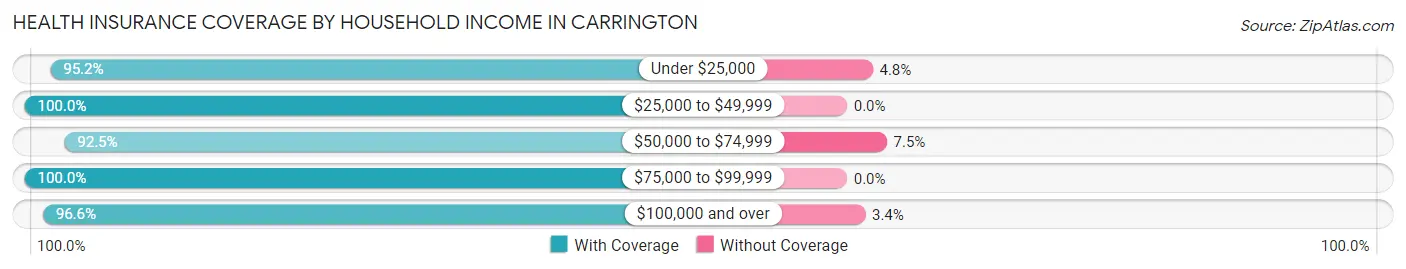
| Household Income | With Coverage | Without Coverage |
| Under $25,000 | 217 (95.2%) | 11 (4.8%) |
| $25,000 to $49,999 | 371 (100.0%) | 0 (0.0%) |
| $50,000 to $74,999 | 273 (92.5%) | 22 (7.5%) |
| $75,000 to $99,999 | 214 (100.0%) | 0 (0.0%) |
| $100,000 and over | 904 (96.6%) | 32 (3.4%) |
Public vs Private Health Insurance Coverage by Age in Carrington
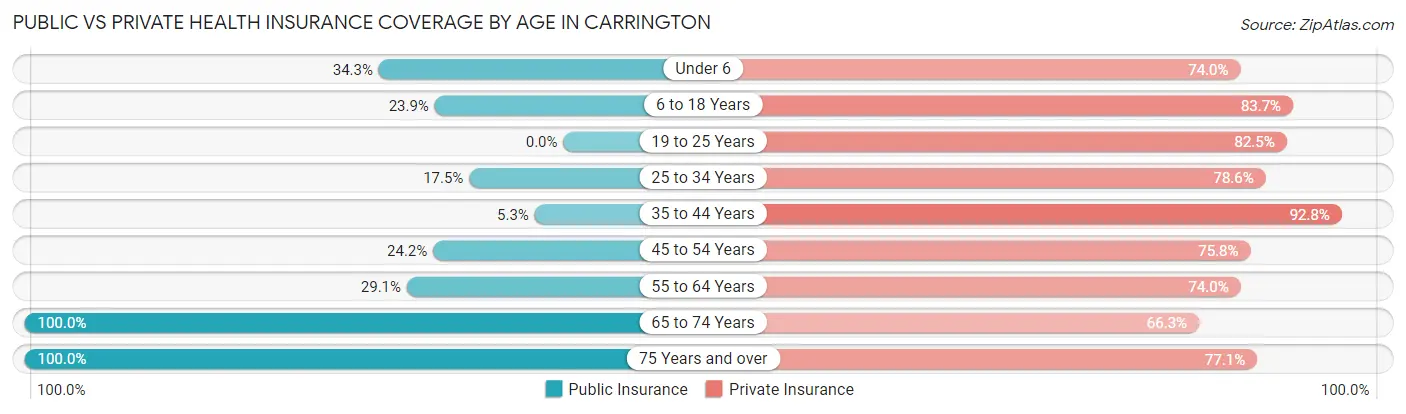
| Age Bracket | Public Insurance | Private Insurance |
| Under 6 | 50 (34.3%) | 108 (74.0%) |
| 6 to 18 Years | 91 (23.9%) | 319 (83.7%) |
| 19 to 25 Years | 0 (0.0%) | 104 (82.5%) |
| 25 to 34 Years | 36 (17.5%) | 162 (78.6%) |
| 35 to 44 Years | 14 (5.3%) | 244 (92.8%) |
| 45 to 54 Years | 58 (24.2%) | 182 (75.8%) |
| 55 to 64 Years | 95 (29.0%) | 242 (74.0%) |
| 65 to 74 Years | 172 (100.0%) | 114 (66.3%) |
| 75 Years and over | 192 (100.0%) | 148 (77.1%) |
| Total | 708 (34.5%) | 1,623 (79.1%) |
Disability Status by Sex by Age in Carrington
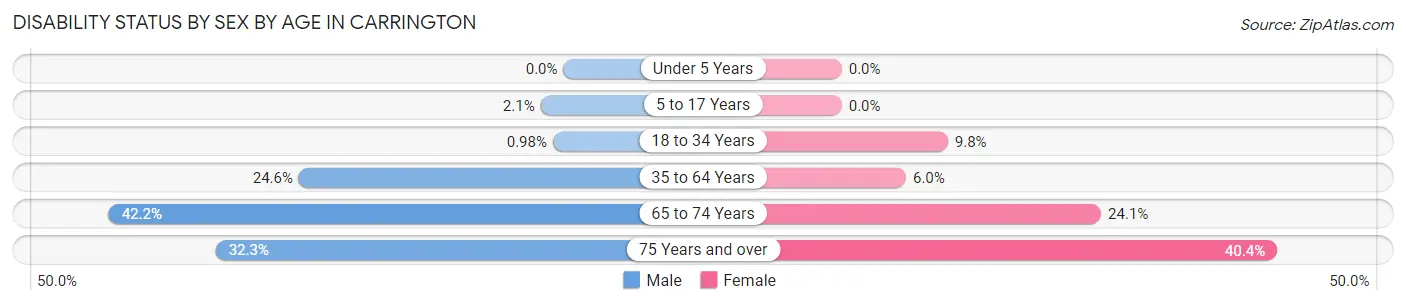
| Age Bracket | Male | Female |
| Under 5 Years | 0 (0.0%) | 0 (0.0%) |
| 5 to 17 Years | 4 (2.1%) | 0 (0.0%) |
| 18 to 34 Years | 2 (1.0%) | 18 (9.8%) |
| 35 to 64 Years | 109 (24.5%) | 23 (6.0%) |
| 65 to 74 Years | 27 (42.2%) | 26 (24.1%) |
| 75 Years and over | 30 (32.3%) | 40 (40.4%) |
Disability Class by Sex by Age in Carrington
Disability Class: Hearing Difficulty
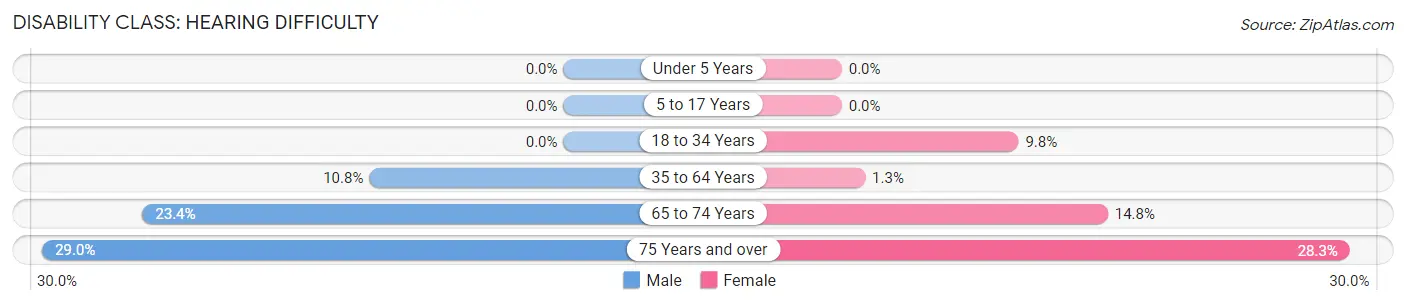
| Age Bracket | Male | Female |
| Under 5 Years | 0 (0.0%) | 0 (0.0%) |
| 5 to 17 Years | 0 (0.0%) | 0 (0.0%) |
| 18 to 34 Years | 0 (0.0%) | 18 (9.8%) |
| 35 to 64 Years | 48 (10.8%) | 5 (1.3%) |
| 65 to 74 Years | 15 (23.4%) | 16 (14.8%) |
| 75 Years and over | 27 (29.0%) | 28 (28.3%) |
Disability Class: Vision Difficulty
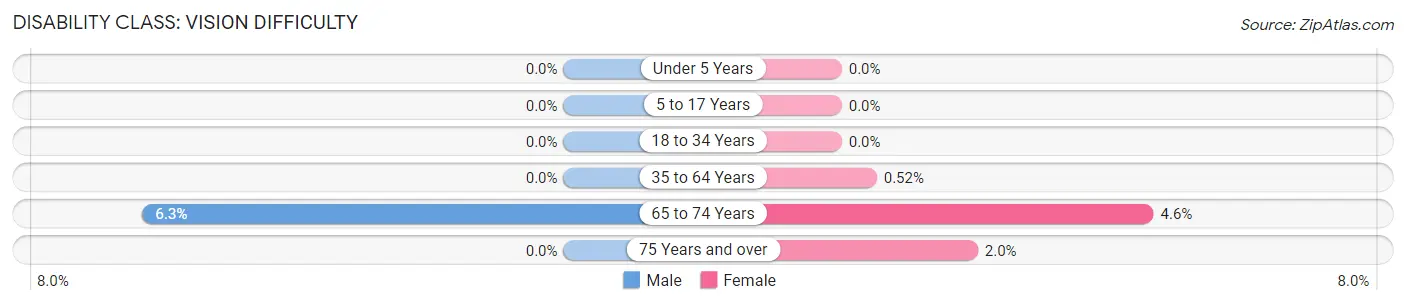
| Age Bracket | Male | Female |
| Under 5 Years | 0 (0.0%) | 0 (0.0%) |
| 5 to 17 Years | 0 (0.0%) | 0 (0.0%) |
| 18 to 34 Years | 0 (0.0%) | 0 (0.0%) |
| 35 to 64 Years | 0 (0.0%) | 2 (0.5%) |
| 65 to 74 Years | 4 (6.2%) | 5 (4.6%) |
| 75 Years and over | 0 (0.0%) | 2 (2.0%) |
Disability Class: Cognitive Difficulty
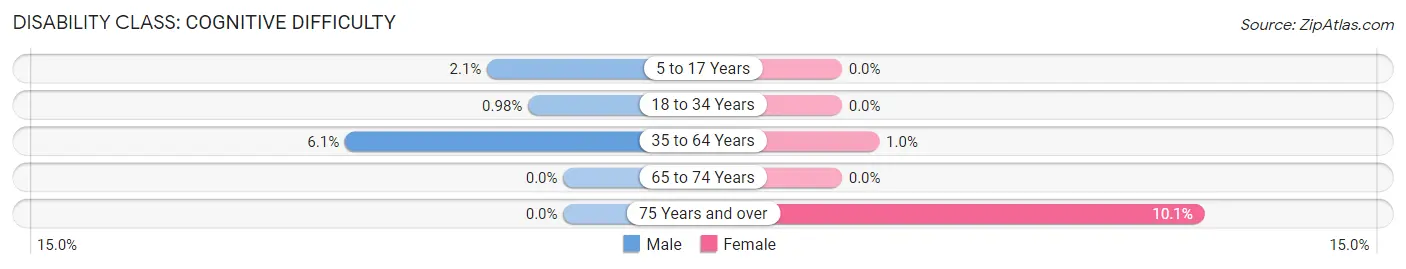
| Age Bracket | Male | Female |
| 5 to 17 Years | 4 (2.1%) | 0 (0.0%) |
| 18 to 34 Years | 2 (1.0%) | 0 (0.0%) |
| 35 to 64 Years | 27 (6.1%) | 4 (1.0%) |
| 65 to 74 Years | 0 (0.0%) | 0 (0.0%) |
| 75 Years and over | 0 (0.0%) | 10 (10.1%) |
Disability Class: Ambulatory Difficulty
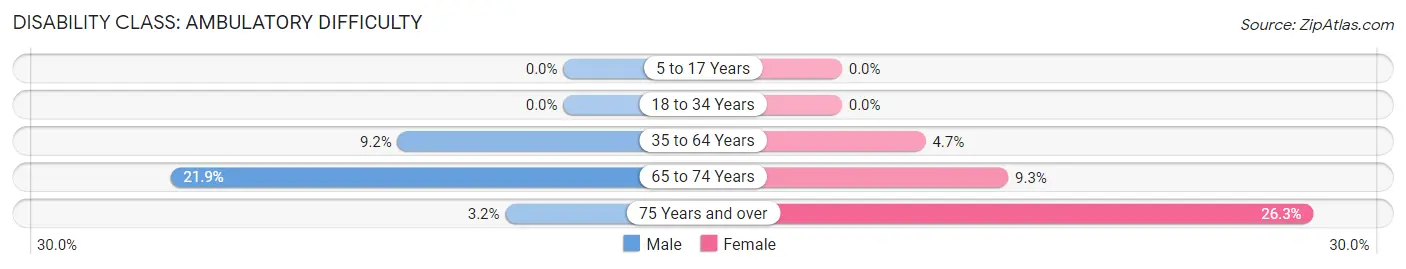
| Age Bracket | Male | Female |
| 5 to 17 Years | 0 (0.0%) | 0 (0.0%) |
| 18 to 34 Years | 0 (0.0%) | 0 (0.0%) |
| 35 to 64 Years | 41 (9.2%) | 18 (4.7%) |
| 65 to 74 Years | 14 (21.9%) | 10 (9.3%) |
| 75 Years and over | 3 (3.2%) | 26 (26.3%) |
Disability Class: Self-Care Difficulty
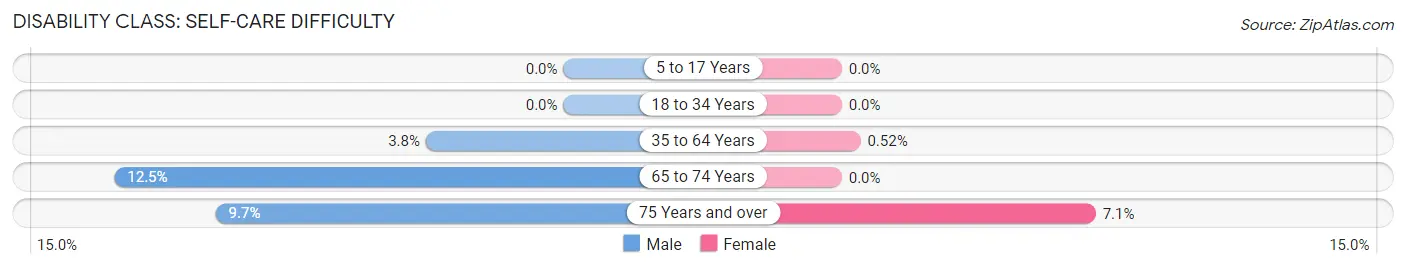
| Age Bracket | Male | Female |
| 5 to 17 Years | 0 (0.0%) | 0 (0.0%) |
| 18 to 34 Years | 0 (0.0%) | 0 (0.0%) |
| 35 to 64 Years | 17 (3.8%) | 2 (0.5%) |
| 65 to 74 Years | 8 (12.5%) | 0 (0.0%) |
| 75 Years and over | 9 (9.7%) | 7 (7.1%) |
Technology Access in Carrington
Computing Device Access in Carrington
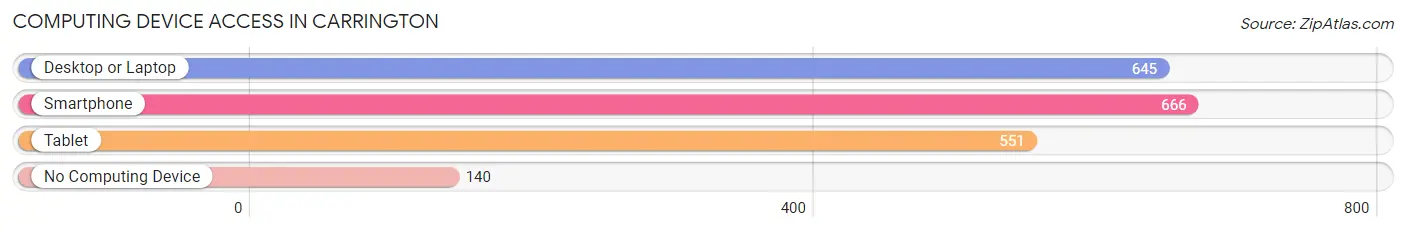
| Device Type | # Households | % Households |
| Desktop or Laptop | 645 | 70.1% |
| Smartphone | 666 | 72.4% |
| Tablet | 551 | 59.9% |
| No Computing Device | 140 | 15.2% |
| Total | 920 | 100.0% |
Internet Access in Carrington
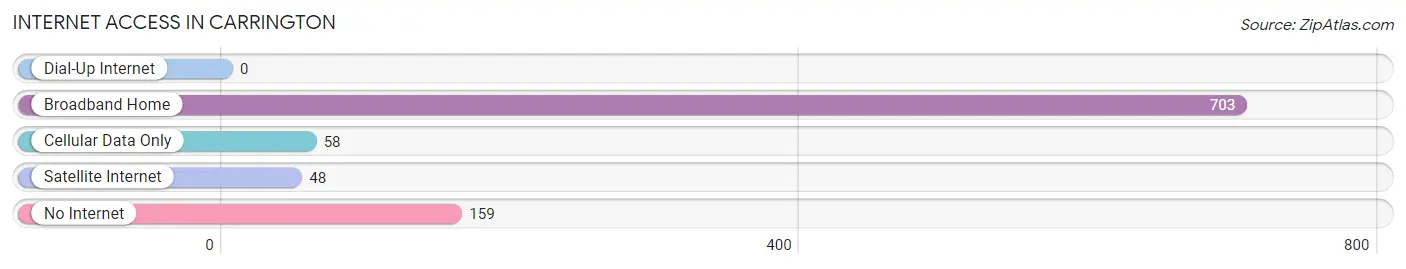
| Internet Type | # Households | % Households |
| Dial-Up Internet | 0 | 0.0% |
| Broadband Home | 703 | 76.4% |
| Cellular Data Only | 58 | 6.3% |
| Satellite Internet | 48 | 5.2% |
| No Internet | 159 | 17.3% |
| Total | 920 | 100.0% |
Carrington Summary
Carrington, North Dakota is a small city located in Foster County, in the northeastern part of the state. It is the county seat of Foster County and is home to a population of 2,478 people, according to the 2010 census. Carrington is located in the heart of the North Dakota prairie, and is surrounded by rolling hills and farmland.
History
Carrington was founded in 1883 by the Northern Pacific Railroad. The city was named after the railroad's president, Charles Carrington. The city was incorporated in 1884 and quickly became a hub for the surrounding agricultural communities. The city was also home to a number of businesses, including a flour mill, a creamery, a lumberyard, and a hotel.
In the early 1900s, Carrington experienced a period of growth and prosperity. The city was home to a number of churches, schools, and businesses. The city also had a number of cultural and recreational activities, including a movie theater, a bowling alley, and a golf course.
Geography
Carrington is located in the northeastern part of North Dakota, in Foster County. The city is situated on the banks of the Sheyenne River, and is surrounded by rolling hills and farmland. The city is located approximately 50 miles from the Minnesota border, and is about 100 miles from the Canadian border.
The climate in Carrington is typical of the northern Great Plains. Summers are warm and humid, with temperatures reaching into the 90s. Winters are cold and dry, with temperatures often dropping below zero.
Economy
The economy of Carrington is largely based on agriculture. The city is home to a number of farms and ranches, and the surrounding area is known for its production of wheat, barley, oats, and other grains. The city is also home to a number of businesses, including a lumberyard, a hotel, and a number of restaurants and retail stores.
Demographics
According to the 2010 census, Carrington has a population of 2,478 people. The population is predominantly white, with a small percentage of African Americans, Native Americans, and other races. The median household income in Carrington is $41,944, and the median age is 37.
Conclusion
Carrington, North Dakota is a small city located in Foster County, in the northeastern part of the state. It is the county seat of Foster County and is home to a population of 2,478 people, according to the 2010 census. Carrington is located in the heart of the North Dakota prairie, and is surrounded by rolling hills and farmland. The economy of Carrington is largely based on agriculture, and the city is home to a number of businesses, churches, schools, and recreational activities. The population of Carrington is predominantly white, with a small percentage of African Americans, Native Americans, and other races.
Common Questions
What is Per Capita Income in Carrington?
Per Capita income in Carrington is $36,141.
What is the Median Family Income in Carrington?
Median Family Income in Carrington is $91,042.
What is the Median Household income in Carrington?
Median Household Income in Carrington is $62,240.
What is Income or Wage Gap in Carrington?
Income or Wage Gap in Carrington is 39.0%.
Women in Carrington earn 61.0 cents for every dollar earned by a man.
What is Family Income Deficit in Carrington?
Family Income Deficit in Carrington is $9,635.
Families that are below poverty line in Carrington earn $9,635 less on average than the poverty threshold level.
What is Inequality or Gini Index in Carrington?
Inequality or Gini Index in Carrington is 0.42.
What is the Total Population of Carrington?
Total Population of Carrington is 2,161.
What is the Total Male Population of Carrington?
Total Male Population of Carrington is 1,061.
What is the Total Female Population of Carrington?
Total Female Population of Carrington is 1,100.
What is the Ratio of Males per 100 Females in Carrington?
There are 96.45 Males per 100 Females in Carrington.
What is the Ratio of Females per 100 Males in Carrington?
There are 103.68 Females per 100 Males in Carrington.
What is the Median Population Age in Carrington?
Median Population Age in Carrington is 44.0 Years.
What is the Average Family Size in Carrington
Average Family Size in Carrington is 3.0 People.
What is the Average Household Size in Carrington
Average Household Size in Carrington is 2.2 People.
How Large is the Labor Force in Carrington?
There are 1,152 People in the Labor Forcein in Carrington.
What is the Percentage of People in the Labor Force in Carrington?
66.5% of People are in the Labor Force in Carrington.