Grafton, ND Map & Demographics
Grafton Map
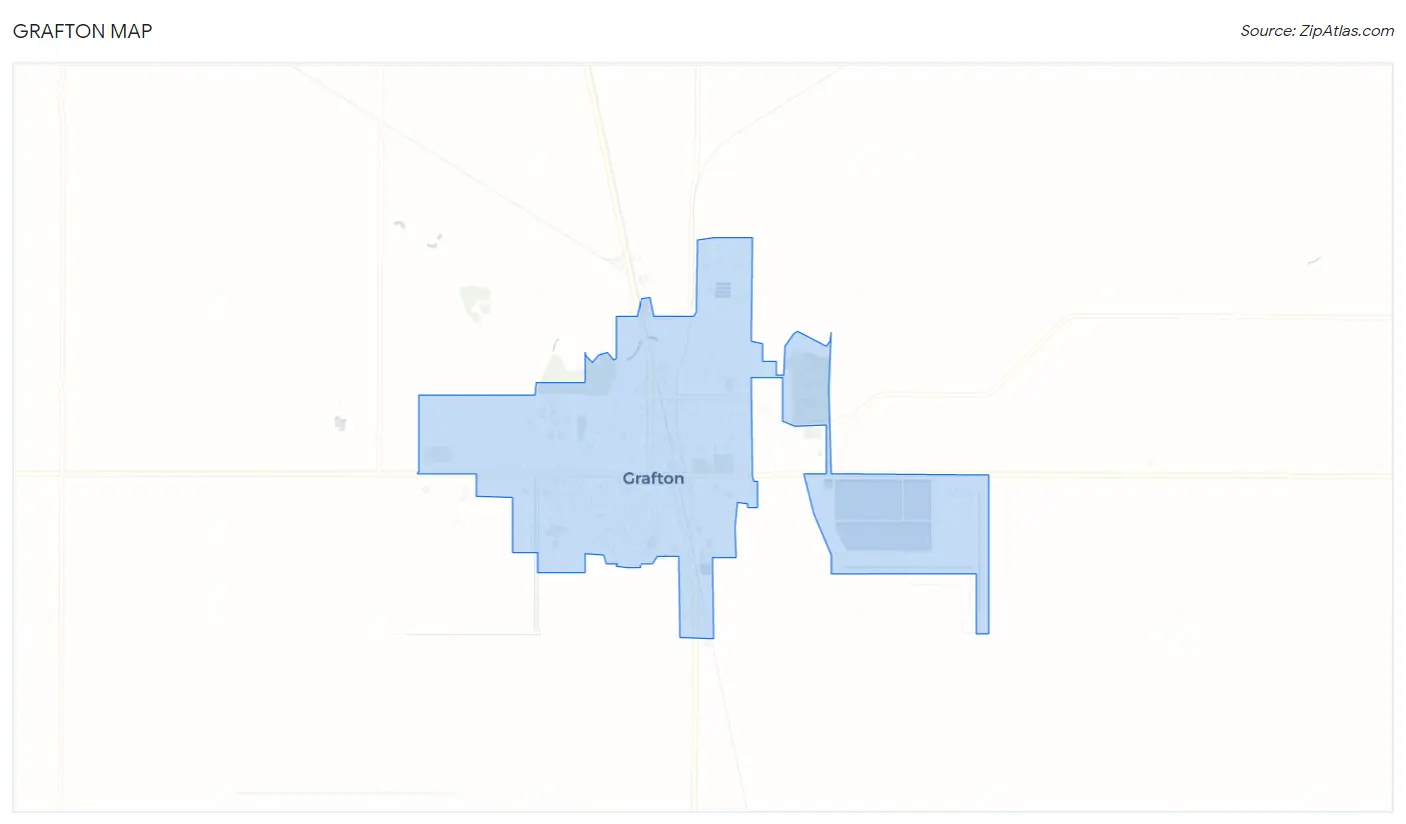
Grafton Overview
$37,187
PER CAPITA INCOME
$72,361
AVG FAMILY INCOME
$59,696
AVG HOUSEHOLD INCOME
24.4%
WAGE / INCOME GAP [ % ]
75.6¢/ $1
WAGE / INCOME GAP [ $ ]
0.48
INEQUALITY / GINI INDEX
4,161
TOTAL POPULATION
2,069
MALE POPULATION
2,092
FEMALE POPULATION
98.90
MALES / 100 FEMALES
101.11
FEMALES / 100 MALES
40.4
MEDIAN AGE
3.0
AVG FAMILY SIZE
2.2
AVG HOUSEHOLD SIZE
2,205
LABOR FORCE [ PEOPLE ]
67.4%
PERCENT IN LABOR FORCE
3.3%
UNEMPLOYMENT RATE
Grafton Zip Codes
Grafton Area Codes
Income in Grafton
Income Overview in Grafton
Per Capita Income in Grafton is $37,187, while median incomes of families and households are $72,361 and $59,696 respectively.
| Characteristic | Number | Measure |
| Per Capita Income | 4,161 | $37,187 |
| Median Family Income | 937 | $72,361 |
| Mean Family Income | 937 | $87,848 |
| Median Household Income | 1,751 | $59,696 |
| Mean Household Income | 1,751 | $84,896 |
| Income Deficit | 937 | $0 |
| Wage / Income Gap (%) | 4,161 | 24.42% |
| Wage / Income Gap ($) | 4,161 | 75.58¢ per $1 |
| Gini / Inequality Index | 4,161 | 0.48 |
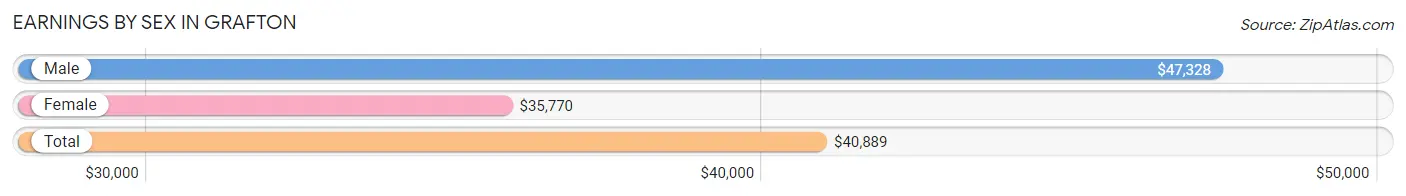
Earnings by Sex in Grafton
Average Earnings in Grafton are $40,889, $47,328 for men and $35,770 for women, a difference of 24.4%.
| Sex | Number | Average Earnings |
| Male | 1,207 (52.3%) | $47,328 |
| Female | 1,101 (47.7%) | $35,770 |
| Total | 2,308 (100.0%) | $40,889 |
Earnings by Sex by Income Bracket in Grafton
The most common earnings brackets in Grafton are $100,000+ for men (172 | 14.2%) and $35,000 to $39,999 for women (133 | 12.1%).
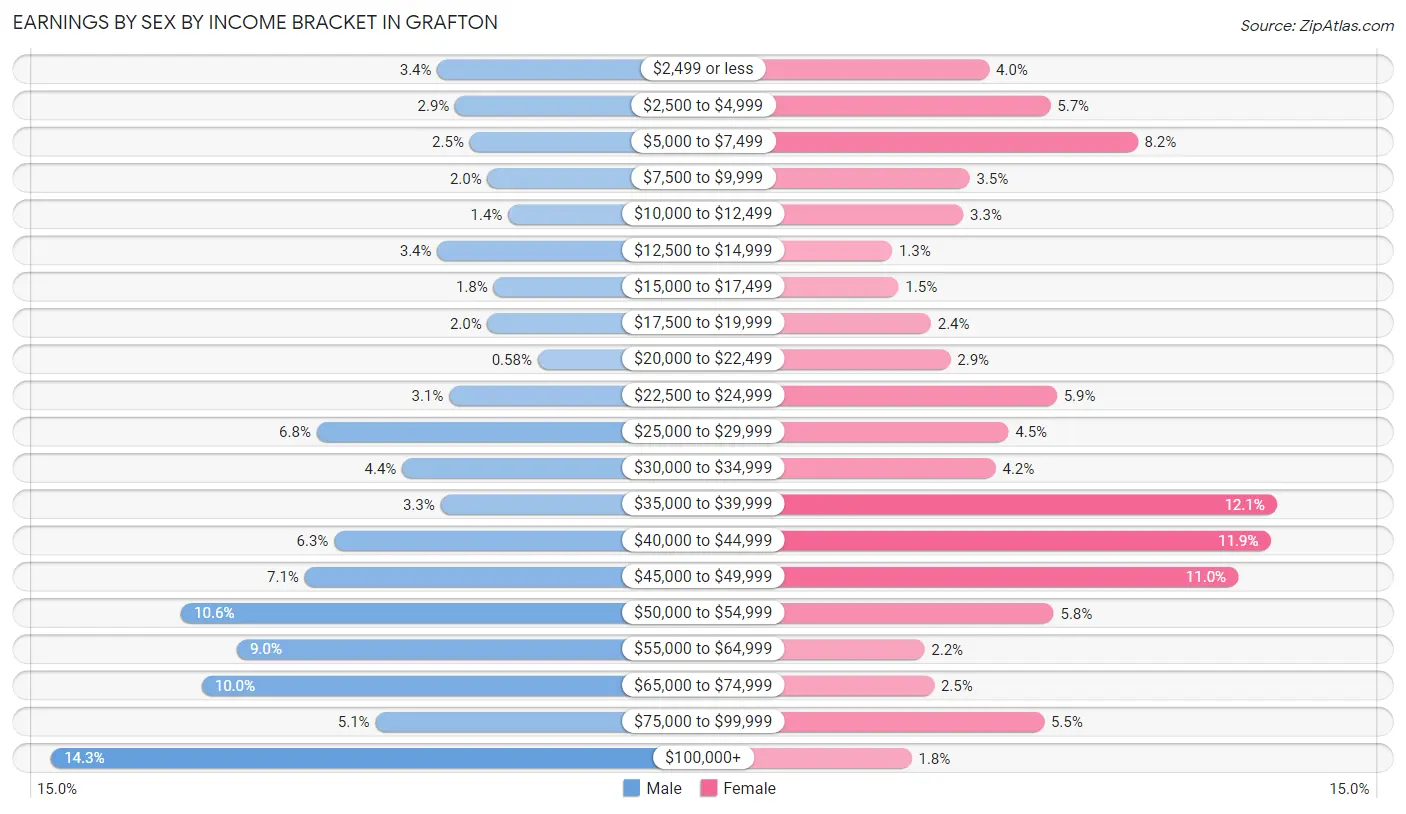
| Income | Male | Female |
| $2,499 or less | 41 (3.4%) | 44 (4.0%) |
| $2,500 to $4,999 | 35 (2.9%) | 63 (5.7%) |
| $5,000 to $7,499 | 30 (2.5%) | 90 (8.2%) |
| $7,500 to $9,999 | 24 (2.0%) | 38 (3.5%) |
| $10,000 to $12,499 | 17 (1.4%) | 36 (3.3%) |
| $12,500 to $14,999 | 41 (3.4%) | 14 (1.3%) |
| $15,000 to $17,499 | 22 (1.8%) | 16 (1.5%) |
| $17,500 to $19,999 | 24 (2.0%) | 26 (2.4%) |
| $20,000 to $22,499 | 7 (0.6%) | 32 (2.9%) |
| $22,500 to $24,999 | 37 (3.1%) | 65 (5.9%) |
| $25,000 to $29,999 | 82 (6.8%) | 50 (4.5%) |
| $30,000 to $34,999 | 53 (4.4%) | 46 (4.2%) |
| $35,000 to $39,999 | 40 (3.3%) | 133 (12.1%) |
| $40,000 to $44,999 | 76 (6.3%) | 131 (11.9%) |
| $45,000 to $49,999 | 86 (7.1%) | 121 (11.0%) |
| $50,000 to $54,999 | 128 (10.6%) | 64 (5.8%) |
| $55,000 to $64,999 | 109 (9.0%) | 24 (2.2%) |
| $65,000 to $74,999 | 121 (10.0%) | 27 (2.5%) |
| $75,000 to $99,999 | 62 (5.1%) | 61 (5.5%) |
| $100,000+ | 172 (14.2%) | 20 (1.8%) |
| Total | 1,207 (100.0%) | 1,101 (100.0%) |
Earnings by Sex by Educational Attainment in Grafton
Average earnings in Grafton are $51,320 for men and $37,941 for women, a difference of 26.1%. Men with an educational attainment of graduate degree enjoy the highest average annual earnings of $74,559, while those with college or associate's degree education earn the least with $44,702. Women with an educational attainment of less than high school earn the most with the average annual earnings of $43,583, while those with bachelor's degree education have the smallest earnings of $35,667.
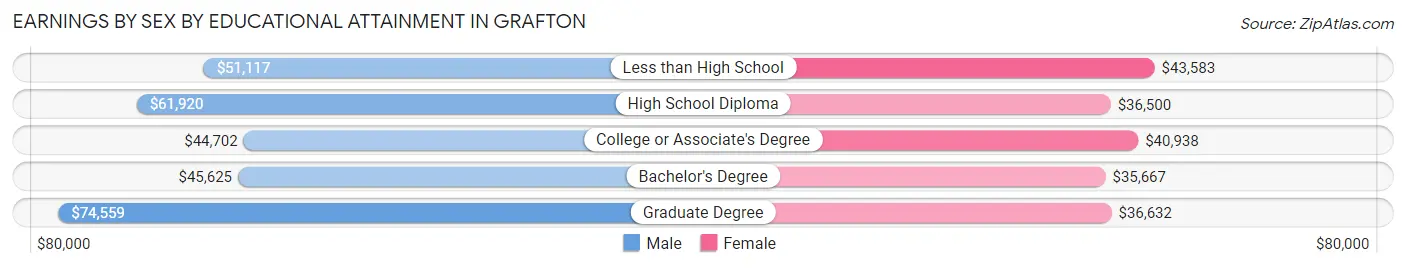
| Educational Attainment | Male Income | Female Income |
| Less than High School | $51,117 | $43,583 |
| High School Diploma | $61,920 | $36,500 |
| College or Associate's Degree | $44,702 | $40,938 |
| Bachelor's Degree | $45,625 | $35,667 |
| Graduate Degree | $74,559 | $36,632 |
| Total | $51,320 | $37,941 |
Family Income in Grafton
Family Income Brackets in Grafton
According to the Grafton family income data, there are 238 families falling into the $100,000 to $149,999 income range, which is the most common income bracket and makes up 25.4% of all families.
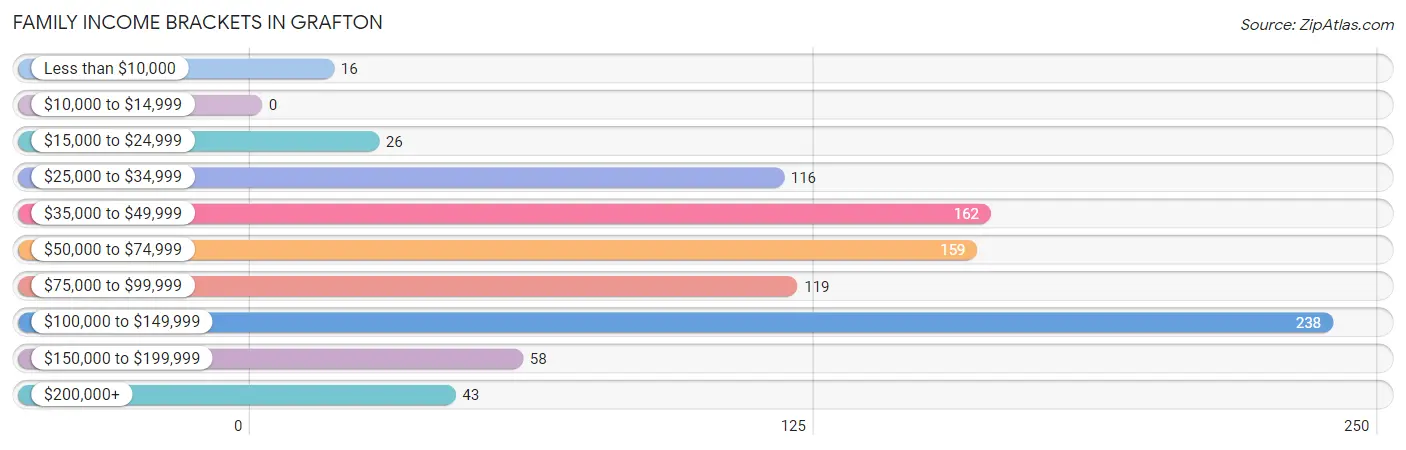
| Income Bracket | # Families | % Families |
| Less than $10,000 | 16 | 1.7% |
| $10,000 to $14,999 | 0 | 0.0% |
| $15,000 to $24,999 | 26 | 2.8% |
| $25,000 to $34,999 | 116 | 12.4% |
| $35,000 to $49,999 | 162 | 17.3% |
| $50,000 to $74,999 | 159 | 17.0% |
| $75,000 to $99,999 | 119 | 12.7% |
| $100,000 to $149,999 | 238 | 25.4% |
| $150,000 to $199,999 | 58 | 6.2% |
| $200,000+ | 43 | 4.6% |
Family Income by Famaliy Size in Grafton
5-person families (94 | 10.0%) account for the highest median family income in Grafton with $128,289 per family, while 2-person families (564 | 60.2%) have the highest median income of $29,486 per family member.
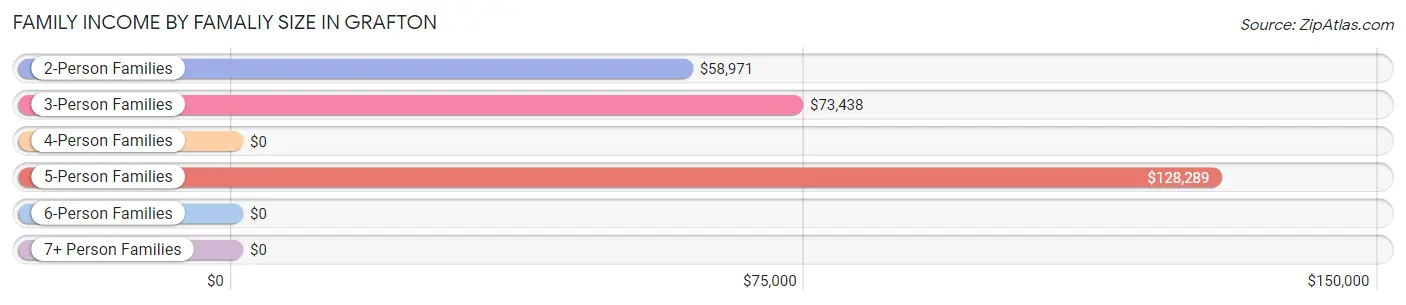
| Income Bracket | # Families | Median Income |
| 2-Person Families | 564 (60.2%) | $58,971 |
| 3-Person Families | 128 (13.7%) | $73,438 |
| 4-Person Families | 117 (12.5%) | $0 |
| 5-Person Families | 94 (10.0%) | $128,289 |
| 6-Person Families | 0 (0.0%) | $0 |
| 7+ Person Families | 34 (3.6%) | $0 |
| Total | 937 (100.0%) | $72,361 |
Family Income by Number of Earners in Grafton
The median family income in Grafton is $72,361, with families comprising 3+ earners (108) having the highest median family income of $118,375, while families with no earners (123) have the lowest median family income of $28,750, accounting for 11.5% and 13.1% of families, respectively.
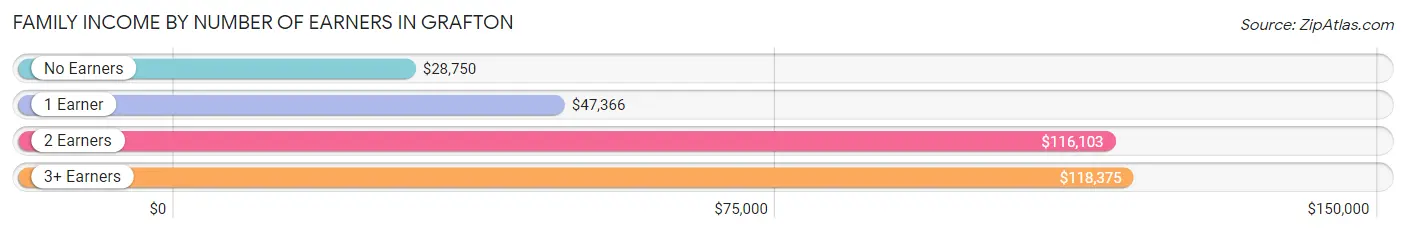
| Number of Earners | # Families | Median Income |
| No Earners | 123 (13.1%) | $28,750 |
| 1 Earner | 337 (36.0%) | $47,366 |
| 2 Earners | 369 (39.4%) | $116,103 |
| 3+ Earners | 108 (11.5%) | $118,375 |
| Total | 937 (100.0%) | $72,361 |
Household Income in Grafton
Household Income Brackets in Grafton
With 319 households falling in the category, the $35,000 to $49,999 income range is the most frequent in Grafton, accounting for 18.2% of all households. In contrast, only 51 households (2.9%) fall into the $15,000 to $24,999 income bracket, making it the least populous group.
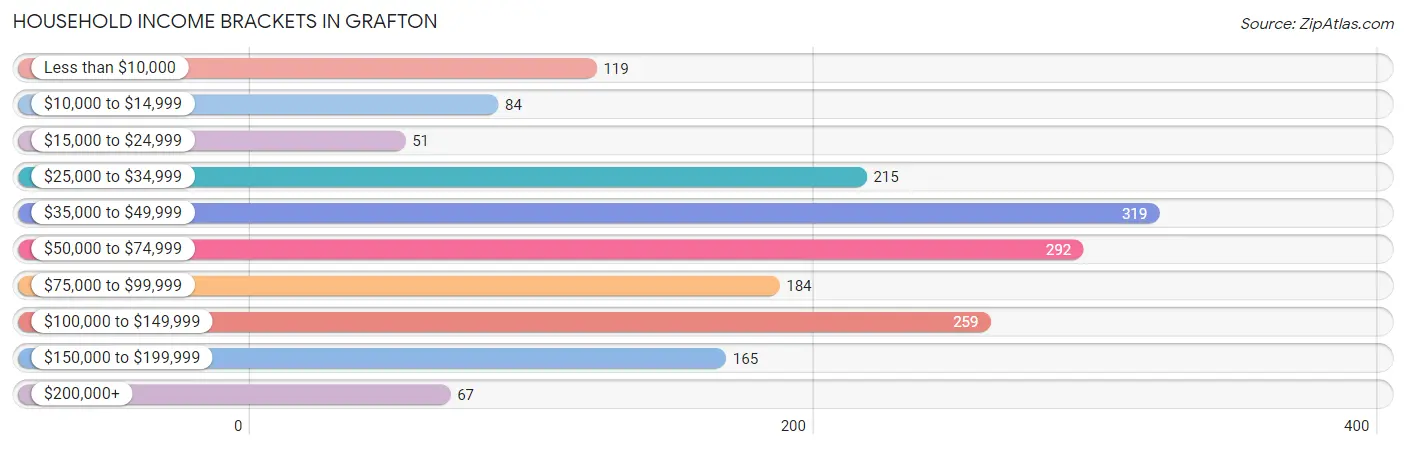
| Income Bracket | # Households | % Households |
| Less than $10,000 | 119 | 6.8% |
| $10,000 to $14,999 | 84 | 4.8% |
| $15,000 to $24,999 | 51 | 2.9% |
| $25,000 to $34,999 | 215 | 12.3% |
| $35,000 to $49,999 | 319 | 18.2% |
| $50,000 to $74,999 | 292 | 16.7% |
| $75,000 to $99,999 | 184 | 10.5% |
| $100,000 to $149,999 | 259 | 14.8% |
| $150,000 to $199,999 | 165 | 9.4% |
| $200,000+ | 67 | 3.8% |
Household Income by Householder Age in Grafton
The median household income in Grafton is $59,696, with the highest median household income of $107,563 found in the 25 to 44 years age bracket for the primary householder. A total of 503 households (28.7%) fall into this category. Meanwhile, the 65+ years age bracket for the primary householder has the lowest median household income of $40,226, with 537 households (30.7%) in this group.
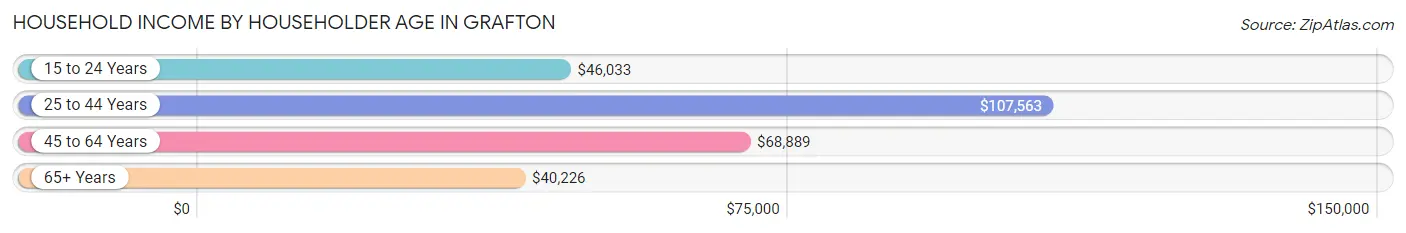
| Income Bracket | # Households | Median Income |
| 15 to 24 Years | 101 (5.8%) | $46,033 |
| 25 to 44 Years | 503 (28.7%) | $107,563 |
| 45 to 64 Years | 610 (34.8%) | $68,889 |
| 65+ Years | 537 (30.7%) | $40,226 |
| Total | 1,751 (100.0%) | $59,696 |
Poverty in Grafton
Income Below Poverty by Sex and Age in Grafton
With 7.8% poverty level for males and 11.3% for females among the residents of Grafton, 16 and 17 year old males and 18 to 24 year old females are the most vulnerable to poverty, with 40 males (59.7%) and 36 females (21.6%) in their respective age groups living below the poverty level.
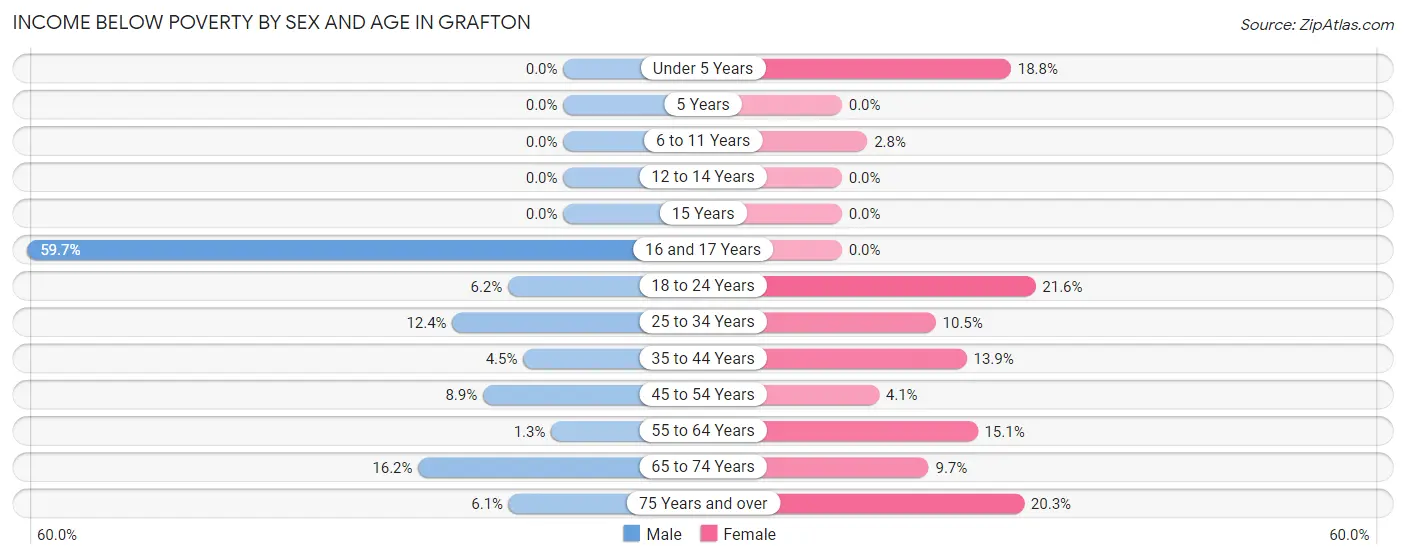
| Age Bracket | Male | Female |
| Under 5 Years | 0 (0.0%) | 16 (18.8%) |
| 5 Years | 0 (0.0%) | 0 (0.0%) |
| 6 to 11 Years | 0 (0.0%) | 6 (2.8%) |
| 12 to 14 Years | 0 (0.0%) | 0 (0.0%) |
| 15 Years | 0 (0.0%) | 0 (0.0%) |
| 16 and 17 Years | 40 (59.7%) | 0 (0.0%) |
| 18 to 24 Years | 12 (6.1%) | 36 (21.6%) |
| 25 to 34 Years | 30 (12.3%) | 23 (10.4%) |
| 35 to 44 Years | 9 (4.5%) | 30 (13.9%) |
| 45 to 54 Years | 22 (8.9%) | 10 (4.1%) |
| 55 to 64 Years | 4 (1.3%) | 42 (15.1%) |
| 65 to 74 Years | 31 (16.2%) | 20 (9.7%) |
| 75 Years and over | 8 (6.1%) | 43 (20.3%) |
| Total | 156 (7.8%) | 226 (11.3%) |
Income Above Poverty by Sex and Age in Grafton
According to the poverty statistics in Grafton, males aged under 5 years and females aged 12 to 14 years are the age groups that are most secure financially, with 100.0% of males and 100.0% of females in these age groups living above the poverty line.
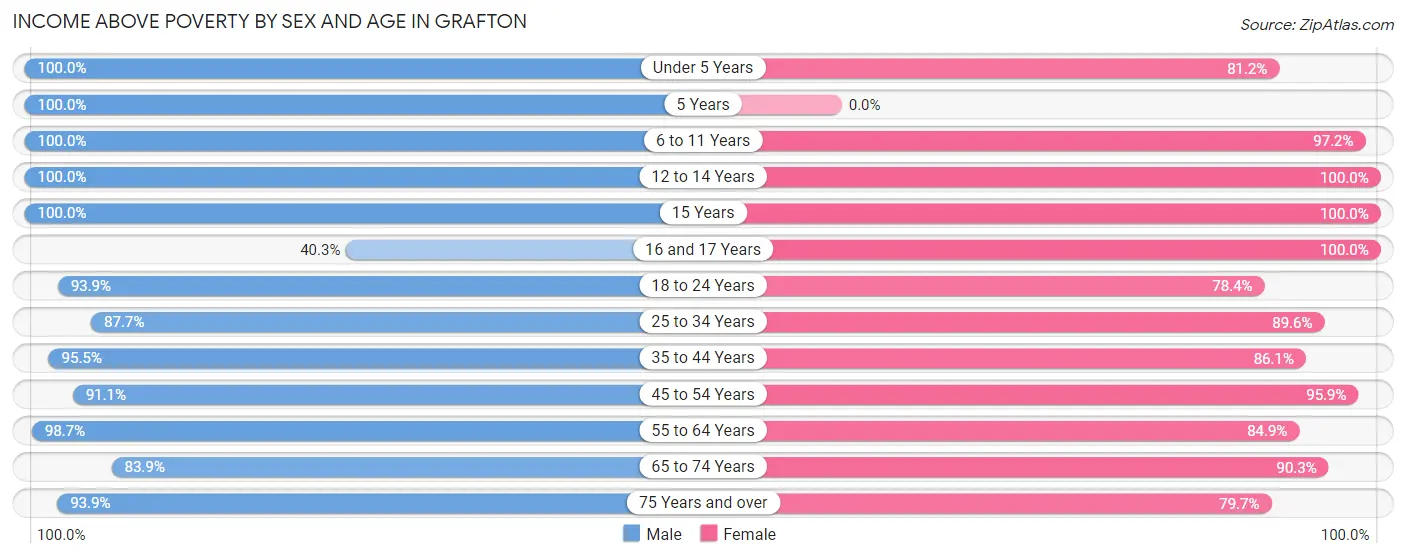
| Age Bracket | Male | Female |
| Under 5 Years | 95 (100.0%) | 69 (81.2%) |
| 5 Years | 14 (100.0%) | 0 (0.0%) |
| 6 to 11 Years | 278 (100.0%) | 206 (97.2%) |
| 12 to 14 Years | 33 (100.0%) | 108 (100.0%) |
| 15 Years | 15 (100.0%) | 37 (100.0%) |
| 16 and 17 Years | 27 (40.3%) | 16 (100.0%) |
| 18 to 24 Years | 183 (93.9%) | 131 (78.4%) |
| 25 to 34 Years | 213 (87.6%) | 197 (89.5%) |
| 35 to 44 Years | 193 (95.5%) | 186 (86.1%) |
| 45 to 54 Years | 224 (91.1%) | 232 (95.9%) |
| 55 to 64 Years | 294 (98.7%) | 236 (84.9%) |
| 65 to 74 Years | 161 (83.9%) | 187 (90.3%) |
| 75 Years and over | 124 (93.9%) | 169 (79.7%) |
| Total | 1,854 (92.2%) | 1,774 (88.7%) |
Income Below Poverty Among Married-Couple Families in Grafton
The poverty statistics for married-couple families in Grafton show that 0.9% or 7 of the total 757 families live below the poverty line. Families with no children have the highest poverty rate of 1.3%, comprising of 7 families. On the other hand, families with 1 or 2 children have the lowest poverty rate of 0.0%, which includes 0 families.
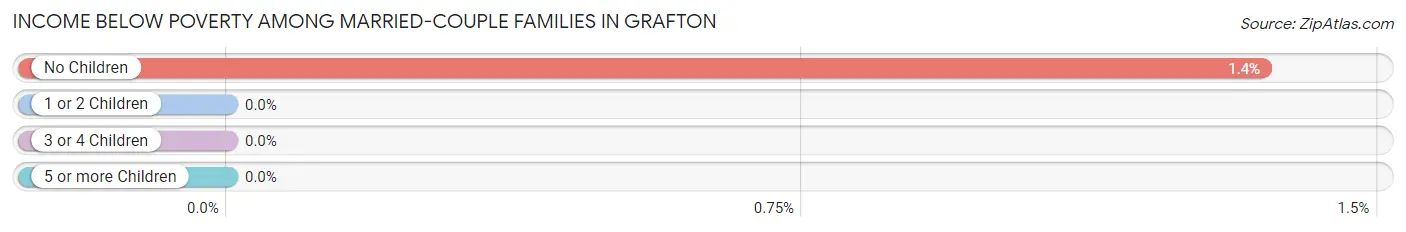
| Children | Above Poverty | Below Poverty |
| No Children | 511 (98.7%) | 7 (1.3%) |
| 1 or 2 Children | 152 (100.0%) | 0 (0.0%) |
| 3 or 4 Children | 73 (100.0%) | 0 (0.0%) |
| 5 or more Children | 14 (100.0%) | 0 (0.0%) |
| Total | 750 (99.1%) | 7 (0.9%) |
Income Below Poverty Among Single-Parent Households in Grafton
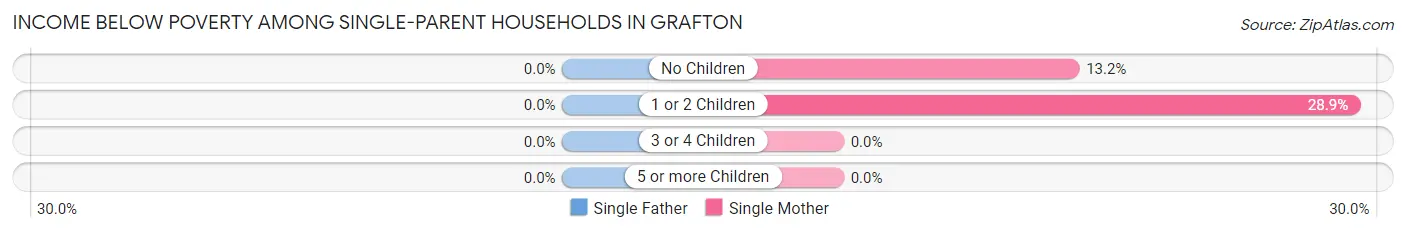
| Children | Single Father | Single Mother |
| No Children | 0 (0.0%) | 5 (13.2%) |
| 1 or 2 Children | 0 (0.0%) | 15 (28.8%) |
| 3 or 4 Children | 0 (0.0%) | 0 (0.0%) |
| 5 or more Children | 0 (0.0%) | 0 (0.0%) |
| Total | 0 (0.0%) | 20 (13.6%) |
Income Below Poverty Among Married-Couple vs Single-Parent Households in Grafton
The poverty data for Grafton shows that 7 of the married-couple family households (0.9%) and 20 of the single-parent households (11.1%) are living below the poverty level. Within the married-couple family households, those with no children have the highest poverty rate, with 7 households (1.3%) falling below the poverty line. Among the single-parent households, those with 1 or 2 children have the highest poverty rate, with 15 household (17.6%) living below poverty.
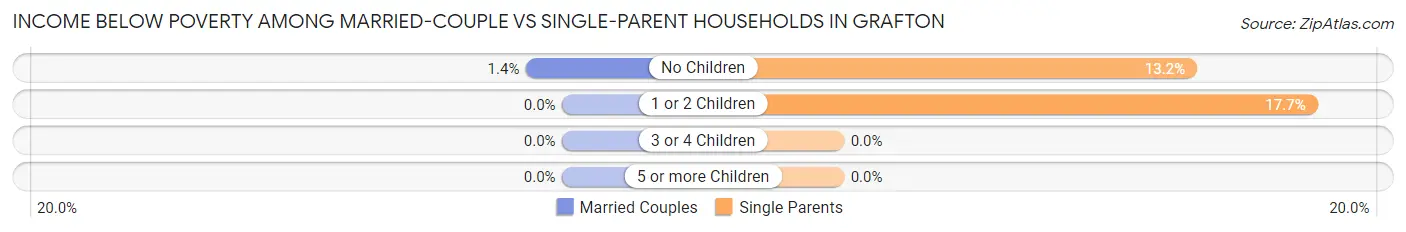
| Children | Married-Couple Families | Single-Parent Households |
| No Children | 7 (1.3%) | 5 (13.2%) |
| 1 or 2 Children | 0 (0.0%) | 15 (17.6%) |
| 3 or 4 Children | 0 (0.0%) | 0 (0.0%) |
| 5 or more Children | 0 (0.0%) | 0 (0.0%) |
| Total | 7 (0.9%) | 20 (11.1%) |
Race in Grafton
The most populous races in Grafton are White / Caucasian (3,408 | 81.9%), Hispanic or Latino (1,031 | 24.8%), and Two or more Races (433 | 10.4%).
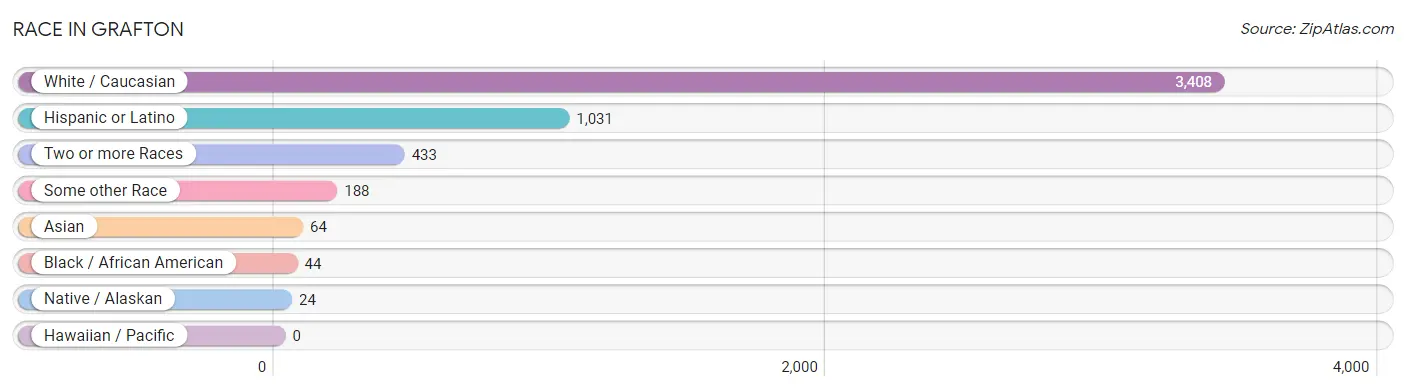
| Race | # Population | % Population |
| Asian | 64 | 1.5% |
| Black / African American | 44 | 1.1% |
| Hawaiian / Pacific | 0 | 0.0% |
| Hispanic or Latino | 1,031 | 24.8% |
| Native / Alaskan | 24 | 0.6% |
| White / Caucasian | 3,408 | 81.9% |
| Two or more Races | 433 | 10.4% |
| Some other Race | 188 | 4.5% |
| Total | 4,161 | 100.0% |
Ancestry in Grafton
The most populous ancestries reported in Grafton are Norwegian (944 | 22.7%), Mexican (862 | 20.7%), German (762 | 18.3%), Polish (246 | 5.9%), and Irish (206 | 5.0%), together accounting for 72.6% of all Grafton residents.
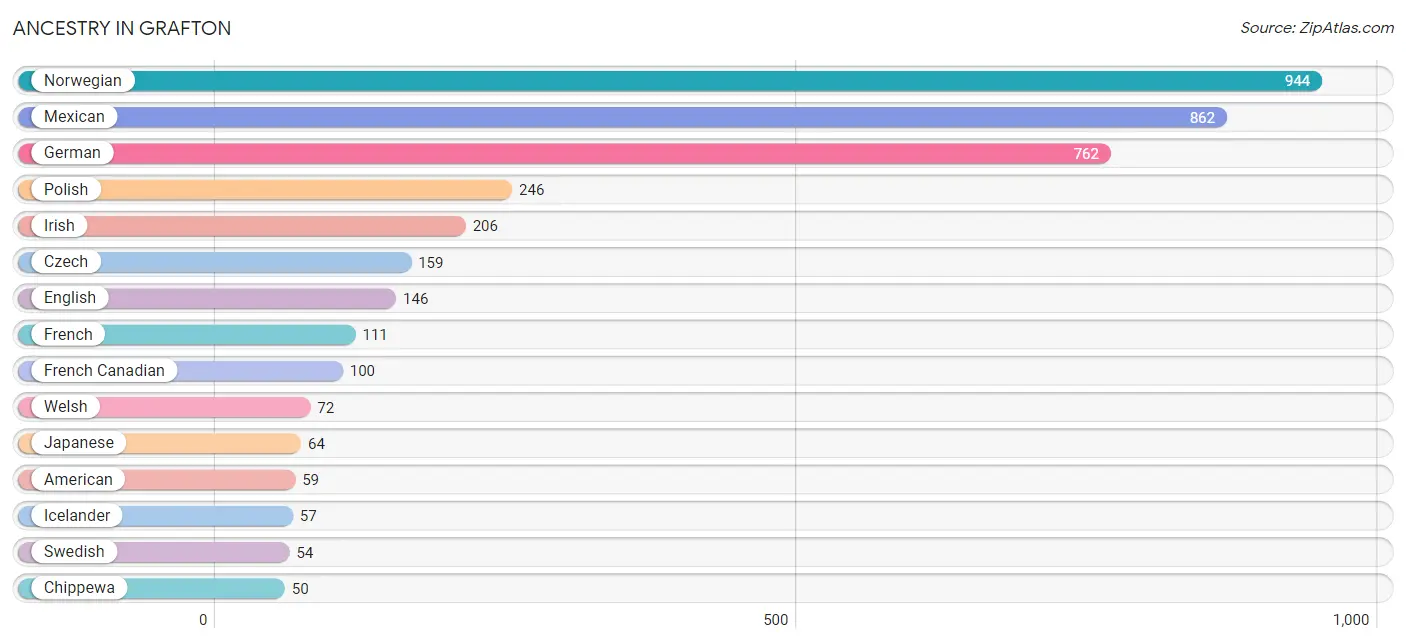
| Ancestry | # Population | % Population |
| American | 59 | 1.4% |
| Austrian | 8 | 0.2% |
| Bahamian | 14 | 0.3% |
| Bulgarian | 7 | 0.2% |
| Cherokee | 1 | 0.0% |
| Chippewa | 50 | 1.2% |
| Choctaw | 8 | 0.2% |
| Czech | 159 | 3.8% |
| Czechoslovakian | 9 | 0.2% |
| Danish | 6 | 0.1% |
| Dutch | 11 | 0.3% |
| Eastern European | 7 | 0.2% |
| English | 146 | 3.5% |
| European | 17 | 0.4% |
| Finnish | 9 | 0.2% |
| French | 111 | 2.7% |
| French Canadian | 100 | 2.4% |
| German | 762 | 18.3% |
| Icelander | 57 | 1.4% |
| Irish | 206 | 5.0% |
| Italian | 9 | 0.2% |
| Japanese | 64 | 1.5% |
| Korean | 6 | 0.1% |
| Mexican | 862 | 20.7% |
| Nigerian | 3 | 0.1% |
| Norwegian | 944 | 22.7% |
| Polish | 246 | 5.9% |
| Puerto Rican | 15 | 0.4% |
| Russian | 6 | 0.1% |
| Scandinavian | 18 | 0.4% |
| Scotch-Irish | 31 | 0.7% |
| Scottish | 8 | 0.2% |
| Sioux | 9 | 0.2% |
| Subsaharan African | 12 | 0.3% |
| Swedish | 54 | 1.3% |
| Thai | 7 | 0.2% |
| Ukrainian | 6 | 0.1% |
| Welsh | 72 | 1.7% |
| Zimbabwean | 9 | 0.2% | View All 39 Rows |
Immigrants in Grafton
The most numerous immigrant groups reported in Grafton came from Central America (166 | 4.0%), Latin America (166 | 4.0%), Mexico (166 | 4.0%), Asia (13 | 0.3%), and Africa (12 | 0.3%), together accounting for 12.6% of all Grafton residents.
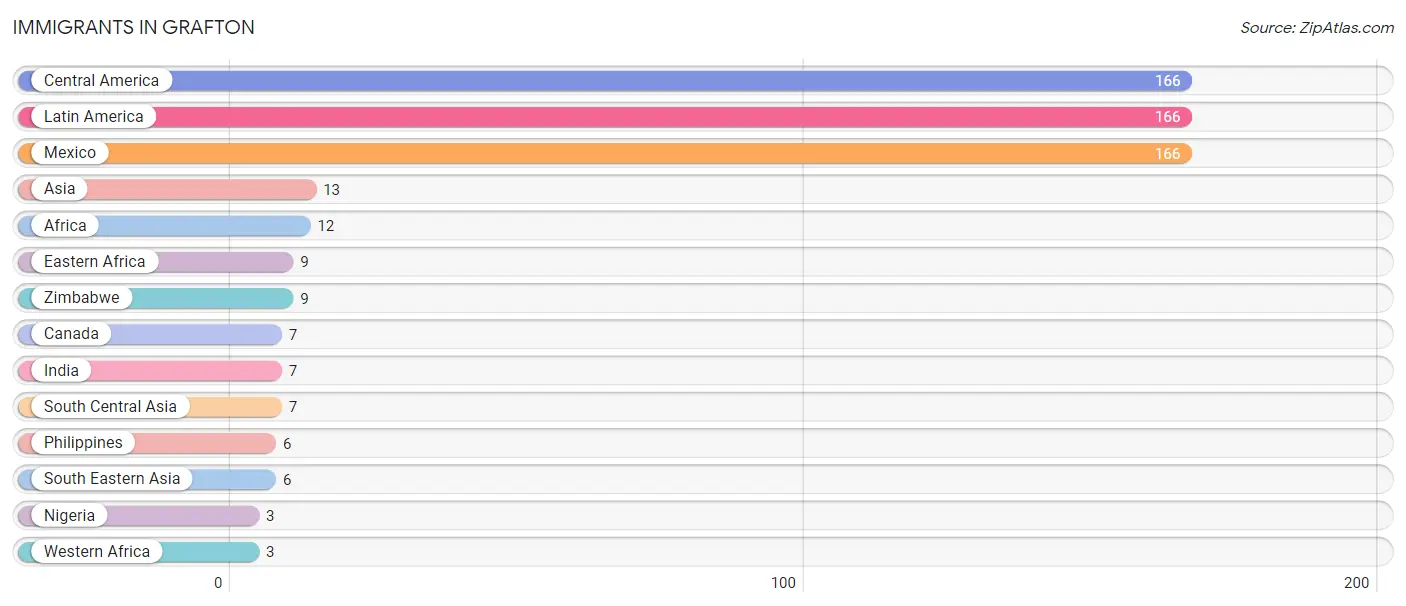
| Immigration Origin | # Population | % Population |
| Africa | 12 | 0.3% |
| Asia | 13 | 0.3% |
| Canada | 7 | 0.2% |
| Central America | 166 | 4.0% |
| Eastern Africa | 9 | 0.2% |
| India | 7 | 0.2% |
| Latin America | 166 | 4.0% |
| Mexico | 166 | 4.0% |
| Nigeria | 3 | 0.1% |
| Philippines | 6 | 0.1% |
| South Central Asia | 7 | 0.2% |
| South Eastern Asia | 6 | 0.1% |
| Western Africa | 3 | 0.1% |
| Zimbabwe | 9 | 0.2% | View All 14 Rows |
Sex and Age in Grafton
Sex and Age in Grafton
The most populous age groups in Grafton are 5 to 9 Years (285 | 13.8%) for men and 85 Years and over (188 | 9.0%) for women.
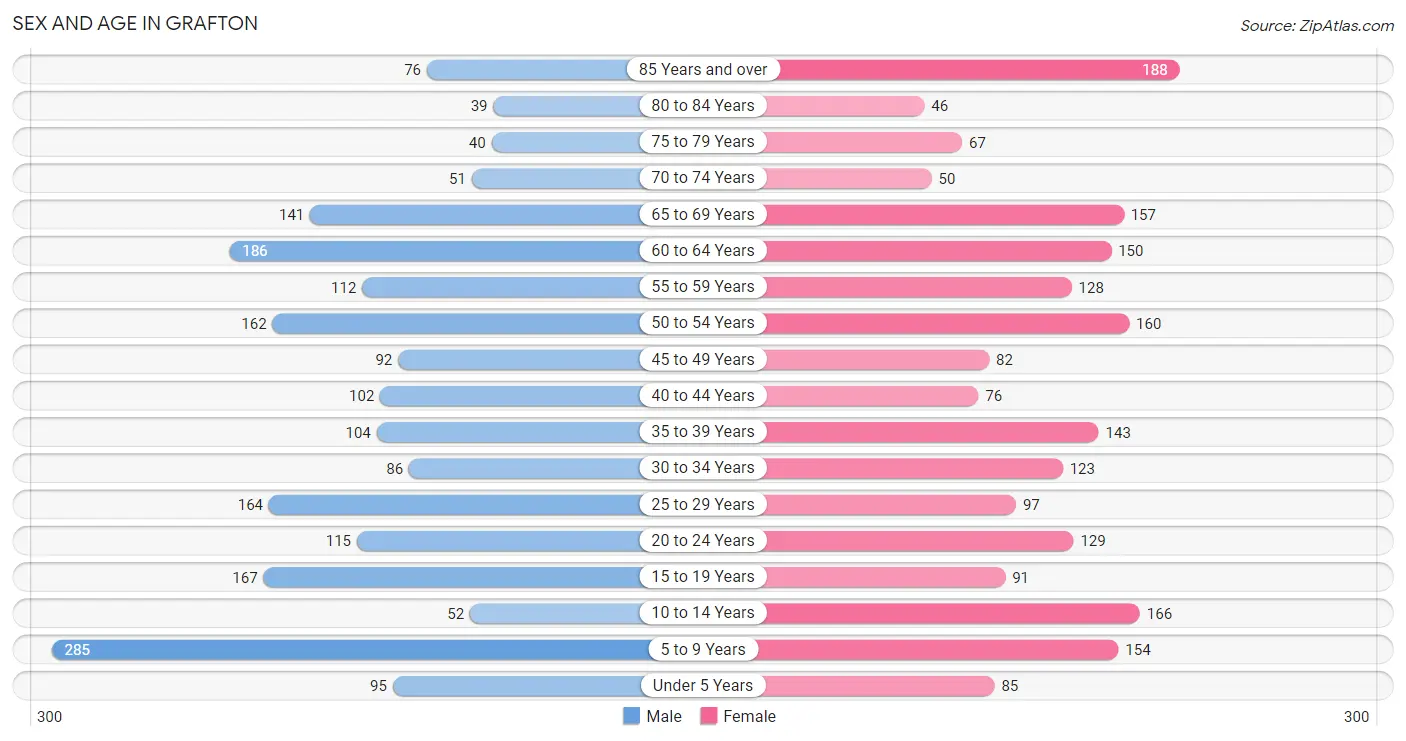
| Age Bracket | Male | Female |
| Under 5 Years | 95 (4.6%) | 85 (4.1%) |
| 5 to 9 Years | 285 (13.8%) | 154 (7.4%) |
| 10 to 14 Years | 52 (2.5%) | 166 (7.9%) |
| 15 to 19 Years | 167 (8.1%) | 91 (4.3%) |
| 20 to 24 Years | 115 (5.6%) | 129 (6.2%) |
| 25 to 29 Years | 164 (7.9%) | 97 (4.6%) |
| 30 to 34 Years | 86 (4.2%) | 123 (5.9%) |
| 35 to 39 Years | 104 (5.0%) | 143 (6.8%) |
| 40 to 44 Years | 102 (4.9%) | 76 (3.6%) |
| 45 to 49 Years | 92 (4.4%) | 82 (3.9%) |
| 50 to 54 Years | 162 (7.8%) | 160 (7.6%) |
| 55 to 59 Years | 112 (5.4%) | 128 (6.1%) |
| 60 to 64 Years | 186 (9.0%) | 150 (7.2%) |
| 65 to 69 Years | 141 (6.8%) | 157 (7.5%) |
| 70 to 74 Years | 51 (2.5%) | 50 (2.4%) |
| 75 to 79 Years | 40 (1.9%) | 67 (3.2%) |
| 80 to 84 Years | 39 (1.9%) | 46 (2.2%) |
| 85 Years and over | 76 (3.7%) | 188 (9.0%) |
| Total | 2,069 (100.0%) | 2,092 (100.0%) |
Families and Households in Grafton
Median Family Size in Grafton
The median family size in Grafton is 2.98 persons per family, with single female/mother families (147 | 15.7%) accounting for the largest median family size of 3.31 persons per family. On the other hand, married-couple families (757 | 80.8%) represent the smallest median family size with 2.90 persons per family.
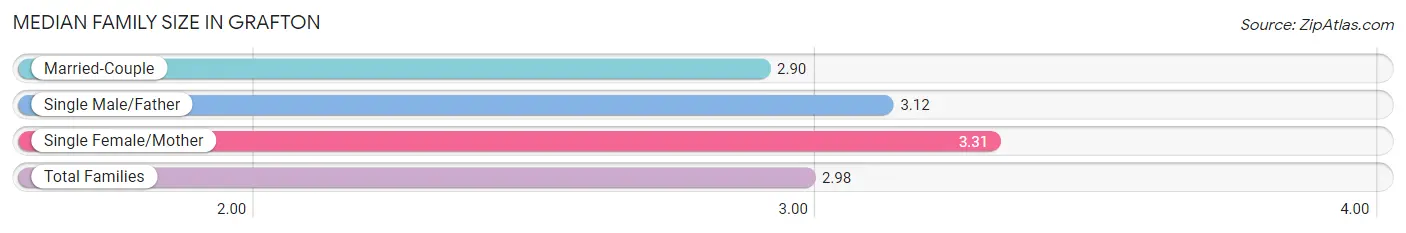
| Family Type | # Families | Family Size |
| Married-Couple | 757 (80.8%) | 2.90 |
| Single Male/Father | 33 (3.5%) | 3.12 |
| Single Female/Mother | 147 (15.7%) | 3.31 |
| Total Families | 937 (100.0%) | 2.98 |
Median Household Size in Grafton
The median household size in Grafton is 2.19 persons per household, with single female/mother households (147 | 8.4%) accounting for the largest median household size of 3.78 persons per household. non-family households (814 | 46.5%) represent the smallest median household size with 1.15 persons per household.
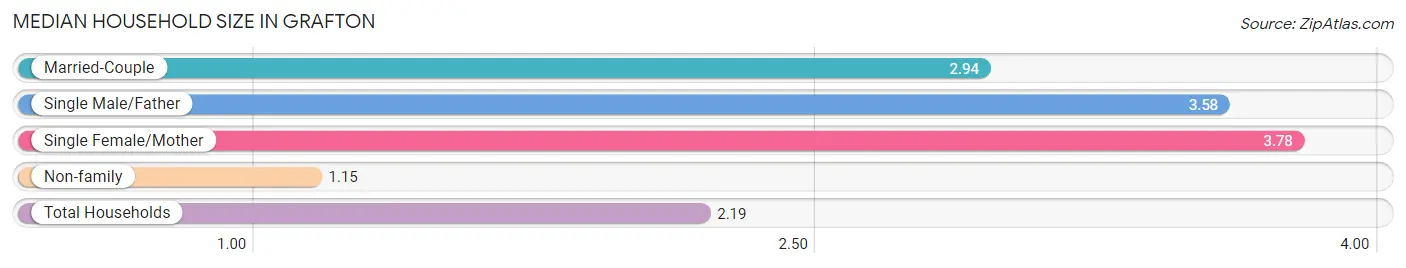
| Household Type | # Households | Household Size |
| Married-Couple | 757 (43.2%) | 2.94 |
| Single Male/Father | 33 (1.9%) | 3.58 |
| Single Female/Mother | 147 (8.4%) | 3.78 |
| Non-family | 814 (46.5%) | 1.15 |
| Total Households | 1,751 (100.0%) | 2.19 |
Household Size by Marriage Status in Grafton
Out of a total of 1,751 households in Grafton, 937 (53.5%) are family households, while 814 (46.5%) are nonfamily households. The most numerous type of family households are 2-person households, comprising 521, and the most common type of nonfamily households are 1-person households, comprising 700.
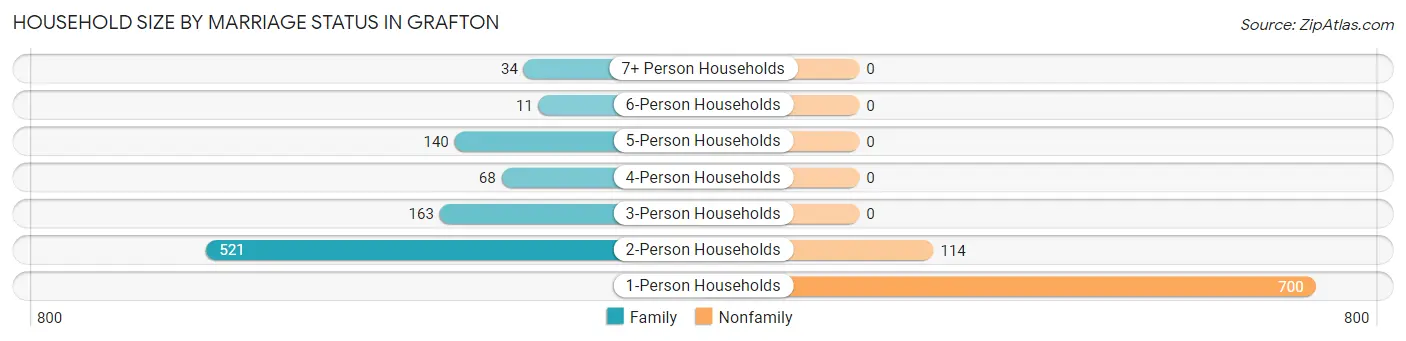
| Household Size | Family Households | Nonfamily Households |
| 1-Person Households | - | 700 (40.0%) |
| 2-Person Households | 521 (29.7%) | 114 (6.5%) |
| 3-Person Households | 163 (9.3%) | 0 (0.0%) |
| 4-Person Households | 68 (3.9%) | 0 (0.0%) |
| 5-Person Households | 140 (8.0%) | 0 (0.0%) |
| 6-Person Households | 11 (0.6%) | 0 (0.0%) |
| 7+ Person Households | 34 (1.9%) | 0 (0.0%) |
| Total | 937 (53.5%) | 814 (46.5%) |
Female Fertility in Grafton
Fertility by Age in Grafton
Average fertility rate in Grafton is 134.0 births per 1,000 women. Women in the age bracket of 20 to 34 years have the highest fertility rate with 289.0 births per 1,000 women. Women in the age bracket of 20 to 34 years acount for 100.0% of all women with births.
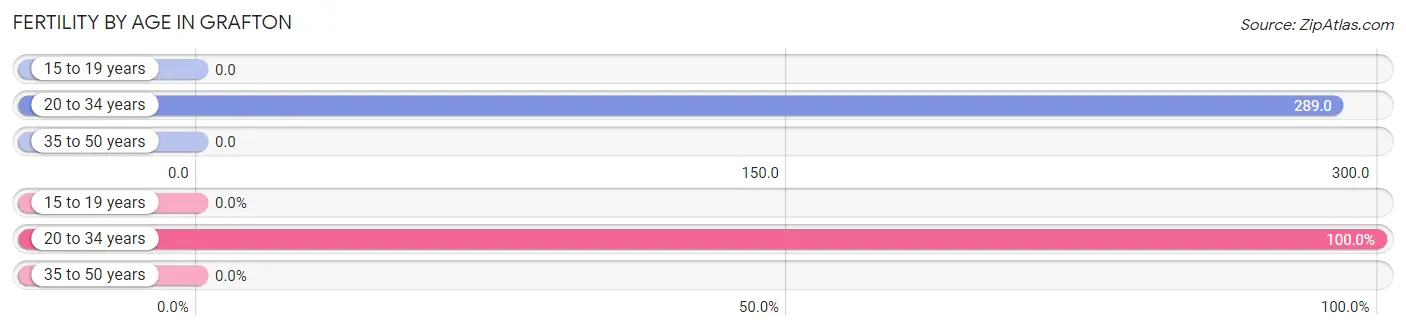
| Age Bracket | Women with Births | Births / 1,000 Women |
| 15 to 19 years | 0 (0.0%) | 0.0 |
| 20 to 34 years | 101 (100.0%) | 289.0 |
| 35 to 50 years | 0 (0.0%) | 0.0 |
| Total | 101 (100.0%) | 134.0 |
Fertility by Age by Marriage Status in Grafton
22.8% of women with births (101) in Grafton are married. The highest percentage of unmarried women with births falls into 20 to 34 years age bracket with 77.2% of them unmarried at the time of birth, while the lowest percentage of unmarried women with births belong to 20 to 34 years age bracket with 77.2% of them unmarried.
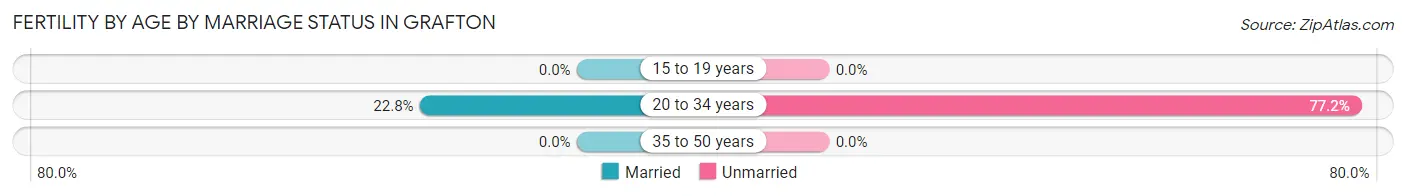
| Age Bracket | Married | Unmarried |
| 15 to 19 years | 0 (0.0%) | 0 (0.0%) |
| 20 to 34 years | 23 (22.8%) | 78 (77.2%) |
| 35 to 50 years | 0 (0.0%) | 0 (0.0%) |
| Total | 23 (22.8%) | 78 (77.2%) |
Fertility by Education in Grafton
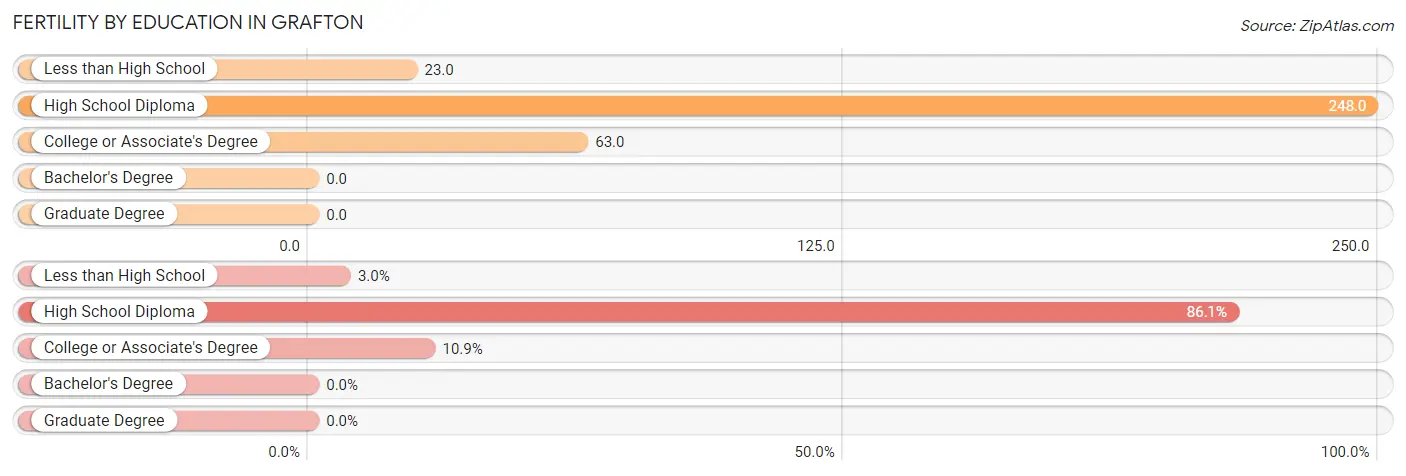
| Educational Attainment | Women with Births | Births / 1,000 Women |
| Less than High School | 3 (3.0%) | 23.0 |
| High School Diploma | 87 (86.1%) | 248.0 |
| College or Associate's Degree | 11 (10.9%) | 63.0 |
| Bachelor's Degree | 0 (0.0%) | 0.0 |
| Graduate Degree | 0 (0.0%) | 0.0 |
| Total | 101 (100.0%) | 134.0 |
Fertility by Education by Marriage Status in Grafton
77.2% of women with births in Grafton are unmarried. Women with the educational attainment of college or associate's degree are most likely to be married with 100.0% of them married at childbirth, while women with the educational attainment of less than high school are least likely to be married with 100.0% of them unmarried at childbirth.
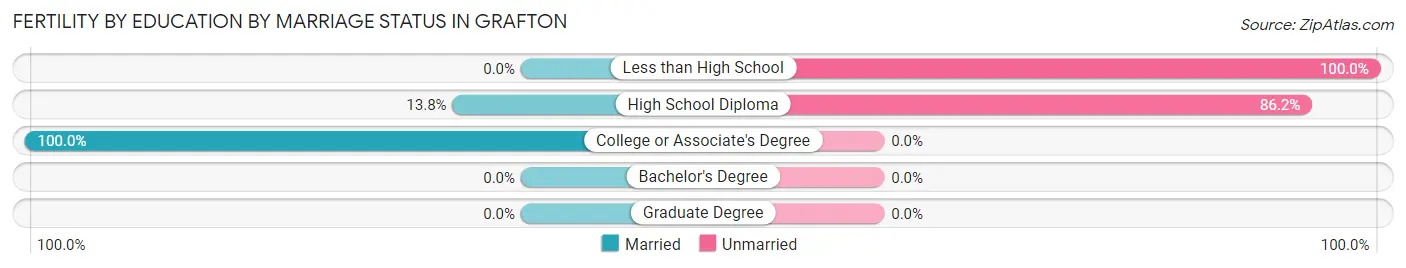
| Educational Attainment | Married | Unmarried |
| Less than High School | 0 (0.0%) | 3 (100.0%) |
| High School Diploma | 12 (13.8%) | 75 (86.2%) |
| College or Associate's Degree | 11 (100.0%) | 0 (0.0%) |
| Bachelor's Degree | 0 (0.0%) | 0 (0.0%) |
| Graduate Degree | 0 (0.0%) | 0 (0.0%) |
| Total | 23 (22.8%) | 78 (77.2%) |
Employment Characteristics in Grafton
Employment by Class of Employer in Grafton
Among the 2,047 employed individuals in Grafton, private company employees (1,236 | 60.4%), not-for-profit organizations (259 | 12.7%), and state government employees (204 | 10.0%) make up the most common classes of employment.
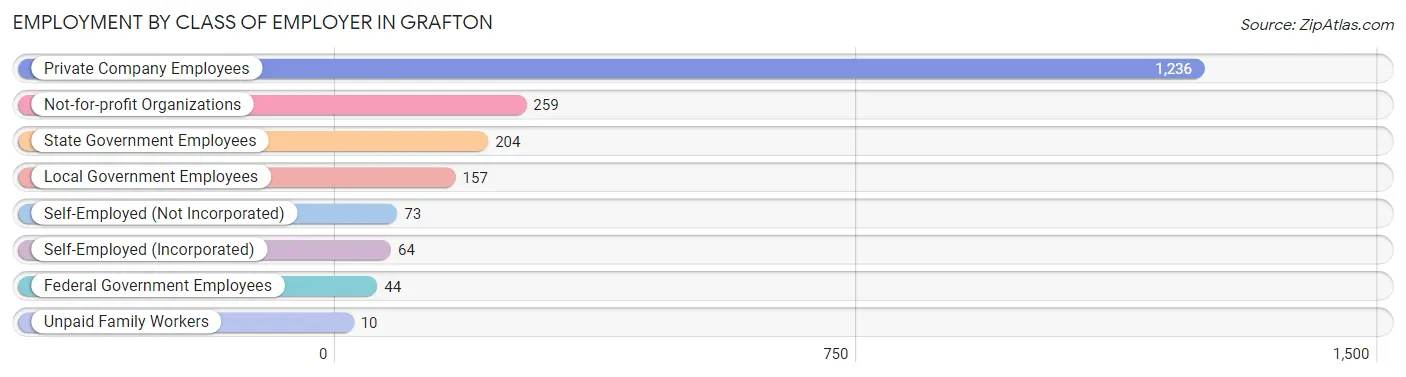
| Employer Class | # Employees | % Employees |
| Private Company Employees | 1,236 | 60.4% |
| Self-Employed (Incorporated) | 64 | 3.1% |
| Self-Employed (Not Incorporated) | 73 | 3.6% |
| Not-for-profit Organizations | 259 | 12.7% |
| Local Government Employees | 157 | 7.7% |
| State Government Employees | 204 | 10.0% |
| Federal Government Employees | 44 | 2.1% |
| Unpaid Family Workers | 10 | 0.5% |
| Total | 2,047 | 100.0% |
Employment Status by Age in Grafton
According to the labor force statistics for Grafton, out of the total population over 16 years of age (3,272), 67.4% or 2,205 individuals are in the labor force, with 3.3% or 73 of them unemployed. The age group with the highest labor force participation rate is 30 to 34 years, with 92.3% or 193 individuals in the labor force. Within the labor force, the 75 years and over age range has the highest percentage of unemployed individuals, with 27.7% or 13 of them being unemployed.
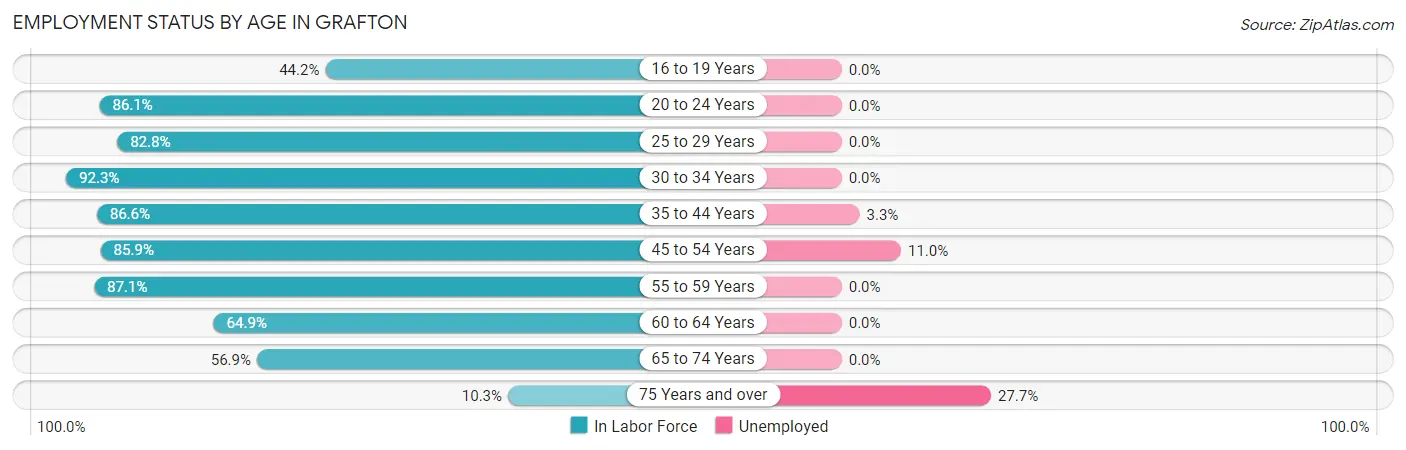
| Age Bracket | In Labor Force | Unemployed |
| 16 to 19 Years | 91 (44.2%) | 0 (0.0%) |
| 20 to 24 Years | 210 (86.1%) | 0 (0.0%) |
| 25 to 29 Years | 216 (82.8%) | 0 (0.0%) |
| 30 to 34 Years | 193 (92.3%) | 0 (0.0%) |
| 35 to 44 Years | 368 (86.6%) | 12 (3.3%) |
| 45 to 54 Years | 426 (85.9%) | 47 (11.0%) |
| 55 to 59 Years | 209 (87.1%) | 0 (0.0%) |
| 60 to 64 Years | 218 (64.9%) | 0 (0.0%) |
| 65 to 74 Years | 227 (56.9%) | 0 (0.0%) |
| 75 Years and over | 47 (10.3%) | 13 (27.7%) |
| Total | 2,205 (67.4%) | 73 (3.3%) |
Employment Status by Educational Attainment in Grafton
According to labor force statistics for Grafton, 82.9% of individuals (1,631) out of the total population between 25 and 64 years of age (1,967) are in the labor force, with 3.6% or 59 of them being unemployed. The group with the highest labor force participation rate are those with the educational attainment of college / associate degree, with 85.2% or 438 individuals in the labor force. Within the labor force, individuals with high school diploma education have the highest percentage of unemployment, with 8.3% or 54 of them being unemployed.
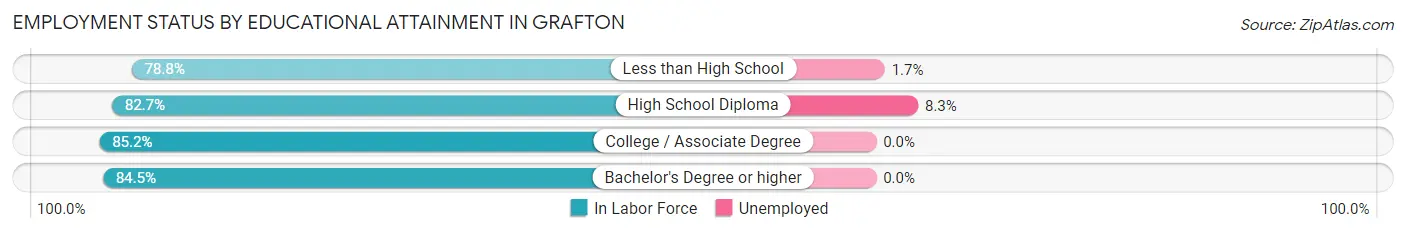
| Educational Attainment | In Labor Force | Unemployed |
| Less than High School | 293 (78.8%) | 6 (1.7%) |
| High School Diploma | 648 (82.7%) | 65 (8.3%) |
| College / Associate Degree | 438 (85.2%) | 0 (0.0%) |
| Bachelor's Degree or higher | 251 (84.5%) | 0 (0.0%) |
| Total | 1,631 (82.9%) | 71 (3.6%) |
Employment Occupations by Sex in Grafton
Management, Business, Science and Arts Occupations
The most common Management, Business, Science and Arts occupations in Grafton are Management (273 | 13.1%), Community & Social Service (189 | 9.0%), Education Instruction & Library (121 | 5.8%), Health Diagnosing & Treating (104 | 5.0%), and Computers, Engineering & Science (57 | 2.7%).
Management, Business, Science and Arts Occupations by Sex
Within the Management, Business, Science and Arts occupations in Grafton, the most male-oriented occupations are Architecture & Engineering (100.0%), Legal Services & Support (80.0%), and Computers, Engineering & Science (63.2%), while the most female-oriented occupations are Arts, Media & Entertainment (100.0%), Health Technologists (100.0%), and Health Diagnosing & Treating (95.2%).
| Occupation | Male | Female |
| Management | 139 (50.9%) | 134 (49.1%) |
| Business & Financial | 14 (58.3%) | 10 (41.7%) |
| Computers, Engineering & Science | 36 (63.2%) | 21 (36.8%) |
| Computers & Mathematics | 0 (0.0%) | 0 (0.0%) |
| Architecture & Engineering | 16 (100.0%) | 0 (0.0%) |
| Life, Physical & Social Science | 20 (48.8%) | 21 (51.2%) |
| Community & Social Service | 103 (54.5%) | 86 (45.5%) |
| Education, Arts & Media | 24 (44.4%) | 30 (55.6%) |
| Legal Services & Support | 4 (80.0%) | 1 (20.0%) |
| Education Instruction & Library | 75 (62.0%) | 46 (38.0%) |
| Arts, Media & Entertainment | 0 (0.0%) | 9 (100.0%) |
| Health Diagnosing & Treating | 5 (4.8%) | 99 (95.2%) |
| Health Technologists | 0 (0.0%) | 45 (100.0%) |
| Total (Category) | 297 (45.9%) | 350 (54.1%) |
| Total (Overall) | 1,085 (51.9%) | 1,007 (48.1%) |
Services Occupations
The most common Services occupations in Grafton are Healthcare Support (292 | 14.0%), Cleaning & Maintenance (75 | 3.6%), Food Preparation & Serving (61 | 2.9%), and Personal Care & Service (34 | 1.6%).
Services Occupations by Sex
Within the Services occupations in Grafton, the most male-oriented occupations are Cleaning & Maintenance (74.7%), Food Preparation & Serving (62.3%), and Healthcare Support (23.6%), while the most female-oriented occupations are Personal Care & Service (91.2%), Healthcare Support (76.4%), and Food Preparation & Serving (37.7%).
| Occupation | Male | Female |
| Healthcare Support | 69 (23.6%) | 223 (76.4%) |
| Security & Protection | 0 (0.0%) | 0 (0.0%) |
| Firefighting & Prevention | 0 (0.0%) | 0 (0.0%) |
| Law Enforcement | 0 (0.0%) | 0 (0.0%) |
| Food Preparation & Serving | 38 (62.3%) | 23 (37.7%) |
| Cleaning & Maintenance | 56 (74.7%) | 19 (25.3%) |
| Personal Care & Service | 3 (8.8%) | 31 (91.2%) |
| Total (Category) | 166 (35.9%) | 296 (64.1%) |
| Total (Overall) | 1,085 (51.9%) | 1,007 (48.1%) |
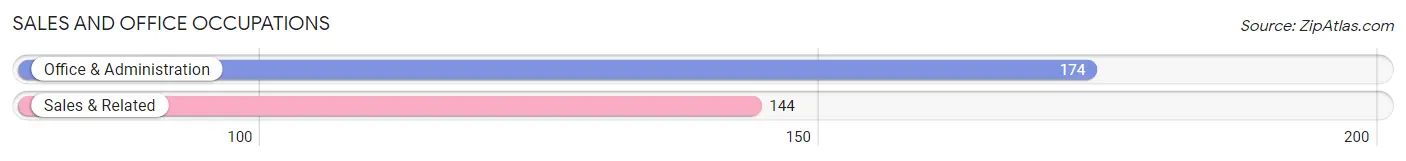
Sales and Office Occupations
The most common Sales and Office occupations in Grafton are Office & Administration (174 | 8.3%), and Sales & Related (144 | 6.9%).
Sales and Office Occupations by Sex
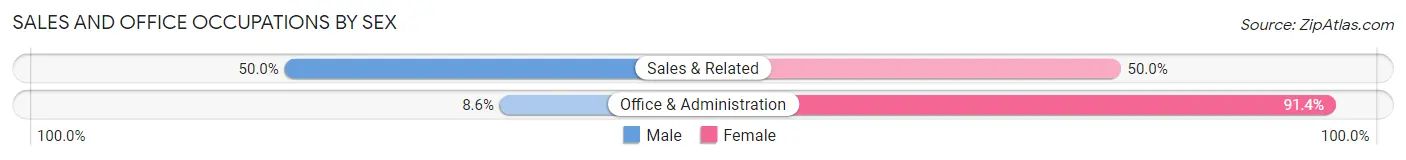
| Occupation | Male | Female |
| Sales & Related | 72 (50.0%) | 72 (50.0%) |
| Office & Administration | 15 (8.6%) | 159 (91.4%) |
| Total (Category) | 87 (27.4%) | 231 (72.6%) |
| Total (Overall) | 1,085 (51.9%) | 1,007 (48.1%) |
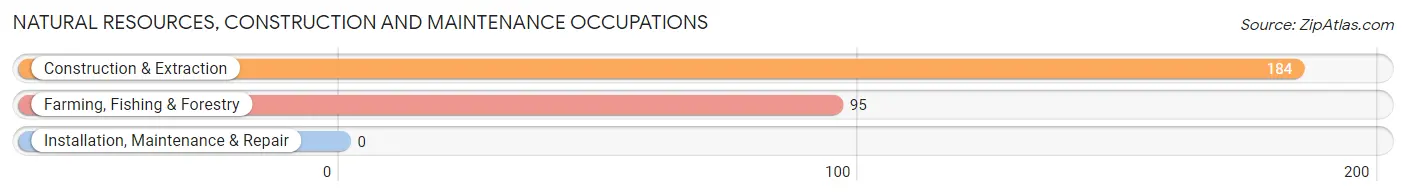
Natural Resources, Construction and Maintenance Occupations
The most common Natural Resources, Construction and Maintenance occupations in Grafton are Construction & Extraction (184 | 8.8%), and Farming, Fishing & Forestry (95 | 4.5%).
Natural Resources, Construction and Maintenance Occupations by Sex
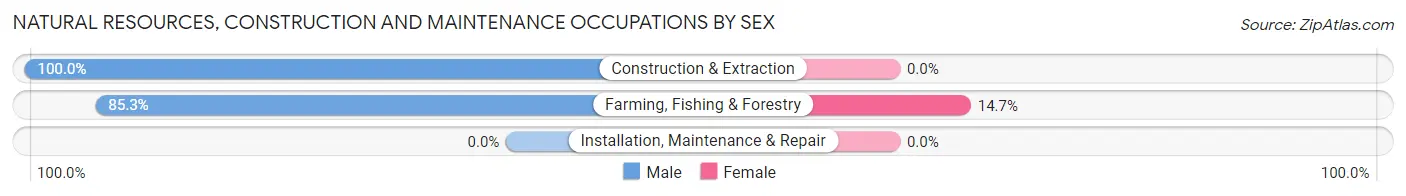
| Occupation | Male | Female |
| Farming, Fishing & Forestry | 81 (85.3%) | 14 (14.7%) |
| Construction & Extraction | 184 (100.0%) | 0 (0.0%) |
| Installation, Maintenance & Repair | 0 (0.0%) | 0 (0.0%) |
| Total (Category) | 265 (95.0%) | 14 (5.0%) |
| Total (Overall) | 1,085 (51.9%) | 1,007 (48.1%) |
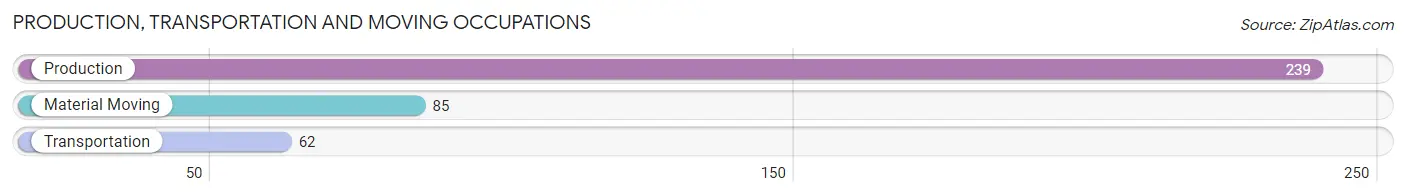
Production, Transportation and Moving Occupations
The most common Production, Transportation and Moving occupations in Grafton are Production (239 | 11.4%), Material Moving (85 | 4.1%), and Transportation (62 | 3.0%).
Production, Transportation and Moving Occupations by Sex
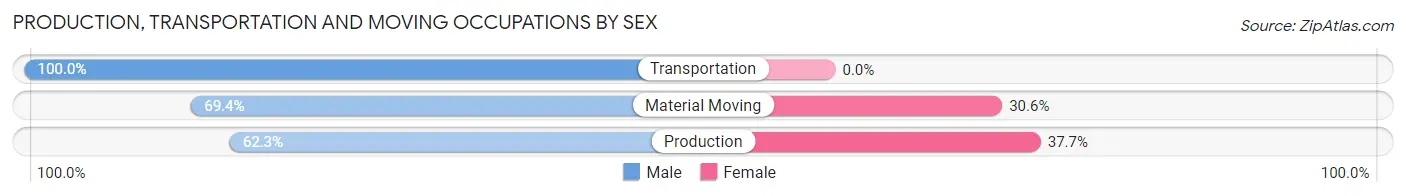
| Occupation | Male | Female |
| Production | 149 (62.3%) | 90 (37.7%) |
| Transportation | 62 (100.0%) | 0 (0.0%) |
| Material Moving | 59 (69.4%) | 26 (30.6%) |
| Total (Category) | 270 (70.0%) | 116 (30.0%) |
| Total (Overall) | 1,085 (51.9%) | 1,007 (48.1%) |
Employment Industries by Sex in Grafton
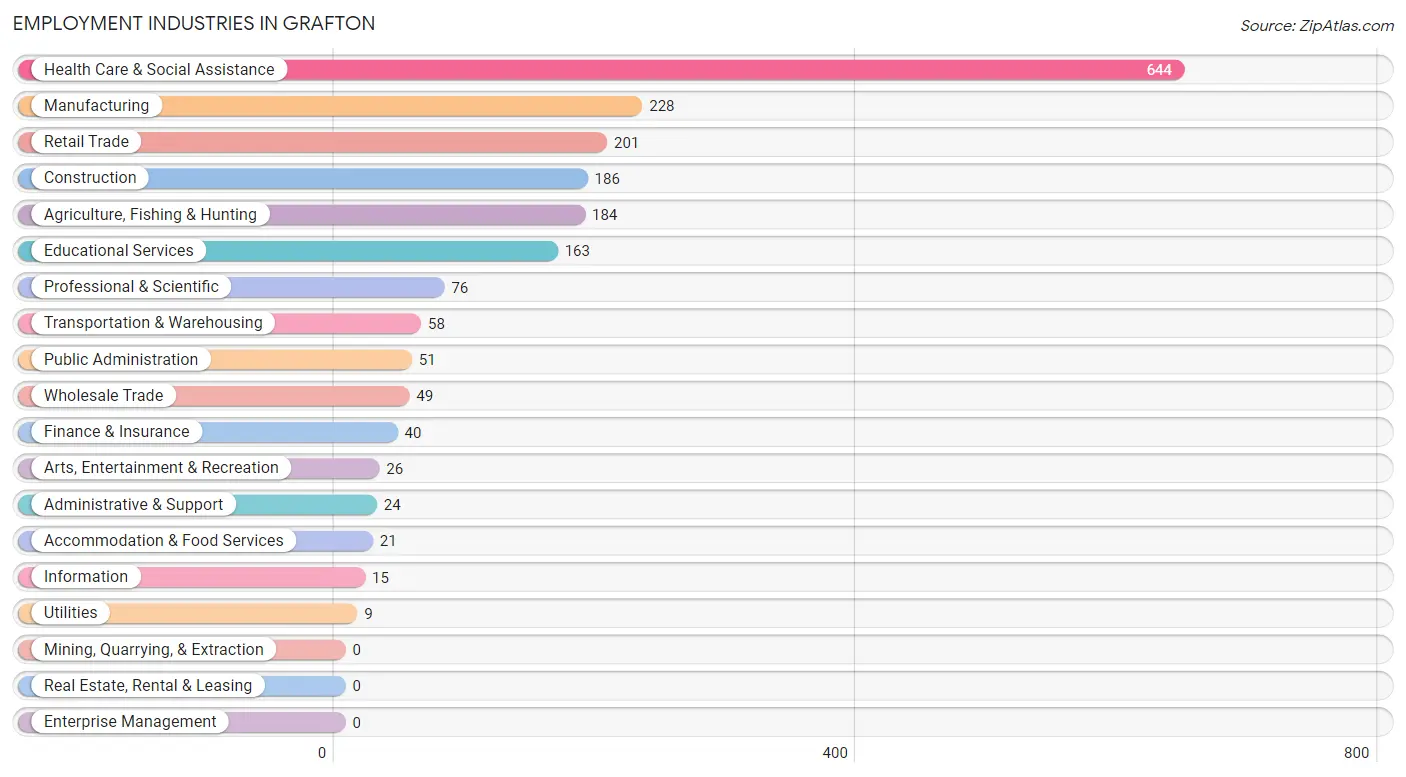
Employment Industries in Grafton
The major employment industries in Grafton include Health Care & Social Assistance (644 | 30.8%), Manufacturing (228 | 10.9%), Retail Trade (201 | 9.6%), Construction (186 | 8.9%), and Agriculture, Fishing & Hunting (184 | 8.8%).
Employment Industries by Sex in Grafton
The Grafton industries that see more men than women are Agriculture, Fishing & Hunting (100.0%), Transportation & Warehousing (100.0%), and Arts, Entertainment & Recreation (100.0%), whereas the industries that tend to have a higher number of women are Utilities (100.0%), Information (100.0%), and Professional & Scientific (94.7%).
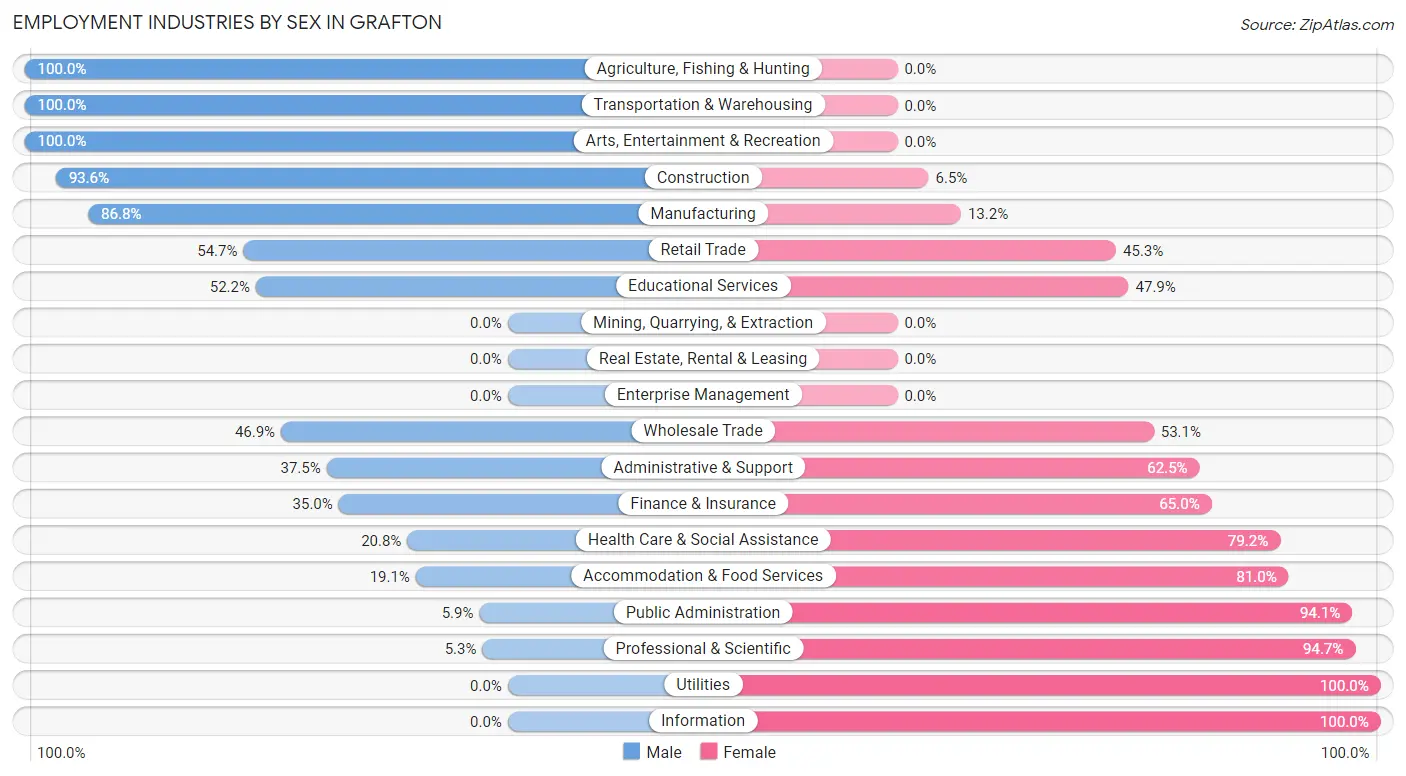
| Industry | Male | Female |
| Agriculture, Fishing & Hunting | 184 (100.0%) | 0 (0.0%) |
| Mining, Quarrying, & Extraction | 0 (0.0%) | 0 (0.0%) |
| Construction | 174 (93.5%) | 12 (6.5%) |
| Manufacturing | 198 (86.8%) | 30 (13.2%) |
| Wholesale Trade | 23 (46.9%) | 26 (53.1%) |
| Retail Trade | 110 (54.7%) | 91 (45.3%) |
| Transportation & Warehousing | 58 (100.0%) | 0 (0.0%) |
| Utilities | 0 (0.0%) | 9 (100.0%) |
| Information | 0 (0.0%) | 15 (100.0%) |
| Finance & Insurance | 14 (35.0%) | 26 (65.0%) |
| Real Estate, Rental & Leasing | 0 (0.0%) | 0 (0.0%) |
| Professional & Scientific | 4 (5.3%) | 72 (94.7%) |
| Enterprise Management | 0 (0.0%) | 0 (0.0%) |
| Administrative & Support | 9 (37.5%) | 15 (62.5%) |
| Educational Services | 85 (52.1%) | 78 (47.8%) |
| Health Care & Social Assistance | 134 (20.8%) | 510 (79.2%) |
| Arts, Entertainment & Recreation | 26 (100.0%) | 0 (0.0%) |
| Accommodation & Food Services | 4 (19.1%) | 17 (80.9%) |
| Public Administration | 3 (5.9%) | 48 (94.1%) |
| Total | 1,085 (51.9%) | 1,007 (48.1%) |
Education in Grafton
School Enrollment in Grafton
The most common levels of schooling among the 884 students in Grafton are elementary school (308 | 34.8%), high school (202 | 22.9%), and middle school (179 | 20.3%).
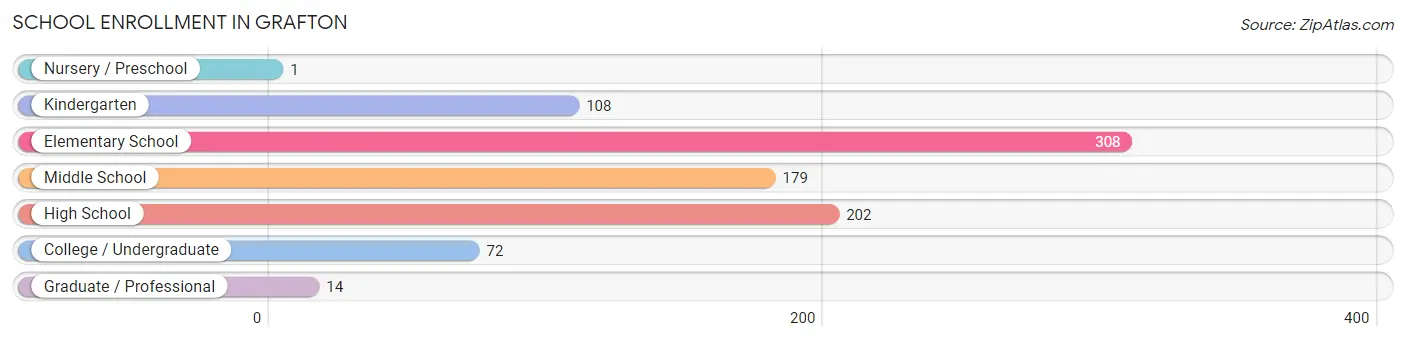
| School Level | # Students | % Students |
| Nursery / Preschool | 1 | 0.1% |
| Kindergarten | 108 | 12.2% |
| Elementary School | 308 | 34.8% |
| Middle School | 179 | 20.3% |
| High School | 202 | 22.9% |
| College / Undergraduate | 72 | 8.1% |
| Graduate / Professional | 14 | 1.6% |
| Total | 884 | 100.0% |
School Enrollment by Age by Funding Source in Grafton
Out of a total of 884 students who are enrolled in schools in Grafton, 27 (3.1%) attend a private institution, while the remaining 857 (96.9%) are enrolled in public schools. The age group of 25 to 34 year olds has the highest likelihood of being enrolled in private schools, with 8 (100.0% in the age bracket) enrolled. Conversely, the age group of 3 to 4 year olds has the lowest likelihood of being enrolled in a private school, with 1 (100.0% in the age bracket) attending a public institution.
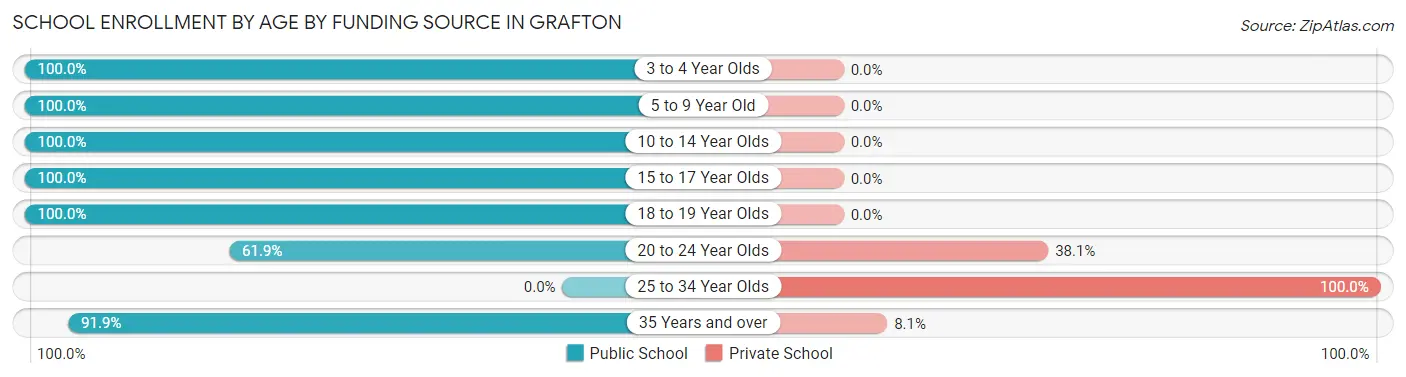
| Age Bracket | Public School | Private School |
| 3 to 4 Year Olds | 1 (100.0%) | 0 (0.0%) |
| 5 to 9 Year Old | 416 (100.0%) | 0 (0.0%) |
| 10 to 14 Year Olds | 189 (100.0%) | 0 (0.0%) |
| 15 to 17 Year Olds | 109 (100.0%) | 0 (0.0%) |
| 18 to 19 Year Olds | 82 (100.0%) | 0 (0.0%) |
| 20 to 24 Year Olds | 26 (61.9%) | 16 (38.1%) |
| 25 to 34 Year Olds | 0 (0.0%) | 8 (100.0%) |
| 35 Years and over | 34 (91.9%) | 3 (8.1%) |
| Total | 857 (96.9%) | 27 (3.1%) |
Educational Attainment by Field of Study in Grafton
Education (207 | 42.9%), business (58 | 12.0%), science & technology (47 | 9.8%), bio, nature & agricultural (35 | 7.3%), and liberal arts & history (29 | 6.0%) are the most common fields of study among 482 individuals in Grafton who have obtained a bachelor's degree or higher.
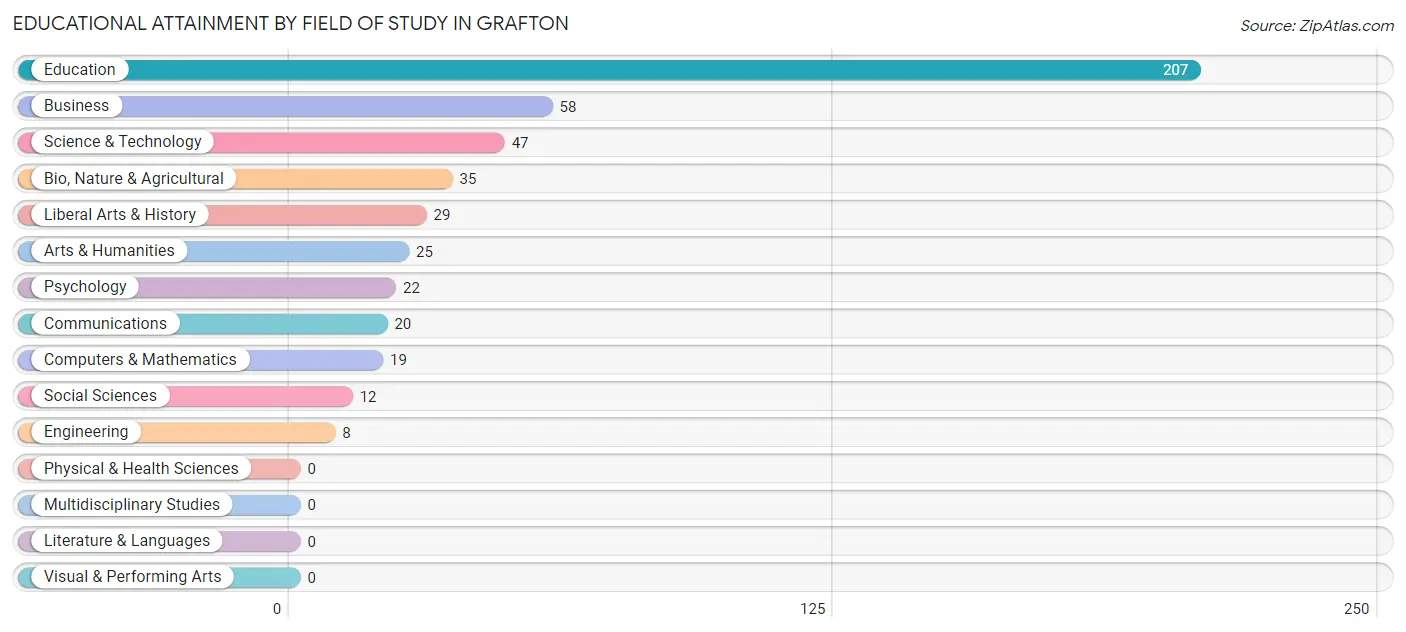
| Field of Study | # Graduates | % Graduates |
| Computers & Mathematics | 19 | 3.9% |
| Bio, Nature & Agricultural | 35 | 7.3% |
| Physical & Health Sciences | 0 | 0.0% |
| Psychology | 22 | 4.6% |
| Social Sciences | 12 | 2.5% |
| Engineering | 8 | 1.7% |
| Multidisciplinary Studies | 0 | 0.0% |
| Science & Technology | 47 | 9.8% |
| Business | 58 | 12.0% |
| Education | 207 | 42.9% |
| Literature & Languages | 0 | 0.0% |
| Liberal Arts & History | 29 | 6.0% |
| Visual & Performing Arts | 0 | 0.0% |
| Communications | 20 | 4.2% |
| Arts & Humanities | 25 | 5.2% |
| Total | 482 | 100.0% |
Transportation & Commute in Grafton
Vehicle Availability by Sex in Grafton
The most prevalent vehicle ownership categories in Grafton are males with 2 vehicles (531, accounting for 49.3%) and females with 2 vehicles (386, making up 60.6%).
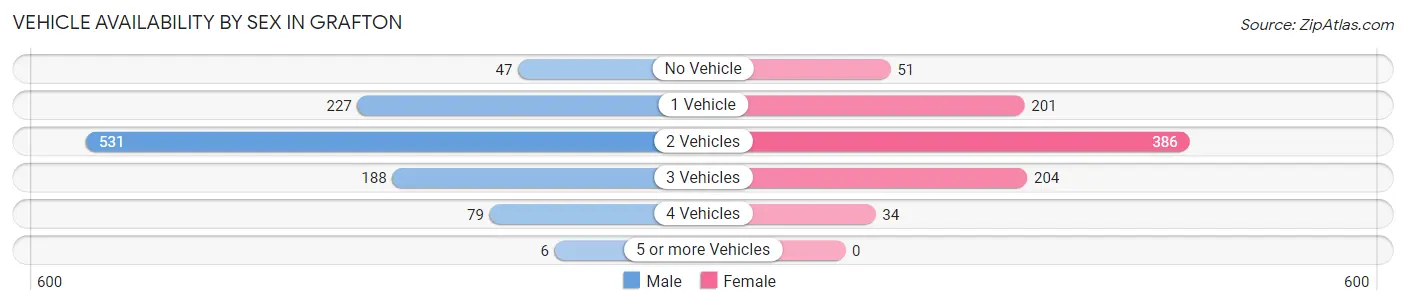
| Vehicles Available | Male | Female |
| No Vehicle | 47 (4.4%) | 51 (5.8%) |
| 1 Vehicle | 227 (21.1%) | 201 (23.0%) |
| 2 Vehicles | 531 (49.3%) | 386 (44.1%) |
| 3 Vehicles | 188 (17.4%) | 204 (23.3%) |
| 4 Vehicles | 79 (7.3%) | 34 (3.9%) |
| 5 or more Vehicles | 6 (0.6%) | 0 (0.0%) |
| Total | 1,078 (100.0%) | 876 (100.0%) |
Commute Time in Grafton
The most frequently occuring commute durations in Grafton are 5 to 9 minutes (742 commuters, 36.5%), 10 to 14 minutes (499 commuters, 24.6%), and less than 5 minutes (243 commuters, 12.0%).
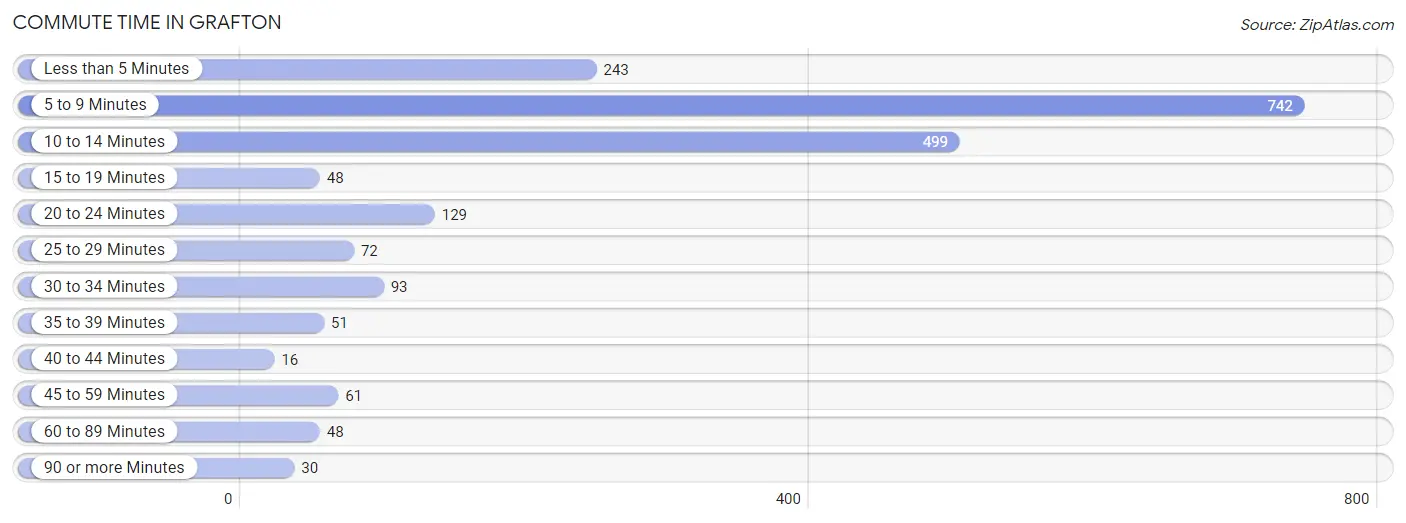
| Commute Time | # Commuters | % Commuters |
| Less than 5 Minutes | 243 | 12.0% |
| 5 to 9 Minutes | 742 | 36.5% |
| 10 to 14 Minutes | 499 | 24.6% |
| 15 to 19 Minutes | 48 | 2.4% |
| 20 to 24 Minutes | 129 | 6.4% |
| 25 to 29 Minutes | 72 | 3.5% |
| 30 to 34 Minutes | 93 | 4.6% |
| 35 to 39 Minutes | 51 | 2.5% |
| 40 to 44 Minutes | 16 | 0.8% |
| 45 to 59 Minutes | 61 | 3.0% |
| 60 to 89 Minutes | 48 | 2.4% |
| 90 or more Minutes | 30 | 1.5% |
Commute Time by Sex in Grafton
The most common commute times in Grafton are 5 to 9 minutes (417 commuters, 37.2%) for males and 5 to 9 minutes (325 commuters, 35.7%) for females.
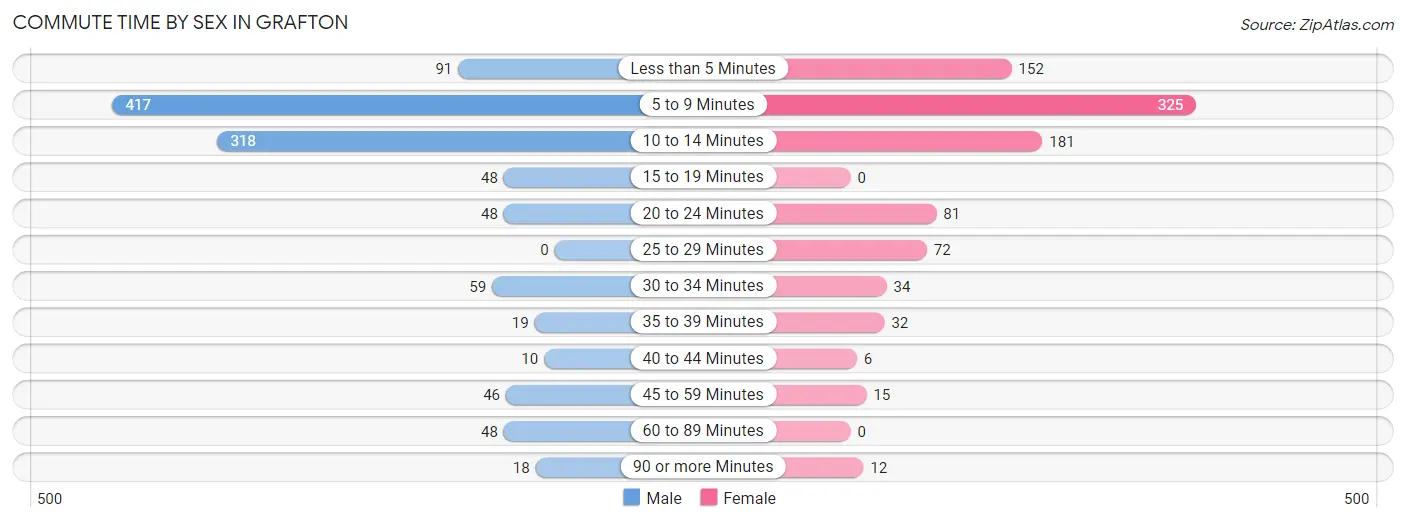
| Commute Time | Male | Female |
| Less than 5 Minutes | 91 (8.1%) | 152 (16.7%) |
| 5 to 9 Minutes | 417 (37.2%) | 325 (35.7%) |
| 10 to 14 Minutes | 318 (28.3%) | 181 (19.9%) |
| 15 to 19 Minutes | 48 (4.3%) | 0 (0.0%) |
| 20 to 24 Minutes | 48 (4.3%) | 81 (8.9%) |
| 25 to 29 Minutes | 0 (0.0%) | 72 (7.9%) |
| 30 to 34 Minutes | 59 (5.3%) | 34 (3.7%) |
| 35 to 39 Minutes | 19 (1.7%) | 32 (3.5%) |
| 40 to 44 Minutes | 10 (0.9%) | 6 (0.7%) |
| 45 to 59 Minutes | 46 (4.1%) | 15 (1.7%) |
| 60 to 89 Minutes | 48 (4.3%) | 0 (0.0%) |
| 90 or more Minutes | 18 (1.6%) | 12 (1.3%) |
Time of Departure to Work by Sex in Grafton
The most frequent times of departure to work in Grafton are 7:30 AM to 7:59 AM (219, 19.5%) for males and 7:30 AM to 7:59 AM (177, 19.5%) for females.
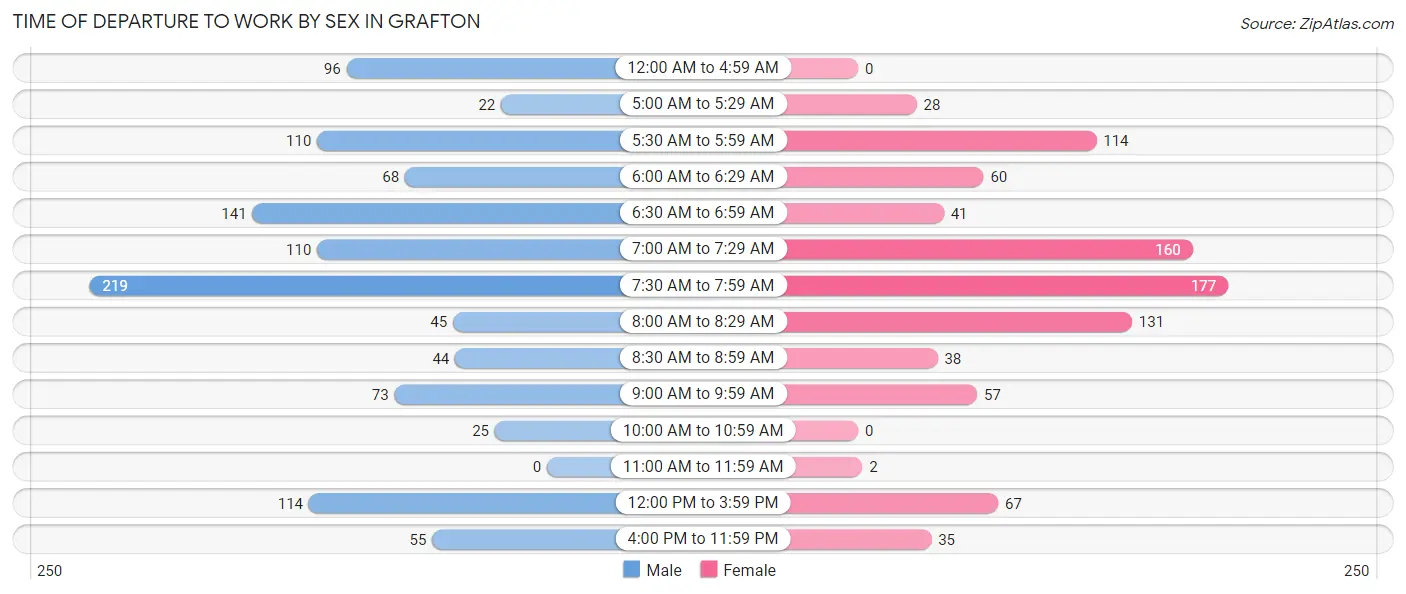
| Time of Departure | Male | Female |
| 12:00 AM to 4:59 AM | 96 (8.6%) | 0 (0.0%) |
| 5:00 AM to 5:29 AM | 22 (2.0%) | 28 (3.1%) |
| 5:30 AM to 5:59 AM | 110 (9.8%) | 114 (12.5%) |
| 6:00 AM to 6:29 AM | 68 (6.1%) | 60 (6.6%) |
| 6:30 AM to 6:59 AM | 141 (12.6%) | 41 (4.5%) |
| 7:00 AM to 7:29 AM | 110 (9.8%) | 160 (17.6%) |
| 7:30 AM to 7:59 AM | 219 (19.5%) | 177 (19.5%) |
| 8:00 AM to 8:29 AM | 45 (4.0%) | 131 (14.4%) |
| 8:30 AM to 8:59 AM | 44 (3.9%) | 38 (4.2%) |
| 9:00 AM to 9:59 AM | 73 (6.5%) | 57 (6.3%) |
| 10:00 AM to 10:59 AM | 25 (2.2%) | 0 (0.0%) |
| 11:00 AM to 11:59 AM | 0 (0.0%) | 2 (0.2%) |
| 12:00 PM to 3:59 PM | 114 (10.2%) | 67 (7.4%) |
| 4:00 PM to 11:59 PM | 55 (4.9%) | 35 (3.8%) |
| Total | 1,122 (100.0%) | 910 (100.0%) |
Housing Occupancy in Grafton
Occupancy by Ownership in Grafton
Of the total 1,751 dwellings in Grafton, owner-occupied units account for 1,145 (65.4%), while renter-occupied units make up 606 (34.6%).
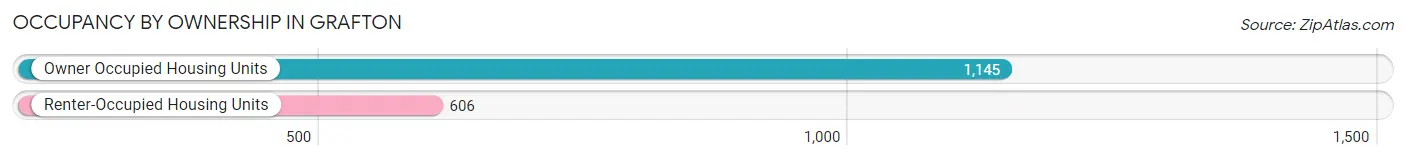
| Occupancy | # Housing Units | % Housing Units |
| Owner Occupied Housing Units | 1,145 | 65.4% |
| Renter-Occupied Housing Units | 606 | 34.6% |
| Total Occupied Housing Units | 1,751 | 100.0% |
Occupancy by Household Size in Grafton
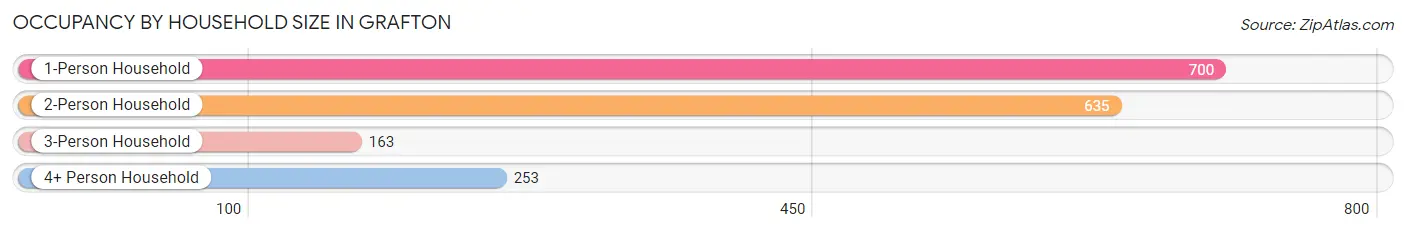
| Household Size | # Housing Units | % Housing Units |
| 1-Person Household | 700 | 40.0% |
| 2-Person Household | 635 | 36.3% |
| 3-Person Household | 163 | 9.3% |
| 4+ Person Household | 253 | 14.4% |
| Total Housing Units | 1,751 | 100.0% |
Occupancy by Ownership by Household Size in Grafton
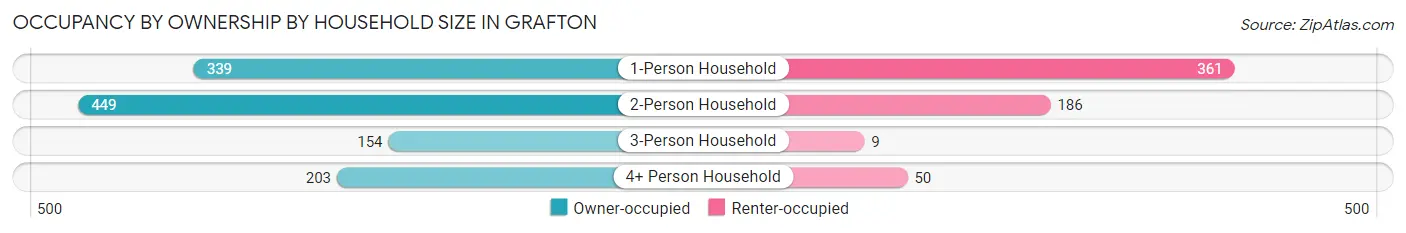
| Household Size | Owner-occupied | Renter-occupied |
| 1-Person Household | 339 (48.4%) | 361 (51.6%) |
| 2-Person Household | 449 (70.7%) | 186 (29.3%) |
| 3-Person Household | 154 (94.5%) | 9 (5.5%) |
| 4+ Person Household | 203 (80.2%) | 50 (19.8%) |
| Total Housing Units | 1,145 (65.4%) | 606 (34.6%) |
Occupancy by Educational Attainment in Grafton
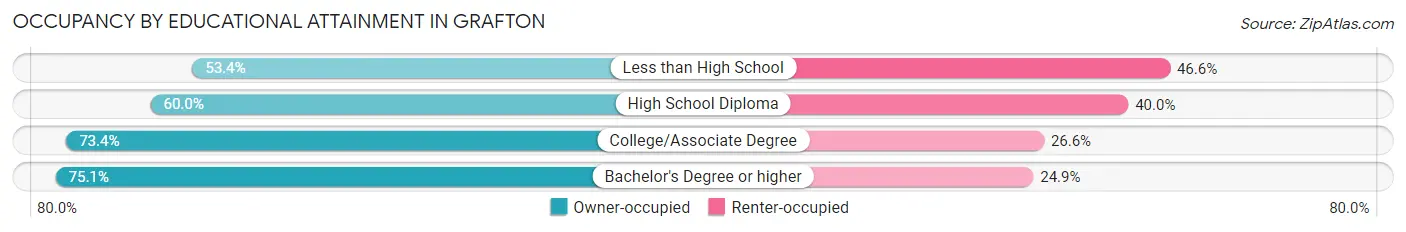
| Household Size | Owner-occupied | Renter-occupied |
| Less than High School | 102 (53.4%) | 89 (46.6%) |
| High School Diploma | 482 (60.0%) | 321 (40.0%) |
| College/Associate Degree | 320 (73.4%) | 116 (26.6%) |
| Bachelor's Degree or higher | 241 (75.1%) | 80 (24.9%) |
Occupancy by Age of Householder in Grafton
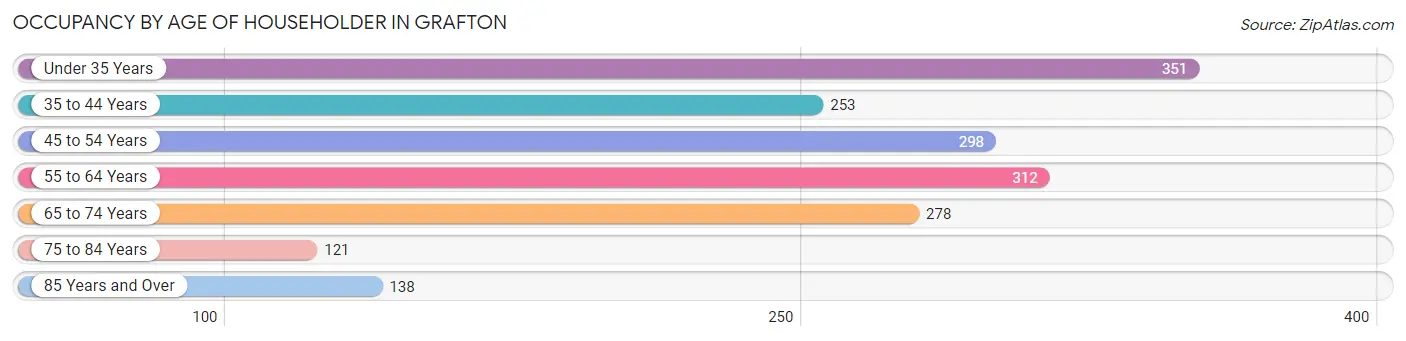
| Age Bracket | # Households | % Households |
| Under 35 Years | 351 | 20.1% |
| 35 to 44 Years | 253 | 14.4% |
| 45 to 54 Years | 298 | 17.0% |
| 55 to 64 Years | 312 | 17.8% |
| 65 to 74 Years | 278 | 15.9% |
| 75 to 84 Years | 121 | 6.9% |
| 85 Years and Over | 138 | 7.9% |
| Total | 1,751 | 100.0% |
Housing Finances in Grafton
Median Income by Occupancy in Grafton
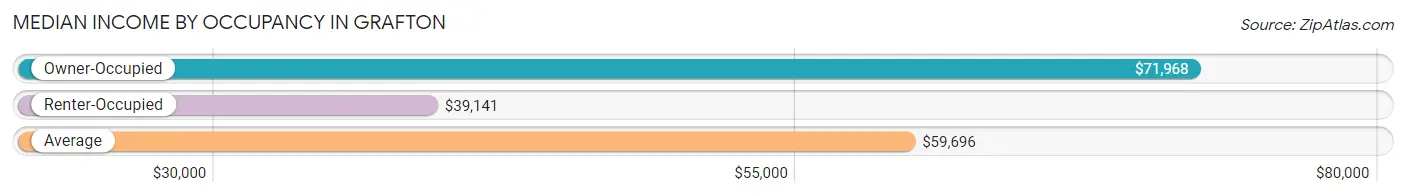
| Occupancy Type | # Households | Median Income |
| Owner-Occupied | 1,145 (65.4%) | $71,968 |
| Renter-Occupied | 606 (34.6%) | $39,141 |
| Average | 1,751 (100.0%) | $59,696 |
Occupancy by Householder Income Bracket in Grafton
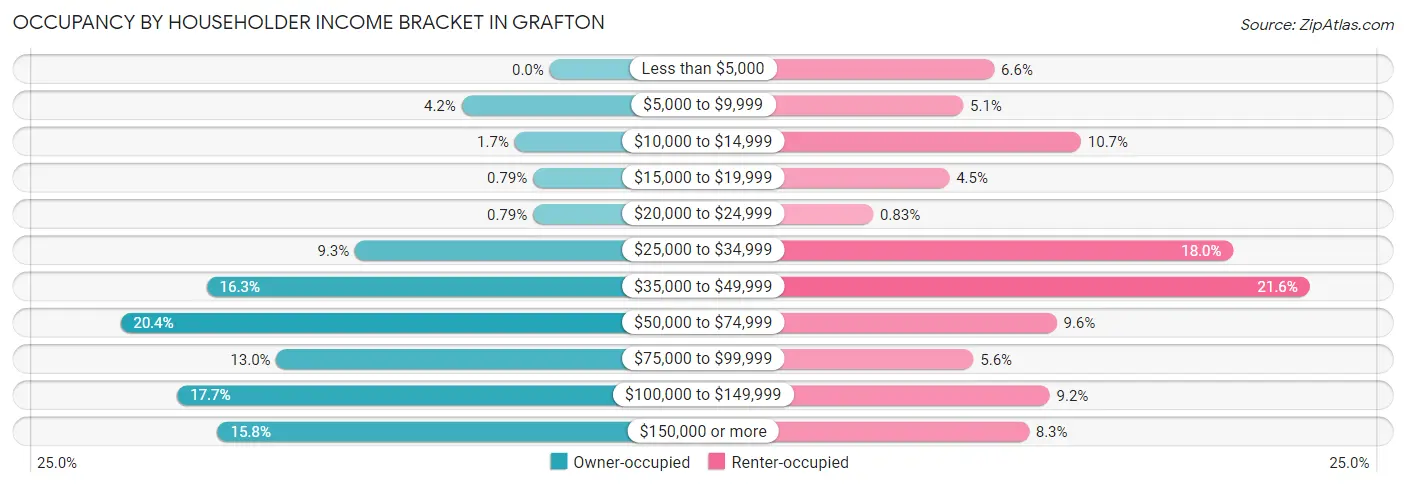
| Income Bracket | Owner-occupied | Renter-occupied |
| Less than $5,000 | 0 (0.0%) | 40 (6.6%) |
| $5,000 to $9,999 | 48 (4.2%) | 31 (5.1%) |
| $10,000 to $14,999 | 19 (1.7%) | 65 (10.7%) |
| $15,000 to $19,999 | 9 (0.8%) | 27 (4.5%) |
| $20,000 to $24,999 | 9 (0.8%) | 5 (0.8%) |
| $25,000 to $34,999 | 106 (9.3%) | 109 (18.0%) |
| $35,000 to $49,999 | 187 (16.3%) | 131 (21.6%) |
| $50,000 to $74,999 | 234 (20.4%) | 58 (9.6%) |
| $75,000 to $99,999 | 149 (13.0%) | 34 (5.6%) |
| $100,000 to $149,999 | 203 (17.7%) | 56 (9.2%) |
| $150,000 or more | 181 (15.8%) | 50 (8.3%) |
| Total | 1,145 (100.0%) | 606 (100.0%) |
Monthly Housing Cost Tiers in Grafton
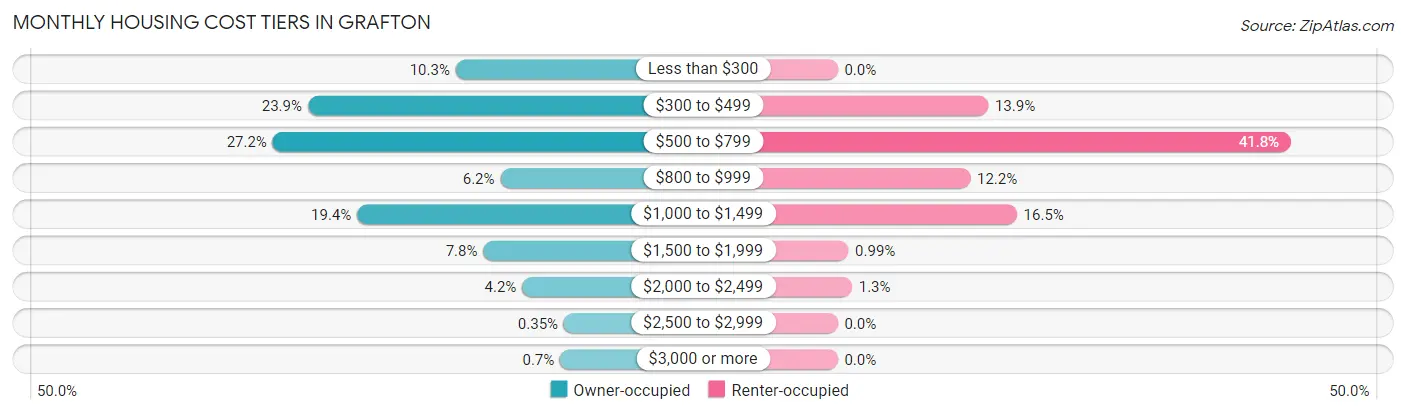
| Monthly Cost | Owner-occupied | Renter-occupied |
| Less than $300 | 118 (10.3%) | 0 (0.0%) |
| $300 to $499 | 274 (23.9%) | 84 (13.9%) |
| $500 to $799 | 311 (27.2%) | 253 (41.7%) |
| $800 to $999 | 71 (6.2%) | 74 (12.2%) |
| $1,000 to $1,499 | 222 (19.4%) | 100 (16.5%) |
| $1,500 to $1,999 | 89 (7.8%) | 6 (1.0%) |
| $2,000 to $2,499 | 48 (4.2%) | 8 (1.3%) |
| $2,500 to $2,999 | 4 (0.4%) | 0 (0.0%) |
| $3,000 or more | 8 (0.7%) | 0 (0.0%) |
| Total | 1,145 (100.0%) | 606 (100.0%) |
Physical Housing Characteristics in Grafton
Housing Structures in Grafton
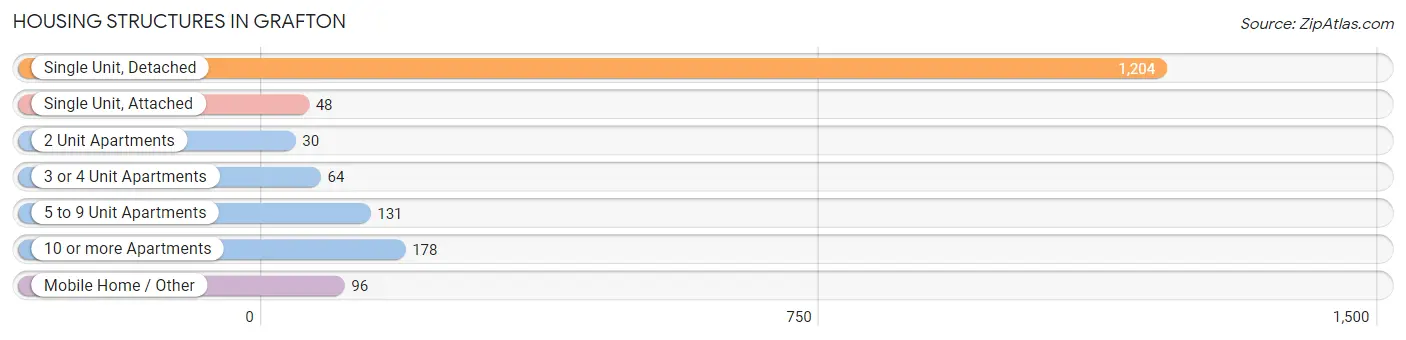
| Structure Type | # Housing Units | % Housing Units |
| Single Unit, Detached | 1,204 | 68.8% |
| Single Unit, Attached | 48 | 2.7% |
| 2 Unit Apartments | 30 | 1.7% |
| 3 or 4 Unit Apartments | 64 | 3.7% |
| 5 to 9 Unit Apartments | 131 | 7.5% |
| 10 or more Apartments | 178 | 10.2% |
| Mobile Home / Other | 96 | 5.5% |
| Total | 1,751 | 100.0% |
Housing Structures by Occupancy in Grafton
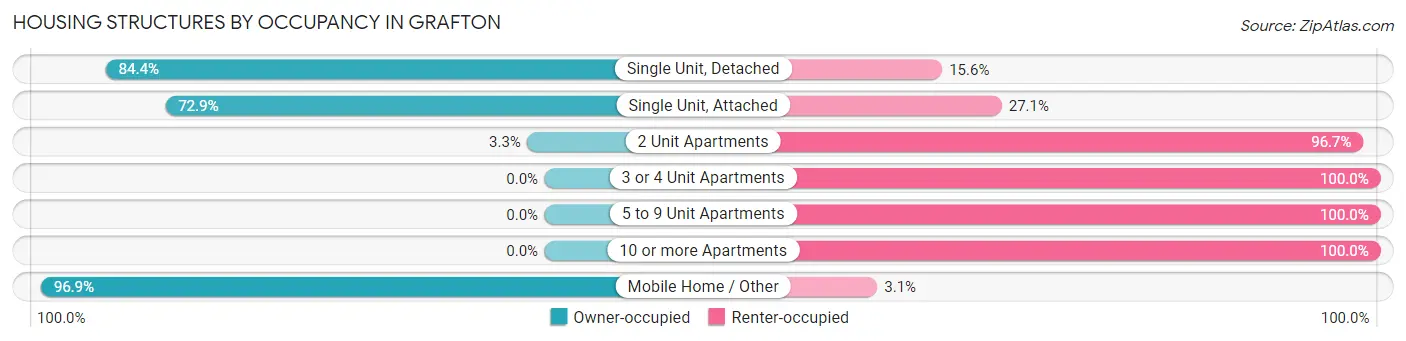
| Structure Type | Owner-occupied | Renter-occupied |
| Single Unit, Detached | 1,016 (84.4%) | 188 (15.6%) |
| Single Unit, Attached | 35 (72.9%) | 13 (27.1%) |
| 2 Unit Apartments | 1 (3.3%) | 29 (96.7%) |
| 3 or 4 Unit Apartments | 0 (0.0%) | 64 (100.0%) |
| 5 to 9 Unit Apartments | 0 (0.0%) | 131 (100.0%) |
| 10 or more Apartments | 0 (0.0%) | 178 (100.0%) |
| Mobile Home / Other | 93 (96.9%) | 3 (3.1%) |
| Total | 1,145 (65.4%) | 606 (34.6%) |
Housing Structures by Number of Rooms in Grafton
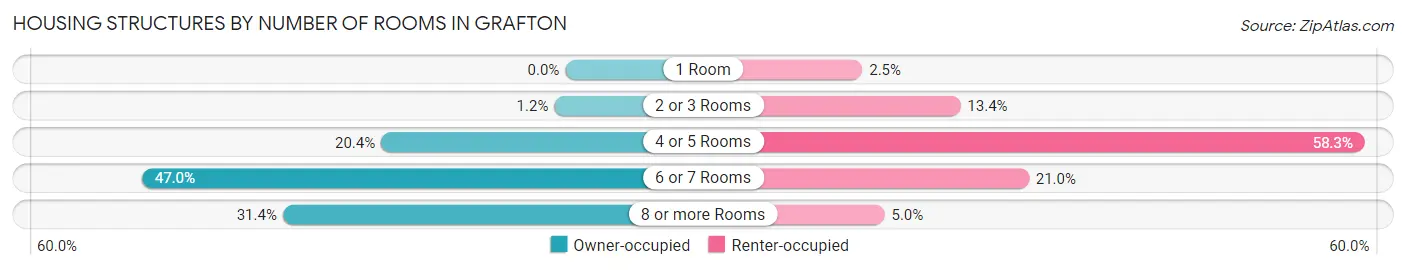
| Number of Rooms | Owner-occupied | Renter-occupied |
| 1 Room | 0 (0.0%) | 15 (2.5%) |
| 2 or 3 Rooms | 14 (1.2%) | 81 (13.4%) |
| 4 or 5 Rooms | 234 (20.4%) | 353 (58.3%) |
| 6 or 7 Rooms | 538 (47.0%) | 127 (21.0%) |
| 8 or more Rooms | 359 (31.4%) | 30 (5.0%) |
| Total | 1,145 (100.0%) | 606 (100.0%) |
Housing Structure by Heating Type in Grafton
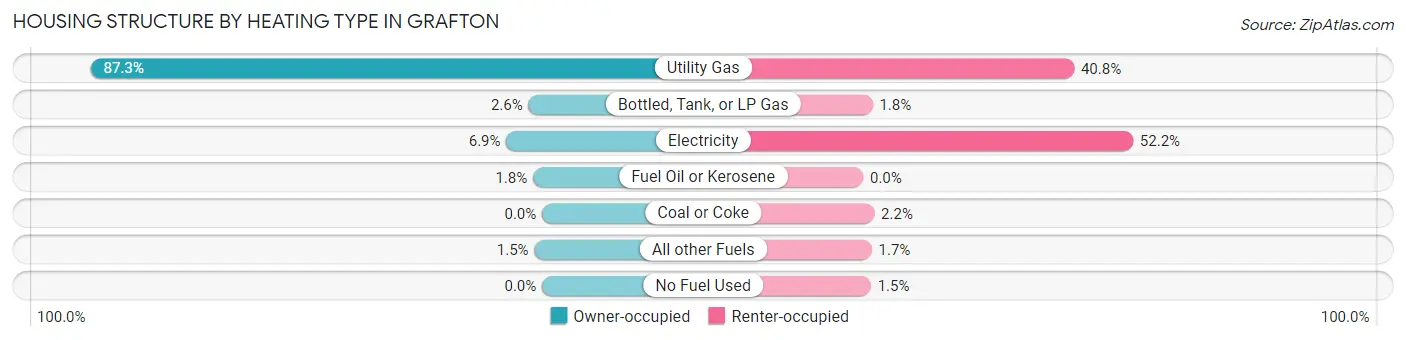
| Heating Type | Owner-occupied | Renter-occupied |
| Utility Gas | 999 (87.3%) | 247 (40.8%) |
| Bottled, Tank, or LP Gas | 30 (2.6%) | 11 (1.8%) |
| Electricity | 79 (6.9%) | 316 (52.1%) |
| Fuel Oil or Kerosene | 20 (1.8%) | 0 (0.0%) |
| Coal or Coke | 0 (0.0%) | 13 (2.1%) |
| All other Fuels | 17 (1.5%) | 10 (1.7%) |
| No Fuel Used | 0 (0.0%) | 9 (1.5%) |
| Total | 1,145 (100.0%) | 606 (100.0%) |
Household Vehicle Usage in Grafton
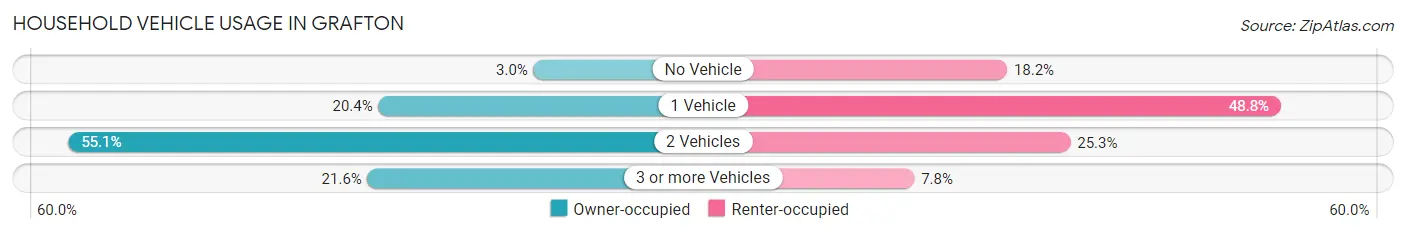
| Vehicles per Household | Owner-occupied | Renter-occupied |
| No Vehicle | 34 (3.0%) | 110 (18.1%) |
| 1 Vehicle | 233 (20.3%) | 296 (48.8%) |
| 2 Vehicles | 631 (55.1%) | 153 (25.3%) |
| 3 or more Vehicles | 247 (21.6%) | 47 (7.8%) |
| Total | 1,145 (100.0%) | 606 (100.0%) |
Real Estate & Mortgages in Grafton
Real Estate and Mortgage Overview in Grafton
| Characteristic | Without Mortgage | With Mortgage |
| Housing Units | 700 | 445 |
| Median Property Value | $79,600 | $174,100 |
| Median Household Income | $70,324 | $61 |
| Monthly Housing Costs | $484 | $0 |
| Real Estate Taxes | $1,441 | $31 |
Property Value by Mortgage Status in Grafton
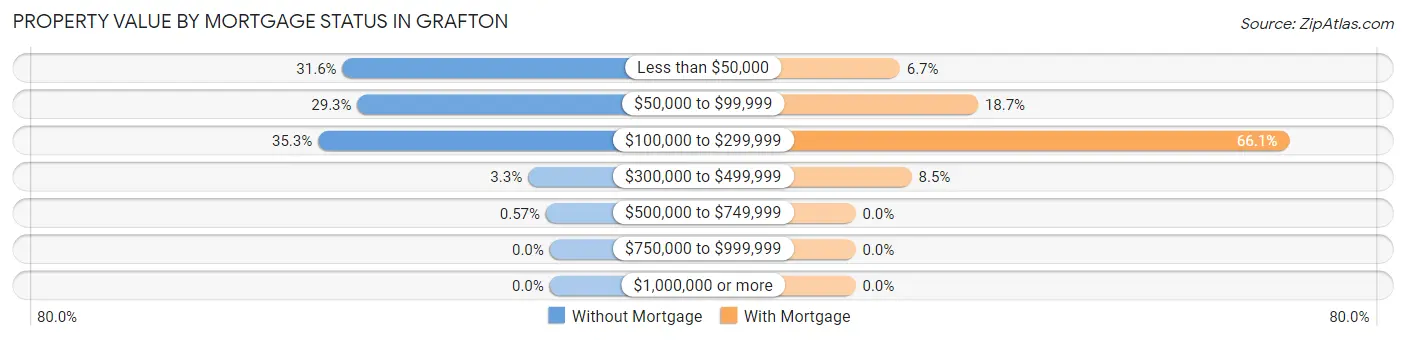
| Property Value | Without Mortgage | With Mortgage |
| Less than $50,000 | 221 (31.6%) | 30 (6.7%) |
| $50,000 to $99,999 | 205 (29.3%) | 83 (18.6%) |
| $100,000 to $299,999 | 247 (35.3%) | 294 (66.1%) |
| $300,000 to $499,999 | 23 (3.3%) | 38 (8.5%) |
| $500,000 to $749,999 | 4 (0.6%) | 0 (0.0%) |
| $750,000 to $999,999 | 0 (0.0%) | 0 (0.0%) |
| $1,000,000 or more | 0 (0.0%) | 0 (0.0%) |
| Total | 700 (100.0%) | 445 (100.0%) |
Household Income by Mortgage Status in Grafton
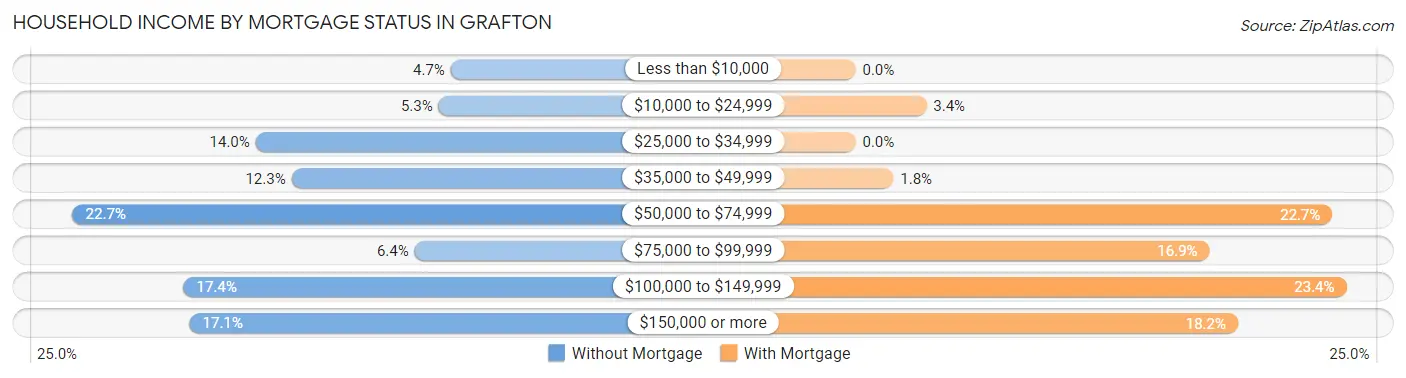
| Household Income | Without Mortgage | With Mortgage |
| Less than $10,000 | 33 (4.7%) | 0 (0.0%) |
| $10,000 to $24,999 | 37 (5.3%) | 15 (3.4%) |
| $25,000 to $34,999 | 98 (14.0%) | 0 (0.0%) |
| $35,000 to $49,999 | 86 (12.3%) | 8 (1.8%) |
| $50,000 to $74,999 | 159 (22.7%) | 101 (22.7%) |
| $75,000 to $99,999 | 45 (6.4%) | 75 (16.9%) |
| $100,000 to $149,999 | 122 (17.4%) | 104 (23.4%) |
| $150,000 or more | 120 (17.1%) | 81 (18.2%) |
| Total | 700 (100.0%) | 445 (100.0%) |
Property Value to Household Income Ratio in Grafton
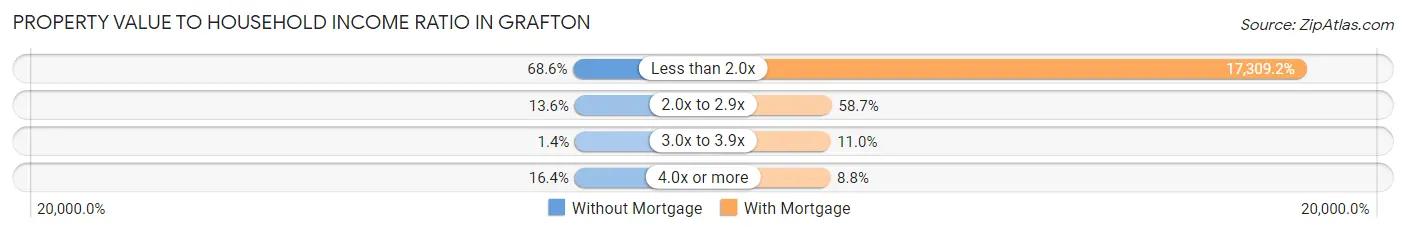
| Value-to-Income Ratio | Without Mortgage | With Mortgage |
| Less than 2.0x | 480 (68.6%) | 77,026 (17,309.2%) |
| 2.0x to 2.9x | 95 (13.6%) | 261 (58.7%) |
| 3.0x to 3.9x | 10 (1.4%) | 49 (11.0%) |
| 4.0x or more | 115 (16.4%) | 39 (8.8%) |
| Total | 700 (100.0%) | 445 (100.0%) |
Real Estate Taxes by Mortgage Status in Grafton
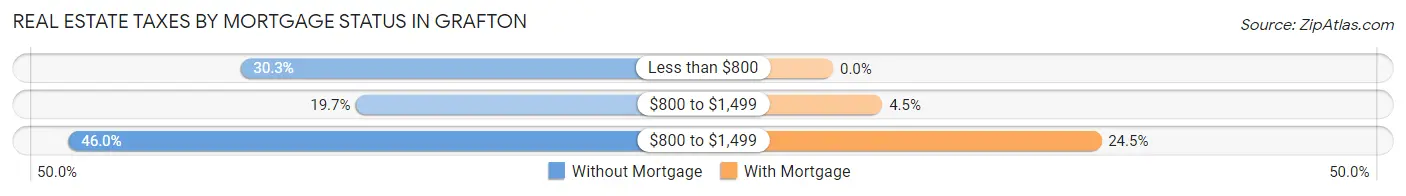
| Property Taxes | Without Mortgage | With Mortgage |
| Less than $800 | 212 (30.3%) | 0 (0.0%) |
| $800 to $1,499 | 138 (19.7%) | 20 (4.5%) |
| $800 to $1,499 | 322 (46.0%) | 109 (24.5%) |
| Total | 700 (100.0%) | 445 (100.0%) |
Health & Disability in Grafton
Health Insurance Coverage by Age in Grafton
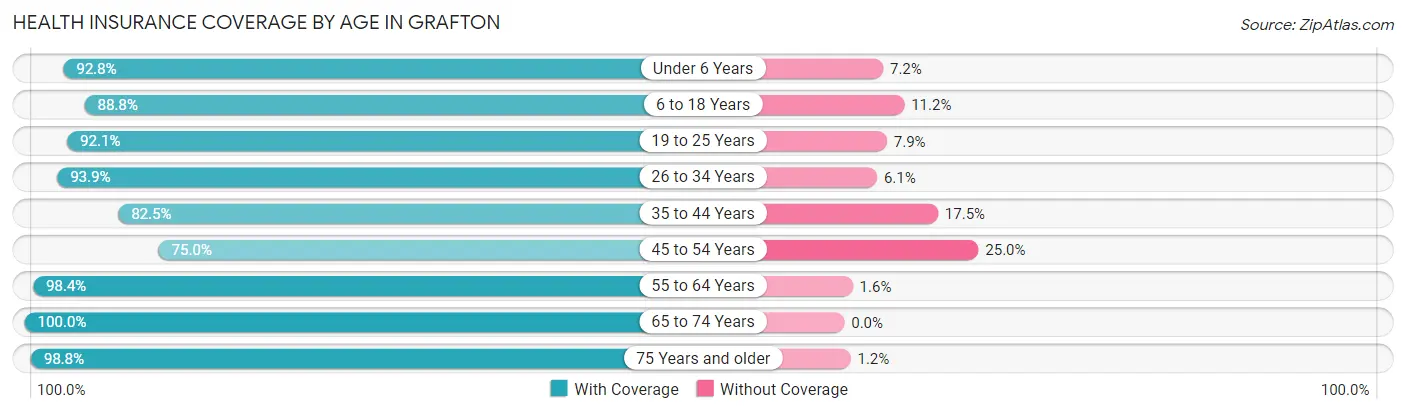
| Age Bracket | With Coverage | Without Coverage |
| Under 6 Years | 180 (92.8%) | 14 (7.2%) |
| 6 to 18 Years | 755 (88.8%) | 95 (11.2%) |
| 19 to 25 Years | 232 (92.1%) | 20 (7.9%) |
| 26 to 34 Years | 432 (93.9%) | 28 (6.1%) |
| 35 to 44 Years | 345 (82.5%) | 73 (17.5%) |
| 45 to 54 Years | 366 (75.0%) | 122 (25.0%) |
| 55 to 64 Years | 567 (98.4%) | 9 (1.6%) |
| 65 to 74 Years | 399 (100.0%) | 0 (0.0%) |
| 75 Years and older | 340 (98.8%) | 4 (1.2%) |
| Total | 3,616 (90.8%) | 365 (9.2%) |
Health Insurance Coverage by Citizenship Status in Grafton
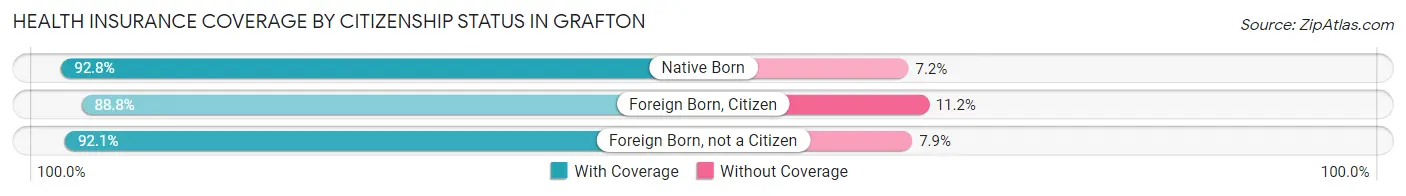
| Citizenship Status | With Coverage | Without Coverage |
| Native Born | 180 (92.8%) | 14 (7.2%) |
| Foreign Born, Citizen | 755 (88.8%) | 95 (11.2%) |
| Foreign Born, not a Citizen | 232 (92.1%) | 20 (7.9%) |
Health Insurance Coverage by Household Income in Grafton
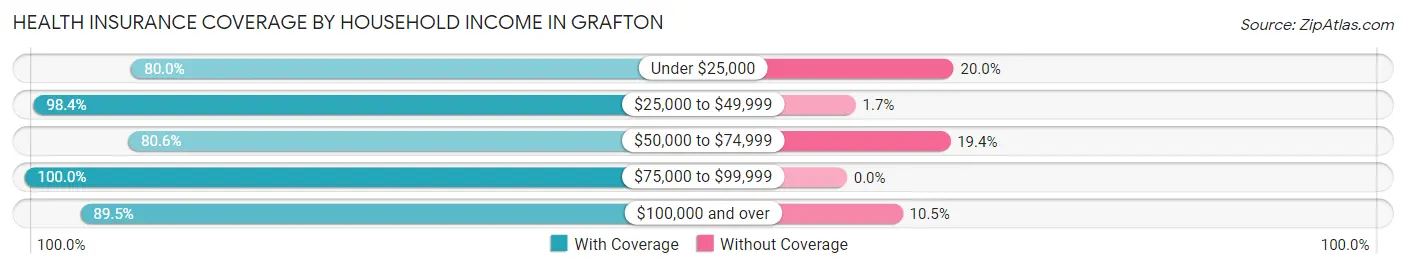
| Household Income | With Coverage | Without Coverage |
| Under $25,000 | 244 (80.0%) | 61 (20.0%) |
| $25,000 to $49,999 | 773 (98.4%) | 13 (1.7%) |
| $50,000 to $74,999 | 466 (80.6%) | 112 (19.4%) |
| $75,000 to $99,999 | 408 (100.0%) | 0 (0.0%) |
| $100,000 and over | 1,533 (89.5%) | 179 (10.5%) |
Public vs Private Health Insurance Coverage by Age in Grafton
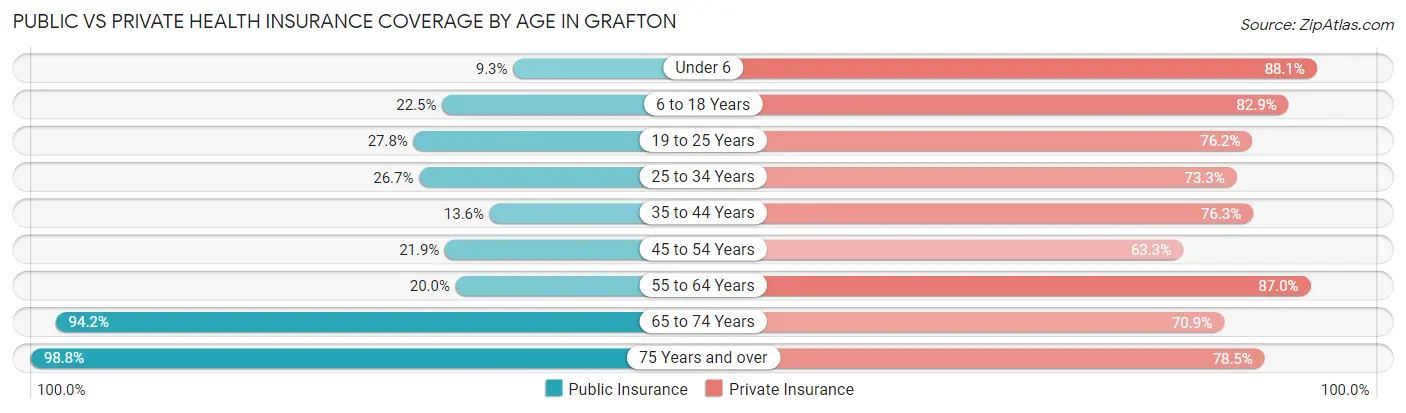
| Age Bracket | Public Insurance | Private Insurance |
| Under 6 | 18 (9.3%) | 171 (88.1%) |
| 6 to 18 Years | 191 (22.5%) | 705 (82.9%) |
| 19 to 25 Years | 70 (27.8%) | 192 (76.2%) |
| 25 to 34 Years | 123 (26.7%) | 337 (73.3%) |
| 35 to 44 Years | 57 (13.6%) | 319 (76.3%) |
| 45 to 54 Years | 107 (21.9%) | 309 (63.3%) |
| 55 to 64 Years | 115 (20.0%) | 501 (87.0%) |
| 65 to 74 Years | 376 (94.2%) | 283 (70.9%) |
| 75 Years and over | 340 (98.8%) | 270 (78.5%) |
| Total | 1,397 (35.1%) | 3,087 (77.5%) |
Disability Status by Sex by Age in Grafton
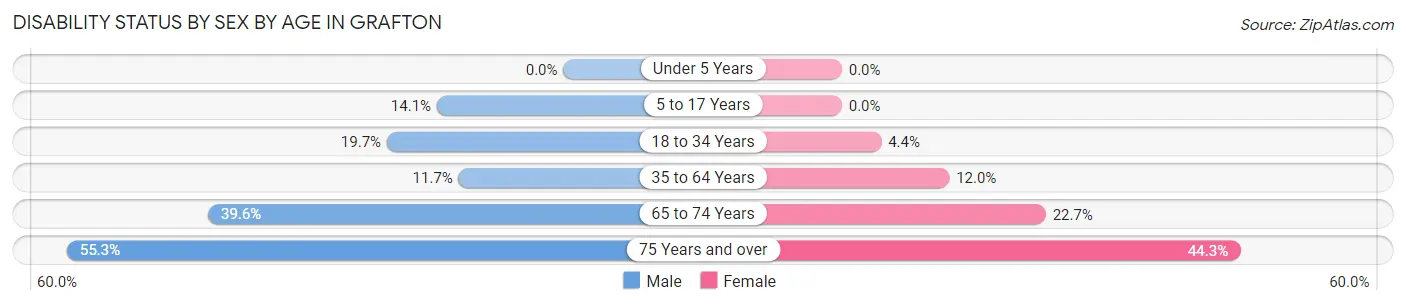
| Age Bracket | Male | Female |
| Under 5 Years | 0 (0.0%) | 0 (0.0%) |
| 5 to 17 Years | 59 (14.1%) | 0 (0.0%) |
| 18 to 34 Years | 78 (19.7%) | 17 (4.4%) |
| 35 to 64 Years | 87 (11.7%) | 88 (12.0%) |
| 65 to 74 Years | 76 (39.6%) | 47 (22.7%) |
| 75 Years and over | 73 (55.3%) | 94 (44.3%) |
Disability Class by Sex by Age in Grafton
Disability Class: Hearing Difficulty
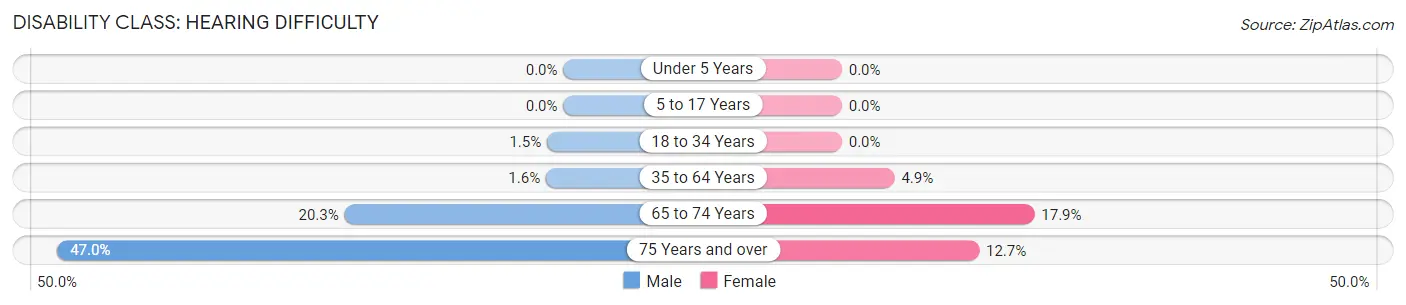
| Age Bracket | Male | Female |
| Under 5 Years | 0 (0.0%) | 0 (0.0%) |
| 5 to 17 Years | 0 (0.0%) | 0 (0.0%) |
| 18 to 34 Years | 6 (1.5%) | 0 (0.0%) |
| 35 to 64 Years | 12 (1.6%) | 36 (4.9%) |
| 65 to 74 Years | 39 (20.3%) | 37 (17.9%) |
| 75 Years and over | 62 (47.0%) | 27 (12.7%) |
Disability Class: Vision Difficulty
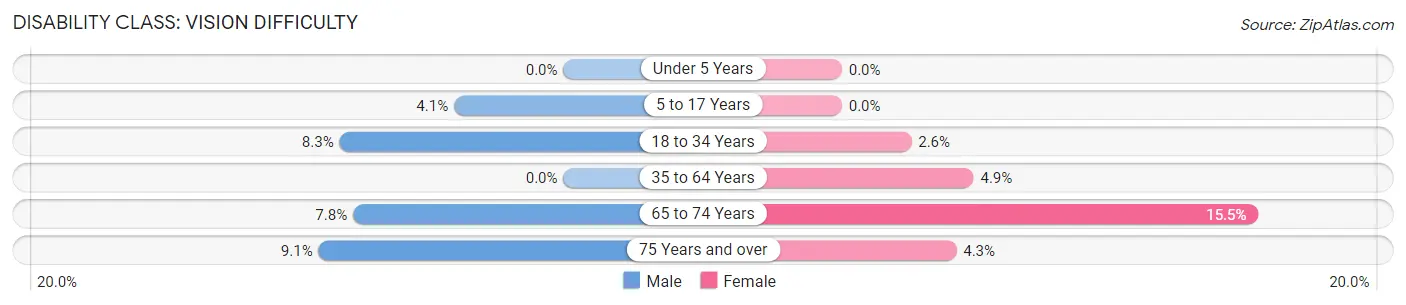
| Age Bracket | Male | Female |
| Under 5 Years | 0 (0.0%) | 0 (0.0%) |
| 5 to 17 Years | 17 (4.1%) | 0 (0.0%) |
| 18 to 34 Years | 33 (8.3%) | 10 (2.6%) |
| 35 to 64 Years | 0 (0.0%) | 36 (4.9%) |
| 65 to 74 Years | 15 (7.8%) | 32 (15.5%) |
| 75 Years and over | 12 (9.1%) | 9 (4.3%) |
Disability Class: Cognitive Difficulty
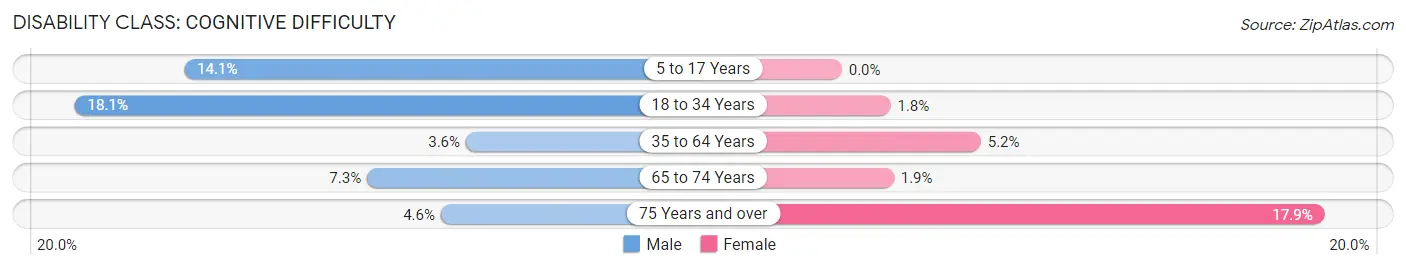
| Age Bracket | Male | Female |
| 5 to 17 Years | 59 (14.1%) | 0 (0.0%) |
| 18 to 34 Years | 72 (18.1%) | 7 (1.8%) |
| 35 to 64 Years | 27 (3.6%) | 38 (5.2%) |
| 65 to 74 Years | 14 (7.3%) | 4 (1.9%) |
| 75 Years and over | 6 (4.5%) | 38 (17.9%) |
Disability Class: Ambulatory Difficulty
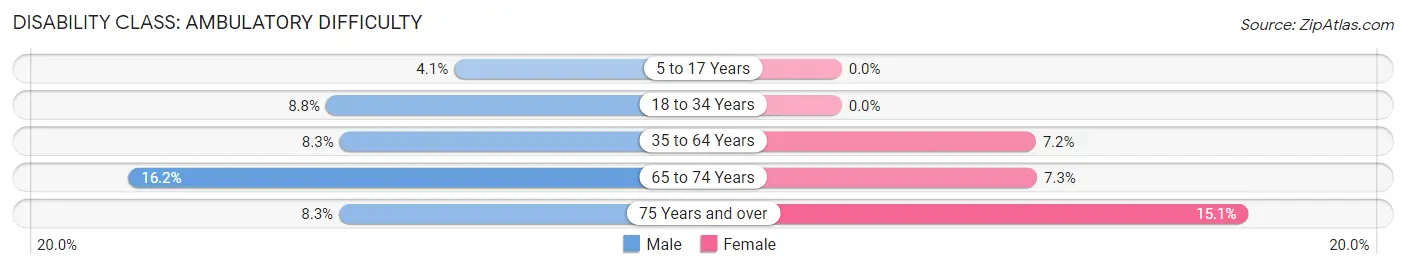
| Age Bracket | Male | Female |
| 5 to 17 Years | 17 (4.1%) | 0 (0.0%) |
| 18 to 34 Years | 35 (8.8%) | 0 (0.0%) |
| 35 to 64 Years | 62 (8.3%) | 53 (7.2%) |
| 65 to 74 Years | 31 (16.2%) | 15 (7.2%) |
| 75 Years and over | 11 (8.3%) | 32 (15.1%) |
Disability Class: Self-Care Difficulty
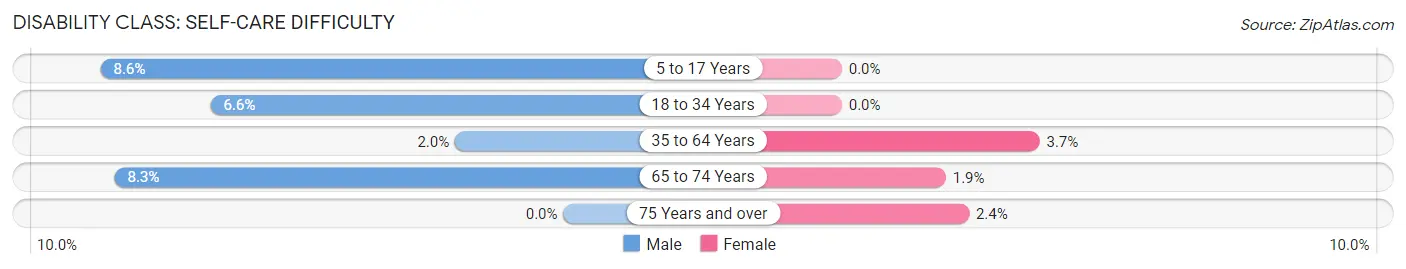
| Age Bracket | Male | Female |
| 5 to 17 Years | 36 (8.6%) | 0 (0.0%) |
| 18 to 34 Years | 26 (6.6%) | 0 (0.0%) |
| 35 to 64 Years | 15 (2.0%) | 27 (3.7%) |
| 65 to 74 Years | 16 (8.3%) | 4 (1.9%) |
| 75 Years and over | 0 (0.0%) | 5 (2.4%) |
Technology Access in Grafton
Computing Device Access in Grafton
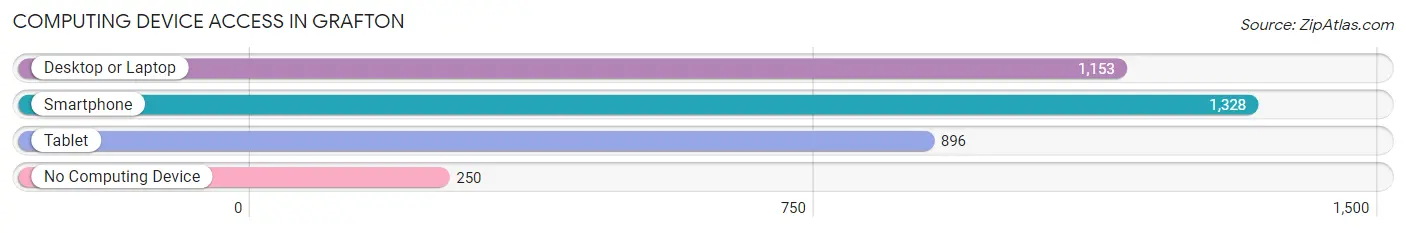
| Device Type | # Households | % Households |
| Desktop or Laptop | 1,153 | 65.8% |
| Smartphone | 1,328 | 75.8% |
| Tablet | 896 | 51.2% |
| No Computing Device | 250 | 14.3% |
| Total | 1,751 | 100.0% |
Internet Access in Grafton
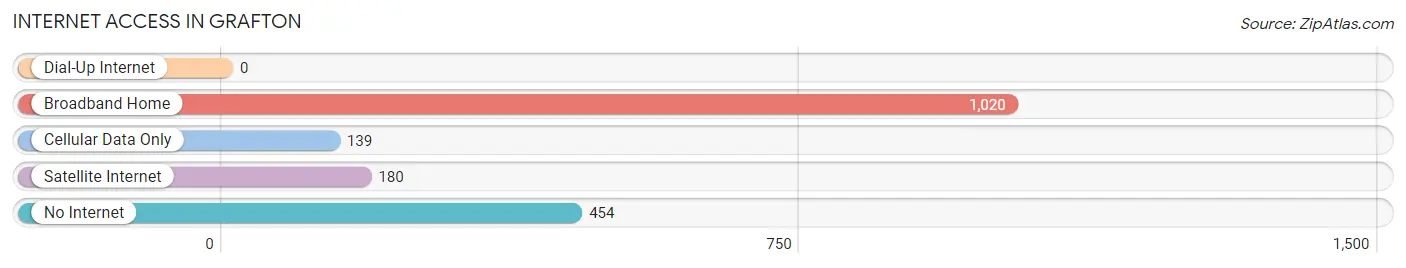
| Internet Type | # Households | % Households |
| Dial-Up Internet | 0 | 0.0% |
| Broadband Home | 1,020 | 58.3% |
| Cellular Data Only | 139 | 7.9% |
| Satellite Internet | 180 | 10.3% |
| No Internet | 454 | 25.9% |
| Total | 1,751 | 100.0% |
Grafton Summary
Grafton is a city located in Walsh County, North Dakota, United States. It is the county seat of Walsh County. The population was 2,876 at the 2010 census. Grafton is located along the Red River of the North, which forms the border between North Dakota and Minnesota.
Geography
Grafton is located at 48°37′N 97°24′W (48.619, -97.400). According to the United States Census Bureau, the city has a total area of 2.2 square miles (5.7 km2), all of it land.
History
Grafton was founded in 1881 by the Northern Pacific Railway. It was named after Grafton County, New Hampshire, the birthplace of a railroad official. The city was incorporated in 1883.
Grafton was the site of a major battle between the Sioux and the United States Army in 1863. The battle, known as the Battle of Dead Buffalo Lake, was part of the U.S. government's effort to force the Sioux onto reservations.
Economy
Grafton's economy is largely based on agriculture and manufacturing. The city is home to several large grain elevators, as well as a number of manufacturing plants. The city is also home to a number of retail stores, restaurants, and other businesses.
Demographics
As of the census of 2010, there were 2,876 people, 1,214 households, and 717 families residing in the city. The population density was 1,303.6 people per square mile (502.7/km2). There were 1,314 housing units at an average density of 590.9 per square mile (228.2/km2). The racial makeup of the city was 97.2% White, 0.3% African American, 0.7% Native American, 0.3% Asian, 0.1% Pacific Islander, 0.3% from other races, and 1.2% from two or more races. Hispanic or Latino of any race were 1.2% of the population.
There were 1,214 households, out of which 28.2% had children under the age of 18 living with them, 46.2% were married couples living together, 10.2% had a female householder with no husband present, and 39.2% were non-families. 34.2% of all households were made up of individuals, and 16.2% had someone living alone who was 65 years of age or older. The average household size was 2.30 and the average family size was 2.97.
In the city, the population was spread out, with 24.2% under the age of 18, 7.7% from 18 to 24, 25.2% from 25 to 44, 22.3% from 45 to 64, and 20.6% who were 65 years of age or older. The median age was 40 years. For every 100 females, there were 91.2 males. For every 100 females age 18 and over, there were 87.2 males.
The median income for a household in the city was $31,944, and the median income for a family was $41,944. Males had a median income of $30,944 versus $20,944 for females. The per capita income for the city was $17,944. About 8.2% of families and 11.2% of the population were below the poverty line, including 14.2% of those under age 18 and 8.2% of those age 65 or over.
Common Questions
What is Per Capita Income in Grafton?
Per Capita income in Grafton is $37,187.
What is the Median Family Income in Grafton?
Median Family Income in Grafton is $72,361.
What is the Median Household income in Grafton?
Median Household Income in Grafton is $59,696.
What is Income or Wage Gap in Grafton?
Income or Wage Gap in Grafton is 24.4%.
Women in Grafton earn 75.6 cents for every dollar earned by a man.
What is Inequality or Gini Index in Grafton?
Inequality or Gini Index in Grafton is 0.48.
What is the Total Population of Grafton?
Total Population of Grafton is 4,161.
What is the Total Male Population of Grafton?
Total Male Population of Grafton is 2,069.
What is the Total Female Population of Grafton?
Total Female Population of Grafton is 2,092.
What is the Ratio of Males per 100 Females in Grafton?
There are 98.90 Males per 100 Females in Grafton.
What is the Ratio of Females per 100 Males in Grafton?
There are 101.11 Females per 100 Males in Grafton.
What is the Median Population Age in Grafton?
Median Population Age in Grafton is 40.4 Years.
What is the Average Family Size in Grafton
Average Family Size in Grafton is 3.0 People.
What is the Average Household Size in Grafton
Average Household Size in Grafton is 2.2 People.
How Large is the Labor Force in Grafton?
There are 2,205 People in the Labor Forcein in Grafton.
What is the Percentage of People in the Labor Force in Grafton?
67.4% of People are in the Labor Force in Grafton.
What is the Unemployment Rate in Grafton?
Unemployment Rate in Grafton is 3.3%.