New Town, ND Map & Demographics
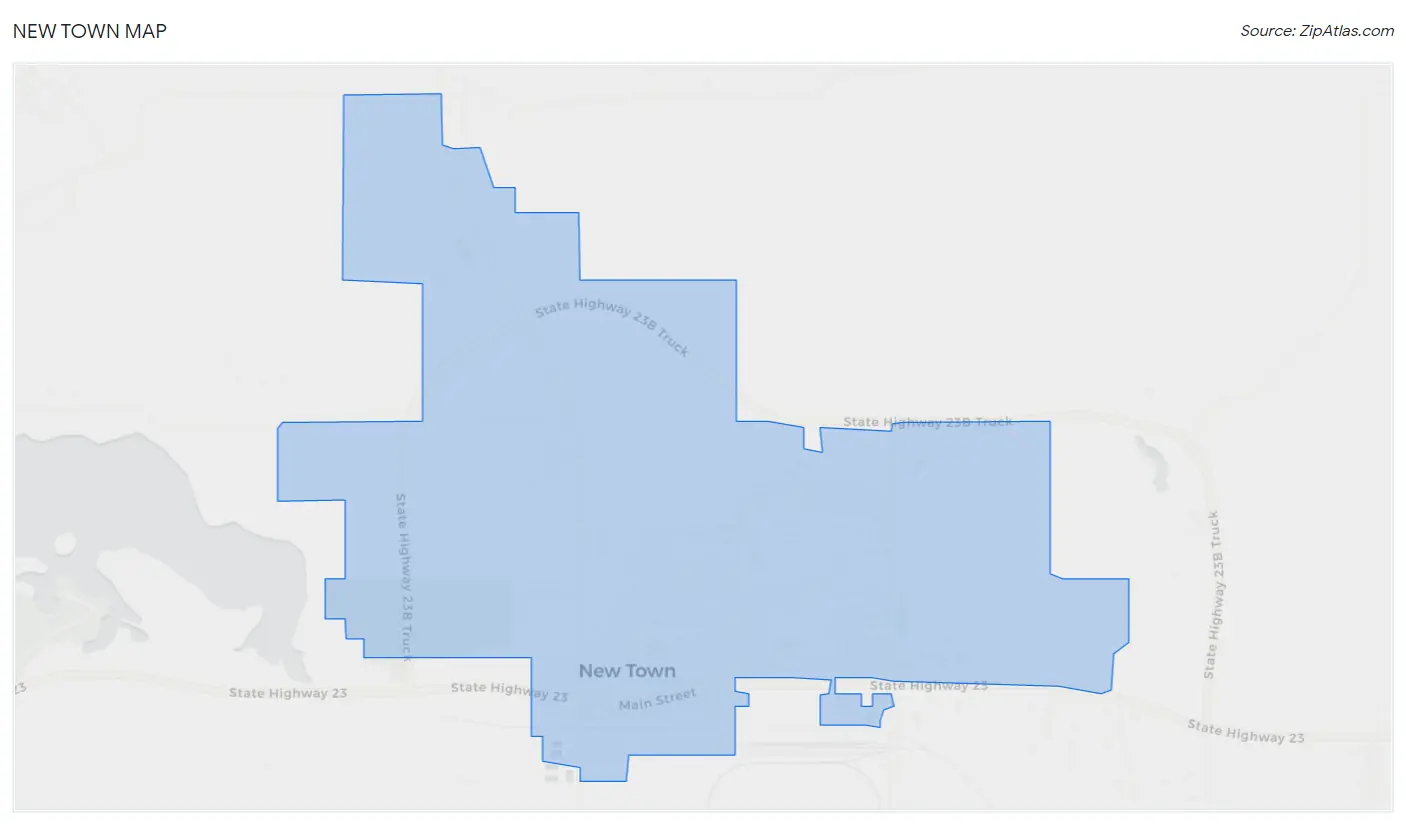
New Town Map
New Town Overview
$23,263
PER CAPITA INCOME
$59,792
AVG FAMILY INCOME
$56,176
AVG HOUSEHOLD INCOME
5.2%
WAGE / INCOME GAP [ % ]
94.8¢/ $1
WAGE / INCOME GAP [ $ ]
0.44
INEQUALITY / GINI INDEX
2,714
TOTAL POPULATION
1,329
MALE POPULATION
1,385
FEMALE POPULATION
95.96
MALES / 100 FEMALES
104.21
FEMALES / 100 MALES
28.4
MEDIAN AGE
4.5
AVG FAMILY SIZE
3.2
AVG HOUSEHOLD SIZE
1,122
LABOR FORCE [ PEOPLE ]
61.5%
PERCENT IN LABOR FORCE
3.9%
UNEMPLOYMENT RATE
New Town Zip Codes
New Town Area Codes
Income in New Town
Income Overview in New Town
Per Capita Income in New Town is $23,263, while median incomes of families and households are $59,792 and $56,176 respectively.
| Characteristic | Number | Measure |
| Per Capita Income | 2,714 | $23,263 |
| Median Family Income | 478 | $59,792 |
| Mean Family Income | 478 | $70,424 |
| Median Household Income | 830 | $56,176 |
| Mean Household Income | 830 | $66,029 |
| Income Deficit | 478 | $0 |
| Wage / Income Gap (%) | 2,714 | 5.22% |
| Wage / Income Gap ($) | 2,714 | 94.78¢ per $1 |
| Gini / Inequality Index | 2,714 | 0.44 |
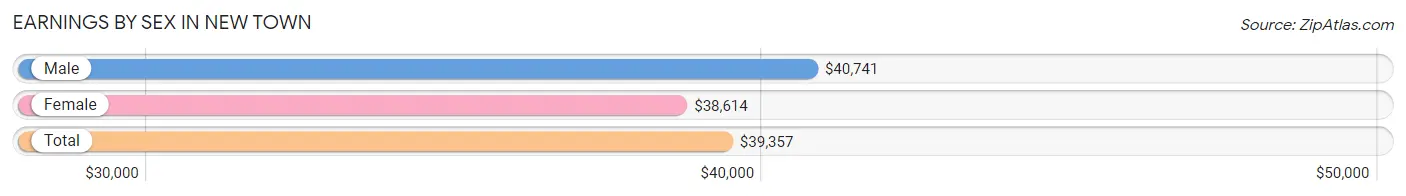
Earnings by Sex in New Town
Average Earnings in New Town are $39,357, $40,741 for men and $38,614 for women, a difference of 5.2%.
| Sex | Number | Average Earnings |
| Male | 606 (51.4%) | $40,741 |
| Female | 573 (48.6%) | $38,614 |
| Total | 1,179 (100.0%) | $39,357 |
Earnings by Sex by Income Bracket in New Town
The most common earnings brackets in New Town are $5,000 to $7,499 for men (75 | 12.4%) and $35,000 to $39,999 for women (65 | 11.3%).
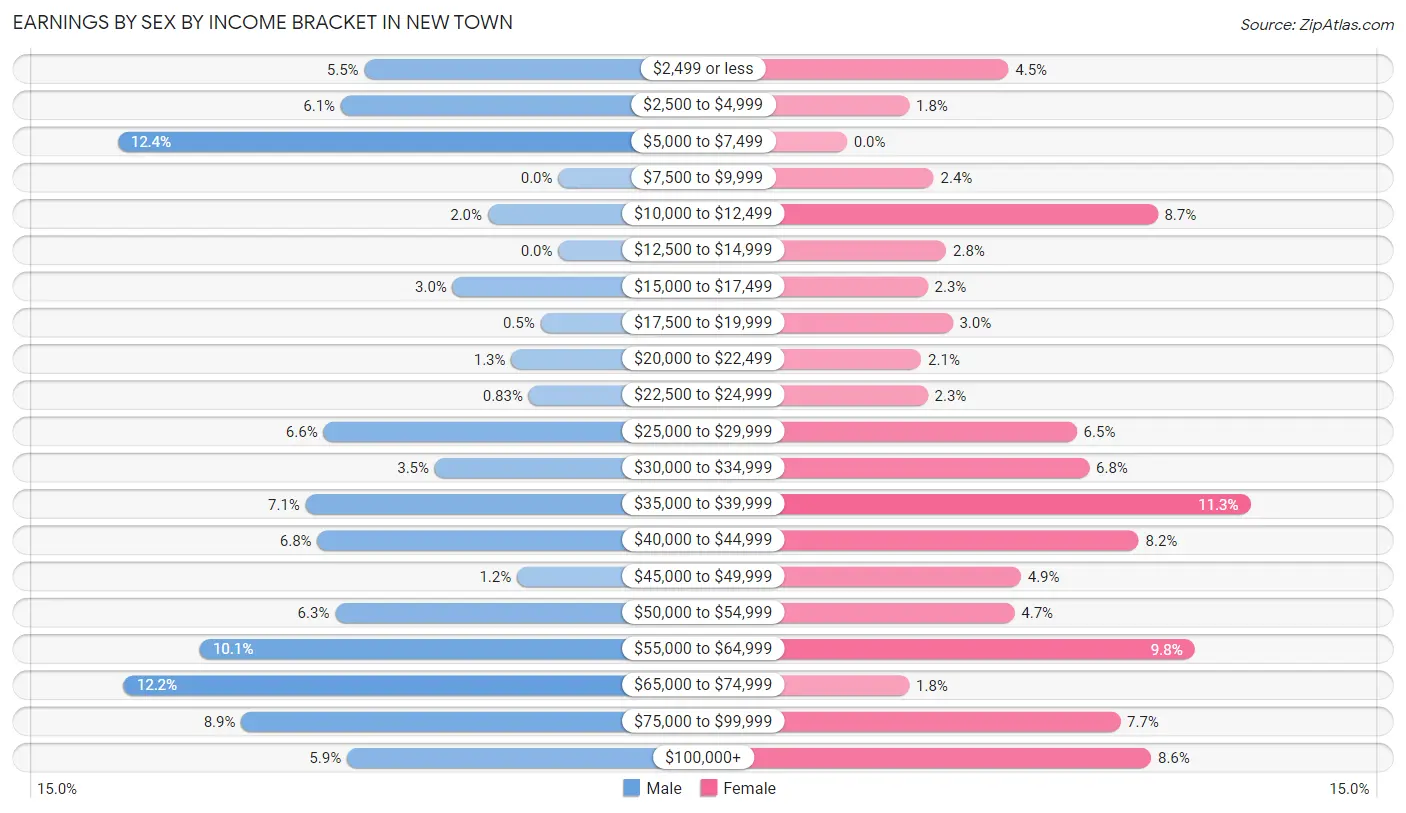
| Income | Male | Female |
| $2,499 or less | 33 (5.4%) | 26 (4.5%) |
| $2,500 to $4,999 | 37 (6.1%) | 10 (1.8%) |
| $5,000 to $7,499 | 75 (12.4%) | 0 (0.0%) |
| $7,500 to $9,999 | 0 (0.0%) | 14 (2.4%) |
| $10,000 to $12,499 | 12 (2.0%) | 50 (8.7%) |
| $12,500 to $14,999 | 0 (0.0%) | 16 (2.8%) |
| $15,000 to $17,499 | 18 (3.0%) | 13 (2.3%) |
| $17,500 to $19,999 | 3 (0.5%) | 17 (3.0%) |
| $20,000 to $22,499 | 8 (1.3%) | 12 (2.1%) |
| $22,500 to $24,999 | 5 (0.8%) | 13 (2.3%) |
| $25,000 to $29,999 | 40 (6.6%) | 37 (6.5%) |
| $30,000 to $34,999 | 21 (3.5%) | 39 (6.8%) |
| $35,000 to $39,999 | 43 (7.1%) | 65 (11.3%) |
| $40,000 to $44,999 | 41 (6.8%) | 47 (8.2%) |
| $45,000 to $49,999 | 7 (1.2%) | 28 (4.9%) |
| $50,000 to $54,999 | 38 (6.3%) | 27 (4.7%) |
| $55,000 to $64,999 | 61 (10.1%) | 56 (9.8%) |
| $65,000 to $74,999 | 74 (12.2%) | 10 (1.8%) |
| $75,000 to $99,999 | 54 (8.9%) | 44 (7.7%) |
| $100,000+ | 36 (5.9%) | 49 (8.6%) |
| Total | 606 (100.0%) | 573 (100.0%) |
Earnings by Sex by Educational Attainment in New Town
Average earnings in New Town are $51,172 for men and $42,750 for women, a difference of 16.5%. Men with an educational attainment of less than high school enjoy the highest average annual earnings of $67,685, while those with high school diploma education earn the least with $42,407. Women with an educational attainment of graduate degree earn the most with the average annual earnings of $51,563, while those with college or associate's degree education have the smallest earnings of $39,129.
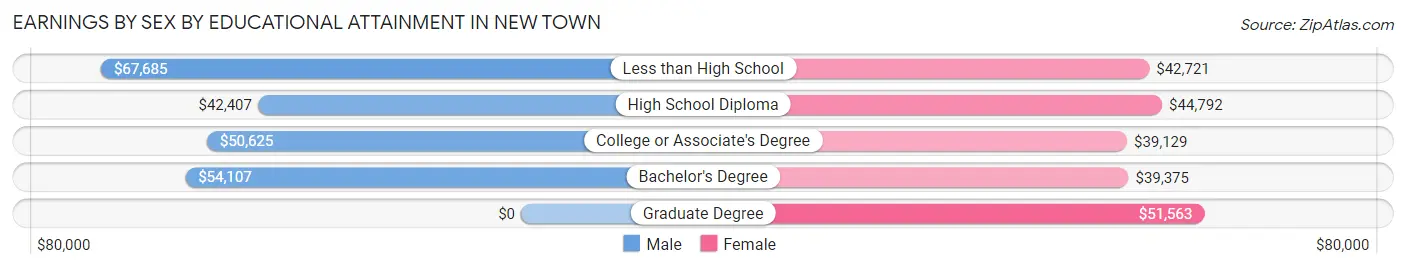
| Educational Attainment | Male Income | Female Income |
| Less than High School | $67,685 | $42,721 |
| High School Diploma | $42,407 | $44,792 |
| College or Associate's Degree | $50,625 | $39,129 |
| Bachelor's Degree | $54,107 | $39,375 |
| Graduate Degree | - | - |
| Total | $51,172 | $42,750 |
Family Income in New Town
Family Income Brackets in New Town
According to the New Town family income data, there are 106 families falling into the $50,000 to $74,999 income range, which is the most common income bracket and makes up 22.2% of all families.
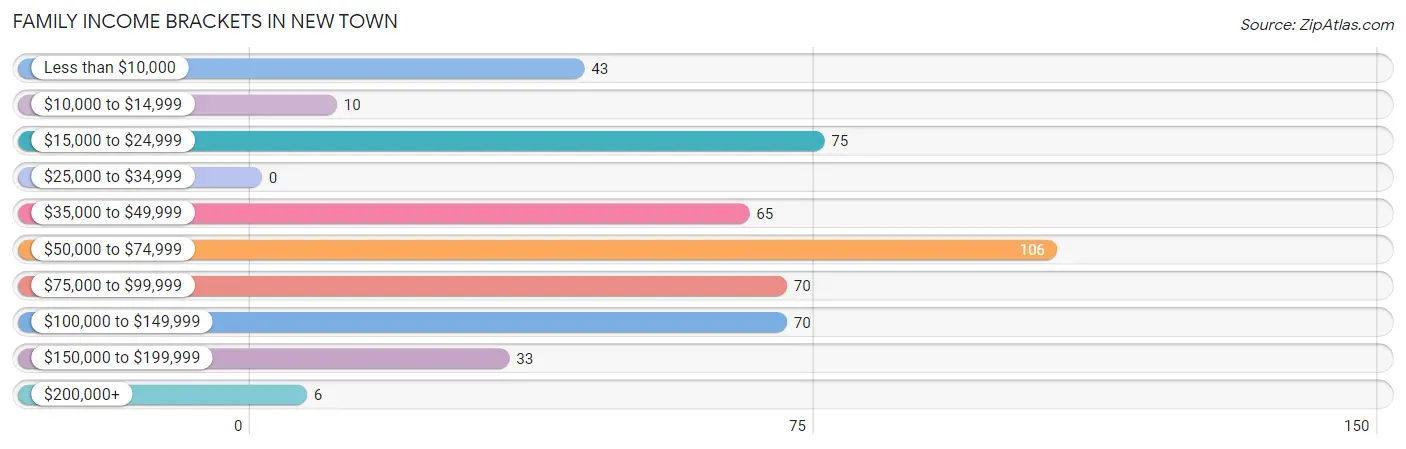
| Income Bracket | # Families | % Families |
| Less than $10,000 | 43 | 9.0% |
| $10,000 to $14,999 | 10 | 2.1% |
| $15,000 to $24,999 | 75 | 15.7% |
| $25,000 to $34,999 | 0 | 0.0% |
| $35,000 to $49,999 | 65 | 13.6% |
| $50,000 to $74,999 | 106 | 22.2% |
| $75,000 to $99,999 | 70 | 14.6% |
| $100,000 to $149,999 | 70 | 14.6% |
| $150,000 to $199,999 | 33 | 6.9% |
| $200,000+ | 6 | 1.3% |
Family Income by Famaliy Size in New Town
3-person families (109 | 22.8%) account for the highest median family income in New Town with $90,938 per family, while 3-person families (109 | 22.8%) have the highest median income of $30,313 per family member.
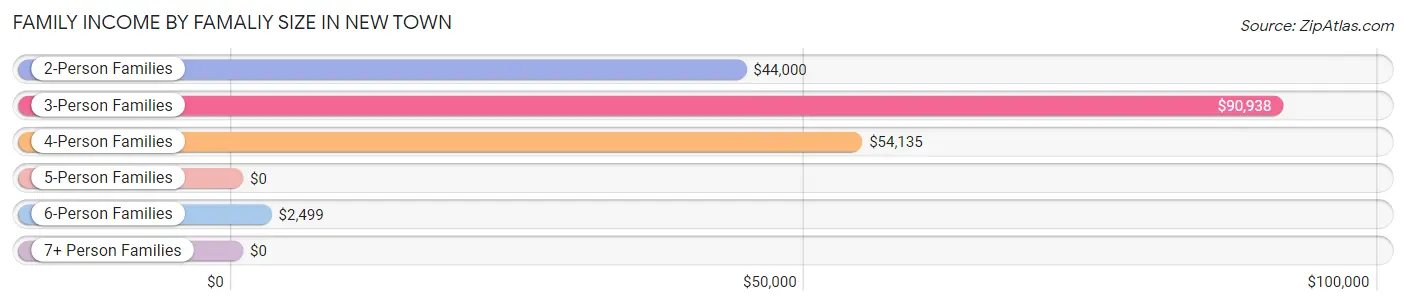
| Income Bracket | # Families | Median Income |
| 2-Person Families | 204 (42.7%) | $44,000 |
| 3-Person Families | 109 (22.8%) | $90,938 |
| 4-Person Families | 61 (12.8%) | $54,135 |
| 5-Person Families | 80 (16.7%) | $0 |
| 6-Person Families | 13 (2.7%) | $2,499 |
| 7+ Person Families | 11 (2.3%) | $0 |
| Total | 478 (100.0%) | $59,792 |
Family Income by Number of Earners in New Town
The median family income in New Town is $59,792, with families comprising 3+ earners (53) having the highest median family income of $136,875, while families with no earners (116) have the lowest median family income of $23,125, accounting for 11.1% and 24.3% of families, respectively.
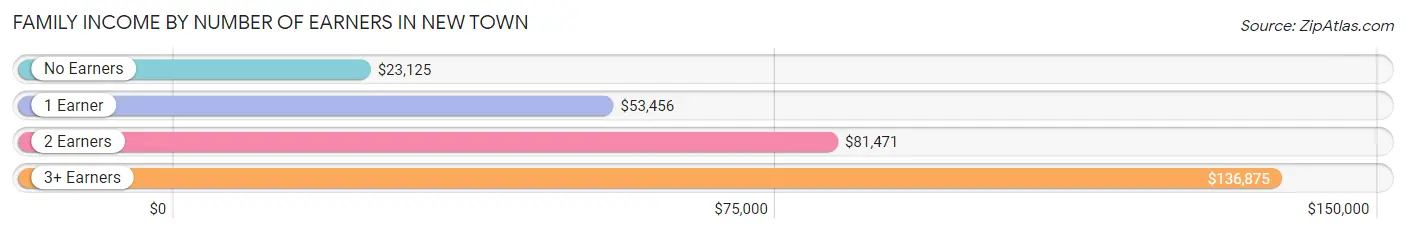
| Number of Earners | # Families | Median Income |
| No Earners | 116 (24.3%) | $23,125 |
| 1 Earner | 159 (33.3%) | $53,456 |
| 2 Earners | 150 (31.4%) | $81,471 |
| 3+ Earners | 53 (11.1%) | $136,875 |
| Total | 478 (100.0%) | $59,792 |
Household Income in New Town
Household Income Brackets in New Town
With 143 households falling in the category, the $100,000 to $149,999 income range is the most frequent in New Town, accounting for 17.2% of all households. In contrast, only 14 households (1.7%) fall into the $25,000 to $34,999 income bracket, making it the least populous group.
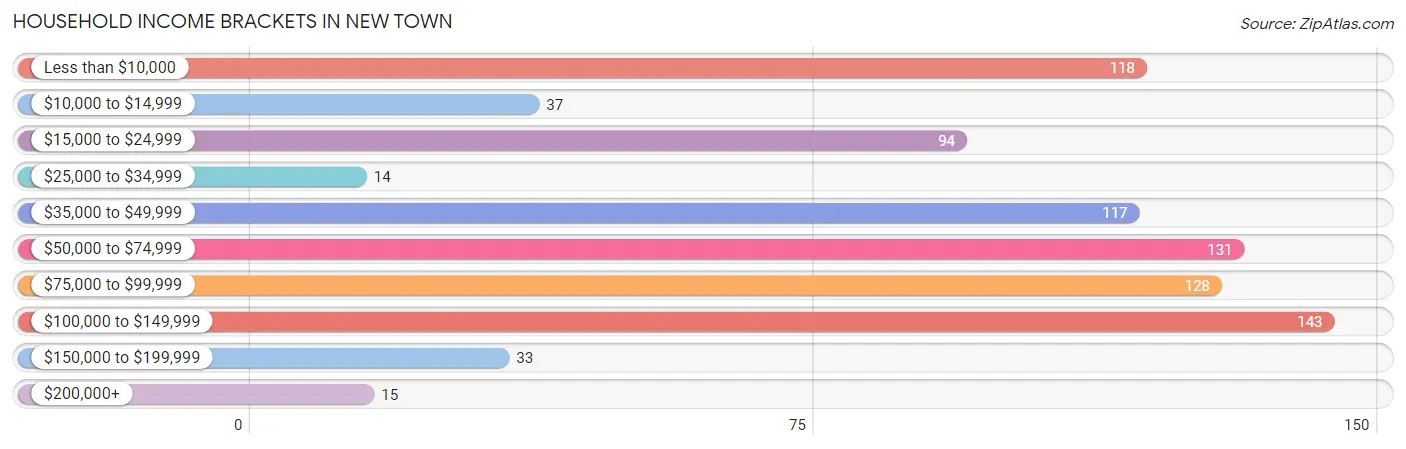
| Income Bracket | # Households | % Households |
| Less than $10,000 | 118 | 14.2% |
| $10,000 to $14,999 | 37 | 4.5% |
| $15,000 to $24,999 | 94 | 11.3% |
| $25,000 to $34,999 | 14 | 1.7% |
| $35,000 to $49,999 | 117 | 14.1% |
| $50,000 to $74,999 | 131 | 15.8% |
| $75,000 to $99,999 | 128 | 15.4% |
| $100,000 to $149,999 | 143 | 17.2% |
| $150,000 to $199,999 | 33 | 4.0% |
| $200,000+ | 15 | 1.8% |
Household Income by Householder Age in New Town
The median household income in New Town is $56,176, with the highest median household income of $69,375 found in the 45 to 64 years age bracket for the primary householder. A total of 320 households (38.6%) fall into this category. Meanwhile, the 15 to 24 years age bracket for the primary householder has the lowest median household income of $0, with 68 households (8.2%) in this group.
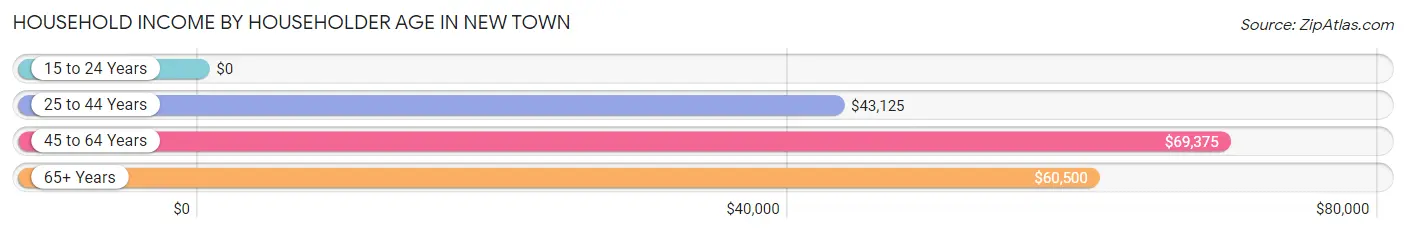
| Income Bracket | # Households | Median Income |
| 15 to 24 Years | 68 (8.2%) | $0 |
| 25 to 44 Years | 308 (37.1%) | $43,125 |
| 45 to 64 Years | 320 (38.6%) | $69,375 |
| 65+ Years | 134 (16.1%) | $60,500 |
| Total | 830 (100.0%) | $56,176 |
Poverty in New Town
Income Below Poverty by Sex and Age in New Town
With 20.3% poverty level for males and 20.4% for females among the residents of New Town, 12 to 14 year old males and 75 year old and over females are the most vulnerable to poverty, with 70 males (42.7%) and 17 females (80.9%) in their respective age groups living below the poverty level.
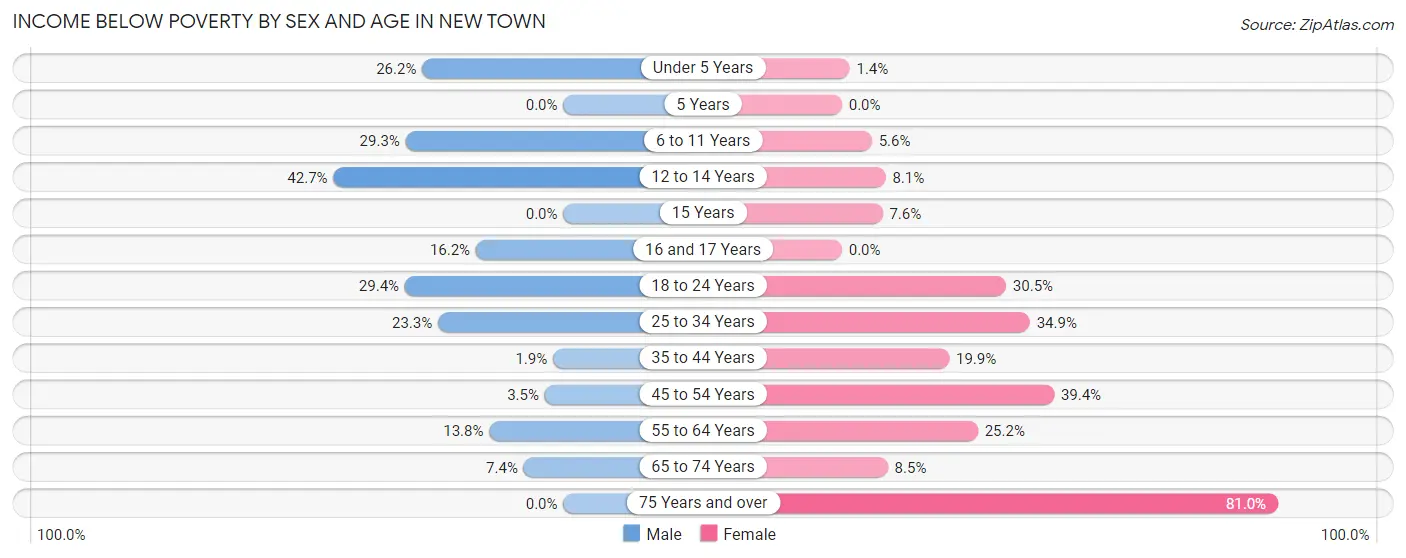
| Age Bracket | Male | Female |
| Under 5 Years | 33 (26.2%) | 2 (1.4%) |
| 5 Years | 0 (0.0%) | 0 (0.0%) |
| 6 to 11 Years | 36 (29.3%) | 8 (5.6%) |
| 12 to 14 Years | 70 (42.7%) | 6 (8.1%) |
| 15 Years | 0 (0.0%) | 4 (7.5%) |
| 16 and 17 Years | 6 (16.2%) | 0 (0.0%) |
| 18 to 24 Years | 50 (29.4%) | 46 (30.5%) |
| 25 to 34 Years | 40 (23.3%) | 60 (34.9%) |
| 35 to 44 Years | 3 (1.9%) | 40 (19.9%) |
| 45 to 54 Years | 4 (3.5%) | 63 (39.4%) |
| 55 to 64 Years | 22 (13.8%) | 27 (25.2%) |
| 65 to 74 Years | 5 (7.3%) | 8 (8.5%) |
| 75 Years and over | 0 (0.0%) | 17 (80.9%) |
| Total | 269 (20.3%) | 281 (20.4%) |
Income Above Poverty by Sex and Age in New Town
According to the poverty statistics in New Town, males aged 5 years and females aged 5 years are the age groups that are most secure financially, with 100.0% of males and 100.0% of females in these age groups living above the poverty line.
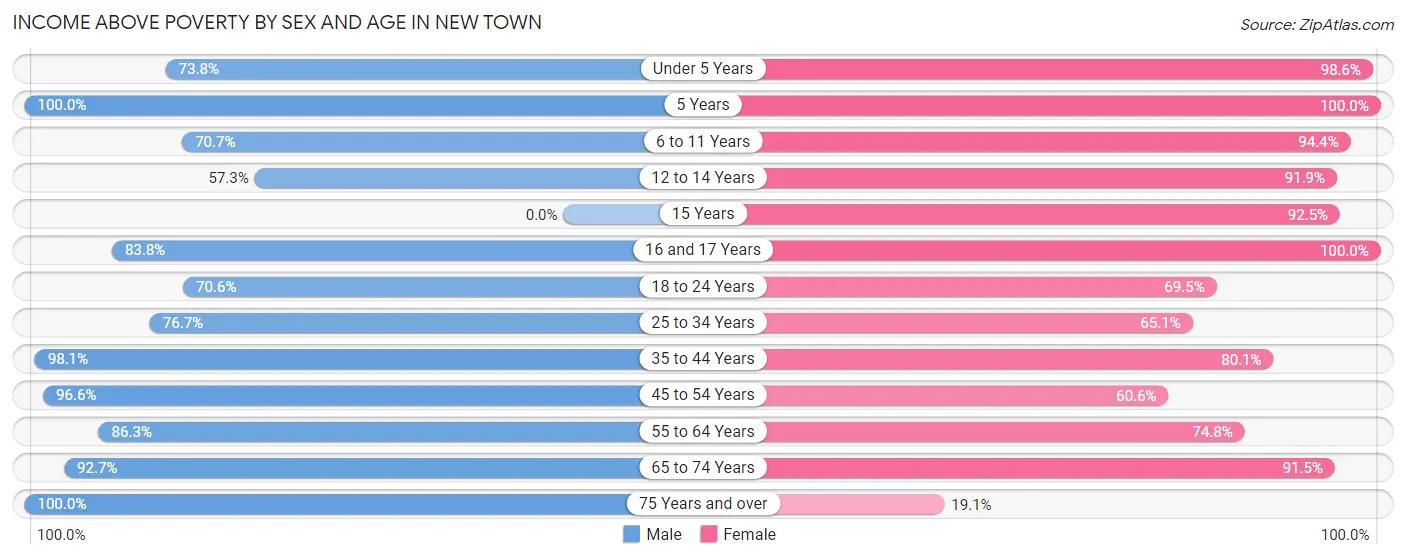
| Age Bracket | Male | Female |
| Under 5 Years | 93 (73.8%) | 137 (98.6%) |
| 5 Years | 19 (100.0%) | 48 (100.0%) |
| 6 to 11 Years | 87 (70.7%) | 136 (94.4%) |
| 12 to 14 Years | 94 (57.3%) | 68 (91.9%) |
| 15 Years | 0 (0.0%) | 49 (92.4%) |
| 16 and 17 Years | 31 (83.8%) | 12 (100.0%) |
| 18 to 24 Years | 120 (70.6%) | 105 (69.5%) |
| 25 to 34 Years | 132 (76.7%) | 112 (65.1%) |
| 35 to 44 Years | 154 (98.1%) | 161 (80.1%) |
| 45 to 54 Years | 112 (96.6%) | 97 (60.6%) |
| 55 to 64 Years | 138 (86.3%) | 80 (74.8%) |
| 65 to 74 Years | 63 (92.6%) | 86 (91.5%) |
| 75 Years and over | 12 (100.0%) | 4 (19.1%) |
| Total | 1,055 (79.7%) | 1,095 (79.6%) |
Income Below Poverty Among Married-Couple Families in New Town
The poverty statistics for married-couple families in New Town show that 5.5% or 13 of the total 237 families live below the poverty line. Families with 3 or 4 children have the highest poverty rate of 23.1%, comprising of 9 families. On the other hand, families with 1 or 2 children have the lowest poverty rate of 0.0%, which includes 0 families.
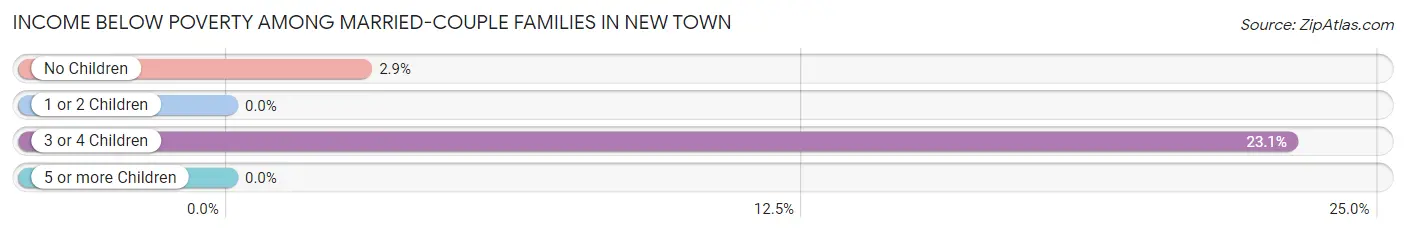
| Children | Above Poverty | Below Poverty |
| No Children | 133 (97.1%) | 4 (2.9%) |
| 1 or 2 Children | 61 (100.0%) | 0 (0.0%) |
| 3 or 4 Children | 30 (76.9%) | 9 (23.1%) |
| 5 or more Children | 0 (0.0%) | 0 (0.0%) |
| Total | 224 (94.5%) | 13 (5.5%) |
Income Below Poverty Among Single-Parent Households in New Town
According to the poverty data in New Town, 8.9% or 7 single-father households and 30.9% or 50 single-mother households are living below the poverty line. Among single-father households, those with 1 or 2 children have the highest poverty rate, with 7 households (13.7%) experiencing poverty. Likewise, among single-mother households, those with 1 or 2 children have the highest poverty rate, with 30 households (42.2%) falling below the poverty line.
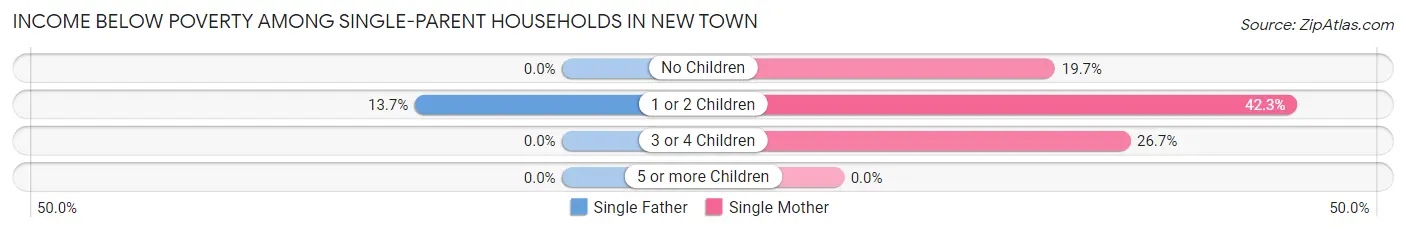
| Children | Single Father | Single Mother |
| No Children | 0 (0.0%) | 12 (19.7%) |
| 1 or 2 Children | 7 (13.7%) | 30 (42.2%) |
| 3 or 4 Children | 0 (0.0%) | 8 (26.7%) |
| 5 or more Children | 0 (0.0%) | 0 (0.0%) |
| Total | 7 (8.9%) | 50 (30.9%) |
Income Below Poverty Among Married-Couple vs Single-Parent Households in New Town
The poverty data for New Town shows that 13 of the married-couple family households (5.5%) and 57 of the single-parent households (23.6%) are living below the poverty level. Within the married-couple family households, those with 3 or 4 children have the highest poverty rate, with 9 households (23.1%) falling below the poverty line. Among the single-parent households, those with 1 or 2 children have the highest poverty rate, with 37 household (30.3%) living below poverty.
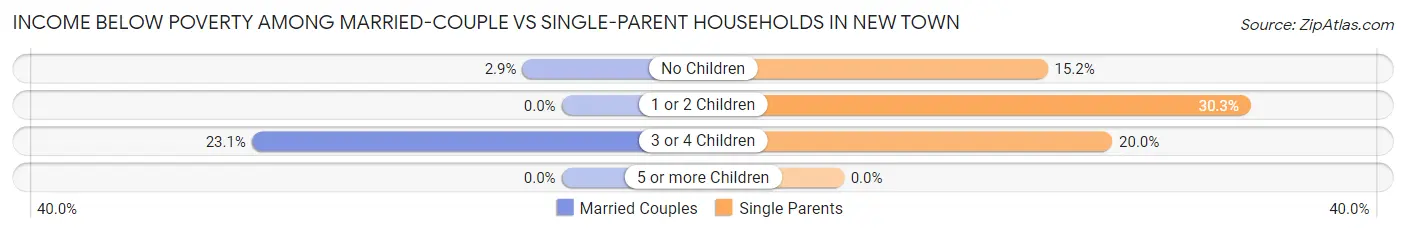
| Children | Married-Couple Families | Single-Parent Households |
| No Children | 4 (2.9%) | 12 (15.2%) |
| 1 or 2 Children | 0 (0.0%) | 37 (30.3%) |
| 3 or 4 Children | 9 (23.1%) | 8 (20.0%) |
| 5 or more Children | 0 (0.0%) | 0 (0.0%) |
| Total | 13 (5.5%) | 57 (23.6%) |
Race in New Town
The most populous races in New Town are Native / Alaskan (1,950 | 71.9%), White / Caucasian (355 | 13.1%), and Hispanic or Latino (347 | 12.8%).
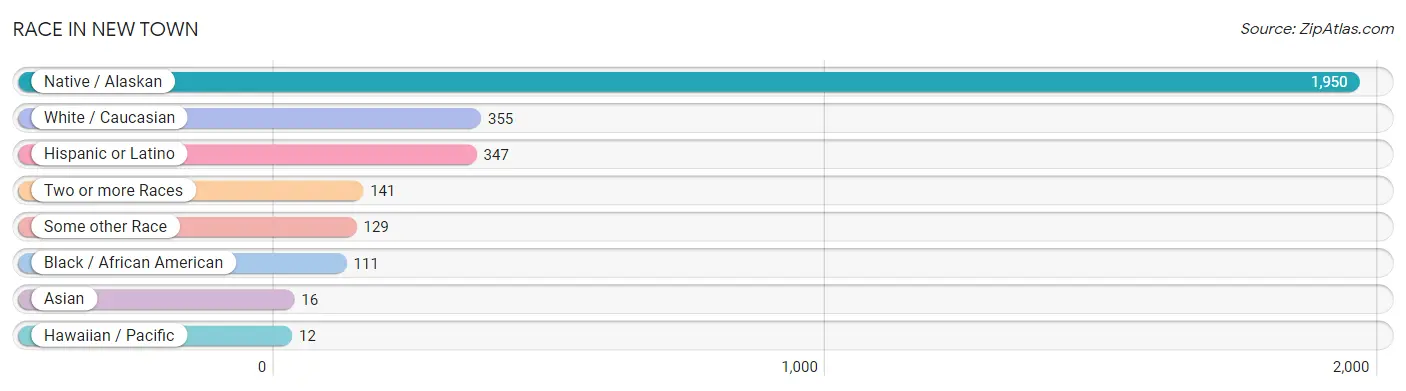
| Race | # Population | % Population |
| Asian | 16 | 0.6% |
| Black / African American | 111 | 4.1% |
| Hawaiian / Pacific | 12 | 0.4% |
| Hispanic or Latino | 347 | 12.8% |
| Native / Alaskan | 1,950 | 71.9% |
| White / Caucasian | 355 | 13.1% |
| Two or more Races | 141 | 5.2% |
| Some other Race | 129 | 4.8% |
| Total | 2,714 | 100.0% |
Ancestry in New Town
The most populous ancestries reported in New Town are Sioux (241 | 8.9%), Mexican (189 | 7.0%), Norwegian (123 | 4.5%), German (83 | 3.1%), and American (73 | 2.7%), together accounting for 26.1% of all New Town residents.
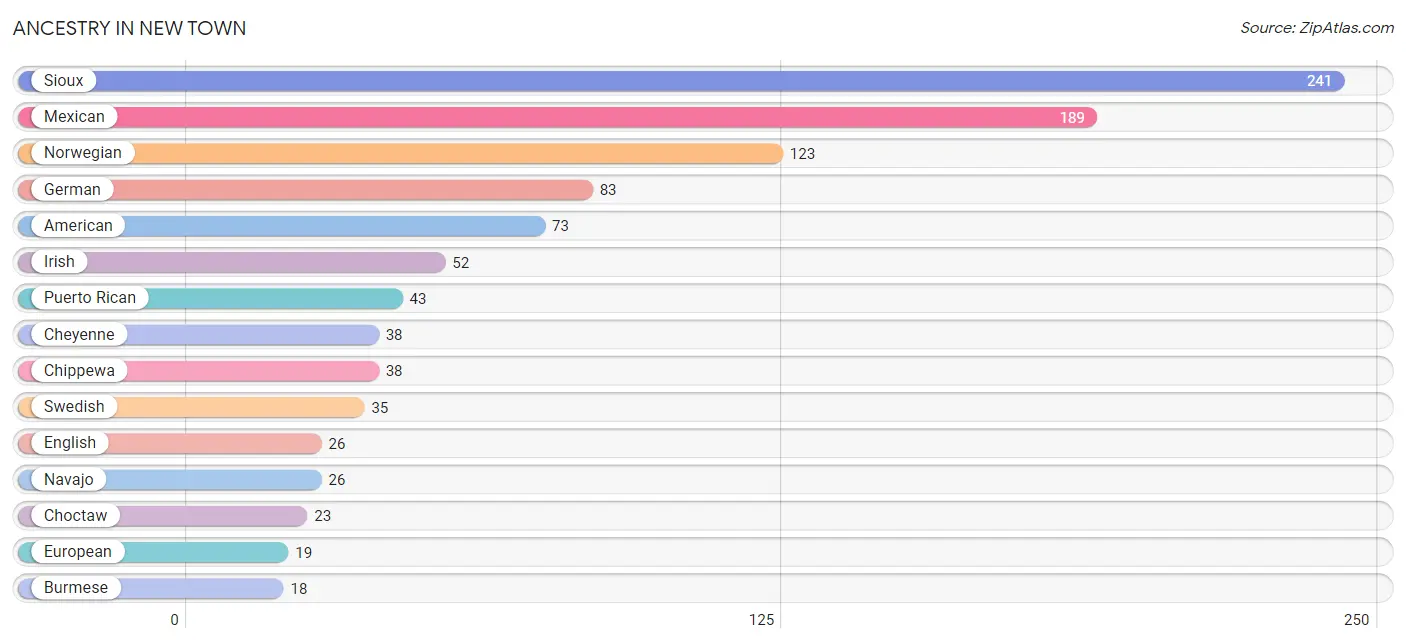
| Ancestry | # Population | % Population |
| African | 8 | 0.3% |
| American | 73 | 2.7% |
| Burmese | 18 | 0.7% |
| Cheyenne | 38 | 1.4% |
| Chickasaw | 16 | 0.6% |
| Chippewa | 38 | 1.4% |
| Choctaw | 23 | 0.9% |
| Colombian | 13 | 0.5% |
| Cuban | 15 | 0.5% |
| Czech | 5 | 0.2% |
| Dutch | 6 | 0.2% |
| English | 26 | 1.0% |
| European | 19 | 0.7% |
| Finnish | 16 | 0.6% |
| French | 3 | 0.1% |
| French Canadian | 3 | 0.1% |
| German | 83 | 3.1% |
| Guamanian / Chamorro | 12 | 0.4% |
| Haitian | 14 | 0.5% |
| Hopi | 16 | 0.6% |
| Irish | 52 | 1.9% |
| Italian | 17 | 0.6% |
| Korean | 9 | 0.3% |
| Mexican | 189 | 7.0% |
| Navajo | 26 | 1.0% |
| Norwegian | 123 | 4.5% |
| Pakistani | 7 | 0.3% |
| Puerto Rican | 43 | 1.6% |
| Russian | 2 | 0.1% |
| Scandinavian | 9 | 0.3% |
| Scottish | 18 | 0.7% |
| Shoshone | 13 | 0.5% |
| Sioux | 241 | 8.9% |
| South American | 13 | 0.5% |
| Subsaharan African | 8 | 0.3% |
| Swedish | 35 | 1.3% |
| Swiss | 5 | 0.2% |
| Welsh | 5 | 0.2% |
| Yuman | 4 | 0.2% | View All 39 Rows |
Immigrants in New Town
The most numerous immigrant groups reported in New Town came from Latin America (84 | 3.1%), Brazil (51 | 1.9%), South America (51 | 1.9%), Oceania (39 | 1.4%), and Central America (25 | 0.9%), together accounting for 9.2% of all New Town residents.
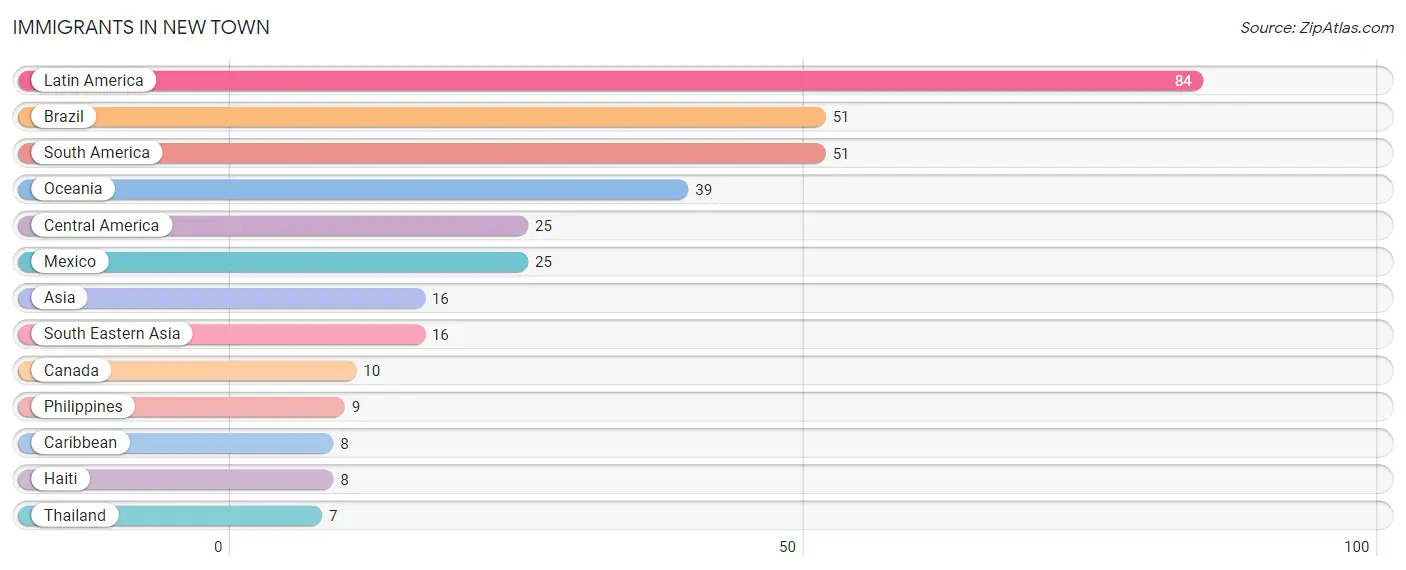
| Immigration Origin | # Population | % Population |
| Asia | 16 | 0.6% |
| Brazil | 51 | 1.9% |
| Canada | 10 | 0.4% |
| Caribbean | 8 | 0.3% |
| Central America | 25 | 0.9% |
| Haiti | 8 | 0.3% |
| Latin America | 84 | 3.1% |
| Mexico | 25 | 0.9% |
| Oceania | 39 | 1.4% |
| Philippines | 9 | 0.3% |
| South America | 51 | 1.9% |
| South Eastern Asia | 16 | 0.6% |
| Thailand | 7 | 0.3% | View All 13 Rows |
Sex and Age in New Town
Sex and Age in New Town
The most populous age groups in New Town are 10 to 14 Years (193 | 14.5%) for men and 5 to 9 Years (173 | 12.5%) for women.
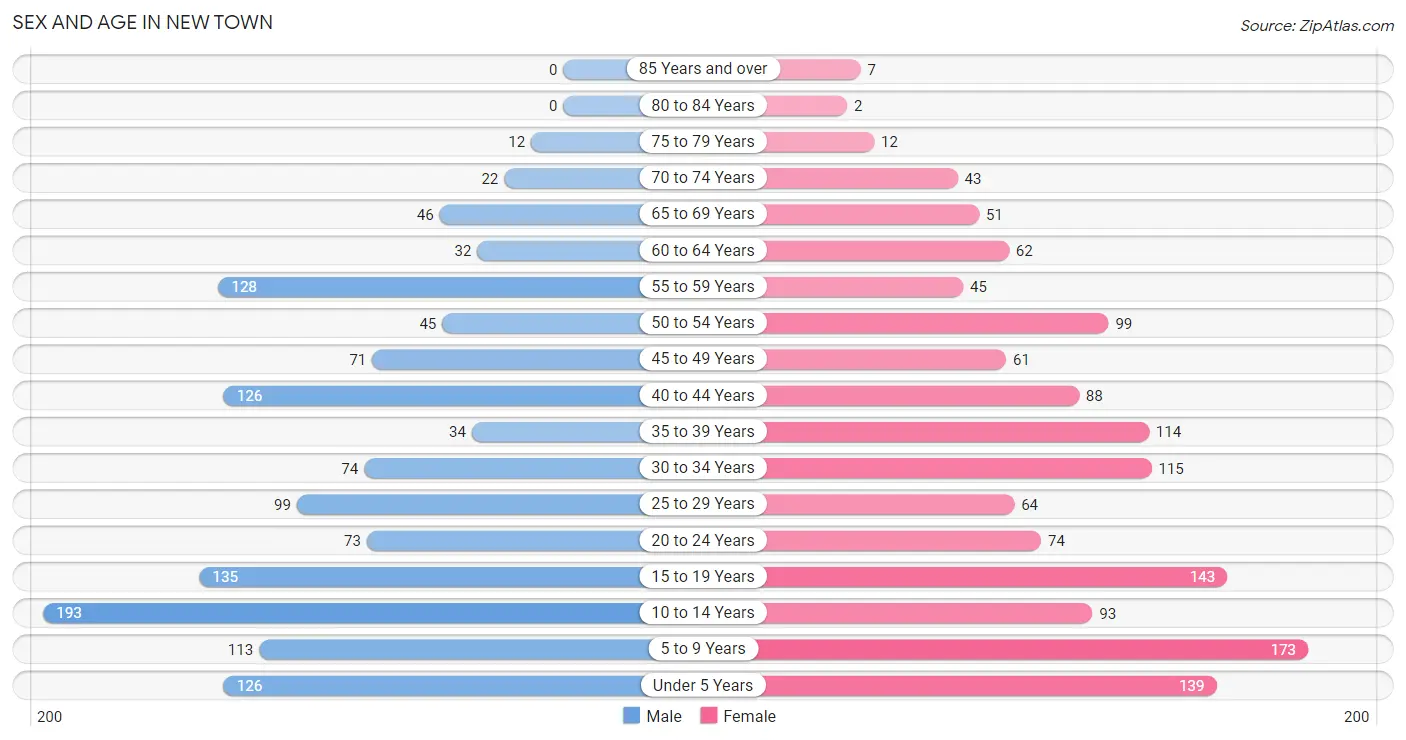
| Age Bracket | Male | Female |
| Under 5 Years | 126 (9.5%) | 139 (10.0%) |
| 5 to 9 Years | 113 (8.5%) | 173 (12.5%) |
| 10 to 14 Years | 193 (14.5%) | 93 (6.7%) |
| 15 to 19 Years | 135 (10.2%) | 143 (10.3%) |
| 20 to 24 Years | 73 (5.5%) | 74 (5.3%) |
| 25 to 29 Years | 99 (7.4%) | 64 (4.6%) |
| 30 to 34 Years | 74 (5.6%) | 115 (8.3%) |
| 35 to 39 Years | 34 (2.6%) | 114 (8.2%) |
| 40 to 44 Years | 126 (9.5%) | 88 (6.4%) |
| 45 to 49 Years | 71 (5.3%) | 61 (4.4%) |
| 50 to 54 Years | 45 (3.4%) | 99 (7.1%) |
| 55 to 59 Years | 128 (9.6%) | 45 (3.3%) |
| 60 to 64 Years | 32 (2.4%) | 62 (4.5%) |
| 65 to 69 Years | 46 (3.5%) | 51 (3.7%) |
| 70 to 74 Years | 22 (1.7%) | 43 (3.1%) |
| 75 to 79 Years | 12 (0.9%) | 12 (0.9%) |
| 80 to 84 Years | 0 (0.0%) | 2 (0.1%) |
| 85 Years and over | 0 (0.0%) | 7 (0.5%) |
| Total | 1,329 (100.0%) | 1,385 (100.0%) |
Families and Households in New Town
Median Family Size in New Town
The median family size in New Town is 4.46 persons per family, with single male/father families (79 | 16.5%) accounting for the largest median family size of 5.1 persons per family. On the other hand, married-couple families (237 | 49.6%) represent the smallest median family size with 4.27 persons per family.
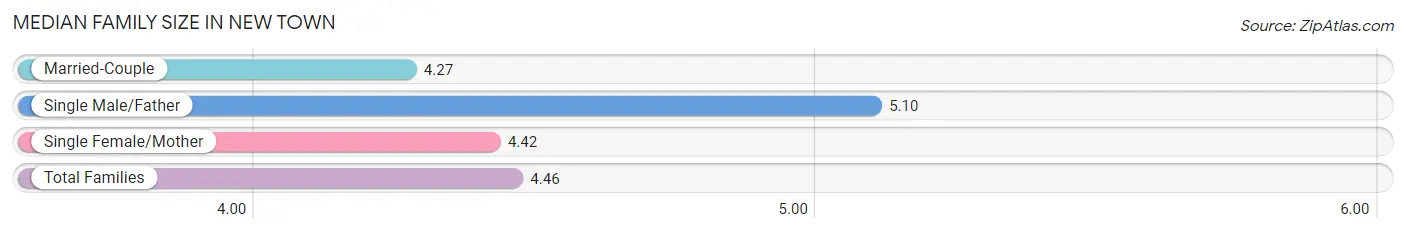
| Family Type | # Families | Family Size |
| Married-Couple | 237 (49.6%) | 4.27 |
| Single Male/Father | 79 (16.5%) | 5.10 |
| Single Female/Mother | 162 (33.9%) | 4.42 |
| Total Families | 478 (100.0%) | 4.46 |
Median Household Size in New Town
The median household size in New Town is 3.23 persons per household, with single male/father households (79 | 9.5%) accounting for the largest median household size of 5.67 persons per household. non-family households (352 | 42.4%) represent the smallest median household size with 1.18 persons per household.
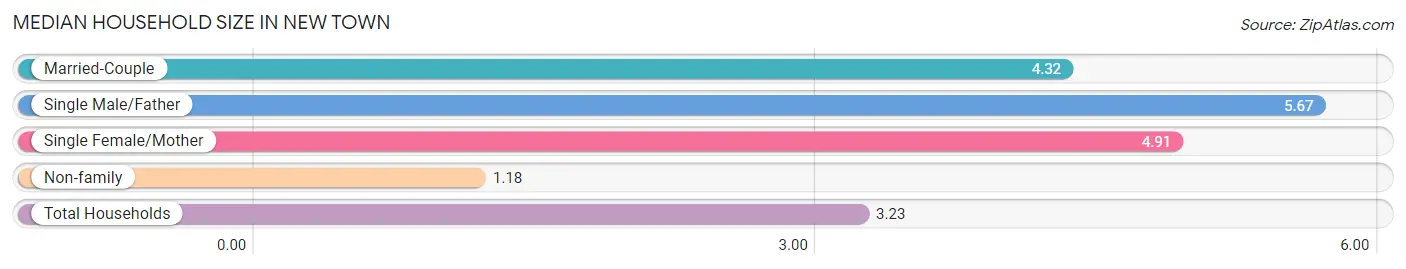
| Household Type | # Households | Household Size |
| Married-Couple | 237 (28.5%) | 4.32 |
| Single Male/Father | 79 (9.5%) | 5.67 |
| Single Female/Mother | 162 (19.5%) | 4.91 |
| Non-family | 352 (42.4%) | 1.18 |
| Total Households | 830 (100.0%) | 3.23 |
Household Size by Marriage Status in New Town
Out of a total of 830 households in New Town, 478 (57.6%) are family households, while 352 (42.4%) are nonfamily households. The most numerous type of family households are 2-person households, comprising 161, and the most common type of nonfamily households are 1-person households, comprising 320.
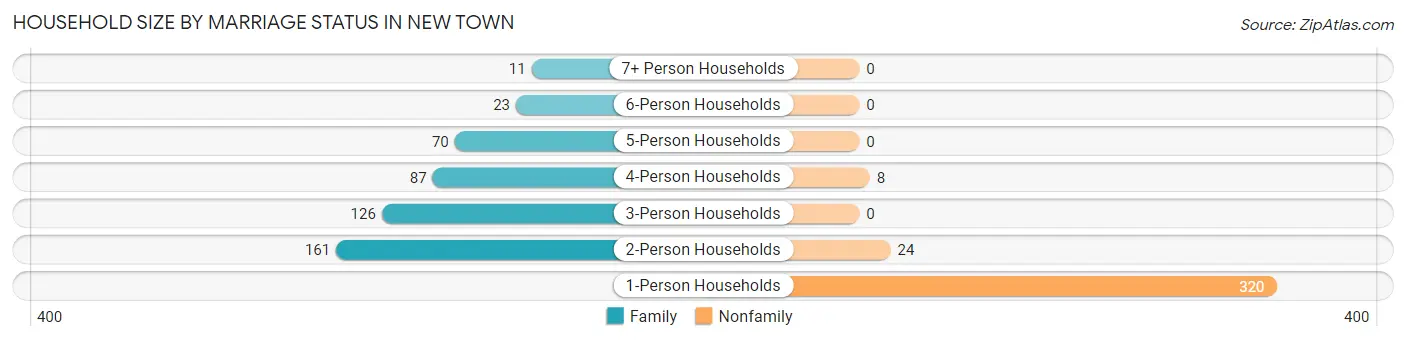
| Household Size | Family Households | Nonfamily Households |
| 1-Person Households | - | 320 (38.6%) |
| 2-Person Households | 161 (19.4%) | 24 (2.9%) |
| 3-Person Households | 126 (15.2%) | 0 (0.0%) |
| 4-Person Households | 87 (10.5%) | 8 (1.0%) |
| 5-Person Households | 70 (8.4%) | 0 (0.0%) |
| 6-Person Households | 23 (2.8%) | 0 (0.0%) |
| 7+ Person Households | 11 (1.3%) | 0 (0.0%) |
| Total | 478 (57.6%) | 352 (42.4%) |
Female Fertility in New Town
Fertility by Age in New Town
Average fertility rate in New Town is 47.0 births per 1,000 women. Women in the age bracket of 35 to 50 years have the highest fertility rate with 68.0 births per 1,000 women. Women in the age bracket of 35 to 50 years acount for 58.1% of all women with births.
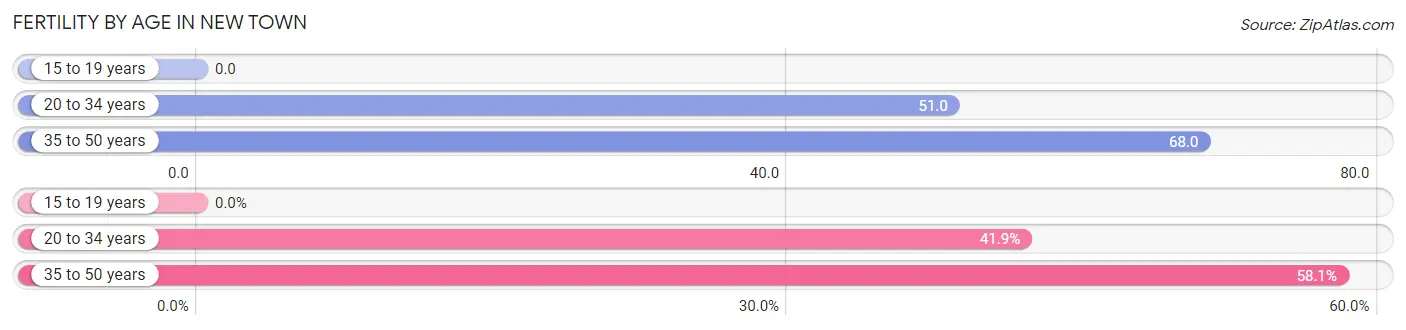
| Age Bracket | Women with Births | Births / 1,000 Women |
| 15 to 19 years | 0 (0.0%) | 0.0 |
| 20 to 34 years | 13 (41.9%) | 51.0 |
| 35 to 50 years | 18 (58.1%) | 68.0 |
| Total | 31 (100.0%) | 47.0 |
Fertility by Age by Marriage Status in New Town
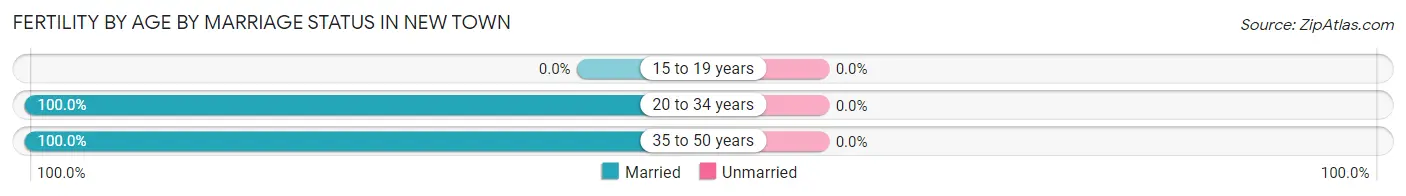
| Age Bracket | Married | Unmarried |
| 15 to 19 years | 0 (0.0%) | 0 (0.0%) |
| 20 to 34 years | 13 (100.0%) | 0 (0.0%) |
| 35 to 50 years | 18 (100.0%) | 0 (0.0%) |
| Total | 31 (100.0%) | 0 (0.0%) |
Fertility by Education in New Town
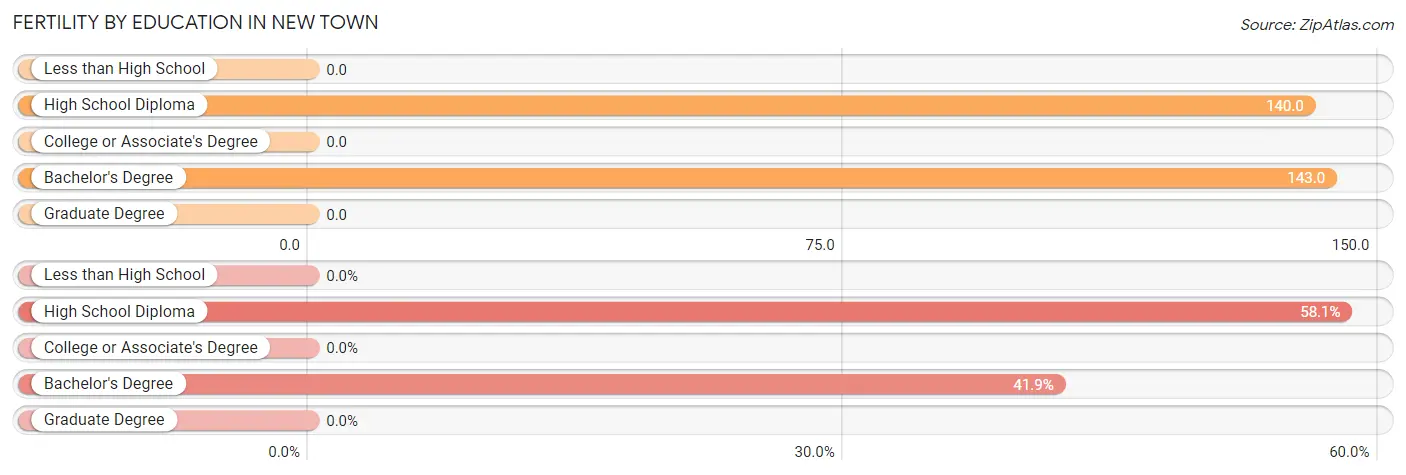
| Educational Attainment | Women with Births | Births / 1,000 Women |
| Less than High School | 0 (0.0%) | 0.0 |
| High School Diploma | 18 (58.1%) | 140.0 |
| College or Associate's Degree | 0 (0.0%) | 0.0 |
| Bachelor's Degree | 13 (41.9%) | 143.0 |
| Graduate Degree | 0 (0.0%) | 0.0 |
| Total | 31 (100.0%) | 47.0 |
Fertility by Education by Marriage Status in New Town
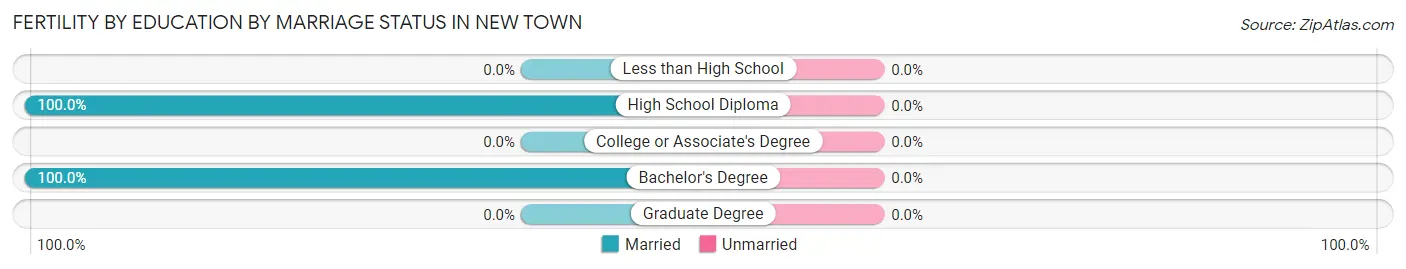
| Educational Attainment | Married | Unmarried |
| Less than High School | 0 (0.0%) | 0 (0.0%) |
| High School Diploma | 18 (100.0%) | 0 (0.0%) |
| College or Associate's Degree | 0 (0.0%) | 0 (0.0%) |
| Bachelor's Degree | 13 (100.0%) | 0 (0.0%) |
| Graduate Degree | 0 (0.0%) | 0 (0.0%) |
| Total | 31 (100.0%) | 0 (0.0%) |
Employment Characteristics in New Town
Employment by Class of Employer in New Town
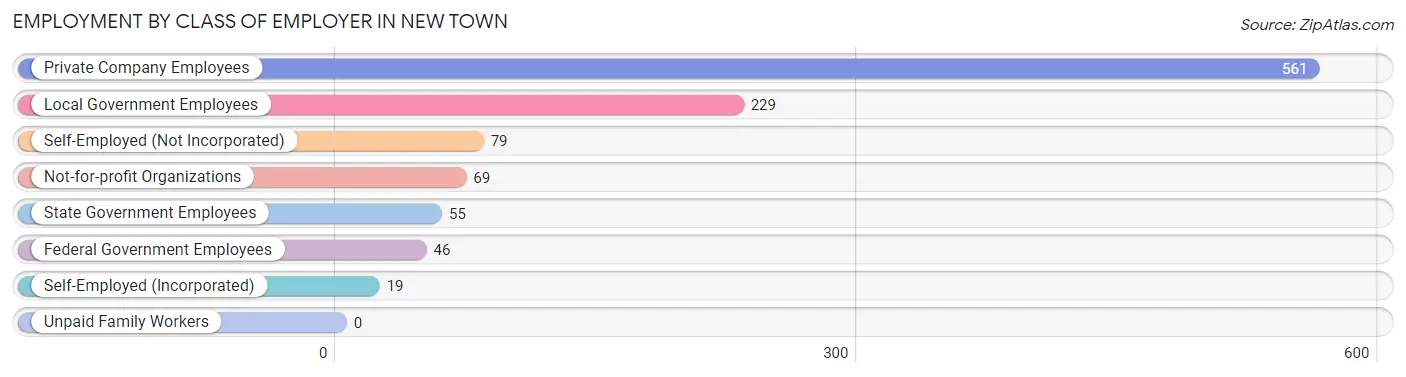
Among the 1,058 employed individuals in New Town, private company employees (561 | 53.0%), local government employees (229 | 21.6%), and self-employed (not incorporated) (79 | 7.5%) make up the most common classes of employment.
| Employer Class | # Employees | % Employees |
| Private Company Employees | 561 | 53.0% |
| Self-Employed (Incorporated) | 19 | 1.8% |
| Self-Employed (Not Incorporated) | 79 | 7.5% |
| Not-for-profit Organizations | 69 | 6.5% |
| Local Government Employees | 229 | 21.6% |
| State Government Employees | 55 | 5.2% |
| Federal Government Employees | 46 | 4.3% |
| Unpaid Family Workers | 0 | 0.0% |
| Total | 1,058 | 100.0% |
Employment Status by Age in New Town
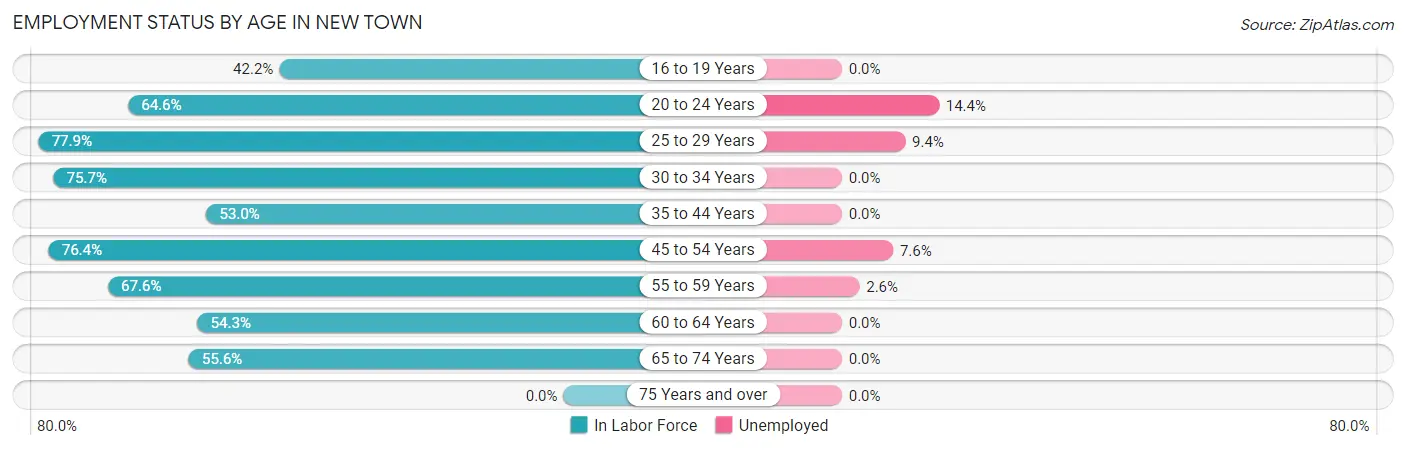
According to the labor force statistics for New Town, out of the total population over 16 years of age (1,824), 61.5% or 1,122 individuals are in the labor force, with 3.9% or 44 of them unemployed. The age group with the highest labor force participation rate is 25 to 29 years, with 77.9% or 127 individuals in the labor force. Within the labor force, the 20 to 24 years age range has the highest percentage of unemployed individuals, with 14.4% or 14 of them being unemployed.
| Age Bracket | In Labor Force | Unemployed |
| 16 to 19 Years | 95 (42.2%) | 0 (0.0%) |
| 20 to 24 Years | 95 (64.6%) | 14 (14.4%) |
| 25 to 29 Years | 127 (77.9%) | 12 (9.4%) |
| 30 to 34 Years | 143 (75.7%) | 0 (0.0%) |
| 35 to 44 Years | 192 (53.0%) | 0 (0.0%) |
| 45 to 54 Years | 211 (76.4%) | 16 (7.6%) |
| 55 to 59 Years | 117 (67.6%) | 3 (2.6%) |
| 60 to 64 Years | 51 (54.3%) | 0 (0.0%) |
| 65 to 74 Years | 90 (55.6%) | 0 (0.0%) |
| 75 Years and over | 0 (0.0%) | 0 (0.0%) |
| Total | 1,122 (61.5%) | 44 (3.9%) |
Employment Status by Educational Attainment in New Town
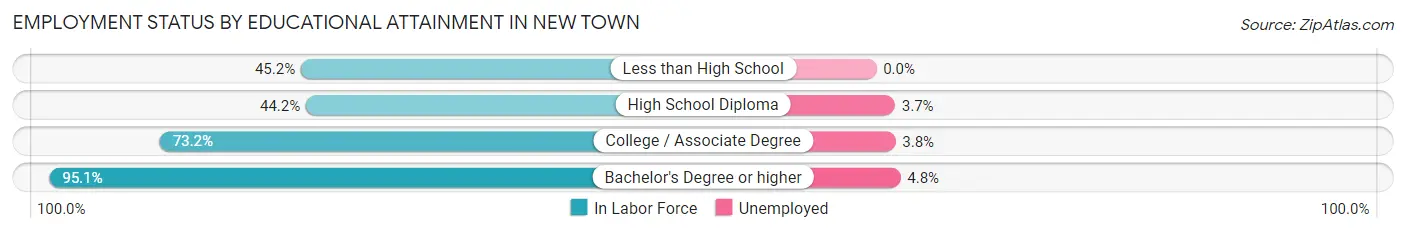
According to labor force statistics for New Town, 66.9% of individuals (841) out of the total population between 25 and 64 years of age (1,257) are in the labor force, with 3.7% or 31 of them being unemployed. The group with the highest labor force participation rate are those with the educational attainment of bachelor's degree or higher, with 95.1% or 292 individuals in the labor force. Within the labor force, individuals with bachelor's degree or higher education have the highest percentage of unemployment, with 4.8% or 14 of them being unemployed.
| Educational Attainment | In Labor Force | Unemployed |
| Less than High School | 95 (45.2%) | 0 (0.0%) |
| High School Diploma | 134 (44.2%) | 11 (3.7%) |
| College / Associate Degree | 320 (73.2%) | 17 (3.8%) |
| Bachelor's Degree or higher | 292 (95.1%) | 15 (4.8%) |
| Total | 841 (66.9%) | 47 (3.7%) |
Employment Occupations by Sex in New Town
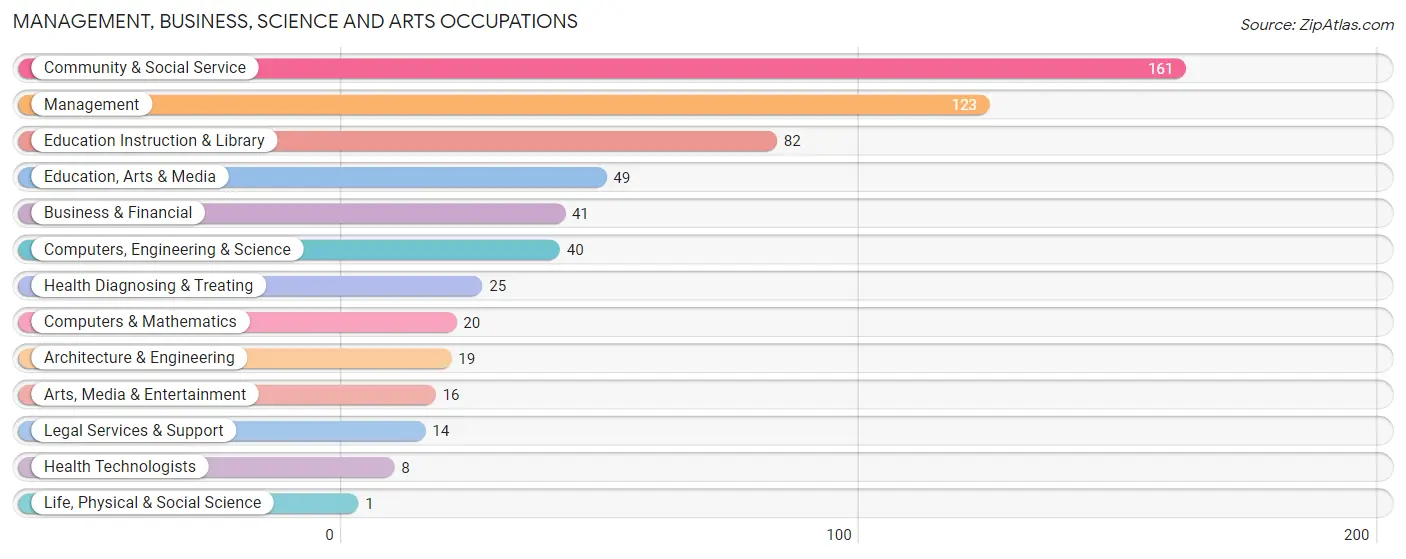
Management, Business, Science and Arts Occupations
The most common Management, Business, Science and Arts occupations in New Town are Community & Social Service (161 | 15.0%), Management (123 | 11.5%), Education Instruction & Library (82 | 7.6%), Education, Arts & Media (49 | 4.6%), and Business & Financial (41 | 3.8%).
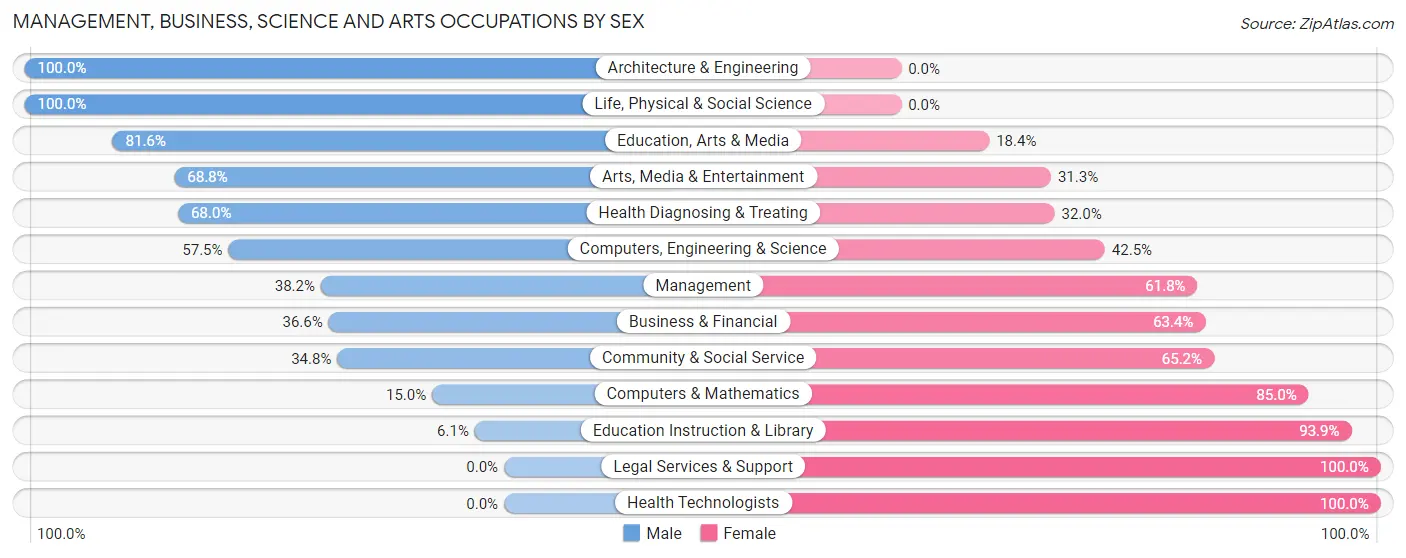
Management, Business, Science and Arts Occupations by Sex
Within the Management, Business, Science and Arts occupations in New Town, the most male-oriented occupations are Architecture & Engineering (100.0%), Life, Physical & Social Science (100.0%), and Education, Arts & Media (81.6%), while the most female-oriented occupations are Legal Services & Support (100.0%), Health Technologists (100.0%), and Education Instruction & Library (93.9%).
| Occupation | Male | Female |
| Management | 47 (38.2%) | 76 (61.8%) |
| Business & Financial | 15 (36.6%) | 26 (63.4%) |
| Computers, Engineering & Science | 23 (57.5%) | 17 (42.5%) |
| Computers & Mathematics | 3 (15.0%) | 17 (85.0%) |
| Architecture & Engineering | 19 (100.0%) | 0 (0.0%) |
| Life, Physical & Social Science | 1 (100.0%) | 0 (0.0%) |
| Community & Social Service | 56 (34.8%) | 105 (65.2%) |
| Education, Arts & Media | 40 (81.6%) | 9 (18.4%) |
| Legal Services & Support | 0 (0.0%) | 14 (100.0%) |
| Education Instruction & Library | 5 (6.1%) | 77 (93.9%) |
| Arts, Media & Entertainment | 11 (68.8%) | 5 (31.2%) |
| Health Diagnosing & Treating | 17 (68.0%) | 8 (32.0%) |
| Health Technologists | 0 (0.0%) | 8 (100.0%) |
| Total (Category) | 158 (40.5%) | 232 (59.5%) |
| Total (Overall) | 549 (51.2%) | 523 (48.8%) |
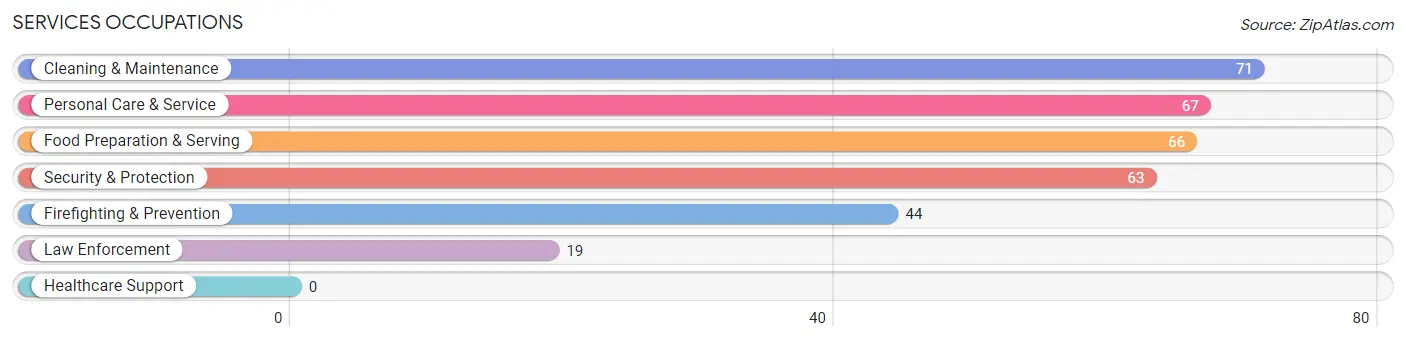
Services Occupations
The most common Services occupations in New Town are Cleaning & Maintenance (71 | 6.6%), Personal Care & Service (67 | 6.2%), Food Preparation & Serving (66 | 6.2%), Security & Protection (63 | 5.9%), and Firefighting & Prevention (44 | 4.1%).
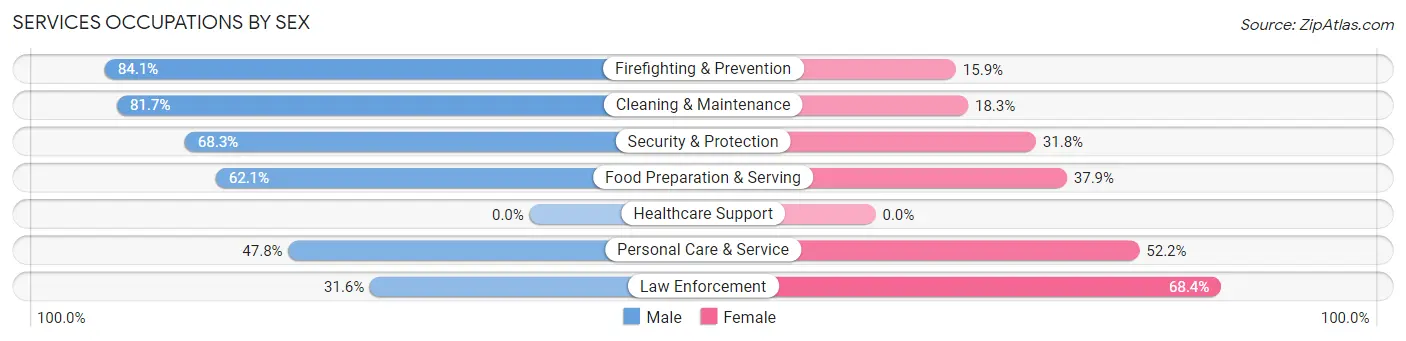
Services Occupations by Sex
Within the Services occupations in New Town, the most male-oriented occupations are Firefighting & Prevention (84.1%), Cleaning & Maintenance (81.7%), and Security & Protection (68.2%), while the most female-oriented occupations are Law Enforcement (68.4%), Personal Care & Service (52.2%), and Food Preparation & Serving (37.9%).
| Occupation | Male | Female |
| Healthcare Support | 0 (0.0%) | 0 (0.0%) |
| Security & Protection | 43 (68.2%) | 20 (31.8%) |
| Firefighting & Prevention | 37 (84.1%) | 7 (15.9%) |
| Law Enforcement | 6 (31.6%) | 13 (68.4%) |
| Food Preparation & Serving | 41 (62.1%) | 25 (37.9%) |
| Cleaning & Maintenance | 58 (81.7%) | 13 (18.3%) |
| Personal Care & Service | 32 (47.8%) | 35 (52.2%) |
| Total (Category) | 174 (65.2%) | 93 (34.8%) |
| Total (Overall) | 549 (51.2%) | 523 (48.8%) |
Sales and Office Occupations
The most common Sales and Office occupations in New Town are Office & Administration (133 | 12.4%), and Sales & Related (109 | 10.2%).

Sales and Office Occupations by Sex

| Occupation | Male | Female |
| Sales & Related | 43 (39.5%) | 66 (60.6%) |
| Office & Administration | 12 (9.0%) | 121 (91.0%) |
| Total (Category) | 55 (22.7%) | 187 (77.3%) |
| Total (Overall) | 549 (51.2%) | 523 (48.8%) |
Natural Resources, Construction and Maintenance Occupations
The most common Natural Resources, Construction and Maintenance occupations in New Town are Construction & Extraction (35 | 3.3%), and Installation, Maintenance & Repair (23 | 2.1%).
Natural Resources, Construction and Maintenance Occupations by Sex
| Occupation | Male | Female |
| Farming, Fishing & Forestry | 0 (0.0%) | 0 (0.0%) |
| Construction & Extraction | 35 (100.0%) | 0 (0.0%) |
| Installation, Maintenance & Repair | 23 (100.0%) | 0 (0.0%) |
| Total (Category) | 58 (100.0%) | 0 (0.0%) |
| Total (Overall) | 549 (51.2%) | 523 (48.8%) |
Production, Transportation and Moving Occupations
The most common Production, Transportation and Moving occupations in New Town are Transportation (51 | 4.8%), Production (50 | 4.7%), and Material Moving (14 | 1.3%).
Production, Transportation and Moving Occupations by Sex
| Occupation | Male | Female |
| Production | 39 (78.0%) | 11 (22.0%) |
| Transportation | 51 (100.0%) | 0 (0.0%) |
| Material Moving | 14 (100.0%) | 0 (0.0%) |
| Total (Category) | 104 (90.4%) | 11 (9.6%) |
| Total (Overall) | 549 (51.2%) | 523 (48.8%) |
Employment Industries by Sex in New Town
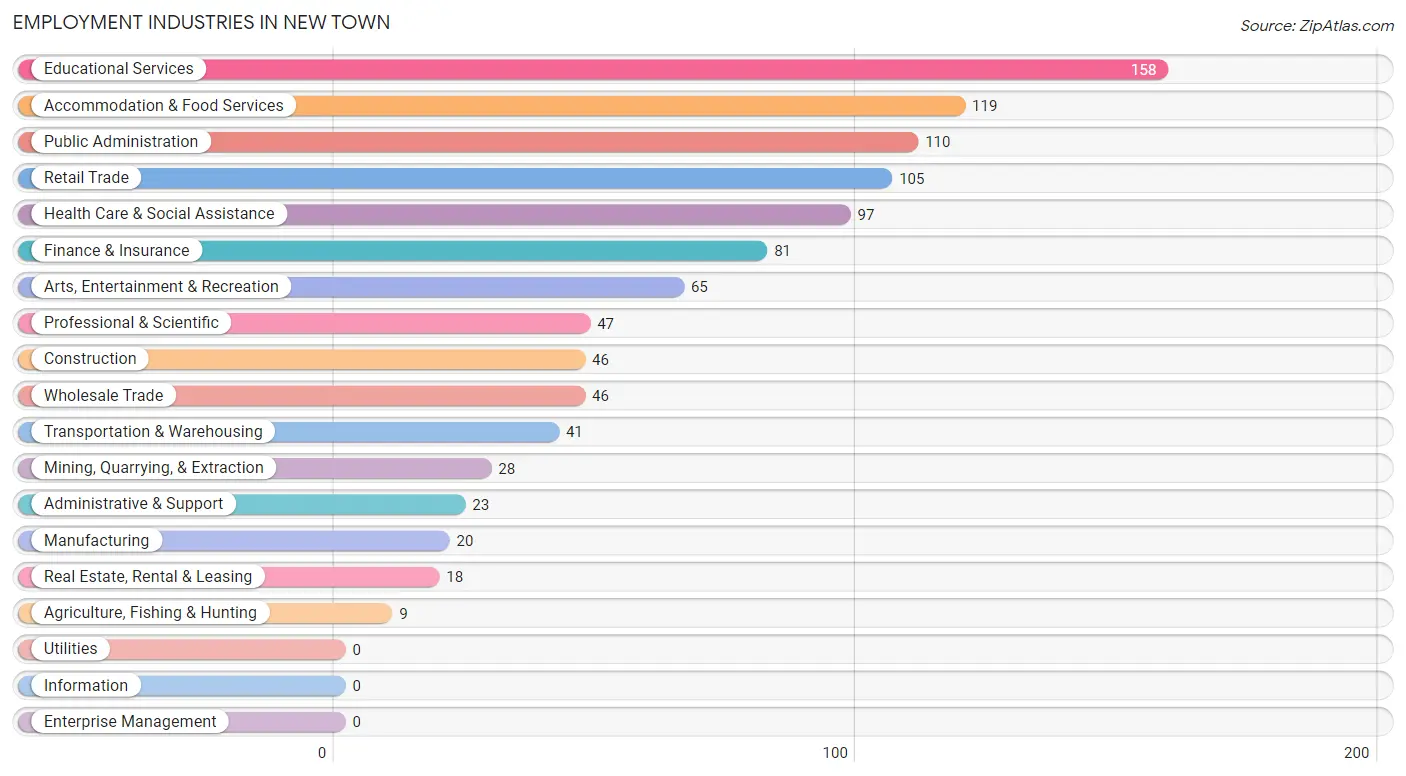
Employment Industries in New Town
The major employment industries in New Town include Educational Services (158 | 14.7%), Accommodation & Food Services (119 | 11.1%), Public Administration (110 | 10.3%), Retail Trade (105 | 9.8%), and Health Care & Social Assistance (97 | 9.0%).
Employment Industries by Sex in New Town
The New Town industries that see more men than women are Agriculture, Fishing & Hunting (100.0%), Mining, Quarrying, & Extraction (100.0%), and Transportation & Warehousing (100.0%), whereas the industries that tend to have a higher number of women are Finance & Insurance (93.8%), Educational Services (84.8%), and Arts, Entertainment & Recreation (60.0%).
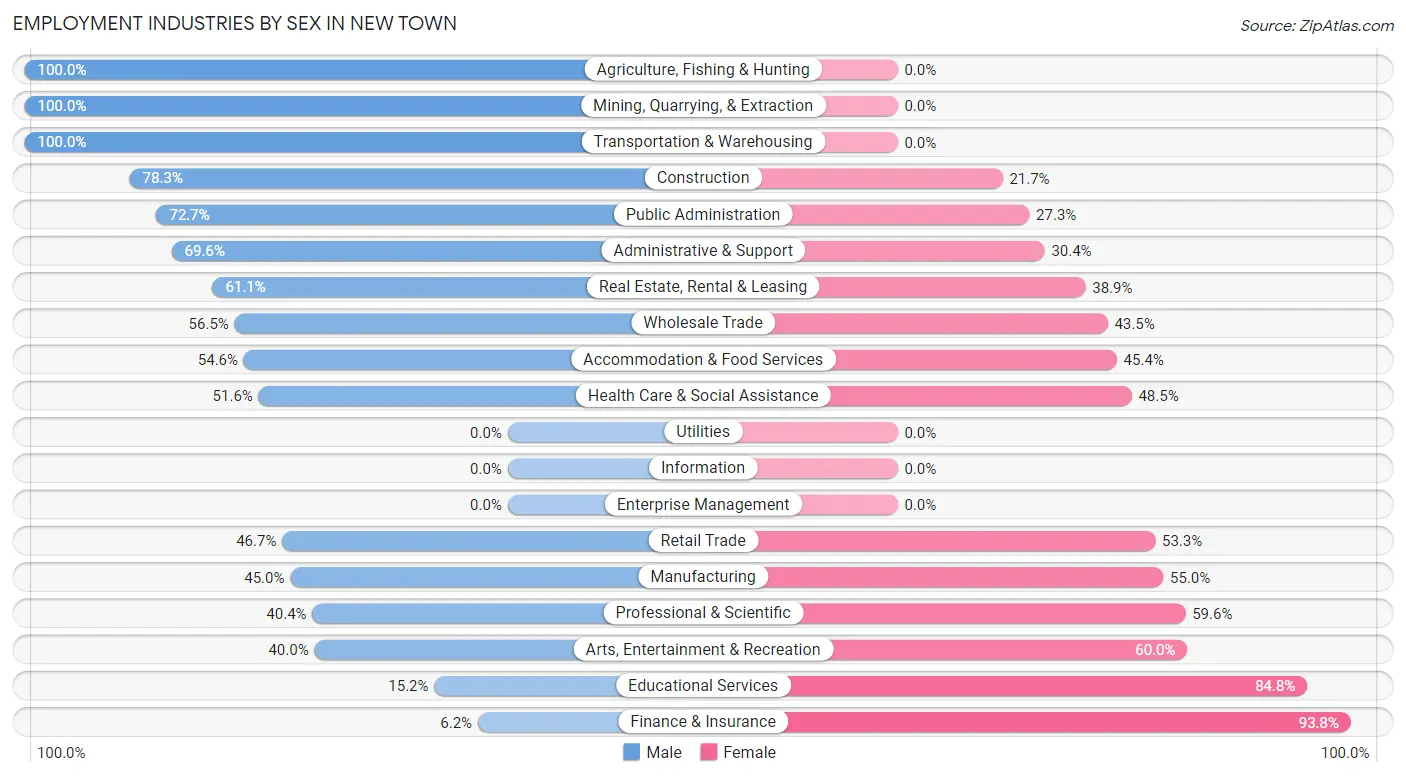
| Industry | Male | Female |
| Agriculture, Fishing & Hunting | 9 (100.0%) | 0 (0.0%) |
| Mining, Quarrying, & Extraction | 28 (100.0%) | 0 (0.0%) |
| Construction | 36 (78.3%) | 10 (21.7%) |
| Manufacturing | 9 (45.0%) | 11 (55.0%) |
| Wholesale Trade | 26 (56.5%) | 20 (43.5%) |
| Retail Trade | 49 (46.7%) | 56 (53.3%) |
| Transportation & Warehousing | 41 (100.0%) | 0 (0.0%) |
| Utilities | 0 (0.0%) | 0 (0.0%) |
| Information | 0 (0.0%) | 0 (0.0%) |
| Finance & Insurance | 5 (6.2%) | 76 (93.8%) |
| Real Estate, Rental & Leasing | 11 (61.1%) | 7 (38.9%) |
| Professional & Scientific | 19 (40.4%) | 28 (59.6%) |
| Enterprise Management | 0 (0.0%) | 0 (0.0%) |
| Administrative & Support | 16 (69.6%) | 7 (30.4%) |
| Educational Services | 24 (15.2%) | 134 (84.8%) |
| Health Care & Social Assistance | 50 (51.5%) | 47 (48.4%) |
| Arts, Entertainment & Recreation | 26 (40.0%) | 39 (60.0%) |
| Accommodation & Food Services | 65 (54.6%) | 54 (45.4%) |
| Public Administration | 80 (72.7%) | 30 (27.3%) |
| Total | 549 (51.2%) | 523 (48.8%) |
Education in New Town
School Enrollment in New Town
The most common levels of schooling among the 945 students in New Town are high school (255 | 27.0%), middle school (244 | 25.8%), and elementary school (185 | 19.6%).
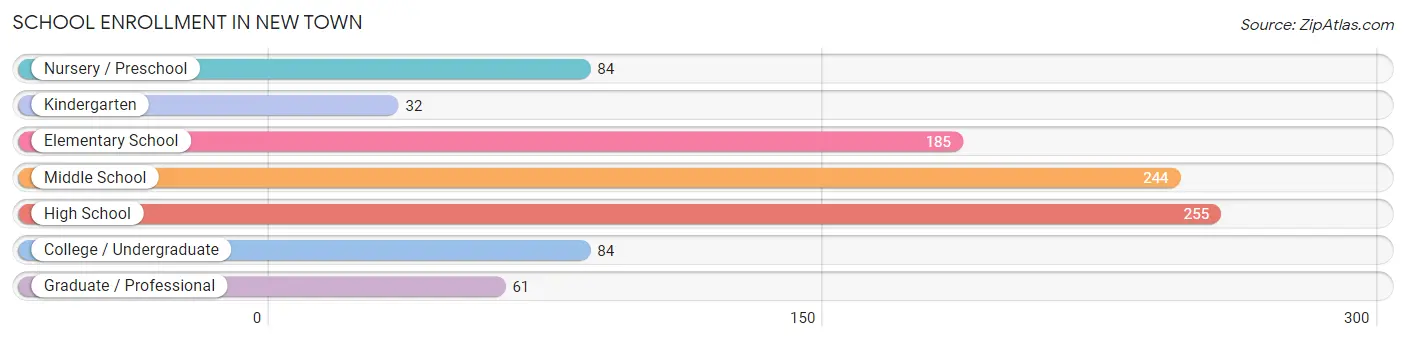
| School Level | # Students | % Students |
| Nursery / Preschool | 84 | 8.9% |
| Kindergarten | 32 | 3.4% |
| Elementary School | 185 | 19.6% |
| Middle School | 244 | 25.8% |
| High School | 255 | 27.0% |
| College / Undergraduate | 84 | 8.9% |
| Graduate / Professional | 61 | 6.5% |
| Total | 945 | 100.0% |
School Enrollment by Age by Funding Source in New Town
Out of a total of 945 students who are enrolled in schools in New Town, 89 (9.4%) attend a private institution, while the remaining 856 (90.6%) are enrolled in public schools. The age group of 35 years and over has the highest likelihood of being enrolled in private schools, with 30 (44.1% in the age bracket) enrolled. Conversely, the age group of 3 to 4 year olds has the lowest likelihood of being enrolled in a private school, with 44 (100.0% in the age bracket) attending a public institution.
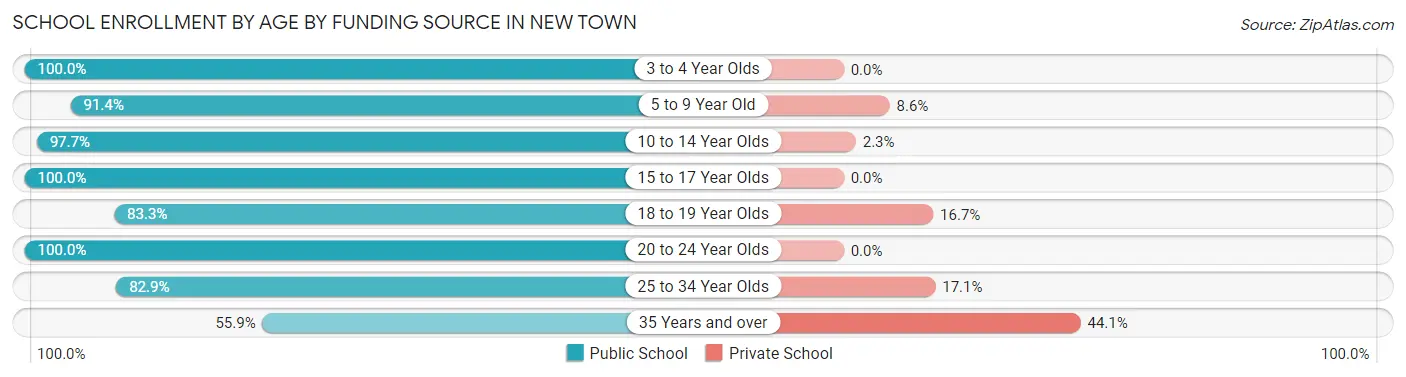
| Age Bracket | Public School | Private School |
| 3 to 4 Year Olds | 44 (100.0%) | 0 (0.0%) |
| 5 to 9 Year Old | 235 (91.4%) | 22 (8.6%) |
| 10 to 14 Year Olds | 259 (97.7%) | 6 (2.3%) |
| 15 to 17 Year Olds | 99 (100.0%) | 0 (0.0%) |
| 18 to 19 Year Olds | 120 (83.3%) | 24 (16.7%) |
| 20 to 24 Year Olds | 27 (100.0%) | 0 (0.0%) |
| 25 to 34 Year Olds | 34 (82.9%) | 7 (17.1%) |
| 35 Years and over | 38 (55.9%) | 30 (44.1%) |
| Total | 856 (90.6%) | 89 (9.4%) |
Educational Attainment by Field of Study in New Town
Education (65 | 17.0%), liberal arts & history (59 | 15.4%), science & technology (50 | 13.1%), business (50 | 13.1%), and social sciences (48 | 12.5%) are the most common fields of study among 383 individuals in New Town who have obtained a bachelor's degree or higher.
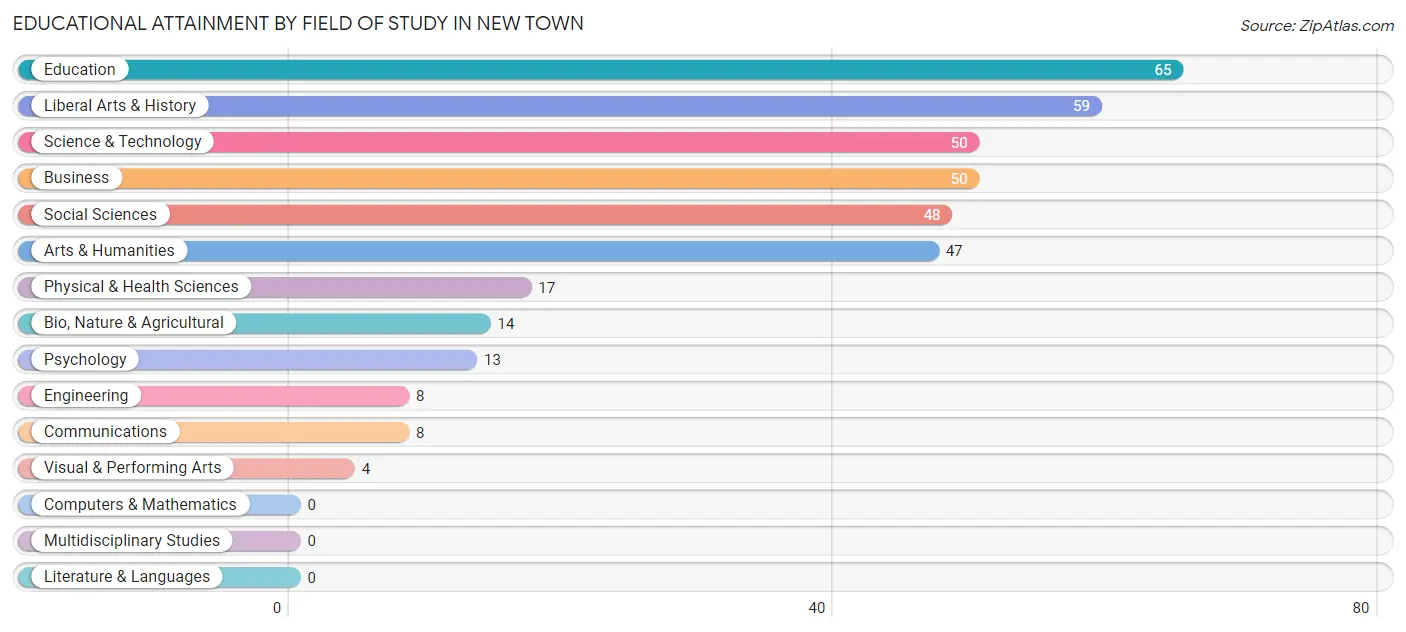
| Field of Study | # Graduates | % Graduates |
| Computers & Mathematics | 0 | 0.0% |
| Bio, Nature & Agricultural | 14 | 3.7% |
| Physical & Health Sciences | 17 | 4.4% |
| Psychology | 13 | 3.4% |
| Social Sciences | 48 | 12.5% |
| Engineering | 8 | 2.1% |
| Multidisciplinary Studies | 0 | 0.0% |
| Science & Technology | 50 | 13.1% |
| Business | 50 | 13.1% |
| Education | 65 | 17.0% |
| Literature & Languages | 0 | 0.0% |
| Liberal Arts & History | 59 | 15.4% |
| Visual & Performing Arts | 4 | 1.0% |
| Communications | 8 | 2.1% |
| Arts & Humanities | 47 | 12.3% |
| Total | 383 | 100.0% |
Transportation & Commute in New Town
Vehicle Availability by Sex in New Town
The most prevalent vehicle ownership categories in New Town are males with 1 vehicle (153, accounting for 28.7%) and females with 1 vehicle (182, making up 29.4%).
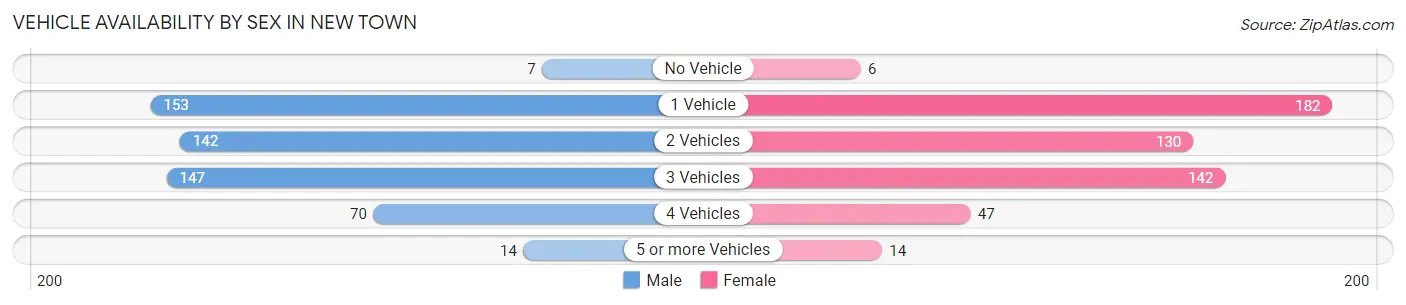
| Vehicles Available | Male | Female |
| No Vehicle | 7 (1.3%) | 6 (1.1%) |
| 1 Vehicle | 153 (28.7%) | 182 (34.9%) |
| 2 Vehicles | 142 (26.6%) | 130 (24.9%) |
| 3 Vehicles | 147 (27.6%) | 142 (27.3%) |
| 4 Vehicles | 70 (13.1%) | 47 (9.0%) |
| 5 or more Vehicles | 14 (2.6%) | 14 (2.7%) |
| Total | 533 (100.0%) | 521 (100.0%) |
Commute Time in New Town
The most frequently occuring commute durations in New Town are less than 5 minutes (247 commuters, 23.4%), 5 to 9 minutes (247 commuters, 23.4%), and 10 to 14 minutes (218 commuters, 20.6%).
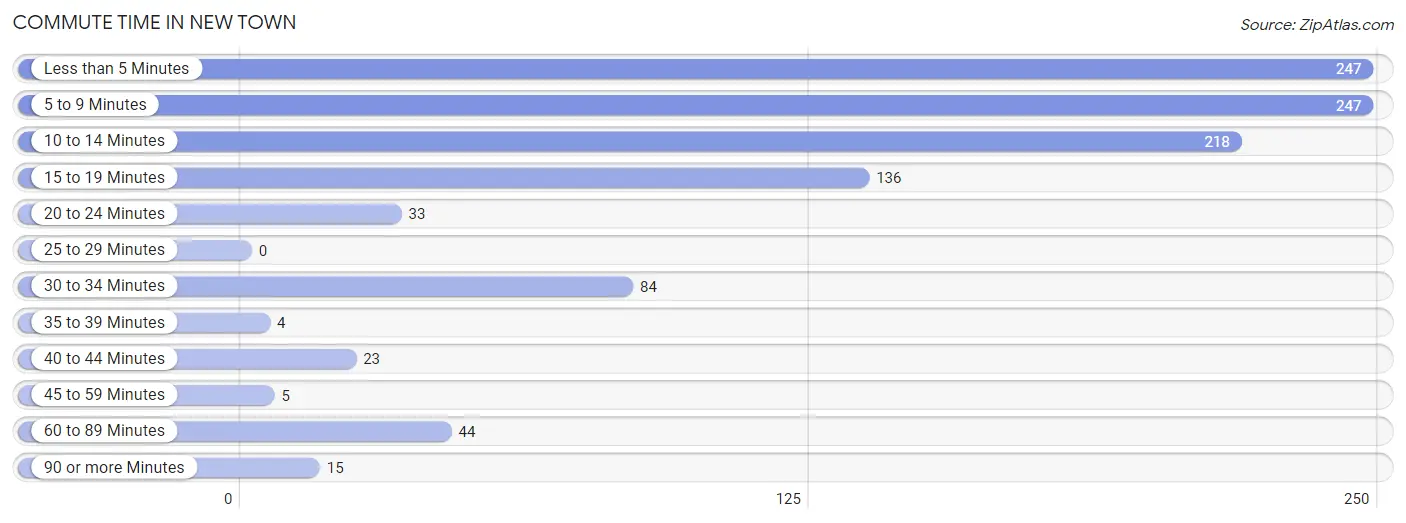
| Commute Time | # Commuters | % Commuters |
| Less than 5 Minutes | 247 | 23.4% |
| 5 to 9 Minutes | 247 | 23.4% |
| 10 to 14 Minutes | 218 | 20.6% |
| 15 to 19 Minutes | 136 | 12.9% |
| 20 to 24 Minutes | 33 | 3.1% |
| 25 to 29 Minutes | 0 | 0.0% |
| 30 to 34 Minutes | 84 | 8.0% |
| 35 to 39 Minutes | 4 | 0.4% |
| 40 to 44 Minutes | 23 | 2.2% |
| 45 to 59 Minutes | 5 | 0.5% |
| 60 to 89 Minutes | 44 | 4.2% |
| 90 or more Minutes | 15 | 1.4% |
Commute Time by Sex in New Town
The most common commute times in New Town are less than 5 minutes (137 commuters, 25.5%) for males and 10 to 14 minutes (153 commuters, 29.5%) for females.
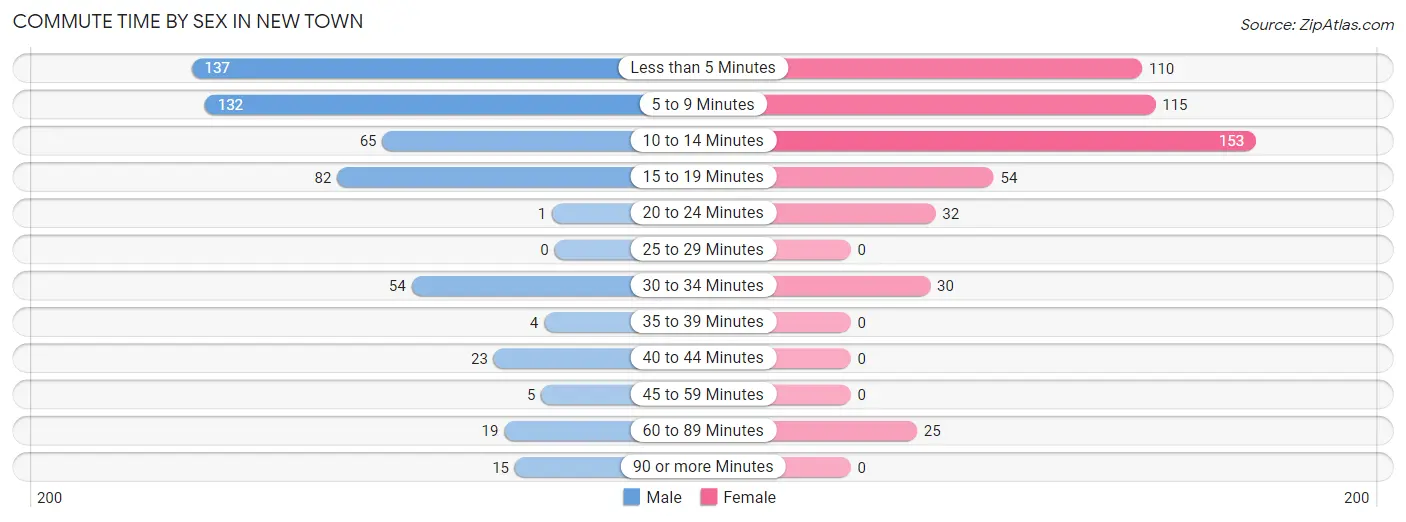
| Commute Time | Male | Female |
| Less than 5 Minutes | 137 (25.5%) | 110 (21.2%) |
| 5 to 9 Minutes | 132 (24.6%) | 115 (22.2%) |
| 10 to 14 Minutes | 65 (12.1%) | 153 (29.5%) |
| 15 to 19 Minutes | 82 (15.3%) | 54 (10.4%) |
| 20 to 24 Minutes | 1 (0.2%) | 32 (6.2%) |
| 25 to 29 Minutes | 0 (0.0%) | 0 (0.0%) |
| 30 to 34 Minutes | 54 (10.1%) | 30 (5.8%) |
| 35 to 39 Minutes | 4 (0.7%) | 0 (0.0%) |
| 40 to 44 Minutes | 23 (4.3%) | 0 (0.0%) |
| 45 to 59 Minutes | 5 (0.9%) | 0 (0.0%) |
| 60 to 89 Minutes | 19 (3.5%) | 25 (4.8%) |
| 90 or more Minutes | 15 (2.8%) | 0 (0.0%) |
Time of Departure to Work by Sex in New Town
The most frequent times of departure to work in New Town are 7:30 AM to 7:59 AM (99, 18.4%) for males and 8:00 AM to 8:29 AM (123, 23.7%) for females.
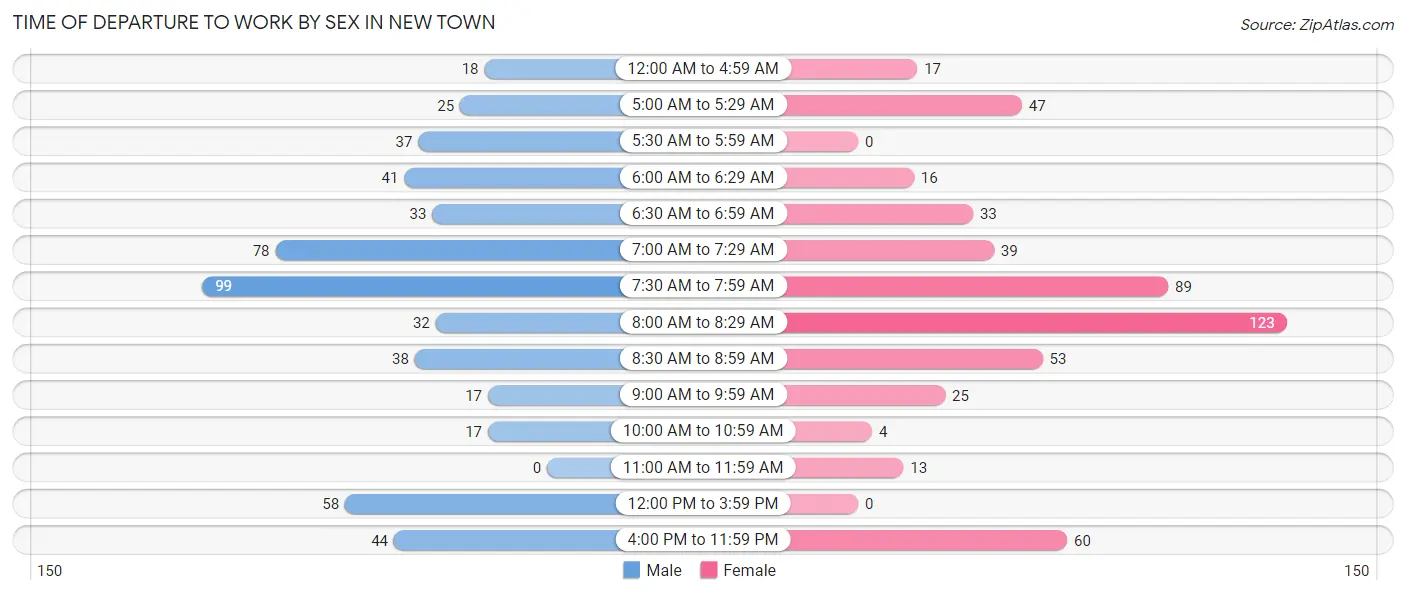
| Time of Departure | Male | Female |
| 12:00 AM to 4:59 AM | 18 (3.4%) | 17 (3.3%) |
| 5:00 AM to 5:29 AM | 25 (4.7%) | 47 (9.1%) |
| 5:30 AM to 5:59 AM | 37 (6.9%) | 0 (0.0%) |
| 6:00 AM to 6:29 AM | 41 (7.6%) | 16 (3.1%) |
| 6:30 AM to 6:59 AM | 33 (6.1%) | 33 (6.4%) |
| 7:00 AM to 7:29 AM | 78 (14.5%) | 39 (7.5%) |
| 7:30 AM to 7:59 AM | 99 (18.4%) | 89 (17.2%) |
| 8:00 AM to 8:29 AM | 32 (6.0%) | 123 (23.7%) |
| 8:30 AM to 8:59 AM | 38 (7.1%) | 53 (10.2%) |
| 9:00 AM to 9:59 AM | 17 (3.2%) | 25 (4.8%) |
| 10:00 AM to 10:59 AM | 17 (3.2%) | 4 (0.8%) |
| 11:00 AM to 11:59 AM | 0 (0.0%) | 13 (2.5%) |
| 12:00 PM to 3:59 PM | 58 (10.8%) | 0 (0.0%) |
| 4:00 PM to 11:59 PM | 44 (8.2%) | 60 (11.6%) |
| Total | 537 (100.0%) | 519 (100.0%) |
Housing Occupancy in New Town
Occupancy by Ownership in New Town
Of the total 830 dwellings in New Town, owner-occupied units account for 282 (34.0%), while renter-occupied units make up 548 (66.0%).
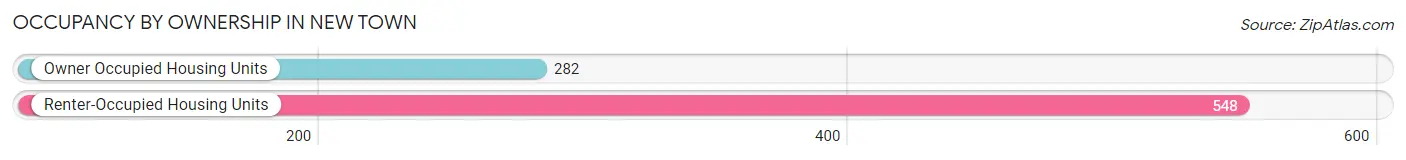
| Occupancy | # Housing Units | % Housing Units |
| Owner Occupied Housing Units | 282 | 34.0% |
| Renter-Occupied Housing Units | 548 | 66.0% |
| Total Occupied Housing Units | 830 | 100.0% |
Occupancy by Household Size in New Town
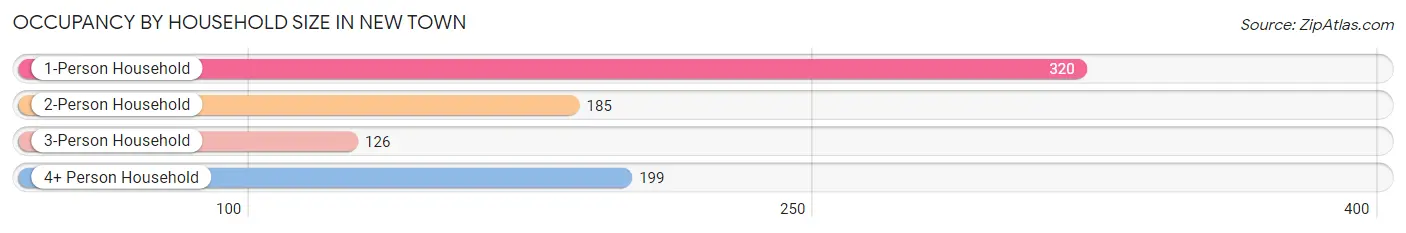
| Household Size | # Housing Units | % Housing Units |
| 1-Person Household | 320 | 38.6% |
| 2-Person Household | 185 | 22.3% |
| 3-Person Household | 126 | 15.2% |
| 4+ Person Household | 199 | 24.0% |
| Total Housing Units | 830 | 100.0% |
Occupancy by Ownership by Household Size in New Town
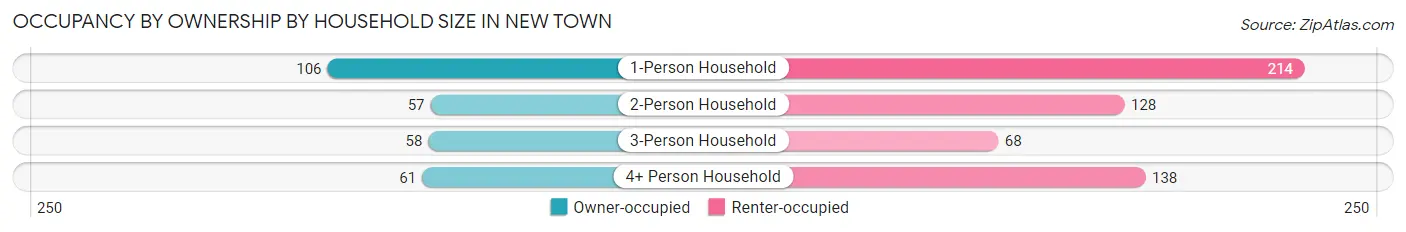
| Household Size | Owner-occupied | Renter-occupied |
| 1-Person Household | 106 (33.1%) | 214 (66.9%) |
| 2-Person Household | 57 (30.8%) | 128 (69.2%) |
| 3-Person Household | 58 (46.0%) | 68 (54.0%) |
| 4+ Person Household | 61 (30.6%) | 138 (69.4%) |
| Total Housing Units | 282 (34.0%) | 548 (66.0%) |
Occupancy by Educational Attainment in New Town
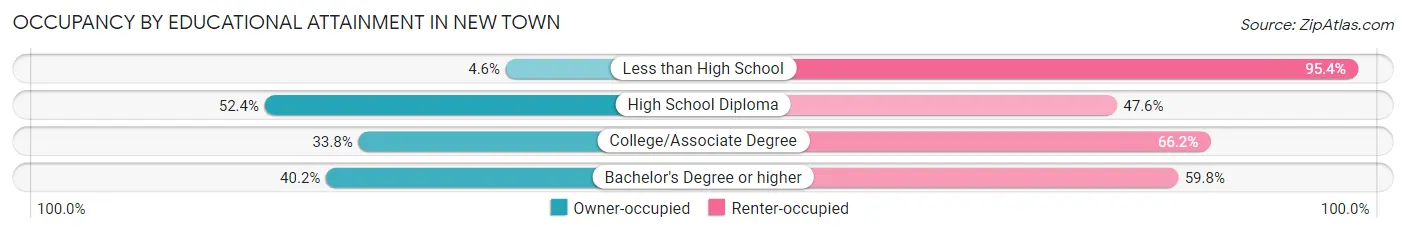
| Household Size | Owner-occupied | Renter-occupied |
| Less than High School | 6 (4.6%) | 125 (95.4%) |
| High School Diploma | 77 (52.4%) | 70 (47.6%) |
| College/Associate Degree | 121 (33.8%) | 237 (66.2%) |
| Bachelor's Degree or higher | 78 (40.2%) | 116 (59.8%) |
Occupancy by Age of Householder in New Town
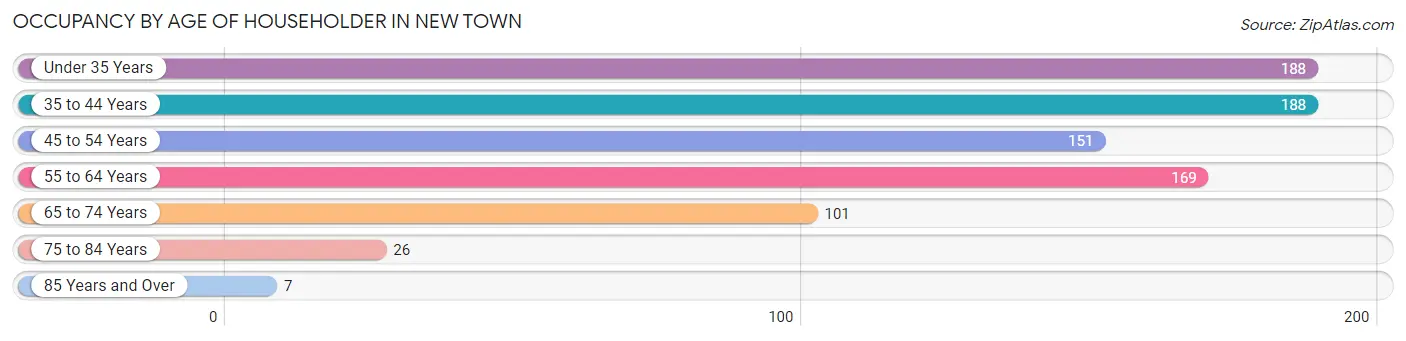
| Age Bracket | # Households | % Households |
| Under 35 Years | 188 | 22.7% |
| 35 to 44 Years | 188 | 22.7% |
| 45 to 54 Years | 151 | 18.2% |
| 55 to 64 Years | 169 | 20.4% |
| 65 to 74 Years | 101 | 12.2% |
| 75 to 84 Years | 26 | 3.1% |
| 85 Years and Over | 7 | 0.8% |
| Total | 830 | 100.0% |
Housing Finances in New Town
Median Income by Occupancy in New Town
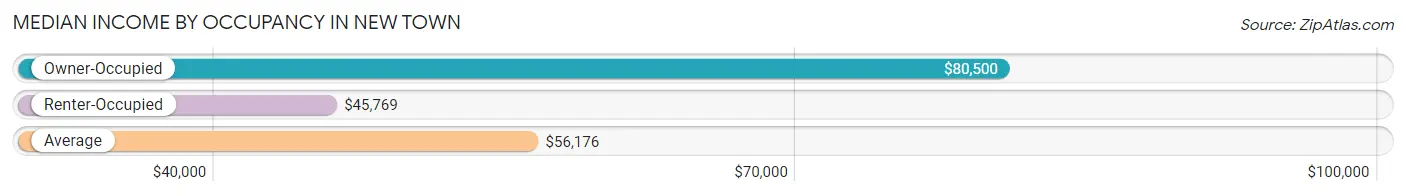
| Occupancy Type | # Households | Median Income |
| Owner-Occupied | 282 (34.0%) | $80,500 |
| Renter-Occupied | 548 (66.0%) | $45,769 |
| Average | 830 (100.0%) | $56,176 |
Occupancy by Householder Income Bracket in New Town
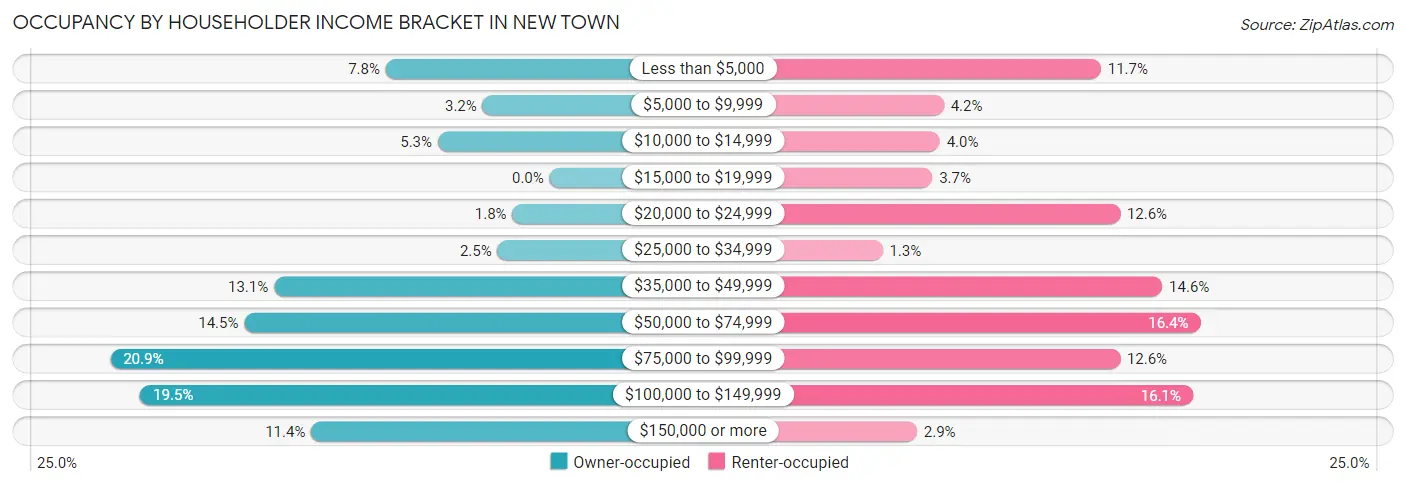
| Income Bracket | Owner-occupied | Renter-occupied |
| Less than $5,000 | 22 (7.8%) | 64 (11.7%) |
| $5,000 to $9,999 | 9 (3.2%) | 23 (4.2%) |
| $10,000 to $14,999 | 15 (5.3%) | 22 (4.0%) |
| $15,000 to $19,999 | 0 (0.0%) | 20 (3.6%) |
| $20,000 to $24,999 | 5 (1.8%) | 69 (12.6%) |
| $25,000 to $34,999 | 7 (2.5%) | 7 (1.3%) |
| $35,000 to $49,999 | 37 (13.1%) | 80 (14.6%) |
| $50,000 to $74,999 | 41 (14.5%) | 90 (16.4%) |
| $75,000 to $99,999 | 59 (20.9%) | 69 (12.6%) |
| $100,000 to $149,999 | 55 (19.5%) | 88 (16.1%) |
| $150,000 or more | 32 (11.4%) | 16 (2.9%) |
| Total | 282 (100.0%) | 548 (100.0%) |
Monthly Housing Cost Tiers in New Town
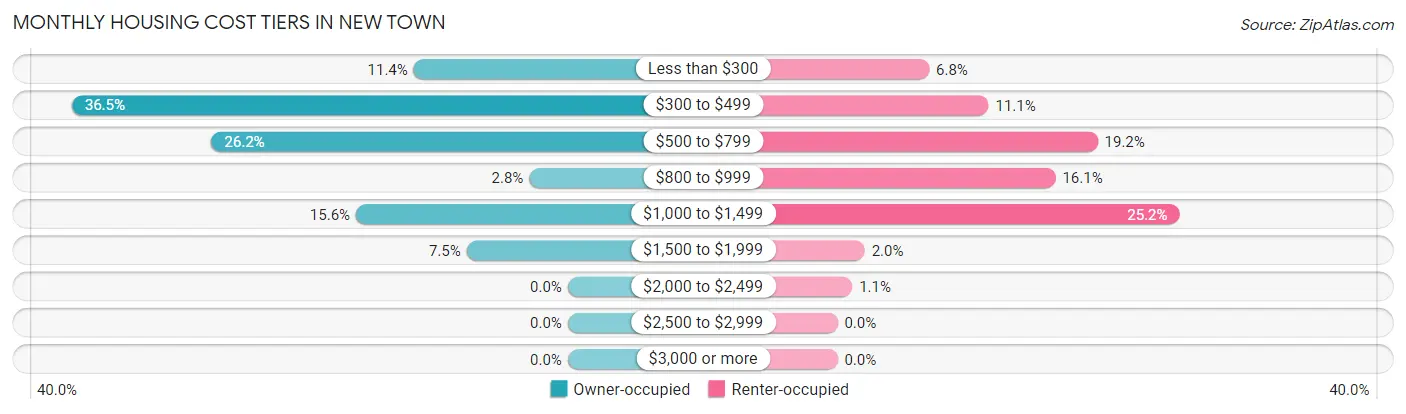
| Monthly Cost | Owner-occupied | Renter-occupied |
| Less than $300 | 32 (11.4%) | 37 (6.8%) |
| $300 to $499 | 103 (36.5%) | 61 (11.1%) |
| $500 to $799 | 74 (26.2%) | 105 (19.2%) |
| $800 to $999 | 8 (2.8%) | 88 (16.1%) |
| $1,000 to $1,499 | 44 (15.6%) | 138 (25.2%) |
| $1,500 to $1,999 | 21 (7.4%) | 11 (2.0%) |
| $2,000 to $2,499 | 0 (0.0%) | 6 (1.1%) |
| $2,500 to $2,999 | 0 (0.0%) | 0 (0.0%) |
| $3,000 or more | 0 (0.0%) | 0 (0.0%) |
| Total | 282 (100.0%) | 548 (100.0%) |
Physical Housing Characteristics in New Town
Housing Structures in New Town
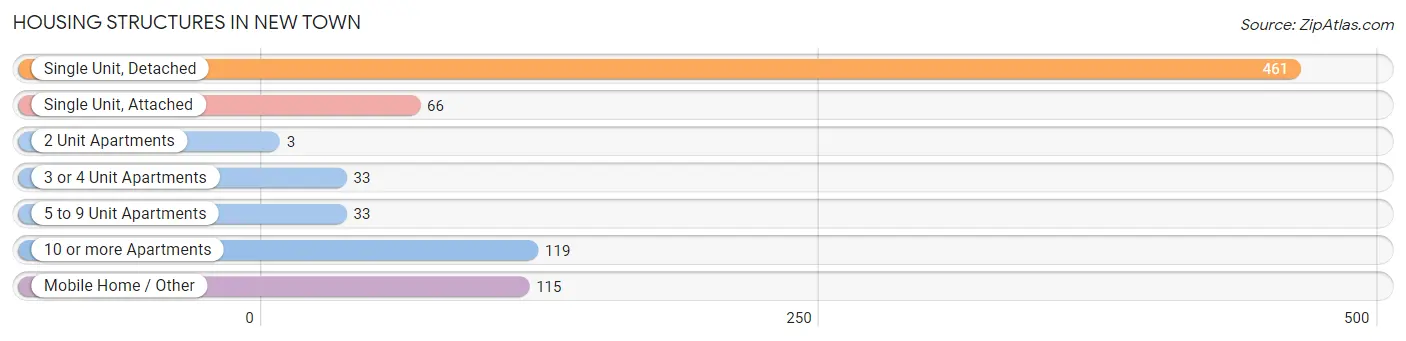
| Structure Type | # Housing Units | % Housing Units |
| Single Unit, Detached | 461 | 55.5% |
| Single Unit, Attached | 66 | 8.0% |
| 2 Unit Apartments | 3 | 0.4% |
| 3 or 4 Unit Apartments | 33 | 4.0% |
| 5 to 9 Unit Apartments | 33 | 4.0% |
| 10 or more Apartments | 119 | 14.3% |
| Mobile Home / Other | 115 | 13.9% |
| Total | 830 | 100.0% |
Housing Structures by Occupancy in New Town
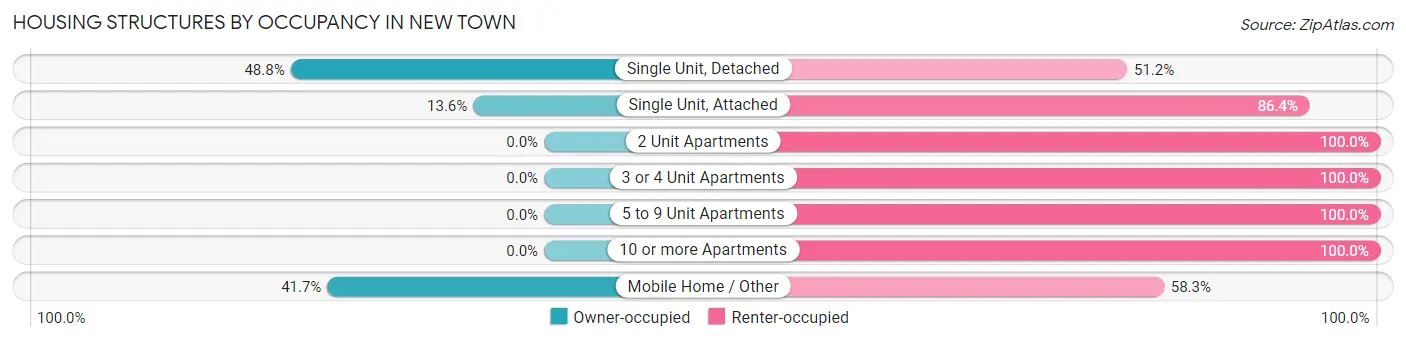
| Structure Type | Owner-occupied | Renter-occupied |
| Single Unit, Detached | 225 (48.8%) | 236 (51.2%) |
| Single Unit, Attached | 9 (13.6%) | 57 (86.4%) |
| 2 Unit Apartments | 0 (0.0%) | 3 (100.0%) |
| 3 or 4 Unit Apartments | 0 (0.0%) | 33 (100.0%) |
| 5 to 9 Unit Apartments | 0 (0.0%) | 33 (100.0%) |
| 10 or more Apartments | 0 (0.0%) | 119 (100.0%) |
| Mobile Home / Other | 48 (41.7%) | 67 (58.3%) |
| Total | 282 (34.0%) | 548 (66.0%) |
Housing Structures by Number of Rooms in New Town
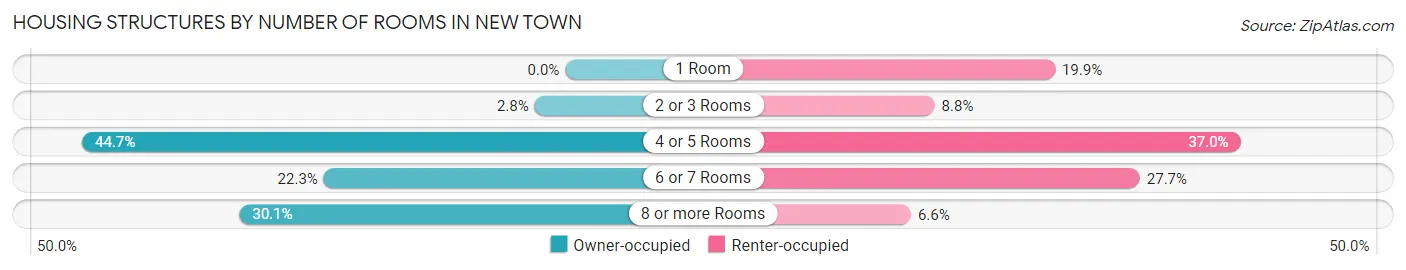
| Number of Rooms | Owner-occupied | Renter-occupied |
| 1 Room | 0 (0.0%) | 109 (19.9%) |
| 2 or 3 Rooms | 8 (2.8%) | 48 (8.8%) |
| 4 or 5 Rooms | 126 (44.7%) | 203 (37.0%) |
| 6 or 7 Rooms | 63 (22.3%) | 152 (27.7%) |
| 8 or more Rooms | 85 (30.1%) | 36 (6.6%) |
| Total | 282 (100.0%) | 548 (100.0%) |
Housing Structure by Heating Type in New Town
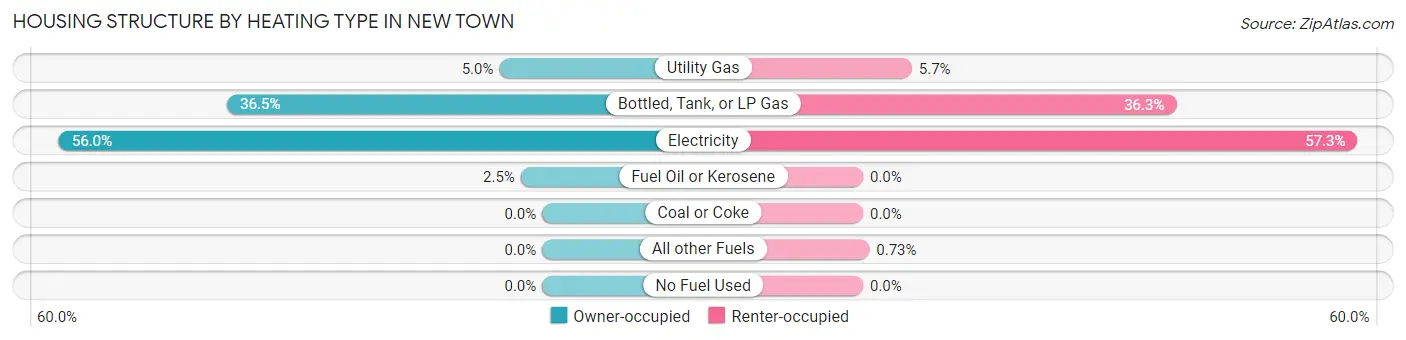
| Heating Type | Owner-occupied | Renter-occupied |
| Utility Gas | 14 (5.0%) | 31 (5.7%) |
| Bottled, Tank, or LP Gas | 103 (36.5%) | 199 (36.3%) |
| Electricity | 158 (56.0%) | 314 (57.3%) |
| Fuel Oil or Kerosene | 7 (2.5%) | 0 (0.0%) |
| Coal or Coke | 0 (0.0%) | 0 (0.0%) |
| All other Fuels | 0 (0.0%) | 4 (0.7%) |
| No Fuel Used | 0 (0.0%) | 0 (0.0%) |
| Total | 282 (100.0%) | 548 (100.0%) |
Household Vehicle Usage in New Town
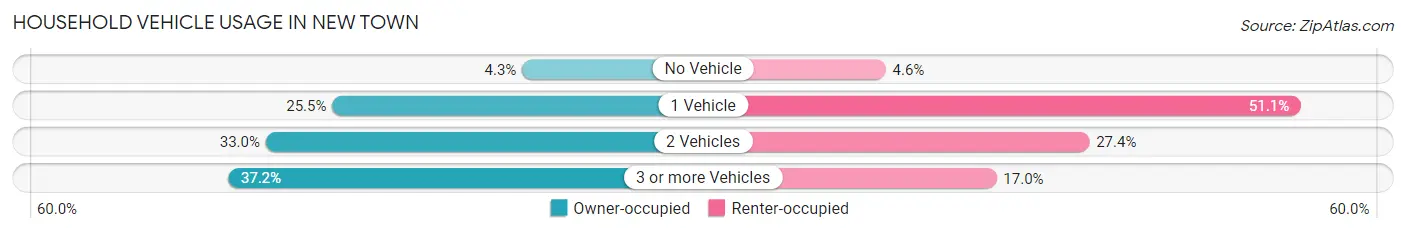
| Vehicles per Household | Owner-occupied | Renter-occupied |
| No Vehicle | 12 (4.3%) | 25 (4.6%) |
| 1 Vehicle | 72 (25.5%) | 280 (51.1%) |
| 2 Vehicles | 93 (33.0%) | 150 (27.4%) |
| 3 or more Vehicles | 105 (37.2%) | 93 (17.0%) |
| Total | 282 (100.0%) | 548 (100.0%) |
Real Estate & Mortgages in New Town
Real Estate and Mortgage Overview in New Town
| Characteristic | Without Mortgage | With Mortgage |
| Housing Units | 218 | 64 |
| Median Property Value | $183,300 | $173,100 |
| Median Household Income | $60,357 | $13 |
| Monthly Housing Costs | $471 | $0 |
| Real Estate Taxes | $1,403 | $27 |
Property Value by Mortgage Status in New Town
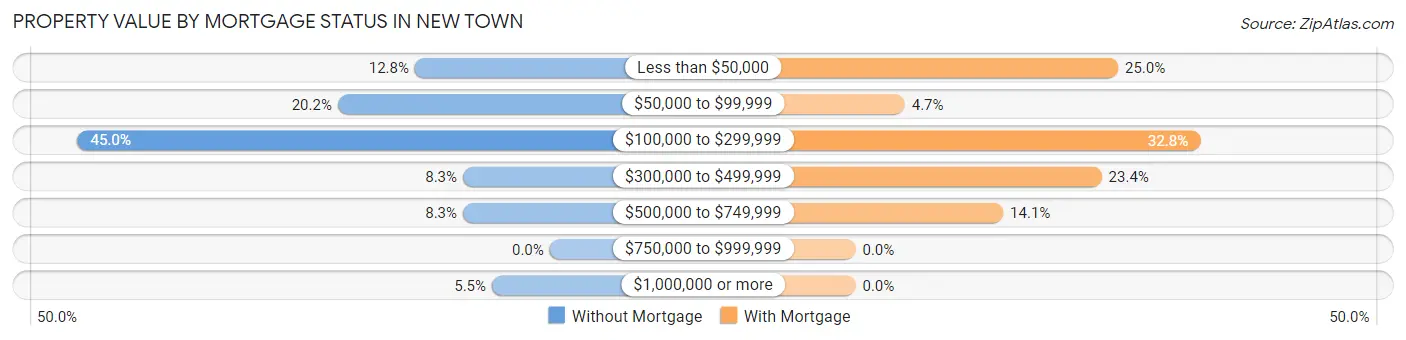
| Property Value | Without Mortgage | With Mortgage |
| Less than $50,000 | 28 (12.8%) | 16 (25.0%) |
| $50,000 to $99,999 | 44 (20.2%) | 3 (4.7%) |
| $100,000 to $299,999 | 98 (45.0%) | 21 (32.8%) |
| $300,000 to $499,999 | 18 (8.3%) | 15 (23.4%) |
| $500,000 to $749,999 | 18 (8.3%) | 9 (14.1%) |
| $750,000 to $999,999 | 0 (0.0%) | 0 (0.0%) |
| $1,000,000 or more | 12 (5.5%) | 0 (0.0%) |
| Total | 218 (100.0%) | 64 (100.0%) |
Household Income by Mortgage Status in New Town
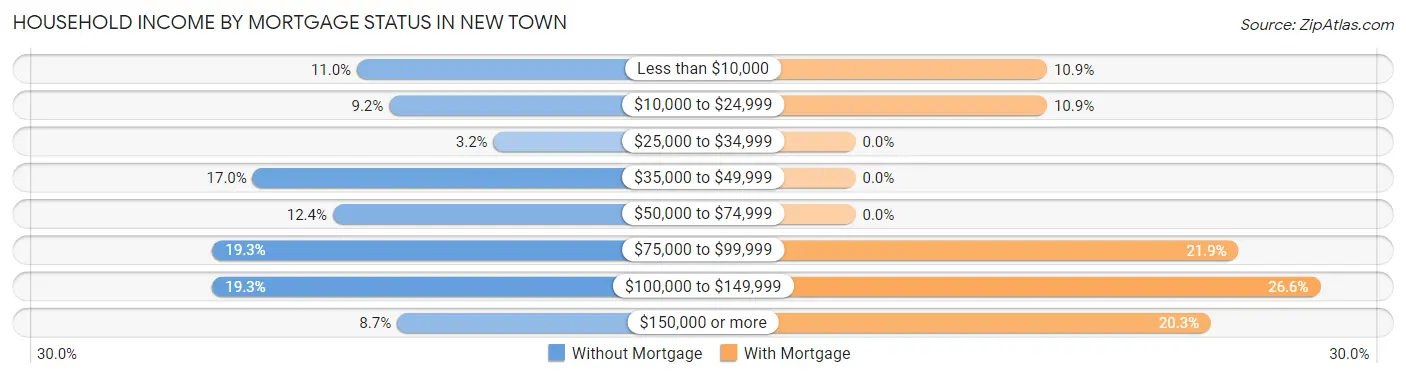
| Household Income | Without Mortgage | With Mortgage |
| Less than $10,000 | 24 (11.0%) | 7 (10.9%) |
| $10,000 to $24,999 | 20 (9.2%) | 7 (10.9%) |
| $25,000 to $34,999 | 7 (3.2%) | 0 (0.0%) |
| $35,000 to $49,999 | 37 (17.0%) | 0 (0.0%) |
| $50,000 to $74,999 | 27 (12.4%) | 0 (0.0%) |
| $75,000 to $99,999 | 42 (19.3%) | 14 (21.9%) |
| $100,000 to $149,999 | 42 (19.3%) | 17 (26.6%) |
| $150,000 or more | 19 (8.7%) | 13 (20.3%) |
| Total | 218 (100.0%) | 64 (100.0%) |
Property Value to Household Income Ratio in New Town
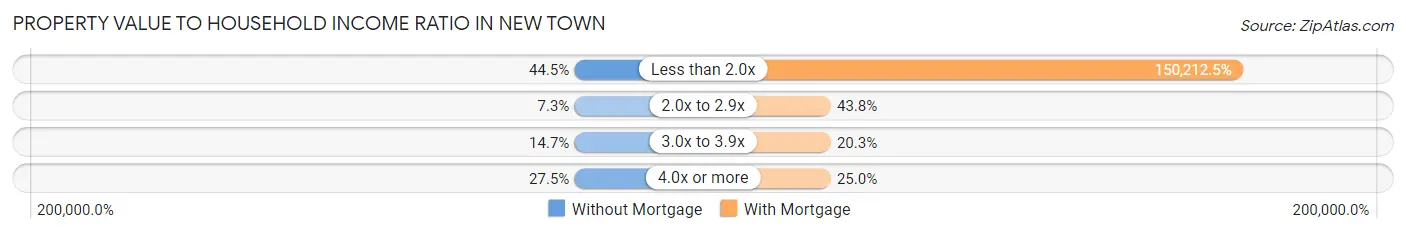
| Value-to-Income Ratio | Without Mortgage | With Mortgage |
| Less than 2.0x | 97 (44.5%) | 96,136 (150,212.5%) |
| 2.0x to 2.9x | 16 (7.3%) | 28 (43.8%) |
| 3.0x to 3.9x | 32 (14.7%) | 13 (20.3%) |
| 4.0x or more | 60 (27.5%) | 16 (25.0%) |
| Total | 218 (100.0%) | 64 (100.0%) |
Real Estate Taxes by Mortgage Status in New Town
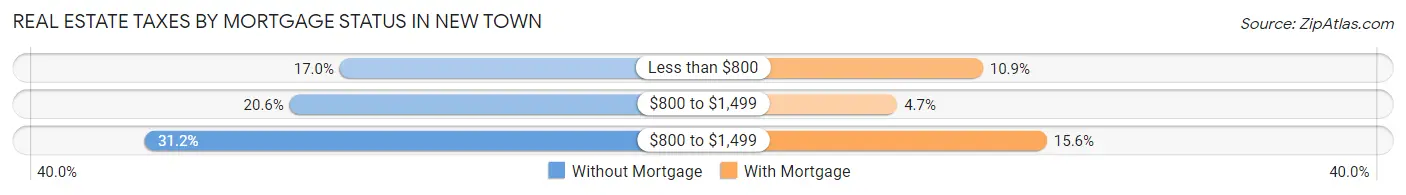
| Property Taxes | Without Mortgage | With Mortgage |
| Less than $800 | 37 (17.0%) | 7 (10.9%) |
| $800 to $1,499 | 45 (20.6%) | 3 (4.7%) |
| $800 to $1,499 | 68 (31.2%) | 10 (15.6%) |
| Total | 218 (100.0%) | 64 (100.0%) |
Health & Disability in New Town
Health Insurance Coverage by Age in New Town
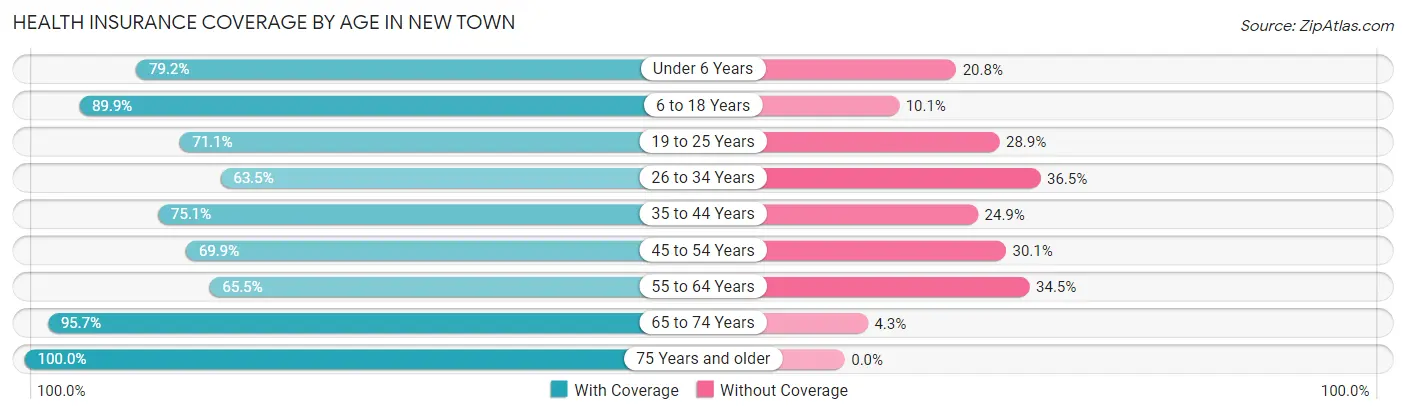
| Age Bracket | With Coverage | Without Coverage |
| Under 6 Years | 263 (79.2%) | 69 (20.8%) |
| 6 to 18 Years | 665 (89.9%) | 75 (10.1%) |
| 19 to 25 Years | 143 (71.1%) | 58 (28.9%) |
| 26 to 34 Years | 207 (63.5%) | 119 (36.5%) |
| 35 to 44 Years | 269 (75.1%) | 89 (24.9%) |
| 45 to 54 Years | 193 (69.9%) | 83 (30.1%) |
| 55 to 64 Years | 175 (65.5%) | 92 (34.5%) |
| 65 to 74 Years | 155 (95.7%) | 7 (4.3%) |
| 75 Years and older | 33 (100.0%) | 0 (0.0%) |
| Total | 2,103 (78.0%) | 592 (22.0%) |
Health Insurance Coverage by Citizenship Status in New Town
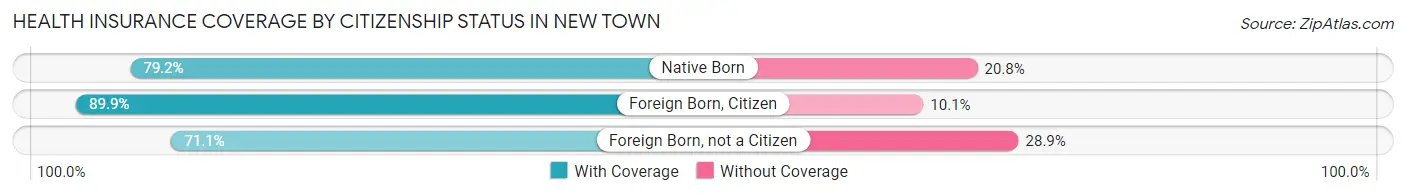
| Citizenship Status | With Coverage | Without Coverage |
| Native Born | 263 (79.2%) | 69 (20.8%) |
| Foreign Born, Citizen | 665 (89.9%) | 75 (10.1%) |
| Foreign Born, not a Citizen | 143 (71.1%) | 58 (28.9%) |
Health Insurance Coverage by Household Income in New Town
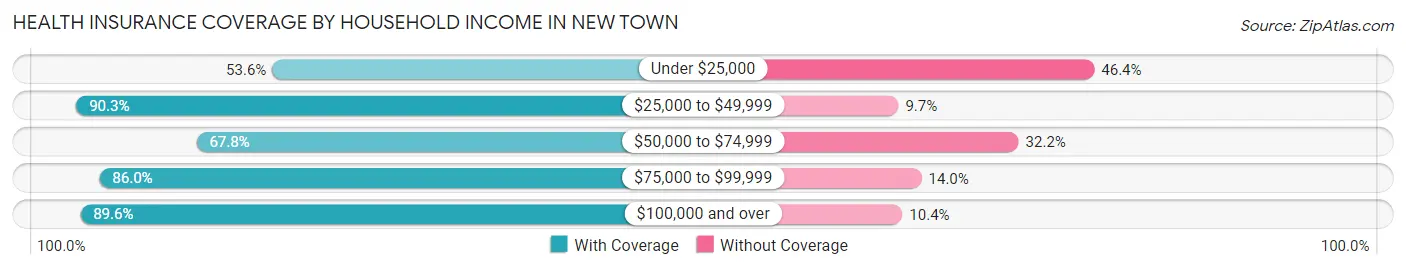
| Household Income | With Coverage | Without Coverage |
| Under $25,000 | 289 (53.6%) | 250 (46.4%) |
| $25,000 to $49,999 | 364 (90.3%) | 39 (9.7%) |
| $50,000 to $74,999 | 339 (67.8%) | 161 (32.2%) |
| $75,000 to $99,999 | 319 (86.0%) | 52 (14.0%) |
| $100,000 and over | 774 (89.6%) | 90 (10.4%) |
Public vs Private Health Insurance Coverage by Age in New Town
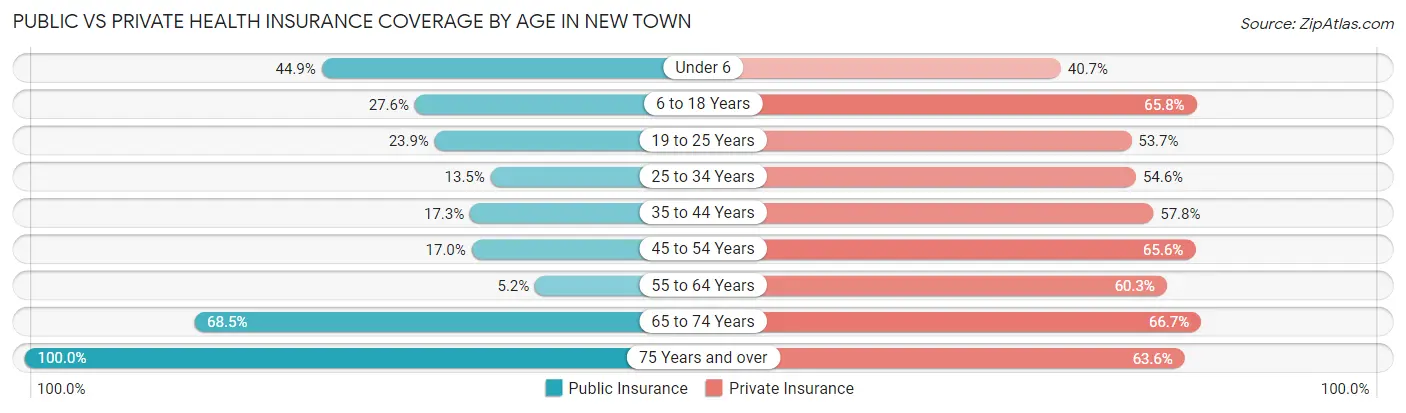
| Age Bracket | Public Insurance | Private Insurance |
| Under 6 | 149 (44.9%) | 135 (40.7%) |
| 6 to 18 Years | 204 (27.6%) | 487 (65.8%) |
| 19 to 25 Years | 48 (23.9%) | 108 (53.7%) |
| 25 to 34 Years | 44 (13.5%) | 178 (54.6%) |
| 35 to 44 Years | 62 (17.3%) | 207 (57.8%) |
| 45 to 54 Years | 47 (17.0%) | 181 (65.6%) |
| 55 to 64 Years | 14 (5.2%) | 161 (60.3%) |
| 65 to 74 Years | 111 (68.5%) | 108 (66.7%) |
| 75 Years and over | 33 (100.0%) | 21 (63.6%) |
| Total | 712 (26.4%) | 1,586 (58.9%) |
Disability Status by Sex by Age in New Town
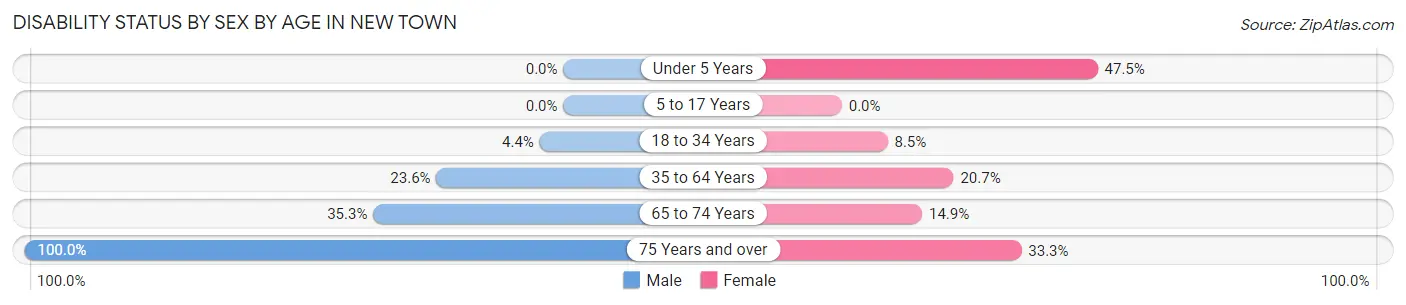
| Age Bracket | Male | Female |
| Under 5 Years | 0 (0.0%) | 66 (47.5%) |
| 5 to 17 Years | 0 (0.0%) | 0 (0.0%) |
| 18 to 34 Years | 15 (4.4%) | 27 (8.5%) |
| 35 to 64 Years | 102 (23.6%) | 97 (20.7%) |
| 65 to 74 Years | 24 (35.3%) | 14 (14.9%) |
| 75 Years and over | 12 (100.0%) | 7 (33.3%) |
Disability Class by Sex by Age in New Town
Disability Class: Hearing Difficulty
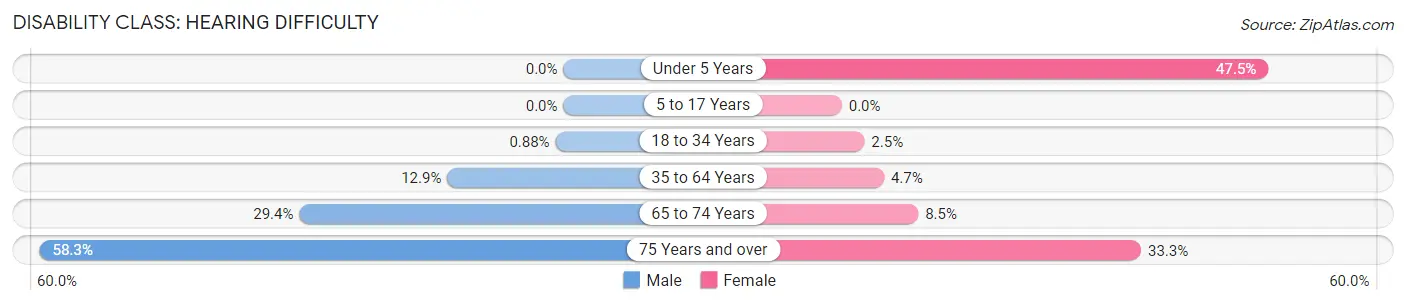
| Age Bracket | Male | Female |
| Under 5 Years | 0 (0.0%) | 66 (47.5%) |
| 5 to 17 Years | 0 (0.0%) | 0 (0.0%) |
| 18 to 34 Years | 3 (0.9%) | 8 (2.5%) |
| 35 to 64 Years | 56 (12.9%) | 22 (4.7%) |
| 65 to 74 Years | 20 (29.4%) | 8 (8.5%) |
| 75 Years and over | 7 (58.3%) | 7 (33.3%) |
Disability Class: Vision Difficulty
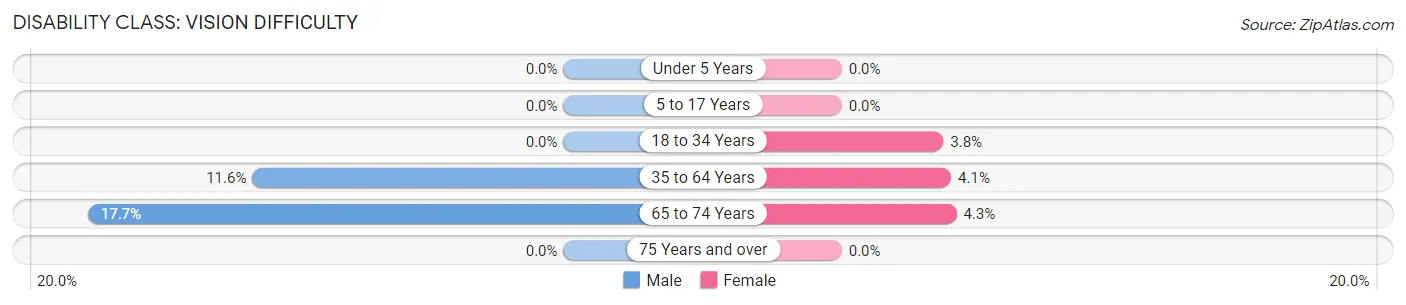
| Age Bracket | Male | Female |
| Under 5 Years | 0 (0.0%) | 0 (0.0%) |
| 5 to 17 Years | 0 (0.0%) | 0 (0.0%) |
| 18 to 34 Years | 0 (0.0%) | 12 (3.8%) |
| 35 to 64 Years | 50 (11.6%) | 19 (4.1%) |
| 65 to 74 Years | 12 (17.6%) | 4 (4.3%) |
| 75 Years and over | 0 (0.0%) | 0 (0.0%) |
Disability Class: Cognitive Difficulty
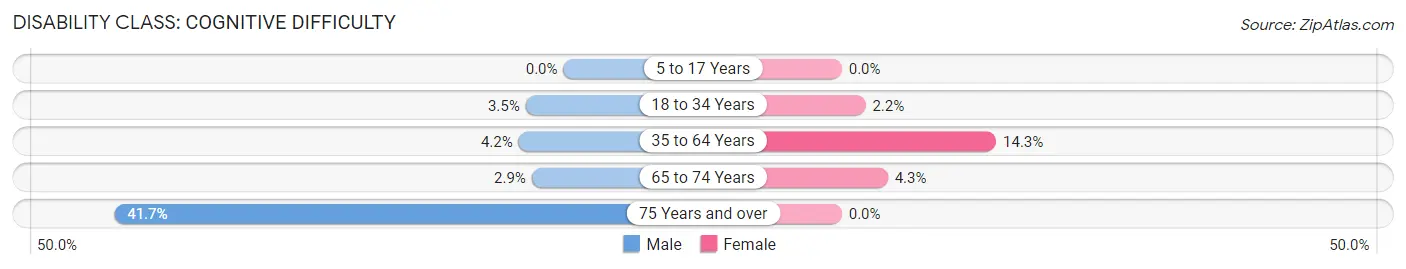
| Age Bracket | Male | Female |
| 5 to 17 Years | 0 (0.0%) | 0 (0.0%) |
| 18 to 34 Years | 12 (3.5%) | 7 (2.2%) |
| 35 to 64 Years | 18 (4.2%) | 67 (14.3%) |
| 65 to 74 Years | 2 (2.9%) | 4 (4.3%) |
| 75 Years and over | 5 (41.7%) | 0 (0.0%) |
Disability Class: Ambulatory Difficulty
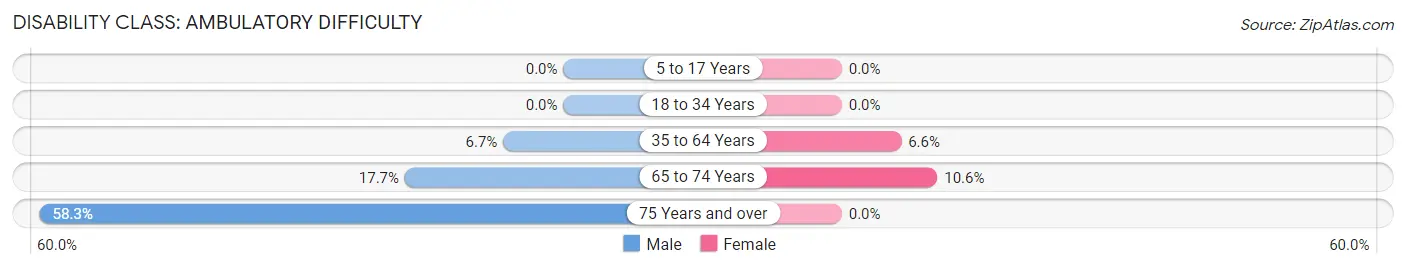
| Age Bracket | Male | Female |
| 5 to 17 Years | 0 (0.0%) | 0 (0.0%) |
| 18 to 34 Years | 0 (0.0%) | 0 (0.0%) |
| 35 to 64 Years | 29 (6.7%) | 31 (6.6%) |
| 65 to 74 Years | 12 (17.6%) | 10 (10.6%) |
| 75 Years and over | 7 (58.3%) | 0 (0.0%) |
Disability Class: Self-Care Difficulty
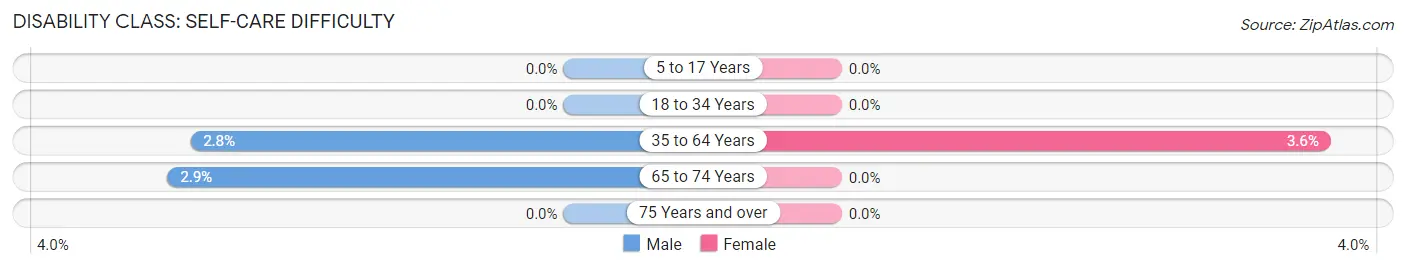
| Age Bracket | Male | Female |
| 5 to 17 Years | 0 (0.0%) | 0 (0.0%) |
| 18 to 34 Years | 0 (0.0%) | 0 (0.0%) |
| 35 to 64 Years | 12 (2.8%) | 17 (3.6%) |
| 65 to 74 Years | 2 (2.9%) | 0 (0.0%) |
| 75 Years and over | 0 (0.0%) | 0 (0.0%) |
Technology Access in New Town
Computing Device Access in New Town
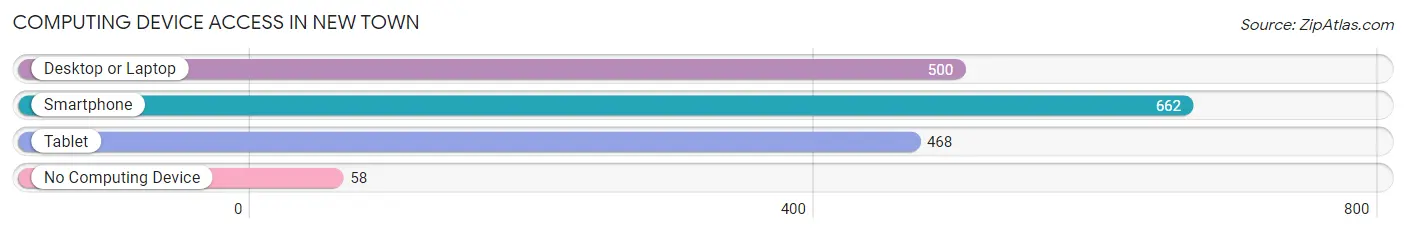
| Device Type | # Households | % Households |
| Desktop or Laptop | 500 | 60.2% |
| Smartphone | 662 | 79.8% |
| Tablet | 468 | 56.4% |
| No Computing Device | 58 | 7.0% |
| Total | 830 | 100.0% |
Internet Access in New Town
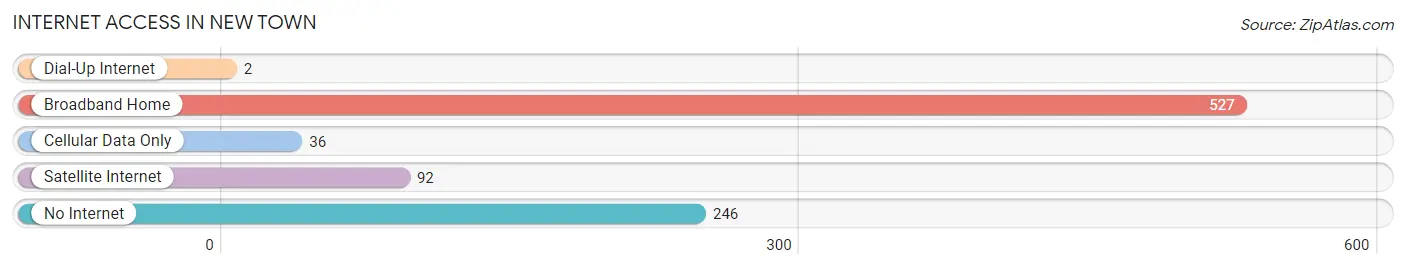
| Internet Type | # Households | % Households |
| Dial-Up Internet | 2 | 0.2% |
| Broadband Home | 527 | 63.5% |
| Cellular Data Only | 36 | 4.3% |
| Satellite Internet | 92 | 11.1% |
| No Internet | 246 | 29.6% |
| Total | 830 | 100.0% |
New Town Summary
New Town, North Dakota is a small city located in Mountrail County, in the northwestern part of the state. It is situated on the Fort Berthold Indian Reservation, and is the county seat of Mountrail County. The city was founded in 1951, and has a population of 2,639 as of the 2010 census.
History
New Town was founded in 1951, when the U.S. government relocated members of the Three Affiliated Tribes of the Fort Berthold Indian Reservation to the area. The relocation was part of a larger effort to consolidate the reservation, which had been divided into several smaller parcels of land. The relocation was controversial, as many of the tribal members were forced to leave their homes and move to a new area.
The city was named after the nearby town of New Town, which had been established in 1885. The city was incorporated in 1953, and has since grown to become the largest city on the Fort Berthold Indian Reservation.
Geography
New Town is located in northwestern North Dakota, in Mountrail County. It is situated on the Fort Berthold Indian Reservation, and is the county seat of Mountrail County. The city is located at the intersection of U.S. Route 85 and North Dakota Highway 23.
The city has a total area of 2.2 square miles, all of which is land. The city is located in a flat, open area, with no major bodies of water nearby. The nearest major body of water is Lake Sakakawea, which is located about 25 miles to the east.
Economy
New Town’s economy is largely based on the oil and gas industry. The city is home to several oil and gas companies, including Continental Resources, Hess Corporation, and Marathon Oil. The city is also home to several other businesses, including a grocery store, a hardware store, and a bank.
The city is also home to the Three Affiliated Tribes of the Fort Berthold Indian Reservation, which operates several businesses in the area. These businesses include a casino, a hotel, and a gas station.
Demographics
As of the 2010 census, New Town had a population of 2,639. The racial makeup of the city was 94.3% Native American, 4.2% White, 0.2% African American, 0.1% Asian, and 0.2% from other races. The median household income was $30,938, and the median family income was $35,938.
The city has a high rate of poverty, with 33.3% of the population living below the poverty line. The unemployment rate is also high, at 8.3%. The city has a high rate of crime, with a violent crime rate of 8.3 per 1,000 residents.
Conclusion
New Town, North Dakota is a small city located in Mountrail County, in the northwestern part of the state. It is situated on the Fort Berthold Indian Reservation, and is the county seat of Mountrail County. The city was founded in 1951, and has a population of 2,639 as of the 2010 census. The city’s economy is largely based on the oil and gas industry, and it is also home to several businesses owned by the Three Affiliated Tribes of the Fort Berthold Indian Reservation. The city has a high rate of poverty, with 33.3% of the population living below the poverty line, and a high rate of crime, with a violent crime rate of 8.3 per 1,000 residents.
Common Questions
What is Per Capita Income in New Town?
Per Capita income in New Town is $23,263.
What is the Median Family Income in New Town?
Median Family Income in New Town is $59,792.
What is the Median Household income in New Town?
Median Household Income in New Town is $56,176.
What is Income or Wage Gap in New Town?
Income or Wage Gap in New Town is 5.2%.
Women in New Town earn 94.8 cents for every dollar earned by a man.
What is Inequality or Gini Index in New Town?
Inequality or Gini Index in New Town is 0.44.
What is the Total Population of New Town?
Total Population of New Town is 2,714.
What is the Total Male Population of New Town?
Total Male Population of New Town is 1,329.
What is the Total Female Population of New Town?
Total Female Population of New Town is 1,385.
What is the Ratio of Males per 100 Females in New Town?
There are 95.96 Males per 100 Females in New Town.
What is the Ratio of Females per 100 Males in New Town?
There are 104.21 Females per 100 Males in New Town.
What is the Median Population Age in New Town?
Median Population Age in New Town is 28.4 Years.
What is the Average Family Size in New Town
Average Family Size in New Town is 4.5 People.
What is the Average Household Size in New Town
Average Household Size in New Town is 3.2 People.
How Large is the Labor Force in New Town?
There are 1,122 People in the Labor Forcein in New Town.
What is the Percentage of People in the Labor Force in New Town?
61.5% of People are in the Labor Force in New Town.
What is the Unemployment Rate in New Town?
Unemployment Rate in New Town is 3.9%.