Beulah, ND Map & Demographics
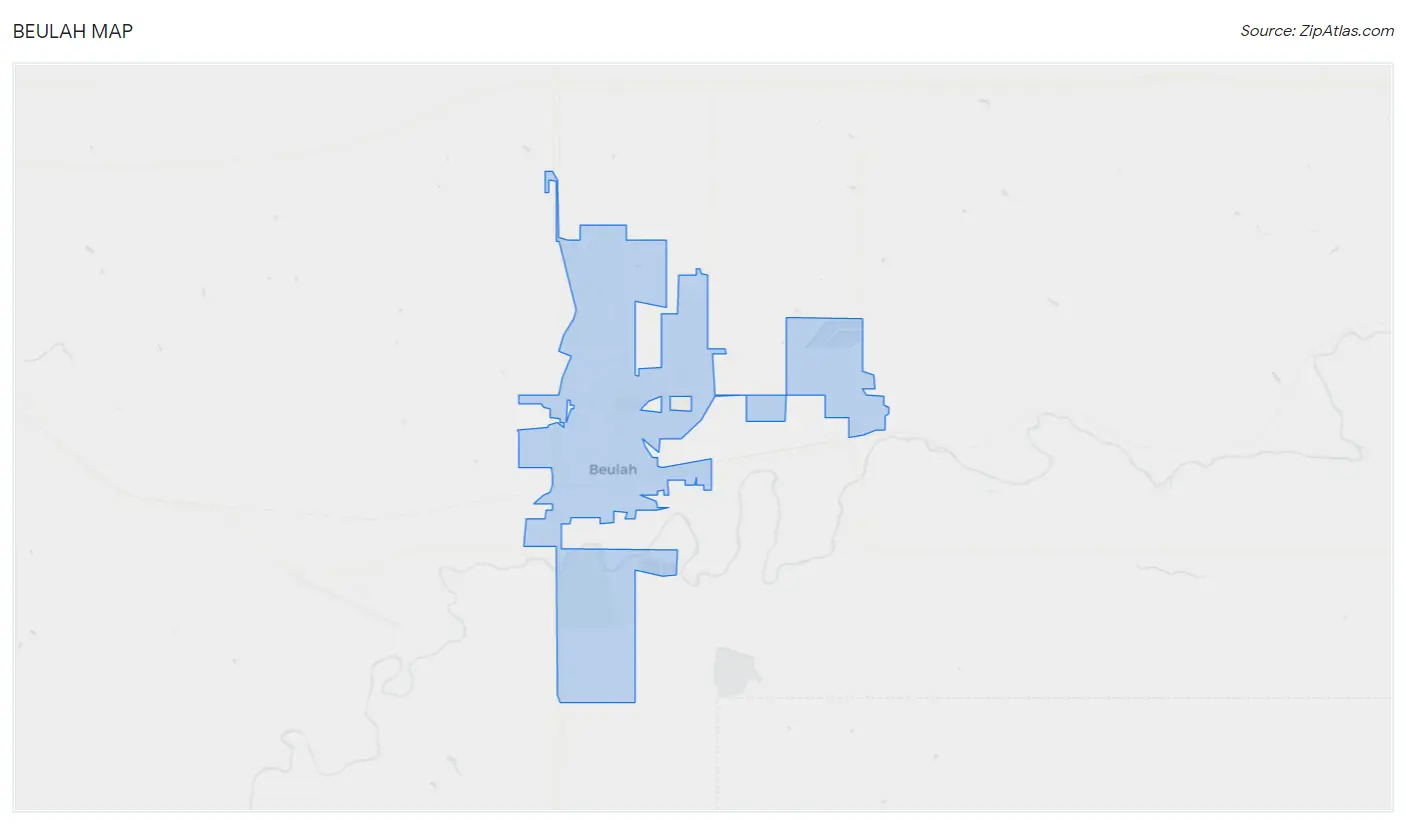
Beulah Map
Beulah Overview
$36,040
PER CAPITA INCOME
$108,750
AVG FAMILY INCOME
$90,655
AVG HOUSEHOLD INCOME
64.9%
WAGE / INCOME GAP [ % ]
35.1¢/ $1
WAGE / INCOME GAP [ $ ]
0.36
INEQUALITY / GINI INDEX
3,063
TOTAL POPULATION
1,466
MALE POPULATION
1,597
FEMALE POPULATION
91.80
MALES / 100 FEMALES
108.94
FEMALES / 100 MALES
40.3
MEDIAN AGE
2.7
AVG FAMILY SIZE
2.3
AVG HOUSEHOLD SIZE
1,579
LABOR FORCE [ PEOPLE ]
62.1%
PERCENT IN LABOR FORCE
0.6%
UNEMPLOYMENT RATE
Beulah Zip Codes
Beulah Area Codes
Income in Beulah
Income Overview in Beulah
Per Capita Income in Beulah is $36,040, while median incomes of families and households are $108,750 and $90,655 respectively.
| Characteristic | Number | Measure |
| Per Capita Income | 3,063 | $36,040 |
| Median Family Income | 884 | $108,750 |
| Mean Family Income | 884 | $111,504 |
| Median Household Income | 1,262 | $90,655 |
| Mean Household Income | 1,262 | $95,525 |
| Income Deficit | 884 | $0 |
| Wage / Income Gap (%) | 3,063 | 64.95% |
| Wage / Income Gap ($) | 3,063 | 35.05¢ per $1 |
| Gini / Inequality Index | 3,063 | 0.36 |
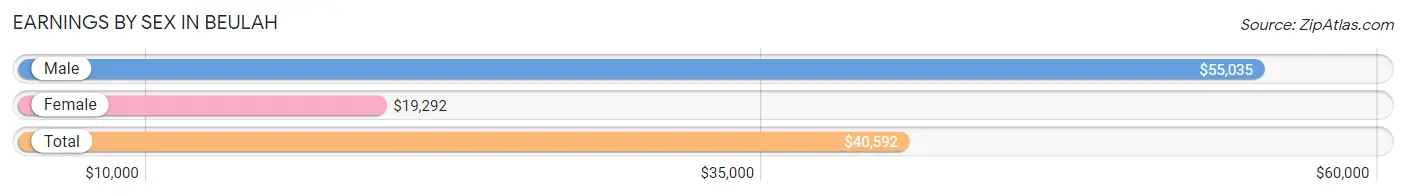
Earnings by Sex in Beulah
Average Earnings in Beulah are $40,592, $55,035 for men and $19,292 for women, a difference of 64.9%.
| Sex | Number | Average Earnings |
| Male | 993 (58.5%) | $55,035 |
| Female | 706 (41.5%) | $19,292 |
| Total | 1,699 (100.0%) | $40,592 |
Earnings by Sex by Income Bracket in Beulah
The most common earnings brackets in Beulah are $100,000+ for men (314 | 31.6%) and $2,499 or less for women (110 | 15.6%).
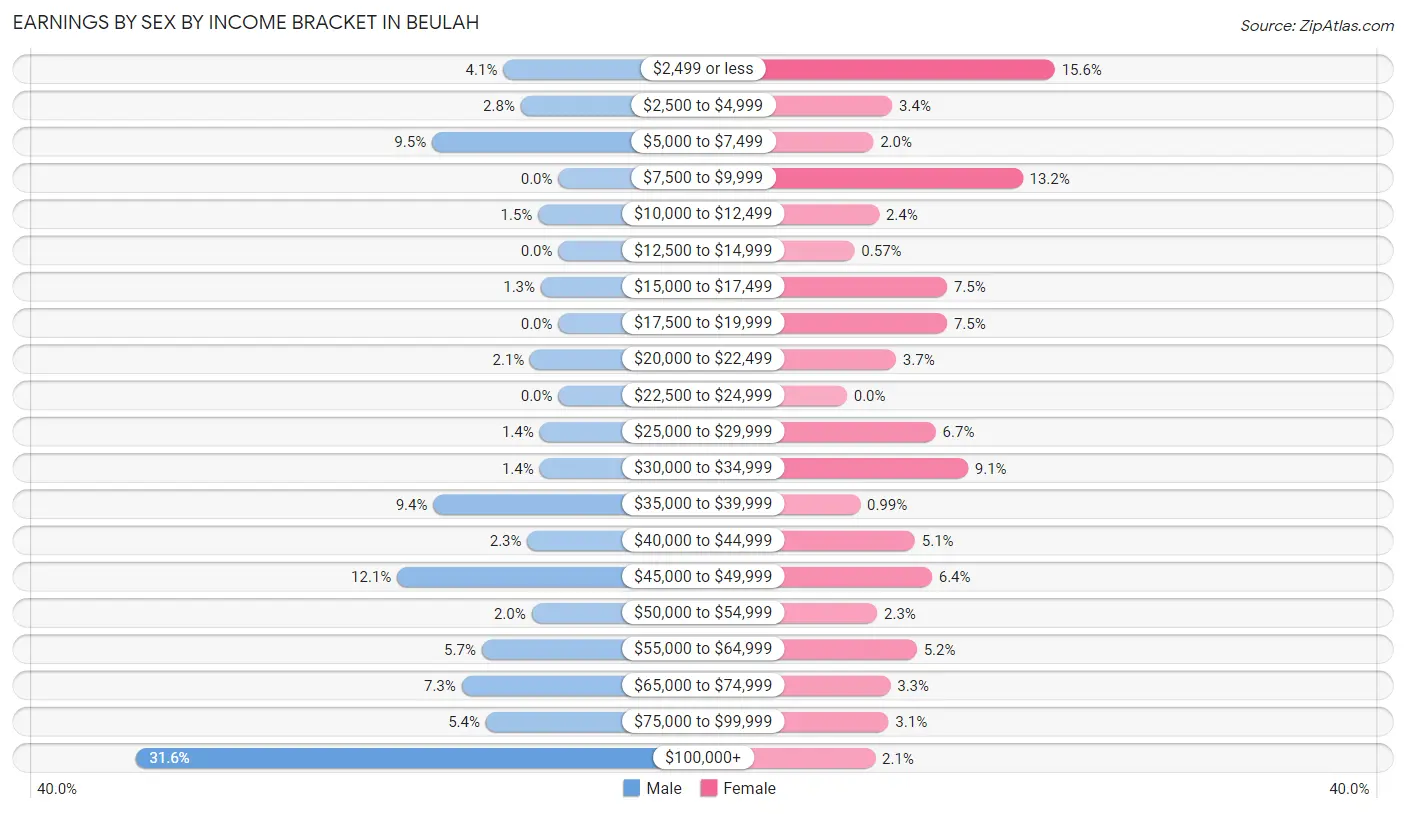
| Income | Male | Female |
| $2,499 or less | 41 (4.1%) | 110 (15.6%) |
| $2,500 to $4,999 | 28 (2.8%) | 24 (3.4%) |
| $5,000 to $7,499 | 94 (9.5%) | 14 (2.0%) |
| $7,500 to $9,999 | 0 (0.0%) | 93 (13.2%) |
| $10,000 to $12,499 | 15 (1.5%) | 17 (2.4%) |
| $12,500 to $14,999 | 0 (0.0%) | 4 (0.6%) |
| $15,000 to $17,499 | 13 (1.3%) | 53 (7.5%) |
| $17,500 to $19,999 | 0 (0.0%) | 53 (7.5%) |
| $20,000 to $22,499 | 21 (2.1%) | 26 (3.7%) |
| $22,500 to $24,999 | 0 (0.0%) | 0 (0.0%) |
| $25,000 to $29,999 | 14 (1.4%) | 47 (6.7%) |
| $30,000 to $34,999 | 14 (1.4%) | 64 (9.1%) |
| $35,000 to $39,999 | 93 (9.4%) | 7 (1.0%) |
| $40,000 to $44,999 | 23 (2.3%) | 36 (5.1%) |
| $45,000 to $49,999 | 120 (12.1%) | 45 (6.4%) |
| $50,000 to $54,999 | 20 (2.0%) | 16 (2.3%) |
| $55,000 to $64,999 | 57 (5.7%) | 37 (5.2%) |
| $65,000 to $74,999 | 72 (7.2%) | 23 (3.3%) |
| $75,000 to $99,999 | 54 (5.4%) | 22 (3.1%) |
| $100,000+ | 314 (31.6%) | 15 (2.1%) |
| Total | 993 (100.0%) | 706 (100.0%) |
Earnings by Sex by Educational Attainment in Beulah
Average earnings in Beulah are $66,094 for men and $29,441 for women, a difference of 55.5%. Men with an educational attainment of college or associate's degree enjoy the highest average annual earnings of $101,974, while those with less than high school education earn the least with $48,031. Women with an educational attainment of bachelor's degree earn the most with the average annual earnings of $46,618, while those with college or associate's degree education have the smallest earnings of $21,394.
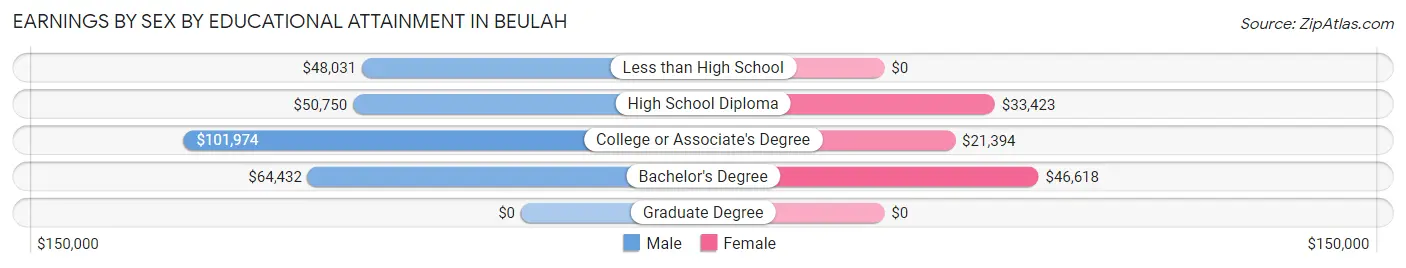
| Educational Attainment | Male Income | Female Income |
| Less than High School | $48,031 | $0 |
| High School Diploma | $50,750 | $33,423 |
| College or Associate's Degree | $101,974 | $21,394 |
| Bachelor's Degree | $64,432 | $46,618 |
| Graduate Degree | - | - |
| Total | $66,094 | $29,441 |
Family Income in Beulah
Family Income Brackets in Beulah
According to the Beulah family income data, there are 256 families falling into the $100,000 to $149,999 income range, which is the most common income bracket and makes up 29.0% of all families.
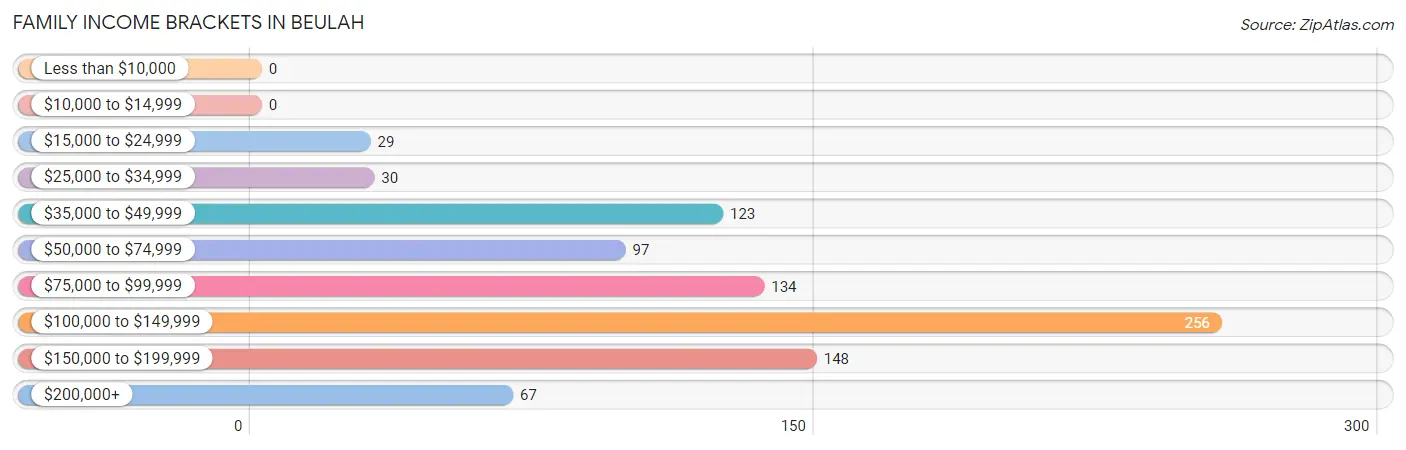
| Income Bracket | # Families | % Families |
| Less than $10,000 | 0 | 0.0% |
| $10,000 to $14,999 | 0 | 0.0% |
| $15,000 to $24,999 | 29 | 3.3% |
| $25,000 to $34,999 | 30 | 3.4% |
| $35,000 to $49,999 | 123 | 13.9% |
| $50,000 to $74,999 | 97 | 11.0% |
| $75,000 to $99,999 | 134 | 15.2% |
| $100,000 to $149,999 | 256 | 29.0% |
| $150,000 to $199,999 | 148 | 16.7% |
| $200,000+ | 67 | 7.6% |
Family Income by Famaliy Size in Beulah
3-person families (174 | 19.7%) account for the highest median family income in Beulah with $161,333 per family, while 3-person families (174 | 19.7%) have the highest median income of $53,778 per family member.
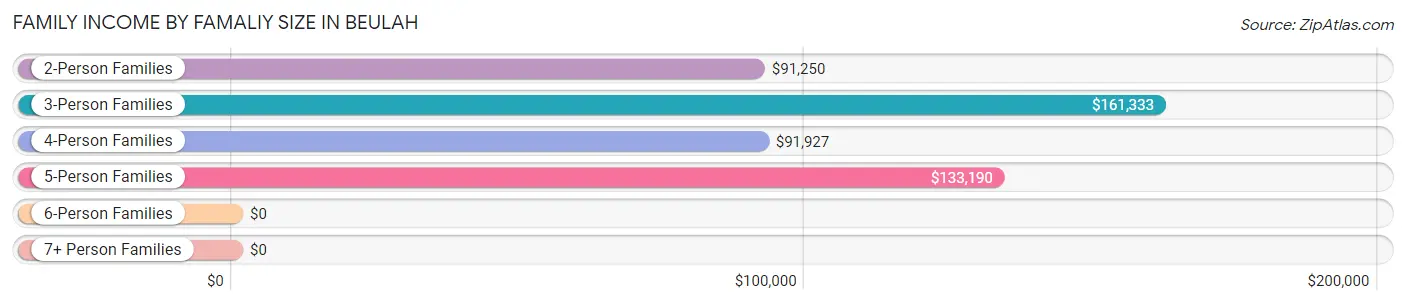
| Income Bracket | # Families | Median Income |
| 2-Person Families | 509 (57.6%) | $91,250 |
| 3-Person Families | 174 (19.7%) | $161,333 |
| 4-Person Families | 135 (15.3%) | $91,927 |
| 5-Person Families | 66 (7.5%) | $133,190 |
| 6-Person Families | 0 (0.0%) | $0 |
| 7+ Person Families | 0 (0.0%) | $0 |
| Total | 884 (100.0%) | $108,750 |
Family Income by Number of Earners in Beulah
The median family income in Beulah is $108,750, with families comprising 3+ earners (97) having the highest median family income of $186,719, while families with 1 earner (213) have the lowest median family income of $49,719, accounting for 11.0% and 24.1% of families, respectively.
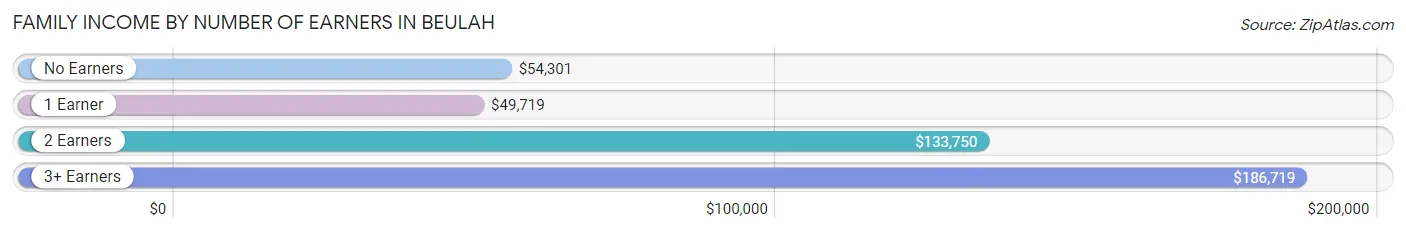
| Number of Earners | # Families | Median Income |
| No Earners | 165 (18.7%) | $54,301 |
| 1 Earner | 213 (24.1%) | $49,719 |
| 2 Earners | 409 (46.3%) | $133,750 |
| 3+ Earners | 97 (11.0%) | $186,719 |
| Total | 884 (100.0%) | $108,750 |
Household Income in Beulah
Household Income Brackets in Beulah
With 309 households falling in the category, the $100,000 to $149,999 income range is the most frequent in Beulah, accounting for 24.5% of all households. In contrast, only 15 households (1.2%) fall into the $10,000 to $14,999 income bracket, making it the least populous group.
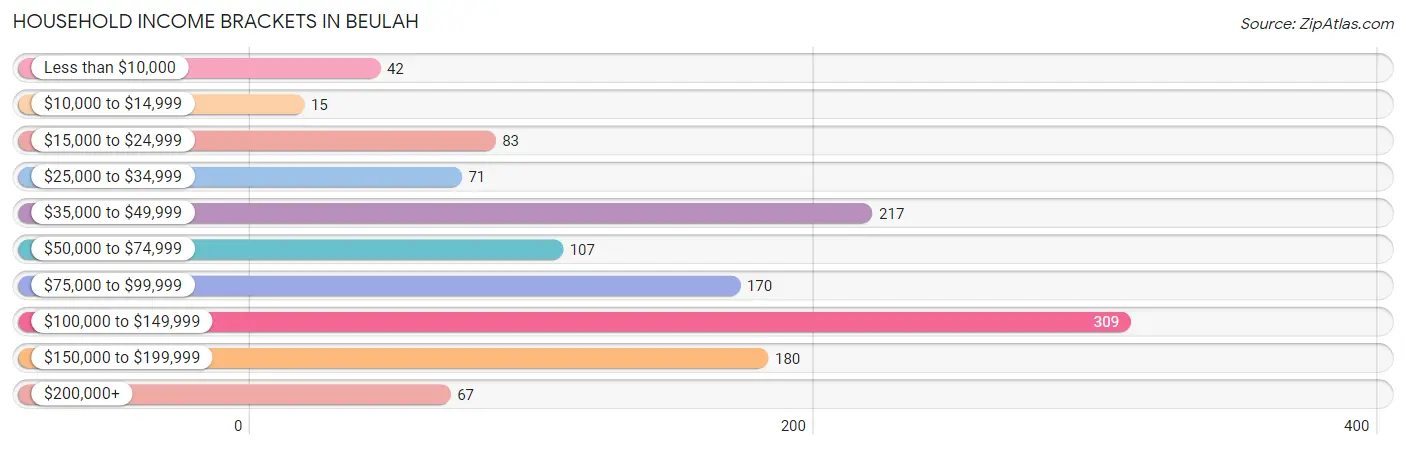
| Income Bracket | # Households | % Households |
| Less than $10,000 | 42 | 3.3% |
| $10,000 to $14,999 | 15 | 1.2% |
| $15,000 to $24,999 | 83 | 6.6% |
| $25,000 to $34,999 | 71 | 5.6% |
| $35,000 to $49,999 | 217 | 17.2% |
| $50,000 to $74,999 | 107 | 8.5% |
| $75,000 to $99,999 | 170 | 13.5% |
| $100,000 to $149,999 | 309 | 24.5% |
| $150,000 to $199,999 | 180 | 14.3% |
| $200,000+ | 67 | 5.3% |
Household Income by Householder Age in Beulah
The median household income in Beulah is $90,655, with the highest median household income of $120,694 found in the 25 to 44 years age bracket for the primary householder. A total of 426 households (33.8%) fall into this category. Meanwhile, the 15 to 24 years age bracket for the primary householder has the lowest median household income of $0, with 112 households (8.9%) in this group.
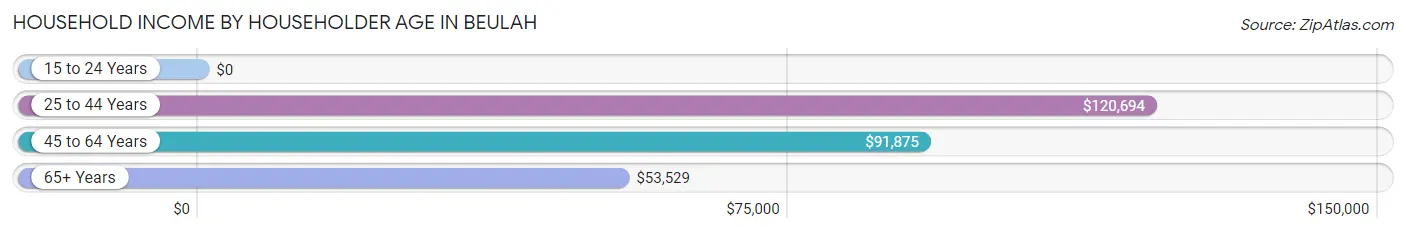
| Income Bracket | # Households | Median Income |
| 15 to 24 Years | 112 (8.9%) | $0 |
| 25 to 44 Years | 426 (33.8%) | $120,694 |
| 45 to 64 Years | 406 (32.2%) | $91,875 |
| 65+ Years | 318 (25.2%) | $53,529 |
| Total | 1,262 (100.0%) | $90,655 |
Poverty in Beulah
Income Below Poverty by Sex and Age in Beulah
With 5.0% poverty level for males and 9.0% for females among the residents of Beulah, 18 to 24 year old males and 18 to 24 year old females are the most vulnerable to poverty, with 71 males (35.9%) and 81 females (59.1%) in their respective age groups living below the poverty level.
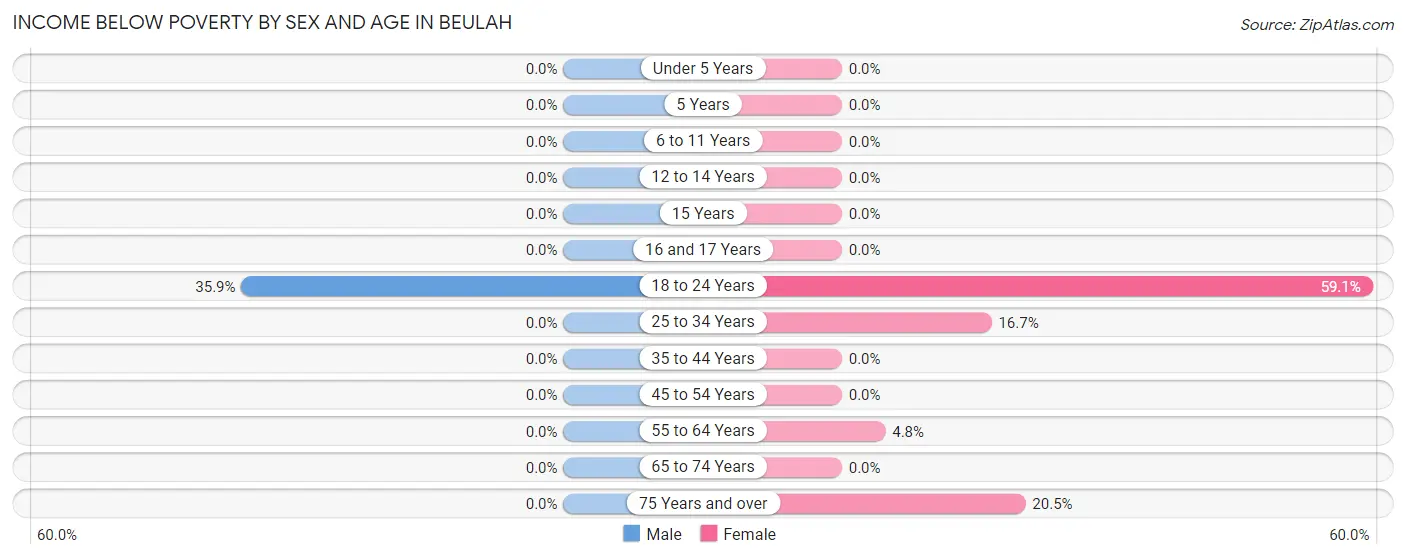
| Age Bracket | Male | Female |
| Under 5 Years | 0 (0.0%) | 0 (0.0%) |
| 5 Years | 0 (0.0%) | 0 (0.0%) |
| 6 to 11 Years | 0 (0.0%) | 0 (0.0%) |
| 12 to 14 Years | 0 (0.0%) | 0 (0.0%) |
| 15 Years | 0 (0.0%) | 0 (0.0%) |
| 16 and 17 Years | 0 (0.0%) | 0 (0.0%) |
| 18 to 24 Years | 71 (35.9%) | 81 (59.1%) |
| 25 to 34 Years | 0 (0.0%) | 18 (16.7%) |
| 35 to 44 Years | 0 (0.0%) | 0 (0.0%) |
| 45 to 54 Years | 0 (0.0%) | 0 (0.0%) |
| 55 to 64 Years | 0 (0.0%) | 12 (4.8%) |
| 65 to 74 Years | 0 (0.0%) | 0 (0.0%) |
| 75 Years and over | 0 (0.0%) | 27 (20.4%) |
| Total | 71 (5.0%) | 138 (9.0%) |
Income Above Poverty by Sex and Age in Beulah
According to the poverty statistics in Beulah, males aged under 5 years and females aged under 5 years are the age groups that are most secure financially, with 100.0% of males and 100.0% of females in these age groups living above the poverty line.
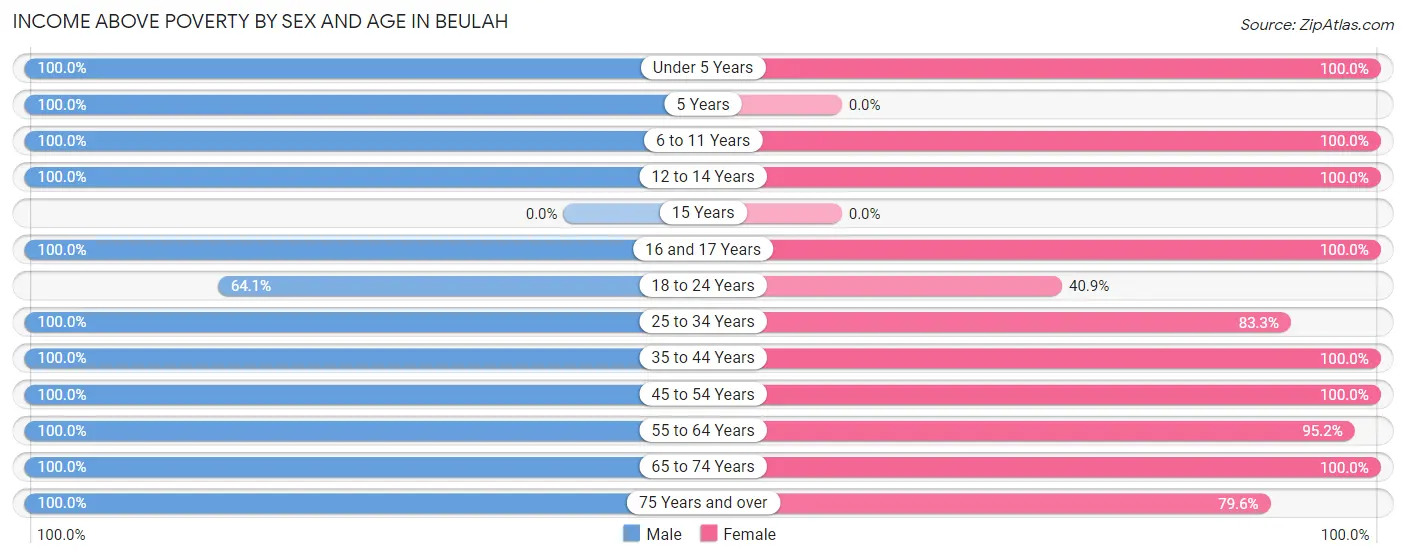
| Age Bracket | Male | Female |
| Under 5 Years | 68 (100.0%) | 142 (100.0%) |
| 5 Years | 13 (100.0%) | 0 (0.0%) |
| 6 to 11 Years | 85 (100.0%) | 101 (100.0%) |
| 12 to 14 Years | 42 (100.0%) | 70 (100.0%) |
| 15 Years | 0 (0.0%) | 0 (0.0%) |
| 16 and 17 Years | 94 (100.0%) | 76 (100.0%) |
| 18 to 24 Years | 127 (64.1%) | 56 (40.9%) |
| 25 to 34 Years | 175 (100.0%) | 90 (83.3%) |
| 35 to 44 Years | 200 (100.0%) | 222 (100.0%) |
| 45 to 54 Years | 147 (100.0%) | 170 (100.0%) |
| 55 to 64 Years | 200 (100.0%) | 236 (95.2%) |
| 65 to 74 Years | 119 (100.0%) | 123 (100.0%) |
| 75 Years and over | 76 (100.0%) | 105 (79.5%) |
| Total | 1,346 (95.0%) | 1,391 (91.0%) |
Income Below Poverty Among Married-Couple Families in Beulah
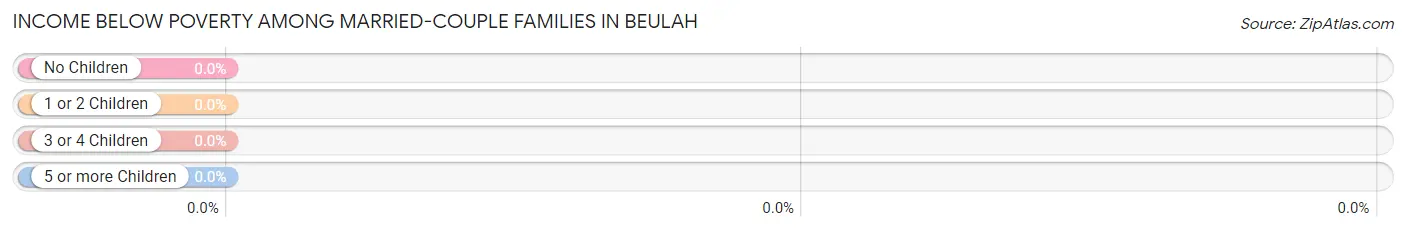
| Children | Above Poverty | Below Poverty |
| No Children | 424 (100.0%) | 0 (0.0%) |
| 1 or 2 Children | 261 (100.0%) | 0 (0.0%) |
| 3 or 4 Children | 66 (100.0%) | 0 (0.0%) |
| 5 or more Children | 0 (0.0%) | 0 (0.0%) |
| Total | 751 (100.0%) | 0 (0.0%) |
Income Below Poverty Among Single-Parent Households in Beulah
| Children | Single Father | Single Mother |
| No Children | 0 (0.0%) | 0 (0.0%) |
| 1 or 2 Children | 0 (0.0%) | 0 (0.0%) |
| 3 or 4 Children | 0 (0.0%) | 0 (0.0%) |
| 5 or more Children | 0 (0.0%) | 0 (0.0%) |
| Total | 0 (0.0%) | 0 (0.0%) |
Income Below Poverty Among Married-Couple vs Single-Parent Households in Beulah
| Children | Married-Couple Families | Single-Parent Households |
| No Children | 0 (0.0%) | 0 (0.0%) |
| 1 or 2 Children | 0 (0.0%) | 0 (0.0%) |
| 3 or 4 Children | 0 (0.0%) | 0 (0.0%) |
| 5 or more Children | 0 (0.0%) | 0 (0.0%) |
| Total | 0 (0.0%) | 0 (0.0%) |
Race in Beulah
The most populous races in Beulah are White / Caucasian (2,852 | 93.1%), Two or more Races (136 | 4.4%), and Hispanic or Latino (75 | 2.5%).
| Race | # Population | % Population |
| Asian | 25 | 0.8% |
| Black / African American | 0 | 0.0% |
| Hawaiian / Pacific | 0 | 0.0% |
| Hispanic or Latino | 75 | 2.5% |
| Native / Alaskan | 50 | 1.6% |
| White / Caucasian | 2,852 | 93.1% |
| Two or more Races | 136 | 4.4% |
| Some other Race | 0 | 0.0% |
| Total | 3,063 | 100.0% |
Ancestry in Beulah
The most populous ancestries reported in Beulah are German (1,378 | 45.0%), Norwegian (365 | 11.9%), Russian (178 | 5.8%), American (125 | 4.1%), and Irish (115 | 3.7%), together accounting for 70.6% of all Beulah residents.
| Ancestry | # Population | % Population |
| American | 125 | 4.1% |
| Brazilian | 10 | 0.3% |
| British | 16 | 0.5% |
| Chippewa | 49 | 1.6% |
| Croatian | 26 | 0.9% |
| Czech | 7 | 0.2% |
| Czechoslovakian | 10 | 0.3% |
| Danish | 10 | 0.3% |
| English | 88 | 2.9% |
| French | 84 | 2.7% |
| German | 1,378 | 45.0% |
| German Russian | 42 | 1.4% |
| Hungarian | 3 | 0.1% |
| Irish | 115 | 3.7% |
| Italian | 55 | 1.8% |
| Korean | 25 | 0.8% |
| Mexican | 75 | 2.5% |
| Norwegian | 365 | 11.9% |
| Polish | 19 | 0.6% |
| Russian | 178 | 5.8% |
| Scandinavian | 7 | 0.2% |
| Scottish | 20 | 0.6% |
| Sioux | 14 | 0.5% |
| Swedish | 100 | 3.3% |
| Ukrainian | 83 | 2.7% |
| Welsh | 24 | 0.8% | View All 26 Rows |
Immigrants in Beulah
The most numerous immigrant groups reported in Beulah came from Brazil (36 | 1.2%), Latin America (36 | 1.2%), South America (36 | 1.2%), Asia (25 | 0.8%), and Philippines (25 | 0.8%), together accounting for 5.2% of all Beulah residents.
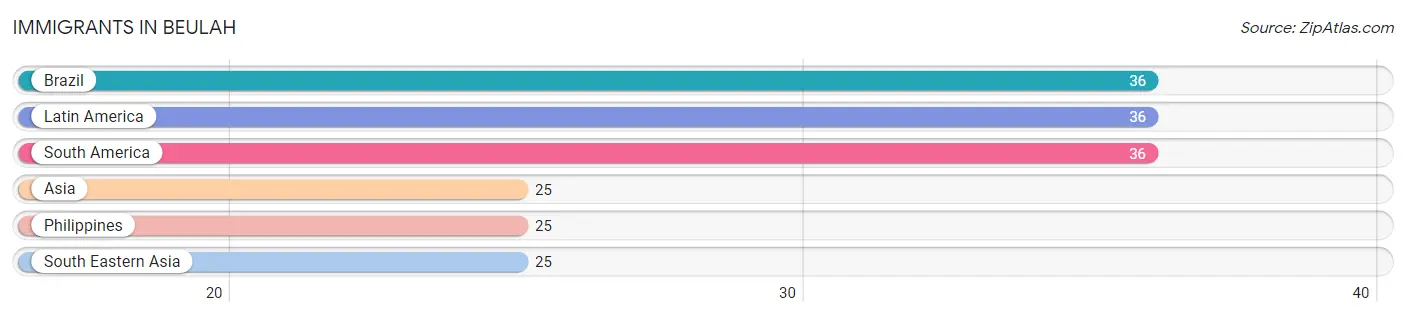
| Immigration Origin | # Population | % Population |
| Asia | 25 | 0.8% |
| Brazil | 36 | 1.2% |
| Latin America | 36 | 1.2% |
| Philippines | 25 | 0.8% |
| South America | 36 | 1.2% |
| South Eastern Asia | 25 | 0.8% | View All 6 Rows |
Sex and Age in Beulah
Sex and Age in Beulah
The most populous age groups in Beulah are 20 to 24 Years (185 | 12.6%) for men and 40 to 44 Years (159 | 10.0%) for women.
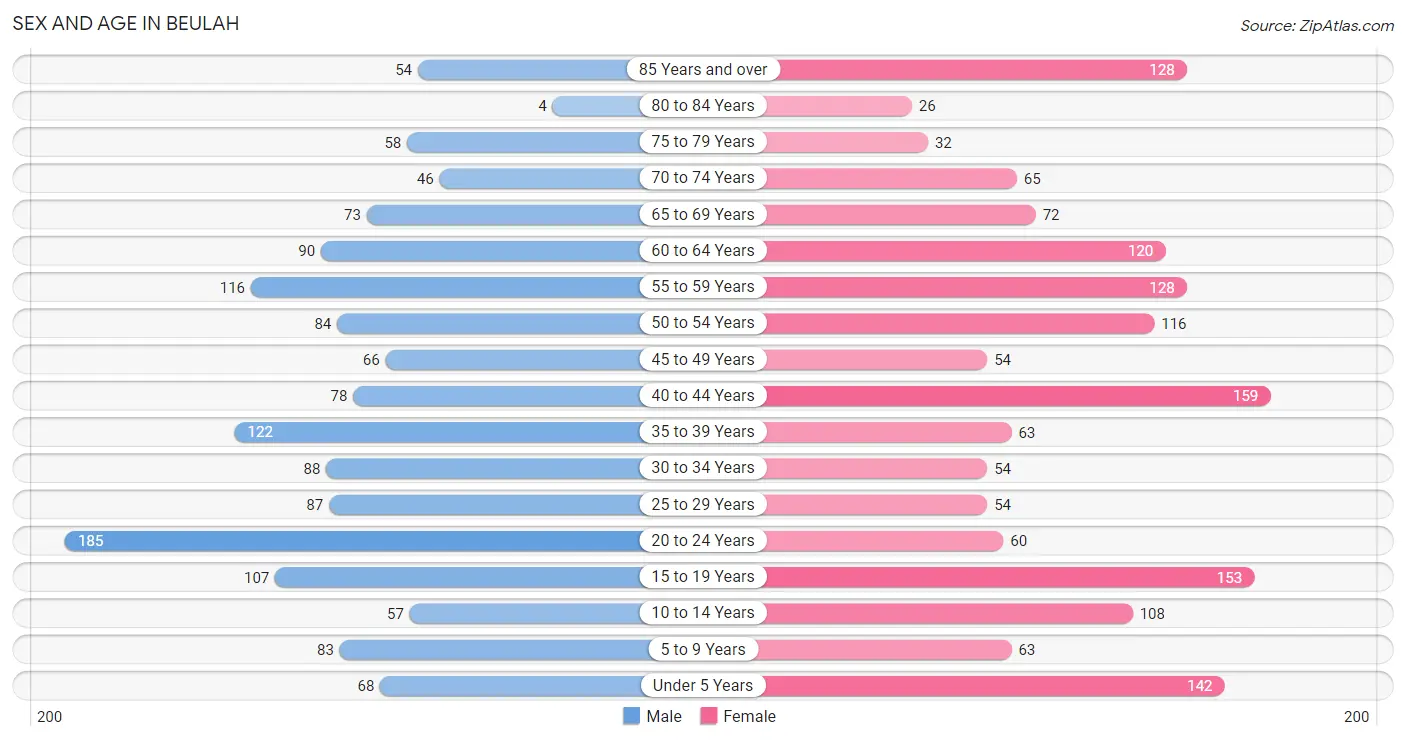
| Age Bracket | Male | Female |
| Under 5 Years | 68 (4.6%) | 142 (8.9%) |
| 5 to 9 Years | 83 (5.7%) | 63 (3.9%) |
| 10 to 14 Years | 57 (3.9%) | 108 (6.8%) |
| 15 to 19 Years | 107 (7.3%) | 153 (9.6%) |
| 20 to 24 Years | 185 (12.6%) | 60 (3.8%) |
| 25 to 29 Years | 87 (5.9%) | 54 (3.4%) |
| 30 to 34 Years | 88 (6.0%) | 54 (3.4%) |
| 35 to 39 Years | 122 (8.3%) | 63 (3.9%) |
| 40 to 44 Years | 78 (5.3%) | 159 (10.0%) |
| 45 to 49 Years | 66 (4.5%) | 54 (3.4%) |
| 50 to 54 Years | 84 (5.7%) | 116 (7.3%) |
| 55 to 59 Years | 116 (7.9%) | 128 (8.0%) |
| 60 to 64 Years | 90 (6.1%) | 120 (7.5%) |
| 65 to 69 Years | 73 (5.0%) | 72 (4.5%) |
| 70 to 74 Years | 46 (3.1%) | 65 (4.1%) |
| 75 to 79 Years | 58 (4.0%) | 32 (2.0%) |
| 80 to 84 Years | 4 (0.3%) | 26 (1.6%) |
| 85 Years and over | 54 (3.7%) | 128 (8.0%) |
| Total | 1,466 (100.0%) | 1,597 (100.0%) |
Families and Households in Beulah
Median Family Size in Beulah
The median family size in Beulah is 2.72 persons per family, with married-couple families (751 | 85.0%) accounting for the largest median family size of 2.78 persons per family. On the other hand, single female/mother families (64 | 7.2%) represent the smallest median family size with 2.30 persons per family.
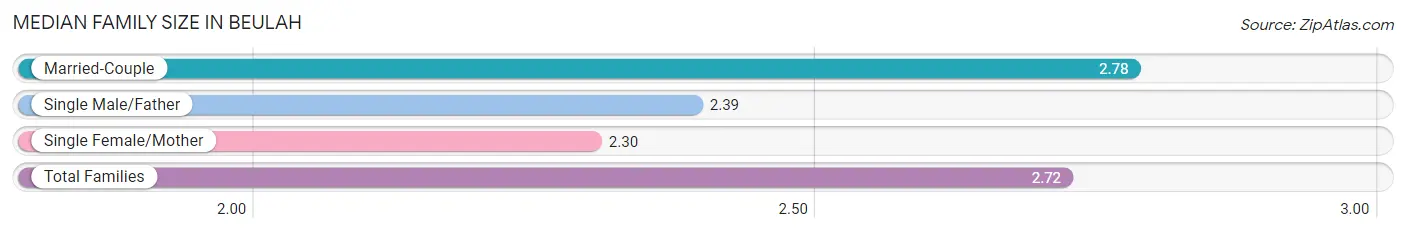
| Family Type | # Families | Family Size |
| Married-Couple | 751 (85.0%) | 2.78 |
| Single Male/Father | 69 (7.8%) | 2.39 |
| Single Female/Mother | 64 (7.2%) | 2.30 |
| Total Families | 884 (100.0%) | 2.72 |
Median Household Size in Beulah
The median household size in Beulah is 2.33 persons per household, with married-couple households (751 | 59.5%) accounting for the largest median household size of 2.78 persons per household. non-family households (378 | 29.9%) represent the smallest median household size with 1.38 persons per household.
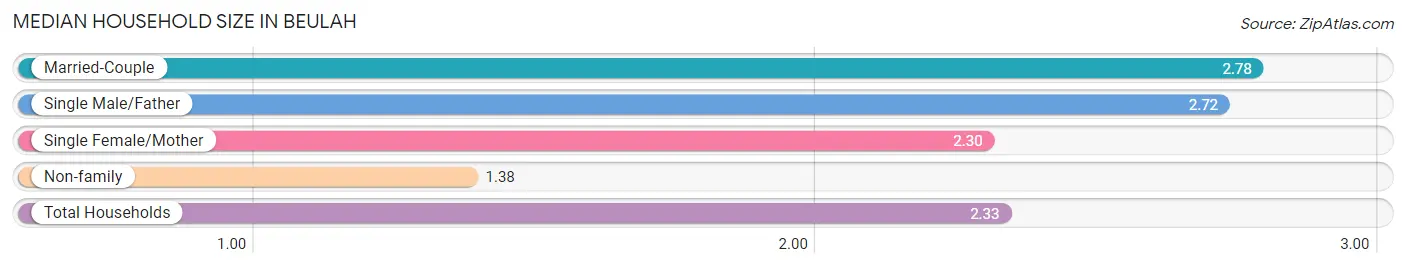
| Household Type | # Households | Household Size |
| Married-Couple | 751 (59.5%) | 2.78 |
| Single Male/Father | 69 (5.5%) | 2.72 |
| Single Female/Mother | 64 (5.1%) | 2.30 |
| Non-family | 378 (29.9%) | 1.38 |
| Total Households | 1,262 (100.0%) | 2.33 |
Household Size by Marriage Status in Beulah
Out of a total of 1,262 households in Beulah, 884 (70.1%) are family households, while 378 (29.9%) are nonfamily households. The most numerous type of family households are 2-person households, comprising 467, and the most common type of nonfamily households are 1-person households, comprising 304.
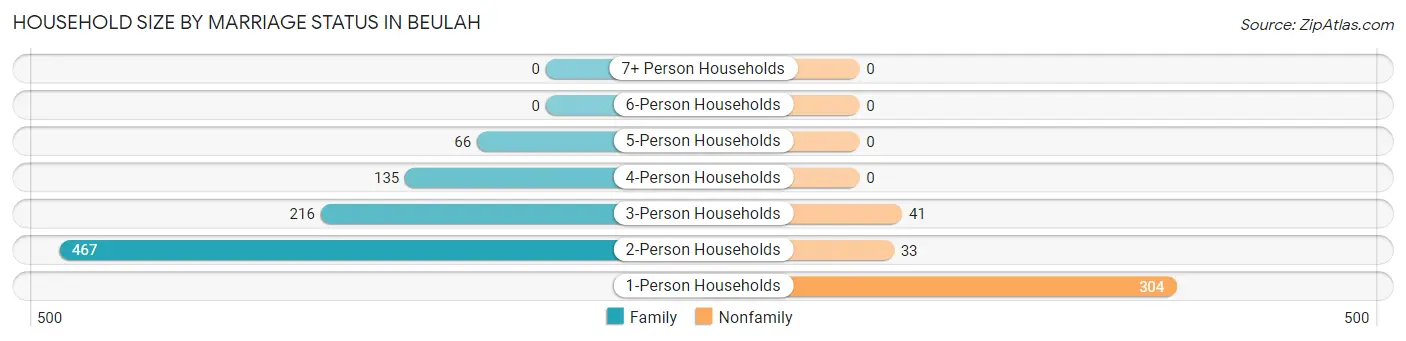
| Household Size | Family Households | Nonfamily Households |
| 1-Person Households | - | 304 (24.1%) |
| 2-Person Households | 467 (37.0%) | 33 (2.6%) |
| 3-Person Households | 216 (17.1%) | 41 (3.3%) |
| 4-Person Households | 135 (10.7%) | 0 (0.0%) |
| 5-Person Households | 66 (5.2%) | 0 (0.0%) |
| 6-Person Households | 0 (0.0%) | 0 (0.0%) |
| 7+ Person Households | 0 (0.0%) | 0 (0.0%) |
| Total | 884 (70.1%) | 378 (29.9%) |
Female Fertility in Beulah
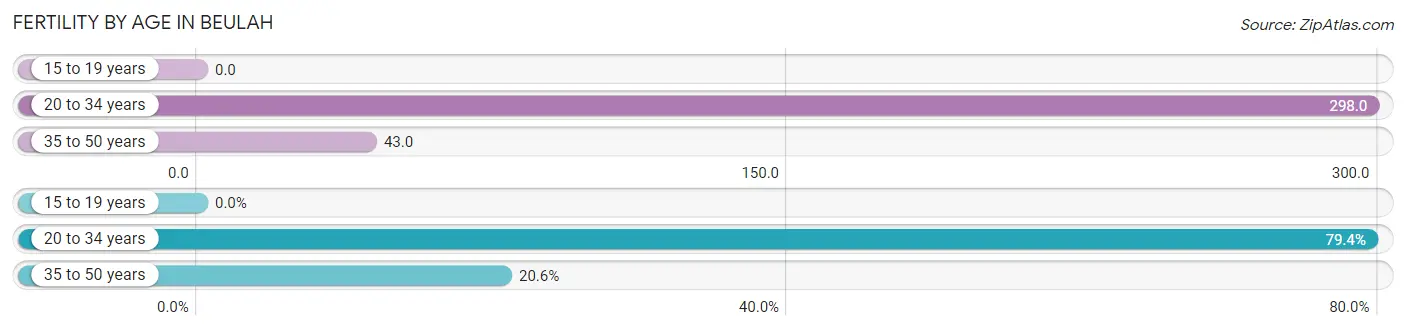
Fertility by Age in Beulah
Average fertility rate in Beulah is 101.0 births per 1,000 women. Women in the age bracket of 20 to 34 years have the highest fertility rate with 298.0 births per 1,000 women. Women in the age bracket of 20 to 34 years acount for 79.4% of all women with births.
| Age Bracket | Women with Births | Births / 1,000 Women |
| 15 to 19 years | 0 (0.0%) | 0.0 |
| 20 to 34 years | 50 (79.4%) | 298.0 |
| 35 to 50 years | 13 (20.6%) | 43.0 |
| Total | 63 (100.0%) | 101.0 |
Fertility by Age by Marriage Status in Beulah
82.5% of women with births (63) in Beulah are married. The highest percentage of unmarried women with births falls into 20 to 34 years age bracket with 22.0% of them unmarried at the time of birth, while the lowest percentage of unmarried women with births belong to 35 to 50 years age bracket with 0.0% of them unmarried.
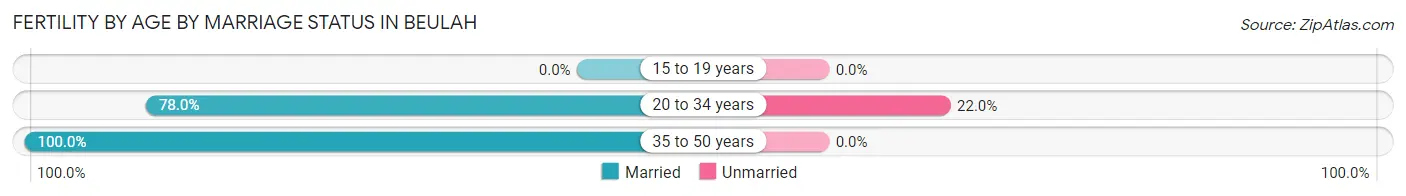
| Age Bracket | Married | Unmarried |
| 15 to 19 years | 0 (0.0%) | 0 (0.0%) |
| 20 to 34 years | 39 (78.0%) | 11 (22.0%) |
| 35 to 50 years | 13 (100.0%) | 0 (0.0%) |
| Total | 52 (82.5%) | 11 (17.5%) |
Fertility by Education in Beulah
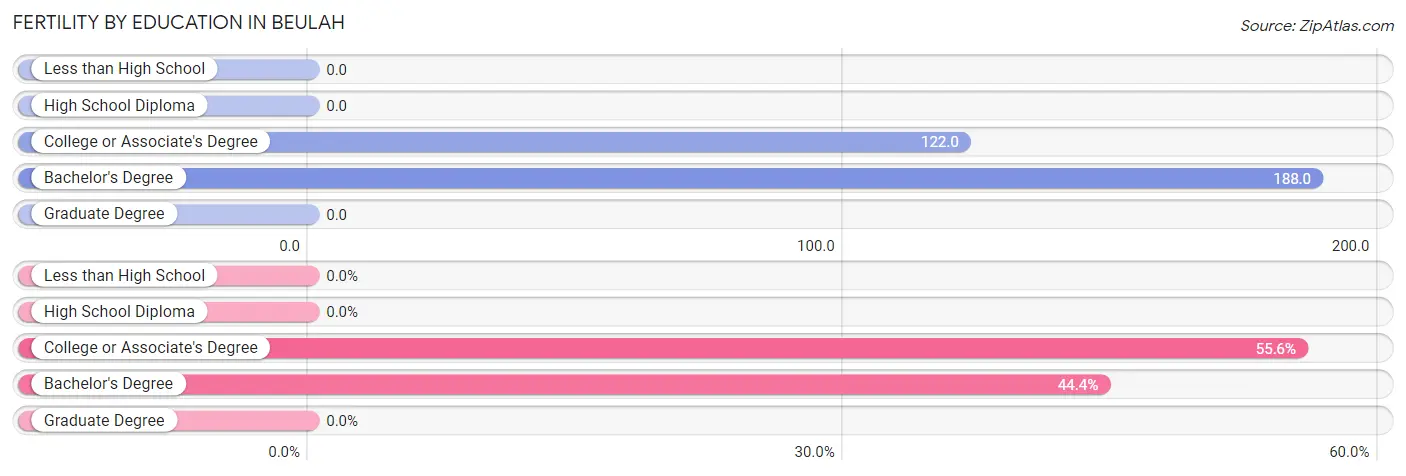
| Educational Attainment | Women with Births | Births / 1,000 Women |
| Less than High School | 0 (0.0%) | 0.0 |
| High School Diploma | 0 (0.0%) | 0.0 |
| College or Associate's Degree | 35 (55.6%) | 122.0 |
| Bachelor's Degree | 28 (44.4%) | 188.0 |
| Graduate Degree | 0 (0.0%) | 0.0 |
| Total | 63 (100.0%) | 101.0 |
Fertility by Education by Marriage Status in Beulah
17.5% of women with births in Beulah are unmarried. Women with the educational attainment of college or associate's degree are most likely to be married with 100.0% of them married at childbirth, while women with the educational attainment of bachelor's degree are least likely to be married with 39.3% of them unmarried at childbirth.
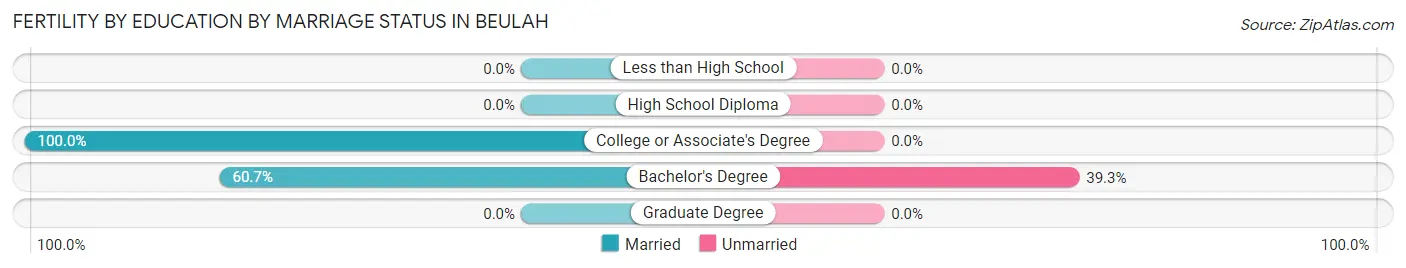
| Educational Attainment | Married | Unmarried |
| Less than High School | 0 (0.0%) | 0 (0.0%) |
| High School Diploma | 0 (0.0%) | 0 (0.0%) |
| College or Associate's Degree | 35 (100.0%) | 0 (0.0%) |
| Bachelor's Degree | 17 (60.7%) | 11 (39.3%) |
| Graduate Degree | 0 (0.0%) | 0 (0.0%) |
| Total | 52 (82.5%) | 11 (17.5%) |
Employment Characteristics in Beulah
Employment by Class of Employer in Beulah
Among the 1,569 employed individuals in Beulah, private company employees (1,315 | 83.8%), local government employees (102 | 6.5%), and not-for-profit organizations (45 | 2.9%) make up the most common classes of employment.
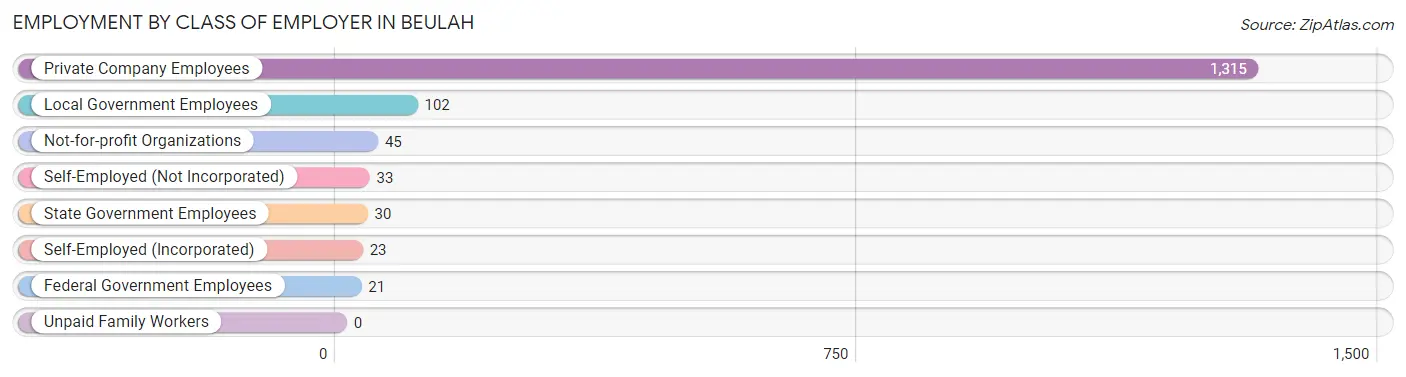
| Employer Class | # Employees | % Employees |
| Private Company Employees | 1,315 | 83.8% |
| Self-Employed (Incorporated) | 23 | 1.5% |
| Self-Employed (Not Incorporated) | 33 | 2.1% |
| Not-for-profit Organizations | 45 | 2.9% |
| Local Government Employees | 102 | 6.5% |
| State Government Employees | 30 | 1.9% |
| Federal Government Employees | 21 | 1.3% |
| Unpaid Family Workers | 0 | 0.0% |
| Total | 1,569 | 100.0% |
Employment Status by Age in Beulah
According to the labor force statistics for Beulah, out of the total population over 16 years of age (2,542), 62.1% or 1,579 individuals are in the labor force, with 0.6% or 9 of them unemployed. The age group with the highest labor force participation rate is 35 to 44 years, with 96.0% or 405 individuals in the labor force. Within the labor force, the 25 to 29 years age range has the highest percentage of unemployed individuals, with 8.3% or 10 of them being unemployed.
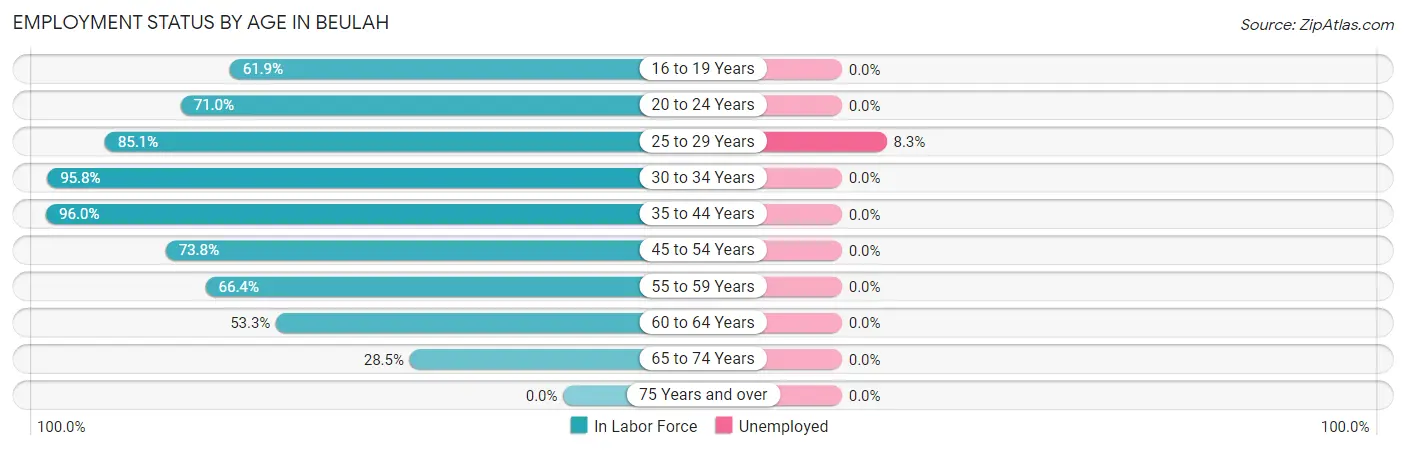
| Age Bracket | In Labor Force | Unemployed |
| 16 to 19 Years | 161 (61.9%) | 0 (0.0%) |
| 20 to 24 Years | 174 (71.0%) | 0 (0.0%) |
| 25 to 29 Years | 120 (85.1%) | 10 (8.3%) |
| 30 to 34 Years | 136 (95.8%) | 0 (0.0%) |
| 35 to 44 Years | 405 (96.0%) | 0 (0.0%) |
| 45 to 54 Years | 236 (73.8%) | 0 (0.0%) |
| 55 to 59 Years | 162 (66.4%) | 0 (0.0%) |
| 60 to 64 Years | 112 (53.3%) | 0 (0.0%) |
| 65 to 74 Years | 73 (28.5%) | 0 (0.0%) |
| 75 Years and over | 0 (0.0%) | 0 (0.0%) |
| Total | 1,579 (62.1%) | 9 (0.6%) |
Employment Status by Educational Attainment in Beulah
According to labor force statistics for Beulah, 79.2% of individuals (1,171) out of the total population between 25 and 64 years of age (1,479) are in the labor force, with 0.9% or 11 of them being unemployed. The group with the highest labor force participation rate are those with the educational attainment of bachelor's degree or higher, with 83.7% or 190 individuals in the labor force. Within the labor force, individuals with college / associate degree education have the highest percentage of unemployment, with 1.7% or 10 of them being unemployed.
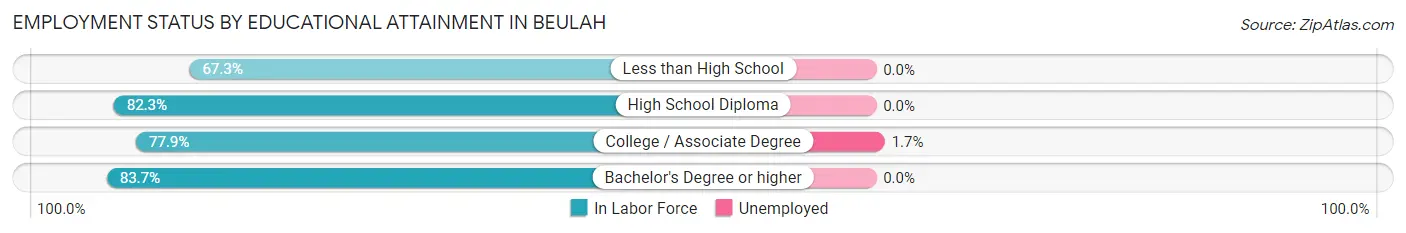
| Educational Attainment | In Labor Force | Unemployed |
| Less than High School | 72 (67.3%) | 0 (0.0%) |
| High School Diploma | 320 (82.3%) | 0 (0.0%) |
| College / Associate Degree | 589 (77.9%) | 13 (1.7%) |
| Bachelor's Degree or higher | 190 (83.7%) | 0 (0.0%) |
| Total | 1,171 (79.2%) | 13 (0.9%) |
Employment Occupations by Sex in Beulah
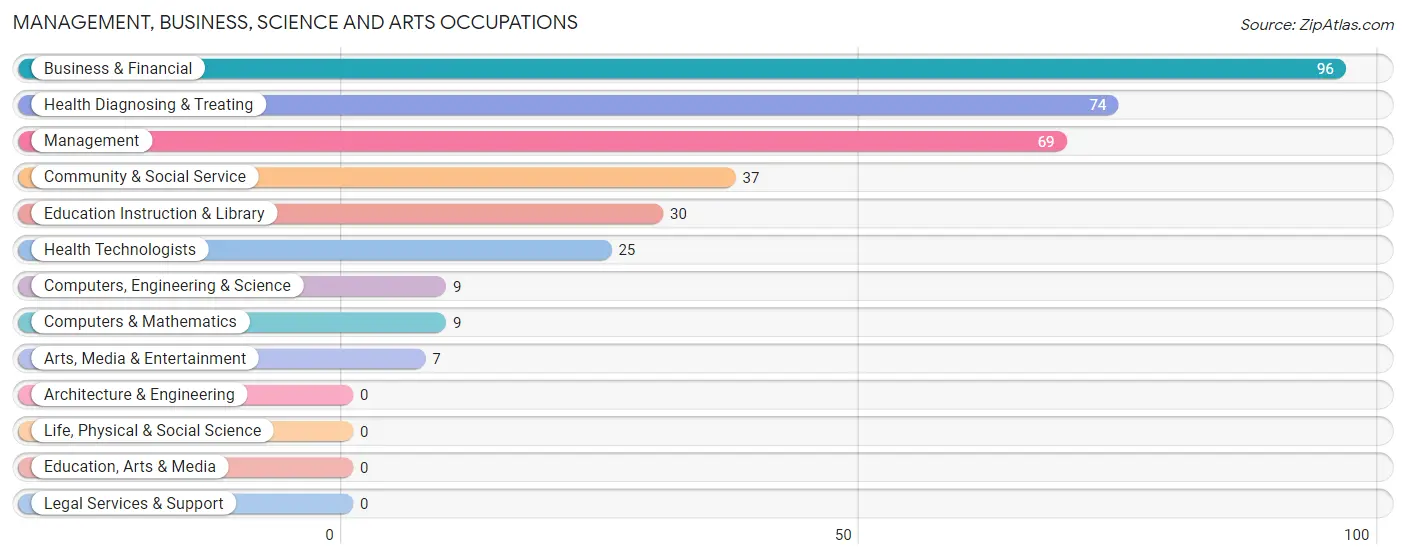
Management, Business, Science and Arts Occupations
The most common Management, Business, Science and Arts occupations in Beulah are Business & Financial (96 | 6.1%), Health Diagnosing & Treating (74 | 4.7%), Management (69 | 4.4%), Community & Social Service (37 | 2.4%), and Education Instruction & Library (30 | 1.9%).
Management, Business, Science and Arts Occupations by Sex
Within the Management, Business, Science and Arts occupations in Beulah, the most male-oriented occupations are Computers, Engineering & Science (100.0%), Computers & Mathematics (100.0%), and Arts, Media & Entertainment (100.0%), while the most female-oriented occupations are Health Diagnosing & Treating (96.0%), Health Technologists (88.0%), and Management (62.3%).
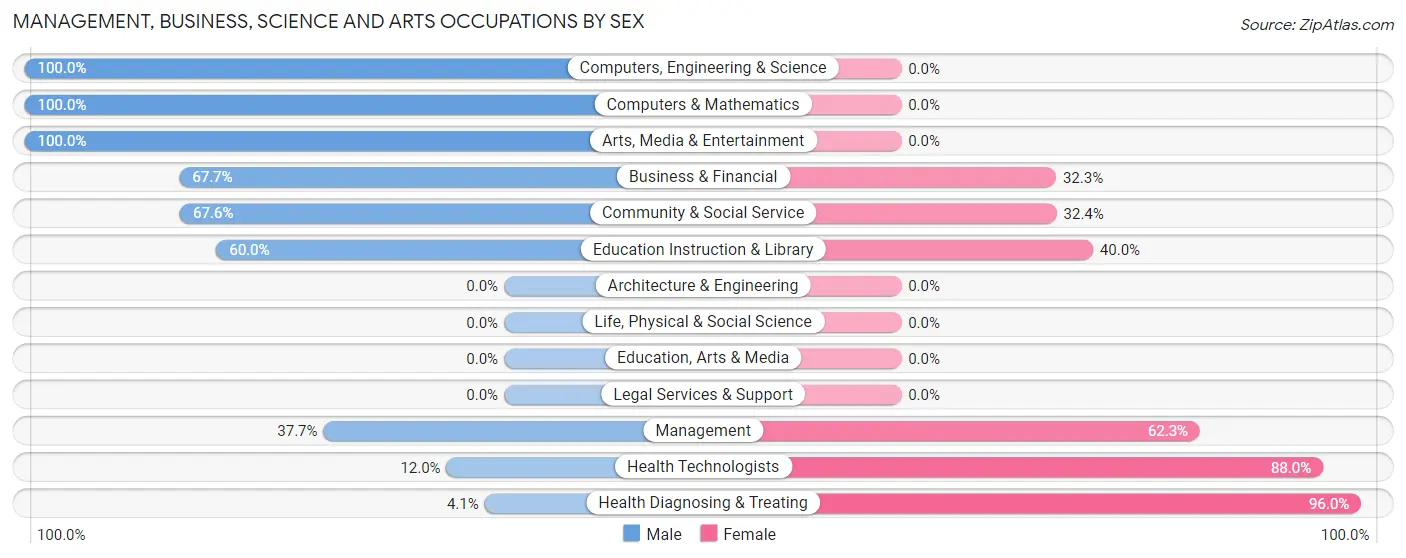
| Occupation | Male | Female |
| Management | 26 (37.7%) | 43 (62.3%) |
| Business & Financial | 65 (67.7%) | 31 (32.3%) |
| Computers, Engineering & Science | 9 (100.0%) | 0 (0.0%) |
| Computers & Mathematics | 9 (100.0%) | 0 (0.0%) |
| Architecture & Engineering | 0 (0.0%) | 0 (0.0%) |
| Life, Physical & Social Science | 0 (0.0%) | 0 (0.0%) |
| Community & Social Service | 25 (67.6%) | 12 (32.4%) |
| Education, Arts & Media | 0 (0.0%) | 0 (0.0%) |
| Legal Services & Support | 0 (0.0%) | 0 (0.0%) |
| Education Instruction & Library | 18 (60.0%) | 12 (40.0%) |
| Arts, Media & Entertainment | 7 (100.0%) | 0 (0.0%) |
| Health Diagnosing & Treating | 3 (4.1%) | 71 (96.0%) |
| Health Technologists | 3 (12.0%) | 22 (88.0%) |
| Total (Category) | 128 (44.9%) | 157 (55.1%) |
| Total (Overall) | 904 (57.6%) | 665 (42.4%) |
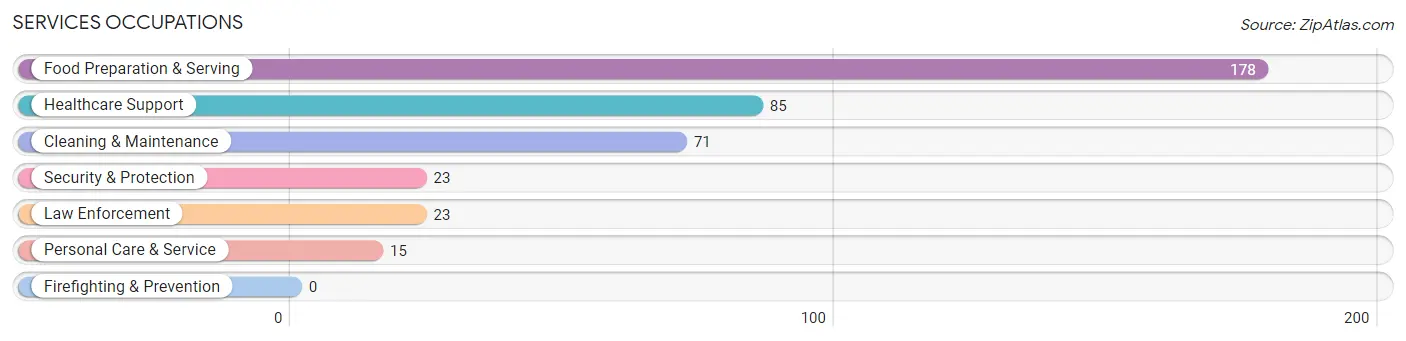
Services Occupations
The most common Services occupations in Beulah are Food Preparation & Serving (178 | 11.3%), Healthcare Support (85 | 5.4%), Cleaning & Maintenance (71 | 4.5%), Security & Protection (23 | 1.5%), and Law Enforcement (23 | 1.5%).
Services Occupations by Sex
Within the Services occupations in Beulah, the most male-oriented occupations are Security & Protection (100.0%), Law Enforcement (100.0%), and Cleaning & Maintenance (77.5%), while the most female-oriented occupations are Healthcare Support (100.0%), Personal Care & Service (100.0%), and Food Preparation & Serving (43.3%).
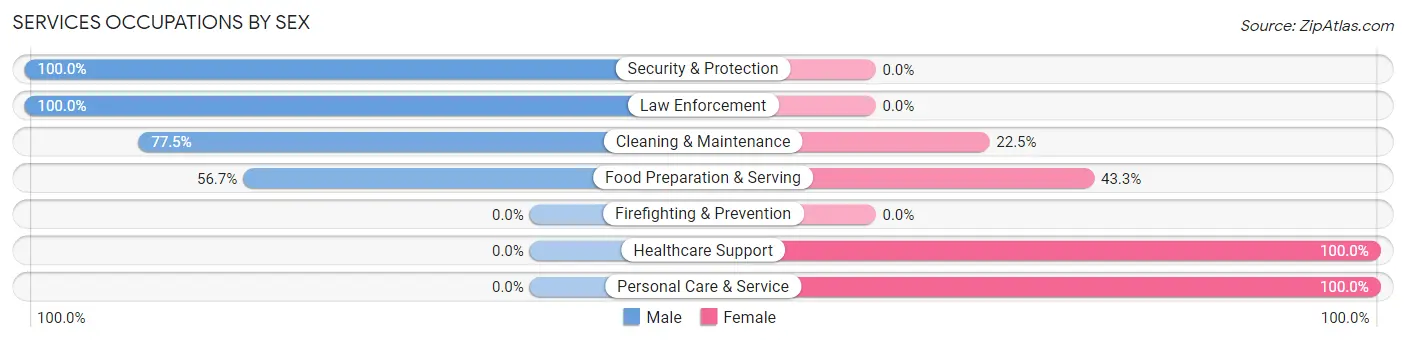
| Occupation | Male | Female |
| Healthcare Support | 0 (0.0%) | 85 (100.0%) |
| Security & Protection | 23 (100.0%) | 0 (0.0%) |
| Firefighting & Prevention | 0 (0.0%) | 0 (0.0%) |
| Law Enforcement | 23 (100.0%) | 0 (0.0%) |
| Food Preparation & Serving | 101 (56.7%) | 77 (43.3%) |
| Cleaning & Maintenance | 55 (77.5%) | 16 (22.5%) |
| Personal Care & Service | 0 (0.0%) | 15 (100.0%) |
| Total (Category) | 179 (48.1%) | 193 (51.9%) |
| Total (Overall) | 904 (57.6%) | 665 (42.4%) |
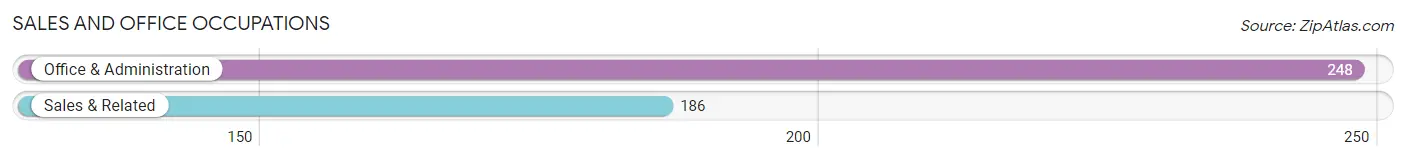
Sales and Office Occupations
The most common Sales and Office occupations in Beulah are Office & Administration (248 | 15.8%), and Sales & Related (186 | 11.8%).
Sales and Office Occupations by Sex
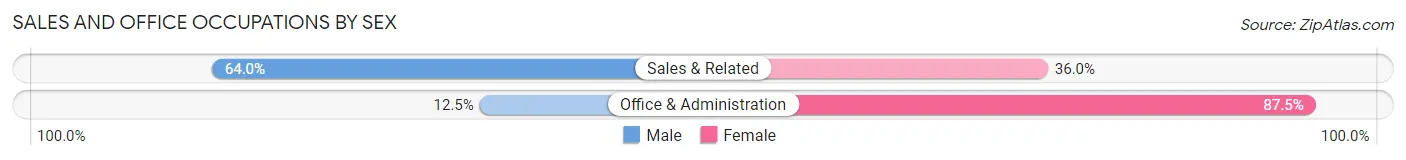
| Occupation | Male | Female |
| Sales & Related | 119 (64.0%) | 67 (36.0%) |
| Office & Administration | 31 (12.5%) | 217 (87.5%) |
| Total (Category) | 150 (34.6%) | 284 (65.4%) |
| Total (Overall) | 904 (57.6%) | 665 (42.4%) |
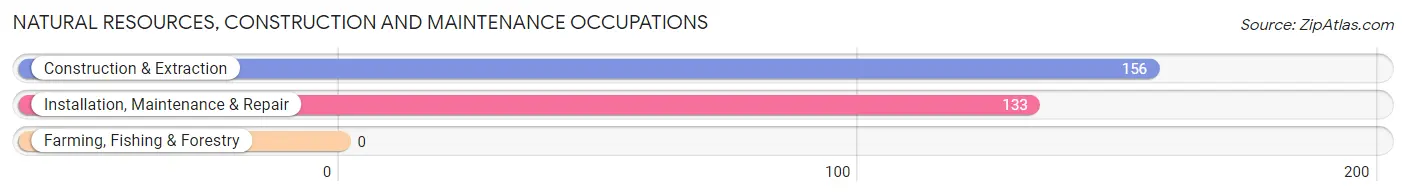
Natural Resources, Construction and Maintenance Occupations
The most common Natural Resources, Construction and Maintenance occupations in Beulah are Construction & Extraction (156 | 9.9%), and Installation, Maintenance & Repair (133 | 8.5%).
Natural Resources, Construction and Maintenance Occupations by Sex
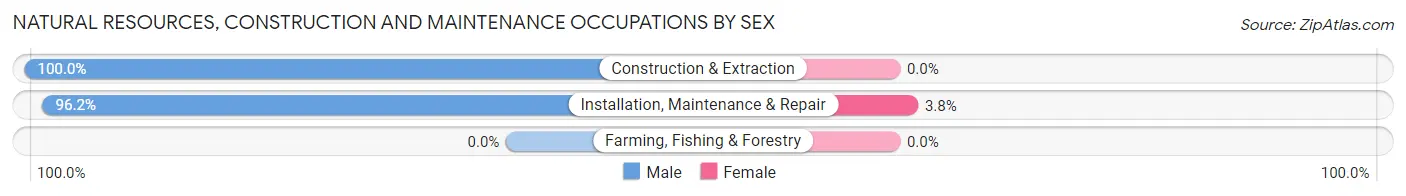
| Occupation | Male | Female |
| Farming, Fishing & Forestry | 0 (0.0%) | 0 (0.0%) |
| Construction & Extraction | 156 (100.0%) | 0 (0.0%) |
| Installation, Maintenance & Repair | 128 (96.2%) | 5 (3.8%) |
| Total (Category) | 284 (98.3%) | 5 (1.7%) |
| Total (Overall) | 904 (57.6%) | 665 (42.4%) |
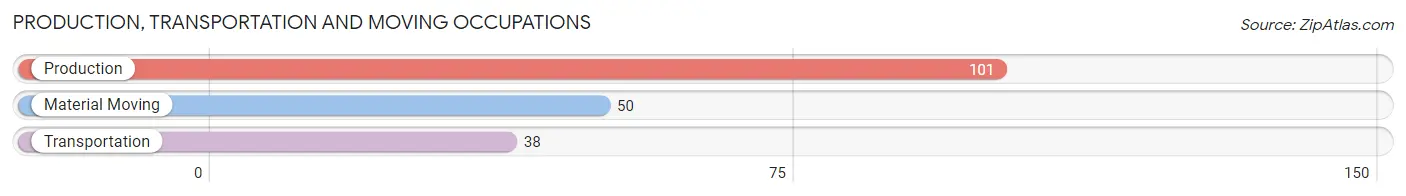
Production, Transportation and Moving Occupations
The most common Production, Transportation and Moving occupations in Beulah are Production (101 | 6.4%), Material Moving (50 | 3.2%), and Transportation (38 | 2.4%).
Production, Transportation and Moving Occupations by Sex
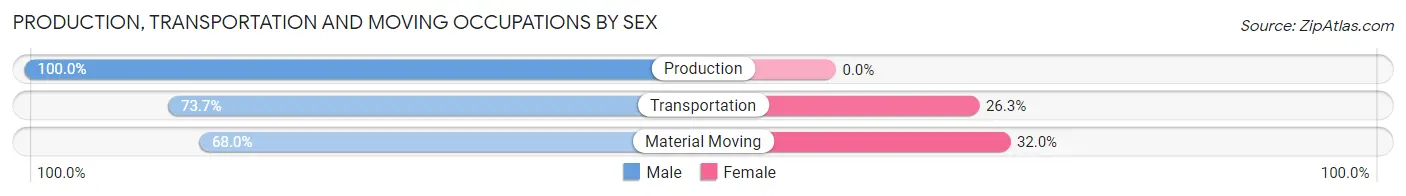
| Occupation | Male | Female |
| Production | 101 (100.0%) | 0 (0.0%) |
| Transportation | 28 (73.7%) | 10 (26.3%) |
| Material Moving | 34 (68.0%) | 16 (32.0%) |
| Total (Category) | 163 (86.2%) | 26 (13.8%) |
| Total (Overall) | 904 (57.6%) | 665 (42.4%) |
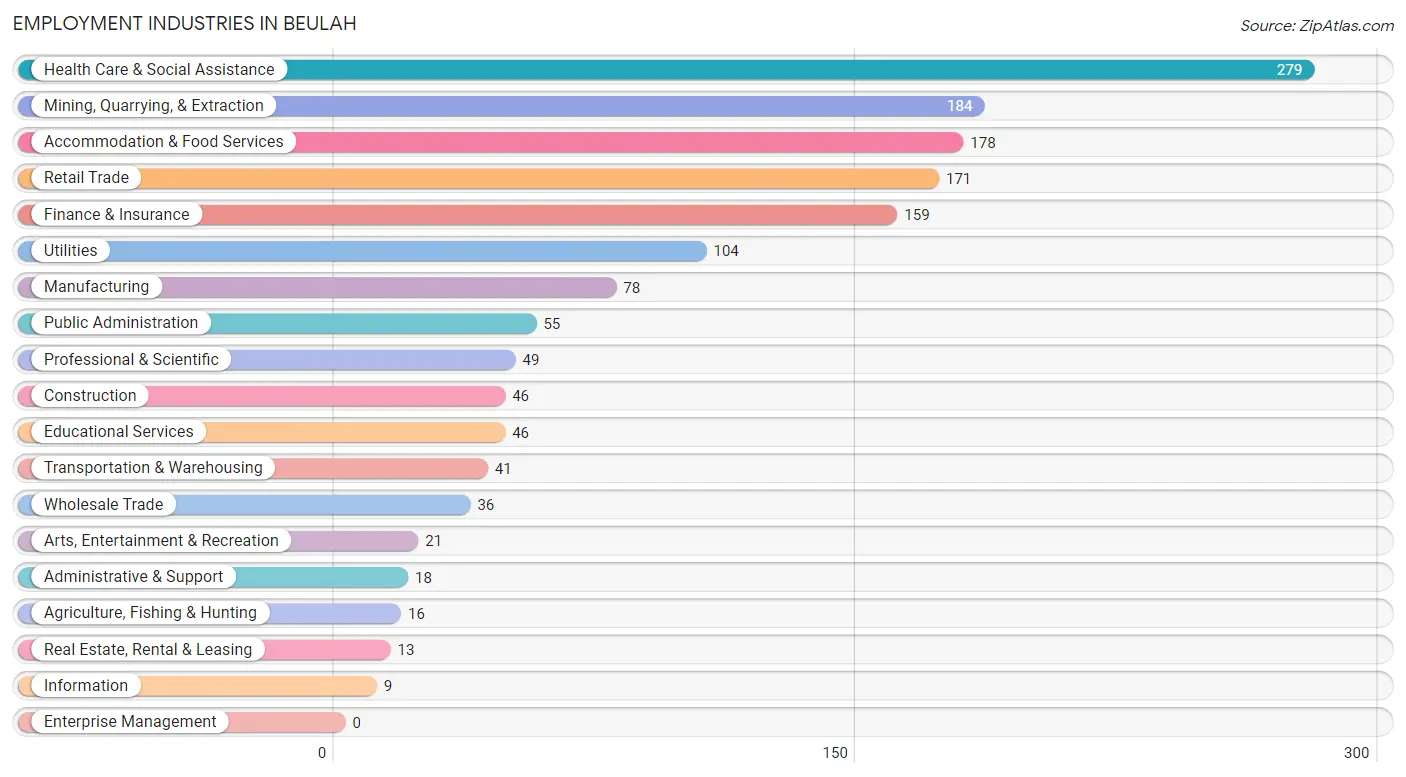
Employment Industries by Sex in Beulah
Employment Industries in Beulah
The major employment industries in Beulah include Health Care & Social Assistance (279 | 17.8%), Mining, Quarrying, & Extraction (184 | 11.7%), Accommodation & Food Services (178 | 11.3%), Retail Trade (171 | 10.9%), and Finance & Insurance (159 | 10.1%).
Employment Industries by Sex in Beulah
The Beulah industries that see more men than women are Agriculture, Fishing & Hunting (100.0%), Construction (100.0%), and Manufacturing (100.0%), whereas the industries that tend to have a higher number of women are Real Estate, Rental & Leasing (100.0%), Professional & Scientific (100.0%), and Arts, Entertainment & Recreation (100.0%).
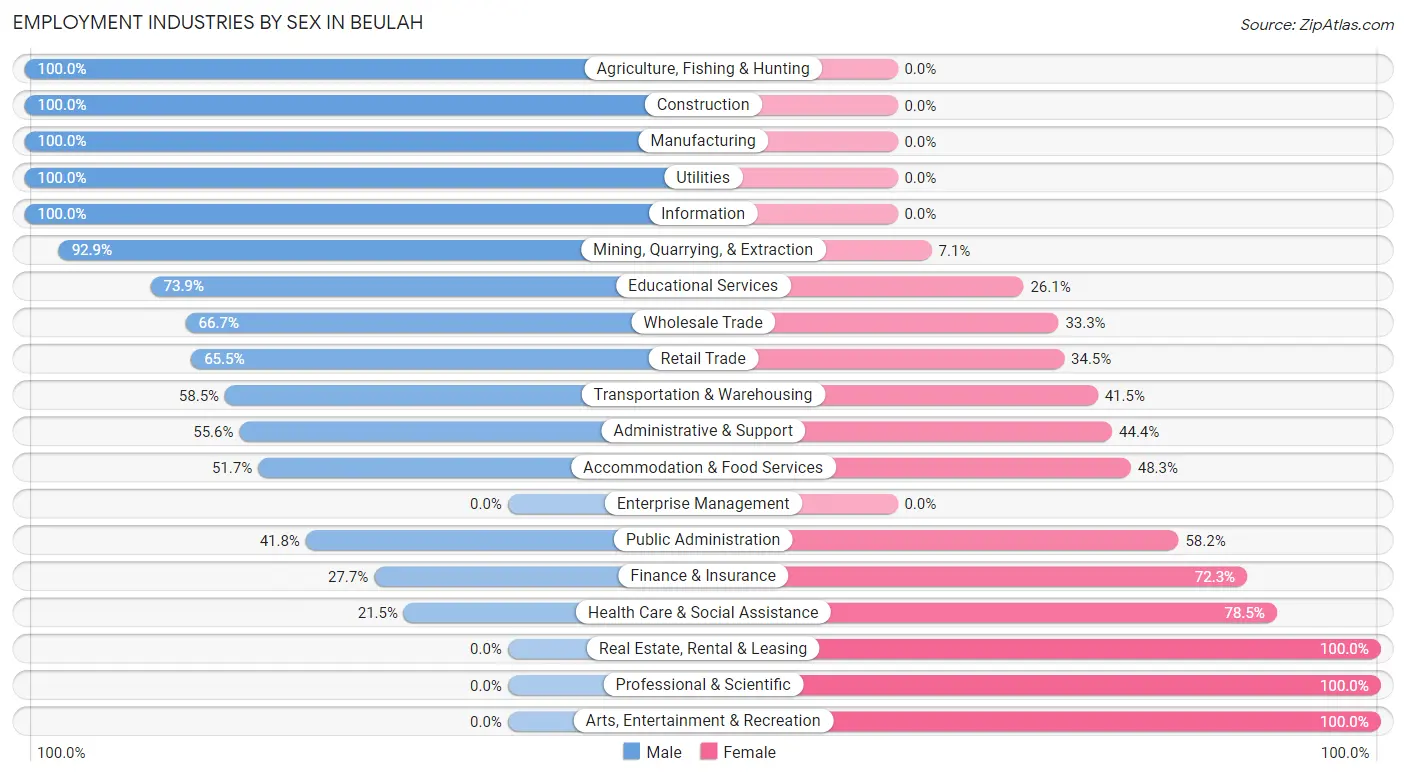
| Industry | Male | Female |
| Agriculture, Fishing & Hunting | 16 (100.0%) | 0 (0.0%) |
| Mining, Quarrying, & Extraction | 171 (92.9%) | 13 (7.1%) |
| Construction | 46 (100.0%) | 0 (0.0%) |
| Manufacturing | 78 (100.0%) | 0 (0.0%) |
| Wholesale Trade | 24 (66.7%) | 12 (33.3%) |
| Retail Trade | 112 (65.5%) | 59 (34.5%) |
| Transportation & Warehousing | 24 (58.5%) | 17 (41.5%) |
| Utilities | 104 (100.0%) | 0 (0.0%) |
| Information | 9 (100.0%) | 0 (0.0%) |
| Finance & Insurance | 44 (27.7%) | 115 (72.3%) |
| Real Estate, Rental & Leasing | 0 (0.0%) | 13 (100.0%) |
| Professional & Scientific | 0 (0.0%) | 49 (100.0%) |
| Enterprise Management | 0 (0.0%) | 0 (0.0%) |
| Administrative & Support | 10 (55.6%) | 8 (44.4%) |
| Educational Services | 34 (73.9%) | 12 (26.1%) |
| Health Care & Social Assistance | 60 (21.5%) | 219 (78.5%) |
| Arts, Entertainment & Recreation | 0 (0.0%) | 21 (100.0%) |
| Accommodation & Food Services | 92 (51.7%) | 86 (48.3%) |
| Public Administration | 23 (41.8%) | 32 (58.2%) |
| Total | 904 (57.6%) | 665 (42.4%) |
Education in Beulah
School Enrollment in Beulah
The most common levels of schooling among the 686 students in Beulah are high school (183 | 26.7%), college / undergraduate (165 | 24.0%), and elementary school (137 | 20.0%).
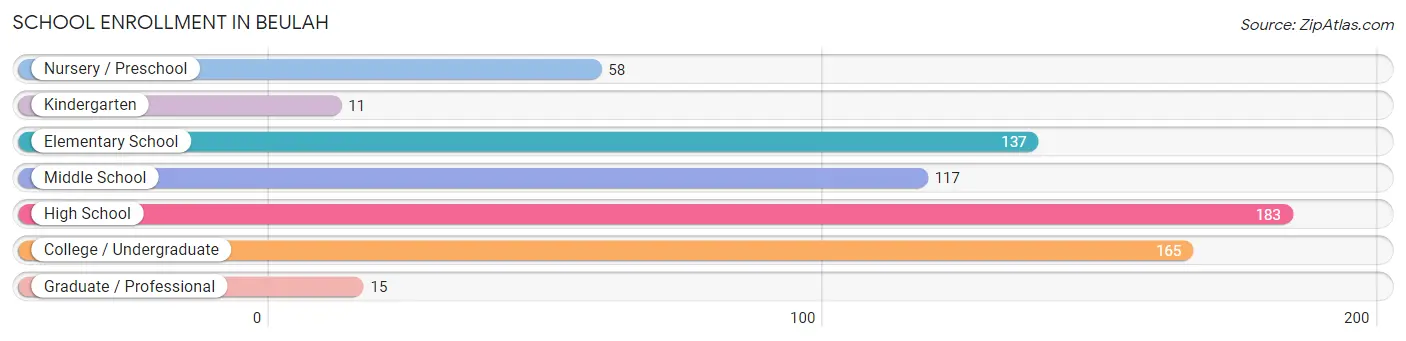
| School Level | # Students | % Students |
| Nursery / Preschool | 58 | 8.5% |
| Kindergarten | 11 | 1.6% |
| Elementary School | 137 | 20.0% |
| Middle School | 117 | 17.1% |
| High School | 183 | 26.7% |
| College / Undergraduate | 165 | 24.0% |
| Graduate / Professional | 15 | 2.2% |
| Total | 686 | 100.0% |
School Enrollment by Age by Funding Source in Beulah
Out of a total of 686 students who are enrolled in schools in Beulah, 131 (19.1%) attend a private institution, while the remaining 555 (80.9%) are enrolled in public schools. The age group of 20 to 24 year olds has the highest likelihood of being enrolled in private schools, with 47 (66.2% in the age bracket) enrolled. Conversely, the age group of 15 to 17 year olds has the lowest likelihood of being enrolled in a private school, with 170 (100.0% in the age bracket) attending a public institution.
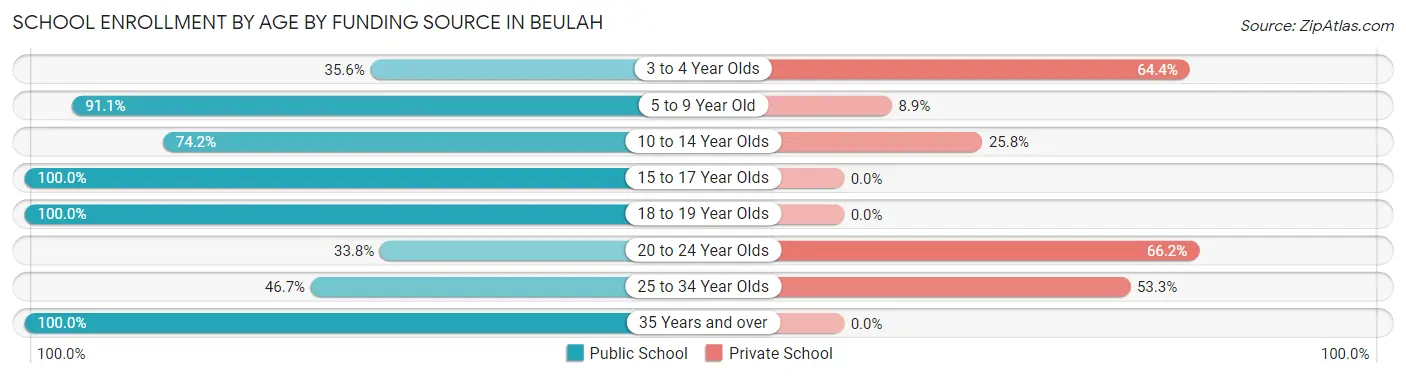
| Age Bracket | Public School | Private School |
| 3 to 4 Year Olds | 16 (35.6%) | 29 (64.4%) |
| 5 to 9 Year Old | 133 (91.1%) | 13 (8.9%) |
| 10 to 14 Year Olds | 98 (74.2%) | 34 (25.8%) |
| 15 to 17 Year Olds | 170 (100.0%) | 0 (0.0%) |
| 18 to 19 Year Olds | 90 (100.0%) | 0 (0.0%) |
| 20 to 24 Year Olds | 24 (33.8%) | 47 (66.2%) |
| 25 to 34 Year Olds | 7 (46.7%) | 8 (53.3%) |
| 35 Years and over | 17 (100.0%) | 0 (0.0%) |
| Total | 555 (80.9%) | 131 (19.1%) |
Educational Attainment by Field of Study in Beulah
Business (138 | 42.5%), education (77 | 23.7%), science & technology (32 | 9.9%), computers & mathematics (22 | 6.8%), and arts & humanities (17 | 5.2%) are the most common fields of study among 325 individuals in Beulah who have obtained a bachelor's degree or higher.
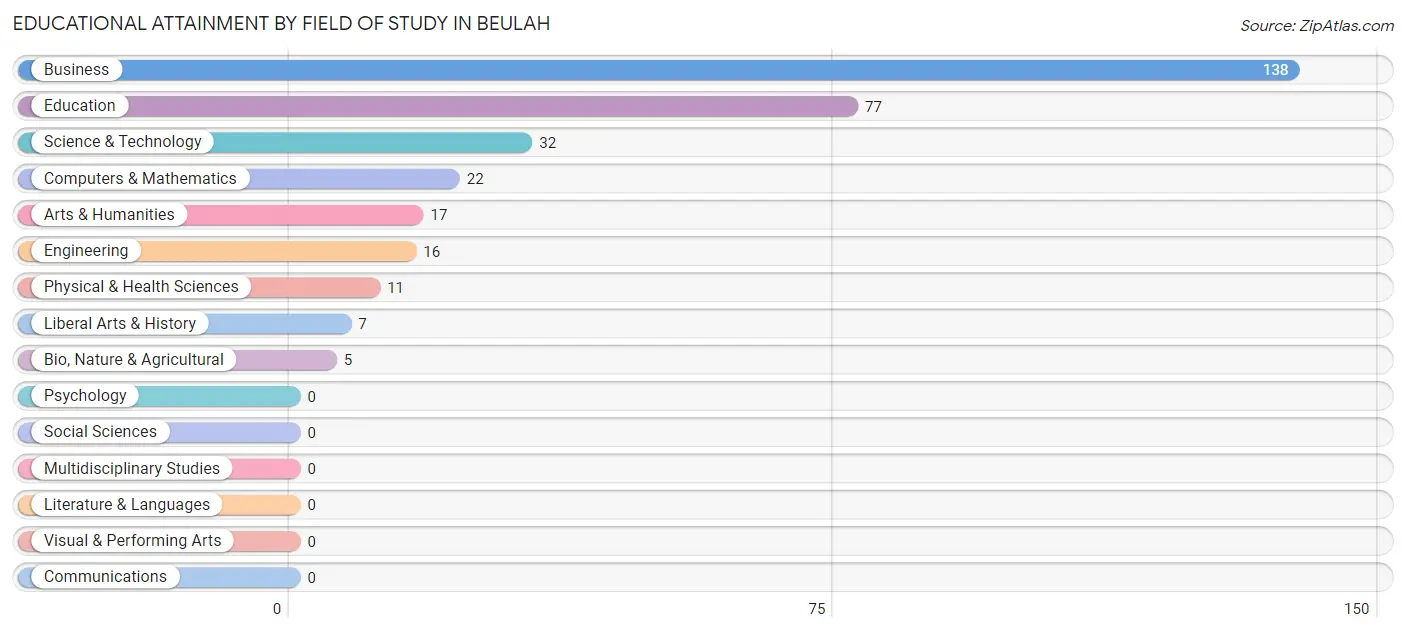
| Field of Study | # Graduates | % Graduates |
| Computers & Mathematics | 22 | 6.8% |
| Bio, Nature & Agricultural | 5 | 1.5% |
| Physical & Health Sciences | 11 | 3.4% |
| Psychology | 0 | 0.0% |
| Social Sciences | 0 | 0.0% |
| Engineering | 16 | 4.9% |
| Multidisciplinary Studies | 0 | 0.0% |
| Science & Technology | 32 | 9.9% |
| Business | 138 | 42.5% |
| Education | 77 | 23.7% |
| Literature & Languages | 0 | 0.0% |
| Liberal Arts & History | 7 | 2.1% |
| Visual & Performing Arts | 0 | 0.0% |
| Communications | 0 | 0.0% |
| Arts & Humanities | 17 | 5.2% |
| Total | 325 | 100.0% |
Transportation & Commute in Beulah
Vehicle Availability by Sex in Beulah
The most prevalent vehicle ownership categories in Beulah are males with 3 vehicles (369, accounting for 40.8%) and females with 3 vehicles (216, making up 55.5%).
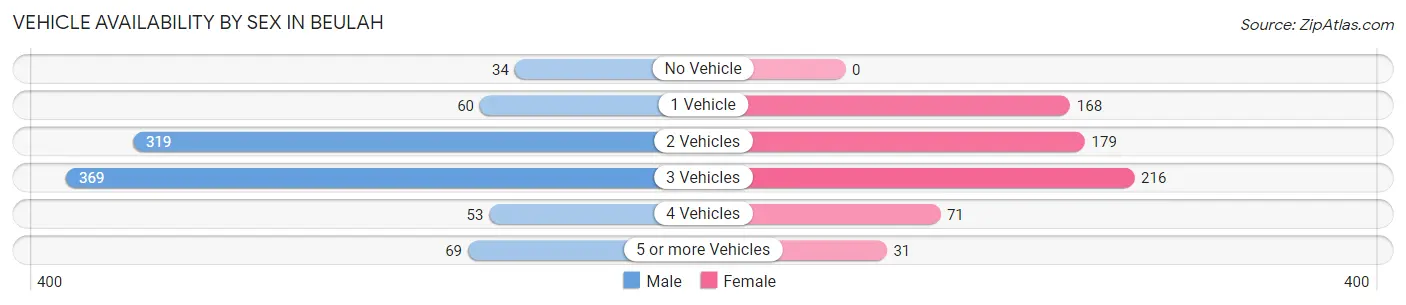
| Vehicles Available | Male | Female |
| No Vehicle | 34 (3.8%) | 0 (0.0%) |
| 1 Vehicle | 60 (6.6%) | 168 (25.3%) |
| 2 Vehicles | 319 (35.3%) | 179 (26.9%) |
| 3 Vehicles | 369 (40.8%) | 216 (32.5%) |
| 4 Vehicles | 53 (5.9%) | 71 (10.7%) |
| 5 or more Vehicles | 69 (7.6%) | 31 (4.7%) |
| Total | 904 (100.0%) | 665 (100.0%) |
Commute Time in Beulah
The most frequently occuring commute durations in Beulah are 5 to 9 minutes (462 commuters, 29.6%), 10 to 14 minutes (342 commuters, 21.9%), and less than 5 minutes (282 commuters, 18.1%).
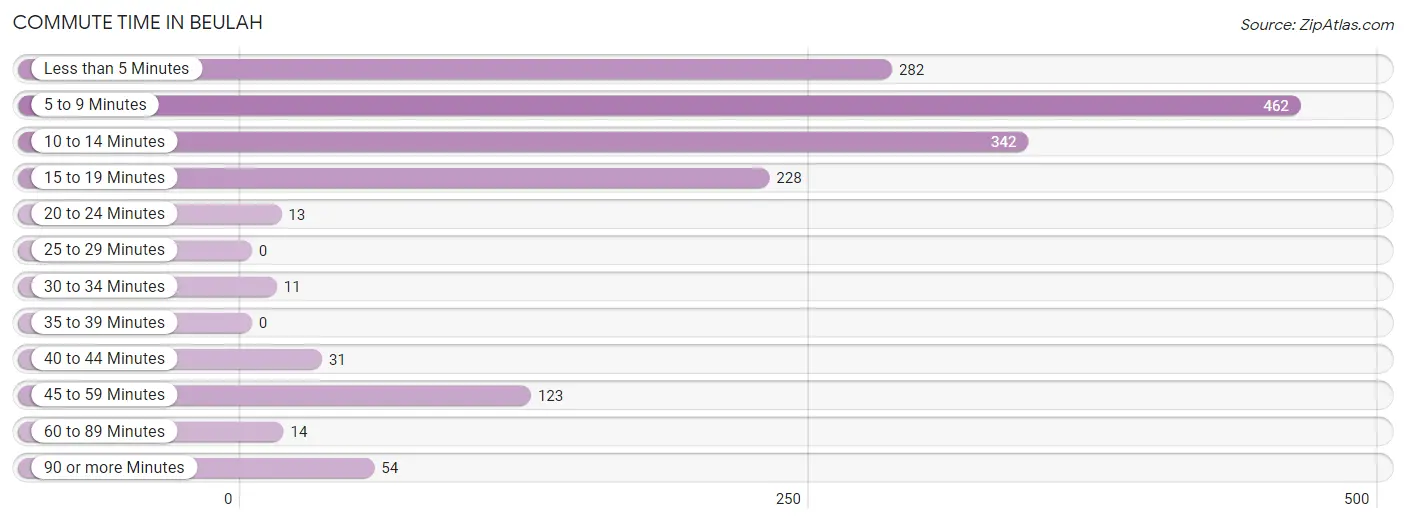
| Commute Time | # Commuters | % Commuters |
| Less than 5 Minutes | 282 | 18.1% |
| 5 to 9 Minutes | 462 | 29.6% |
| 10 to 14 Minutes | 342 | 21.9% |
| 15 to 19 Minutes | 228 | 14.6% |
| 20 to 24 Minutes | 13 | 0.8% |
| 25 to 29 Minutes | 0 | 0.0% |
| 30 to 34 Minutes | 11 | 0.7% |
| 35 to 39 Minutes | 0 | 0.0% |
| 40 to 44 Minutes | 31 | 2.0% |
| 45 to 59 Minutes | 123 | 7.9% |
| 60 to 89 Minutes | 14 | 0.9% |
| 90 or more Minutes | 54 | 3.5% |
Commute Time by Sex in Beulah
The most common commute times in Beulah are 5 to 9 minutes (269 commuters, 29.8%) for males and 5 to 9 minutes (193 commuters, 29.4%) for females.
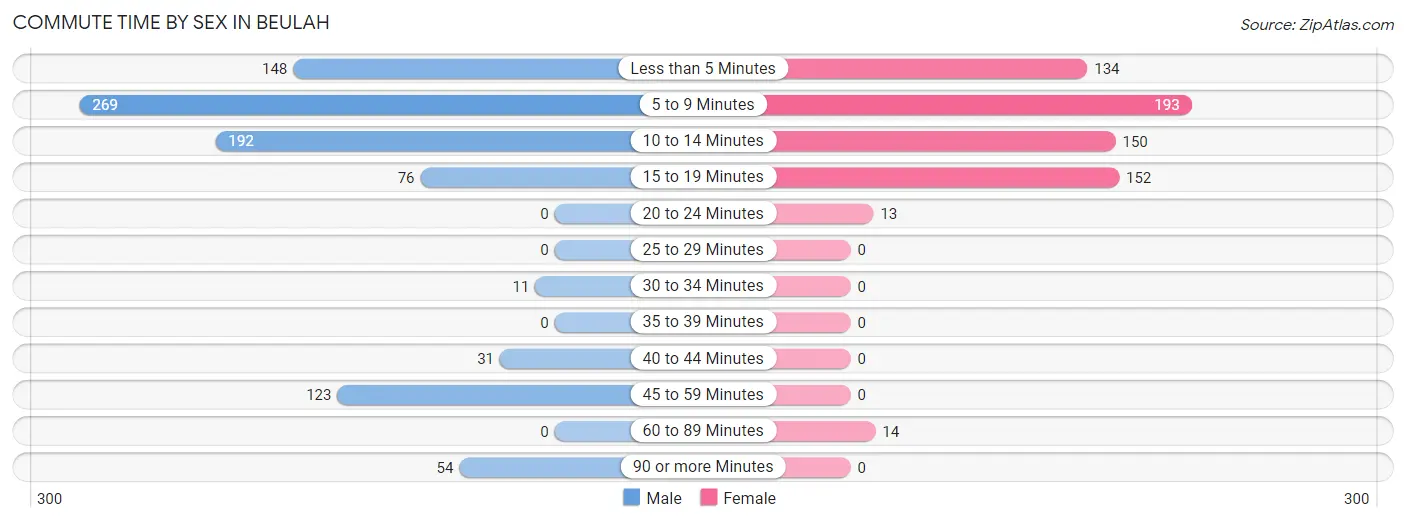
| Commute Time | Male | Female |
| Less than 5 Minutes | 148 (16.4%) | 134 (20.4%) |
| 5 to 9 Minutes | 269 (29.8%) | 193 (29.4%) |
| 10 to 14 Minutes | 192 (21.2%) | 150 (22.9%) |
| 15 to 19 Minutes | 76 (8.4%) | 152 (23.2%) |
| 20 to 24 Minutes | 0 (0.0%) | 13 (2.0%) |
| 25 to 29 Minutes | 0 (0.0%) | 0 (0.0%) |
| 30 to 34 Minutes | 11 (1.2%) | 0 (0.0%) |
| 35 to 39 Minutes | 0 (0.0%) | 0 (0.0%) |
| 40 to 44 Minutes | 31 (3.4%) | 0 (0.0%) |
| 45 to 59 Minutes | 123 (13.6%) | 0 (0.0%) |
| 60 to 89 Minutes | 0 (0.0%) | 14 (2.1%) |
| 90 or more Minutes | 54 (6.0%) | 0 (0.0%) |
Time of Departure to Work by Sex in Beulah
The most frequent times of departure to work in Beulah are 8:00 AM to 8:29 AM (191, 21.1%) for males and 7:00 AM to 7:29 AM (179, 27.3%) for females.
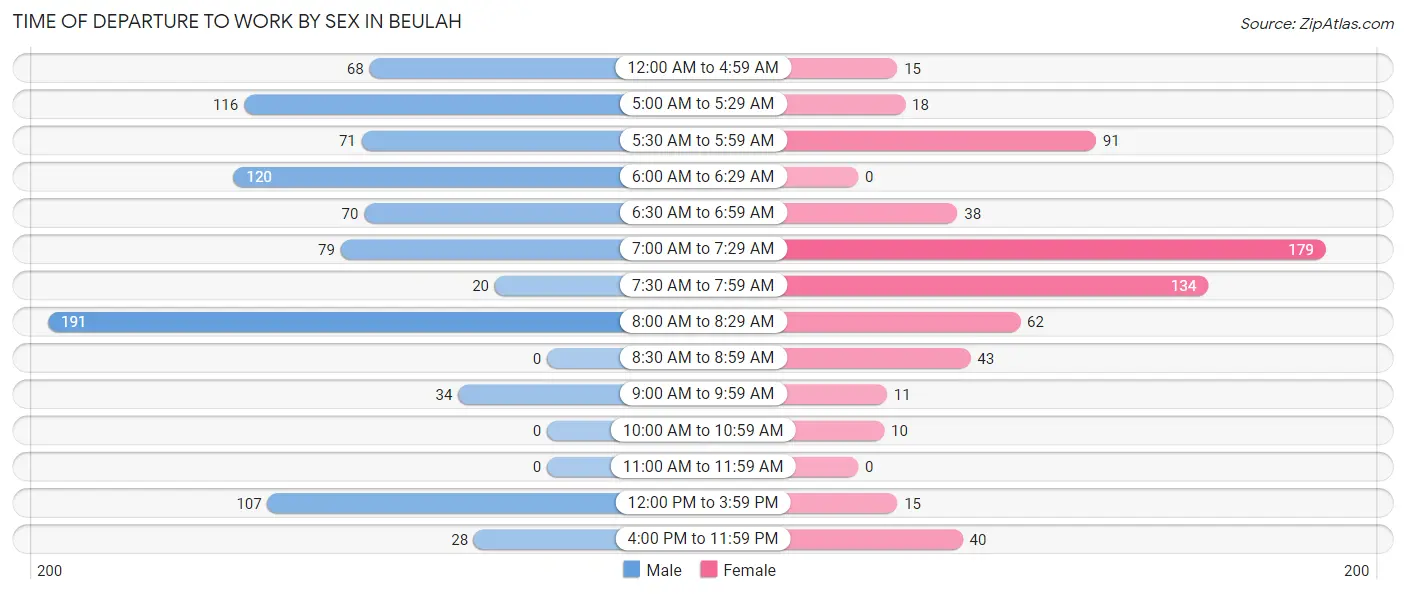
| Time of Departure | Male | Female |
| 12:00 AM to 4:59 AM | 68 (7.5%) | 15 (2.3%) |
| 5:00 AM to 5:29 AM | 116 (12.8%) | 18 (2.7%) |
| 5:30 AM to 5:59 AM | 71 (7.9%) | 91 (13.9%) |
| 6:00 AM to 6:29 AM | 120 (13.3%) | 0 (0.0%) |
| 6:30 AM to 6:59 AM | 70 (7.7%) | 38 (5.8%) |
| 7:00 AM to 7:29 AM | 79 (8.7%) | 179 (27.3%) |
| 7:30 AM to 7:59 AM | 20 (2.2%) | 134 (20.4%) |
| 8:00 AM to 8:29 AM | 191 (21.1%) | 62 (9.5%) |
| 8:30 AM to 8:59 AM | 0 (0.0%) | 43 (6.6%) |
| 9:00 AM to 9:59 AM | 34 (3.8%) | 11 (1.7%) |
| 10:00 AM to 10:59 AM | 0 (0.0%) | 10 (1.5%) |
| 11:00 AM to 11:59 AM | 0 (0.0%) | 0 (0.0%) |
| 12:00 PM to 3:59 PM | 107 (11.8%) | 15 (2.3%) |
| 4:00 PM to 11:59 PM | 28 (3.1%) | 40 (6.1%) |
| Total | 904 (100.0%) | 656 (100.0%) |
Housing Occupancy in Beulah
Occupancy by Ownership in Beulah
Of the total 1,262 dwellings in Beulah, owner-occupied units account for 1,029 (81.5%), while renter-occupied units make up 233 (18.5%).
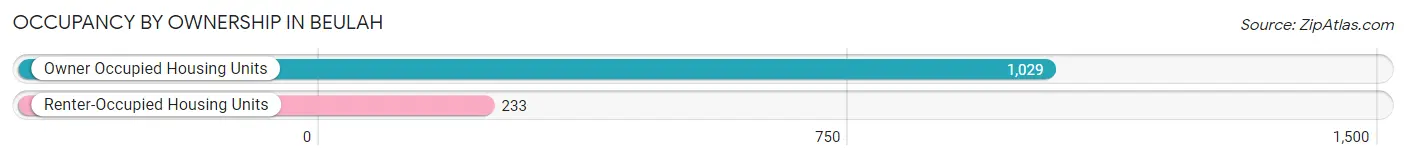
| Occupancy | # Housing Units | % Housing Units |
| Owner Occupied Housing Units | 1,029 | 81.5% |
| Renter-Occupied Housing Units | 233 | 18.5% |
| Total Occupied Housing Units | 1,262 | 100.0% |
Occupancy by Household Size in Beulah
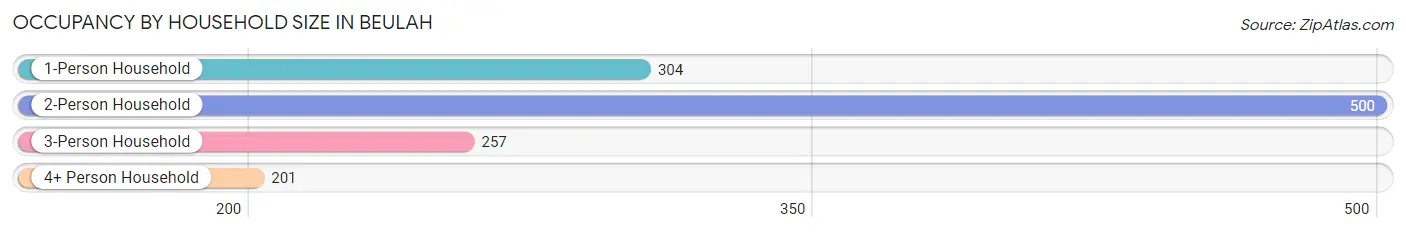
| Household Size | # Housing Units | % Housing Units |
| 1-Person Household | 304 | 24.1% |
| 2-Person Household | 500 | 39.6% |
| 3-Person Household | 257 | 20.4% |
| 4+ Person Household | 201 | 15.9% |
| Total Housing Units | 1,262 | 100.0% |
Occupancy by Ownership by Household Size in Beulah
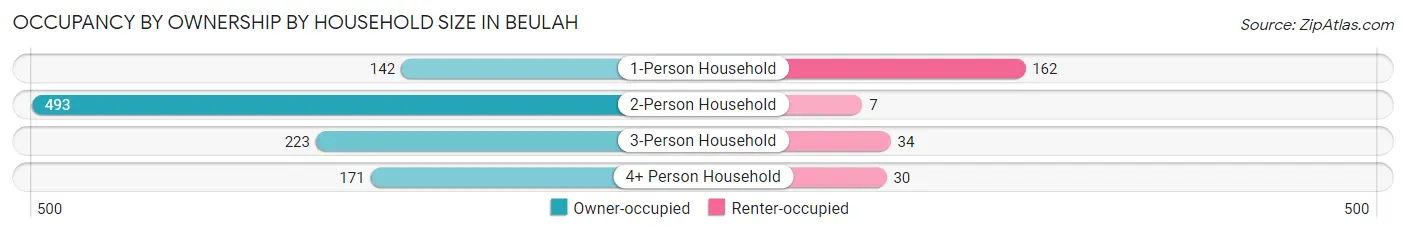
| Household Size | Owner-occupied | Renter-occupied |
| 1-Person Household | 142 (46.7%) | 162 (53.3%) |
| 2-Person Household | 493 (98.6%) | 7 (1.4%) |
| 3-Person Household | 223 (86.8%) | 34 (13.2%) |
| 4+ Person Household | 171 (85.1%) | 30 (14.9%) |
| Total Housing Units | 1,029 (81.5%) | 233 (18.5%) |
Occupancy by Educational Attainment in Beulah
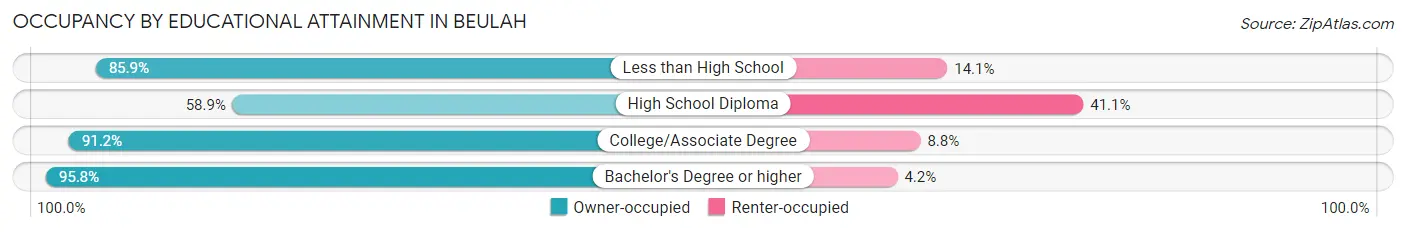
| Household Size | Owner-occupied | Renter-occupied |
| Less than High School | 140 (85.9%) | 23 (14.1%) |
| High School Diploma | 221 (58.9%) | 154 (41.1%) |
| College/Associate Degree | 509 (91.2%) | 49 (8.8%) |
| Bachelor's Degree or higher | 159 (95.8%) | 7 (4.2%) |
Occupancy by Age of Householder in Beulah
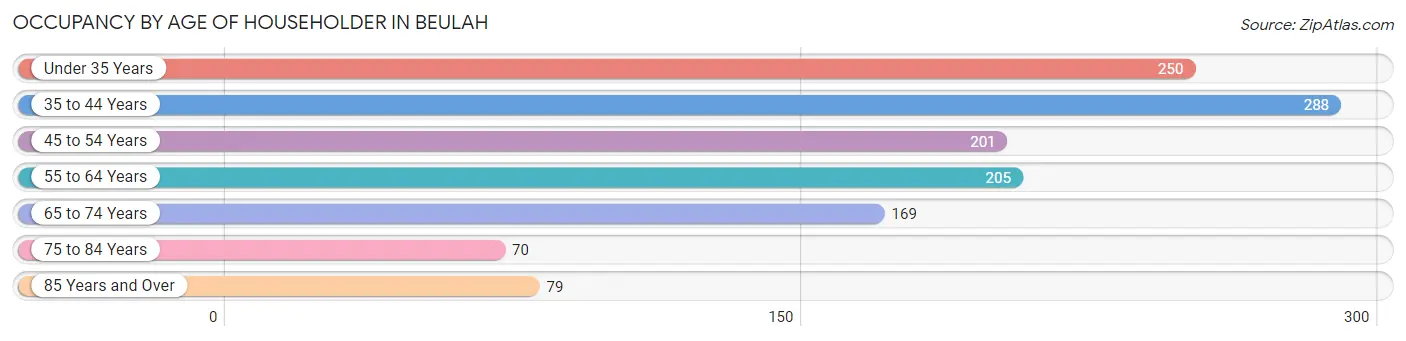
| Age Bracket | # Households | % Households |
| Under 35 Years | 250 | 19.8% |
| 35 to 44 Years | 288 | 22.8% |
| 45 to 54 Years | 201 | 15.9% |
| 55 to 64 Years | 205 | 16.2% |
| 65 to 74 Years | 169 | 13.4% |
| 75 to 84 Years | 70 | 5.6% |
| 85 Years and Over | 79 | 6.3% |
| Total | 1,262 | 100.0% |
Housing Finances in Beulah
Median Income by Occupancy in Beulah
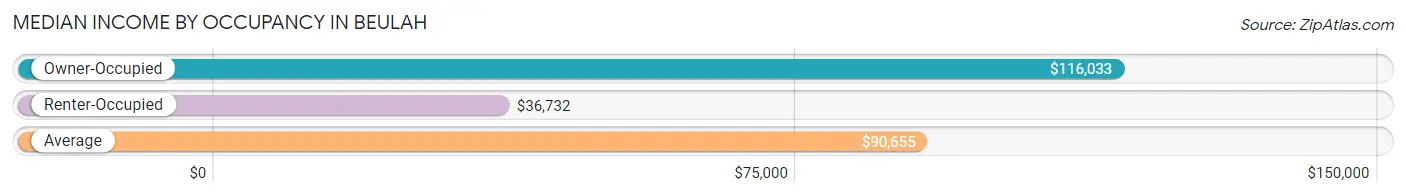
| Occupancy Type | # Households | Median Income |
| Owner-Occupied | 1,029 (81.5%) | $116,033 |
| Renter-Occupied | 233 (18.5%) | $36,732 |
| Average | 1,262 (100.0%) | $90,655 |
Occupancy by Householder Income Bracket in Beulah
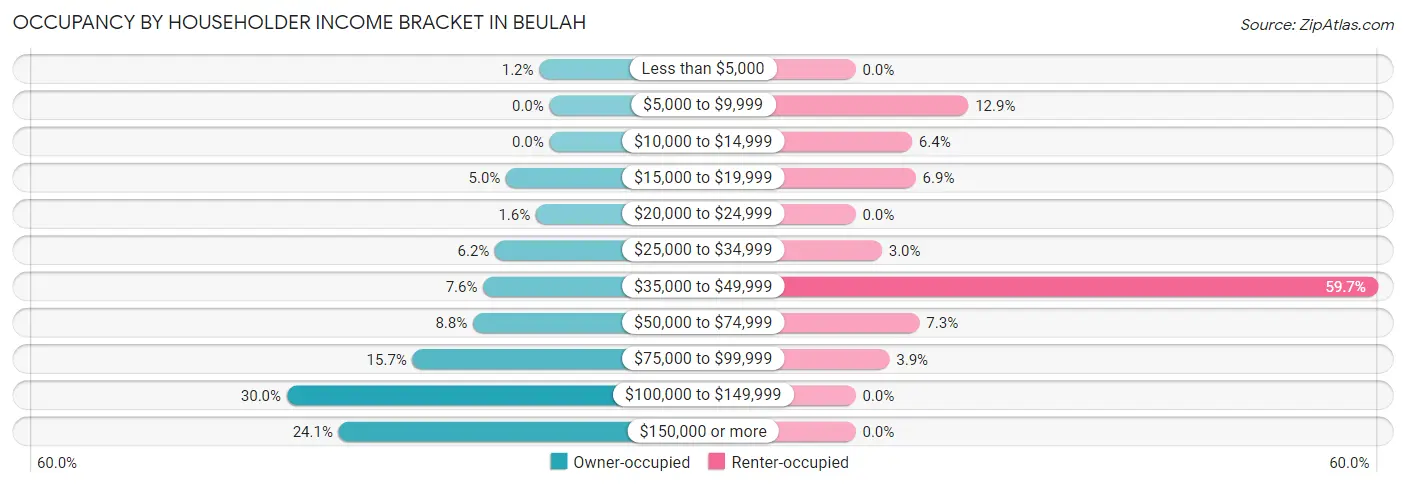
| Income Bracket | Owner-occupied | Renter-occupied |
| Less than $5,000 | 12 (1.2%) | 0 (0.0%) |
| $5,000 to $9,999 | 0 (0.0%) | 30 (12.9%) |
| $10,000 to $14,999 | 0 (0.0%) | 15 (6.4%) |
| $15,000 to $19,999 | 51 (5.0%) | 16 (6.9%) |
| $20,000 to $24,999 | 16 (1.5%) | 0 (0.0%) |
| $25,000 to $34,999 | 64 (6.2%) | 7 (3.0%) |
| $35,000 to $49,999 | 78 (7.6%) | 139 (59.7%) |
| $50,000 to $74,999 | 90 (8.7%) | 17 (7.3%) |
| $75,000 to $99,999 | 161 (15.7%) | 9 (3.9%) |
| $100,000 to $149,999 | 309 (30.0%) | 0 (0.0%) |
| $150,000 or more | 248 (24.1%) | 0 (0.0%) |
| Total | 1,029 (100.0%) | 233 (100.0%) |
Monthly Housing Cost Tiers in Beulah
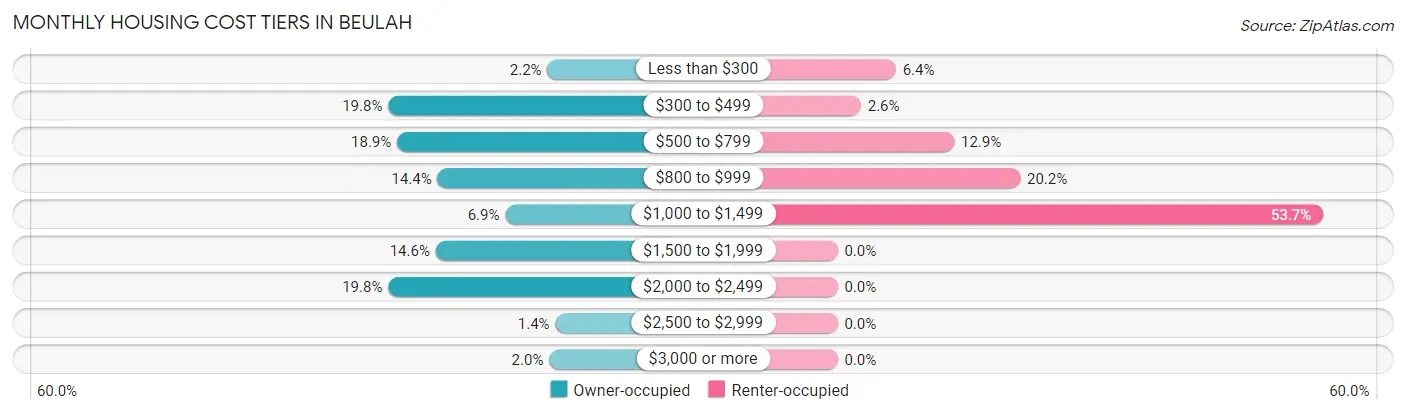
| Monthly Cost | Owner-occupied | Renter-occupied |
| Less than $300 | 23 (2.2%) | 15 (6.4%) |
| $300 to $499 | 204 (19.8%) | 6 (2.6%) |
| $500 to $799 | 194 (18.9%) | 30 (12.9%) |
| $800 to $999 | 148 (14.4%) | 47 (20.2%) |
| $1,000 to $1,499 | 71 (6.9%) | 125 (53.6%) |
| $1,500 to $1,999 | 150 (14.6%) | 0 (0.0%) |
| $2,000 to $2,499 | 204 (19.8%) | 0 (0.0%) |
| $2,500 to $2,999 | 14 (1.4%) | 0 (0.0%) |
| $3,000 or more | 21 (2.0%) | 0 (0.0%) |
| Total | 1,029 (100.0%) | 233 (100.0%) |
Physical Housing Characteristics in Beulah
Housing Structures in Beulah
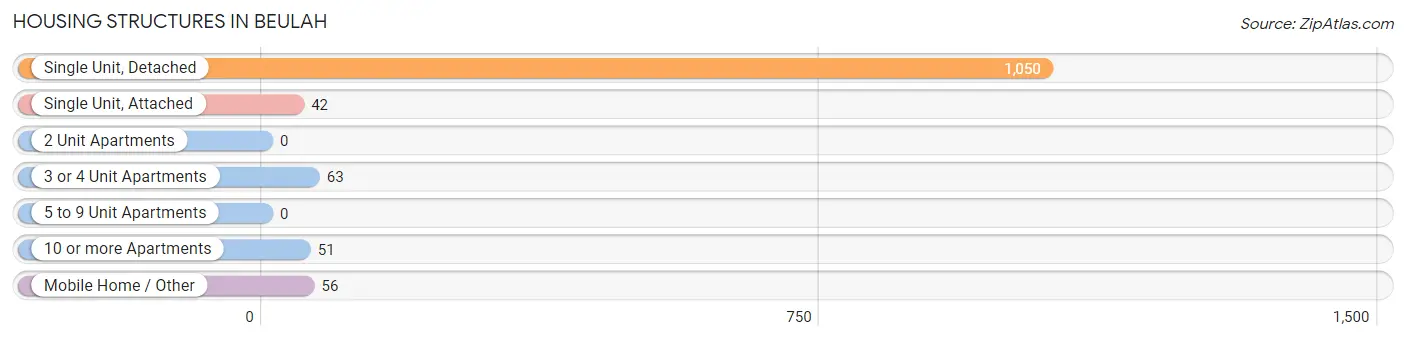
| Structure Type | # Housing Units | % Housing Units |
| Single Unit, Detached | 1,050 | 83.2% |
| Single Unit, Attached | 42 | 3.3% |
| 2 Unit Apartments | 0 | 0.0% |
| 3 or 4 Unit Apartments | 63 | 5.0% |
| 5 to 9 Unit Apartments | 0 | 0.0% |
| 10 or more Apartments | 51 | 4.0% |
| Mobile Home / Other | 56 | 4.4% |
| Total | 1,262 | 100.0% |
Housing Structures by Occupancy in Beulah
| Structure Type | Owner-occupied | Renter-occupied |
| Single Unit, Detached | 940 (89.5%) | 110 (10.5%) |
| Single Unit, Attached | 19 (45.2%) | 23 (54.8%) |
| 2 Unit Apartments | 0 (0.0%) | 0 (0.0%) |
| 3 or 4 Unit Apartments | 8 (12.7%) | 55 (87.3%) |
| 5 to 9 Unit Apartments | 0 (0.0%) | 0 (0.0%) |
| 10 or more Apartments | 12 (23.5%) | 39 (76.5%) |
| Mobile Home / Other | 50 (89.3%) | 6 (10.7%) |
| Total | 1,029 (81.5%) | 233 (18.5%) |
Housing Structures by Number of Rooms in Beulah
| Number of Rooms | Owner-occupied | Renter-occupied |
| 1 Room | 0 (0.0%) | 39 (16.7%) |
| 2 or 3 Rooms | 0 (0.0%) | 22 (9.4%) |
| 4 or 5 Rooms | 272 (26.4%) | 125 (53.6%) |
| 6 or 7 Rooms | 356 (34.6%) | 6 (2.6%) |
| 8 or more Rooms | 401 (39.0%) | 41 (17.6%) |
| Total | 1,029 (100.0%) | 233 (100.0%) |
Housing Structure by Heating Type in Beulah
| Heating Type | Owner-occupied | Renter-occupied |
| Utility Gas | 55 (5.3%) | 0 (0.0%) |
| Bottled, Tank, or LP Gas | 666 (64.7%) | 89 (38.2%) |
| Electricity | 294 (28.6%) | 144 (61.8%) |
| Fuel Oil or Kerosene | 4 (0.4%) | 0 (0.0%) |
| Coal or Coke | 0 (0.0%) | 0 (0.0%) |
| All other Fuels | 10 (1.0%) | 0 (0.0%) |
| No Fuel Used | 0 (0.0%) | 0 (0.0%) |
| Total | 1,029 (100.0%) | 233 (100.0%) |
Household Vehicle Usage in Beulah
| Vehicles per Household | Owner-occupied | Renter-occupied |
| No Vehicle | 12 (1.2%) | 34 (14.6%) |
| 1 Vehicle | 221 (21.5%) | 80 (34.3%) |
| 2 Vehicles | 242 (23.5%) | 119 (51.1%) |
| 3 or more Vehicles | 554 (53.8%) | 0 (0.0%) |
| Total | 1,029 (100.0%) | 233 (100.0%) |
Real Estate & Mortgages in Beulah
Real Estate and Mortgage Overview in Beulah
| Characteristic | Without Mortgage | With Mortgage |
| Housing Units | 549 | 480 |
| Median Property Value | $142,300 | $287,400 |
| Median Household Income | $78,594 | $167 |
| Monthly Housing Costs | $597 | $21 |
| Real Estate Taxes | $2,233 | $0 |
Property Value by Mortgage Status in Beulah
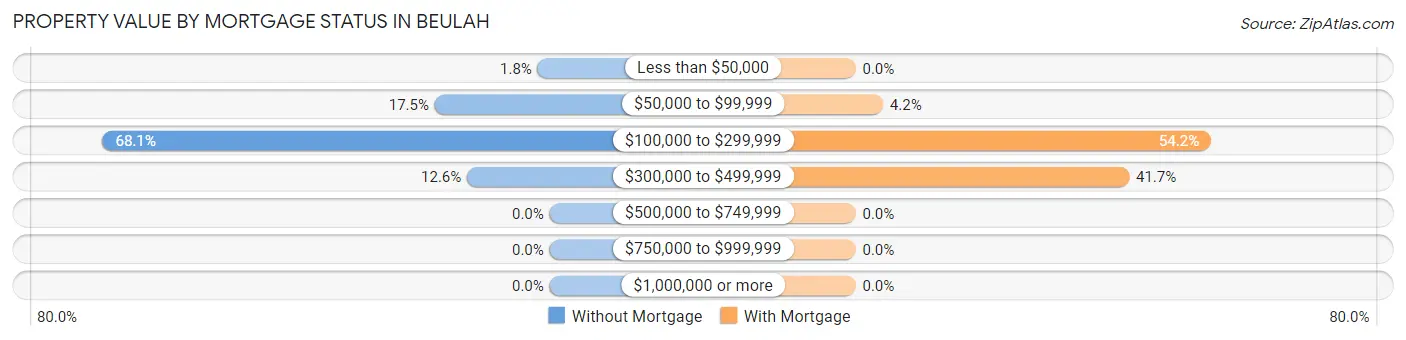
| Property Value | Without Mortgage | With Mortgage |
| Less than $50,000 | 10 (1.8%) | 0 (0.0%) |
| $50,000 to $99,999 | 96 (17.5%) | 20 (4.2%) |
| $100,000 to $299,999 | 374 (68.1%) | 260 (54.2%) |
| $300,000 to $499,999 | 69 (12.6%) | 200 (41.7%) |
| $500,000 to $749,999 | 0 (0.0%) | 0 (0.0%) |
| $750,000 to $999,999 | 0 (0.0%) | 0 (0.0%) |
| $1,000,000 or more | 0 (0.0%) | 0 (0.0%) |
| Total | 549 (100.0%) | 480 (100.0%) |
Household Income by Mortgage Status in Beulah
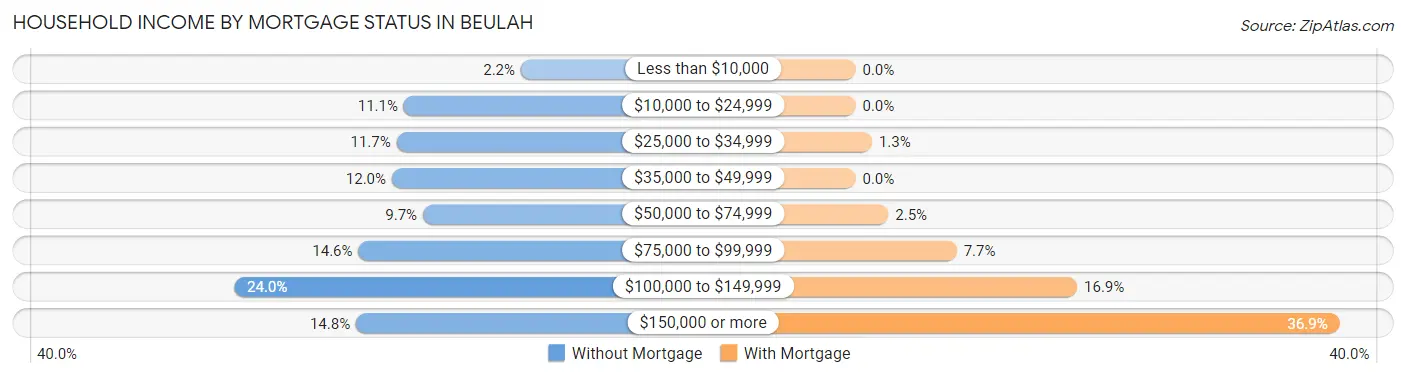
| Household Income | Without Mortgage | With Mortgage |
| Less than $10,000 | 12 (2.2%) | 0 (0.0%) |
| $10,000 to $24,999 | 61 (11.1%) | 0 (0.0%) |
| $25,000 to $34,999 | 64 (11.7%) | 6 (1.3%) |
| $35,000 to $49,999 | 66 (12.0%) | 0 (0.0%) |
| $50,000 to $74,999 | 53 (9.7%) | 12 (2.5%) |
| $75,000 to $99,999 | 80 (14.6%) | 37 (7.7%) |
| $100,000 to $149,999 | 132 (24.0%) | 81 (16.9%) |
| $150,000 or more | 81 (14.7%) | 177 (36.9%) |
| Total | 549 (100.0%) | 480 (100.0%) |
Property Value to Household Income Ratio in Beulah
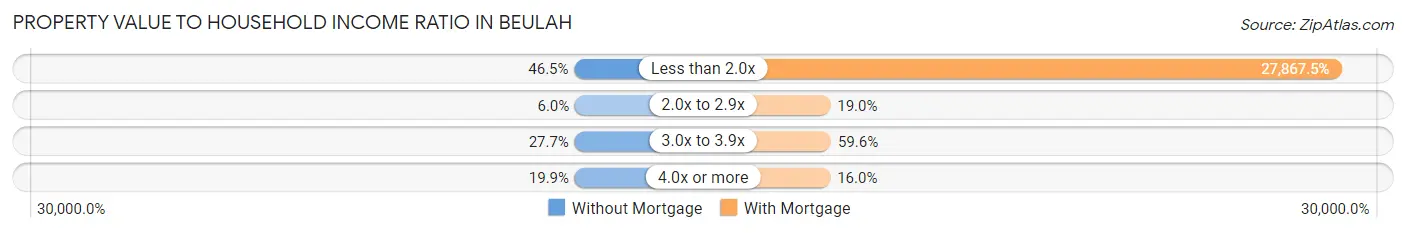
| Value-to-Income Ratio | Without Mortgage | With Mortgage |
| Less than 2.0x | 255 (46.5%) | 133,764 (27,867.5%) |
| 2.0x to 2.9x | 33 (6.0%) | 91 (19.0%) |
| 3.0x to 3.9x | 152 (27.7%) | 286 (59.6%) |
| 4.0x or more | 109 (19.9%) | 77 (16.0%) |
| Total | 549 (100.0%) | 480 (100.0%) |
Real Estate Taxes by Mortgage Status in Beulah
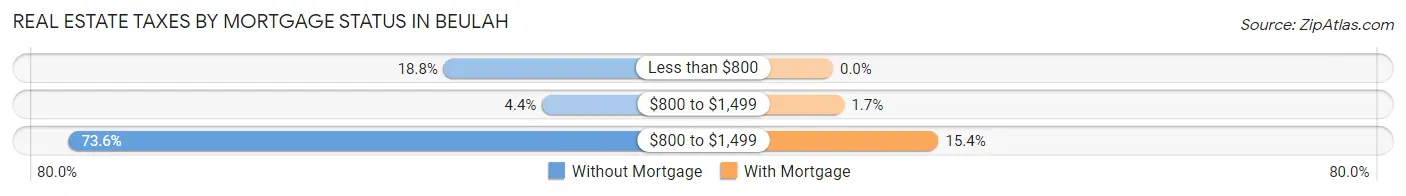
| Property Taxes | Without Mortgage | With Mortgage |
| Less than $800 | 103 (18.8%) | 0 (0.0%) |
| $800 to $1,499 | 24 (4.4%) | 8 (1.7%) |
| $800 to $1,499 | 404 (73.6%) | 74 (15.4%) |
| Total | 549 (100.0%) | 480 (100.0%) |
Health & Disability in Beulah
Health Insurance Coverage by Age in Beulah
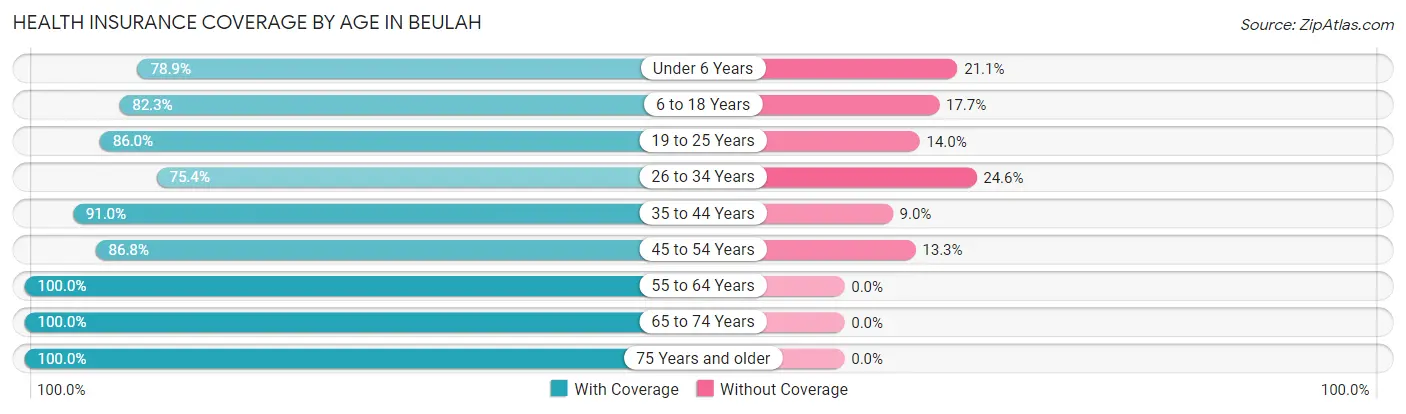
| Age Bracket | With Coverage | Without Coverage |
| Under 6 Years | 176 (78.9%) | 47 (21.1%) |
| 6 to 18 Years | 396 (82.3%) | 85 (17.7%) |
| 19 to 25 Years | 300 (86.0%) | 49 (14.0%) |
| 26 to 34 Years | 193 (75.4%) | 63 (24.6%) |
| 35 to 44 Years | 384 (91.0%) | 38 (9.0%) |
| 45 to 54 Years | 275 (86.8%) | 42 (13.3%) |
| 55 to 64 Years | 448 (100.0%) | 0 (0.0%) |
| 65 to 74 Years | 242 (100.0%) | 0 (0.0%) |
| 75 Years and older | 208 (100.0%) | 0 (0.0%) |
| Total | 2,622 (89.0%) | 324 (11.0%) |
Health Insurance Coverage by Citizenship Status in Beulah
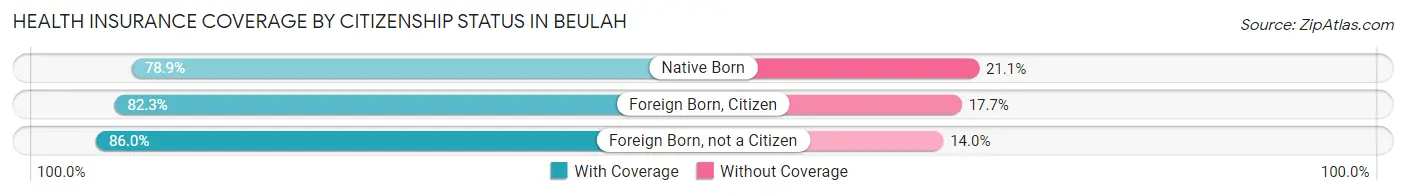
| Citizenship Status | With Coverage | Without Coverage |
| Native Born | 176 (78.9%) | 47 (21.1%) |
| Foreign Born, Citizen | 396 (82.3%) | 85 (17.7%) |
| Foreign Born, not a Citizen | 300 (86.0%) | 49 (14.0%) |
Health Insurance Coverage by Household Income in Beulah
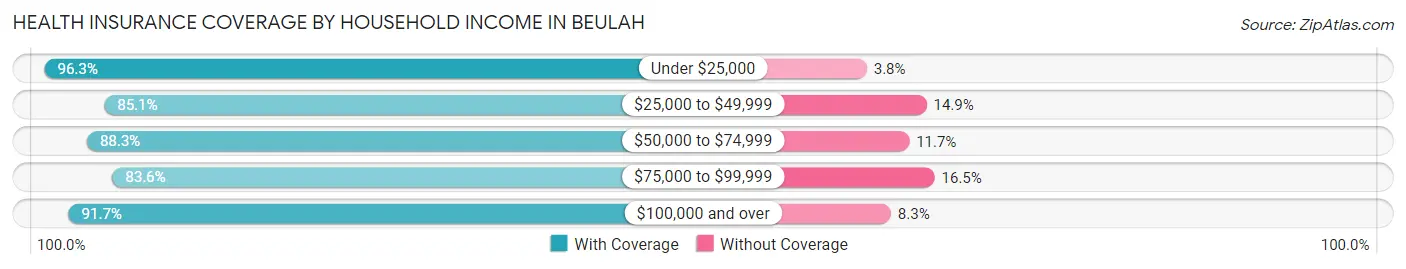
| Household Income | With Coverage | Without Coverage |
| Under $25,000 | 154 (96.3%) | 6 (3.7%) |
| $25,000 to $49,999 | 535 (85.1%) | 94 (14.9%) |
| $50,000 to $74,999 | 219 (88.3%) | 29 (11.7%) |
| $75,000 to $99,999 | 381 (83.6%) | 75 (16.5%) |
| $100,000 and over | 1,333 (91.7%) | 120 (8.3%) |
Public vs Private Health Insurance Coverage by Age in Beulah
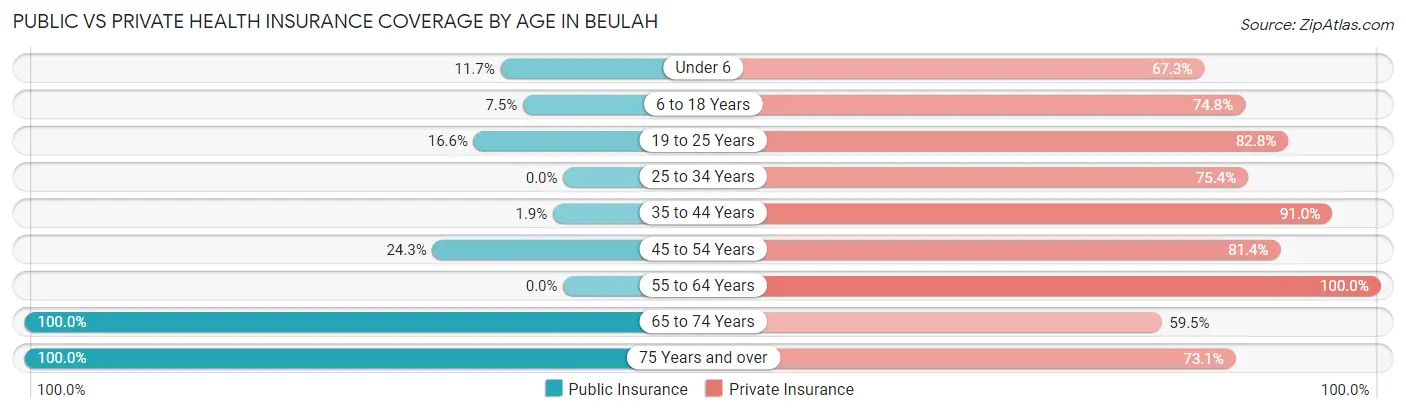
| Age Bracket | Public Insurance | Private Insurance |
| Under 6 | 26 (11.7%) | 150 (67.3%) |
| 6 to 18 Years | 36 (7.5%) | 360 (74.8%) |
| 19 to 25 Years | 58 (16.6%) | 289 (82.8%) |
| 25 to 34 Years | 0 (0.0%) | 193 (75.4%) |
| 35 to 44 Years | 8 (1.9%) | 384 (91.0%) |
| 45 to 54 Years | 77 (24.3%) | 258 (81.4%) |
| 55 to 64 Years | 0 (0.0%) | 448 (100.0%) |
| 65 to 74 Years | 242 (100.0%) | 144 (59.5%) |
| 75 Years and over | 208 (100.0%) | 152 (73.1%) |
| Total | 655 (22.2%) | 2,378 (80.7%) |
Disability Status by Sex by Age in Beulah
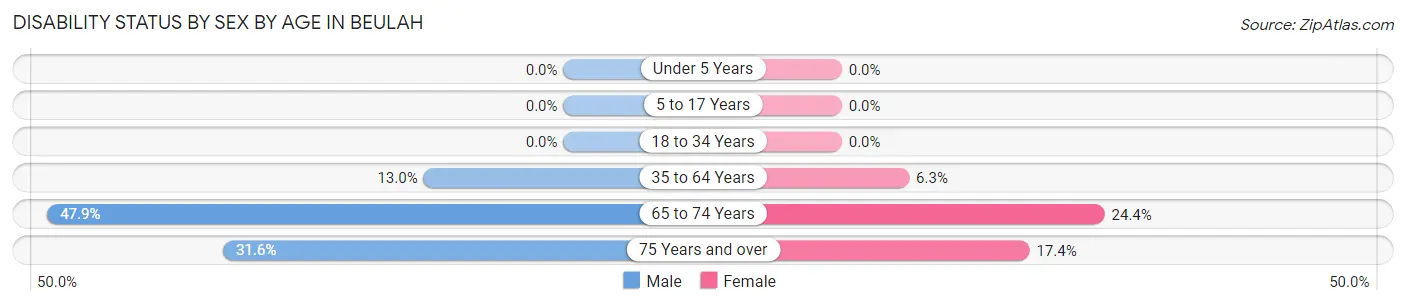
| Age Bracket | Male | Female |
| Under 5 Years | 0 (0.0%) | 0 (0.0%) |
| 5 to 17 Years | 0 (0.0%) | 0 (0.0%) |
| 18 to 34 Years | 0 (0.0%) | 0 (0.0%) |
| 35 to 64 Years | 71 (13.0%) | 40 (6.2%) |
| 65 to 74 Years | 57 (47.9%) | 30 (24.4%) |
| 75 Years and over | 24 (31.6%) | 23 (17.4%) |
Disability Class by Sex by Age in Beulah
Disability Class: Hearing Difficulty
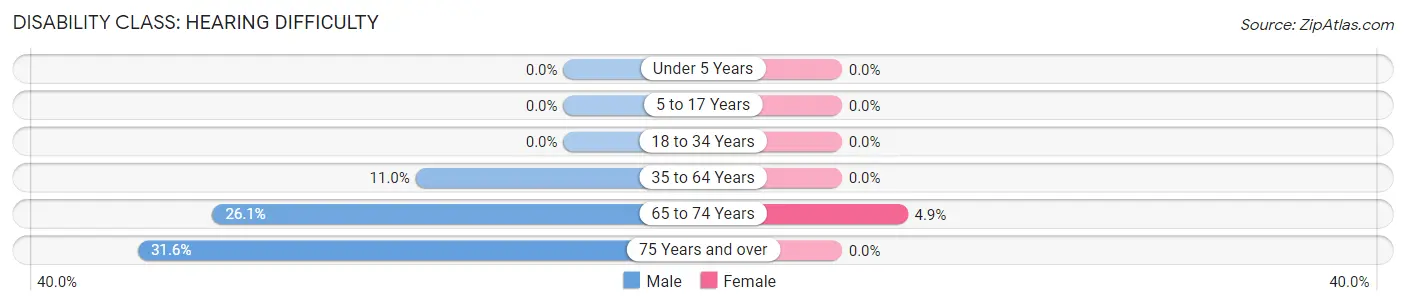
| Age Bracket | Male | Female |
| Under 5 Years | 0 (0.0%) | 0 (0.0%) |
| 5 to 17 Years | 0 (0.0%) | 0 (0.0%) |
| 18 to 34 Years | 0 (0.0%) | 0 (0.0%) |
| 35 to 64 Years | 60 (11.0%) | 0 (0.0%) |
| 65 to 74 Years | 31 (26.1%) | 6 (4.9%) |
| 75 Years and over | 24 (31.6%) | 0 (0.0%) |
Disability Class: Vision Difficulty
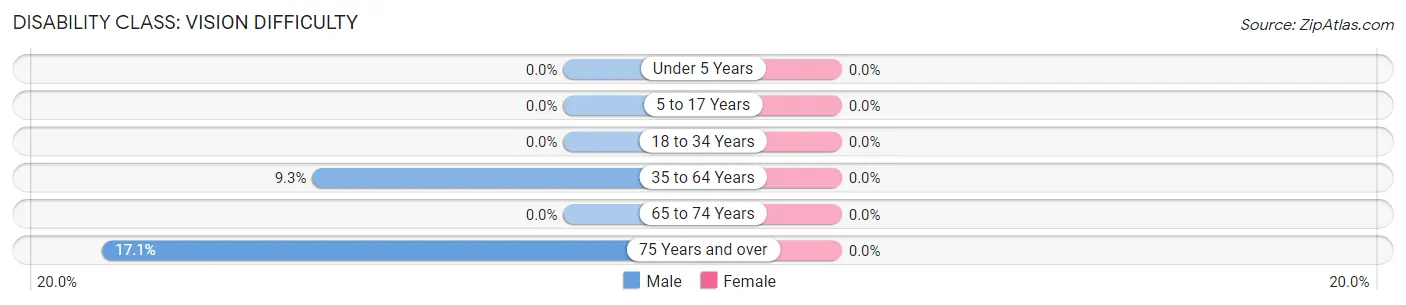
| Age Bracket | Male | Female |
| Under 5 Years | 0 (0.0%) | 0 (0.0%) |
| 5 to 17 Years | 0 (0.0%) | 0 (0.0%) |
| 18 to 34 Years | 0 (0.0%) | 0 (0.0%) |
| 35 to 64 Years | 51 (9.3%) | 0 (0.0%) |
| 65 to 74 Years | 0 (0.0%) | 0 (0.0%) |
| 75 Years and over | 13 (17.1%) | 0 (0.0%) |
Disability Class: Cognitive Difficulty
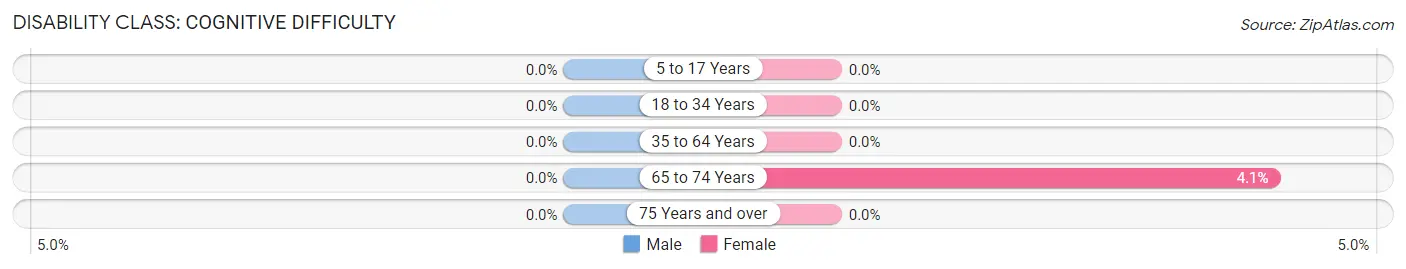
| Age Bracket | Male | Female |
| 5 to 17 Years | 0 (0.0%) | 0 (0.0%) |
| 18 to 34 Years | 0 (0.0%) | 0 (0.0%) |
| 35 to 64 Years | 0 (0.0%) | 0 (0.0%) |
| 65 to 74 Years | 0 (0.0%) | 5 (4.1%) |
| 75 Years and over | 0 (0.0%) | 0 (0.0%) |
Disability Class: Ambulatory Difficulty
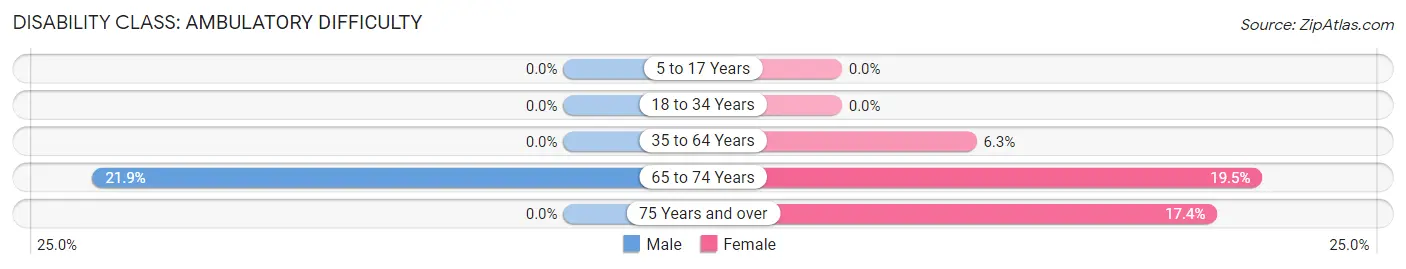
| Age Bracket | Male | Female |
| 5 to 17 Years | 0 (0.0%) | 0 (0.0%) |
| 18 to 34 Years | 0 (0.0%) | 0 (0.0%) |
| 35 to 64 Years | 0 (0.0%) | 40 (6.2%) |
| 65 to 74 Years | 26 (21.8%) | 24 (19.5%) |
| 75 Years and over | 0 (0.0%) | 23 (17.4%) |
Disability Class: Self-Care Difficulty
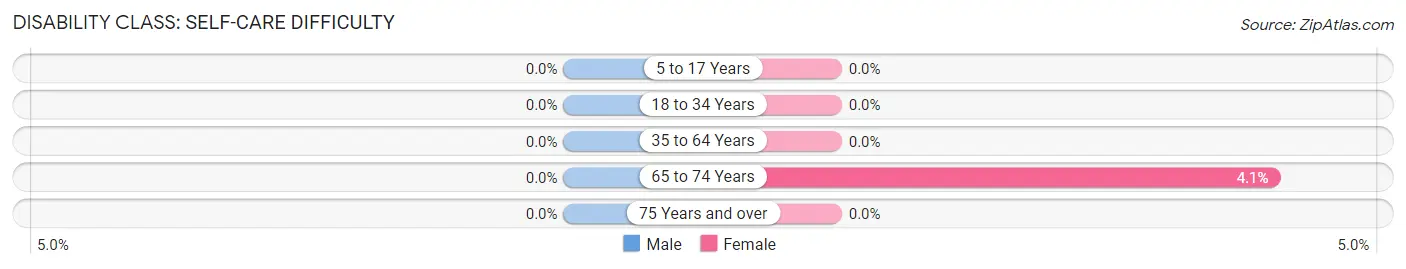
| Age Bracket | Male | Female |
| 5 to 17 Years | 0 (0.0%) | 0 (0.0%) |
| 18 to 34 Years | 0 (0.0%) | 0 (0.0%) |
| 35 to 64 Years | 0 (0.0%) | 0 (0.0%) |
| 65 to 74 Years | 0 (0.0%) | 5 (4.1%) |
| 75 Years and over | 0 (0.0%) | 0 (0.0%) |
Technology Access in Beulah
Computing Device Access in Beulah
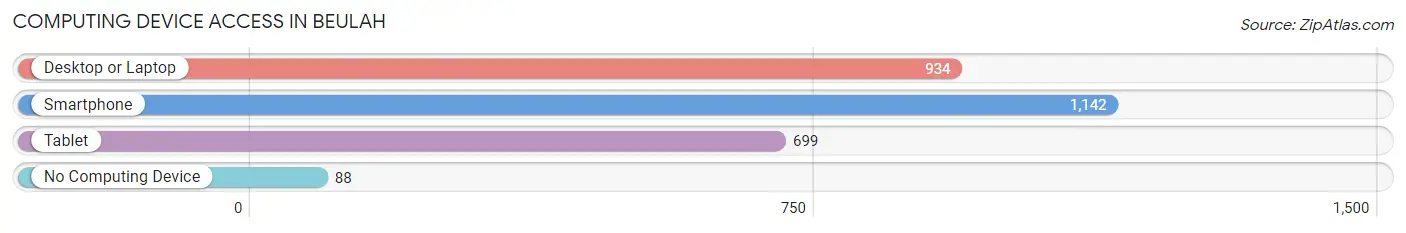
| Device Type | # Households | % Households |
| Desktop or Laptop | 934 | 74.0% |
| Smartphone | 1,142 | 90.5% |
| Tablet | 699 | 55.4% |
| No Computing Device | 88 | 7.0% |
| Total | 1,262 | 100.0% |
Internet Access in Beulah
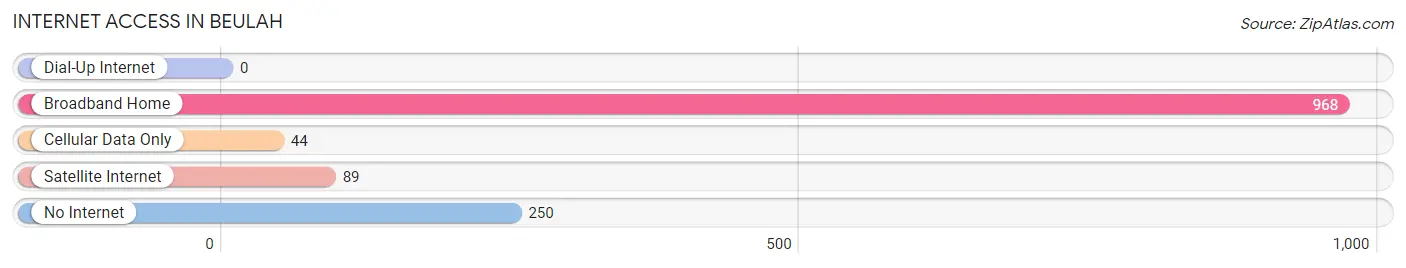
| Internet Type | # Households | % Households |
| Dial-Up Internet | 0 | 0.0% |
| Broadband Home | 968 | 76.7% |
| Cellular Data Only | 44 | 3.5% |
| Satellite Internet | 89 | 7.0% |
| No Internet | 250 | 19.8% |
| Total | 1,262 | 100.0% |
Beulah Summary
Beulah, North Dakota is a small city located in Mercer County, in the western part of the state. It is the county seat of Mercer County and is located on the banks of the Knife River. The city has a population of 2,731 as of the 2010 census.
Beulah was founded in 1883 by German-Russian immigrants who had come to the area to farm. The city was named after the biblical city of Beulah, which is mentioned in the book of Isaiah. The city was incorporated in 1887 and has since grown to become the largest city in Mercer County.
Geography
Beulah is located in the western part of North Dakota, in Mercer County. It is situated on the banks of the Knife River, which flows through the city. The city is located at an elevation of 1,845 feet (562 m) above sea level. The city has a total area of 2.2 square miles (5.7 km2), all of which is land.
The climate in Beulah is semi-arid, with cold winters and hot summers. The average annual temperature is 45.2 °F (7.3 °C). The average annual precipitation is 16.7 inches (42.4 cm).
Economy
Beulah’s economy is largely based on agriculture and energy production. The city is home to several large agricultural operations, including a large dairy farm and a large grain elevator. The city is also home to several energy production facilities, including a coal-fired power plant and a natural gas processing plant.
Beulah is also home to several businesses, including a grocery store, a hardware store, a bank, and several restaurants. The city is also home to a hospital and a nursing home.
Demographics
As of the 2010 census, Beulah had a population of 2,731. The racial makeup of the city was 95.2% White, 0.3% African American, 0.7% Native American, 0.2% Asian, 0.1% Pacific Islander, 1.2% from other races, and 2.4% from two or more races. Hispanic or Latino of any race were 3.2% of the population.
The median income for a household in Beulah was $41,944, and the median income for a family was $50,938. The per capita income for the city was $20,945. About 8.2% of families and 10.3% of the population were below the poverty line, including 14.2% of those under age 18 and 8.2% of those age 65 or over.
Beulah is served by the Beulah Public School District, which includes an elementary school, a middle school, and a high school. The city is also home to a branch of the University of Mary, a private Catholic university.
Beulah is a small city with a rich history and a strong economy. It is home to several large agricultural operations and energy production facilities, as well as several businesses and educational institutions. The city has a diverse population and a strong sense of community.
Common Questions
What is Per Capita Income in Beulah?
Per Capita income in Beulah is $36,040.
What is the Median Family Income in Beulah?
Median Family Income in Beulah is $108,750.
What is the Median Household income in Beulah?
Median Household Income in Beulah is $90,655.
What is Income or Wage Gap in Beulah?
Income or Wage Gap in Beulah is 64.9%.
Women in Beulah earn 35.1 cents for every dollar earned by a man.
What is Inequality or Gini Index in Beulah?
Inequality or Gini Index in Beulah is 0.36.
What is the Total Population of Beulah?
Total Population of Beulah is 3,063.
What is the Total Male Population of Beulah?
Total Male Population of Beulah is 1,466.
What is the Total Female Population of Beulah?
Total Female Population of Beulah is 1,597.
What is the Ratio of Males per 100 Females in Beulah?
There are 91.80 Males per 100 Females in Beulah.
What is the Ratio of Females per 100 Males in Beulah?
There are 108.94 Females per 100 Males in Beulah.
What is the Median Population Age in Beulah?
Median Population Age in Beulah is 40.3 Years.
What is the Average Family Size in Beulah
Average Family Size in Beulah is 2.7 People.
What is the Average Household Size in Beulah
Average Household Size in Beulah is 2.3 People.
How Large is the Labor Force in Beulah?
There are 1,579 People in the Labor Forcein in Beulah.
What is the Percentage of People in the Labor Force in Beulah?
62.1% of People are in the Labor Force in Beulah.
What is the Unemployment Rate in Beulah?
Unemployment Rate in Beulah is 0.6%.