Stanley, ND Map & Demographics
Stanley Map
Stanley Overview
$44,087
PER CAPITA INCOME
$125,245
AVG FAMILY INCOME
$101,351
AVG HOUSEHOLD INCOME
53.7%
WAGE / INCOME GAP [ % ]
46.3¢/ $1
WAGE / INCOME GAP [ $ ]
0.38
INEQUALITY / GINI INDEX
2,189
TOTAL POPULATION
1,178
MALE POPULATION
1,011
FEMALE POPULATION
116.52
MALES / 100 FEMALES
85.82
FEMALES / 100 MALES
37.2
MEDIAN AGE
3.0
AVG FAMILY SIZE
2.4
AVG HOUSEHOLD SIZE
1,245
LABOR FORCE [ PEOPLE ]
70.6%
PERCENT IN LABOR FORCE
3.3%
UNEMPLOYMENT RATE
Stanley Zip Codes
Stanley Area Codes
Income in Stanley
Income Overview in Stanley
Per Capita Income in Stanley is $44,087, while median incomes of families and households are $125,245 and $101,351 respectively.
| Characteristic | Number | Measure |
| Per Capita Income | 2,189 | $44,087 |
| Median Family Income | 569 | $125,245 |
| Mean Family Income | 569 | $138,179 |
| Median Household Income | 890 | $101,351 |
| Mean Household Income | 890 | $111,965 |
| Income Deficit | 569 | $0 |
| Wage / Income Gap (%) | 2,189 | 53.70% |
| Wage / Income Gap ($) | 2,189 | 46.30¢ per $1 |
| Gini / Inequality Index | 2,189 | 0.38 |
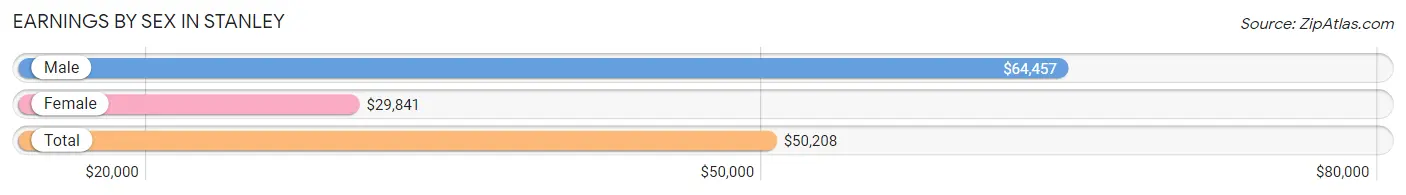
Earnings by Sex in Stanley
Average Earnings in Stanley are $50,208, $64,457 for men and $29,841 for women, a difference of 53.7%.
| Sex | Number | Average Earnings |
| Male | 810 (62.9%) | $64,457 |
| Female | 478 (37.1%) | $29,841 |
| Total | 1,288 (100.0%) | $50,208 |
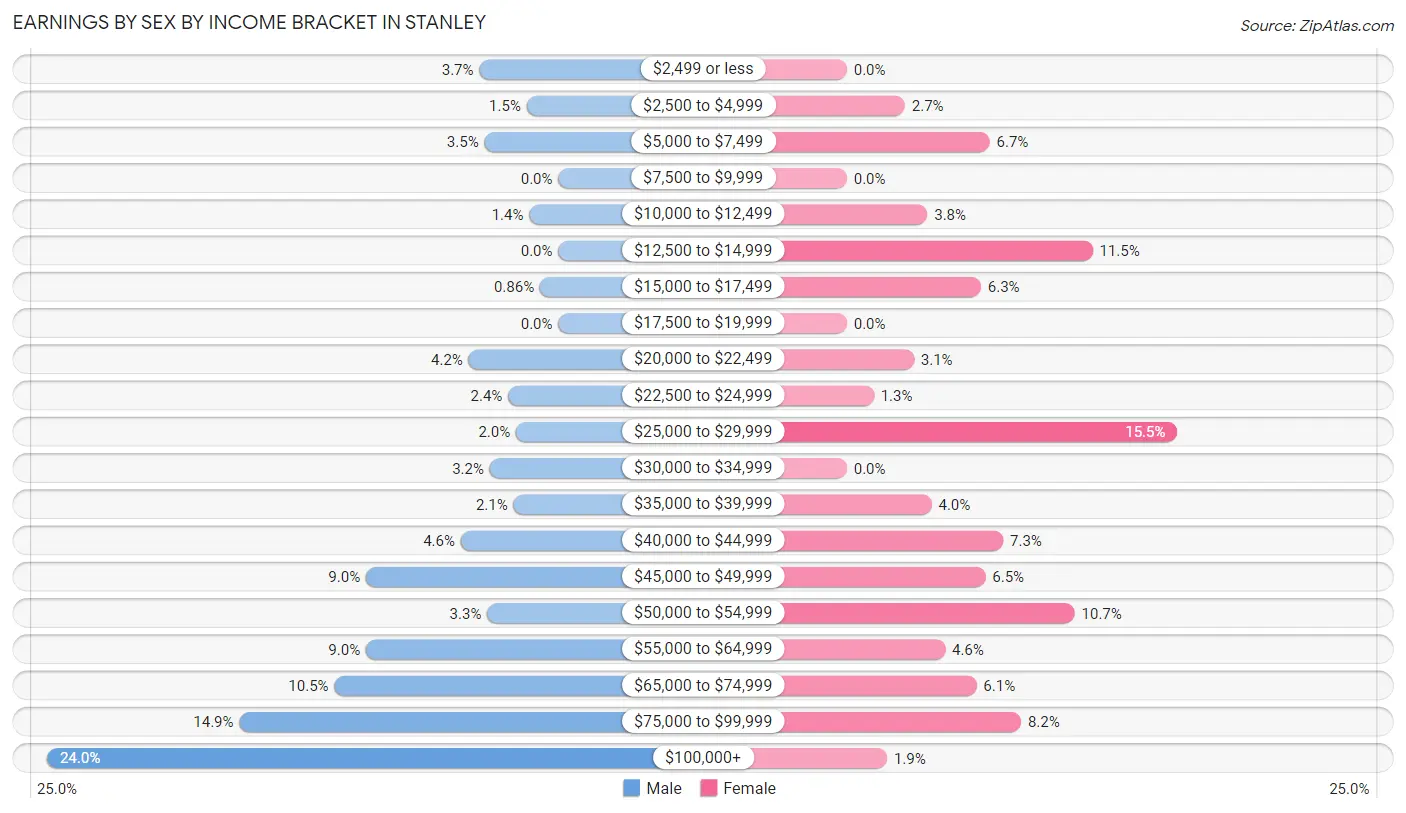
Earnings by Sex by Income Bracket in Stanley
The most common earnings brackets in Stanley are $100,000+ for men (194 | 23.9%) and $25,000 to $29,999 for women (74 | 15.5%).
| Income | Male | Female |
| $2,499 or less | 30 (3.7%) | 0 (0.0%) |
| $2,500 to $4,999 | 12 (1.5%) | 13 (2.7%) |
| $5,000 to $7,499 | 28 (3.5%) | 32 (6.7%) |
| $7,500 to $9,999 | 0 (0.0%) | 0 (0.0%) |
| $10,000 to $12,499 | 11 (1.4%) | 18 (3.8%) |
| $12,500 to $14,999 | 0 (0.0%) | 55 (11.5%) |
| $15,000 to $17,499 | 7 (0.9%) | 30 (6.3%) |
| $17,500 to $19,999 | 0 (0.0%) | 0 (0.0%) |
| $20,000 to $22,499 | 34 (4.2%) | 15 (3.1%) |
| $22,500 to $24,999 | 19 (2.4%) | 6 (1.3%) |
| $25,000 to $29,999 | 16 (2.0%) | 74 (15.5%) |
| $30,000 to $34,999 | 26 (3.2%) | 0 (0.0%) |
| $35,000 to $39,999 | 17 (2.1%) | 19 (4.0%) |
| $40,000 to $44,999 | 37 (4.6%) | 35 (7.3%) |
| $45,000 to $49,999 | 73 (9.0%) | 31 (6.5%) |
| $50,000 to $54,999 | 27 (3.3%) | 51 (10.7%) |
| $55,000 to $64,999 | 73 (9.0%) | 22 (4.6%) |
| $65,000 to $74,999 | 85 (10.5%) | 29 (6.1%) |
| $75,000 to $99,999 | 121 (14.9%) | 39 (8.2%) |
| $100,000+ | 194 (23.9%) | 9 (1.9%) |
| Total | 810 (100.0%) | 478 (100.0%) |
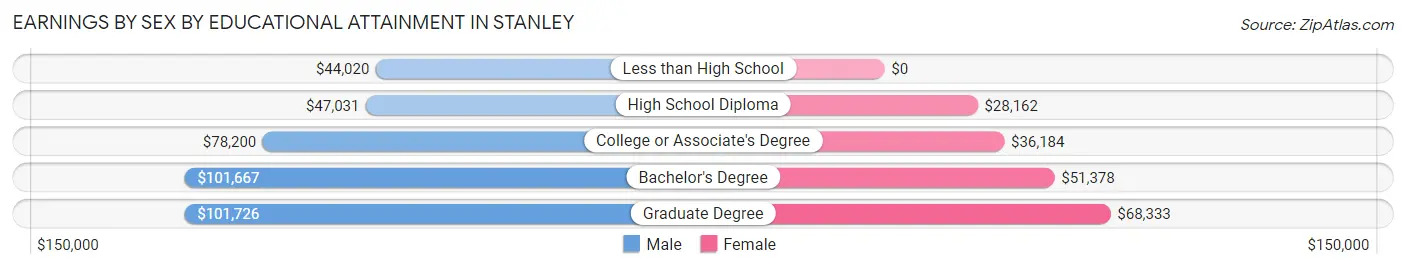
Earnings by Sex by Educational Attainment in Stanley
Average earnings in Stanley are $68,516 for men and $44,571 for women, a difference of 34.9%. Men with an educational attainment of graduate degree enjoy the highest average annual earnings of $101,726, while those with less than high school education earn the least with $44,020. Women with an educational attainment of graduate degree earn the most with the average annual earnings of $68,333, while those with high school diploma education have the smallest earnings of $28,162.
| Educational Attainment | Male Income | Female Income |
| Less than High School | $44,020 | $0 |
| High School Diploma | $47,031 | $28,162 |
| College or Associate's Degree | $78,200 | $36,184 |
| Bachelor's Degree | $101,667 | $51,378 |
| Graduate Degree | $101,726 | $68,333 |
| Total | $68,516 | $44,571 |
Family Income in Stanley
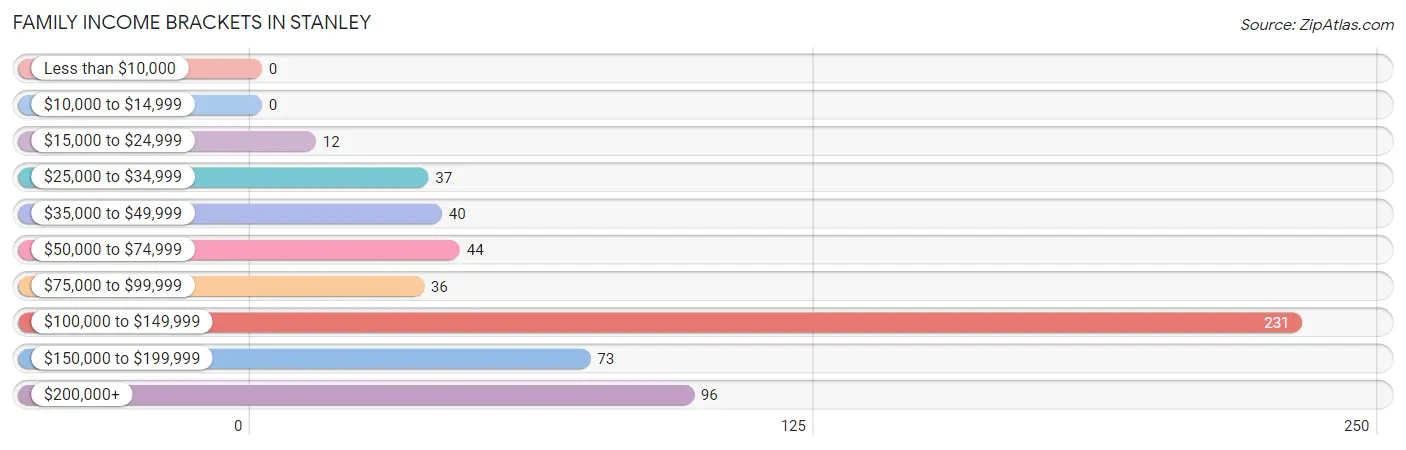
Family Income Brackets in Stanley
According to the Stanley family income data, there are 231 families falling into the $100,000 to $149,999 income range, which is the most common income bracket and makes up 40.6% of all families.
| Income Bracket | # Families | % Families |
| Less than $10,000 | 0 | 0.0% |
| $10,000 to $14,999 | 0 | 0.0% |
| $15,000 to $24,999 | 12 | 2.1% |
| $25,000 to $34,999 | 37 | 6.5% |
| $35,000 to $49,999 | 40 | 7.0% |
| $50,000 to $74,999 | 44 | 7.7% |
| $75,000 to $99,999 | 36 | 6.3% |
| $100,000 to $149,999 | 231 | 40.6% |
| $150,000 to $199,999 | 73 | 12.8% |
| $200,000+ | 96 | 16.9% |
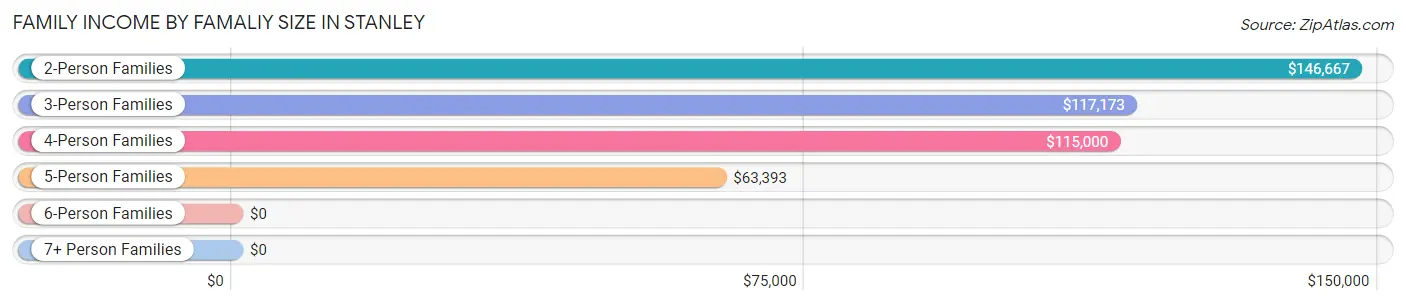
Family Income by Famaliy Size in Stanley
2-person families (282 | 49.6%) account for the highest median family income in Stanley with $146,667 per family, while 2-person families (282 | 49.6%) have the highest median income of $73,334 per family member.
| Income Bracket | # Families | Median Income |
| 2-Person Families | 282 (49.6%) | $146,667 |
| 3-Person Families | 85 (14.9%) | $117,173 |
| 4-Person Families | 128 (22.5%) | $115,000 |
| 5-Person Families | 70 (12.3%) | $63,393 |
| 6-Person Families | 0 (0.0%) | $0 |
| 7+ Person Families | 4 (0.7%) | $0 |
| Total | 569 (100.0%) | $125,245 |
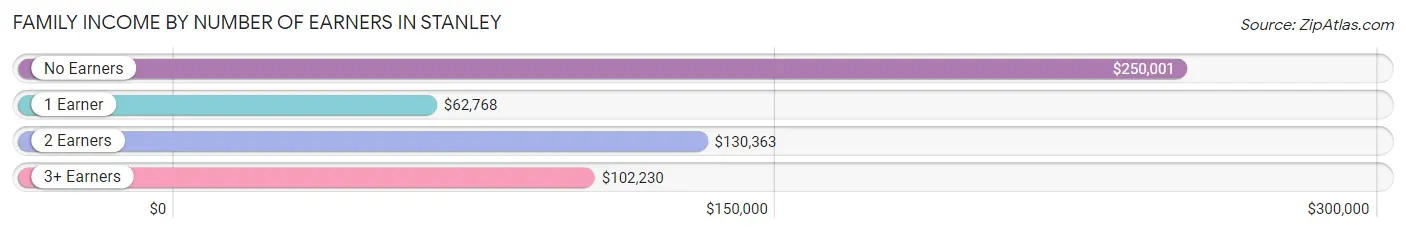
Family Income by Number of Earners in Stanley
The median family income in Stanley is $125,245, with families comprising no earners (47) having the highest median family income of $250,001, while families with 1 earner (125) have the lowest median family income of $62,768, accounting for 8.3% and 22.0% of families, respectively.
| Number of Earners | # Families | Median Income |
| No Earners | 47 (8.3%) | $250,001 |
| 1 Earner | 125 (22.0%) | $62,768 |
| 2 Earners | 331 (58.2%) | $130,363 |
| 3+ Earners | 66 (11.6%) | $102,230 |
| Total | 569 (100.0%) | $125,245 |
Household Income in Stanley
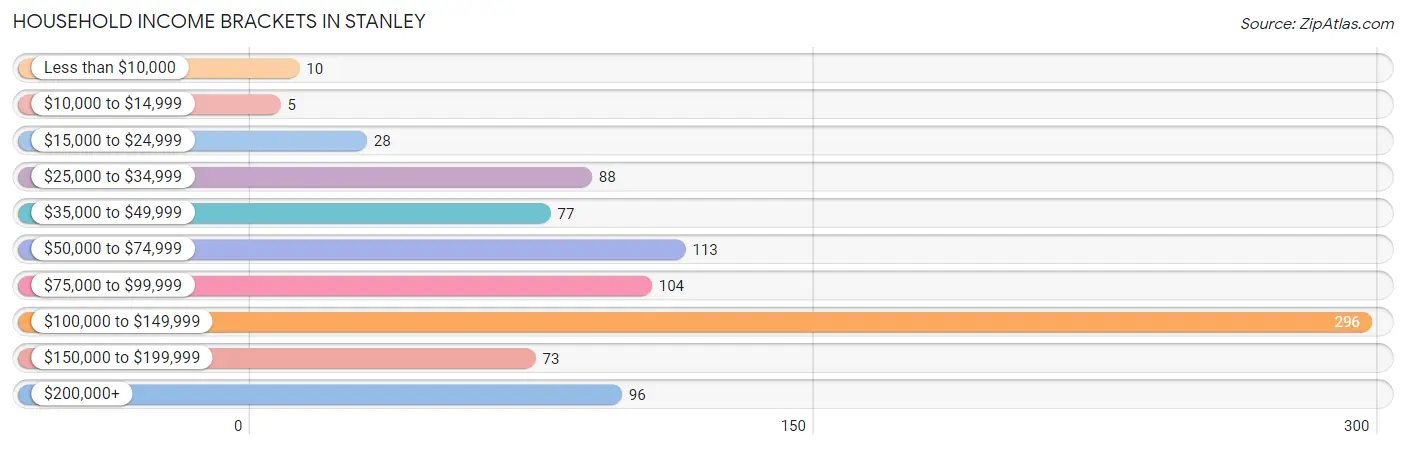
Household Income Brackets in Stanley
With 296 households falling in the category, the $100,000 to $149,999 income range is the most frequent in Stanley, accounting for 33.3% of all households. In contrast, only 5 households (0.6%) fall into the $10,000 to $14,999 income bracket, making it the least populous group.
| Income Bracket | # Households | % Households |
| Less than $10,000 | 10 | 1.1% |
| $10,000 to $14,999 | 5 | 0.6% |
| $15,000 to $24,999 | 28 | 3.1% |
| $25,000 to $34,999 | 88 | 9.9% |
| $35,000 to $49,999 | 77 | 8.7% |
| $50,000 to $74,999 | 113 | 12.7% |
| $75,000 to $99,999 | 104 | 11.7% |
| $100,000 to $149,999 | 296 | 33.3% |
| $150,000 to $199,999 | 73 | 8.2% |
| $200,000+ | 96 | 10.8% |
Household Income by Householder Age in Stanley
The median household income in Stanley is $101,351, with the highest median household income of $126,302 found in the 45 to 64 years age bracket for the primary householder. A total of 265 households (29.8%) fall into this category. Meanwhile, the 65+ years age bracket for the primary householder has the lowest median household income of $54,429, with 214 households (24.0%) in this group.
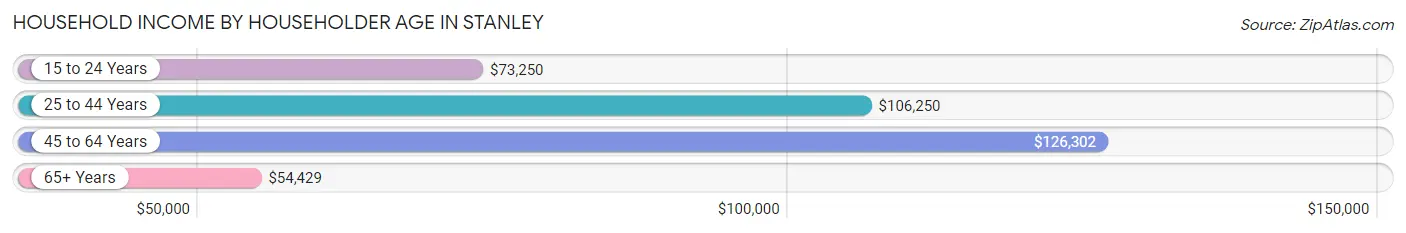
| Income Bracket | # Households | Median Income |
| 15 to 24 Years | 53 (6.0%) | $73,250 |
| 25 to 44 Years | 358 (40.2%) | $106,250 |
| 45 to 64 Years | 265 (29.8%) | $126,302 |
| 65+ Years | 214 (24.0%) | $54,429 |
| Total | 890 (100.0%) | $101,351 |
Poverty in Stanley
Income Below Poverty by Sex and Age in Stanley
With 5.4% poverty level for males and 5.4% for females among the residents of Stanley, 12 to 14 year old males and 25 to 34 year old females are the most vulnerable to poverty, with 20 males (66.7%) and 18 females (14.0%) in their respective age groups living below the poverty level.
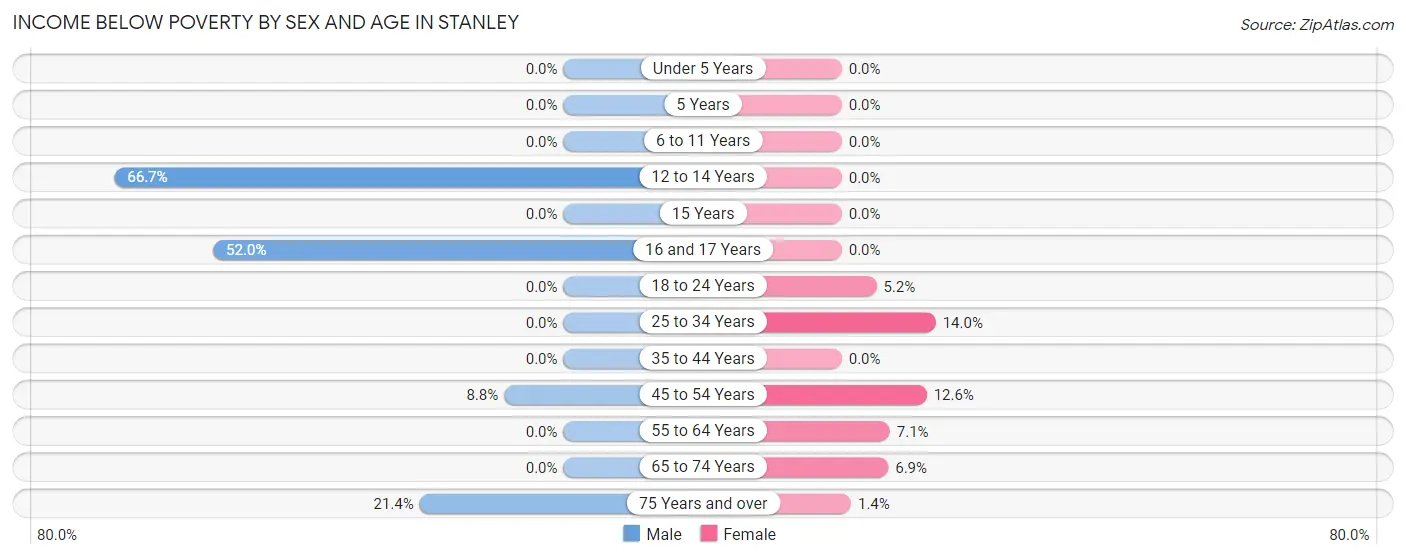
| Age Bracket | Male | Female |
| Under 5 Years | 0 (0.0%) | 0 (0.0%) |
| 5 Years | 0 (0.0%) | 0 (0.0%) |
| 6 to 11 Years | 0 (0.0%) | 0 (0.0%) |
| 12 to 14 Years | 20 (66.7%) | 0 (0.0%) |
| 15 Years | 0 (0.0%) | 0 (0.0%) |
| 16 and 17 Years | 13 (52.0%) | 0 (0.0%) |
| 18 to 24 Years | 0 (0.0%) | 5 (5.1%) |
| 25 to 34 Years | 0 (0.0%) | 18 (14.0%) |
| 35 to 44 Years | 0 (0.0%) | 0 (0.0%) |
| 45 to 54 Years | 11 (8.8%) | 15 (12.6%) |
| 55 to 64 Years | 0 (0.0%) | 10 (7.1%) |
| 65 to 74 Years | 0 (0.0%) | 4 (6.9%) |
| 75 Years and over | 19 (21.3%) | 1 (1.4%) |
| Total | 63 (5.4%) | 53 (5.4%) |
Income Above Poverty by Sex and Age in Stanley
According to the poverty statistics in Stanley, males aged under 5 years and females aged under 5 years are the age groups that are most secure financially, with 100.0% of males and 100.0% of females in these age groups living above the poverty line.
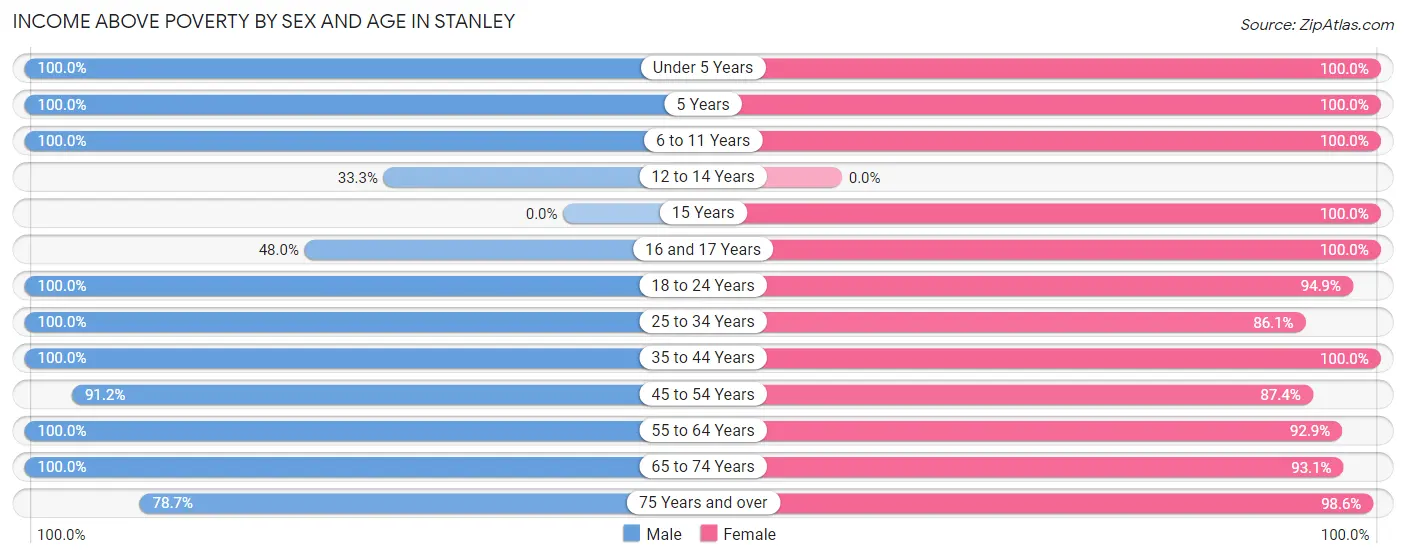
| Age Bracket | Male | Female |
| Under 5 Years | 112 (100.0%) | 105 (100.0%) |
| 5 Years | 38 (100.0%) | 36 (100.0%) |
| 6 to 11 Years | 51 (100.0%) | 24 (100.0%) |
| 12 to 14 Years | 10 (33.3%) | 0 (0.0%) |
| 15 Years | 0 (0.0%) | 29 (100.0%) |
| 16 and 17 Years | 12 (48.0%) | 53 (100.0%) |
| 18 to 24 Years | 81 (100.0%) | 92 (94.9%) |
| 25 to 34 Years | 221 (100.0%) | 111 (86.1%) |
| 35 to 44 Years | 161 (100.0%) | 111 (100.0%) |
| 45 to 54 Years | 114 (91.2%) | 104 (87.4%) |
| 55 to 64 Years | 144 (100.0%) | 130 (92.9%) |
| 65 to 74 Years | 89 (100.0%) | 54 (93.1%) |
| 75 Years and over | 70 (78.6%) | 72 (98.6%) |
| Total | 1,103 (94.6%) | 921 (94.6%) |
Income Below Poverty Among Married-Couple Families in Stanley
The poverty statistics for married-couple families in Stanley show that 2.8% or 15 of the total 540 families live below the poverty line. Families with 3 or 4 children have the highest poverty rate of 21.4%, comprising of 15 families. On the other hand, families with no children have the lowest poverty rate of 0.0%, which includes 0 families.
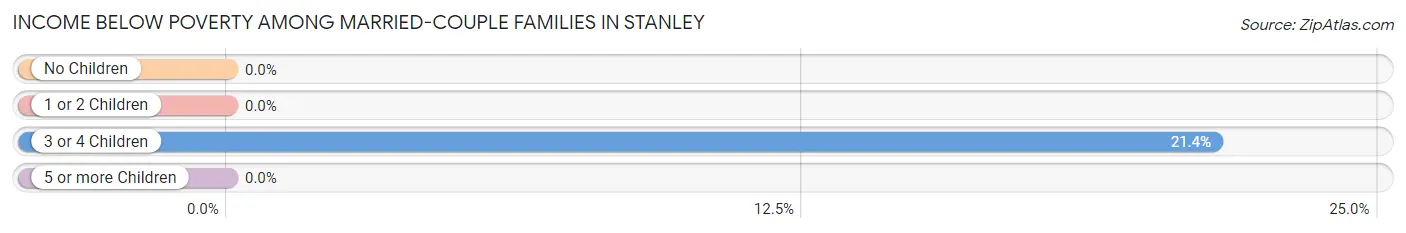
| Children | Above Poverty | Below Poverty |
| No Children | 289 (100.0%) | 0 (0.0%) |
| 1 or 2 Children | 181 (100.0%) | 0 (0.0%) |
| 3 or 4 Children | 55 (78.6%) | 15 (21.4%) |
| 5 or more Children | 0 (0.0%) | 0 (0.0%) |
| Total | 525 (97.2%) | 15 (2.8%) |
Income Below Poverty Among Single-Parent Households in Stanley
| Children | Single Father | Single Mother |
| No Children | 0 (0.0%) | 0 (0.0%) |
| 1 or 2 Children | 0 (0.0%) | 0 (0.0%) |
| 3 or 4 Children | 0 (0.0%) | 0 (0.0%) |
| 5 or more Children | 0 (0.0%) | 0 (0.0%) |
| Total | 0 (0.0%) | 0 (0.0%) |
Income Below Poverty Among Married-Couple vs Single-Parent Households in Stanley
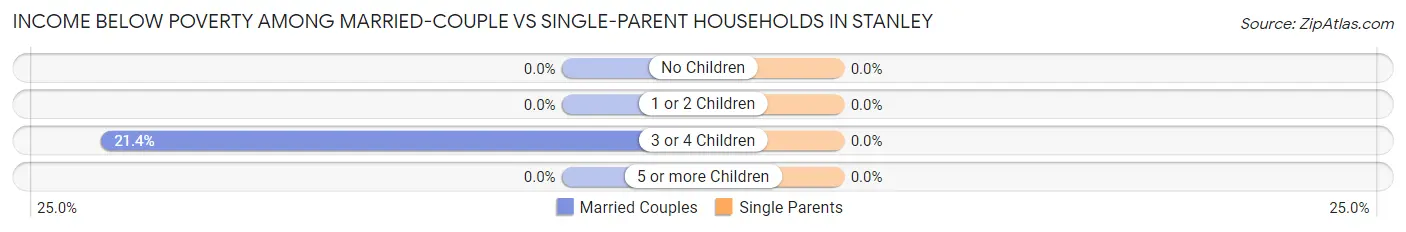
| Children | Married-Couple Families | Single-Parent Households |
| No Children | 0 (0.0%) | 0 (0.0%) |
| 1 or 2 Children | 0 (0.0%) | 0 (0.0%) |
| 3 or 4 Children | 15 (21.4%) | 0 (0.0%) |
| 5 or more Children | 0 (0.0%) | 0 (0.0%) |
| Total | 15 (2.8%) | 0 (0.0%) |
Race in Stanley
The most populous races in Stanley are White / Caucasian (1,821 | 83.2%), Hispanic or Latino (365 | 16.7%), and Two or more Races (227 | 10.4%).
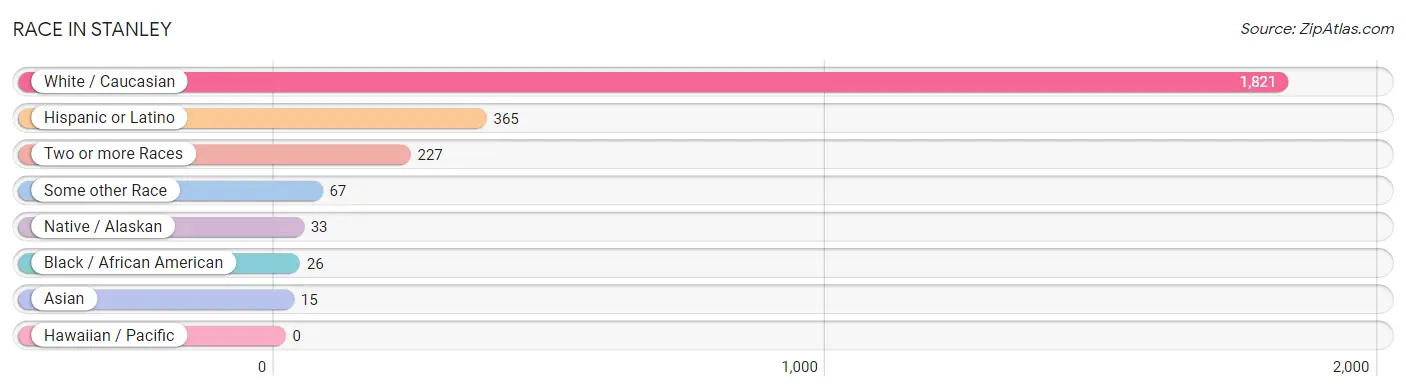
| Race | # Population | % Population |
| Asian | 15 | 0.7% |
| Black / African American | 26 | 1.2% |
| Hawaiian / Pacific | 0 | 0.0% |
| Hispanic or Latino | 365 | 16.7% |
| Native / Alaskan | 33 | 1.5% |
| White / Caucasian | 1,821 | 83.2% |
| Two or more Races | 227 | 10.4% |
| Some other Race | 67 | 3.1% |
| Total | 2,189 | 100.0% |
Ancestry in Stanley
The most populous ancestries reported in Stanley are German (505 | 23.1%), Norwegian (445 | 20.3%), Mexican (224 | 10.2%), Irish (205 | 9.4%), and Italian (117 | 5.3%), together accounting for 68.3% of all Stanley residents.
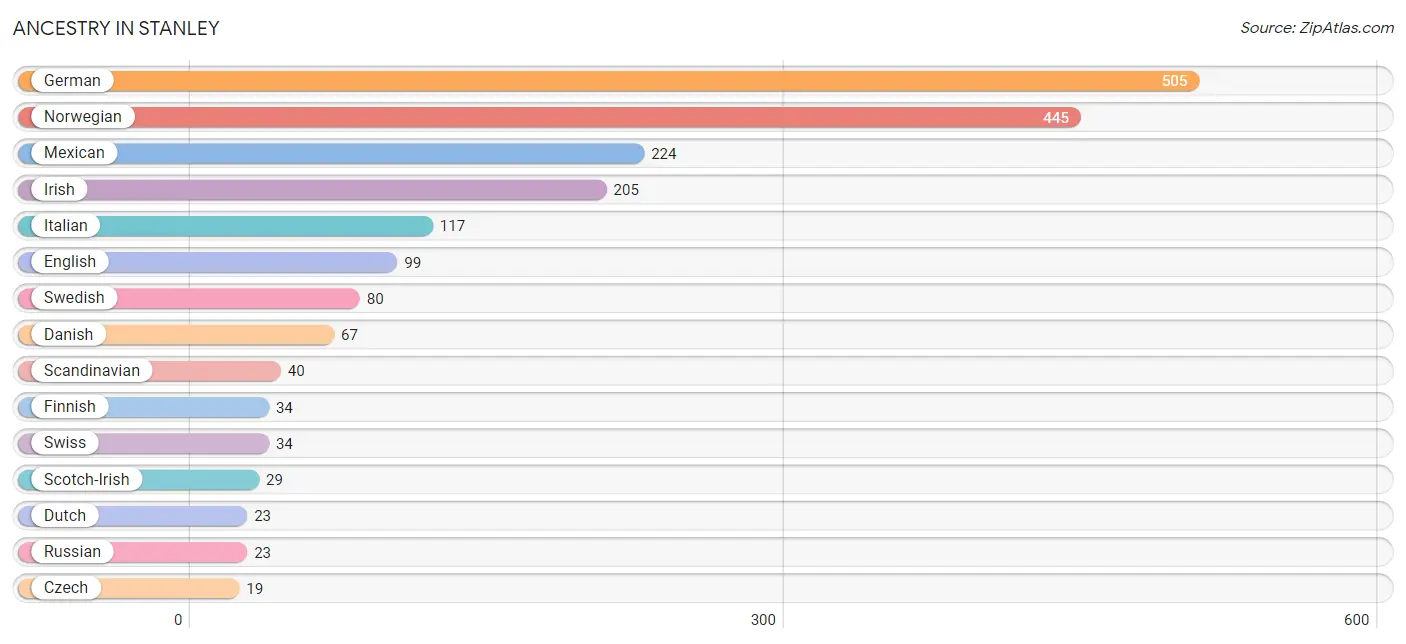
| Ancestry | # Population | % Population |
| American | 10 | 0.5% |
| Bahamian | 11 | 0.5% |
| Canadian | 8 | 0.4% |
| Central American | 15 | 0.7% |
| Chippewa | 2 | 0.1% |
| Czech | 19 | 0.9% |
| Danish | 67 | 3.1% |
| Dutch | 23 | 1.1% |
| English | 99 | 4.5% |
| European | 9 | 0.4% |
| Finnish | 34 | 1.5% |
| French | 15 | 0.7% |
| French Canadian | 5 | 0.2% |
| German | 505 | 23.1% |
| Irish | 205 | 9.4% |
| Italian | 117 | 5.3% |
| Mexican | 224 | 10.2% |
| Norwegian | 445 | 20.3% |
| Polish | 12 | 0.5% |
| Puget Sound Salish | 11 | 0.5% |
| Russian | 23 | 1.1% |
| Salvadoran | 15 | 0.7% |
| Scandinavian | 40 | 1.8% |
| Scotch-Irish | 29 | 1.3% |
| Scottish | 17 | 0.8% |
| Sioux | 1 | 0.1% |
| Spaniard | 1 | 0.1% |
| Swedish | 80 | 3.6% |
| Swiss | 34 | 1.5% |
| Welsh | 6 | 0.3% | View All 30 Rows |
Immigrants in Stanley
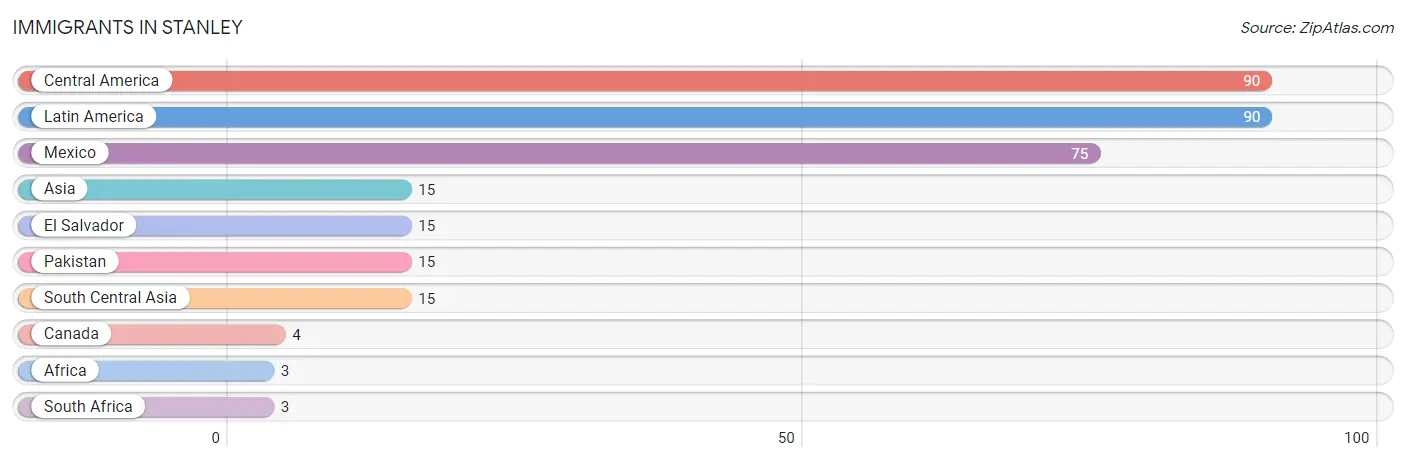
The most numerous immigrant groups reported in Stanley came from Central America (90 | 4.1%), Latin America (90 | 4.1%), Mexico (75 | 3.4%), Asia (15 | 0.7%), and El Salvador (15 | 0.7%), together accounting for 13.0% of all Stanley residents.
| Immigration Origin | # Population | % Population |
| Africa | 3 | 0.1% |
| Asia | 15 | 0.7% |
| Canada | 4 | 0.2% |
| Central America | 90 | 4.1% |
| El Salvador | 15 | 0.7% |
| Latin America | 90 | 4.1% |
| Mexico | 75 | 3.4% |
| Pakistan | 15 | 0.7% |
| South Africa | 3 | 0.1% |
| South Central Asia | 15 | 0.7% | View All 10 Rows |
Sex and Age in Stanley
Sex and Age in Stanley
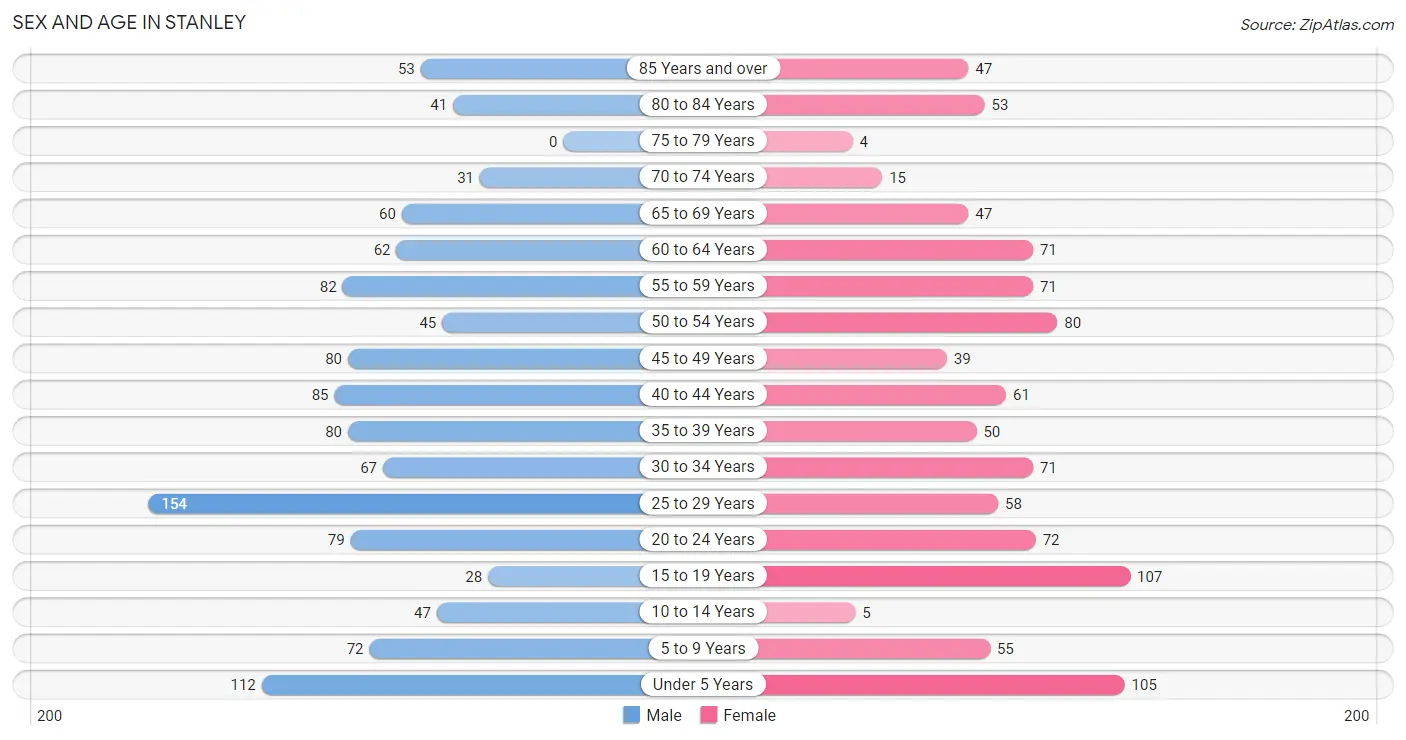
The most populous age groups in Stanley are 25 to 29 Years (154 | 13.1%) for men and 15 to 19 Years (107 | 10.6%) for women.
| Age Bracket | Male | Female |
| Under 5 Years | 112 (9.5%) | 105 (10.4%) |
| 5 to 9 Years | 72 (6.1%) | 55 (5.4%) |
| 10 to 14 Years | 47 (4.0%) | 5 (0.5%) |
| 15 to 19 Years | 28 (2.4%) | 107 (10.6%) |
| 20 to 24 Years | 79 (6.7%) | 72 (7.1%) |
| 25 to 29 Years | 154 (13.1%) | 58 (5.7%) |
| 30 to 34 Years | 67 (5.7%) | 71 (7.0%) |
| 35 to 39 Years | 80 (6.8%) | 50 (5.0%) |
| 40 to 44 Years | 85 (7.2%) | 61 (6.0%) |
| 45 to 49 Years | 80 (6.8%) | 39 (3.9%) |
| 50 to 54 Years | 45 (3.8%) | 80 (7.9%) |
| 55 to 59 Years | 82 (7.0%) | 71 (7.0%) |
| 60 to 64 Years | 62 (5.3%) | 71 (7.0%) |
| 65 to 69 Years | 60 (5.1%) | 47 (4.6%) |
| 70 to 74 Years | 31 (2.6%) | 15 (1.5%) |
| 75 to 79 Years | 0 (0.0%) | 4 (0.4%) |
| 80 to 84 Years | 41 (3.5%) | 53 (5.2%) |
| 85 Years and over | 53 (4.5%) | 47 (4.6%) |
| Total | 1,178 (100.0%) | 1,011 (100.0%) |
Families and Households in Stanley
Median Family Size in Stanley
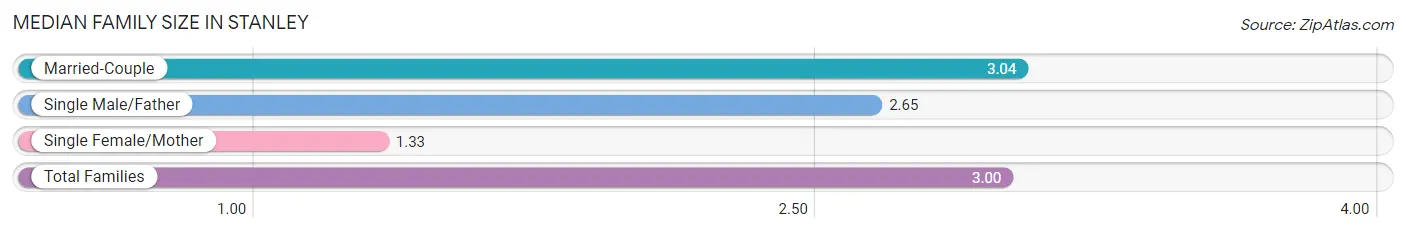
The median family size in Stanley is 3.00 persons per family, with married-couple families (540 | 94.9%) accounting for the largest median family size of 3.04 persons per family. On the other hand, single female/mother families (9 | 1.6%) represent the smallest median family size with 1.33 persons per family.
| Family Type | # Families | Family Size |
| Married-Couple | 540 (94.9%) | 3.04 |
| Single Male/Father | 20 (3.5%) | 2.65 |
| Single Female/Mother | 9 (1.6%) | 1.33 |
| Total Families | 569 (100.0%) | 3.00 |
Median Household Size in Stanley
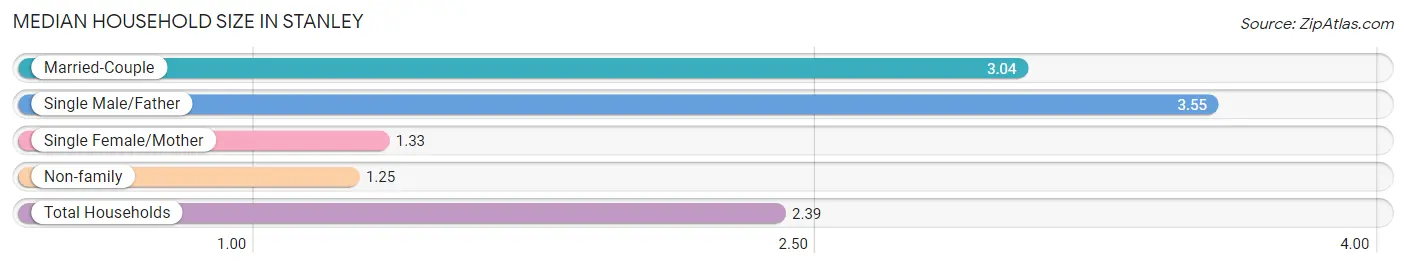
The median household size in Stanley is 2.39 persons per household, with single male/father households (20 | 2.2%) accounting for the largest median household size of 3.55 persons per household. non-family households (321 | 36.1%) represent the smallest median household size with 1.25 persons per household.
| Household Type | # Households | Household Size |
| Married-Couple | 540 (60.7%) | 3.04 |
| Single Male/Father | 20 (2.2%) | 3.55 |
| Single Female/Mother | 9 (1.0%) | 1.33 |
| Non-family | 321 (36.1%) | 1.25 |
| Total Households | 890 (100.0%) | 2.39 |
Household Size by Marriage Status in Stanley
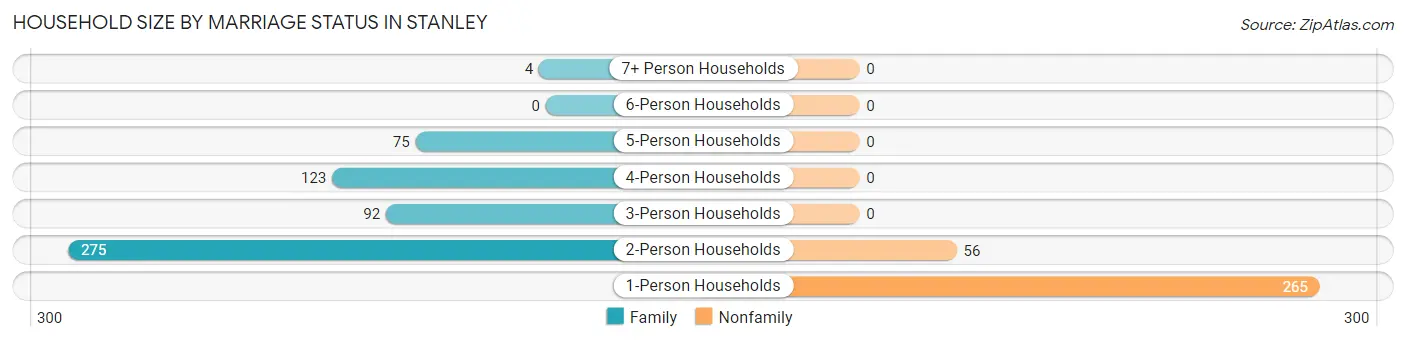
Out of a total of 890 households in Stanley, 569 (63.9%) are family households, while 321 (36.1%) are nonfamily households. The most numerous type of family households are 2-person households, comprising 275, and the most common type of nonfamily households are 1-person households, comprising 265.
| Household Size | Family Households | Nonfamily Households |
| 1-Person Households | - | 265 (29.8%) |
| 2-Person Households | 275 (30.9%) | 56 (6.3%) |
| 3-Person Households | 92 (10.3%) | 0 (0.0%) |
| 4-Person Households | 123 (13.8%) | 0 (0.0%) |
| 5-Person Households | 75 (8.4%) | 0 (0.0%) |
| 6-Person Households | 0 (0.0%) | 0 (0.0%) |
| 7+ Person Households | 4 (0.4%) | 0 (0.0%) |
| Total | 569 (63.9%) | 321 (36.1%) |
Female Fertility in Stanley
Fertility by Age in Stanley
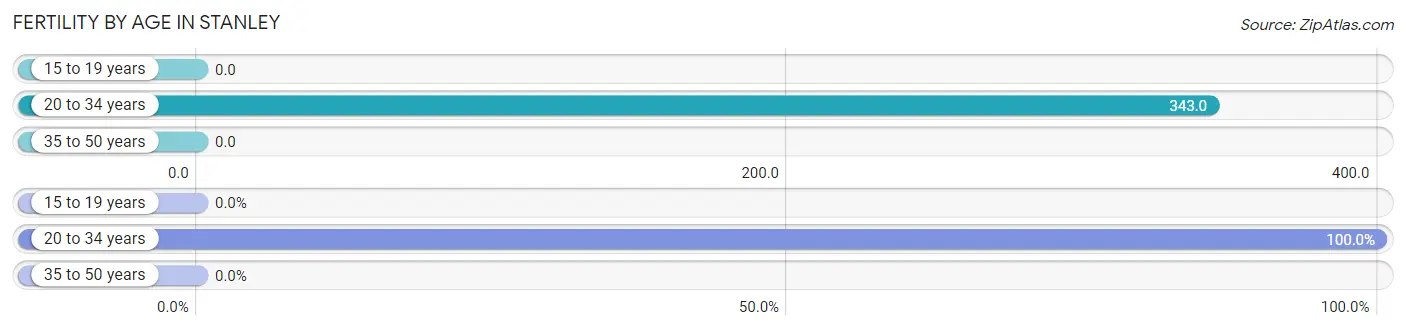
Average fertility rate in Stanley is 149.0 births per 1,000 women. Women in the age bracket of 20 to 34 years have the highest fertility rate with 343.0 births per 1,000 women. Women in the age bracket of 20 to 34 years acount for 100.0% of all women with births.
| Age Bracket | Women with Births | Births / 1,000 Women |
| 15 to 19 years | 0 (0.0%) | 0.0 |
| 20 to 34 years | 69 (100.0%) | 343.0 |
| 35 to 50 years | 0 (0.0%) | 0.0 |
| Total | 69 (100.0%) | 149.0 |
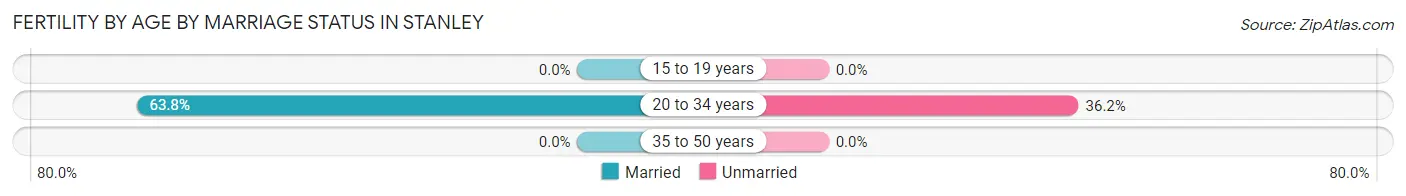
Fertility by Age by Marriage Status in Stanley
63.8% of women with births (69) in Stanley are married. The highest percentage of unmarried women with births falls into 20 to 34 years age bracket with 36.2% of them unmarried at the time of birth, while the lowest percentage of unmarried women with births belong to 20 to 34 years age bracket with 36.2% of them unmarried.
| Age Bracket | Married | Unmarried |
| 15 to 19 years | 0 (0.0%) | 0 (0.0%) |
| 20 to 34 years | 44 (63.8%) | 25 (36.2%) |
| 35 to 50 years | 0 (0.0%) | 0 (0.0%) |
| Total | 44 (63.8%) | 25 (36.2%) |
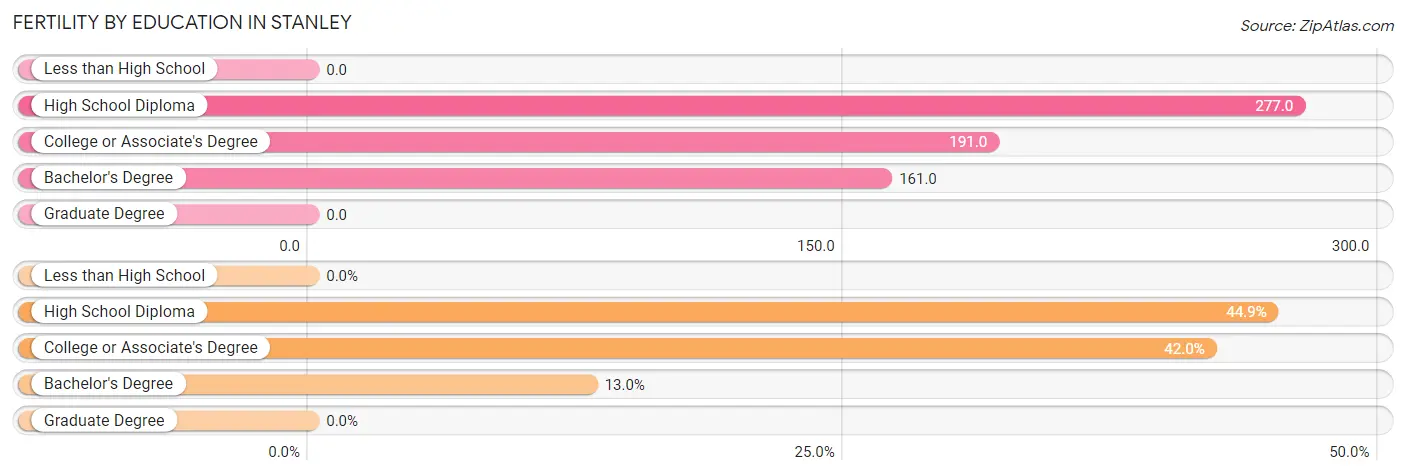
Fertility by Education in Stanley
| Educational Attainment | Women with Births | Births / 1,000 Women |
| Less than High School | 0 (0.0%) | 0.0 |
| High School Diploma | 31 (44.9%) | 277.0 |
| College or Associate's Degree | 29 (42.0%) | 191.0 |
| Bachelor's Degree | 9 (13.0%) | 161.0 |
| Graduate Degree | 0 (0.0%) | 0.0 |
| Total | 69 (100.0%) | 149.0 |
Fertility by Education by Marriage Status in Stanley
36.2% of women with births in Stanley are unmarried. Women with the educational attainment of bachelor's degree are most likely to be married with 100.0% of them married at childbirth, while women with the educational attainment of college or associate's degree are least likely to be married with 69.0% of them unmarried at childbirth.
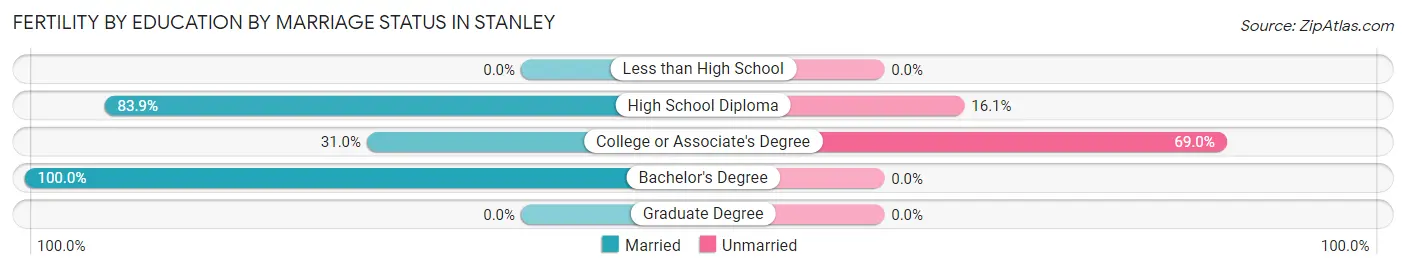
| Educational Attainment | Married | Unmarried |
| Less than High School | 0 (0.0%) | 0 (0.0%) |
| High School Diploma | 26 (83.9%) | 5 (16.1%) |
| College or Associate's Degree | 9 (31.0%) | 20 (69.0%) |
| Bachelor's Degree | 9 (100.0%) | 0 (0.0%) |
| Graduate Degree | 0 (0.0%) | 0 (0.0%) |
| Total | 44 (63.8%) | 25 (36.2%) |
Employment Characteristics in Stanley
Employment by Class of Employer in Stanley
Among the 1,202 employed individuals in Stanley, private company employees (752 | 62.6%), local government employees (136 | 11.3%), and state government employees (108 | 9.0%) make up the most common classes of employment.
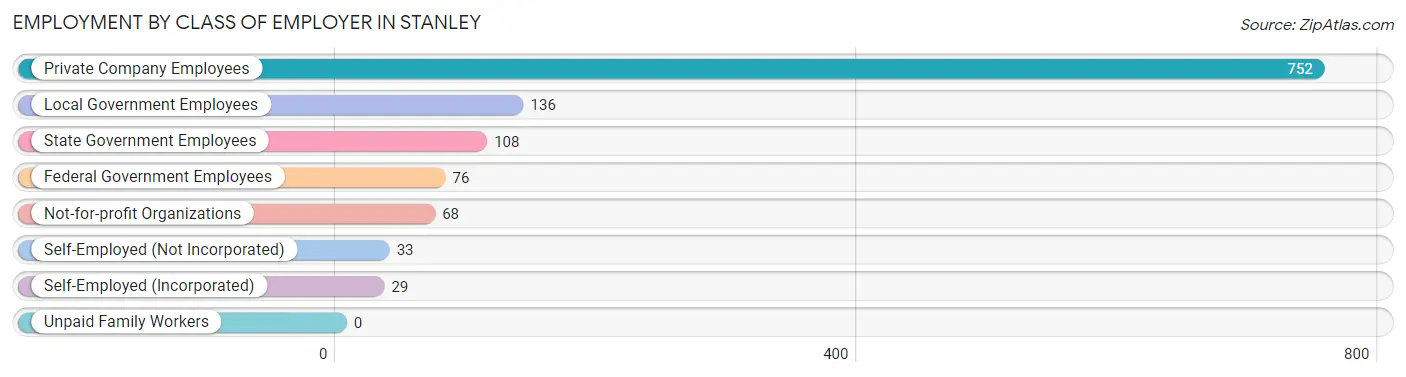
| Employer Class | # Employees | % Employees |
| Private Company Employees | 752 | 62.6% |
| Self-Employed (Incorporated) | 29 | 2.4% |
| Self-Employed (Not Incorporated) | 33 | 2.8% |
| Not-for-profit Organizations | 68 | 5.7% |
| Local Government Employees | 136 | 11.3% |
| State Government Employees | 108 | 9.0% |
| Federal Government Employees | 76 | 6.3% |
| Unpaid Family Workers | 0 | 0.0% |
| Total | 1,202 | 100.0% |
Employment Status by Age in Stanley
According to the labor force statistics for Stanley, out of the total population over 16 years of age (1,764), 70.6% or 1,245 individuals are in the labor force, with 3.3% or 41 of them unemployed. The age group with the highest labor force participation rate is 20 to 24 years, with 100.0% or 151 individuals in the labor force. Within the labor force, the 16 to 19 years age range has the highest percentage of unemployed individuals, with 45.0% or 36 of them being unemployed.
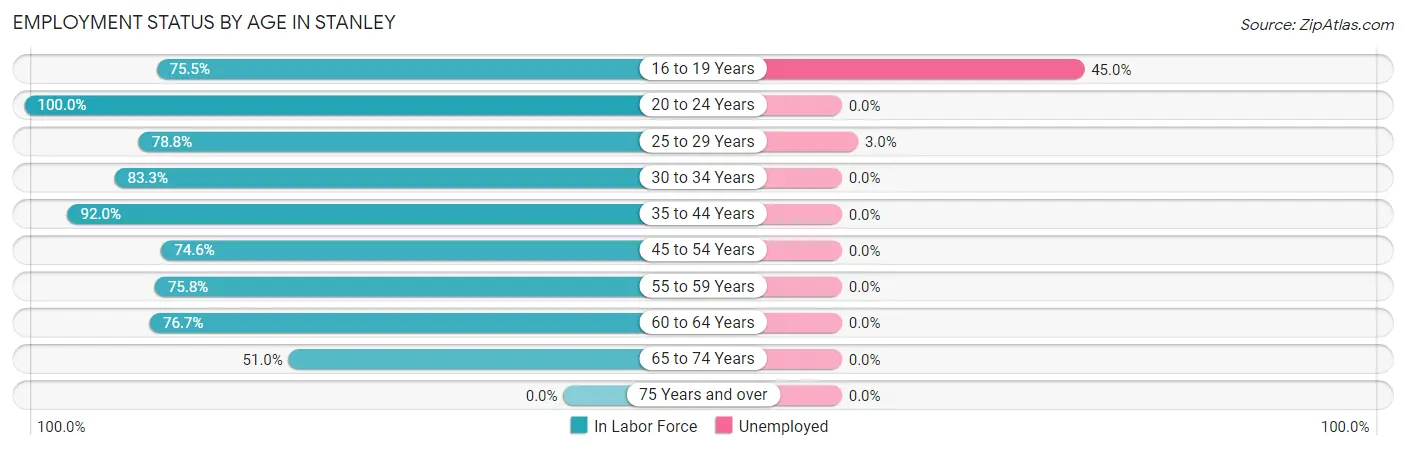
| Age Bracket | In Labor Force | Unemployed |
| 16 to 19 Years | 80 (75.5%) | 36 (45.0%) |
| 20 to 24 Years | 151 (100.0%) | 0 (0.0%) |
| 25 to 29 Years | 167 (78.8%) | 5 (3.0%) |
| 30 to 34 Years | 115 (83.3%) | 0 (0.0%) |
| 35 to 44 Years | 254 (92.0%) | 0 (0.0%) |
| 45 to 54 Years | 182 (74.6%) | 0 (0.0%) |
| 55 to 59 Years | 116 (75.8%) | 0 (0.0%) |
| 60 to 64 Years | 102 (76.7%) | 0 (0.0%) |
| 65 to 74 Years | 78 (51.0%) | 0 (0.0%) |
| 75 Years and over | 0 (0.0%) | 0 (0.0%) |
| Total | 1,245 (70.6%) | 41 (3.3%) |
Employment Status by Educational Attainment in Stanley
According to labor force statistics for Stanley, 81.0% of individuals (936) out of the total population between 25 and 64 years of age (1,156) are in the labor force, with 0.5% or 5 of them being unemployed. The group with the highest labor force participation rate are those with the educational attainment of college / associate degree, with 89.0% or 307 individuals in the labor force. Within the labor force, individuals with bachelor's degree or higher education have the highest percentage of unemployment, with 2.6% or 5 of them being unemployed.
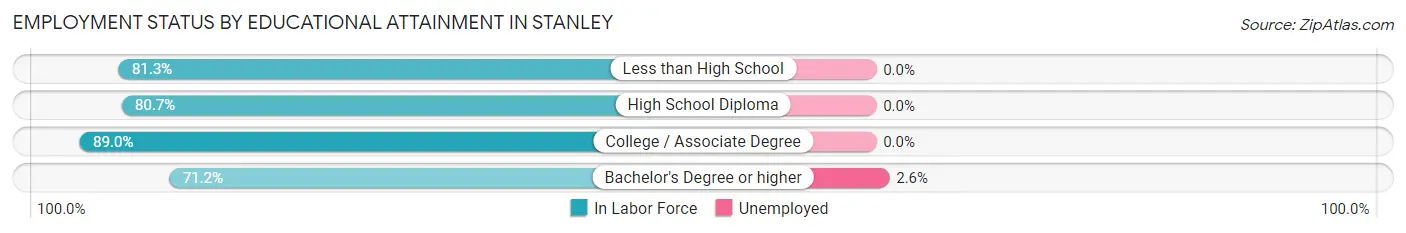
| Educational Attainment | In Labor Force | Unemployed |
| Less than High School | 100 (81.3%) | 0 (0.0%) |
| High School Diploma | 334 (80.7%) | 0 (0.0%) |
| College / Associate Degree | 307 (89.0%) | 0 (0.0%) |
| Bachelor's Degree or higher | 195 (71.2%) | 7 (2.6%) |
| Total | 936 (81.0%) | 6 (0.5%) |
Employment Occupations by Sex in Stanley
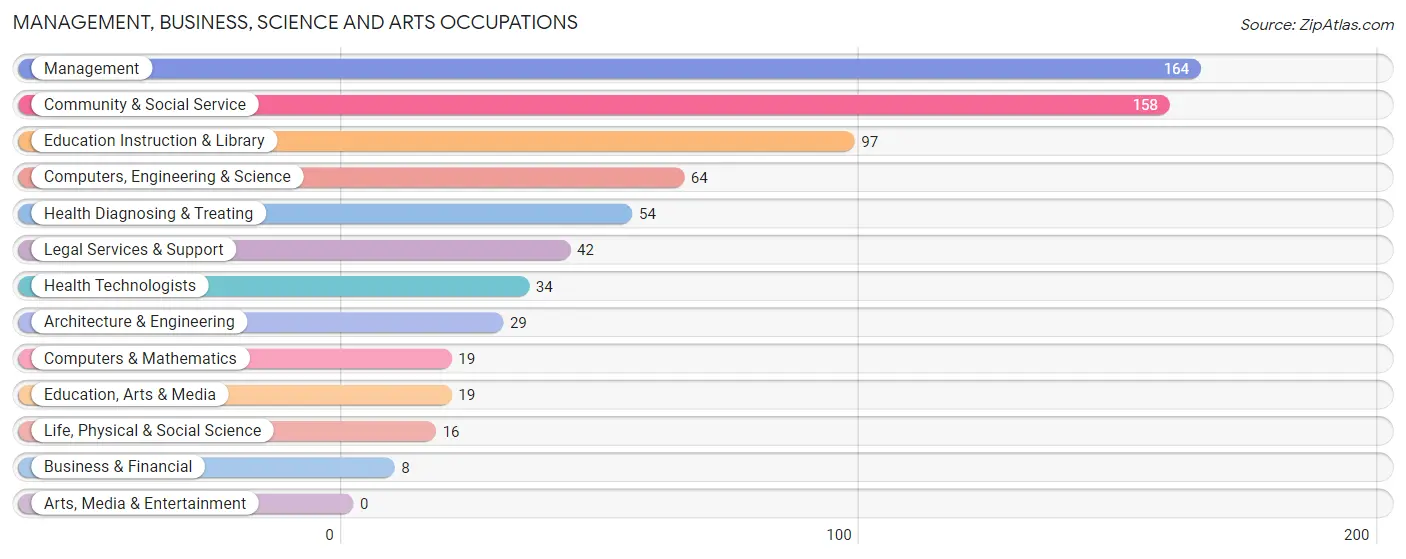
Management, Business, Science and Arts Occupations
The most common Management, Business, Science and Arts occupations in Stanley are Management (164 | 13.6%), Community & Social Service (158 | 13.1%), Education Instruction & Library (97 | 8.1%), Computers, Engineering & Science (64 | 5.3%), and Health Diagnosing & Treating (54 | 4.5%).
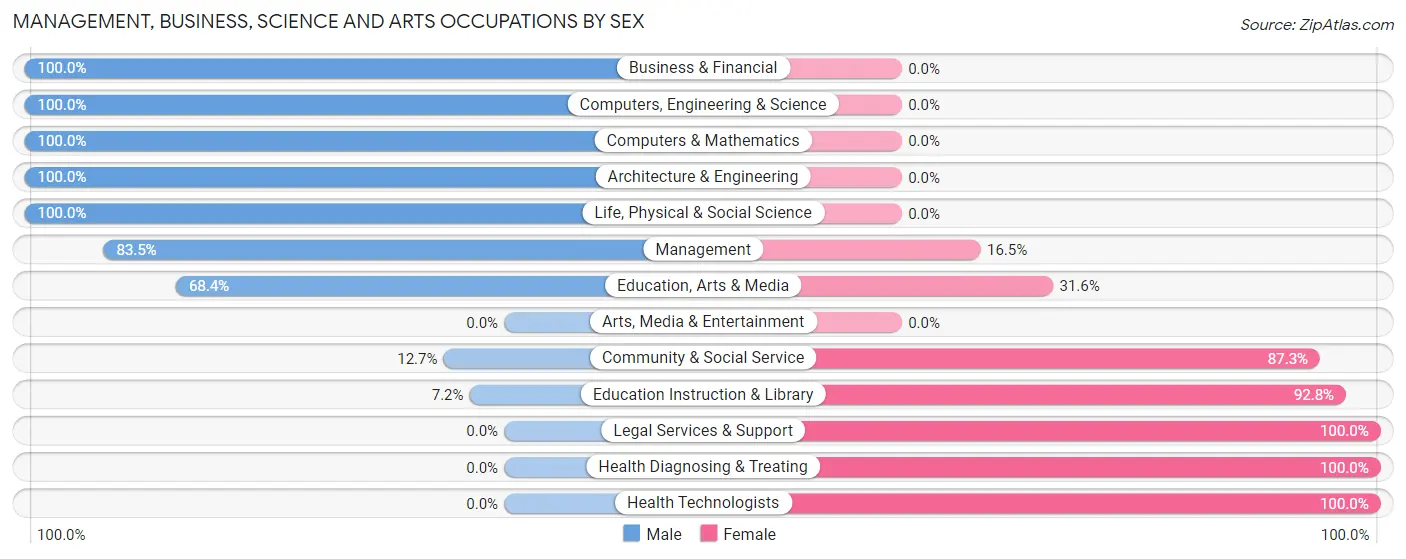
Management, Business, Science and Arts Occupations by Sex
Within the Management, Business, Science and Arts occupations in Stanley, the most male-oriented occupations are Business & Financial (100.0%), Computers, Engineering & Science (100.0%), and Computers & Mathematics (100.0%), while the most female-oriented occupations are Legal Services & Support (100.0%), Health Diagnosing & Treating (100.0%), and Health Technologists (100.0%).
| Occupation | Male | Female |
| Management | 137 (83.5%) | 27 (16.5%) |
| Business & Financial | 8 (100.0%) | 0 (0.0%) |
| Computers, Engineering & Science | 64 (100.0%) | 0 (0.0%) |
| Computers & Mathematics | 19 (100.0%) | 0 (0.0%) |
| Architecture & Engineering | 29 (100.0%) | 0 (0.0%) |
| Life, Physical & Social Science | 16 (100.0%) | 0 (0.0%) |
| Community & Social Service | 20 (12.7%) | 138 (87.3%) |
| Education, Arts & Media | 13 (68.4%) | 6 (31.6%) |
| Legal Services & Support | 0 (0.0%) | 42 (100.0%) |
| Education Instruction & Library | 7 (7.2%) | 90 (92.8%) |
| Arts, Media & Entertainment | 0 (0.0%) | 0 (0.0%) |
| Health Diagnosing & Treating | 0 (0.0%) | 54 (100.0%) |
| Health Technologists | 0 (0.0%) | 34 (100.0%) |
| Total (Category) | 229 (51.1%) | 219 (48.9%) |
| Total (Overall) | 756 (62.8%) | 448 (37.2%) |
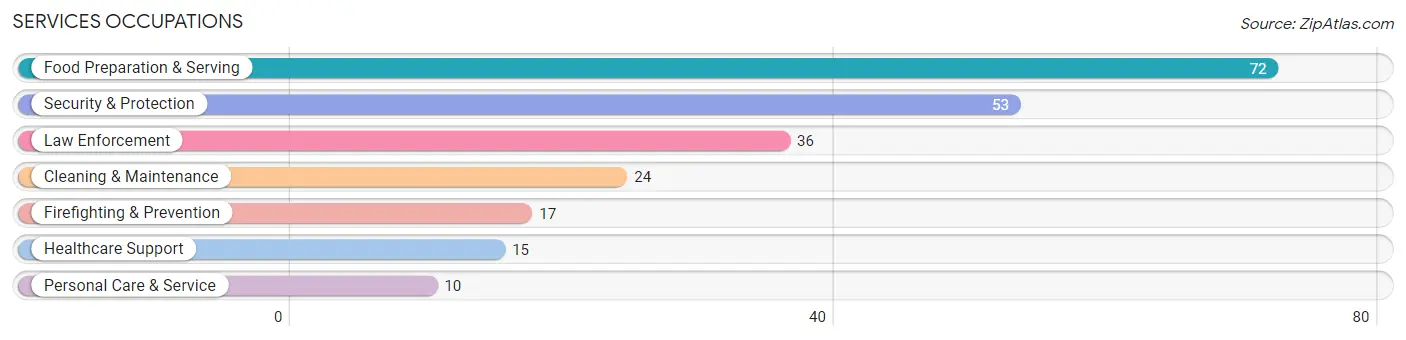
Services Occupations
The most common Services occupations in Stanley are Food Preparation & Serving (72 | 6.0%), Security & Protection (53 | 4.4%), Law Enforcement (36 | 3.0%), Cleaning & Maintenance (24 | 2.0%), and Firefighting & Prevention (17 | 1.4%).
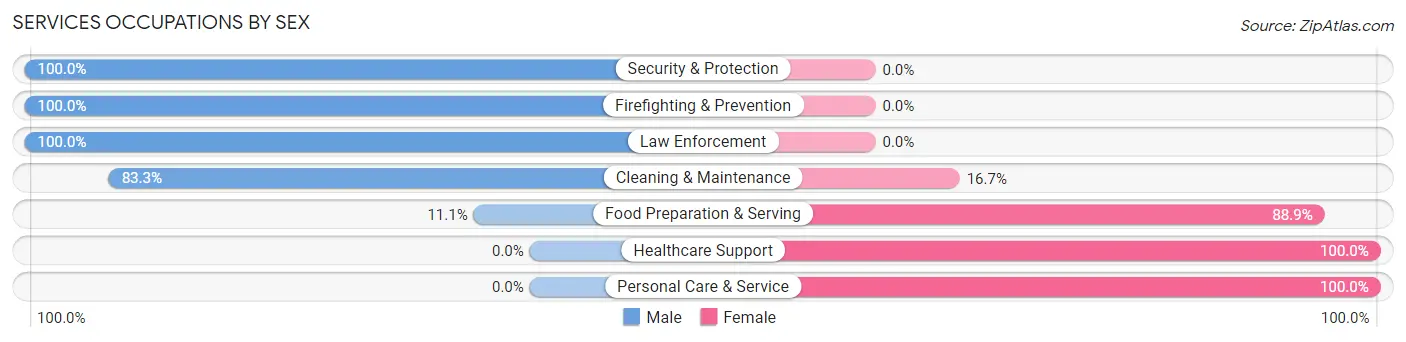
Services Occupations by Sex
Within the Services occupations in Stanley, the most male-oriented occupations are Security & Protection (100.0%), Firefighting & Prevention (100.0%), and Law Enforcement (100.0%), while the most female-oriented occupations are Healthcare Support (100.0%), Personal Care & Service (100.0%), and Food Preparation & Serving (88.9%).
| Occupation | Male | Female |
| Healthcare Support | 0 (0.0%) | 15 (100.0%) |
| Security & Protection | 53 (100.0%) | 0 (0.0%) |
| Firefighting & Prevention | 17 (100.0%) | 0 (0.0%) |
| Law Enforcement | 36 (100.0%) | 0 (0.0%) |
| Food Preparation & Serving | 8 (11.1%) | 64 (88.9%) |
| Cleaning & Maintenance | 20 (83.3%) | 4 (16.7%) |
| Personal Care & Service | 0 (0.0%) | 10 (100.0%) |
| Total (Category) | 81 (46.6%) | 93 (53.4%) |
| Total (Overall) | 756 (62.8%) | 448 (37.2%) |
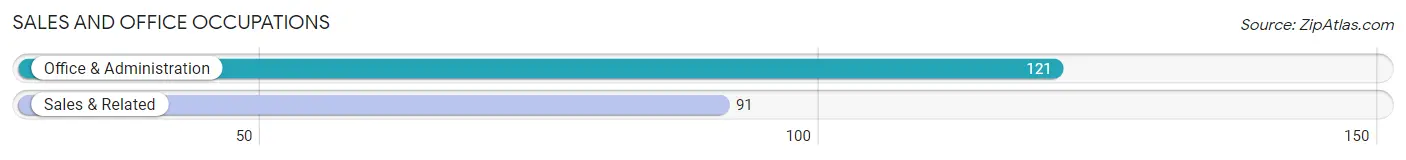
Sales and Office Occupations
The most common Sales and Office occupations in Stanley are Office & Administration (121 | 10.1%), and Sales & Related (91 | 7.6%).
Sales and Office Occupations by Sex
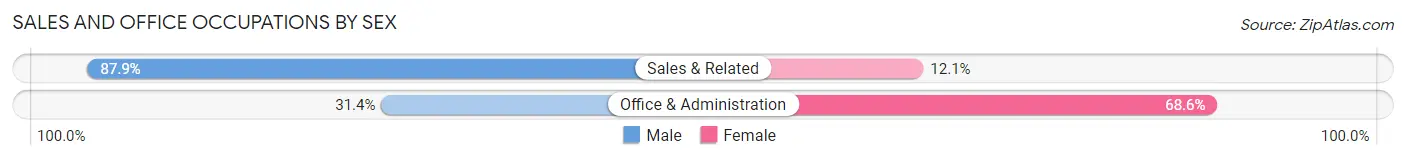
| Occupation | Male | Female |
| Sales & Related | 80 (87.9%) | 11 (12.1%) |
| Office & Administration | 38 (31.4%) | 83 (68.6%) |
| Total (Category) | 118 (55.7%) | 94 (44.3%) |
| Total (Overall) | 756 (62.8%) | 448 (37.2%) |
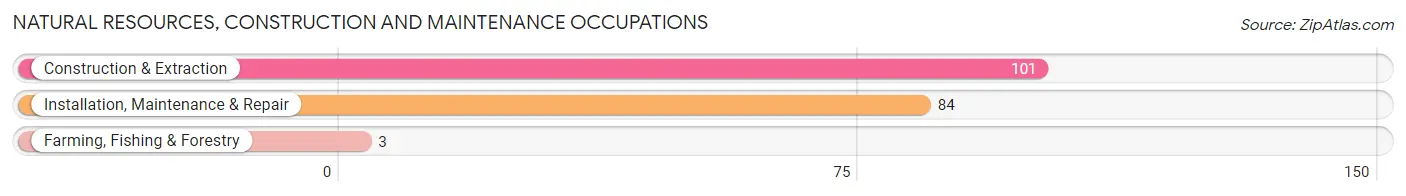
Natural Resources, Construction and Maintenance Occupations
The most common Natural Resources, Construction and Maintenance occupations in Stanley are Construction & Extraction (101 | 8.4%), Installation, Maintenance & Repair (84 | 7.0%), and Farming, Fishing & Forestry (3 | 0.3%).
Natural Resources, Construction and Maintenance Occupations by Sex
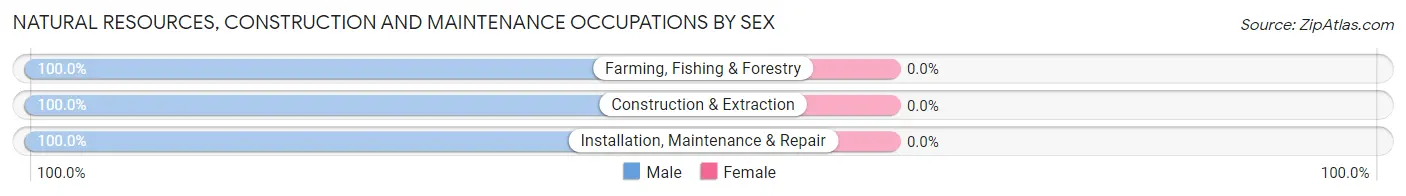
| Occupation | Male | Female |
| Farming, Fishing & Forestry | 3 (100.0%) | 0 (0.0%) |
| Construction & Extraction | 101 (100.0%) | 0 (0.0%) |
| Installation, Maintenance & Repair | 84 (100.0%) | 0 (0.0%) |
| Total (Category) | 188 (100.0%) | 0 (0.0%) |
| Total (Overall) | 756 (62.8%) | 448 (37.2%) |
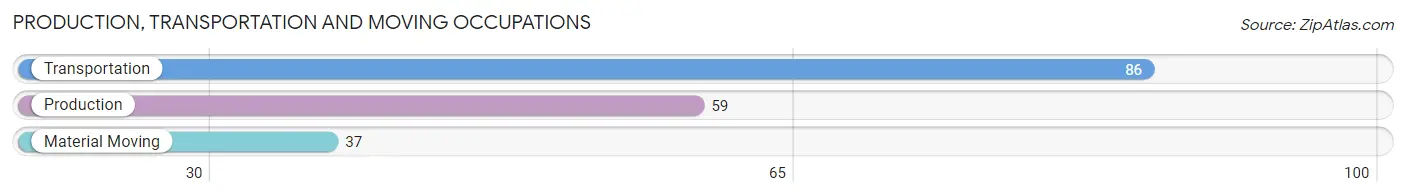
Production, Transportation and Moving Occupations
The most common Production, Transportation and Moving occupations in Stanley are Transportation (86 | 7.1%), Production (59 | 4.9%), and Material Moving (37 | 3.1%).
Production, Transportation and Moving Occupations by Sex
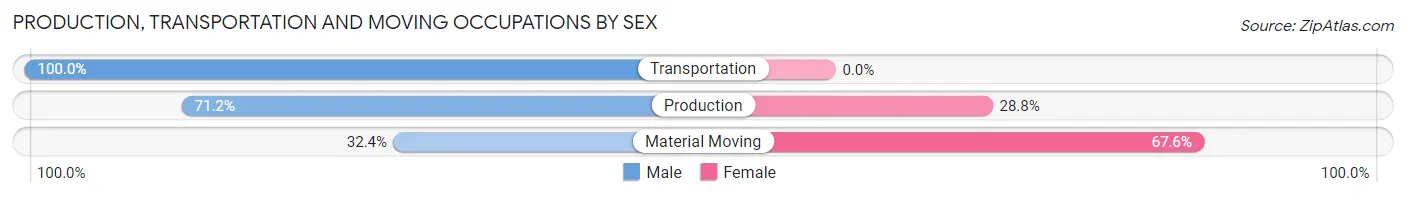
| Occupation | Male | Female |
| Production | 42 (71.2%) | 17 (28.8%) |
| Transportation | 86 (100.0%) | 0 (0.0%) |
| Material Moving | 12 (32.4%) | 25 (67.6%) |
| Total (Category) | 140 (76.9%) | 42 (23.1%) |
| Total (Overall) | 756 (62.8%) | 448 (37.2%) |
Employment Industries by Sex in Stanley
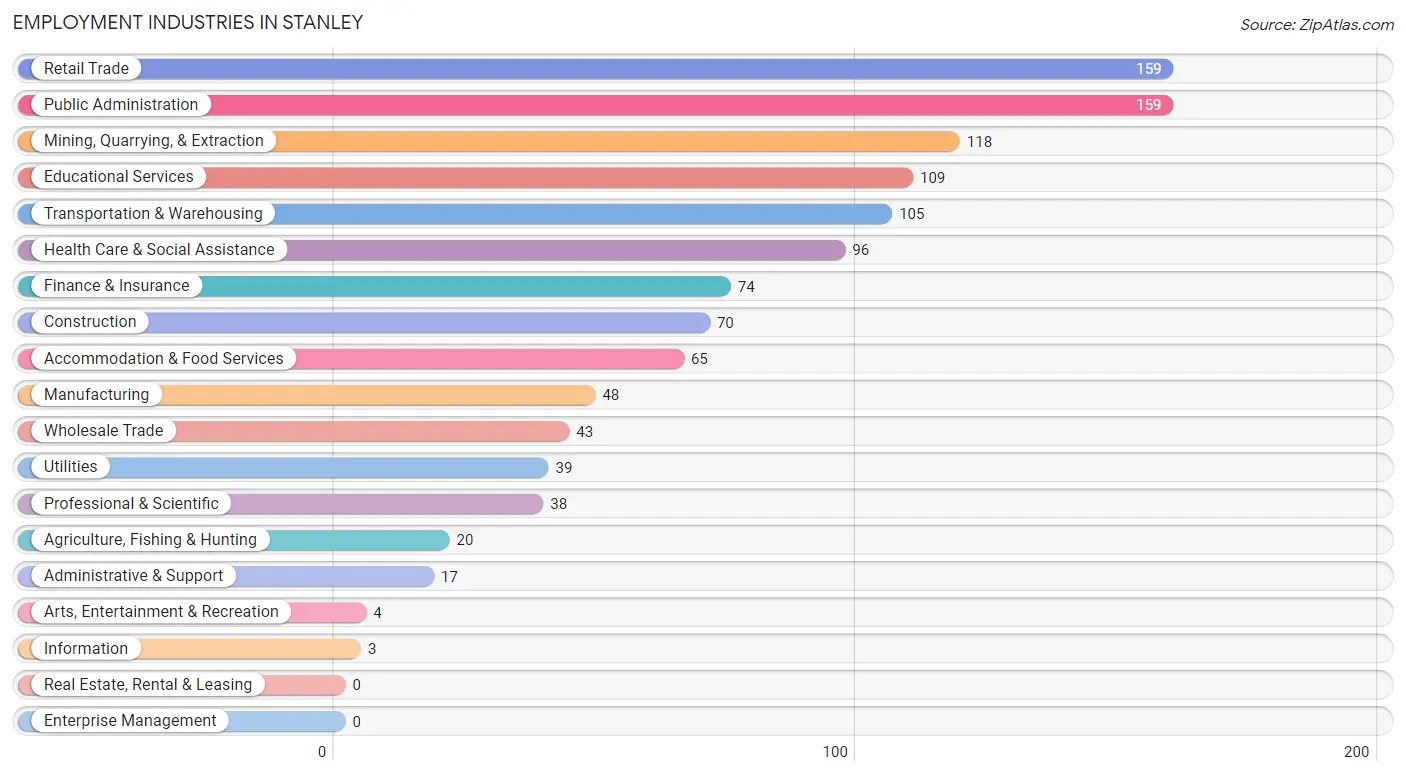
Employment Industries in Stanley
The major employment industries in Stanley include Retail Trade (159 | 13.2%), Public Administration (159 | 13.2%), Mining, Quarrying, & Extraction (118 | 9.8%), Educational Services (109 | 9.0%), and Transportation & Warehousing (105 | 8.7%).
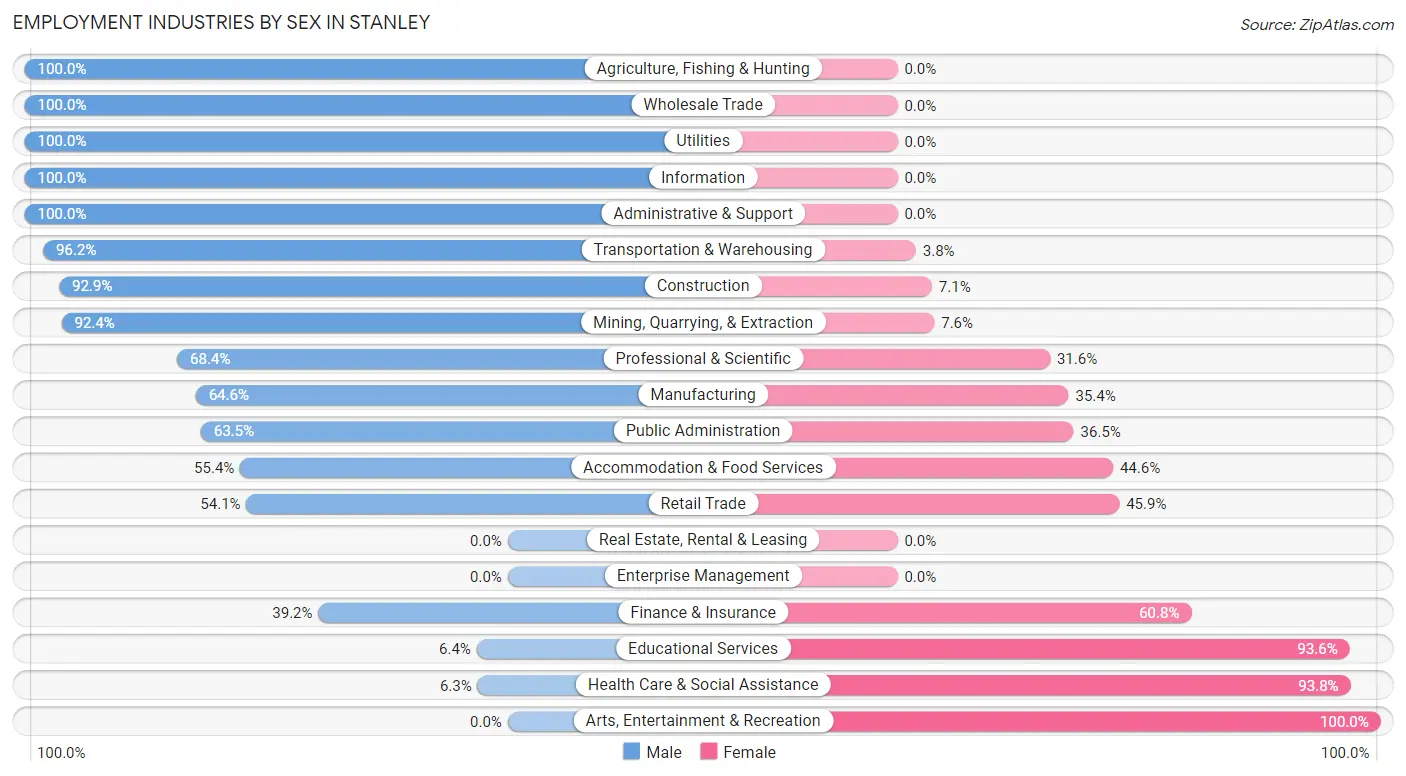
Employment Industries by Sex in Stanley
The Stanley industries that see more men than women are Agriculture, Fishing & Hunting (100.0%), Wholesale Trade (100.0%), and Utilities (100.0%), whereas the industries that tend to have a higher number of women are Arts, Entertainment & Recreation (100.0%), Health Care & Social Assistance (93.8%), and Educational Services (93.6%).
| Industry | Male | Female |
| Agriculture, Fishing & Hunting | 20 (100.0%) | 0 (0.0%) |
| Mining, Quarrying, & Extraction | 109 (92.4%) | 9 (7.6%) |
| Construction | 65 (92.9%) | 5 (7.1%) |
| Manufacturing | 31 (64.6%) | 17 (35.4%) |
| Wholesale Trade | 43 (100.0%) | 0 (0.0%) |
| Retail Trade | 86 (54.1%) | 73 (45.9%) |
| Transportation & Warehousing | 101 (96.2%) | 4 (3.8%) |
| Utilities | 39 (100.0%) | 0 (0.0%) |
| Information | 3 (100.0%) | 0 (0.0%) |
| Finance & Insurance | 29 (39.2%) | 45 (60.8%) |
| Real Estate, Rental & Leasing | 0 (0.0%) | 0 (0.0%) |
| Professional & Scientific | 26 (68.4%) | 12 (31.6%) |
| Enterprise Management | 0 (0.0%) | 0 (0.0%) |
| Administrative & Support | 17 (100.0%) | 0 (0.0%) |
| Educational Services | 7 (6.4%) | 102 (93.6%) |
| Health Care & Social Assistance | 6 (6.2%) | 90 (93.8%) |
| Arts, Entertainment & Recreation | 0 (0.0%) | 4 (100.0%) |
| Accommodation & Food Services | 36 (55.4%) | 29 (44.6%) |
| Public Administration | 101 (63.5%) | 58 (36.5%) |
| Total | 756 (62.8%) | 448 (37.2%) |
Education in Stanley
School Enrollment in Stanley
The most common levels of schooling among the 286 students in Stanley are college / undergraduate (75 | 26.2%), high school (73 | 25.5%), and middle school (63 | 22.0%).
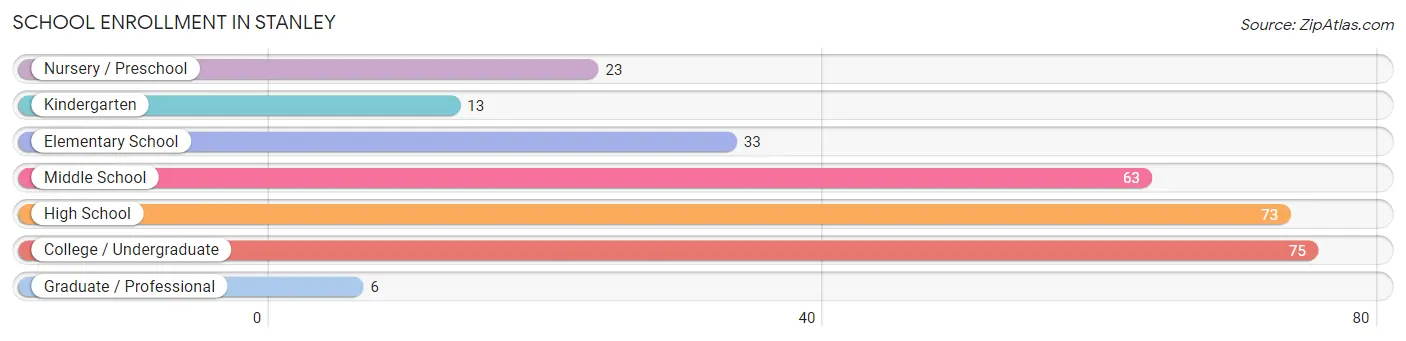
| School Level | # Students | % Students |
| Nursery / Preschool | 23 | 8.0% |
| Kindergarten | 13 | 4.5% |
| Elementary School | 33 | 11.5% |
| Middle School | 63 | 22.0% |
| High School | 73 | 25.5% |
| College / Undergraduate | 75 | 26.2% |
| Graduate / Professional | 6 | 2.1% |
| Total | 286 | 100.0% |
School Enrollment by Age by Funding Source in Stanley
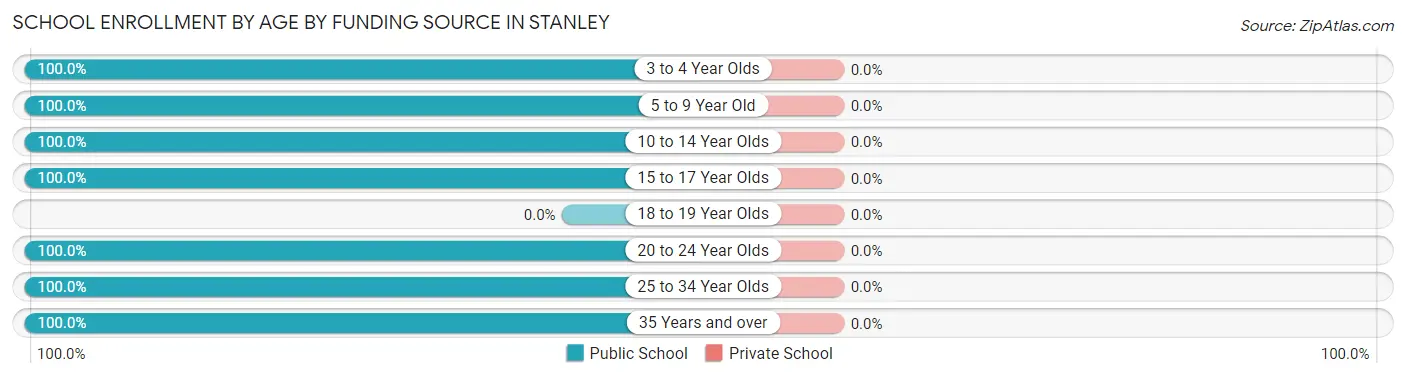
| Age Bracket | Public School | Private School |
| 3 to 4 Year Olds | 13 (100.0%) | 0 (0.0%) |
| 5 to 9 Year Old | 67 (100.0%) | 0 (0.0%) |
| 10 to 14 Year Olds | 52 (100.0%) | 0 (0.0%) |
| 15 to 17 Year Olds | 73 (100.0%) | 0 (0.0%) |
| 18 to 19 Year Olds | 0 (0.0%) | 0 (0.0%) |
| 20 to 24 Year Olds | 59 (100.0%) | 0 (0.0%) |
| 25 to 34 Year Olds | 18 (100.0%) | 0 (0.0%) |
| 35 Years and over | 4 (100.0%) | 0 (0.0%) |
| Total | 286 (100.0%) | 0 (0.0%) |
Educational Attainment by Field of Study in Stanley
Education (122 | 33.7%), science & technology (64 | 17.7%), business (55 | 15.2%), engineering (32 | 8.8%), and computers & mathematics (22 | 6.1%) are the most common fields of study among 362 individuals in Stanley who have obtained a bachelor's degree or higher.
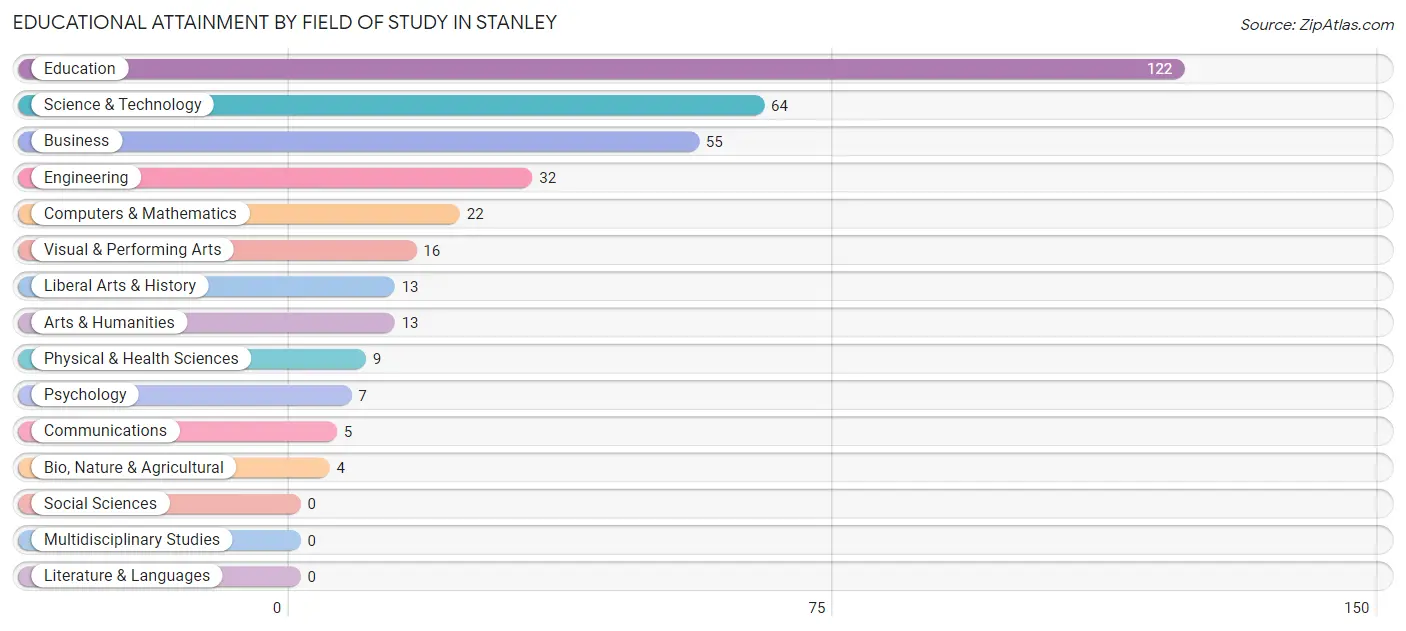
| Field of Study | # Graduates | % Graduates |
| Computers & Mathematics | 22 | 6.1% |
| Bio, Nature & Agricultural | 4 | 1.1% |
| Physical & Health Sciences | 9 | 2.5% |
| Psychology | 7 | 1.9% |
| Social Sciences | 0 | 0.0% |
| Engineering | 32 | 8.8% |
| Multidisciplinary Studies | 0 | 0.0% |
| Science & Technology | 64 | 17.7% |
| Business | 55 | 15.2% |
| Education | 122 | 33.7% |
| Literature & Languages | 0 | 0.0% |
| Liberal Arts & History | 13 | 3.6% |
| Visual & Performing Arts | 16 | 4.4% |
| Communications | 5 | 1.4% |
| Arts & Humanities | 13 | 3.6% |
| Total | 362 | 100.0% |
Transportation & Commute in Stanley
Vehicle Availability by Sex in Stanley
The most prevalent vehicle ownership categories in Stanley are males with 3 vehicles (271, accounting for 36.2%) and females with 3 vehicles (148, making up 61.2%).
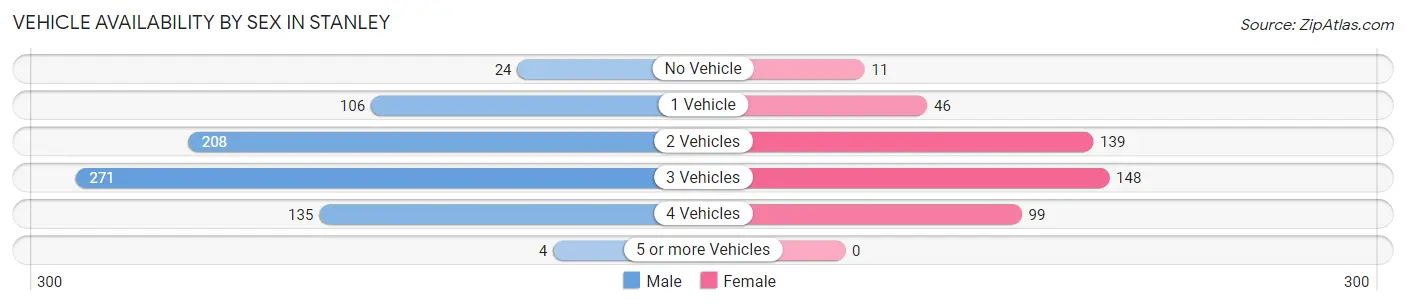
| Vehicles Available | Male | Female |
| No Vehicle | 24 (3.2%) | 11 (2.5%) |
| 1 Vehicle | 106 (14.2%) | 46 (10.4%) |
| 2 Vehicles | 208 (27.8%) | 139 (31.4%) |
| 3 Vehicles | 271 (36.2%) | 148 (33.4%) |
| 4 Vehicles | 135 (18.0%) | 99 (22.4%) |
| 5 or more Vehicles | 4 (0.5%) | 0 (0.0%) |
| Total | 748 (100.0%) | 443 (100.0%) |
Commute Time in Stanley
The most frequently occuring commute durations in Stanley are 5 to 9 minutes (393 commuters, 34.9%), less than 5 minutes (205 commuters, 18.2%), and 30 to 34 minutes (113 commuters, 10.0%).
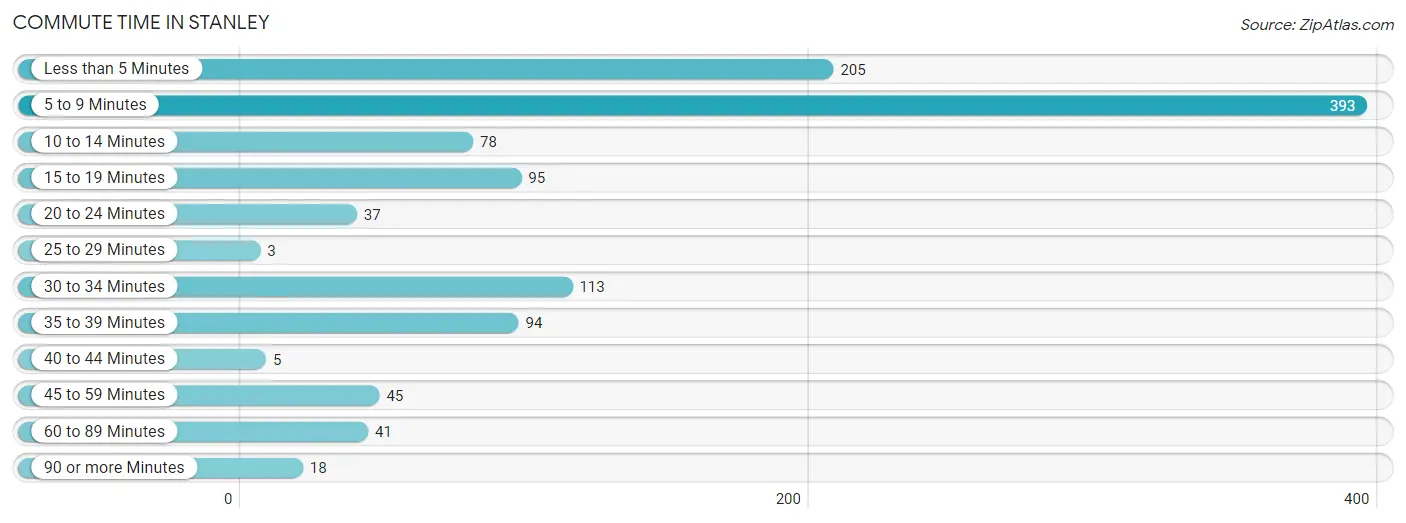
| Commute Time | # Commuters | % Commuters |
| Less than 5 Minutes | 205 | 18.2% |
| 5 to 9 Minutes | 393 | 34.9% |
| 10 to 14 Minutes | 78 | 6.9% |
| 15 to 19 Minutes | 95 | 8.4% |
| 20 to 24 Minutes | 37 | 3.3% |
| 25 to 29 Minutes | 3 | 0.3% |
| 30 to 34 Minutes | 113 | 10.0% |
| 35 to 39 Minutes | 94 | 8.3% |
| 40 to 44 Minutes | 5 | 0.4% |
| 45 to 59 Minutes | 45 | 4.0% |
| 60 to 89 Minutes | 41 | 3.6% |
| 90 or more Minutes | 18 | 1.6% |
Commute Time by Sex in Stanley
The most common commute times in Stanley are 5 to 9 minutes (223 commuters, 31.4%) for males and 5 to 9 minutes (170 commuters, 40.9%) for females.
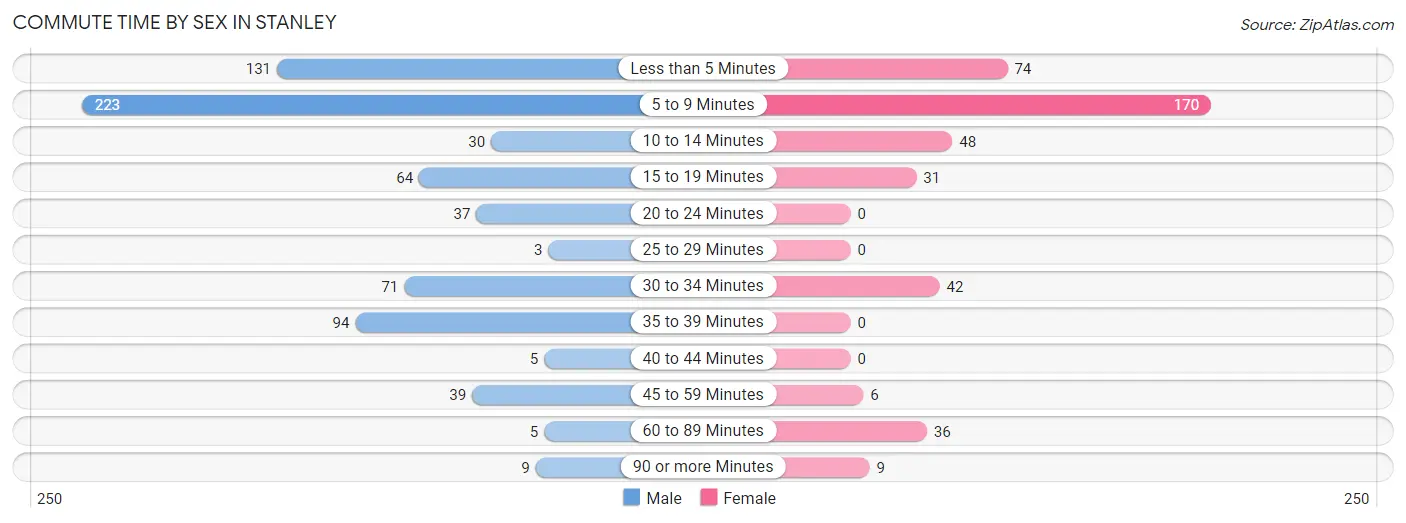
| Commute Time | Male | Female |
| Less than 5 Minutes | 131 (18.4%) | 74 (17.8%) |
| 5 to 9 Minutes | 223 (31.4%) | 170 (40.9%) |
| 10 to 14 Minutes | 30 (4.2%) | 48 (11.5%) |
| 15 to 19 Minutes | 64 (9.0%) | 31 (7.4%) |
| 20 to 24 Minutes | 37 (5.2%) | 0 (0.0%) |
| 25 to 29 Minutes | 3 (0.4%) | 0 (0.0%) |
| 30 to 34 Minutes | 71 (10.0%) | 42 (10.1%) |
| 35 to 39 Minutes | 94 (13.2%) | 0 (0.0%) |
| 40 to 44 Minutes | 5 (0.7%) | 0 (0.0%) |
| 45 to 59 Minutes | 39 (5.5%) | 6 (1.4%) |
| 60 to 89 Minutes | 5 (0.7%) | 36 (8.6%) |
| 90 or more Minutes | 9 (1.3%) | 9 (2.2%) |
Time of Departure to Work by Sex in Stanley
The most frequent times of departure to work in Stanley are 6:30 AM to 6:59 AM (139, 19.6%) for males and 7:30 AM to 7:59 AM (109, 26.2%) for females.
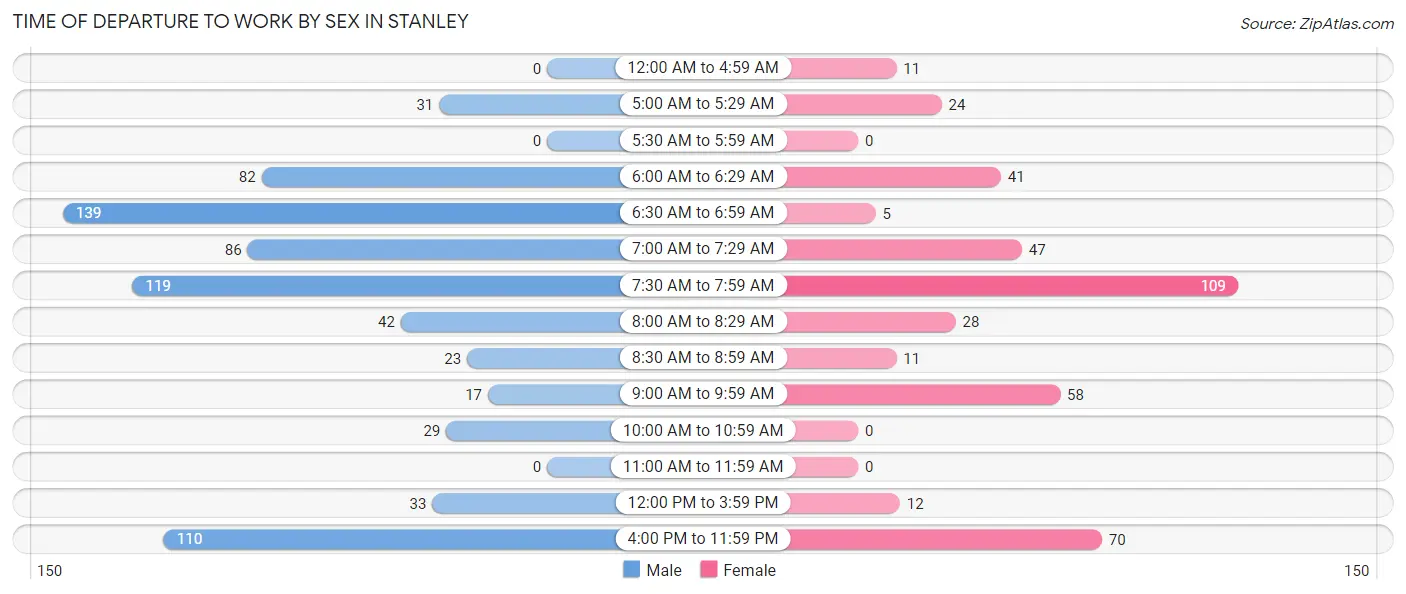
| Time of Departure | Male | Female |
| 12:00 AM to 4:59 AM | 0 (0.0%) | 11 (2.6%) |
| 5:00 AM to 5:29 AM | 31 (4.4%) | 24 (5.8%) |
| 5:30 AM to 5:59 AM | 0 (0.0%) | 0 (0.0%) |
| 6:00 AM to 6:29 AM | 82 (11.5%) | 41 (9.9%) |
| 6:30 AM to 6:59 AM | 139 (19.6%) | 5 (1.2%) |
| 7:00 AM to 7:29 AM | 86 (12.1%) | 47 (11.3%) |
| 7:30 AM to 7:59 AM | 119 (16.7%) | 109 (26.2%) |
| 8:00 AM to 8:29 AM | 42 (5.9%) | 28 (6.7%) |
| 8:30 AM to 8:59 AM | 23 (3.2%) | 11 (2.6%) |
| 9:00 AM to 9:59 AM | 17 (2.4%) | 58 (13.9%) |
| 10:00 AM to 10:59 AM | 29 (4.1%) | 0 (0.0%) |
| 11:00 AM to 11:59 AM | 0 (0.0%) | 0 (0.0%) |
| 12:00 PM to 3:59 PM | 33 (4.6%) | 12 (2.9%) |
| 4:00 PM to 11:59 PM | 110 (15.5%) | 70 (16.8%) |
| Total | 711 (100.0%) | 416 (100.0%) |
Housing Occupancy in Stanley
Occupancy by Ownership in Stanley
Of the total 890 dwellings in Stanley, owner-occupied units account for 545 (61.2%), while renter-occupied units make up 345 (38.8%).
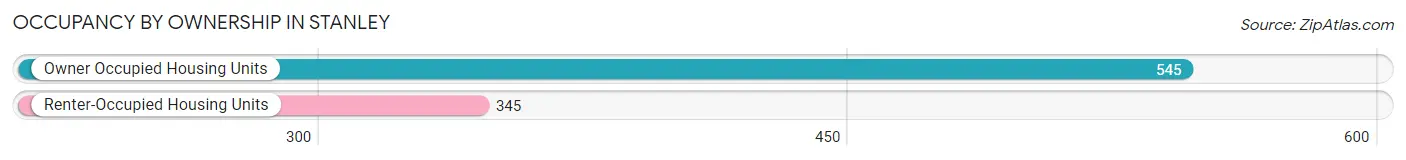
| Occupancy | # Housing Units | % Housing Units |
| Owner Occupied Housing Units | 545 | 61.2% |
| Renter-Occupied Housing Units | 345 | 38.8% |
| Total Occupied Housing Units | 890 | 100.0% |
Occupancy by Household Size in Stanley
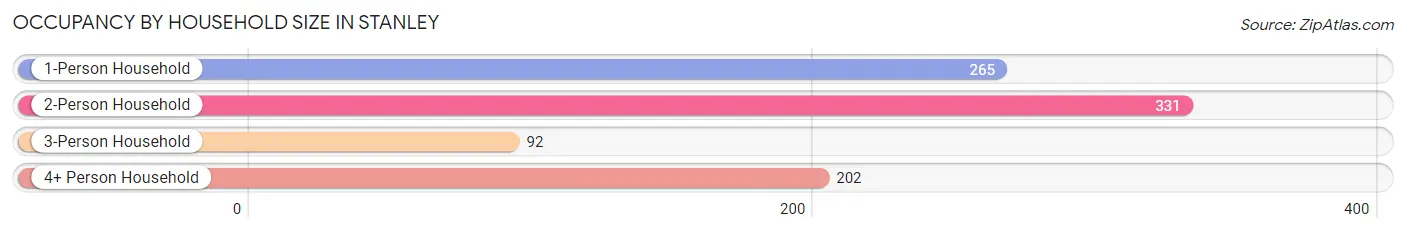
| Household Size | # Housing Units | % Housing Units |
| 1-Person Household | 265 | 29.8% |
| 2-Person Household | 331 | 37.2% |
| 3-Person Household | 92 | 10.3% |
| 4+ Person Household | 202 | 22.7% |
| Total Housing Units | 890 | 100.0% |
Occupancy by Ownership by Household Size in Stanley
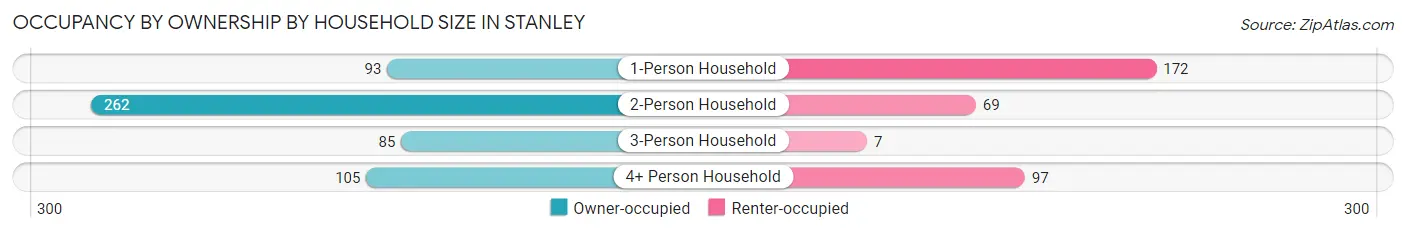
| Household Size | Owner-occupied | Renter-occupied |
| 1-Person Household | 93 (35.1%) | 172 (64.9%) |
| 2-Person Household | 262 (79.1%) | 69 (20.8%) |
| 3-Person Household | 85 (92.4%) | 7 (7.6%) |
| 4+ Person Household | 105 (52.0%) | 97 (48.0%) |
| Total Housing Units | 545 (61.2%) | 345 (38.8%) |
Occupancy by Educational Attainment in Stanley
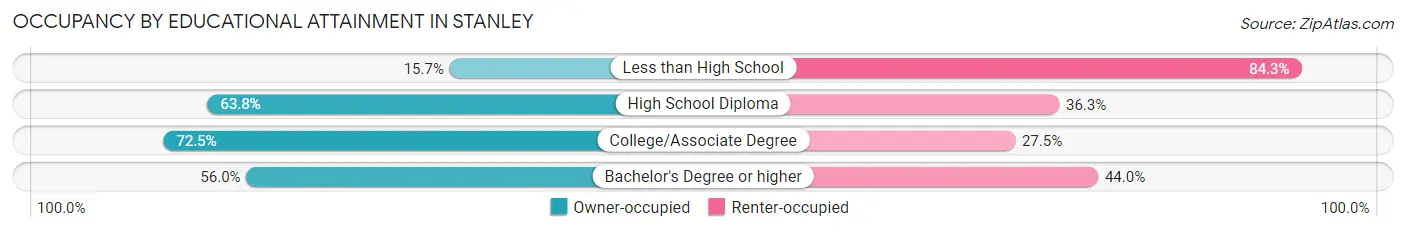
| Household Size | Owner-occupied | Renter-occupied |
| Less than High School | 11 (15.7%) | 59 (84.3%) |
| High School Diploma | 211 (63.7%) | 120 (36.2%) |
| College/Associate Degree | 216 (72.5%) | 82 (27.5%) |
| Bachelor's Degree or higher | 107 (56.0%) | 84 (44.0%) |
Occupancy by Age of Householder in Stanley
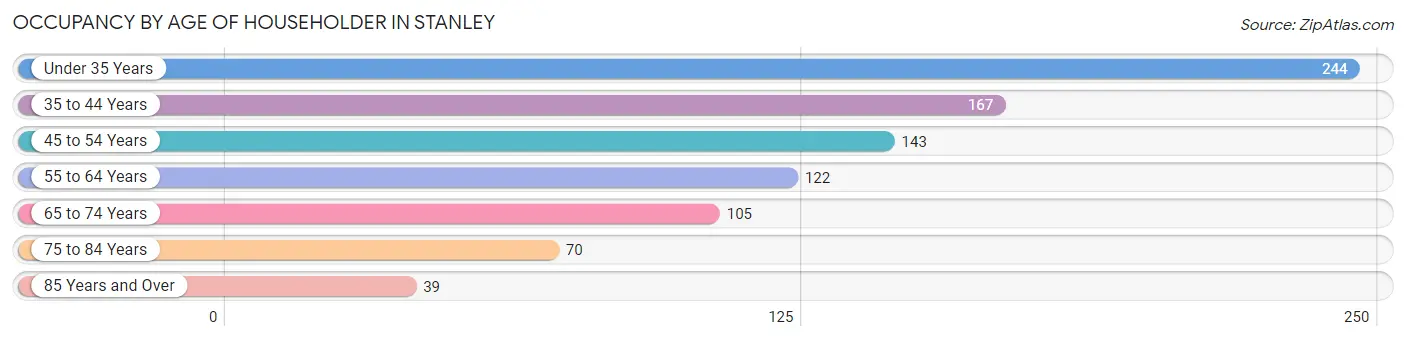
| Age Bracket | # Households | % Households |
| Under 35 Years | 244 | 27.4% |
| 35 to 44 Years | 167 | 18.8% |
| 45 to 54 Years | 143 | 16.1% |
| 55 to 64 Years | 122 | 13.7% |
| 65 to 74 Years | 105 | 11.8% |
| 75 to 84 Years | 70 | 7.9% |
| 85 Years and Over | 39 | 4.4% |
| Total | 890 | 100.0% |
Housing Finances in Stanley
Median Income by Occupancy in Stanley
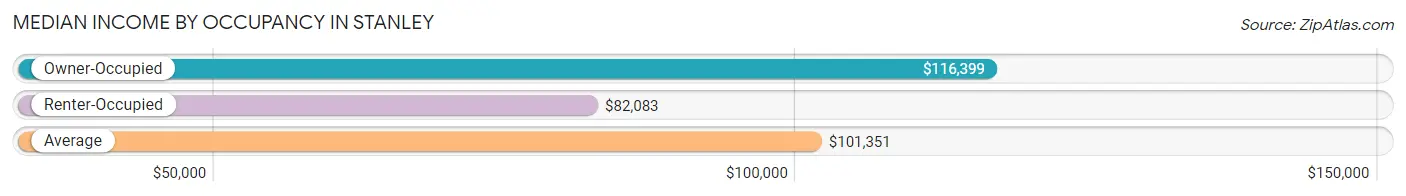
| Occupancy Type | # Households | Median Income |
| Owner-Occupied | 545 (61.2%) | $116,399 |
| Renter-Occupied | 345 (38.8%) | $82,083 |
| Average | 890 (100.0%) | $101,351 |
Occupancy by Householder Income Bracket in Stanley
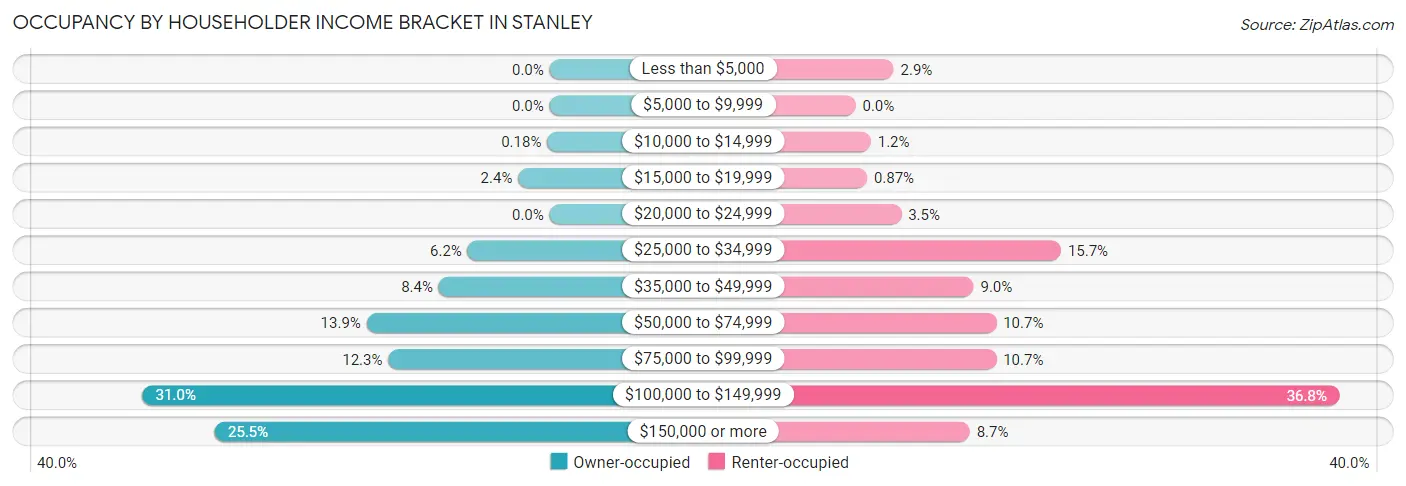
| Income Bracket | Owner-occupied | Renter-occupied |
| Less than $5,000 | 0 (0.0%) | 10 (2.9%) |
| $5,000 to $9,999 | 0 (0.0%) | 0 (0.0%) |
| $10,000 to $14,999 | 1 (0.2%) | 4 (1.2%) |
| $15,000 to $19,999 | 13 (2.4%) | 3 (0.9%) |
| $20,000 to $24,999 | 0 (0.0%) | 12 (3.5%) |
| $25,000 to $34,999 | 34 (6.2%) | 54 (15.7%) |
| $35,000 to $49,999 | 46 (8.4%) | 31 (9.0%) |
| $50,000 to $74,999 | 76 (13.9%) | 37 (10.7%) |
| $75,000 to $99,999 | 67 (12.3%) | 37 (10.7%) |
| $100,000 to $149,999 | 169 (31.0%) | 127 (36.8%) |
| $150,000 or more | 139 (25.5%) | 30 (8.7%) |
| Total | 545 (100.0%) | 345 (100.0%) |
Monthly Housing Cost Tiers in Stanley
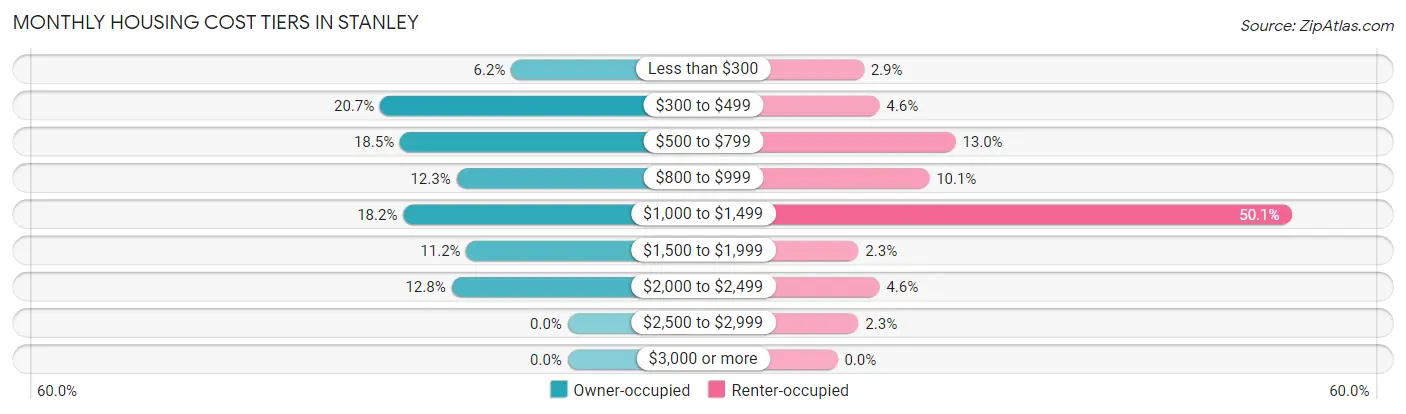
| Monthly Cost | Owner-occupied | Renter-occupied |
| Less than $300 | 34 (6.2%) | 10 (2.9%) |
| $300 to $499 | 113 (20.7%) | 16 (4.6%) |
| $500 to $799 | 101 (18.5%) | 45 (13.0%) |
| $800 to $999 | 67 (12.3%) | 35 (10.1%) |
| $1,000 to $1,499 | 99 (18.2%) | 173 (50.1%) |
| $1,500 to $1,999 | 61 (11.2%) | 8 (2.3%) |
| $2,000 to $2,499 | 70 (12.8%) | 16 (4.6%) |
| $2,500 to $2,999 | 0 (0.0%) | 8 (2.3%) |
| $3,000 or more | 0 (0.0%) | 0 (0.0%) |
| Total | 545 (100.0%) | 345 (100.0%) |
Physical Housing Characteristics in Stanley
Housing Structures in Stanley
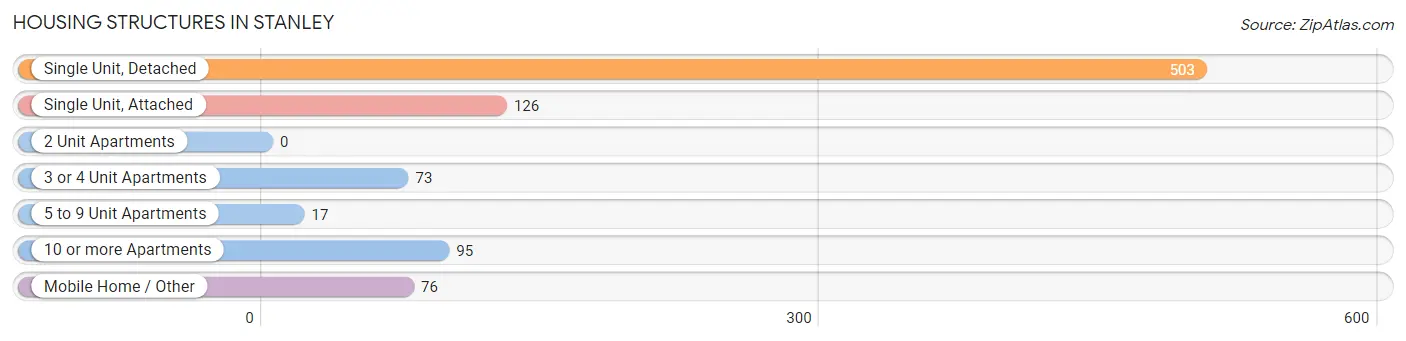
| Structure Type | # Housing Units | % Housing Units |
| Single Unit, Detached | 503 | 56.5% |
| Single Unit, Attached | 126 | 14.2% |
| 2 Unit Apartments | 0 | 0.0% |
| 3 or 4 Unit Apartments | 73 | 8.2% |
| 5 to 9 Unit Apartments | 17 | 1.9% |
| 10 or more Apartments | 95 | 10.7% |
| Mobile Home / Other | 76 | 8.5% |
| Total | 890 | 100.0% |
Housing Structures by Occupancy in Stanley
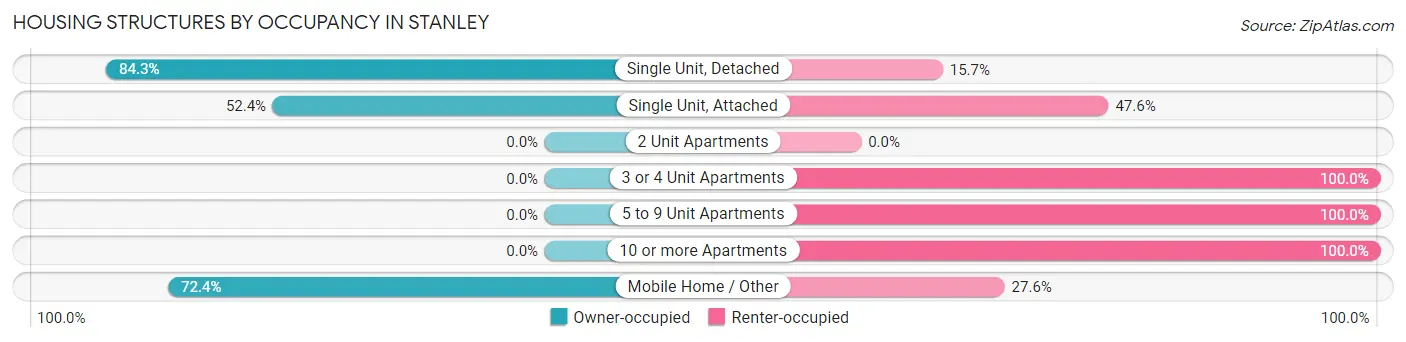
| Structure Type | Owner-occupied | Renter-occupied |
| Single Unit, Detached | 424 (84.3%) | 79 (15.7%) |
| Single Unit, Attached | 66 (52.4%) | 60 (47.6%) |
| 2 Unit Apartments | 0 (0.0%) | 0 (0.0%) |
| 3 or 4 Unit Apartments | 0 (0.0%) | 73 (100.0%) |
| 5 to 9 Unit Apartments | 0 (0.0%) | 17 (100.0%) |
| 10 or more Apartments | 0 (0.0%) | 95 (100.0%) |
| Mobile Home / Other | 55 (72.4%) | 21 (27.6%) |
| Total | 545 (61.2%) | 345 (38.8%) |
Housing Structures by Number of Rooms in Stanley
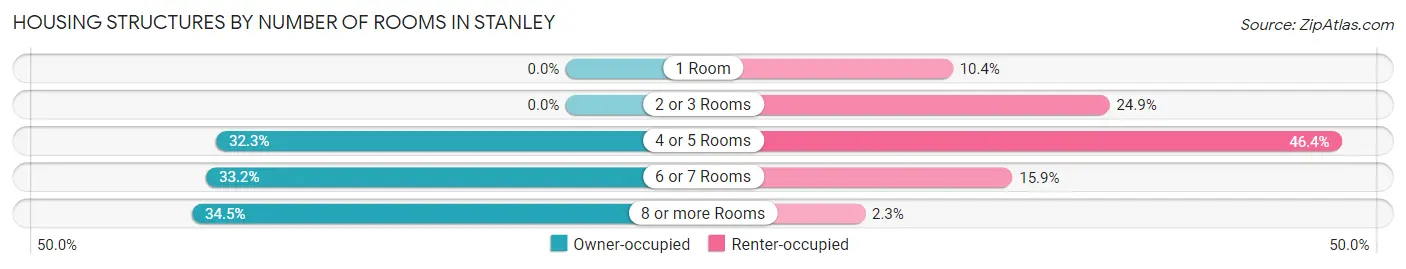
| Number of Rooms | Owner-occupied | Renter-occupied |
| 1 Room | 0 (0.0%) | 36 (10.4%) |
| 2 or 3 Rooms | 0 (0.0%) | 86 (24.9%) |
| 4 or 5 Rooms | 176 (32.3%) | 160 (46.4%) |
| 6 or 7 Rooms | 181 (33.2%) | 55 (15.9%) |
| 8 or more Rooms | 188 (34.5%) | 8 (2.3%) |
| Total | 545 (100.0%) | 345 (100.0%) |
Housing Structure by Heating Type in Stanley
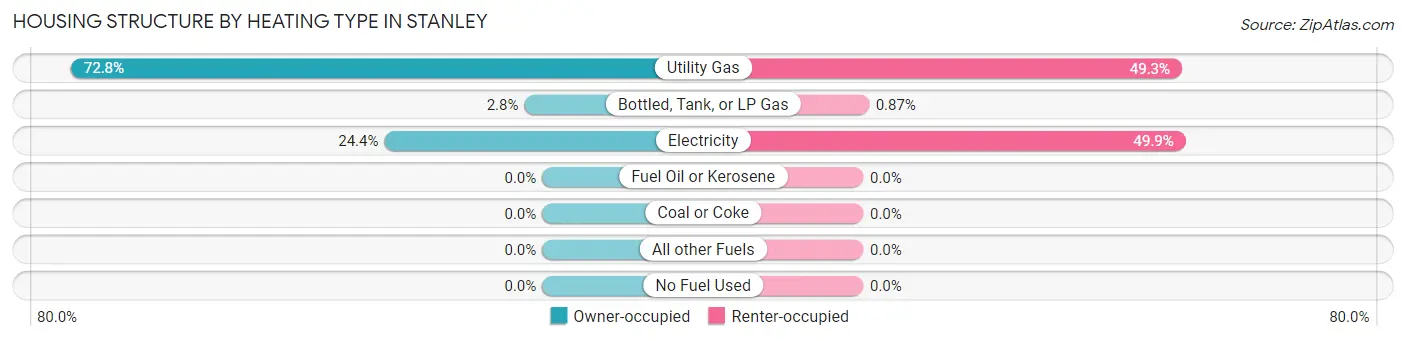
| Heating Type | Owner-occupied | Renter-occupied |
| Utility Gas | 397 (72.8%) | 170 (49.3%) |
| Bottled, Tank, or LP Gas | 15 (2.8%) | 3 (0.9%) |
| Electricity | 133 (24.4%) | 172 (49.9%) |
| Fuel Oil or Kerosene | 0 (0.0%) | 0 (0.0%) |
| Coal or Coke | 0 (0.0%) | 0 (0.0%) |
| All other Fuels | 0 (0.0%) | 0 (0.0%) |
| No Fuel Used | 0 (0.0%) | 0 (0.0%) |
| Total | 545 (100.0%) | 345 (100.0%) |
Household Vehicle Usage in Stanley
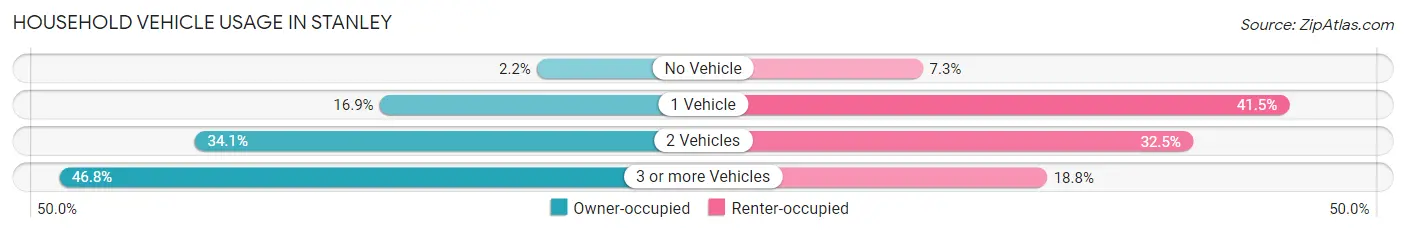
| Vehicles per Household | Owner-occupied | Renter-occupied |
| No Vehicle | 12 (2.2%) | 25 (7.2%) |
| 1 Vehicle | 92 (16.9%) | 143 (41.4%) |
| 2 Vehicles | 186 (34.1%) | 112 (32.5%) |
| 3 or more Vehicles | 255 (46.8%) | 65 (18.8%) |
| Total | 545 (100.0%) | 345 (100.0%) |
Real Estate & Mortgages in Stanley
Real Estate and Mortgage Overview in Stanley
| Characteristic | Without Mortgage | With Mortgage |
| Housing Units | 250 | 295 |
| Median Property Value | $188,300 | $227,400 |
| Median Household Income | $124,167 | $54 |
| Monthly Housing Costs | $474 | $0 |
| Real Estate Taxes | $1,644 | $50 |
Property Value by Mortgage Status in Stanley
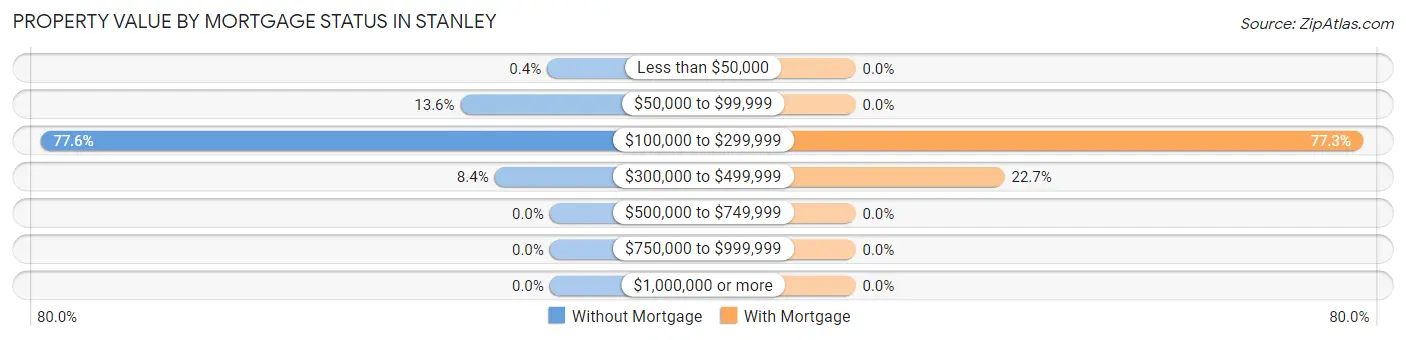
| Property Value | Without Mortgage | With Mortgage |
| Less than $50,000 | 1 (0.4%) | 0 (0.0%) |
| $50,000 to $99,999 | 34 (13.6%) | 0 (0.0%) |
| $100,000 to $299,999 | 194 (77.6%) | 228 (77.3%) |
| $300,000 to $499,999 | 21 (8.4%) | 67 (22.7%) |
| $500,000 to $749,999 | 0 (0.0%) | 0 (0.0%) |
| $750,000 to $999,999 | 0 (0.0%) | 0 (0.0%) |
| $1,000,000 or more | 0 (0.0%) | 0 (0.0%) |
| Total | 250 (100.0%) | 295 (100.0%) |
Household Income by Mortgage Status in Stanley
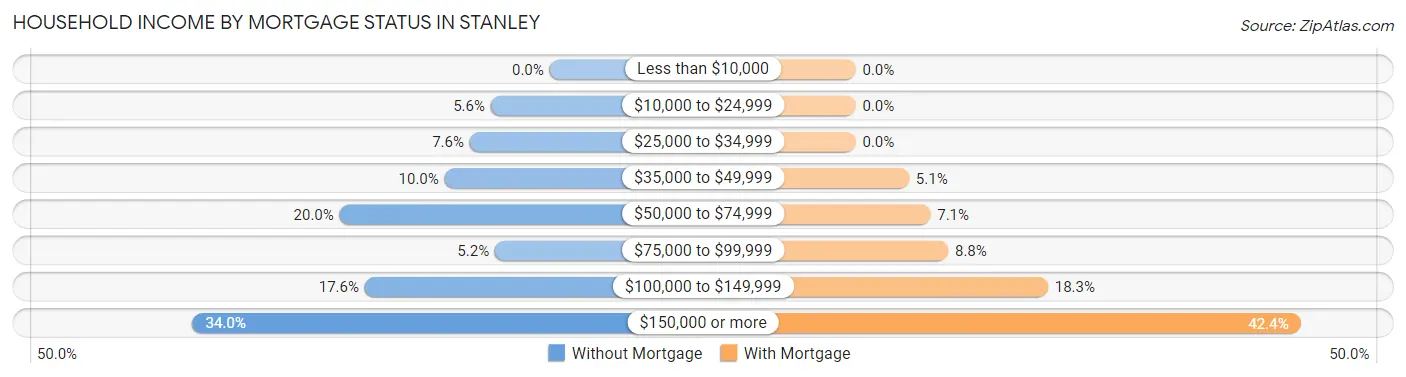
| Household Income | Without Mortgage | With Mortgage |
| Less than $10,000 | 0 (0.0%) | 0 (0.0%) |
| $10,000 to $24,999 | 14 (5.6%) | 0 (0.0%) |
| $25,000 to $34,999 | 19 (7.6%) | 0 (0.0%) |
| $35,000 to $49,999 | 25 (10.0%) | 15 (5.1%) |
| $50,000 to $74,999 | 50 (20.0%) | 21 (7.1%) |
| $75,000 to $99,999 | 13 (5.2%) | 26 (8.8%) |
| $100,000 to $149,999 | 44 (17.6%) | 54 (18.3%) |
| $150,000 or more | 85 (34.0%) | 125 (42.4%) |
| Total | 250 (100.0%) | 295 (100.0%) |
Property Value to Household Income Ratio in Stanley
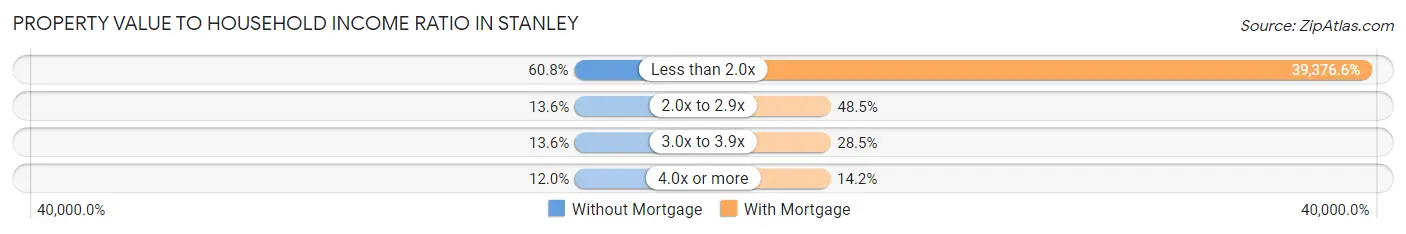
| Value-to-Income Ratio | Without Mortgage | With Mortgage |
| Less than 2.0x | 152 (60.8%) | 116,161 (39,376.6%) |
| 2.0x to 2.9x | 34 (13.6%) | 143 (48.5%) |
| 3.0x to 3.9x | 34 (13.6%) | 84 (28.5%) |
| 4.0x or more | 30 (12.0%) | 42 (14.2%) |
| Total | 250 (100.0%) | 295 (100.0%) |
Real Estate Taxes by Mortgage Status in Stanley
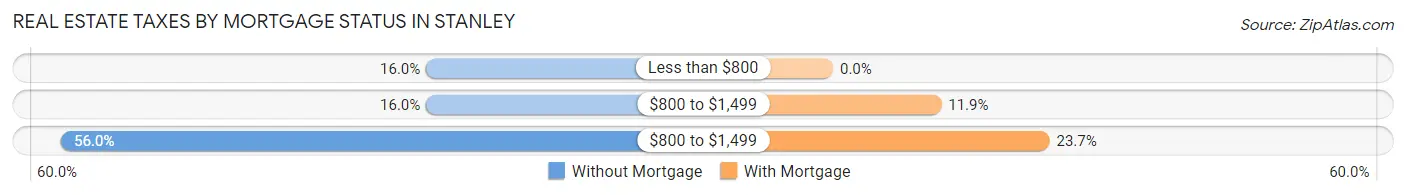
| Property Taxes | Without Mortgage | With Mortgage |
| Less than $800 | 40 (16.0%) | 0 (0.0%) |
| $800 to $1,499 | 40 (16.0%) | 35 (11.9%) |
| $800 to $1,499 | 140 (56.0%) | 70 (23.7%) |
| Total | 250 (100.0%) | 295 (100.0%) |
Health & Disability in Stanley
Health Insurance Coverage by Age in Stanley
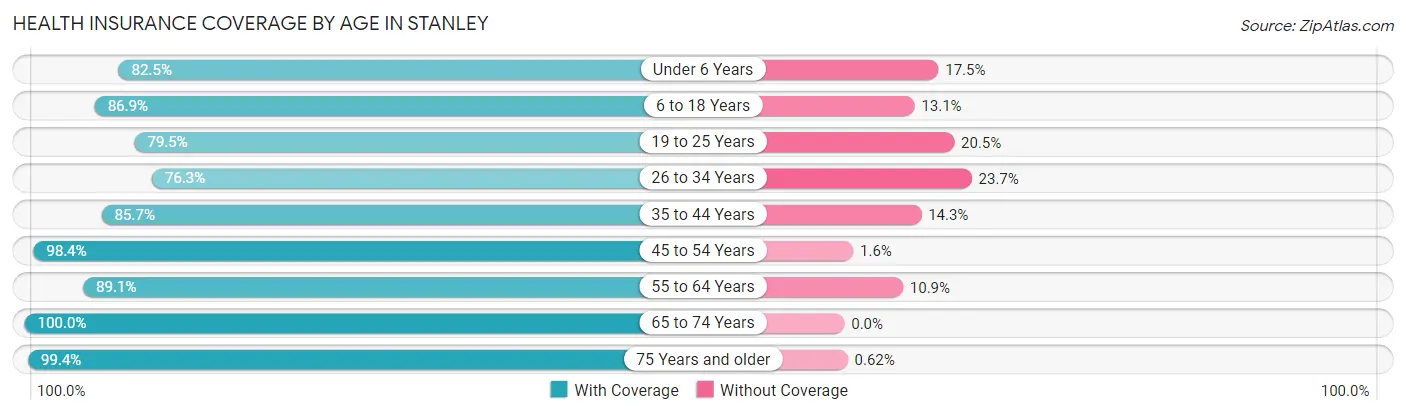
| Age Bracket | With Coverage | Without Coverage |
| Under 6 Years | 240 (82.5%) | 51 (17.5%) |
| 6 to 18 Years | 206 (86.9%) | 31 (13.1%) |
| 19 to 25 Years | 132 (79.5%) | 34 (20.5%) |
| 26 to 34 Years | 257 (76.3%) | 80 (23.7%) |
| 35 to 44 Years | 233 (85.7%) | 39 (14.3%) |
| 45 to 54 Years | 240 (98.4%) | 4 (1.6%) |
| 55 to 64 Years | 253 (89.1%) | 31 (10.9%) |
| 65 to 74 Years | 147 (100.0%) | 0 (0.0%) |
| 75 Years and older | 161 (99.4%) | 1 (0.6%) |
| Total | 1,869 (87.3%) | 271 (12.7%) |
Health Insurance Coverage by Citizenship Status in Stanley
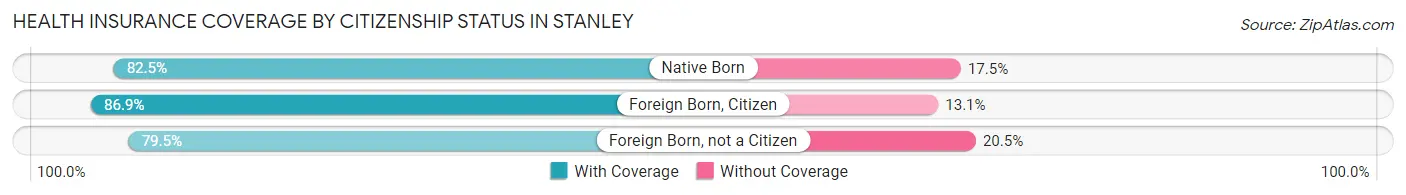
| Citizenship Status | With Coverage | Without Coverage |
| Native Born | 240 (82.5%) | 51 (17.5%) |
| Foreign Born, Citizen | 206 (86.9%) | 31 (13.1%) |
| Foreign Born, not a Citizen | 132 (79.5%) | 34 (20.5%) |
Health Insurance Coverage by Household Income in Stanley
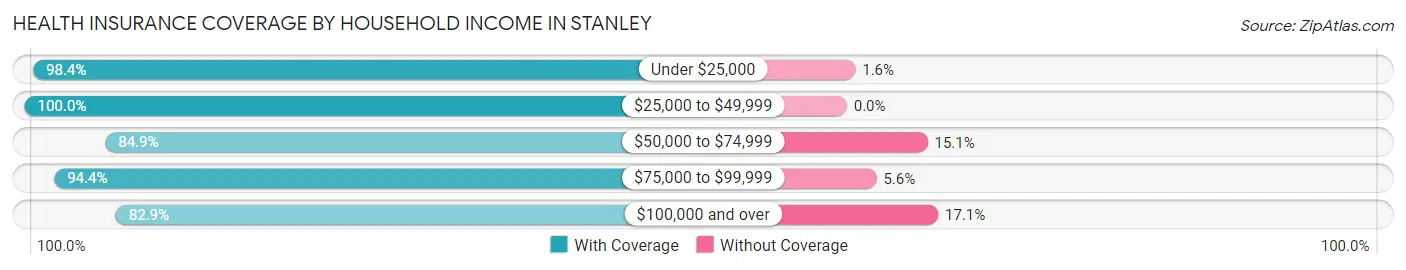
| Household Income | With Coverage | Without Coverage |
| Under $25,000 | 62 (98.4%) | 1 (1.6%) |
| $25,000 to $49,999 | 343 (100.0%) | 0 (0.0%) |
| $50,000 to $74,999 | 258 (84.9%) | 46 (15.1%) |
| $75,000 to $99,999 | 153 (94.4%) | 9 (5.6%) |
| $100,000 and over | 1,042 (82.9%) | 215 (17.1%) |
Public vs Private Health Insurance Coverage by Age in Stanley
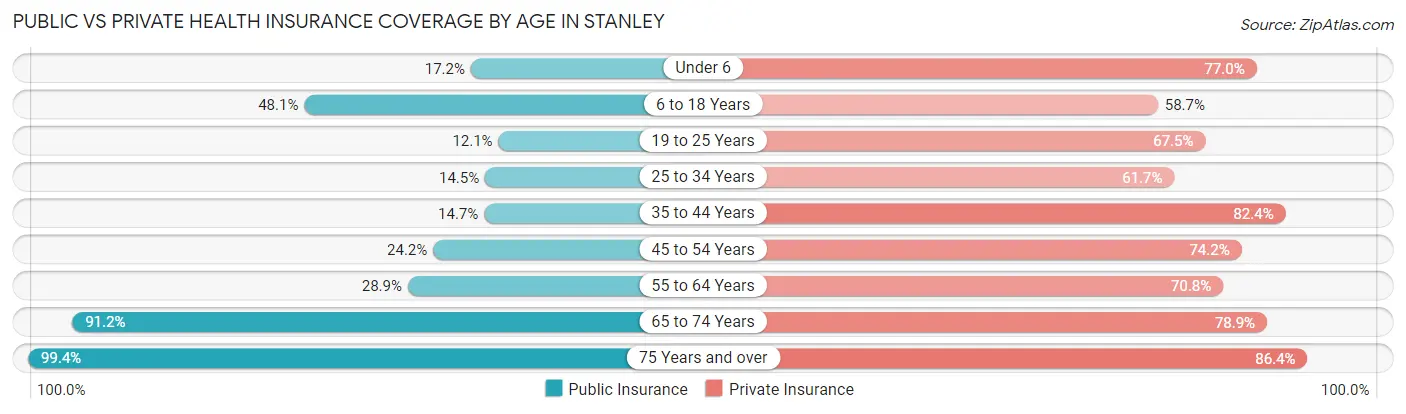
| Age Bracket | Public Insurance | Private Insurance |
| Under 6 | 50 (17.2%) | 224 (77.0%) |
| 6 to 18 Years | 114 (48.1%) | 139 (58.7%) |
| 19 to 25 Years | 20 (12.0%) | 112 (67.5%) |
| 25 to 34 Years | 49 (14.5%) | 208 (61.7%) |
| 35 to 44 Years | 40 (14.7%) | 224 (82.4%) |
| 45 to 54 Years | 59 (24.2%) | 181 (74.2%) |
| 55 to 64 Years | 82 (28.9%) | 201 (70.8%) |
| 65 to 74 Years | 134 (91.2%) | 116 (78.9%) |
| 75 Years and over | 161 (99.4%) | 140 (86.4%) |
| Total | 709 (33.1%) | 1,545 (72.2%) |
Disability Status by Sex by Age in Stanley
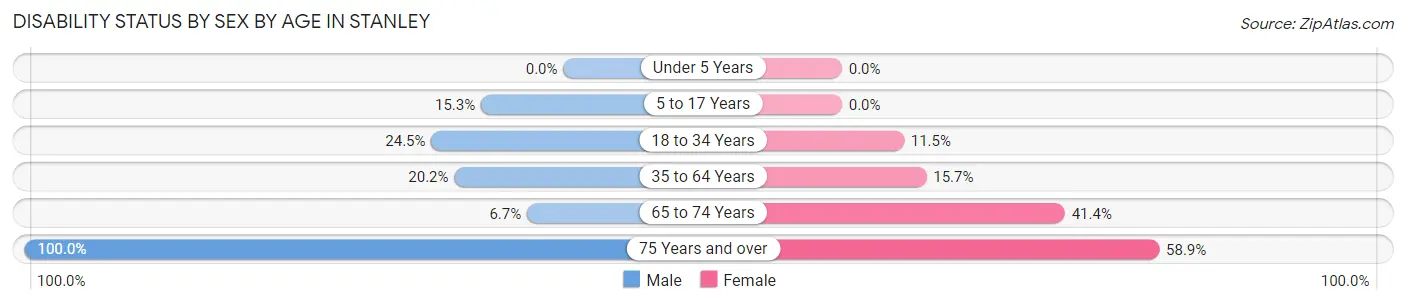
| Age Bracket | Male | Female |
| Under 5 Years | 0 (0.0%) | 0 (0.0%) |
| 5 to 17 Years | 22 (15.3%) | 0 (0.0%) |
| 18 to 34 Years | 74 (24.5%) | 26 (11.5%) |
| 35 to 64 Years | 87 (20.2%) | 58 (15.7%) |
| 65 to 74 Years | 6 (6.7%) | 24 (41.4%) |
| 75 Years and over | 89 (100.0%) | 43 (58.9%) |
Disability Class by Sex by Age in Stanley
Disability Class: Hearing Difficulty
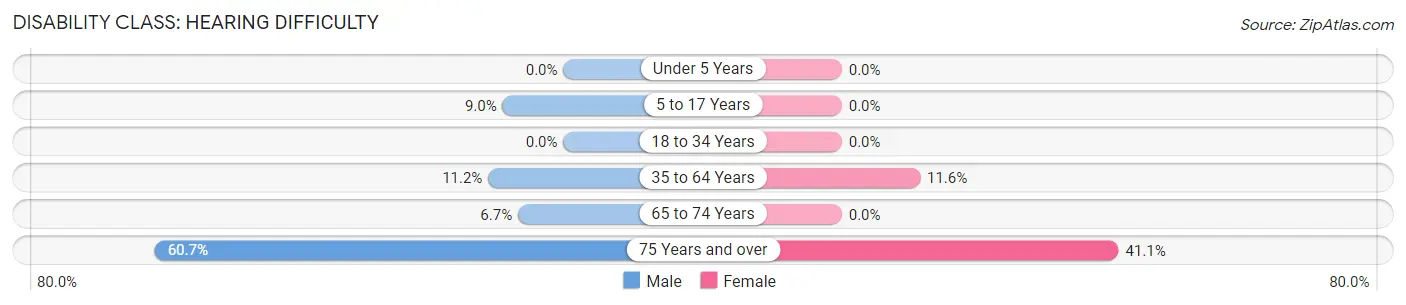
| Age Bracket | Male | Female |
| Under 5 Years | 0 (0.0%) | 0 (0.0%) |
| 5 to 17 Years | 13 (9.0%) | 0 (0.0%) |
| 18 to 34 Years | 0 (0.0%) | 0 (0.0%) |
| 35 to 64 Years | 48 (11.2%) | 43 (11.6%) |
| 65 to 74 Years | 6 (6.7%) | 0 (0.0%) |
| 75 Years and over | 54 (60.7%) | 30 (41.1%) |
Disability Class: Vision Difficulty
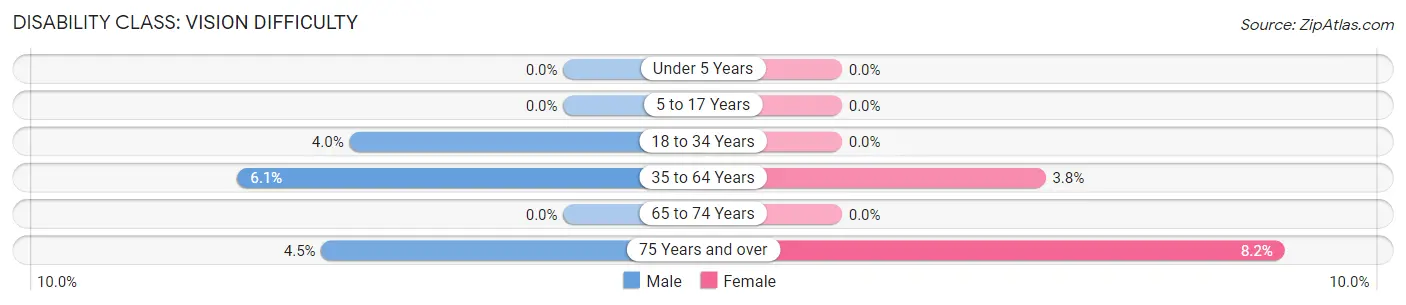
| Age Bracket | Male | Female |
| Under 5 Years | 0 (0.0%) | 0 (0.0%) |
| 5 to 17 Years | 0 (0.0%) | 0 (0.0%) |
| 18 to 34 Years | 12 (4.0%) | 0 (0.0%) |
| 35 to 64 Years | 26 (6.0%) | 14 (3.8%) |
| 65 to 74 Years | 0 (0.0%) | 0 (0.0%) |
| 75 Years and over | 4 (4.5%) | 6 (8.2%) |
Disability Class: Cognitive Difficulty
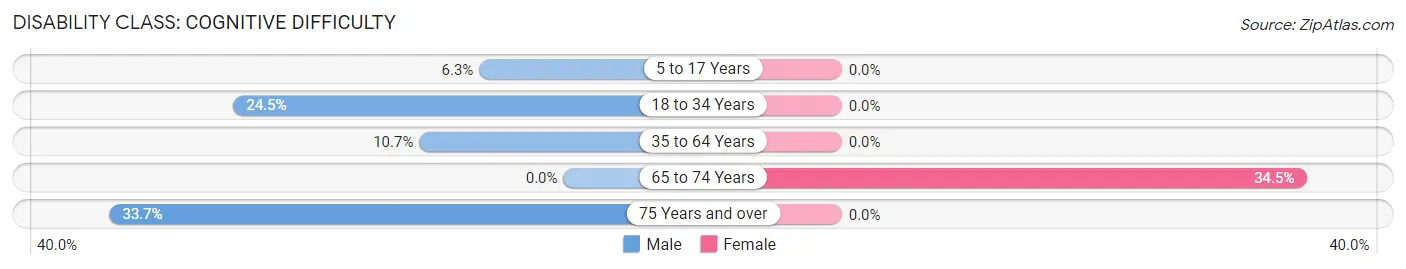
| Age Bracket | Male | Female |
| 5 to 17 Years | 9 (6.2%) | 0 (0.0%) |
| 18 to 34 Years | 74 (24.5%) | 0 (0.0%) |
| 35 to 64 Years | 46 (10.7%) | 0 (0.0%) |
| 65 to 74 Years | 0 (0.0%) | 20 (34.5%) |
| 75 Years and over | 30 (33.7%) | 0 (0.0%) |
Disability Class: Ambulatory Difficulty
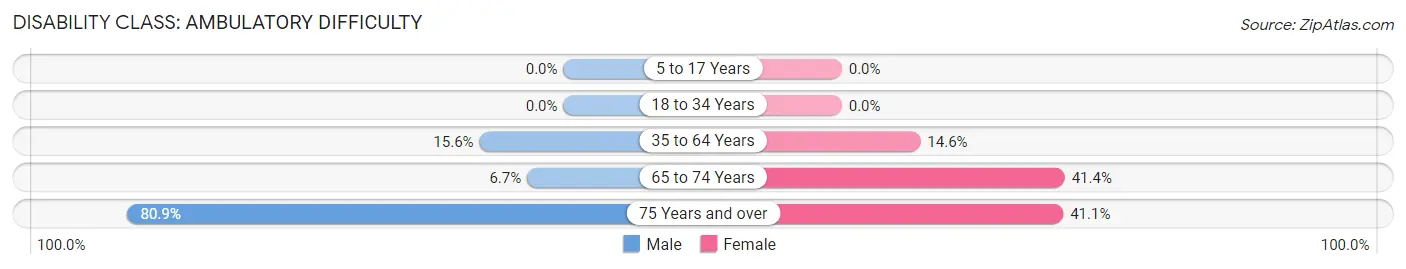
| Age Bracket | Male | Female |
| 5 to 17 Years | 0 (0.0%) | 0 (0.0%) |
| 18 to 34 Years | 0 (0.0%) | 0 (0.0%) |
| 35 to 64 Years | 67 (15.6%) | 54 (14.6%) |
| 65 to 74 Years | 6 (6.7%) | 24 (41.4%) |
| 75 Years and over | 72 (80.9%) | 30 (41.1%) |
Disability Class: Self-Care Difficulty
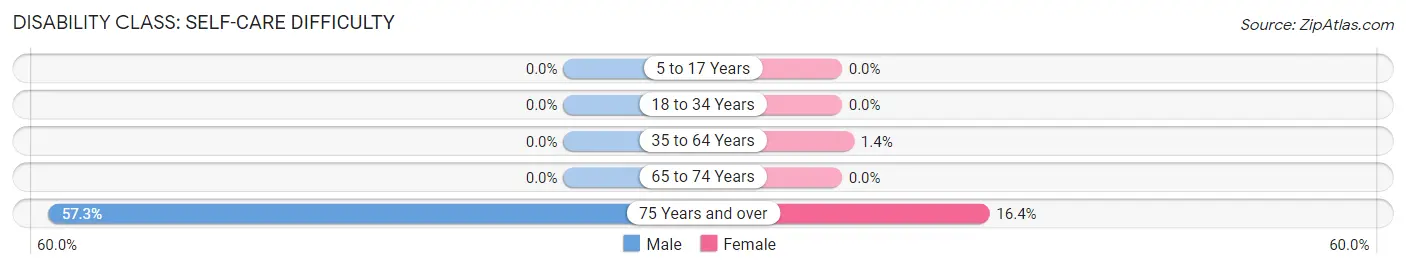
| Age Bracket | Male | Female |
| 5 to 17 Years | 0 (0.0%) | 0 (0.0%) |
| 18 to 34 Years | 0 (0.0%) | 0 (0.0%) |
| 35 to 64 Years | 0 (0.0%) | 5 (1.3%) |
| 65 to 74 Years | 0 (0.0%) | 0 (0.0%) |
| 75 Years and over | 51 (57.3%) | 12 (16.4%) |
Technology Access in Stanley
Computing Device Access in Stanley
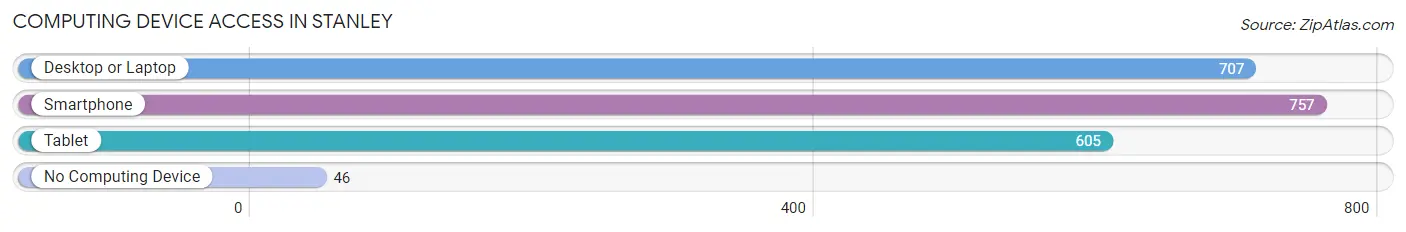
| Device Type | # Households | % Households |
| Desktop or Laptop | 707 | 79.4% |
| Smartphone | 757 | 85.1% |
| Tablet | 605 | 68.0% |
| No Computing Device | 46 | 5.2% |
| Total | 890 | 100.0% |
Internet Access in Stanley
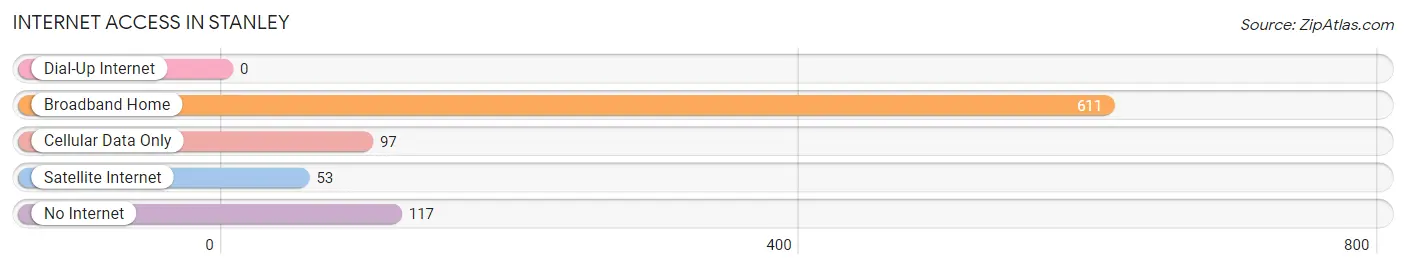
| Internet Type | # Households | % Households |
| Dial-Up Internet | 0 | 0.0% |
| Broadband Home | 611 | 68.6% |
| Cellular Data Only | 97 | 10.9% |
| Satellite Internet | 53 | 6.0% |
| No Internet | 117 | 13.2% |
| Total | 890 | 100.0% |
Stanley Summary
Stanley, North Dakota is a small city located in Mountrail County in the northwestern part of the state. It is the county seat and the largest city in the county. The city was founded in 1887 and has a population of 2,521 as of the 2020 census.
History
The area that is now Stanley was first settled in 1885 by a group of Norwegian immigrants. The city was named after Stanley County, which was created in 1887. The county was named after Stanley, a town in England. The city was incorporated in 1889 and was the first city in Mountrail County.
The city was an important center for the area's agricultural and lumber industries. In the early 1900s, the city was home to several sawmills, a flour mill, and a creamery. The city also had a railroad station, which was important for the transportation of goods and people.
The city experienced a period of growth in the 1950s and 1960s, when the oil industry began to develop in the area. The city was also home to a large military base, which was closed in the 1970s.
Geography
Stanley is located in the northwestern part of North Dakota, in Mountrail County. The city is situated on the banks of the Little Missouri River, which flows through the city. The city is surrounded by rolling hills and prairies.
The city has a total area of 4.2 square miles, all of which is land. The city has a humid continental climate, with cold winters and hot summers.
Economy
The economy of Stanley is largely based on agriculture and oil production. The city is home to several large farms, which produce a variety of crops, including wheat, corn, and soybeans. The city is also home to several oil and gas companies, which are responsible for much of the city's economic activity.
The city is also home to several manufacturing companies, which produce a variety of products, including furniture, clothing, and food products. The city is also home to several retail stores, which provide goods and services to the local population.
Demographics
As of the 2020 census, the population of Stanley was 2,521. The city has a population density of 597 people per square mile. The median age of the population is 39.7 years, and the median household income is $50,945.
The city is predominantly white, with 91.3% of the population identifying as white. The city also has a small Hispanic population, with 4.2% of the population identifying as Hispanic or Latino. The city also has a small Native American population, with 1.2% of the population identifying as Native American.
The city has a high rate of educational attainment, with 92.3% of the population having a high school diploma or higher. The city also has a low unemployment rate, with only 3.2% of the population being unemployed.
Conclusion
Stanley, North Dakota is a small city located in Mountrail County in the northwestern part of the state. The city was founded in 1887 and has a population of 2,521 as of the 2020 census. The city is largely based on agriculture and oil production, and is home to several large farms, oil and gas companies, and manufacturing companies. The city has a predominantly white population, with 91.3% of the population identifying as white. The city also has a high rate of educational attainment, with 92.3% of the population having a high school diploma or higher.
Common Questions
What is Per Capita Income in Stanley?
Per Capita income in Stanley is $44,087.
What is the Median Family Income in Stanley?
Median Family Income in Stanley is $125,245.
What is the Median Household income in Stanley?
Median Household Income in Stanley is $101,351.
What is Income or Wage Gap in Stanley?
Income or Wage Gap in Stanley is 53.7%.
Women in Stanley earn 46.3 cents for every dollar earned by a man.
What is Inequality or Gini Index in Stanley?
Inequality or Gini Index in Stanley is 0.38.
What is the Total Population of Stanley?
Total Population of Stanley is 2,189.
What is the Total Male Population of Stanley?
Total Male Population of Stanley is 1,178.
What is the Total Female Population of Stanley?
Total Female Population of Stanley is 1,011.
What is the Ratio of Males per 100 Females in Stanley?
There are 116.52 Males per 100 Females in Stanley.
What is the Ratio of Females per 100 Males in Stanley?
There are 85.82 Females per 100 Males in Stanley.
What is the Median Population Age in Stanley?
Median Population Age in Stanley is 37.2 Years.
What is the Average Family Size in Stanley
Average Family Size in Stanley is 3.0 People.
What is the Average Household Size in Stanley
Average Household Size in Stanley is 2.4 People.
How Large is the Labor Force in Stanley?
There are 1,245 People in the Labor Forcein in Stanley.
What is the Percentage of People in the Labor Force in Stanley?
70.6% of People are in the Labor Force in Stanley.
What is the Unemployment Rate in Stanley?
Unemployment Rate in Stanley is 3.3%.