Robeson County, NC Map & Demographics
Robeson County Map
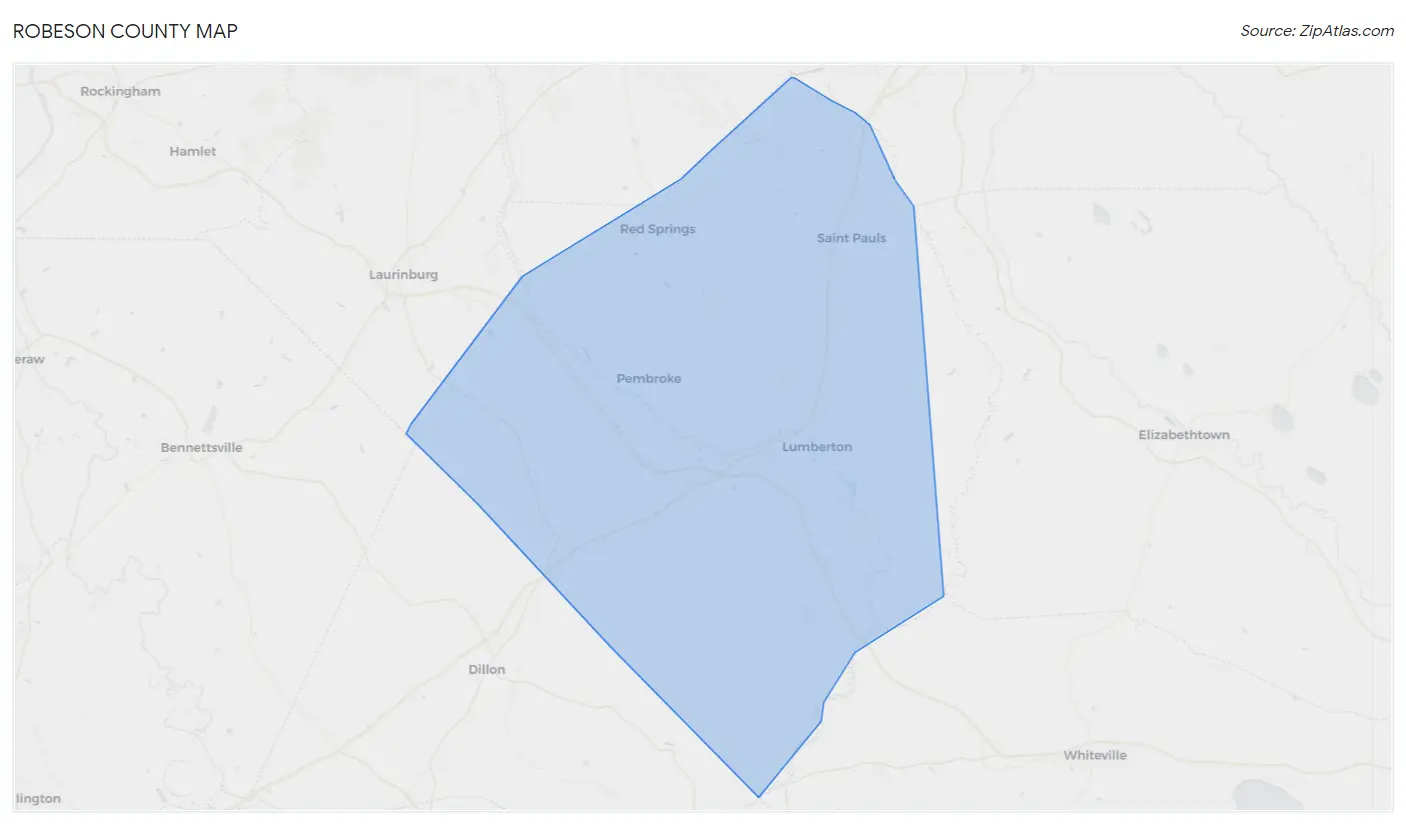
Robeson County Overview
$21,998
PER CAPITA INCOME
$50,612
AVG FAMILY INCOME
$39,393
AVG HOUSEHOLD INCOME
19.2%
WAGE / INCOME GAP [ % ]
80.8¢/ $1
WAGE / INCOME GAP [ $ ]
$11,869
FAMILY INCOME DEFICIT
0.50
INEQUALITY / GINI INDEX
117,573
TOTAL POPULATION
56,878
MALE POPULATION
60,695
FEMALE POPULATION
93.71
MALES / 100 FEMALES
106.71
FEMALES / 100 MALES
36.8
MEDIAN AGE
3.4
AVG FAMILY SIZE
2.7
AVG HOUSEHOLD SIZE
46,744
LABOR FORCE [ PEOPLE ]
51.0%
PERCENT IN LABOR FORCE
6.4%
UNEMPLOYMENT RATE
Robeson County Area Codes
Income in Robeson County
Income Overview in Robeson County
Per Capita Income in Robeson County is $21,998, while median incomes of families and households are $50,612 and $39,393 respectively.
| Characteristic | Number | Measure |
| Per Capita Income | 117,573 | $21,998 |
| Median Family Income | 27,726 | $50,612 |
| Mean Family Income | 27,726 | $69,937 |
| Median Household Income | 42,509 | $39,393 |
| Mean Household Income | 42,509 | $57,841 |
| Income Deficit | 27,726 | $11,869 |
| Wage / Income Gap (%) | 117,573 | 19.19% |
| Wage / Income Gap ($) | 117,573 | 80.81¢ per $1 |
| Gini / Inequality Index | 117,573 | 0.50 |
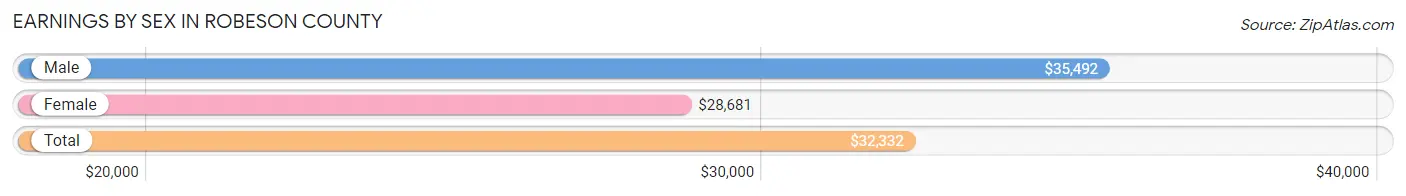
Earnings by Sex in Robeson County
Average Earnings in Robeson County are $32,332, $35,492 for men and $28,681 for women, a difference of 19.2%.
| Sex | Number | Average Earnings |
| Male | 23,937 (50.5%) | $35,492 |
| Female | 23,501 (49.5%) | $28,681 |
| Total | 47,438 (100.0%) | $32,332 |
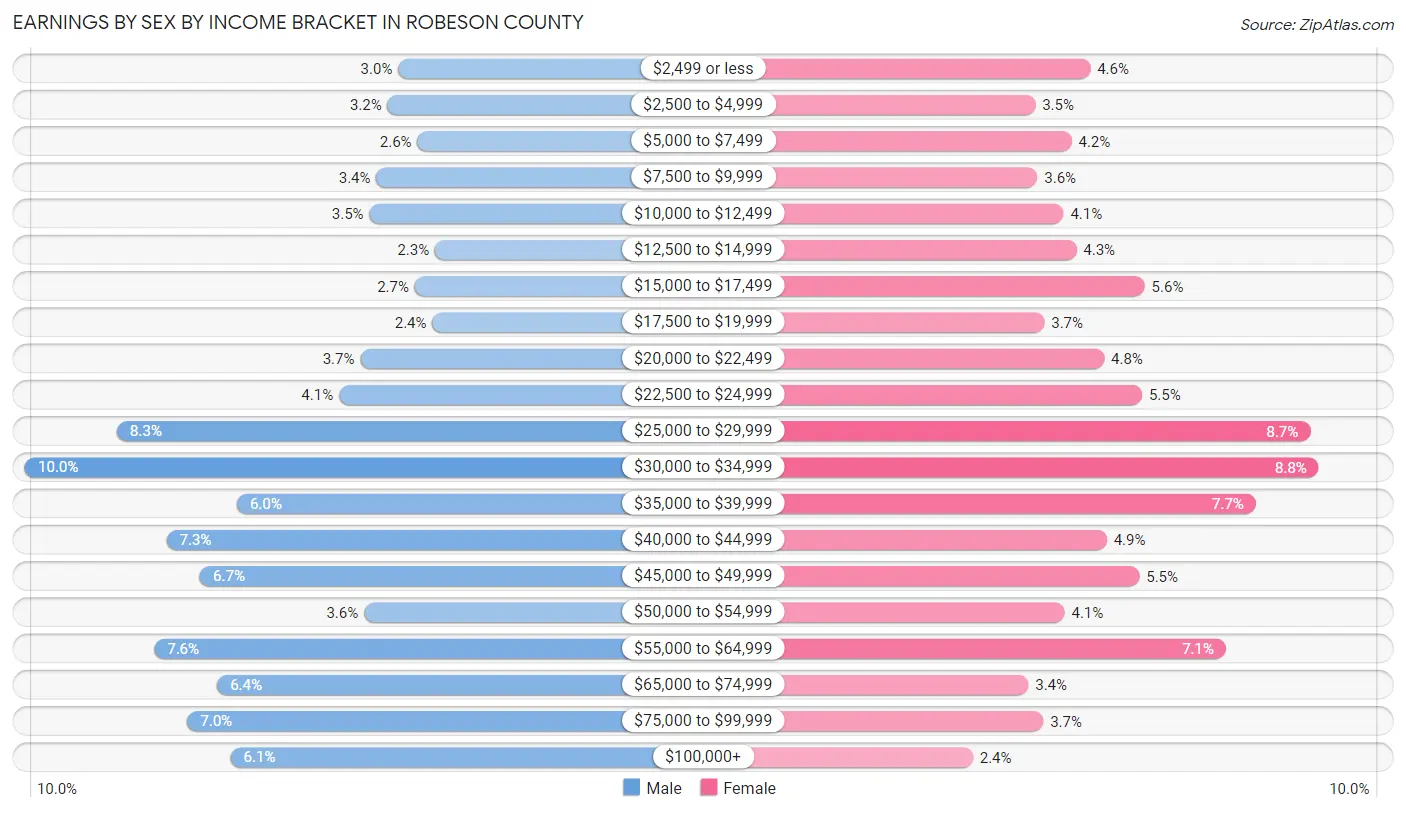
Earnings by Sex by Income Bracket in Robeson County
The most common earnings brackets in Robeson County are $30,000 to $34,999 for men (2,392 | 10.0%) and $30,000 to $34,999 for women (2,077 | 8.8%).
| Income | Male | Female |
| $2,499 or less | 718 (3.0%) | 1,072 (4.6%) |
| $2,500 to $4,999 | 766 (3.2%) | 829 (3.5%) |
| $5,000 to $7,499 | 632 (2.6%) | 989 (4.2%) |
| $7,500 to $9,999 | 817 (3.4%) | 838 (3.6%) |
| $10,000 to $12,499 | 848 (3.5%) | 953 (4.1%) |
| $12,500 to $14,999 | 552 (2.3%) | 1,011 (4.3%) |
| $15,000 to $17,499 | 644 (2.7%) | 1,312 (5.6%) |
| $17,500 to $19,999 | 565 (2.4%) | 870 (3.7%) |
| $20,000 to $22,499 | 887 (3.7%) | 1,133 (4.8%) |
| $22,500 to $24,999 | 983 (4.1%) | 1,300 (5.5%) |
| $25,000 to $29,999 | 1,980 (8.3%) | 2,040 (8.7%) |
| $30,000 to $34,999 | 2,392 (10.0%) | 2,077 (8.8%) |
| $35,000 to $39,999 | 1,442 (6.0%) | 1,800 (7.7%) |
| $40,000 to $44,999 | 1,758 (7.3%) | 1,145 (4.9%) |
| $45,000 to $49,999 | 1,605 (6.7%) | 1,287 (5.5%) |
| $50,000 to $54,999 | 872 (3.6%) | 960 (4.1%) |
| $55,000 to $64,999 | 1,813 (7.6%) | 1,668 (7.1%) |
| $65,000 to $74,999 | 1,530 (6.4%) | 799 (3.4%) |
| $75,000 to $99,999 | 1,664 (7.0%) | 864 (3.7%) |
| $100,000+ | 1,469 (6.1%) | 554 (2.4%) |
| Total | 23,937 (100.0%) | 23,501 (100.0%) |
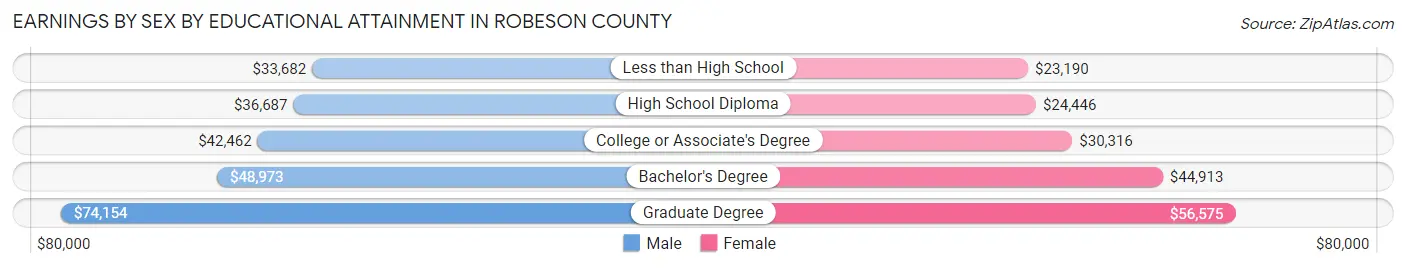
Earnings by Sex by Educational Attainment in Robeson County
Average earnings in Robeson County are $40,066 for men and $31,810 for women, a difference of 20.6%. Men with an educational attainment of graduate degree enjoy the highest average annual earnings of $74,154, while those with less than high school education earn the least with $33,682. Women with an educational attainment of graduate degree earn the most with the average annual earnings of $56,575, while those with less than high school education have the smallest earnings of $23,190.
| Educational Attainment | Male Income | Female Income |
| Less than High School | $33,682 | $23,190 |
| High School Diploma | $36,687 | $24,446 |
| College or Associate's Degree | $42,462 | $30,316 |
| Bachelor's Degree | $48,973 | $44,913 |
| Graduate Degree | $74,154 | $56,575 |
| Total | $40,066 | $31,810 |
Family Income in Robeson County
Family Income Brackets in Robeson County
According to the Robeson County family income data, there are 4,797 families falling into the $50,000 to $74,999 income range, which is the most common income bracket and makes up 17.3% of all families. Conversely, the $200,000+ income bracket is the least frequent group with only 749 families (2.7%) belonging to this category.
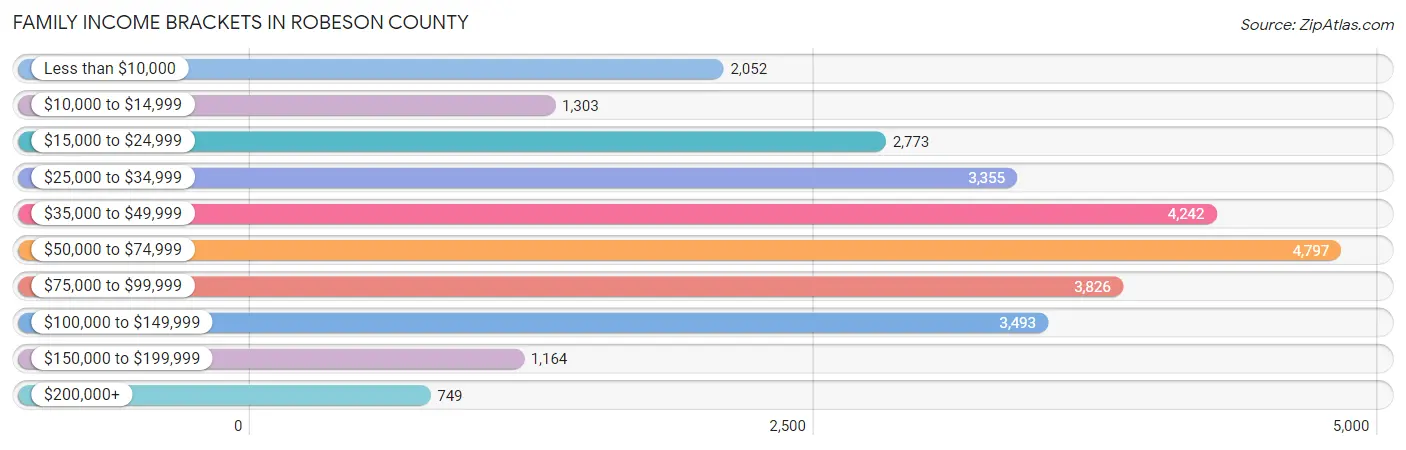
| Income Bracket | # Families | % Families |
| Less than $10,000 | 2,052 | 7.4% |
| $10,000 to $14,999 | 1,303 | 4.7% |
| $15,000 to $24,999 | 2,773 | 10.0% |
| $25,000 to $34,999 | 3,355 | 12.1% |
| $35,000 to $49,999 | 4,242 | 15.3% |
| $50,000 to $74,999 | 4,797 | 17.3% |
| $75,000 to $99,999 | 3,826 | 13.8% |
| $100,000 to $149,999 | 3,493 | 12.6% |
| $150,000 to $199,999 | 1,164 | 4.2% |
| $200,000+ | 749 | 2.7% |
Family Income by Famaliy Size in Robeson County
7+ person families (494 | 1.8%) account for the highest median family income in Robeson County with $66,111 per family, while 2-person families (12,777 | 46.1%) have the highest median income of $23,404 per family member.
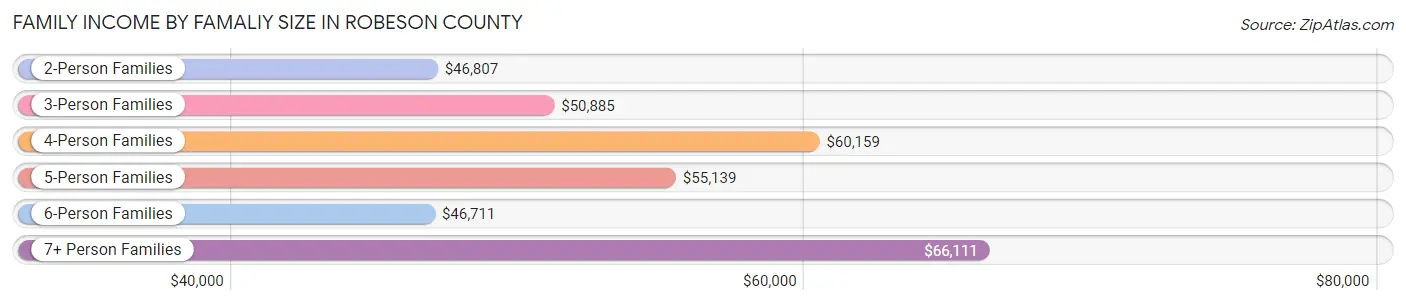
| Income Bracket | # Families | Median Income |
| 2-Person Families | 12,777 (46.1%) | $46,807 |
| 3-Person Families | 6,515 (23.5%) | $50,885 |
| 4-Person Families | 5,099 (18.4%) | $60,159 |
| 5-Person Families | 1,991 (7.2%) | $55,139 |
| 6-Person Families | 850 (3.1%) | $46,711 |
| 7+ Person Families | 494 (1.8%) | $66,111 |
| Total | 27,726 (100.0%) | $50,612 |
Family Income by Number of Earners in Robeson County
The median family income in Robeson County is $50,612, with families comprising 3+ earners (1,848) having the highest median family income of $113,056, while families with no earners (6,383) have the lowest median family income of $25,324, accounting for 6.7% and 23.0% of families, respectively.
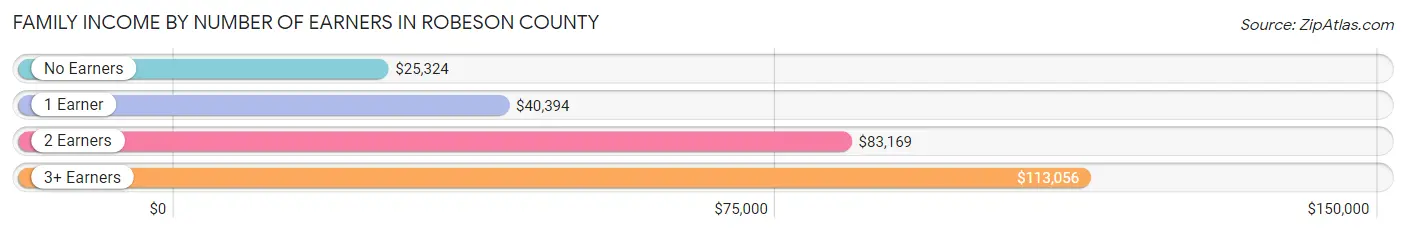
| Number of Earners | # Families | Median Income |
| No Earners | 6,383 (23.0%) | $25,324 |
| 1 Earner | 10,632 (38.4%) | $40,394 |
| 2 Earners | 8,863 (32.0%) | $83,169 |
| 3+ Earners | 1,848 (6.7%) | $113,056 |
| Total | 27,726 (100.0%) | $50,612 |
Household Income in Robeson County
Household Income Brackets in Robeson County
With 6,674 households falling in the category, the $50,000 to $74,999 income range is the most frequent in Robeson County, accounting for 15.7% of all households. In contrast, only 850 households (2.0%) fall into the $200,000+ income bracket, making it the least populous group.
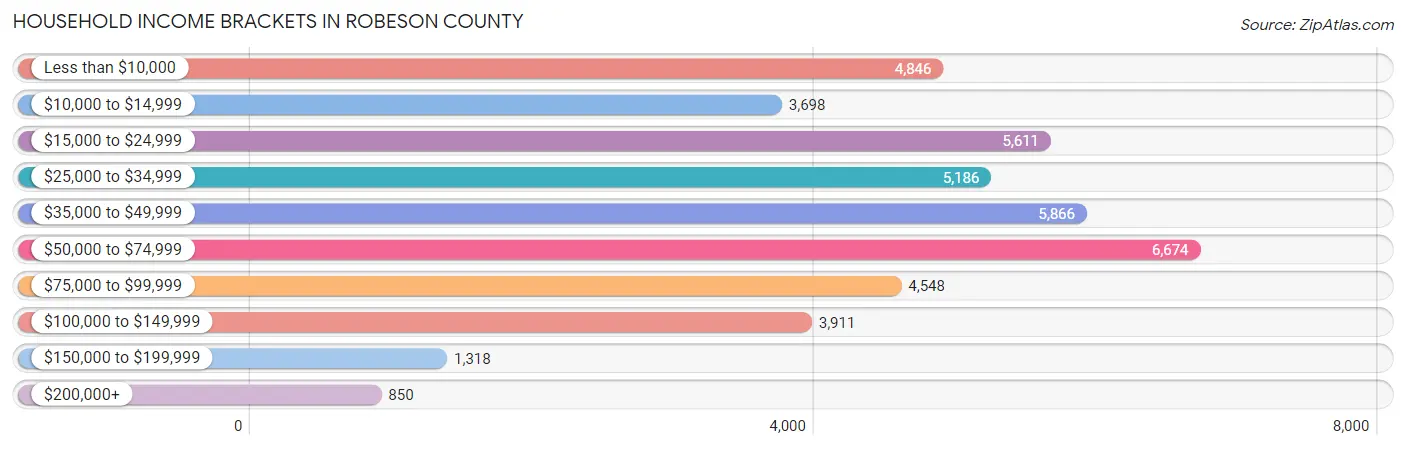
| Income Bracket | # Households | % Households |
| Less than $10,000 | 4,846 | 11.4% |
| $10,000 to $14,999 | 3,698 | 8.7% |
| $15,000 to $24,999 | 5,611 | 13.2% |
| $25,000 to $34,999 | 5,186 | 12.2% |
| $35,000 to $49,999 | 5,866 | 13.8% |
| $50,000 to $74,999 | 6,674 | 15.7% |
| $75,000 to $99,999 | 4,548 | 10.7% |
| $100,000 to $149,999 | 3,911 | 9.2% |
| $150,000 to $199,999 | 1,318 | 3.1% |
| $200,000+ | 850 | 2.0% |
Household Income by Householder Age in Robeson County
The median household income in Robeson County is $39,393, with the highest median household income of $47,884 found in the 45 to 64 years age bracket for the primary householder. A total of 16,343 households (38.5%) fall into this category. Meanwhile, the 15 to 24 years age bracket for the primary householder has the lowest median household income of $23,866, with 1,572 households (3.7%) in this group.
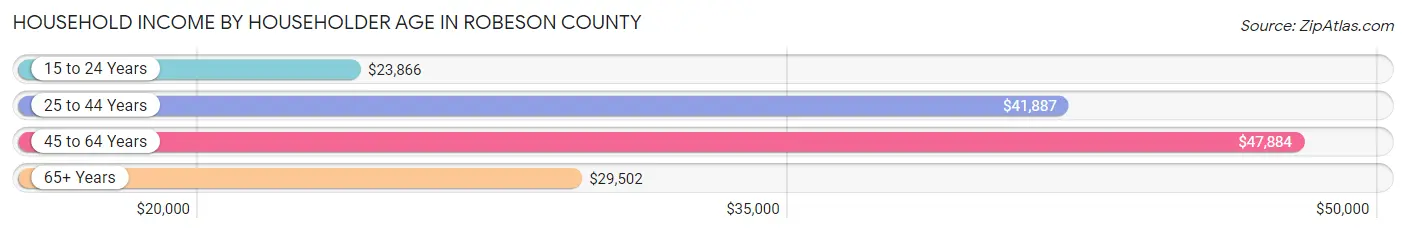
| Income Bracket | # Households | Median Income |
| 15 to 24 Years | 1,572 (3.7%) | $23,866 |
| 25 to 44 Years | 12,699 (29.9%) | $41,887 |
| 45 to 64 Years | 16,343 (38.5%) | $47,884 |
| 65+ Years | 11,895 (28.0%) | $29,502 |
| Total | 42,509 (100.0%) | $39,393 |
Poverty in Robeson County
Income Below Poverty by Sex and Age in Robeson County
With 25.0% poverty level for males and 29.1% for females among the residents of Robeson County, 15 year old males and under 5 year old females are the most vulnerable to poverty, with 389 males (48.7%) and 1,534 females (41.0%) in their respective age groups living below the poverty level.
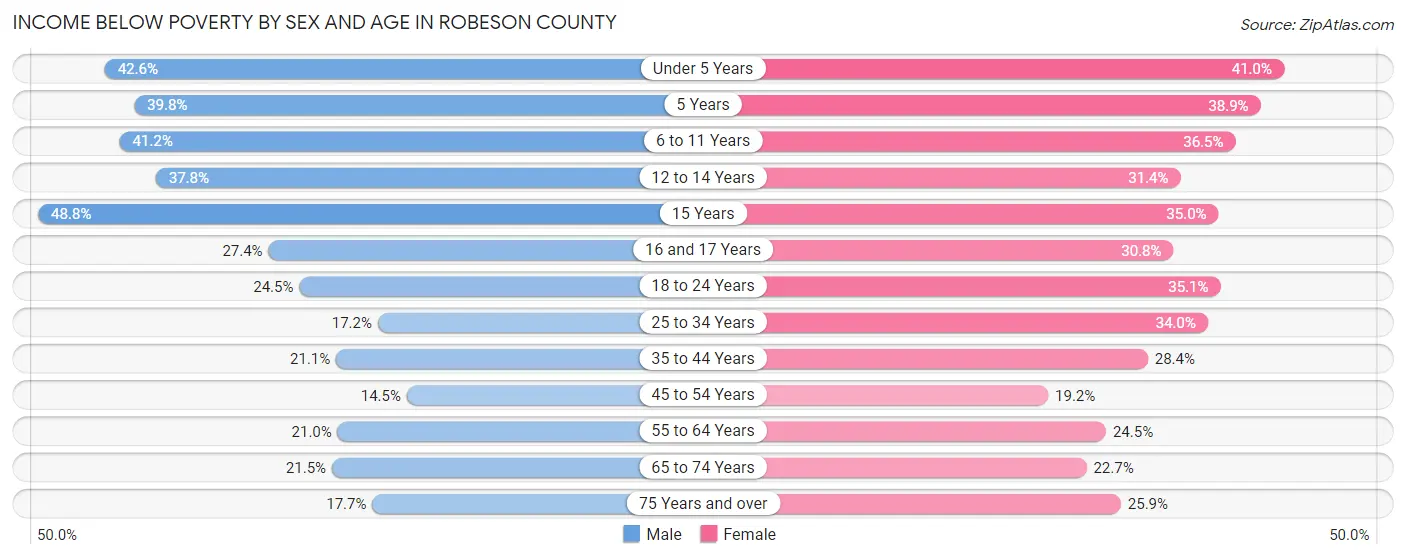
| Age Bracket | Male | Female |
| Under 5 Years | 1,682 (42.6%) | 1,534 (41.0%) |
| 5 Years | 323 (39.8%) | 249 (38.9%) |
| 6 to 11 Years | 2,004 (41.2%) | 1,627 (36.5%) |
| 12 to 14 Years | 977 (37.8%) | 937 (31.4%) |
| 15 Years | 389 (48.7%) | 296 (34.9%) |
| 16 and 17 Years | 479 (27.4%) | 496 (30.8%) |
| 18 to 24 Years | 1,329 (24.5%) | 1,840 (35.1%) |
| 25 to 34 Years | 1,206 (17.2%) | 2,522 (34.0%) |
| 35 to 44 Years | 1,282 (21.1%) | 2,014 (28.4%) |
| 45 to 54 Years | 1,002 (14.5%) | 1,413 (19.2%) |
| 55 to 64 Years | 1,444 (20.9%) | 1,895 (24.5%) |
| 65 to 74 Years | 1,101 (21.5%) | 1,399 (22.7%) |
| 75 Years and over | 471 (17.7%) | 1,012 (25.9%) |
| Total | 13,689 (25.0%) | 17,234 (29.1%) |
Income Above Poverty by Sex and Age in Robeson County
According to the poverty statistics in Robeson County, males aged 45 to 54 years and females aged 45 to 54 years are the age groups that are most secure financially, with 85.5% of males and 80.8% of females in these age groups living above the poverty line.
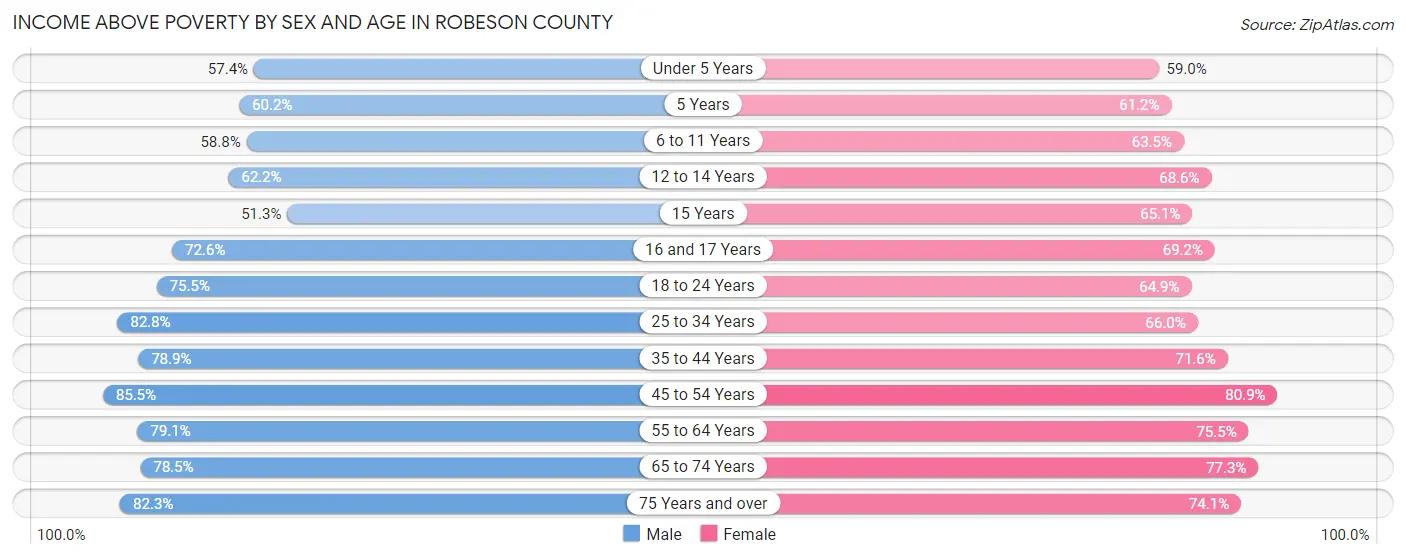
| Age Bracket | Male | Female |
| Under 5 Years | 2,270 (57.4%) | 2,206 (59.0%) |
| 5 Years | 488 (60.2%) | 392 (61.2%) |
| 6 to 11 Years | 2,861 (58.8%) | 2,828 (63.5%) |
| 12 to 14 Years | 1,606 (62.2%) | 2,046 (68.6%) |
| 15 Years | 409 (51.2%) | 551 (65.0%) |
| 16 and 17 Years | 1,271 (72.6%) | 1,116 (69.2%) |
| 18 to 24 Years | 4,093 (75.5%) | 3,398 (64.9%) |
| 25 to 34 Years | 5,797 (82.8%) | 4,905 (66.0%) |
| 35 to 44 Years | 4,797 (78.9%) | 5,078 (71.6%) |
| 45 to 54 Years | 5,894 (85.5%) | 5,965 (80.8%) |
| 55 to 64 Years | 5,447 (79.0%) | 5,832 (75.5%) |
| 65 to 74 Years | 4,025 (78.5%) | 4,762 (77.3%) |
| 75 Years and over | 2,186 (82.3%) | 2,896 (74.1%) |
| Total | 41,144 (75.0%) | 41,975 (70.9%) |
Income Below Poverty Among Married-Couple Families in Robeson County
The poverty statistics for married-couple families in Robeson County show that 10.4% or 1,690 of the total 16,222 families live below the poverty line. Families with 5 or more children have the highest poverty rate of 42.4%, comprising of 64 families. On the other hand, families with no children have the lowest poverty rate of 8.1%, which includes 803 families.
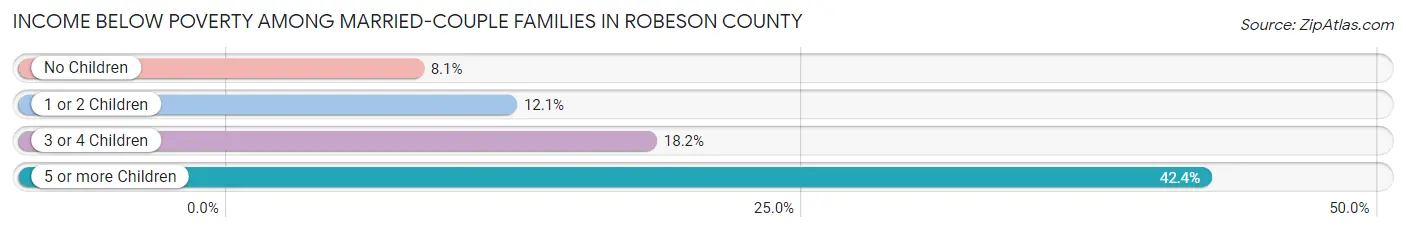
| Children | Above Poverty | Below Poverty |
| No Children | 9,139 (91.9%) | 803 (8.1%) |
| 1 or 2 Children | 4,243 (87.9%) | 586 (12.1%) |
| 3 or 4 Children | 1,063 (81.8%) | 237 (18.2%) |
| 5 or more Children | 87 (57.6%) | 64 (42.4%) |
| Total | 14,532 (89.6%) | 1,690 (10.4%) |
Income Below Poverty Among Single-Parent Households in Robeson County
According to the poverty data in Robeson County, 25.2% or 718 single-father households and 38.3% or 3,309 single-mother households are living below the poverty line. Among single-father households, those with 5 or more children have the highest poverty rate, with 15 households (100.0%) experiencing poverty. Likewise, among single-mother households, those with 5 or more children have the highest poverty rate, with 211 households (96.4%) falling below the poverty line.
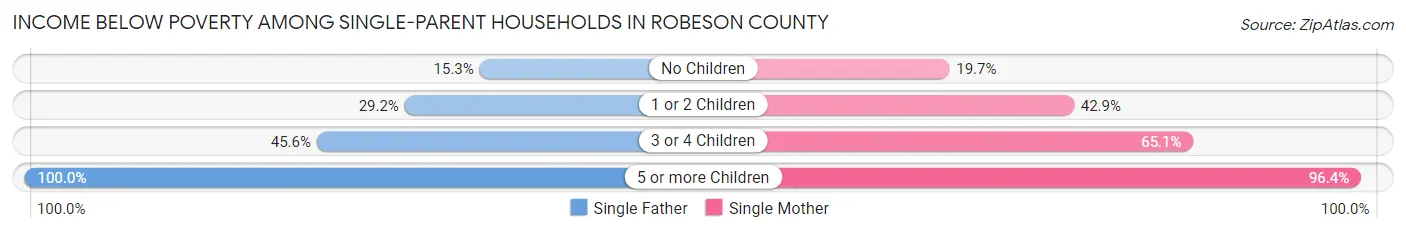
| Children | Single Father | Single Mother |
| No Children | 190 (15.2%) | 632 (19.7%) |
| 1 or 2 Children | 379 (29.2%) | 1,798 (42.9%) |
| 3 or 4 Children | 134 (45.6%) | 668 (65.1%) |
| 5 or more Children | 15 (100.0%) | 211 (96.4%) |
| Total | 718 (25.2%) | 3,309 (38.3%) |
Income Below Poverty Among Married-Couple vs Single-Parent Households in Robeson County
The poverty data for Robeson County shows that 1,690 of the married-couple family households (10.4%) and 4,027 of the single-parent households (35.0%) are living below the poverty level. Within the married-couple family households, those with 5 or more children have the highest poverty rate, with 64 households (42.4%) falling below the poverty line. Among the single-parent households, those with 5 or more children have the highest poverty rate, with 226 household (96.6%) living below poverty.
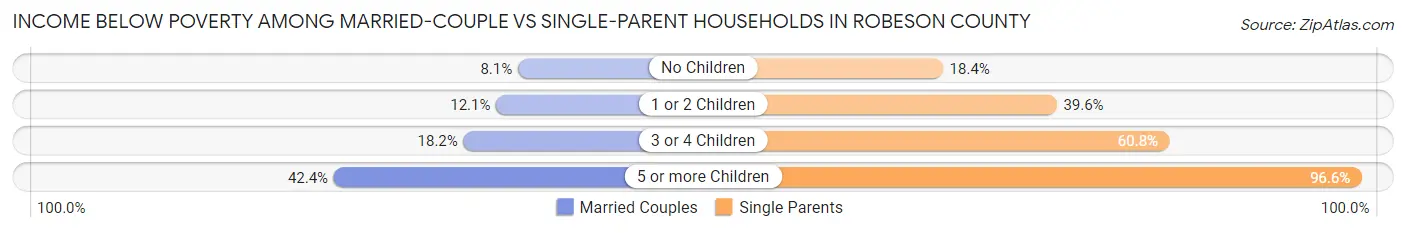
| Children | Married-Couple Families | Single-Parent Households |
| No Children | 803 (8.1%) | 822 (18.4%) |
| 1 or 2 Children | 586 (12.1%) | 2,177 (39.6%) |
| 3 or 4 Children | 237 (18.2%) | 802 (60.8%) |
| 5 or more Children | 64 (42.4%) | 226 (96.6%) |
| Total | 1,690 (10.4%) | 4,027 (35.0%) |
Race in Robeson County
The most populous races in Robeson County are Native / Alaskan (47,225 | 40.2%), White / Caucasian (30,143 | 25.6%), and Black / African American (27,784 | 23.6%).
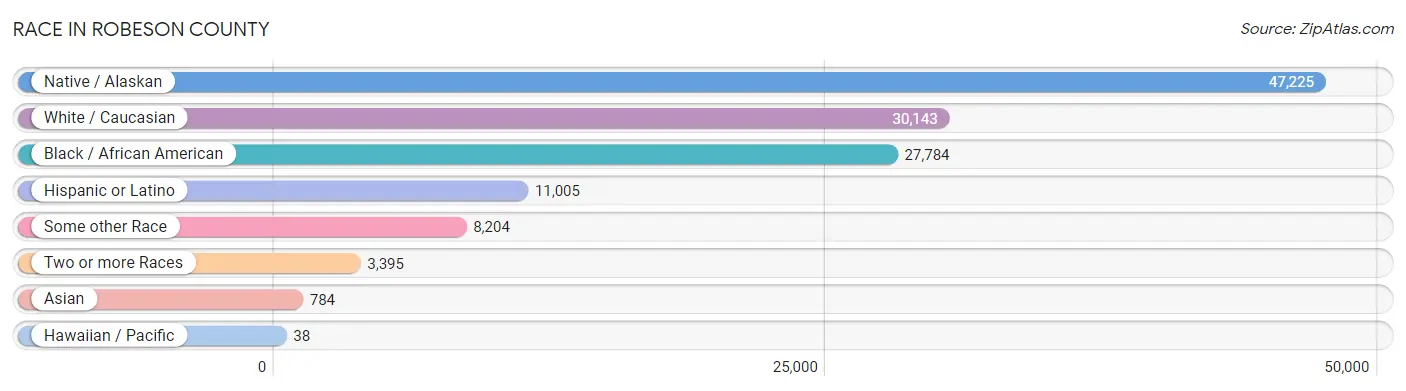
| Race | # Population | % Population |
| Asian | 784 | 0.7% |
| Black / African American | 27,784 | 23.6% |
| Hawaiian / Pacific | 38 | 0.0% |
| Hispanic or Latino | 11,005 | 9.4% |
| Native / Alaskan | 47,225 | 40.2% |
| White / Caucasian | 30,143 | 25.6% |
| Two or more Races | 3,395 | 2.9% |
| Some other Race | 8,204 | 7.0% |
| Total | 117,573 | 100.0% |
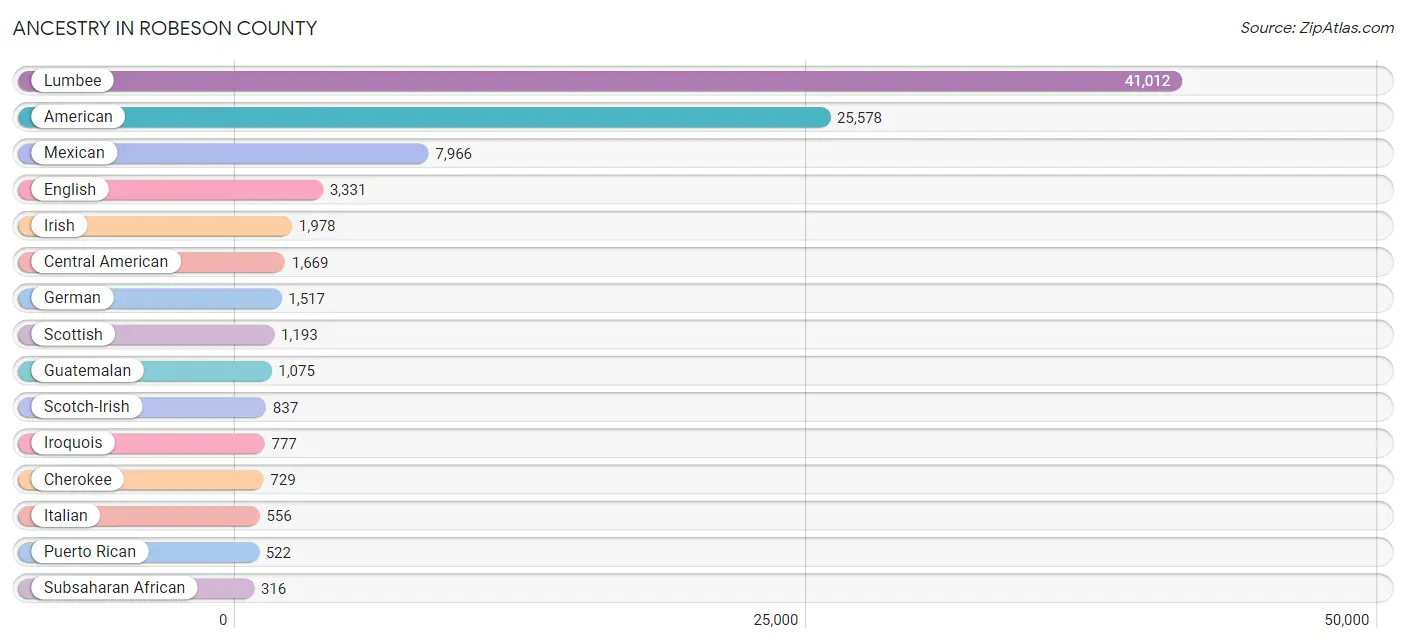
Ancestry in Robeson County
The most populous ancestries reported in Robeson County are Lumbee (41,012 | 34.9%), American (25,578 | 21.7%), Mexican (7,966 | 6.8%), English (3,331 | 2.8%), and Irish (1,978 | 1.7%), together accounting for 67.9% of all Robeson County residents.
| Ancestry | # Population | % Population |
| African | 239 | 0.2% |
| Albanian | 1 | 0.0% |
| American | 25,578 | 21.7% |
| Apache | 35 | 0.0% |
| Arab | 77 | 0.1% |
| Armenian | 19 | 0.0% |
| Austrian | 8 | 0.0% |
| Bangladeshi | 74 | 0.1% |
| Bhutanese | 97 | 0.1% |
| Blackfeet | 124 | 0.1% |
| British | 198 | 0.2% |
| Burmese | 73 | 0.1% |
| Cajun | 15 | 0.0% |
| Canadian | 21 | 0.0% |
| Central American | 1,669 | 1.4% |
| Cherokee | 729 | 0.6% |
| Chippewa | 9 | 0.0% |
| Choctaw | 14 | 0.0% |
| Colombian | 2 | 0.0% |
| Creek | 10 | 0.0% |
| Cuban | 118 | 0.1% |
| Czechoslovakian | 45 | 0.0% |
| Danish | 15 | 0.0% |
| Dominican | 13 | 0.0% |
| Dutch | 37 | 0.0% |
| Eastern European | 29 | 0.0% |
| Ecuadorian | 4 | 0.0% |
| Egyptian | 4 | 0.0% |
| English | 3,331 | 2.8% |
| Ethiopian | 9 | 0.0% |
| European | 310 | 0.3% |
| Finnish | 3 | 0.0% |
| French | 312 | 0.3% |
| French Canadian | 54 | 0.1% |
| German | 1,517 | 1.3% |
| Ghanaian | 23 | 0.0% |
| Greek | 4 | 0.0% |
| Guatemalan | 1,075 | 0.9% |
| Haitian | 87 | 0.1% |
| Honduran | 219 | 0.2% |
| Hungarian | 47 | 0.0% |
| Indian (Asian) | 167 | 0.1% |
| Iranian | 52 | 0.0% |
| Irish | 1,978 | 1.7% |
| Iroquois | 777 | 0.7% |
| Israeli | 6 | 0.0% |
| Italian | 556 | 0.5% |
| Jamaican | 77 | 0.1% |
| Korean | 185 | 0.2% |
| Latvian | 5 | 0.0% |
| Lebanese | 38 | 0.0% |
| Lithuanian | 20 | 0.0% |
| Lumbee | 41,012 | 34.9% |
| Mexican | 7,966 | 6.8% |
| Mexican American Indian | 139 | 0.1% |
| Native Hawaiian | 81 | 0.1% |
| Navajo | 43 | 0.0% |
| Nicaraguan | 9 | 0.0% |
| Nigerian | 34 | 0.0% |
| Norwegian | 194 | 0.2% |
| Palestinian | 3 | 0.0% |
| Panamanian | 132 | 0.1% |
| Peruvian | 12 | 0.0% |
| Polish | 185 | 0.2% |
| Portuguese | 19 | 0.0% |
| Puerto Rican | 522 | 0.4% |
| Russian | 52 | 0.0% |
| Salvadoran | 234 | 0.2% |
| Samoan | 39 | 0.0% |
| Scandinavian | 107 | 0.1% |
| Scotch-Irish | 837 | 0.7% |
| Scottish | 1,193 | 1.0% |
| Sioux | 95 | 0.1% |
| South American | 18 | 0.0% |
| Spaniard | 114 | 0.1% |
| Spanish | 80 | 0.1% |
| Sri Lankan | 216 | 0.2% |
| Subsaharan African | 316 | 0.3% |
| Sudanese | 10 | 0.0% |
| Swedish | 35 | 0.0% |
| Swiss | 18 | 0.0% |
| Syrian | 12 | 0.0% |
| Thai | 183 | 0.2% |
| Ukrainian | 69 | 0.1% |
| Welsh | 99 | 0.1% | View All 85 Rows |
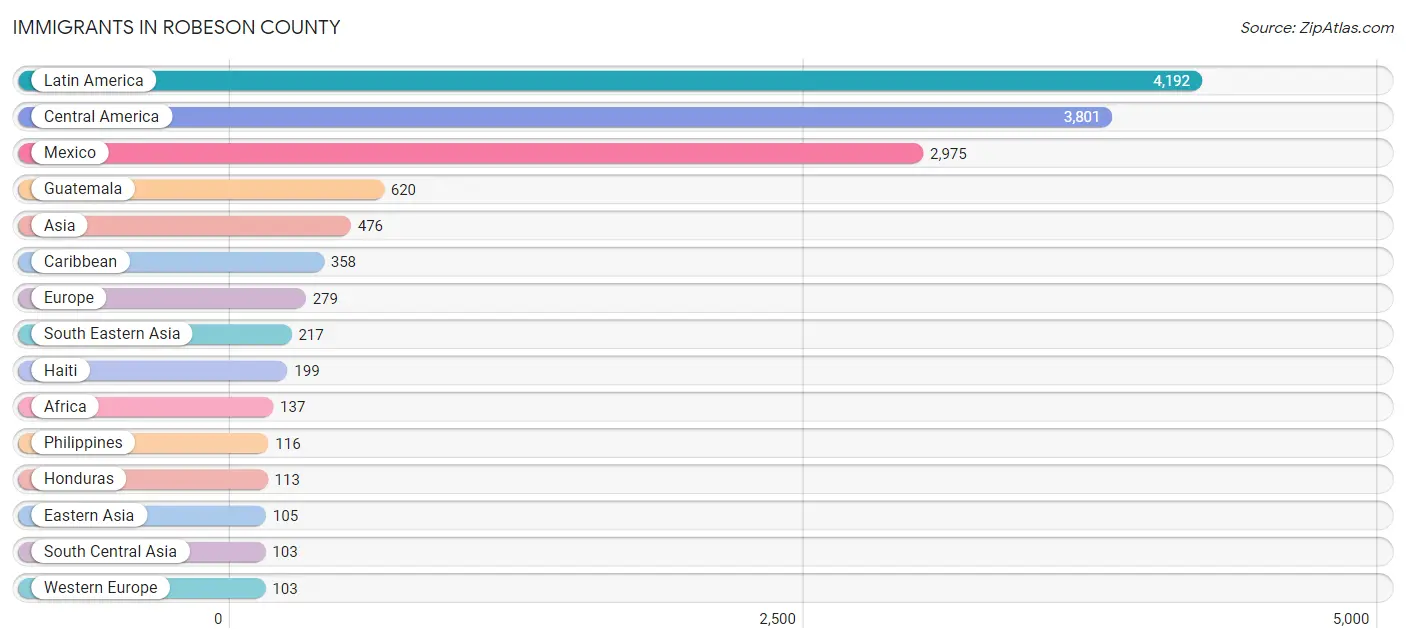
Immigrants in Robeson County
The most numerous immigrant groups reported in Robeson County came from Latin America (4,192 | 3.6%), Central America (3,801 | 3.2%), Mexico (2,975 | 2.5%), Guatemala (620 | 0.5%), and Asia (476 | 0.4%), together accounting for 10.3% of all Robeson County residents.
| Immigration Origin | # Population | % Population |
| Africa | 137 | 0.1% |
| Asia | 476 | 0.4% |
| Brazil | 15 | 0.0% |
| Canada | 32 | 0.0% |
| Caribbean | 358 | 0.3% |
| Central America | 3,801 | 3.2% |
| China | 100 | 0.1% |
| Cuba | 100 | 0.1% |
| Denmark | 1 | 0.0% |
| Dominican Republic | 11 | 0.0% |
| Eastern Africa | 26 | 0.0% |
| Eastern Asia | 105 | 0.1% |
| Eastern Europe | 28 | 0.0% |
| Ecuador | 4 | 0.0% |
| Egypt | 15 | 0.0% |
| El Salvador | 66 | 0.1% |
| England | 56 | 0.1% |
| Ethiopia | 9 | 0.0% |
| Europe | 279 | 0.2% |
| France | 7 | 0.0% |
| Germany | 96 | 0.1% |
| Guatemala | 620 | 0.5% |
| Haiti | 199 | 0.2% |
| Honduras | 113 | 0.1% |
| India | 95 | 0.1% |
| Indonesia | 3 | 0.0% |
| Iran | 8 | 0.0% |
| Ireland | 6 | 0.0% |
| Israel | 7 | 0.0% |
| Italy | 4 | 0.0% |
| Jamaica | 29 | 0.0% |
| Japan | 1 | 0.0% |
| Kenya | 7 | 0.0% |
| Korea | 4 | 0.0% |
| Kuwait | 5 | 0.0% |
| Laos | 5 | 0.0% |
| Latin America | 4,192 | 3.6% |
| Malaysia | 5 | 0.0% |
| Mexico | 2,975 | 2.5% |
| Nicaragua | 1 | 0.0% |
| Nigeria | 65 | 0.1% |
| Northern Africa | 15 | 0.0% |
| Northern Europe | 63 | 0.1% |
| Oceania | 22 | 0.0% |
| Panama | 26 | 0.0% |
| Philippines | 116 | 0.1% |
| Russia | 21 | 0.0% |
| Senegal | 27 | 0.0% |
| South America | 33 | 0.0% |
| South Central Asia | 103 | 0.1% |
| South Eastern Asia | 217 | 0.2% |
| Southern Europe | 82 | 0.1% |
| Spain | 36 | 0.0% |
| Thailand | 11 | 0.0% |
| Trinidad and Tobago | 19 | 0.0% |
| Ukraine | 7 | 0.0% |
| Venezuela | 14 | 0.0% |
| Vietnam | 77 | 0.1% |
| Western Africa | 92 | 0.1% |
| Western Asia | 48 | 0.0% |
| Western Europe | 103 | 0.1% |
| Yemen | 36 | 0.0% | View All 62 Rows |
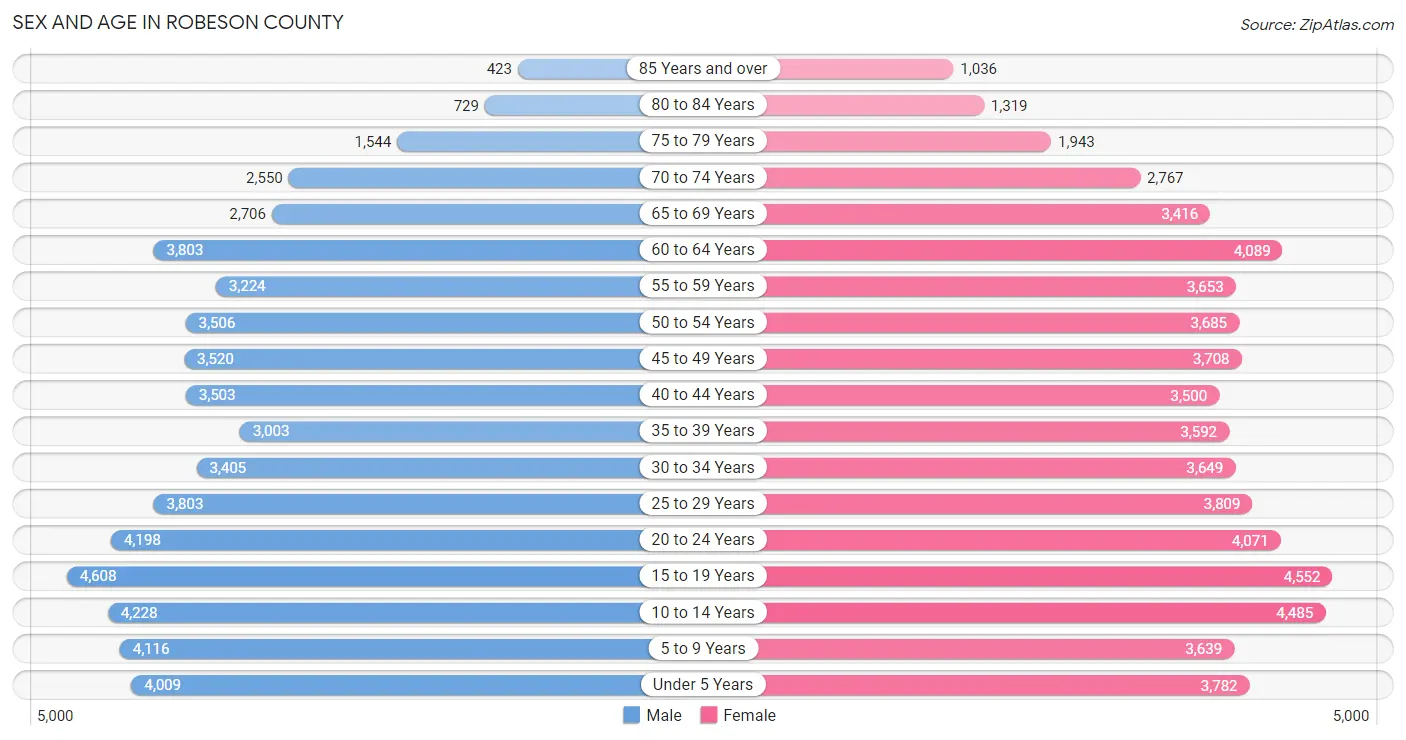
Sex and Age in Robeson County
Sex and Age in Robeson County
The most populous age groups in Robeson County are 15 to 19 Years (4,608 | 8.1%) for men and 15 to 19 Years (4,552 | 7.5%) for women.
| Age Bracket | Male | Female |
| Under 5 Years | 4,009 (7.0%) | 3,782 (6.2%) |
| 5 to 9 Years | 4,116 (7.2%) | 3,639 (6.0%) |
| 10 to 14 Years | 4,228 (7.4%) | 4,485 (7.4%) |
| 15 to 19 Years | 4,608 (8.1%) | 4,552 (7.5%) |
| 20 to 24 Years | 4,198 (7.4%) | 4,071 (6.7%) |
| 25 to 29 Years | 3,803 (6.7%) | 3,809 (6.3%) |
| 30 to 34 Years | 3,405 (6.0%) | 3,649 (6.0%) |
| 35 to 39 Years | 3,003 (5.3%) | 3,592 (5.9%) |
| 40 to 44 Years | 3,503 (6.2%) | 3,500 (5.8%) |
| 45 to 49 Years | 3,520 (6.2%) | 3,708 (6.1%) |
| 50 to 54 Years | 3,506 (6.2%) | 3,685 (6.1%) |
| 55 to 59 Years | 3,224 (5.7%) | 3,653 (6.0%) |
| 60 to 64 Years | 3,803 (6.7%) | 4,089 (6.7%) |
| 65 to 69 Years | 2,706 (4.8%) | 3,416 (5.6%) |
| 70 to 74 Years | 2,550 (4.5%) | 2,767 (4.6%) |
| 75 to 79 Years | 1,544 (2.7%) | 1,943 (3.2%) |
| 80 to 84 Years | 729 (1.3%) | 1,319 (2.2%) |
| 85 Years and over | 423 (0.7%) | 1,036 (1.7%) |
| Total | 56,878 (100.0%) | 60,695 (100.0%) |
Families and Households in Robeson County
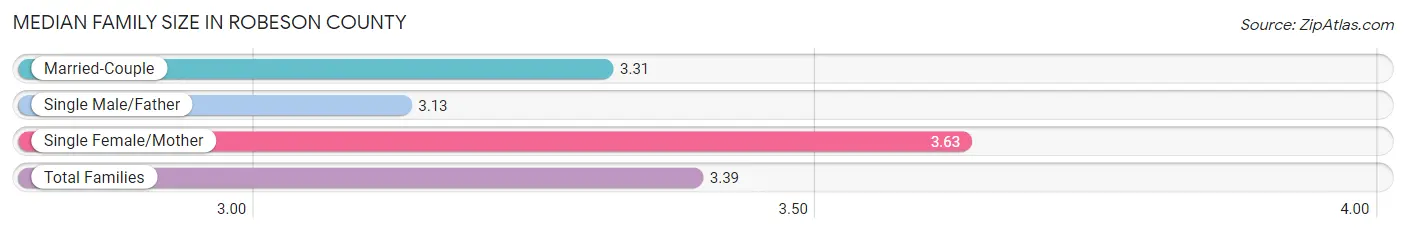
Median Family Size in Robeson County
The median family size in Robeson County is 3.39 persons per family, with single female/mother families (8,651 | 31.2%) accounting for the largest median family size of 3.63 persons per family. On the other hand, single male/father families (2,853 | 10.3%) represent the smallest median family size with 3.13 persons per family.
| Family Type | # Families | Family Size |
| Married-Couple | 16,222 (58.5%) | 3.31 |
| Single Male/Father | 2,853 (10.3%) | 3.13 |
| Single Female/Mother | 8,651 (31.2%) | 3.63 |
| Total Families | 27,726 (100.0%) | 3.39 |
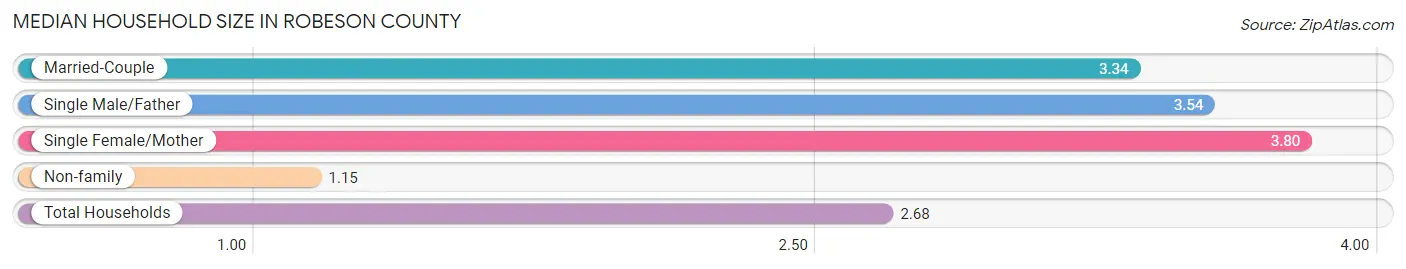
Median Household Size in Robeson County
The median household size in Robeson County is 2.68 persons per household, with single female/mother households (8,651 | 20.3%) accounting for the largest median household size of 3.8 persons per household. non-family households (14,783 | 34.8%) represent the smallest median household size with 1.15 persons per household.
| Household Type | # Households | Household Size |
| Married-Couple | 16,222 (38.2%) | 3.34 |
| Single Male/Father | 2,853 (6.7%) | 3.54 |
| Single Female/Mother | 8,651 (20.3%) | 3.80 |
| Non-family | 14,783 (34.8%) | 1.15 |
| Total Households | 42,509 (100.0%) | 2.68 |
Household Size by Marriage Status in Robeson County
Out of a total of 42,509 households in Robeson County, 27,726 (65.2%) are family households, while 14,783 (34.8%) are nonfamily households. The most numerous type of family households are 2-person households, comprising 11,766, and the most common type of nonfamily households are 1-person households, comprising 13,099.
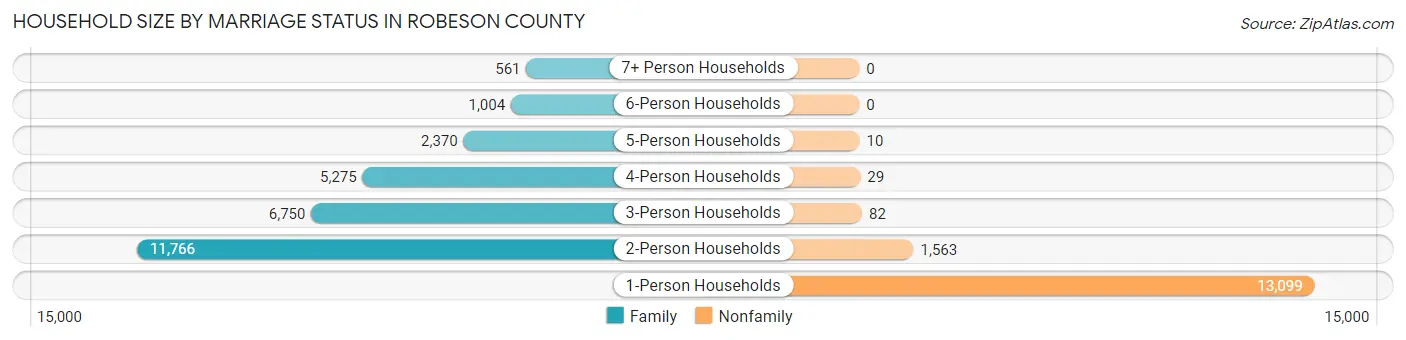
| Household Size | Family Households | Nonfamily Households |
| 1-Person Households | - | 13,099 (30.8%) |
| 2-Person Households | 11,766 (27.7%) | 1,563 (3.7%) |
| 3-Person Households | 6,750 (15.9%) | 82 (0.2%) |
| 4-Person Households | 5,275 (12.4%) | 29 (0.1%) |
| 5-Person Households | 2,370 (5.6%) | 10 (0.0%) |
| 6-Person Households | 1,004 (2.4%) | 0 (0.0%) |
| 7+ Person Households | 561 (1.3%) | 0 (0.0%) |
| Total | 27,726 (65.2%) | 14,783 (34.8%) |
Female Fertility in Robeson County
Fertility by Age in Robeson County
Average fertility rate in Robeson County is 44.0 births per 1,000 women. Women in the age bracket of 20 to 34 years have the highest fertility rate with 83.0 births per 1,000 women. Women in the age bracket of 20 to 34 years acount for 79.1% of all women with births.
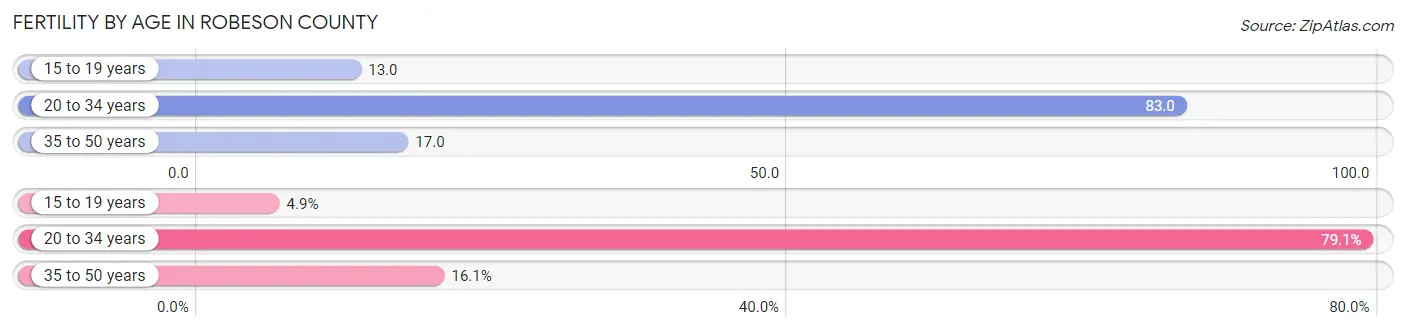
| Age Bracket | Women with Births | Births / 1,000 Women |
| 15 to 19 years | 59 (4.9%) | 13.0 |
| 20 to 34 years | 961 (79.1%) | 83.0 |
| 35 to 50 years | 195 (16.1%) | 17.0 |
| Total | 1,215 (100.0%) | 44.0 |
Fertility by Age by Marriage Status in Robeson County
44.3% of women with births (1,215) in Robeson County are married. The highest percentage of unmarried women with births falls into 15 to 19 years age bracket with 100.0% of them unmarried at the time of birth, while the lowest percentage of unmarried women with births belong to 35 to 50 years age bracket with 34.4% of them unmarried.
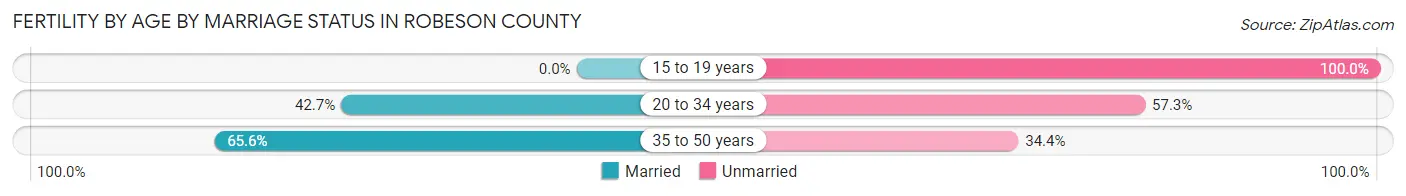
| Age Bracket | Married | Unmarried |
| 15 to 19 years | 0 (0.0%) | 59 (100.0%) |
| 20 to 34 years | 410 (42.7%) | 551 (57.3%) |
| 35 to 50 years | 128 (65.6%) | 67 (34.4%) |
| Total | 538 (44.3%) | 677 (55.7%) |
Fertility by Education in Robeson County
Average fertility rate in Robeson County is 44.0 births per 1,000 women. Women with the education attainment of graduate degree have the highest fertility rate of 54.0 births per 1,000 women, while women with the education attainment of bachelor's degree have the lowest fertility at 28.0 births per 1,000 women. Women with the education attainment of college or associate's degree represent 42.7% of all women with births.
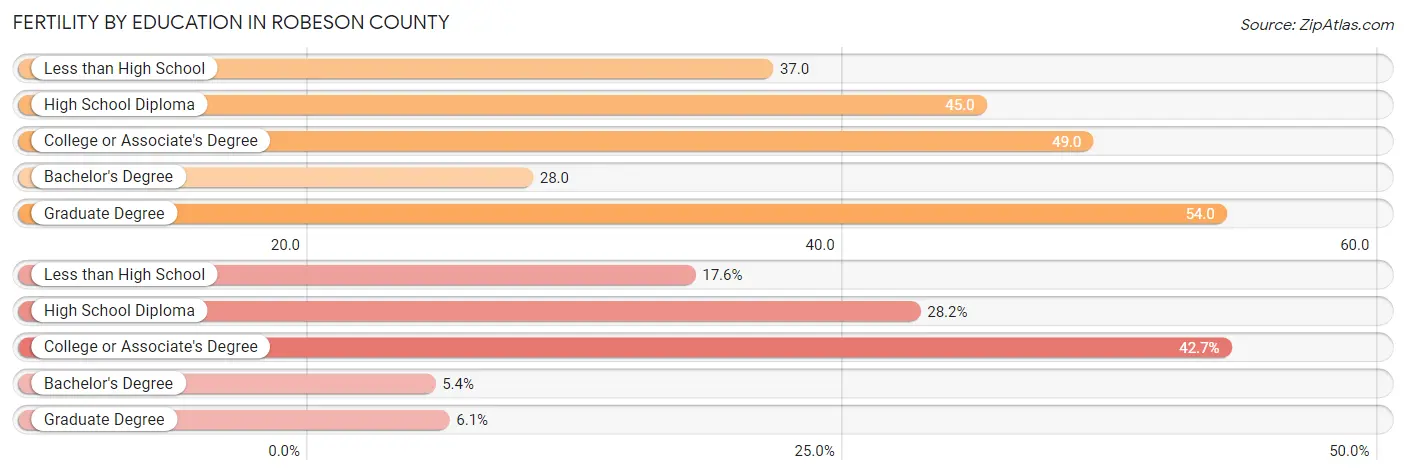
| Educational Attainment | Women with Births | Births / 1,000 Women |
| Less than High School | 214 (17.6%) | 37.0 |
| High School Diploma | 342 (28.1%) | 45.0 |
| College or Associate's Degree | 519 (42.7%) | 49.0 |
| Bachelor's Degree | 66 (5.4%) | 28.0 |
| Graduate Degree | 74 (6.1%) | 54.0 |
| Total | 1,215 (100.0%) | 44.0 |
Fertility by Education by Marriage Status in Robeson County
55.7% of women with births in Robeson County are unmarried. Women with the educational attainment of bachelor's degree are most likely to be married with 100.0% of them married at childbirth, while women with the educational attainment of college or associate's degree are least likely to be married with 67.4% of them unmarried at childbirth.
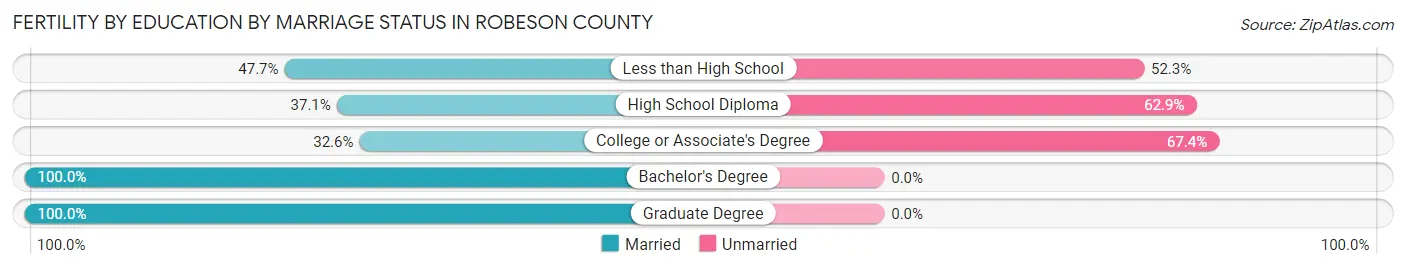
| Educational Attainment | Married | Unmarried |
| Less than High School | 102 (47.7%) | 112 (52.3%) |
| High School Diploma | 127 (37.1%) | 215 (62.9%) |
| College or Associate's Degree | 169 (32.6%) | 350 (67.4%) |
| Bachelor's Degree | 66 (100.0%) | 0 (0.0%) |
| Graduate Degree | 74 (100.0%) | 0 (0.0%) |
| Total | 538 (44.3%) | 677 (55.7%) |
Employment Characteristics in Robeson County
Employment by Class of Employer in Robeson County
Among the 43,118 employed individuals in Robeson County, private company employees (31,595 | 73.3%), state government employees (3,338 | 7.7%), and local government employees (2,572 | 6.0%) make up the most common classes of employment.
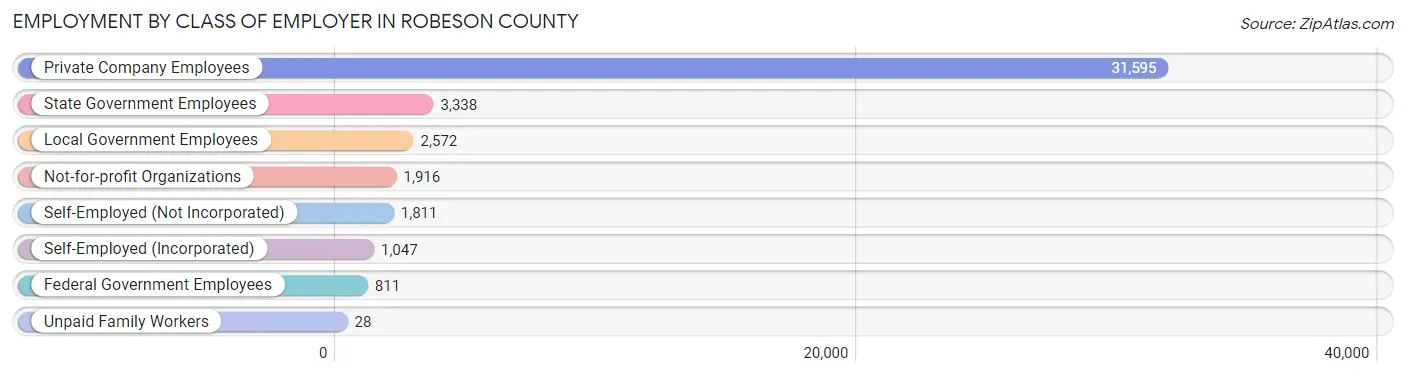
| Employer Class | # Employees | % Employees |
| Private Company Employees | 31,595 | 73.3% |
| Self-Employed (Incorporated) | 1,047 | 2.4% |
| Self-Employed (Not Incorporated) | 1,811 | 4.2% |
| Not-for-profit Organizations | 1,916 | 4.4% |
| Local Government Employees | 2,572 | 6.0% |
| State Government Employees | 3,338 | 7.7% |
| Federal Government Employees | 811 | 1.9% |
| Unpaid Family Workers | 28 | 0.1% |
| Total | 43,118 | 100.0% |
Employment Status by Age in Robeson County
According to the labor force statistics for Robeson County, out of the total population over 16 years of age (91,655), 51.0% or 46,744 individuals are in the labor force, with 6.4% or 2,992 of them unemployed. The age group with the highest labor force participation rate is 25 to 29 years, with 73.6% or 5,602 individuals in the labor force. Within the labor force, the 16 to 19 years age range has the highest percentage of unemployed individuals, with 16.9% or 303 of them being unemployed.
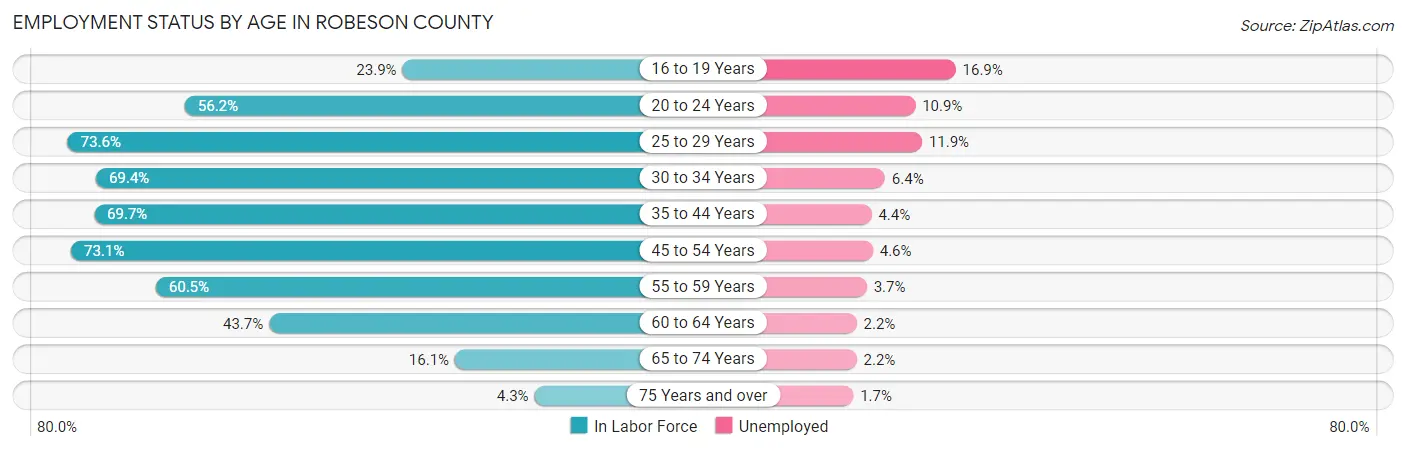
| Age Bracket | In Labor Force | Unemployed |
| 16 to 19 Years | 1,793 (23.9%) | 303 (16.9%) |
| 20 to 24 Years | 4,647 (56.2%) | 507 (10.9%) |
| 25 to 29 Years | 5,602 (73.6%) | 667 (11.9%) |
| 30 to 34 Years | 4,895 (69.4%) | 313 (6.4%) |
| 35 to 44 Years | 9,478 (69.7%) | 417 (4.4%) |
| 45 to 54 Years | 10,540 (73.1%) | 485 (4.6%) |
| 55 to 59 Years | 4,161 (60.5%) | 154 (3.7%) |
| 60 to 64 Years | 3,449 (43.7%) | 76 (2.2%) |
| 65 to 74 Years | 1,842 (16.1%) | 41 (2.2%) |
| 75 Years and over | 301 (4.3%) | 5 (1.7%) |
| Total | 46,744 (51.0%) | 2,992 (6.4%) |
Employment Status by Educational Attainment in Robeson County
According to labor force statistics for Robeson County, 66.3% of individuals (38,091) out of the total population between 25 and 64 years of age (57,452) are in the labor force, with 5.5% or 2,095 of them being unemployed. The group with the highest labor force participation rate are those with the educational attainment of bachelor's degree or higher, with 86.2% or 7,130 individuals in the labor force. Within the labor force, individuals with less than high school education have the highest percentage of unemployment, with 7.4% or 398 of them being unemployed.
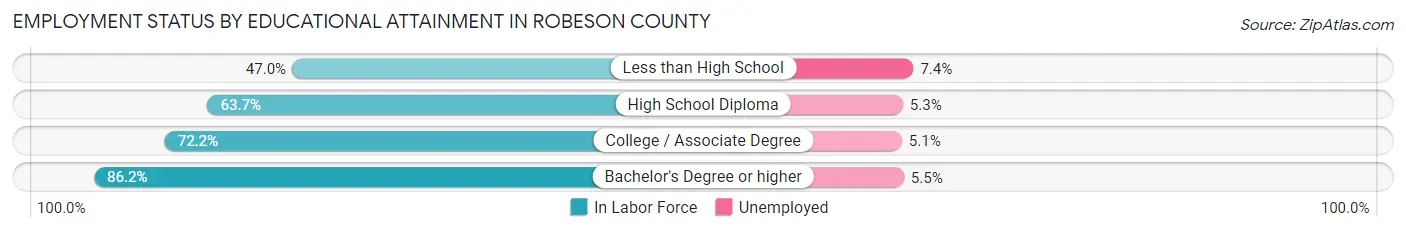
| Educational Attainment | In Labor Force | Unemployed |
| Less than High School | 5,376 (47.0%) | 846 (7.4%) |
| High School Diploma | 12,293 (63.7%) | 1,023 (5.3%) |
| College / Associate Degree | 13,316 (72.2%) | 941 (5.1%) |
| Bachelor's Degree or higher | 7,130 (86.2%) | 455 (5.5%) |
| Total | 38,091 (66.3%) | 3,160 (5.5%) |
Employment Occupations by Sex in Robeson County
Management, Business, Science and Arts Occupations
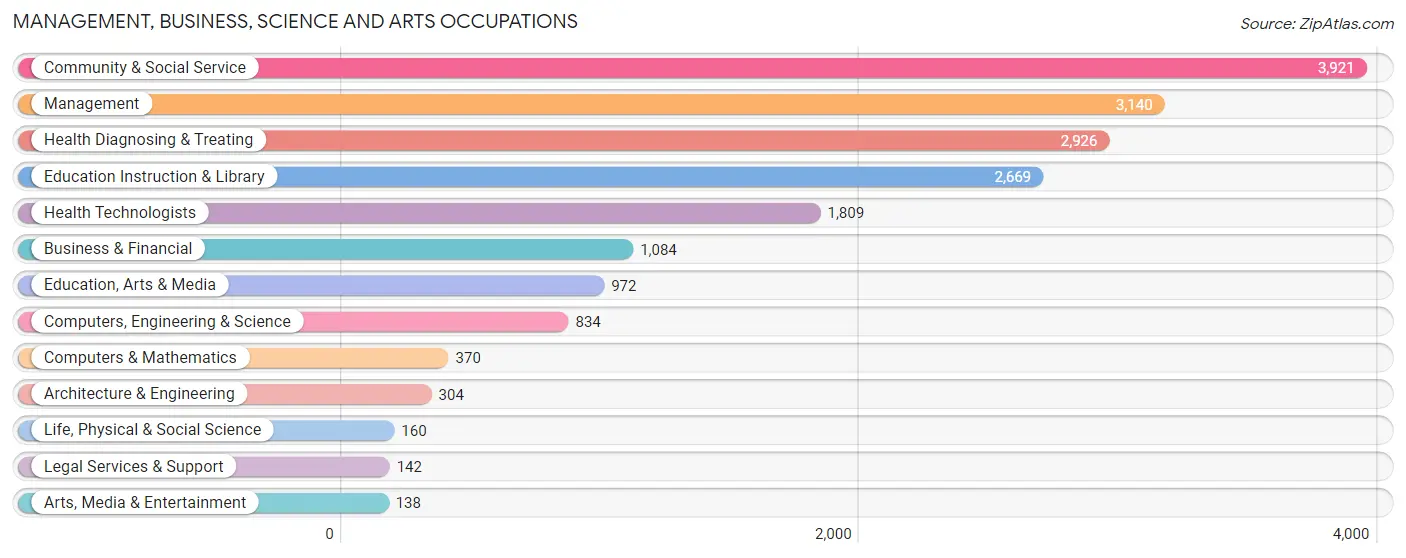
The most common Management, Business, Science and Arts occupations in Robeson County are Community & Social Service (3,921 | 9.0%), Management (3,140 | 7.2%), Health Diagnosing & Treating (2,926 | 6.7%), Education Instruction & Library (2,669 | 6.1%), and Health Technologists (1,809 | 4.2%).
Management, Business, Science and Arts Occupations by Sex
Within the Management, Business, Science and Arts occupations in Robeson County, the most male-oriented occupations are Architecture & Engineering (60.2%), Management (57.3%), and Computers, Engineering & Science (55.3%), while the most female-oriented occupations are Education Instruction & Library (85.7%), Health Diagnosing & Treating (82.3%), and Community & Social Service (80.2%).
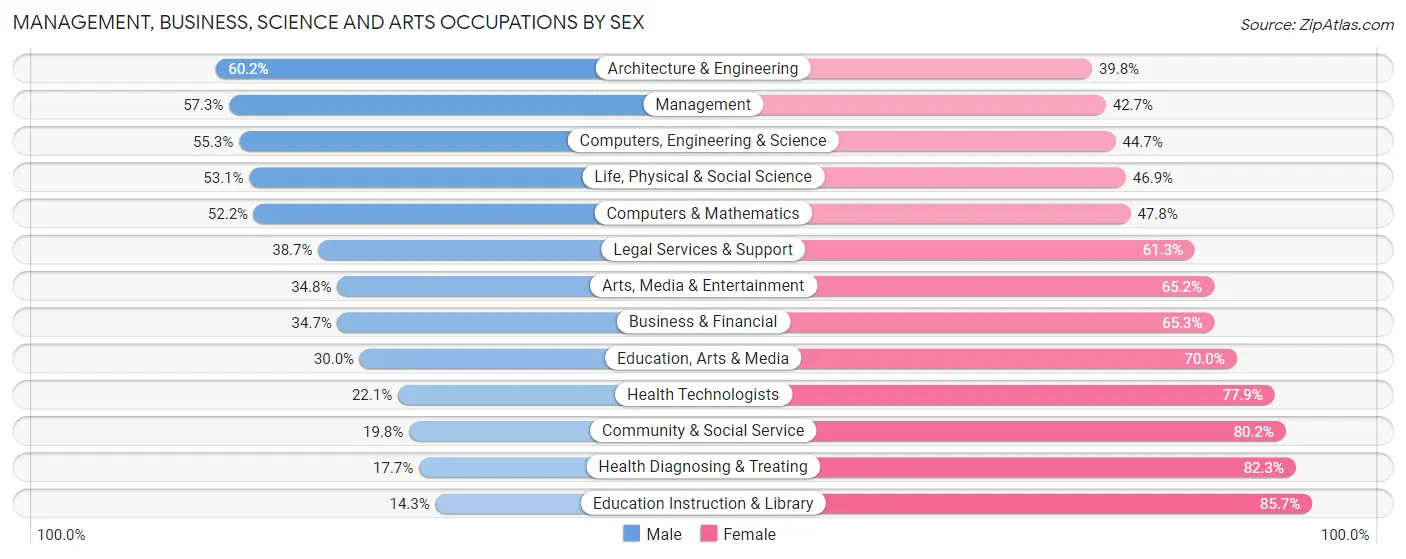
| Occupation | Male | Female |
| Management | 1,800 (57.3%) | 1,340 (42.7%) |
| Business & Financial | 376 (34.7%) | 708 (65.3%) |
| Computers, Engineering & Science | 461 (55.3%) | 373 (44.7%) |
| Computers & Mathematics | 193 (52.2%) | 177 (47.8%) |
| Architecture & Engineering | 183 (60.2%) | 121 (39.8%) |
| Life, Physical & Social Science | 85 (53.1%) | 75 (46.9%) |
| Community & Social Service | 776 (19.8%) | 3,145 (80.2%) |
| Education, Arts & Media | 292 (30.0%) | 680 (70.0%) |
| Legal Services & Support | 55 (38.7%) | 87 (61.3%) |
| Education Instruction & Library | 381 (14.3%) | 2,288 (85.7%) |
| Arts, Media & Entertainment | 48 (34.8%) | 90 (65.2%) |
| Health Diagnosing & Treating | 518 (17.7%) | 2,408 (82.3%) |
| Health Technologists | 400 (22.1%) | 1,409 (77.9%) |
| Total (Category) | 3,931 (33.0%) | 7,974 (67.0%) |
| Total (Overall) | 21,886 (50.2%) | 21,732 (49.8%) |
Services Occupations
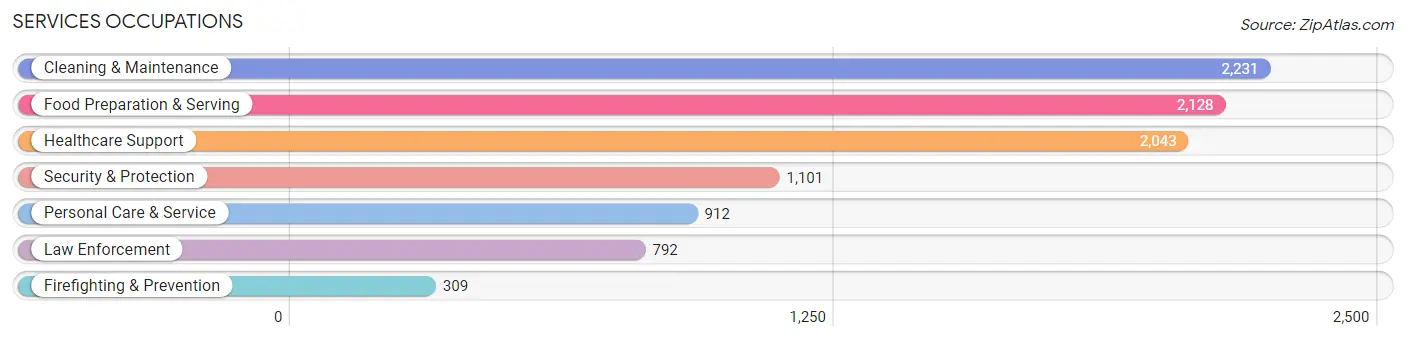
The most common Services occupations in Robeson County are Cleaning & Maintenance (2,231 | 5.1%), Food Preparation & Serving (2,128 | 4.9%), Healthcare Support (2,043 | 4.7%), Security & Protection (1,101 | 2.5%), and Personal Care & Service (912 | 2.1%).
Services Occupations by Sex
Within the Services occupations in Robeson County, the most male-oriented occupations are Firefighting & Prevention (84.8%), Security & Protection (80.5%), and Law Enforcement (78.8%), while the most female-oriented occupations are Healthcare Support (85.6%), Food Preparation & Serving (73.6%), and Personal Care & Service (65.3%).
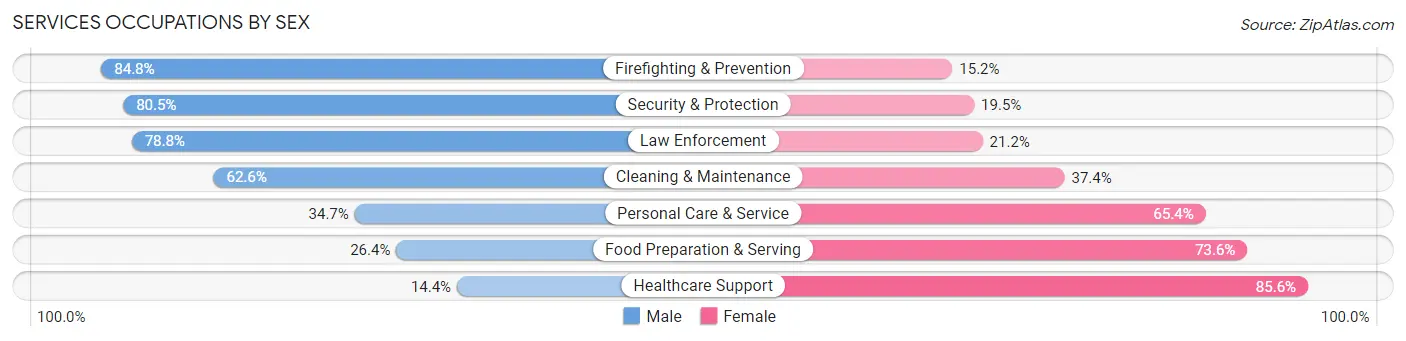
| Occupation | Male | Female |
| Healthcare Support | 294 (14.4%) | 1,749 (85.6%) |
| Security & Protection | 886 (80.5%) | 215 (19.5%) |
| Firefighting & Prevention | 262 (84.8%) | 47 (15.2%) |
| Law Enforcement | 624 (78.8%) | 168 (21.2%) |
| Food Preparation & Serving | 562 (26.4%) | 1,566 (73.6%) |
| Cleaning & Maintenance | 1,396 (62.6%) | 835 (37.4%) |
| Personal Care & Service | 316 (34.6%) | 596 (65.3%) |
| Total (Category) | 3,454 (41.0%) | 4,961 (59.0%) |
| Total (Overall) | 21,886 (50.2%) | 21,732 (49.8%) |
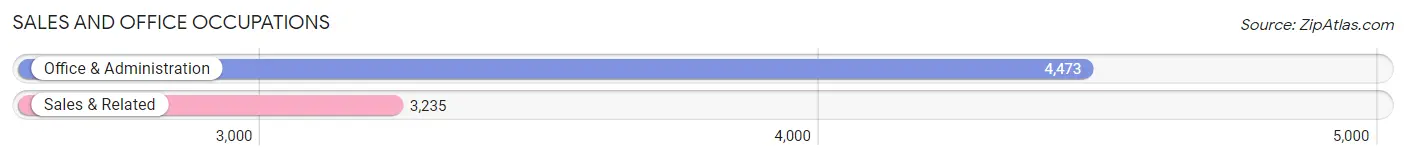
Sales and Office Occupations
The most common Sales and Office occupations in Robeson County are Office & Administration (4,473 | 10.2%), and Sales & Related (3,235 | 7.4%).
Sales and Office Occupations by Sex
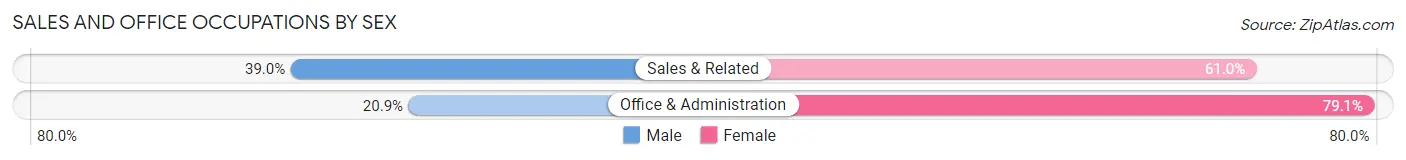
| Occupation | Male | Female |
| Sales & Related | 1,262 (39.0%) | 1,973 (61.0%) |
| Office & Administration | 934 (20.9%) | 3,539 (79.1%) |
| Total (Category) | 2,196 (28.5%) | 5,512 (71.5%) |
| Total (Overall) | 21,886 (50.2%) | 21,732 (49.8%) |
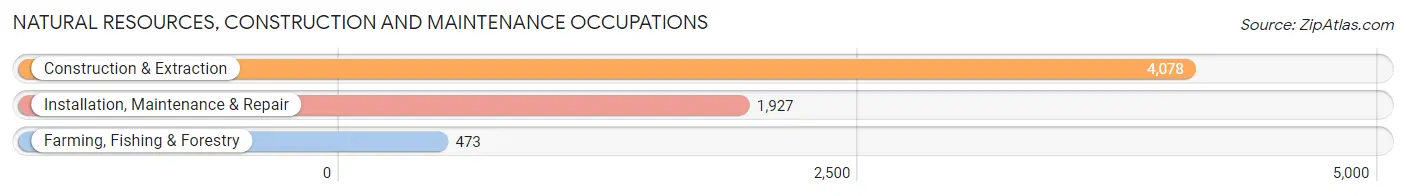
Natural Resources, Construction and Maintenance Occupations
The most common Natural Resources, Construction and Maintenance occupations in Robeson County are Construction & Extraction (4,078 | 9.3%), Installation, Maintenance & Repair (1,927 | 4.4%), and Farming, Fishing & Forestry (473 | 1.1%).
Natural Resources, Construction and Maintenance Occupations by Sex
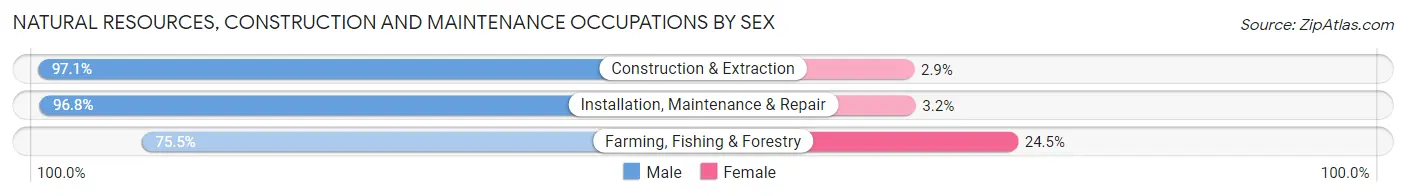
| Occupation | Male | Female |
| Farming, Fishing & Forestry | 357 (75.5%) | 116 (24.5%) |
| Construction & Extraction | 3,958 (97.1%) | 120 (2.9%) |
| Installation, Maintenance & Repair | 1,865 (96.8%) | 62 (3.2%) |
| Total (Category) | 6,180 (95.4%) | 298 (4.6%) |
| Total (Overall) | 21,886 (50.2%) | 21,732 (49.8%) |
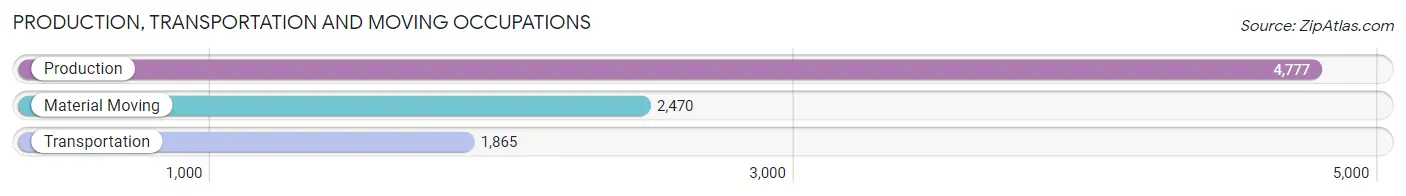
Production, Transportation and Moving Occupations
The most common Production, Transportation and Moving occupations in Robeson County are Production (4,777 | 11.0%), Material Moving (2,470 | 5.7%), and Transportation (1,865 | 4.3%).
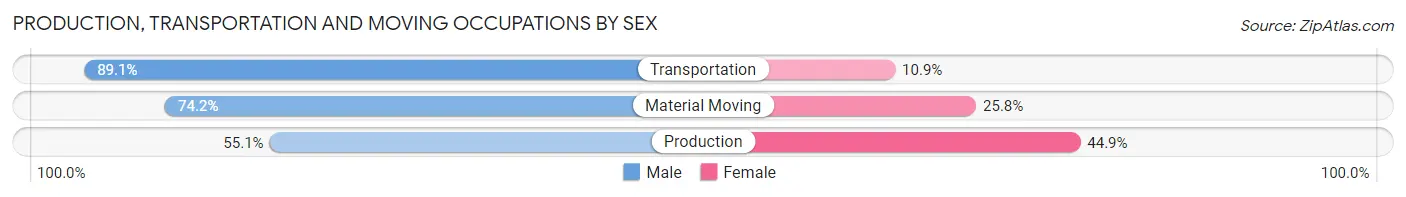
Production, Transportation and Moving Occupations by Sex
| Occupation | Male | Female |
| Production | 2,631 (55.1%) | 2,146 (44.9%) |
| Transportation | 1,661 (89.1%) | 204 (10.9%) |
| Material Moving | 1,833 (74.2%) | 637 (25.8%) |
| Total (Category) | 6,125 (67.2%) | 2,987 (32.8%) |
| Total (Overall) | 21,886 (50.2%) | 21,732 (49.8%) |
Employment Industries by Sex in Robeson County
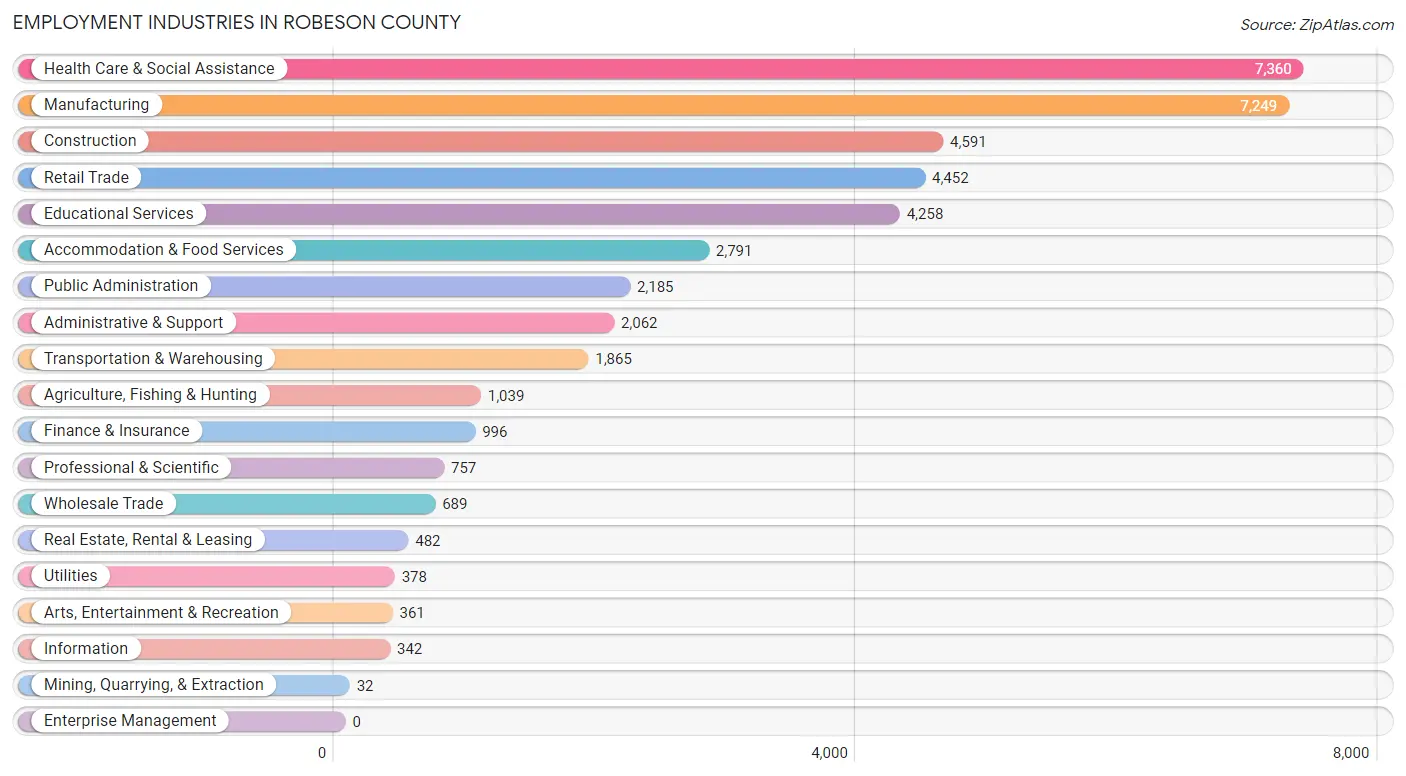
Employment Industries in Robeson County
The major employment industries in Robeson County include Health Care & Social Assistance (7,360 | 16.9%), Manufacturing (7,249 | 16.6%), Construction (4,591 | 10.5%), Retail Trade (4,452 | 10.2%), and Educational Services (4,258 | 9.8%).
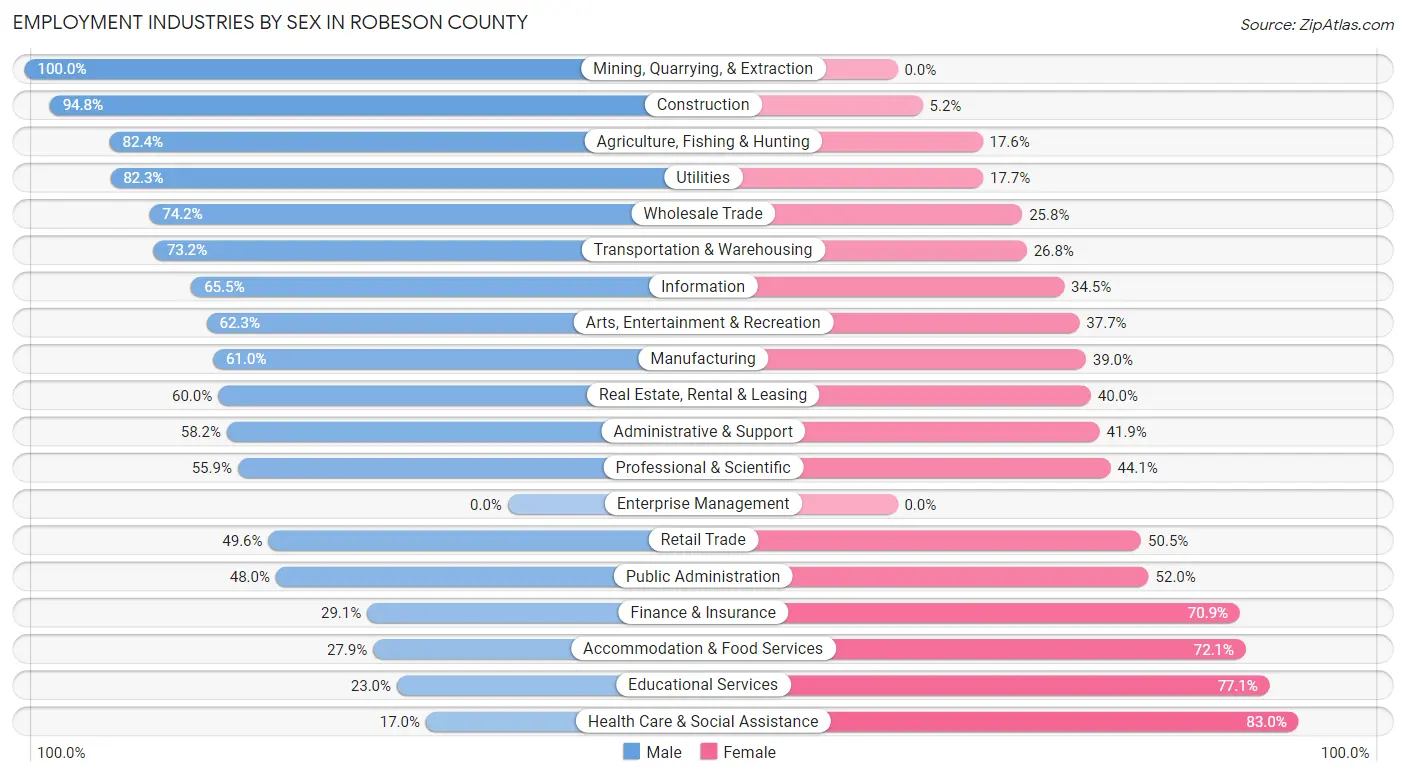
Employment Industries by Sex in Robeson County
The Robeson County industries that see more men than women are Mining, Quarrying, & Extraction (100.0%), Construction (94.8%), and Agriculture, Fishing & Hunting (82.4%), whereas the industries that tend to have a higher number of women are Health Care & Social Assistance (83.0%), Educational Services (77.0%), and Accommodation & Food Services (72.1%).
| Industry | Male | Female |
| Agriculture, Fishing & Hunting | 856 (82.4%) | 183 (17.6%) |
| Mining, Quarrying, & Extraction | 32 (100.0%) | 0 (0.0%) |
| Construction | 4,352 (94.8%) | 239 (5.2%) |
| Manufacturing | 4,422 (61.0%) | 2,827 (39.0%) |
| Wholesale Trade | 511 (74.2%) | 178 (25.8%) |
| Retail Trade | 2,206 (49.5%) | 2,246 (50.4%) |
| Transportation & Warehousing | 1,366 (73.2%) | 499 (26.8%) |
| Utilities | 311 (82.3%) | 67 (17.7%) |
| Information | 224 (65.5%) | 118 (34.5%) |
| Finance & Insurance | 290 (29.1%) | 706 (70.9%) |
| Real Estate, Rental & Leasing | 289 (60.0%) | 193 (40.0%) |
| Professional & Scientific | 423 (55.9%) | 334 (44.1%) |
| Enterprise Management | 0 (0.0%) | 0 (0.0%) |
| Administrative & Support | 1,199 (58.2%) | 863 (41.8%) |
| Educational Services | 977 (23.0%) | 3,281 (77.0%) |
| Health Care & Social Assistance | 1,248 (17.0%) | 6,112 (83.0%) |
| Arts, Entertainment & Recreation | 225 (62.3%) | 136 (37.7%) |
| Accommodation & Food Services | 778 (27.9%) | 2,013 (72.1%) |
| Public Administration | 1,049 (48.0%) | 1,136 (52.0%) |
| Total | 21,886 (50.2%) | 21,732 (49.8%) |
Education in Robeson County
School Enrollment in Robeson County
The most common levels of schooling among the 29,601 students in Robeson County are middle school (6,729 | 22.7%), high school (6,691 | 22.6%), and college / undergraduate (6,481 | 21.9%).
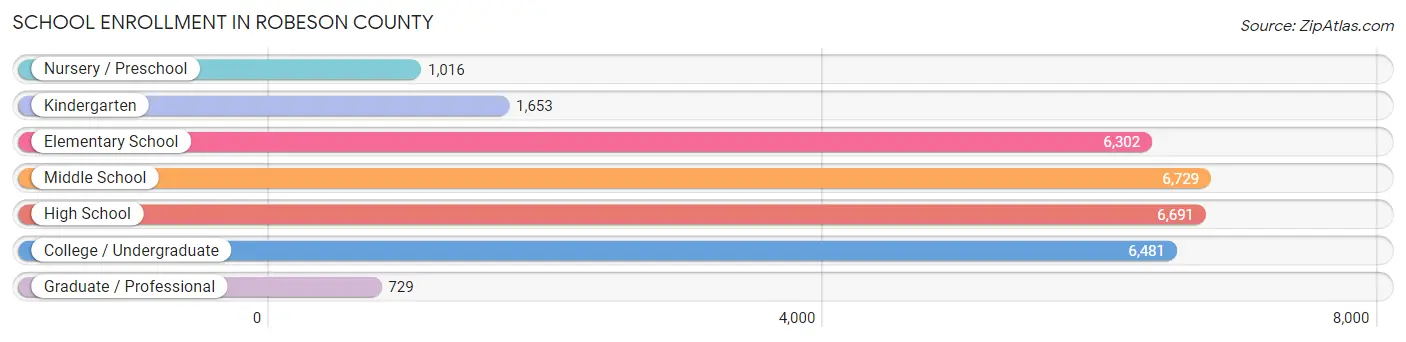
| School Level | # Students | % Students |
| Nursery / Preschool | 1,016 | 3.4% |
| Kindergarten | 1,653 | 5.6% |
| Elementary School | 6,302 | 21.3% |
| Middle School | 6,729 | 22.7% |
| High School | 6,691 | 22.6% |
| College / Undergraduate | 6,481 | 21.9% |
| Graduate / Professional | 729 | 2.5% |
| Total | 29,601 | 100.0% |
School Enrollment by Age by Funding Source in Robeson County
Out of a total of 29,601 students who are enrolled in schools in Robeson County, 2,486 (8.4%) attend a private institution, while the remaining 27,115 (91.6%) are enrolled in public schools. The age group of 35 years and over has the highest likelihood of being enrolled in private schools, with 357 (26.1% in the age bracket) enrolled. Conversely, the age group of 15 to 17 year olds has the lowest likelihood of being enrolled in a private school, with 4,512 (95.9% in the age bracket) attending a public institution.
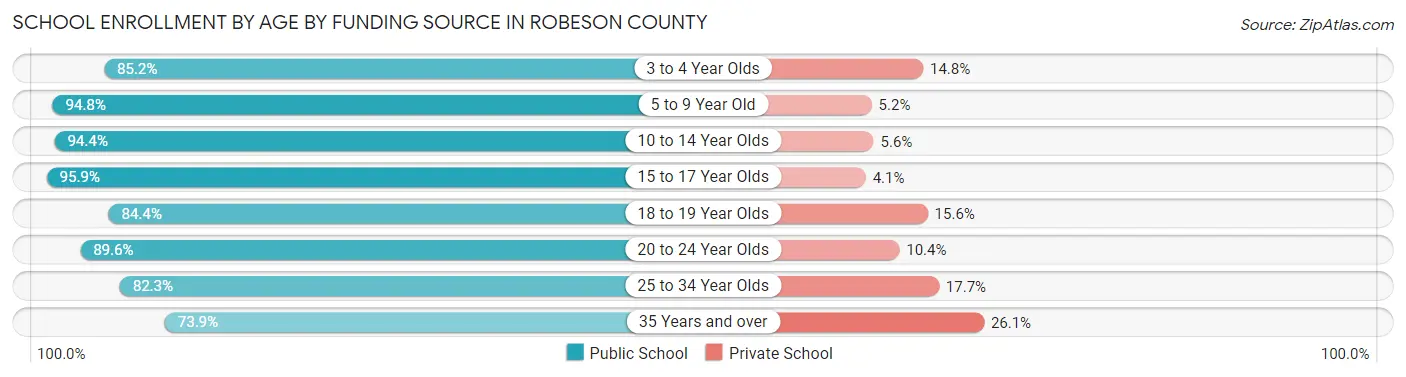
| Age Bracket | Public School | Private School |
| 3 to 4 Year Olds | 576 (85.2%) | 100 (14.8%) |
| 5 to 9 Year Old | 6,936 (94.8%) | 381 (5.2%) |
| 10 to 14 Year Olds | 8,054 (94.4%) | 475 (5.6%) |
| 15 to 17 Year Olds | 4,512 (95.9%) | 193 (4.1%) |
| 18 to 19 Year Olds | 2,497 (84.4%) | 463 (15.6%) |
| 20 to 24 Year Olds | 2,588 (89.6%) | 299 (10.4%) |
| 25 to 34 Year Olds | 955 (82.3%) | 206 (17.7%) |
| 35 Years and over | 1,009 (73.9%) | 357 (26.1%) |
| Total | 27,115 (91.6%) | 2,486 (8.4%) |
Educational Attainment by Field of Study in Robeson County
Education (2,662 | 23.1%), business (1,673 | 14.5%), arts & humanities (1,383 | 12.0%), science & technology (1,261 | 10.9%), and social sciences (926 | 8.0%) are the most common fields of study among 11,533 individuals in Robeson County who have obtained a bachelor's degree or higher.
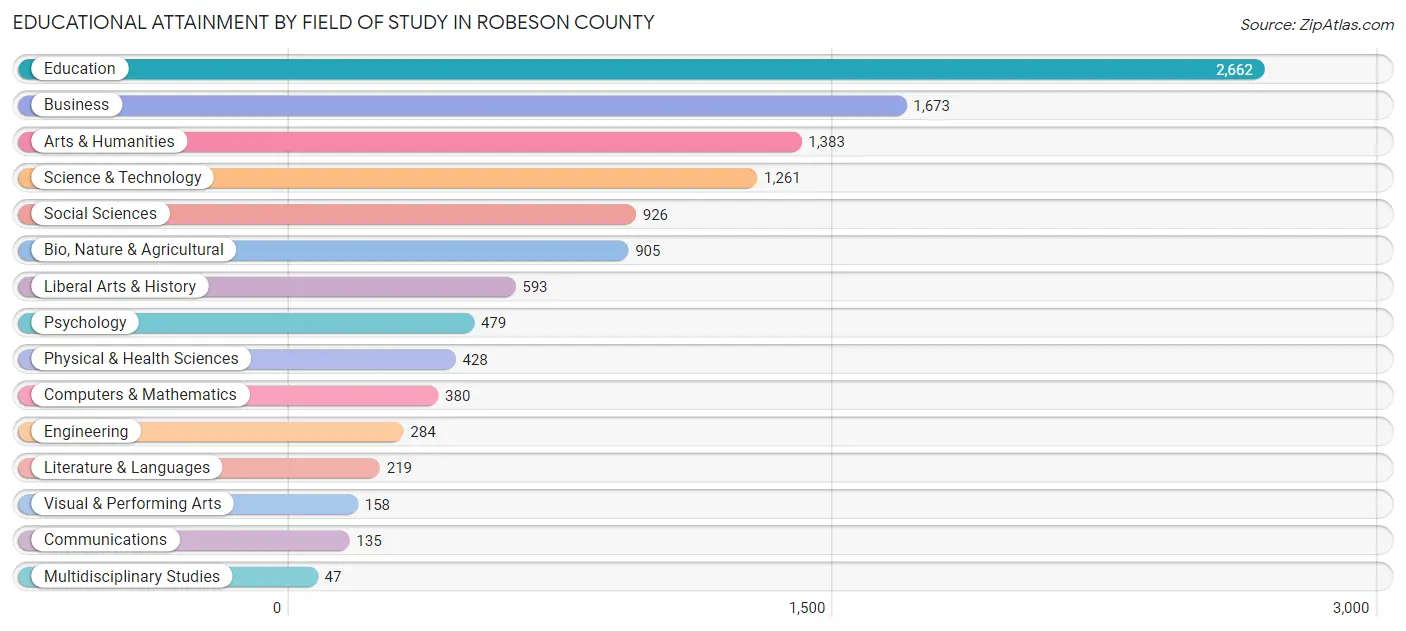
| Field of Study | # Graduates | % Graduates |
| Computers & Mathematics | 380 | 3.3% |
| Bio, Nature & Agricultural | 905 | 7.9% |
| Physical & Health Sciences | 428 | 3.7% |
| Psychology | 479 | 4.2% |
| Social Sciences | 926 | 8.0% |
| Engineering | 284 | 2.5% |
| Multidisciplinary Studies | 47 | 0.4% |
| Science & Technology | 1,261 | 10.9% |
| Business | 1,673 | 14.5% |
| Education | 2,662 | 23.1% |
| Literature & Languages | 219 | 1.9% |
| Liberal Arts & History | 593 | 5.1% |
| Visual & Performing Arts | 158 | 1.4% |
| Communications | 135 | 1.2% |
| Arts & Humanities | 1,383 | 12.0% |
| Total | 11,533 | 100.0% |
Transportation & Commute in Robeson County
Vehicle Availability by Sex in Robeson County
The most prevalent vehicle ownership categories in Robeson County are males with 2 vehicles (7,408, accounting for 34.2%) and females with 2 vehicles (7,470, making up 34.9%).
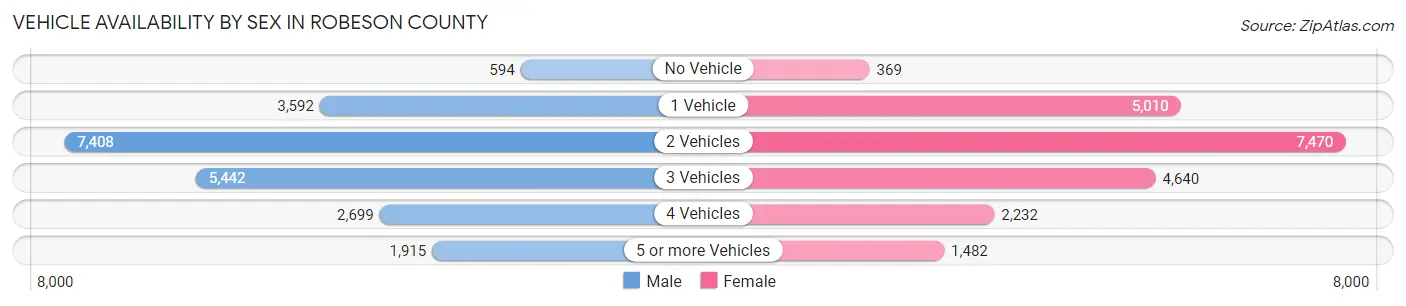
| Vehicles Available | Male | Female |
| No Vehicle | 594 (2.7%) | 369 (1.7%) |
| 1 Vehicle | 3,592 (16.6%) | 5,010 (23.6%) |
| 2 Vehicles | 7,408 (34.2%) | 7,470 (35.2%) |
| 3 Vehicles | 5,442 (25.1%) | 4,640 (21.9%) |
| 4 Vehicles | 2,699 (12.5%) | 2,232 (10.5%) |
| 5 or more Vehicles | 1,915 (8.8%) | 1,482 (7.0%) |
| Total | 21,650 (100.0%) | 21,203 (100.0%) |
Commute Time in Robeson County
The most frequently occuring commute durations in Robeson County are 15 to 19 minutes (7,071 commuters, 17.0%), 10 to 14 minutes (6,302 commuters, 15.1%), and 20 to 24 minutes (6,239 commuters, 14.9%).
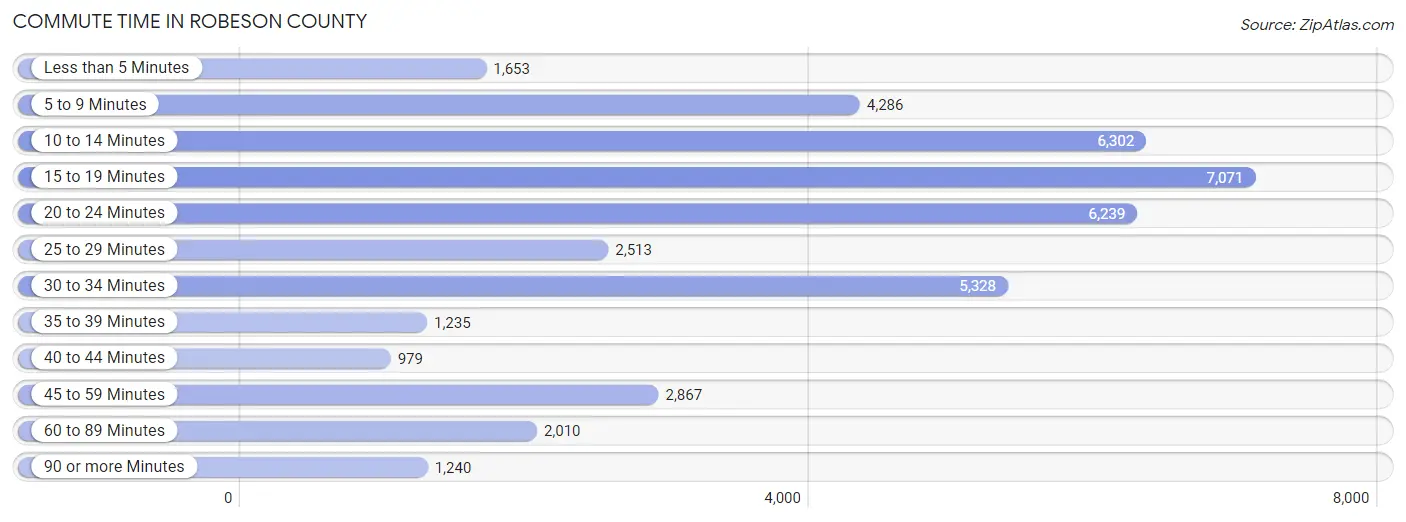
| Commute Time | # Commuters | % Commuters |
| Less than 5 Minutes | 1,653 | 4.0% |
| 5 to 9 Minutes | 4,286 | 10.3% |
| 10 to 14 Minutes | 6,302 | 15.1% |
| 15 to 19 Minutes | 7,071 | 17.0% |
| 20 to 24 Minutes | 6,239 | 14.9% |
| 25 to 29 Minutes | 2,513 | 6.0% |
| 30 to 34 Minutes | 5,328 | 12.8% |
| 35 to 39 Minutes | 1,235 | 3.0% |
| 40 to 44 Minutes | 979 | 2.4% |
| 45 to 59 Minutes | 2,867 | 6.9% |
| 60 to 89 Minutes | 2,010 | 4.8% |
| 90 or more Minutes | 1,240 | 3.0% |
Commute Time by Sex in Robeson County
The most common commute times in Robeson County are 15 to 19 minutes (3,220 commuters, 15.2%) for males and 15 to 19 minutes (3,851 commuters, 18.7%) for females.
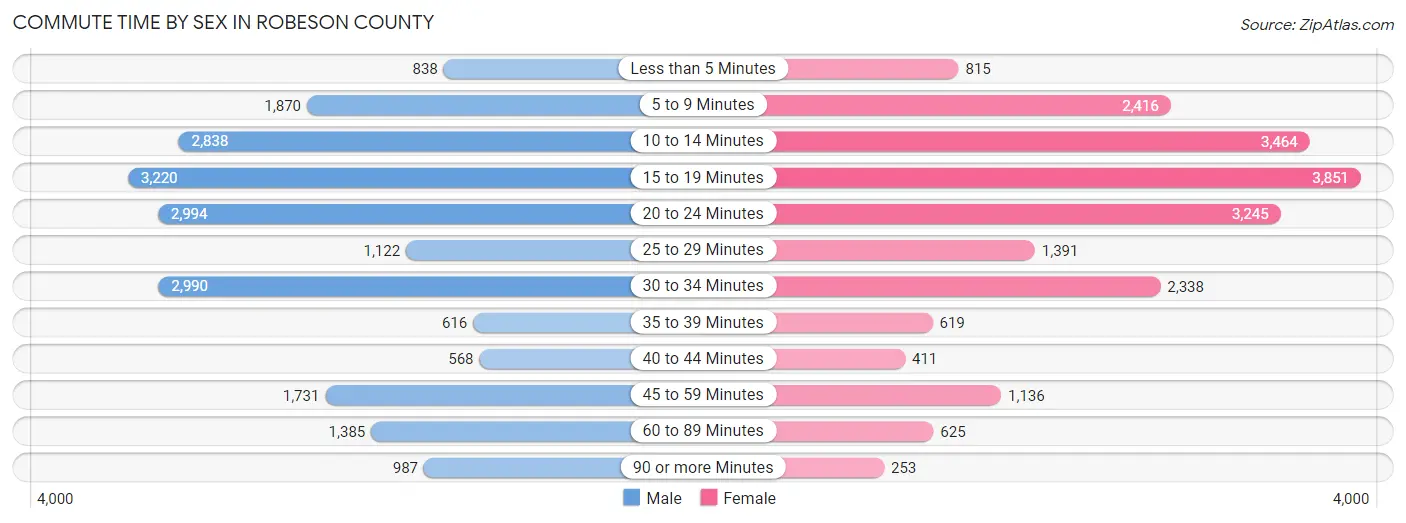
| Commute Time | Male | Female |
| Less than 5 Minutes | 838 (4.0%) | 815 (4.0%) |
| 5 to 9 Minutes | 1,870 (8.8%) | 2,416 (11.7%) |
| 10 to 14 Minutes | 2,838 (13.4%) | 3,464 (16.8%) |
| 15 to 19 Minutes | 3,220 (15.2%) | 3,851 (18.7%) |
| 20 to 24 Minutes | 2,994 (14.1%) | 3,245 (15.8%) |
| 25 to 29 Minutes | 1,122 (5.3%) | 1,391 (6.8%) |
| 30 to 34 Minutes | 2,990 (14.1%) | 2,338 (11.4%) |
| 35 to 39 Minutes | 616 (2.9%) | 619 (3.0%) |
| 40 to 44 Minutes | 568 (2.7%) | 411 (2.0%) |
| 45 to 59 Minutes | 1,731 (8.2%) | 1,136 (5.5%) |
| 60 to 89 Minutes | 1,385 (6.6%) | 625 (3.0%) |
| 90 or more Minutes | 987 (4.7%) | 253 (1.2%) |
Time of Departure to Work by Sex in Robeson County
The most frequent times of departure to work in Robeson County are 7:00 AM to 7:29 AM (3,405, 16.1%) for males and 7:00 AM to 7:29 AM (4,363, 21.2%) for females.
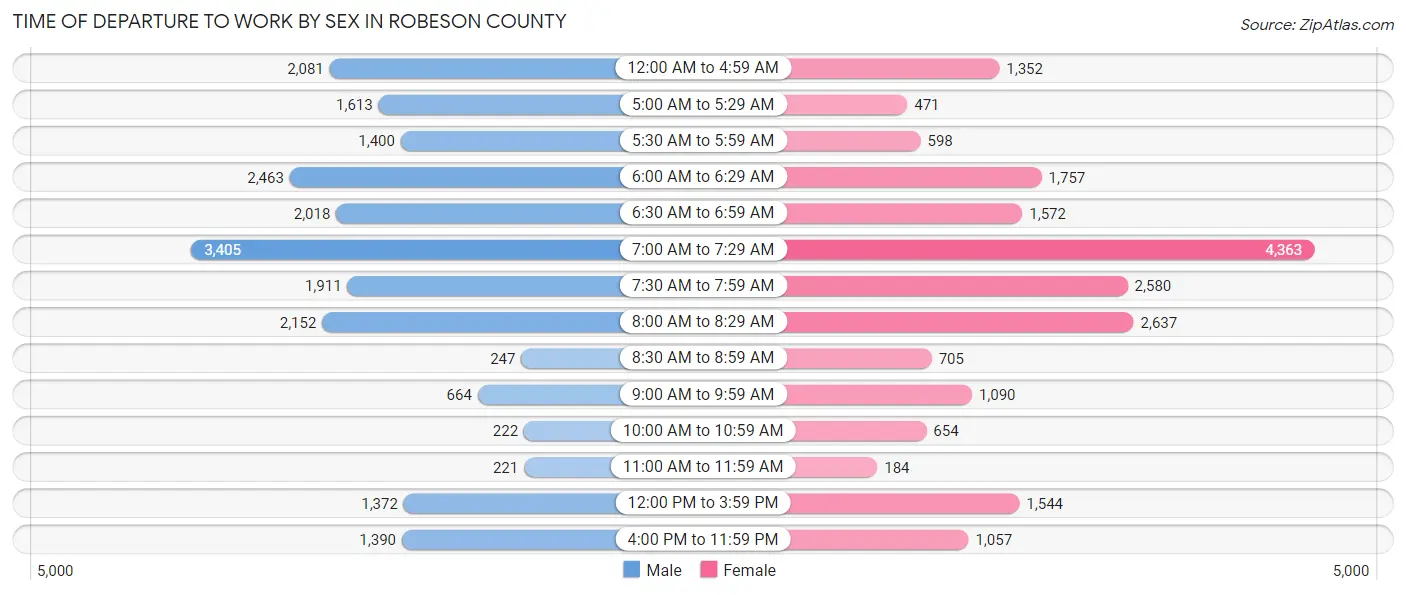
| Time of Departure | Male | Female |
| 12:00 AM to 4:59 AM | 2,081 (9.8%) | 1,352 (6.6%) |
| 5:00 AM to 5:29 AM | 1,613 (7.6%) | 471 (2.3%) |
| 5:30 AM to 5:59 AM | 1,400 (6.6%) | 598 (2.9%) |
| 6:00 AM to 6:29 AM | 2,463 (11.6%) | 1,757 (8.5%) |
| 6:30 AM to 6:59 AM | 2,018 (9.5%) | 1,572 (7.6%) |
| 7:00 AM to 7:29 AM | 3,405 (16.1%) | 4,363 (21.2%) |
| 7:30 AM to 7:59 AM | 1,911 (9.0%) | 2,580 (12.6%) |
| 8:00 AM to 8:29 AM | 2,152 (10.2%) | 2,637 (12.8%) |
| 8:30 AM to 8:59 AM | 247 (1.2%) | 705 (3.4%) |
| 9:00 AM to 9:59 AM | 664 (3.1%) | 1,090 (5.3%) |
| 10:00 AM to 10:59 AM | 222 (1.1%) | 654 (3.2%) |
| 11:00 AM to 11:59 AM | 221 (1.0%) | 184 (0.9%) |
| 12:00 PM to 3:59 PM | 1,372 (6.5%) | 1,544 (7.5%) |
| 4:00 PM to 11:59 PM | 1,390 (6.6%) | 1,057 (5.1%) |
| Total | 21,159 (100.0%) | 20,564 (100.0%) |
Housing Occupancy in Robeson County
Occupancy by Ownership in Robeson County
Of the total 42,509 dwellings in Robeson County, owner-occupied units account for 27,881 (65.6%), while renter-occupied units make up 14,628 (34.4%).
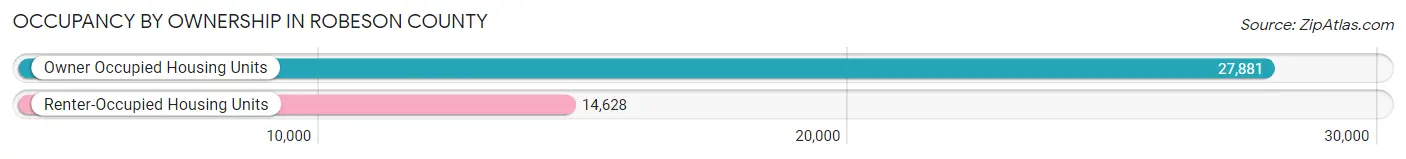
| Occupancy | # Housing Units | % Housing Units |
| Owner Occupied Housing Units | 27,881 | 65.6% |
| Renter-Occupied Housing Units | 14,628 | 34.4% |
| Total Occupied Housing Units | 42,509 | 100.0% |
Occupancy by Household Size in Robeson County
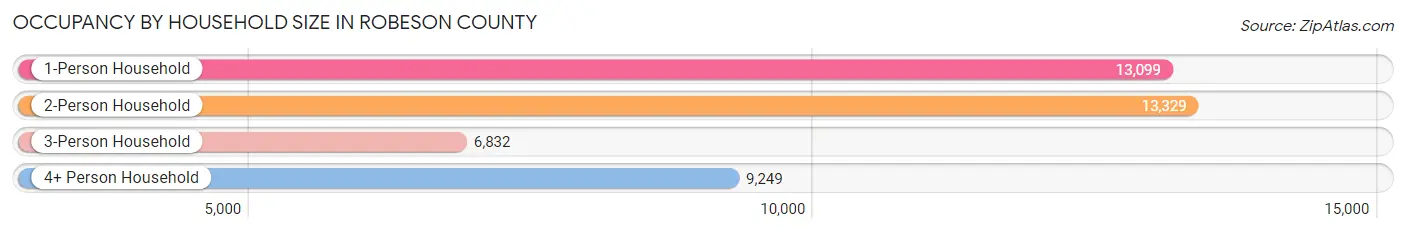
| Household Size | # Housing Units | % Housing Units |
| 1-Person Household | 13,099 | 30.8% |
| 2-Person Household | 13,329 | 31.4% |
| 3-Person Household | 6,832 | 16.1% |
| 4+ Person Household | 9,249 | 21.8% |
| Total Housing Units | 42,509 | 100.0% |
Occupancy by Ownership by Household Size in Robeson County
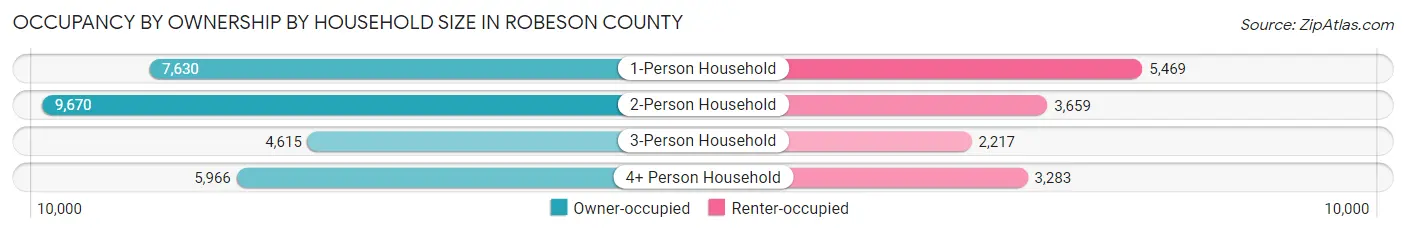
| Household Size | Owner-occupied | Renter-occupied |
| 1-Person Household | 7,630 (58.3%) | 5,469 (41.7%) |
| 2-Person Household | 9,670 (72.6%) | 3,659 (27.5%) |
| 3-Person Household | 4,615 (67.5%) | 2,217 (32.5%) |
| 4+ Person Household | 5,966 (64.5%) | 3,283 (35.5%) |
| Total Housing Units | 27,881 (65.6%) | 14,628 (34.4%) |
Occupancy by Educational Attainment in Robeson County
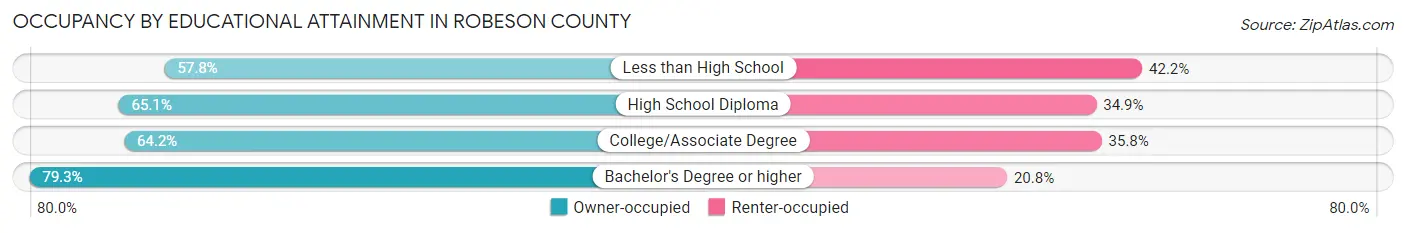
| Household Size | Owner-occupied | Renter-occupied |
| Less than High School | 4,848 (57.8%) | 3,537 (42.2%) |
| High School Diploma | 8,625 (65.1%) | 4,625 (34.9%) |
| College/Associate Degree | 9,138 (64.2%) | 5,086 (35.8%) |
| Bachelor's Degree or higher | 5,270 (79.2%) | 1,380 (20.7%) |
Occupancy by Age of Householder in Robeson County
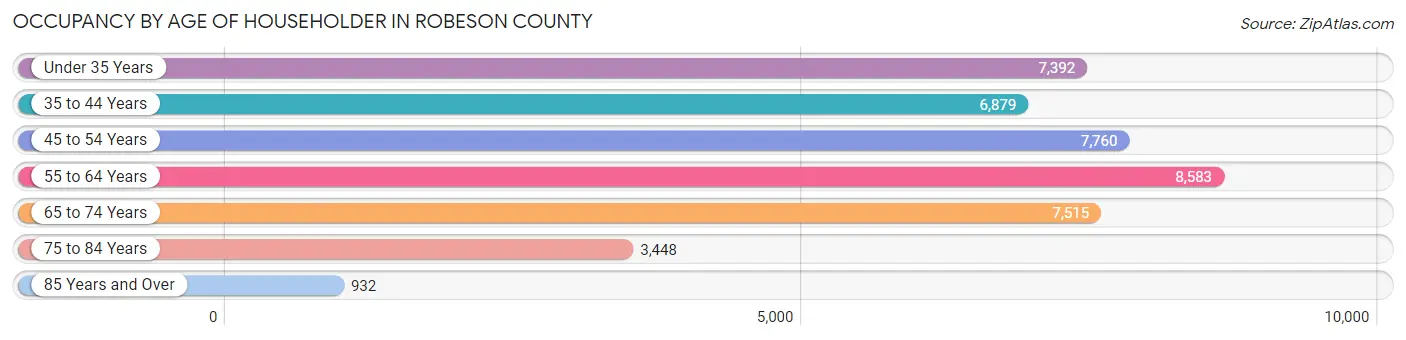
| Age Bracket | # Households | % Households |
| Under 35 Years | 7,392 | 17.4% |
| 35 to 44 Years | 6,879 | 16.2% |
| 45 to 54 Years | 7,760 | 18.2% |
| 55 to 64 Years | 8,583 | 20.2% |
| 65 to 74 Years | 7,515 | 17.7% |
| 75 to 84 Years | 3,448 | 8.1% |
| 85 Years and Over | 932 | 2.2% |
| Total | 42,509 | 100.0% |
Housing Finances in Robeson County
Median Income by Occupancy in Robeson County
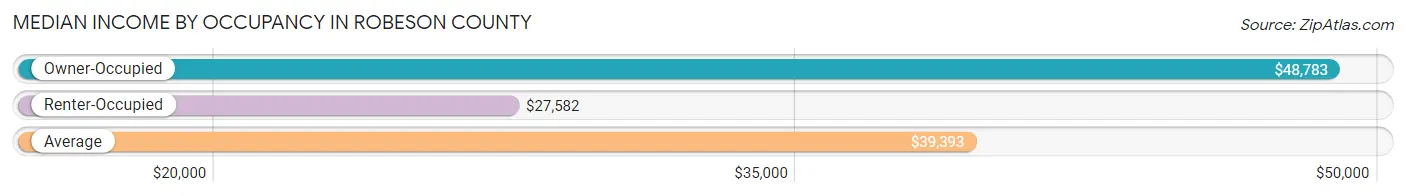
| Occupancy Type | # Households | Median Income |
| Owner-Occupied | 27,881 (65.6%) | $48,783 |
| Renter-Occupied | 14,628 (34.4%) | $27,582 |
| Average | 42,509 (100.0%) | $39,393 |
Occupancy by Householder Income Bracket in Robeson County
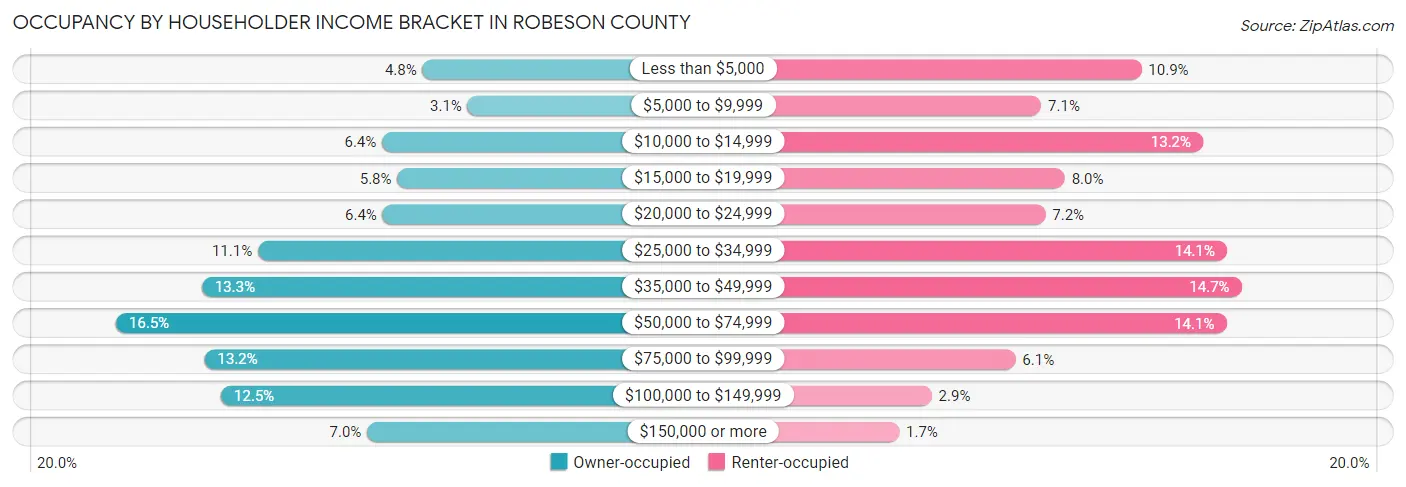
| Income Bracket | Owner-occupied | Renter-occupied |
| Less than $5,000 | 1,349 (4.8%) | 1,593 (10.9%) |
| $5,000 to $9,999 | 869 (3.1%) | 1,034 (7.1%) |
| $10,000 to $14,999 | 1,779 (6.4%) | 1,935 (13.2%) |
| $15,000 to $19,999 | 1,618 (5.8%) | 1,166 (8.0%) |
| $20,000 to $24,999 | 1,773 (6.4%) | 1,058 (7.2%) |
| $25,000 to $34,999 | 3,098 (11.1%) | 2,068 (14.1%) |
| $35,000 to $49,999 | 3,695 (13.3%) | 2,150 (14.7%) |
| $50,000 to $74,999 | 4,605 (16.5%) | 2,066 (14.1%) |
| $75,000 to $99,999 | 3,666 (13.2%) | 891 (6.1%) |
| $100,000 to $149,999 | 3,491 (12.5%) | 424 (2.9%) |
| $150,000 or more | 1,938 (7.0%) | 243 (1.7%) |
| Total | 27,881 (100.0%) | 14,628 (100.0%) |
Monthly Housing Cost Tiers in Robeson County
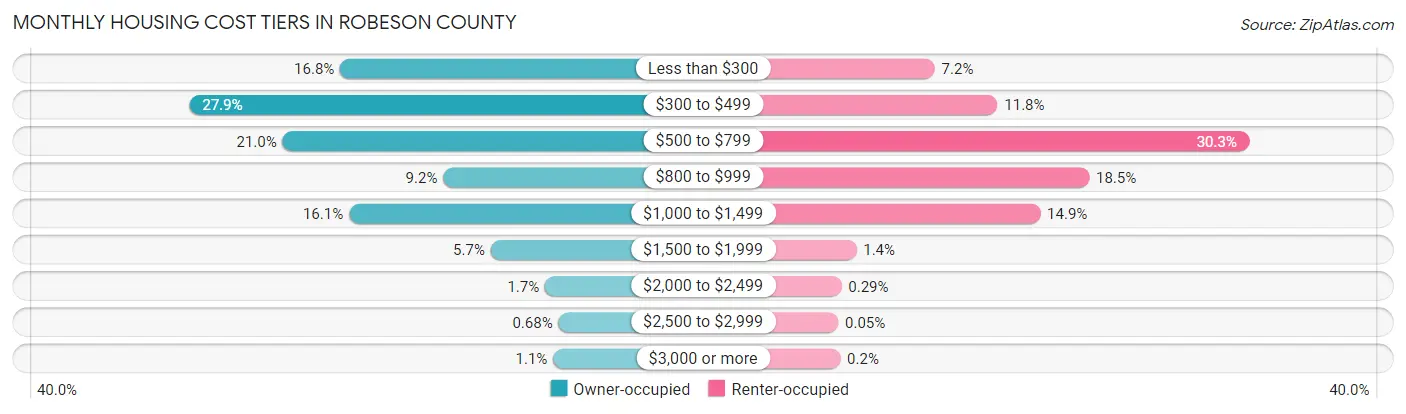
| Monthly Cost | Owner-occupied | Renter-occupied |
| Less than $300 | 4,673 (16.8%) | 1,047 (7.2%) |
| $300 to $499 | 7,770 (27.9%) | 1,723 (11.8%) |
| $500 to $799 | 5,855 (21.0%) | 4,431 (30.3%) |
| $800 to $999 | 2,557 (9.2%) | 2,710 (18.5%) |
| $1,000 to $1,499 | 4,491 (16.1%) | 2,184 (14.9%) |
| $1,500 to $1,999 | 1,582 (5.7%) | 203 (1.4%) |
| $2,000 to $2,499 | 466 (1.7%) | 42 (0.3%) |
| $2,500 to $2,999 | 189 (0.7%) | 8 (0.1%) |
| $3,000 or more | 298 (1.1%) | 29 (0.2%) |
| Total | 27,881 (100.0%) | 14,628 (100.0%) |
Physical Housing Characteristics in Robeson County
Housing Structures in Robeson County
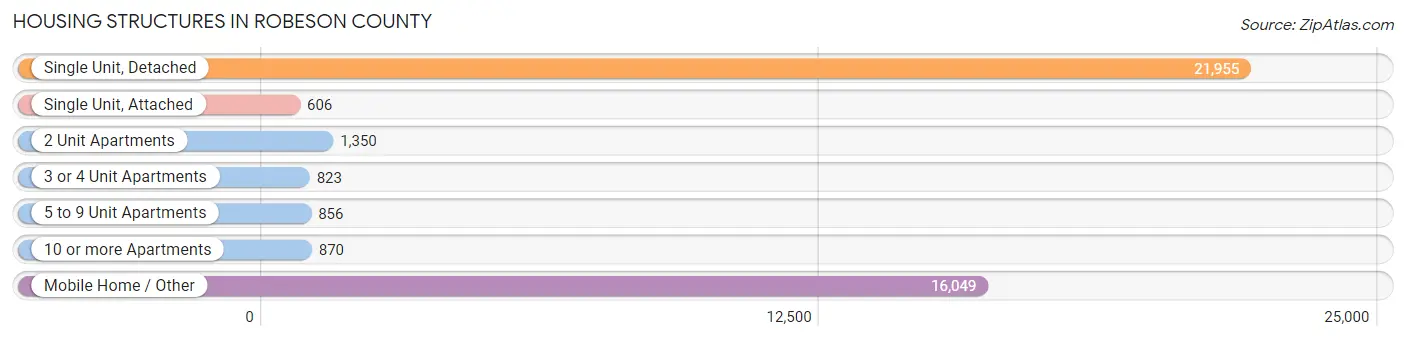
| Structure Type | # Housing Units | % Housing Units |
| Single Unit, Detached | 21,955 | 51.6% |
| Single Unit, Attached | 606 | 1.4% |
| 2 Unit Apartments | 1,350 | 3.2% |
| 3 or 4 Unit Apartments | 823 | 1.9% |
| 5 to 9 Unit Apartments | 856 | 2.0% |
| 10 or more Apartments | 870 | 2.1% |
| Mobile Home / Other | 16,049 | 37.8% |
| Total | 42,509 | 100.0% |
Housing Structures by Occupancy in Robeson County
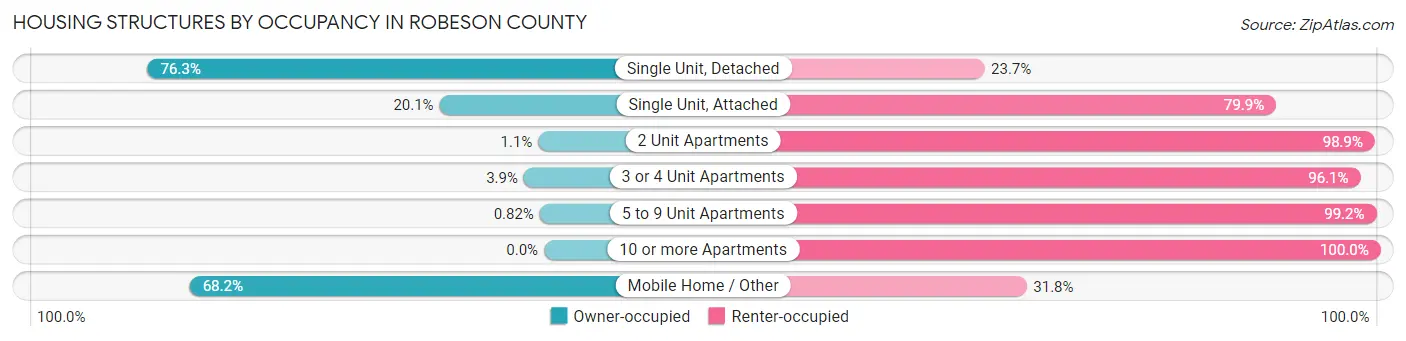
| Structure Type | Owner-occupied | Renter-occupied |
| Single Unit, Detached | 16,759 (76.3%) | 5,196 (23.7%) |
| Single Unit, Attached | 122 (20.1%) | 484 (79.9%) |
| 2 Unit Apartments | 15 (1.1%) | 1,335 (98.9%) |
| 3 or 4 Unit Apartments | 32 (3.9%) | 791 (96.1%) |
| 5 to 9 Unit Apartments | 7 (0.8%) | 849 (99.2%) |
| 10 or more Apartments | 0 (0.0%) | 870 (100.0%) |
| Mobile Home / Other | 10,946 (68.2%) | 5,103 (31.8%) |
| Total | 27,881 (65.6%) | 14,628 (34.4%) |
Housing Structures by Number of Rooms in Robeson County
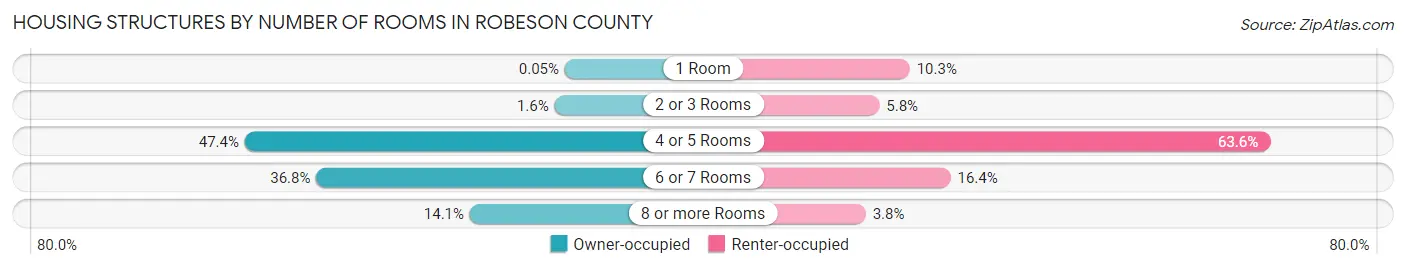
| Number of Rooms | Owner-occupied | Renter-occupied |
| 1 Room | 13 (0.1%) | 1,511 (10.3%) |
| 2 or 3 Rooms | 441 (1.6%) | 854 (5.8%) |
| 4 or 5 Rooms | 13,220 (47.4%) | 9,309 (63.6%) |
| 6 or 7 Rooms | 10,272 (36.8%) | 2,395 (16.4%) |
| 8 or more Rooms | 3,935 (14.1%) | 559 (3.8%) |
| Total | 27,881 (100.0%) | 14,628 (100.0%) |
Housing Structure by Heating Type in Robeson County
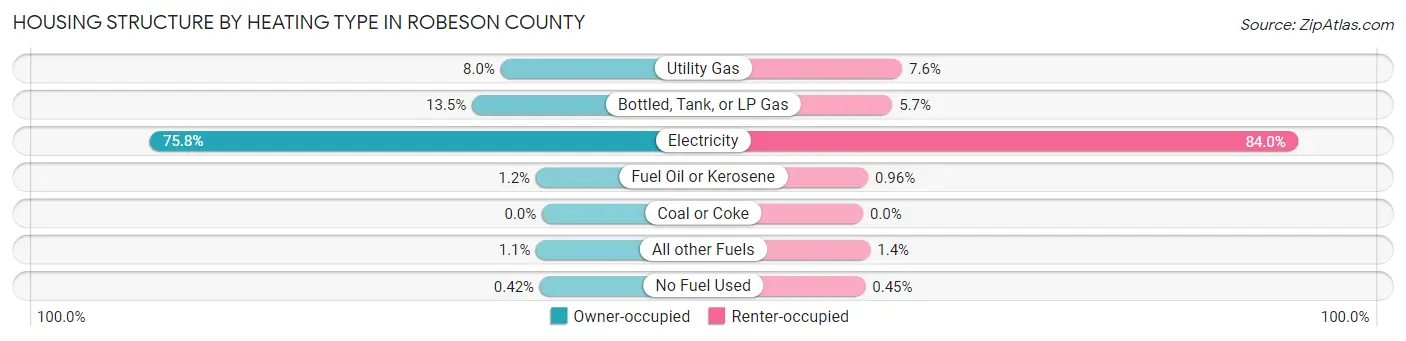
| Heating Type | Owner-occupied | Renter-occupied |
| Utility Gas | 2,229 (8.0%) | 1,105 (7.5%) |
| Bottled, Tank, or LP Gas | 3,770 (13.5%) | 826 (5.7%) |
| Electricity | 21,124 (75.8%) | 12,284 (84.0%) |
| Fuel Oil or Kerosene | 331 (1.2%) | 141 (1.0%) |
| Coal or Coke | 0 (0.0%) | 0 (0.0%) |
| All other Fuels | 309 (1.1%) | 206 (1.4%) |
| No Fuel Used | 118 (0.4%) | 66 (0.4%) |
| Total | 27,881 (100.0%) | 14,628 (100.0%) |
Household Vehicle Usage in Robeson County
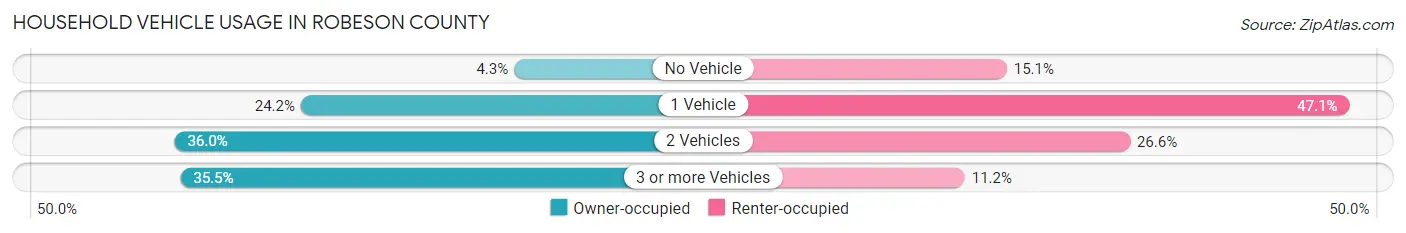
| Vehicles per Household | Owner-occupied | Renter-occupied |
| No Vehicle | 1,202 (4.3%) | 2,211 (15.1%) |
| 1 Vehicle | 6,754 (24.2%) | 6,888 (47.1%) |
| 2 Vehicles | 10,039 (36.0%) | 3,892 (26.6%) |
| 3 or more Vehicles | 9,886 (35.5%) | 1,637 (11.2%) |
| Total | 27,881 (100.0%) | 14,628 (100.0%) |
Real Estate & Mortgages in Robeson County
Real Estate and Mortgage Overview in Robeson County
| Characteristic | Without Mortgage | With Mortgage |
| Housing Units | 17,289 | 10,592 |
| Median Property Value | $73,200 | $117,000 |
| Median Household Income | $38,892 | $1,095 |
| Monthly Housing Costs | $399 | $253 |
| Real Estate Taxes | $677 | $448 |
Property Value by Mortgage Status in Robeson County
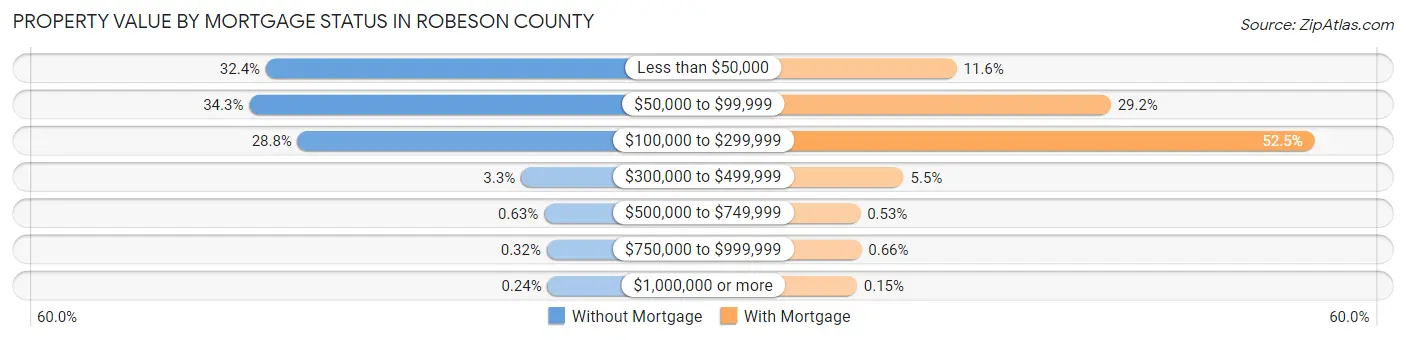
| Property Value | Without Mortgage | With Mortgage |
| Less than $50,000 | 5,605 (32.4%) | 1,223 (11.6%) |
| $50,000 to $99,999 | 5,935 (34.3%) | 3,089 (29.2%) |
| $100,000 to $299,999 | 4,977 (28.8%) | 5,557 (52.5%) |
| $300,000 to $499,999 | 566 (3.3%) | 581 (5.5%) |
| $500,000 to $749,999 | 109 (0.6%) | 56 (0.5%) |
| $750,000 to $999,999 | 56 (0.3%) | 70 (0.7%) |
| $1,000,000 or more | 41 (0.2%) | 16 (0.2%) |
| Total | 17,289 (100.0%) | 10,592 (100.0%) |
Household Income by Mortgage Status in Robeson County
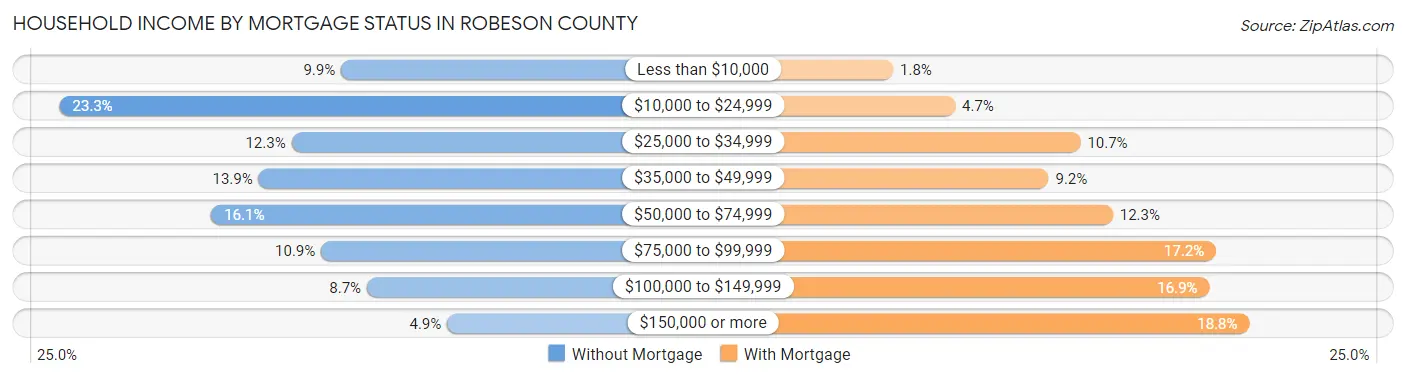
| Household Income | Without Mortgage | With Mortgage |
| Less than $10,000 | 1,716 (9.9%) | 190 (1.8%) |
| $10,000 to $24,999 | 4,036 (23.3%) | 502 (4.7%) |
| $25,000 to $34,999 | 2,125 (12.3%) | 1,134 (10.7%) |
| $35,000 to $49,999 | 2,397 (13.9%) | 973 (9.2%) |
| $50,000 to $74,999 | 2,786 (16.1%) | 1,298 (12.2%) |
| $75,000 to $99,999 | 1,881 (10.9%) | 1,819 (17.2%) |
| $100,000 to $149,999 | 1,505 (8.7%) | 1,785 (16.9%) |
| $150,000 or more | 843 (4.9%) | 1,986 (18.8%) |
| Total | 17,289 (100.0%) | 10,592 (100.0%) |
Property Value to Household Income Ratio in Robeson County
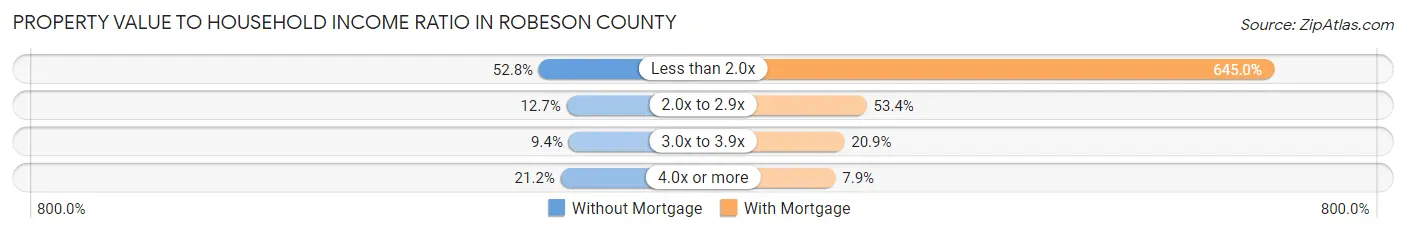
| Value-to-Income Ratio | Without Mortgage | With Mortgage |
| Less than 2.0x | 9,122 (52.8%) | 68,314 (645.0%) |
| 2.0x to 2.9x | 2,196 (12.7%) | 5,655 (53.4%) |
| 3.0x to 3.9x | 1,628 (9.4%) | 2,208 (20.8%) |
| 4.0x or more | 3,661 (21.2%) | 841 (7.9%) |
| Total | 17,289 (100.0%) | 10,592 (100.0%) |
Real Estate Taxes by Mortgage Status in Robeson County
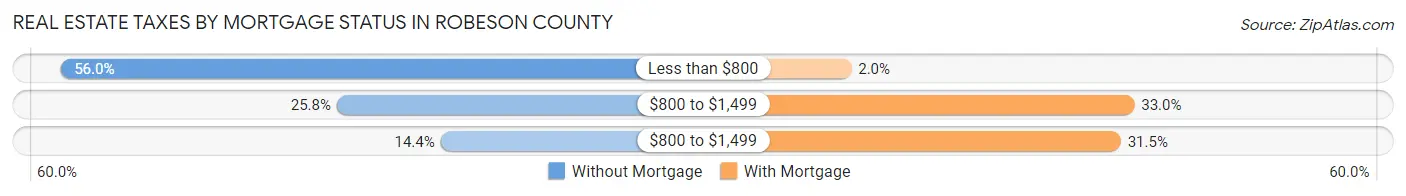
| Property Taxes | Without Mortgage | With Mortgage |
| Less than $800 | 9,678 (56.0%) | 212 (2.0%) |
| $800 to $1,499 | 4,459 (25.8%) | 3,496 (33.0%) |
| $800 to $1,499 | 2,493 (14.4%) | 3,340 (31.5%) |
| Total | 17,289 (100.0%) | 10,592 (100.0%) |
Health & Disability in Robeson County
Health Insurance Coverage by Age in Robeson County
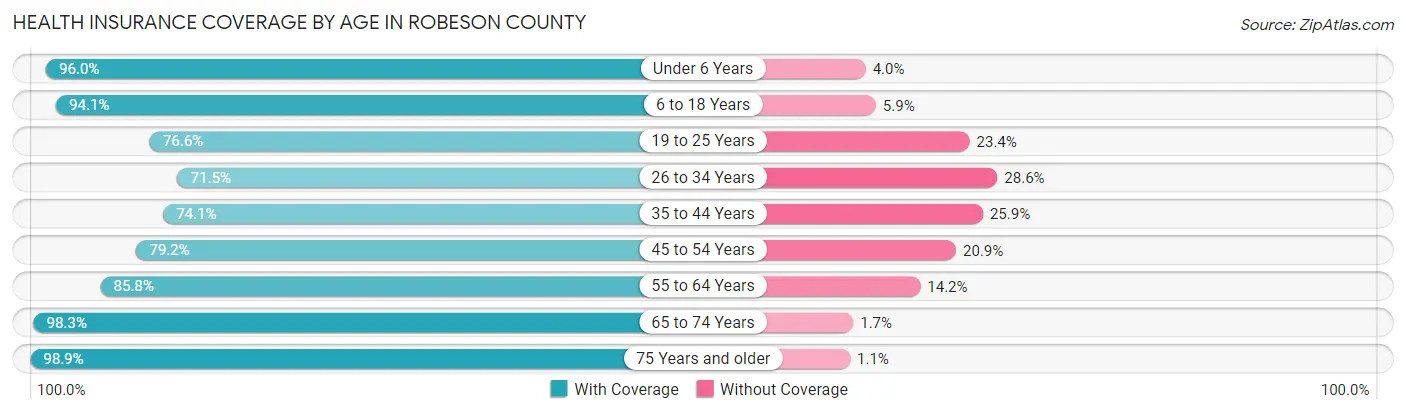
| Age Bracket | With Coverage | Without Coverage |
| Under 6 Years | 8,874 (96.0%) | 370 (4.0%) |
| 6 to 18 Years | 20,849 (94.1%) | 1,305 (5.9%) |
| 19 to 25 Years | 9,012 (76.6%) | 2,748 (23.4%) |
| 26 to 34 Years | 9,154 (71.5%) | 3,657 (28.5%) |
| 35 to 44 Years | 9,736 (74.1%) | 3,396 (25.9%) |
| 45 to 54 Years | 11,289 (79.1%) | 2,974 (20.8%) |
| 55 to 64 Years | 12,545 (85.8%) | 2,073 (14.2%) |
| 65 to 74 Years | 11,097 (98.3%) | 190 (1.7%) |
| 75 Years and older | 6,494 (98.9%) | 71 (1.1%) |
| Total | 99,050 (85.5%) | 16,784 (14.5%) |
Health Insurance Coverage by Citizenship Status in Robeson County
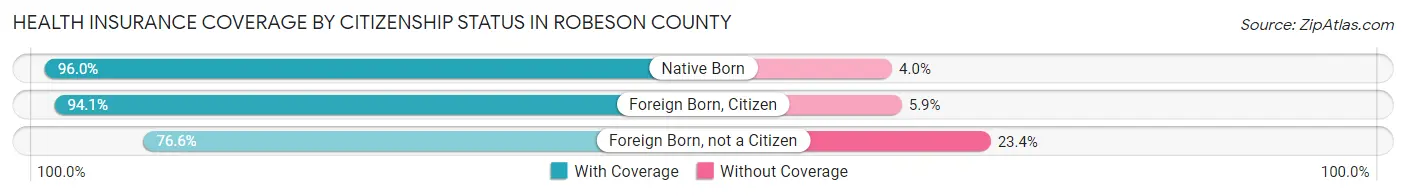
| Citizenship Status | With Coverage | Without Coverage |
| Native Born | 8,874 (96.0%) | 370 (4.0%) |
| Foreign Born, Citizen | 20,849 (94.1%) | 1,305 (5.9%) |
| Foreign Born, not a Citizen | 9,012 (76.6%) | 2,748 (23.4%) |
Health Insurance Coverage by Household Income in Robeson County
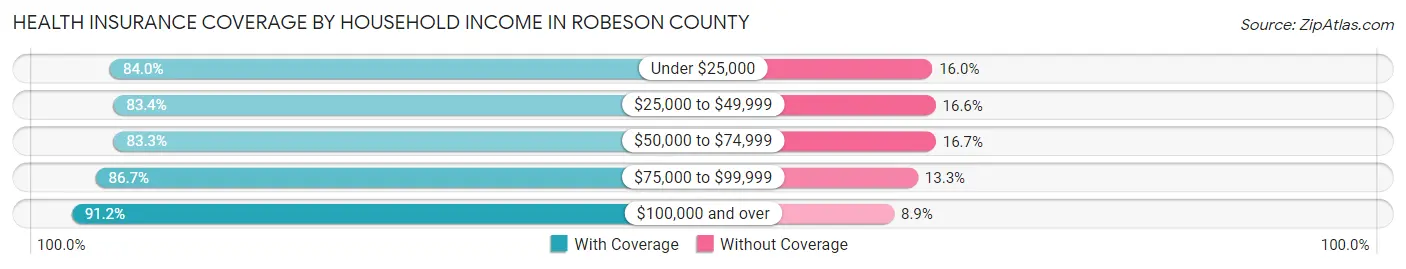
| Household Income | With Coverage | Without Coverage |
| Under $25,000 | 24,224 (84.0%) | 4,617 (16.0%) |
| $25,000 to $49,999 | 24,872 (83.4%) | 4,965 (16.6%) |
| $50,000 to $74,999 | 16,309 (83.3%) | 3,264 (16.7%) |
| $75,000 to $99,999 | 12,861 (86.7%) | 1,977 (13.3%) |
| $100,000 and over | 18,964 (91.1%) | 1,841 (8.8%) |
Public vs Private Health Insurance Coverage by Age in Robeson County
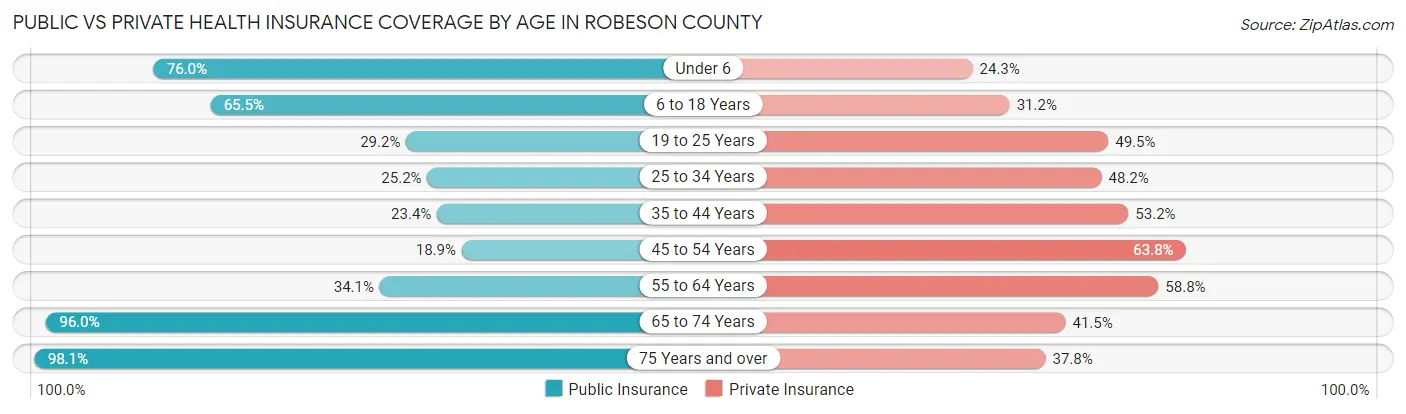
| Age Bracket | Public Insurance | Private Insurance |
| Under 6 | 7,026 (76.0%) | 2,244 (24.3%) |
| 6 to 18 Years | 14,499 (65.4%) | 6,906 (31.2%) |
| 19 to 25 Years | 3,429 (29.2%) | 5,816 (49.5%) |
| 25 to 34 Years | 3,232 (25.2%) | 6,177 (48.2%) |
| 35 to 44 Years | 3,075 (23.4%) | 6,986 (53.2%) |
| 45 to 54 Years | 2,689 (18.9%) | 9,096 (63.8%) |
| 55 to 64 Years | 4,980 (34.1%) | 8,591 (58.8%) |
| 65 to 74 Years | 10,832 (96.0%) | 4,687 (41.5%) |
| 75 Years and over | 6,440 (98.1%) | 2,483 (37.8%) |
| Total | 56,202 (48.5%) | 52,986 (45.7%) |
Disability Status by Sex by Age in Robeson County
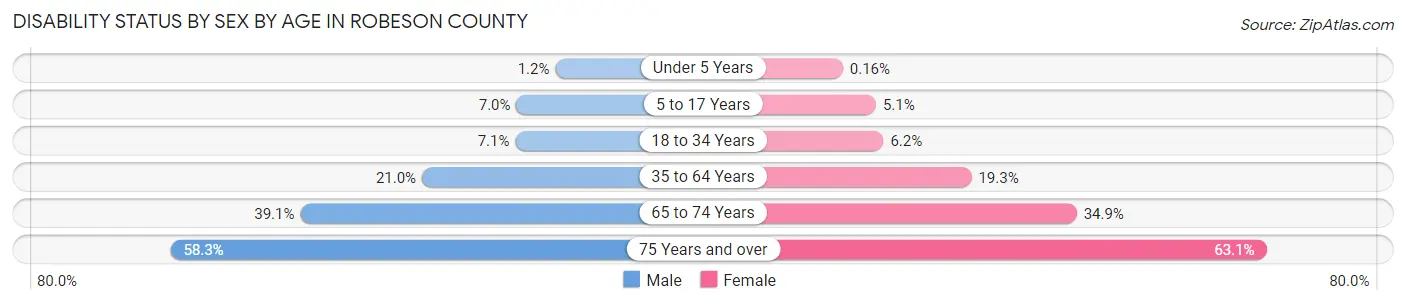
| Age Bracket | Male | Female |
| Under 5 Years | 48 (1.2%) | 6 (0.2%) |
| 5 to 17 Years | 759 (7.0%) | 537 (5.1%) |
| 18 to 34 Years | 937 (7.1%) | 841 (6.2%) |
| 35 to 64 Years | 4,162 (21.0%) | 4,275 (19.3%) |
| 65 to 74 Years | 2,002 (39.1%) | 2,149 (34.9%) |
| 75 Years and over | 1,550 (58.3%) | 2,464 (63.0%) |
Disability Class by Sex by Age in Robeson County
Disability Class: Hearing Difficulty
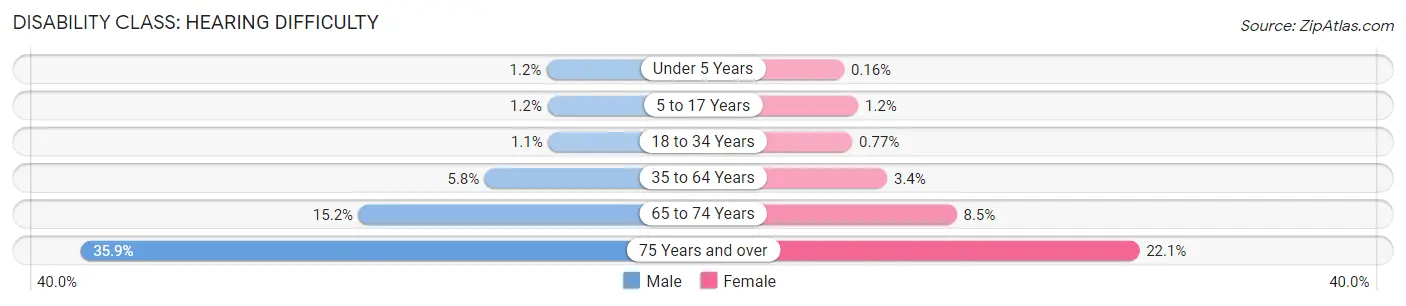
| Age Bracket | Male | Female |
| Under 5 Years | 48 (1.2%) | 6 (0.2%) |
| 5 to 17 Years | 126 (1.2%) | 128 (1.2%) |
| 18 to 34 Years | 145 (1.1%) | 105 (0.8%) |
| 35 to 64 Years | 1,152 (5.8%) | 745 (3.4%) |
| 65 to 74 Years | 778 (15.2%) | 525 (8.5%) |
| 75 Years and over | 953 (35.9%) | 863 (22.1%) |
Disability Class: Vision Difficulty
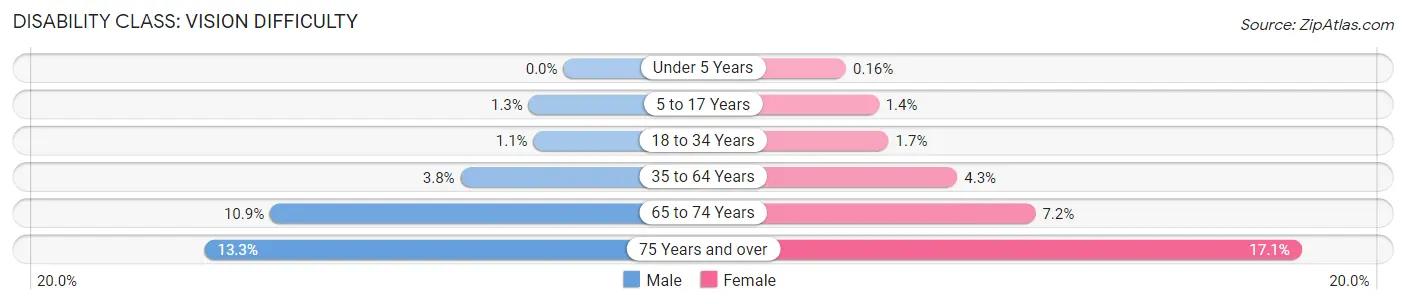
| Age Bracket | Male | Female |
| Under 5 Years | 0 (0.0%) | 6 (0.2%) |
| 5 to 17 Years | 140 (1.3%) | 145 (1.4%) |
| 18 to 34 Years | 146 (1.1%) | 237 (1.7%) |
| 35 to 64 Years | 756 (3.8%) | 952 (4.3%) |
| 65 to 74 Years | 558 (10.9%) | 443 (7.2%) |
| 75 Years and over | 354 (13.3%) | 667 (17.1%) |
Disability Class: Cognitive Difficulty
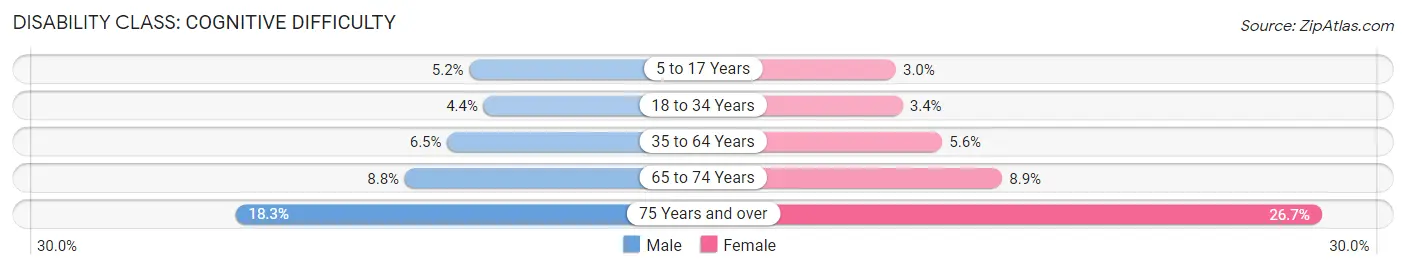
| Age Bracket | Male | Female |
| 5 to 17 Years | 569 (5.2%) | 319 (3.0%) |
| 18 to 34 Years | 582 (4.4%) | 462 (3.4%) |
| 35 to 64 Years | 1,280 (6.5%) | 1,244 (5.6%) |
| 65 to 74 Years | 452 (8.8%) | 551 (8.9%) |
| 75 Years and over | 485 (18.2%) | 1,044 (26.7%) |
Disability Class: Ambulatory Difficulty
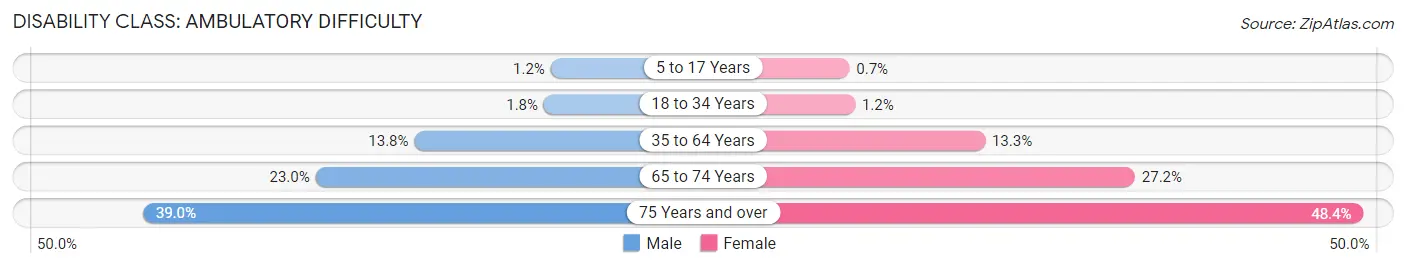
| Age Bracket | Male | Female |
| 5 to 17 Years | 128 (1.2%) | 74 (0.7%) |
| 18 to 34 Years | 238 (1.8%) | 166 (1.2%) |
| 35 to 64 Years | 2,740 (13.8%) | 2,951 (13.3%) |
| 65 to 74 Years | 1,179 (23.0%) | 1,676 (27.2%) |
| 75 Years and over | 1,037 (39.0%) | 1,892 (48.4%) |
Disability Class: Self-Care Difficulty
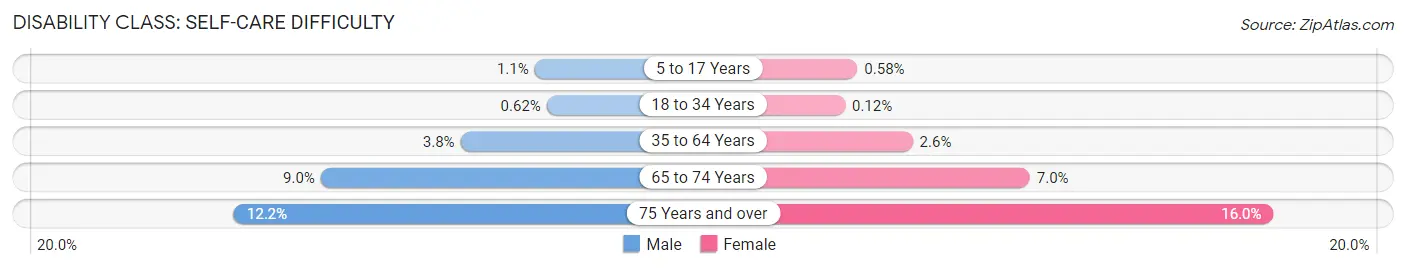
| Age Bracket | Male | Female |
| 5 to 17 Years | 116 (1.1%) | 61 (0.6%) |
| 18 to 34 Years | 81 (0.6%) | 16 (0.1%) |
| 35 to 64 Years | 757 (3.8%) | 583 (2.6%) |
| 65 to 74 Years | 462 (9.0%) | 430 (7.0%) |
| 75 Years and over | 325 (12.2%) | 626 (16.0%) |
Technology Access in Robeson County
Computing Device Access in Robeson County
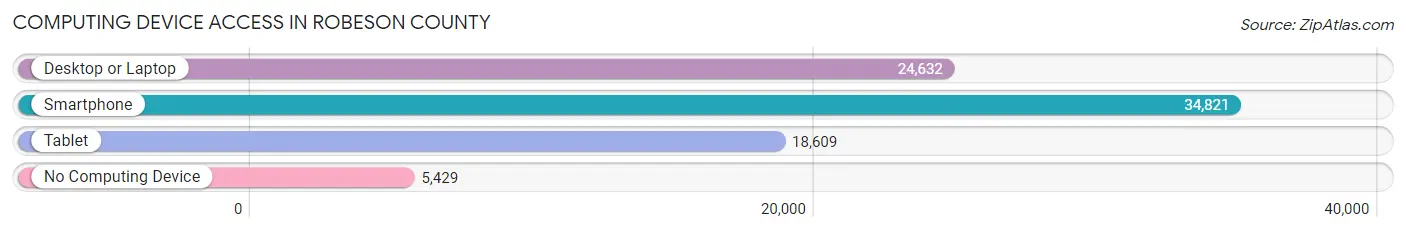
| Device Type | # Households | % Households |
| Desktop or Laptop | 24,632 | 58.0% |
| Smartphone | 34,821 | 81.9% |
| Tablet | 18,609 | 43.8% |
| No Computing Device | 5,429 | 12.8% |
| Total | 42,509 | 100.0% |
Internet Access in Robeson County
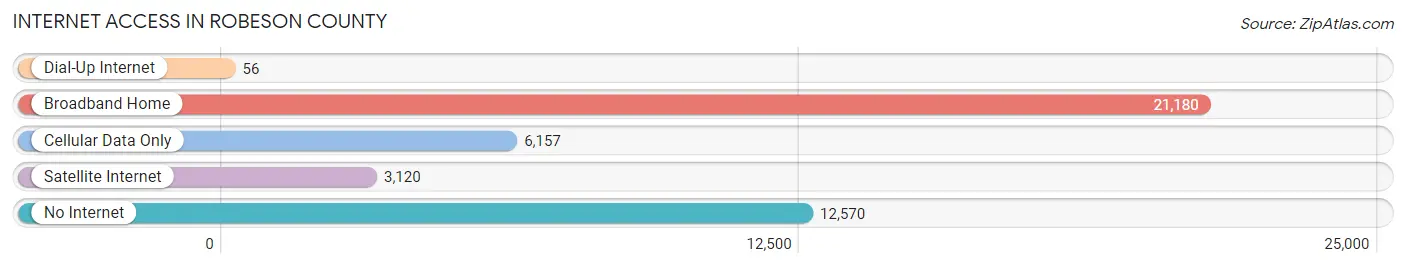
| Internet Type | # Households | % Households |
| Dial-Up Internet | 56 | 0.1% |
| Broadband Home | 21,180 | 49.8% |
| Cellular Data Only | 6,157 | 14.5% |
| Satellite Internet | 3,120 | 7.3% |
| No Internet | 12,570 | 29.6% |
| Total | 42,509 | 100.0% |
Robeson County Summary
Robeson County, North Carolina is located in the southeastern corner of the state and is the largest county in North Carolina by land area. It is bordered by Scotland County to the north, Bladen County to the east, Columbus County to the south, and Cumberland County to the west. The county seat is Lumberton, and the county is home to a population of 134,168 people as of the 2019 census.
History
Robeson County was formed in 1787 from Bladen County and was named for Colonel Thomas Robeson, a Revolutionary War hero. The county was home to the Lumbee Tribe of Native Americans, who were the largest Native American tribe east of the Mississippi River. The Lumbee were originally part of the Cheraw tribe, but they were forced to migrate to Robeson County in the late 1700s. The Lumbee have been recognized as a tribe by the state of North Carolina since 1885.
Robeson County was a major center of the Civil War, with several battles taking place in the area. The Battle of Averasboro was fought in the county in 1865, and the Battle of Bentonville was fought nearby in Johnston County.
Geography
Robeson County is located in the southeastern corner of North Carolina and is the largest county in the state by land area. It is bordered by Scotland County to the north, Bladen County to the east, Columbus County to the south, and Cumberland County to the west. The county is located in the Coastal Plain region of the state and is mostly flat, with some rolling hills in the northern part of the county. The Lumber River runs through the county and is a popular destination for fishing, canoeing, and kayaking.
The county is home to several state parks, including Lumber River State Park, which is located along the Lumber River and is a popular destination for camping, fishing, and canoeing. The county is also home to the Carolina Sandhills National Wildlife Refuge, which is a protected area of sandhills and longleaf pine forests.
Economy
Robeson County has a diverse economy, with the largest industries being manufacturing, healthcare, and retail. The county is home to several large manufacturing companies, including Corning, Inc., which produces glass and ceramic products, and Pactiv, which produces plastic packaging products. The county is also home to several healthcare facilities, including Southeastern Regional Medical Center and Robeson Health Care Corporation.
Retail is also an important part of the county’s economy, with several large shopping centers located in the county, including Lumberton Mall and Biggs Park Mall. The county is also home to several large employers, including the Robeson County Public Schools system, which employs over 4,000 people.
Demographics
Robeson County is home to a population of 134,168 people as of the 2019 census. The population is 44.3% white, 43.2% African American, 8.2% Native American, and 4.3% Hispanic or Latino. The median household income in the county is $37,845, and the median home value is $117,400.
Robeson County is home to several colleges and universities, including the University of North Carolina at Pembroke, which is the only public university in the county. The county is also home to several private colleges, including St. Andrews University and Methodist University.
Conclusion
Robeson County, North Carolina is a large county located in the southeastern corner of the state. It is home to a diverse population and a diverse economy, with the largest industries being manufacturing, healthcare, and retail. The county is also home to several colleges and universities, making it an attractive destination for students and professionals alike.
Common Questions
What is Per Capita Income in Robeson County?
Per Capita income in Robeson County is $21,998.
What is the Median Family Income in Robeson County?
Median Family Income in Robeson County is $50,612.
What is the Median Household income in Robeson County?
Median Household Income in Robeson County is $39,393.
What is Income or Wage Gap in Robeson County?
Income or Wage Gap in Robeson County is 19.2%.
Women in Robeson County earn 80.8 cents for every dollar earned by a man.
What is Family Income Deficit in Robeson County?
Family Income Deficit in Robeson County is $11,869.
Families that are below poverty line in Robeson County earn $11,869 less on average than the poverty threshold level.
What is Inequality or Gini Index in Robeson County?
Inequality or Gini Index in Robeson County is 0.50.
What is the Total Population of Robeson County?
Total Population of Robeson County is 117,573.
What is the Total Male Population of Robeson County?
Total Male Population of Robeson County is 56,878.
What is the Total Female Population of Robeson County?
Total Female Population of Robeson County is 60,695.
What is the Ratio of Males per 100 Females in Robeson County?
There are 93.71 Males per 100 Females in Robeson County.
What is the Ratio of Females per 100 Males in Robeson County?
There are 106.71 Females per 100 Males in Robeson County.
What is the Median Population Age in Robeson County?
Median Population Age in Robeson County is 36.8 Years.
What is the Average Family Size in Robeson County
Average Family Size in Robeson County is 3.4 People.
What is the Average Household Size in Robeson County
Average Household Size in Robeson County is 2.7 People.
How Large is the Labor Force in Robeson County?
There are 46,744 People in the Labor Forcein in Robeson County.
What is the Percentage of People in the Labor Force in Robeson County?
51.0% of People are in the Labor Force in Robeson County.
What is the Unemployment Rate in Robeson County?
Unemployment Rate in Robeson County is 6.4%.