Salisbury, NC Map & Demographics
Salisbury Map
Salisbury Overview
$30,319
PER CAPITA INCOME
$64,583
AVG FAMILY INCOME
$48,888
AVG HOUSEHOLD INCOME
28.0%
WAGE / INCOME GAP [ % ]
72.0¢/ $1
WAGE / INCOME GAP [ $ ]
$10,958
FAMILY INCOME DEFICIT
0.52
INEQUALITY / GINI INDEX
35,437
TOTAL POPULATION
18,198
MALE POPULATION
17,239
FEMALE POPULATION
105.56
MALES / 100 FEMALES
94.73
FEMALES / 100 MALES
36.5
MEDIAN AGE
3.1
AVG FAMILY SIZE
2.4
AVG HOUSEHOLD SIZE
16,254
LABOR FORCE [ PEOPLE ]
57.1%
PERCENT IN LABOR FORCE
7.0%
UNEMPLOYMENT RATE
Income in Salisbury
Income Overview in Salisbury
Per Capita Income in Salisbury is $30,319, while median incomes of families and households are $64,583 and $48,888 respectively.
| Characteristic | Number | Measure |
| Per Capita Income | 35,437 | $30,319 |
| Median Family Income | 7,785 | $64,583 |
| Mean Family Income | 7,785 | $98,105 |
| Median Household Income | 13,258 | $48,888 |
| Mean Household Income | 13,258 | $75,239 |
| Income Deficit | 7,785 | $10,958 |
| Wage / Income Gap (%) | 35,437 | 27.95% |
| Wage / Income Gap ($) | 35,437 | 72.05¢ per $1 |
| Gini / Inequality Index | 35,437 | 0.52 |
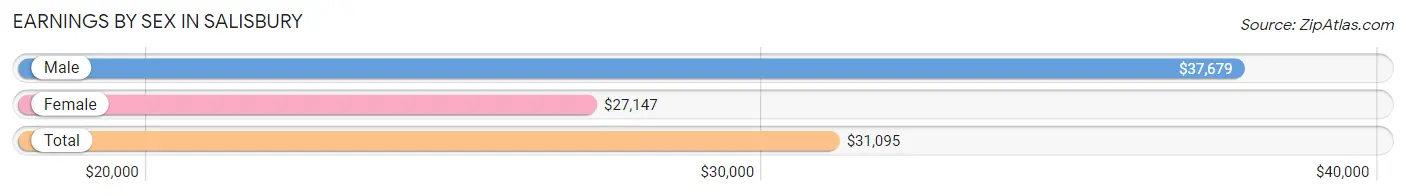
Earnings by Sex in Salisbury
Average Earnings in Salisbury are $31,095, $37,679 for men and $27,147 for women, a difference of 28.0%.
| Sex | Number | Average Earnings |
| Male | 9,073 (51.7%) | $37,679 |
| Female | 8,479 (48.3%) | $27,147 |
| Total | 17,552 (100.0%) | $31,095 |
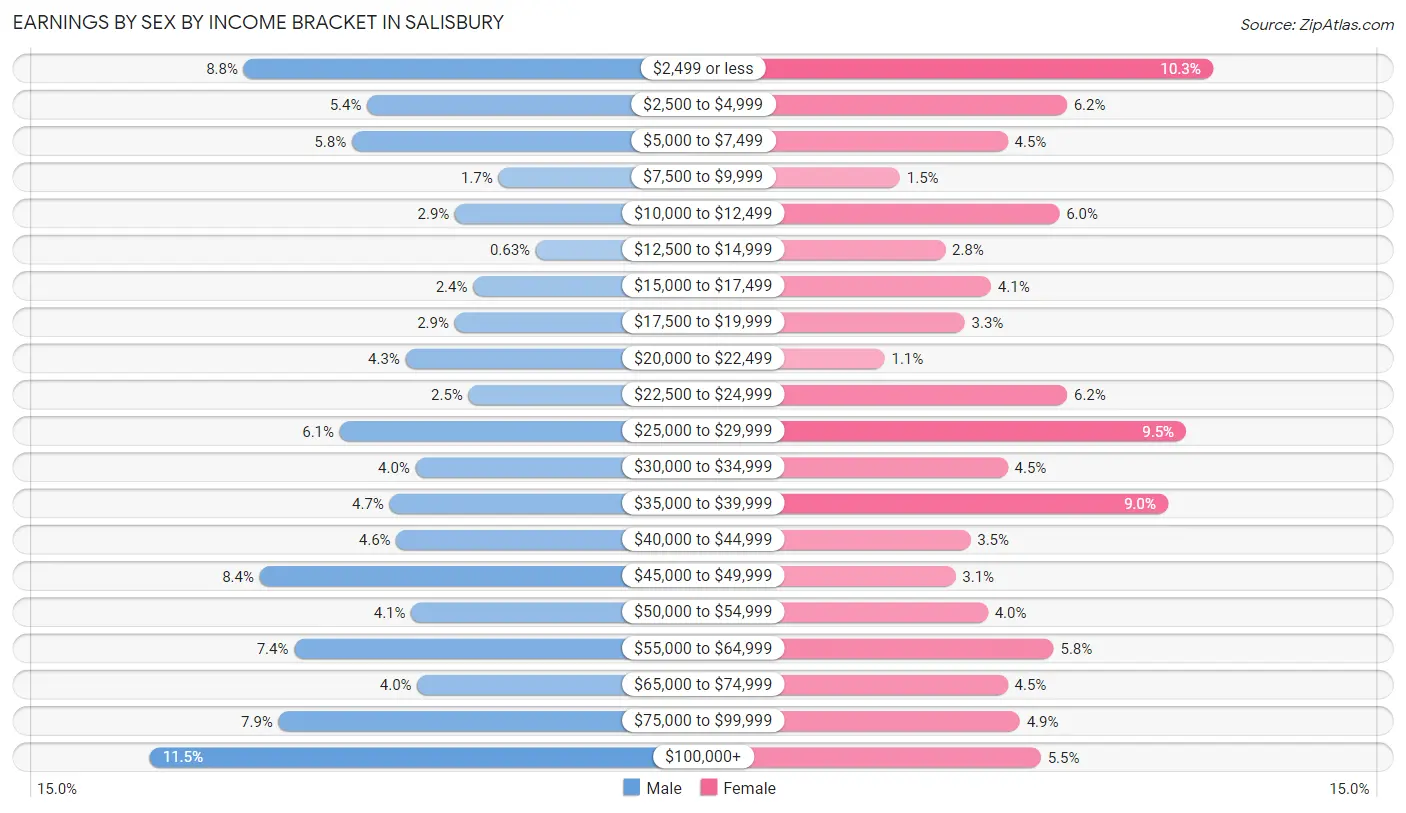
Earnings by Sex by Income Bracket in Salisbury
The most common earnings brackets in Salisbury are $100,000+ for men (1,042 | 11.5%) and $2,499 or less for women (872 | 10.3%).
| Income | Male | Female |
| $2,499 or less | 802 (8.8%) | 872 (10.3%) |
| $2,500 to $4,999 | 487 (5.4%) | 524 (6.2%) |
| $5,000 to $7,499 | 526 (5.8%) | 383 (4.5%) |
| $7,500 to $9,999 | 152 (1.7%) | 126 (1.5%) |
| $10,000 to $12,499 | 263 (2.9%) | 506 (6.0%) |
| $12,500 to $14,999 | 57 (0.6%) | 234 (2.8%) |
| $15,000 to $17,499 | 217 (2.4%) | 343 (4.1%) |
| $17,500 to $19,999 | 264 (2.9%) | 281 (3.3%) |
| $20,000 to $22,499 | 389 (4.3%) | 90 (1.1%) |
| $22,500 to $24,999 | 229 (2.5%) | 525 (6.2%) |
| $25,000 to $29,999 | 557 (6.1%) | 808 (9.5%) |
| $30,000 to $34,999 | 364 (4.0%) | 383 (4.5%) |
| $35,000 to $39,999 | 430 (4.7%) | 765 (9.0%) |
| $40,000 to $44,999 | 413 (4.5%) | 294 (3.5%) |
| $45,000 to $49,999 | 761 (8.4%) | 259 (3.0%) |
| $50,000 to $54,999 | 375 (4.1%) | 336 (4.0%) |
| $55,000 to $64,999 | 673 (7.4%) | 493 (5.8%) |
| $65,000 to $74,999 | 359 (4.0%) | 383 (4.5%) |
| $75,000 to $99,999 | 713 (7.9%) | 412 (4.9%) |
| $100,000+ | 1,042 (11.5%) | 462 (5.4%) |
| Total | 9,073 (100.0%) | 8,479 (100.0%) |
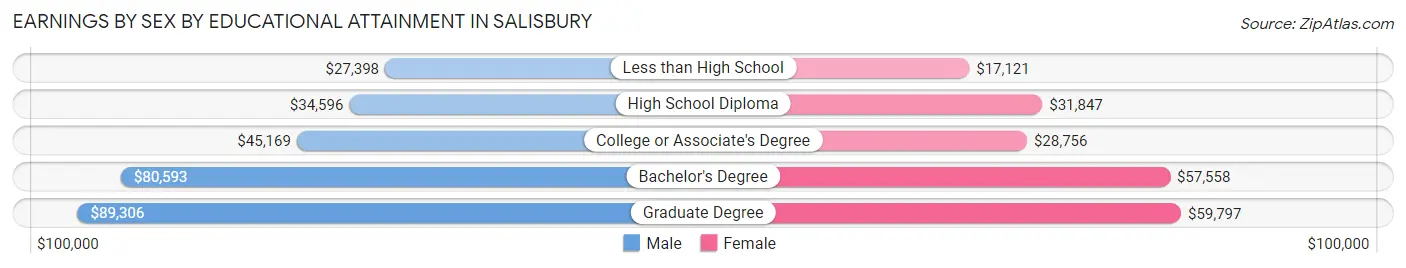
Earnings by Sex by Educational Attainment in Salisbury
Average earnings in Salisbury are $45,524 for men and $35,028 for women, a difference of 23.1%. Men with an educational attainment of graduate degree enjoy the highest average annual earnings of $89,306, while those with less than high school education earn the least with $27,398. Women with an educational attainment of graduate degree earn the most with the average annual earnings of $59,797, while those with less than high school education have the smallest earnings of $17,121.
| Educational Attainment | Male Income | Female Income |
| Less than High School | $27,398 | $17,121 |
| High School Diploma | $34,596 | $31,847 |
| College or Associate's Degree | $45,169 | $28,756 |
| Bachelor's Degree | $80,593 | $57,558 |
| Graduate Degree | $89,306 | $59,797 |
| Total | $45,524 | $35,028 |
Family Income in Salisbury
Family Income Brackets in Salisbury
According to the Salisbury family income data, there are 1,362 families falling into the $50,000 to $74,999 income range, which is the most common income bracket and makes up 17.5% of all families. Conversely, the $10,000 to $14,999 income bracket is the least frequent group with only 304 families (3.9%) belonging to this category.
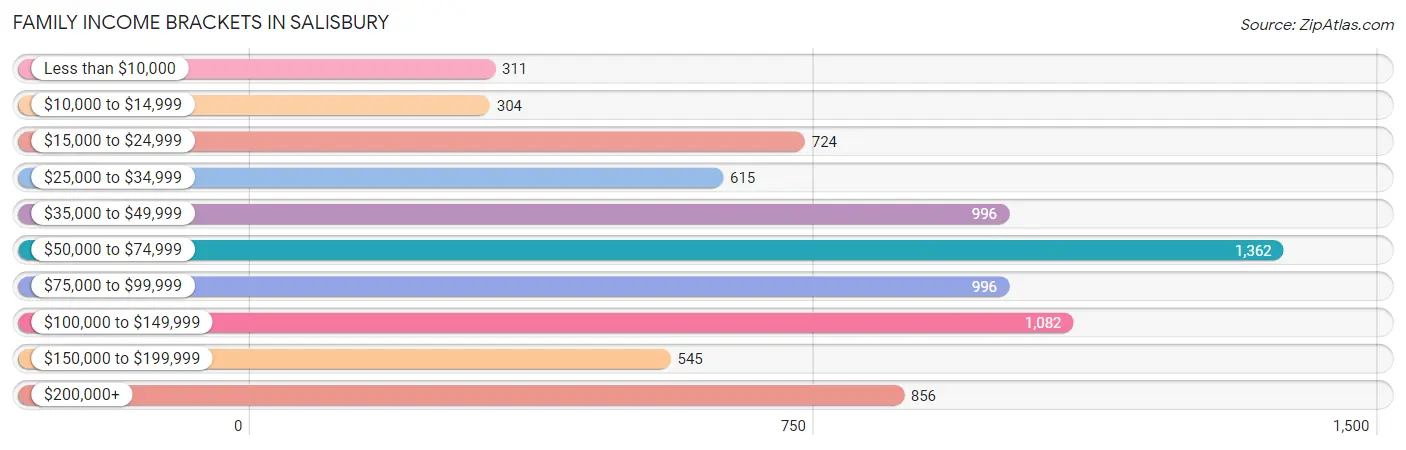
| Income Bracket | # Families | % Families |
| Less than $10,000 | 311 | 4.0% |
| $10,000 to $14,999 | 304 | 3.9% |
| $15,000 to $24,999 | 724 | 9.3% |
| $25,000 to $34,999 | 615 | 7.9% |
| $35,000 to $49,999 | 996 | 12.8% |
| $50,000 to $74,999 | 1,362 | 17.5% |
| $75,000 to $99,999 | 996 | 12.8% |
| $100,000 to $149,999 | 1,082 | 13.9% |
| $150,000 to $199,999 | 545 | 7.0% |
| $200,000+ | 856 | 11.0% |
Family Income by Famaliy Size in Salisbury
5-person families (734 | 9.4%) account for the highest median family income in Salisbury with $83,333 per family, while 2-person families (3,479 | 44.7%) have the highest median income of $34,168 per family member.
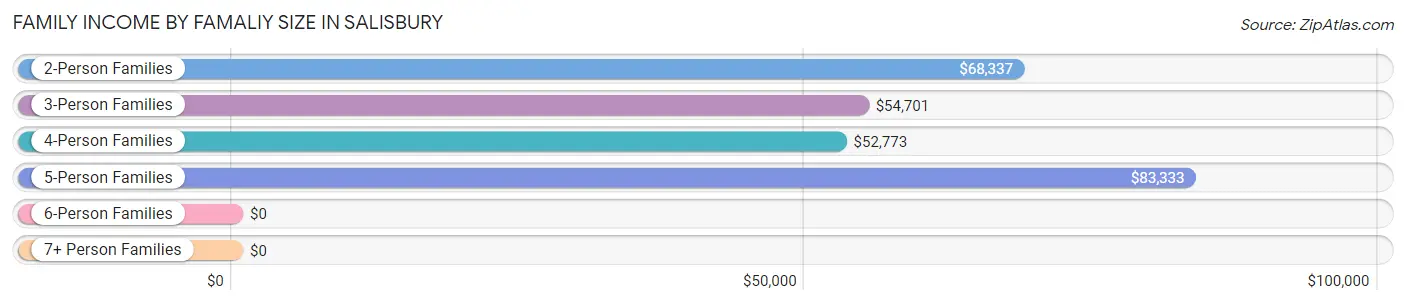
| Income Bracket | # Families | Median Income |
| 2-Person Families | 3,479 (44.7%) | $68,337 |
| 3-Person Families | 2,086 (26.8%) | $54,701 |
| 4-Person Families | 1,153 (14.8%) | $52,773 |
| 5-Person Families | 734 (9.4%) | $83,333 |
| 6-Person Families | 220 (2.8%) | $0 |
| 7+ Person Families | 113 (1.5%) | $0 |
| Total | 7,785 (100.0%) | $64,583 |
Family Income by Number of Earners in Salisbury
The median family income in Salisbury is $64,583, with families comprising 2 earners (3,267) having the highest median family income of $95,064, while families with no earners (988) have the lowest median family income of $46,731, accounting for 42.0% and 12.7% of families, respectively.
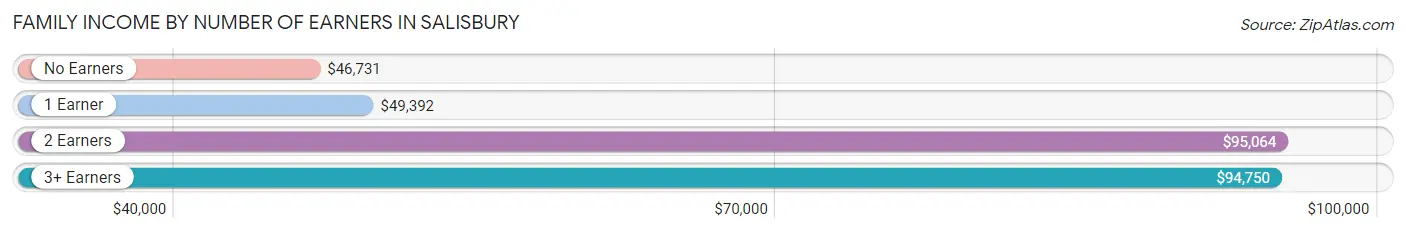
| Number of Earners | # Families | Median Income |
| No Earners | 988 (12.7%) | $46,731 |
| 1 Earner | 3,125 (40.1%) | $49,392 |
| 2 Earners | 3,267 (42.0%) | $95,064 |
| 3+ Earners | 405 (5.2%) | $94,750 |
| Total | 7,785 (100.0%) | $64,583 |
Household Income in Salisbury
Household Income Brackets in Salisbury
With 1,949 households falling in the category, the $50,000 to $74,999 income range is the most frequent in Salisbury, accounting for 14.7% of all households. In contrast, only 570 households (4.3%) fall into the $150,000 to $199,999 income bracket, making it the least populous group.
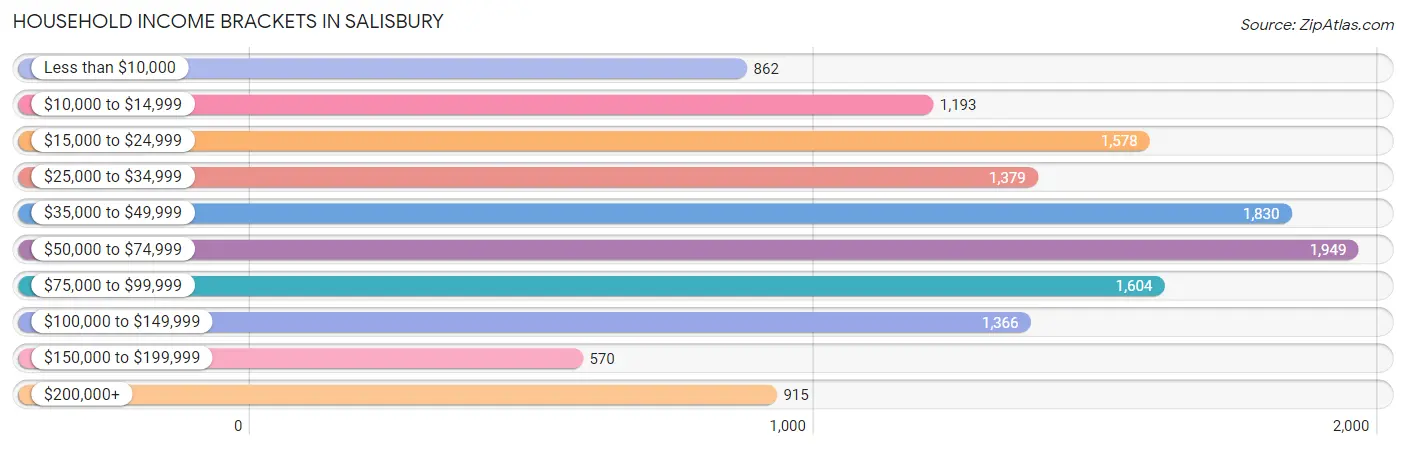
| Income Bracket | # Households | % Households |
| Less than $10,000 | 862 | 6.5% |
| $10,000 to $14,999 | 1,193 | 9.0% |
| $15,000 to $24,999 | 1,578 | 11.9% |
| $25,000 to $34,999 | 1,379 | 10.4% |
| $35,000 to $49,999 | 1,830 | 13.8% |
| $50,000 to $74,999 | 1,949 | 14.7% |
| $75,000 to $99,999 | 1,604 | 12.1% |
| $100,000 to $149,999 | 1,366 | 10.3% |
| $150,000 to $199,999 | 570 | 4.3% |
| $200,000+ | 915 | 6.9% |
Household Income by Householder Age in Salisbury
The median household income in Salisbury is $48,888, with the highest median household income of $64,301 found in the 45 to 64 years age bracket for the primary householder. A total of 4,745 households (35.8%) fall into this category. Meanwhile, the 15 to 24 years age bracket for the primary householder has the lowest median household income of $24,767, with 605 households (4.6%) in this group.
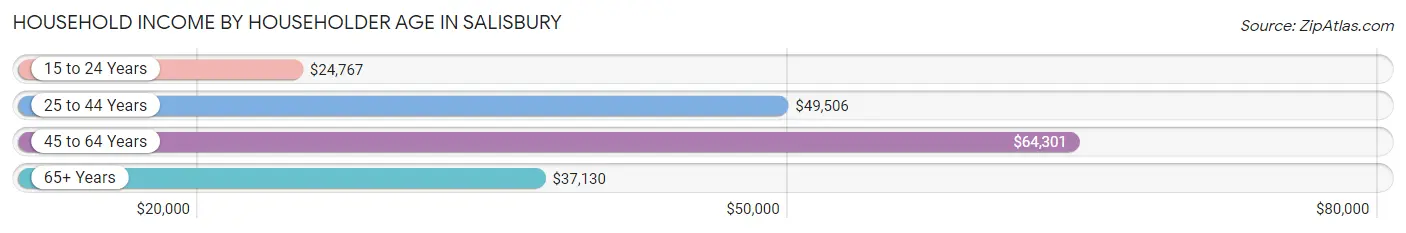
| Income Bracket | # Households | Median Income |
| 15 to 24 Years | 605 (4.6%) | $24,767 |
| 25 to 44 Years | 4,073 (30.7%) | $49,506 |
| 45 to 64 Years | 4,745 (35.8%) | $64,301 |
| 65+ Years | 3,835 (28.9%) | $37,130 |
| Total | 13,258 (100.0%) | $48,888 |
Poverty in Salisbury
Income Below Poverty by Sex and Age in Salisbury
With 22.3% poverty level for males and 24.3% for females among the residents of Salisbury, 5 year old males and 5 year old females are the most vulnerable to poverty, with 179 males (77.2%) and 178 females (61.0%) in their respective age groups living below the poverty level.
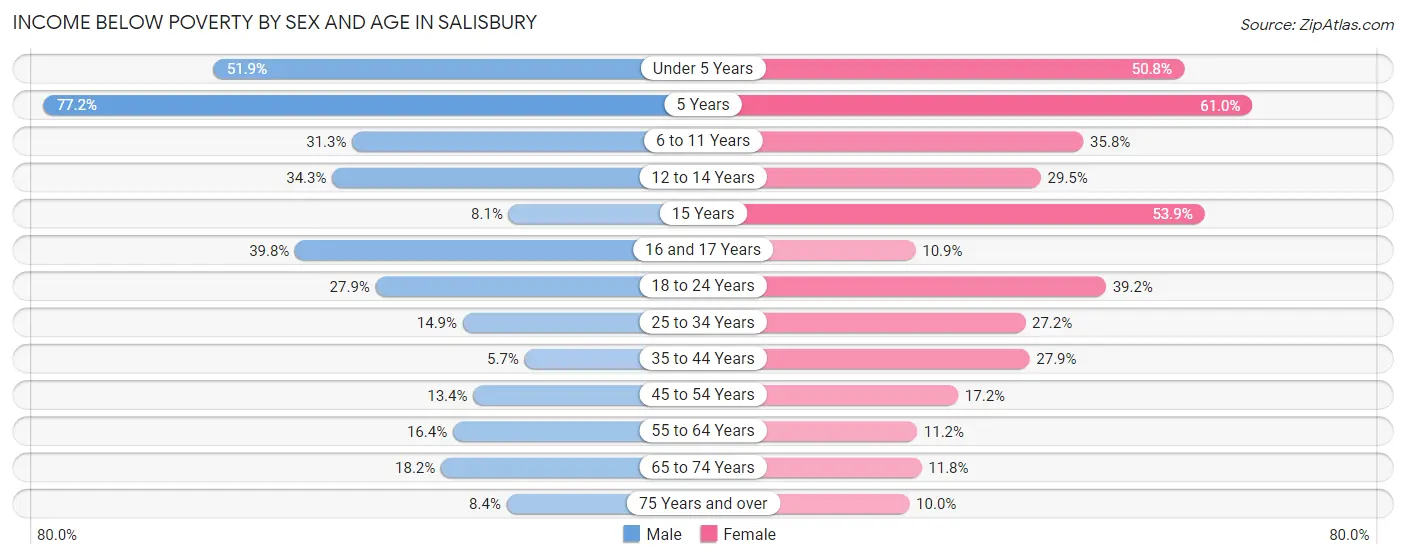
| Age Bracket | Male | Female |
| Under 5 Years | 709 (51.9%) | 289 (50.8%) |
| 5 Years | 179 (77.2%) | 178 (61.0%) |
| 6 to 11 Years | 441 (31.3%) | 462 (35.8%) |
| 12 to 14 Years | 303 (34.3%) | 142 (29.5%) |
| 15 Years | 12 (8.1%) | 161 (53.8%) |
| 16 and 17 Years | 219 (39.8%) | 43 (10.9%) |
| 18 to 24 Years | 342 (27.9%) | 573 (39.2%) |
| 25 to 34 Years | 354 (14.9%) | 573 (27.2%) |
| 35 to 44 Years | 100 (5.7%) | 565 (27.9%) |
| 45 to 54 Years | 252 (13.4%) | 368 (17.2%) |
| 55 to 64 Years | 300 (16.4%) | 206 (11.2%) |
| 65 to 74 Years | 249 (18.1%) | 212 (11.8%) |
| 75 Years and over | 64 (8.4%) | 141 (10.0%) |
| Total | 3,524 (22.3%) | 3,913 (24.3%) |
Income Above Poverty by Sex and Age in Salisbury
According to the poverty statistics in Salisbury, males aged 35 to 44 years and females aged 75 years and over are the age groups that are most secure financially, with 94.3% of males and 90.0% of females in these age groups living above the poverty line.
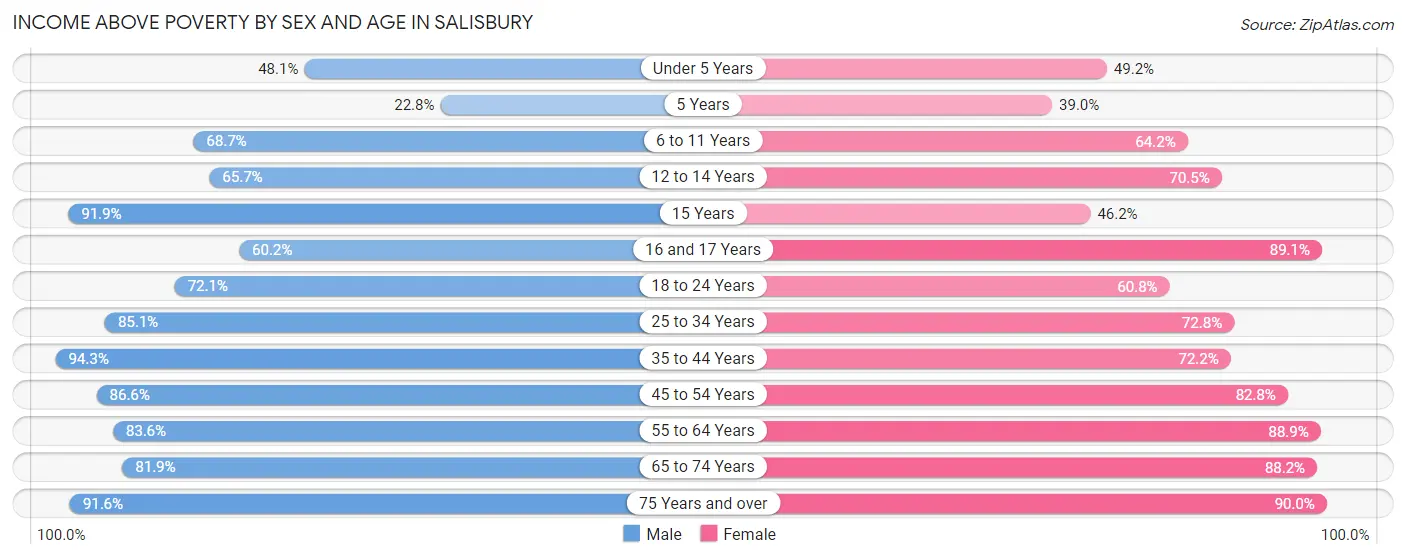
| Age Bracket | Male | Female |
| Under 5 Years | 657 (48.1%) | 280 (49.2%) |
| 5 Years | 53 (22.8%) | 114 (39.0%) |
| 6 to 11 Years | 966 (68.7%) | 827 (64.2%) |
| 12 to 14 Years | 580 (65.7%) | 339 (70.5%) |
| 15 Years | 136 (91.9%) | 138 (46.2%) |
| 16 and 17 Years | 331 (60.2%) | 351 (89.1%) |
| 18 to 24 Years | 885 (72.1%) | 889 (60.8%) |
| 25 to 34 Years | 2,019 (85.1%) | 1,533 (72.8%) |
| 35 to 44 Years | 1,643 (94.3%) | 1,464 (72.2%) |
| 45 to 54 Years | 1,633 (86.6%) | 1,767 (82.8%) |
| 55 to 64 Years | 1,530 (83.6%) | 1,642 (88.8%) |
| 65 to 74 Years | 1,123 (81.9%) | 1,583 (88.2%) |
| 75 Years and over | 697 (91.6%) | 1,269 (90.0%) |
| Total | 12,253 (77.7%) | 12,196 (75.7%) |
Income Below Poverty Among Married-Couple Families in Salisbury
The poverty statistics for married-couple families in Salisbury show that 5.2% or 251 of the total 4,811 families live below the poverty line. Families with 3 or 4 children have the highest poverty rate of 29.2%, comprising of 121 families. On the other hand, families with 5 or more children have the lowest poverty rate of 0.0%, which includes 0 families.
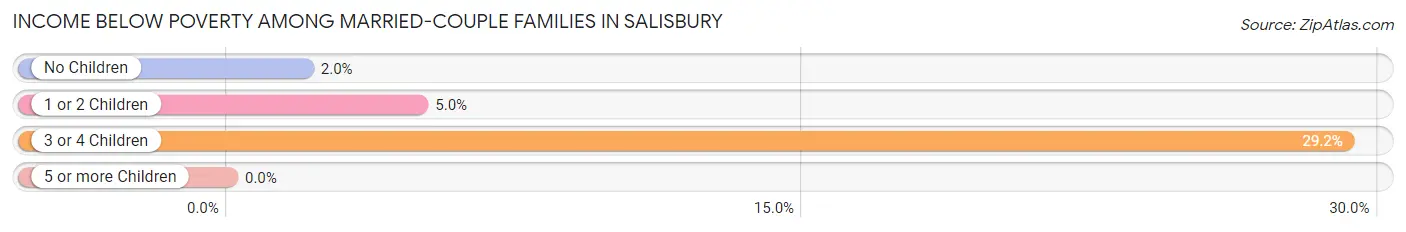
| Children | Above Poverty | Below Poverty |
| No Children | 2,866 (98.0%) | 58 (2.0%) |
| 1 or 2 Children | 1,377 (95.0%) | 72 (5.0%) |
| 3 or 4 Children | 294 (70.8%) | 121 (29.2%) |
| 5 or more Children | 23 (100.0%) | 0 (0.0%) |
| Total | 4,560 (94.8%) | 251 (5.2%) |
Income Below Poverty Among Single-Parent Households in Salisbury
According to the poverty data in Salisbury, 10.9% or 69 single-father households and 42.8% or 1,002 single-mother households are living below the poverty line. Among single-father households, those with 1 or 2 children have the highest poverty rate, with 69 households (34.3%) experiencing poverty. Likewise, among single-mother households, those with 5 or more children have the highest poverty rate, with 10 households (100.0%) falling below the poverty line.
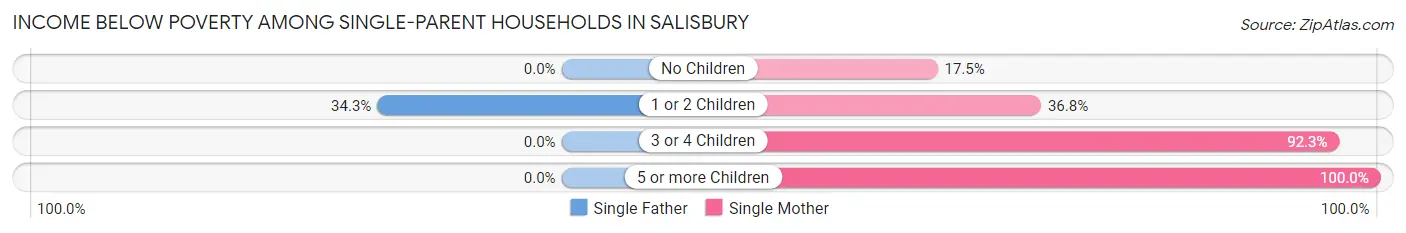
| Children | Single Father | Single Mother |
| No Children | 0 (0.0%) | 120 (17.5%) |
| 1 or 2 Children | 69 (34.3%) | 427 (36.7%) |
| 3 or 4 Children | 0 (0.0%) | 445 (92.3%) |
| 5 or more Children | 0 (0.0%) | 10 (100.0%) |
| Total | 69 (10.9%) | 1,002 (42.8%) |
Income Below Poverty Among Married-Couple vs Single-Parent Households in Salisbury
The poverty data for Salisbury shows that 251 of the married-couple family households (5.2%) and 1,071 of the single-parent households (36.0%) are living below the poverty level. Within the married-couple family households, those with 3 or 4 children have the highest poverty rate, with 121 households (29.2%) falling below the poverty line. Among the single-parent households, those with 5 or more children have the highest poverty rate, with 10 household (100.0%) living below poverty.
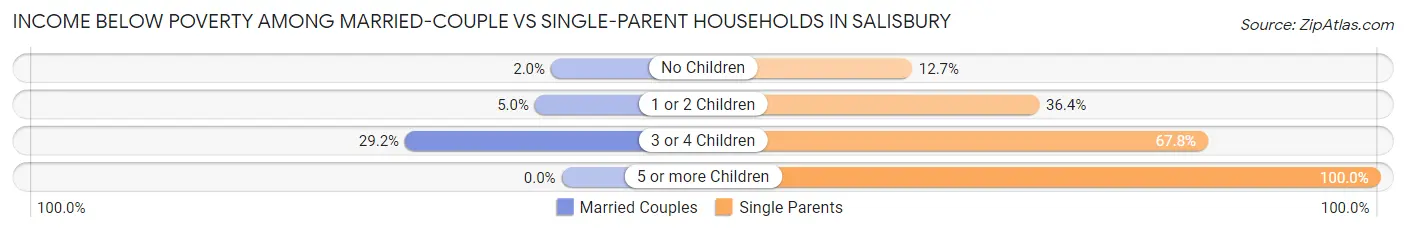
| Children | Married-Couple Families | Single-Parent Households |
| No Children | 58 (2.0%) | 120 (12.7%) |
| 1 or 2 Children | 72 (5.0%) | 496 (36.4%) |
| 3 or 4 Children | 121 (29.2%) | 445 (67.8%) |
| 5 or more Children | 0 (0.0%) | 10 (100.0%) |
| Total | 251 (5.2%) | 1,071 (36.0%) |
Race in Salisbury
The most populous races in Salisbury are White / Caucasian (18,813 | 53.1%), Black / African American (13,217 | 37.3%), and Hispanic or Latino (3,650 | 10.3%).
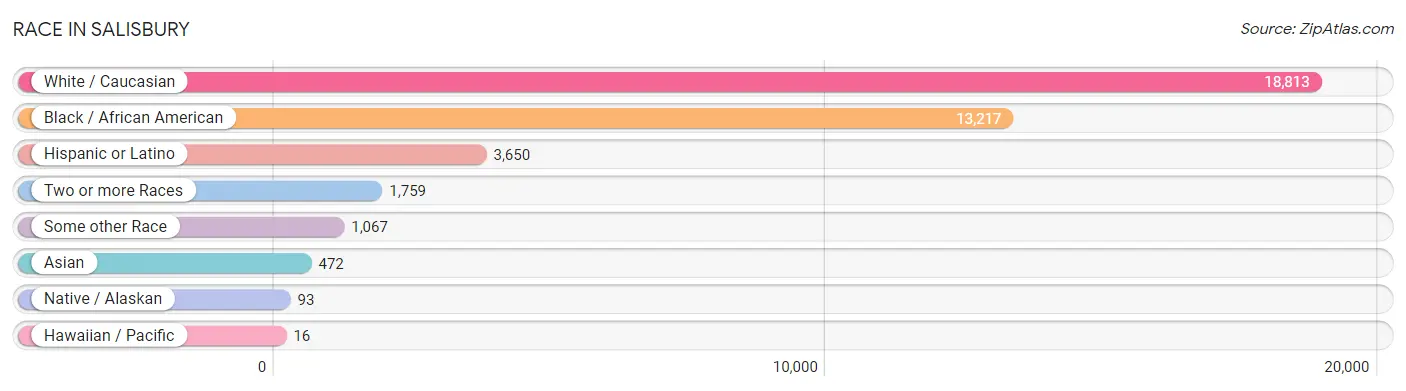
| Race | # Population | % Population |
| Asian | 472 | 1.3% |
| Black / African American | 13,217 | 37.3% |
| Hawaiian / Pacific | 16 | 0.1% |
| Hispanic or Latino | 3,650 | 10.3% |
| Native / Alaskan | 93 | 0.3% |
| White / Caucasian | 18,813 | 53.1% |
| Two or more Races | 1,759 | 5.0% |
| Some other Race | 1,067 | 3.0% |
| Total | 35,437 | 100.0% |
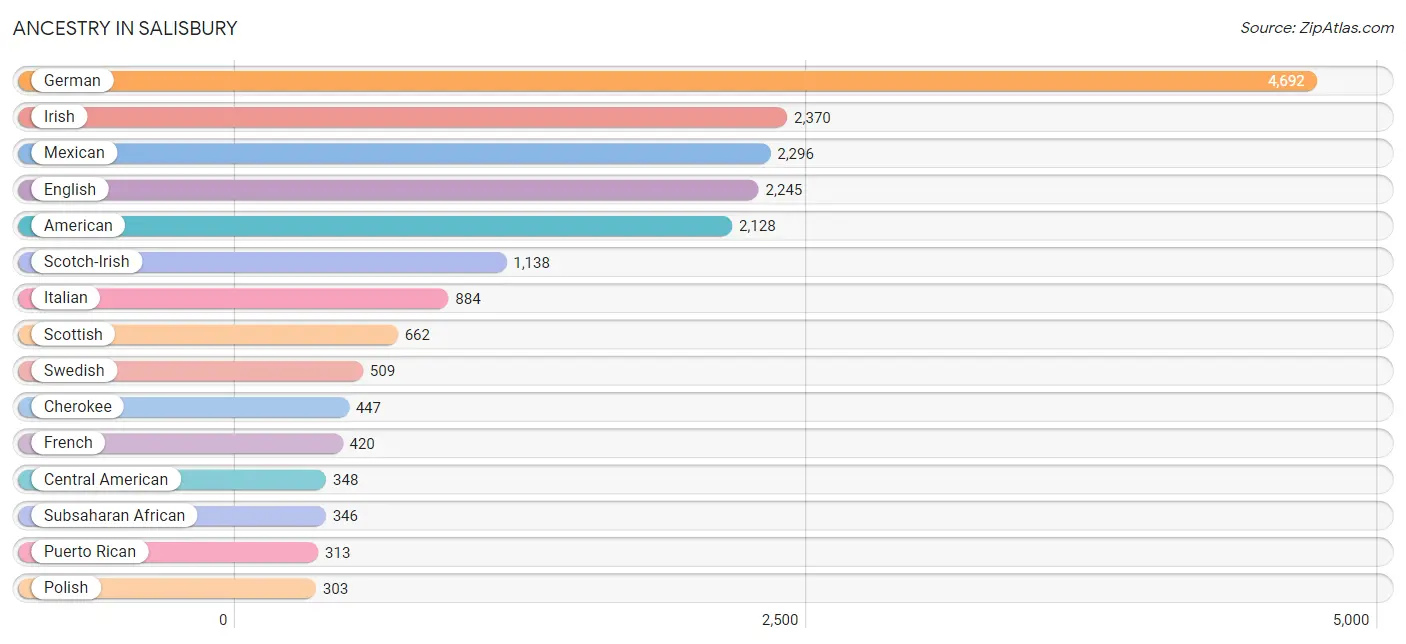
Ancestry in Salisbury
The most populous ancestries reported in Salisbury are German (4,692 | 13.2%), Irish (2,370 | 6.7%), Mexican (2,296 | 6.5%), English (2,245 | 6.3%), and American (2,128 | 6.0%), together accounting for 38.8% of all Salisbury residents.
| Ancestry | # Population | % Population |
| African | 194 | 0.5% |
| Albanian | 22 | 0.1% |
| American | 2,128 | 6.0% |
| Apache | 32 | 0.1% |
| Arab | 111 | 0.3% |
| Austrian | 5 | 0.0% |
| Barbadian | 10 | 0.0% |
| Blackfeet | 32 | 0.1% |
| British | 150 | 0.4% |
| British West Indian | 7 | 0.0% |
| Burmese | 30 | 0.1% |
| Canadian | 41 | 0.1% |
| Central American | 348 | 1.0% |
| Cherokee | 447 | 1.3% |
| Chippewa | 44 | 0.1% |
| Choctaw | 24 | 0.1% |
| Colombian | 11 | 0.0% |
| Cuban | 59 | 0.2% |
| Czech | 52 | 0.2% |
| Danish | 34 | 0.1% |
| Dominican | 297 | 0.8% |
| Dutch | 127 | 0.4% |
| Eastern European | 144 | 0.4% |
| English | 2,245 | 6.3% |
| European | 274 | 0.8% |
| Finnish | 60 | 0.2% |
| French | 420 | 1.2% |
| French Canadian | 32 | 0.1% |
| German | 4,692 | 13.2% |
| Greek | 18 | 0.1% |
| Guatemalan | 111 | 0.3% |
| Haitian | 36 | 0.1% |
| Honduran | 119 | 0.3% |
| Hungarian | 109 | 0.3% |
| Indian (Asian) | 25 | 0.1% |
| Irish | 2,370 | 6.7% |
| Iroquois | 18 | 0.1% |
| Israeli | 5 | 0.0% |
| Italian | 884 | 2.5% |
| Jamaican | 86 | 0.2% |
| Korean | 44 | 0.1% |
| Latvian | 9 | 0.0% |
| Lebanese | 38 | 0.1% |
| Liberian | 93 | 0.3% |
| Lumbee | 50 | 0.1% |
| Mexican | 2,296 | 6.5% |
| Moroccan | 53 | 0.2% |
| Native Hawaiian | 4 | 0.0% |
| Nigerian | 28 | 0.1% |
| Northern European | 9 | 0.0% |
| Norwegian | 55 | 0.2% |
| Pakistani | 50 | 0.1% |
| Panamanian | 5 | 0.0% |
| Peruvian | 12 | 0.0% |
| Polish | 303 | 0.9% |
| Portuguese | 46 | 0.1% |
| Puerto Rican | 313 | 0.9% |
| Romanian | 34 | 0.1% |
| Russian | 116 | 0.3% |
| Salvadoran | 113 | 0.3% |
| Scandinavian | 61 | 0.2% |
| Scotch-Irish | 1,138 | 3.2% |
| Scottish | 662 | 1.9% |
| Serbian | 9 | 0.0% |
| Sioux | 5 | 0.0% |
| Slovak | 25 | 0.1% |
| Slovene | 7 | 0.0% |
| South American | 70 | 0.2% |
| Spaniard | 197 | 0.6% |
| Spanish | 9 | 0.0% |
| Sri Lankan | 227 | 0.6% |
| Subsaharan African | 346 | 1.0% |
| Sudanese | 31 | 0.1% |
| Swedish | 509 | 1.4% |
| Swiss | 23 | 0.1% |
| Thai | 139 | 0.4% |
| Trinidadian and Tobagonian | 9 | 0.0% |
| Uruguayan | 47 | 0.1% |
| Welsh | 261 | 0.7% |
| West Indian | 40 | 0.1% | View All 80 Rows |
Immigrants in Salisbury
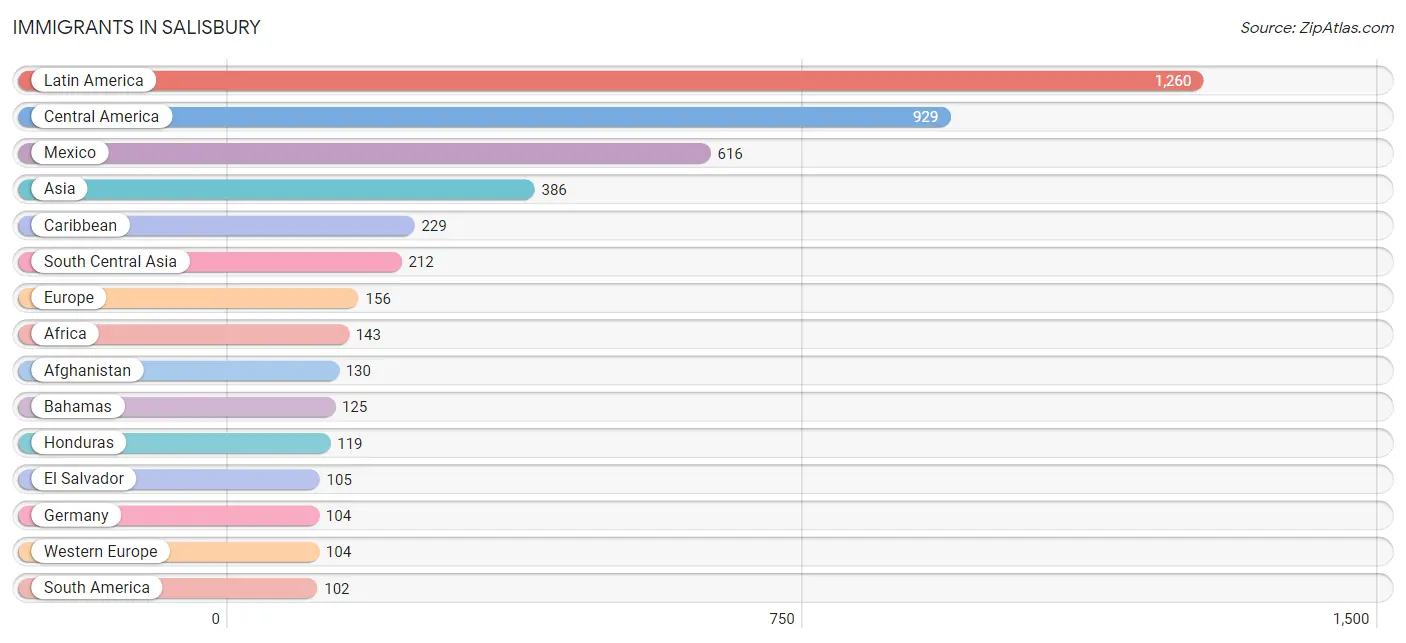
The most numerous immigrant groups reported in Salisbury came from Latin America (1,260 | 3.6%), Central America (929 | 2.6%), Mexico (616 | 1.7%), Asia (386 | 1.1%), and Caribbean (229 | 0.6%), together accounting for 9.7% of all Salisbury residents.
| Immigration Origin | # Population | % Population |
| Afghanistan | 130 | 0.4% |
| Africa | 143 | 0.4% |
| Asia | 386 | 1.1% |
| Australia | 32 | 0.1% |
| Bahamas | 125 | 0.4% |
| Brazil | 26 | 0.1% |
| Canada | 17 | 0.1% |
| Caribbean | 229 | 0.6% |
| Central America | 929 | 2.6% |
| China | 36 | 0.1% |
| Colombia | 44 | 0.1% |
| Cuba | 59 | 0.2% |
| Dominican Republic | 25 | 0.1% |
| Eastern Asia | 57 | 0.2% |
| Eastern Europe | 8 | 0.0% |
| Egypt | 31 | 0.1% |
| El Salvador | 105 | 0.3% |
| England | 27 | 0.1% |
| Europe | 156 | 0.4% |
| Germany | 104 | 0.3% |
| Guatemala | 89 | 0.3% |
| Honduras | 119 | 0.3% |
| India | 82 | 0.2% |
| Israel | 10 | 0.0% |
| Italy | 9 | 0.0% |
| Jamaica | 11 | 0.0% |
| Jordan | 16 | 0.1% |
| Korea | 21 | 0.1% |
| Latin America | 1,260 | 3.6% |
| Liberia | 84 | 0.2% |
| Mexico | 616 | 1.7% |
| Northern Africa | 31 | 0.1% |
| Northern Europe | 27 | 0.1% |
| Oceania | 32 | 0.1% |
| Peru | 12 | 0.0% |
| Philippines | 27 | 0.1% |
| Russia | 8 | 0.0% |
| South America | 102 | 0.3% |
| South Central Asia | 212 | 0.6% |
| South Eastern Asia | 91 | 0.3% |
| Southern Europe | 17 | 0.1% |
| Spain | 8 | 0.0% |
| Taiwan | 36 | 0.1% |
| Thailand | 50 | 0.1% |
| Trinidad and Tobago | 9 | 0.0% |
| Uruguay | 20 | 0.1% |
| Vietnam | 14 | 0.0% |
| Western Africa | 93 | 0.3% |
| Western Asia | 26 | 0.1% |
| Western Europe | 104 | 0.3% | View All 50 Rows |
Sex and Age in Salisbury
Sex and Age in Salisbury
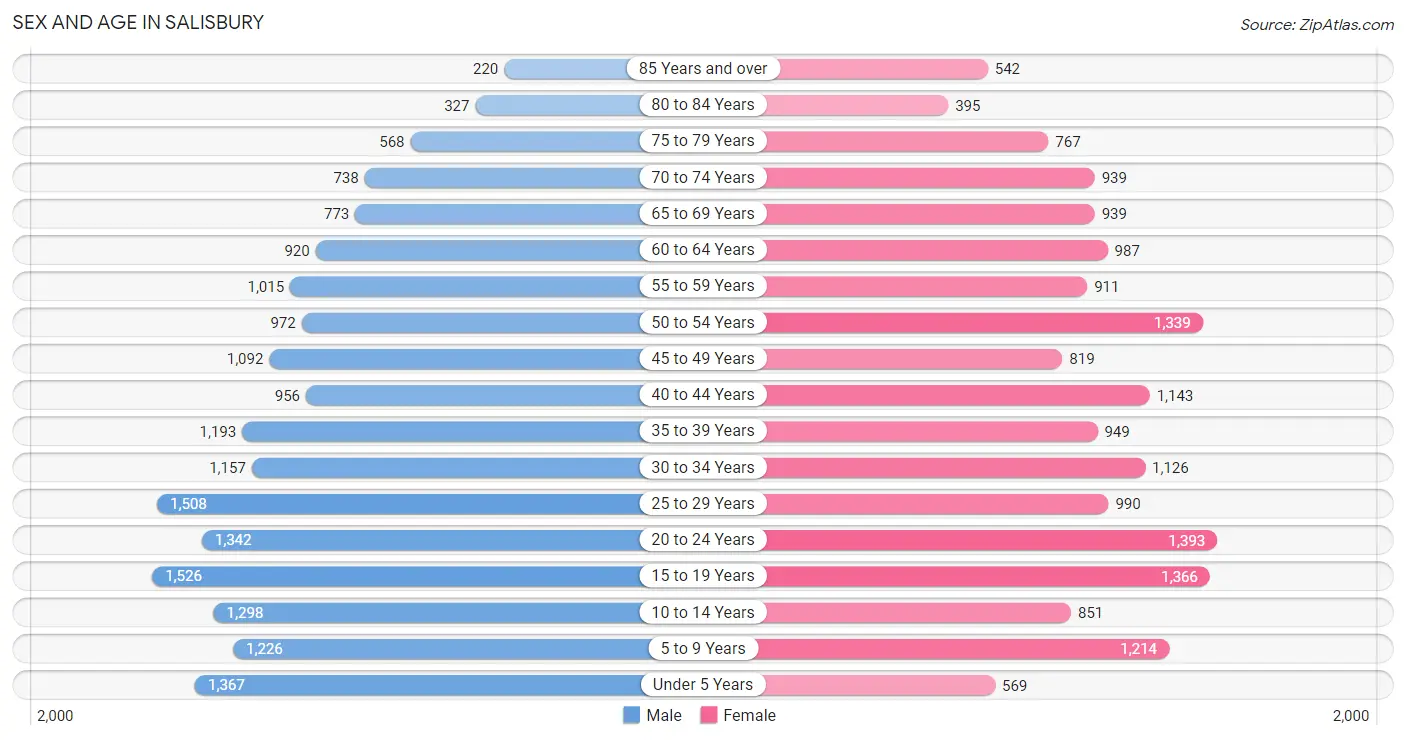
The most populous age groups in Salisbury are 15 to 19 Years (1,526 | 8.4%) for men and 20 to 24 Years (1,393 | 8.1%) for women.
| Age Bracket | Male | Female |
| Under 5 Years | 1,367 (7.5%) | 569 (3.3%) |
| 5 to 9 Years | 1,226 (6.7%) | 1,214 (7.0%) |
| 10 to 14 Years | 1,298 (7.1%) | 851 (4.9%) |
| 15 to 19 Years | 1,526 (8.4%) | 1,366 (7.9%) |
| 20 to 24 Years | 1,342 (7.4%) | 1,393 (8.1%) |
| 25 to 29 Years | 1,508 (8.3%) | 990 (5.7%) |
| 30 to 34 Years | 1,157 (6.4%) | 1,126 (6.5%) |
| 35 to 39 Years | 1,193 (6.6%) | 949 (5.5%) |
| 40 to 44 Years | 956 (5.2%) | 1,143 (6.6%) |
| 45 to 49 Years | 1,092 (6.0%) | 819 (4.8%) |
| 50 to 54 Years | 972 (5.3%) | 1,339 (7.8%) |
| 55 to 59 Years | 1,015 (5.6%) | 911 (5.3%) |
| 60 to 64 Years | 920 (5.1%) | 987 (5.7%) |
| 65 to 69 Years | 773 (4.3%) | 939 (5.4%) |
| 70 to 74 Years | 738 (4.1%) | 939 (5.4%) |
| 75 to 79 Years | 568 (3.1%) | 767 (4.4%) |
| 80 to 84 Years | 327 (1.8%) | 395 (2.3%) |
| 85 Years and over | 220 (1.2%) | 542 (3.1%) |
| Total | 18,198 (100.0%) | 17,239 (100.0%) |
Families and Households in Salisbury
Median Family Size in Salisbury
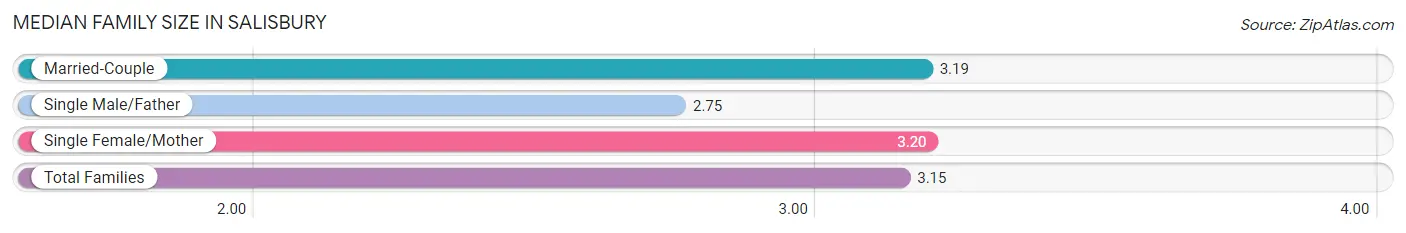
The median family size in Salisbury is 3.15 persons per family, with single female/mother families (2,340 | 30.1%) accounting for the largest median family size of 3.2 persons per family. On the other hand, single male/father families (634 | 8.1%) represent the smallest median family size with 2.75 persons per family.
| Family Type | # Families | Family Size |
| Married-Couple | 4,811 (61.8%) | 3.19 |
| Single Male/Father | 634 (8.1%) | 2.75 |
| Single Female/Mother | 2,340 (30.1%) | 3.20 |
| Total Families | 7,785 (100.0%) | 3.15 |
Median Household Size in Salisbury
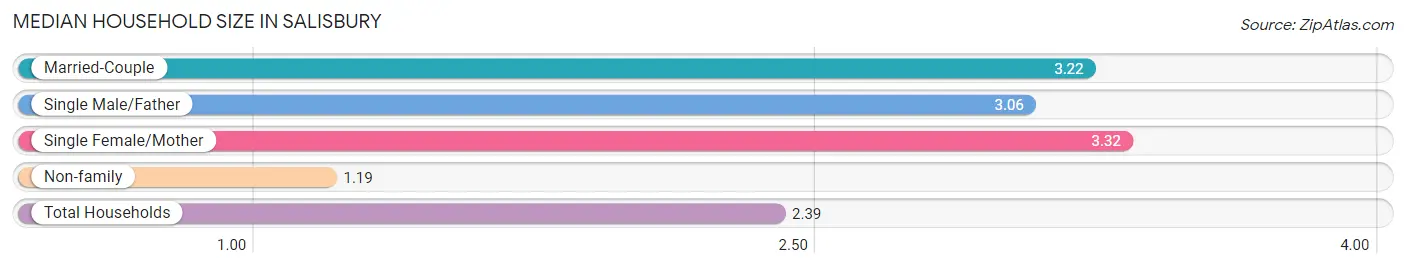
The median household size in Salisbury is 2.39 persons per household, with single female/mother households (2,340 | 17.6%) accounting for the largest median household size of 3.32 persons per household. non-family households (5,473 | 41.3%) represent the smallest median household size with 1.19 persons per household.
| Household Type | # Households | Household Size |
| Married-Couple | 4,811 (36.3%) | 3.22 |
| Single Male/Father | 634 (4.8%) | 3.06 |
| Single Female/Mother | 2,340 (17.6%) | 3.32 |
| Non-family | 5,473 (41.3%) | 1.19 |
| Total Households | 13,258 (100.0%) | 2.39 |
Household Size by Marriage Status in Salisbury
Out of a total of 13,258 households in Salisbury, 7,785 (58.7%) are family households, while 5,473 (41.3%) are nonfamily households. The most numerous type of family households are 2-person households, comprising 3,342, and the most common type of nonfamily households are 1-person households, comprising 4,626.
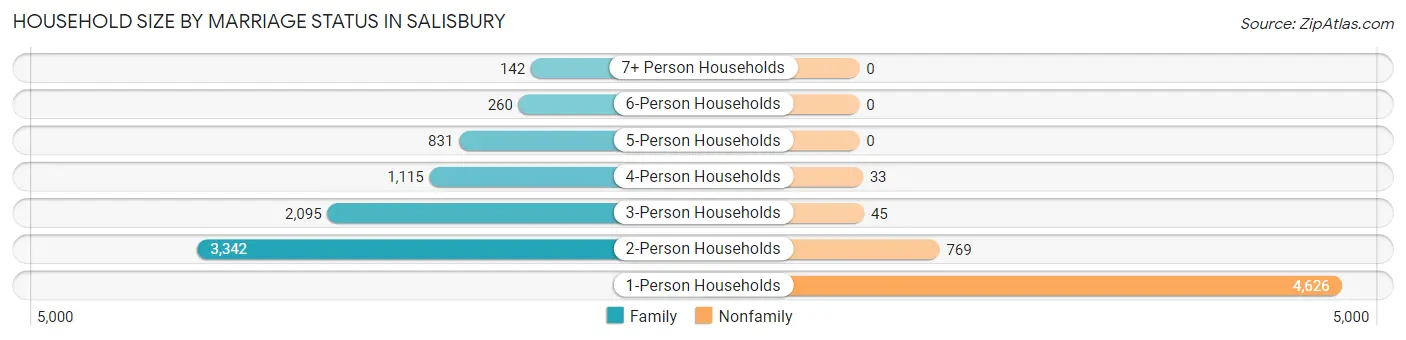
| Household Size | Family Households | Nonfamily Households |
| 1-Person Households | - | 4,626 (34.9%) |
| 2-Person Households | 3,342 (25.2%) | 769 (5.8%) |
| 3-Person Households | 2,095 (15.8%) | 45 (0.3%) |
| 4-Person Households | 1,115 (8.4%) | 33 (0.3%) |
| 5-Person Households | 831 (6.3%) | 0 (0.0%) |
| 6-Person Households | 260 (2.0%) | 0 (0.0%) |
| 7+ Person Households | 142 (1.1%) | 0 (0.0%) |
| Total | 7,785 (58.7%) | 5,473 (41.3%) |
Female Fertility in Salisbury
Fertility by Age in Salisbury
Average fertility rate in Salisbury is 54.0 births per 1,000 women. Women in the age bracket of 20 to 34 years have the highest fertility rate with 113.0 births per 1,000 women. Women in the age bracket of 20 to 34 years acount for 89.6% of all women with births.
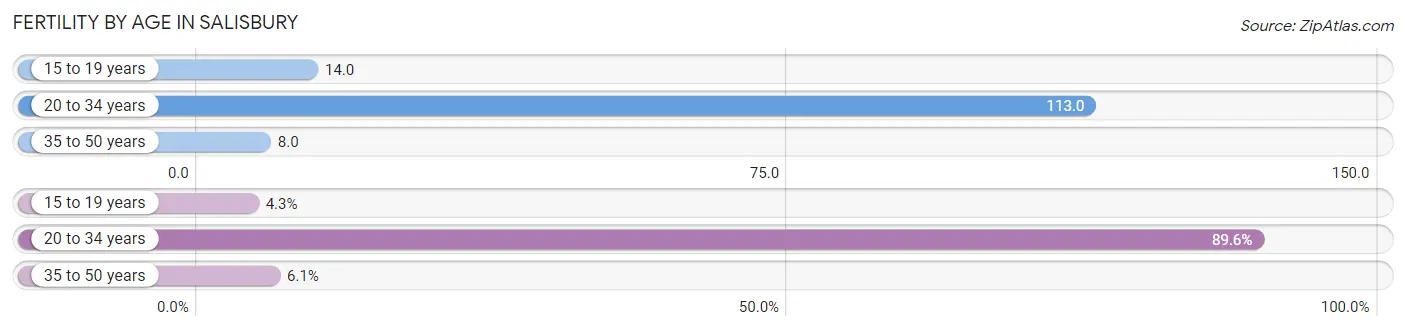
| Age Bracket | Women with Births | Births / 1,000 Women |
| 15 to 19 years | 19 (4.3%) | 14.0 |
| 20 to 34 years | 396 (89.6%) | 113.0 |
| 35 to 50 years | 27 (6.1%) | 8.0 |
| Total | 442 (100.0%) | 54.0 |
Fertility by Age by Marriage Status in Salisbury
42.5% of women with births (442) in Salisbury are married. The highest percentage of unmarried women with births falls into 15 to 19 years age bracket with 100.0% of them unmarried at the time of birth, while the lowest percentage of unmarried women with births belong to 20 to 34 years age bracket with 52.5% of them unmarried.
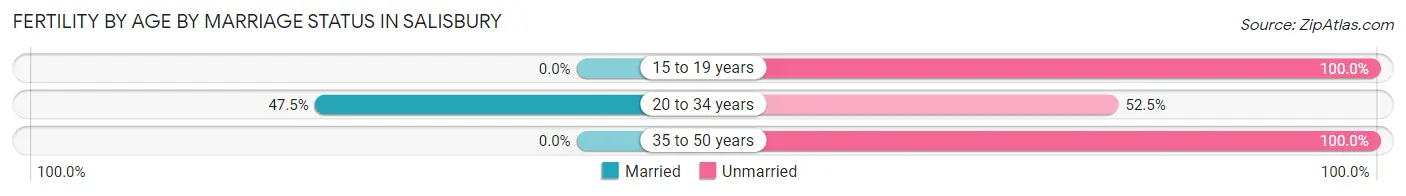
| Age Bracket | Married | Unmarried |
| 15 to 19 years | 0 (0.0%) | 19 (100.0%) |
| 20 to 34 years | 188 (47.5%) | 208 (52.5%) |
| 35 to 50 years | 0 (0.0%) | 27 (100.0%) |
| Total | 188 (42.5%) | 254 (57.5%) |
Fertility by Education in Salisbury
Average fertility rate in Salisbury is 54.0 births per 1,000 women. Women with the education attainment of bachelor's degree have the highest fertility rate of 107.0 births per 1,000 women, while women with the education attainment of less than high school have the lowest fertility at 23.0 births per 1,000 women. Women with the education attainment of college or associate's degree represent 33.0% of all women with births.
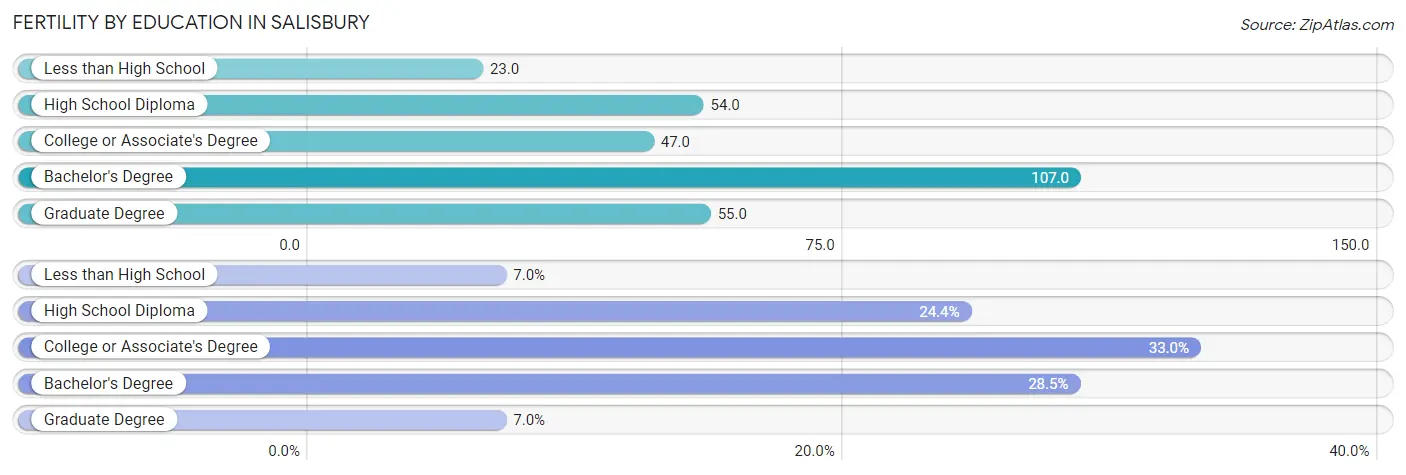
| Educational Attainment | Women with Births | Births / 1,000 Women |
| Less than High School | 31 (7.0%) | 23.0 |
| High School Diploma | 108 (24.4%) | 54.0 |
| College or Associate's Degree | 146 (33.0%) | 47.0 |
| Bachelor's Degree | 126 (28.5%) | 107.0 |
| Graduate Degree | 31 (7.0%) | 55.0 |
| Total | 442 (100.0%) | 54.0 |
Fertility by Education by Marriage Status in Salisbury
57.5% of women with births in Salisbury are unmarried. Women with the educational attainment of bachelor's degree are most likely to be married with 92.9% of them married at childbirth, while women with the educational attainment of less than high school are least likely to be married with 100.0% of them unmarried at childbirth.
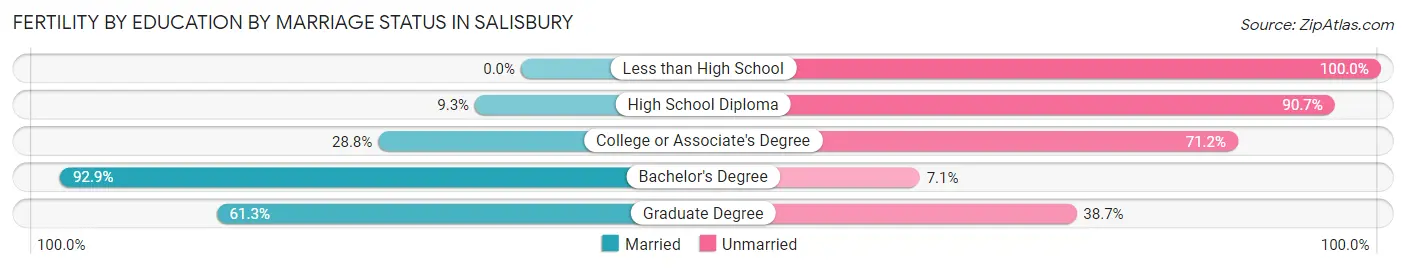
| Educational Attainment | Married | Unmarried |
| Less than High School | 0 (0.0%) | 31 (100.0%) |
| High School Diploma | 10 (9.3%) | 98 (90.7%) |
| College or Associate's Degree | 42 (28.8%) | 104 (71.2%) |
| Bachelor's Degree | 117 (92.9%) | 9 (7.1%) |
| Graduate Degree | 19 (61.3%) | 12 (38.7%) |
| Total | 188 (42.5%) | 254 (57.5%) |
Employment Characteristics in Salisbury
Employment by Class of Employer in Salisbury
Among the 14,587 employed individuals in Salisbury, private company employees (10,277 | 70.5%), not-for-profit organizations (1,296 | 8.9%), and federal government employees (686 | 4.7%) make up the most common classes of employment.
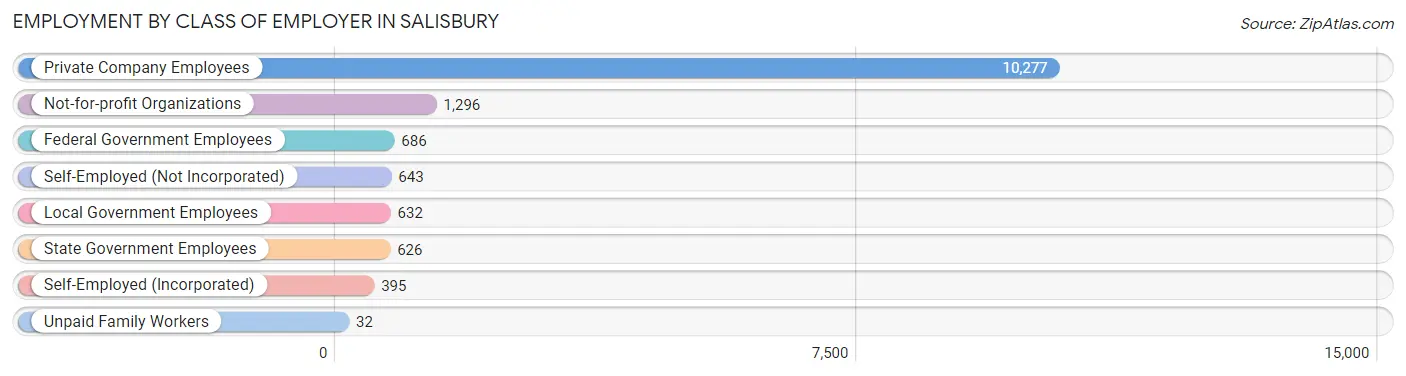
| Employer Class | # Employees | % Employees |
| Private Company Employees | 10,277 | 70.5% |
| Self-Employed (Incorporated) | 395 | 2.7% |
| Self-Employed (Not Incorporated) | 643 | 4.4% |
| Not-for-profit Organizations | 1,296 | 8.9% |
| Local Government Employees | 632 | 4.3% |
| State Government Employees | 626 | 4.3% |
| Federal Government Employees | 686 | 4.7% |
| Unpaid Family Workers | 32 | 0.2% |
| Total | 14,587 | 100.0% |
Employment Status by Age in Salisbury
According to the labor force statistics for Salisbury, out of the total population over 16 years of age (28,465), 57.1% or 16,254 individuals are in the labor force, with 7.0% or 1,138 of them unemployed. The age group with the highest labor force participation rate is 25 to 29 years, with 90.3% or 2,256 individuals in the labor force. Within the labor force, the 16 to 19 years age range has the highest percentage of unemployed individuals, with 38.4% or 361 of them being unemployed.
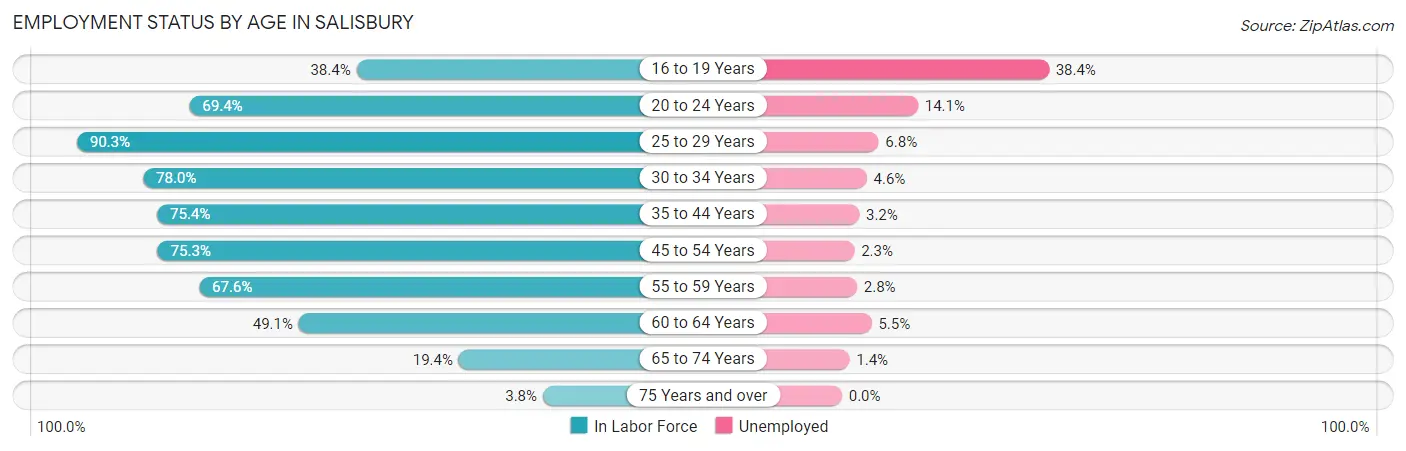
| Age Bracket | In Labor Force | Unemployed |
| 16 to 19 Years | 939 (38.4%) | 361 (38.4%) |
| 20 to 24 Years | 1,898 (69.4%) | 268 (14.1%) |
| 25 to 29 Years | 2,256 (90.3%) | 153 (6.8%) |
| 30 to 34 Years | 1,781 (78.0%) | 82 (4.6%) |
| 35 to 44 Years | 3,198 (75.4%) | 102 (3.2%) |
| 45 to 54 Years | 3,179 (75.3%) | 73 (2.3%) |
| 55 to 59 Years | 1,302 (67.6%) | 36 (2.8%) |
| 60 to 64 Years | 936 (49.1%) | 51 (5.5%) |
| 65 to 74 Years | 657 (19.4%) | 9 (1.4%) |
| 75 Years and over | 107 (3.8%) | 0 (0.0%) |
| Total | 16,254 (57.1%) | 1,138 (7.0%) |
Employment Status by Educational Attainment in Salisbury
According to labor force statistics for Salisbury, 74.1% of individuals (12,654) out of the total population between 25 and 64 years of age (17,077) are in the labor force, with 3.9% or 494 of them being unemployed. The group with the highest labor force participation rate are those with the educational attainment of bachelor's degree or higher, with 86.6% or 3,923 individuals in the labor force. Within the labor force, individuals with less than high school education have the highest percentage of unemployment, with 8.9% or 98 of them being unemployed.
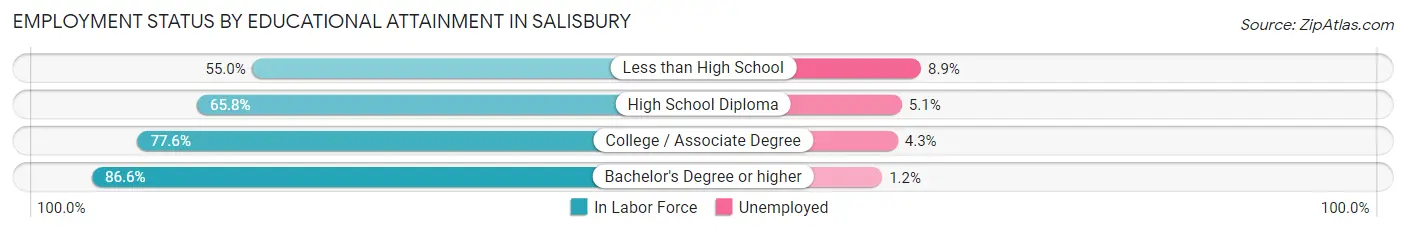
| Educational Attainment | In Labor Force | Unemployed |
| Less than High School | 1,104 (55.0%) | 179 (8.9%) |
| High School Diploma | 3,102 (65.8%) | 240 (5.1%) |
| College / Associate Degree | 4,520 (77.6%) | 250 (4.3%) |
| Bachelor's Degree or higher | 3,923 (86.6%) | 54 (1.2%) |
| Total | 12,654 (74.1%) | 666 (3.9%) |
Employment Occupations by Sex in Salisbury
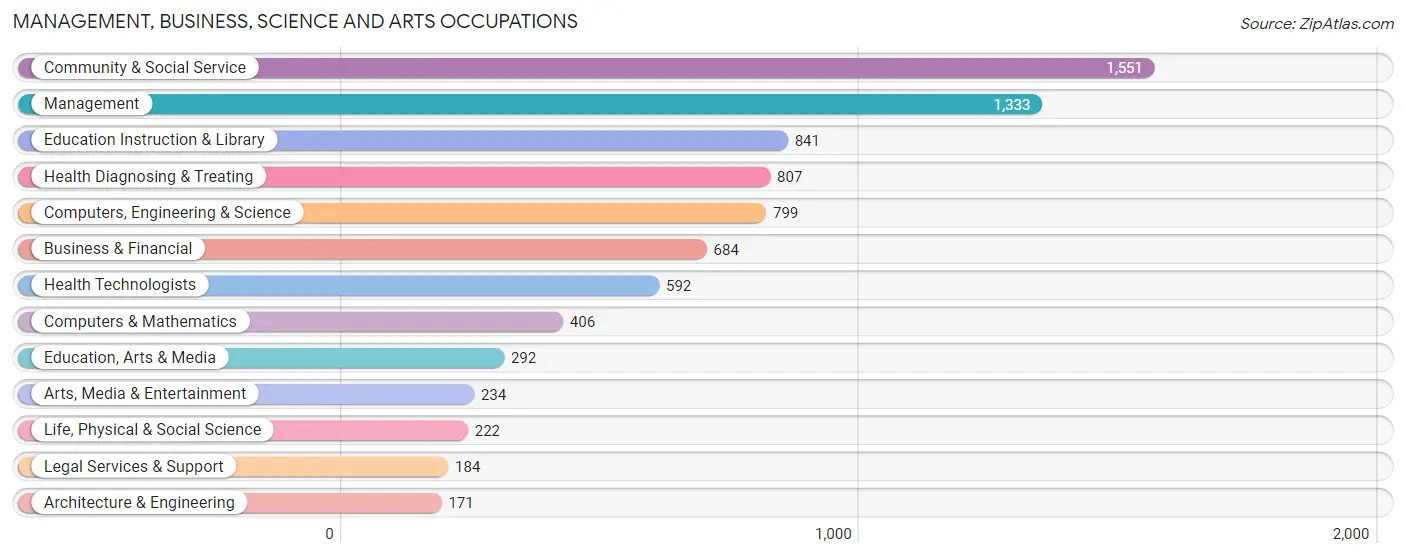
Management, Business, Science and Arts Occupations
The most common Management, Business, Science and Arts occupations in Salisbury are Community & Social Service (1,551 | 10.3%), Management (1,333 | 8.8%), Education Instruction & Library (841 | 5.6%), Health Diagnosing & Treating (807 | 5.3%), and Computers, Engineering & Science (799 | 5.3%).
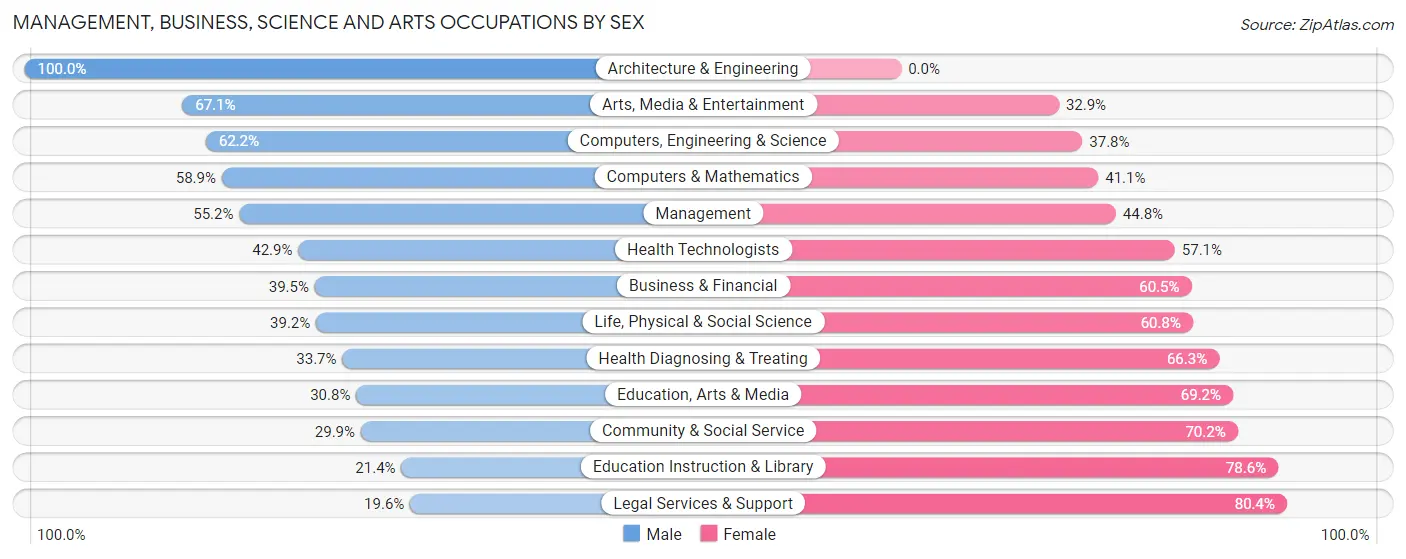
Management, Business, Science and Arts Occupations by Sex
Within the Management, Business, Science and Arts occupations in Salisbury, the most male-oriented occupations are Architecture & Engineering (100.0%), Arts, Media & Entertainment (67.1%), and Computers, Engineering & Science (62.2%), while the most female-oriented occupations are Legal Services & Support (80.4%), Education Instruction & Library (78.6%), and Community & Social Service (70.2%).
| Occupation | Male | Female |
| Management | 736 (55.2%) | 597 (44.8%) |
| Business & Financial | 270 (39.5%) | 414 (60.5%) |
| Computers, Engineering & Science | 497 (62.2%) | 302 (37.8%) |
| Computers & Mathematics | 239 (58.9%) | 167 (41.1%) |
| Architecture & Engineering | 171 (100.0%) | 0 (0.0%) |
| Life, Physical & Social Science | 87 (39.2%) | 135 (60.8%) |
| Community & Social Service | 463 (29.8%) | 1,088 (70.2%) |
| Education, Arts & Media | 90 (30.8%) | 202 (69.2%) |
| Legal Services & Support | 36 (19.6%) | 148 (80.4%) |
| Education Instruction & Library | 180 (21.4%) | 661 (78.6%) |
| Arts, Media & Entertainment | 157 (67.1%) | 77 (32.9%) |
| Health Diagnosing & Treating | 272 (33.7%) | 535 (66.3%) |
| Health Technologists | 254 (42.9%) | 338 (57.1%) |
| Total (Category) | 2,238 (43.2%) | 2,936 (56.8%) |
| Total (Overall) | 7,562 (50.0%) | 7,558 (50.0%) |
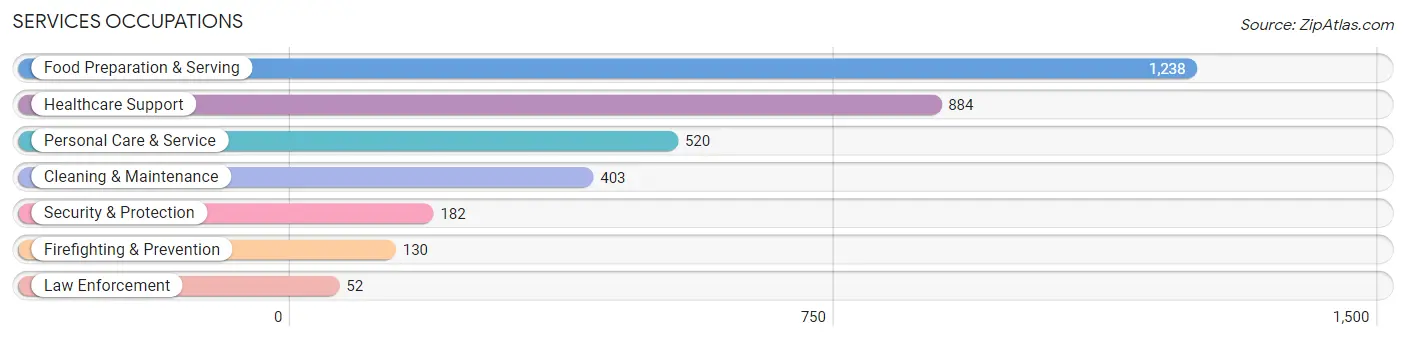
Services Occupations
The most common Services occupations in Salisbury are Food Preparation & Serving (1,238 | 8.2%), Healthcare Support (884 | 5.9%), Personal Care & Service (520 | 3.4%), Cleaning & Maintenance (403 | 2.7%), and Security & Protection (182 | 1.2%).
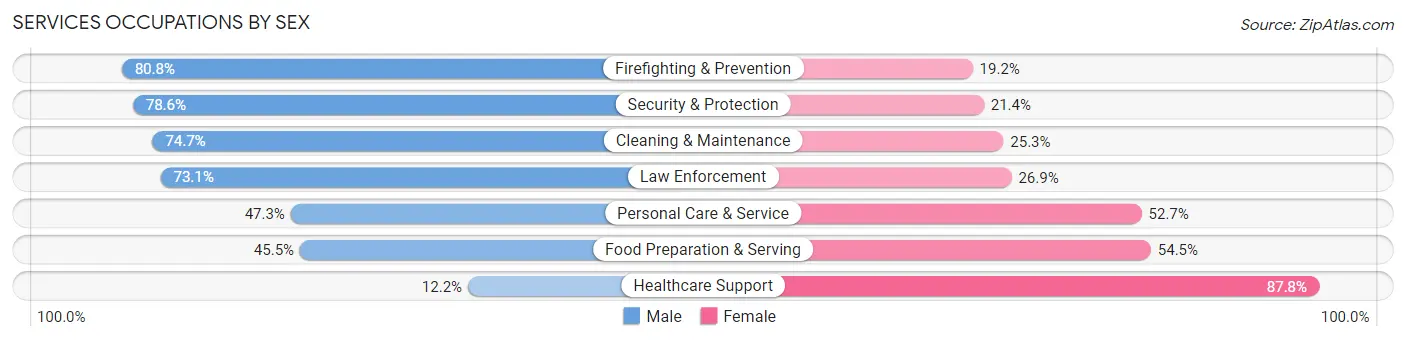
Services Occupations by Sex
Within the Services occupations in Salisbury, the most male-oriented occupations are Firefighting & Prevention (80.8%), Security & Protection (78.6%), and Cleaning & Maintenance (74.7%), while the most female-oriented occupations are Healthcare Support (87.8%), Food Preparation & Serving (54.5%), and Personal Care & Service (52.7%).
| Occupation | Male | Female |
| Healthcare Support | 108 (12.2%) | 776 (87.8%) |
| Security & Protection | 143 (78.6%) | 39 (21.4%) |
| Firefighting & Prevention | 105 (80.8%) | 25 (19.2%) |
| Law Enforcement | 38 (73.1%) | 14 (26.9%) |
| Food Preparation & Serving | 563 (45.5%) | 675 (54.5%) |
| Cleaning & Maintenance | 301 (74.7%) | 102 (25.3%) |
| Personal Care & Service | 246 (47.3%) | 274 (52.7%) |
| Total (Category) | 1,361 (42.2%) | 1,866 (57.8%) |
| Total (Overall) | 7,562 (50.0%) | 7,558 (50.0%) |
Sales and Office Occupations
The most common Sales and Office occupations in Salisbury are Office & Administration (1,294 | 8.6%), and Sales & Related (1,221 | 8.1%).
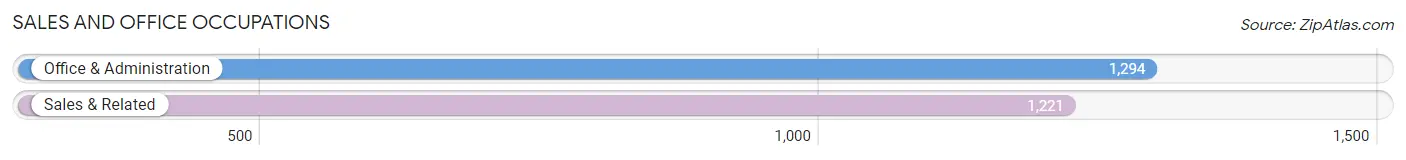
Sales and Office Occupations by Sex
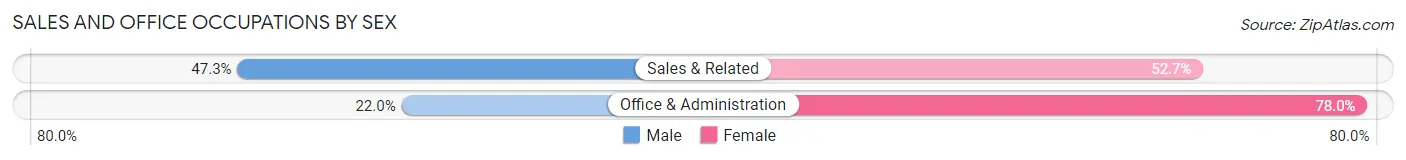
| Occupation | Male | Female |
| Sales & Related | 577 (47.3%) | 644 (52.7%) |
| Office & Administration | 285 (22.0%) | 1,009 (78.0%) |
| Total (Category) | 862 (34.3%) | 1,653 (65.7%) |
| Total (Overall) | 7,562 (50.0%) | 7,558 (50.0%) |
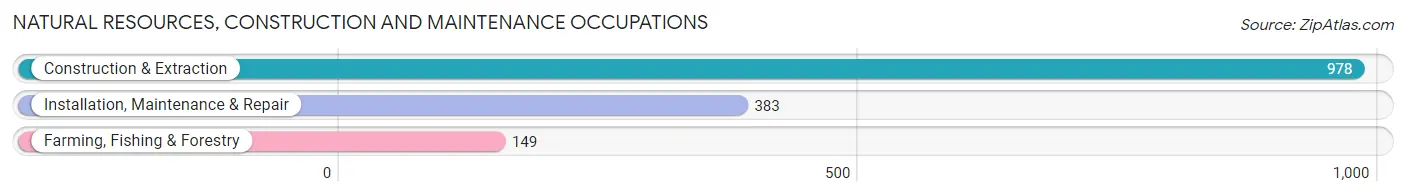
Natural Resources, Construction and Maintenance Occupations
The most common Natural Resources, Construction and Maintenance occupations in Salisbury are Construction & Extraction (978 | 6.5%), Installation, Maintenance & Repair (383 | 2.5%), and Farming, Fishing & Forestry (149 | 1.0%).
Natural Resources, Construction and Maintenance Occupations by Sex
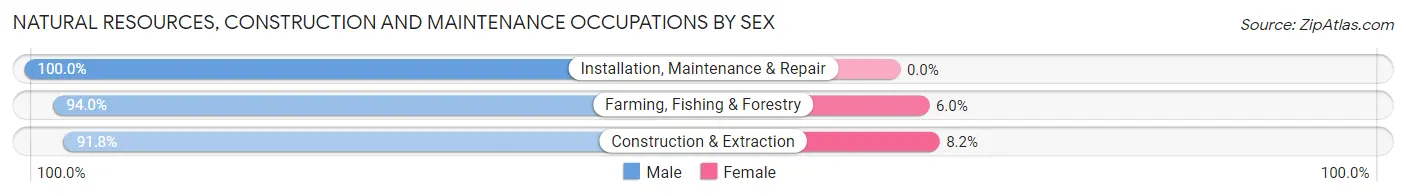
| Occupation | Male | Female |
| Farming, Fishing & Forestry | 140 (94.0%) | 9 (6.0%) |
| Construction & Extraction | 898 (91.8%) | 80 (8.2%) |
| Installation, Maintenance & Repair | 383 (100.0%) | 0 (0.0%) |
| Total (Category) | 1,421 (94.1%) | 89 (5.9%) |
| Total (Overall) | 7,562 (50.0%) | 7,558 (50.0%) |
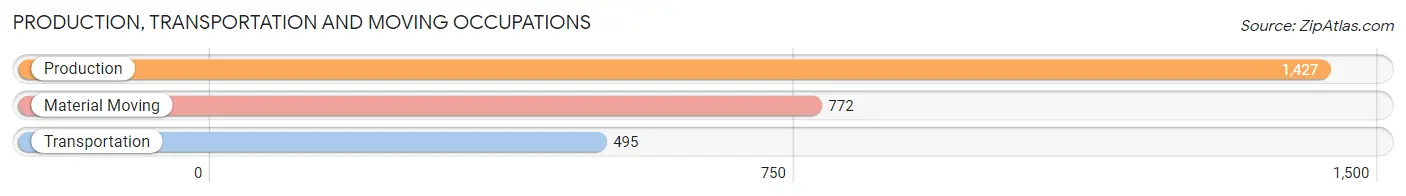
Production, Transportation and Moving Occupations
The most common Production, Transportation and Moving occupations in Salisbury are Production (1,427 | 9.4%), Material Moving (772 | 5.1%), and Transportation (495 | 3.3%).
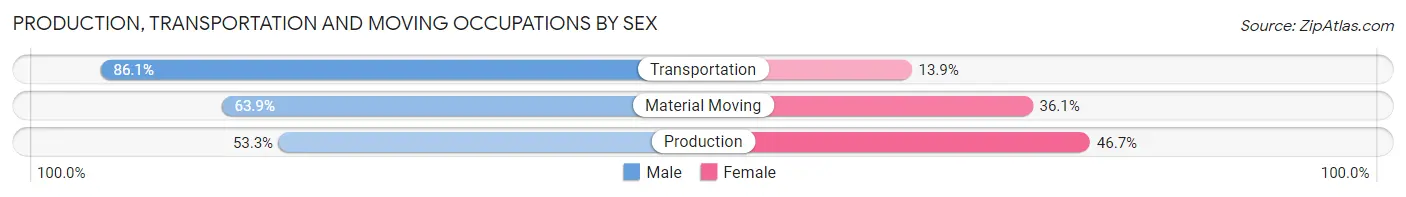
Production, Transportation and Moving Occupations by Sex
| Occupation | Male | Female |
| Production | 761 (53.3%) | 666 (46.7%) |
| Transportation | 426 (86.1%) | 69 (13.9%) |
| Material Moving | 493 (63.9%) | 279 (36.1%) |
| Total (Category) | 1,680 (62.4%) | 1,014 (37.6%) |
| Total (Overall) | 7,562 (50.0%) | 7,558 (50.0%) |
Employment Industries by Sex in Salisbury
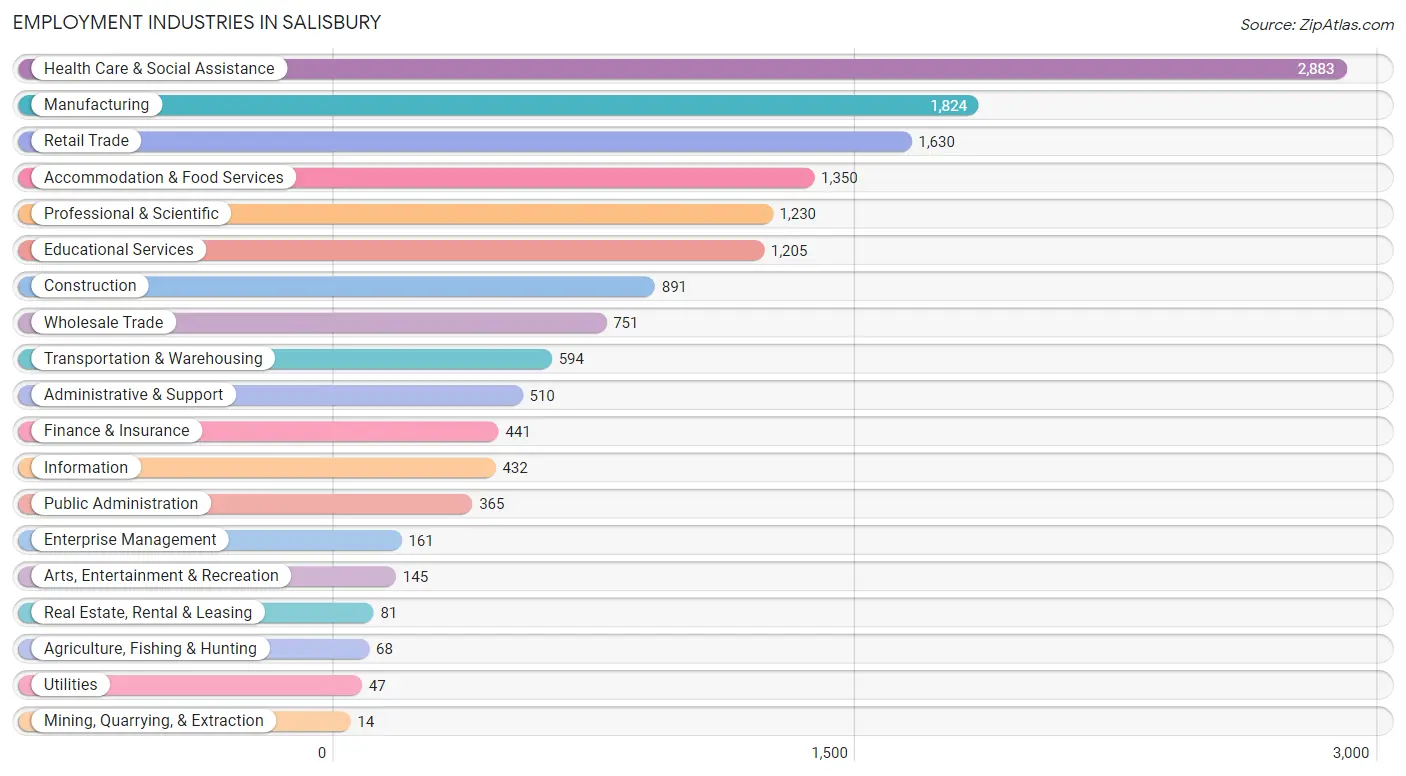
Employment Industries in Salisbury
The major employment industries in Salisbury include Health Care & Social Assistance (2,883 | 19.1%), Manufacturing (1,824 | 12.1%), Retail Trade (1,630 | 10.8%), Accommodation & Food Services (1,350 | 8.9%), and Professional & Scientific (1,230 | 8.1%).
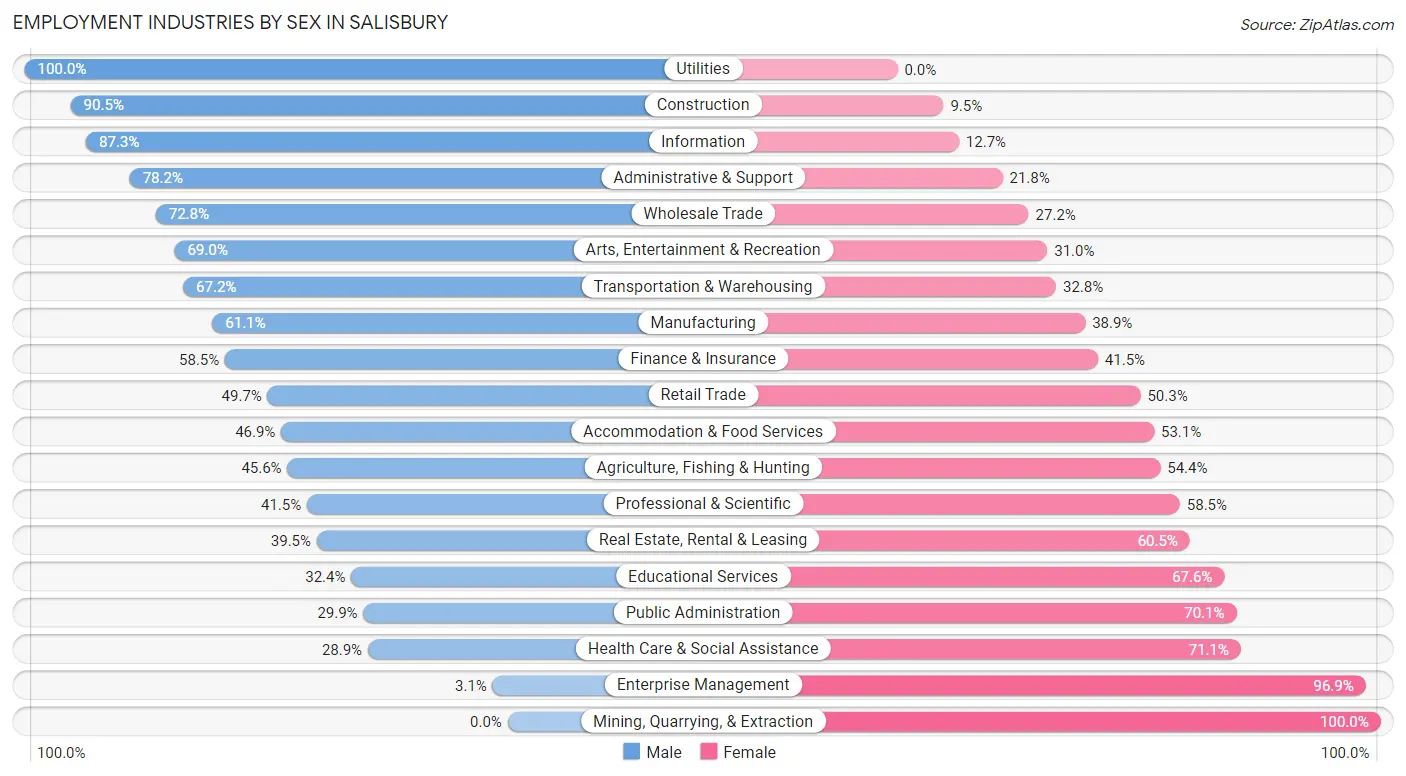
Employment Industries by Sex in Salisbury
The Salisbury industries that see more men than women are Utilities (100.0%), Construction (90.5%), and Information (87.3%), whereas the industries that tend to have a higher number of women are Mining, Quarrying, & Extraction (100.0%), Enterprise Management (96.9%), and Health Care & Social Assistance (71.1%).
| Industry | Male | Female |
| Agriculture, Fishing & Hunting | 31 (45.6%) | 37 (54.4%) |
| Mining, Quarrying, & Extraction | 0 (0.0%) | 14 (100.0%) |
| Construction | 806 (90.5%) | 85 (9.5%) |
| Manufacturing | 1,115 (61.1%) | 709 (38.9%) |
| Wholesale Trade | 547 (72.8%) | 204 (27.2%) |
| Retail Trade | 810 (49.7%) | 820 (50.3%) |
| Transportation & Warehousing | 399 (67.2%) | 195 (32.8%) |
| Utilities | 47 (100.0%) | 0 (0.0%) |
| Information | 377 (87.3%) | 55 (12.7%) |
| Finance & Insurance | 258 (58.5%) | 183 (41.5%) |
| Real Estate, Rental & Leasing | 32 (39.5%) | 49 (60.5%) |
| Professional & Scientific | 511 (41.5%) | 719 (58.5%) |
| Enterprise Management | 5 (3.1%) | 156 (96.9%) |
| Administrative & Support | 399 (78.2%) | 111 (21.8%) |
| Educational Services | 390 (32.4%) | 815 (67.6%) |
| Health Care & Social Assistance | 834 (28.9%) | 2,049 (71.1%) |
| Arts, Entertainment & Recreation | 100 (69.0%) | 45 (31.0%) |
| Accommodation & Food Services | 633 (46.9%) | 717 (53.1%) |
| Public Administration | 109 (29.9%) | 256 (70.1%) |
| Total | 7,562 (50.0%) | 7,558 (50.0%) |
Education in Salisbury
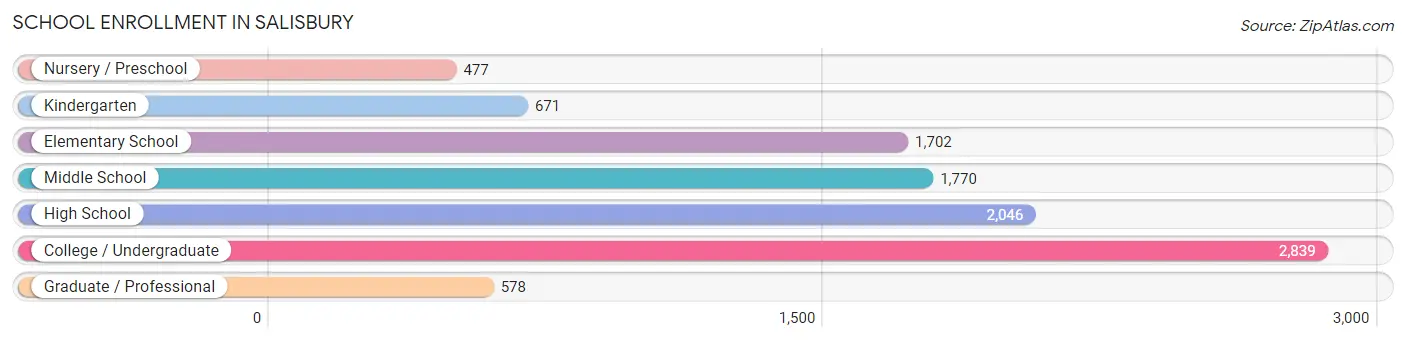
School Enrollment in Salisbury
The most common levels of schooling among the 10,083 students in Salisbury are college / undergraduate (2,839 | 28.2%), high school (2,046 | 20.3%), and middle school (1,770 | 17.5%).
| School Level | # Students | % Students |
| Nursery / Preschool | 477 | 4.7% |
| Kindergarten | 671 | 6.7% |
| Elementary School | 1,702 | 16.9% |
| Middle School | 1,770 | 17.5% |
| High School | 2,046 | 20.3% |
| College / Undergraduate | 2,839 | 28.2% |
| Graduate / Professional | 578 | 5.7% |
| Total | 10,083 | 100.0% |
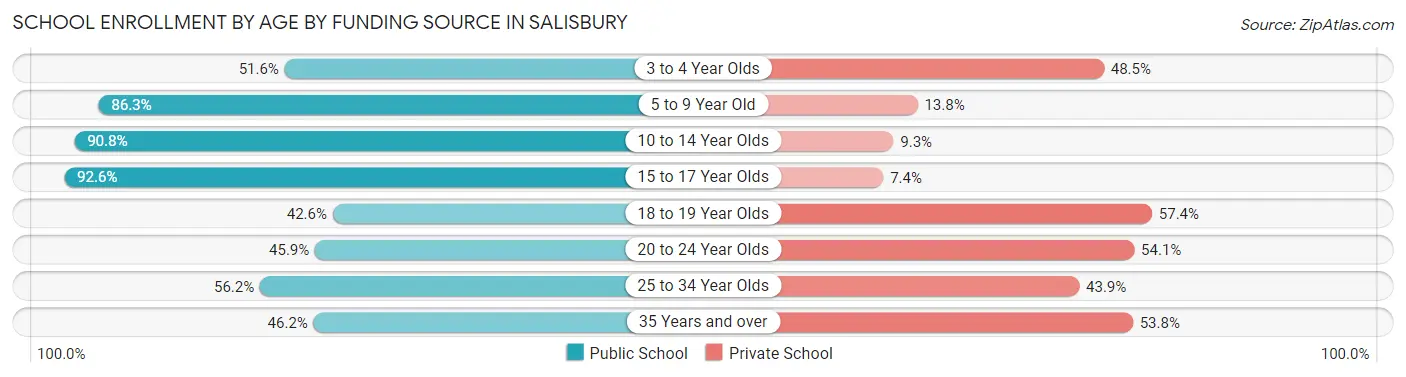
School Enrollment by Age by Funding Source in Salisbury
Out of a total of 10,083 students who are enrolled in schools in Salisbury, 2,904 (28.8%) attend a private institution, while the remaining 7,179 (71.2%) are enrolled in public schools. The age group of 18 to 19 year olds has the highest likelihood of being enrolled in private schools, with 790 (57.4% in the age bracket) enrolled. Conversely, the age group of 15 to 17 year olds has the lowest likelihood of being enrolled in a private school, with 1,269 (92.6% in the age bracket) attending a public institution.
| Age Bracket | Public School | Private School |
| 3 to 4 Year Olds | 166 (51.5%) | 156 (48.4%) |
| 5 to 9 Year Old | 2,033 (86.3%) | 324 (13.8%) |
| 10 to 14 Year Olds | 1,924 (90.7%) | 196 (9.2%) |
| 15 to 17 Year Olds | 1,269 (92.6%) | 101 (7.4%) |
| 18 to 19 Year Olds | 586 (42.6%) | 790 (57.4%) |
| 20 to 24 Year Olds | 564 (45.9%) | 665 (54.1%) |
| 25 to 34 Year Olds | 201 (56.1%) | 157 (43.9%) |
| 35 Years and over | 439 (46.2%) | 512 (53.8%) |
| Total | 7,179 (71.2%) | 2,904 (28.8%) |
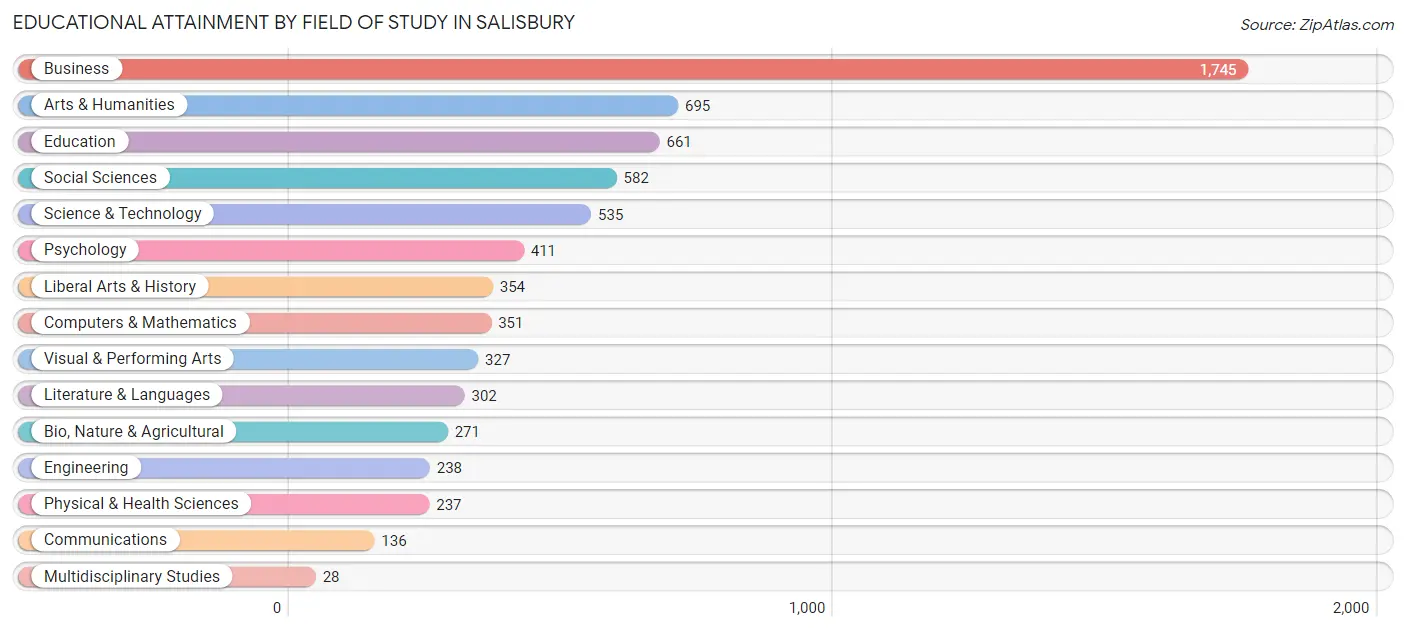
Educational Attainment by Field of Study in Salisbury
Business (1,745 | 25.4%), arts & humanities (695 | 10.1%), education (661 | 9.6%), social sciences (582 | 8.5%), and science & technology (535 | 7.8%) are the most common fields of study among 6,873 individuals in Salisbury who have obtained a bachelor's degree or higher.
| Field of Study | # Graduates | % Graduates |
| Computers & Mathematics | 351 | 5.1% |
| Bio, Nature & Agricultural | 271 | 3.9% |
| Physical & Health Sciences | 237 | 3.5% |
| Psychology | 411 | 6.0% |
| Social Sciences | 582 | 8.5% |
| Engineering | 238 | 3.5% |
| Multidisciplinary Studies | 28 | 0.4% |
| Science & Technology | 535 | 7.8% |
| Business | 1,745 | 25.4% |
| Education | 661 | 9.6% |
| Literature & Languages | 302 | 4.4% |
| Liberal Arts & History | 354 | 5.1% |
| Visual & Performing Arts | 327 | 4.8% |
| Communications | 136 | 2.0% |
| Arts & Humanities | 695 | 10.1% |
| Total | 6,873 | 100.0% |
Transportation & Commute in Salisbury
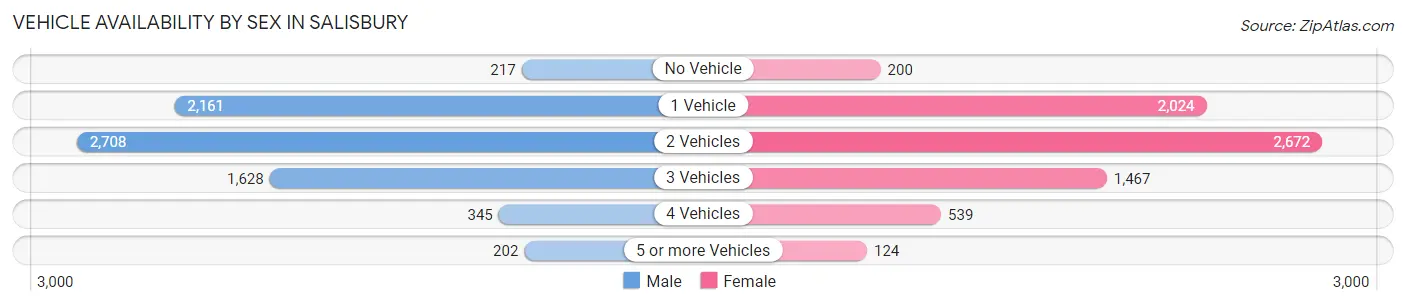
Vehicle Availability by Sex in Salisbury
The most prevalent vehicle ownership categories in Salisbury are males with 2 vehicles (2,708, accounting for 37.3%) and females with 2 vehicles (2,672, making up 38.5%).
| Vehicles Available | Male | Female |
| No Vehicle | 217 (3.0%) | 200 (2.9%) |
| 1 Vehicle | 2,161 (29.8%) | 2,024 (28.8%) |
| 2 Vehicles | 2,708 (37.3%) | 2,672 (38.0%) |
| 3 Vehicles | 1,628 (22.4%) | 1,467 (20.9%) |
| 4 Vehicles | 345 (4.8%) | 539 (7.7%) |
| 5 or more Vehicles | 202 (2.8%) | 124 (1.8%) |
| Total | 7,261 (100.0%) | 7,026 (100.0%) |
Commute Time in Salisbury
The most frequently occuring commute durations in Salisbury are 5 to 9 minutes (2,955 commuters, 21.8%), 10 to 14 minutes (2,380 commuters, 17.6%), and 15 to 19 minutes (1,854 commuters, 13.7%).
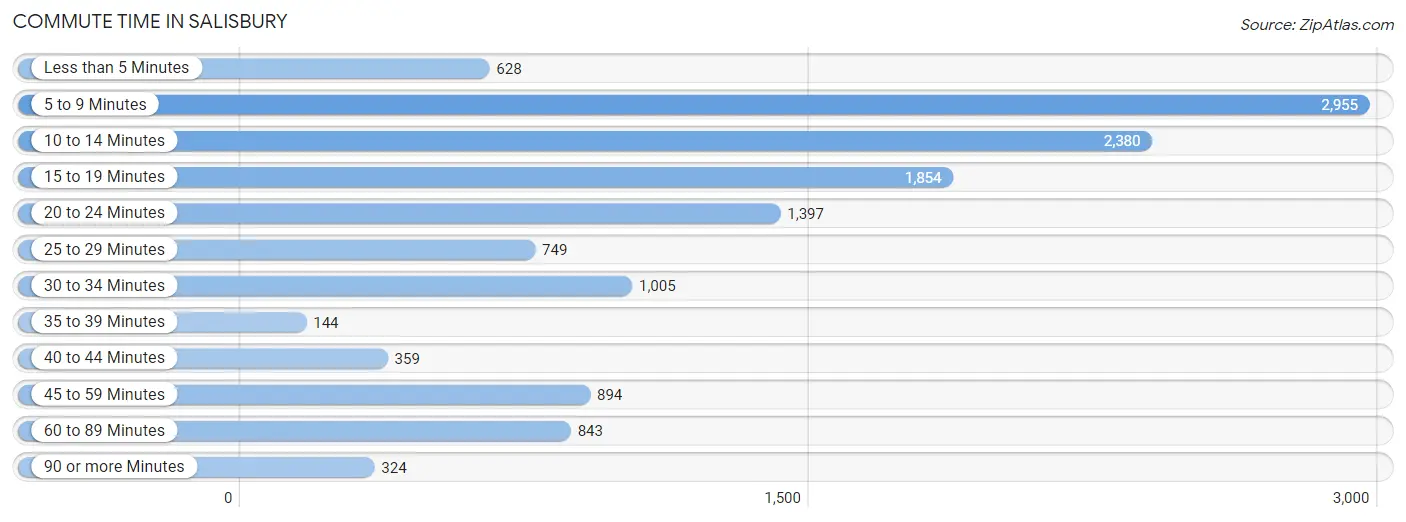
| Commute Time | # Commuters | % Commuters |
| Less than 5 Minutes | 628 | 4.6% |
| 5 to 9 Minutes | 2,955 | 21.8% |
| 10 to 14 Minutes | 2,380 | 17.6% |
| 15 to 19 Minutes | 1,854 | 13.7% |
| 20 to 24 Minutes | 1,397 | 10.3% |
| 25 to 29 Minutes | 749 | 5.5% |
| 30 to 34 Minutes | 1,005 | 7.4% |
| 35 to 39 Minutes | 144 | 1.1% |
| 40 to 44 Minutes | 359 | 2.6% |
| 45 to 59 Minutes | 894 | 6.6% |
| 60 to 89 Minutes | 843 | 6.2% |
| 90 or more Minutes | 324 | 2.4% |
Commute Time by Sex in Salisbury
The most common commute times in Salisbury are 5 to 9 minutes (1,100 commuters, 15.9%) for males and 5 to 9 minutes (1,855 commuters, 28.0%) for females.
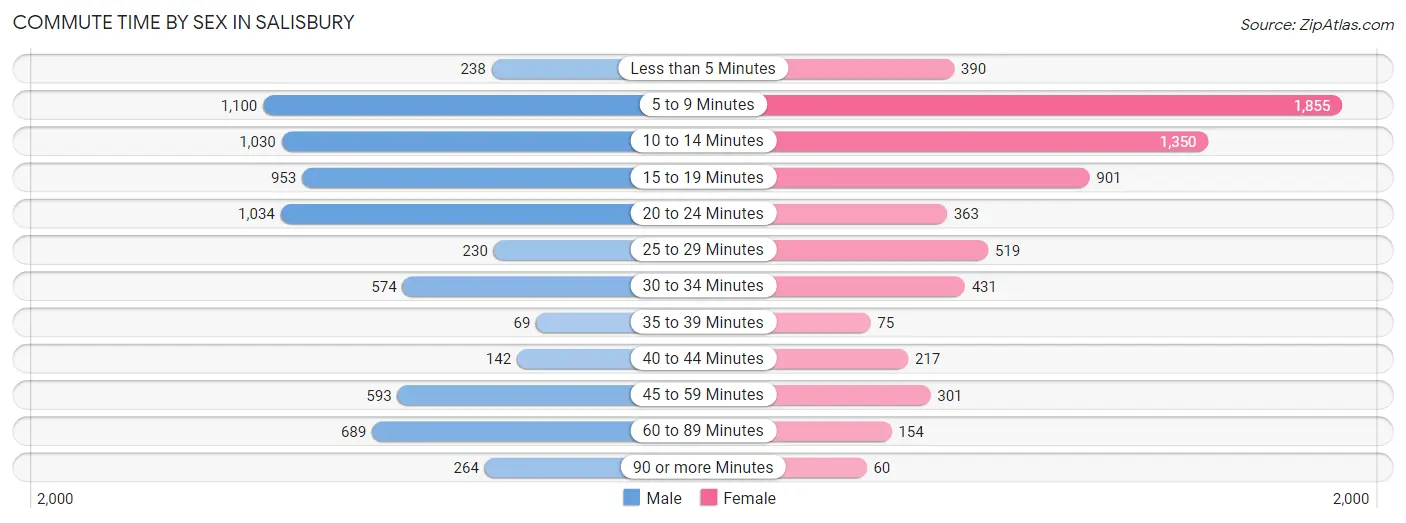
| Commute Time | Male | Female |
| Less than 5 Minutes | 238 (3.4%) | 390 (5.9%) |
| 5 to 9 Minutes | 1,100 (15.9%) | 1,855 (28.0%) |
| 10 to 14 Minutes | 1,030 (14.9%) | 1,350 (20.4%) |
| 15 to 19 Minutes | 953 (13.8%) | 901 (13.6%) |
| 20 to 24 Minutes | 1,034 (14.9%) | 363 (5.5%) |
| 25 to 29 Minutes | 230 (3.3%) | 519 (7.8%) |
| 30 to 34 Minutes | 574 (8.3%) | 431 (6.5%) |
| 35 to 39 Minutes | 69 (1.0%) | 75 (1.1%) |
| 40 to 44 Minutes | 142 (2.1%) | 217 (3.3%) |
| 45 to 59 Minutes | 593 (8.6%) | 301 (4.5%) |
| 60 to 89 Minutes | 689 (10.0%) | 154 (2.3%) |
| 90 or more Minutes | 264 (3.8%) | 60 (0.9%) |
Time of Departure to Work by Sex in Salisbury
The most frequent times of departure to work in Salisbury are 6:30 AM to 6:59 AM (1,004, 14.5%) for males and 7:30 AM to 7:59 AM (1,352, 20.4%) for females.
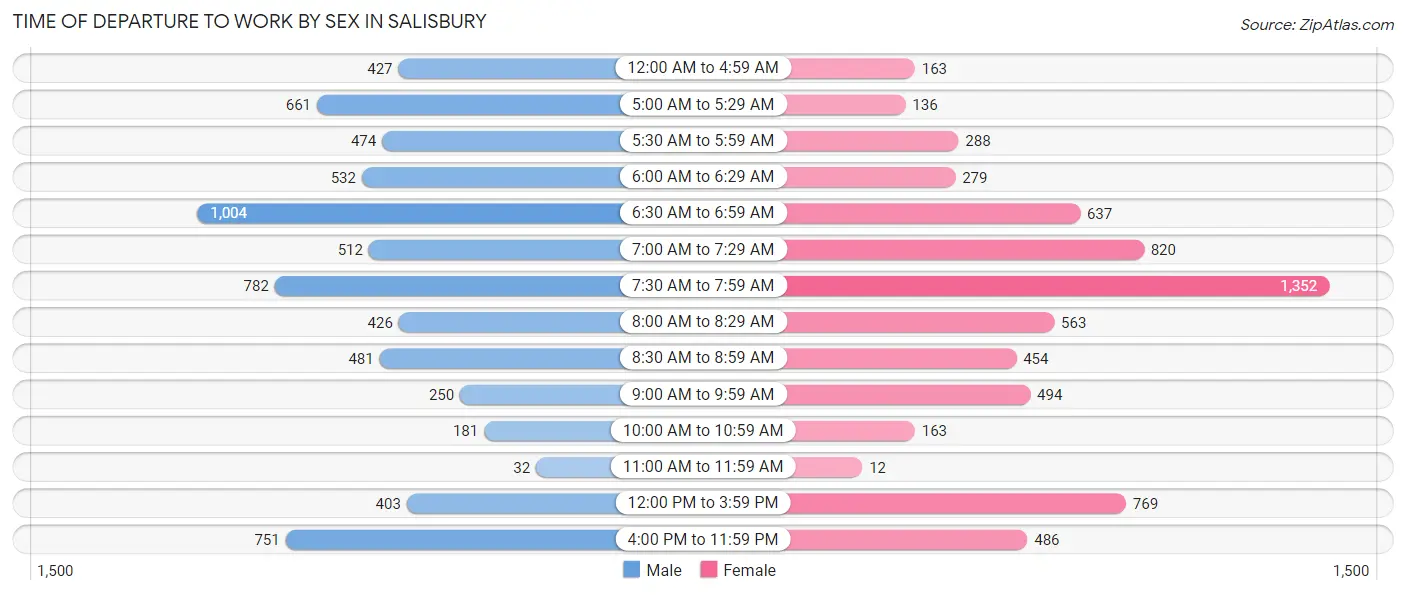
| Time of Departure | Male | Female |
| 12:00 AM to 4:59 AM | 427 (6.2%) | 163 (2.5%) |
| 5:00 AM to 5:29 AM | 661 (9.6%) | 136 (2.1%) |
| 5:30 AM to 5:59 AM | 474 (6.9%) | 288 (4.3%) |
| 6:00 AM to 6:29 AM | 532 (7.7%) | 279 (4.2%) |
| 6:30 AM to 6:59 AM | 1,004 (14.5%) | 637 (9.6%) |
| 7:00 AM to 7:29 AM | 512 (7.4%) | 820 (12.4%) |
| 7:30 AM to 7:59 AM | 782 (11.3%) | 1,352 (20.4%) |
| 8:00 AM to 8:29 AM | 426 (6.2%) | 563 (8.5%) |
| 8:30 AM to 8:59 AM | 481 (7.0%) | 454 (6.9%) |
| 9:00 AM to 9:59 AM | 250 (3.6%) | 494 (7.5%) |
| 10:00 AM to 10:59 AM | 181 (2.6%) | 163 (2.5%) |
| 11:00 AM to 11:59 AM | 32 (0.5%) | 12 (0.2%) |
| 12:00 PM to 3:59 PM | 403 (5.8%) | 769 (11.6%) |
| 4:00 PM to 11:59 PM | 751 (10.9%) | 486 (7.3%) |
| Total | 6,916 (100.0%) | 6,616 (100.0%) |
Housing Occupancy in Salisbury
Occupancy by Ownership in Salisbury
Of the total 13,258 dwellings in Salisbury, owner-occupied units account for 6,798 (51.3%), while renter-occupied units make up 6,460 (48.7%).
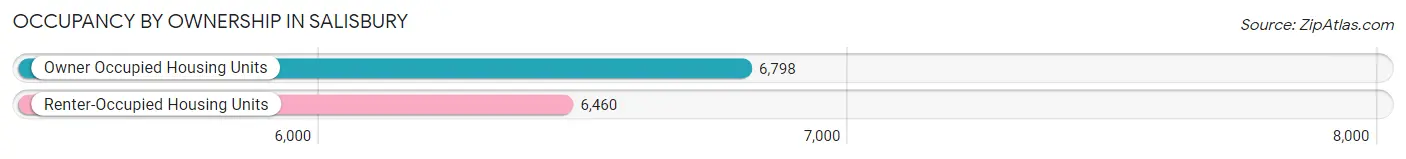
| Occupancy | # Housing Units | % Housing Units |
| Owner Occupied Housing Units | 6,798 | 51.3% |
| Renter-Occupied Housing Units | 6,460 | 48.7% |
| Total Occupied Housing Units | 13,258 | 100.0% |
Occupancy by Household Size in Salisbury
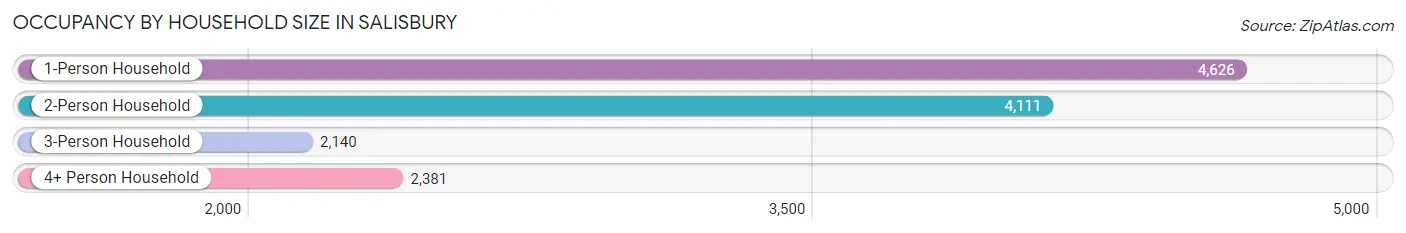
| Household Size | # Housing Units | % Housing Units |
| 1-Person Household | 4,626 | 34.9% |
| 2-Person Household | 4,111 | 31.0% |
| 3-Person Household | 2,140 | 16.1% |
| 4+ Person Household | 2,381 | 18.0% |
| Total Housing Units | 13,258 | 100.0% |
Occupancy by Ownership by Household Size in Salisbury
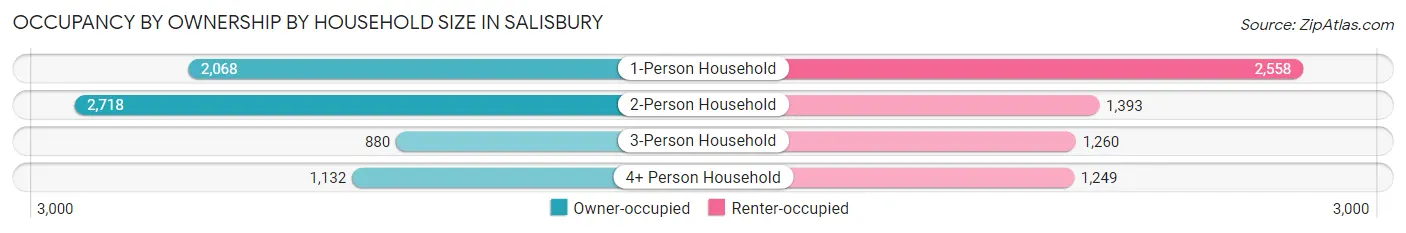
| Household Size | Owner-occupied | Renter-occupied |
| 1-Person Household | 2,068 (44.7%) | 2,558 (55.3%) |
| 2-Person Household | 2,718 (66.1%) | 1,393 (33.9%) |
| 3-Person Household | 880 (41.1%) | 1,260 (58.9%) |
| 4+ Person Household | 1,132 (47.5%) | 1,249 (52.5%) |
| Total Housing Units | 6,798 (51.3%) | 6,460 (48.7%) |
Occupancy by Educational Attainment in Salisbury
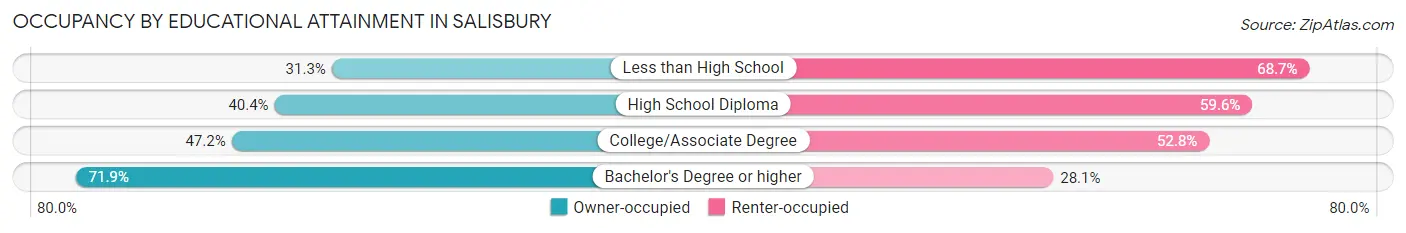
| Household Size | Owner-occupied | Renter-occupied |
| Less than High School | 379 (31.3%) | 832 (68.7%) |
| High School Diploma | 1,349 (40.4%) | 1,993 (59.6%) |
| College/Associate Degree | 2,271 (47.2%) | 2,541 (52.8%) |
| Bachelor's Degree or higher | 2,799 (71.9%) | 1,094 (28.1%) |
Occupancy by Age of Householder in Salisbury
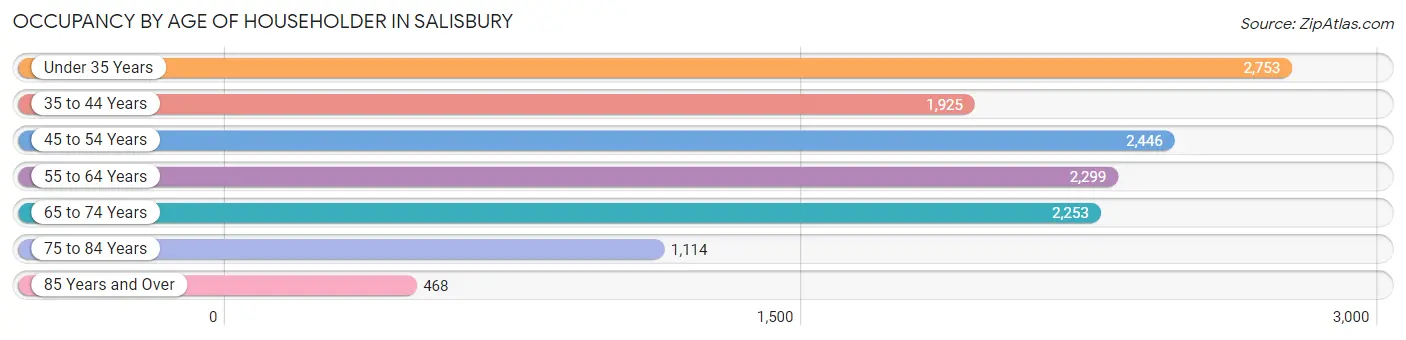
| Age Bracket | # Households | % Households |
| Under 35 Years | 2,753 | 20.8% |
| 35 to 44 Years | 1,925 | 14.5% |
| 45 to 54 Years | 2,446 | 18.4% |
| 55 to 64 Years | 2,299 | 17.3% |
| 65 to 74 Years | 2,253 | 17.0% |
| 75 to 84 Years | 1,114 | 8.4% |
| 85 Years and Over | 468 | 3.5% |
| Total | 13,258 | 100.0% |
Housing Finances in Salisbury
Median Income by Occupancy in Salisbury
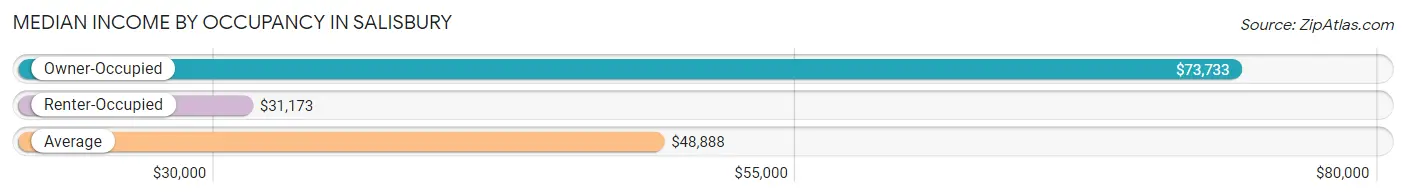
| Occupancy Type | # Households | Median Income |
| Owner-Occupied | 6,798 (51.3%) | $73,733 |
| Renter-Occupied | 6,460 (48.7%) | $31,173 |
| Average | 13,258 (100.0%) | $48,888 |
Occupancy by Householder Income Bracket in Salisbury
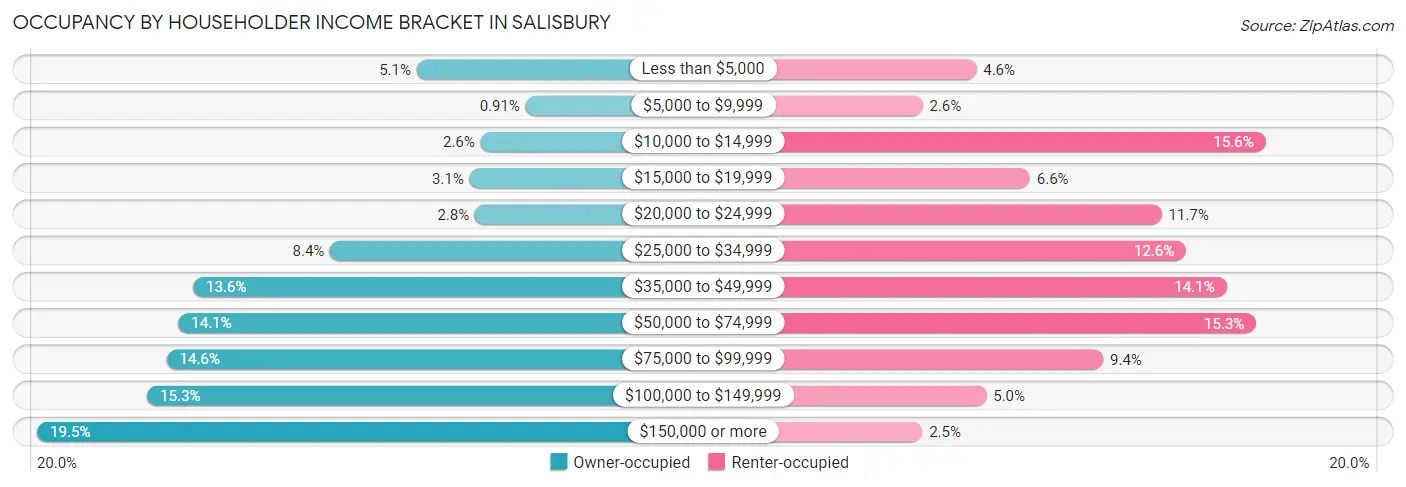
| Income Bracket | Owner-occupied | Renter-occupied |
| Less than $5,000 | 344 (5.1%) | 297 (4.6%) |
| $5,000 to $9,999 | 62 (0.9%) | 165 (2.5%) |
| $10,000 to $14,999 | 179 (2.6%) | 1,009 (15.6%) |
| $15,000 to $19,999 | 207 (3.0%) | 429 (6.6%) |
| $20,000 to $24,999 | 193 (2.8%) | 753 (11.7%) |
| $25,000 to $34,999 | 568 (8.4%) | 813 (12.6%) |
| $35,000 to $49,999 | 923 (13.6%) | 913 (14.1%) |
| $50,000 to $74,999 | 961 (14.1%) | 986 (15.3%) |
| $75,000 to $99,999 | 992 (14.6%) | 609 (9.4%) |
| $100,000 to $149,999 | 1,042 (15.3%) | 322 (5.0%) |
| $150,000 or more | 1,327 (19.5%) | 164 (2.5%) |
| Total | 6,798 (100.0%) | 6,460 (100.0%) |
Monthly Housing Cost Tiers in Salisbury
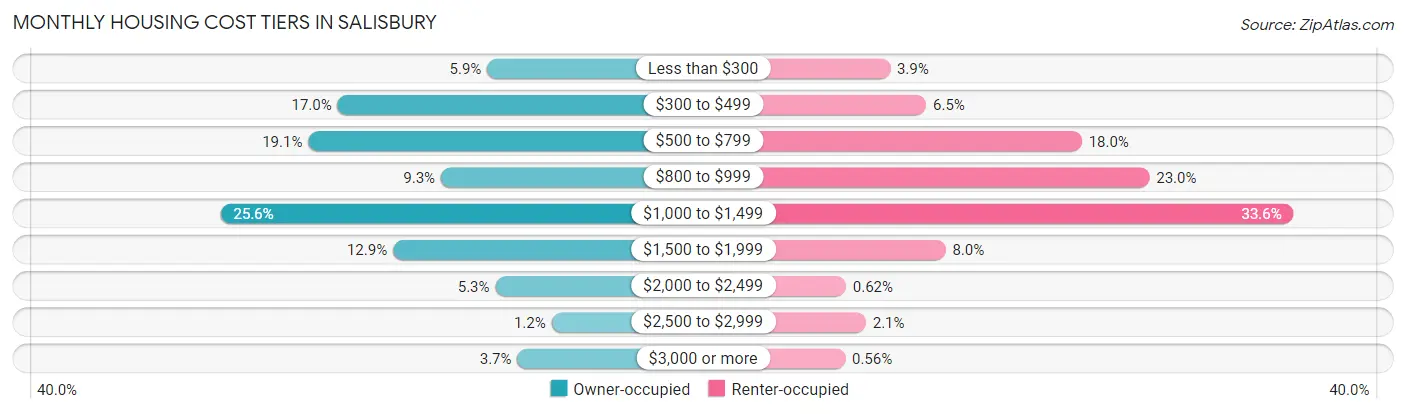
| Monthly Cost | Owner-occupied | Renter-occupied |
| Less than $300 | 403 (5.9%) | 250 (3.9%) |
| $300 to $499 | 1,152 (17.0%) | 422 (6.5%) |
| $500 to $799 | 1,299 (19.1%) | 1,162 (18.0%) |
| $800 to $999 | 635 (9.3%) | 1,484 (23.0%) |
| $1,000 to $1,499 | 1,739 (25.6%) | 2,170 (33.6%) |
| $1,500 to $1,999 | 875 (12.9%) | 514 (8.0%) |
| $2,000 to $2,499 | 362 (5.3%) | 40 (0.6%) |
| $2,500 to $2,999 | 81 (1.2%) | 135 (2.1%) |
| $3,000 or more | 252 (3.7%) | 36 (0.6%) |
| Total | 6,798 (100.0%) | 6,460 (100.0%) |
Physical Housing Characteristics in Salisbury
Housing Structures in Salisbury
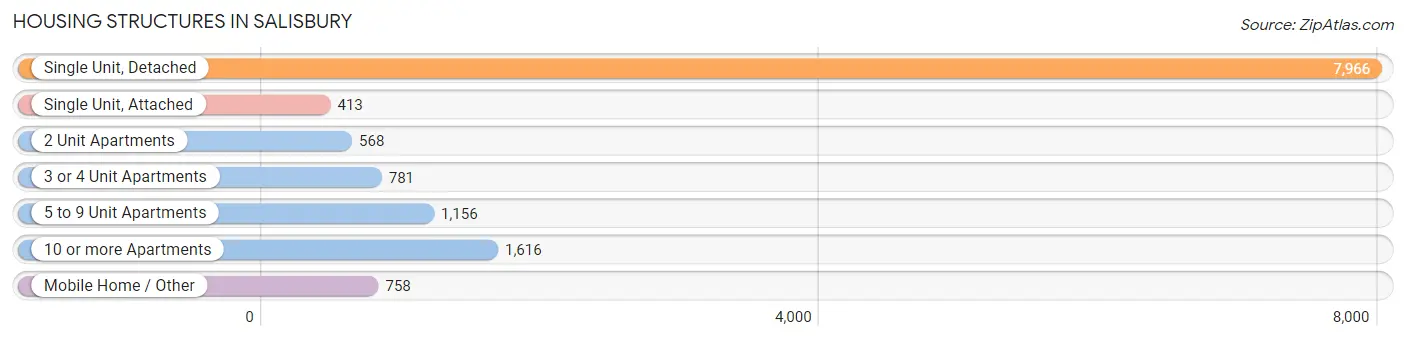
| Structure Type | # Housing Units | % Housing Units |
| Single Unit, Detached | 7,966 | 60.1% |
| Single Unit, Attached | 413 | 3.1% |
| 2 Unit Apartments | 568 | 4.3% |
| 3 or 4 Unit Apartments | 781 | 5.9% |
| 5 to 9 Unit Apartments | 1,156 | 8.7% |
| 10 or more Apartments | 1,616 | 12.2% |
| Mobile Home / Other | 758 | 5.7% |
| Total | 13,258 | 100.0% |
Housing Structures by Occupancy in Salisbury
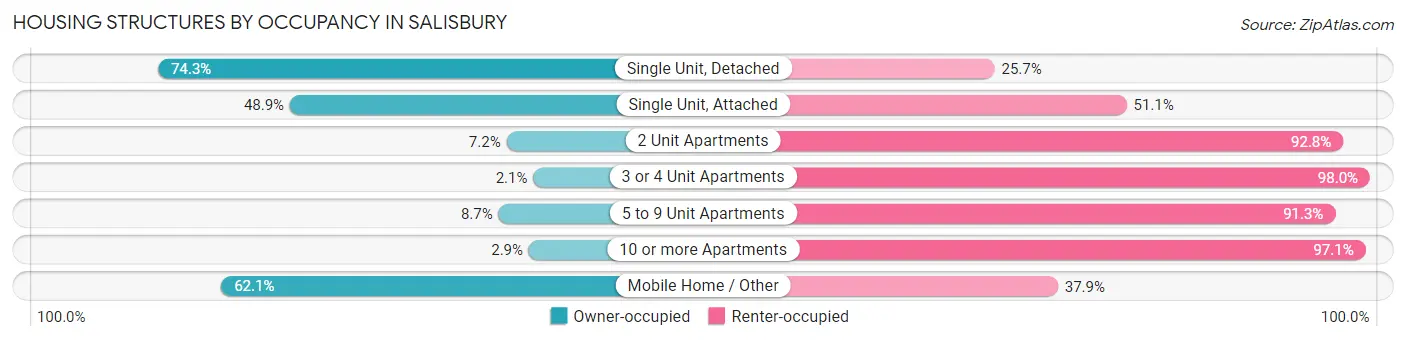
| Structure Type | Owner-occupied | Renter-occupied |
| Single Unit, Detached | 5,920 (74.3%) | 2,046 (25.7%) |
| Single Unit, Attached | 202 (48.9%) | 211 (51.1%) |
| 2 Unit Apartments | 41 (7.2%) | 527 (92.8%) |
| 3 or 4 Unit Apartments | 16 (2.1%) | 765 (98.0%) |
| 5 to 9 Unit Apartments | 101 (8.7%) | 1,055 (91.3%) |
| 10 or more Apartments | 47 (2.9%) | 1,569 (97.1%) |
| Mobile Home / Other | 471 (62.1%) | 287 (37.9%) |
| Total | 6,798 (51.3%) | 6,460 (48.7%) |
Housing Structures by Number of Rooms in Salisbury
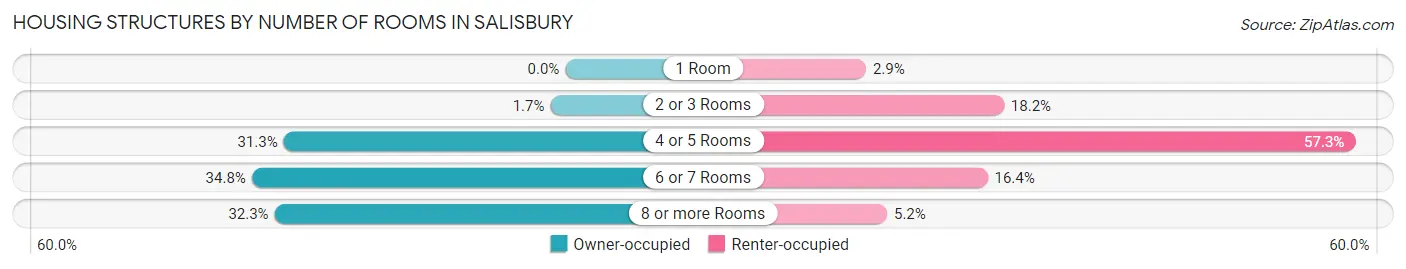
| Number of Rooms | Owner-occupied | Renter-occupied |
| 1 Room | 0 (0.0%) | 187 (2.9%) |
| 2 or 3 Rooms | 113 (1.7%) | 1,176 (18.2%) |
| 4 or 5 Rooms | 2,125 (31.3%) | 3,701 (57.3%) |
| 6 or 7 Rooms | 2,366 (34.8%) | 1,058 (16.4%) |
| 8 or more Rooms | 2,194 (32.3%) | 338 (5.2%) |
| Total | 6,798 (100.0%) | 6,460 (100.0%) |
Housing Structure by Heating Type in Salisbury
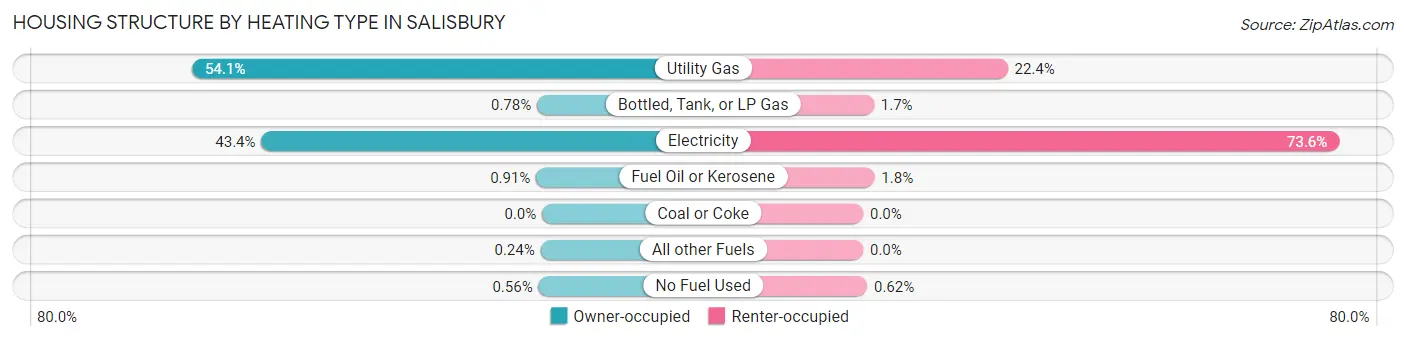
| Heating Type | Owner-occupied | Renter-occupied |
| Utility Gas | 3,679 (54.1%) | 1,444 (22.4%) |
| Bottled, Tank, or LP Gas | 53 (0.8%) | 108 (1.7%) |
| Electricity | 2,950 (43.4%) | 4,754 (73.6%) |
| Fuel Oil or Kerosene | 62 (0.9%) | 114 (1.8%) |
| Coal or Coke | 0 (0.0%) | 0 (0.0%) |
| All other Fuels | 16 (0.2%) | 0 (0.0%) |
| No Fuel Used | 38 (0.6%) | 40 (0.6%) |
| Total | 6,798 (100.0%) | 6,460 (100.0%) |
Household Vehicle Usage in Salisbury
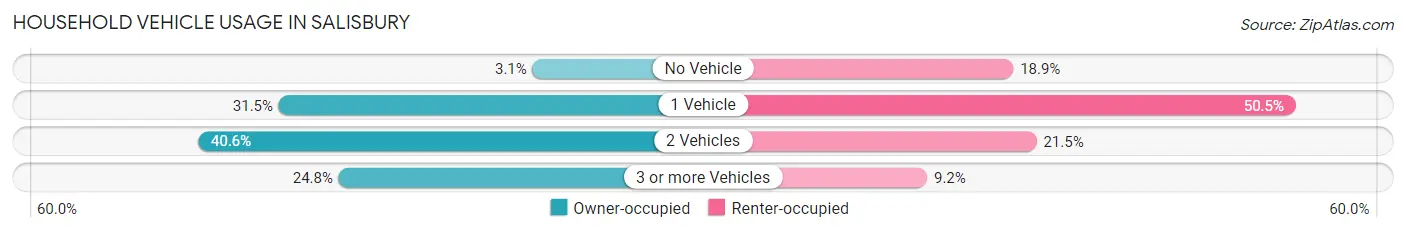
| Vehicles per Household | Owner-occupied | Renter-occupied |
| No Vehicle | 210 (3.1%) | 1,218 (18.9%) |
| 1 Vehicle | 2,143 (31.5%) | 3,262 (50.5%) |
| 2 Vehicles | 2,759 (40.6%) | 1,386 (21.5%) |
| 3 or more Vehicles | 1,686 (24.8%) | 594 (9.2%) |
| Total | 6,798 (100.0%) | 6,460 (100.0%) |
Real Estate & Mortgages in Salisbury
Real Estate and Mortgage Overview in Salisbury
| Characteristic | Without Mortgage | With Mortgage |
| Housing Units | 2,553 | 4,245 |
| Median Property Value | $153,700 | $206,800 |
| Median Household Income | $47,896 | $1,008 |
| Monthly Housing Costs | $454 | $239 |
| Real Estate Taxes | $1,621 | $26 |
Property Value by Mortgage Status in Salisbury
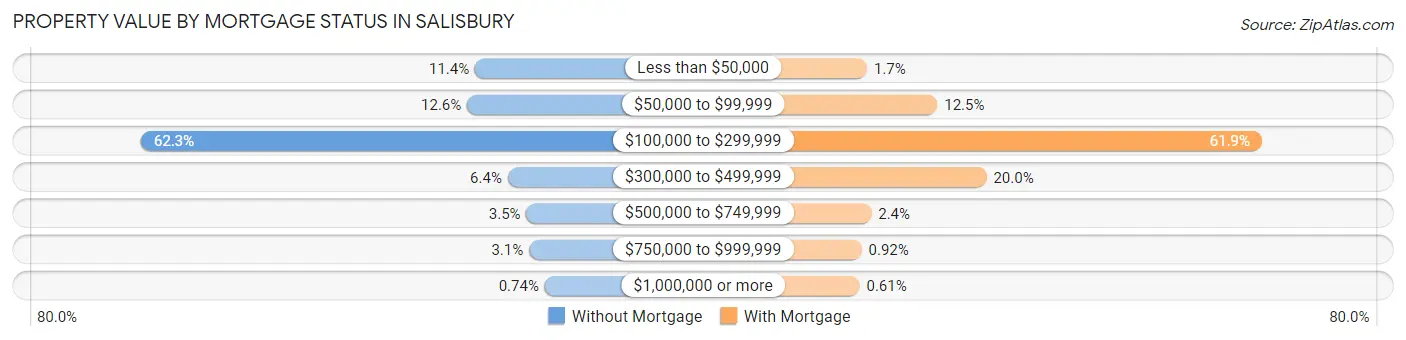
| Property Value | Without Mortgage | With Mortgage |
| Less than $50,000 | 290 (11.4%) | 74 (1.7%) |
| $50,000 to $99,999 | 321 (12.6%) | 529 (12.5%) |
| $100,000 to $299,999 | 1,590 (62.3%) | 2,628 (61.9%) |
| $300,000 to $499,999 | 163 (6.4%) | 847 (20.0%) |
| $500,000 to $749,999 | 90 (3.5%) | 102 (2.4%) |
| $750,000 to $999,999 | 80 (3.1%) | 39 (0.9%) |
| $1,000,000 or more | 19 (0.7%) | 26 (0.6%) |
| Total | 2,553 (100.0%) | 4,245 (100.0%) |
Household Income by Mortgage Status in Salisbury
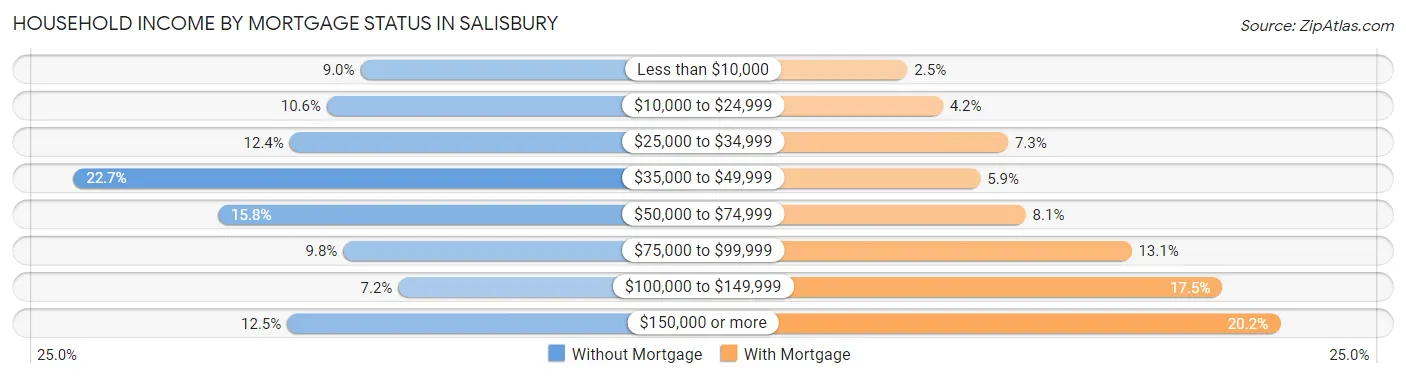
| Household Income | Without Mortgage | With Mortgage |
| Less than $10,000 | 230 (9.0%) | 105 (2.5%) |
| $10,000 to $24,999 | 271 (10.6%) | 176 (4.2%) |
| $25,000 to $34,999 | 316 (12.4%) | 308 (7.3%) |
| $35,000 to $49,999 | 579 (22.7%) | 252 (5.9%) |
| $50,000 to $74,999 | 403 (15.8%) | 344 (8.1%) |
| $75,000 to $99,999 | 251 (9.8%) | 558 (13.1%) |
| $100,000 to $149,999 | 184 (7.2%) | 741 (17.5%) |
| $150,000 or more | 319 (12.5%) | 858 (20.2%) |
| Total | 2,553 (100.0%) | 4,245 (100.0%) |
Property Value to Household Income Ratio in Salisbury
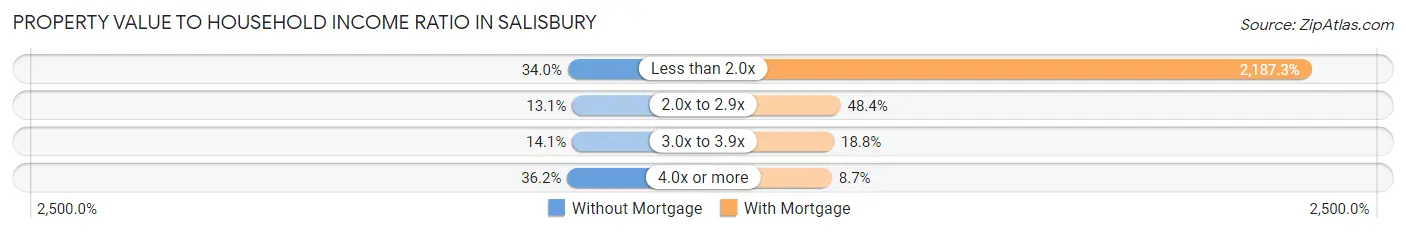
| Value-to-Income Ratio | Without Mortgage | With Mortgage |
| Less than 2.0x | 868 (34.0%) | 92,849 (2,187.3%) |
| 2.0x to 2.9x | 334 (13.1%) | 2,053 (48.4%) |
| 3.0x to 3.9x | 361 (14.1%) | 797 (18.8%) |
| 4.0x or more | 925 (36.2%) | 368 (8.7%) |
| Total | 2,553 (100.0%) | 4,245 (100.0%) |
Real Estate Taxes by Mortgage Status in Salisbury
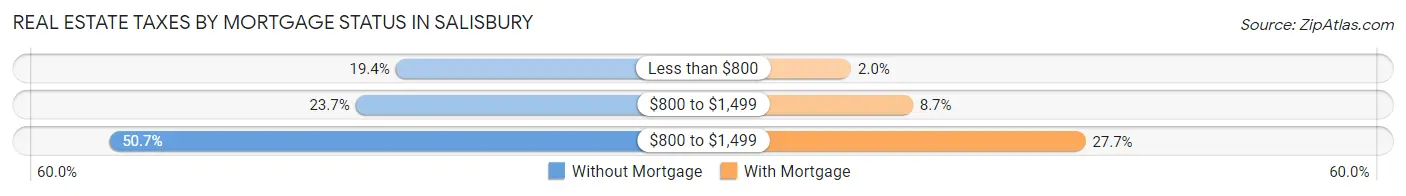
| Property Taxes | Without Mortgage | With Mortgage |
| Less than $800 | 494 (19.4%) | 84 (2.0%) |
| $800 to $1,499 | 606 (23.7%) | 371 (8.7%) |
| $800 to $1,499 | 1,295 (50.7%) | 1,174 (27.7%) |
| Total | 2,553 (100.0%) | 4,245 (100.0%) |
Health & Disability in Salisbury
Health Insurance Coverage by Age in Salisbury
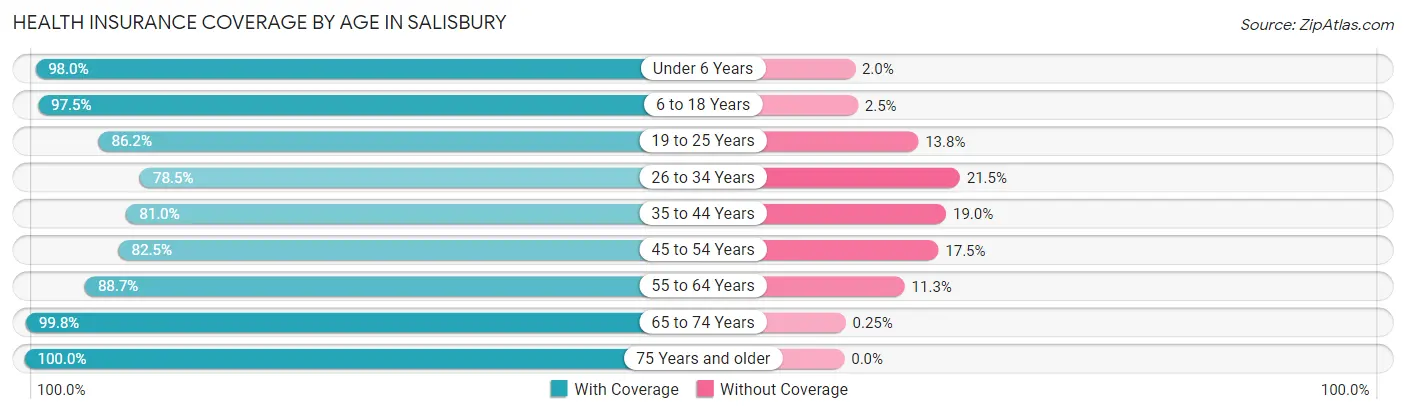
| Age Bracket | With Coverage | Without Coverage |
| Under 6 Years | 2,410 (98.0%) | 49 (2.0%) |
| 6 to 18 Years | 5,827 (97.5%) | 151 (2.5%) |
| 19 to 25 Years | 3,357 (86.2%) | 537 (13.8%) |
| 26 to 34 Years | 3,257 (78.5%) | 894 (21.5%) |
| 35 to 44 Years | 3,056 (81.0%) | 716 (19.0%) |
| 45 to 54 Years | 3,315 (82.5%) | 705 (17.5%) |
| 55 to 64 Years | 3,264 (88.7%) | 414 (11.3%) |
| 65 to 74 Years | 3,159 (99.8%) | 8 (0.3%) |
| 75 Years and older | 2,171 (100.0%) | 0 (0.0%) |
| Total | 29,816 (89.6%) | 3,474 (10.4%) |
Health Insurance Coverage by Citizenship Status in Salisbury
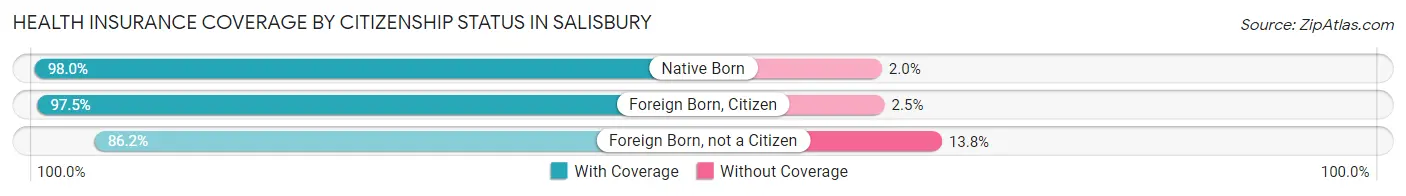
| Citizenship Status | With Coverage | Without Coverage |
| Native Born | 2,410 (98.0%) | 49 (2.0%) |
| Foreign Born, Citizen | 5,827 (97.5%) | 151 (2.5%) |
| Foreign Born, not a Citizen | 3,357 (86.2%) | 537 (13.8%) |
Health Insurance Coverage by Household Income in Salisbury
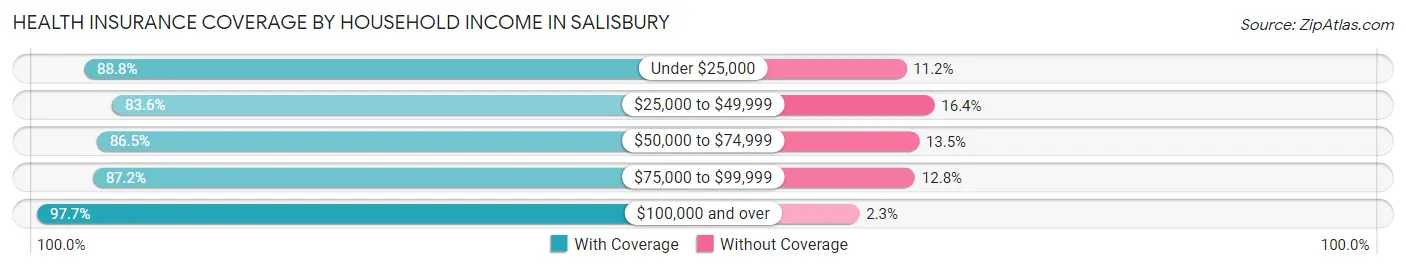
| Household Income | With Coverage | Without Coverage |
| Under $25,000 | 6,154 (88.8%) | 773 (11.2%) |
| $25,000 to $49,999 | 5,745 (83.6%) | 1,128 (16.4%) |
| $50,000 to $74,999 | 3,812 (86.5%) | 596 (13.5%) |
| $75,000 to $99,999 | 3,712 (87.2%) | 543 (12.8%) |
| $100,000 and over | 9,019 (97.7%) | 216 (2.3%) |
Public vs Private Health Insurance Coverage by Age in Salisbury
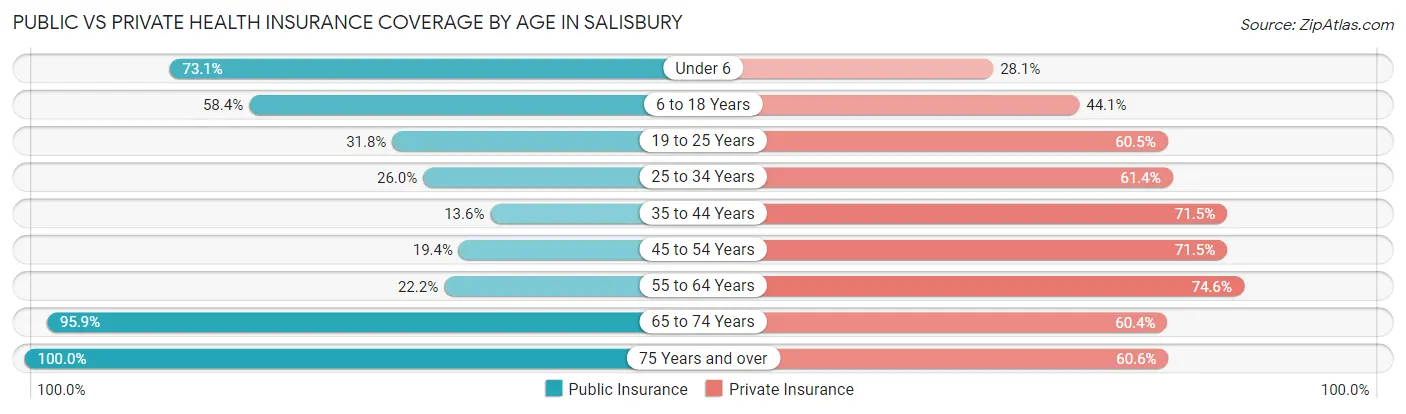
| Age Bracket | Public Insurance | Private Insurance |
| Under 6 | 1,798 (73.1%) | 691 (28.1%) |
| 6 to 18 Years | 3,488 (58.4%) | 2,635 (44.1%) |
| 19 to 25 Years | 1,237 (31.8%) | 2,354 (60.5%) |
| 25 to 34 Years | 1,081 (26.0%) | 2,548 (61.4%) |
| 35 to 44 Years | 512 (13.6%) | 2,697 (71.5%) |
| 45 to 54 Years | 780 (19.4%) | 2,874 (71.5%) |
| 55 to 64 Years | 815 (22.2%) | 2,744 (74.6%) |
| 65 to 74 Years | 3,036 (95.9%) | 1,914 (60.4%) |
| 75 Years and over | 2,171 (100.0%) | 1,316 (60.6%) |
| Total | 14,918 (44.8%) | 19,773 (59.4%) |
Disability Status by Sex by Age in Salisbury
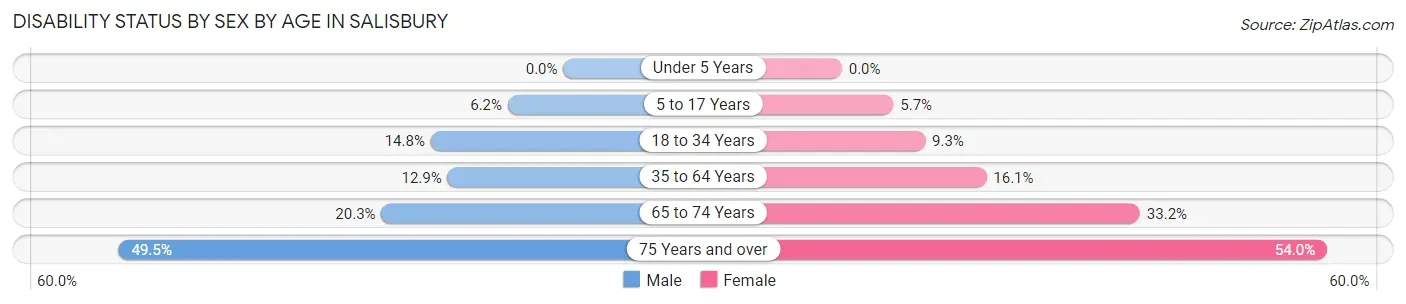
| Age Bracket | Male | Female |
| Under 5 Years | 0 (0.0%) | 0 (0.0%) |
| 5 to 17 Years | 199 (6.2%) | 158 (5.7%) |
| 18 to 34 Years | 650 (14.8%) | 387 (9.3%) |
| 35 to 64 Years | 704 (12.9%) | 968 (16.1%) |
| 65 to 74 Years | 278 (20.3%) | 596 (33.2%) |
| 75 Years and over | 377 (49.5%) | 762 (54.0%) |
Disability Class by Sex by Age in Salisbury
Disability Class: Hearing Difficulty
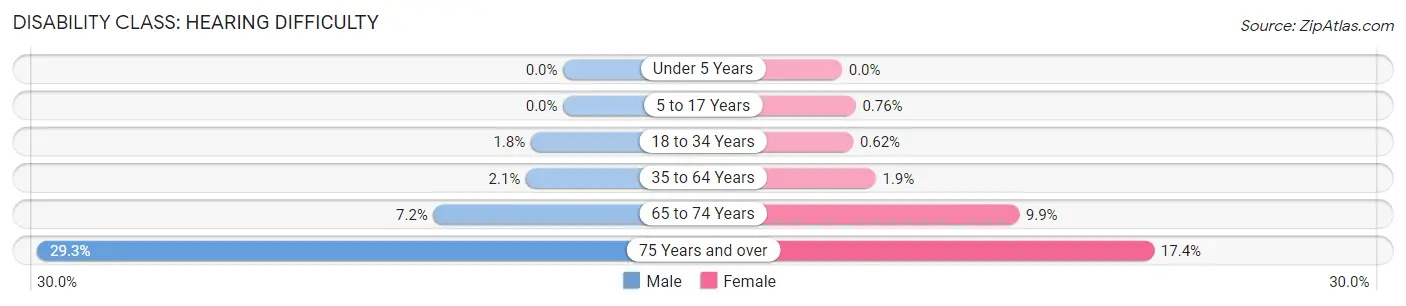
| Age Bracket | Male | Female |
| Under 5 Years | 0 (0.0%) | 0 (0.0%) |
| 5 to 17 Years | 0 (0.0%) | 21 (0.8%) |
| 18 to 34 Years | 79 (1.8%) | 26 (0.6%) |
| 35 to 64 Years | 113 (2.1%) | 113 (1.9%) |
| 65 to 74 Years | 99 (7.2%) | 177 (9.9%) |
| 75 Years and over | 223 (29.3%) | 245 (17.4%) |
Disability Class: Vision Difficulty
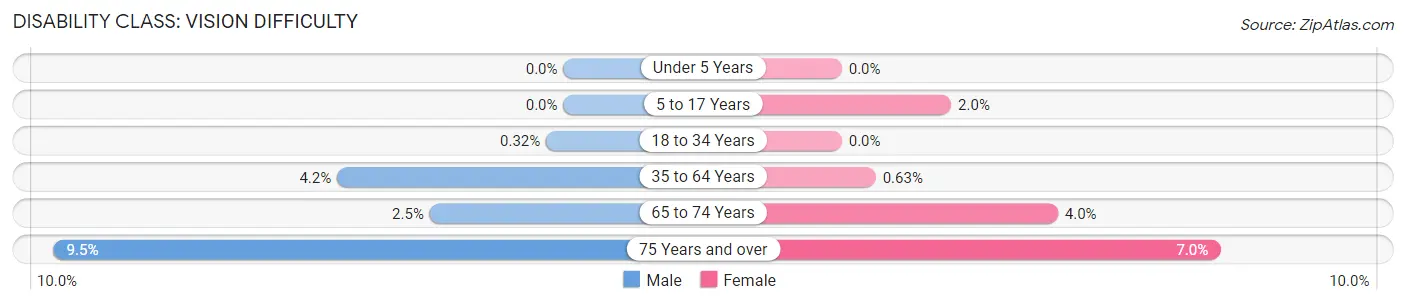
| Age Bracket | Male | Female |
| Under 5 Years | 0 (0.0%) | 0 (0.0%) |
| 5 to 17 Years | 0 (0.0%) | 56 (2.0%) |
| 18 to 34 Years | 14 (0.3%) | 0 (0.0%) |
| 35 to 64 Years | 229 (4.2%) | 38 (0.6%) |
| 65 to 74 Years | 34 (2.5%) | 72 (4.0%) |
| 75 Years and over | 72 (9.5%) | 99 (7.0%) |
Disability Class: Cognitive Difficulty
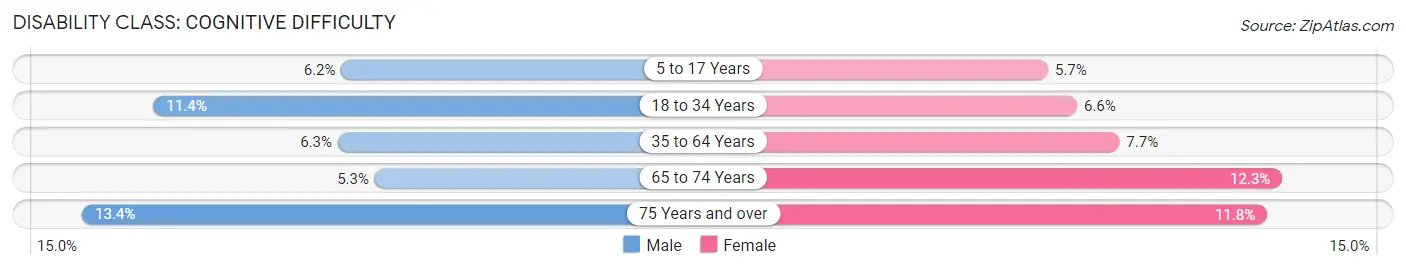
| Age Bracket | Male | Female |
| 5 to 17 Years | 199 (6.2%) | 158 (5.7%) |
| 18 to 34 Years | 502 (11.4%) | 273 (6.6%) |
| 35 to 64 Years | 343 (6.3%) | 465 (7.7%) |
| 65 to 74 Years | 72 (5.2%) | 220 (12.3%) |
| 75 Years and over | 102 (13.4%) | 167 (11.8%) |
Disability Class: Ambulatory Difficulty
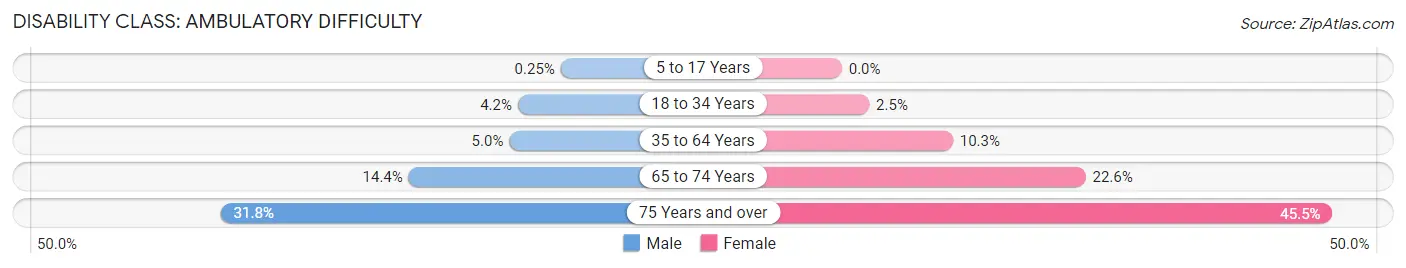
| Age Bracket | Male | Female |
| 5 to 17 Years | 8 (0.3%) | 0 (0.0%) |
| 18 to 34 Years | 186 (4.2%) | 106 (2.5%) |
| 35 to 64 Years | 274 (5.0%) | 619 (10.3%) |
| 65 to 74 Years | 197 (14.4%) | 406 (22.6%) |
| 75 Years and over | 242 (31.8%) | 642 (45.5%) |
Disability Class: Self-Care Difficulty
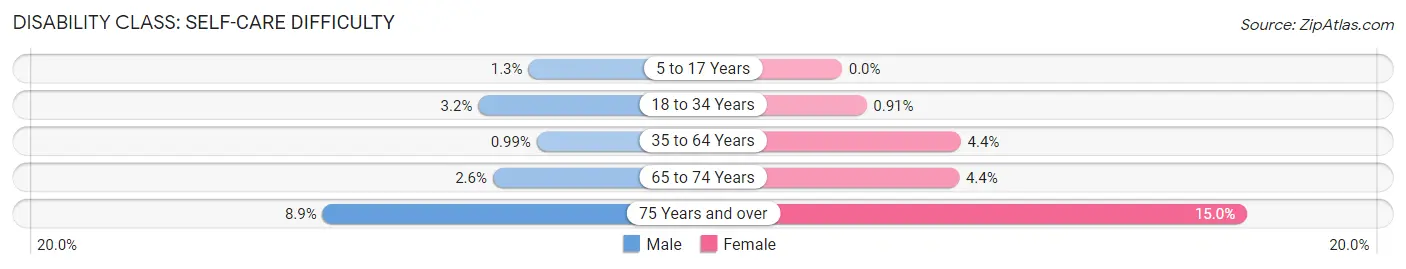
| Age Bracket | Male | Female |
| 5 to 17 Years | 42 (1.3%) | 0 (0.0%) |
| 18 to 34 Years | 139 (3.2%) | 38 (0.9%) |
| 35 to 64 Years | 54 (1.0%) | 265 (4.4%) |
| 65 to 74 Years | 36 (2.6%) | 78 (4.3%) |
| 75 Years and over | 68 (8.9%) | 212 (15.0%) |
Technology Access in Salisbury
Computing Device Access in Salisbury
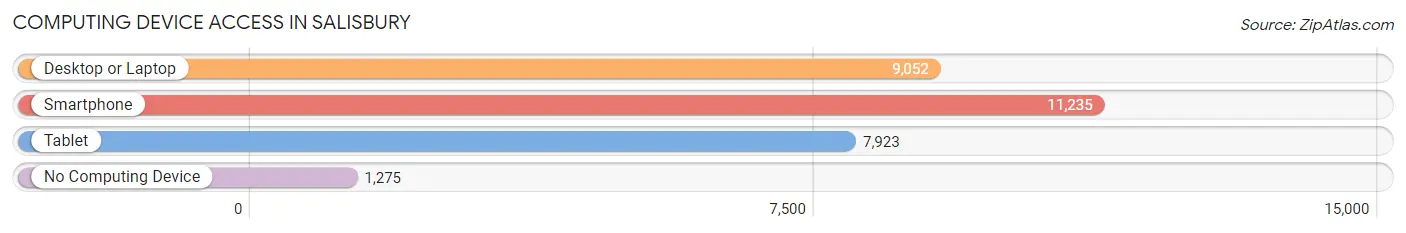
| Device Type | # Households | % Households |
| Desktop or Laptop | 9,052 | 68.3% |
| Smartphone | 11,235 | 84.7% |
| Tablet | 7,923 | 59.8% |
| No Computing Device | 1,275 | 9.6% |
| Total | 13,258 | 100.0% |
Internet Access in Salisbury
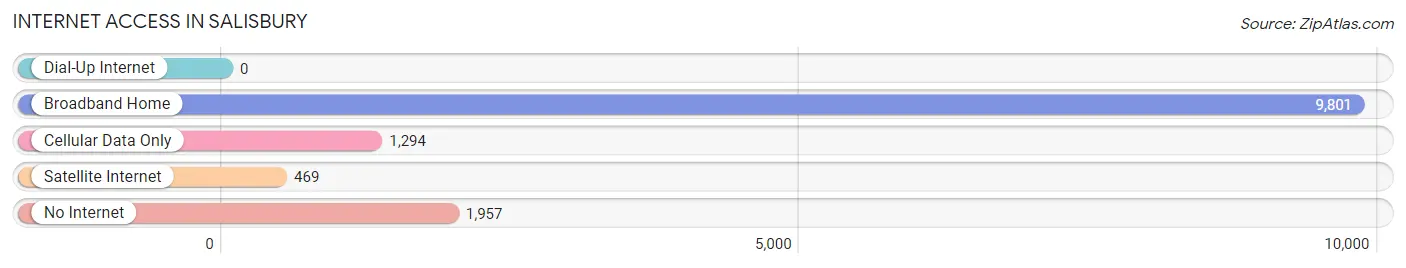
| Internet Type | # Households | % Households |
| Dial-Up Internet | 0 | 0.0% |
| Broadband Home | 9,801 | 73.9% |
| Cellular Data Only | 1,294 | 9.8% |
| Satellite Internet | 469 | 3.5% |
| No Internet | 1,957 | 14.8% |
| Total | 13,258 | 100.0% |
Salisbury Summary
Salisbury, North Carolina is a city located in Rowan County, in the central part of the state. It is the county seat and the largest city in the county. The city is situated on the banks of the Yadkin River, and is located approximately 40 miles northeast of Charlotte. The population of Salisbury was estimated to be 33,662 in 2019.
History
Salisbury was founded in 1753 by a group of German and Swiss immigrants led by John Van Lear. The city was named after Salisbury, England, and was incorporated in 1755. The city was an important trading center during the Revolutionary War, and was the site of several battles.
In the 19th century, Salisbury became an important railroad hub, and the city's economy was largely based on the railroad industry. The city was also home to several textile mills, and the economy was further bolstered by the tobacco industry.
Geography
Salisbury is located in the Piedmont region of North Carolina, and is situated on the banks of the Yadkin River. The city is located approximately 40 miles northeast of Charlotte, and is bordered by the towns of Spencer, Kannapolis, and Concord. The city covers an area of 16.3 square miles, and has an elevation of 845 feet.
Climate
Salisbury has a humid subtropical climate, with hot, humid summers and mild winters. The average annual temperature is 61°F, and the average annual precipitation is 44 inches.
Economy
The economy of Salisbury is largely based on manufacturing, with several major employers in the city. The largest employers in the city include Food Lion, Novant Health, and Corning. The city is also home to several small businesses, including restaurants, retail stores, and professional services.
Demographics
As of 2019, the population of Salisbury was estimated to be 33,662. The racial makeup of the city was 68.3% White, 25.2% African American, 0.7% Native American, 1.7% Asian, and 3.9% from other races. The median household income was $41,945, and the median home value was $142,400.
Conclusion
Salisbury, North Carolina is a city located in Rowan County, in the central part of the state. It was founded in 1753 by a group of German and Swiss immigrants, and was an important trading center during the Revolutionary War. The city is situated on the banks of the Yadkin River, and is located approximately 40 miles northeast of Charlotte. The economy of Salisbury is largely based on manufacturing, and the city is home to several major employers. The population of Salisbury was estimated to be 33,662 in 2019, and the racial makeup of the city was 68.3% White, 25.2% African American, 0.7% Native American, 1.7% Asian, and 3.9% from other races.
Common Questions
What is Per Capita Income in Salisbury?
Per Capita income in Salisbury is $30,319.
What is the Median Family Income in Salisbury?
Median Family Income in Salisbury is $64,583.
What is the Median Household income in Salisbury?
Median Household Income in Salisbury is $48,888.
What is Income or Wage Gap in Salisbury?
Income or Wage Gap in Salisbury is 28.0%.
Women in Salisbury earn 72.0 cents for every dollar earned by a man.
What is Family Income Deficit in Salisbury?
Family Income Deficit in Salisbury is $10,958.
Families that are below poverty line in Salisbury earn $10,958 less on average than the poverty threshold level.
What is Inequality or Gini Index in Salisbury?
Inequality or Gini Index in Salisbury is 0.52.
What is the Total Population of Salisbury?
Total Population of Salisbury is 35,437.
What is the Total Male Population of Salisbury?
Total Male Population of Salisbury is 18,198.
What is the Total Female Population of Salisbury?
Total Female Population of Salisbury is 17,239.
What is the Ratio of Males per 100 Females in Salisbury?
There are 105.56 Males per 100 Females in Salisbury.
What is the Ratio of Females per 100 Males in Salisbury?
There are 94.73 Females per 100 Males in Salisbury.
What is the Median Population Age in Salisbury?
Median Population Age in Salisbury is 36.5 Years.
What is the Average Family Size in Salisbury
Average Family Size in Salisbury is 3.1 People.
What is the Average Household Size in Salisbury
Average Household Size in Salisbury is 2.4 People.
How Large is the Labor Force in Salisbury?
There are 16,254 People in the Labor Forcein in Salisbury.
What is the Percentage of People in the Labor Force in Salisbury?
57.1% of People are in the Labor Force in Salisbury.
What is the Unemployment Rate in Salisbury?
Unemployment Rate in Salisbury is 7.0%.