Fuquay Varina, NC Map & Demographics
Fuquay Varina Map
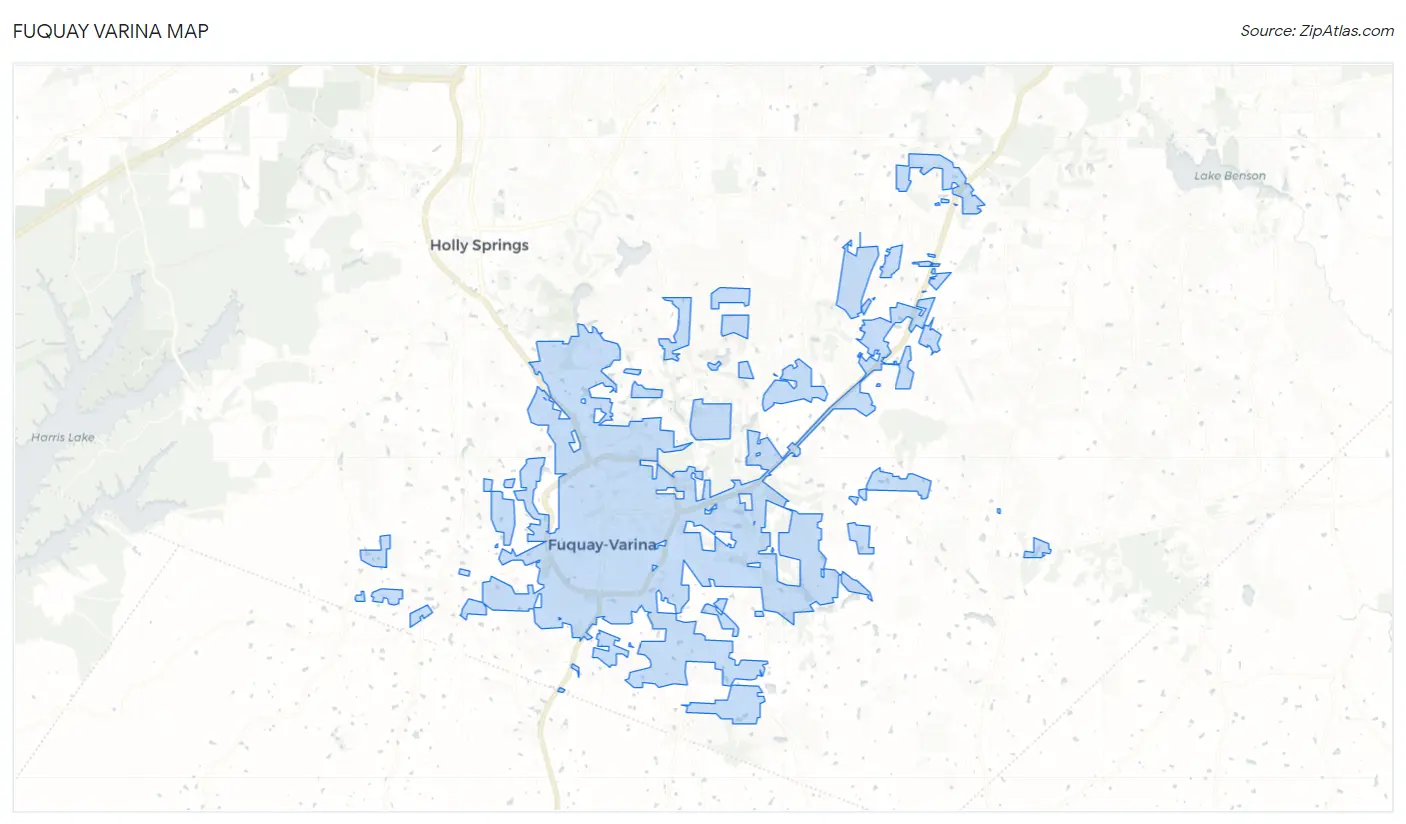
Fuquay Varina Overview
$39,817
PER CAPITA INCOME
$115,215
AVG FAMILY INCOME
$94,142
AVG HOUSEHOLD INCOME
19.8%
WAGE / INCOME GAP [ % ]
80.2¢/ $1
WAGE / INCOME GAP [ $ ]
0.39
INEQUALITY / GINI INDEX
35,428
TOTAL POPULATION
16,905
MALE POPULATION
18,523
FEMALE POPULATION
91.26
MALES / 100 FEMALES
109.57
FEMALES / 100 MALES
35.3
MEDIAN AGE
3.3
AVG FAMILY SIZE
2.8
AVG HOUSEHOLD SIZE
17,827
LABOR FORCE [ PEOPLE ]
68.1%
PERCENT IN LABOR FORCE
3.4%
UNEMPLOYMENT RATE
Fuquay Varina Zip Codes
Fuquay Varina Area Codes
Income in Fuquay Varina
Income Overview in Fuquay Varina
Per Capita Income in Fuquay Varina is $39,817, while median incomes of families and households are $115,215 and $94,142 respectively.
| Characteristic | Number | Measure |
| Per Capita Income | 35,428 | $39,817 |
| Median Family Income | 9,212 | $115,215 |
| Mean Family Income | 9,212 | $127,431 |
| Median Household Income | 12,449 | $94,142 |
| Mean Household Income | 12,449 | $111,579 |
| Income Deficit | 9,212 | $0 |
| Wage / Income Gap (%) | 35,428 | 19.81% |
| Wage / Income Gap ($) | 35,428 | 80.19¢ per $1 |
| Gini / Inequality Index | 35,428 | 0.39 |
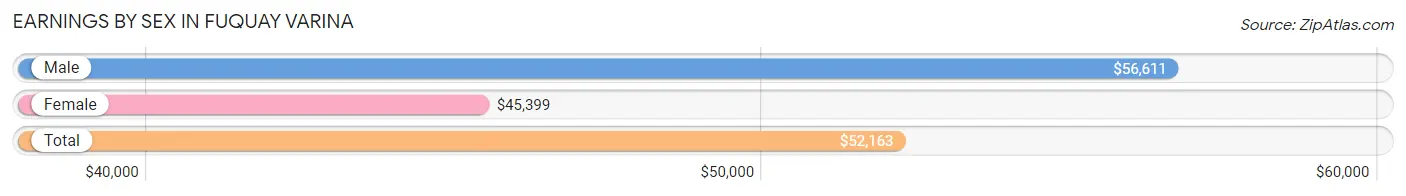
Earnings by Sex in Fuquay Varina
Average Earnings in Fuquay Varina are $52,163, $56,611 for men and $45,399 for women, a difference of 19.8%.
| Sex | Number | Average Earnings |
| Male | 10,104 (53.2%) | $56,611 |
| Female | 8,893 (46.8%) | $45,399 |
| Total | 18,997 (100.0%) | $52,163 |
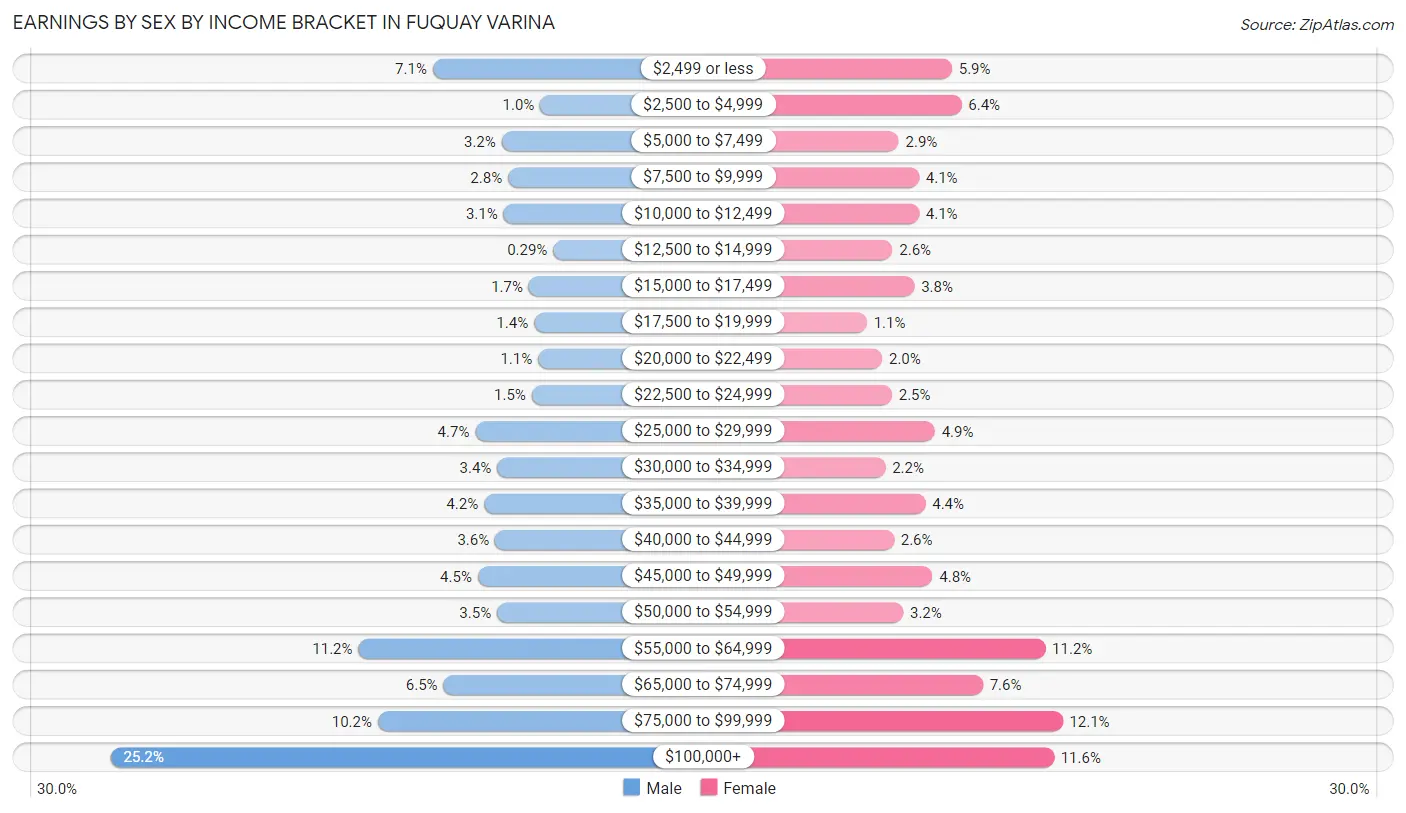
Earnings by Sex by Income Bracket in Fuquay Varina
The most common earnings brackets in Fuquay Varina are $100,000+ for men (2,543 | 25.2%) and $75,000 to $99,999 for women (1,078 | 12.1%).
| Income | Male | Female |
| $2,499 or less | 713 (7.1%) | 525 (5.9%) |
| $2,500 to $4,999 | 103 (1.0%) | 573 (6.4%) |
| $5,000 to $7,499 | 322 (3.2%) | 259 (2.9%) |
| $7,500 to $9,999 | 286 (2.8%) | 360 (4.1%) |
| $10,000 to $12,499 | 311 (3.1%) | 360 (4.1%) |
| $12,500 to $14,999 | 29 (0.3%) | 228 (2.6%) |
| $15,000 to $17,499 | 168 (1.7%) | 337 (3.8%) |
| $17,500 to $19,999 | 138 (1.4%) | 100 (1.1%) |
| $20,000 to $22,499 | 115 (1.1%) | 176 (2.0%) |
| $22,500 to $24,999 | 152 (1.5%) | 225 (2.5%) |
| $25,000 to $29,999 | 472 (4.7%) | 439 (4.9%) |
| $30,000 to $34,999 | 348 (3.4%) | 192 (2.2%) |
| $35,000 to $39,999 | 422 (4.2%) | 392 (4.4%) |
| $40,000 to $44,999 | 360 (3.6%) | 235 (2.6%) |
| $45,000 to $49,999 | 458 (4.5%) | 428 (4.8%) |
| $50,000 to $54,999 | 349 (3.5%) | 281 (3.2%) |
| $55,000 to $64,999 | 1,136 (11.2%) | 992 (11.2%) |
| $65,000 to $74,999 | 653 (6.5%) | 679 (7.6%) |
| $75,000 to $99,999 | 1,026 (10.2%) | 1,078 (12.1%) |
| $100,000+ | 2,543 (25.2%) | 1,034 (11.6%) |
| Total | 10,104 (100.0%) | 8,893 (100.0%) |
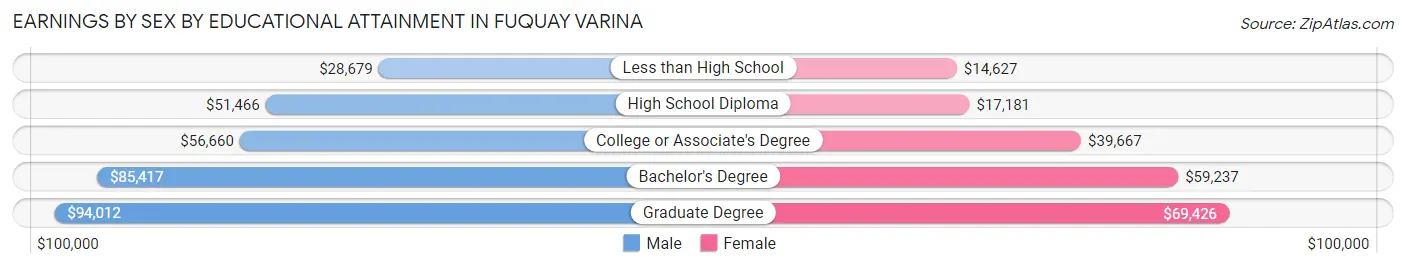
Earnings by Sex by Educational Attainment in Fuquay Varina
Average earnings in Fuquay Varina are $62,447 for men and $54,690 for women, a difference of 12.4%. Men with an educational attainment of graduate degree enjoy the highest average annual earnings of $94,012, while those with less than high school education earn the least with $28,679. Women with an educational attainment of graduate degree earn the most with the average annual earnings of $69,426, while those with less than high school education have the smallest earnings of $14,627.
| Educational Attainment | Male Income | Female Income |
| Less than High School | $28,679 | $14,627 |
| High School Diploma | $51,466 | $17,181 |
| College or Associate's Degree | $56,660 | $39,667 |
| Bachelor's Degree | $85,417 | $59,237 |
| Graduate Degree | $94,012 | $69,426 |
| Total | $62,447 | $54,690 |
Family Income in Fuquay Varina
Family Income Brackets in Fuquay Varina
According to the Fuquay Varina family income data, there are 2,671 families falling into the $100,000 to $149,999 income range, which is the most common income bracket and makes up 29.0% of all families. Conversely, the $10,000 to $14,999 income bracket is the least frequent group with only 46 families (0.5%) belonging to this category.
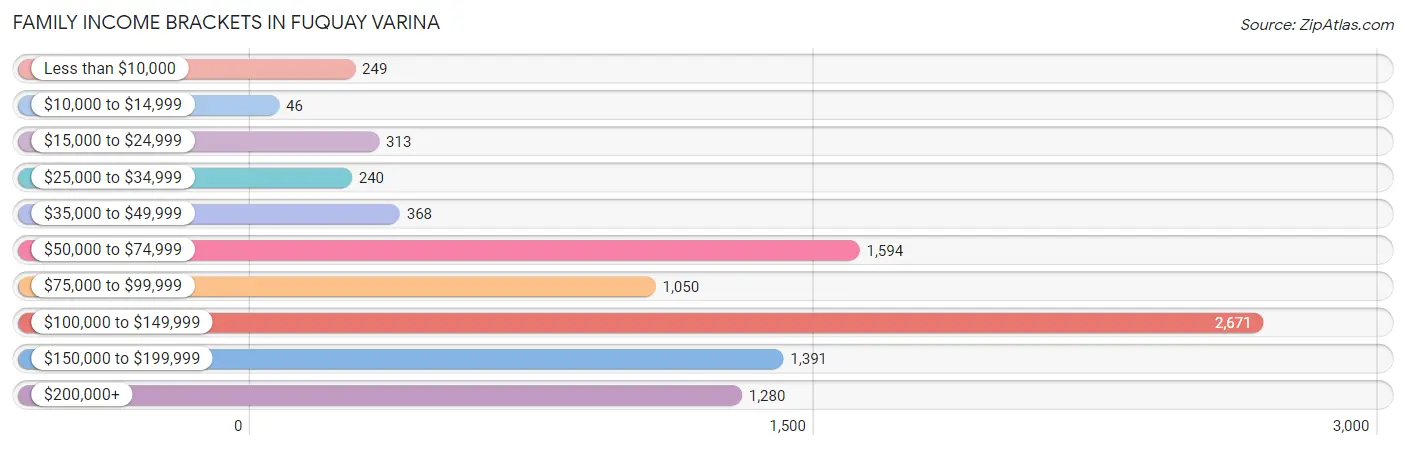
| Income Bracket | # Families | % Families |
| Less than $10,000 | 249 | 2.7% |
| $10,000 to $14,999 | 46 | 0.5% |
| $15,000 to $24,999 | 313 | 3.4% |
| $25,000 to $34,999 | 240 | 2.6% |
| $35,000 to $49,999 | 368 | 4.0% |
| $50,000 to $74,999 | 1,594 | 17.3% |
| $75,000 to $99,999 | 1,050 | 11.4% |
| $100,000 to $149,999 | 2,671 | 29.0% |
| $150,000 to $199,999 | 1,391 | 15.1% |
| $200,000+ | 1,280 | 13.9% |
Family Income by Famaliy Size in Fuquay Varina
5-person families (855 | 9.3%) account for the highest median family income in Fuquay Varina with $140,060 per family, while 2-person families (3,500 | 38.0%) have the highest median income of $43,606 per family member.
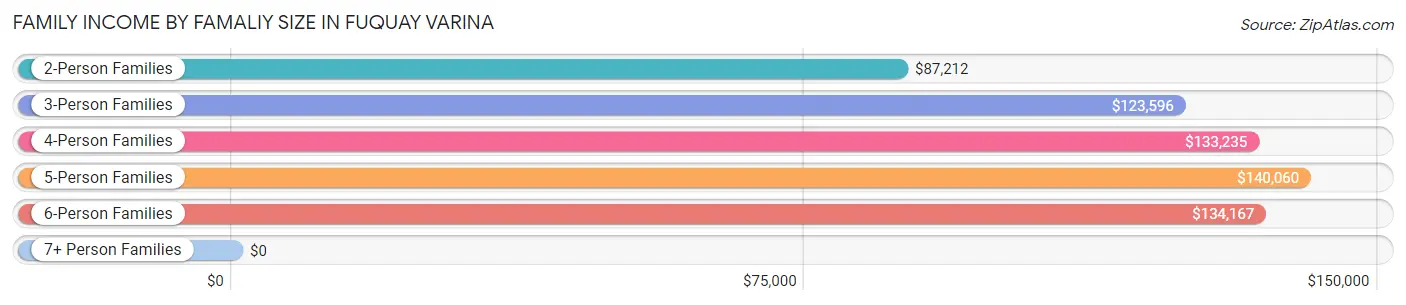
| Income Bracket | # Families | Median Income |
| 2-Person Families | 3,500 (38.0%) | $87,212 |
| 3-Person Families | 2,572 (27.9%) | $123,596 |
| 4-Person Families | 1,778 (19.3%) | $133,235 |
| 5-Person Families | 855 (9.3%) | $140,060 |
| 6-Person Families | 338 (3.7%) | $134,167 |
| 7+ Person Families | 169 (1.8%) | $0 |
| Total | 9,212 (100.0%) | $115,215 |
Family Income by Number of Earners in Fuquay Varina
The median family income in Fuquay Varina is $115,215, with families comprising 3+ earners (1,026) having the highest median family income of $139,090, while families with no earners (1,199) have the lowest median family income of $65,942, accounting for 11.1% and 13.0% of families, respectively.
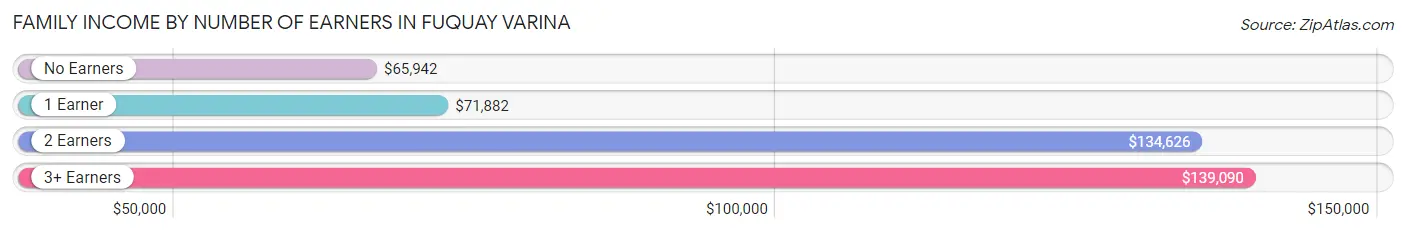
| Number of Earners | # Families | Median Income |
| No Earners | 1,199 (13.0%) | $65,942 |
| 1 Earner | 2,437 (26.5%) | $71,882 |
| 2 Earners | 4,550 (49.4%) | $134,626 |
| 3+ Earners | 1,026 (11.1%) | $139,090 |
| Total | 9,212 (100.0%) | $115,215 |
Household Income in Fuquay Varina
Household Income Brackets in Fuquay Varina
With 2,876 households falling in the category, the $100,000 to $149,999 income range is the most frequent in Fuquay Varina, accounting for 23.1% of all households. In contrast, only 112 households (0.9%) fall into the $10,000 to $14,999 income bracket, making it the least populous group.
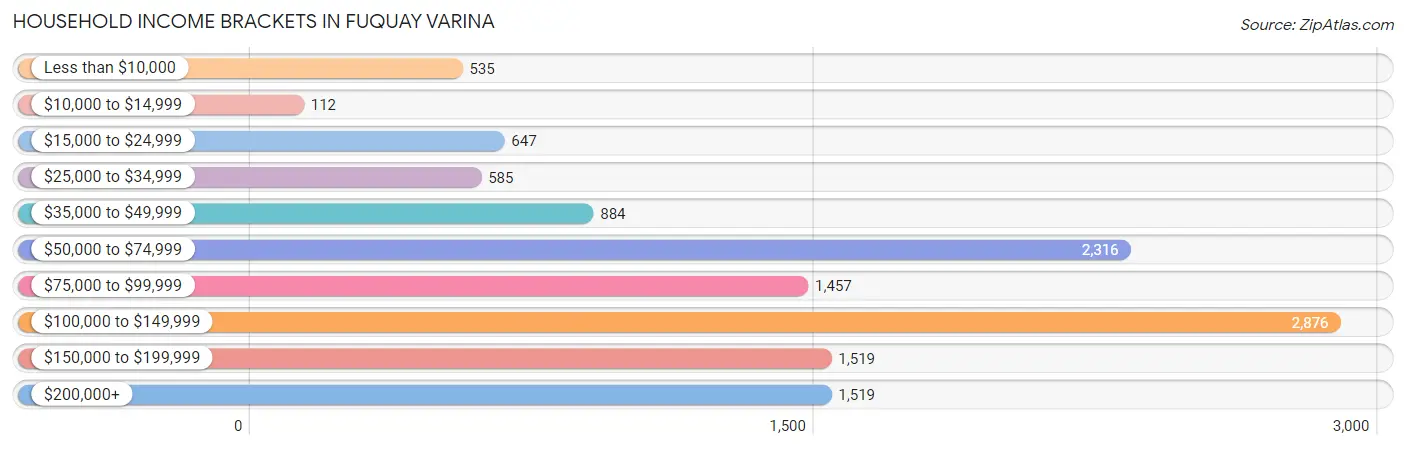
| Income Bracket | # Households | % Households |
| Less than $10,000 | 535 | 4.3% |
| $10,000 to $14,999 | 112 | 0.9% |
| $15,000 to $24,999 | 647 | 5.2% |
| $25,000 to $34,999 | 585 | 4.7% |
| $35,000 to $49,999 | 884 | 7.1% |
| $50,000 to $74,999 | 2,316 | 18.6% |
| $75,000 to $99,999 | 1,457 | 11.7% |
| $100,000 to $149,999 | 2,876 | 23.1% |
| $150,000 to $199,999 | 1,519 | 12.2% |
| $200,000+ | 1,519 | 12.2% |
Household Income by Householder Age in Fuquay Varina
The median household income in Fuquay Varina is $94,142, with the highest median household income of $112,559 found in the 25 to 44 years age bracket for the primary householder. A total of 5,283 households (42.4%) fall into this category. Meanwhile, the 15 to 24 years age bracket for the primary householder has the lowest median household income of $46,708, with 214 households (1.7%) in this group.
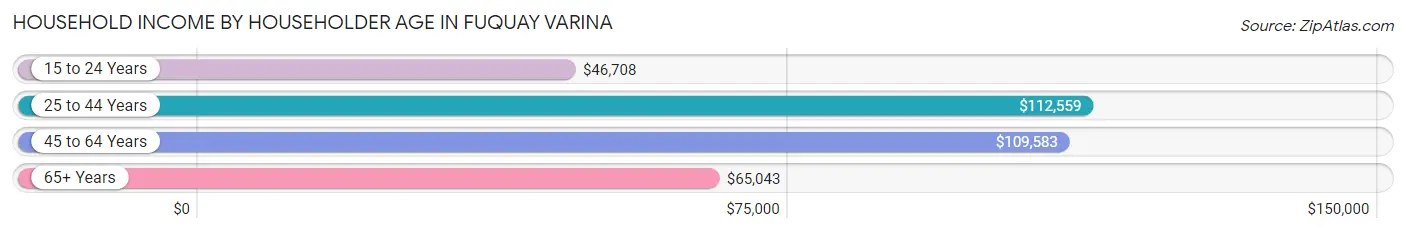
| Income Bracket | # Households | Median Income |
| 15 to 24 Years | 214 (1.7%) | $46,708 |
| 25 to 44 Years | 5,283 (42.4%) | $112,559 |
| 45 to 64 Years | 3,957 (31.8%) | $109,583 |
| 65+ Years | 2,995 (24.1%) | $65,043 |
| Total | 12,449 (100.0%) | $94,142 |
Poverty in Fuquay Varina
Income Below Poverty by Sex and Age in Fuquay Varina
With 8.3% poverty level for males and 12.7% for females among the residents of Fuquay Varina, 18 to 24 year old males and 18 to 24 year old females are the most vulnerable to poverty, with 242 males (17.9%) and 451 females (33.9%) in their respective age groups living below the poverty level.
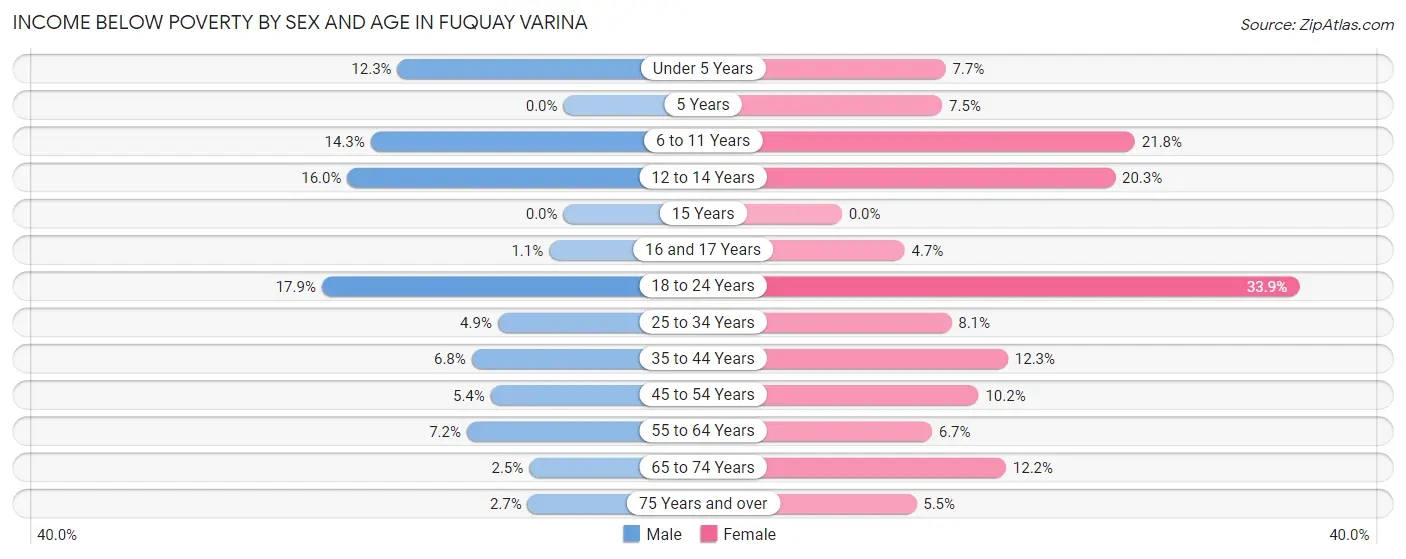
| Age Bracket | Male | Female |
| Under 5 Years | 148 (12.3%) | 96 (7.7%) |
| 5 Years | 0 (0.0%) | 26 (7.4%) |
| 6 to 11 Years | 271 (14.3%) | 430 (21.8%) |
| 12 to 14 Years | 163 (16.0%) | 152 (20.3%) |
| 15 Years | 0 (0.0%) | 0 (0.0%) |
| 16 and 17 Years | 5 (1.1%) | 15 (4.7%) |
| 18 to 24 Years | 242 (17.9%) | 451 (33.9%) |
| 25 to 34 Years | 123 (4.9%) | 187 (8.1%) |
| 35 to 44 Years | 181 (6.8%) | 374 (12.3%) |
| 45 to 54 Years | 123 (5.4%) | 256 (10.2%) |
| 55 to 64 Years | 87 (7.2%) | 100 (6.7%) |
| 65 to 74 Years | 33 (2.5%) | 188 (12.2%) |
| 75 Years and over | 15 (2.7%) | 63 (5.5%) |
| Total | 1,391 (8.3%) | 2,338 (12.7%) |
Income Above Poverty by Sex and Age in Fuquay Varina
According to the poverty statistics in Fuquay Varina, males aged 5 years and females aged 15 years are the age groups that are most secure financially, with 100.0% of males and 100.0% of females in these age groups living above the poverty line.
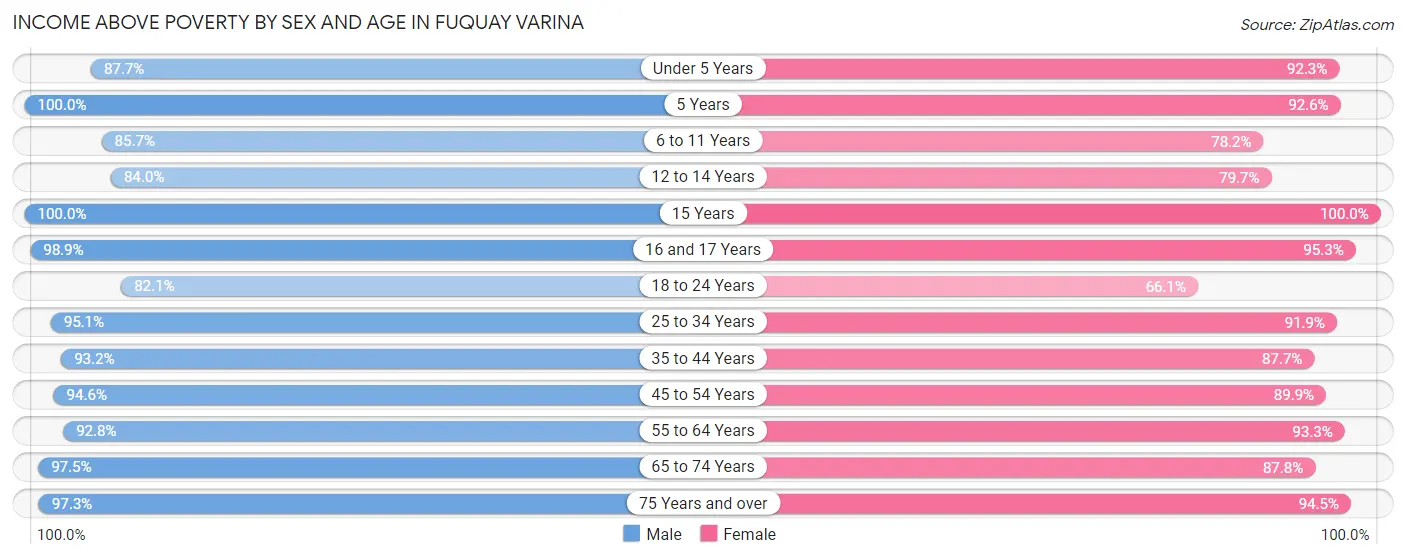
| Age Bracket | Male | Female |
| Under 5 Years | 1,053 (87.7%) | 1,150 (92.3%) |
| 5 Years | 198 (100.0%) | 323 (92.5%) |
| 6 to 11 Years | 1,623 (85.7%) | 1,546 (78.2%) |
| 12 to 14 Years | 853 (84.0%) | 597 (79.7%) |
| 15 Years | 161 (100.0%) | 352 (100.0%) |
| 16 and 17 Years | 467 (98.9%) | 307 (95.3%) |
| 18 to 24 Years | 1,107 (82.1%) | 878 (66.1%) |
| 25 to 34 Years | 2,405 (95.1%) | 2,113 (91.9%) |
| 35 to 44 Years | 2,475 (93.2%) | 2,660 (87.7%) |
| 45 to 54 Years | 2,156 (94.6%) | 2,265 (89.8%) |
| 55 to 64 Years | 1,127 (92.8%) | 1,398 (93.3%) |
| 65 to 74 Years | 1,265 (97.5%) | 1,355 (87.8%) |
| 75 Years and over | 548 (97.3%) | 1,076 (94.5%) |
| Total | 15,438 (91.7%) | 16,020 (87.3%) |
Income Below Poverty Among Married-Couple Families in Fuquay Varina
The poverty statistics for married-couple families in Fuquay Varina show that 3.8% or 294 of the total 7,683 families live below the poverty line. Families with 5 or more children have the highest poverty rate of 88.5%, comprising of 108 families. On the other hand, families with no children have the lowest poverty rate of 2.1%, which includes 72 families.
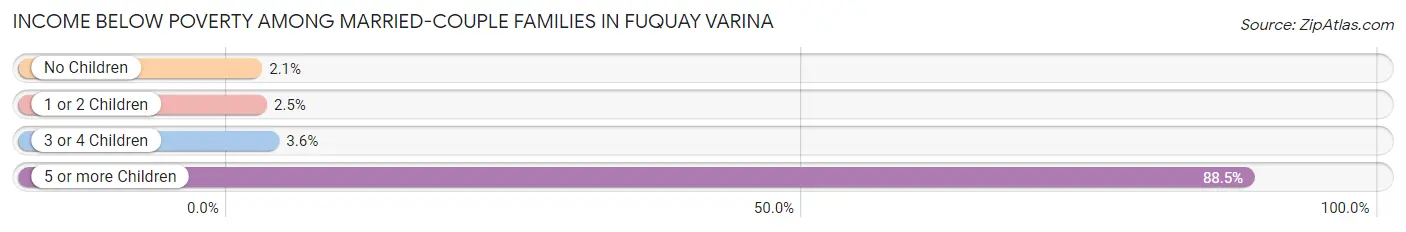
| Children | Above Poverty | Below Poverty |
| No Children | 3,342 (97.9%) | 72 (2.1%) |
| 1 or 2 Children | 3,230 (97.5%) | 84 (2.5%) |
| 3 or 4 Children | 803 (96.4%) | 30 (3.6%) |
| 5 or more Children | 14 (11.5%) | 108 (88.5%) |
| Total | 7,389 (96.2%) | 294 (3.8%) |
Income Below Poverty Among Single-Parent Households in Fuquay Varina
According to the poverty data in Fuquay Varina, 6.4% or 15 single-father households and 29.3% or 379 single-mother households are living below the poverty line. Among single-father households, those with 1 or 2 children have the highest poverty rate, with 15 households (24.2%) experiencing poverty. Likewise, among single-mother households, those with 3 or 4 children have the highest poverty rate, with 47 households (54.0%) falling below the poverty line.
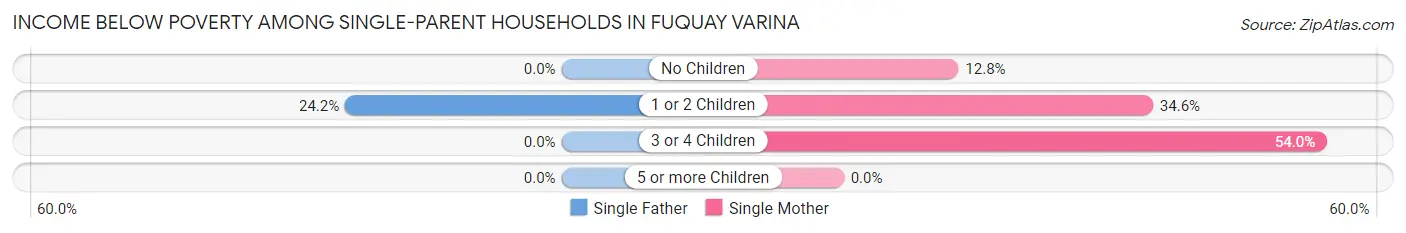
| Children | Single Father | Single Mother |
| No Children | 0 (0.0%) | 50 (12.8%) |
| 1 or 2 Children | 15 (24.2%) | 282 (34.6%) |
| 3 or 4 Children | 0 (0.0%) | 47 (54.0%) |
| 5 or more Children | 0 (0.0%) | 0 (0.0%) |
| Total | 15 (6.4%) | 379 (29.3%) |
Income Below Poverty Among Married-Couple vs Single-Parent Households in Fuquay Varina
The poverty data for Fuquay Varina shows that 294 of the married-couple family households (3.8%) and 394 of the single-parent households (25.8%) are living below the poverty level. Within the married-couple family households, those with 5 or more children have the highest poverty rate, with 108 households (88.5%) falling below the poverty line. Among the single-parent households, those with 3 or 4 children have the highest poverty rate, with 47 household (44.8%) living below poverty.
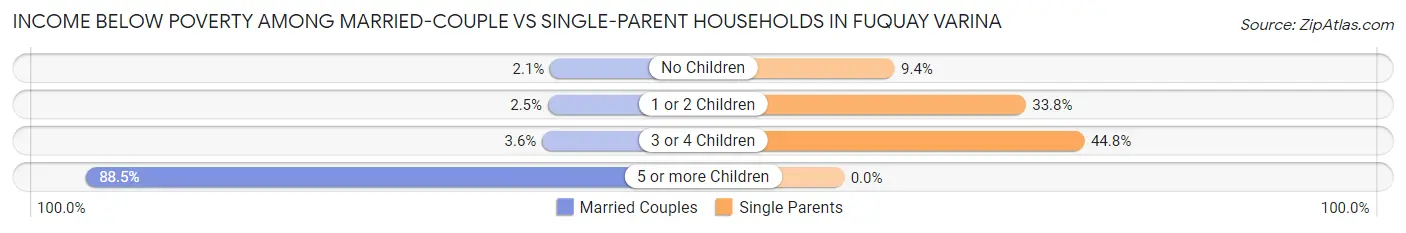
| Children | Married-Couple Families | Single-Parent Households |
| No Children | 72 (2.1%) | 50 (9.4%) |
| 1 or 2 Children | 84 (2.5%) | 297 (33.8%) |
| 3 or 4 Children | 30 (3.6%) | 47 (44.8%) |
| 5 or more Children | 108 (88.5%) | 0 (0.0%) |
| Total | 294 (3.8%) | 394 (25.8%) |
Race in Fuquay Varina
The most populous races in Fuquay Varina are White / Caucasian (25,296 | 71.4%), Black / African American (5,555 | 15.7%), and Hispanic or Latino (3,240 | 9.1%).
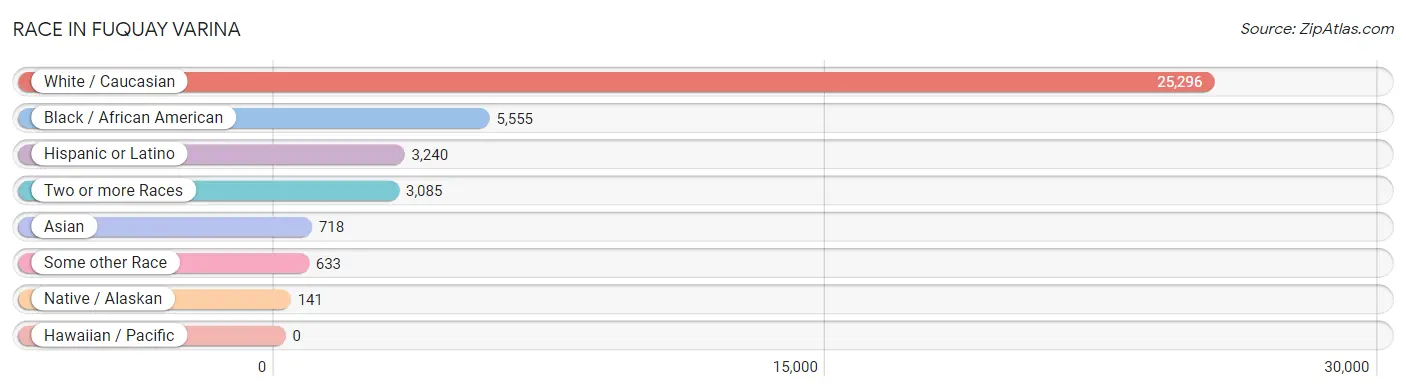
| Race | # Population | % Population |
| Asian | 718 | 2.0% |
| Black / African American | 5,555 | 15.7% |
| Hawaiian / Pacific | 0 | 0.0% |
| Hispanic or Latino | 3,240 | 9.1% |
| Native / Alaskan | 141 | 0.4% |
| White / Caucasian | 25,296 | 71.4% |
| Two or more Races | 3,085 | 8.7% |
| Some other Race | 633 | 1.8% |
| Total | 35,428 | 100.0% |
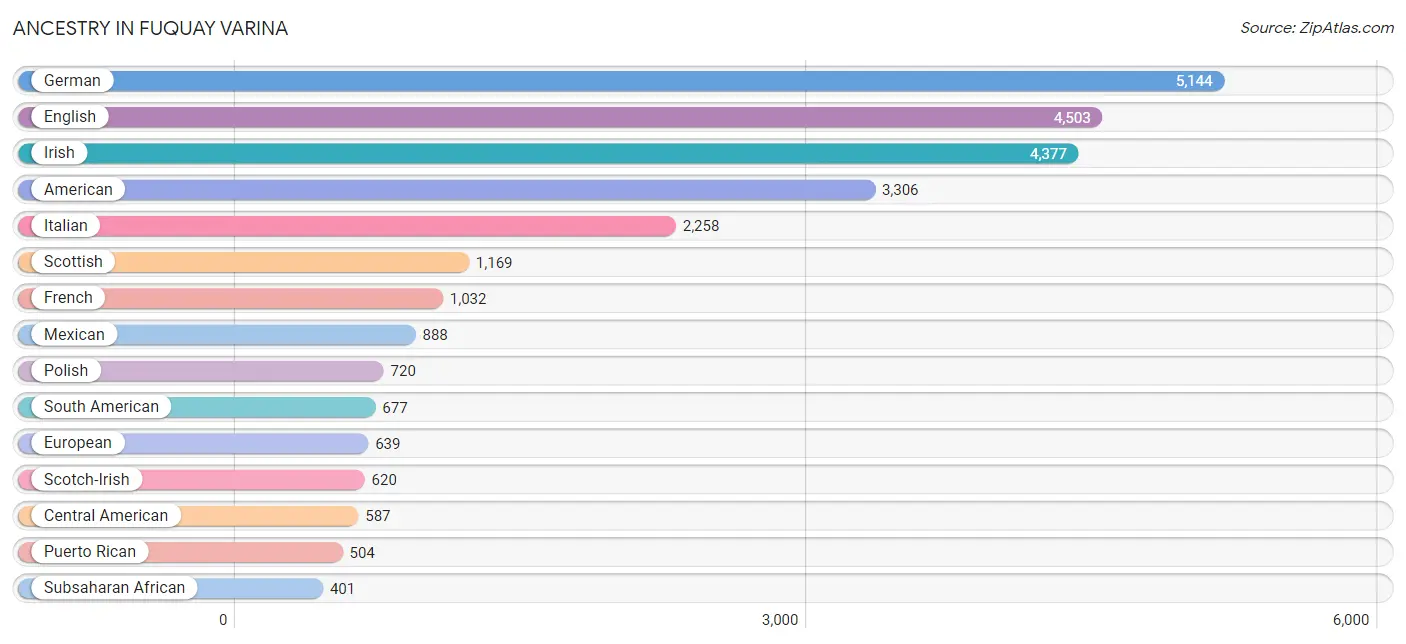
Ancestry in Fuquay Varina
The most populous ancestries reported in Fuquay Varina are German (5,144 | 14.5%), English (4,503 | 12.7%), Irish (4,377 | 12.3%), American (3,306 | 9.3%), and Italian (2,258 | 6.4%), together accounting for 55.3% of all Fuquay Varina residents.
| Ancestry | # Population | % Population |
| African | 231 | 0.6% |
| Albanian | 18 | 0.1% |
| American | 3,306 | 9.3% |
| Arab | 261 | 0.7% |
| Austrian | 33 | 0.1% |
| Bhutanese | 165 | 0.5% |
| Brazilian | 164 | 0.5% |
| British | 244 | 0.7% |
| Burmese | 203 | 0.6% |
| Canadian | 128 | 0.4% |
| Carpatho Rusyn | 6 | 0.0% |
| Central American | 587 | 1.7% |
| Central American Indian | 86 | 0.2% |
| Cherokee | 384 | 1.1% |
| Chilean | 176 | 0.5% |
| Colombian | 57 | 0.2% |
| Croatian | 58 | 0.2% |
| Cuban | 310 | 0.9% |
| Czech | 153 | 0.4% |
| Czechoslovakian | 26 | 0.1% |
| Danish | 13 | 0.0% |
| Dutch | 306 | 0.9% |
| Eastern European | 51 | 0.1% |
| Ecuadorian | 249 | 0.7% |
| Egyptian | 87 | 0.3% |
| English | 4,503 | 12.7% |
| European | 639 | 1.8% |
| Filipino | 17 | 0.1% |
| Finnish | 41 | 0.1% |
| French | 1,032 | 2.9% |
| French Canadian | 150 | 0.4% |
| German | 5,144 | 14.5% |
| Ghanaian | 29 | 0.1% |
| Greek | 71 | 0.2% |
| Guatemalan | 163 | 0.5% |
| Guyanese | 24 | 0.1% |
| Haitian | 17 | 0.1% |
| Honduran | 193 | 0.5% |
| Hungarian | 262 | 0.7% |
| Icelander | 16 | 0.1% |
| Indian (Asian) | 96 | 0.3% |
| Iranian | 5 | 0.0% |
| Irish | 4,377 | 12.3% |
| Iroquois | 36 | 0.1% |
| Italian | 2,258 | 6.4% |
| Jamaican | 147 | 0.4% |
| Kenyan | 38 | 0.1% |
| Korean | 262 | 0.7% |
| Lebanese | 62 | 0.2% |
| Lithuanian | 47 | 0.1% |
| Luxembourger | 30 | 0.1% |
| Macedonian | 6 | 0.0% |
| Mexican | 888 | 2.5% |
| Mongolian | 9 | 0.0% |
| Moroccan | 100 | 0.3% |
| Norwegian | 157 | 0.4% |
| Panamanian | 104 | 0.3% |
| Paraguayan | 73 | 0.2% |
| Peruvian | 91 | 0.3% |
| Polish | 720 | 2.0% |
| Portuguese | 136 | 0.4% |
| Puerto Rican | 504 | 1.4% |
| Russian | 204 | 0.6% |
| Salvadoran | 127 | 0.4% |
| Samoan | 20 | 0.1% |
| Scandinavian | 158 | 0.4% |
| Scotch-Irish | 620 | 1.8% |
| Scottish | 1,169 | 3.3% |
| Slavic | 37 | 0.1% |
| Slovak | 67 | 0.2% |
| South American | 677 | 1.9% |
| South American Indian | 73 | 0.2% |
| Spaniard | 36 | 0.1% |
| Spanish | 238 | 0.7% |
| Sri Lankan | 80 | 0.2% |
| Subsaharan African | 401 | 1.1% |
| Swedish | 306 | 0.9% |
| Swiss | 61 | 0.2% |
| Thai | 165 | 0.5% |
| Turkish | 11 | 0.0% |
| Ukrainian | 322 | 0.9% |
| Venezuelan | 11 | 0.0% |
| Welsh | 282 | 0.8% | View All 83 Rows |
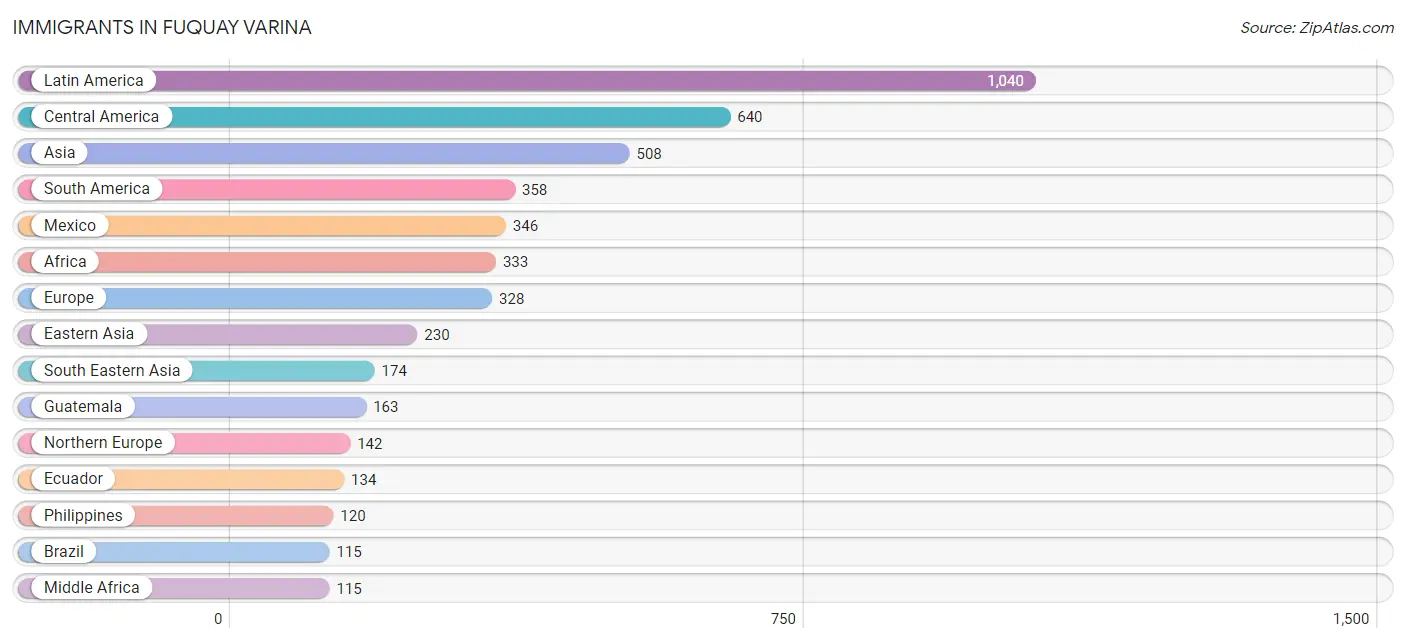
Immigrants in Fuquay Varina
The most numerous immigrant groups reported in Fuquay Varina came from Latin America (1,040 | 2.9%), Central America (640 | 1.8%), Asia (508 | 1.4%), South America (358 | 1.0%), and Mexico (346 | 1.0%), together accounting for 8.2% of all Fuquay Varina residents.
| Immigration Origin | # Population | % Population |
| Africa | 333 | 0.9% |
| Albania | 9 | 0.0% |
| Asia | 508 | 1.4% |
| Belize | 17 | 0.1% |
| Brazil | 115 | 0.3% |
| Canada | 61 | 0.2% |
| Caribbean | 42 | 0.1% |
| Central America | 640 | 1.8% |
| China | 95 | 0.3% |
| Colombia | 14 | 0.0% |
| Congo | 50 | 0.1% |
| Costa Rica | 37 | 0.1% |
| Cuba | 20 | 0.1% |
| Eastern Africa | 57 | 0.2% |
| Eastern Asia | 230 | 0.6% |
| Eastern Europe | 15 | 0.0% |
| Ecuador | 134 | 0.4% |
| Egypt | 30 | 0.1% |
| El Salvador | 30 | 0.1% |
| England | 50 | 0.1% |
| Europe | 328 | 0.9% |
| Germany | 67 | 0.2% |
| Ghana | 29 | 0.1% |
| Guatemala | 163 | 0.5% |
| Honduras | 23 | 0.1% |
| India | 82 | 0.2% |
| Iran | 5 | 0.0% |
| Italy | 53 | 0.2% |
| Jamaica | 22 | 0.1% |
| Japan | 79 | 0.2% |
| Kenya | 57 | 0.2% |
| Korea | 56 | 0.2% |
| Latin America | 1,040 | 2.9% |
| Malaysia | 9 | 0.0% |
| Mexico | 346 | 1.0% |
| Middle Africa | 115 | 0.3% |
| Morocco | 53 | 0.2% |
| Nepal | 17 | 0.1% |
| North Macedonia | 6 | 0.0% |
| Northern Africa | 83 | 0.2% |
| Northern Europe | 142 | 0.4% |
| Panama | 24 | 0.1% |
| Peru | 58 | 0.2% |
| Philippines | 120 | 0.3% |
| South Africa | 49 | 0.1% |
| South America | 358 | 1.0% |
| South Central Asia | 104 | 0.3% |
| South Eastern Asia | 174 | 0.5% |
| Southern Europe | 76 | 0.2% |
| Spain | 23 | 0.1% |
| Sweden | 15 | 0.0% |
| Switzerland | 28 | 0.1% |
| Taiwan | 17 | 0.1% |
| Vietnam | 45 | 0.1% |
| Western Africa | 29 | 0.1% |
| Western Europe | 95 | 0.3% |
| Zaire | 65 | 0.2% | View All 57 Rows |
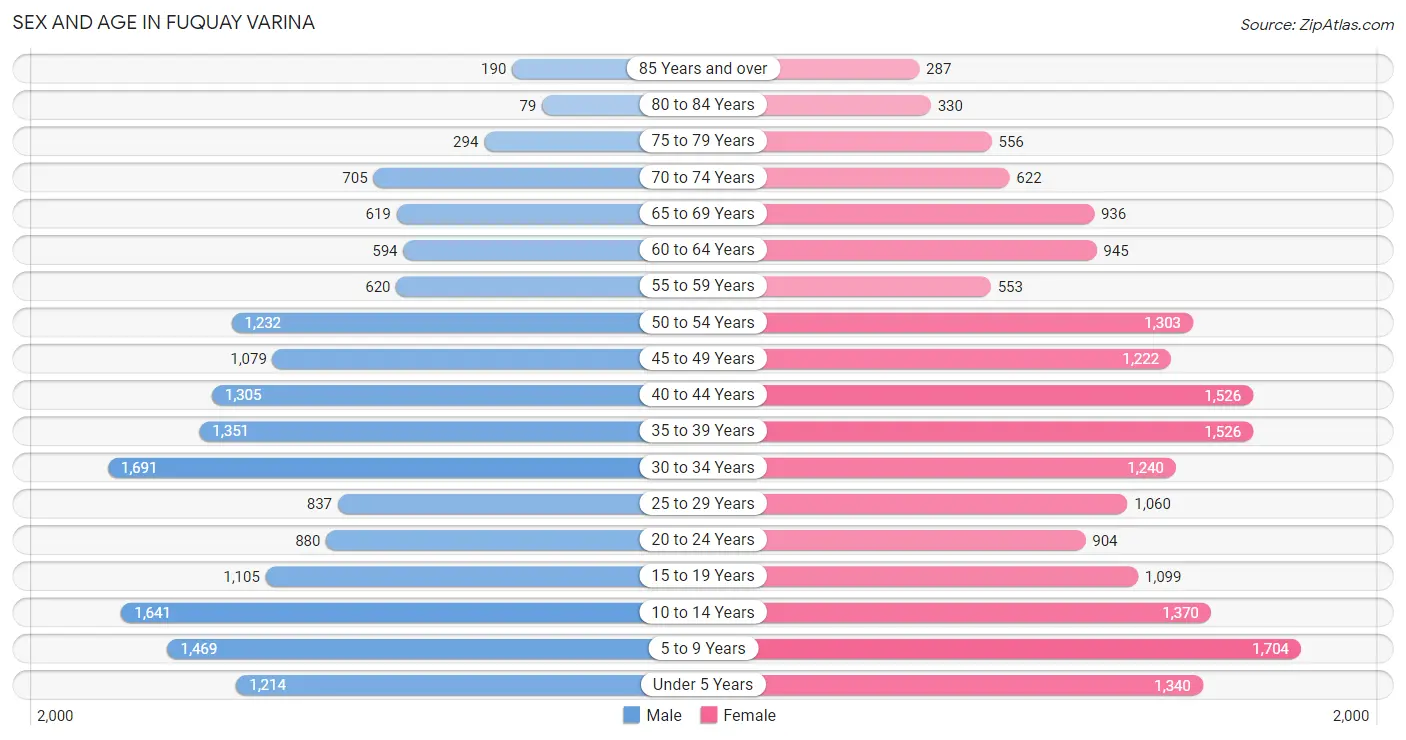
Sex and Age in Fuquay Varina
Sex and Age in Fuquay Varina
The most populous age groups in Fuquay Varina are 30 to 34 Years (1,691 | 10.0%) for men and 5 to 9 Years (1,704 | 9.2%) for women.
| Age Bracket | Male | Female |
| Under 5 Years | 1,214 (7.2%) | 1,340 (7.2%) |
| 5 to 9 Years | 1,469 (8.7%) | 1,704 (9.2%) |
| 10 to 14 Years | 1,641 (9.7%) | 1,370 (7.4%) |
| 15 to 19 Years | 1,105 (6.5%) | 1,099 (5.9%) |
| 20 to 24 Years | 880 (5.2%) | 904 (4.9%) |
| 25 to 29 Years | 837 (5.0%) | 1,060 (5.7%) |
| 30 to 34 Years | 1,691 (10.0%) | 1,240 (6.7%) |
| 35 to 39 Years | 1,351 (8.0%) | 1,526 (8.2%) |
| 40 to 44 Years | 1,305 (7.7%) | 1,526 (8.2%) |
| 45 to 49 Years | 1,079 (6.4%) | 1,222 (6.6%) |
| 50 to 54 Years | 1,232 (7.3%) | 1,303 (7.0%) |
| 55 to 59 Years | 620 (3.7%) | 553 (3.0%) |
| 60 to 64 Years | 594 (3.5%) | 945 (5.1%) |
| 65 to 69 Years | 619 (3.7%) | 936 (5.1%) |
| 70 to 74 Years | 705 (4.2%) | 622 (3.4%) |
| 75 to 79 Years | 294 (1.7%) | 556 (3.0%) |
| 80 to 84 Years | 79 (0.5%) | 330 (1.8%) |
| 85 Years and over | 190 (1.1%) | 287 (1.5%) |
| Total | 16,905 (100.0%) | 18,523 (100.0%) |
Families and Households in Fuquay Varina
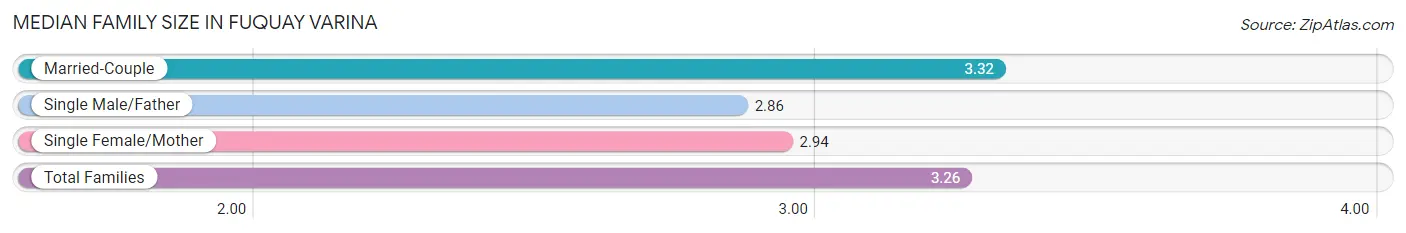
Median Family Size in Fuquay Varina
The median family size in Fuquay Varina is 3.26 persons per family, with married-couple families (7,683 | 83.4%) accounting for the largest median family size of 3.32 persons per family. On the other hand, single male/father families (236 | 2.6%) represent the smallest median family size with 2.86 persons per family.
| Family Type | # Families | Family Size |
| Married-Couple | 7,683 (83.4%) | 3.32 |
| Single Male/Father | 236 (2.6%) | 2.86 |
| Single Female/Mother | 1,293 (14.0%) | 2.94 |
| Total Families | 9,212 (100.0%) | 3.26 |
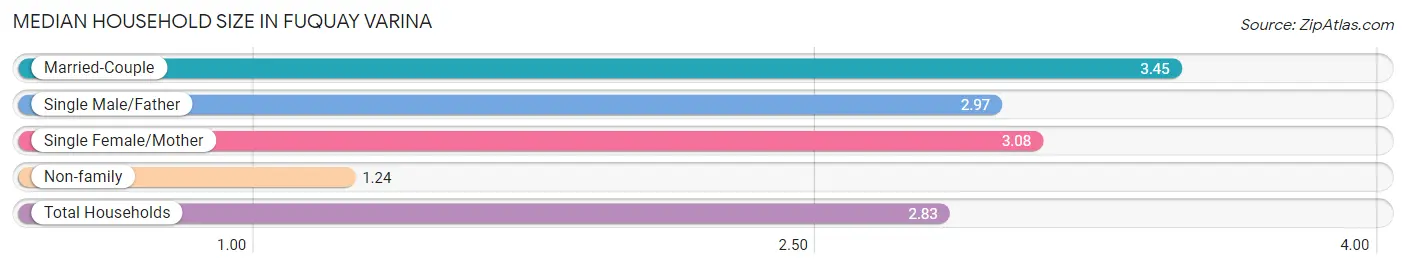
Median Household Size in Fuquay Varina
The median household size in Fuquay Varina is 2.83 persons per household, with married-couple households (7,683 | 61.7%) accounting for the largest median household size of 3.45 persons per household. non-family households (3,237 | 26.0%) represent the smallest median household size with 1.24 persons per household.
| Household Type | # Households | Household Size |
| Married-Couple | 7,683 (61.7%) | 3.45 |
| Single Male/Father | 236 (1.9%) | 2.97 |
| Single Female/Mother | 1,293 (10.4%) | 3.08 |
| Non-family | 3,237 (26.0%) | 1.24 |
| Total Households | 12,449 (100.0%) | 2.83 |
Household Size by Marriage Status in Fuquay Varina
Out of a total of 12,449 households in Fuquay Varina, 9,212 (74.0%) are family households, while 3,237 (26.0%) are nonfamily households. The most numerous type of family households are 2-person households, comprising 3,479, and the most common type of nonfamily households are 1-person households, comprising 2,556.
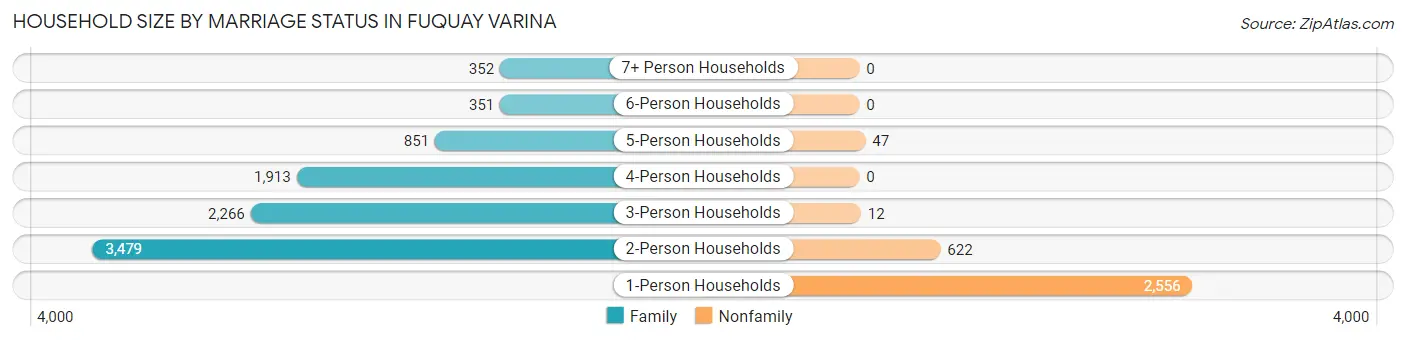
| Household Size | Family Households | Nonfamily Households |
| 1-Person Households | - | 2,556 (20.5%) |
| 2-Person Households | 3,479 (28.0%) | 622 (5.0%) |
| 3-Person Households | 2,266 (18.2%) | 12 (0.1%) |
| 4-Person Households | 1,913 (15.4%) | 0 (0.0%) |
| 5-Person Households | 851 (6.8%) | 47 (0.4%) |
| 6-Person Households | 351 (2.8%) | 0 (0.0%) |
| 7+ Person Households | 352 (2.8%) | 0 (0.0%) |
| Total | 9,212 (74.0%) | 3,237 (26.0%) |
Female Fertility in Fuquay Varina
Fertility by Age in Fuquay Varina
Average fertility rate in Fuquay Varina is 55.0 births per 1,000 women. Women in the age bracket of 20 to 34 years have the highest fertility rate with 110.0 births per 1,000 women. Women in the age bracket of 20 to 34 years acount for 70.5% of all women with births.
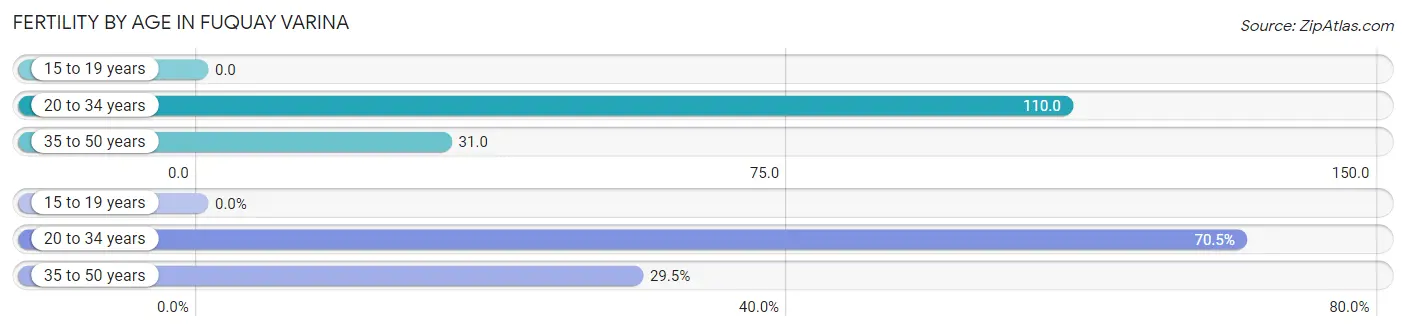
| Age Bracket | Women with Births | Births / 1,000 Women |
| 15 to 19 years | 0 (0.0%) | 0.0 |
| 20 to 34 years | 351 (70.5%) | 110.0 |
| 35 to 50 years | 147 (29.5%) | 31.0 |
| Total | 498 (100.0%) | 55.0 |
Fertility by Age by Marriage Status in Fuquay Varina
67.1% of women with births (498) in Fuquay Varina are married. The highest percentage of unmarried women with births falls into 20 to 34 years age bracket with 43.3% of them unmarried at the time of birth, while the lowest percentage of unmarried women with births belong to 35 to 50 years age bracket with 8.2% of them unmarried.
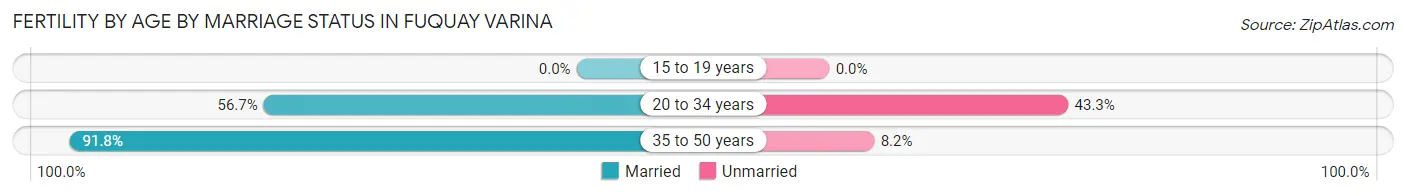
| Age Bracket | Married | Unmarried |
| 15 to 19 years | 0 (0.0%) | 0 (0.0%) |
| 20 to 34 years | 199 (56.7%) | 152 (43.3%) |
| 35 to 50 years | 135 (91.8%) | 12 (8.2%) |
| Total | 334 (67.1%) | 164 (32.9%) |
Fertility by Education in Fuquay Varina
Average fertility rate in Fuquay Varina is 55.0 births per 1,000 women. Women with the education attainment of high school diploma have the highest fertility rate of 116.0 births per 1,000 women, while women with the education attainment of less than high school have the lowest fertility at 8.0 births per 1,000 women. Women with the education attainment of bachelor's degree represent 35.7% of all women with births.
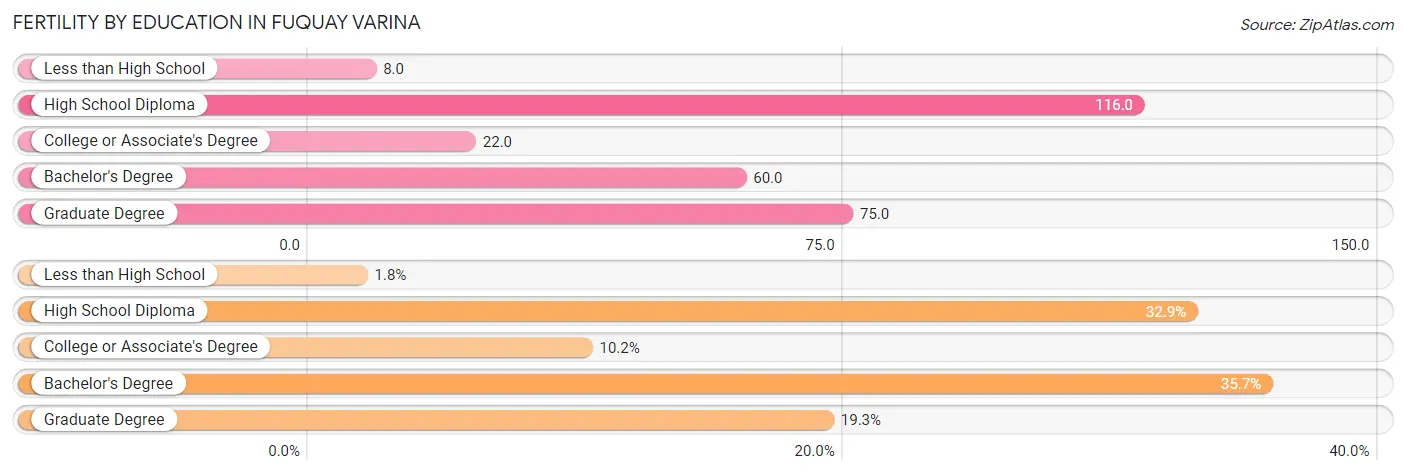
| Educational Attainment | Women with Births | Births / 1,000 Women |
| Less than High School | 9 (1.8%) | 8.0 |
| High School Diploma | 164 (32.9%) | 116.0 |
| College or Associate's Degree | 51 (10.2%) | 22.0 |
| Bachelor's Degree | 178 (35.7%) | 60.0 |
| Graduate Degree | 96 (19.3%) | 75.0 |
| Total | 498 (100.0%) | 55.0 |
Fertility by Education by Marriage Status in Fuquay Varina
32.9% of women with births in Fuquay Varina are unmarried. Women with the educational attainment of less than high school are most likely to be married with 100.0% of them married at childbirth, while women with the educational attainment of high school diploma are least likely to be married with 100.0% of them unmarried at childbirth.
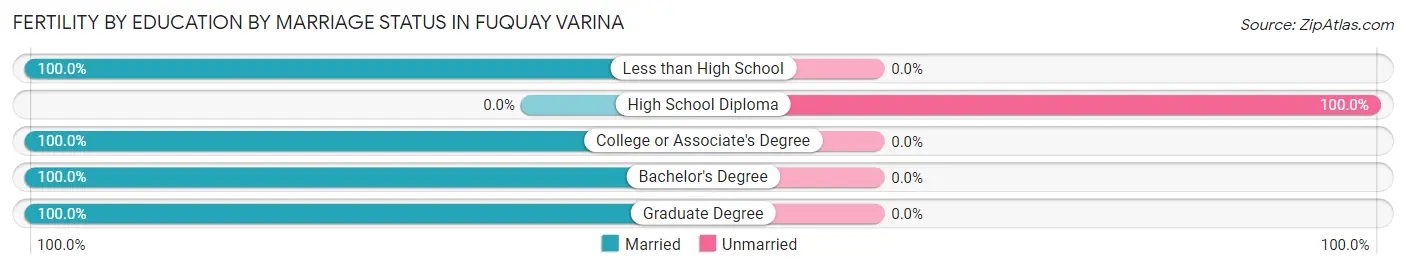
| Educational Attainment | Married | Unmarried |
| Less than High School | 9 (100.0%) | 0 (0.0%) |
| High School Diploma | 0 (0.0%) | 164 (100.0%) |
| College or Associate's Degree | 51 (100.0%) | 0 (0.0%) |
| Bachelor's Degree | 178 (100.0%) | 0 (0.0%) |
| Graduate Degree | 96 (100.0%) | 0 (0.0%) |
| Total | 334 (67.1%) | 164 (32.9%) |
Employment Characteristics in Fuquay Varina
Employment by Class of Employer in Fuquay Varina
Among the 17,053 employed individuals in Fuquay Varina, private company employees (12,368 | 72.5%), local government employees (1,332 | 7.8%), and not-for-profit organizations (1,095 | 6.4%) make up the most common classes of employment.
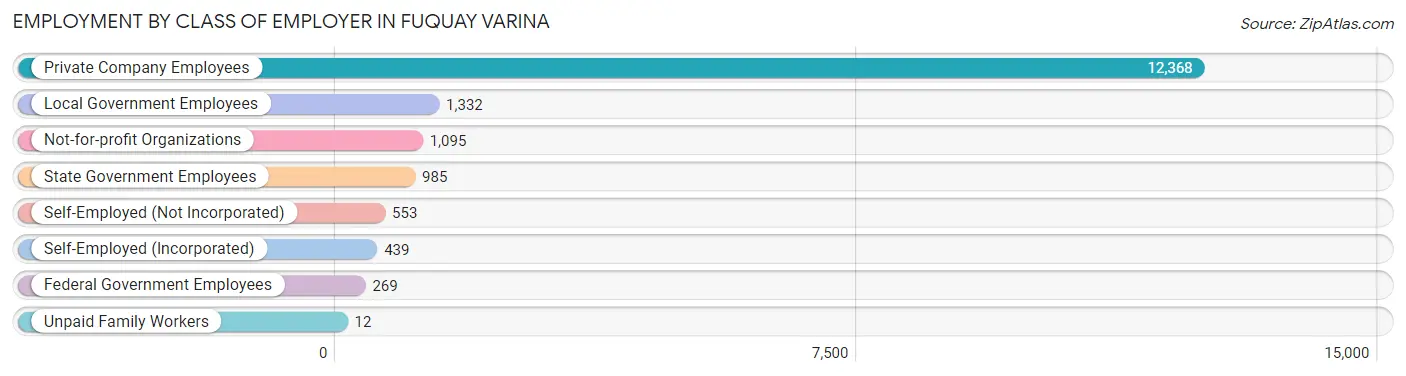
| Employer Class | # Employees | % Employees |
| Private Company Employees | 12,368 | 72.5% |
| Self-Employed (Incorporated) | 439 | 2.6% |
| Self-Employed (Not Incorporated) | 553 | 3.2% |
| Not-for-profit Organizations | 1,095 | 6.4% |
| Local Government Employees | 1,332 | 7.8% |
| State Government Employees | 985 | 5.8% |
| Federal Government Employees | 269 | 1.6% |
| Unpaid Family Workers | 12 | 0.1% |
| Total | 17,053 | 100.0% |
Employment Status by Age in Fuquay Varina
According to the labor force statistics for Fuquay Varina, out of the total population over 16 years of age (26,177), 68.1% or 17,827 individuals are in the labor force, with 3.4% or 606 of them unemployed. The age group with the highest labor force participation rate is 25 to 29 years, with 91.4% or 1,734 individuals in the labor force. Within the labor force, the 75 years and over age range has the highest percentage of unemployed individuals, with 22.6% or 7 of them being unemployed.
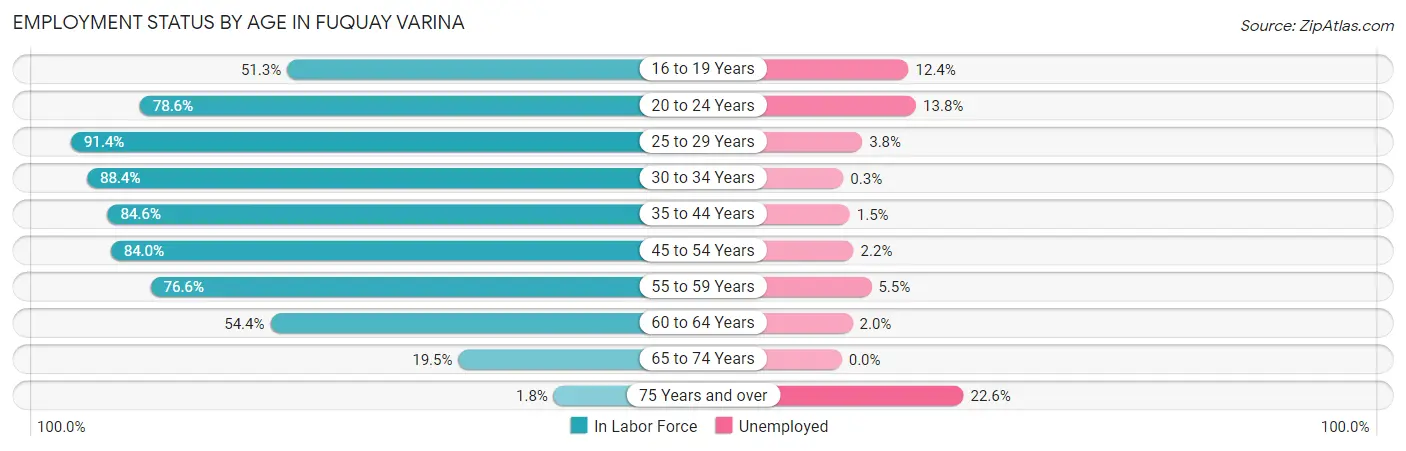
| Age Bracket | In Labor Force | Unemployed |
| 16 to 19 Years | 867 (51.3%) | 108 (12.4%) |
| 20 to 24 Years | 1,402 (78.6%) | 193 (13.8%) |
| 25 to 29 Years | 1,734 (91.4%) | 66 (3.8%) |
| 30 to 34 Years | 2,591 (88.4%) | 8 (0.3%) |
| 35 to 44 Years | 4,829 (84.6%) | 72 (1.5%) |
| 45 to 54 Years | 4,062 (84.0%) | 89 (2.2%) |
| 55 to 59 Years | 899 (76.6%) | 49 (5.5%) |
| 60 to 64 Years | 837 (54.4%) | 17 (2.0%) |
| 65 to 74 Years | 562 (19.5%) | 0 (0.0%) |
| 75 Years and over | 31 (1.8%) | 7 (22.6%) |
| Total | 17,827 (68.1%) | 606 (3.4%) |
Employment Status by Educational Attainment in Fuquay Varina
According to labor force statistics for Fuquay Varina, 82.7% of individuals (14,955) out of the total population between 25 and 64 years of age (18,084) are in the labor force, with 2.0% or 299 of them being unemployed. The group with the highest labor force participation rate are those with the educational attainment of bachelor's degree or higher, with 86.2% or 8,266 individuals in the labor force. Within the labor force, individuals with high school diploma education have the highest percentage of unemployment, with 4.2% or 77 of them being unemployed.
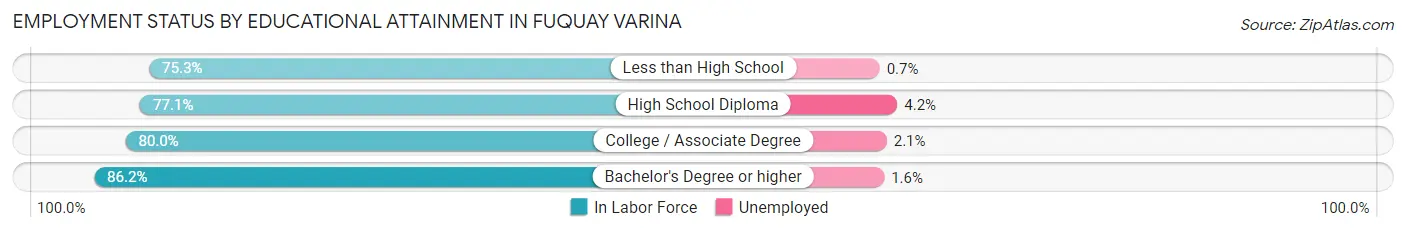
| Educational Attainment | In Labor Force | Unemployed |
| Less than High School | 608 (75.3%) | 6 (0.7%) |
| High School Diploma | 1,844 (77.1%) | 100 (4.2%) |
| College / Associate Degree | 4,237 (80.0%) | 111 (2.1%) |
| Bachelor's Degree or higher | 8,266 (86.2%) | 153 (1.6%) |
| Total | 14,955 (82.7%) | 362 (2.0%) |
Employment Occupations by Sex in Fuquay Varina
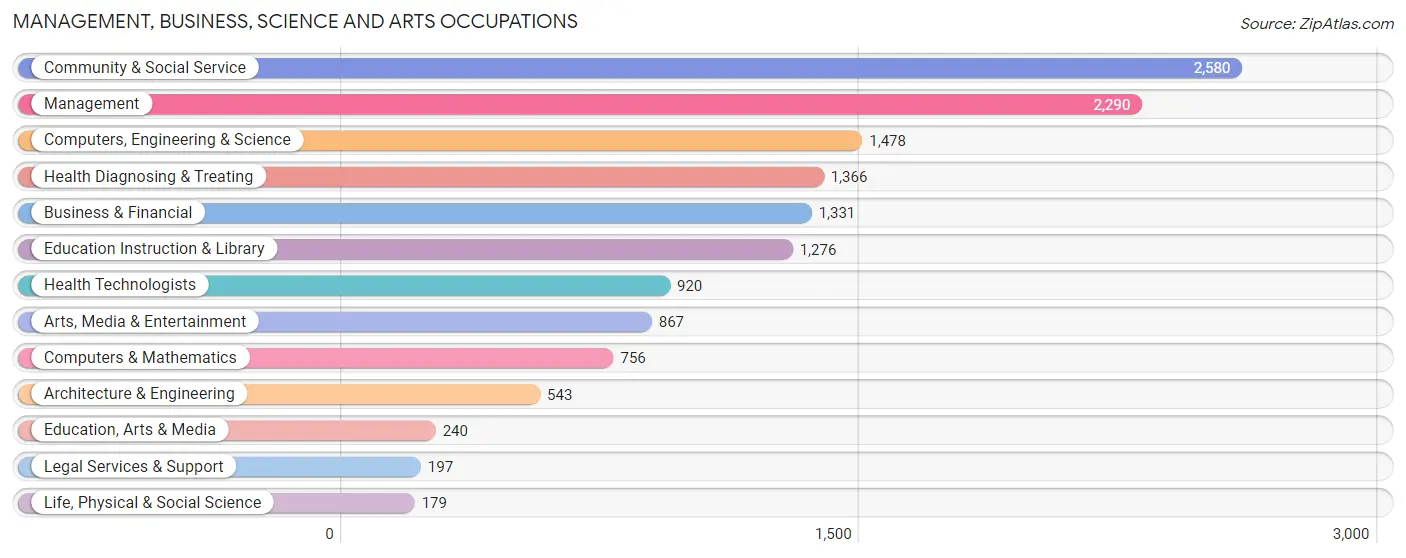
Management, Business, Science and Arts Occupations
The most common Management, Business, Science and Arts occupations in Fuquay Varina are Community & Social Service (2,580 | 15.0%), Management (2,290 | 13.4%), Computers, Engineering & Science (1,478 | 8.6%), Health Diagnosing & Treating (1,366 | 8.0%), and Business & Financial (1,331 | 7.8%).
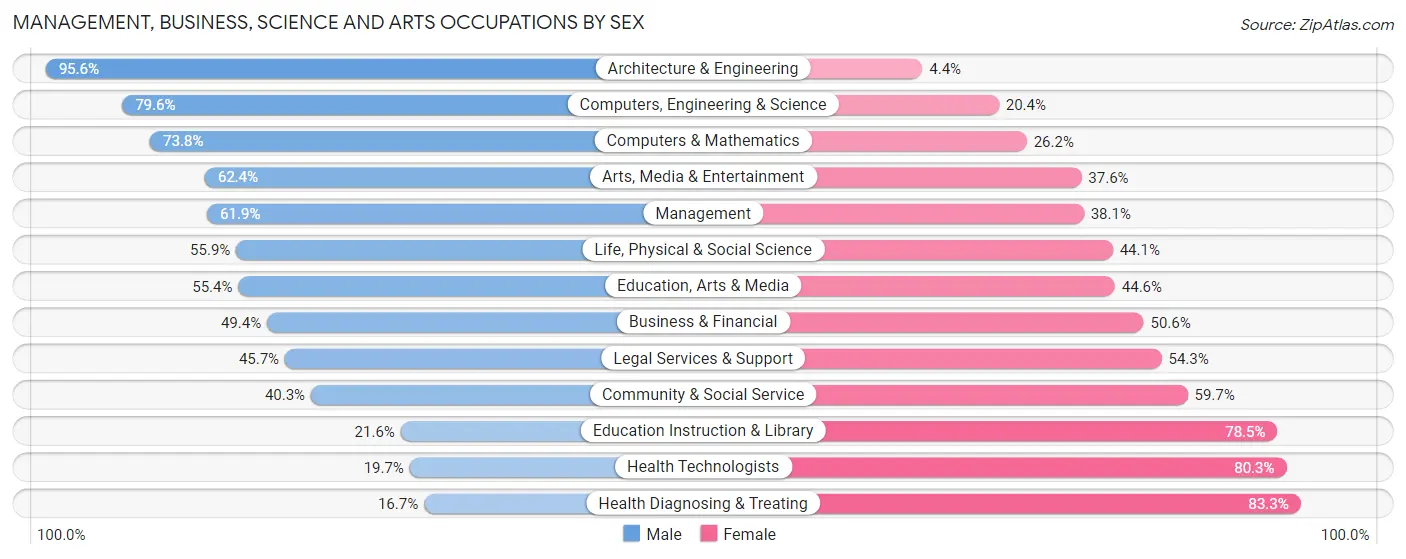
Management, Business, Science and Arts Occupations by Sex
Within the Management, Business, Science and Arts occupations in Fuquay Varina, the most male-oriented occupations are Architecture & Engineering (95.6%), Computers, Engineering & Science (79.6%), and Computers & Mathematics (73.8%), while the most female-oriented occupations are Health Diagnosing & Treating (83.3%), Health Technologists (80.3%), and Education Instruction & Library (78.4%).
| Occupation | Male | Female |
| Management | 1,418 (61.9%) | 872 (38.1%) |
| Business & Financial | 658 (49.4%) | 673 (50.6%) |
| Computers, Engineering & Science | 1,177 (79.6%) | 301 (20.4%) |
| Computers & Mathematics | 558 (73.8%) | 198 (26.2%) |
| Architecture & Engineering | 519 (95.6%) | 24 (4.4%) |
| Life, Physical & Social Science | 100 (55.9%) | 79 (44.1%) |
| Community & Social Service | 1,039 (40.3%) | 1,541 (59.7%) |
| Education, Arts & Media | 133 (55.4%) | 107 (44.6%) |
| Legal Services & Support | 90 (45.7%) | 107 (54.3%) |
| Education Instruction & Library | 275 (21.5%) | 1,001 (78.4%) |
| Arts, Media & Entertainment | 541 (62.4%) | 326 (37.6%) |
| Health Diagnosing & Treating | 228 (16.7%) | 1,138 (83.3%) |
| Health Technologists | 181 (19.7%) | 739 (80.3%) |
| Total (Category) | 4,520 (50.0%) | 4,525 (50.0%) |
| Total (Overall) | 9,113 (53.2%) | 8,025 (46.8%) |
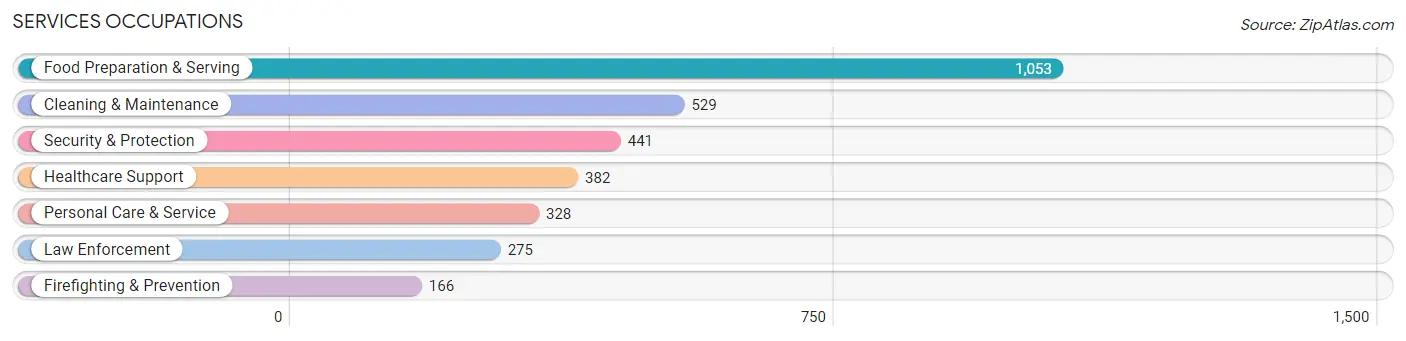
Services Occupations
The most common Services occupations in Fuquay Varina are Food Preparation & Serving (1,053 | 6.1%), Cleaning & Maintenance (529 | 3.1%), Security & Protection (441 | 2.6%), Healthcare Support (382 | 2.2%), and Personal Care & Service (328 | 1.9%).
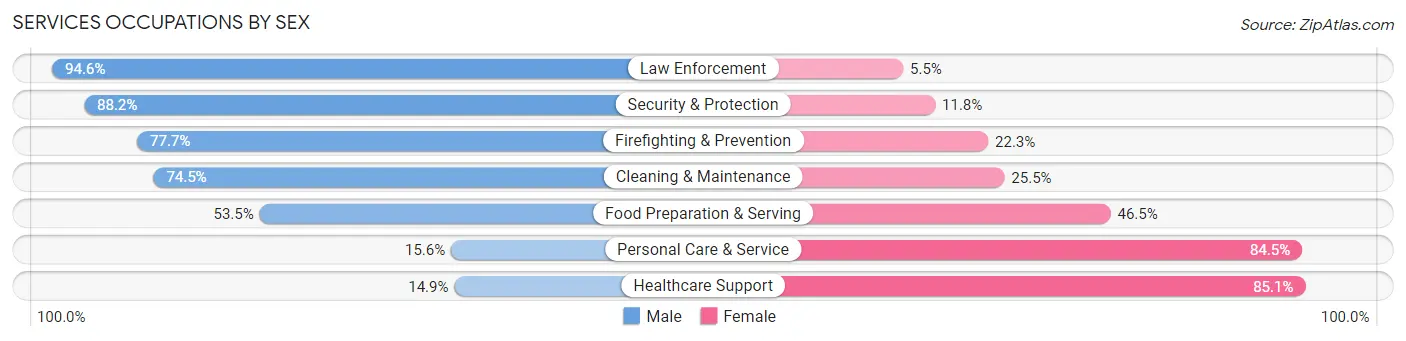
Services Occupations by Sex
Within the Services occupations in Fuquay Varina, the most male-oriented occupations are Law Enforcement (94.6%), Security & Protection (88.2%), and Firefighting & Prevention (77.7%), while the most female-oriented occupations are Healthcare Support (85.1%), Personal Care & Service (84.5%), and Food Preparation & Serving (46.5%).
| Occupation | Male | Female |
| Healthcare Support | 57 (14.9%) | 325 (85.1%) |
| Security & Protection | 389 (88.2%) | 52 (11.8%) |
| Firefighting & Prevention | 129 (77.7%) | 37 (22.3%) |
| Law Enforcement | 260 (94.6%) | 15 (5.4%) |
| Food Preparation & Serving | 563 (53.5%) | 490 (46.5%) |
| Cleaning & Maintenance | 394 (74.5%) | 135 (25.5%) |
| Personal Care & Service | 51 (15.5%) | 277 (84.5%) |
| Total (Category) | 1,454 (53.2%) | 1,279 (46.8%) |
| Total (Overall) | 9,113 (53.2%) | 8,025 (46.8%) |
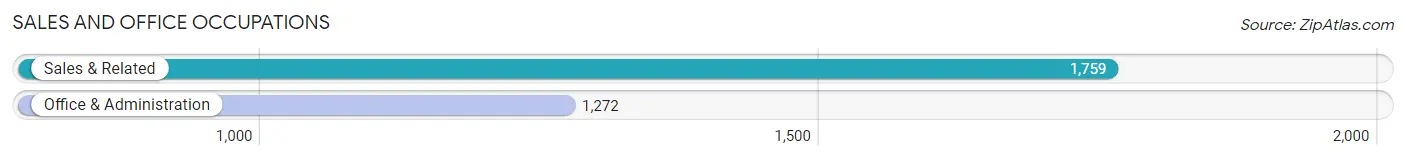
Sales and Office Occupations
The most common Sales and Office occupations in Fuquay Varina are Sales & Related (1,759 | 10.3%), and Office & Administration (1,272 | 7.4%).
Sales and Office Occupations by Sex
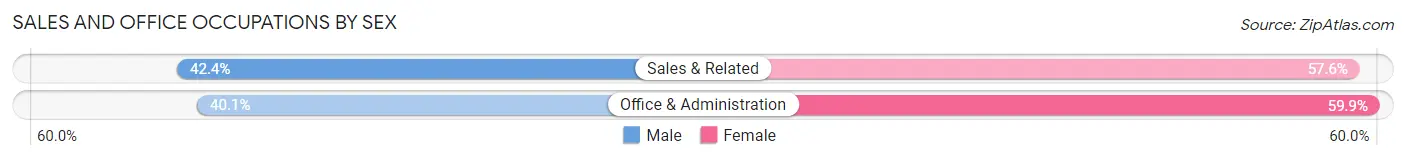
| Occupation | Male | Female |
| Sales & Related | 746 (42.4%) | 1,013 (57.6%) |
| Office & Administration | 510 (40.1%) | 762 (59.9%) |
| Total (Category) | 1,256 (41.4%) | 1,775 (58.6%) |
| Total (Overall) | 9,113 (53.2%) | 8,025 (46.8%) |
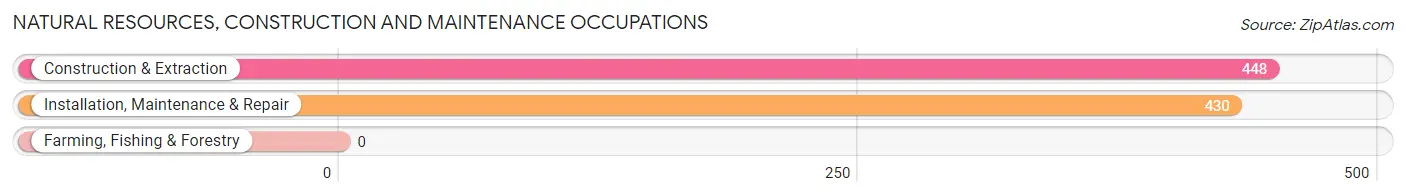
Natural Resources, Construction and Maintenance Occupations
The most common Natural Resources, Construction and Maintenance occupations in Fuquay Varina are Construction & Extraction (448 | 2.6%), and Installation, Maintenance & Repair (430 | 2.5%).
Natural Resources, Construction and Maintenance Occupations by Sex
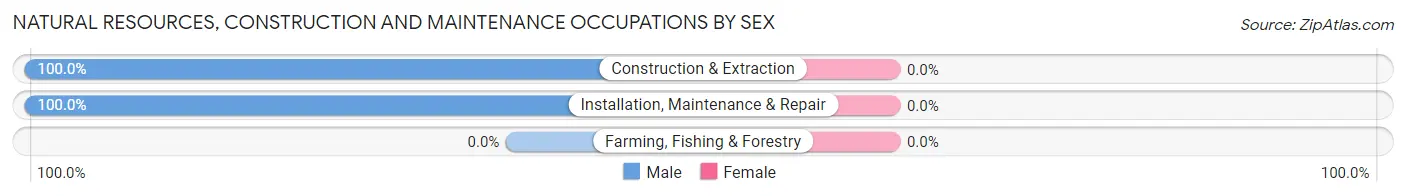
| Occupation | Male | Female |
| Farming, Fishing & Forestry | 0 (0.0%) | 0 (0.0%) |
| Construction & Extraction | 448 (100.0%) | 0 (0.0%) |
| Installation, Maintenance & Repair | 430 (100.0%) | 0 (0.0%) |
| Total (Category) | 878 (100.0%) | 0 (0.0%) |
| Total (Overall) | 9,113 (53.2%) | 8,025 (46.8%) |
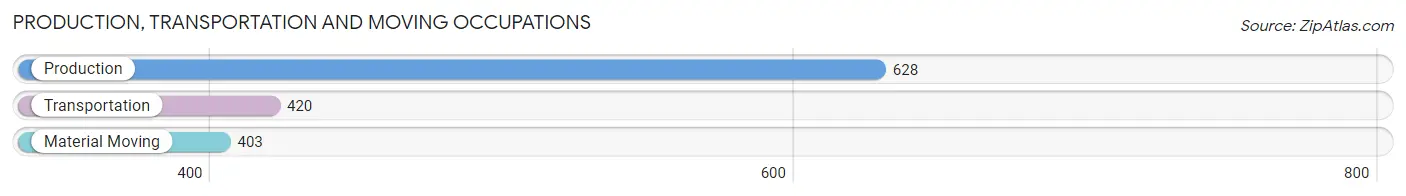
Production, Transportation and Moving Occupations
The most common Production, Transportation and Moving occupations in Fuquay Varina are Production (628 | 3.7%), Transportation (420 | 2.5%), and Material Moving (403 | 2.4%).
Production, Transportation and Moving Occupations by Sex
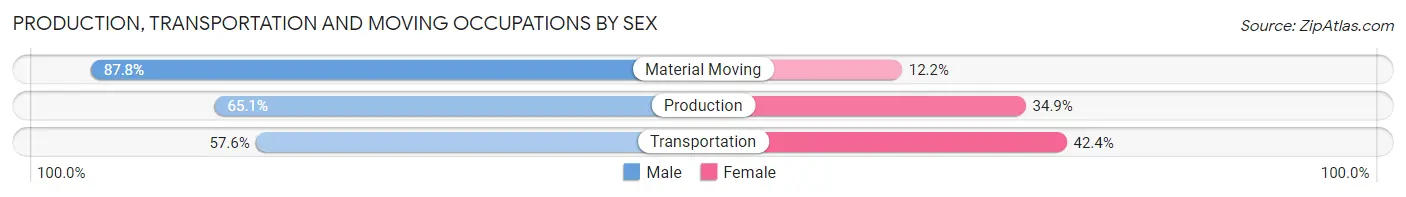
| Occupation | Male | Female |
| Production | 409 (65.1%) | 219 (34.9%) |
| Transportation | 242 (57.6%) | 178 (42.4%) |
| Material Moving | 354 (87.8%) | 49 (12.2%) |
| Total (Category) | 1,005 (69.3%) | 446 (30.7%) |
| Total (Overall) | 9,113 (53.2%) | 8,025 (46.8%) |
Employment Industries by Sex in Fuquay Varina
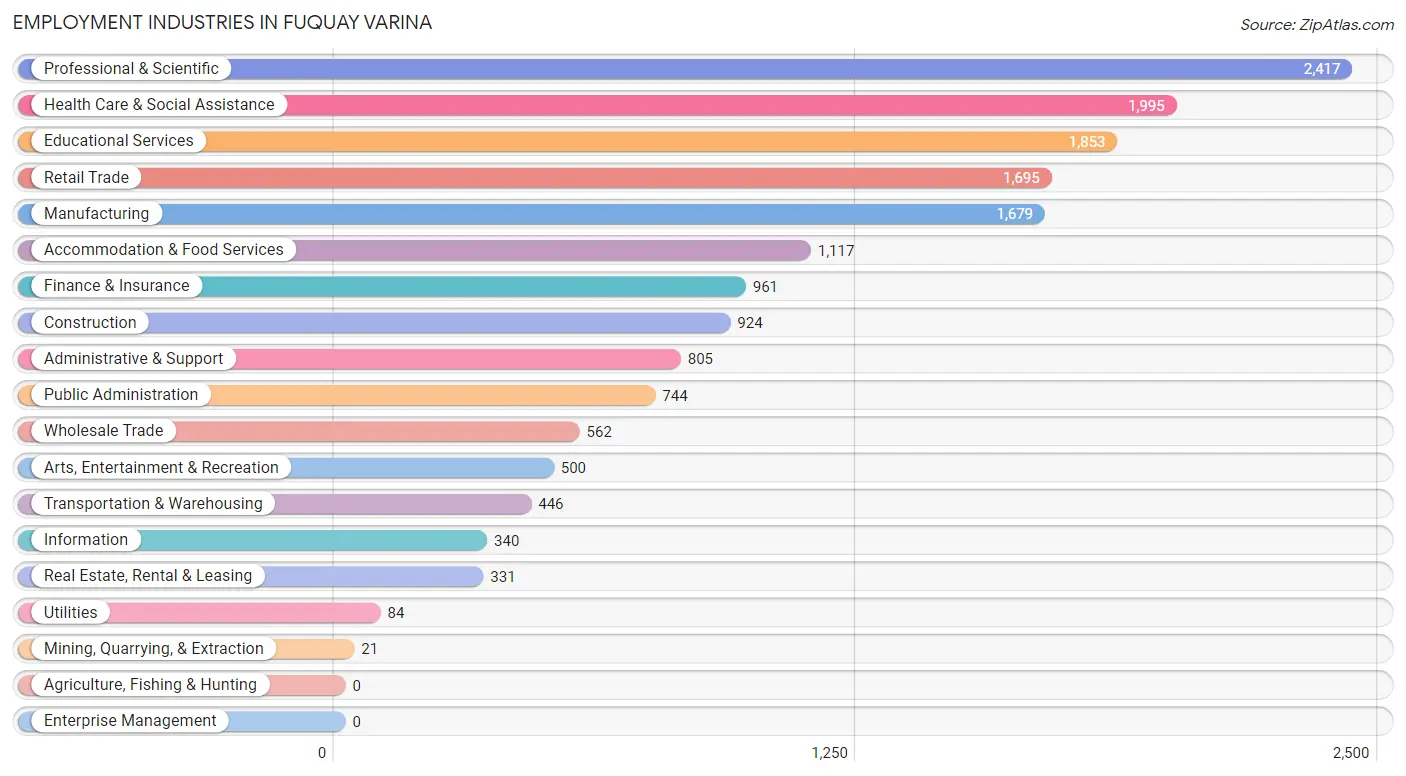
Employment Industries in Fuquay Varina
The major employment industries in Fuquay Varina include Professional & Scientific (2,417 | 14.1%), Health Care & Social Assistance (1,995 | 11.6%), Educational Services (1,853 | 10.8%), Retail Trade (1,695 | 9.9%), and Manufacturing (1,679 | 9.8%).
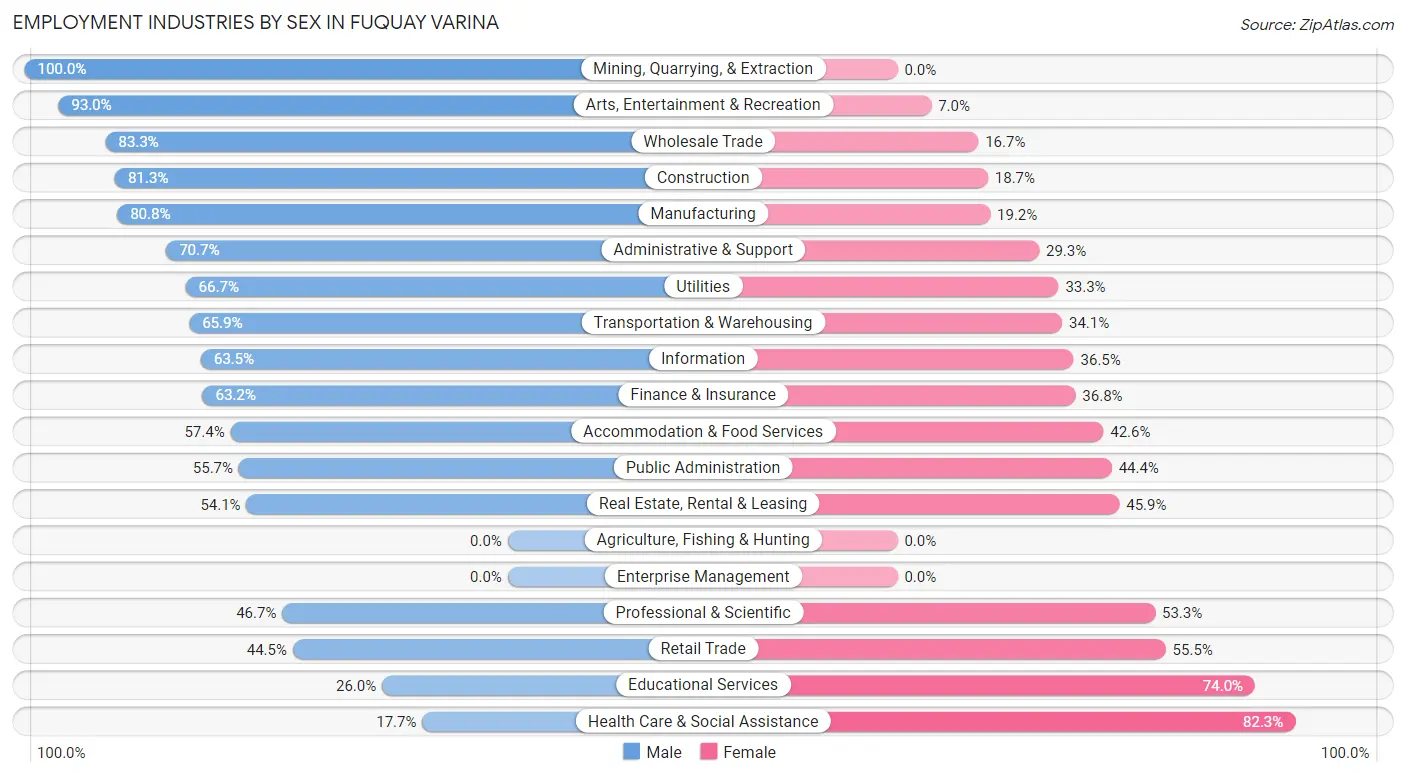
Employment Industries by Sex in Fuquay Varina
The Fuquay Varina industries that see more men than women are Mining, Quarrying, & Extraction (100.0%), Arts, Entertainment & Recreation (93.0%), and Wholesale Trade (83.3%), whereas the industries that tend to have a higher number of women are Health Care & Social Assistance (82.3%), Educational Services (74.0%), and Retail Trade (55.5%).
| Industry | Male | Female |
| Agriculture, Fishing & Hunting | 0 (0.0%) | 0 (0.0%) |
| Mining, Quarrying, & Extraction | 21 (100.0%) | 0 (0.0%) |
| Construction | 751 (81.3%) | 173 (18.7%) |
| Manufacturing | 1,357 (80.8%) | 322 (19.2%) |
| Wholesale Trade | 468 (83.3%) | 94 (16.7%) |
| Retail Trade | 754 (44.5%) | 941 (55.5%) |
| Transportation & Warehousing | 294 (65.9%) | 152 (34.1%) |
| Utilities | 56 (66.7%) | 28 (33.3%) |
| Information | 216 (63.5%) | 124 (36.5%) |
| Finance & Insurance | 607 (63.2%) | 354 (36.8%) |
| Real Estate, Rental & Leasing | 179 (54.1%) | 152 (45.9%) |
| Professional & Scientific | 1,128 (46.7%) | 1,289 (53.3%) |
| Enterprise Management | 0 (0.0%) | 0 (0.0%) |
| Administrative & Support | 569 (70.7%) | 236 (29.3%) |
| Educational Services | 482 (26.0%) | 1,371 (74.0%) |
| Health Care & Social Assistance | 353 (17.7%) | 1,642 (82.3%) |
| Arts, Entertainment & Recreation | 465 (93.0%) | 35 (7.0%) |
| Accommodation & Food Services | 641 (57.4%) | 476 (42.6%) |
| Public Administration | 414 (55.6%) | 330 (44.4%) |
| Total | 9,113 (53.2%) | 8,025 (46.8%) |
Education in Fuquay Varina
School Enrollment in Fuquay Varina
The most common levels of schooling among the 9,560 students in Fuquay Varina are elementary school (2,532 | 26.5%), middle school (2,249 | 23.5%), and high school (1,702 | 17.8%).
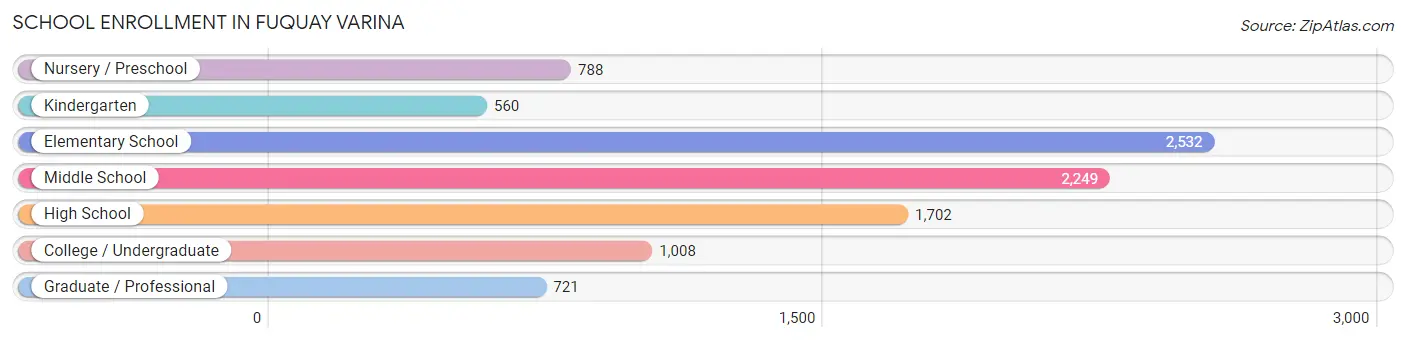
| School Level | # Students | % Students |
| Nursery / Preschool | 788 | 8.2% |
| Kindergarten | 560 | 5.9% |
| Elementary School | 2,532 | 26.5% |
| Middle School | 2,249 | 23.5% |
| High School | 1,702 | 17.8% |
| College / Undergraduate | 1,008 | 10.5% |
| Graduate / Professional | 721 | 7.5% |
| Total | 9,560 | 100.0% |
School Enrollment by Age by Funding Source in Fuquay Varina
Out of a total of 9,560 students who are enrolled in schools in Fuquay Varina, 1,960 (20.5%) attend a private institution, while the remaining 7,600 (79.5%) are enrolled in public schools. The age group of 3 to 4 year olds has the highest likelihood of being enrolled in private schools, with 431 (72.0% in the age bracket) enrolled. Conversely, the age group of 15 to 17 year olds has the lowest likelihood of being enrolled in a private school, with 1,184 (92.6% in the age bracket) attending a public institution.
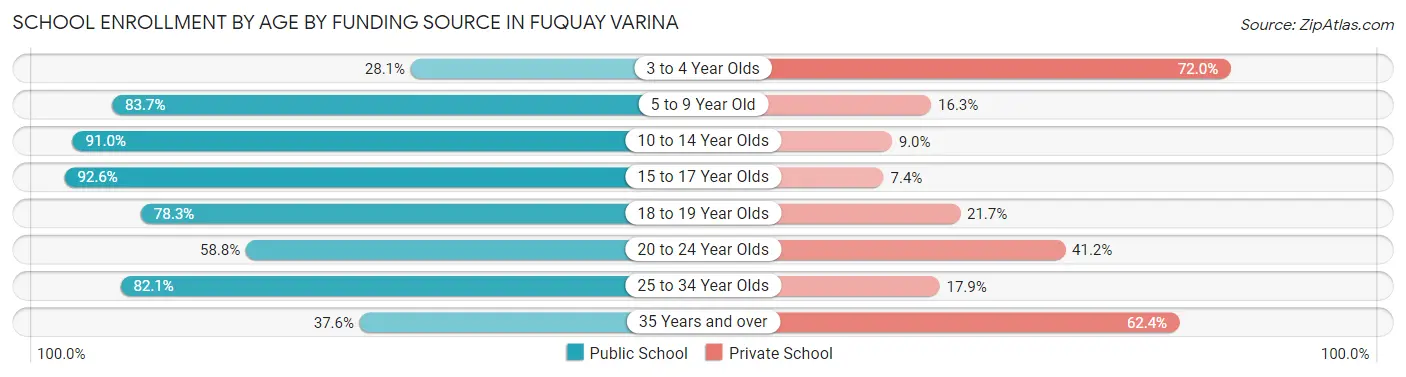
| Age Bracket | Public School | Private School |
| 3 to 4 Year Olds | 168 (28.1%) | 431 (72.0%) |
| 5 to 9 Year Old | 2,343 (83.7%) | 456 (16.3%) |
| 10 to 14 Year Olds | 2,691 (91.0%) | 265 (9.0%) |
| 15 to 17 Year Olds | 1,184 (92.6%) | 95 (7.4%) |
| 18 to 19 Year Olds | 412 (78.3%) | 114 (21.7%) |
| 20 to 24 Year Olds | 208 (58.8%) | 146 (41.2%) |
| 25 to 34 Year Olds | 368 (82.1%) | 80 (17.9%) |
| 35 Years and over | 225 (37.6%) | 374 (62.4%) |
| Total | 7,600 (79.5%) | 1,960 (20.5%) |
Educational Attainment by Field of Study in Fuquay Varina
Business (2,261 | 18.6%), education (1,479 | 12.1%), science & technology (1,249 | 10.2%), engineering (917 | 7.5%), and arts & humanities (806 | 6.6%) are the most common fields of study among 12,180 individuals in Fuquay Varina who have obtained a bachelor's degree or higher.
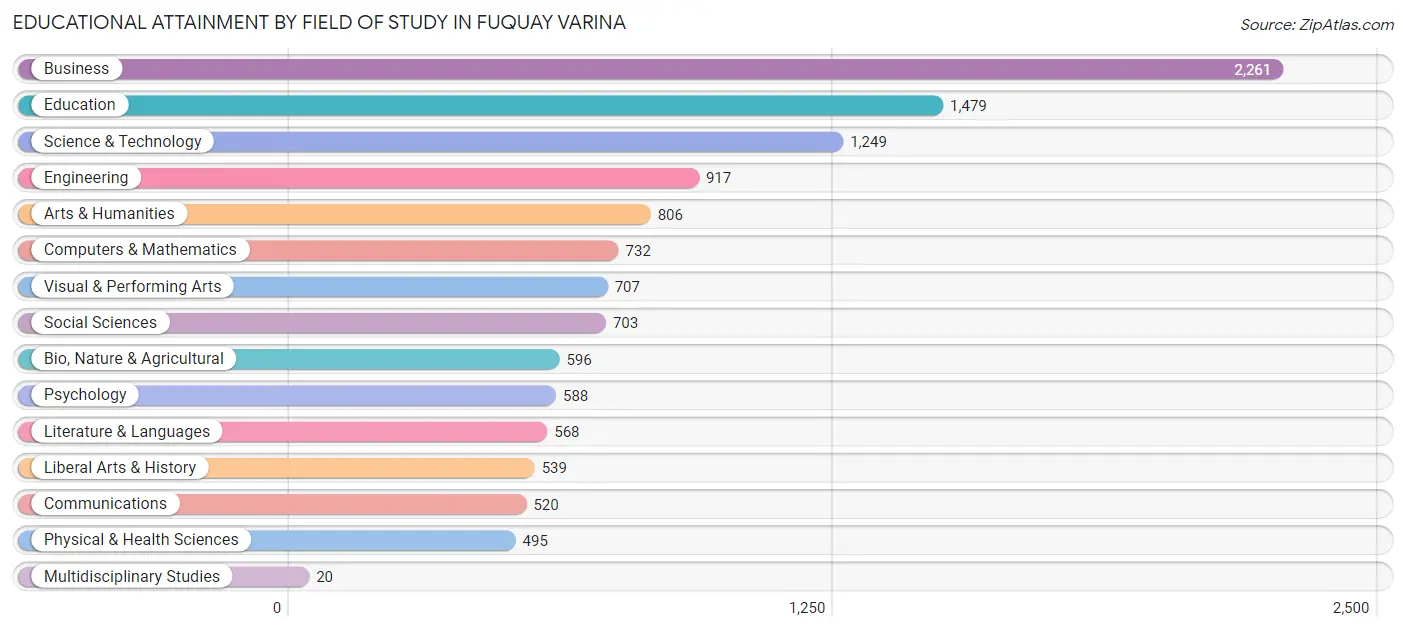
| Field of Study | # Graduates | % Graduates |
| Computers & Mathematics | 732 | 6.0% |
| Bio, Nature & Agricultural | 596 | 4.9% |
| Physical & Health Sciences | 495 | 4.1% |
| Psychology | 588 | 4.8% |
| Social Sciences | 703 | 5.8% |
| Engineering | 917 | 7.5% |
| Multidisciplinary Studies | 20 | 0.2% |
| Science & Technology | 1,249 | 10.2% |
| Business | 2,261 | 18.6% |
| Education | 1,479 | 12.1% |
| Literature & Languages | 568 | 4.7% |
| Liberal Arts & History | 539 | 4.4% |
| Visual & Performing Arts | 707 | 5.8% |
| Communications | 520 | 4.3% |
| Arts & Humanities | 806 | 6.6% |
| Total | 12,180 | 100.0% |
Transportation & Commute in Fuquay Varina
Vehicle Availability by Sex in Fuquay Varina
The most prevalent vehicle ownership categories in Fuquay Varina are males with 2 vehicles (5,293, accounting for 57.7%) and females with 2 vehicles (4,257, making up 67.3%).
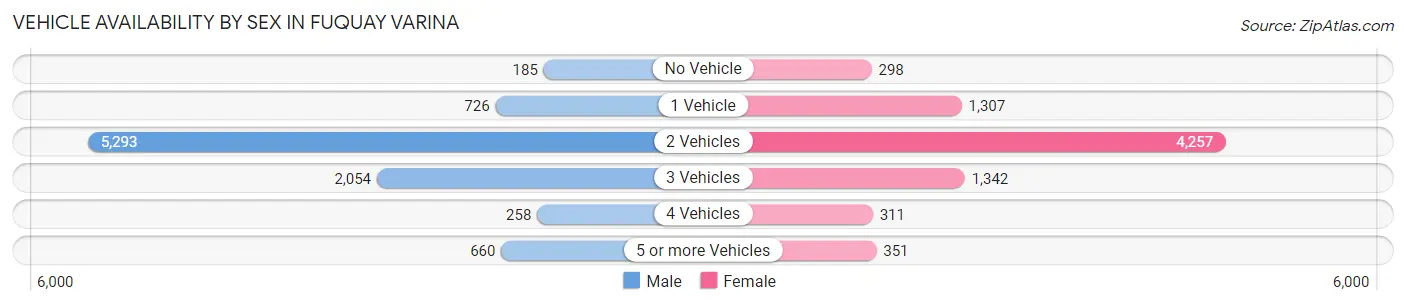
| Vehicles Available | Male | Female |
| No Vehicle | 185 (2.0%) | 298 (3.8%) |
| 1 Vehicle | 726 (7.9%) | 1,307 (16.6%) |
| 2 Vehicles | 5,293 (57.7%) | 4,257 (54.1%) |
| 3 Vehicles | 2,054 (22.4%) | 1,342 (17.1%) |
| 4 Vehicles | 258 (2.8%) | 311 (4.0%) |
| 5 or more Vehicles | 660 (7.2%) | 351 (4.5%) |
| Total | 9,176 (100.0%) | 7,866 (100.0%) |
Commute Time in Fuquay Varina
The most frequently occuring commute durations in Fuquay Varina are 45 to 59 minutes (2,244 commuters, 16.7%), 30 to 34 minutes (1,917 commuters, 14.3%), and 40 to 44 minutes (1,551 commuters, 11.6%).
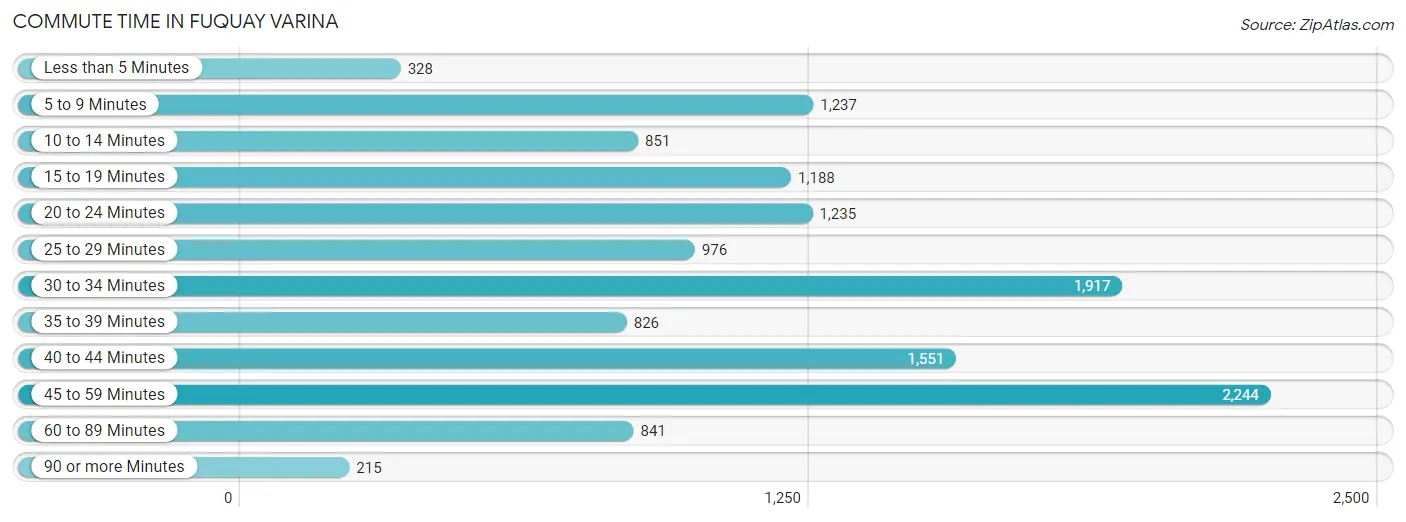
| Commute Time | # Commuters | % Commuters |
| Less than 5 Minutes | 328 | 2.5% |
| 5 to 9 Minutes | 1,237 | 9.2% |
| 10 to 14 Minutes | 851 | 6.4% |
| 15 to 19 Minutes | 1,188 | 8.9% |
| 20 to 24 Minutes | 1,235 | 9.2% |
| 25 to 29 Minutes | 976 | 7.3% |
| 30 to 34 Minutes | 1,917 | 14.3% |
| 35 to 39 Minutes | 826 | 6.2% |
| 40 to 44 Minutes | 1,551 | 11.6% |
| 45 to 59 Minutes | 2,244 | 16.7% |
| 60 to 89 Minutes | 841 | 6.3% |
| 90 or more Minutes | 215 | 1.6% |
Commute Time by Sex in Fuquay Varina
The most common commute times in Fuquay Varina are 30 to 34 minutes (1,121 commuters, 16.1%) for males and 45 to 59 minutes (1,247 commuters, 19.4%) for females.
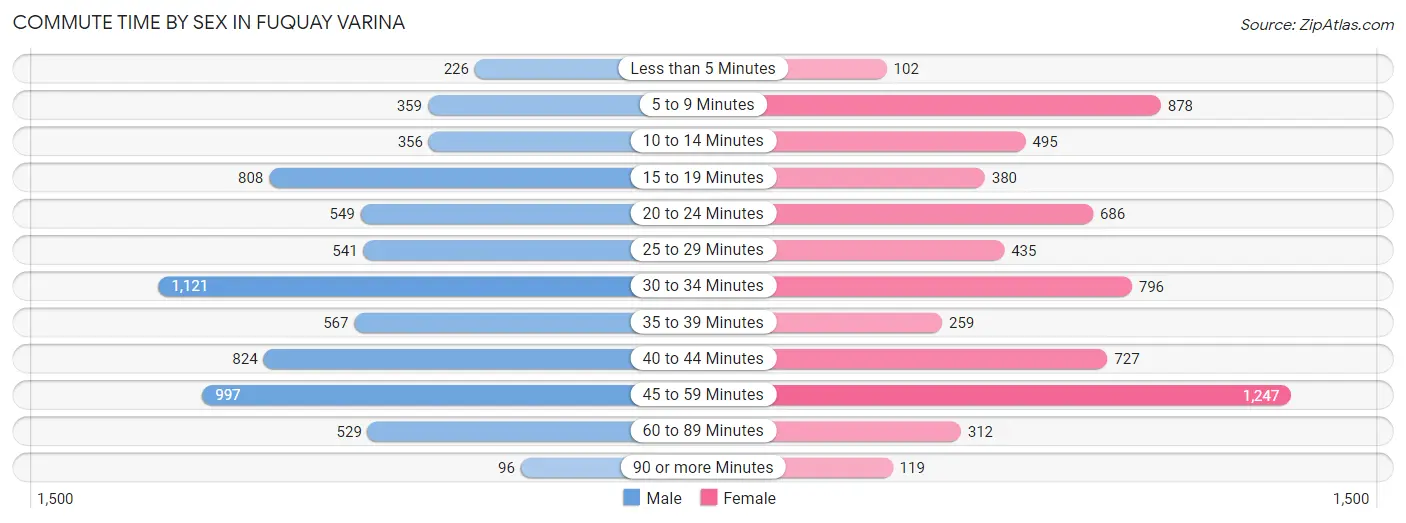
| Commute Time | Male | Female |
| Less than 5 Minutes | 226 (3.2%) | 102 (1.6%) |
| 5 to 9 Minutes | 359 (5.1%) | 878 (13.6%) |
| 10 to 14 Minutes | 356 (5.1%) | 495 (7.7%) |
| 15 to 19 Minutes | 808 (11.6%) | 380 (5.9%) |
| 20 to 24 Minutes | 549 (7.9%) | 686 (10.7%) |
| 25 to 29 Minutes | 541 (7.8%) | 435 (6.8%) |
| 30 to 34 Minutes | 1,121 (16.1%) | 796 (12.4%) |
| 35 to 39 Minutes | 567 (8.1%) | 259 (4.0%) |
| 40 to 44 Minutes | 824 (11.8%) | 727 (11.3%) |
| 45 to 59 Minutes | 997 (14.3%) | 1,247 (19.4%) |
| 60 to 89 Minutes | 529 (7.6%) | 312 (4.9%) |
| 90 or more Minutes | 96 (1.4%) | 119 (1.8%) |
Time of Departure to Work by Sex in Fuquay Varina
The most frequent times of departure to work in Fuquay Varina are 6:30 AM to 6:59 AM (826, 11.8%) for males and 7:00 AM to 7:29 AM (1,129, 17.5%) for females.
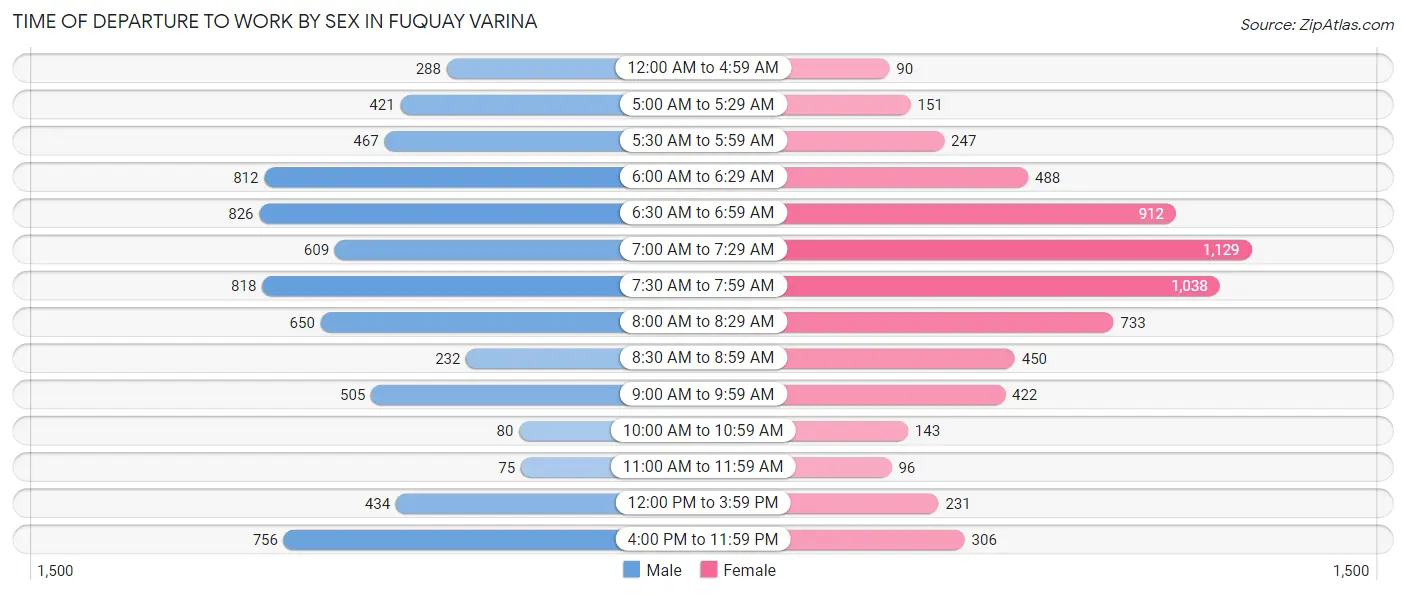
| Time of Departure | Male | Female |
| 12:00 AM to 4:59 AM | 288 (4.1%) | 90 (1.4%) |
| 5:00 AM to 5:29 AM | 421 (6.0%) | 151 (2.4%) |
| 5:30 AM to 5:59 AM | 467 (6.7%) | 247 (3.8%) |
| 6:00 AM to 6:29 AM | 812 (11.6%) | 488 (7.6%) |
| 6:30 AM to 6:59 AM | 826 (11.8%) | 912 (14.2%) |
| 7:00 AM to 7:29 AM | 609 (8.7%) | 1,129 (17.5%) |
| 7:30 AM to 7:59 AM | 818 (11.7%) | 1,038 (16.1%) |
| 8:00 AM to 8:29 AM | 650 (9.3%) | 733 (11.4%) |
| 8:30 AM to 8:59 AM | 232 (3.3%) | 450 (7.0%) |
| 9:00 AM to 9:59 AM | 505 (7.2%) | 422 (6.6%) |
| 10:00 AM to 10:59 AM | 80 (1.1%) | 143 (2.2%) |
| 11:00 AM to 11:59 AM | 75 (1.1%) | 96 (1.5%) |
| 12:00 PM to 3:59 PM | 434 (6.2%) | 231 (3.6%) |
| 4:00 PM to 11:59 PM | 756 (10.8%) | 306 (4.8%) |
| Total | 6,973 (100.0%) | 6,436 (100.0%) |
Housing Occupancy in Fuquay Varina
Occupancy by Ownership in Fuquay Varina
Of the total 12,449 dwellings in Fuquay Varina, owner-occupied units account for 8,951 (71.9%), while renter-occupied units make up 3,498 (28.1%).
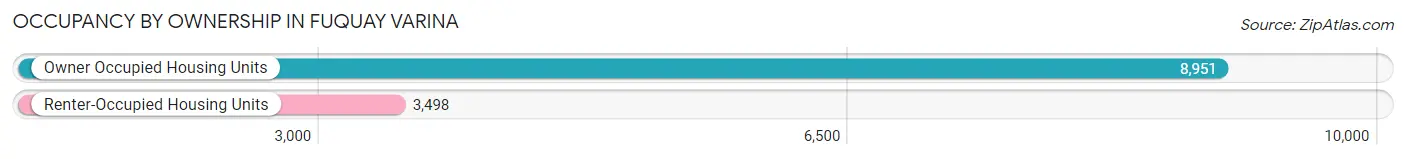
| Occupancy | # Housing Units | % Housing Units |
| Owner Occupied Housing Units | 8,951 | 71.9% |
| Renter-Occupied Housing Units | 3,498 | 28.1% |
| Total Occupied Housing Units | 12,449 | 100.0% |
Occupancy by Household Size in Fuquay Varina
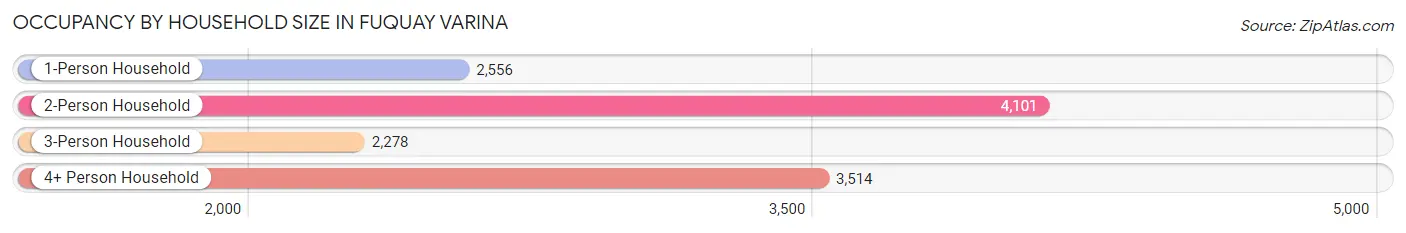
| Household Size | # Housing Units | % Housing Units |
| 1-Person Household | 2,556 | 20.5% |
| 2-Person Household | 4,101 | 32.9% |
| 3-Person Household | 2,278 | 18.3% |
| 4+ Person Household | 3,514 | 28.2% |
| Total Housing Units | 12,449 | 100.0% |
Occupancy by Ownership by Household Size in Fuquay Varina
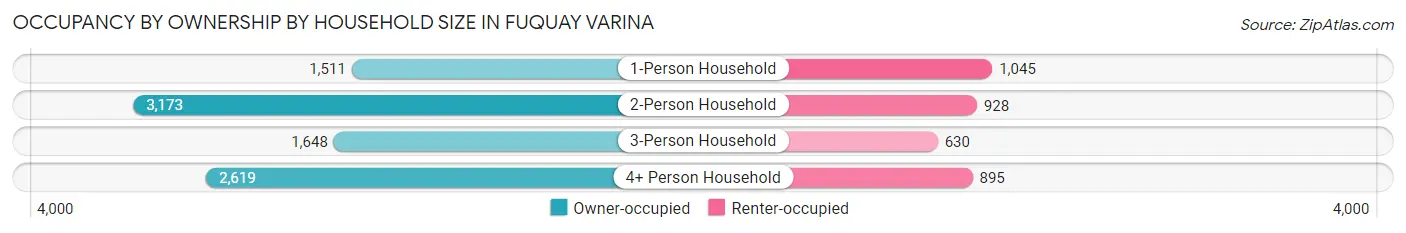
| Household Size | Owner-occupied | Renter-occupied |
| 1-Person Household | 1,511 (59.1%) | 1,045 (40.9%) |
| 2-Person Household | 3,173 (77.4%) | 928 (22.6%) |
| 3-Person Household | 1,648 (72.3%) | 630 (27.7%) |
| 4+ Person Household | 2,619 (74.5%) | 895 (25.5%) |
| Total Housing Units | 8,951 (71.9%) | 3,498 (28.1%) |
Occupancy by Educational Attainment in Fuquay Varina
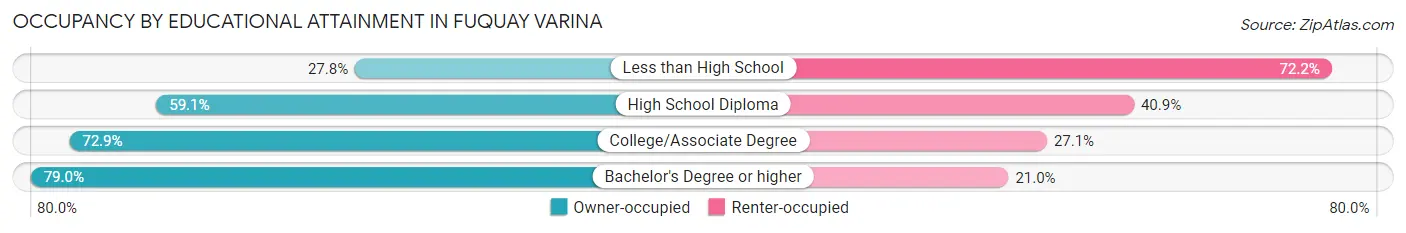
| Household Size | Owner-occupied | Renter-occupied |
| Less than High School | 181 (27.8%) | 471 (72.2%) |
| High School Diploma | 938 (59.1%) | 649 (40.9%) |
| College/Associate Degree | 2,818 (72.9%) | 1,047 (27.1%) |
| Bachelor's Degree or higher | 5,014 (79.0%) | 1,331 (21.0%) |
Occupancy by Age of Householder in Fuquay Varina
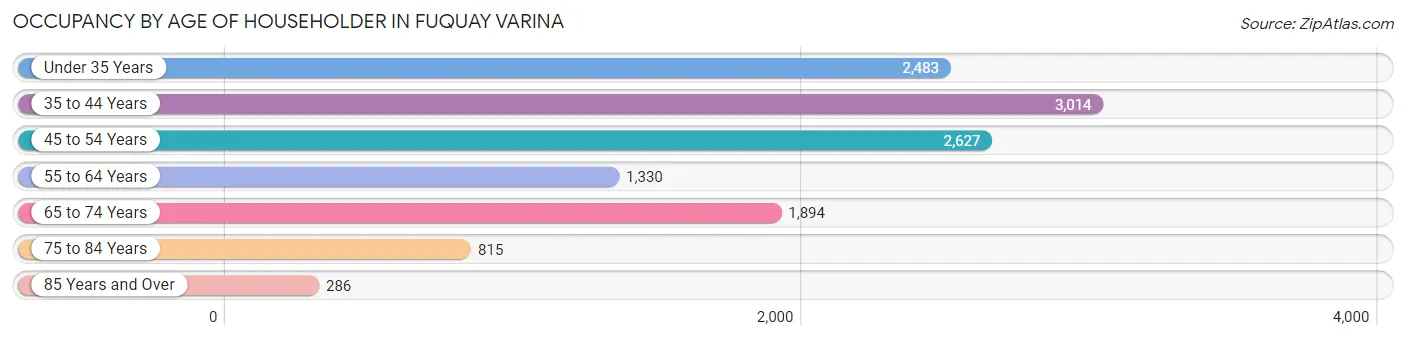
| Age Bracket | # Households | % Households |
| Under 35 Years | 2,483 | 20.0% |
| 35 to 44 Years | 3,014 | 24.2% |
| 45 to 54 Years | 2,627 | 21.1% |
| 55 to 64 Years | 1,330 | 10.7% |
| 65 to 74 Years | 1,894 | 15.2% |
| 75 to 84 Years | 815 | 6.6% |
| 85 Years and Over | 286 | 2.3% |
| Total | 12,449 | 100.0% |
Housing Finances in Fuquay Varina
Median Income by Occupancy in Fuquay Varina
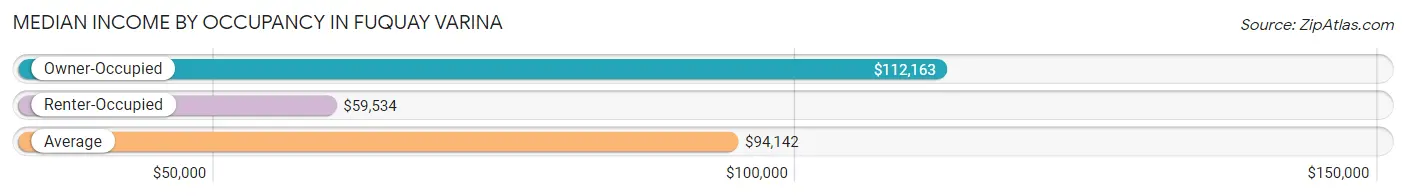
| Occupancy Type | # Households | Median Income |
| Owner-Occupied | 8,951 (71.9%) | $112,163 |
| Renter-Occupied | 3,498 (28.1%) | $59,534 |
| Average | 12,449 (100.0%) | $94,142 |
Occupancy by Householder Income Bracket in Fuquay Varina
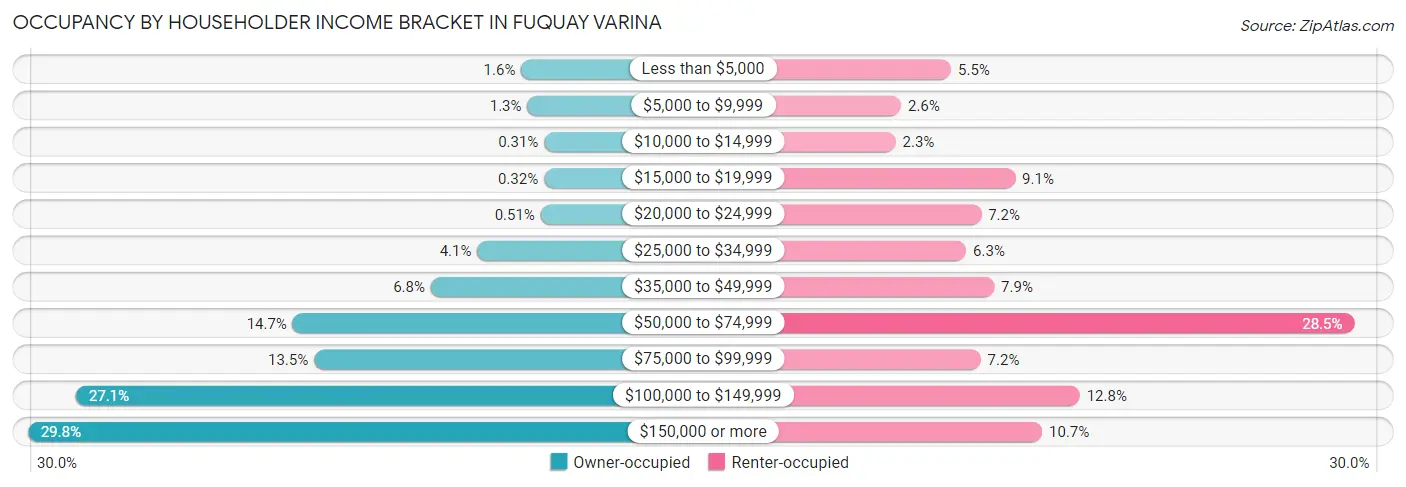
| Income Bracket | Owner-occupied | Renter-occupied |
| Less than $5,000 | 145 (1.6%) | 191 (5.5%) |
| $5,000 to $9,999 | 114 (1.3%) | 91 (2.6%) |
| $10,000 to $14,999 | 28 (0.3%) | 80 (2.3%) |
| $15,000 to $19,999 | 29 (0.3%) | 319 (9.1%) |
| $20,000 to $24,999 | 46 (0.5%) | 251 (7.2%) |
| $25,000 to $34,999 | 370 (4.1%) | 221 (6.3%) |
| $35,000 to $49,999 | 608 (6.8%) | 277 (7.9%) |
| $50,000 to $74,999 | 1,314 (14.7%) | 997 (28.5%) |
| $75,000 to $99,999 | 1,205 (13.5%) | 250 (7.1%) |
| $100,000 to $149,999 | 2,423 (27.1%) | 448 (12.8%) |
| $150,000 or more | 2,669 (29.8%) | 373 (10.7%) |
| Total | 8,951 (100.0%) | 3,498 (100.0%) |
Monthly Housing Cost Tiers in Fuquay Varina
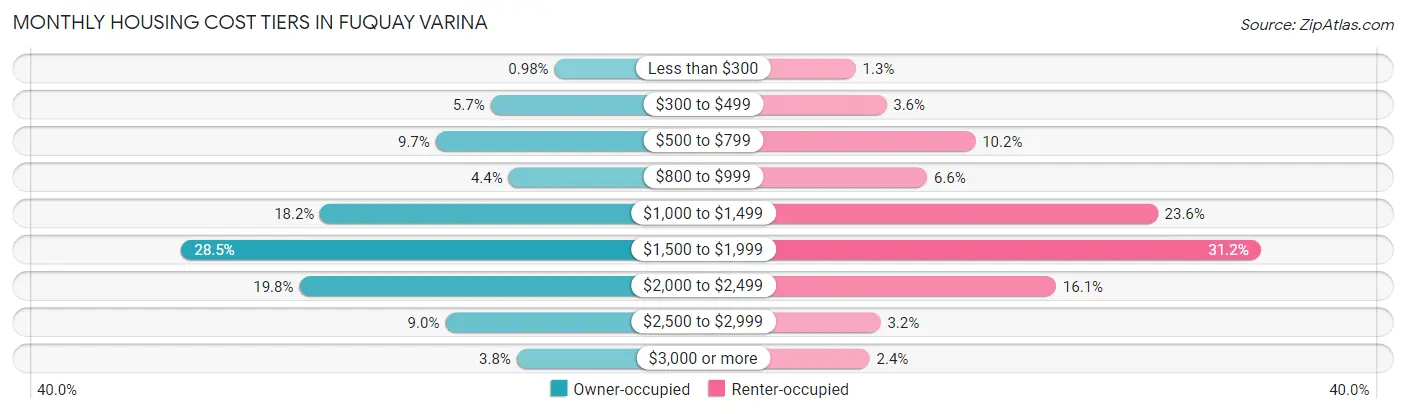
| Monthly Cost | Owner-occupied | Renter-occupied |
| Less than $300 | 88 (1.0%) | 47 (1.3%) |
| $300 to $499 | 509 (5.7%) | 126 (3.6%) |
| $500 to $799 | 871 (9.7%) | 355 (10.2%) |
| $800 to $999 | 390 (4.4%) | 231 (6.6%) |
| $1,000 to $1,499 | 1,632 (18.2%) | 825 (23.6%) |
| $1,500 to $1,999 | 2,547 (28.4%) | 1,090 (31.2%) |
| $2,000 to $2,499 | 1,770 (19.8%) | 563 (16.1%) |
| $2,500 to $2,999 | 807 (9.0%) | 111 (3.2%) |
| $3,000 or more | 337 (3.8%) | 83 (2.4%) |
| Total | 8,951 (100.0%) | 3,498 (100.0%) |
Physical Housing Characteristics in Fuquay Varina
Housing Structures in Fuquay Varina
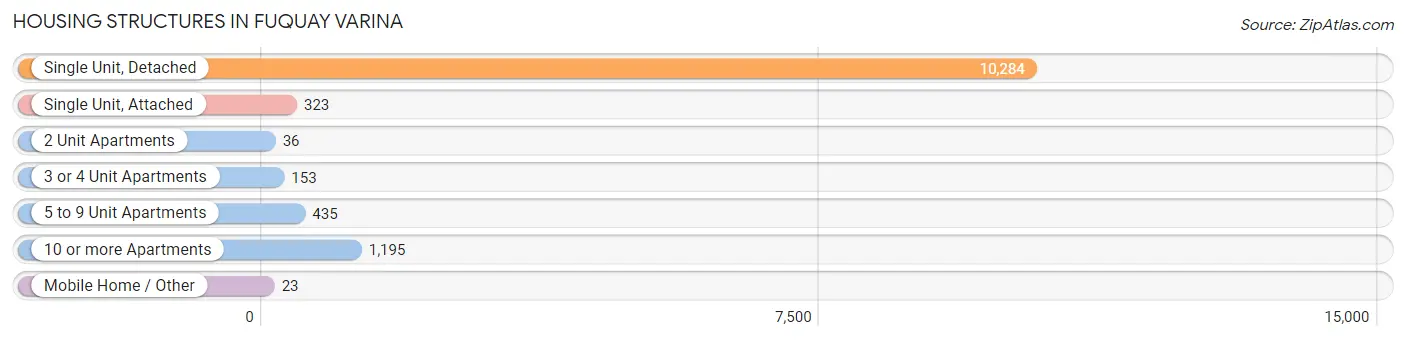
| Structure Type | # Housing Units | % Housing Units |
| Single Unit, Detached | 10,284 | 82.6% |
| Single Unit, Attached | 323 | 2.6% |
| 2 Unit Apartments | 36 | 0.3% |
| 3 or 4 Unit Apartments | 153 | 1.2% |
| 5 to 9 Unit Apartments | 435 | 3.5% |
| 10 or more Apartments | 1,195 | 9.6% |
| Mobile Home / Other | 23 | 0.2% |
| Total | 12,449 | 100.0% |
Housing Structures by Occupancy in Fuquay Varina
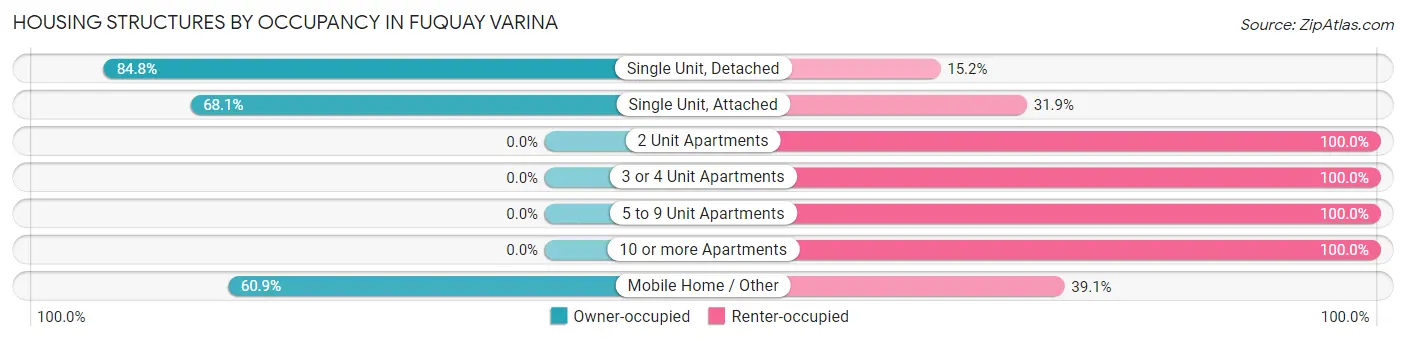
| Structure Type | Owner-occupied | Renter-occupied |
| Single Unit, Detached | 8,717 (84.8%) | 1,567 (15.2%) |
| Single Unit, Attached | 220 (68.1%) | 103 (31.9%) |
| 2 Unit Apartments | 0 (0.0%) | 36 (100.0%) |
| 3 or 4 Unit Apartments | 0 (0.0%) | 153 (100.0%) |
| 5 to 9 Unit Apartments | 0 (0.0%) | 435 (100.0%) |
| 10 or more Apartments | 0 (0.0%) | 1,195 (100.0%) |
| Mobile Home / Other | 14 (60.9%) | 9 (39.1%) |
| Total | 8,951 (71.9%) | 3,498 (28.1%) |
Housing Structures by Number of Rooms in Fuquay Varina

| Number of Rooms | Owner-occupied | Renter-occupied |
| 1 Room | 30 (0.3%) | 26 (0.7%) |
| 2 or 3 Rooms | 16 (0.2%) | 771 (22.0%) |
| 4 or 5 Rooms | 1,810 (20.2%) | 1,573 (45.0%) |
| 6 or 7 Rooms | 3,304 (36.9%) | 534 (15.3%) |
| 8 or more Rooms | 3,791 (42.3%) | 594 (17.0%) |
| Total | 8,951 (100.0%) | 3,498 (100.0%) |
Housing Structure by Heating Type in Fuquay Varina
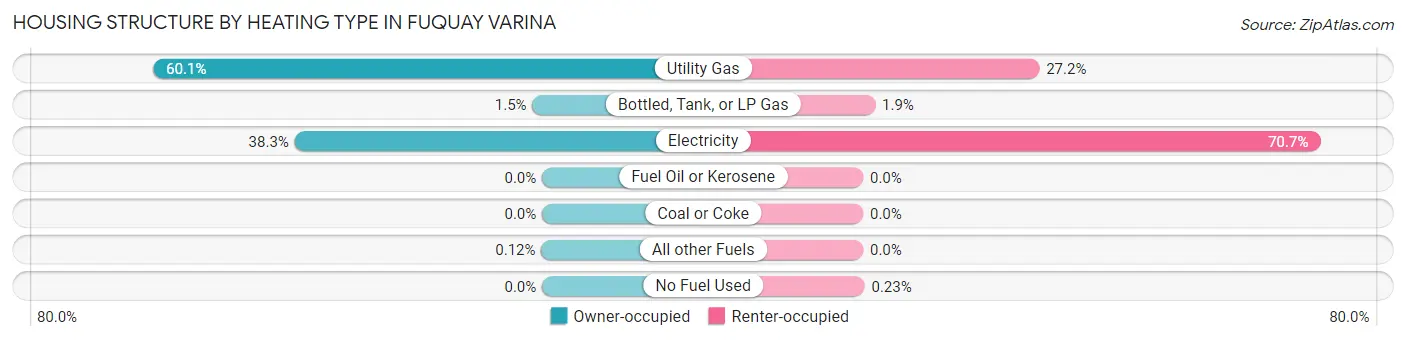
| Heating Type | Owner-occupied | Renter-occupied |
| Utility Gas | 5,383 (60.1%) | 953 (27.2%) |
| Bottled, Tank, or LP Gas | 133 (1.5%) | 65 (1.9%) |
| Electricity | 3,424 (38.3%) | 2,472 (70.7%) |
| Fuel Oil or Kerosene | 0 (0.0%) | 0 (0.0%) |
| Coal or Coke | 0 (0.0%) | 0 (0.0%) |
| All other Fuels | 11 (0.1%) | 0 (0.0%) |
| No Fuel Used | 0 (0.0%) | 8 (0.2%) |
| Total | 8,951 (100.0%) | 3,498 (100.0%) |
Household Vehicle Usage in Fuquay Varina
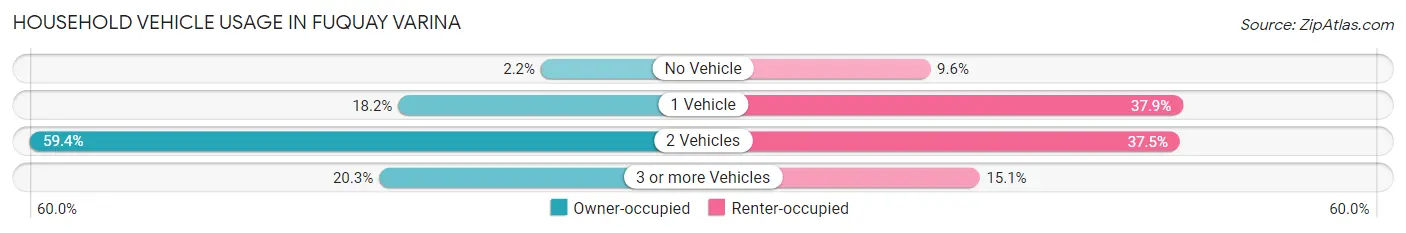
| Vehicles per Household | Owner-occupied | Renter-occupied |
| No Vehicle | 194 (2.2%) | 334 (9.6%) |
| 1 Vehicle | 1,625 (18.1%) | 1,325 (37.9%) |
| 2 Vehicles | 5,315 (59.4%) | 1,312 (37.5%) |
| 3 or more Vehicles | 1,817 (20.3%) | 527 (15.1%) |
| Total | 8,951 (100.0%) | 3,498 (100.0%) |
Real Estate & Mortgages in Fuquay Varina
Real Estate and Mortgage Overview in Fuquay Varina
| Characteristic | Without Mortgage | With Mortgage |
| Housing Units | 1,484 | 7,467 |
| Median Property Value | $347,900 | $368,300 |
| Median Household Income | $83,800 | $2,376 |
| Monthly Housing Costs | $562 | $337 |
| Real Estate Taxes | $2,918 | $181 |
Property Value by Mortgage Status in Fuquay Varina
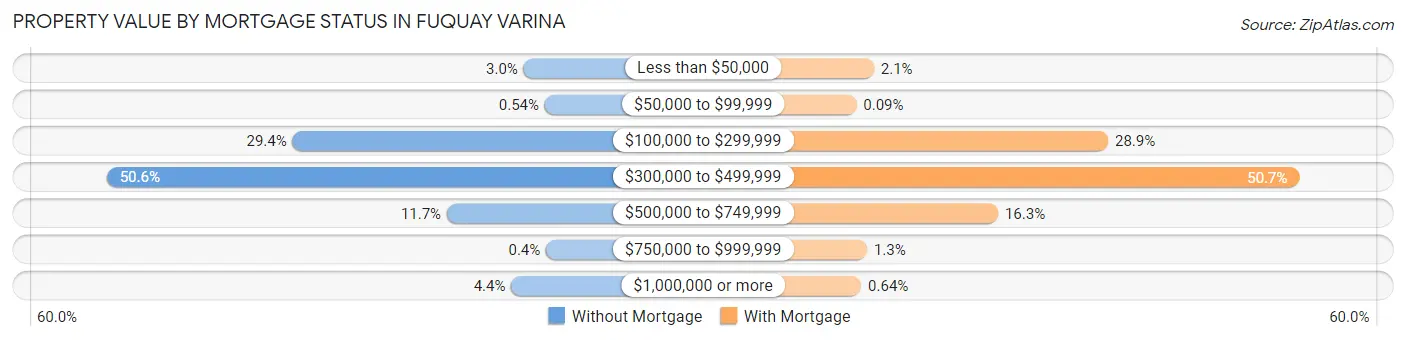
| Property Value | Without Mortgage | With Mortgage |
| Less than $50,000 | 44 (3.0%) | 156 (2.1%) |
| $50,000 to $99,999 | 8 (0.5%) | 7 (0.1%) |
| $100,000 to $299,999 | 436 (29.4%) | 2,155 (28.9%) |
| $300,000 to $499,999 | 751 (50.6%) | 3,787 (50.7%) |
| $500,000 to $749,999 | 174 (11.7%) | 1,216 (16.3%) |
| $750,000 to $999,999 | 6 (0.4%) | 98 (1.3%) |
| $1,000,000 or more | 65 (4.4%) | 48 (0.6%) |
| Total | 1,484 (100.0%) | 7,467 (100.0%) |
Household Income by Mortgage Status in Fuquay Varina
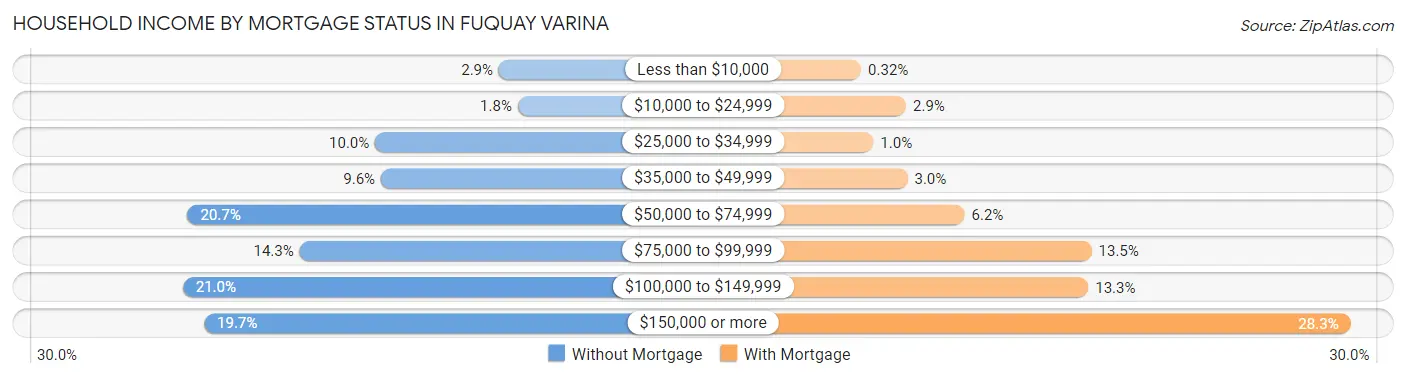
| Household Income | Without Mortgage | With Mortgage |
| Less than $10,000 | 43 (2.9%) | 24 (0.3%) |
| $10,000 to $24,999 | 27 (1.8%) | 216 (2.9%) |
| $25,000 to $34,999 | 148 (10.0%) | 76 (1.0%) |
| $35,000 to $49,999 | 143 (9.6%) | 222 (3.0%) |
| $50,000 to $74,999 | 307 (20.7%) | 465 (6.2%) |
| $75,000 to $99,999 | 212 (14.3%) | 1,007 (13.5%) |
| $100,000 to $149,999 | 311 (21.0%) | 993 (13.3%) |
| $150,000 or more | 293 (19.7%) | 2,112 (28.3%) |
| Total | 1,484 (100.0%) | 7,467 (100.0%) |
Property Value to Household Income Ratio in Fuquay Varina
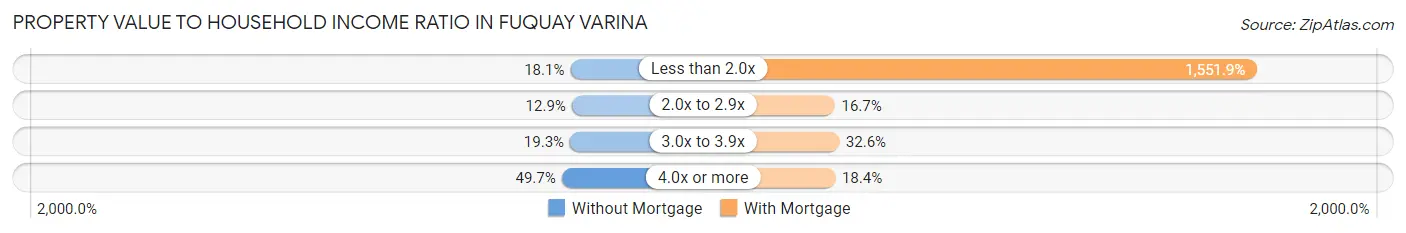
| Value-to-Income Ratio | Without Mortgage | With Mortgage |
| Less than 2.0x | 269 (18.1%) | 115,883 (1,551.9%) |
| 2.0x to 2.9x | 192 (12.9%) | 1,248 (16.7%) |
| 3.0x to 3.9x | 286 (19.3%) | 2,433 (32.6%) |
| 4.0x or more | 737 (49.7%) | 1,377 (18.4%) |
| Total | 1,484 (100.0%) | 7,467 (100.0%) |
Real Estate Taxes by Mortgage Status in Fuquay Varina
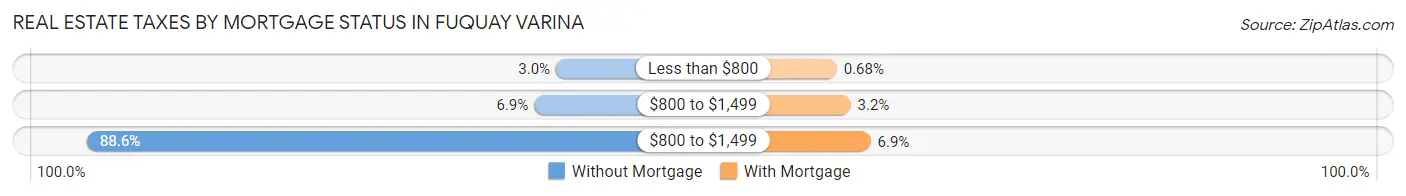
| Property Taxes | Without Mortgage | With Mortgage |
| Less than $800 | 44 (3.0%) | 51 (0.7%) |
| $800 to $1,499 | 103 (6.9%) | 240 (3.2%) |
| $800 to $1,499 | 1,315 (88.6%) | 512 (6.9%) |
| Total | 1,484 (100.0%) | 7,467 (100.0%) |
Health & Disability in Fuquay Varina
Health Insurance Coverage by Age in Fuquay Varina
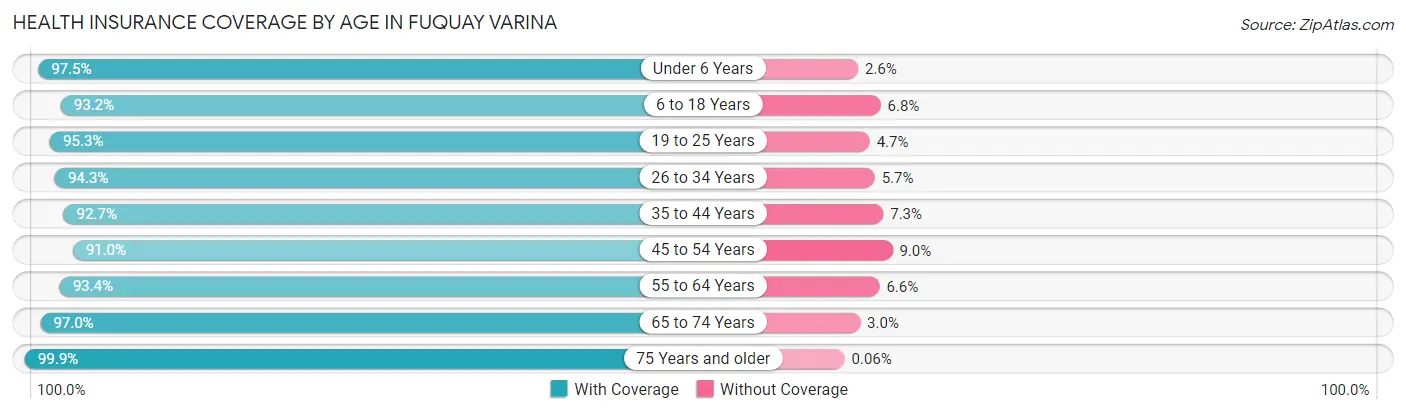
| Age Bracket | With Coverage | Without Coverage |
| Under 6 Years | 3,022 (97.5%) | 79 (2.5%) |
| 6 to 18 Years | 7,022 (93.2%) | 510 (6.8%) |
| 19 to 25 Years | 2,252 (95.3%) | 112 (4.7%) |
| 26 to 34 Years | 4,242 (94.3%) | 255 (5.7%) |
| 35 to 44 Years | 5,259 (92.7%) | 412 (7.3%) |
| 45 to 54 Years | 4,369 (91.0%) | 431 (9.0%) |
| 55 to 64 Years | 2,534 (93.4%) | 178 (6.6%) |
| 65 to 74 Years | 2,757 (97.0%) | 84 (3.0%) |
| 75 Years and older | 1,701 (99.9%) | 1 (0.1%) |
| Total | 33,158 (94.2%) | 2,062 (5.9%) |
Health Insurance Coverage by Citizenship Status in Fuquay Varina
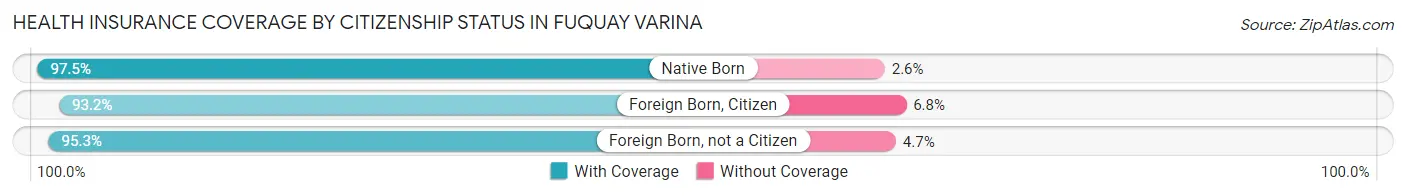
| Citizenship Status | With Coverage | Without Coverage |
| Native Born | 3,022 (97.5%) | 79 (2.5%) |
| Foreign Born, Citizen | 7,022 (93.2%) | 510 (6.8%) |
| Foreign Born, not a Citizen | 2,252 (95.3%) | 112 (4.7%) |
Health Insurance Coverage by Household Income in Fuquay Varina
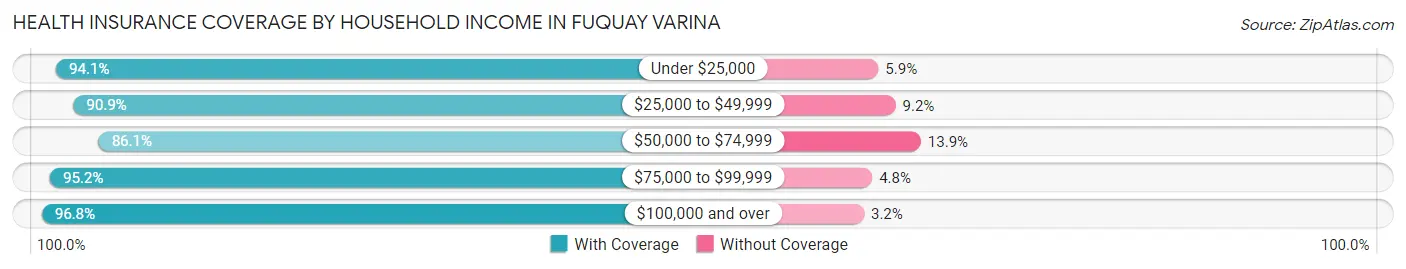
| Household Income | With Coverage | Without Coverage |
| Under $25,000 | 2,225 (94.1%) | 140 (5.9%) |
| $25,000 to $49,999 | 3,096 (90.8%) | 312 (9.1%) |
| $50,000 to $74,999 | 4,809 (86.1%) | 776 (13.9%) |
| $75,000 to $99,999 | 3,391 (95.2%) | 170 (4.8%) |
| $100,000 and over | 19,584 (96.8%) | 653 (3.2%) |
Public vs Private Health Insurance Coverage by Age in Fuquay Varina
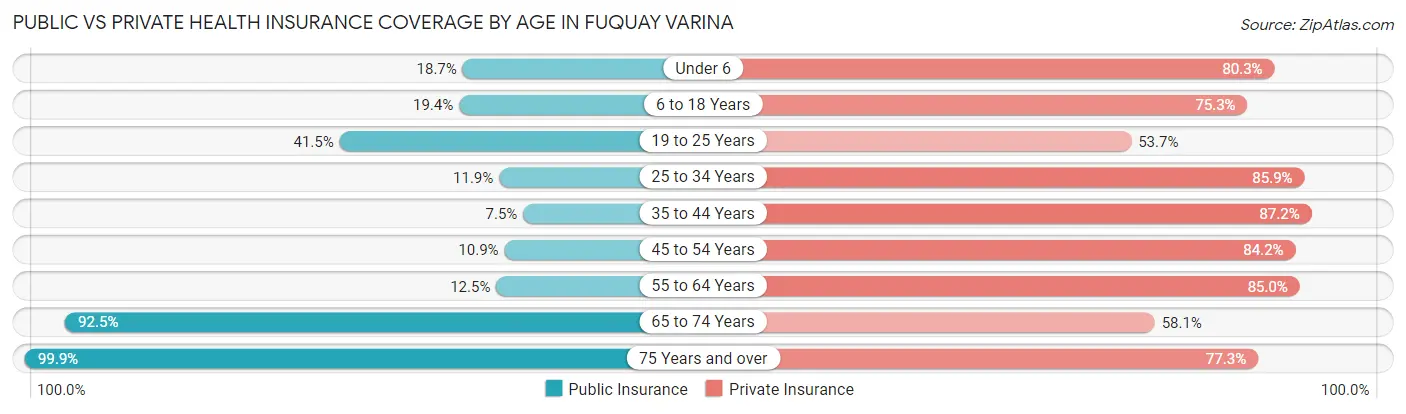
| Age Bracket | Public Insurance | Private Insurance |
| Under 6 | 580 (18.7%) | 2,490 (80.3%) |
| 6 to 18 Years | 1,458 (19.4%) | 5,671 (75.3%) |
| 19 to 25 Years | 982 (41.5%) | 1,270 (53.7%) |
| 25 to 34 Years | 536 (11.9%) | 3,861 (85.9%) |
| 35 to 44 Years | 423 (7.5%) | 4,945 (87.2%) |
| 45 to 54 Years | 525 (10.9%) | 4,041 (84.2%) |
| 55 to 64 Years | 338 (12.5%) | 2,305 (85.0%) |
| 65 to 74 Years | 2,627 (92.5%) | 1,650 (58.1%) |
| 75 Years and over | 1,701 (99.9%) | 1,315 (77.3%) |
| Total | 9,170 (26.0%) | 27,548 (78.2%) |
Disability Status by Sex by Age in Fuquay Varina
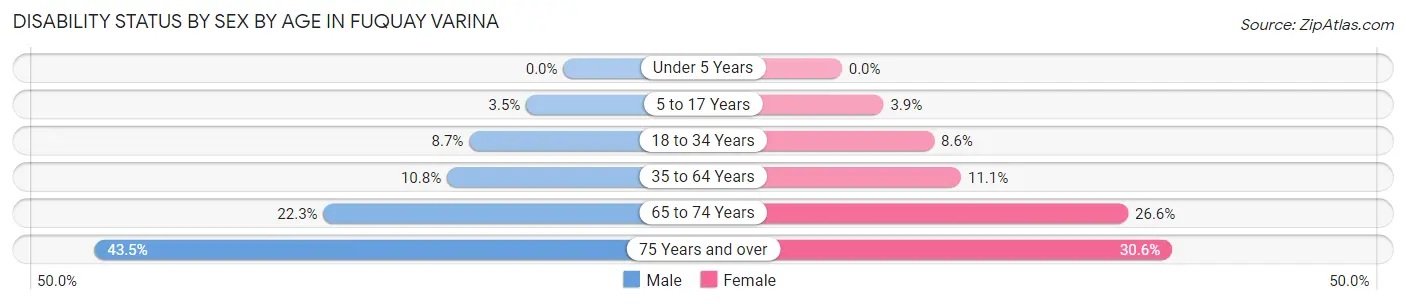
| Age Bracket | Male | Female |
| Under 5 Years | 0 (0.0%) | 0 (0.0%) |
| 5 to 17 Years | 129 (3.5%) | 145 (3.9%) |
| 18 to 34 Years | 334 (8.7%) | 311 (8.6%) |
| 35 to 64 Years | 662 (10.8%) | 781 (11.1%) |
| 65 to 74 Years | 289 (22.3%) | 410 (26.6%) |
| 75 Years and over | 245 (43.5%) | 349 (30.6%) |
Disability Class by Sex by Age in Fuquay Varina
Disability Class: Hearing Difficulty
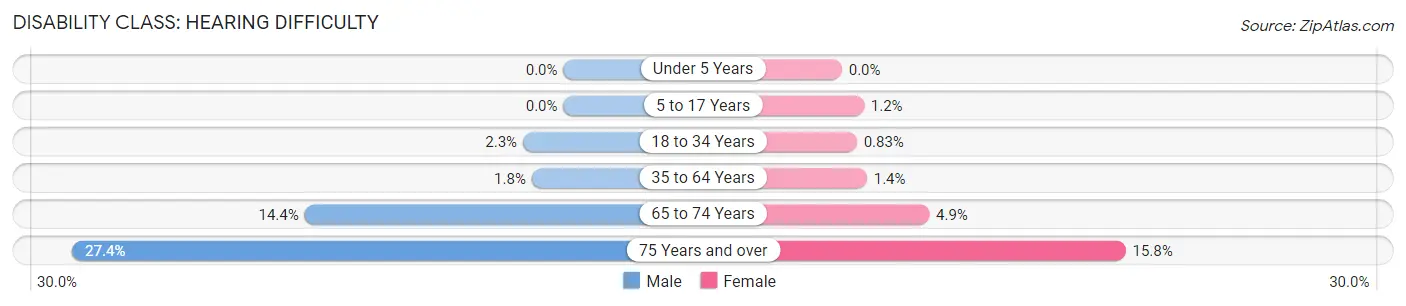
| Age Bracket | Male | Female |
| Under 5 Years | 0 (0.0%) | 0 (0.0%) |
| 5 to 17 Years | 0 (0.0%) | 46 (1.2%) |
| 18 to 34 Years | 86 (2.2%) | 30 (0.8%) |
| 35 to 64 Years | 108 (1.8%) | 98 (1.4%) |
| 65 to 74 Years | 187 (14.4%) | 75 (4.9%) |
| 75 Years and over | 154 (27.4%) | 180 (15.8%) |
Disability Class: Vision Difficulty
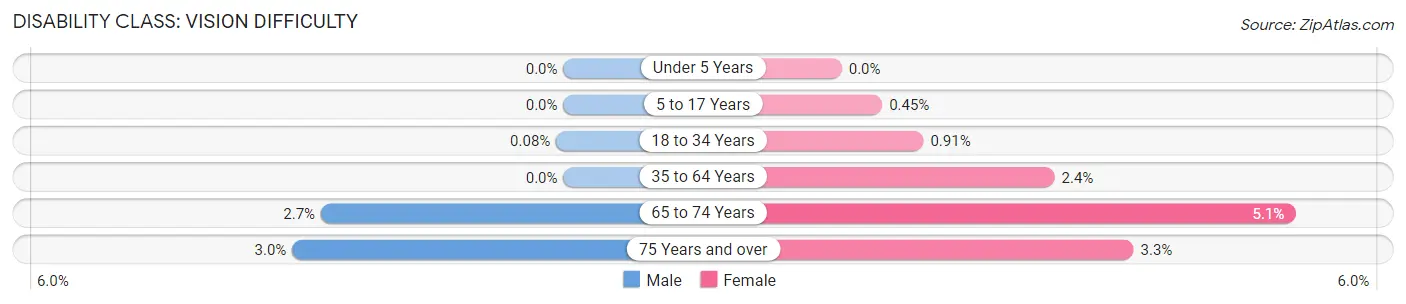
| Age Bracket | Male | Female |
| Under 5 Years | 0 (0.0%) | 0 (0.0%) |
| 5 to 17 Years | 0 (0.0%) | 17 (0.4%) |
| 18 to 34 Years | 3 (0.1%) | 33 (0.9%) |
| 35 to 64 Years | 0 (0.0%) | 167 (2.4%) |
| 65 to 74 Years | 35 (2.7%) | 78 (5.1%) |
| 75 Years and over | 17 (3.0%) | 37 (3.3%) |
Disability Class: Cognitive Difficulty
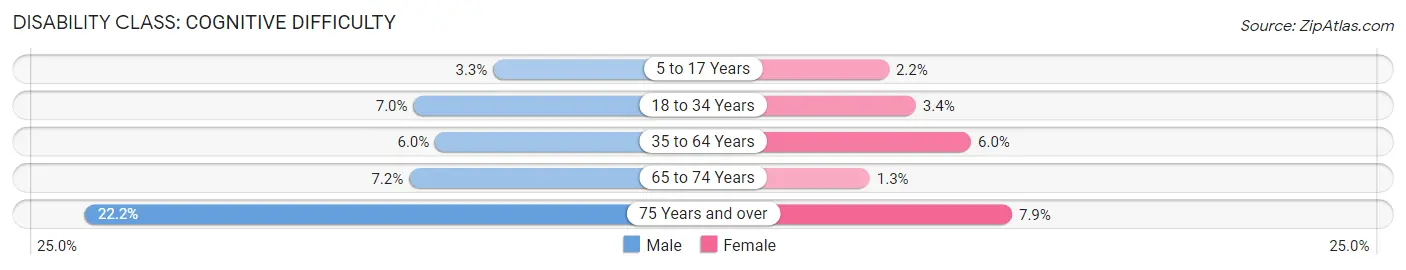
| Age Bracket | Male | Female |
| 5 to 17 Years | 122 (3.3%) | 82 (2.2%) |
| 18 to 34 Years | 266 (7.0%) | 125 (3.4%) |
| 35 to 64 Years | 365 (5.9%) | 423 (6.0%) |
| 65 to 74 Years | 93 (7.2%) | 20 (1.3%) |
| 75 Years and over | 125 (22.2%) | 90 (7.9%) |
Disability Class: Ambulatory Difficulty
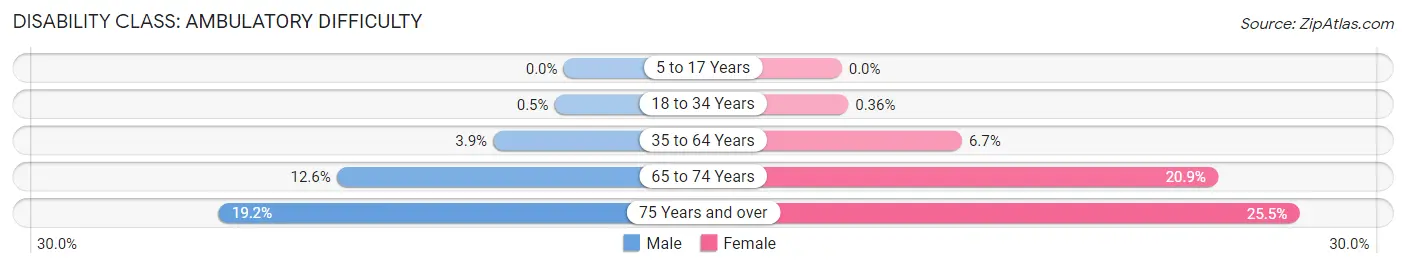
| Age Bracket | Male | Female |
| 5 to 17 Years | 0 (0.0%) | 0 (0.0%) |
| 18 to 34 Years | 19 (0.5%) | 13 (0.4%) |
| 35 to 64 Years | 240 (3.9%) | 472 (6.7%) |
| 65 to 74 Years | 164 (12.6%) | 323 (20.9%) |
| 75 Years and over | 108 (19.2%) | 290 (25.5%) |
Disability Class: Self-Care Difficulty
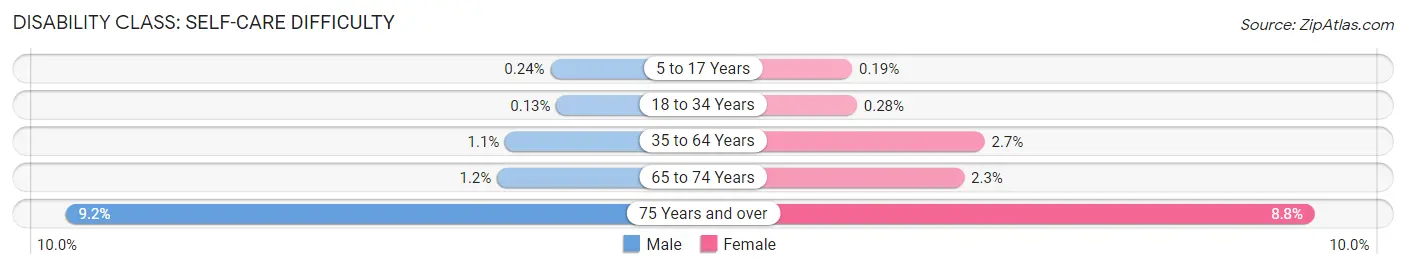
| Age Bracket | Male | Female |
| 5 to 17 Years | 9 (0.2%) | 7 (0.2%) |
| 18 to 34 Years | 5 (0.1%) | 10 (0.3%) |
| 35 to 64 Years | 66 (1.1%) | 187 (2.6%) |
| 65 to 74 Years | 16 (1.2%) | 35 (2.3%) |
| 75 Years and over | 52 (9.2%) | 100 (8.8%) |
Technology Access in Fuquay Varina
Computing Device Access in Fuquay Varina
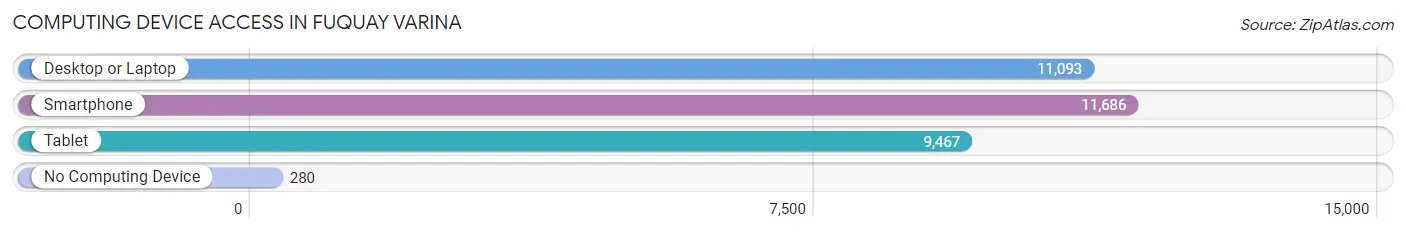
| Device Type | # Households | % Households |
| Desktop or Laptop | 11,093 | 89.1% |
| Smartphone | 11,686 | 93.9% |
| Tablet | 9,467 | 76.0% |
| No Computing Device | 280 | 2.2% |
| Total | 12,449 | 100.0% |
Internet Access in Fuquay Varina
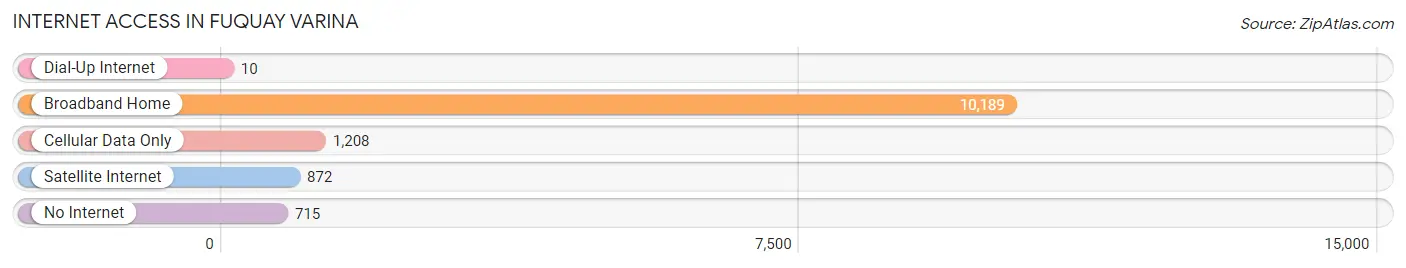
| Internet Type | # Households | % Households |
| Dial-Up Internet | 10 | 0.1% |
| Broadband Home | 10,189 | 81.9% |
| Cellular Data Only | 1,208 | 9.7% |
| Satellite Internet | 872 | 7.0% |
| No Internet | 715 | 5.7% |
| Total | 12,449 | 100.0% |
Fuquay Varina Summary
Fuquay Varina is a town located in Wake County, North Carolina. It is situated approximately 20 miles south of Raleigh, the state capital. The town was founded in 1858 and was named after two prominent families, the Fuquays and the Varinas. The town has a population of approximately 20,000 people and is part of the Research Triangle metropolitan area.
Geography
Fuquay Varina is located in the Piedmont region of North Carolina. The town is situated on the western edge of Wake County, near the border of Chatham County. The town is located at an elevation of approximately 300 feet above sea level. The town is situated on the banks of the Neuse River, which flows through the town. The town is surrounded by rolling hills and forests, and is located in a humid subtropical climate zone.
History
Fuquay Varina was founded in 1858 by two prominent families, the Fuquays and the Varinas. The town was originally known as Fuquay Springs, and was named after the Fuquay family. The Varina family later moved to the area and the town was renamed Fuquay Varina. The town was incorporated in 1876 and has since grown to become a thriving community.
Economy
Fuquay Varina is home to a variety of businesses and industries. The town is home to several large employers, including WakeMed Health & Hospitals, Wake County Public Schools, and the North Carolina Department of Transportation. The town is also home to several small businesses, including restaurants, retail stores, and professional services.
Demographics
As of the 2010 census, the population of Fuquay Varina was 19,983. The racial makeup of the town was 79.3% White, 11.3% African American, 0.4% Native American, 2.2% Asian, 0.1% Pacific Islander, 4.7% from other races, and 2.1% from two or more races. The median household income in the town was $60,945, and the median family income was $71,945.
Conclusion
Fuquay Varina is a small town located in Wake County, North Carolina. The town was founded in 1858 and has since grown to become a thriving community. The town is home to a variety of businesses and industries, and has a population of approximately 20,000 people. The town is situated on the banks of the Neuse River and is surrounded by rolling hills and forests. The town has a diverse population and a strong economy.
Common Questions
What is Per Capita Income in Fuquay Varina?
Per Capita income in Fuquay Varina is $39,817.
What is the Median Family Income in Fuquay Varina?
Median Family Income in Fuquay Varina is $115,215.
What is the Median Household income in Fuquay Varina?
Median Household Income in Fuquay Varina is $94,142.
What is Income or Wage Gap in Fuquay Varina?
Income or Wage Gap in Fuquay Varina is 19.8%.
Women in Fuquay Varina earn 80.2 cents for every dollar earned by a man.
What is Inequality or Gini Index in Fuquay Varina?
Inequality or Gini Index in Fuquay Varina is 0.39.
What is the Total Population of Fuquay Varina?
Total Population of Fuquay Varina is 35,428.
What is the Total Male Population of Fuquay Varina?
Total Male Population of Fuquay Varina is 16,905.
What is the Total Female Population of Fuquay Varina?
Total Female Population of Fuquay Varina is 18,523.
What is the Ratio of Males per 100 Females in Fuquay Varina?
There are 91.26 Males per 100 Females in Fuquay Varina.
What is the Ratio of Females per 100 Males in Fuquay Varina?
There are 109.57 Females per 100 Males in Fuquay Varina.
What is the Median Population Age in Fuquay Varina?
Median Population Age in Fuquay Varina is 35.3 Years.
What is the Average Family Size in Fuquay Varina
Average Family Size in Fuquay Varina is 3.3 People.
What is the Average Household Size in Fuquay Varina
Average Household Size in Fuquay Varina is 2.8 People.
How Large is the Labor Force in Fuquay Varina?
There are 17,827 People in the Labor Forcein in Fuquay Varina.
What is the Percentage of People in the Labor Force in Fuquay Varina?
68.1% of People are in the Labor Force in Fuquay Varina.
What is the Unemployment Rate in Fuquay Varina?
Unemployment Rate in Fuquay Varina is 3.4%.