Gastonia, NC Map & Demographics
Gastonia Map
Gastonia Overview
$31,832
PER CAPITA INCOME
$75,062
AVG FAMILY INCOME
$58,047
AVG HOUSEHOLD INCOME
24.3%
WAGE / INCOME GAP [ % ]
75.7¢/ $1
WAGE / INCOME GAP [ $ ]
$11,602
FAMILY INCOME DEFICIT
0.46
INEQUALITY / GINI INDEX
80,615
TOTAL POPULATION
38,852
MALE POPULATION
41,763
FEMALE POPULATION
93.03
MALES / 100 FEMALES
107.49
FEMALES / 100 MALES
37.8
MEDIAN AGE
3.2
AVG FAMILY SIZE
2.5
AVG HOUSEHOLD SIZE
40,321
LABOR FORCE [ PEOPLE ]
64.2%
PERCENT IN LABOR FORCE
5.6%
UNEMPLOYMENT RATE
Income in Gastonia
Income Overview in Gastonia
Per Capita Income in Gastonia is $31,832, while median incomes of families and households are $75,062 and $58,047 respectively.
| Characteristic | Number | Measure |
| Per Capita Income | 80,615 | $31,832 |
| Median Family Income | 19,560 | $75,062 |
| Mean Family Income | 19,560 | $93,902 |
| Median Household Income | 31,151 | $58,047 |
| Mean Household Income | 31,151 | $79,358 |
| Income Deficit | 19,560 | $11,602 |
| Wage / Income Gap (%) | 80,615 | 24.25% |
| Wage / Income Gap ($) | 80,615 | 75.75¢ per $1 |
| Gini / Inequality Index | 80,615 | 0.46 |
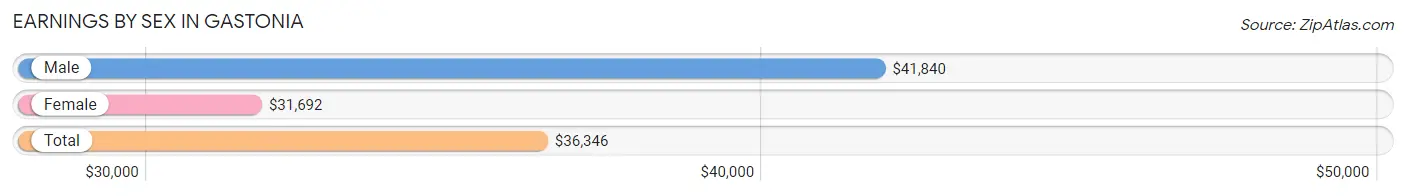
Earnings by Sex in Gastonia
Average Earnings in Gastonia are $36,346, $41,840 for men and $31,692 for women, a difference of 24.2%.
| Sex | Number | Average Earnings |
| Male | 20,699 (49.8%) | $41,840 |
| Female | 20,878 (50.2%) | $31,692 |
| Total | 41,577 (100.0%) | $36,346 |
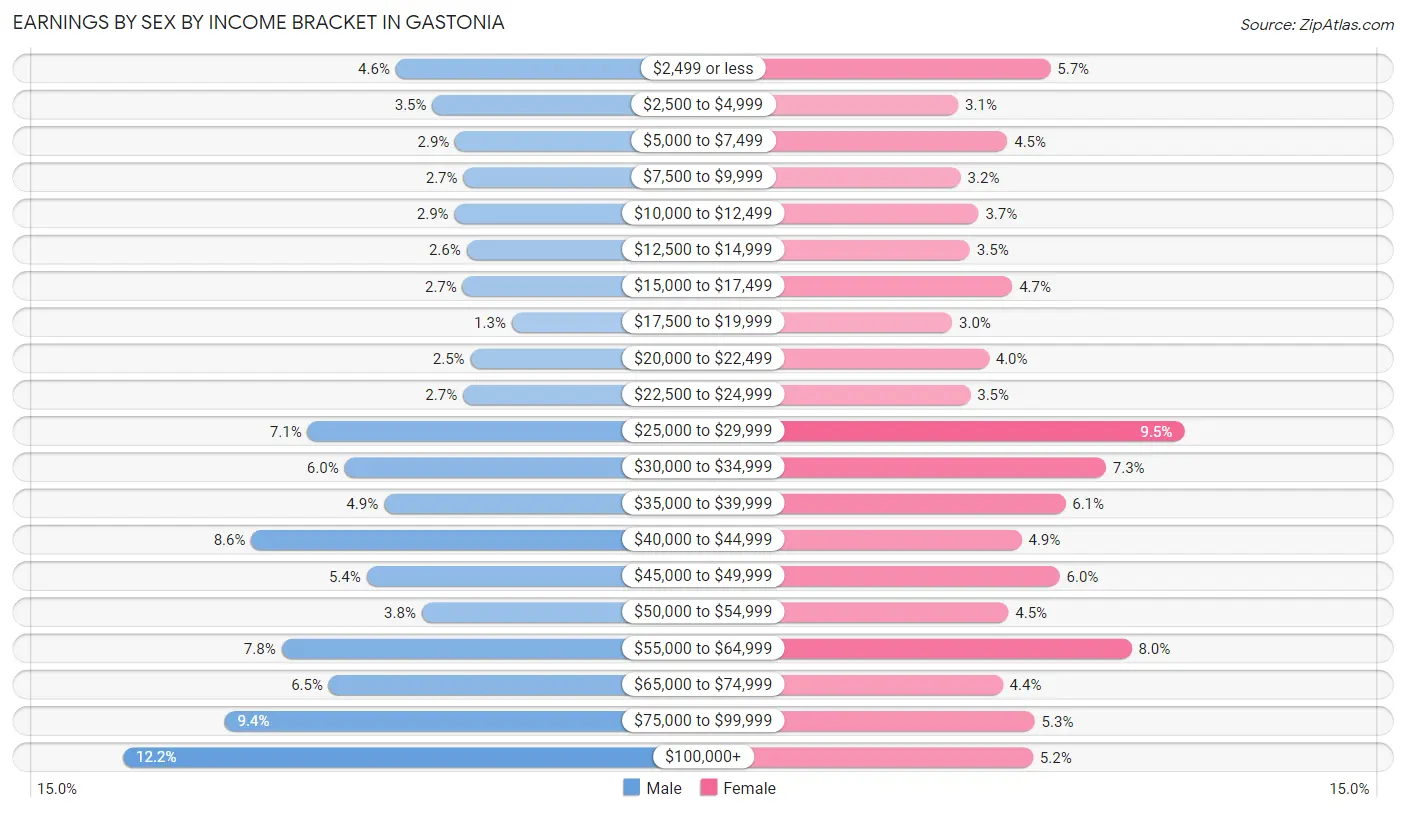
Earnings by Sex by Income Bracket in Gastonia
The most common earnings brackets in Gastonia are $100,000+ for men (2,532 | 12.2%) and $25,000 to $29,999 for women (1,980 | 9.5%).
| Income | Male | Female |
| $2,499 or less | 945 (4.6%) | 1,194 (5.7%) |
| $2,500 to $4,999 | 732 (3.5%) | 654 (3.1%) |
| $5,000 to $7,499 | 601 (2.9%) | 942 (4.5%) |
| $7,500 to $9,999 | 553 (2.7%) | 669 (3.2%) |
| $10,000 to $12,499 | 604 (2.9%) | 772 (3.7%) |
| $12,500 to $14,999 | 534 (2.6%) | 723 (3.5%) |
| $15,000 to $17,499 | 557 (2.7%) | 970 (4.6%) |
| $17,500 to $19,999 | 272 (1.3%) | 617 (3.0%) |
| $20,000 to $22,499 | 512 (2.5%) | 832 (4.0%) |
| $22,500 to $24,999 | 554 (2.7%) | 724 (3.5%) |
| $25,000 to $29,999 | 1,459 (7.0%) | 1,980 (9.5%) |
| $30,000 to $34,999 | 1,245 (6.0%) | 1,519 (7.3%) |
| $35,000 to $39,999 | 1,014 (4.9%) | 1,281 (6.1%) |
| $40,000 to $44,999 | 1,787 (8.6%) | 1,025 (4.9%) |
| $45,000 to $49,999 | 1,116 (5.4%) | 1,248 (6.0%) |
| $50,000 to $54,999 | 795 (3.8%) | 947 (4.5%) |
| $55,000 to $64,999 | 1,610 (7.8%) | 1,671 (8.0%) |
| $65,000 to $74,999 | 1,335 (6.5%) | 915 (4.4%) |
| $75,000 to $99,999 | 1,942 (9.4%) | 1,103 (5.3%) |
| $100,000+ | 2,532 (12.2%) | 1,092 (5.2%) |
| Total | 20,699 (100.0%) | 20,878 (100.0%) |
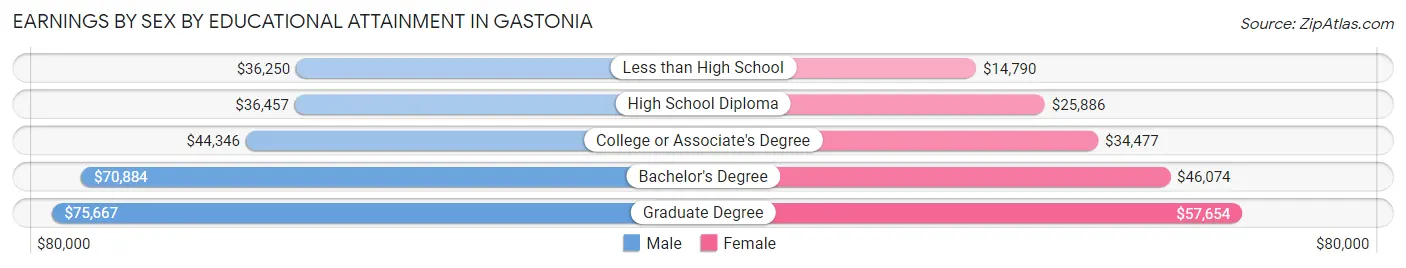
Earnings by Sex by Educational Attainment in Gastonia
Average earnings in Gastonia are $46,378 for men and $35,152 for women, a difference of 24.2%. Men with an educational attainment of graduate degree enjoy the highest average annual earnings of $75,667, while those with less than high school education earn the least with $36,250. Women with an educational attainment of graduate degree earn the most with the average annual earnings of $57,654, while those with less than high school education have the smallest earnings of $14,790.
| Educational Attainment | Male Income | Female Income |
| Less than High School | $36,250 | $14,790 |
| High School Diploma | $36,457 | $25,886 |
| College or Associate's Degree | $44,346 | $34,477 |
| Bachelor's Degree | $70,884 | $46,074 |
| Graduate Degree | $75,667 | $57,654 |
| Total | $46,378 | $35,152 |
Family Income in Gastonia
Family Income Brackets in Gastonia
According to the Gastonia family income data, there are 3,775 families falling into the $100,000 to $149,999 income range, which is the most common income bracket and makes up 19.3% of all families. Conversely, the $10,000 to $14,999 income bracket is the least frequent group with only 352 families (1.8%) belonging to this category.
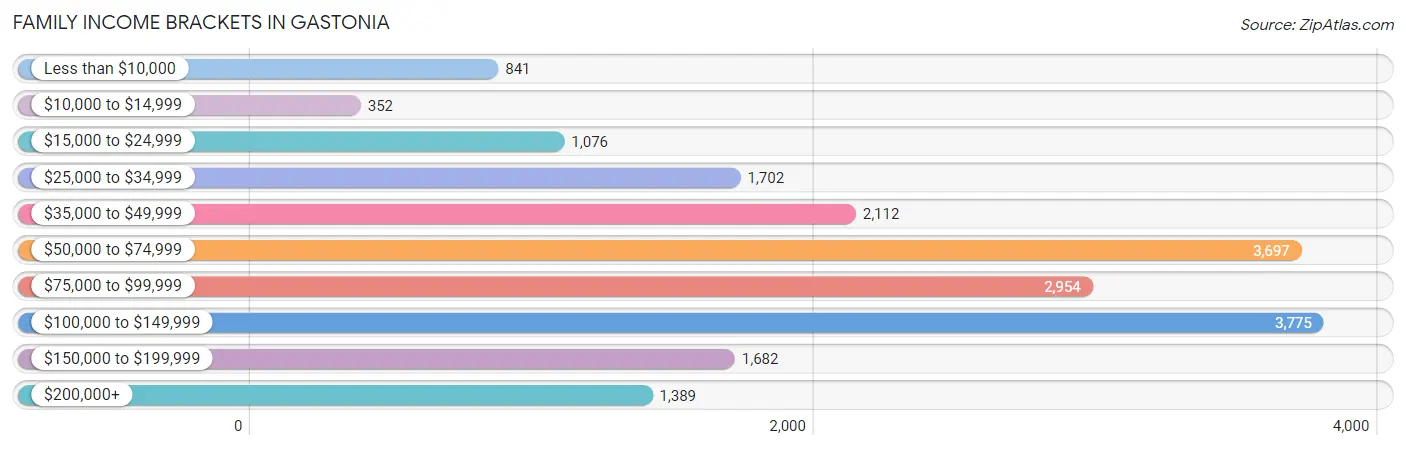
| Income Bracket | # Families | % Families |
| Less than $10,000 | 841 | 4.3% |
| $10,000 to $14,999 | 352 | 1.8% |
| $15,000 to $24,999 | 1,076 | 5.5% |
| $25,000 to $34,999 | 1,702 | 8.7% |
| $35,000 to $49,999 | 2,112 | 10.8% |
| $50,000 to $74,999 | 3,697 | 18.9% |
| $75,000 to $99,999 | 2,954 | 15.1% |
| $100,000 to $149,999 | 3,775 | 19.3% |
| $150,000 to $199,999 | 1,682 | 8.6% |
| $200,000+ | 1,389 | 7.1% |
Family Income by Famaliy Size in Gastonia
5-person families (1,531 | 7.8%) account for the highest median family income in Gastonia with $110,880 per family, while 2-person families (8,560 | 43.8%) have the highest median income of $34,222 per family member.
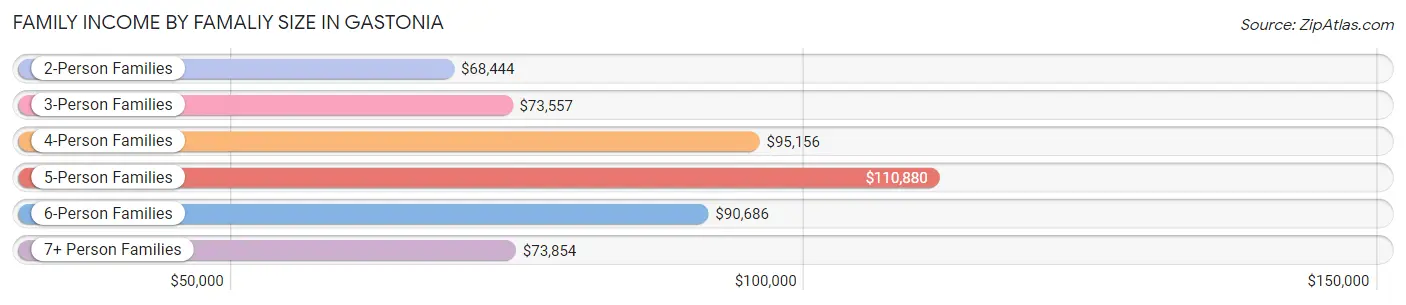
| Income Bracket | # Families | Median Income |
| 2-Person Families | 8,560 (43.8%) | $68,444 |
| 3-Person Families | 5,644 (28.8%) | $73,557 |
| 4-Person Families | 2,934 (15.0%) | $95,156 |
| 5-Person Families | 1,531 (7.8%) | $110,880 |
| 6-Person Families | 614 (3.1%) | $90,686 |
| 7+ Person Families | 277 (1.4%) | $73,854 |
| Total | 19,560 (100.0%) | $75,062 |
Family Income by Number of Earners in Gastonia
The median family income in Gastonia is $75,062, with families comprising 3+ earners (2,049) having the highest median family income of $115,253, while families with no earners (2,456) have the lowest median family income of $40,315, accounting for 10.5% and 12.6% of families, respectively.
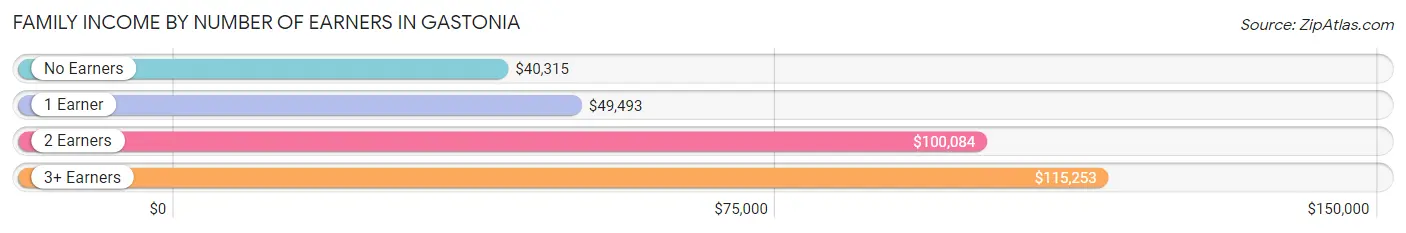
| Number of Earners | # Families | Median Income |
| No Earners | 2,456 (12.6%) | $40,315 |
| 1 Earner | 6,865 (35.1%) | $49,493 |
| 2 Earners | 8,190 (41.9%) | $100,084 |
| 3+ Earners | 2,049 (10.5%) | $115,253 |
| Total | 19,560 (100.0%) | $75,062 |
Household Income in Gastonia
Household Income Brackets in Gastonia
With 5,420 households falling in the category, the $50,000 to $74,999 income range is the most frequent in Gastonia, accounting for 17.4% of all households. In contrast, only 1,620 households (5.2%) fall into the $200,000+ income bracket, making it the least populous group.
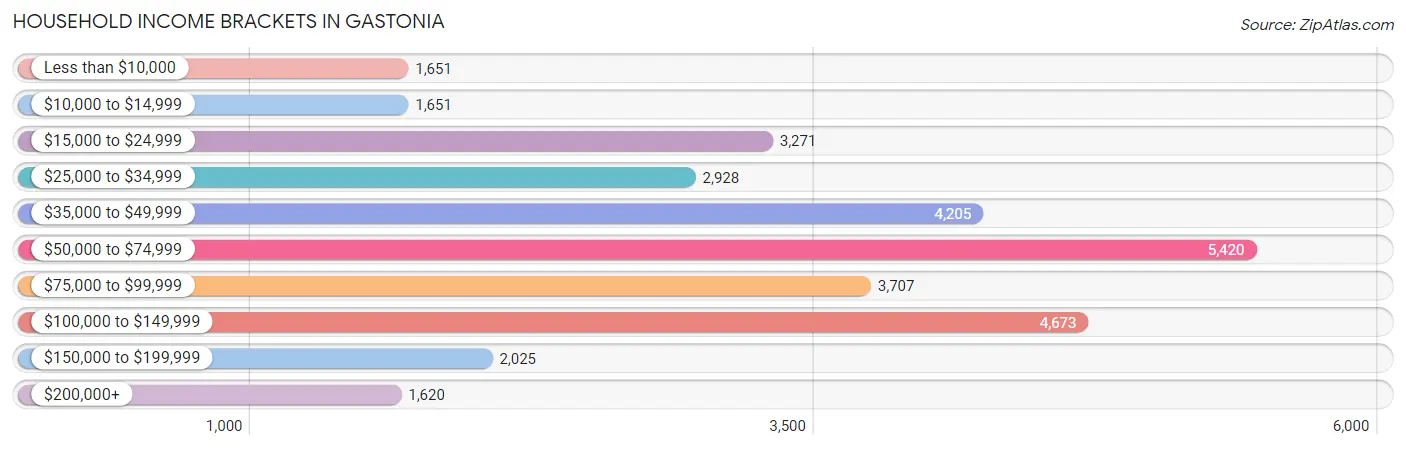
| Income Bracket | # Households | % Households |
| Less than $10,000 | 1,651 | 5.3% |
| $10,000 to $14,999 | 1,651 | 5.3% |
| $15,000 to $24,999 | 3,271 | 10.5% |
| $25,000 to $34,999 | 2,928 | 9.4% |
| $35,000 to $49,999 | 4,205 | 13.5% |
| $50,000 to $74,999 | 5,420 | 17.4% |
| $75,000 to $99,999 | 3,707 | 11.9% |
| $100,000 to $149,999 | 4,673 | 15.0% |
| $150,000 to $199,999 | 2,025 | 6.5% |
| $200,000+ | 1,620 | 5.2% |
Household Income by Householder Age in Gastonia
The median household income in Gastonia is $58,047, with the highest median household income of $65,810 found in the 45 to 64 years age bracket for the primary householder. A total of 11,291 households (36.2%) fall into this category. Meanwhile, the 15 to 24 years age bracket for the primary householder has the lowest median household income of $31,844, with 1,307 households (4.2%) in this group.
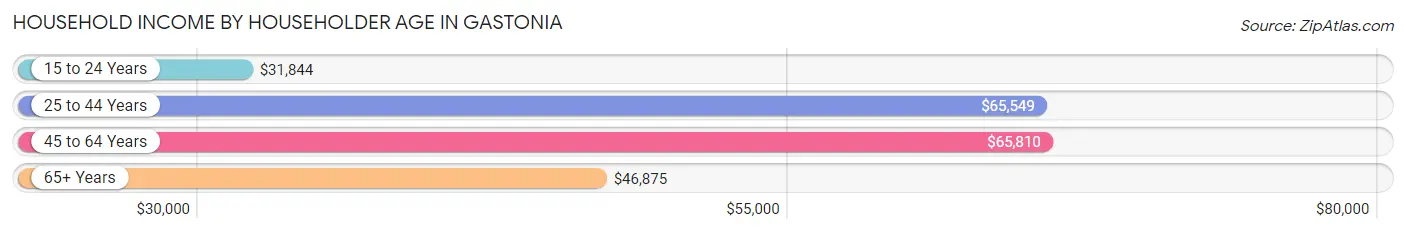
| Income Bracket | # Households | Median Income |
| 15 to 24 Years | 1,307 (4.2%) | $31,844 |
| 25 to 44 Years | 10,690 (34.3%) | $65,549 |
| 45 to 64 Years | 11,291 (36.2%) | $65,810 |
| 65+ Years | 7,863 (25.2%) | $46,875 |
| Total | 31,151 (100.0%) | $58,047 |
Poverty in Gastonia
Income Below Poverty by Sex and Age in Gastonia
With 13.6% poverty level for males and 15.9% for females among the residents of Gastonia, under 5 year old males and under 5 year old females are the most vulnerable to poverty, with 828 males (29.4%) and 576 females (25.8%) in their respective age groups living below the poverty level.
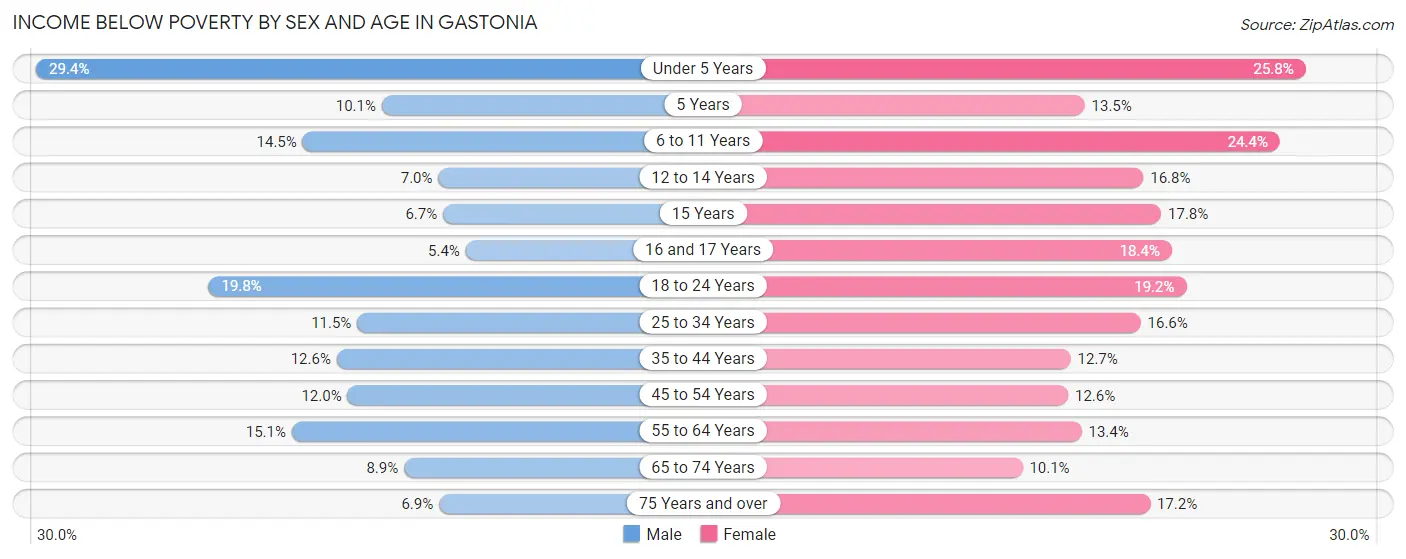
| Age Bracket | Male | Female |
| Under 5 Years | 828 (29.4%) | 576 (25.8%) |
| 5 Years | 65 (10.1%) | 63 (13.5%) |
| 6 to 11 Years | 512 (14.5%) | 675 (24.4%) |
| 12 to 14 Years | 118 (7.0%) | 302 (16.8%) |
| 15 Years | 27 (6.7%) | 112 (17.8%) |
| 16 and 17 Years | 69 (5.4%) | 162 (18.4%) |
| 18 to 24 Years | 663 (19.8%) | 712 (19.2%) |
| 25 to 34 Years | 580 (11.5%) | 942 (16.6%) |
| 35 to 44 Years | 586 (12.6%) | 709 (12.7%) |
| 45 to 54 Years | 609 (12.0%) | 661 (12.6%) |
| 55 to 64 Years | 672 (15.1%) | 652 (13.4%) |
| 65 to 74 Years | 272 (8.9%) | 414 (10.1%) |
| 75 Years and over | 130 (6.9%) | 474 (17.2%) |
| Total | 5,131 (13.6%) | 6,454 (15.9%) |
Income Above Poverty by Sex and Age in Gastonia
According to the poverty statistics in Gastonia, males aged 16 and 17 years and females aged 65 to 74 years are the age groups that are most secure financially, with 94.6% of males and 89.9% of females in these age groups living above the poverty line.
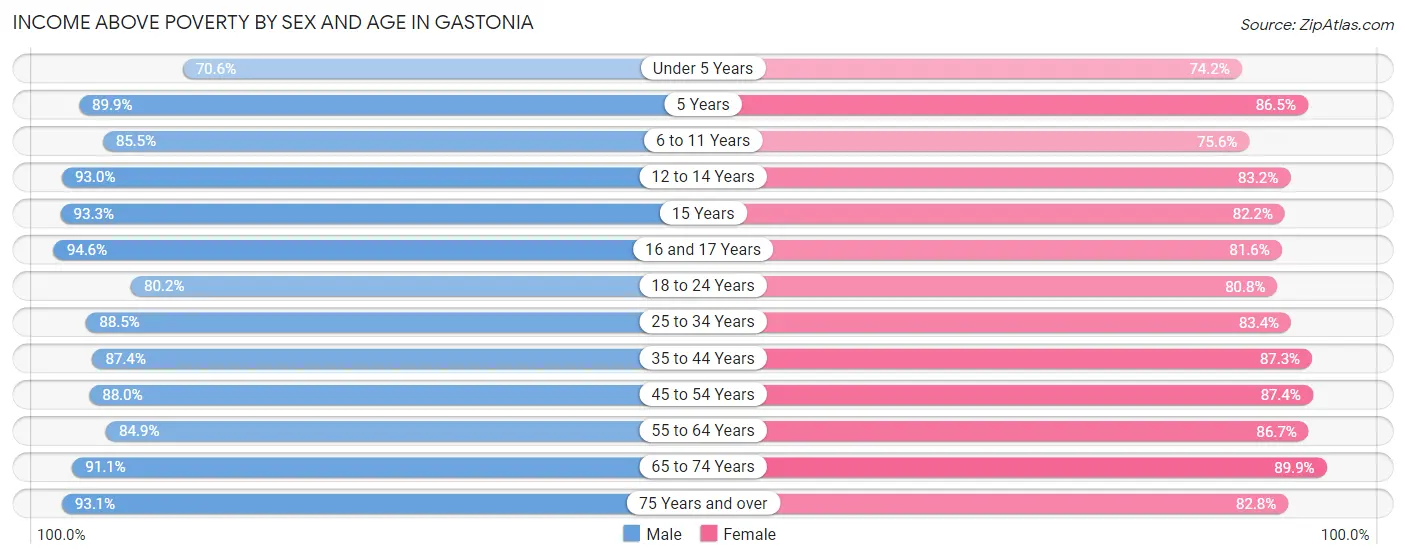
| Age Bracket | Male | Female |
| Under 5 Years | 1,992 (70.6%) | 1,655 (74.2%) |
| 5 Years | 578 (89.9%) | 403 (86.5%) |
| 6 to 11 Years | 3,014 (85.5%) | 2,092 (75.6%) |
| 12 to 14 Years | 1,578 (93.0%) | 1,497 (83.2%) |
| 15 Years | 376 (93.3%) | 518 (82.2%) |
| 16 and 17 Years | 1,199 (94.6%) | 720 (81.6%) |
| 18 to 24 Years | 2,692 (80.2%) | 3,000 (80.8%) |
| 25 to 34 Years | 4,471 (88.5%) | 4,719 (83.4%) |
| 35 to 44 Years | 4,059 (87.4%) | 4,857 (87.3%) |
| 45 to 54 Years | 4,458 (88.0%) | 4,587 (87.4%) |
| 55 to 64 Years | 3,773 (84.9%) | 4,231 (86.7%) |
| 65 to 74 Years | 2,794 (91.1%) | 3,700 (89.9%) |
| 75 Years and over | 1,748 (93.1%) | 2,289 (82.8%) |
| Total | 32,732 (86.5%) | 34,268 (84.2%) |
Income Below Poverty Among Married-Couple Families in Gastonia
The poverty statistics for married-couple families in Gastonia show that 4.5% or 576 of the total 12,807 families live below the poverty line. Families with 3 or 4 children have the highest poverty rate of 12.0%, comprising of 116 families. On the other hand, families with 5 or more children have the lowest poverty rate of 0.0%, which includes 0 families.
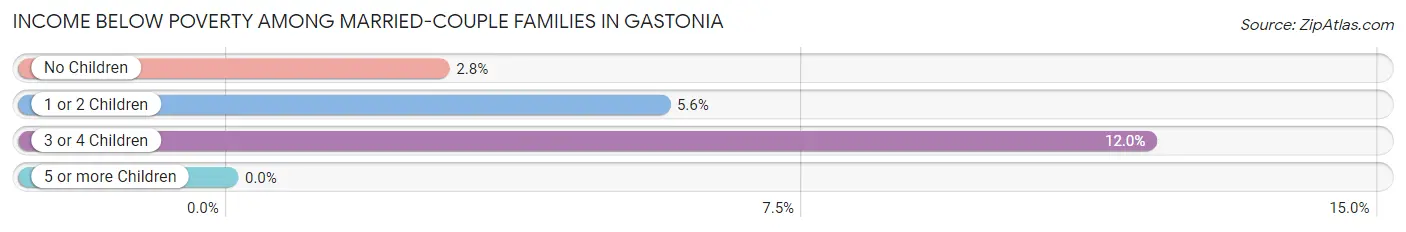
| Children | Above Poverty | Below Poverty |
| No Children | 6,936 (97.2%) | 197 (2.8%) |
| 1 or 2 Children | 4,397 (94.4%) | 263 (5.6%) |
| 3 or 4 Children | 851 (88.0%) | 116 (12.0%) |
| 5 or more Children | 47 (100.0%) | 0 (0.0%) |
| Total | 12,231 (95.5%) | 576 (4.5%) |
Income Below Poverty Among Single-Parent Households in Gastonia
According to the poverty data in Gastonia, 18.9% or 383 single-father households and 22.6% or 1,066 single-mother households are living below the poverty line. Among single-father households, those with 3 or 4 children have the highest poverty rate, with 60 households (34.3%) experiencing poverty. Likewise, among single-mother households, those with 5 or more children have the highest poverty rate, with 53 households (44.2%) falling below the poverty line.
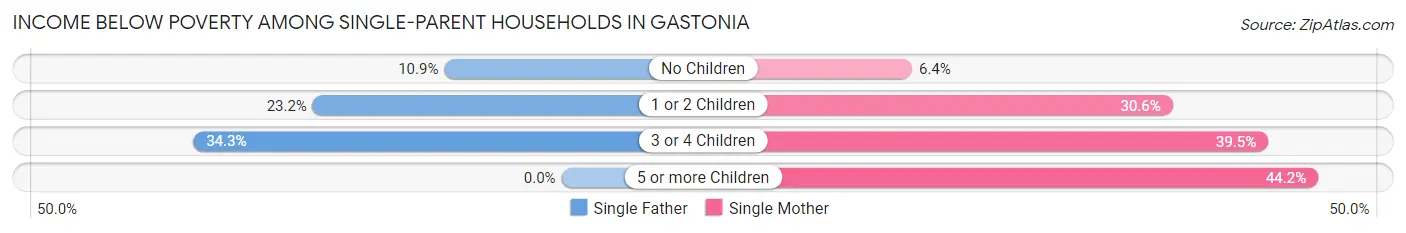
| Children | Single Father | Single Mother |
| No Children | 95 (10.9%) | 112 (6.4%) |
| 1 or 2 Children | 228 (23.2%) | 769 (30.6%) |
| 3 or 4 Children | 60 (34.3%) | 132 (39.5%) |
| 5 or more Children | 0 (0.0%) | 53 (44.2%) |
| Total | 383 (18.9%) | 1,066 (22.6%) |
Income Below Poverty Among Married-Couple vs Single-Parent Households in Gastonia
The poverty data for Gastonia shows that 576 of the married-couple family households (4.5%) and 1,449 of the single-parent households (21.5%) are living below the poverty level. Within the married-couple family households, those with 3 or 4 children have the highest poverty rate, with 116 households (12.0%) falling below the poverty line. Among the single-parent households, those with 5 or more children have the highest poverty rate, with 53 household (44.2%) living below poverty.
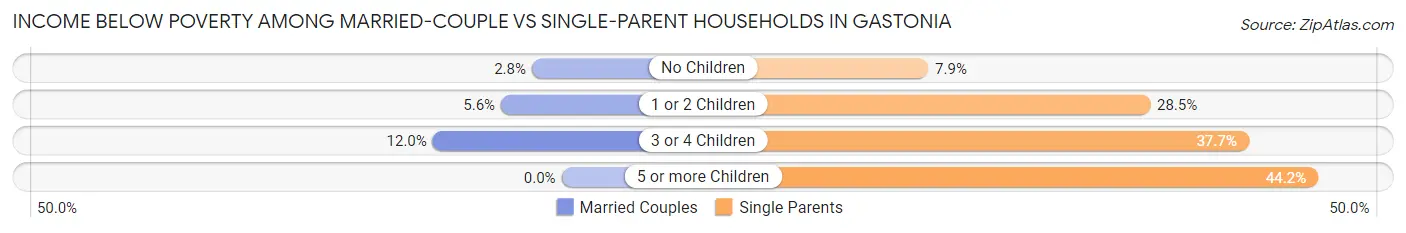
| Children | Married-Couple Families | Single-Parent Households |
| No Children | 197 (2.8%) | 207 (7.9%) |
| 1 or 2 Children | 263 (5.6%) | 997 (28.5%) |
| 3 or 4 Children | 116 (12.0%) | 192 (37.7%) |
| 5 or more Children | 0 (0.0%) | 53 (44.2%) |
| Total | 576 (4.5%) | 1,449 (21.5%) |
Race in Gastonia
The most populous races in Gastonia are White / Caucasian (46,897 | 58.2%), Black / African American (24,031 | 29.8%), and Hispanic or Latino (8,414 | 10.4%).
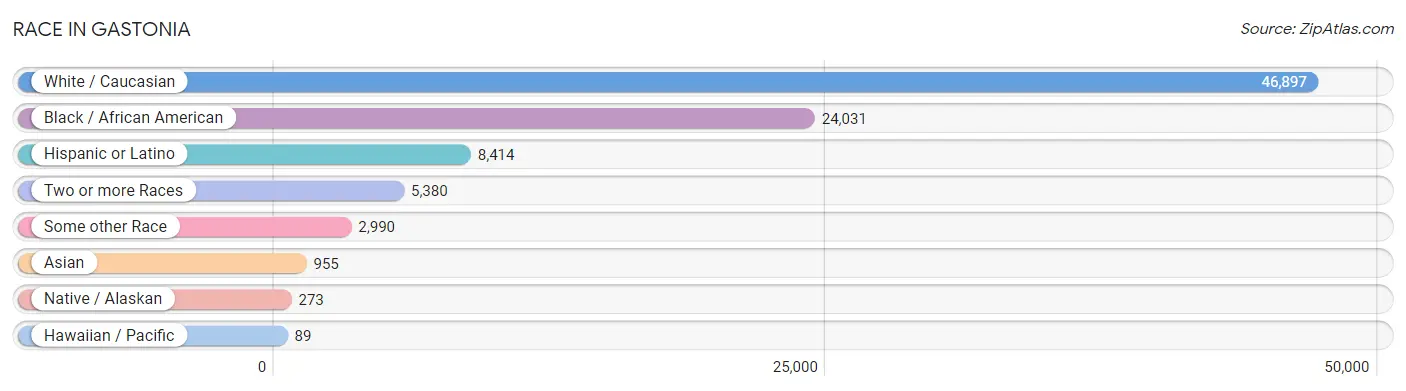
| Race | # Population | % Population |
| Asian | 955 | 1.2% |
| Black / African American | 24,031 | 29.8% |
| Hawaiian / Pacific | 89 | 0.1% |
| Hispanic or Latino | 8,414 | 10.4% |
| Native / Alaskan | 273 | 0.3% |
| White / Caucasian | 46,897 | 58.2% |
| Two or more Races | 5,380 | 6.7% |
| Some other Race | 2,990 | 3.7% |
| Total | 80,615 | 100.0% |
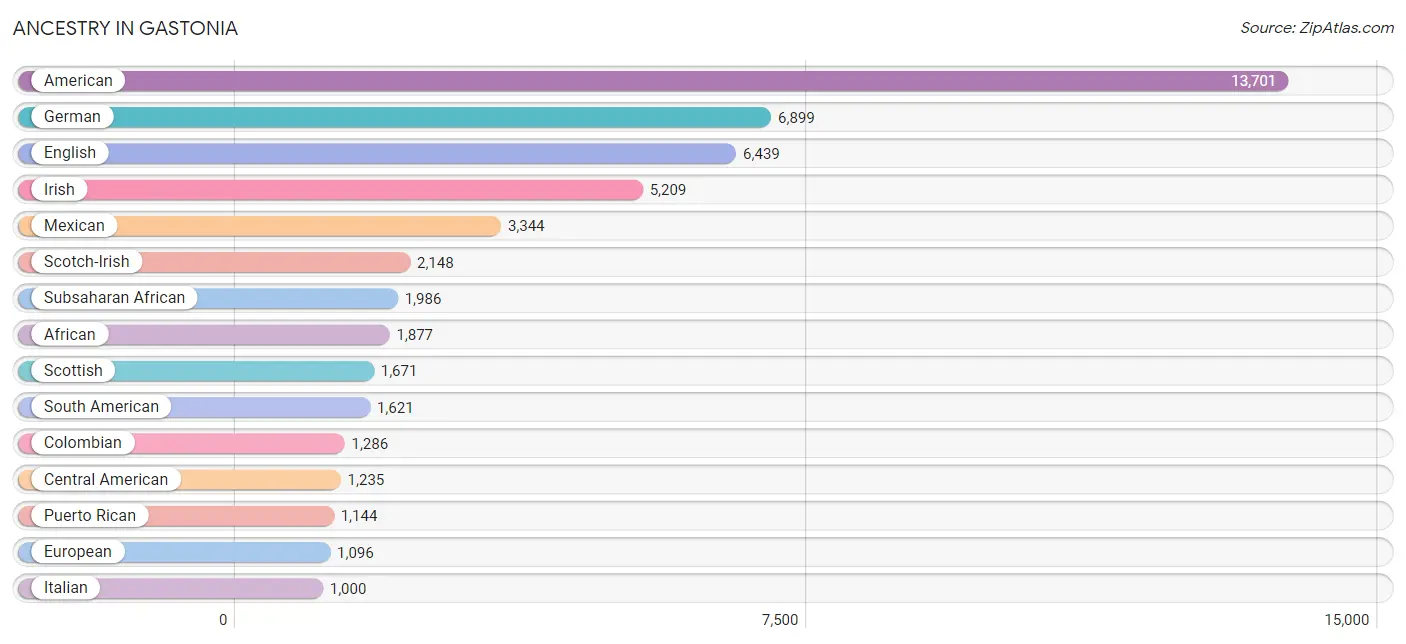
Ancestry in Gastonia
The most populous ancestries reported in Gastonia are American (13,701 | 17.0%), German (6,899 | 8.6%), English (6,439 | 8.0%), Irish (5,209 | 6.5%), and Mexican (3,344 | 4.2%), together accounting for 44.2% of all Gastonia residents.
| Ancestry | # Population | % Population |
| Afghan | 20 | 0.0% |
| African | 1,877 | 2.3% |
| American | 13,701 | 17.0% |
| Apache | 18 | 0.0% |
| Arab | 177 | 0.2% |
| Argentinean | 13 | 0.0% |
| Armenian | 41 | 0.1% |
| Australian | 15 | 0.0% |
| Austrian | 17 | 0.0% |
| Bahamian | 26 | 0.0% |
| Belgian | 15 | 0.0% |
| Bhutanese | 97 | 0.1% |
| Blackfeet | 30 | 0.0% |
| British | 501 | 0.6% |
| Bulgarian | 46 | 0.1% |
| Burmese | 136 | 0.2% |
| Canadian | 50 | 0.1% |
| Central American | 1,235 | 1.5% |
| Central American Indian | 58 | 0.1% |
| Cherokee | 128 | 0.2% |
| Chilean | 136 | 0.2% |
| Choctaw | 21 | 0.0% |
| Colombian | 1,286 | 1.6% |
| Creek | 19 | 0.0% |
| Croatian | 8 | 0.0% |
| Cuban | 54 | 0.1% |
| Czech | 35 | 0.0% |
| Czechoslovakian | 6 | 0.0% |
| Danish | 39 | 0.1% |
| Delaware | 55 | 0.1% |
| Dominican | 348 | 0.4% |
| Dutch | 686 | 0.9% |
| Eastern European | 40 | 0.1% |
| Ecuadorian | 113 | 0.1% |
| Egyptian | 47 | 0.1% |
| English | 6,439 | 8.0% |
| European | 1,096 | 1.4% |
| Finnish | 35 | 0.0% |
| French | 982 | 1.2% |
| French Canadian | 97 | 0.1% |
| German | 6,899 | 8.6% |
| Ghanaian | 40 | 0.1% |
| Greek | 216 | 0.3% |
| Guamanian / Chamorro | 6 | 0.0% |
| Guatemalan | 94 | 0.1% |
| Guyanese | 89 | 0.1% |
| Haitian | 281 | 0.4% |
| Honduran | 302 | 0.4% |
| Hungarian | 70 | 0.1% |
| Indian (Asian) | 219 | 0.3% |
| Inupiat | 2 | 0.0% |
| Irish | 5,209 | 6.5% |
| Israeli | 10 | 0.0% |
| Italian | 1,000 | 1.2% |
| Jamaican | 288 | 0.4% |
| Jordanian | 48 | 0.1% |
| Kenyan | 48 | 0.1% |
| Korean | 184 | 0.2% |
| Laotian | 12 | 0.0% |
| Lebanese | 53 | 0.1% |
| Lithuanian | 35 | 0.0% |
| Lumbee | 130 | 0.2% |
| Malaysian | 84 | 0.1% |
| Mexican | 3,344 | 4.2% |
| Mongolian | 9 | 0.0% |
| Moroccan | 5 | 0.0% |
| Native Hawaiian | 6 | 0.0% |
| Navajo | 17 | 0.0% |
| Nicaraguan | 312 | 0.4% |
| Nigerian | 33 | 0.0% |
| Northern European | 185 | 0.2% |
| Norwegian | 152 | 0.2% |
| Pakistani | 49 | 0.1% |
| Palestinian | 13 | 0.0% |
| Panamanian | 27 | 0.0% |
| Peruvian | 23 | 0.0% |
| Polish | 777 | 1.0% |
| Portuguese | 10 | 0.0% |
| Potawatomi | 5 | 0.0% |
| Puerto Rican | 1,144 | 1.4% |
| Romanian | 14 | 0.0% |
| Russian | 77 | 0.1% |
| Salvadoran | 500 | 0.6% |
| Samoan | 6 | 0.0% |
| Scandinavian | 257 | 0.3% |
| Scotch-Irish | 2,148 | 2.7% |
| Scottish | 1,671 | 2.1% |
| Shoshone | 4 | 0.0% |
| Slovak | 46 | 0.1% |
| South American | 1,621 | 2.0% |
| Spanish | 152 | 0.2% |
| Sri Lankan | 173 | 0.2% |
| Subsaharan African | 1,986 | 2.5% |
| Swedish | 95 | 0.1% |
| Swiss | 220 | 0.3% |
| Syrian | 5 | 0.0% |
| Thai | 429 | 0.5% |
| Trinidadian and Tobagonian | 75 | 0.1% |
| Turkish | 58 | 0.1% |
| Ukrainian | 27 | 0.0% |
| Uruguayan | 11 | 0.0% |
| Venezuelan | 39 | 0.1% |
| Welsh | 119 | 0.2% |
| West Indian | 178 | 0.2% | View All 104 Rows |
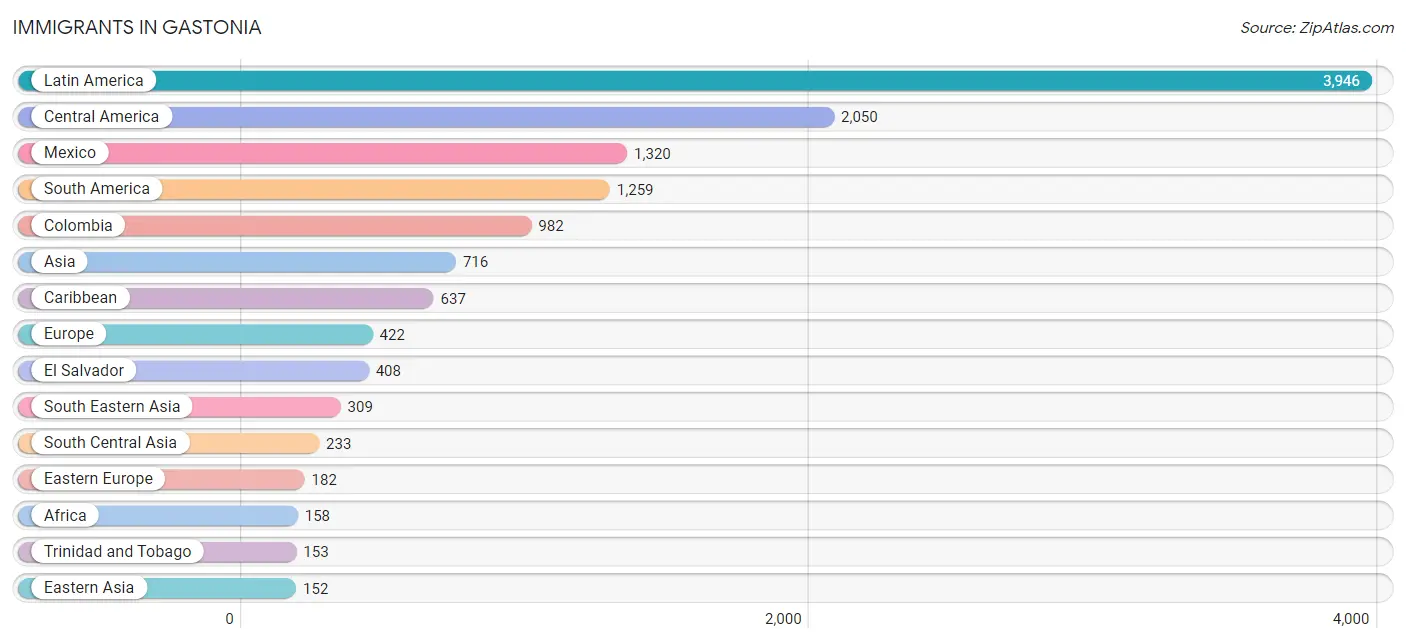
Immigrants in Gastonia
The most numerous immigrant groups reported in Gastonia came from Latin America (3,946 | 4.9%), Central America (2,050 | 2.5%), Mexico (1,320 | 1.6%), South America (1,259 | 1.6%), and Colombia (982 | 1.2%), together accounting for 11.9% of all Gastonia residents.
| Immigration Origin | # Population | % Population |
| Afghanistan | 13 | 0.0% |
| Africa | 158 | 0.2% |
| Argentina | 20 | 0.0% |
| Asia | 716 | 0.9% |
| Australia | 6 | 0.0% |
| Austria | 9 | 0.0% |
| Bahamas | 19 | 0.0% |
| Belgium | 7 | 0.0% |
| Bulgaria | 46 | 0.1% |
| Canada | 51 | 0.1% |
| Caribbean | 637 | 0.8% |
| Central America | 2,050 | 2.5% |
| Chile | 118 | 0.2% |
| China | 65 | 0.1% |
| Colombia | 982 | 1.2% |
| Costa Rica | 29 | 0.0% |
| Cuba | 48 | 0.1% |
| Czechoslovakia | 26 | 0.0% |
| Dominican Republic | 118 | 0.2% |
| Eastern Africa | 87 | 0.1% |
| Eastern Asia | 152 | 0.2% |
| Eastern Europe | 182 | 0.2% |
| Ecuador | 91 | 0.1% |
| Egypt | 8 | 0.0% |
| El Salvador | 408 | 0.5% |
| England | 115 | 0.1% |
| Europe | 422 | 0.5% |
| Germany | 45 | 0.1% |
| Ghana | 32 | 0.0% |
| Guatemala | 63 | 0.1% |
| Guyana | 19 | 0.0% |
| Haiti | 124 | 0.2% |
| Honduras | 140 | 0.2% |
| Hong Kong | 3 | 0.0% |
| India | 140 | 0.2% |
| Israel | 10 | 0.0% |
| Italy | 21 | 0.0% |
| Jamaica | 108 | 0.1% |
| Japan | 51 | 0.1% |
| Kenya | 48 | 0.1% |
| Korea | 36 | 0.0% |
| Laos | 66 | 0.1% |
| Latin America | 3,946 | 4.9% |
| Malaysia | 9 | 0.0% |
| Mexico | 1,320 | 1.6% |
| Middle Africa | 8 | 0.0% |
| Nicaragua | 90 | 0.1% |
| Nigeria | 8 | 0.0% |
| Northern Africa | 8 | 0.0% |
| Northern Europe | 150 | 0.2% |
| Oceania | 20 | 0.0% |
| Pakistan | 68 | 0.1% |
| Peru | 6 | 0.0% |
| Philippines | 124 | 0.2% |
| Poland | 98 | 0.1% |
| Portugal | 8 | 0.0% |
| Russia | 12 | 0.0% |
| Saudi Arabia | 12 | 0.0% |
| South Africa | 9 | 0.0% |
| South America | 1,259 | 1.6% |
| South Central Asia | 233 | 0.3% |
| South Eastern Asia | 309 | 0.4% |
| Southern Europe | 29 | 0.0% |
| Sri Lanka | 12 | 0.0% |
| Taiwan | 13 | 0.0% |
| Trinidad and Tobago | 153 | 0.2% |
| Venezuela | 23 | 0.0% |
| Vietnam | 110 | 0.1% |
| West Indies | 67 | 0.1% |
| Western Africa | 46 | 0.1% |
| Western Asia | 22 | 0.0% |
| Western Europe | 61 | 0.1% |
| Zaire | 8 | 0.0% |
| Zimbabwe | 39 | 0.1% | View All 74 Rows |
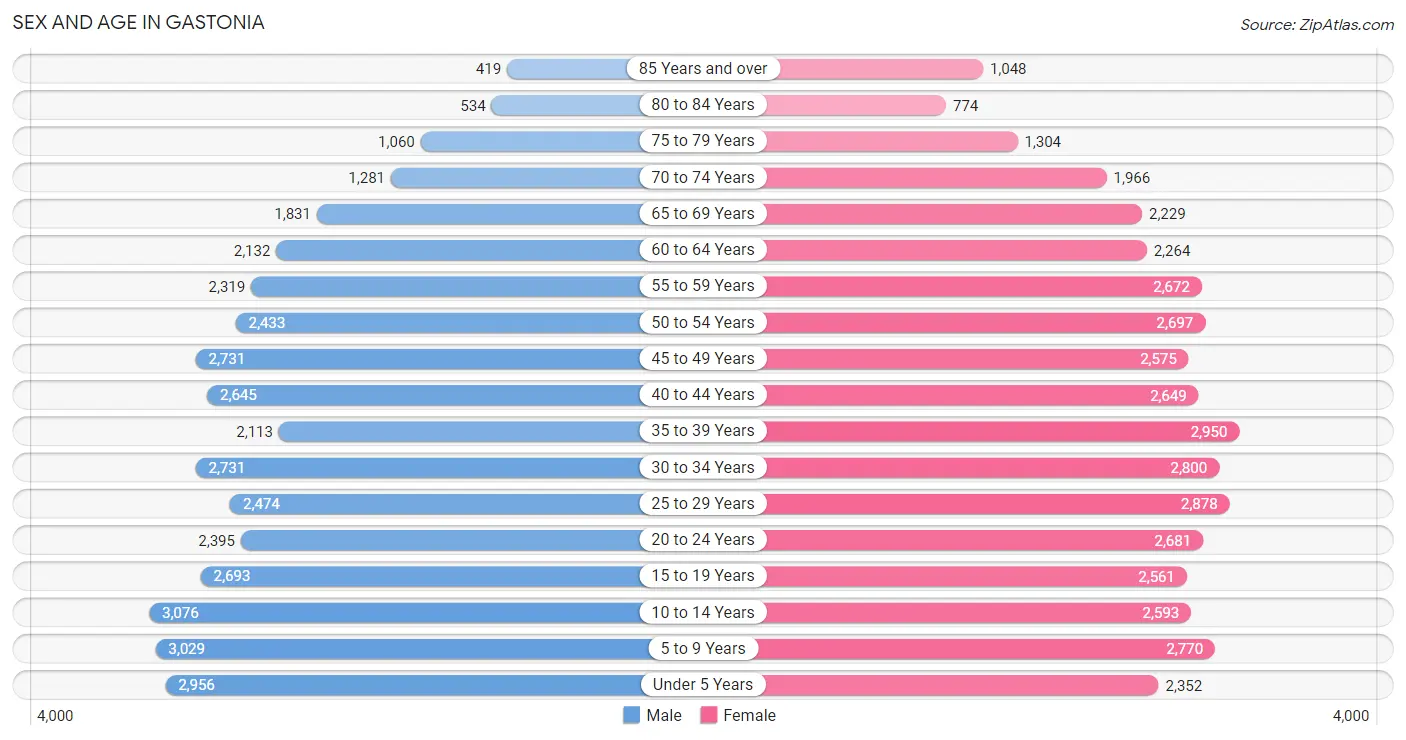
Sex and Age in Gastonia
Sex and Age in Gastonia
The most populous age groups in Gastonia are 10 to 14 Years (3,076 | 7.9%) for men and 35 to 39 Years (2,950 | 7.1%) for women.
| Age Bracket | Male | Female |
| Under 5 Years | 2,956 (7.6%) | 2,352 (5.6%) |
| 5 to 9 Years | 3,029 (7.8%) | 2,770 (6.6%) |
| 10 to 14 Years | 3,076 (7.9%) | 2,593 (6.2%) |
| 15 to 19 Years | 2,693 (6.9%) | 2,561 (6.1%) |
| 20 to 24 Years | 2,395 (6.2%) | 2,681 (6.4%) |
| 25 to 29 Years | 2,474 (6.4%) | 2,878 (6.9%) |
| 30 to 34 Years | 2,731 (7.0%) | 2,800 (6.7%) |
| 35 to 39 Years | 2,113 (5.4%) | 2,950 (7.1%) |
| 40 to 44 Years | 2,645 (6.8%) | 2,649 (6.3%) |
| 45 to 49 Years | 2,731 (7.0%) | 2,575 (6.2%) |
| 50 to 54 Years | 2,433 (6.3%) | 2,697 (6.5%) |
| 55 to 59 Years | 2,319 (6.0%) | 2,672 (6.4%) |
| 60 to 64 Years | 2,132 (5.5%) | 2,264 (5.4%) |
| 65 to 69 Years | 1,831 (4.7%) | 2,229 (5.3%) |
| 70 to 74 Years | 1,281 (3.3%) | 1,966 (4.7%) |
| 75 to 79 Years | 1,060 (2.7%) | 1,304 (3.1%) |
| 80 to 84 Years | 534 (1.4%) | 774 (1.8%) |
| 85 Years and over | 419 (1.1%) | 1,048 (2.5%) |
| Total | 38,852 (100.0%) | 41,763 (100.0%) |
Families and Households in Gastonia
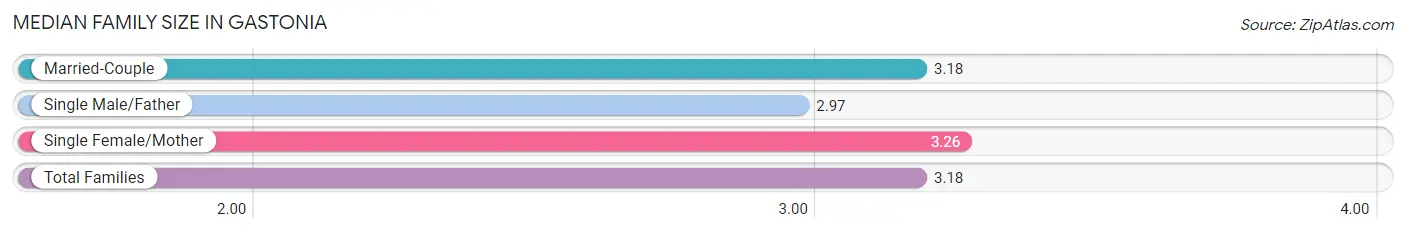
Median Family Size in Gastonia
The median family size in Gastonia is 3.18 persons per family, with single female/mother families (4,724 | 24.1%) accounting for the largest median family size of 3.26 persons per family. On the other hand, single male/father families (2,029 | 10.4%) represent the smallest median family size with 2.97 persons per family.
| Family Type | # Families | Family Size |
| Married-Couple | 12,807 (65.5%) | 3.18 |
| Single Male/Father | 2,029 (10.4%) | 2.97 |
| Single Female/Mother | 4,724 (24.1%) | 3.26 |
| Total Families | 19,560 (100.0%) | 3.18 |
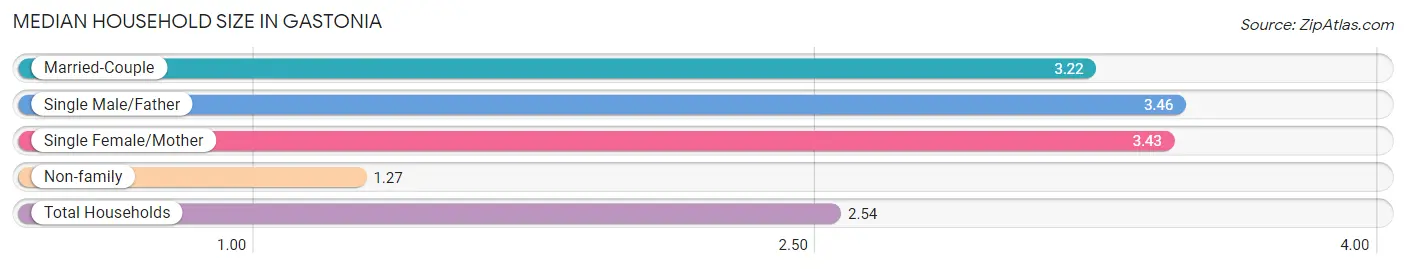
Median Household Size in Gastonia
The median household size in Gastonia is 2.54 persons per household, with single male/father households (2,029 | 6.5%) accounting for the largest median household size of 3.46 persons per household. non-family households (11,591 | 37.2%) represent the smallest median household size with 1.27 persons per household.
| Household Type | # Households | Household Size |
| Married-Couple | 12,807 (41.1%) | 3.22 |
| Single Male/Father | 2,029 (6.5%) | 3.46 |
| Single Female/Mother | 4,724 (15.2%) | 3.43 |
| Non-family | 11,591 (37.2%) | 1.27 |
| Total Households | 31,151 (100.0%) | 2.54 |
Household Size by Marriage Status in Gastonia
Out of a total of 31,151 households in Gastonia, 19,560 (62.8%) are family households, while 11,591 (37.2%) are nonfamily households. The most numerous type of family households are 2-person households, comprising 7,864, and the most common type of nonfamily households are 1-person households, comprising 9,284.
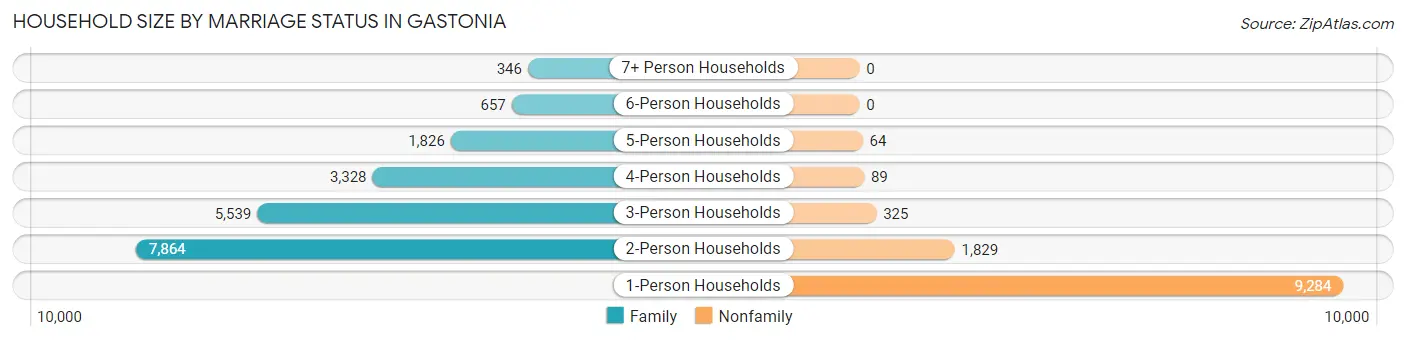
| Household Size | Family Households | Nonfamily Households |
| 1-Person Households | - | 9,284 (29.8%) |
| 2-Person Households | 7,864 (25.2%) | 1,829 (5.9%) |
| 3-Person Households | 5,539 (17.8%) | 325 (1.0%) |
| 4-Person Households | 3,328 (10.7%) | 89 (0.3%) |
| 5-Person Households | 1,826 (5.9%) | 64 (0.2%) |
| 6-Person Households | 657 (2.1%) | 0 (0.0%) |
| 7+ Person Households | 346 (1.1%) | 0 (0.0%) |
| Total | 19,560 (62.8%) | 11,591 (37.2%) |
Female Fertility in Gastonia
Fertility by Age in Gastonia
Average fertility rate in Gastonia is 49.0 births per 1,000 women. Women in the age bracket of 20 to 34 years have the highest fertility rate with 84.0 births per 1,000 women. Women in the age bracket of 20 to 34 years acount for 73.6% of all women with births.
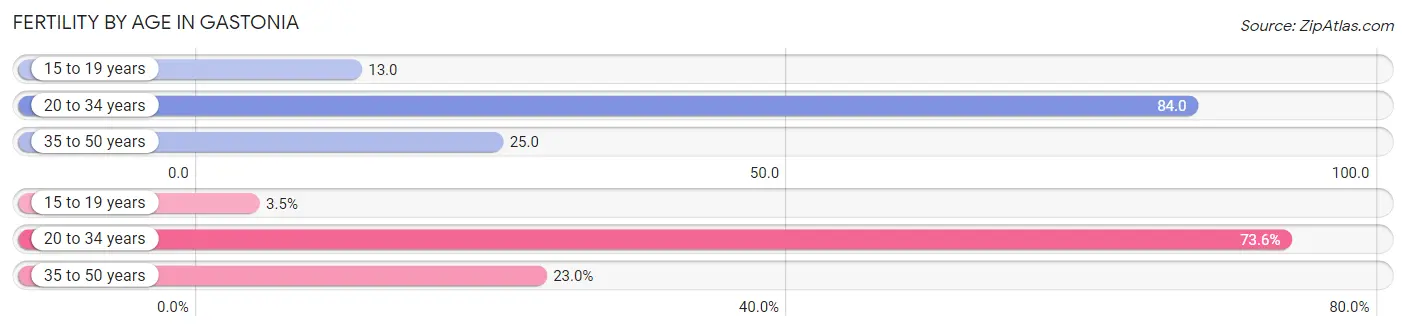
| Age Bracket | Women with Births | Births / 1,000 Women |
| 15 to 19 years | 33 (3.5%) | 13.0 |
| 20 to 34 years | 699 (73.6%) | 84.0 |
| 35 to 50 years | 218 (23.0%) | 25.0 |
| Total | 950 (100.0%) | 49.0 |
Fertility by Age by Marriage Status in Gastonia
42.6% of women with births (950) in Gastonia are married. The highest percentage of unmarried women with births falls into 15 to 19 years age bracket with 100.0% of them unmarried at the time of birth, while the lowest percentage of unmarried women with births belong to 35 to 50 years age bracket with 53.2% of them unmarried.
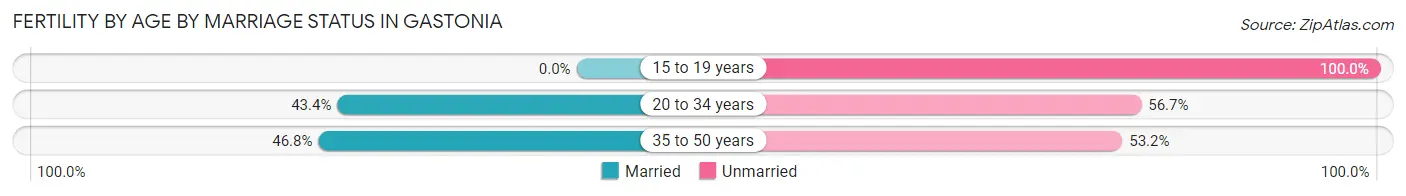
| Age Bracket | Married | Unmarried |
| 15 to 19 years | 0 (0.0%) | 33 (100.0%) |
| 20 to 34 years | 303 (43.3%) | 396 (56.7%) |
| 35 to 50 years | 102 (46.8%) | 116 (53.2%) |
| Total | 405 (42.6%) | 545 (57.4%) |
Fertility by Education in Gastonia
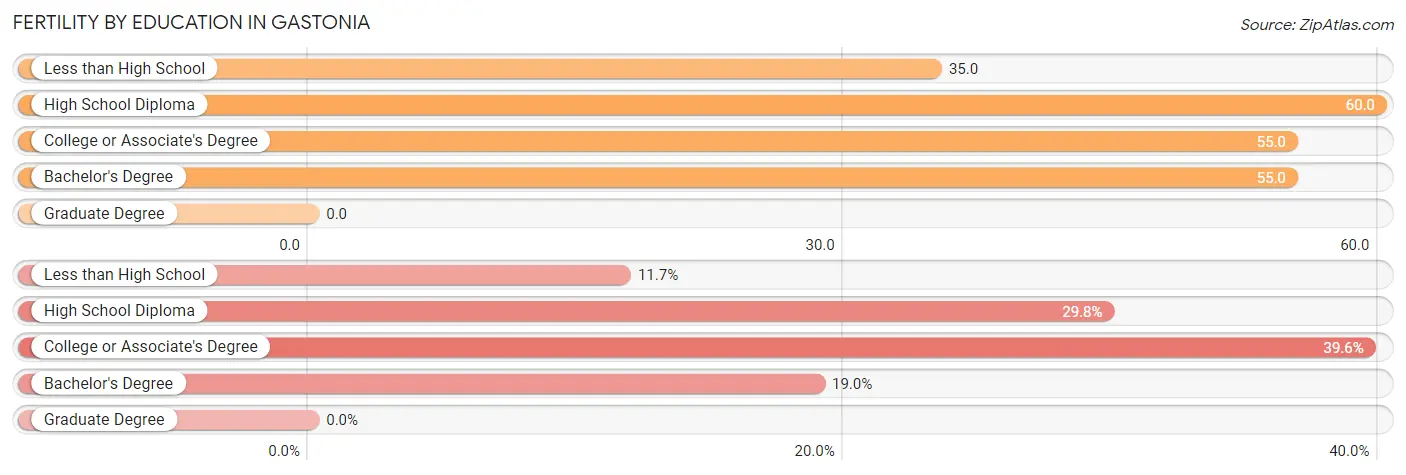
| Educational Attainment | Women with Births | Births / 1,000 Women |
| Less than High School | 111 (11.7%) | 35.0 |
| High School Diploma | 283 (29.8%) | 60.0 |
| College or Associate's Degree | 376 (39.6%) | 55.0 |
| Bachelor's Degree | 180 (19.0%) | 55.0 |
| Graduate Degree | 0 (0.0%) | 0.0 |
| Total | 950 (100.0%) | 49.0 |
Fertility by Education by Marriage Status in Gastonia
57.4% of women with births in Gastonia are unmarried. Women with the educational attainment of bachelor's degree are most likely to be married with 67.2% of them married at childbirth, while women with the educational attainment of high school diploma are least likely to be married with 73.9% of them unmarried at childbirth.
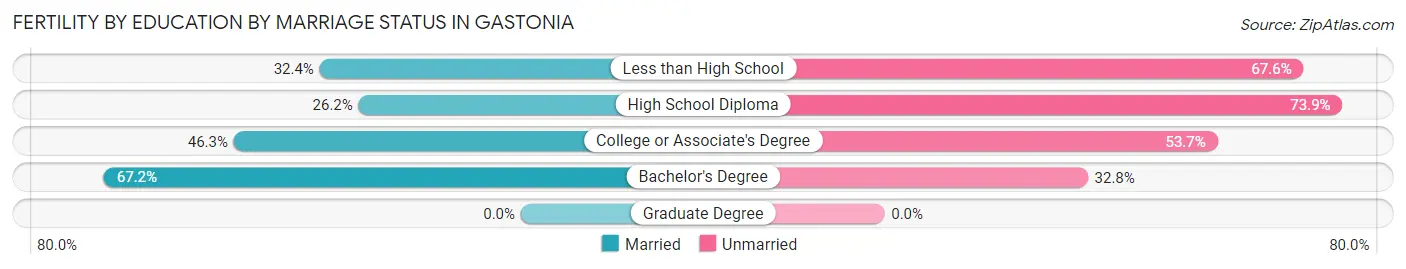
| Educational Attainment | Married | Unmarried |
| Less than High School | 36 (32.4%) | 75 (67.6%) |
| High School Diploma | 74 (26.2%) | 209 (73.9%) |
| College or Associate's Degree | 174 (46.3%) | 202 (53.7%) |
| Bachelor's Degree | 121 (67.2%) | 59 (32.8%) |
| Graduate Degree | 0 (0.0%) | 0 (0.0%) |
| Total | 405 (42.6%) | 545 (57.4%) |
Employment Characteristics in Gastonia
Employment by Class of Employer in Gastonia
Among the 37,322 employed individuals in Gastonia, private company employees (27,519 | 73.7%), not-for-profit organizations (2,972 | 8.0%), and local government employees (2,588 | 6.9%) make up the most common classes of employment.
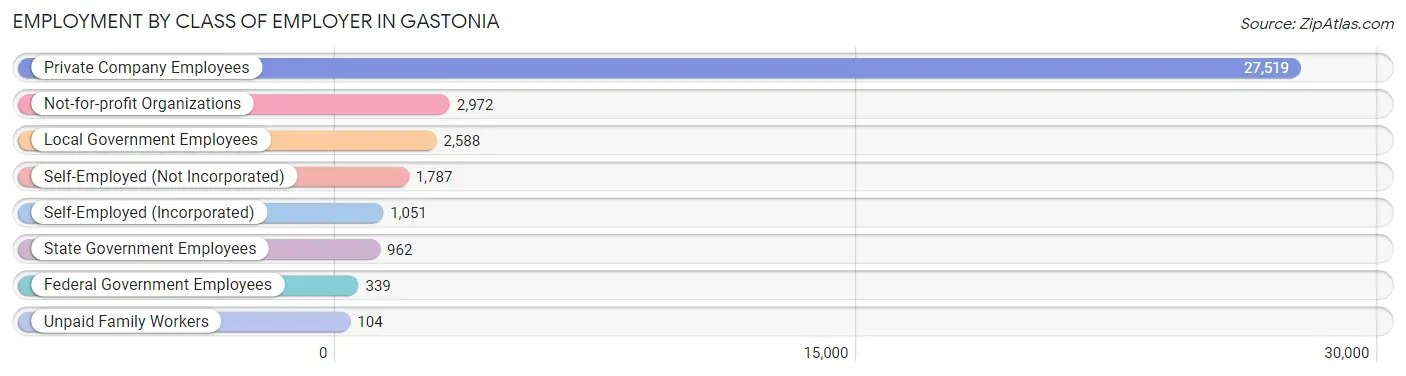
| Employer Class | # Employees | % Employees |
| Private Company Employees | 27,519 | 73.7% |
| Self-Employed (Incorporated) | 1,051 | 2.8% |
| Self-Employed (Not Incorporated) | 1,787 | 4.8% |
| Not-for-profit Organizations | 2,972 | 8.0% |
| Local Government Employees | 2,588 | 6.9% |
| State Government Employees | 962 | 2.6% |
| Federal Government Employees | 339 | 0.9% |
| Unpaid Family Workers | 104 | 0.3% |
| Total | 37,322 | 100.0% |
Employment Status by Age in Gastonia
According to the labor force statistics for Gastonia, out of the total population over 16 years of age (62,805), 64.2% or 40,321 individuals are in the labor force, with 5.6% or 2,258 of them unemployed. The age group with the highest labor force participation rate is 25 to 29 years, with 84.6% or 4,528 individuals in the labor force. Within the labor force, the 20 to 24 years age range has the highest percentage of unemployed individuals, with 14.8% or 561 of them being unemployed.
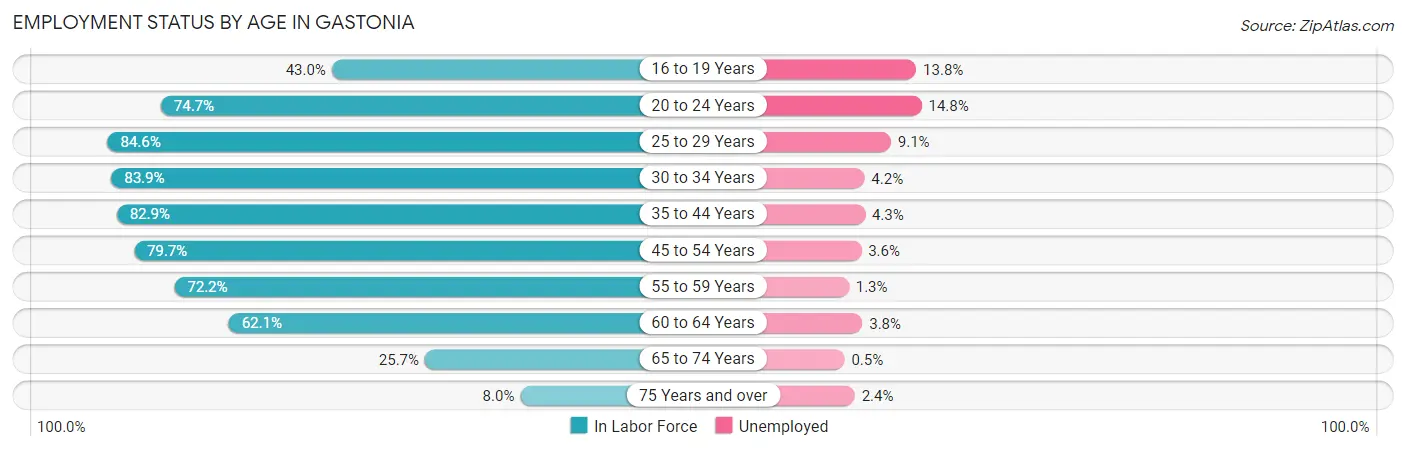
| Age Bracket | In Labor Force | Unemployed |
| 16 to 19 Years | 1,815 (43.0%) | 250 (13.8%) |
| 20 to 24 Years | 3,792 (74.7%) | 561 (14.8%) |
| 25 to 29 Years | 4,528 (84.6%) | 412 (9.1%) |
| 30 to 34 Years | 4,641 (83.9%) | 195 (4.2%) |
| 35 to 44 Years | 8,586 (82.9%) | 369 (4.3%) |
| 45 to 54 Years | 8,317 (79.7%) | 299 (3.6%) |
| 55 to 59 Years | 3,604 (72.2%) | 47 (1.3%) |
| 60 to 64 Years | 2,730 (62.1%) | 104 (3.8%) |
| 65 to 74 Years | 1,878 (25.7%) | 9 (0.5%) |
| 75 Years and over | 411 (8.0%) | 10 (2.4%) |
| Total | 40,321 (64.2%) | 2,258 (5.6%) |
Employment Status by Educational Attainment in Gastonia
According to labor force statistics for Gastonia, 78.9% of individuals (32,399) out of the total population between 25 and 64 years of age (41,063) are in the labor force, with 4.4% or 1,426 of them being unemployed. The group with the highest labor force participation rate are those with the educational attainment of bachelor's degree or higher, with 90.8% or 10,226 individuals in the labor force. Within the labor force, individuals with less than high school education have the highest percentage of unemployment, with 16.7% or 455 of them being unemployed.
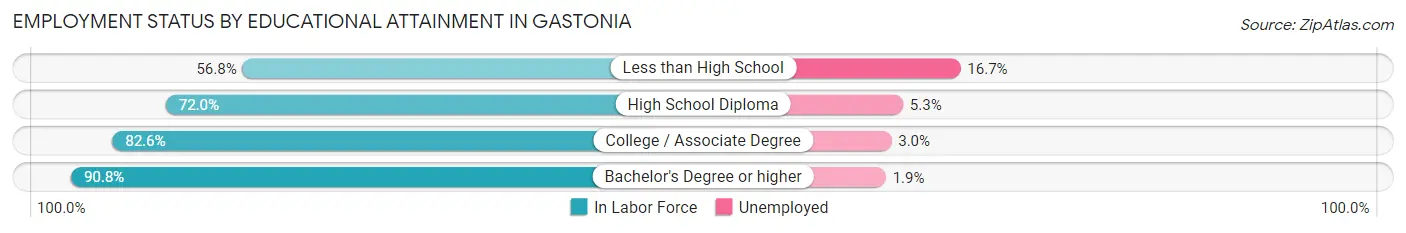
| Educational Attainment | In Labor Force | Unemployed |
| Less than High School | 2,722 (56.8%) | 800 (16.7%) |
| High School Diploma | 8,163 (72.0%) | 601 (5.3%) |
| College / Associate Degree | 11,291 (82.6%) | 410 (3.0%) |
| Bachelor's Degree or higher | 10,226 (90.8%) | 214 (1.9%) |
| Total | 32,399 (78.9%) | 1,807 (4.4%) |
Employment Occupations by Sex in Gastonia
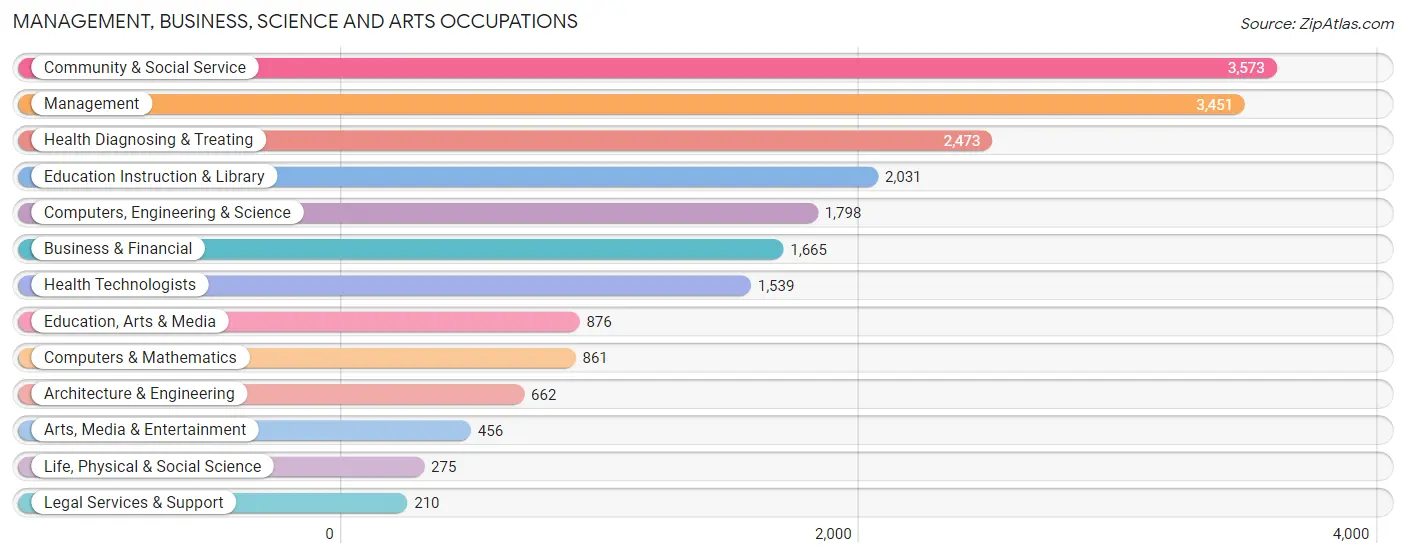
Management, Business, Science and Arts Occupations
The most common Management, Business, Science and Arts occupations in Gastonia are Community & Social Service (3,573 | 9.4%), Management (3,451 | 9.1%), Health Diagnosing & Treating (2,473 | 6.5%), Education Instruction & Library (2,031 | 5.3%), and Computers, Engineering & Science (1,798 | 4.7%).
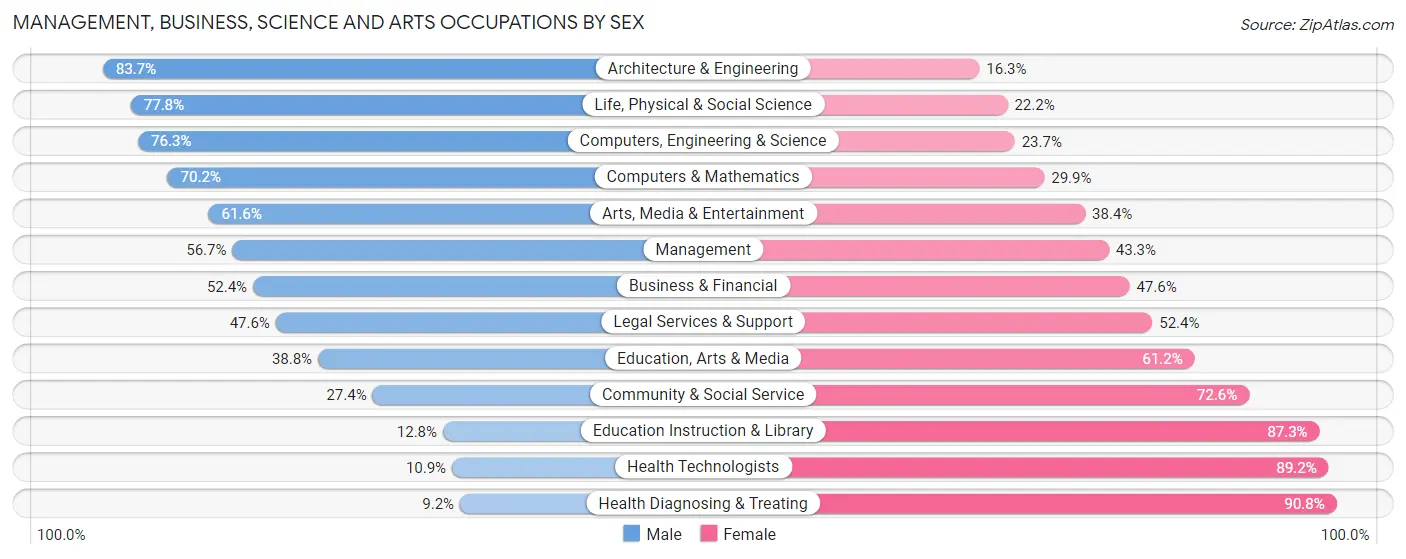
Management, Business, Science and Arts Occupations by Sex
Within the Management, Business, Science and Arts occupations in Gastonia, the most male-oriented occupations are Architecture & Engineering (83.7%), Life, Physical & Social Science (77.8%), and Computers, Engineering & Science (76.3%), while the most female-oriented occupations are Health Diagnosing & Treating (90.8%), Health Technologists (89.1%), and Education Instruction & Library (87.3%).
| Occupation | Male | Female |
| Management | 1,956 (56.7%) | 1,495 (43.3%) |
| Business & Financial | 872 (52.4%) | 793 (47.6%) |
| Computers, Engineering & Science | 1,372 (76.3%) | 426 (23.7%) |
| Computers & Mathematics | 604 (70.2%) | 257 (29.8%) |
| Architecture & Engineering | 554 (83.7%) | 108 (16.3%) |
| Life, Physical & Social Science | 214 (77.8%) | 61 (22.2%) |
| Community & Social Service | 980 (27.4%) | 2,593 (72.6%) |
| Education, Arts & Media | 340 (38.8%) | 536 (61.2%) |
| Legal Services & Support | 100 (47.6%) | 110 (52.4%) |
| Education Instruction & Library | 259 (12.8%) | 1,772 (87.3%) |
| Arts, Media & Entertainment | 281 (61.6%) | 175 (38.4%) |
| Health Diagnosing & Treating | 227 (9.2%) | 2,246 (90.8%) |
| Health Technologists | 167 (10.8%) | 1,372 (89.1%) |
| Total (Category) | 5,407 (41.7%) | 7,553 (58.3%) |
| Total (Overall) | 19,118 (50.3%) | 18,894 (49.7%) |
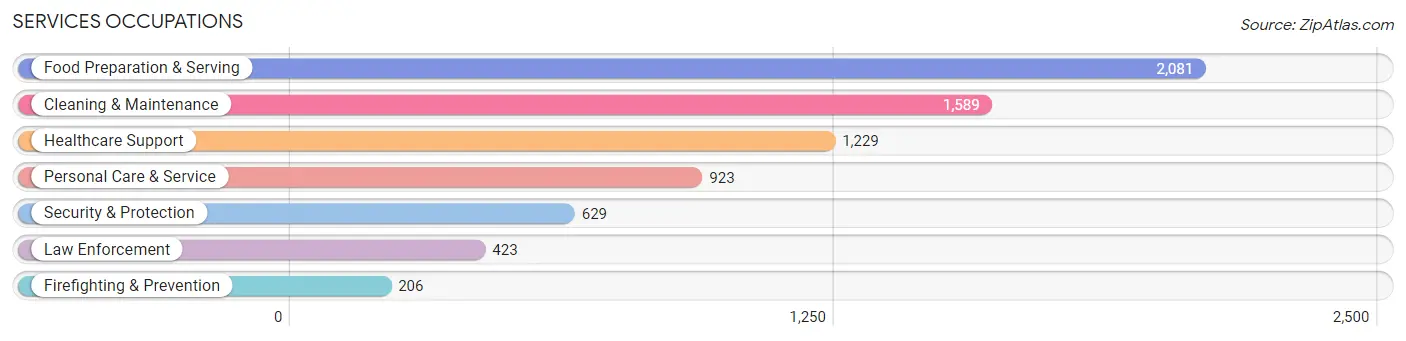
Services Occupations
The most common Services occupations in Gastonia are Food Preparation & Serving (2,081 | 5.5%), Cleaning & Maintenance (1,589 | 4.2%), Healthcare Support (1,229 | 3.2%), Personal Care & Service (923 | 2.4%), and Security & Protection (629 | 1.7%).
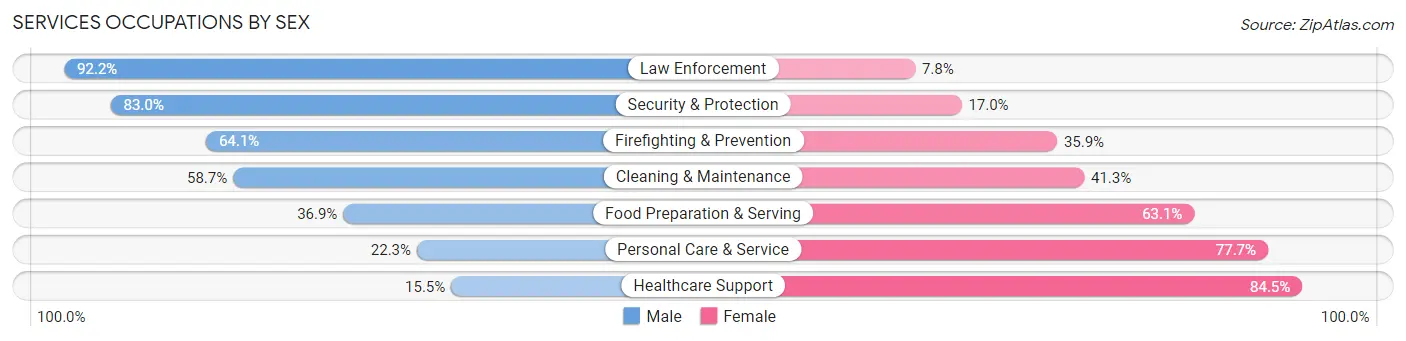
Services Occupations by Sex
Within the Services occupations in Gastonia, the most male-oriented occupations are Law Enforcement (92.2%), Security & Protection (83.0%), and Firefighting & Prevention (64.1%), while the most female-oriented occupations are Healthcare Support (84.5%), Personal Care & Service (77.7%), and Food Preparation & Serving (63.1%).
| Occupation | Male | Female |
| Healthcare Support | 191 (15.5%) | 1,038 (84.5%) |
| Security & Protection | 522 (83.0%) | 107 (17.0%) |
| Firefighting & Prevention | 132 (64.1%) | 74 (35.9%) |
| Law Enforcement | 390 (92.2%) | 33 (7.8%) |
| Food Preparation & Serving | 768 (36.9%) | 1,313 (63.1%) |
| Cleaning & Maintenance | 933 (58.7%) | 656 (41.3%) |
| Personal Care & Service | 206 (22.3%) | 717 (77.7%) |
| Total (Category) | 2,620 (40.6%) | 3,831 (59.4%) |
| Total (Overall) | 19,118 (50.3%) | 18,894 (49.7%) |
Sales and Office Occupations
The most common Sales and Office occupations in Gastonia are Office & Administration (4,129 | 10.9%), and Sales & Related (3,835 | 10.1%).

Sales and Office Occupations by Sex
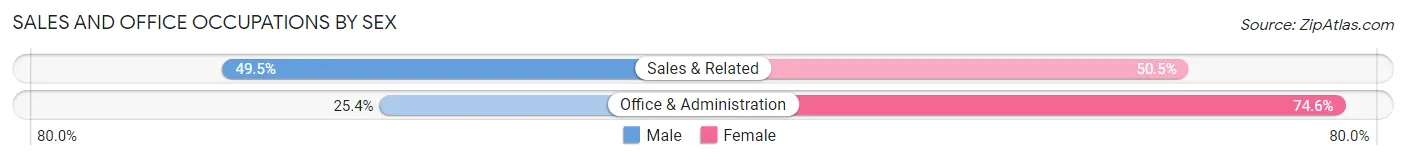
| Occupation | Male | Female |
| Sales & Related | 1,900 (49.5%) | 1,935 (50.5%) |
| Office & Administration | 1,049 (25.4%) | 3,080 (74.6%) |
| Total (Category) | 2,949 (37.0%) | 5,015 (63.0%) |
| Total (Overall) | 19,118 (50.3%) | 18,894 (49.7%) |
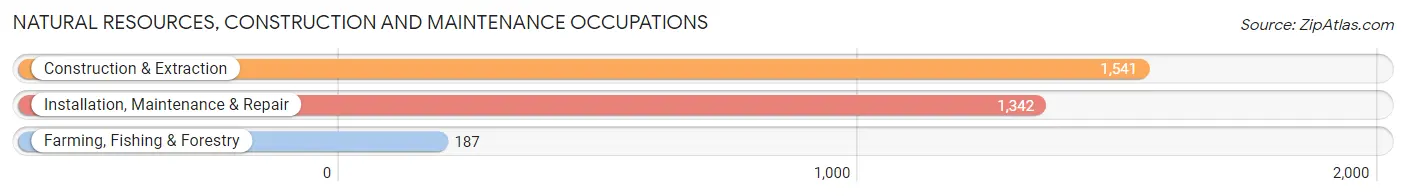
Natural Resources, Construction and Maintenance Occupations
The most common Natural Resources, Construction and Maintenance occupations in Gastonia are Construction & Extraction (1,541 | 4.1%), Installation, Maintenance & Repair (1,342 | 3.5%), and Farming, Fishing & Forestry (187 | 0.5%).
Natural Resources, Construction and Maintenance Occupations by Sex
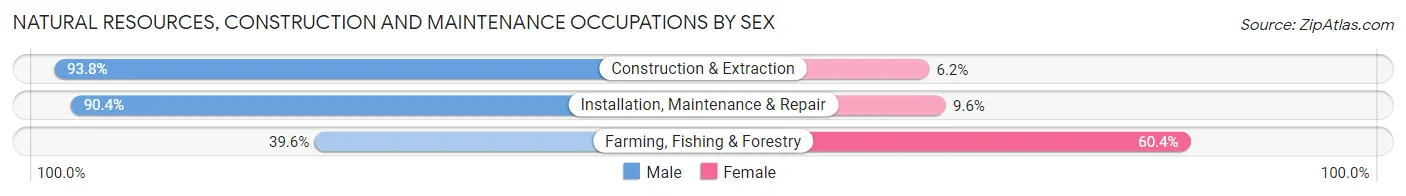
| Occupation | Male | Female |
| Farming, Fishing & Forestry | 74 (39.6%) | 113 (60.4%) |
| Construction & Extraction | 1,446 (93.8%) | 95 (6.2%) |
| Installation, Maintenance & Repair | 1,213 (90.4%) | 129 (9.6%) |
| Total (Category) | 2,733 (89.0%) | 337 (11.0%) |
| Total (Overall) | 19,118 (50.3%) | 18,894 (49.7%) |
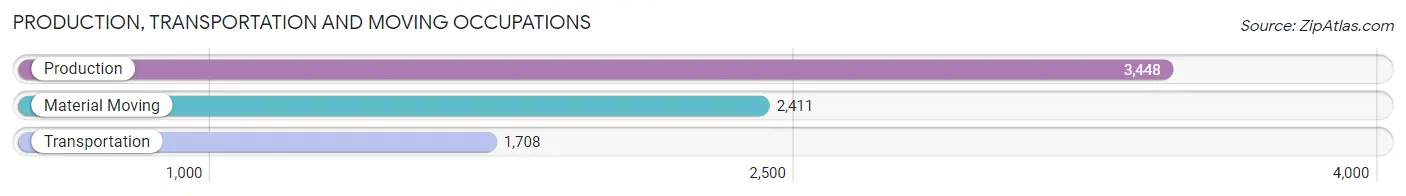
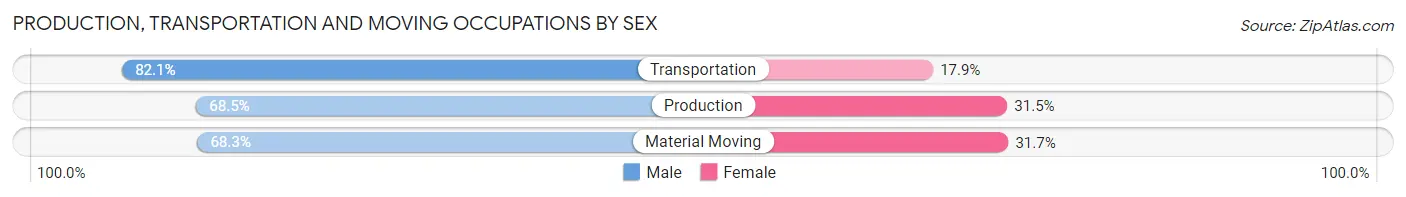
Production, Transportation and Moving Occupations
The most common Production, Transportation and Moving occupations in Gastonia are Production (3,448 | 9.1%), Material Moving (2,411 | 6.3%), and Transportation (1,708 | 4.5%).
Production, Transportation and Moving Occupations by Sex
| Occupation | Male | Female |
| Production | 2,361 (68.5%) | 1,087 (31.5%) |
| Transportation | 1,402 (82.1%) | 306 (17.9%) |
| Material Moving | 1,646 (68.3%) | 765 (31.7%) |
| Total (Category) | 5,409 (71.5%) | 2,158 (28.5%) |
| Total (Overall) | 19,118 (50.3%) | 18,894 (49.7%) |
Employment Industries by Sex in Gastonia
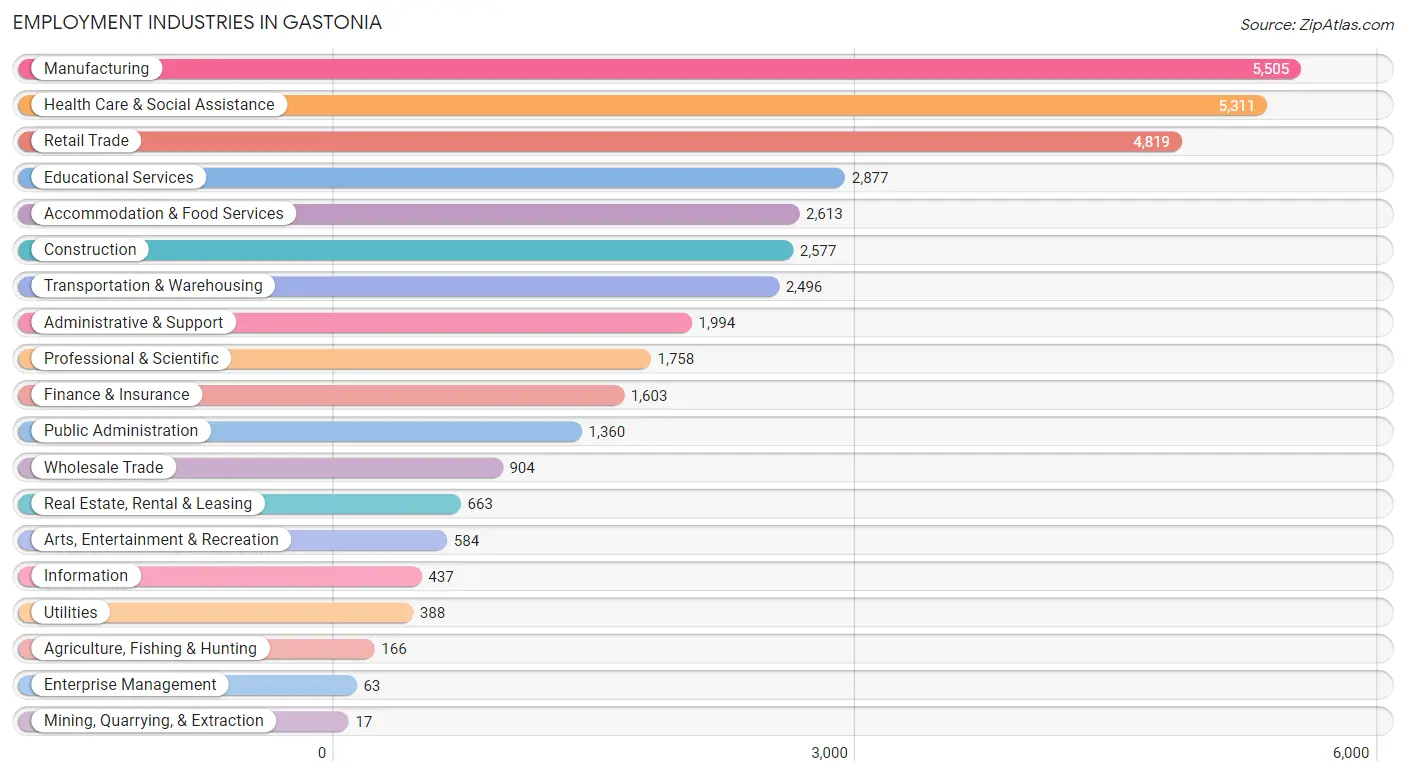
Employment Industries in Gastonia
The major employment industries in Gastonia include Manufacturing (5,505 | 14.5%), Health Care & Social Assistance (5,311 | 14.0%), Retail Trade (4,819 | 12.7%), Educational Services (2,877 | 7.6%), and Accommodation & Food Services (2,613 | 6.9%).
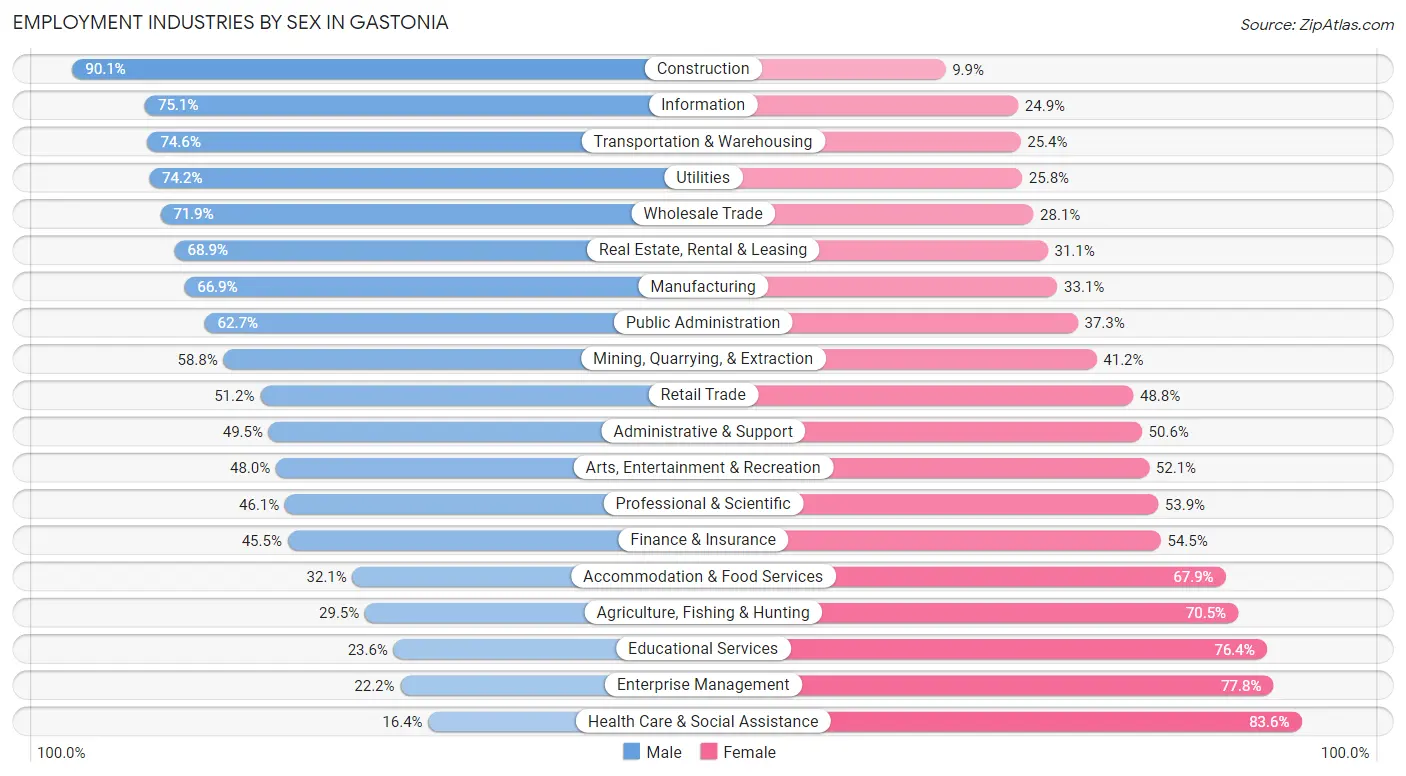
Employment Industries by Sex in Gastonia
The Gastonia industries that see more men than women are Construction (90.1%), Information (75.1%), and Transportation & Warehousing (74.6%), whereas the industries that tend to have a higher number of women are Health Care & Social Assistance (83.6%), Enterprise Management (77.8%), and Educational Services (76.4%).
| Industry | Male | Female |
| Agriculture, Fishing & Hunting | 49 (29.5%) | 117 (70.5%) |
| Mining, Quarrying, & Extraction | 10 (58.8%) | 7 (41.2%) |
| Construction | 2,322 (90.1%) | 255 (9.9%) |
| Manufacturing | 3,685 (66.9%) | 1,820 (33.1%) |
| Wholesale Trade | 650 (71.9%) | 254 (28.1%) |
| Retail Trade | 2,469 (51.2%) | 2,350 (48.8%) |
| Transportation & Warehousing | 1,861 (74.6%) | 635 (25.4%) |
| Utilities | 288 (74.2%) | 100 (25.8%) |
| Information | 328 (75.1%) | 109 (24.9%) |
| Finance & Insurance | 730 (45.5%) | 873 (54.5%) |
| Real Estate, Rental & Leasing | 457 (68.9%) | 206 (31.1%) |
| Professional & Scientific | 810 (46.1%) | 948 (53.9%) |
| Enterprise Management | 14 (22.2%) | 49 (77.8%) |
| Administrative & Support | 986 (49.4%) | 1,008 (50.5%) |
| Educational Services | 679 (23.6%) | 2,198 (76.4%) |
| Health Care & Social Assistance | 872 (16.4%) | 4,439 (83.6%) |
| Arts, Entertainment & Recreation | 280 (47.9%) | 304 (52.0%) |
| Accommodation & Food Services | 839 (32.1%) | 1,774 (67.9%) |
| Public Administration | 853 (62.7%) | 507 (37.3%) |
| Total | 19,118 (50.3%) | 18,894 (49.7%) |
Education in Gastonia
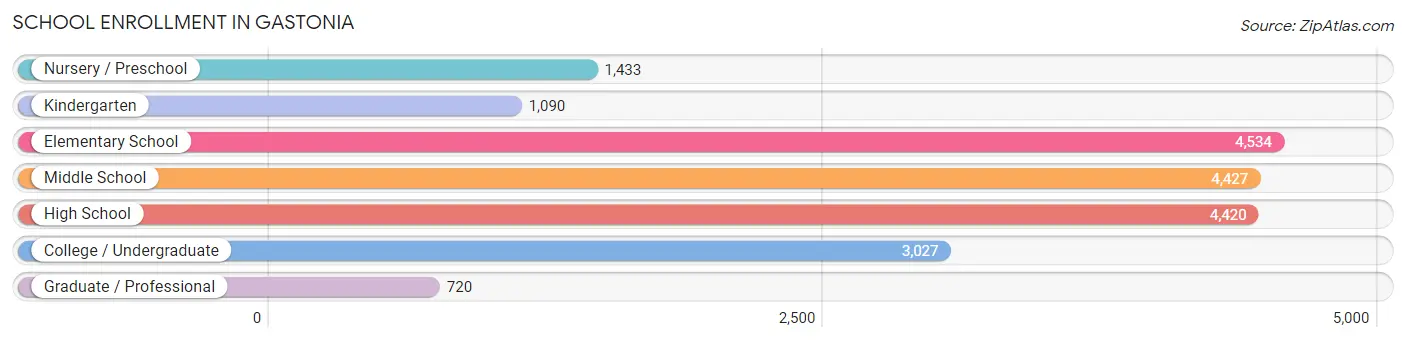
School Enrollment in Gastonia
The most common levels of schooling among the 19,651 students in Gastonia are elementary school (4,534 | 23.1%), middle school (4,427 | 22.5%), and high school (4,420 | 22.5%).
| School Level | # Students | % Students |
| Nursery / Preschool | 1,433 | 7.3% |
| Kindergarten | 1,090 | 5.6% |
| Elementary School | 4,534 | 23.1% |
| Middle School | 4,427 | 22.5% |
| High School | 4,420 | 22.5% |
| College / Undergraduate | 3,027 | 15.4% |
| Graduate / Professional | 720 | 3.7% |
| Total | 19,651 | 100.0% |
School Enrollment by Age by Funding Source in Gastonia
Out of a total of 19,651 students who are enrolled in schools in Gastonia, 3,066 (15.6%) attend a private institution, while the remaining 16,585 (84.4%) are enrolled in public schools. The age group of 3 to 4 year olds has the highest likelihood of being enrolled in private schools, with 436 (44.7% in the age bracket) enrolled. Conversely, the age group of 18 to 19 year olds has the lowest likelihood of being enrolled in a private school, with 1,301 (94.0% in the age bracket) attending a public institution.
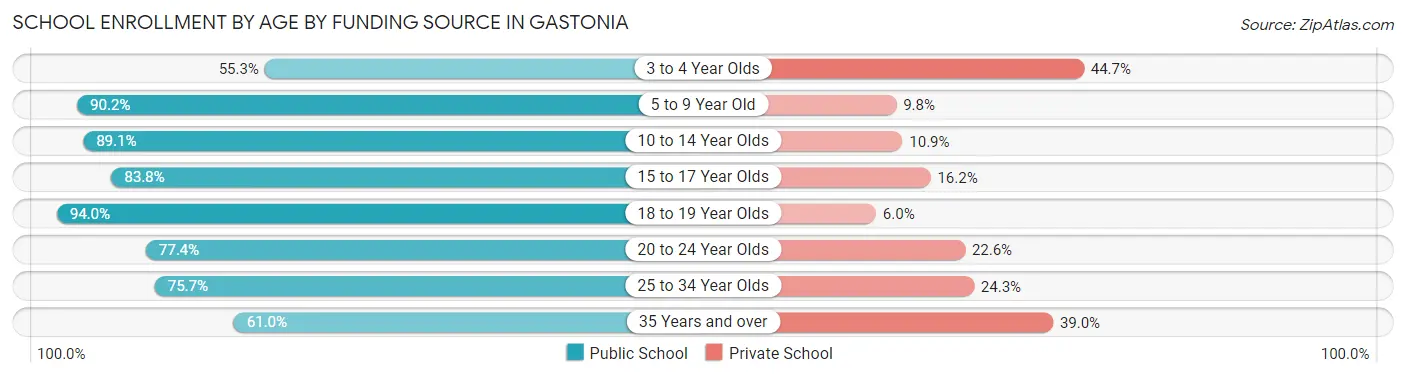
| Age Bracket | Public School | Private School |
| 3 to 4 Year Olds | 539 (55.3%) | 436 (44.7%) |
| 5 to 9 Year Old | 4,950 (90.2%) | 537 (9.8%) |
| 10 to 14 Year Olds | 4,743 (89.1%) | 582 (10.9%) |
| 15 to 17 Year Olds | 2,624 (83.8%) | 506 (16.2%) |
| 18 to 19 Year Olds | 1,301 (94.0%) | 83 (6.0%) |
| 20 to 24 Year Olds | 1,206 (77.4%) | 352 (22.6%) |
| 25 to 34 Year Olds | 687 (75.7%) | 220 (24.3%) |
| 35 Years and over | 540 (61.0%) | 345 (39.0%) |
| Total | 16,585 (84.4%) | 3,066 (15.6%) |
Educational Attainment by Field of Study in Gastonia
Business (2,783 | 17.9%), education (2,621 | 16.9%), arts & humanities (1,649 | 10.6%), science & technology (1,618 | 10.4%), and social sciences (913 | 5.9%) are the most common fields of study among 15,544 individuals in Gastonia who have obtained a bachelor's degree or higher.
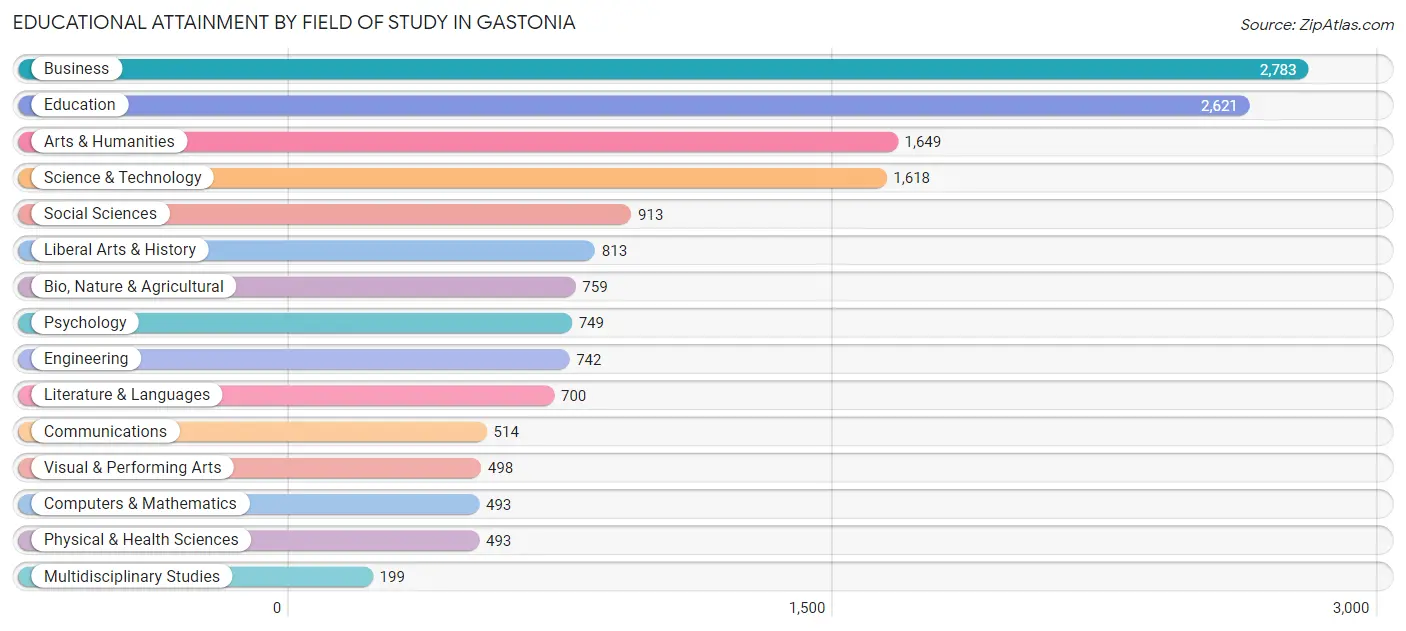
| Field of Study | # Graduates | % Graduates |
| Computers & Mathematics | 493 | 3.2% |
| Bio, Nature & Agricultural | 759 | 4.9% |
| Physical & Health Sciences | 493 | 3.2% |
| Psychology | 749 | 4.8% |
| Social Sciences | 913 | 5.9% |
| Engineering | 742 | 4.8% |
| Multidisciplinary Studies | 199 | 1.3% |
| Science & Technology | 1,618 | 10.4% |
| Business | 2,783 | 17.9% |
| Education | 2,621 | 16.9% |
| Literature & Languages | 700 | 4.5% |
| Liberal Arts & History | 813 | 5.2% |
| Visual & Performing Arts | 498 | 3.2% |
| Communications | 514 | 3.3% |
| Arts & Humanities | 1,649 | 10.6% |
| Total | 15,544 | 100.0% |
Transportation & Commute in Gastonia
Vehicle Availability by Sex in Gastonia
The most prevalent vehicle ownership categories in Gastonia are males with 2 vehicles (7,806, accounting for 41.6%) and females with 2 vehicles (7,230, making up 42.3%).
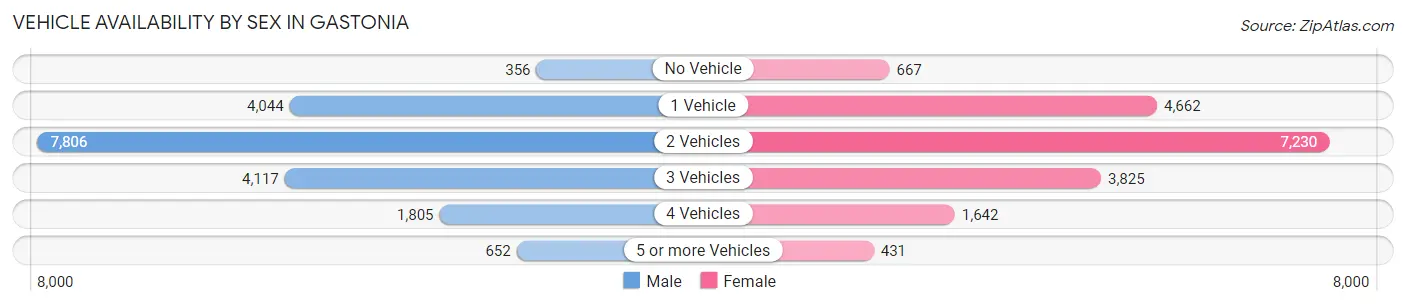
| Vehicles Available | Male | Female |
| No Vehicle | 356 (1.9%) | 667 (3.6%) |
| 1 Vehicle | 4,044 (21.5%) | 4,662 (25.3%) |
| 2 Vehicles | 7,806 (41.6%) | 7,230 (39.2%) |
| 3 Vehicles | 4,117 (21.9%) | 3,825 (20.7%) |
| 4 Vehicles | 1,805 (9.6%) | 1,642 (8.9%) |
| 5 or more Vehicles | 652 (3.5%) | 431 (2.3%) |
| Total | 18,780 (100.0%) | 18,457 (100.0%) |
Commute Time in Gastonia
The most frequently occuring commute durations in Gastonia are 10 to 14 minutes (6,123 commuters, 17.7%), 15 to 19 minutes (5,484 commuters, 15.9%), and 30 to 34 minutes (4,380 commuters, 12.7%).
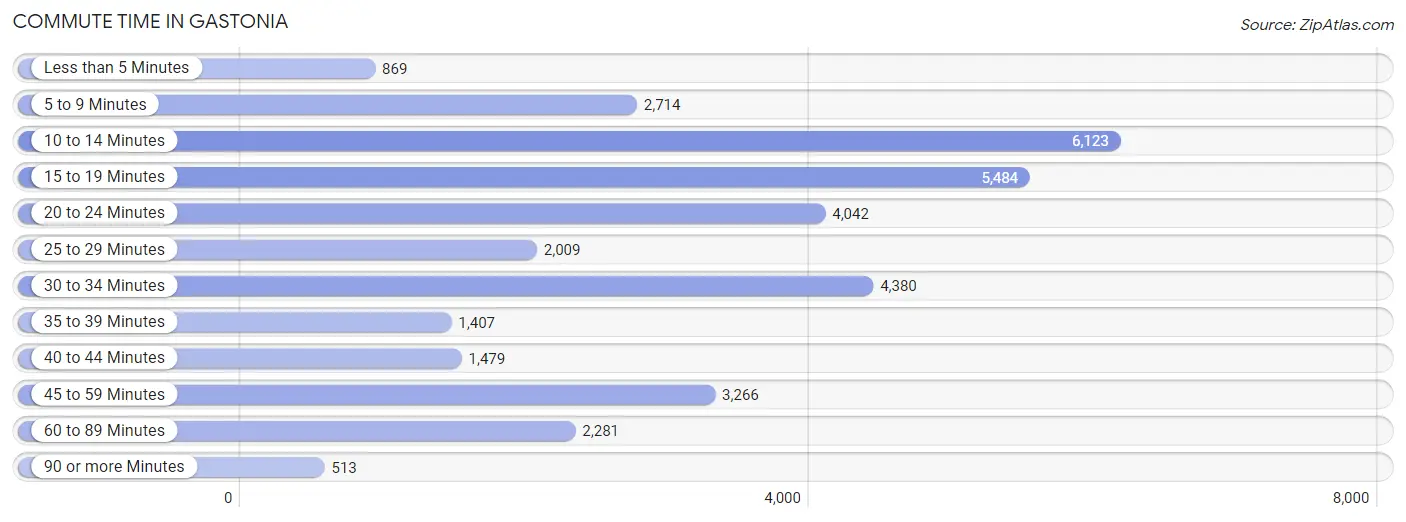
| Commute Time | # Commuters | % Commuters |
| Less than 5 Minutes | 869 | 2.5% |
| 5 to 9 Minutes | 2,714 | 7.9% |
| 10 to 14 Minutes | 6,123 | 17.7% |
| 15 to 19 Minutes | 5,484 | 15.9% |
| 20 to 24 Minutes | 4,042 | 11.7% |
| 25 to 29 Minutes | 2,009 | 5.8% |
| 30 to 34 Minutes | 4,380 | 12.7% |
| 35 to 39 Minutes | 1,407 | 4.1% |
| 40 to 44 Minutes | 1,479 | 4.3% |
| 45 to 59 Minutes | 3,266 | 9.5% |
| 60 to 89 Minutes | 2,281 | 6.6% |
| 90 or more Minutes | 513 | 1.5% |
Commute Time by Sex in Gastonia
The most common commute times in Gastonia are 30 to 34 minutes (2,708 commuters, 15.4%) for males and 10 to 14 minutes (3,867 commuters, 22.8%) for females.
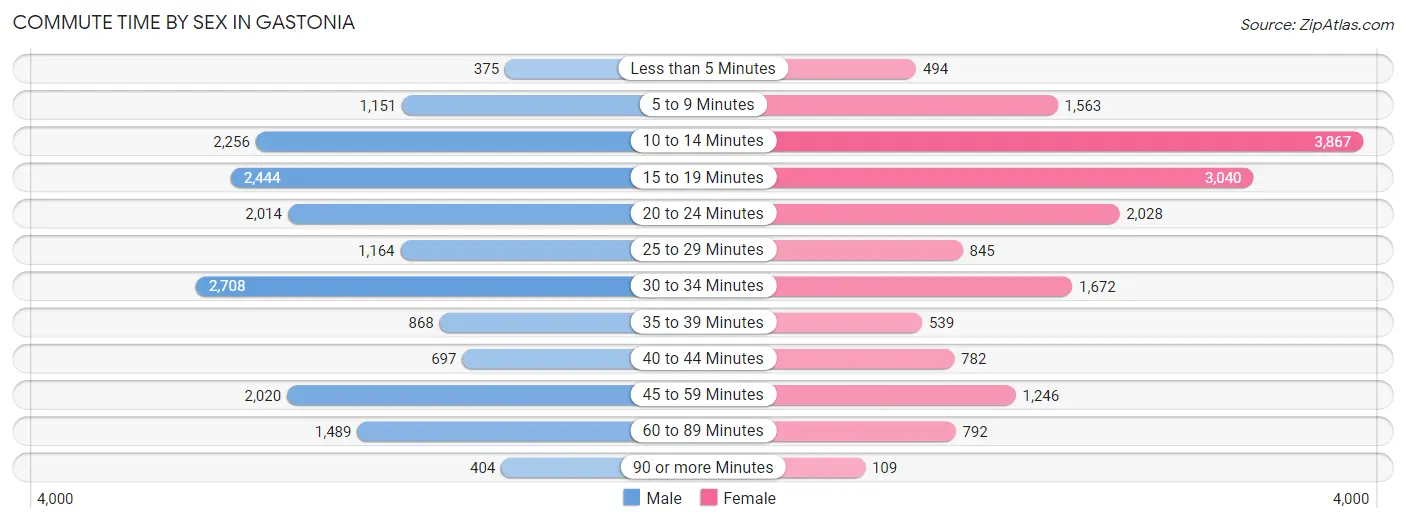
| Commute Time | Male | Female |
| Less than 5 Minutes | 375 (2.1%) | 494 (2.9%) |
| 5 to 9 Minutes | 1,151 (6.5%) | 1,563 (9.2%) |
| 10 to 14 Minutes | 2,256 (12.8%) | 3,867 (22.8%) |
| 15 to 19 Minutes | 2,444 (13.9%) | 3,040 (17.9%) |
| 20 to 24 Minutes | 2,014 (11.5%) | 2,028 (11.9%) |
| 25 to 29 Minutes | 1,164 (6.6%) | 845 (5.0%) |
| 30 to 34 Minutes | 2,708 (15.4%) | 1,672 (9.9%) |
| 35 to 39 Minutes | 868 (4.9%) | 539 (3.2%) |
| 40 to 44 Minutes | 697 (4.0%) | 782 (4.6%) |
| 45 to 59 Minutes | 2,020 (11.5%) | 1,246 (7.3%) |
| 60 to 89 Minutes | 1,489 (8.5%) | 792 (4.7%) |
| 90 or more Minutes | 404 (2.3%) | 109 (0.6%) |
Time of Departure to Work by Sex in Gastonia
The most frequent times of departure to work in Gastonia are 7:00 AM to 7:29 AM (2,202, 12.5%) for males and 7:30 AM to 7:59 AM (2,913, 17.2%) for females.
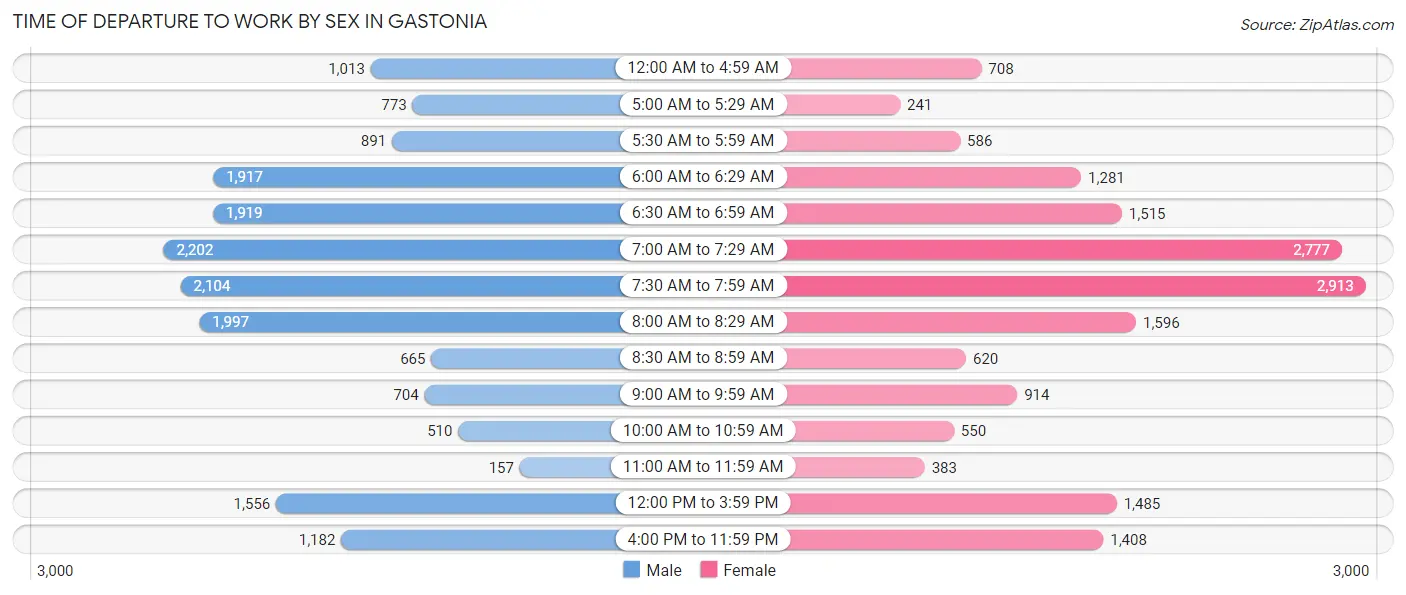
| Time of Departure | Male | Female |
| 12:00 AM to 4:59 AM | 1,013 (5.8%) | 708 (4.2%) |
| 5:00 AM to 5:29 AM | 773 (4.4%) | 241 (1.4%) |
| 5:30 AM to 5:59 AM | 891 (5.1%) | 586 (3.5%) |
| 6:00 AM to 6:29 AM | 1,917 (10.9%) | 1,281 (7.5%) |
| 6:30 AM to 6:59 AM | 1,919 (10.9%) | 1,515 (8.9%) |
| 7:00 AM to 7:29 AM | 2,202 (12.5%) | 2,777 (16.4%) |
| 7:30 AM to 7:59 AM | 2,104 (12.0%) | 2,913 (17.2%) |
| 8:00 AM to 8:29 AM | 1,997 (11.4%) | 1,596 (9.4%) |
| 8:30 AM to 8:59 AM | 665 (3.8%) | 620 (3.6%) |
| 9:00 AM to 9:59 AM | 704 (4.0%) | 914 (5.4%) |
| 10:00 AM to 10:59 AM | 510 (2.9%) | 550 (3.2%) |
| 11:00 AM to 11:59 AM | 157 (0.9%) | 383 (2.3%) |
| 12:00 PM to 3:59 PM | 1,556 (8.8%) | 1,485 (8.7%) |
| 4:00 PM to 11:59 PM | 1,182 (6.7%) | 1,408 (8.3%) |
| Total | 17,590 (100.0%) | 16,977 (100.0%) |
Housing Occupancy in Gastonia
Occupancy by Ownership in Gastonia
Of the total 31,151 dwellings in Gastonia, owner-occupied units account for 17,375 (55.8%), while renter-occupied units make up 13,776 (44.2%).
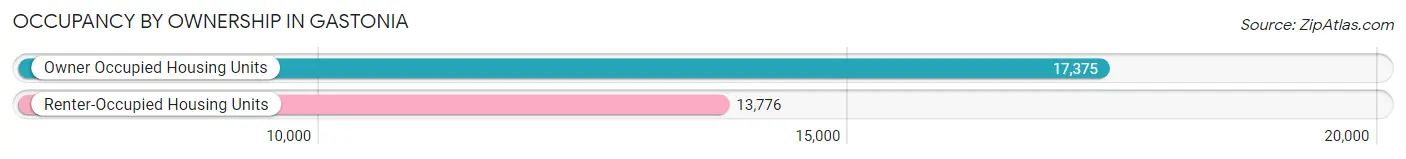
| Occupancy | # Housing Units | % Housing Units |
| Owner Occupied Housing Units | 17,375 | 55.8% |
| Renter-Occupied Housing Units | 13,776 | 44.2% |
| Total Occupied Housing Units | 31,151 | 100.0% |
Occupancy by Household Size in Gastonia
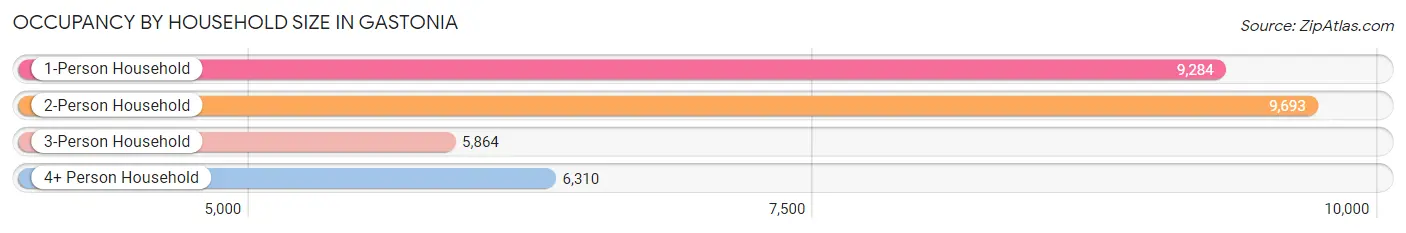
| Household Size | # Housing Units | % Housing Units |
| 1-Person Household | 9,284 | 29.8% |
| 2-Person Household | 9,693 | 31.1% |
| 3-Person Household | 5,864 | 18.8% |
| 4+ Person Household | 6,310 | 20.3% |
| Total Housing Units | 31,151 | 100.0% |
Occupancy by Ownership by Household Size in Gastonia
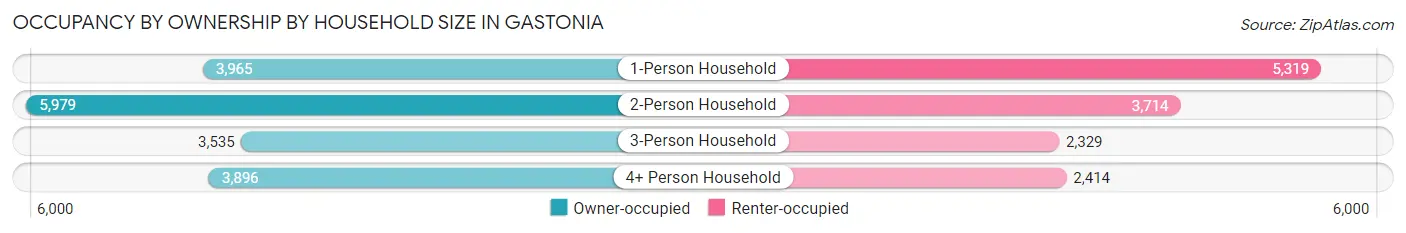
| Household Size | Owner-occupied | Renter-occupied |
| 1-Person Household | 3,965 (42.7%) | 5,319 (57.3%) |
| 2-Person Household | 5,979 (61.7%) | 3,714 (38.3%) |
| 3-Person Household | 3,535 (60.3%) | 2,329 (39.7%) |
| 4+ Person Household | 3,896 (61.7%) | 2,414 (38.3%) |
| Total Housing Units | 17,375 (55.8%) | 13,776 (44.2%) |
Occupancy by Educational Attainment in Gastonia
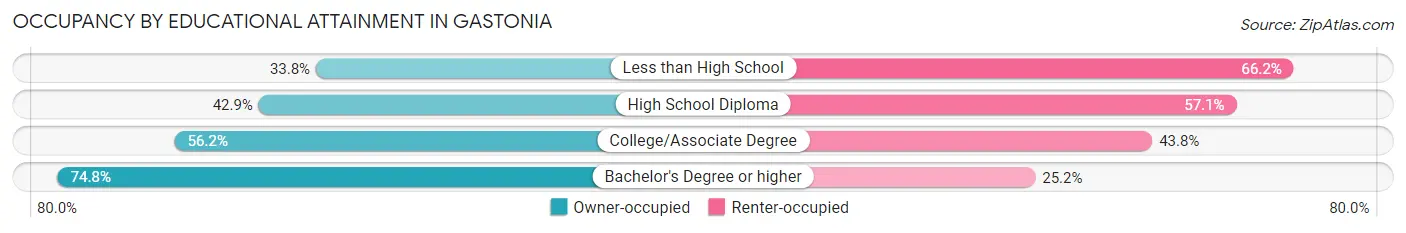
| Household Size | Owner-occupied | Renter-occupied |
| Less than High School | 1,233 (33.8%) | 2,416 (66.2%) |
| High School Diploma | 3,164 (42.9%) | 4,216 (57.1%) |
| College/Associate Degree | 6,265 (56.2%) | 4,878 (43.8%) |
| Bachelor's Degree or higher | 6,713 (74.8%) | 2,266 (25.2%) |
Occupancy by Age of Householder in Gastonia
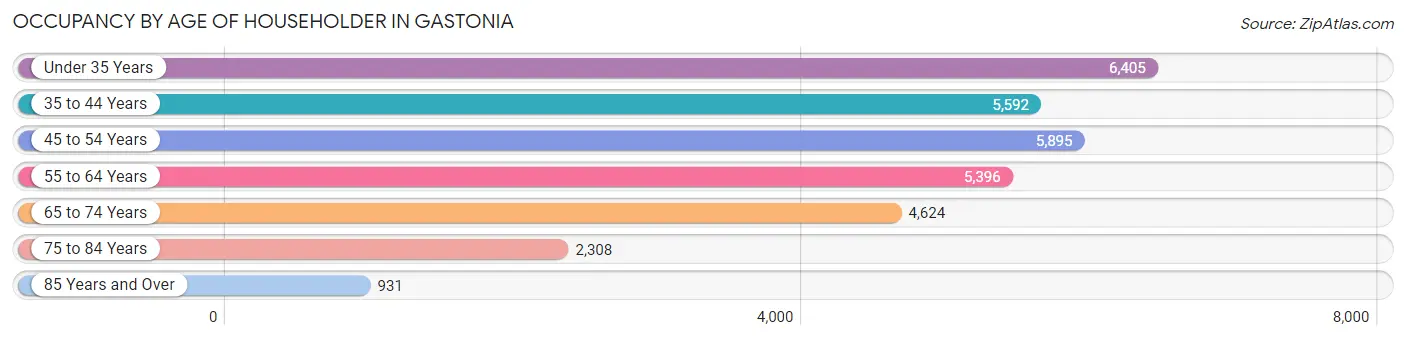
| Age Bracket | # Households | % Households |
| Under 35 Years | 6,405 | 20.6% |
| 35 to 44 Years | 5,592 | 17.9% |
| 45 to 54 Years | 5,895 | 18.9% |
| 55 to 64 Years | 5,396 | 17.3% |
| 65 to 74 Years | 4,624 | 14.8% |
| 75 to 84 Years | 2,308 | 7.4% |
| 85 Years and Over | 931 | 3.0% |
| Total | 31,151 | 100.0% |
Housing Finances in Gastonia
Median Income by Occupancy in Gastonia
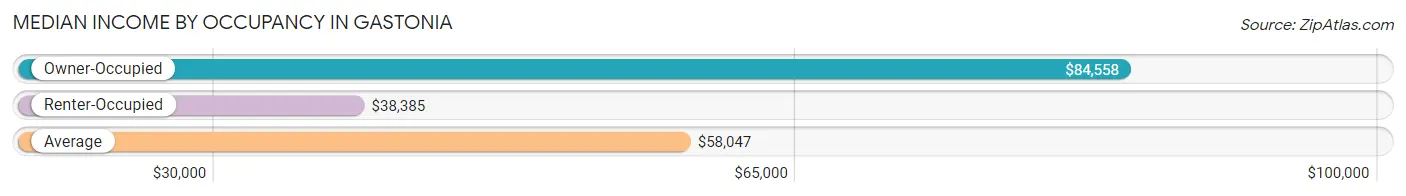
| Occupancy Type | # Households | Median Income |
| Owner-Occupied | 17,375 (55.8%) | $84,558 |
| Renter-Occupied | 13,776 (44.2%) | $38,385 |
| Average | 31,151 (100.0%) | $58,047 |
Occupancy by Householder Income Bracket in Gastonia
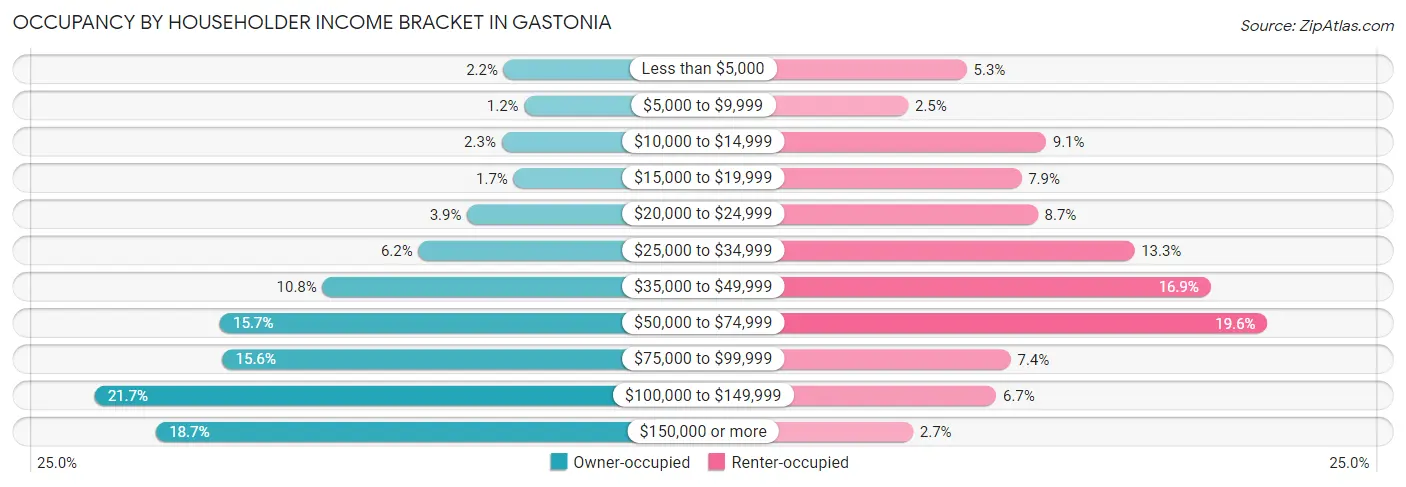
| Income Bracket | Owner-occupied | Renter-occupied |
| Less than $5,000 | 379 (2.2%) | 729 (5.3%) |
| $5,000 to $9,999 | 208 (1.2%) | 345 (2.5%) |
| $10,000 to $14,999 | 396 (2.3%) | 1,248 (9.1%) |
| $15,000 to $19,999 | 297 (1.7%) | 1,087 (7.9%) |
| $20,000 to $24,999 | 681 (3.9%) | 1,195 (8.7%) |
| $25,000 to $34,999 | 1,085 (6.2%) | 1,828 (13.3%) |
| $35,000 to $49,999 | 1,878 (10.8%) | 2,329 (16.9%) |
| $50,000 to $74,999 | 2,727 (15.7%) | 2,701 (19.6%) |
| $75,000 to $99,999 | 2,706 (15.6%) | 1,016 (7.4%) |
| $100,000 to $149,999 | 3,763 (21.7%) | 922 (6.7%) |
| $150,000 or more | 3,255 (18.7%) | 376 (2.7%) |
| Total | 17,375 (100.0%) | 13,776 (100.0%) |
Monthly Housing Cost Tiers in Gastonia
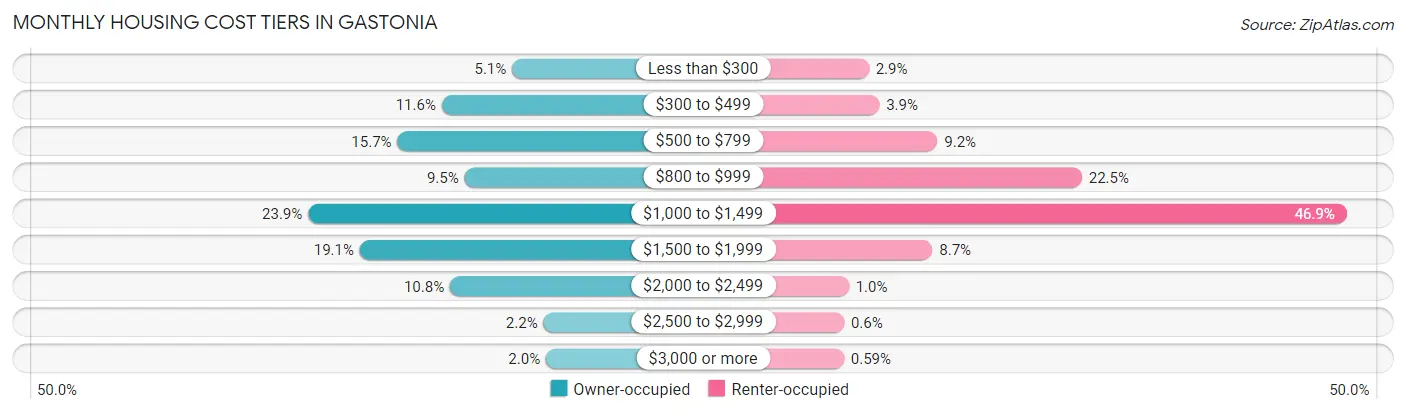
| Monthly Cost | Owner-occupied | Renter-occupied |
| Less than $300 | 889 (5.1%) | 397 (2.9%) |
| $300 to $499 | 2,016 (11.6%) | 530 (3.8%) |
| $500 to $799 | 2,725 (15.7%) | 1,267 (9.2%) |
| $800 to $999 | 1,651 (9.5%) | 3,100 (22.5%) |
| $1,000 to $1,499 | 4,152 (23.9%) | 6,458 (46.9%) |
| $1,500 to $1,999 | 3,325 (19.1%) | 1,204 (8.7%) |
| $2,000 to $2,499 | 1,883 (10.8%) | 143 (1.0%) |
| $2,500 to $2,999 | 387 (2.2%) | 83 (0.6%) |
| $3,000 or more | 347 (2.0%) | 81 (0.6%) |
| Total | 17,375 (100.0%) | 13,776 (100.0%) |
Physical Housing Characteristics in Gastonia
Housing Structures in Gastonia
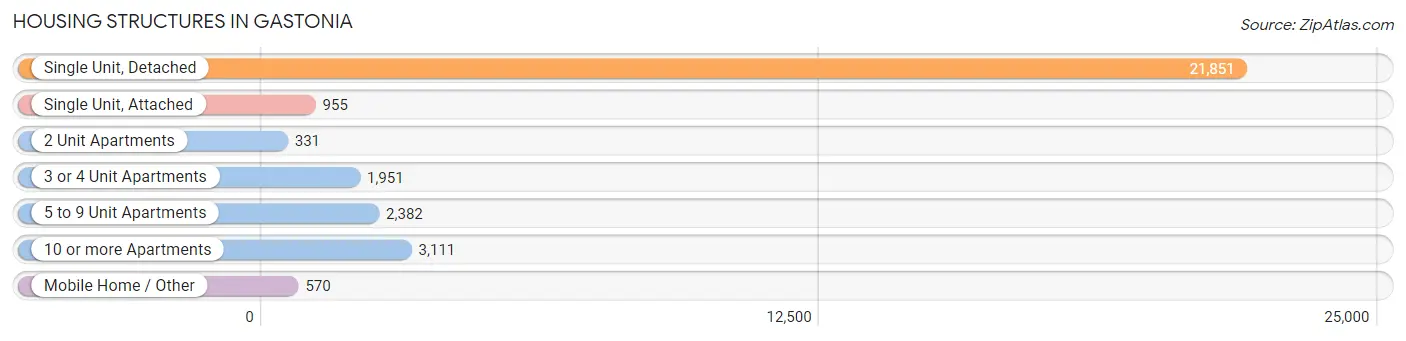
| Structure Type | # Housing Units | % Housing Units |
| Single Unit, Detached | 21,851 | 70.2% |
| Single Unit, Attached | 955 | 3.1% |
| 2 Unit Apartments | 331 | 1.1% |
| 3 or 4 Unit Apartments | 1,951 | 6.3% |
| 5 to 9 Unit Apartments | 2,382 | 7.6% |
| 10 or more Apartments | 3,111 | 10.0% |
| Mobile Home / Other | 570 | 1.8% |
| Total | 31,151 | 100.0% |
Housing Structures by Occupancy in Gastonia
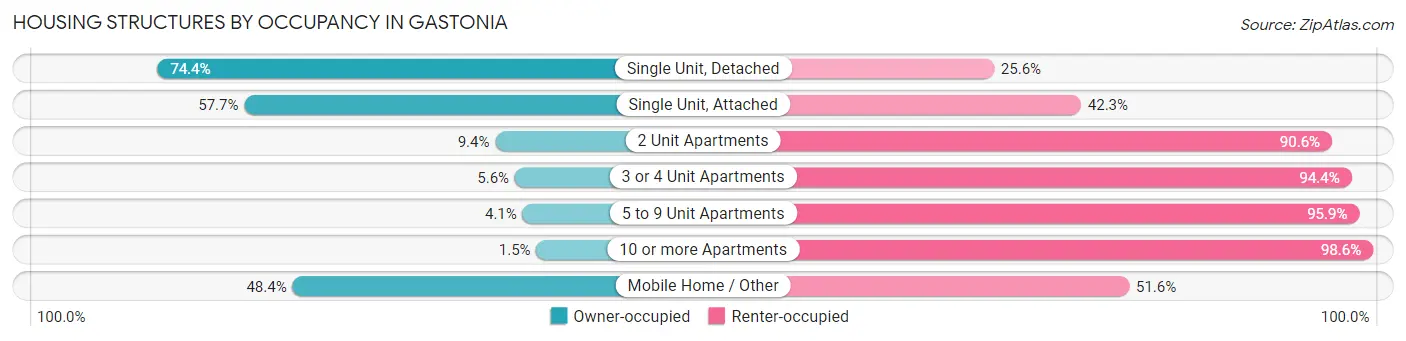
| Structure Type | Owner-occupied | Renter-occupied |
| Single Unit, Detached | 16,265 (74.4%) | 5,586 (25.6%) |
| Single Unit, Attached | 551 (57.7%) | 404 (42.3%) |
| 2 Unit Apartments | 31 (9.4%) | 300 (90.6%) |
| 3 or 4 Unit Apartments | 109 (5.6%) | 1,842 (94.4%) |
| 5 to 9 Unit Apartments | 98 (4.1%) | 2,284 (95.9%) |
| 10 or more Apartments | 45 (1.5%) | 3,066 (98.6%) |
| Mobile Home / Other | 276 (48.4%) | 294 (51.6%) |
| Total | 17,375 (55.8%) | 13,776 (44.2%) |
Housing Structures by Number of Rooms in Gastonia
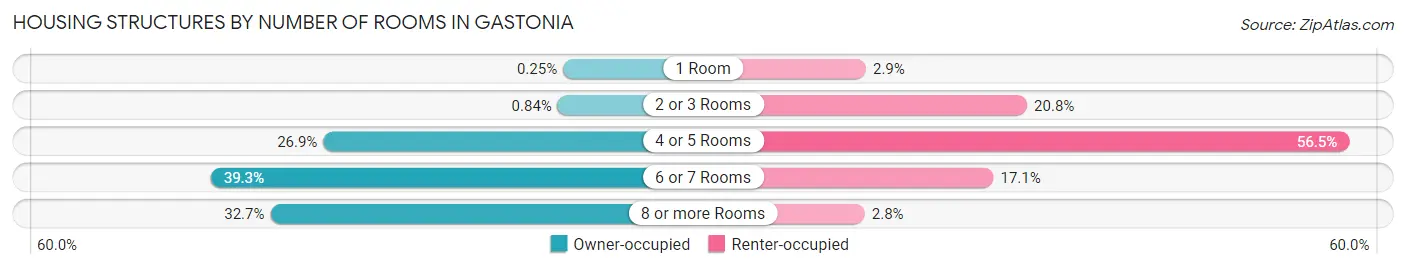
| Number of Rooms | Owner-occupied | Renter-occupied |
| 1 Room | 43 (0.3%) | 399 (2.9%) |
| 2 or 3 Rooms | 146 (0.8%) | 2,862 (20.8%) |
| 4 or 5 Rooms | 4,667 (26.9%) | 7,784 (56.5%) |
| 6 or 7 Rooms | 6,833 (39.3%) | 2,349 (17.1%) |
| 8 or more Rooms | 5,686 (32.7%) | 382 (2.8%) |
| Total | 17,375 (100.0%) | 13,776 (100.0%) |
Housing Structure by Heating Type in Gastonia
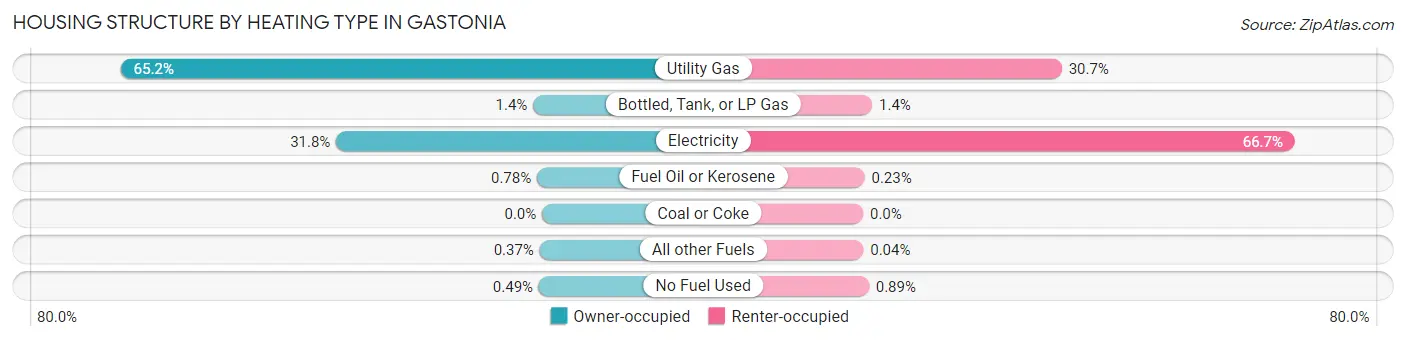
| Heating Type | Owner-occupied | Renter-occupied |
| Utility Gas | 11,320 (65.1%) | 4,230 (30.7%) |
| Bottled, Tank, or LP Gas | 239 (1.4%) | 193 (1.4%) |
| Electricity | 5,531 (31.8%) | 9,194 (66.7%) |
| Fuel Oil or Kerosene | 136 (0.8%) | 32 (0.2%) |
| Coal or Coke | 0 (0.0%) | 0 (0.0%) |
| All other Fuels | 64 (0.4%) | 5 (0.0%) |
| No Fuel Used | 85 (0.5%) | 122 (0.9%) |
| Total | 17,375 (100.0%) | 13,776 (100.0%) |
Household Vehicle Usage in Gastonia
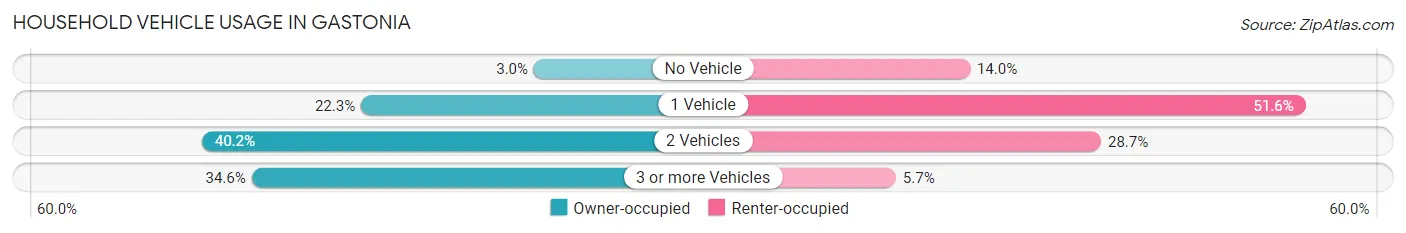
| Vehicles per Household | Owner-occupied | Renter-occupied |
| No Vehicle | 513 (2.9%) | 1,930 (14.0%) |
| 1 Vehicle | 3,878 (22.3%) | 7,108 (51.6%) |
| 2 Vehicles | 6,976 (40.2%) | 3,952 (28.7%) |
| 3 or more Vehicles | 6,008 (34.6%) | 786 (5.7%) |
| Total | 17,375 (100.0%) | 13,776 (100.0%) |
Real Estate & Mortgages in Gastonia
Real Estate and Mortgage Overview in Gastonia
| Characteristic | Without Mortgage | With Mortgage |
| Housing Units | 5,634 | 11,741 |
| Median Property Value | $181,600 | $238,400 |
| Median Household Income | $55,140 | $2,756 |
| Monthly Housing Costs | $494 | $347 |
| Real Estate Taxes | $1,832 | $200 |
Property Value by Mortgage Status in Gastonia
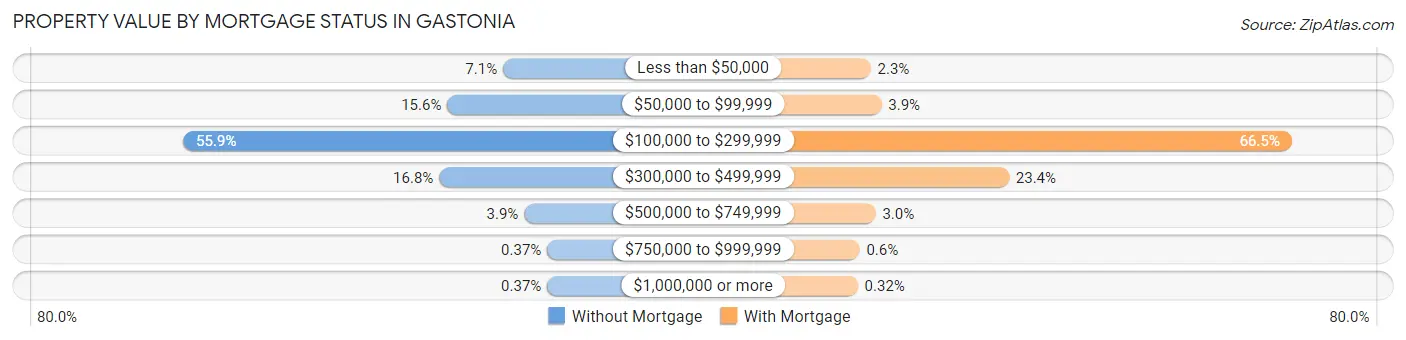
| Property Value | Without Mortgage | With Mortgage |
| Less than $50,000 | 400 (7.1%) | 270 (2.3%) |
| $50,000 to $99,999 | 879 (15.6%) | 461 (3.9%) |
| $100,000 to $299,999 | 3,147 (55.9%) | 7,803 (66.5%) |
| $300,000 to $499,999 | 948 (16.8%) | 2,743 (23.4%) |
| $500,000 to $749,999 | 218 (3.9%) | 356 (3.0%) |
| $750,000 to $999,999 | 21 (0.4%) | 70 (0.6%) |
| $1,000,000 or more | 21 (0.4%) | 38 (0.3%) |
| Total | 5,634 (100.0%) | 11,741 (100.0%) |
Household Income by Mortgage Status in Gastonia
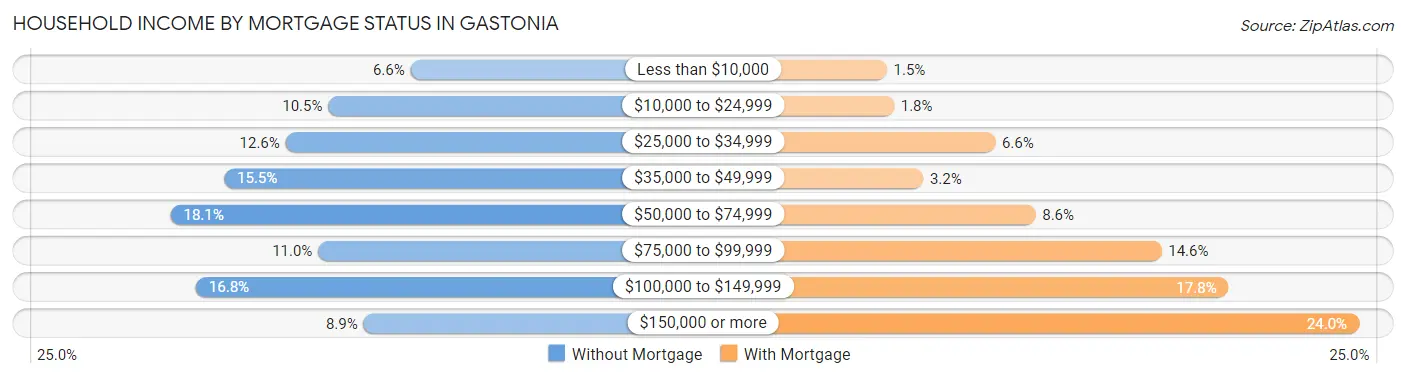
| Household Income | Without Mortgage | With Mortgage |
| Less than $10,000 | 373 (6.6%) | 174 (1.5%) |
| $10,000 to $24,999 | 594 (10.5%) | 214 (1.8%) |
| $25,000 to $34,999 | 708 (12.6%) | 780 (6.6%) |
| $35,000 to $49,999 | 873 (15.5%) | 377 (3.2%) |
| $50,000 to $74,999 | 1,017 (18.0%) | 1,005 (8.6%) |
| $75,000 to $99,999 | 621 (11.0%) | 1,710 (14.6%) |
| $100,000 to $149,999 | 949 (16.8%) | 2,085 (17.8%) |
| $150,000 or more | 499 (8.9%) | 2,814 (24.0%) |
| Total | 5,634 (100.0%) | 11,741 (100.0%) |
Property Value to Household Income Ratio in Gastonia
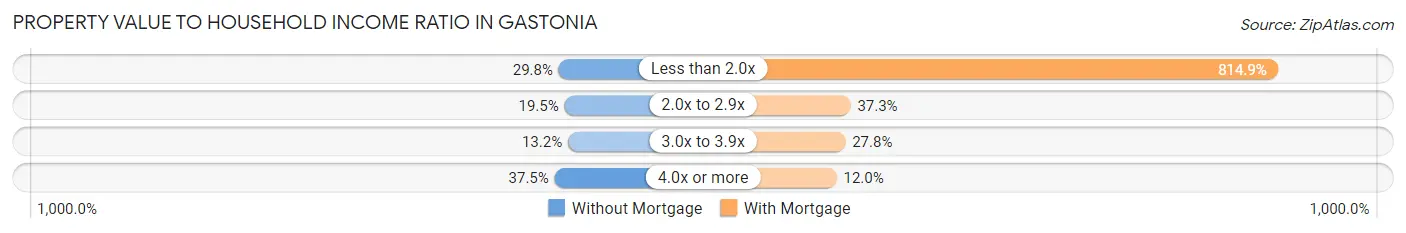
| Value-to-Income Ratio | Without Mortgage | With Mortgage |
| Less than 2.0x | 1,678 (29.8%) | 95,678 (814.9%) |
| 2.0x to 2.9x | 1,097 (19.5%) | 4,378 (37.3%) |
| 3.0x to 3.9x | 743 (13.2%) | 3,268 (27.8%) |
| 4.0x or more | 2,112 (37.5%) | 1,406 (12.0%) |
| Total | 5,634 (100.0%) | 11,741 (100.0%) |
Real Estate Taxes by Mortgage Status in Gastonia
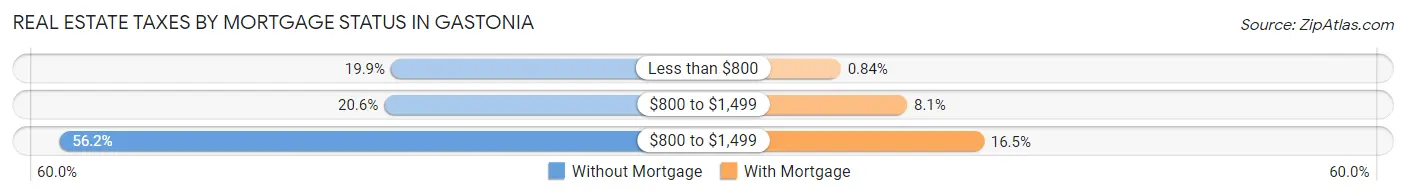
| Property Taxes | Without Mortgage | With Mortgage |
| Less than $800 | 1,119 (19.9%) | 99 (0.8%) |
| $800 to $1,499 | 1,161 (20.6%) | 952 (8.1%) |
| $800 to $1,499 | 3,166 (56.2%) | 1,940 (16.5%) |
| Total | 5,634 (100.0%) | 11,741 (100.0%) |
Health & Disability in Gastonia
Health Insurance Coverage by Age in Gastonia
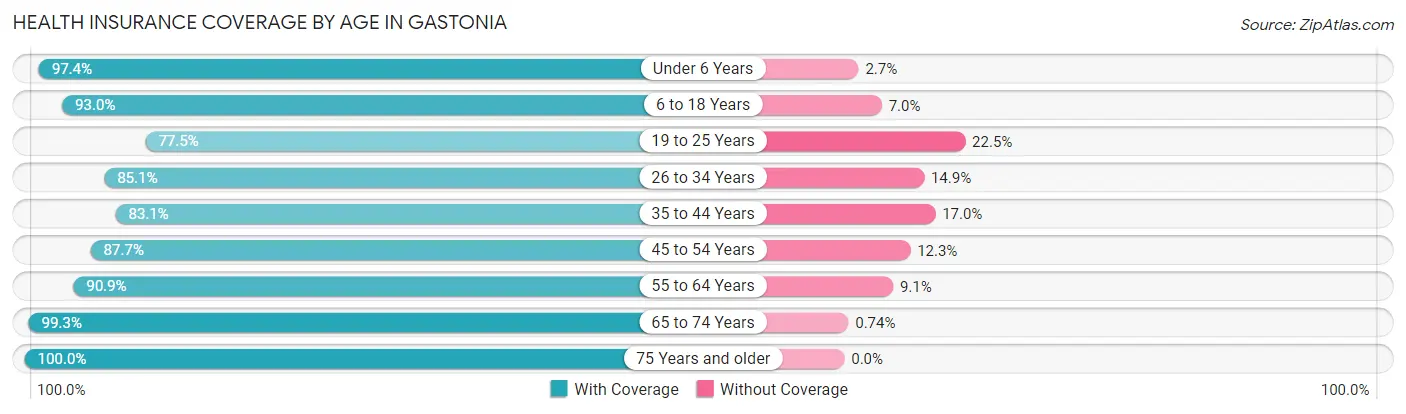
| Age Bracket | With Coverage | Without Coverage |
| Under 6 Years | 6,313 (97.4%) | 172 (2.6%) |
| 6 to 18 Years | 13,381 (93.0%) | 1,004 (7.0%) |
| 19 to 25 Years | 5,529 (77.5%) | 1,609 (22.5%) |
| 26 to 34 Years | 8,251 (85.1%) | 1,440 (14.9%) |
| 35 to 44 Years | 8,470 (83.1%) | 1,729 (17.0%) |
| 45 to 54 Years | 9,047 (87.7%) | 1,268 (12.3%) |
| 55 to 64 Years | 8,481 (90.9%) | 847 (9.1%) |
| 65 to 74 Years | 7,127 (99.3%) | 53 (0.7%) |
| 75 Years and older | 4,641 (100.0%) | 0 (0.0%) |
| Total | 71,240 (89.8%) | 8,122 (10.2%) |
Health Insurance Coverage by Citizenship Status in Gastonia
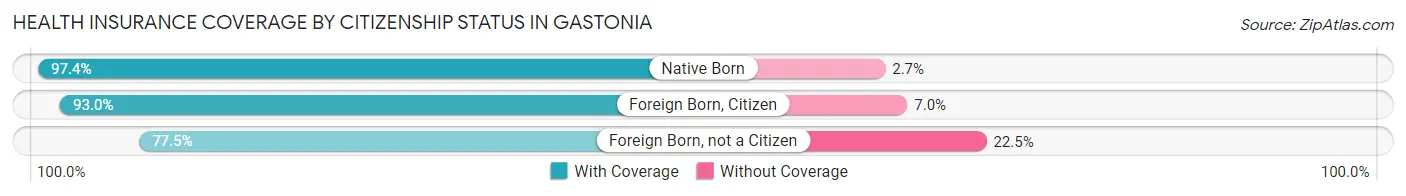
| Citizenship Status | With Coverage | Without Coverage |
| Native Born | 6,313 (97.4%) | 172 (2.6%) |
| Foreign Born, Citizen | 13,381 (93.0%) | 1,004 (7.0%) |
| Foreign Born, not a Citizen | 5,529 (77.5%) | 1,609 (22.5%) |
Health Insurance Coverage by Household Income in Gastonia
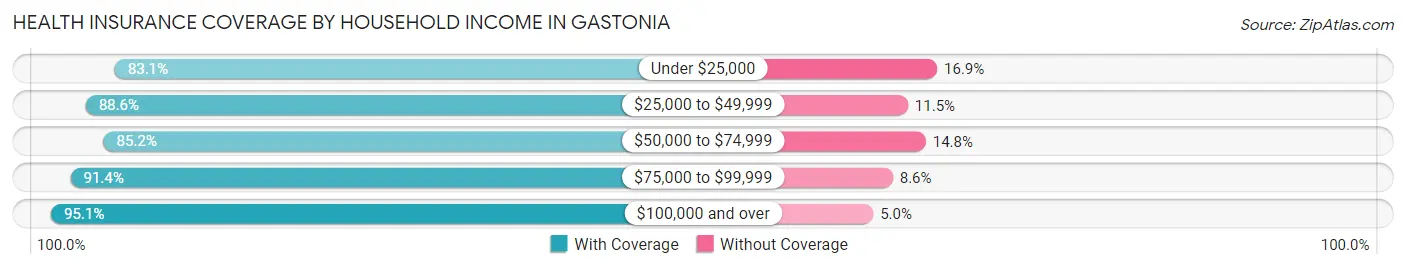
| Household Income | With Coverage | Without Coverage |
| Under $25,000 | 9,230 (83.1%) | 1,880 (16.9%) |
| $25,000 to $49,999 | 14,086 (88.5%) | 1,821 (11.5%) |
| $50,000 to $74,999 | 12,013 (85.2%) | 2,086 (14.8%) |
| $75,000 to $99,999 | 9,975 (91.4%) | 941 (8.6%) |
| $100,000 and over | 25,687 (95.1%) | 1,338 (5.0%) |
Public vs Private Health Insurance Coverage by Age in Gastonia
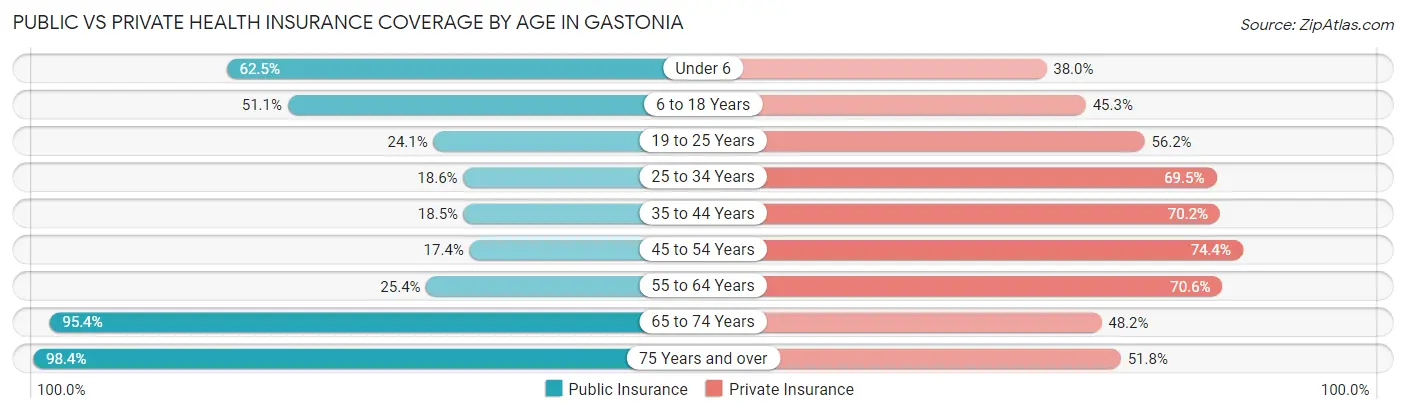
| Age Bracket | Public Insurance | Private Insurance |
| Under 6 | 4,054 (62.5%) | 2,461 (38.0%) |
| 6 to 18 Years | 7,357 (51.1%) | 6,514 (45.3%) |
| 19 to 25 Years | 1,720 (24.1%) | 4,010 (56.2%) |
| 25 to 34 Years | 1,798 (18.5%) | 6,734 (69.5%) |
| 35 to 44 Years | 1,883 (18.5%) | 7,158 (70.2%) |
| 45 to 54 Years | 1,794 (17.4%) | 7,677 (74.4%) |
| 55 to 64 Years | 2,371 (25.4%) | 6,589 (70.6%) |
| 65 to 74 Years | 6,850 (95.4%) | 3,458 (48.2%) |
| 75 Years and over | 4,568 (98.4%) | 2,403 (51.8%) |
| Total | 32,395 (40.8%) | 47,004 (59.2%) |
Disability Status by Sex by Age in Gastonia
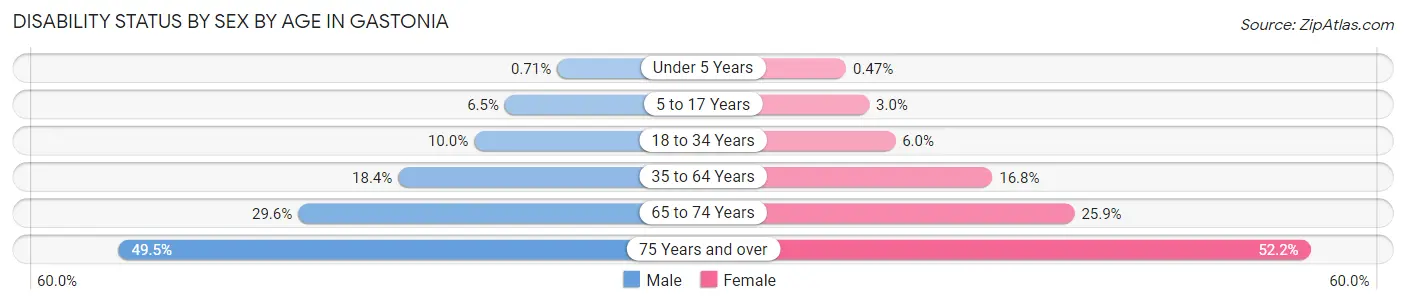
| Age Bracket | Male | Female |
| Under 5 Years | 21 (0.7%) | 11 (0.5%) |
| 5 to 17 Years | 507 (6.5%) | 209 (3.0%) |
| 18 to 34 Years | 833 (10.0%) | 558 (5.9%) |
| 35 to 64 Years | 2,603 (18.4%) | 2,631 (16.8%) |
| 65 to 74 Years | 906 (29.5%) | 1,066 (25.9%) |
| 75 Years and over | 930 (49.5%) | 1,442 (52.2%) |
Disability Class by Sex by Age in Gastonia
Disability Class: Hearing Difficulty
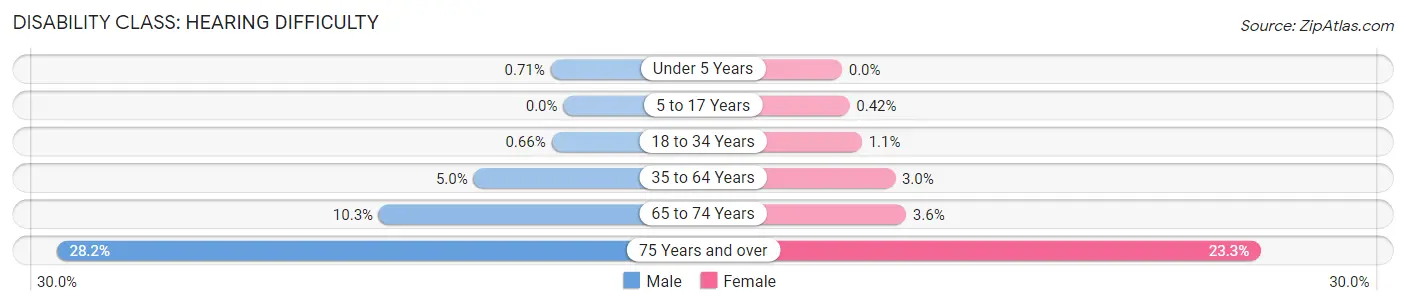
| Age Bracket | Male | Female |
| Under 5 Years | 21 (0.7%) | 0 (0.0%) |
| 5 to 17 Years | 0 (0.0%) | 29 (0.4%) |
| 18 to 34 Years | 55 (0.7%) | 104 (1.1%) |
| 35 to 64 Years | 707 (5.0%) | 465 (3.0%) |
| 65 to 74 Years | 315 (10.3%) | 147 (3.6%) |
| 75 Years and over | 530 (28.2%) | 645 (23.3%) |
Disability Class: Vision Difficulty
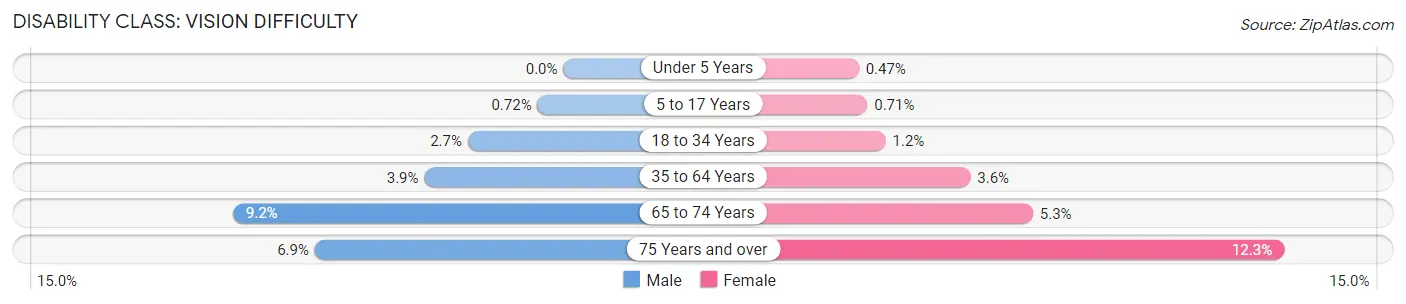
| Age Bracket | Male | Female |
| Under 5 Years | 0 (0.0%) | 11 (0.5%) |
| 5 to 17 Years | 56 (0.7%) | 49 (0.7%) |
| 18 to 34 Years | 223 (2.7%) | 114 (1.2%) |
| 35 to 64 Years | 547 (3.9%) | 562 (3.6%) |
| 65 to 74 Years | 282 (9.2%) | 219 (5.3%) |
| 75 Years and over | 130 (6.9%) | 340 (12.3%) |
Disability Class: Cognitive Difficulty
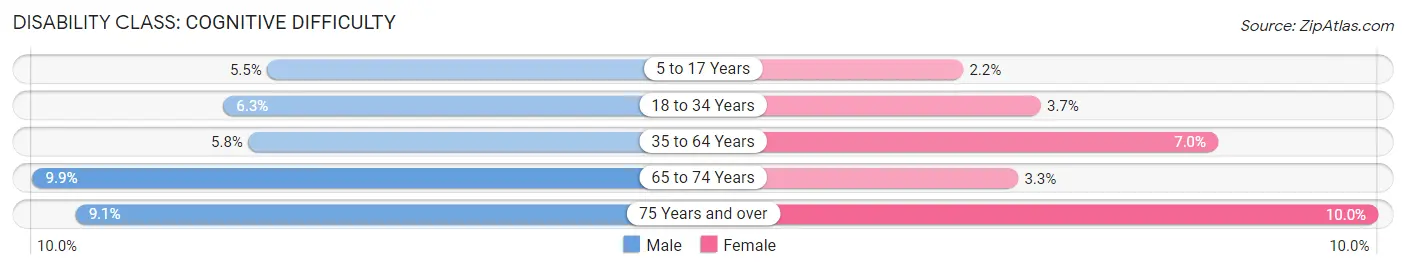
| Age Bracket | Male | Female |
| 5 to 17 Years | 427 (5.5%) | 154 (2.2%) |
| 18 to 34 Years | 528 (6.3%) | 345 (3.7%) |
| 35 to 64 Years | 826 (5.8%) | 1,096 (7.0%) |
| 65 to 74 Years | 302 (9.9%) | 134 (3.3%) |
| 75 Years and over | 170 (9.0%) | 275 (10.0%) |
Disability Class: Ambulatory Difficulty
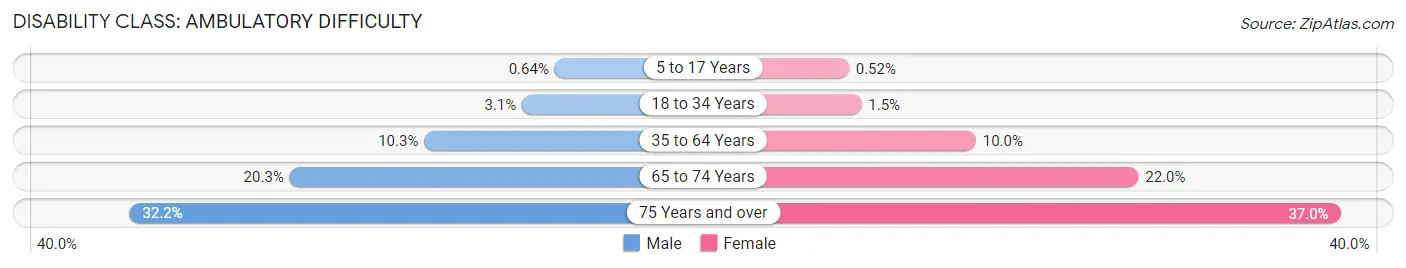
| Age Bracket | Male | Female |
| 5 to 17 Years | 50 (0.6%) | 36 (0.5%) |
| 18 to 34 Years | 256 (3.1%) | 136 (1.5%) |
| 35 to 64 Years | 1,461 (10.3%) | 1,562 (10.0%) |
| 65 to 74 Years | 623 (20.3%) | 906 (22.0%) |
| 75 Years and over | 605 (32.2%) | 1,023 (37.0%) |
Disability Class: Self-Care Difficulty
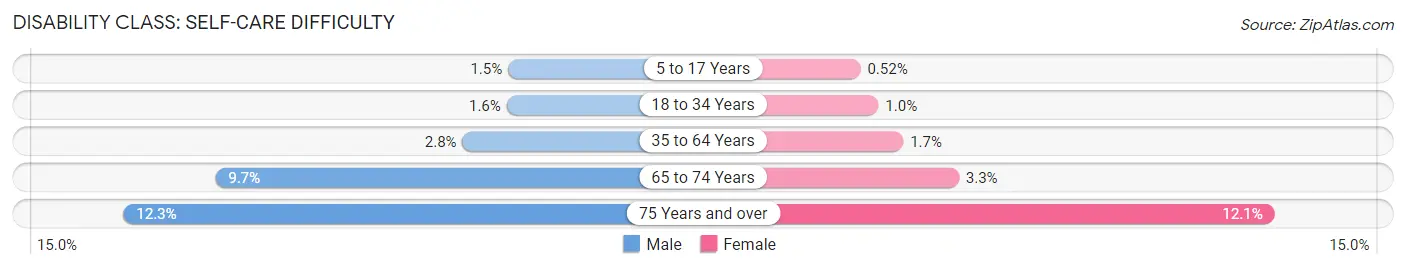
| Age Bracket | Male | Female |
| 5 to 17 Years | 120 (1.5%) | 36 (0.5%) |
| 18 to 34 Years | 132 (1.6%) | 96 (1.0%) |
| 35 to 64 Years | 398 (2.8%) | 268 (1.7%) |
| 65 to 74 Years | 297 (9.7%) | 134 (3.3%) |
| 75 Years and over | 230 (12.2%) | 333 (12.0%) |
Technology Access in Gastonia
Computing Device Access in Gastonia
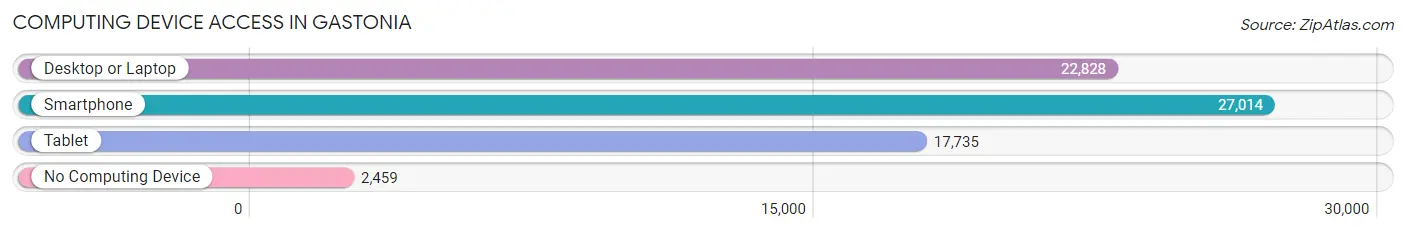
| Device Type | # Households | % Households |
| Desktop or Laptop | 22,828 | 73.3% |
| Smartphone | 27,014 | 86.7% |
| Tablet | 17,735 | 56.9% |
| No Computing Device | 2,459 | 7.9% |
| Total | 31,151 | 100.0% |
Internet Access in Gastonia
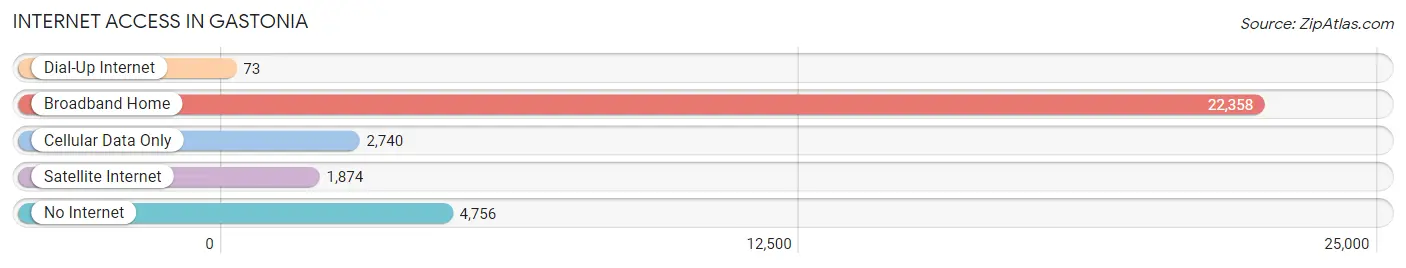
| Internet Type | # Households | % Households |
| Dial-Up Internet | 73 | 0.2% |
| Broadband Home | 22,358 | 71.8% |
| Cellular Data Only | 2,740 | 8.8% |
| Satellite Internet | 1,874 | 6.0% |
| No Internet | 4,756 | 15.3% |
| Total | 31,151 | 100.0% |
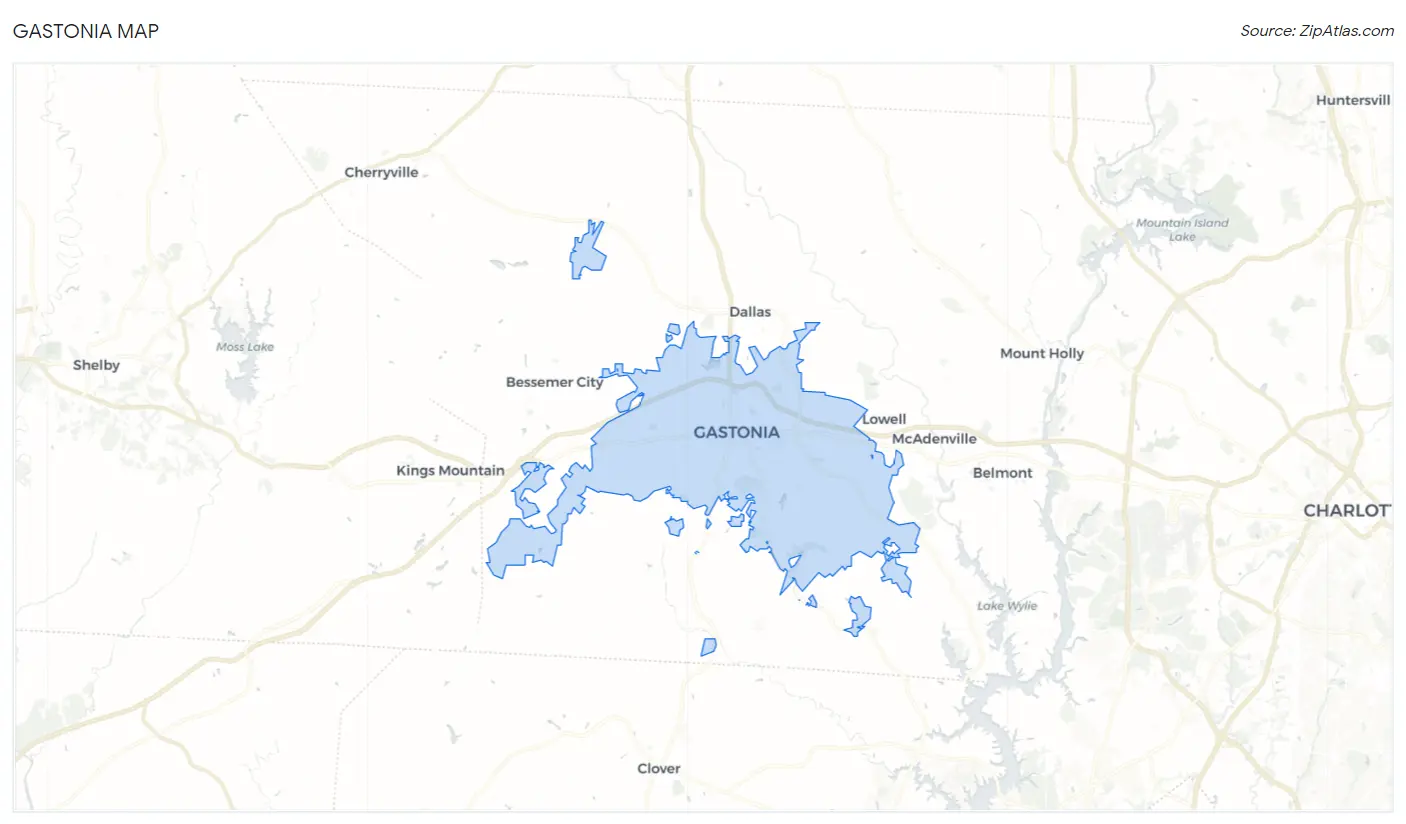
Gastonia Summary
Gastonia is a city located in Gaston County, North Carolina, United States. It is the county seat and largest city of Gaston County. The population was 71,741 at the 2010 census, and it is the second-largest city in the Charlotte metropolitan area. Gastonia is the 13th-largest city in North Carolina. It is part of the Charlotte-Gastonia-Concord Combined Statistical Area.
Geography
Gastonia is located in the Piedmont region of North Carolina, approximately 25 miles west of Charlotte. It is situated in the foothills of the Blue Ridge Mountains, and is bordered by the Catawba River to the east and the South Fork Catawba River to the west. The city is located in the heart of the Carolina Piedmont, a region of rolling hills and valleys.
The city has a total area of 44.3 square miles, of which 44.2 square miles is land and 0.1 square miles is water.
History
Gastonia was founded in 1877 by William Gaston, a prominent lawyer and politician from Raleigh. The city was named after him, and it quickly became a center of industry and commerce. Gastonia was incorporated in 1877 and became a city in 1883.
The city grew rapidly in the late 19th and early 20th centuries, due to its proximity to Charlotte and the abundance of natural resources in the area. The city was home to several cotton mills, and it was also a major center for the production of furniture and textiles.
Economy
Gastonia is a major center for manufacturing and industry. The city is home to several large companies, including CaroMont Health, a major healthcare provider, and Parkdale Mills, a major textile manufacturer. The city is also home to several smaller businesses, including restaurants, retail stores, and service providers.
Gastonia is also home to several educational institutions, including Gaston College, a two-year community college, and Gaston Day School, a private K-12 school.
Demographics
As of the 2010 census, the population of Gastonia was 71,741. The racial makeup of the city was 63.2% White, 28.3% African American, 0.4% Native American, 1.2% Asian, 0.1% Pacific Islander, 4.7% from other races, and 2.1% from two or more races. Hispanic or Latino of any race were 8.7% of the population.
The median income for a household in the city was $37,837, and the median income for a family was $45,945. The per capita income for the city was $20,945. About 17.2% of families and 20.7% of the population were below the poverty line, including 30.2% of those under age 18 and 11.2% of those age 65 or over.
Conclusion
Gastonia is a city located in Gaston County, North Carolina. It is the county seat and largest city of Gaston County, and it is the 13th-largest city in North Carolina. Gastonia is situated in the foothills of the Blue Ridge Mountains, and it is part of the Charlotte-Gastonia-Concord Combined Statistical Area. The city was founded in 1877 and has since become a major center for manufacturing and industry. The population of Gastonia was 71,741 at the 2010 census, and the median income for a household in the city was $37,837. Gastonia is home to several large companies, educational institutions, and smaller businesses.
Common Questions
What is Per Capita Income in Gastonia?
Per Capita income in Gastonia is $31,832.
What is the Median Family Income in Gastonia?
Median Family Income in Gastonia is $75,062.
What is the Median Household income in Gastonia?
Median Household Income in Gastonia is $58,047.
What is Income or Wage Gap in Gastonia?
Income or Wage Gap in Gastonia is 24.3%.
Women in Gastonia earn 75.7 cents for every dollar earned by a man.
What is Family Income Deficit in Gastonia?
Family Income Deficit in Gastonia is $11,602.
Families that are below poverty line in Gastonia earn $11,602 less on average than the poverty threshold level.
What is Inequality or Gini Index in Gastonia?
Inequality or Gini Index in Gastonia is 0.46.
What is the Total Population of Gastonia?
Total Population of Gastonia is 80,615.
What is the Total Male Population of Gastonia?
Total Male Population of Gastonia is 38,852.
What is the Total Female Population of Gastonia?
Total Female Population of Gastonia is 41,763.
What is the Ratio of Males per 100 Females in Gastonia?
There are 93.03 Males per 100 Females in Gastonia.
What is the Ratio of Females per 100 Males in Gastonia?
There are 107.49 Females per 100 Males in Gastonia.
What is the Median Population Age in Gastonia?
Median Population Age in Gastonia is 37.8 Years.
What is the Average Family Size in Gastonia
Average Family Size in Gastonia is 3.2 People.
What is the Average Household Size in Gastonia
Average Household Size in Gastonia is 2.5 People.
How Large is the Labor Force in Gastonia?
There are 40,321 People in the Labor Forcein in Gastonia.
What is the Percentage of People in the Labor Force in Gastonia?
64.2% of People are in the Labor Force in Gastonia.
What is the Unemployment Rate in Gastonia?
Unemployment Rate in Gastonia is 5.6%.