Indian Trail, NC Map & Demographics
Indian Trail Map
Indian Trail Overview
$40,108
PER CAPITA INCOME
$109,425
AVG FAMILY INCOME
$95,101
AVG HOUSEHOLD INCOME
33.5%
WAGE / INCOME GAP [ % ]
66.5¢/ $1
WAGE / INCOME GAP [ $ ]
$14,107
FAMILY INCOME DEFICIT
0.39
INEQUALITY / GINI INDEX
40,325
TOTAL POPULATION
19,947
MALE POPULATION
20,378
FEMALE POPULATION
97.88
MALES / 100 FEMALES
102.16
FEMALES / 100 MALES
36.1
MEDIAN AGE
3.5
AVG FAMILY SIZE
3.1
AVG HOUSEHOLD SIZE
23,093
LABOR FORCE [ PEOPLE ]
76.0%
PERCENT IN LABOR FORCE
5.3%
UNEMPLOYMENT RATE
Indian Trail Zip Codes
Indian Trail Area Codes
Income in Indian Trail
Income Overview in Indian Trail
Per Capita Income in Indian Trail is $40,108, while median incomes of families and households are $109,425 and $95,101 respectively.
| Characteristic | Number | Measure |
| Per Capita Income | 40,325 | $40,108 |
| Median Family Income | 10,570 | $109,425 |
| Mean Family Income | 10,570 | $132,803 |
| Median Household Income | 13,078 | $95,101 |
| Mean Household Income | 13,078 | $121,305 |
| Income Deficit | 10,570 | $14,107 |
| Wage / Income Gap (%) | 40,325 | 33.55% |
| Wage / Income Gap ($) | 40,325 | 66.45¢ per $1 |
| Gini / Inequality Index | 40,325 | 0.39 |
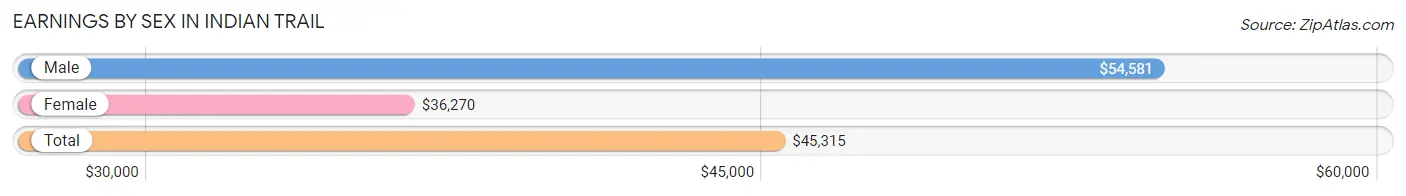
Earnings by Sex in Indian Trail
Average Earnings in Indian Trail are $45,315, $54,581 for men and $36,270 for women, a difference of 33.6%.
| Sex | Number | Average Earnings |
| Male | 12,694 (53.3%) | $54,581 |
| Female | 11,138 (46.7%) | $36,270 |
| Total | 23,832 (100.0%) | $45,315 |
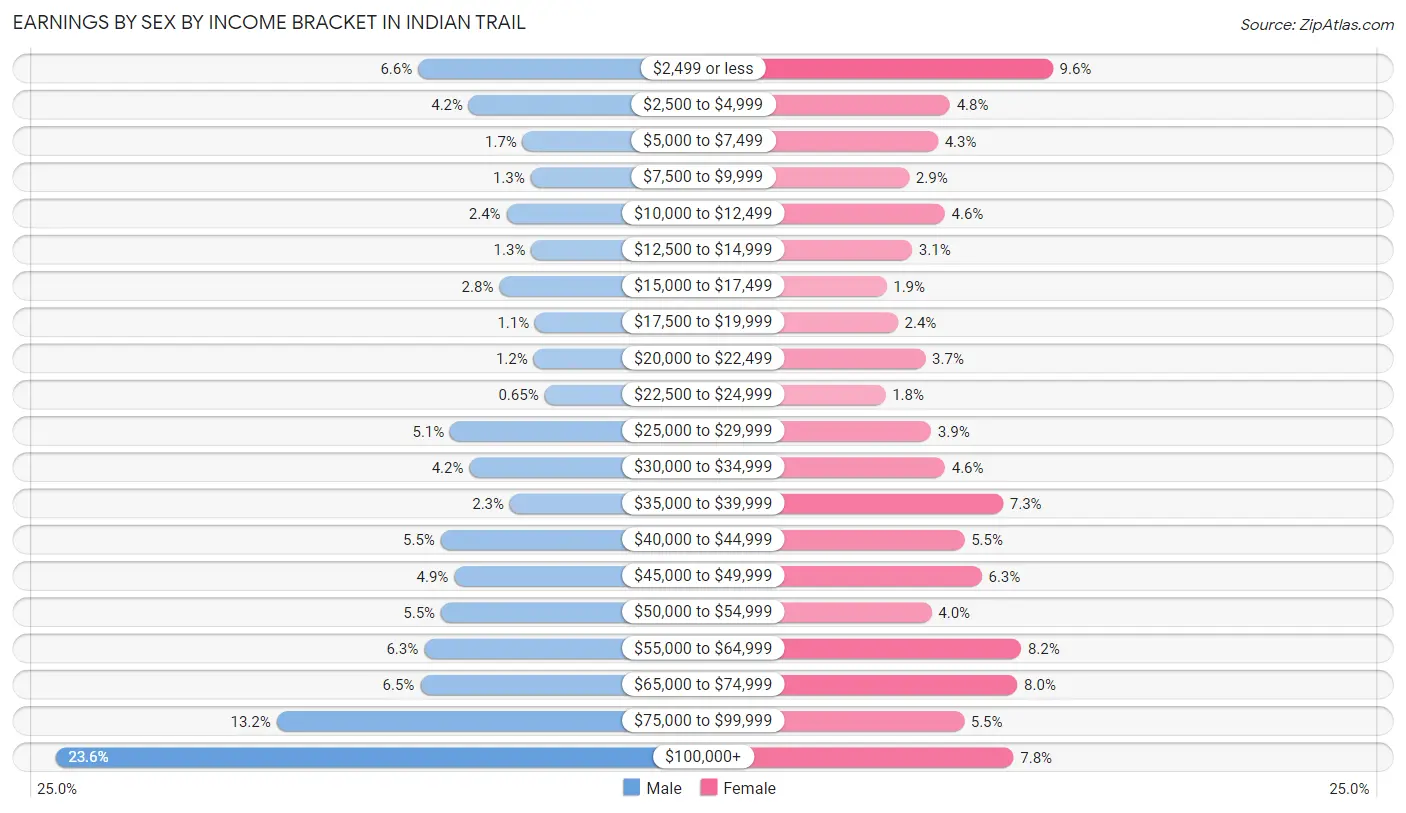
Earnings by Sex by Income Bracket in Indian Trail
The most common earnings brackets in Indian Trail are $100,000+ for men (2,991 | 23.6%) and $2,499 or less for women (1,074 | 9.6%).
| Income | Male | Female |
| $2,499 or less | 834 (6.6%) | 1,074 (9.6%) |
| $2,500 to $4,999 | 532 (4.2%) | 537 (4.8%) |
| $5,000 to $7,499 | 212 (1.7%) | 474 (4.3%) |
| $7,500 to $9,999 | 165 (1.3%) | 324 (2.9%) |
| $10,000 to $12,499 | 308 (2.4%) | 510 (4.6%) |
| $12,500 to $14,999 | 161 (1.3%) | 340 (3.0%) |
| $15,000 to $17,499 | 352 (2.8%) | 206 (1.8%) |
| $17,500 to $19,999 | 138 (1.1%) | 265 (2.4%) |
| $20,000 to $22,499 | 147 (1.2%) | 409 (3.7%) |
| $22,500 to $24,999 | 83 (0.6%) | 201 (1.8%) |
| $25,000 to $29,999 | 644 (5.1%) | 439 (3.9%) |
| $30,000 to $34,999 | 529 (4.2%) | 511 (4.6%) |
| $35,000 to $39,999 | 288 (2.3%) | 814 (7.3%) |
| $40,000 to $44,999 | 699 (5.5%) | 613 (5.5%) |
| $45,000 to $49,999 | 619 (4.9%) | 703 (6.3%) |
| $50,000 to $54,999 | 698 (5.5%) | 441 (4.0%) |
| $55,000 to $64,999 | 798 (6.3%) | 909 (8.2%) |
| $65,000 to $74,999 | 821 (6.5%) | 889 (8.0%) |
| $75,000 to $99,999 | 1,675 (13.2%) | 610 (5.5%) |
| $100,000+ | 2,991 (23.6%) | 869 (7.8%) |
| Total | 12,694 (100.0%) | 11,138 (100.0%) |
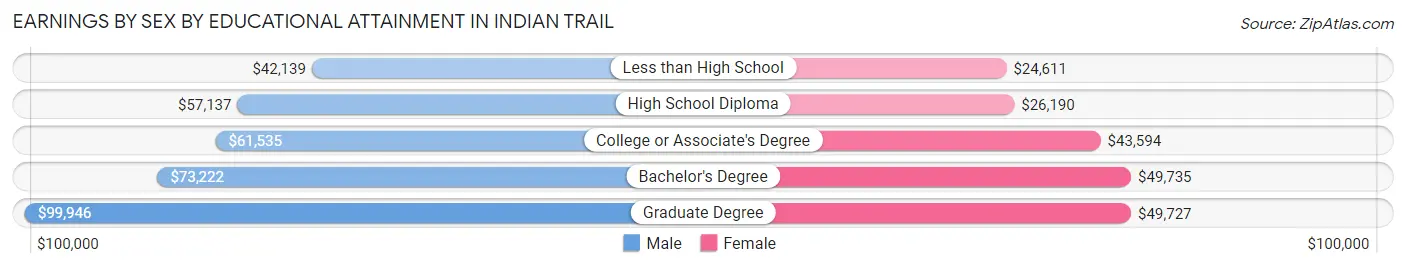
Earnings by Sex by Educational Attainment in Indian Trail
Average earnings in Indian Trail are $66,792 for men and $43,628 for women, a difference of 34.7%. Men with an educational attainment of graduate degree enjoy the highest average annual earnings of $99,946, while those with less than high school education earn the least with $42,139. Women with an educational attainment of bachelor's degree earn the most with the average annual earnings of $49,735, while those with less than high school education have the smallest earnings of $24,611.
| Educational Attainment | Male Income | Female Income |
| Less than High School | $42,139 | $24,611 |
| High School Diploma | $57,137 | $26,190 |
| College or Associate's Degree | $61,535 | $43,594 |
| Bachelor's Degree | $73,222 | $49,735 |
| Graduate Degree | $99,946 | $49,727 |
| Total | $66,792 | $43,628 |
Family Income in Indian Trail
Family Income Brackets in Indian Trail
According to the Indian Trail family income data, there are 2,442 families falling into the $100,000 to $149,999 income range, which is the most common income bracket and makes up 23.1% of all families. Conversely, the $10,000 to $14,999 income bracket is the least frequent group with only 63 families (0.6%) belonging to this category.
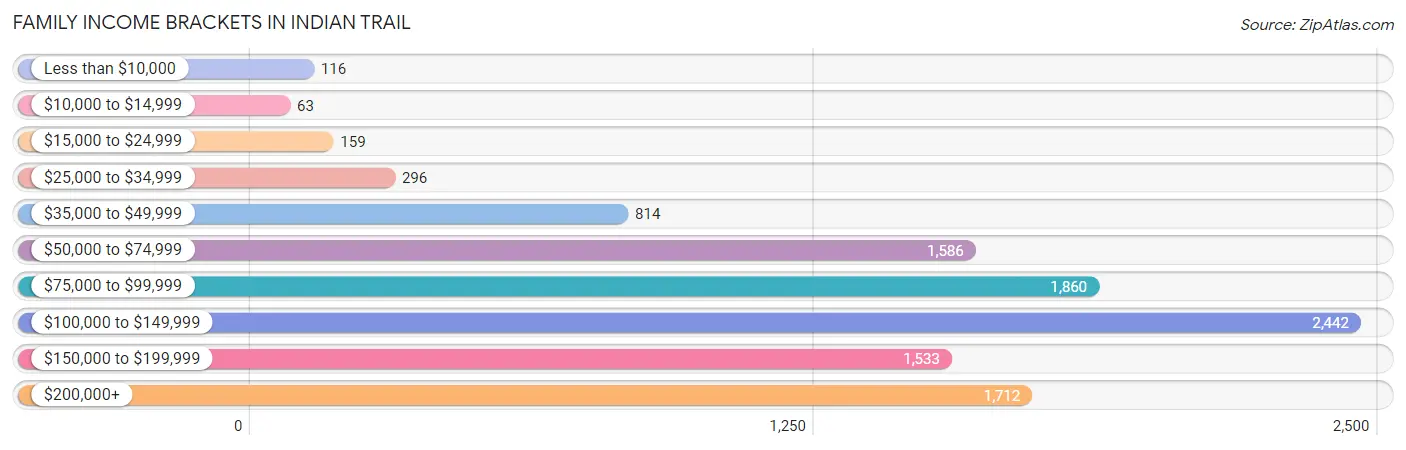
| Income Bracket | # Families | % Families |
| Less than $10,000 | 116 | 1.1% |
| $10,000 to $14,999 | 63 | 0.6% |
| $15,000 to $24,999 | 159 | 1.5% |
| $25,000 to $34,999 | 296 | 2.8% |
| $35,000 to $49,999 | 814 | 7.7% |
| $50,000 to $74,999 | 1,586 | 15.0% |
| $75,000 to $99,999 | 1,860 | 17.6% |
| $100,000 to $149,999 | 2,442 | 23.1% |
| $150,000 to $199,999 | 1,533 | 14.5% |
| $200,000+ | 1,712 | 16.2% |
Family Income by Famaliy Size in Indian Trail
5-person families (1,116 | 10.6%) account for the highest median family income in Indian Trail with $128,143 per family, while 3-person families (2,178 | 20.6%) have the highest median income of $41,463 per family member.
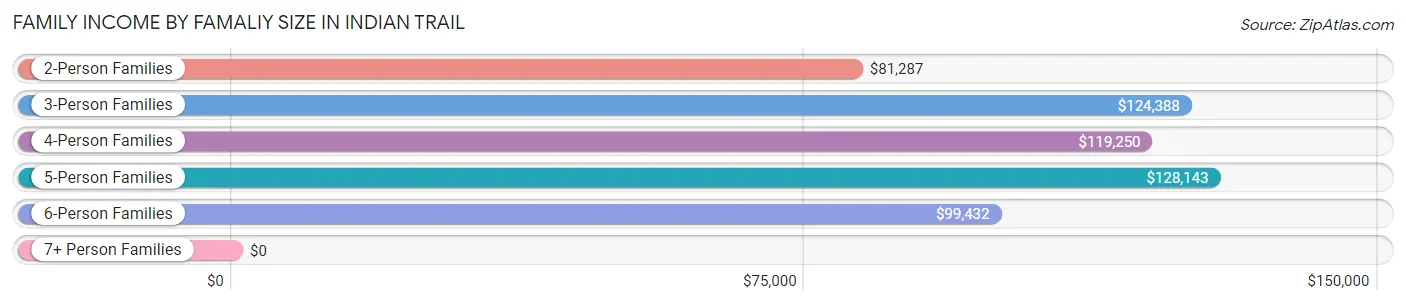
| Income Bracket | # Families | Median Income |
| 2-Person Families | 3,798 (35.9%) | $81,287 |
| 3-Person Families | 2,178 (20.6%) | $124,388 |
| 4-Person Families | 2,898 (27.4%) | $119,250 |
| 5-Person Families | 1,116 (10.6%) | $128,143 |
| 6-Person Families | 328 (3.1%) | $99,432 |
| 7+ Person Families | 252 (2.4%) | $0 |
| Total | 10,570 (100.0%) | $109,425 |
Family Income by Number of Earners in Indian Trail
The median family income in Indian Trail is $109,425, with families comprising 3+ earners (2,188) having the highest median family income of $128,867, while families with no earners (733) have the lowest median family income of $61,653, accounting for 20.7% and 6.9% of families, respectively.
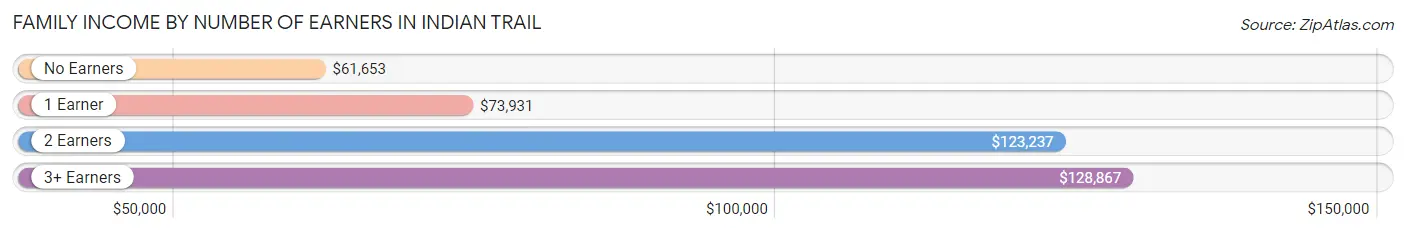
| Number of Earners | # Families | Median Income |
| No Earners | 733 (6.9%) | $61,653 |
| 1 Earner | 2,255 (21.3%) | $73,931 |
| 2 Earners | 5,394 (51.0%) | $123,237 |
| 3+ Earners | 2,188 (20.7%) | $128,867 |
| Total | 10,570 (100.0%) | $109,425 |
Household Income in Indian Trail
Household Income Brackets in Indian Trail
With 2,799 households falling in the category, the $100,000 to $149,999 income range is the most frequent in Indian Trail, accounting for 21.4% of all households. In contrast, only 105 households (0.8%) fall into the $10,000 to $14,999 income bracket, making it the least populous group.
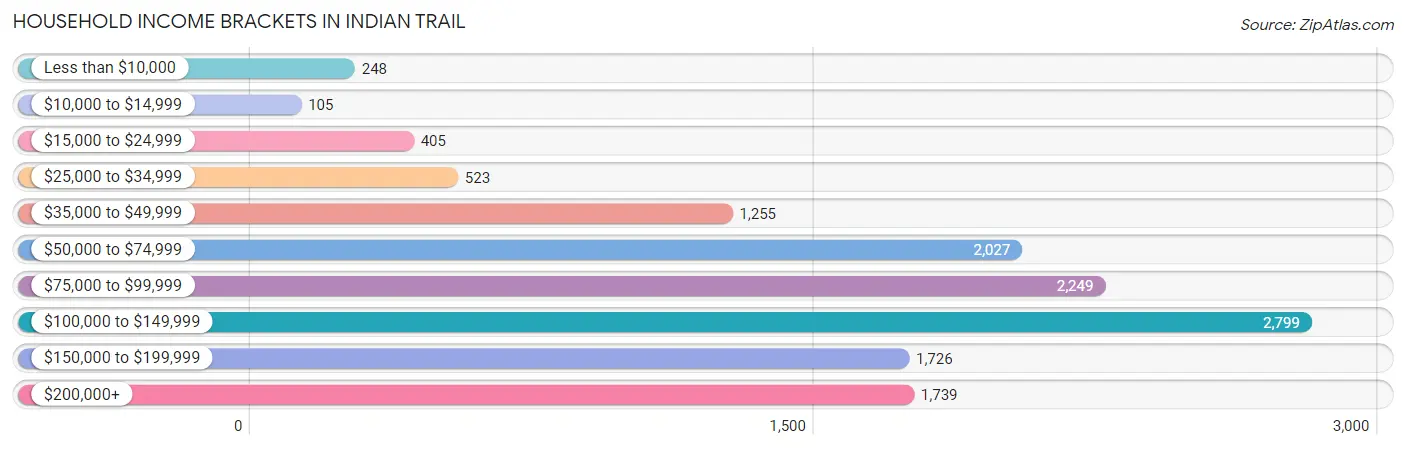
| Income Bracket | # Households | % Households |
| Less than $10,000 | 248 | 1.9% |
| $10,000 to $14,999 | 105 | 0.8% |
| $15,000 to $24,999 | 405 | 3.1% |
| $25,000 to $34,999 | 523 | 4.0% |
| $35,000 to $49,999 | 1,255 | 9.6% |
| $50,000 to $74,999 | 2,027 | 15.5% |
| $75,000 to $99,999 | 2,249 | 17.2% |
| $100,000 to $149,999 | 2,799 | 21.4% |
| $150,000 to $199,999 | 1,726 | 13.2% |
| $200,000+ | 1,739 | 13.3% |
Household Income by Householder Age in Indian Trail
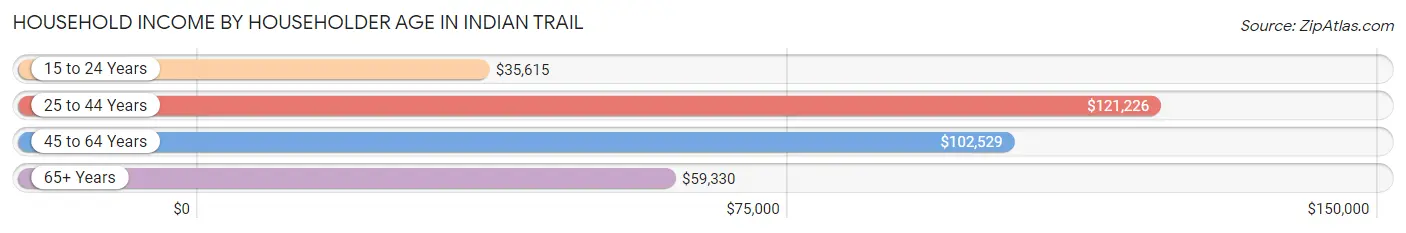
The median household income in Indian Trail is $95,101, with the highest median household income of $121,226 found in the 25 to 44 years age bracket for the primary householder. A total of 4,951 households (37.9%) fall into this category. Meanwhile, the 15 to 24 years age bracket for the primary householder has the lowest median household income of $35,615, with 184 households (1.4%) in this group.
| Income Bracket | # Households | Median Income |
| 15 to 24 Years | 184 (1.4%) | $35,615 |
| 25 to 44 Years | 4,951 (37.9%) | $121,226 |
| 45 to 64 Years | 5,924 (45.3%) | $102,529 |
| 65+ Years | 2,019 (15.4%) | $59,330 |
| Total | 13,078 (100.0%) | $95,101 |
Poverty in Indian Trail
Income Below Poverty by Sex and Age in Indian Trail
With 3.9% poverty level for males and 4.4% for females among the residents of Indian Trail, 5 year old males and 75 year old and over females are the most vulnerable to poverty, with 22 males (12.0%) and 69 females (10.2%) in their respective age groups living below the poverty level.
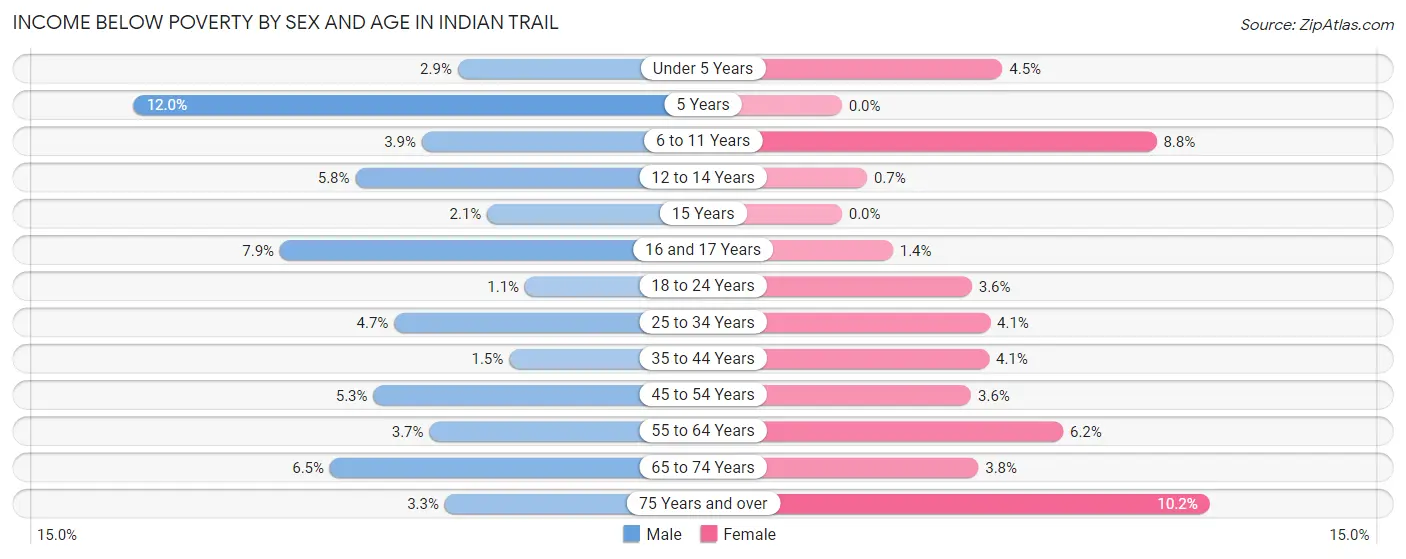
| Age Bracket | Male | Female |
| Under 5 Years | 38 (2.9%) | 62 (4.5%) |
| 5 Years | 22 (12.0%) | 0 (0.0%) |
| 6 to 11 Years | 68 (3.9%) | 147 (8.8%) |
| 12 to 14 Years | 67 (5.8%) | 7 (0.7%) |
| 15 Years | 8 (2.1%) | 0 (0.0%) |
| 16 and 17 Years | 48 (7.9%) | 7 (1.4%) |
| 18 to 24 Years | 22 (1.1%) | 75 (3.6%) |
| 25 to 34 Years | 108 (4.7%) | 95 (4.1%) |
| 35 to 44 Years | 46 (1.5%) | 129 (4.1%) |
| 45 to 54 Years | 168 (5.3%) | 104 (3.6%) |
| 55 to 64 Years | 84 (3.7%) | 142 (6.2%) |
| 65 to 74 Years | 78 (6.5%) | 55 (3.8%) |
| 75 Years and over | 14 (3.3%) | 69 (10.2%) |
| Total | 771 (3.9%) | 892 (4.4%) |
Income Above Poverty by Sex and Age in Indian Trail
According to the poverty statistics in Indian Trail, males aged 18 to 24 years and females aged 5 years are the age groups that are most secure financially, with 98.9% of males and 100.0% of females in these age groups living above the poverty line.
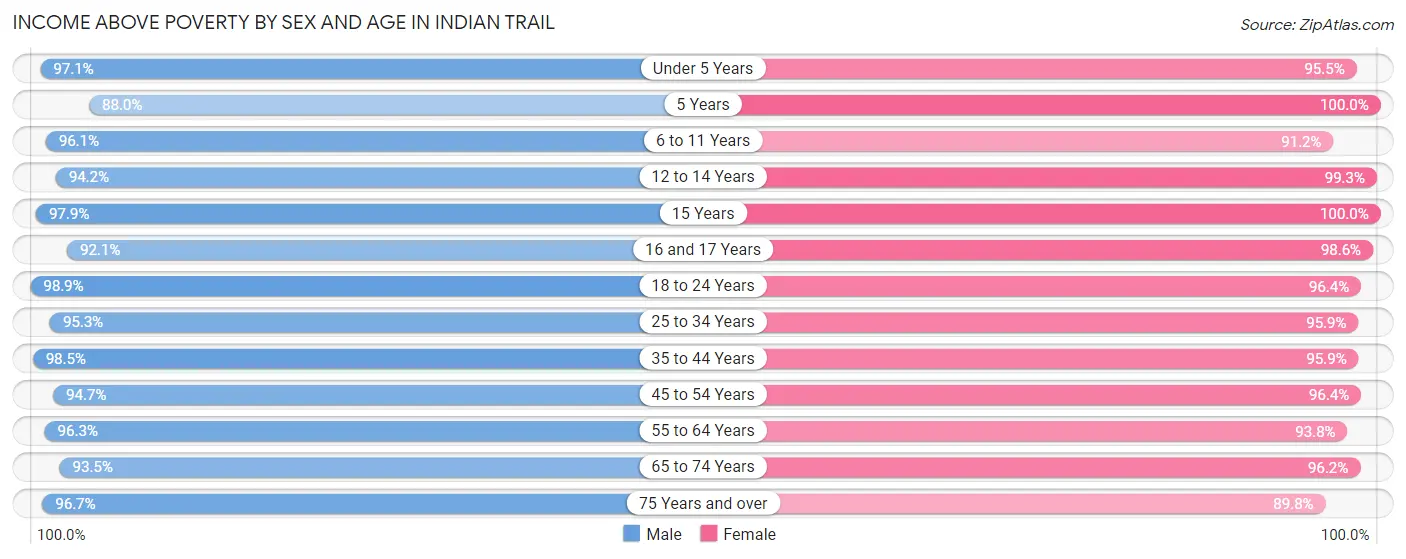
| Age Bracket | Male | Female |
| Under 5 Years | 1,255 (97.1%) | 1,325 (95.5%) |
| 5 Years | 162 (88.0%) | 368 (100.0%) |
| 6 to 11 Years | 1,656 (96.1%) | 1,532 (91.2%) |
| 12 to 14 Years | 1,091 (94.2%) | 988 (99.3%) |
| 15 Years | 370 (97.9%) | 530 (100.0%) |
| 16 and 17 Years | 560 (92.1%) | 485 (98.6%) |
| 18 to 24 Years | 2,026 (98.9%) | 1,994 (96.4%) |
| 25 to 34 Years | 2,184 (95.3%) | 2,207 (95.9%) |
| 35 to 44 Years | 3,010 (98.5%) | 3,020 (95.9%) |
| 45 to 54 Years | 3,010 (94.7%) | 2,784 (96.4%) |
| 55 to 64 Years | 2,167 (96.3%) | 2,165 (93.8%) |
| 65 to 74 Years | 1,122 (93.5%) | 1,392 (96.2%) |
| 75 Years and over | 410 (96.7%) | 605 (89.8%) |
| Total | 19,023 (96.1%) | 19,395 (95.6%) |
Income Below Poverty Among Married-Couple Families in Indian Trail
The poverty statistics for married-couple families in Indian Trail show that 2.0% or 176 of the total 8,830 families live below the poverty line. Families with 1 or 2 children have the highest poverty rate of 2.2%, comprising of 89 families. On the other hand, families with 5 or more children have the lowest poverty rate of 0.0%, which includes 0 families.
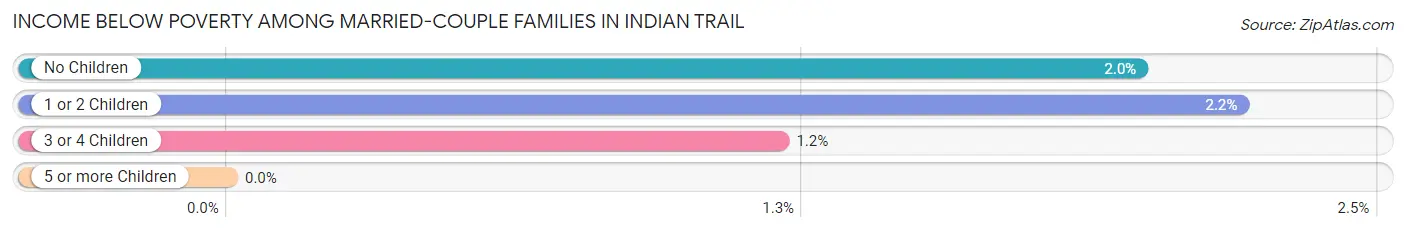
| Children | Above Poverty | Below Poverty |
| No Children | 3,871 (98.0%) | 78 (2.0%) |
| 1 or 2 Children | 3,952 (97.8%) | 89 (2.2%) |
| 3 or 4 Children | 740 (98.8%) | 9 (1.2%) |
| 5 or more Children | 91 (100.0%) | 0 (0.0%) |
| Total | 8,654 (98.0%) | 176 (2.0%) |
Income Below Poverty Among Single-Parent Households in Indian Trail
According to the poverty data in Indian Trail, 5.9% or 35 single-father households and 8.7% or 99 single-mother households are living below the poverty line. Among single-father households, those with 1 or 2 children have the highest poverty rate, with 35 households (11.8%) experiencing poverty. Likewise, among single-mother households, those with 3 or 4 children have the highest poverty rate, with 38 households (51.3%) falling below the poverty line.
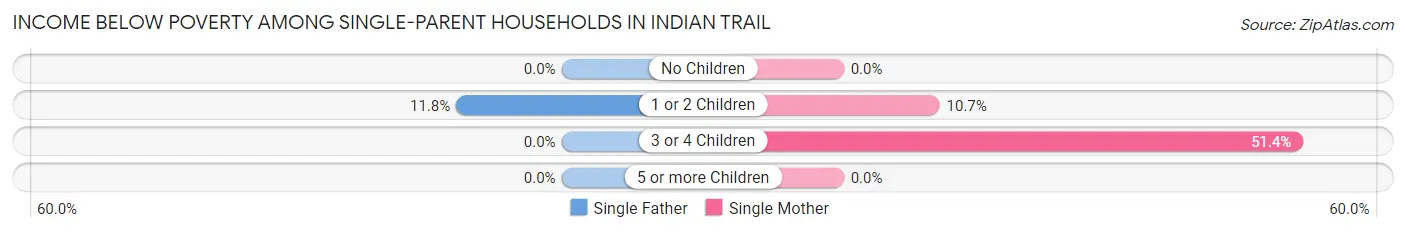
| Children | Single Father | Single Mother |
| No Children | 0 (0.0%) | 0 (0.0%) |
| 1 or 2 Children | 35 (11.8%) | 61 (10.7%) |
| 3 or 4 Children | 0 (0.0%) | 38 (51.3%) |
| 5 or more Children | 0 (0.0%) | 0 (0.0%) |
| Total | 35 (5.9%) | 99 (8.7%) |
Income Below Poverty Among Married-Couple vs Single-Parent Households in Indian Trail
The poverty data for Indian Trail shows that 176 of the married-couple family households (2.0%) and 134 of the single-parent households (7.7%) are living below the poverty level. Within the married-couple family households, those with 1 or 2 children have the highest poverty rate, with 89 households (2.2%) falling below the poverty line. Among the single-parent households, those with 3 or 4 children have the highest poverty rate, with 38 household (28.6%) living below poverty.
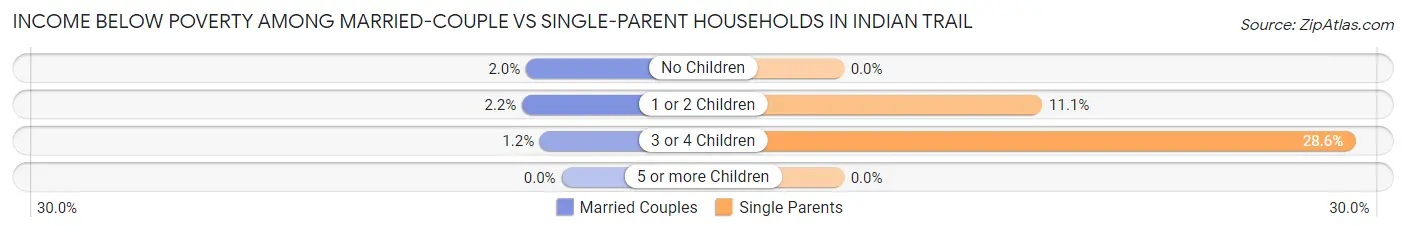
| Children | Married-Couple Families | Single-Parent Households |
| No Children | 78 (2.0%) | 0 (0.0%) |
| 1 or 2 Children | 89 (2.2%) | 96 (11.1%) |
| 3 or 4 Children | 9 (1.2%) | 38 (28.6%) |
| 5 or more Children | 0 (0.0%) | 0 (0.0%) |
| Total | 176 (2.0%) | 134 (7.7%) |
Race in Indian Trail
The most populous races in Indian Trail are White / Caucasian (30,654 | 76.0%), Hispanic or Latino (4,541 | 11.3%), and Black / African American (3,653 | 9.1%).
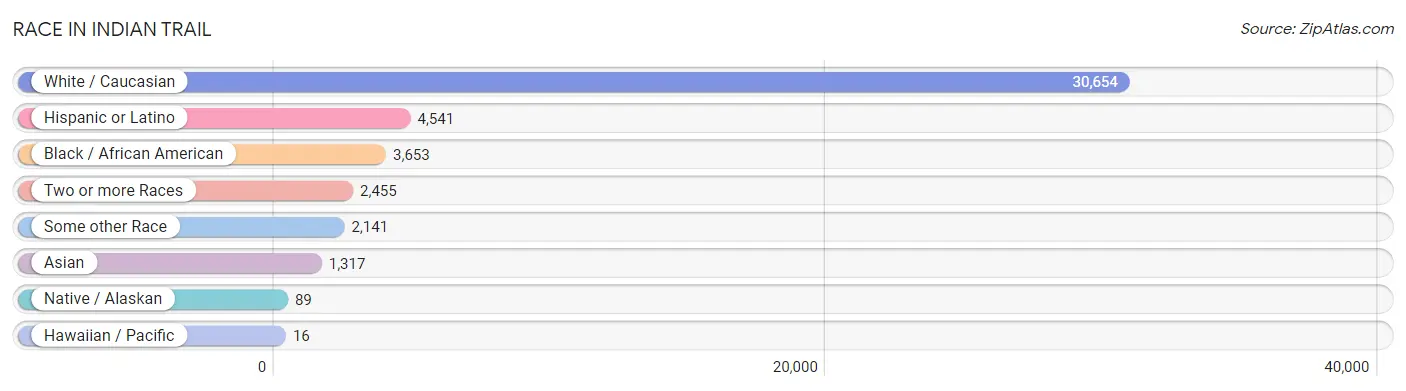
| Race | # Population | % Population |
| Asian | 1,317 | 3.3% |
| Black / African American | 3,653 | 9.1% |
| Hawaiian / Pacific | 16 | 0.0% |
| Hispanic or Latino | 4,541 | 11.3% |
| Native / Alaskan | 89 | 0.2% |
| White / Caucasian | 30,654 | 76.0% |
| Two or more Races | 2,455 | 6.1% |
| Some other Race | 2,141 | 5.3% |
| Total | 40,325 | 100.0% |
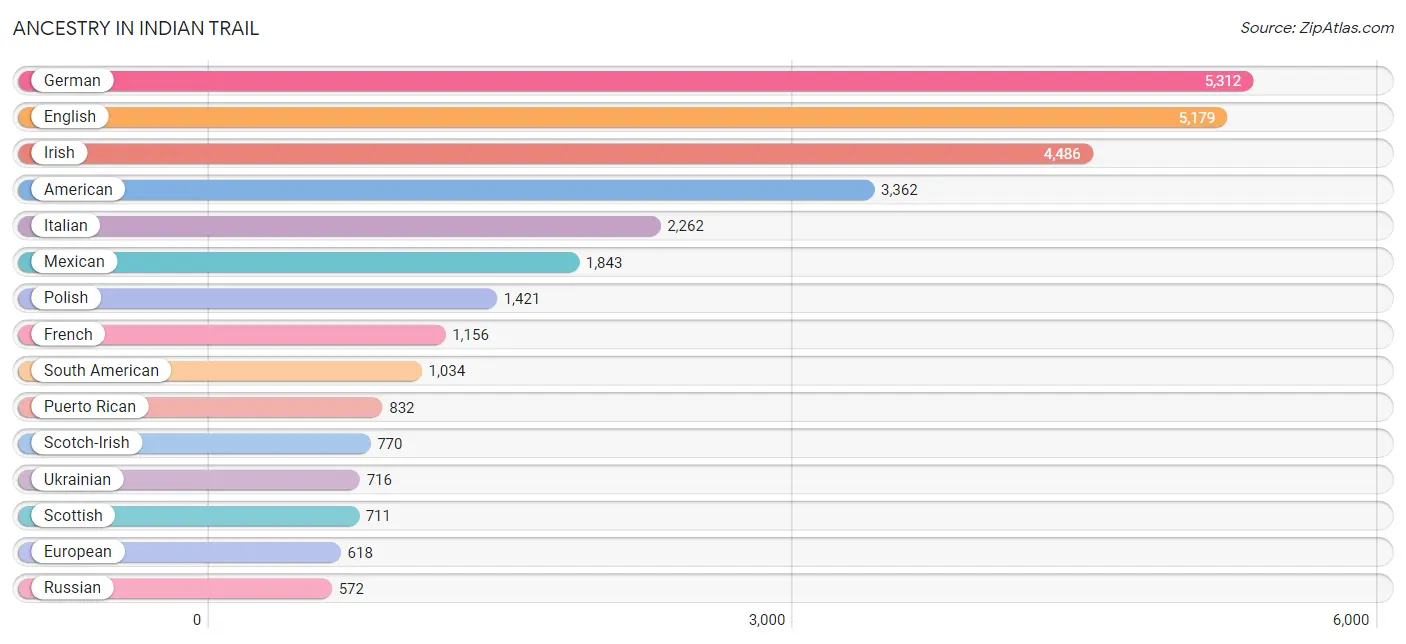
Ancestry in Indian Trail
The most populous ancestries reported in Indian Trail are German (5,312 | 13.2%), English (5,179 | 12.8%), Irish (4,486 | 11.1%), American (3,362 | 8.3%), and Italian (2,262 | 5.6%), together accounting for 51.1% of all Indian Trail residents.
| Ancestry | # Population | % Population |
| African | 116 | 0.3% |
| Albanian | 38 | 0.1% |
| American | 3,362 | 8.3% |
| Arab | 307 | 0.8% |
| Armenian | 19 | 0.1% |
| Austrian | 153 | 0.4% |
| Basque | 10 | 0.0% |
| Belgian | 43 | 0.1% |
| Belizean | 16 | 0.0% |
| Bhutanese | 65 | 0.2% |
| Blackfeet | 21 | 0.1% |
| Brazilian | 53 | 0.1% |
| British | 111 | 0.3% |
| Bulgarian | 78 | 0.2% |
| Burmese | 225 | 0.6% |
| Canadian | 42 | 0.1% |
| Central American | 280 | 0.7% |
| Central American Indian | 88 | 0.2% |
| Cherokee | 71 | 0.2% |
| Chickasaw | 15 | 0.0% |
| Chilean | 26 | 0.1% |
| Colombian | 155 | 0.4% |
| Costa Rican | 63 | 0.2% |
| Creek | 7 | 0.0% |
| Croatian | 13 | 0.0% |
| Cuban | 61 | 0.2% |
| Cypriot | 17 | 0.0% |
| Czech | 83 | 0.2% |
| Czechoslovakian | 32 | 0.1% |
| Danish | 15 | 0.0% |
| Dominican | 38 | 0.1% |
| Dutch | 336 | 0.8% |
| Eastern European | 79 | 0.2% |
| Ecuadorian | 226 | 0.6% |
| English | 5,179 | 12.8% |
| European | 618 | 1.5% |
| Finnish | 13 | 0.0% |
| French | 1,156 | 2.9% |
| French Canadian | 275 | 0.7% |
| German | 5,312 | 13.2% |
| Greek | 110 | 0.3% |
| Honduran | 6 | 0.0% |
| Hungarian | 126 | 0.3% |
| Indian (Asian) | 219 | 0.5% |
| Inupiat | 15 | 0.0% |
| Iranian | 12 | 0.0% |
| Irish | 4,486 | 11.1% |
| Italian | 2,262 | 5.6% |
| Jamaican | 51 | 0.1% |
| Japanese | 4 | 0.0% |
| Jordanian | 26 | 0.1% |
| Korean | 82 | 0.2% |
| Latvian | 22 | 0.1% |
| Lebanese | 121 | 0.3% |
| Liberian | 32 | 0.1% |
| Lithuanian | 165 | 0.4% |
| Lumbee | 304 | 0.7% |
| Mexican | 1,843 | 4.6% |
| Moroccan | 61 | 0.2% |
| Nicaraguan | 43 | 0.1% |
| Northern European | 7 | 0.0% |
| Norwegian | 199 | 0.5% |
| Pakistani | 8 | 0.0% |
| Palestinian | 32 | 0.1% |
| Panamanian | 60 | 0.2% |
| Peruvian | 194 | 0.5% |
| Polish | 1,421 | 3.5% |
| Portuguese | 49 | 0.1% |
| Puerto Rican | 832 | 2.1% |
| Romanian | 327 | 0.8% |
| Russian | 572 | 1.4% |
| Salvadoran | 108 | 0.3% |
| Scandinavian | 63 | 0.2% |
| Scotch-Irish | 770 | 1.9% |
| Scottish | 711 | 1.8% |
| Sioux | 49 | 0.1% |
| Slavic | 109 | 0.3% |
| Slovak | 86 | 0.2% |
| Slovene | 4 | 0.0% |
| South American | 1,034 | 2.6% |
| Spaniard | 124 | 0.3% |
| Spanish | 51 | 0.1% |
| Sri Lankan | 539 | 1.3% |
| Subsaharan African | 238 | 0.6% |
| Swedish | 403 | 1.0% |
| Swiss | 13 | 0.0% |
| Syrian | 67 | 0.2% |
| Thai | 266 | 0.7% |
| Tongan | 43 | 0.1% |
| Turkish | 81 | 0.2% |
| Ukrainian | 716 | 1.8% |
| Venezuelan | 433 | 1.1% |
| Welsh | 157 | 0.4% |
| West Indian | 57 | 0.1% |
| Yugoslavian | 55 | 0.1% | View All 95 Rows |
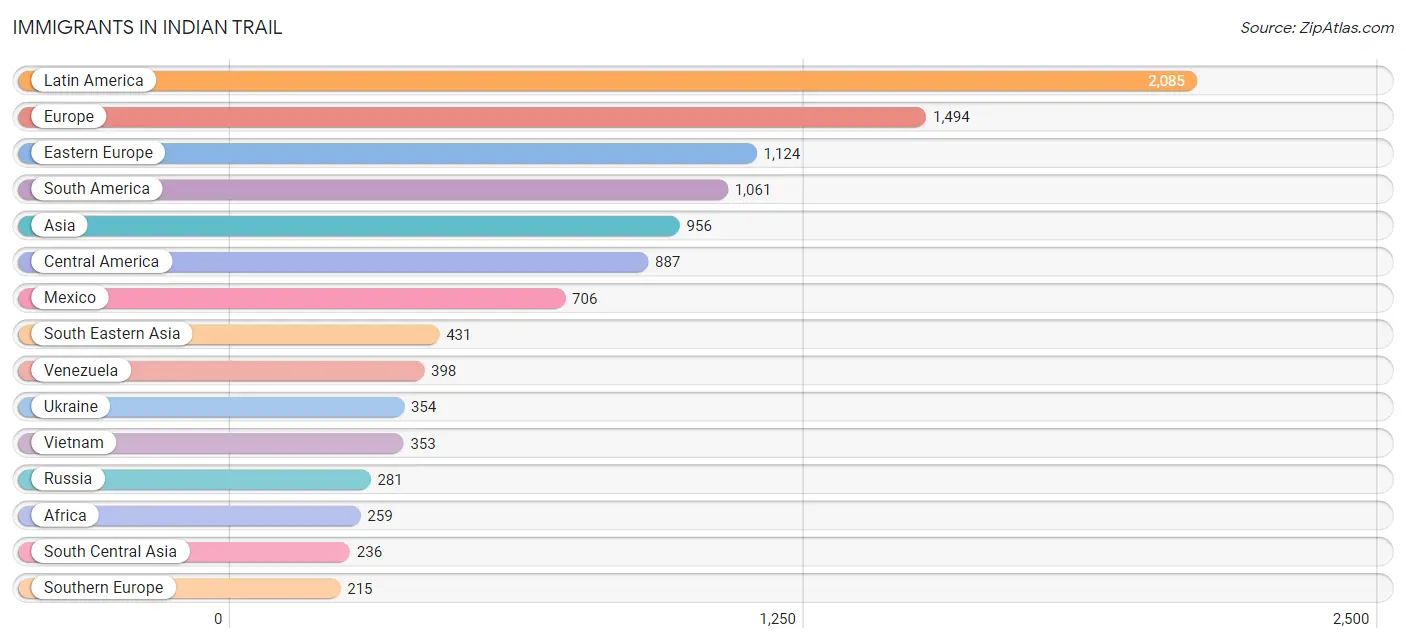
Immigrants in Indian Trail
The most numerous immigrant groups reported in Indian Trail came from Latin America (2,085 | 5.2%), Europe (1,494 | 3.7%), Eastern Europe (1,124 | 2.8%), South America (1,061 | 2.6%), and Asia (956 | 2.4%), together accounting for 16.7% of all Indian Trail residents.
| Immigration Origin | # Population | % Population |
| Africa | 259 | 0.6% |
| Albania | 88 | 0.2% |
| Argentina | 14 | 0.0% |
| Asia | 956 | 2.4% |
| Belgium | 8 | 0.0% |
| Belize | 16 | 0.0% |
| Bosnia and Herzegovina | 39 | 0.1% |
| Brazil | 124 | 0.3% |
| Canada | 45 | 0.1% |
| Caribbean | 137 | 0.3% |
| Central America | 887 | 2.2% |
| Chile | 27 | 0.1% |
| China | 100 | 0.3% |
| Colombia | 128 | 0.3% |
| Costa Rica | 63 | 0.2% |
| Cuba | 38 | 0.1% |
| Czechoslovakia | 18 | 0.0% |
| Dominican Republic | 29 | 0.1% |
| Eastern Africa | 35 | 0.1% |
| Eastern Asia | 164 | 0.4% |
| Eastern Europe | 1,124 | 2.8% |
| Ecuador | 157 | 0.4% |
| El Salvador | 44 | 0.1% |
| England | 47 | 0.1% |
| Eritrea | 19 | 0.1% |
| Europe | 1,494 | 3.7% |
| Germany | 38 | 0.1% |
| Greece | 15 | 0.0% |
| Hong Kong | 33 | 0.1% |
| Hungary | 8 | 0.0% |
| India | 143 | 0.4% |
| Iran | 19 | 0.1% |
| Israel | 8 | 0.0% |
| Italy | 4 | 0.0% |
| Jamaica | 70 | 0.2% |
| Japan | 10 | 0.0% |
| Kazakhstan | 26 | 0.1% |
| Kenya | 16 | 0.0% |
| Korea | 54 | 0.1% |
| Kuwait | 10 | 0.0% |
| Latin America | 2,085 | 5.2% |
| Lebanon | 33 | 0.1% |
| Liberia | 58 | 0.1% |
| Mexico | 706 | 1.8% |
| Middle Africa | 36 | 0.1% |
| Moldova | 120 | 0.3% |
| Morocco | 17 | 0.0% |
| Nepal | 26 | 0.1% |
| Netherlands | 12 | 0.0% |
| Nicaragua | 45 | 0.1% |
| Nigeria | 23 | 0.1% |
| Northern Africa | 17 | 0.0% |
| Northern Europe | 97 | 0.2% |
| Pakistan | 11 | 0.0% |
| Panama | 13 | 0.0% |
| Peru | 198 | 0.5% |
| Philippines | 27 | 0.1% |
| Poland | 99 | 0.3% |
| Russia | 281 | 0.7% |
| Saudi Arabia | 32 | 0.1% |
| Scotland | 22 | 0.1% |
| Sierra Leone | 63 | 0.2% |
| South America | 1,061 | 2.6% |
| South Central Asia | 236 | 0.6% |
| South Eastern Asia | 431 | 1.1% |
| Southern Europe | 215 | 0.5% |
| Spain | 196 | 0.5% |
| Syria | 13 | 0.0% |
| Taiwan | 15 | 0.0% |
| Thailand | 8 | 0.0% |
| Turkey | 29 | 0.1% |
| Ukraine | 354 | 0.9% |
| Uzbekistan | 11 | 0.0% |
| Venezuela | 398 | 1.0% |
| Vietnam | 353 | 0.9% |
| Western Africa | 171 | 0.4% |
| Western Asia | 125 | 0.3% |
| Western Europe | 58 | 0.1% |
| Zaire | 36 | 0.1% | View All 79 Rows |
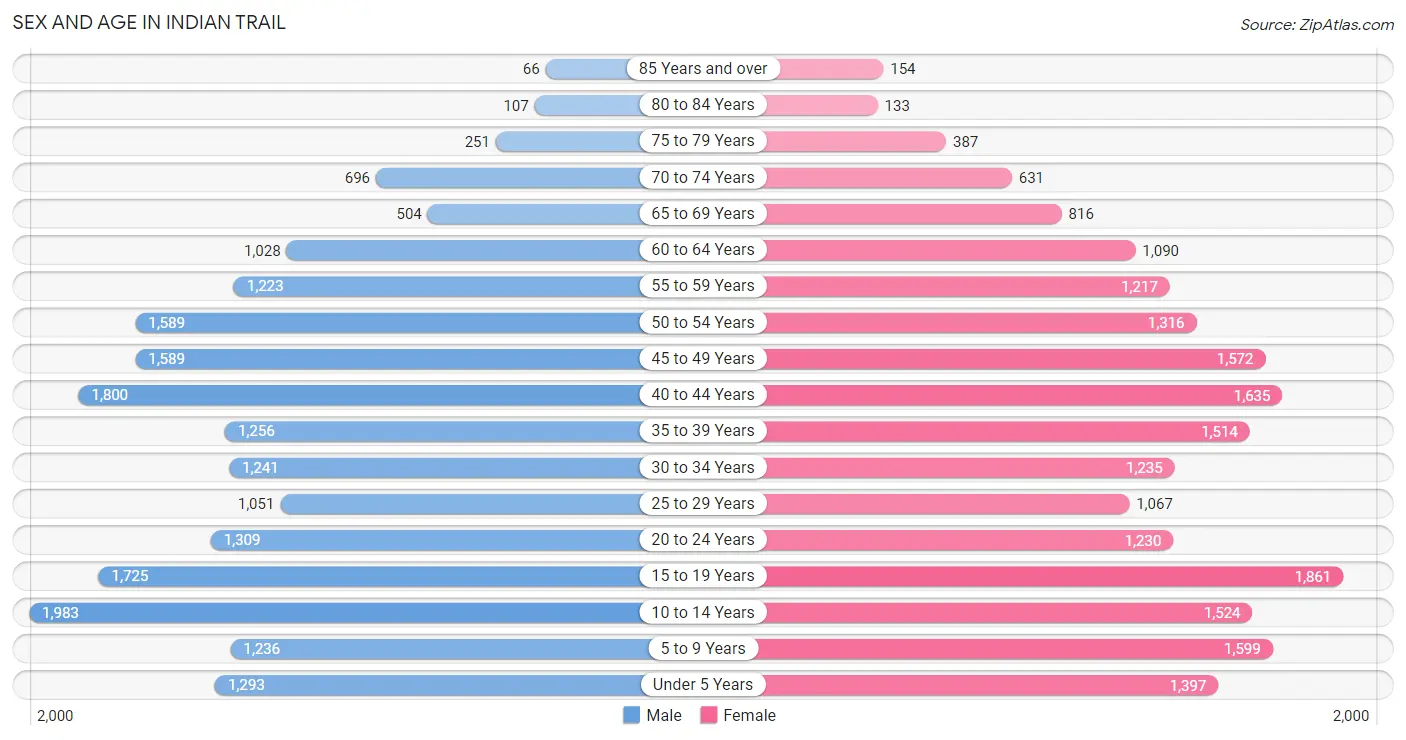
Sex and Age in Indian Trail
Sex and Age in Indian Trail
The most populous age groups in Indian Trail are 10 to 14 Years (1,983 | 9.9%) for men and 15 to 19 Years (1,861 | 9.1%) for women.
| Age Bracket | Male | Female |
| Under 5 Years | 1,293 (6.5%) | 1,397 (6.9%) |
| 5 to 9 Years | 1,236 (6.2%) | 1,599 (7.9%) |
| 10 to 14 Years | 1,983 (9.9%) | 1,524 (7.5%) |
| 15 to 19 Years | 1,725 (8.6%) | 1,861 (9.1%) |
| 20 to 24 Years | 1,309 (6.6%) | 1,230 (6.0%) |
| 25 to 29 Years | 1,051 (5.3%) | 1,067 (5.2%) |
| 30 to 34 Years | 1,241 (6.2%) | 1,235 (6.1%) |
| 35 to 39 Years | 1,256 (6.3%) | 1,514 (7.4%) |
| 40 to 44 Years | 1,800 (9.0%) | 1,635 (8.0%) |
| 45 to 49 Years | 1,589 (8.0%) | 1,572 (7.7%) |
| 50 to 54 Years | 1,589 (8.0%) | 1,316 (6.5%) |
| 55 to 59 Years | 1,223 (6.1%) | 1,217 (6.0%) |
| 60 to 64 Years | 1,028 (5.1%) | 1,090 (5.3%) |
| 65 to 69 Years | 504 (2.5%) | 816 (4.0%) |
| 70 to 74 Years | 696 (3.5%) | 631 (3.1%) |
| 75 to 79 Years | 251 (1.3%) | 387 (1.9%) |
| 80 to 84 Years | 107 (0.5%) | 133 (0.6%) |
| 85 Years and over | 66 (0.3%) | 154 (0.8%) |
| Total | 19,947 (100.0%) | 20,378 (100.0%) |
Families and Households in Indian Trail
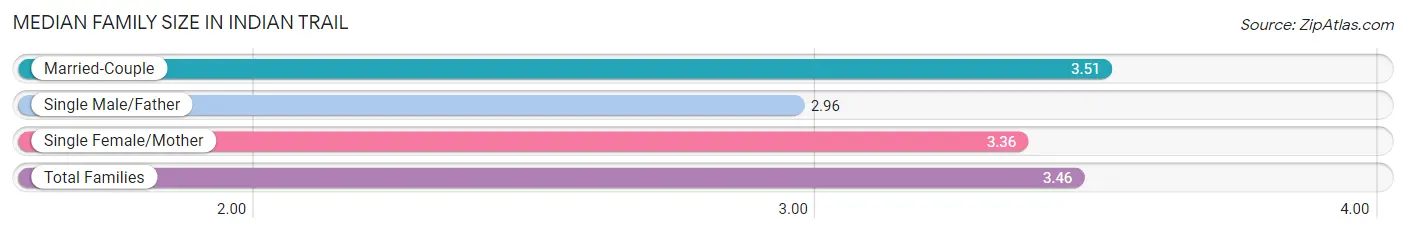
Median Family Size in Indian Trail
The median family size in Indian Trail is 3.46 persons per family, with married-couple families (8,830 | 83.5%) accounting for the largest median family size of 3.51 persons per family. On the other hand, single male/father families (598 | 5.7%) represent the smallest median family size with 2.96 persons per family.
| Family Type | # Families | Family Size |
| Married-Couple | 8,830 (83.5%) | 3.51 |
| Single Male/Father | 598 (5.7%) | 2.96 |
| Single Female/Mother | 1,142 (10.8%) | 3.36 |
| Total Families | 10,570 (100.0%) | 3.46 |
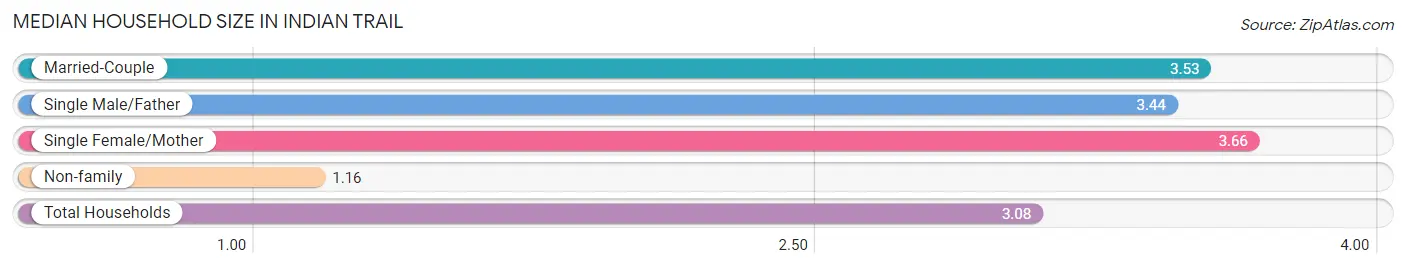
Median Household Size in Indian Trail
The median household size in Indian Trail is 3.08 persons per household, with single female/mother households (1,142 | 8.7%) accounting for the largest median household size of 3.66 persons per household. non-family households (2,508 | 19.2%) represent the smallest median household size with 1.16 persons per household.
| Household Type | # Households | Household Size |
| Married-Couple | 8,830 (67.5%) | 3.53 |
| Single Male/Father | 598 (4.6%) | 3.44 |
| Single Female/Mother | 1,142 (8.7%) | 3.66 |
| Non-family | 2,508 (19.2%) | 1.16 |
| Total Households | 13,078 (100.0%) | 3.08 |
Household Size by Marriage Status in Indian Trail
Out of a total of 13,078 households in Indian Trail, 10,570 (80.8%) are family households, while 2,508 (19.2%) are nonfamily households. The most numerous type of family households are 2-person households, comprising 3,579, and the most common type of nonfamily households are 1-person households, comprising 2,177.
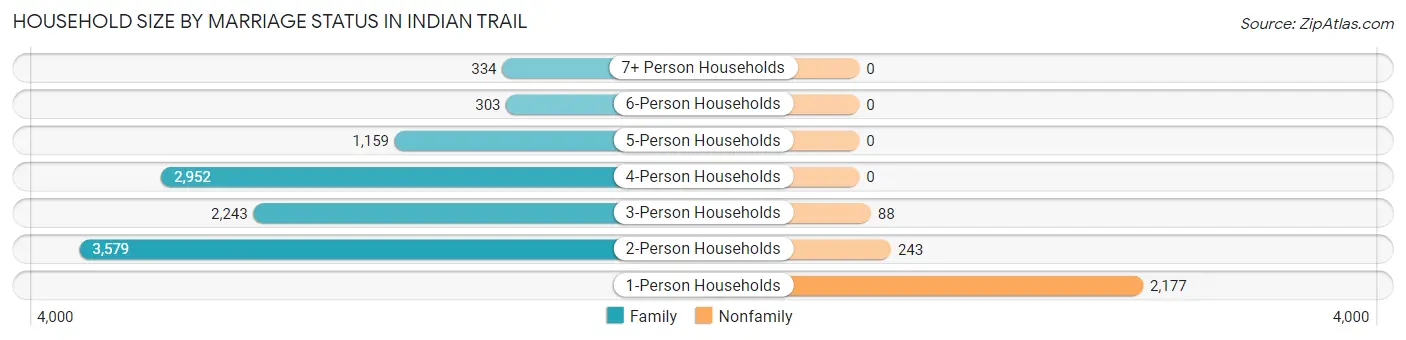
| Household Size | Family Households | Nonfamily Households |
| 1-Person Households | - | 2,177 (16.7%) |
| 2-Person Households | 3,579 (27.4%) | 243 (1.9%) |
| 3-Person Households | 2,243 (17.2%) | 88 (0.7%) |
| 4-Person Households | 2,952 (22.6%) | 0 (0.0%) |
| 5-Person Households | 1,159 (8.9%) | 0 (0.0%) |
| 6-Person Households | 303 (2.3%) | 0 (0.0%) |
| 7+ Person Households | 334 (2.5%) | 0 (0.0%) |
| Total | 10,570 (80.8%) | 2,508 (19.2%) |
Female Fertility in Indian Trail
Fertility by Age in Indian Trail
Average fertility rate in Indian Trail is 52.0 births per 1,000 women. Women in the age bracket of 20 to 34 years have the highest fertility rate with 78.0 births per 1,000 women. Women in the age bracket of 20 to 34 years acount for 50.7% of all women with births.
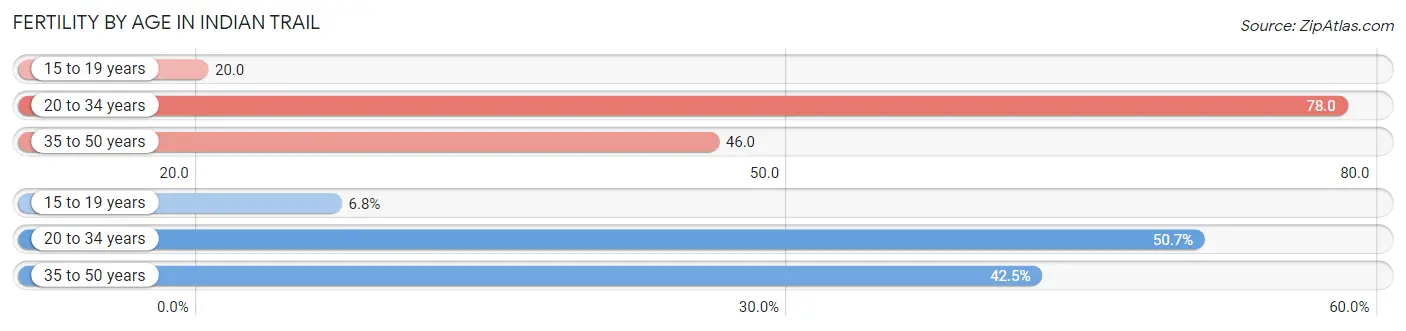
| Age Bracket | Women with Births | Births / 1,000 Women |
| 15 to 19 years | 37 (6.8%) | 20.0 |
| 20 to 34 years | 276 (50.7%) | 78.0 |
| 35 to 50 years | 231 (42.5%) | 46.0 |
| Total | 544 (100.0%) | 52.0 |
Fertility by Age by Marriage Status in Indian Trail
82.7% of women with births (544) in Indian Trail are married. The highest percentage of unmarried women with births falls into 15 to 19 years age bracket with 100.0% of them unmarried at the time of birth, while the lowest percentage of unmarried women with births belong to 35 to 50 years age bracket with 0.0% of them unmarried.
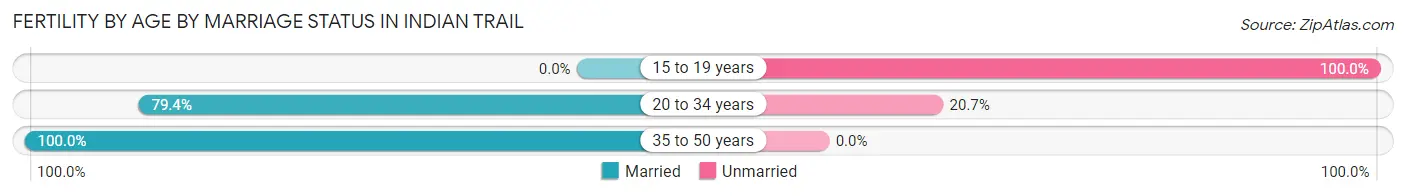
| Age Bracket | Married | Unmarried |
| 15 to 19 years | 0 (0.0%) | 37 (100.0%) |
| 20 to 34 years | 219 (79.3%) | 57 (20.6%) |
| 35 to 50 years | 231 (100.0%) | 0 (0.0%) |
| Total | 450 (82.7%) | 94 (17.3%) |
Fertility by Education in Indian Trail
Average fertility rate in Indian Trail is 52.0 births per 1,000 women. Women with the education attainment of high school diploma have the highest fertility rate of 101.0 births per 1,000 women, while women with the education attainment of less than high school have the lowest fertility at 7.0 births per 1,000 women. Women with the education attainment of high school diploma represent 40.4% of all women with births.
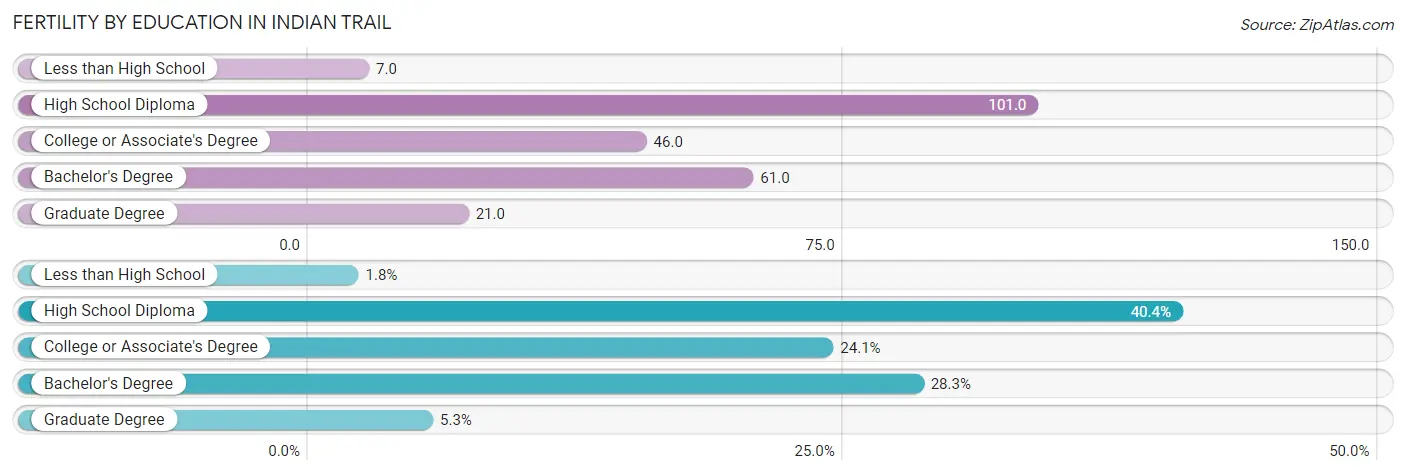
| Educational Attainment | Women with Births | Births / 1,000 Women |
| Less than High School | 10 (1.8%) | 7.0 |
| High School Diploma | 220 (40.4%) | 101.0 |
| College or Associate's Degree | 131 (24.1%) | 46.0 |
| Bachelor's Degree | 154 (28.3%) | 61.0 |
| Graduate Degree | 29 (5.3%) | 21.0 |
| Total | 544 (100.0%) | 52.0 |
Fertility by Education by Marriage Status in Indian Trail
17.3% of women with births in Indian Trail are unmarried. Women with the educational attainment of less than high school are most likely to be married with 100.0% of them married at childbirth, while women with the educational attainment of high school diploma are least likely to be married with 40.0% of them unmarried at childbirth.
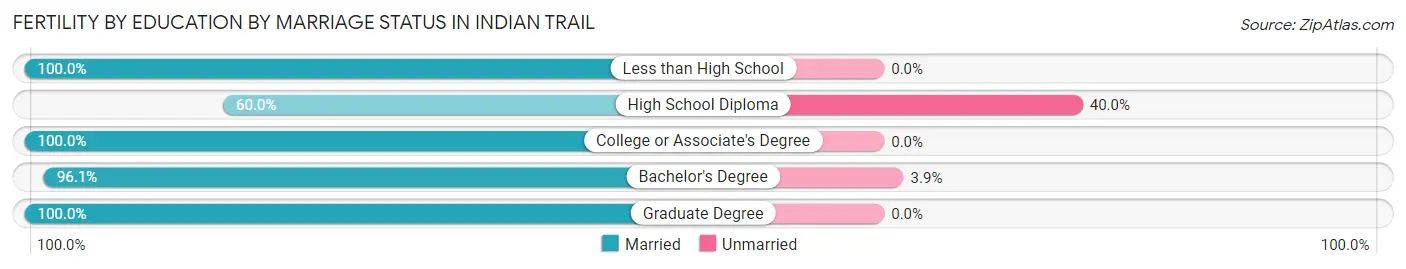
| Educational Attainment | Married | Unmarried |
| Less than High School | 10 (100.0%) | 0 (0.0%) |
| High School Diploma | 132 (60.0%) | 88 (40.0%) |
| College or Associate's Degree | 131 (100.0%) | 0 (0.0%) |
| Bachelor's Degree | 148 (96.1%) | 6 (3.9%) |
| Graduate Degree | 29 (100.0%) | 0 (0.0%) |
| Total | 450 (82.7%) | 94 (17.3%) |
Employment Characteristics in Indian Trail
Employment by Class of Employer in Indian Trail
Among the 21,473 employed individuals in Indian Trail, private company employees (16,028 | 74.6%), not-for-profit organizations (1,530 | 7.1%), and local government employees (1,383 | 6.4%) make up the most common classes of employment.
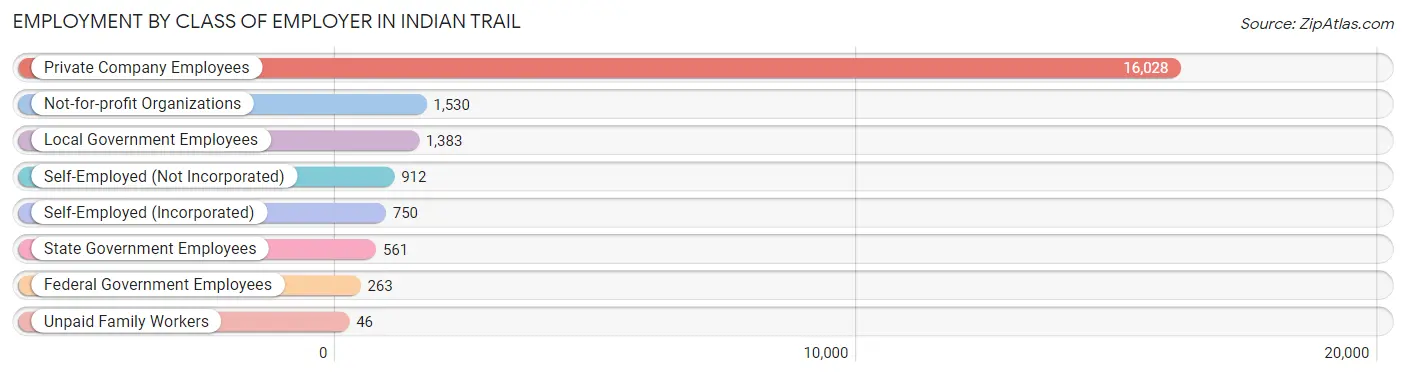
| Employer Class | # Employees | % Employees |
| Private Company Employees | 16,028 | 74.6% |
| Self-Employed (Incorporated) | 750 | 3.5% |
| Self-Employed (Not Incorporated) | 912 | 4.3% |
| Not-for-profit Organizations | 1,530 | 7.1% |
| Local Government Employees | 1,383 | 6.4% |
| State Government Employees | 561 | 2.6% |
| Federal Government Employees | 263 | 1.2% |
| Unpaid Family Workers | 46 | 0.2% |
| Total | 21,473 | 100.0% |
Employment Status by Age in Indian Trail
According to the labor force statistics for Indian Trail, out of the total population over 16 years of age (30,385), 76.0% or 23,093 individuals are in the labor force, with 5.3% or 1,224 of them unemployed. The age group with the highest labor force participation rate is 25 to 29 years, with 94.1% or 1,993 individuals in the labor force. Within the labor force, the 75 years and over age range has the highest percentage of unemployed individuals, with 18.0% or 11 of them being unemployed.
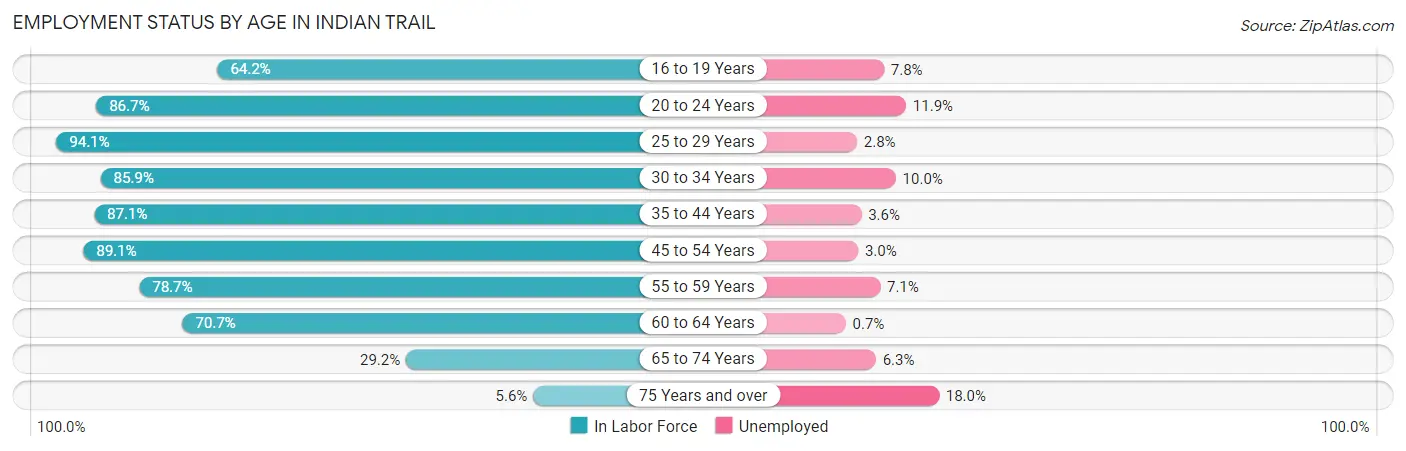
| Age Bracket | In Labor Force | Unemployed |
| 16 to 19 Years | 1,719 (64.2%) | 134 (7.8%) |
| 20 to 24 Years | 2,201 (86.7%) | 262 (11.9%) |
| 25 to 29 Years | 1,993 (94.1%) | 56 (2.8%) |
| 30 to 34 Years | 2,127 (85.9%) | 213 (10.0%) |
| 35 to 44 Years | 5,405 (87.1%) | 195 (3.6%) |
| 45 to 54 Years | 5,405 (89.1%) | 162 (3.0%) |
| 55 to 59 Years | 1,920 (78.7%) | 136 (7.1%) |
| 60 to 64 Years | 1,497 (70.7%) | 10 (0.7%) |
| 65 to 74 Years | 773 (29.2%) | 49 (6.3%) |
| 75 Years and over | 61 (5.6%) | 11 (18.0%) |
| Total | 23,093 (76.0%) | 1,224 (5.3%) |
Employment Status by Educational Attainment in Indian Trail
According to labor force statistics for Indian Trail, 85.6% of individuals (18,338) out of the total population between 25 and 64 years of age (21,423) are in the labor force, with 4.2% or 770 of them being unemployed. The group with the highest labor force participation rate are those with the educational attainment of bachelor's degree or higher, with 91.0% or 8,352 individuals in the labor force. Within the labor force, individuals with high school diploma education have the highest percentage of unemployment, with 5.6% or 209 of them being unemployed.
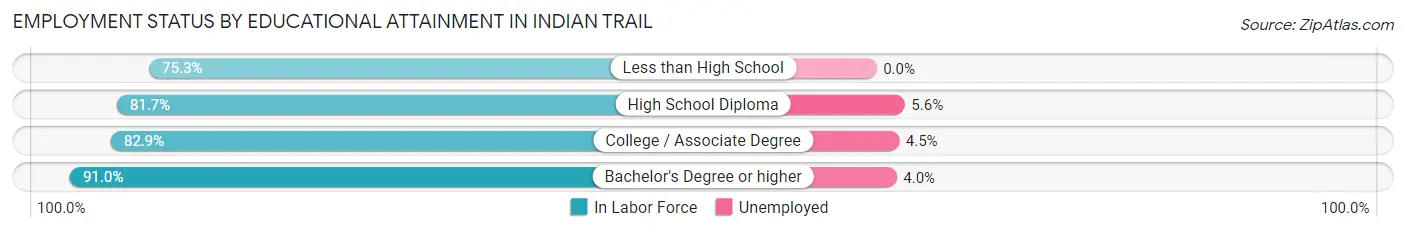
| Educational Attainment | In Labor Force | Unemployed |
| Less than High School | 1,011 (75.3%) | 0 (0.0%) |
| High School Diploma | 3,726 (81.7%) | 255 (5.6%) |
| College / Associate Degree | 5,257 (82.9%) | 285 (4.5%) |
| Bachelor's Degree or higher | 8,352 (91.0%) | 367 (4.0%) |
| Total | 18,338 (85.6%) | 900 (4.2%) |
Employment Occupations by Sex in Indian Trail
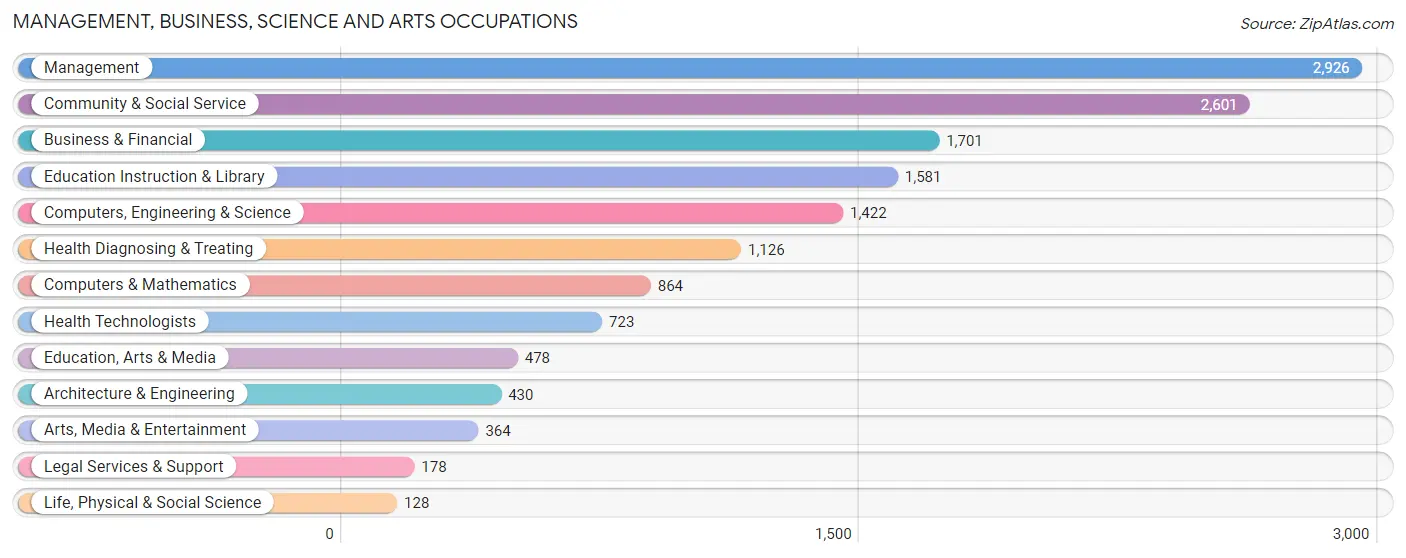
Management, Business, Science and Arts Occupations
The most common Management, Business, Science and Arts occupations in Indian Trail are Management (2,926 | 13.4%), Community & Social Service (2,601 | 11.9%), Business & Financial (1,701 | 7.8%), Education Instruction & Library (1,581 | 7.2%), and Computers, Engineering & Science (1,422 | 6.5%).
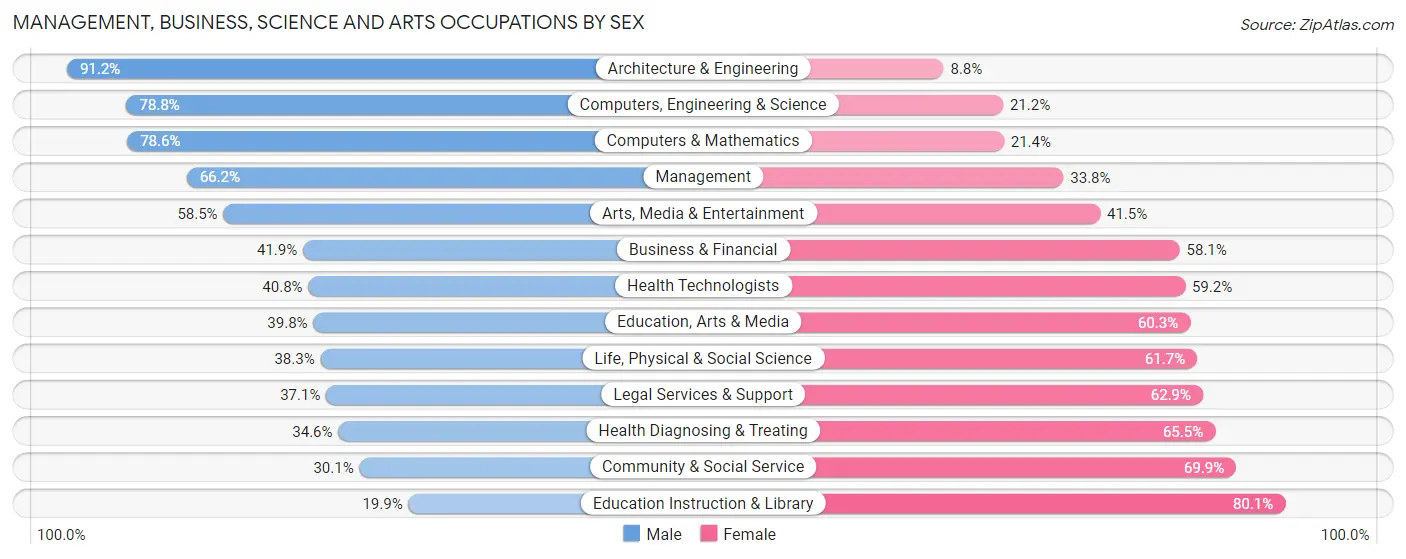
Management, Business, Science and Arts Occupations by Sex
Within the Management, Business, Science and Arts occupations in Indian Trail, the most male-oriented occupations are Architecture & Engineering (91.2%), Computers, Engineering & Science (78.8%), and Computers & Mathematics (78.6%), while the most female-oriented occupations are Education Instruction & Library (80.1%), Community & Social Service (69.9%), and Health Diagnosing & Treating (65.4%).
| Occupation | Male | Female |
| Management | 1,936 (66.2%) | 990 (33.8%) |
| Business & Financial | 713 (41.9%) | 988 (58.1%) |
| Computers, Engineering & Science | 1,120 (78.8%) | 302 (21.2%) |
| Computers & Mathematics | 679 (78.6%) | 185 (21.4%) |
| Architecture & Engineering | 392 (91.2%) | 38 (8.8%) |
| Life, Physical & Social Science | 49 (38.3%) | 79 (61.7%) |
| Community & Social Service | 784 (30.1%) | 1,817 (69.9%) |
| Education, Arts & Media | 190 (39.8%) | 288 (60.3%) |
| Legal Services & Support | 66 (37.1%) | 112 (62.9%) |
| Education Instruction & Library | 315 (19.9%) | 1,266 (80.1%) |
| Arts, Media & Entertainment | 213 (58.5%) | 151 (41.5%) |
| Health Diagnosing & Treating | 389 (34.5%) | 737 (65.4%) |
| Health Technologists | 295 (40.8%) | 428 (59.2%) |
| Total (Category) | 4,942 (50.5%) | 4,834 (49.4%) |
| Total (Overall) | 11,805 (54.0%) | 10,063 (46.0%) |
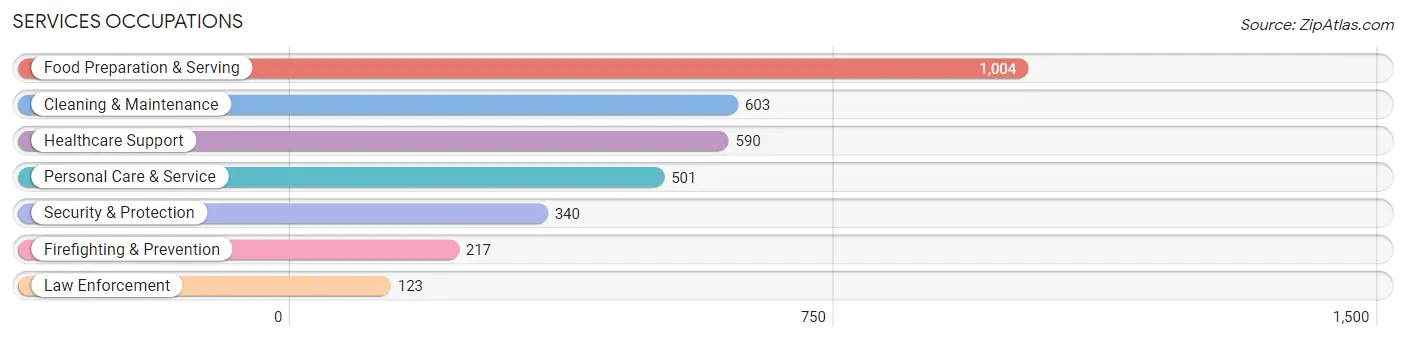
Services Occupations
The most common Services occupations in Indian Trail are Food Preparation & Serving (1,004 | 4.6%), Cleaning & Maintenance (603 | 2.8%), Healthcare Support (590 | 2.7%), Personal Care & Service (501 | 2.3%), and Security & Protection (340 | 1.5%).
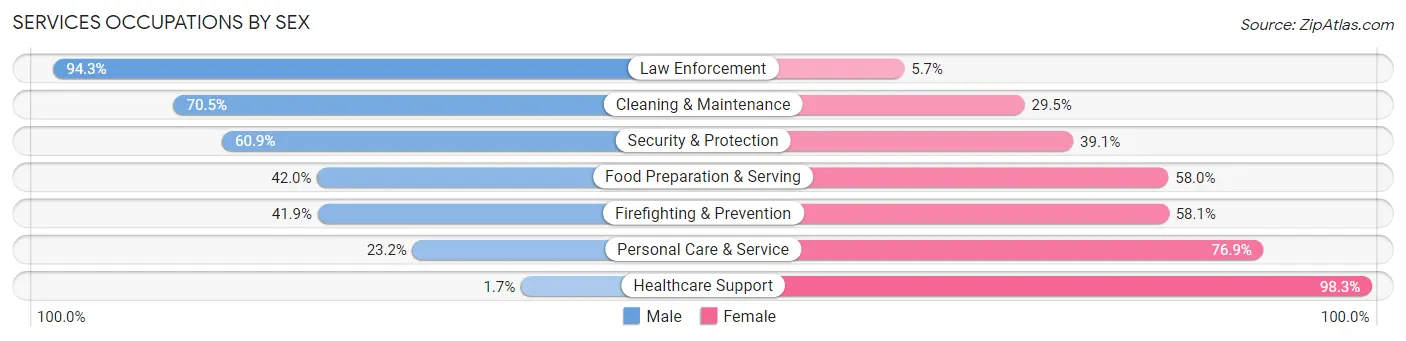
Services Occupations by Sex
Within the Services occupations in Indian Trail, the most male-oriented occupations are Law Enforcement (94.3%), Cleaning & Maintenance (70.5%), and Security & Protection (60.9%), while the most female-oriented occupations are Healthcare Support (98.3%), Personal Care & Service (76.8%), and Firefighting & Prevention (58.1%).
| Occupation | Male | Female |
| Healthcare Support | 10 (1.7%) | 580 (98.3%) |
| Security & Protection | 207 (60.9%) | 133 (39.1%) |
| Firefighting & Prevention | 91 (41.9%) | 126 (58.1%) |
| Law Enforcement | 116 (94.3%) | 7 (5.7%) |
| Food Preparation & Serving | 422 (42.0%) | 582 (58.0%) |
| Cleaning & Maintenance | 425 (70.5%) | 178 (29.5%) |
| Personal Care & Service | 116 (23.2%) | 385 (76.8%) |
| Total (Category) | 1,180 (38.8%) | 1,858 (61.2%) |
| Total (Overall) | 11,805 (54.0%) | 10,063 (46.0%) |
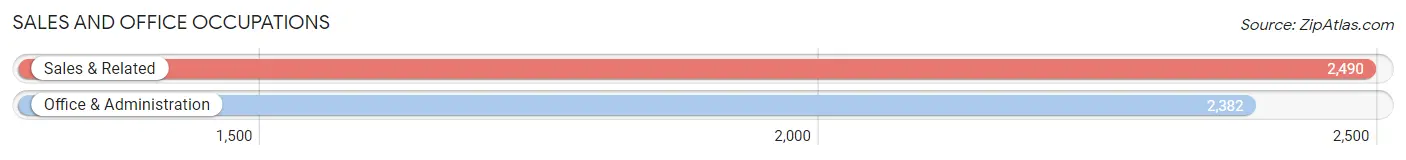
Sales and Office Occupations
The most common Sales and Office occupations in Indian Trail are Sales & Related (2,490 | 11.4%), and Office & Administration (2,382 | 10.9%).
Sales and Office Occupations by Sex
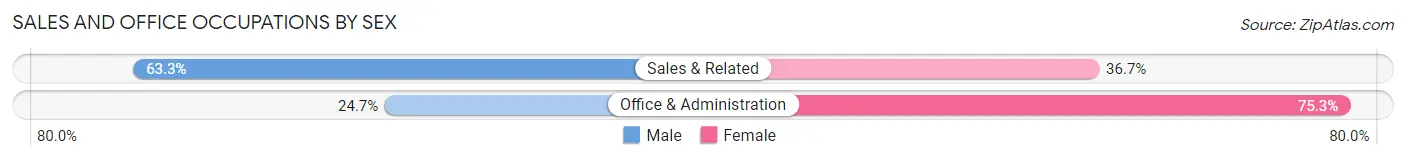
| Occupation | Male | Female |
| Sales & Related | 1,576 (63.3%) | 914 (36.7%) |
| Office & Administration | 588 (24.7%) | 1,794 (75.3%) |
| Total (Category) | 2,164 (44.4%) | 2,708 (55.6%) |
| Total (Overall) | 11,805 (54.0%) | 10,063 (46.0%) |
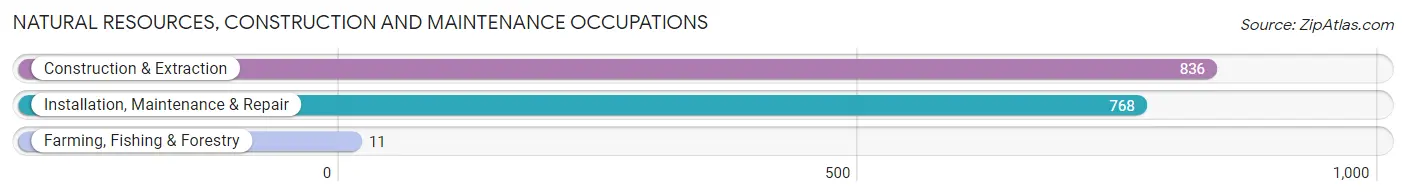
Natural Resources, Construction and Maintenance Occupations
The most common Natural Resources, Construction and Maintenance occupations in Indian Trail are Construction & Extraction (836 | 3.8%), Installation, Maintenance & Repair (768 | 3.5%), and Farming, Fishing & Forestry (11 | 0.1%).
Natural Resources, Construction and Maintenance Occupations by Sex
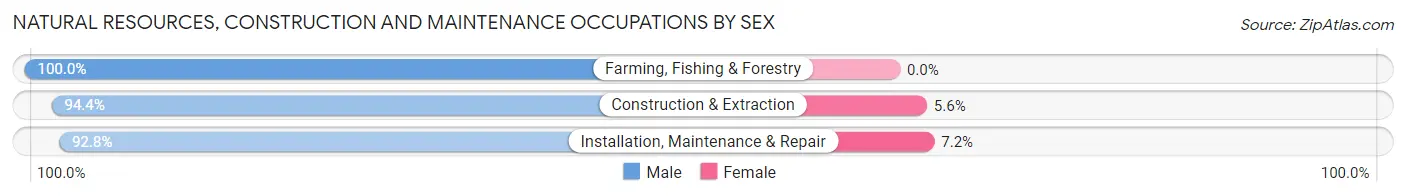
| Occupation | Male | Female |
| Farming, Fishing & Forestry | 11 (100.0%) | 0 (0.0%) |
| Construction & Extraction | 789 (94.4%) | 47 (5.6%) |
| Installation, Maintenance & Repair | 713 (92.8%) | 55 (7.2%) |
| Total (Category) | 1,513 (93.7%) | 102 (6.3%) |
| Total (Overall) | 11,805 (54.0%) | 10,063 (46.0%) |
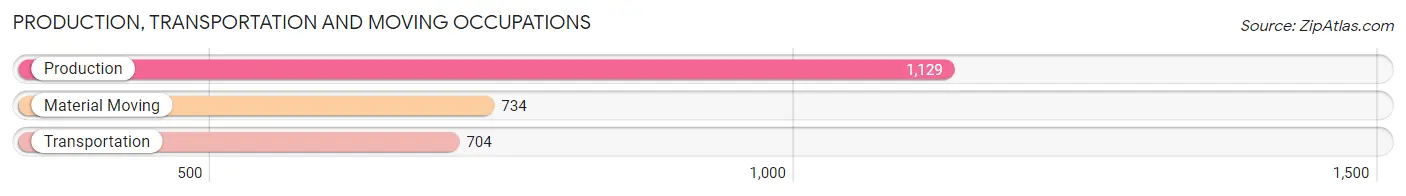
Production, Transportation and Moving Occupations
The most common Production, Transportation and Moving occupations in Indian Trail are Production (1,129 | 5.2%), Material Moving (734 | 3.4%), and Transportation (704 | 3.2%).
Production, Transportation and Moving Occupations by Sex
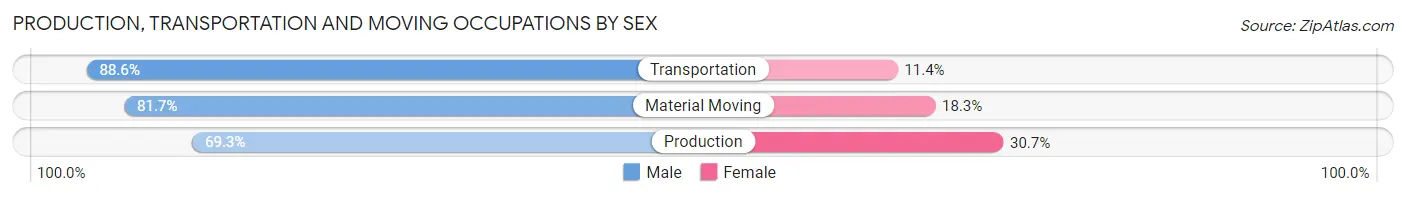
| Occupation | Male | Female |
| Production | 782 (69.3%) | 347 (30.7%) |
| Transportation | 624 (88.6%) | 80 (11.4%) |
| Material Moving | 600 (81.7%) | 134 (18.3%) |
| Total (Category) | 2,006 (78.1%) | 561 (21.8%) |
| Total (Overall) | 11,805 (54.0%) | 10,063 (46.0%) |
Employment Industries by Sex in Indian Trail
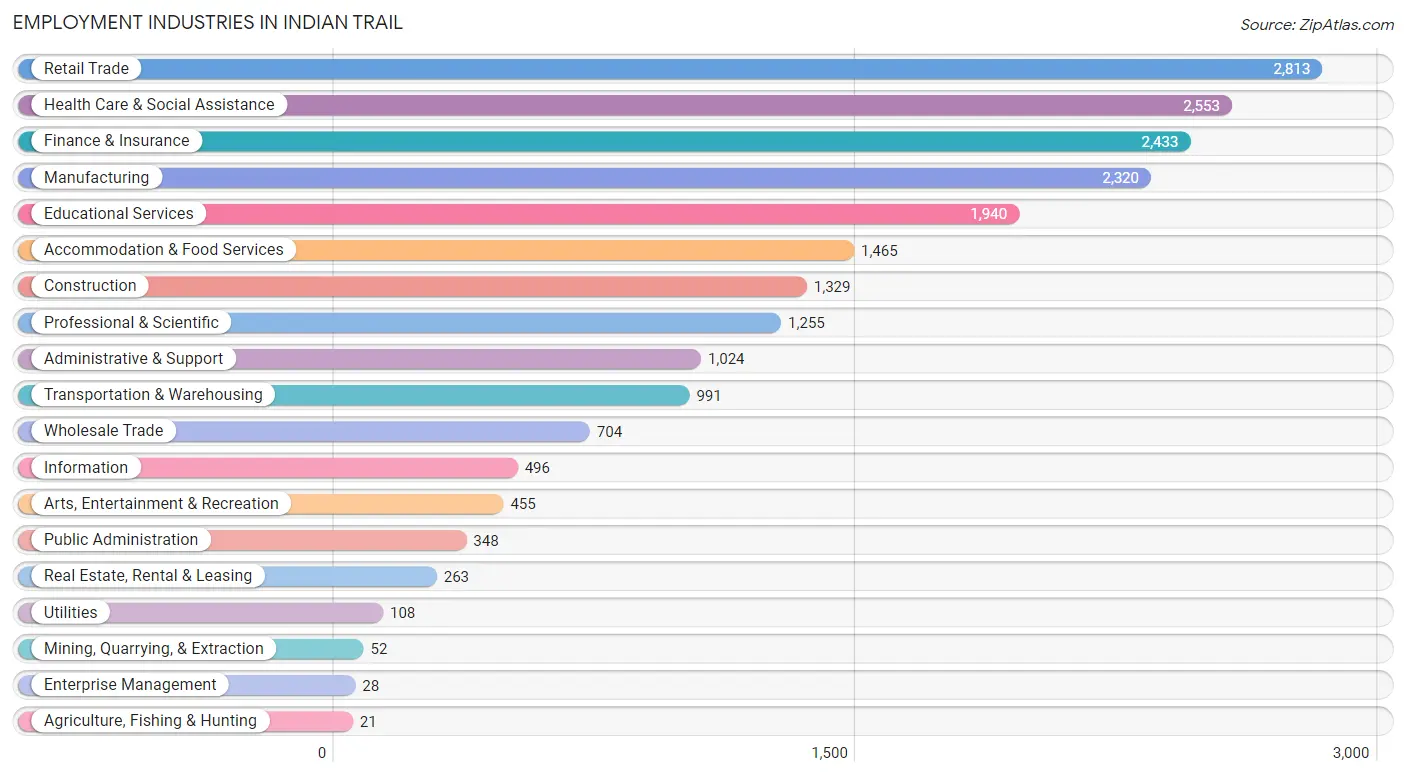
Employment Industries in Indian Trail
The major employment industries in Indian Trail include Retail Trade (2,813 | 12.9%), Health Care & Social Assistance (2,553 | 11.7%), Finance & Insurance (2,433 | 11.1%), Manufacturing (2,320 | 10.6%), and Educational Services (1,940 | 8.9%).
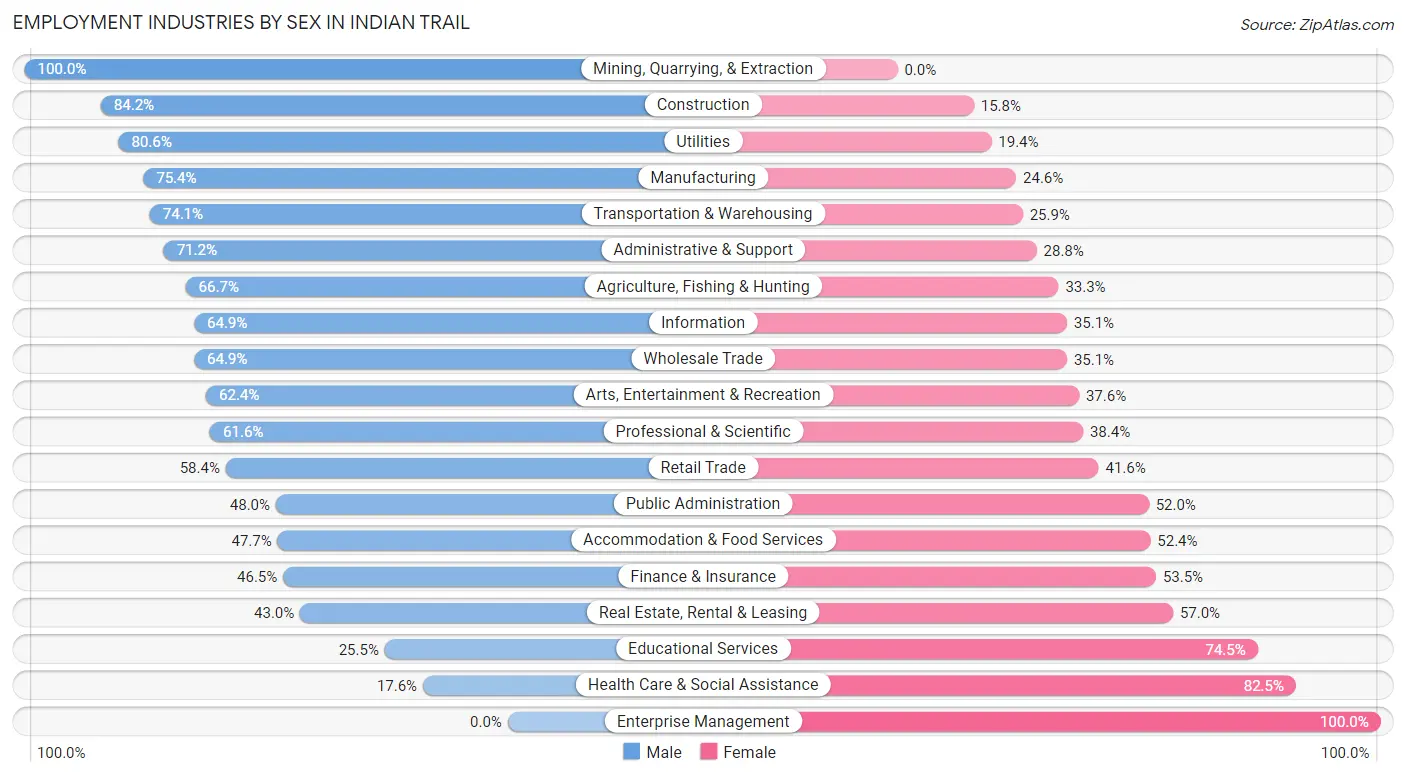
Employment Industries by Sex in Indian Trail
The Indian Trail industries that see more men than women are Mining, Quarrying, & Extraction (100.0%), Construction (84.2%), and Utilities (80.6%), whereas the industries that tend to have a higher number of women are Enterprise Management (100.0%), Health Care & Social Assistance (82.5%), and Educational Services (74.5%).
| Industry | Male | Female |
| Agriculture, Fishing & Hunting | 14 (66.7%) | 7 (33.3%) |
| Mining, Quarrying, & Extraction | 52 (100.0%) | 0 (0.0%) |
| Construction | 1,119 (84.2%) | 210 (15.8%) |
| Manufacturing | 1,750 (75.4%) | 570 (24.6%) |
| Wholesale Trade | 457 (64.9%) | 247 (35.1%) |
| Retail Trade | 1,642 (58.4%) | 1,171 (41.6%) |
| Transportation & Warehousing | 734 (74.1%) | 257 (25.9%) |
| Utilities | 87 (80.6%) | 21 (19.4%) |
| Information | 322 (64.9%) | 174 (35.1%) |
| Finance & Insurance | 1,131 (46.5%) | 1,302 (53.5%) |
| Real Estate, Rental & Leasing | 113 (43.0%) | 150 (57.0%) |
| Professional & Scientific | 773 (61.6%) | 482 (38.4%) |
| Enterprise Management | 0 (0.0%) | 28 (100.0%) |
| Administrative & Support | 729 (71.2%) | 295 (28.8%) |
| Educational Services | 494 (25.5%) | 1,446 (74.5%) |
| Health Care & Social Assistance | 448 (17.5%) | 2,105 (82.5%) |
| Arts, Entertainment & Recreation | 284 (62.4%) | 171 (37.6%) |
| Accommodation & Food Services | 698 (47.6%) | 767 (52.3%) |
| Public Administration | 167 (48.0%) | 181 (52.0%) |
| Total | 11,805 (54.0%) | 10,063 (46.0%) |
Education in Indian Trail
School Enrollment in Indian Trail
The most common levels of schooling among the 11,159 students in Indian Trail are middle school (3,040 | 27.2%), high school (2,678 | 24.0%), and elementary school (2,269 | 20.3%).
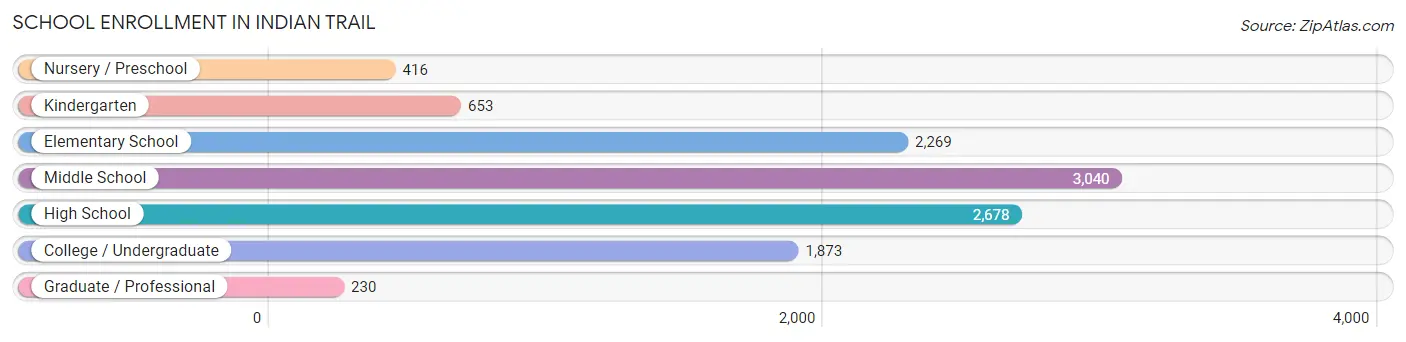
| School Level | # Students | % Students |
| Nursery / Preschool | 416 | 3.7% |
| Kindergarten | 653 | 5.9% |
| Elementary School | 2,269 | 20.3% |
| Middle School | 3,040 | 27.2% |
| High School | 2,678 | 24.0% |
| College / Undergraduate | 1,873 | 16.8% |
| Graduate / Professional | 230 | 2.1% |
| Total | 11,159 | 100.0% |
School Enrollment by Age by Funding Source in Indian Trail
Out of a total of 11,159 students who are enrolled in schools in Indian Trail, 1,897 (17.0%) attend a private institution, while the remaining 9,262 (83.0%) are enrolled in public schools. The age group of 3 to 4 year olds has the highest likelihood of being enrolled in private schools, with 302 (74.2% in the age bracket) enrolled. Conversely, the age group of 5 to 9 year old has the lowest likelihood of being enrolled in a private school, with 2,403 (89.8% in the age bracket) attending a public institution.
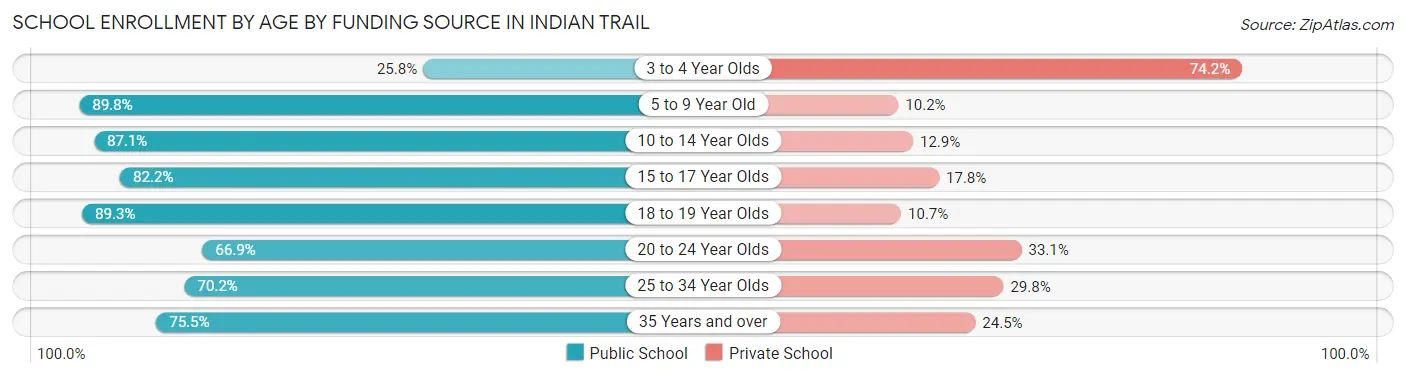
| Age Bracket | Public School | Private School |
| 3 to 4 Year Olds | 105 (25.8%) | 302 (74.2%) |
| 5 to 9 Year Old | 2,403 (89.8%) | 273 (10.2%) |
| 10 to 14 Year Olds | 3,041 (87.1%) | 451 (12.9%) |
| 15 to 17 Year Olds | 1,632 (82.2%) | 353 (17.8%) |
| 18 to 19 Year Olds | 1,143 (89.3%) | 137 (10.7%) |
| 20 to 24 Year Olds | 432 (66.9%) | 214 (33.1%) |
| 25 to 34 Year Olds | 92 (70.2%) | 39 (29.8%) |
| 35 Years and over | 409 (75.5%) | 133 (24.5%) |
| Total | 9,262 (83.0%) | 1,897 (17.0%) |
Educational Attainment by Field of Study in Indian Trail
Business (2,839 | 26.3%), education (1,330 | 12.3%), science & technology (1,020 | 9.4%), arts & humanities (863 | 8.0%), and social sciences (719 | 6.7%) are the most common fields of study among 10,805 individuals in Indian Trail who have obtained a bachelor's degree or higher.
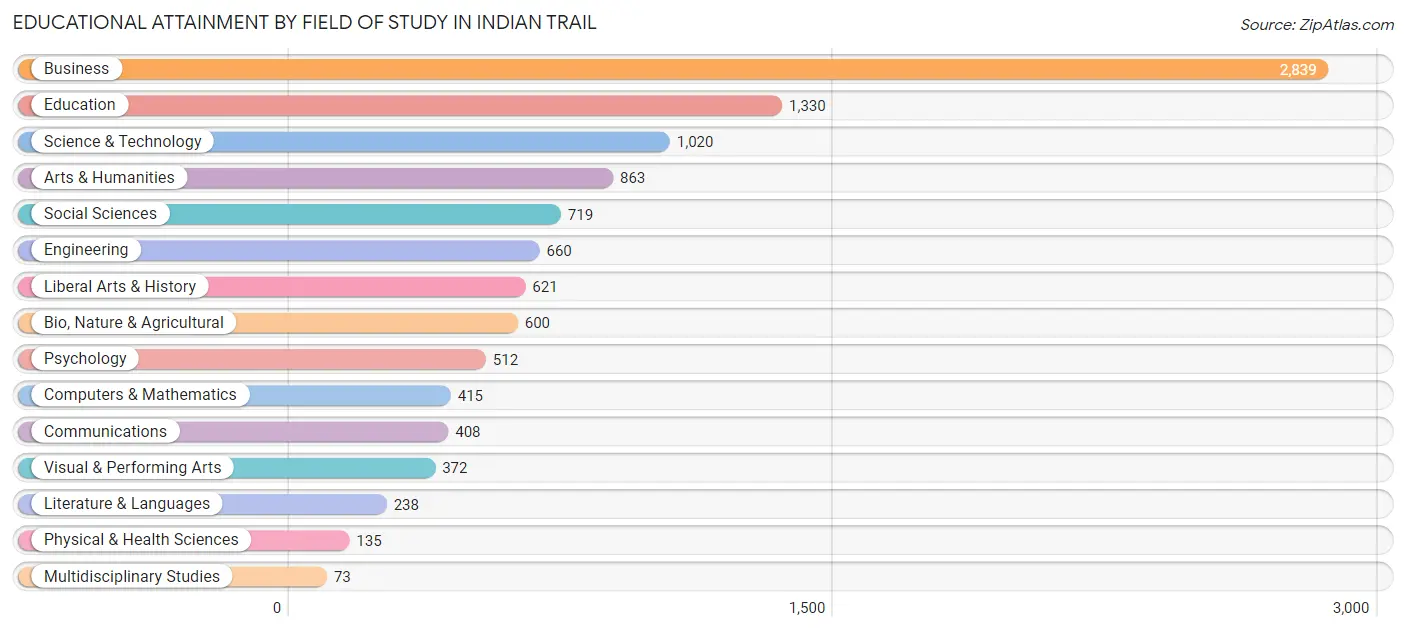
| Field of Study | # Graduates | % Graduates |
| Computers & Mathematics | 415 | 3.8% |
| Bio, Nature & Agricultural | 600 | 5.6% |
| Physical & Health Sciences | 135 | 1.3% |
| Psychology | 512 | 4.7% |
| Social Sciences | 719 | 6.7% |
| Engineering | 660 | 6.1% |
| Multidisciplinary Studies | 73 | 0.7% |
| Science & Technology | 1,020 | 9.4% |
| Business | 2,839 | 26.3% |
| Education | 1,330 | 12.3% |
| Literature & Languages | 238 | 2.2% |
| Liberal Arts & History | 621 | 5.8% |
| Visual & Performing Arts | 372 | 3.4% |
| Communications | 408 | 3.8% |
| Arts & Humanities | 863 | 8.0% |
| Total | 10,805 | 100.0% |
Transportation & Commute in Indian Trail
Vehicle Availability by Sex in Indian Trail
The most prevalent vehicle ownership categories in Indian Trail are males with 2 vehicles (5,041, accounting for 43.2%) and females with 2 vehicles (4,215, making up 51.4%).
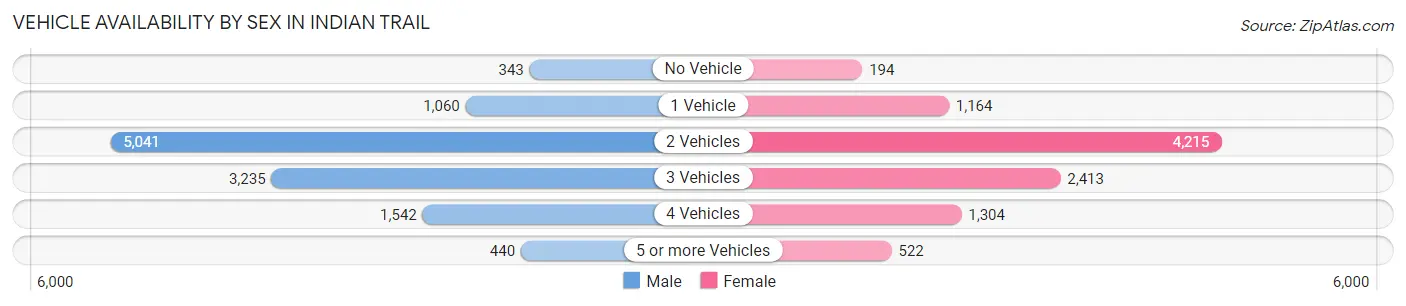
| Vehicles Available | Male | Female |
| No Vehicle | 343 (2.9%) | 194 (2.0%) |
| 1 Vehicle | 1,060 (9.1%) | 1,164 (11.9%) |
| 2 Vehicles | 5,041 (43.2%) | 4,215 (43.0%) |
| 3 Vehicles | 3,235 (27.7%) | 2,413 (24.6%) |
| 4 Vehicles | 1,542 (13.2%) | 1,304 (13.3%) |
| 5 or more Vehicles | 440 (3.8%) | 522 (5.3%) |
| Total | 11,661 (100.0%) | 9,812 (100.0%) |
Commute Time in Indian Trail
The most frequently occuring commute durations in Indian Trail are 30 to 34 minutes (2,756 commuters, 15.3%), 45 to 59 minutes (2,523 commuters, 14.0%), and 15 to 19 minutes (2,384 commuters, 13.3%).
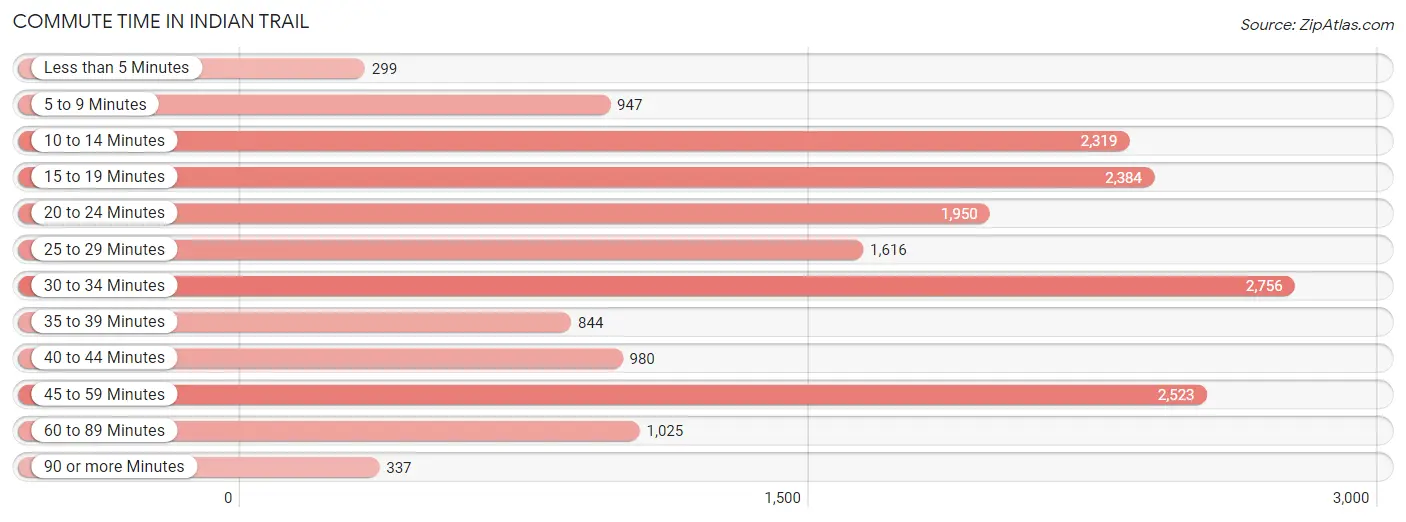
| Commute Time | # Commuters | % Commuters |
| Less than 5 Minutes | 299 | 1.7% |
| 5 to 9 Minutes | 947 | 5.3% |
| 10 to 14 Minutes | 2,319 | 12.9% |
| 15 to 19 Minutes | 2,384 | 13.3% |
| 20 to 24 Minutes | 1,950 | 10.8% |
| 25 to 29 Minutes | 1,616 | 9.0% |
| 30 to 34 Minutes | 2,756 | 15.3% |
| 35 to 39 Minutes | 844 | 4.7% |
| 40 to 44 Minutes | 980 | 5.4% |
| 45 to 59 Minutes | 2,523 | 14.0% |
| 60 to 89 Minutes | 1,025 | 5.7% |
| 90 or more Minutes | 337 | 1.9% |
Commute Time by Sex in Indian Trail
The most common commute times in Indian Trail are 30 to 34 minutes (1,796 commuters, 18.1%) for males and 15 to 19 minutes (1,363 commuters, 16.9%) for females.
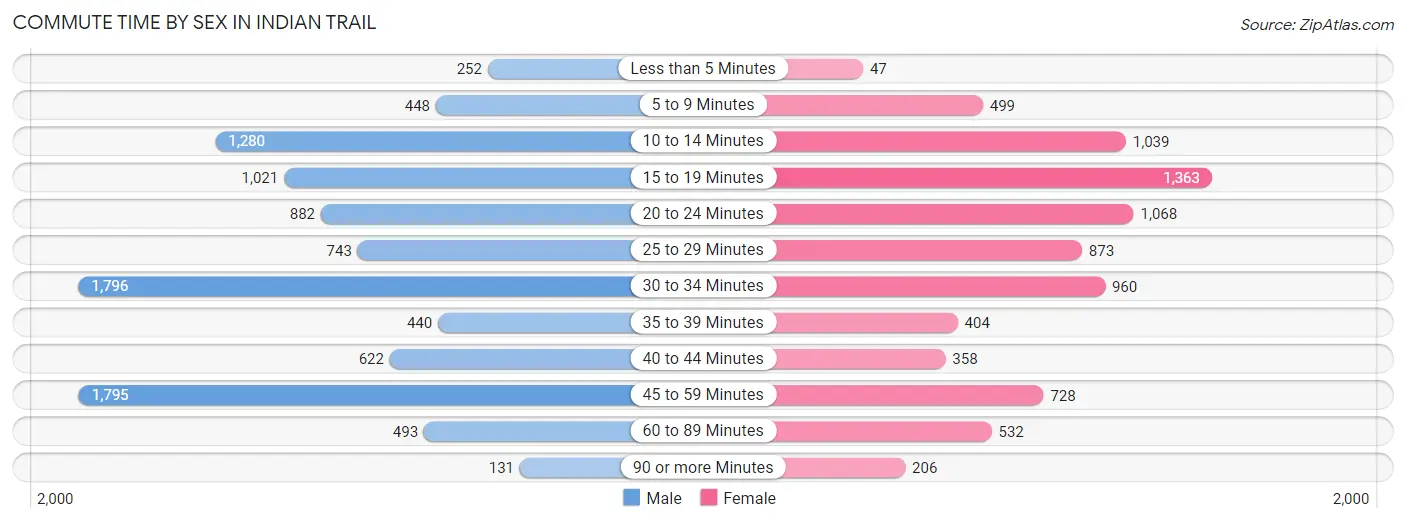
| Commute Time | Male | Female |
| Less than 5 Minutes | 252 (2.5%) | 47 (0.6%) |
| 5 to 9 Minutes | 448 (4.5%) | 499 (6.2%) |
| 10 to 14 Minutes | 1,280 (12.9%) | 1,039 (12.9%) |
| 15 to 19 Minutes | 1,021 (10.3%) | 1,363 (16.9%) |
| 20 to 24 Minutes | 882 (8.9%) | 1,068 (13.2%) |
| 25 to 29 Minutes | 743 (7.5%) | 873 (10.8%) |
| 30 to 34 Minutes | 1,796 (18.1%) | 960 (11.9%) |
| 35 to 39 Minutes | 440 (4.4%) | 404 (5.0%) |
| 40 to 44 Minutes | 622 (6.3%) | 358 (4.4%) |
| 45 to 59 Minutes | 1,795 (18.1%) | 728 (9.0%) |
| 60 to 89 Minutes | 493 (5.0%) | 532 (6.6%) |
| 90 or more Minutes | 131 (1.3%) | 206 (2.5%) |
Time of Departure to Work by Sex in Indian Trail
The most frequent times of departure to work in Indian Trail are 7:00 AM to 7:29 AM (1,814, 18.3%) for males and 6:30 AM to 6:59 AM (1,263, 15.6%) for females.
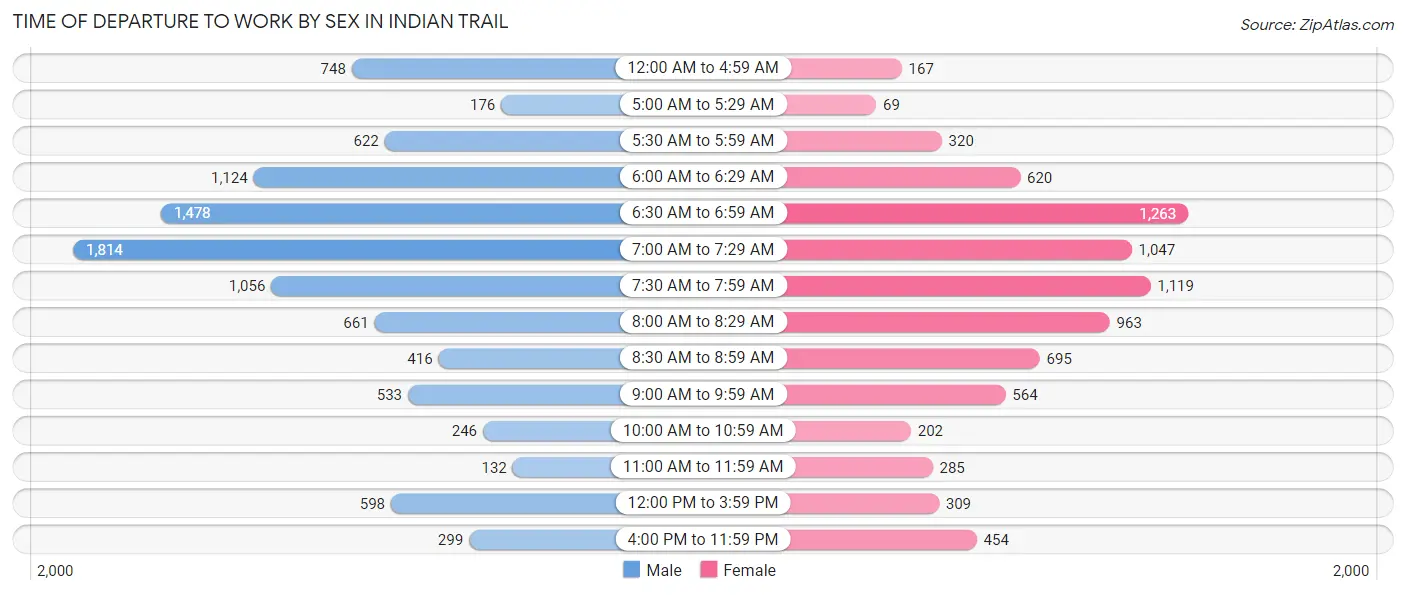
| Time of Departure | Male | Female |
| 12:00 AM to 4:59 AM | 748 (7.5%) | 167 (2.1%) |
| 5:00 AM to 5:29 AM | 176 (1.8%) | 69 (0.9%) |
| 5:30 AM to 5:59 AM | 622 (6.3%) | 320 (4.0%) |
| 6:00 AM to 6:29 AM | 1,124 (11.4%) | 620 (7.7%) |
| 6:30 AM to 6:59 AM | 1,478 (14.9%) | 1,263 (15.6%) |
| 7:00 AM to 7:29 AM | 1,814 (18.3%) | 1,047 (13.0%) |
| 7:30 AM to 7:59 AM | 1,056 (10.7%) | 1,119 (13.9%) |
| 8:00 AM to 8:29 AM | 661 (6.7%) | 963 (11.9%) |
| 8:30 AM to 8:59 AM | 416 (4.2%) | 695 (8.6%) |
| 9:00 AM to 9:59 AM | 533 (5.4%) | 564 (7.0%) |
| 10:00 AM to 10:59 AM | 246 (2.5%) | 202 (2.5%) |
| 11:00 AM to 11:59 AM | 132 (1.3%) | 285 (3.5%) |
| 12:00 PM to 3:59 PM | 598 (6.0%) | 309 (3.8%) |
| 4:00 PM to 11:59 PM | 299 (3.0%) | 454 (5.6%) |
| Total | 9,903 (100.0%) | 8,077 (100.0%) |
Housing Occupancy in Indian Trail
Occupancy by Ownership in Indian Trail
Of the total 13,078 dwellings in Indian Trail, owner-occupied units account for 10,866 (83.1%), while renter-occupied units make up 2,212 (16.9%).
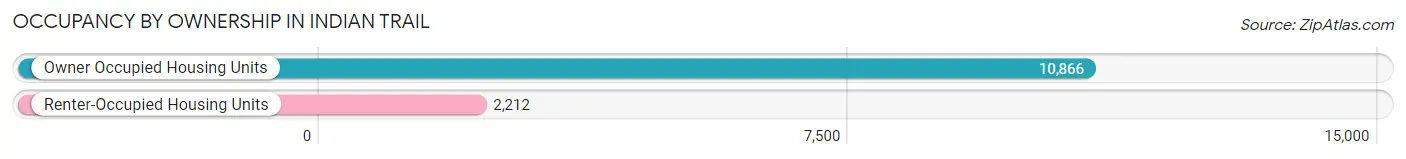
| Occupancy | # Housing Units | % Housing Units |
| Owner Occupied Housing Units | 10,866 | 83.1% |
| Renter-Occupied Housing Units | 2,212 | 16.9% |
| Total Occupied Housing Units | 13,078 | 100.0% |
Occupancy by Household Size in Indian Trail
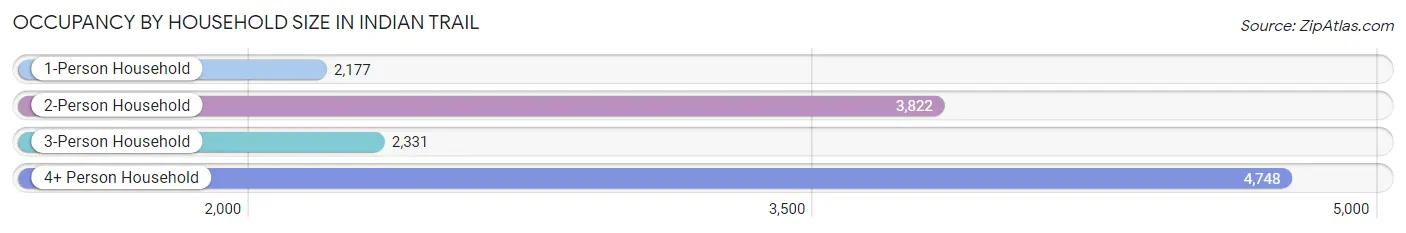
| Household Size | # Housing Units | % Housing Units |
| 1-Person Household | 2,177 | 16.7% |
| 2-Person Household | 3,822 | 29.2% |
| 3-Person Household | 2,331 | 17.8% |
| 4+ Person Household | 4,748 | 36.3% |
| Total Housing Units | 13,078 | 100.0% |
Occupancy by Ownership by Household Size in Indian Trail
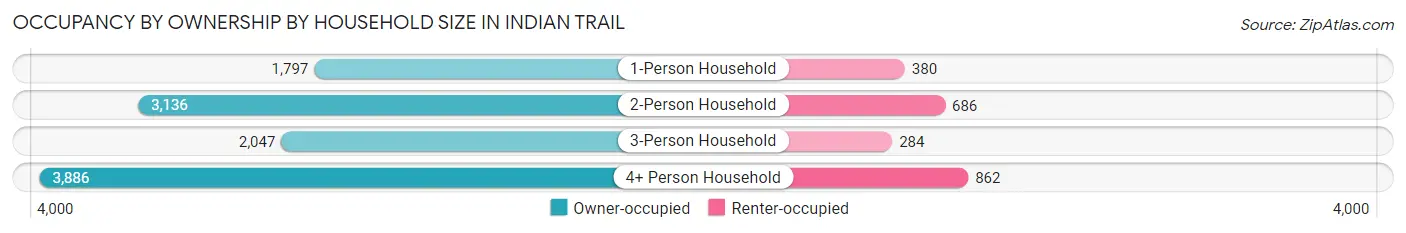
| Household Size | Owner-occupied | Renter-occupied |
| 1-Person Household | 1,797 (82.5%) | 380 (17.5%) |
| 2-Person Household | 3,136 (82.1%) | 686 (17.9%) |
| 3-Person Household | 2,047 (87.8%) | 284 (12.2%) |
| 4+ Person Household | 3,886 (81.8%) | 862 (18.2%) |
| Total Housing Units | 10,866 (83.1%) | 2,212 (16.9%) |
Occupancy by Educational Attainment in Indian Trail
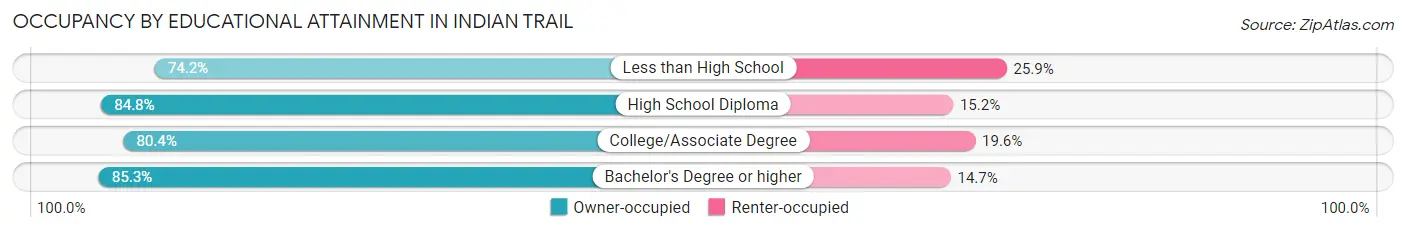
| Household Size | Owner-occupied | Renter-occupied |
| Less than High School | 565 (74.2%) | 197 (25.9%) |
| High School Diploma | 2,321 (84.8%) | 417 (15.2%) |
| College/Associate Degree | 3,074 (80.4%) | 750 (19.6%) |
| Bachelor's Degree or higher | 4,906 (85.3%) | 848 (14.7%) |
Occupancy by Age of Householder in Indian Trail
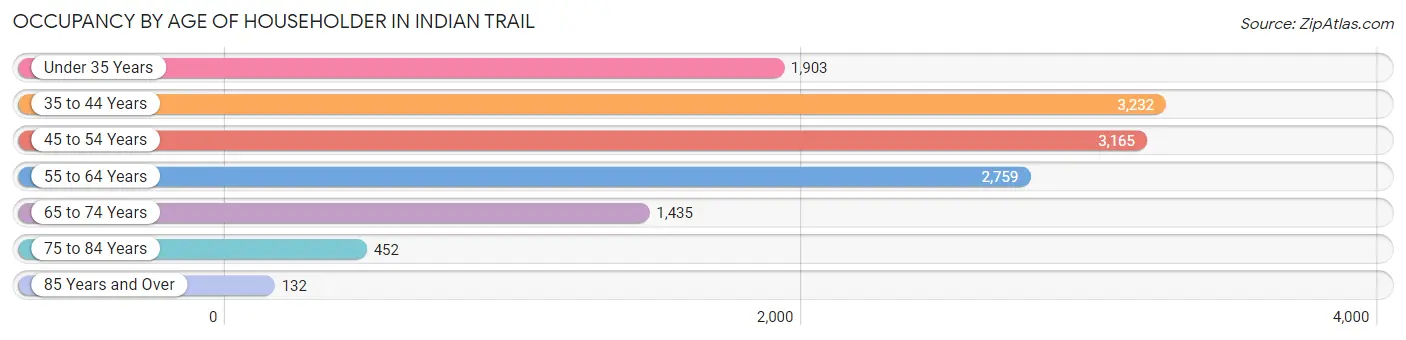
| Age Bracket | # Households | % Households |
| Under 35 Years | 1,903 | 14.5% |
| 35 to 44 Years | 3,232 | 24.7% |
| 45 to 54 Years | 3,165 | 24.2% |
| 55 to 64 Years | 2,759 | 21.1% |
| 65 to 74 Years | 1,435 | 11.0% |
| 75 to 84 Years | 452 | 3.5% |
| 85 Years and Over | 132 | 1.0% |
| Total | 13,078 | 100.0% |
Housing Finances in Indian Trail
Median Income by Occupancy in Indian Trail
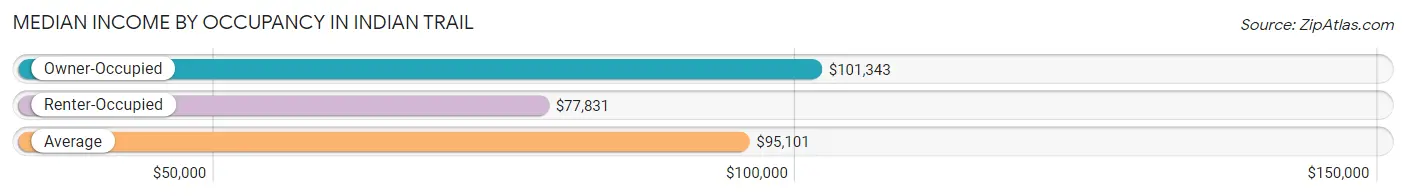
| Occupancy Type | # Households | Median Income |
| Owner-Occupied | 10,866 (83.1%) | $101,343 |
| Renter-Occupied | 2,212 (16.9%) | $77,831 |
| Average | 13,078 (100.0%) | $95,101 |
Occupancy by Householder Income Bracket in Indian Trail
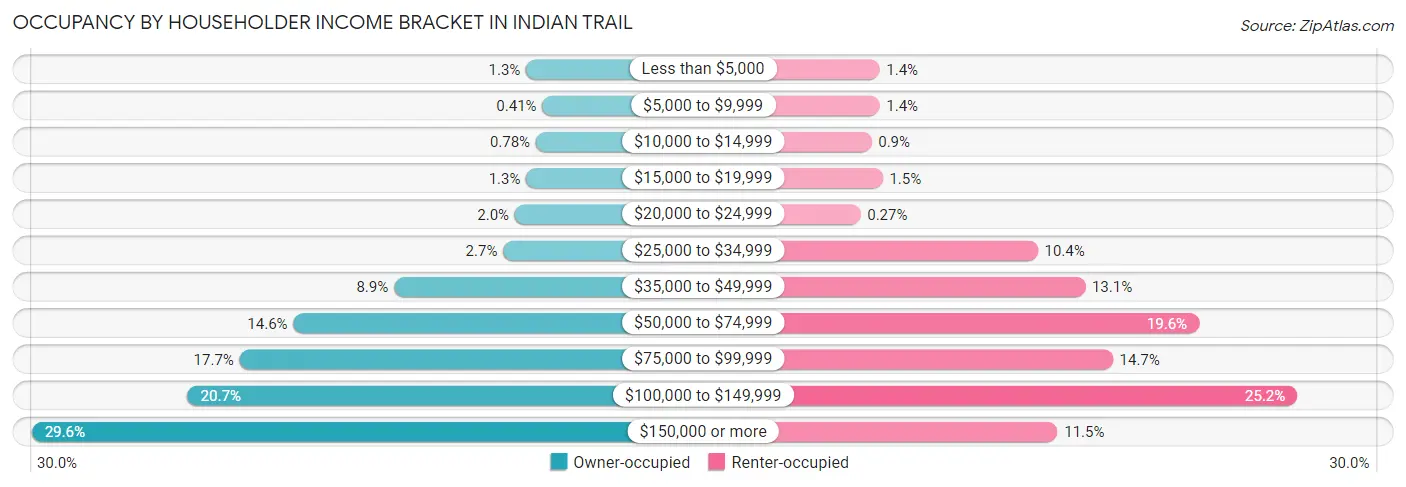
| Income Bracket | Owner-occupied | Renter-occupied |
| Less than $5,000 | 146 (1.3%) | 30 (1.4%) |
| $5,000 to $9,999 | 45 (0.4%) | 30 (1.4%) |
| $10,000 to $14,999 | 85 (0.8%) | 20 (0.9%) |
| $15,000 to $19,999 | 144 (1.3%) | 34 (1.5%) |
| $20,000 to $24,999 | 215 (2.0%) | 6 (0.3%) |
| $25,000 to $34,999 | 288 (2.6%) | 230 (10.4%) |
| $35,000 to $49,999 | 966 (8.9%) | 290 (13.1%) |
| $50,000 to $74,999 | 1,591 (14.6%) | 434 (19.6%) |
| $75,000 to $99,999 | 1,924 (17.7%) | 325 (14.7%) |
| $100,000 to $149,999 | 2,247 (20.7%) | 558 (25.2%) |
| $150,000 or more | 3,215 (29.6%) | 255 (11.5%) |
| Total | 10,866 (100.0%) | 2,212 (100.0%) |
Monthly Housing Cost Tiers in Indian Trail
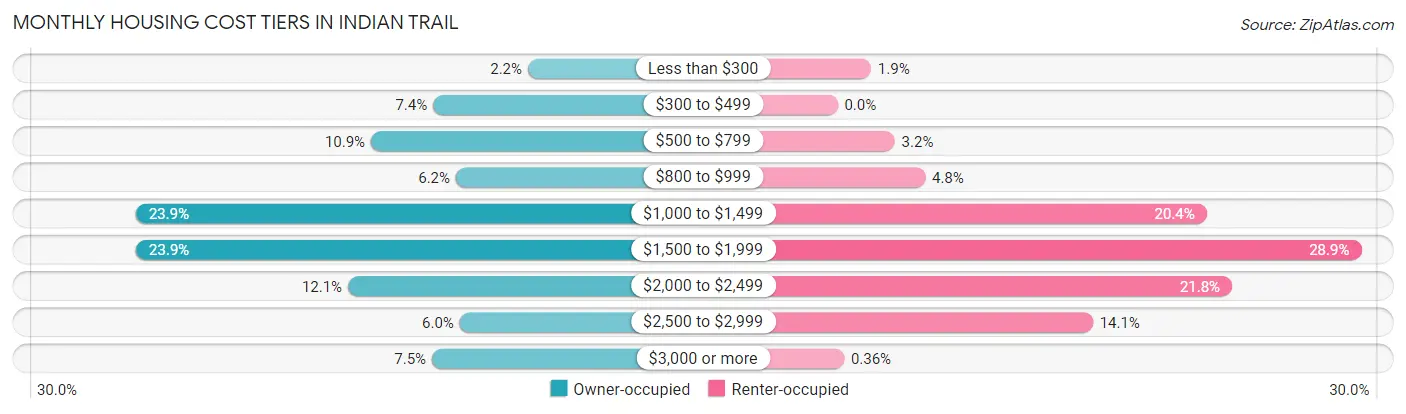
| Monthly Cost | Owner-occupied | Renter-occupied |
| Less than $300 | 239 (2.2%) | 41 (1.8%) |
| $300 to $499 | 808 (7.4%) | 0 (0.0%) |
| $500 to $799 | 1,181 (10.9%) | 70 (3.2%) |
| $800 to $999 | 671 (6.2%) | 107 (4.8%) |
| $1,000 to $1,499 | 2,593 (23.9%) | 451 (20.4%) |
| $1,500 to $1,999 | 2,591 (23.8%) | 640 (28.9%) |
| $2,000 to $2,499 | 1,319 (12.1%) | 482 (21.8%) |
| $2,500 to $2,999 | 649 (6.0%) | 312 (14.1%) |
| $3,000 or more | 815 (7.5%) | 8 (0.4%) |
| Total | 10,866 (100.0%) | 2,212 (100.0%) |
Physical Housing Characteristics in Indian Trail
Housing Structures in Indian Trail
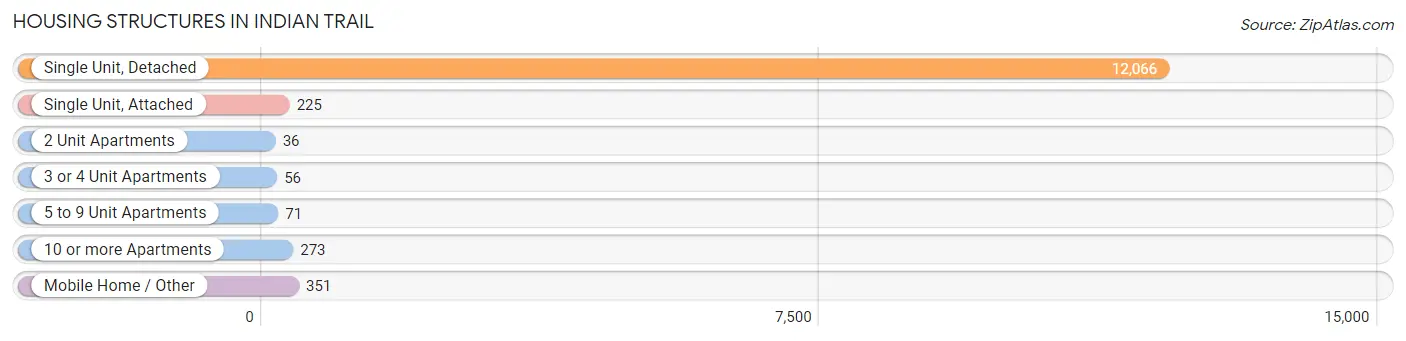
| Structure Type | # Housing Units | % Housing Units |
| Single Unit, Detached | 12,066 | 92.3% |
| Single Unit, Attached | 225 | 1.7% |
| 2 Unit Apartments | 36 | 0.3% |
| 3 or 4 Unit Apartments | 56 | 0.4% |
| 5 to 9 Unit Apartments | 71 | 0.5% |
| 10 or more Apartments | 273 | 2.1% |
| Mobile Home / Other | 351 | 2.7% |
| Total | 13,078 | 100.0% |
Housing Structures by Occupancy in Indian Trail
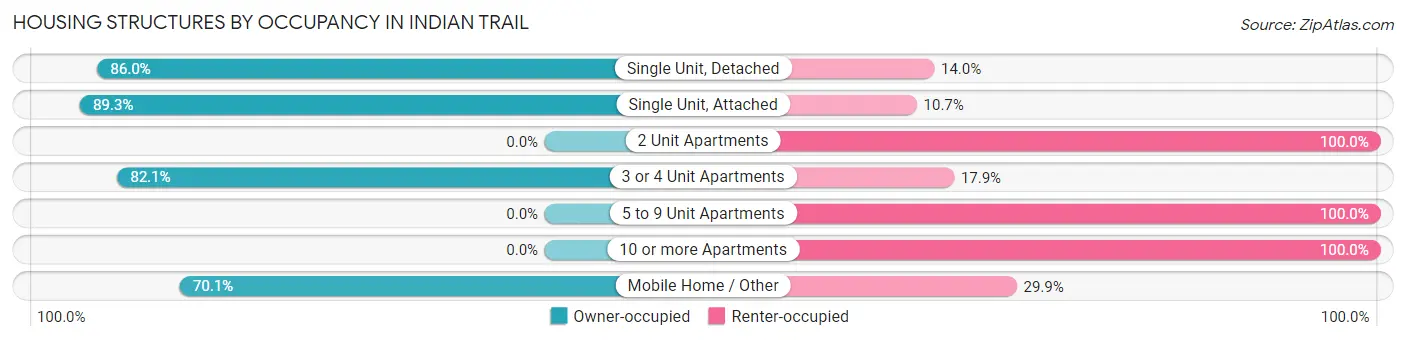
| Structure Type | Owner-occupied | Renter-occupied |
| Single Unit, Detached | 10,373 (86.0%) | 1,693 (14.0%) |
| Single Unit, Attached | 201 (89.3%) | 24 (10.7%) |
| 2 Unit Apartments | 0 (0.0%) | 36 (100.0%) |
| 3 or 4 Unit Apartments | 46 (82.1%) | 10 (17.9%) |
| 5 to 9 Unit Apartments | 0 (0.0%) | 71 (100.0%) |
| 10 or more Apartments | 0 (0.0%) | 273 (100.0%) |
| Mobile Home / Other | 246 (70.1%) | 105 (29.9%) |
| Total | 10,866 (83.1%) | 2,212 (16.9%) |
Housing Structures by Number of Rooms in Indian Trail
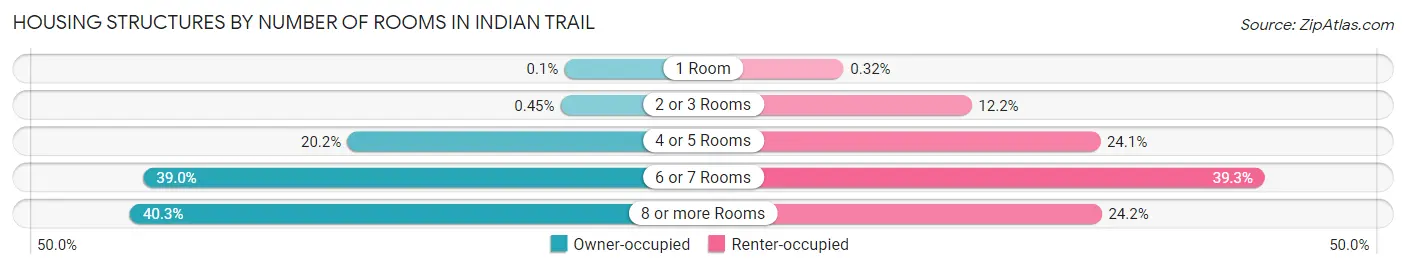
| Number of Rooms | Owner-occupied | Renter-occupied |
| 1 Room | 11 (0.1%) | 7 (0.3%) |
| 2 or 3 Rooms | 49 (0.4%) | 269 (12.2%) |
| 4 or 5 Rooms | 2,193 (20.2%) | 532 (24.0%) |
| 6 or 7 Rooms | 4,239 (39.0%) | 869 (39.3%) |
| 8 or more Rooms | 4,374 (40.3%) | 535 (24.2%) |
| Total | 10,866 (100.0%) | 2,212 (100.0%) |
Housing Structure by Heating Type in Indian Trail
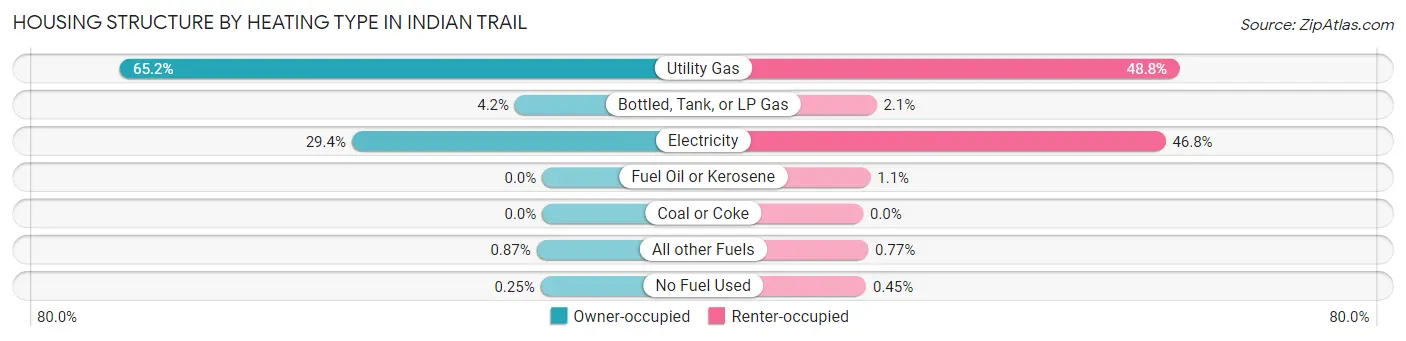
| Heating Type | Owner-occupied | Renter-occupied |
| Utility Gas | 7,088 (65.2%) | 1,080 (48.8%) |
| Bottled, Tank, or LP Gas | 458 (4.2%) | 46 (2.1%) |
| Electricity | 3,198 (29.4%) | 1,034 (46.8%) |
| Fuel Oil or Kerosene | 0 (0.0%) | 25 (1.1%) |
| Coal or Coke | 0 (0.0%) | 0 (0.0%) |
| All other Fuels | 95 (0.9%) | 17 (0.8%) |
| No Fuel Used | 27 (0.3%) | 10 (0.4%) |
| Total | 10,866 (100.0%) | 2,212 (100.0%) |
Household Vehicle Usage in Indian Trail
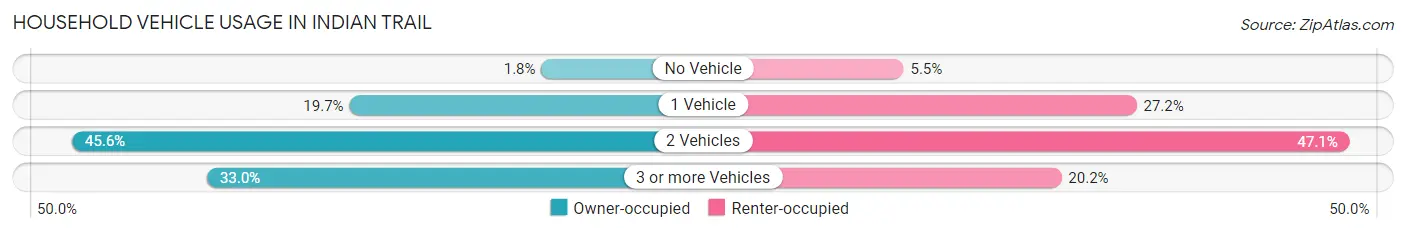
| Vehicles per Household | Owner-occupied | Renter-occupied |
| No Vehicle | 191 (1.8%) | 121 (5.5%) |
| 1 Vehicle | 2,138 (19.7%) | 602 (27.2%) |
| 2 Vehicles | 4,953 (45.6%) | 1,042 (47.1%) |
| 3 or more Vehicles | 3,584 (33.0%) | 447 (20.2%) |
| Total | 10,866 (100.0%) | 2,212 (100.0%) |
Real Estate & Mortgages in Indian Trail
Real Estate and Mortgage Overview in Indian Trail
| Characteristic | Without Mortgage | With Mortgage |
| Housing Units | 2,182 | 8,684 |
| Median Property Value | $269,300 | $313,100 |
| Median Household Income | $69,436 | $3,040 |
| Monthly Housing Costs | $522 | $815 |
| Real Estate Taxes | $1,861 | $235 |
Property Value by Mortgage Status in Indian Trail
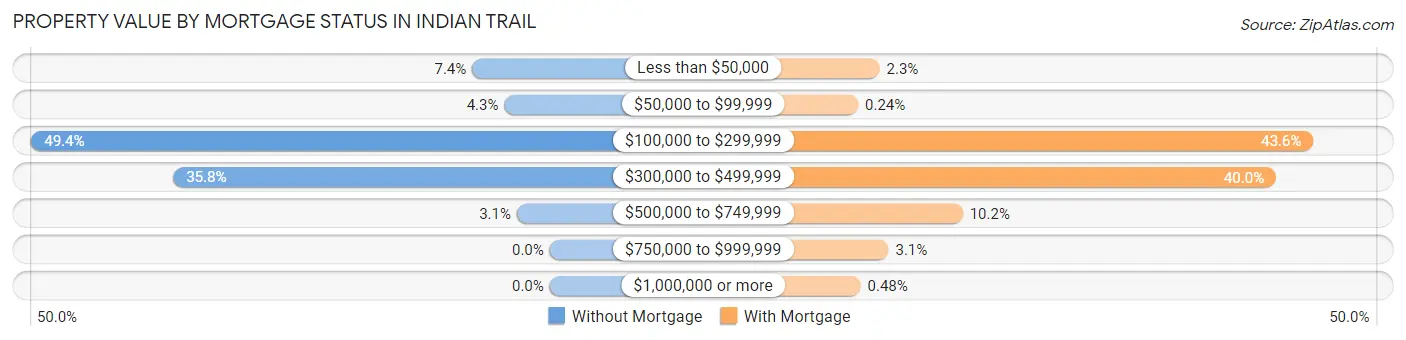
| Property Value | Without Mortgage | With Mortgage |
| Less than $50,000 | 161 (7.4%) | 199 (2.3%) |
| $50,000 to $99,999 | 94 (4.3%) | 21 (0.2%) |
| $100,000 to $299,999 | 1,077 (49.4%) | 3,785 (43.6%) |
| $300,000 to $499,999 | 782 (35.8%) | 3,477 (40.0%) |
| $500,000 to $749,999 | 68 (3.1%) | 887 (10.2%) |
| $750,000 to $999,999 | 0 (0.0%) | 273 (3.1%) |
| $1,000,000 or more | 0 (0.0%) | 42 (0.5%) |
| Total | 2,182 (100.0%) | 8,684 (100.0%) |
Household Income by Mortgage Status in Indian Trail

| Household Income | Without Mortgage | With Mortgage |
| Less than $10,000 | 62 (2.8%) | 32 (0.4%) |
| $10,000 to $24,999 | 239 (11.0%) | 129 (1.5%) |
| $25,000 to $34,999 | 108 (5.0%) | 205 (2.4%) |
| $35,000 to $49,999 | 294 (13.5%) | 180 (2.1%) |
| $50,000 to $74,999 | 504 (23.1%) | 672 (7.7%) |
| $75,000 to $99,999 | 424 (19.4%) | 1,087 (12.5%) |
| $100,000 to $149,999 | 376 (17.2%) | 1,500 (17.3%) |
| $150,000 or more | 175 (8.0%) | 1,871 (21.5%) |
| Total | 2,182 (100.0%) | 8,684 (100.0%) |
Property Value to Household Income Ratio in Indian Trail
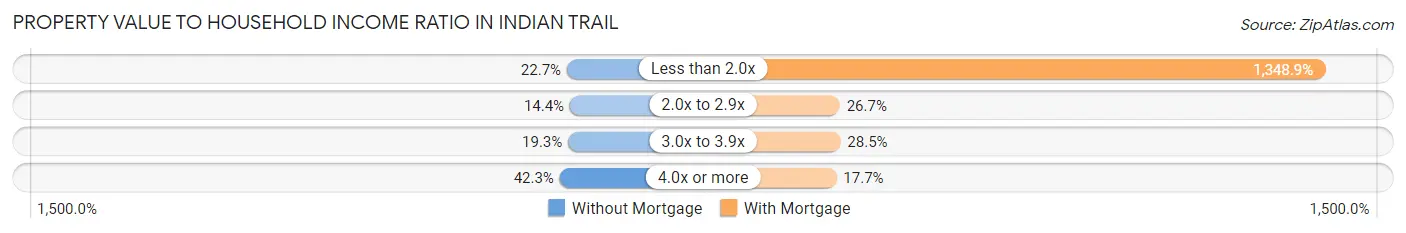
| Value-to-Income Ratio | Without Mortgage | With Mortgage |
| Less than 2.0x | 495 (22.7%) | 117,139 (1,348.9%) |
| 2.0x to 2.9x | 314 (14.4%) | 2,315 (26.7%) |
| 3.0x to 3.9x | 422 (19.3%) | 2,477 (28.5%) |
| 4.0x or more | 923 (42.3%) | 1,538 (17.7%) |
| Total | 2,182 (100.0%) | 8,684 (100.0%) |
Real Estate Taxes by Mortgage Status in Indian Trail
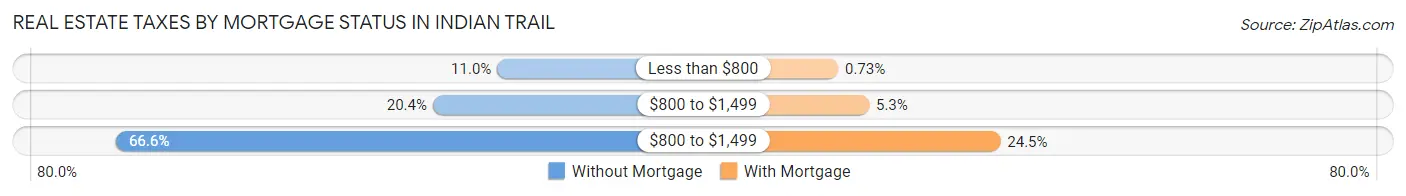
| Property Taxes | Without Mortgage | With Mortgage |
| Less than $800 | 239 (11.0%) | 63 (0.7%) |
| $800 to $1,499 | 444 (20.3%) | 457 (5.3%) |
| $800 to $1,499 | 1,454 (66.6%) | 2,123 (24.4%) |
| Total | 2,182 (100.0%) | 8,684 (100.0%) |
Health & Disability in Indian Trail
Health Insurance Coverage by Age in Indian Trail
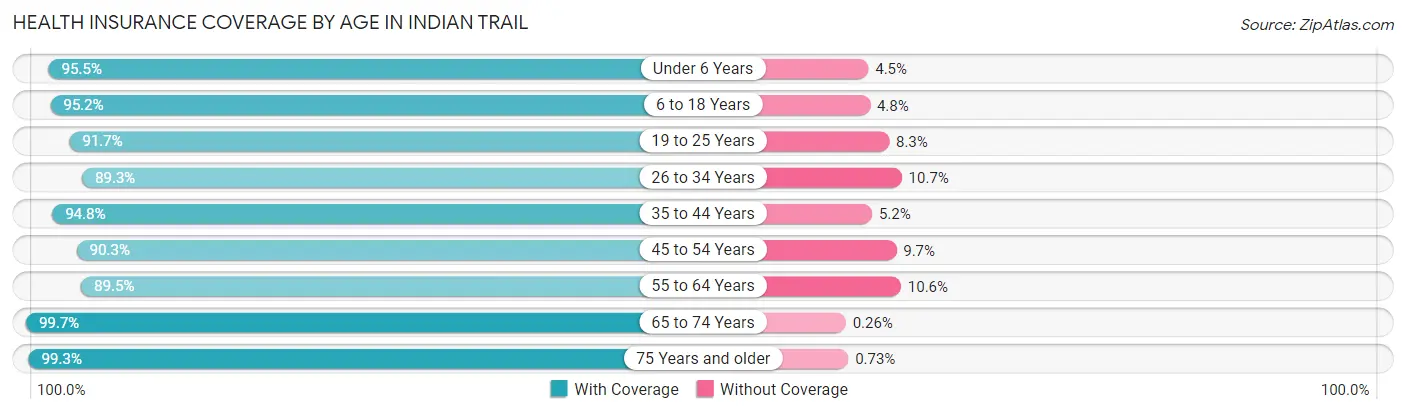
| Age Bracket | With Coverage | Without Coverage |
| Under 6 Years | 3,097 (95.5%) | 145 (4.5%) |
| 6 to 18 Years | 8,187 (95.2%) | 412 (4.8%) |
| 19 to 25 Years | 3,266 (91.7%) | 297 (8.3%) |
| 26 to 34 Years | 3,882 (89.3%) | 465 (10.7%) |
| 35 to 44 Years | 5,885 (94.8%) | 320 (5.2%) |
| 45 to 54 Years | 5,478 (90.3%) | 588 (9.7%) |
| 55 to 64 Years | 4,077 (89.4%) | 481 (10.5%) |
| 65 to 74 Years | 2,640 (99.7%) | 7 (0.3%) |
| 75 Years and older | 1,090 (99.3%) | 8 (0.7%) |
| Total | 37,602 (93.2%) | 2,723 (6.8%) |
Health Insurance Coverage by Citizenship Status in Indian Trail
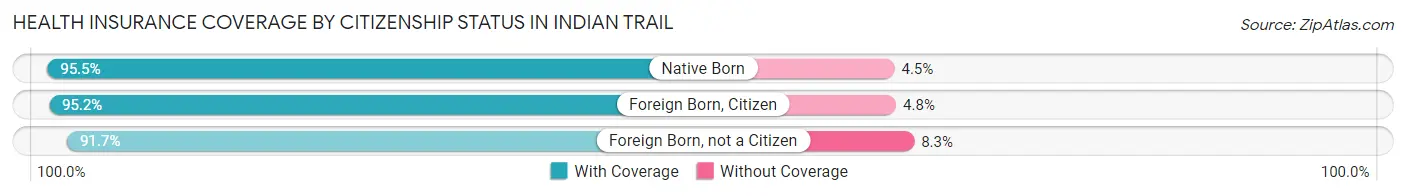
| Citizenship Status | With Coverage | Without Coverage |
| Native Born | 3,097 (95.5%) | 145 (4.5%) |
| Foreign Born, Citizen | 8,187 (95.2%) | 412 (4.8%) |
| Foreign Born, not a Citizen | 3,266 (91.7%) | 297 (8.3%) |
Health Insurance Coverage by Household Income in Indian Trail
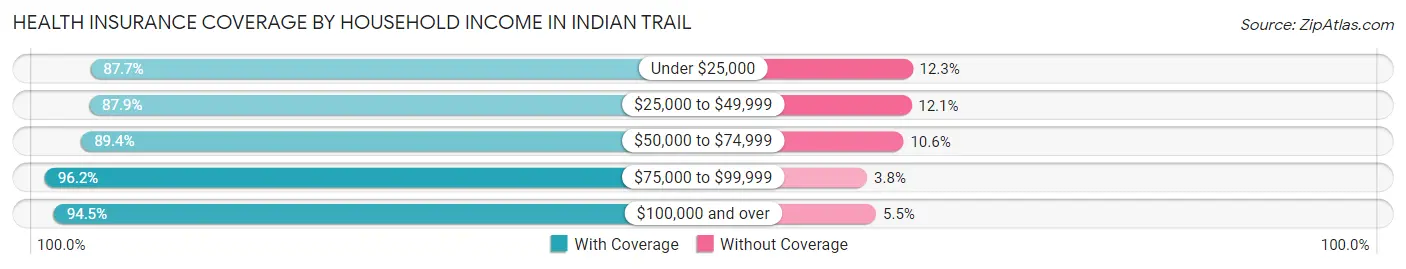
| Household Income | With Coverage | Without Coverage |
| Under $25,000 | 1,402 (87.7%) | 197 (12.3%) |
| $25,000 to $49,999 | 3,253 (87.9%) | 447 (12.1%) |
| $50,000 to $74,999 | 4,839 (89.4%) | 575 (10.6%) |
| $75,000 to $99,999 | 6,969 (96.2%) | 276 (3.8%) |
| $100,000 and over | 21,139 (94.5%) | 1,228 (5.5%) |
Public vs Private Health Insurance Coverage by Age in Indian Trail
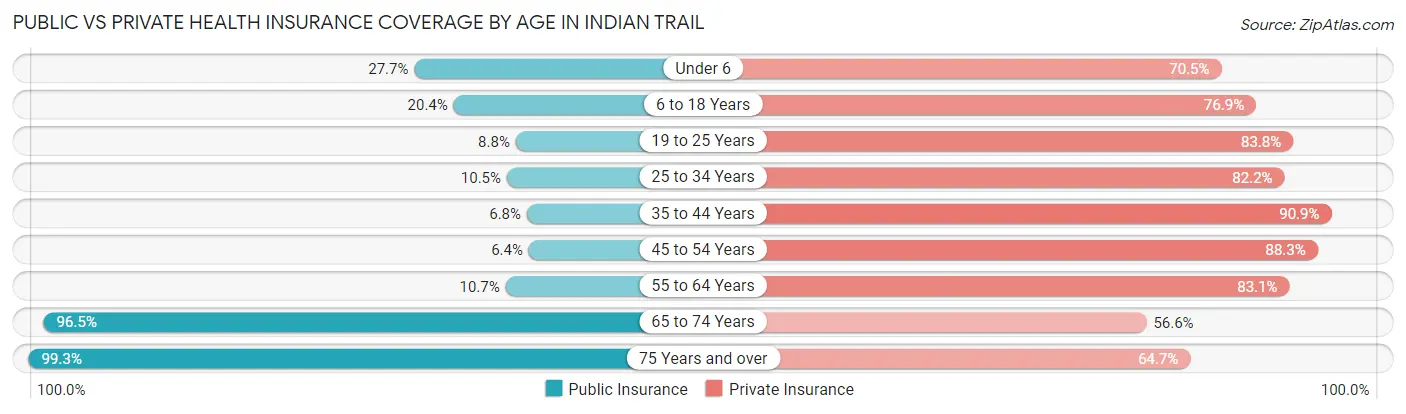
| Age Bracket | Public Insurance | Private Insurance |
| Under 6 | 897 (27.7%) | 2,284 (70.5%) |
| 6 to 18 Years | 1,752 (20.4%) | 6,612 (76.9%) |
| 19 to 25 Years | 315 (8.8%) | 2,984 (83.8%) |
| 25 to 34 Years | 456 (10.5%) | 3,571 (82.2%) |
| 35 to 44 Years | 420 (6.8%) | 5,637 (90.8%) |
| 45 to 54 Years | 389 (6.4%) | 5,356 (88.3%) |
| 55 to 64 Years | 489 (10.7%) | 3,787 (83.1%) |
| 65 to 74 Years | 2,554 (96.5%) | 1,497 (56.6%) |
| 75 Years and over | 1,090 (99.3%) | 710 (64.7%) |
| Total | 8,362 (20.7%) | 32,438 (80.4%) |
Disability Status by Sex by Age in Indian Trail
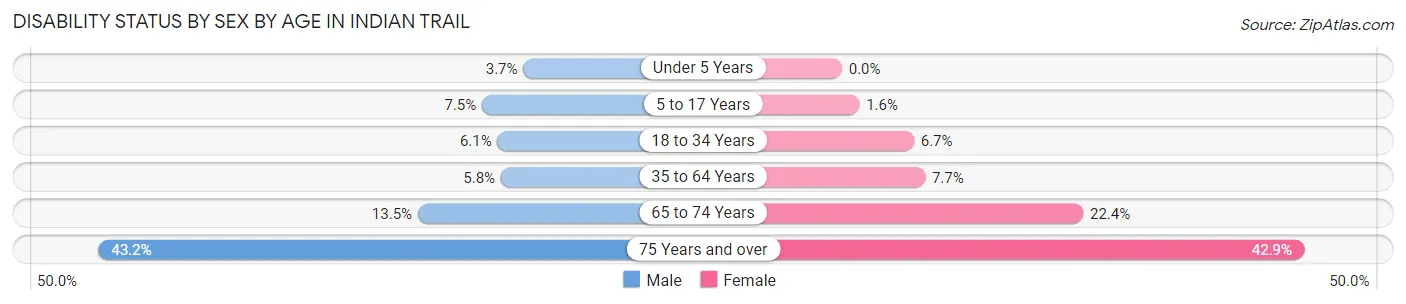
| Age Bracket | Male | Female |
| Under 5 Years | 48 (3.7%) | 0 (0.0%) |
| 5 to 17 Years | 317 (7.5%) | 67 (1.6%) |
| 18 to 34 Years | 265 (6.1%) | 292 (6.7%) |
| 35 to 64 Years | 491 (5.8%) | 644 (7.7%) |
| 65 to 74 Years | 162 (13.5%) | 324 (22.4%) |
| 75 Years and over | 183 (43.2%) | 289 (42.9%) |
Disability Class by Sex by Age in Indian Trail
Disability Class: Hearing Difficulty
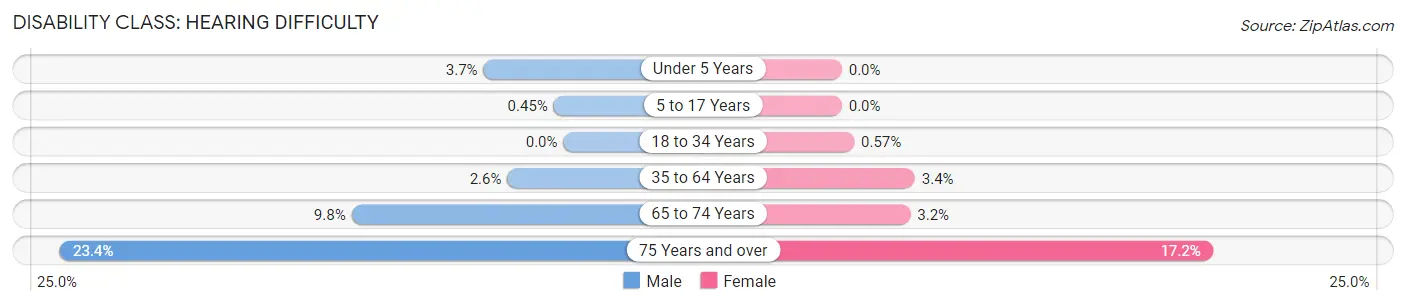
| Age Bracket | Male | Female |
| Under 5 Years | 48 (3.7%) | 0 (0.0%) |
| 5 to 17 Years | 19 (0.4%) | 0 (0.0%) |
| 18 to 34 Years | 0 (0.0%) | 25 (0.6%) |
| 35 to 64 Years | 221 (2.6%) | 283 (3.4%) |
| 65 to 74 Years | 118 (9.8%) | 46 (3.2%) |
| 75 Years and over | 99 (23.4%) | 116 (17.2%) |
Disability Class: Vision Difficulty
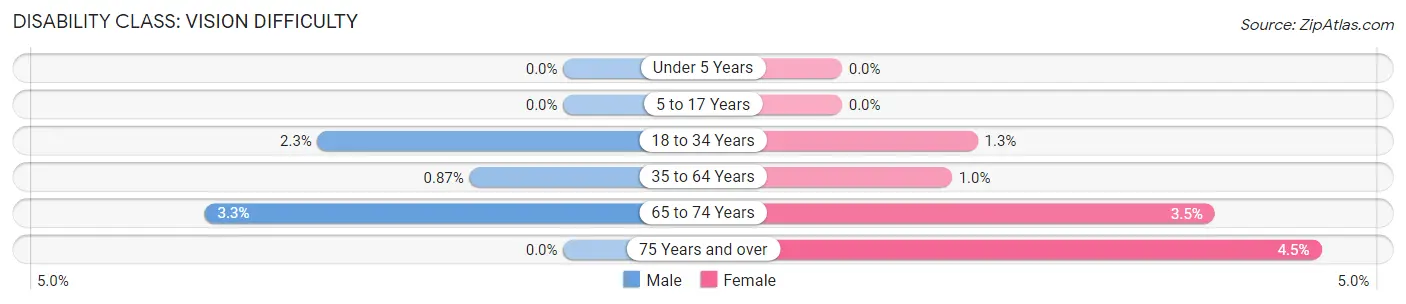
| Age Bracket | Male | Female |
| Under 5 Years | 0 (0.0%) | 0 (0.0%) |
| 5 to 17 Years | 0 (0.0%) | 0 (0.0%) |
| 18 to 34 Years | 99 (2.3%) | 55 (1.3%) |
| 35 to 64 Years | 74 (0.9%) | 85 (1.0%) |
| 65 to 74 Years | 40 (3.3%) | 50 (3.5%) |
| 75 Years and over | 0 (0.0%) | 30 (4.4%) |
Disability Class: Cognitive Difficulty
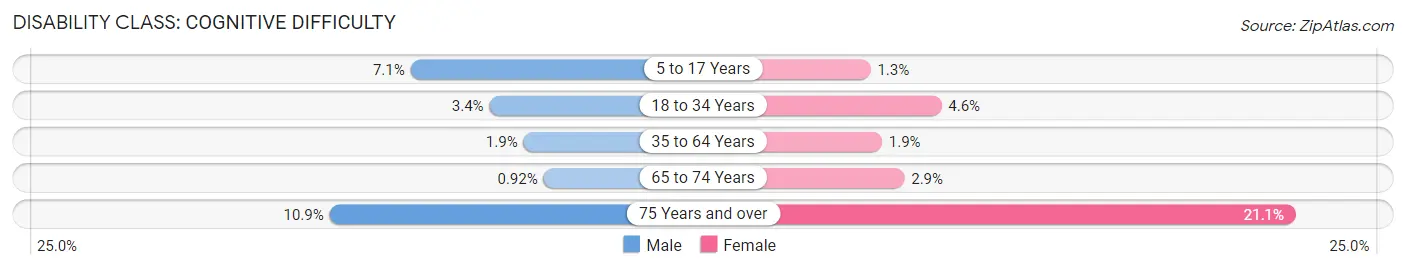
| Age Bracket | Male | Female |
| 5 to 17 Years | 298 (7.1%) | 55 (1.3%) |
| 18 to 34 Years | 149 (3.4%) | 202 (4.6%) |
| 35 to 64 Years | 157 (1.8%) | 155 (1.9%) |
| 65 to 74 Years | 11 (0.9%) | 42 (2.9%) |
| 75 Years and over | 46 (10.8%) | 142 (21.1%) |
Disability Class: Ambulatory Difficulty
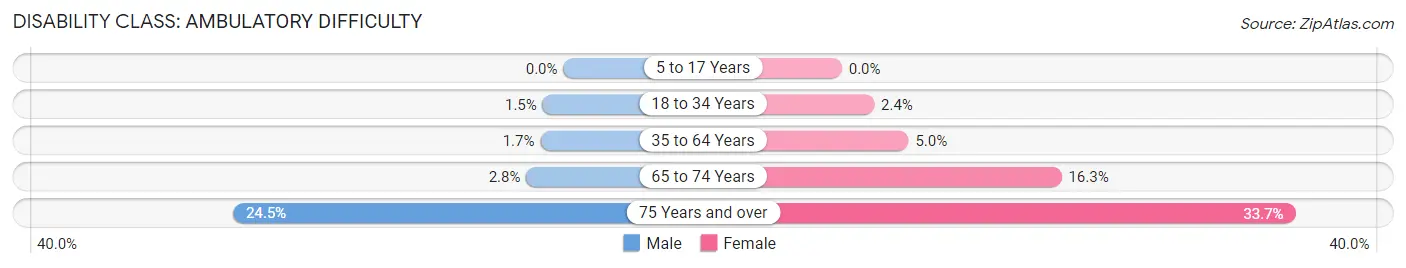
| Age Bracket | Male | Female |
| 5 to 17 Years | 0 (0.0%) | 0 (0.0%) |
| 18 to 34 Years | 67 (1.5%) | 105 (2.4%) |
| 35 to 64 Years | 145 (1.7%) | 413 (5.0%) |
| 65 to 74 Years | 33 (2.8%) | 236 (16.3%) |
| 75 Years and over | 104 (24.5%) | 227 (33.7%) |
Disability Class: Self-Care Difficulty
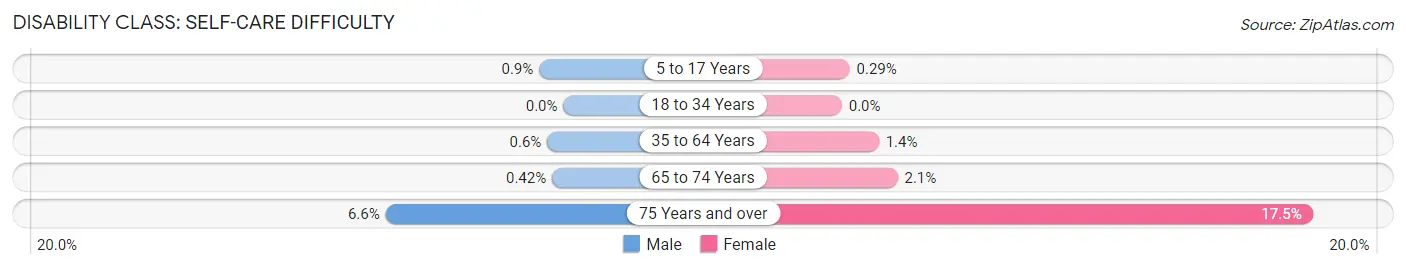
| Age Bracket | Male | Female |
| 5 to 17 Years | 38 (0.9%) | 12 (0.3%) |
| 18 to 34 Years | 0 (0.0%) | 0 (0.0%) |
| 35 to 64 Years | 51 (0.6%) | 114 (1.4%) |
| 65 to 74 Years | 5 (0.4%) | 30 (2.1%) |
| 75 Years and over | 28 (6.6%) | 118 (17.5%) |
Technology Access in Indian Trail
Computing Device Access in Indian Trail
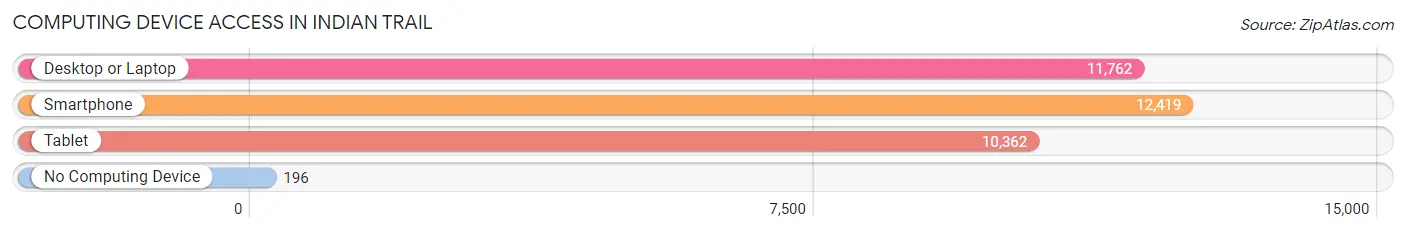
| Device Type | # Households | % Households |
| Desktop or Laptop | 11,762 | 89.9% |
| Smartphone | 12,419 | 95.0% |
| Tablet | 10,362 | 79.2% |
| No Computing Device | 196 | 1.5% |
| Total | 13,078 | 100.0% |
Internet Access in Indian Trail
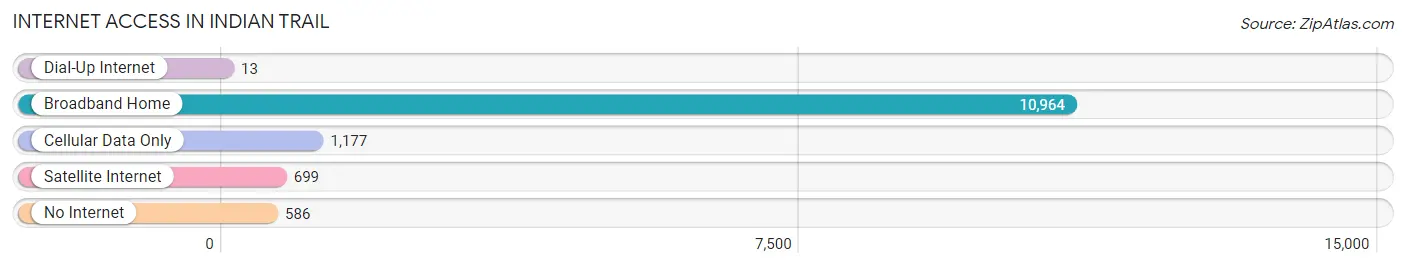
| Internet Type | # Households | % Households |
| Dial-Up Internet | 13 | 0.1% |
| Broadband Home | 10,964 | 83.8% |
| Cellular Data Only | 1,177 | 9.0% |
| Satellite Internet | 699 | 5.3% |
| No Internet | 586 | 4.5% |
| Total | 13,078 | 100.0% |
Indian Trail Summary
Introduction
Indian Trail is a town located in Union County, North Carolina. It is a suburb of Charlotte and is located about 15 miles southeast of the city. The town was founded in the late 1800s and has grown steadily since then. It is now home to over 30,000 people and is a popular destination for those looking to live in a suburban area close to the city.
History
The town of Indian Trail was founded in the late 1800s by a group of settlers from the Catawba Indian Nation. The settlers were looking for a place to call home and found the area to be ideal for farming and raising livestock. The town was originally called “Indian Trail” because of the trails that the settlers used to travel between their homes and the nearby towns.
The town grew slowly over the years and by the early 1900s, it had become a popular destination for those looking to escape the hustle and bustle of the city. The town was incorporated in 1907 and has continued to grow ever since.
Geography
Indian Trail is located in Union County, North Carolina. It is situated about 15 miles southeast of Charlotte and is bordered by the towns of Matthews, Stallings, and Monroe. The town is located in the Piedmont region of North Carolina and is surrounded by rolling hills and forests. The town is located at an elevation of about 800 feet and has a humid subtropical climate.
Economy
The economy of Indian Trail is largely based on the service industry. The town is home to a variety of businesses, including restaurants, retail stores, and professional services. The town is also home to a number of corporate headquarters, including those of Lowe’s Home Improvement and Food Lion.
The town is also home to a number of manufacturing companies, including those that produce furniture, textiles, and automotive parts. The town is also home to a number of technology companies, including those that specialize in software development and IT services.
Demographics
As of the 2010 census, the population of Indian Trail was 30,395. The town has a diverse population, with the majority of residents being white (77.3%), followed by African American (14.2%), Hispanic (4.7%), and Asian (2.7%). The median household income in the town is $63,945, and the median home value is $212,000.
Conclusion
Indian Trail is a town located in Union County, North Carolina. It is a suburb of Charlotte and is located about 15 miles southeast of the city. The town was founded in the late 1800s and has grown steadily since then. It is now home to over 30,000 people and is a popular destination for those looking to live in a suburban area close to the city. The town has a diverse economy, with the majority of its residents employed in the service industry. The town also has a diverse population, with the majority of residents being white. Indian Trail is a great place to live for those looking for a suburban lifestyle close to the city.
Common Questions
What is Per Capita Income in Indian Trail?
Per Capita income in Indian Trail is $40,108.
What is the Median Family Income in Indian Trail?
Median Family Income in Indian Trail is $109,425.
What is the Median Household income in Indian Trail?
Median Household Income in Indian Trail is $95,101.
What is Income or Wage Gap in Indian Trail?
Income or Wage Gap in Indian Trail is 33.5%.
Women in Indian Trail earn 66.5 cents for every dollar earned by a man.
What is Family Income Deficit in Indian Trail?
Family Income Deficit in Indian Trail is $14,107.
Families that are below poverty line in Indian Trail earn $14,107 less on average than the poverty threshold level.
What is Inequality or Gini Index in Indian Trail?
Inequality or Gini Index in Indian Trail is 0.39.
What is the Total Population of Indian Trail?
Total Population of Indian Trail is 40,325.
What is the Total Male Population of Indian Trail?
Total Male Population of Indian Trail is 19,947.
What is the Total Female Population of Indian Trail?
Total Female Population of Indian Trail is 20,378.
What is the Ratio of Males per 100 Females in Indian Trail?
There are 97.88 Males per 100 Females in Indian Trail.
What is the Ratio of Females per 100 Males in Indian Trail?
There are 102.16 Females per 100 Males in Indian Trail.
What is the Median Population Age in Indian Trail?
Median Population Age in Indian Trail is 36.1 Years.
What is the Average Family Size in Indian Trail
Average Family Size in Indian Trail is 3.5 People.
What is the Average Household Size in Indian Trail
Average Household Size in Indian Trail is 3.1 People.
How Large is the Labor Force in Indian Trail?
There are 23,093 People in the Labor Forcein in Indian Trail.
What is the Percentage of People in the Labor Force in Indian Trail?
76.0% of People are in the Labor Force in Indian Trail.
What is the Unemployment Rate in Indian Trail?
Unemployment Rate in Indian Trail is 5.3%.