Area Code 910 Map & Demographics
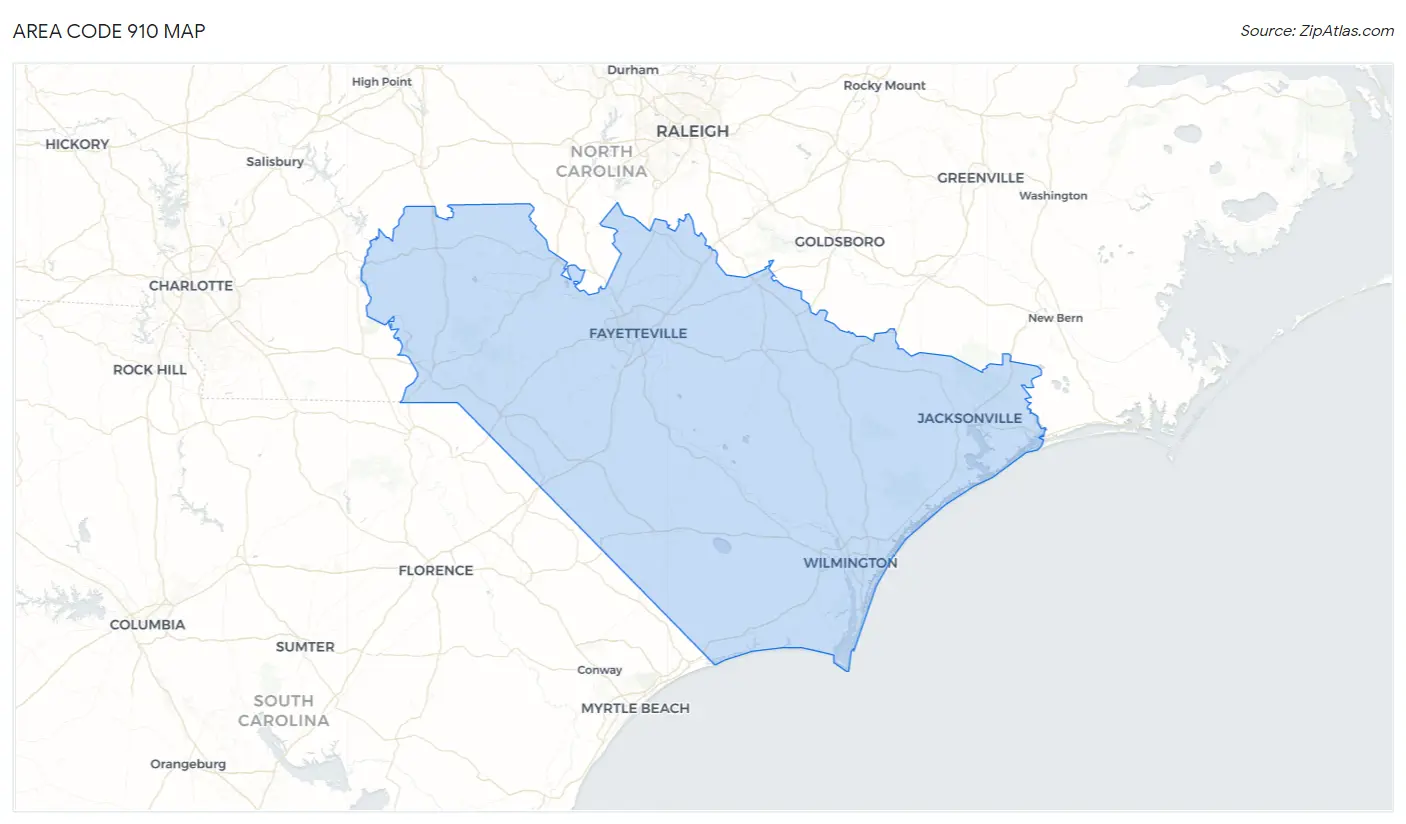
Area Code 910 Map
Area Code 910 Overview
$30,002
PER CAPITA INCOME
$70,714
AVG FAMILY INCOME
$57,012
AVG HOUSEHOLD INCOME
25.2%
WAGE / INCOME GAP [ % ]
74.8¢/ $1
WAGE / INCOME GAP [ $ ]
$11,408
FAMILY INCOME DEFICIT
60.07
INEQUALITY / GINI INDEX
1,538,359
TOTAL POPULATION
765,645
MALE POPULATION
772,714
FEMALE POPULATION
99.09
MALES / 100 FEMALES
100.92
FEMALES / 100 MALES
42.0
MEDIAN AGE
3.2
AVG FAMILY SIZE
2.6
AVG HOUSEHOLD SIZE
698,269
LABOR FORCE [ PEOPLE ]
56.6%
PERCENT IN LABOR FORCE
7.3%
UNEMPLOYMENT RATE
Income in Area Code 910
Income Overview in Area Code 910
Per Capita Income in Area Code 910 is $30,002, while median incomes of families and households are $70,714 and $57,012 respectively.
| Characteristic | Number | Measure |
| Per Capita Income | 1,538,359 | $30,002 |
| Median Family Income | 386,648 | $70,714 |
| Mean Family Income | 386,648 | $11,994,511 |
| Median Household Income | 600,201 | $57,012 |
| Mean Household Income | 600,201 | $10,201,004 |
| Income Deficit | 386,648 | $11,408 |
| Wage / Income Gap (%) | 1,538,359 | 25.23% |
| Wage / Income Gap ($) | 1,538,359 | 74.77¢ per $1 |
| Gini / Inequality Index | 1,538,359 | 60.07 |
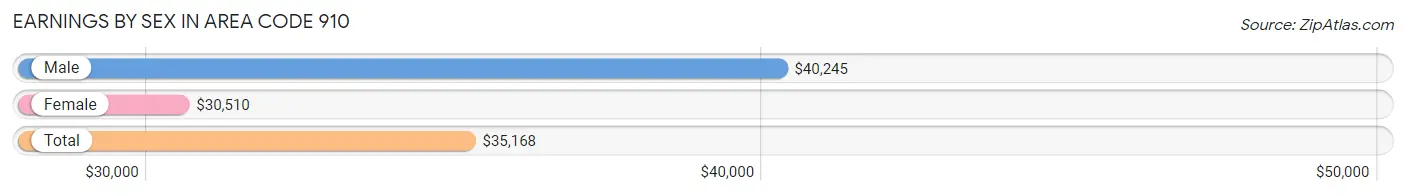
Earnings by Sex in Area Code 910
Average Earnings in Area Code 910 are $35,168, $40,245 for men and $30,510 for women, a difference of 24.2%.
| Sex | Number | Average Earnings |
| Male | 407,076 (53.7%) | $40,245 |
| Female | 351,253 (46.3%) | $30,510 |
| Total | 758,329 (100.0%) | $35,168 |
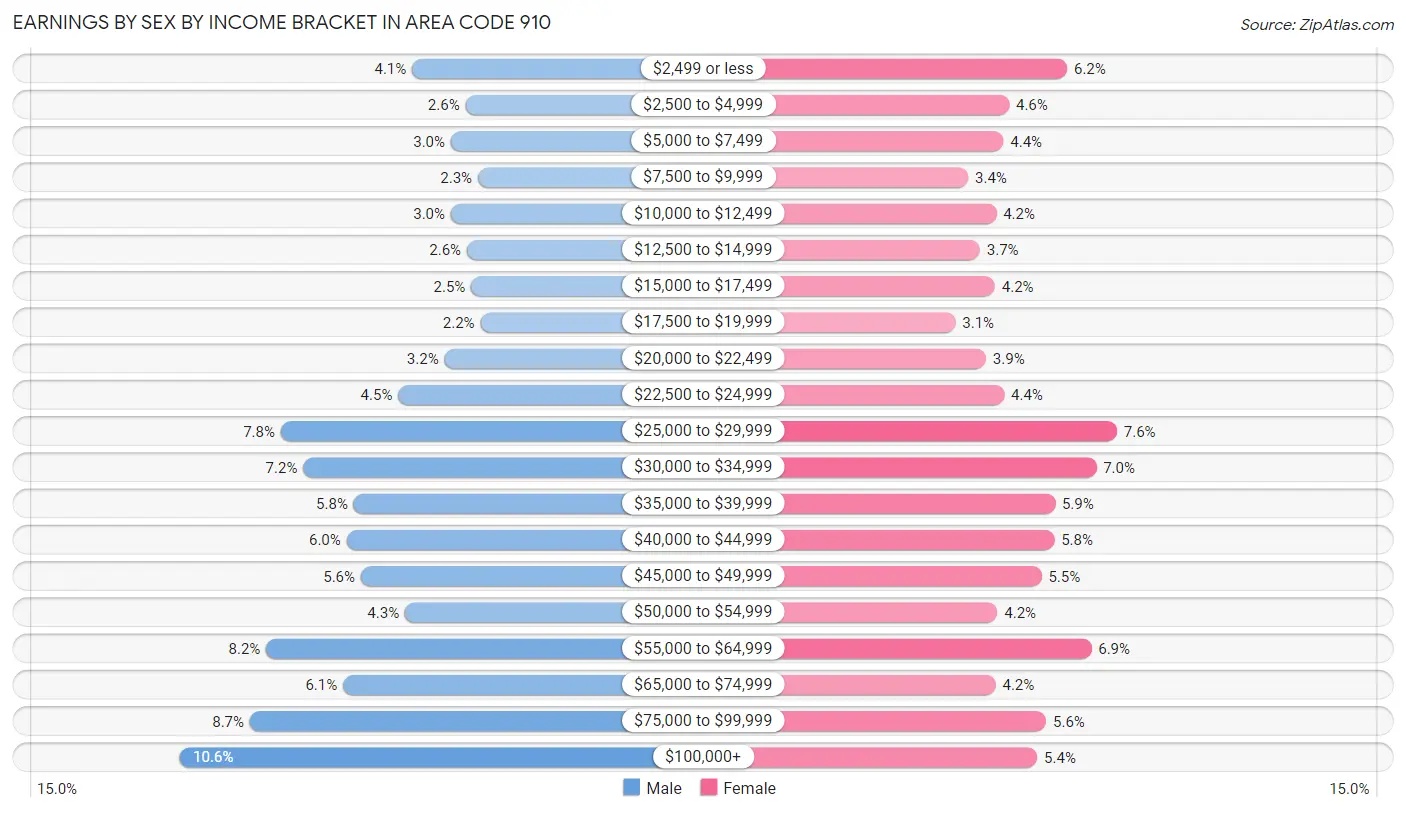
Earnings by Sex by Income Bracket in Area Code 910
The most common earnings brackets in Area Code 910 are $100,000+ for men (43,268 | 10.6%) and $25,000 to $29,999 for women (26,655 | 7.6%).
| Income | Male | Female |
| $2,499 or less | 16,730 (4.1%) | 21,751 (6.2%) |
| $2,500 to $4,999 | 10,633 (2.6%) | 16,000 (4.6%) |
| $5,000 to $7,499 | 12,283 (3.0%) | 15,450 (4.4%) |
| $7,500 to $9,999 | 9,194 (2.3%) | 11,988 (3.4%) |
| $10,000 to $12,499 | 12,292 (3.0%) | 14,761 (4.2%) |
| $12,500 to $14,999 | 10,470 (2.6%) | 13,123 (3.7%) |
| $15,000 to $17,499 | 9,966 (2.5%) | 14,598 (4.2%) |
| $17,500 to $19,999 | 8,905 (2.2%) | 10,707 (3.0%) |
| $20,000 to $22,499 | 13,011 (3.2%) | 13,731 (3.9%) |
| $22,500 to $24,999 | 18,306 (4.5%) | 15,516 (4.4%) |
| $25,000 to $29,999 | 31,736 (7.8%) | 26,655 (7.6%) |
| $30,000 to $34,999 | 29,191 (7.2%) | 24,632 (7.0%) |
| $35,000 to $39,999 | 23,411 (5.8%) | 20,551 (5.9%) |
| $40,000 to $44,999 | 24,222 (5.9%) | 20,462 (5.8%) |
| $45,000 to $49,999 | 22,590 (5.6%) | 19,196 (5.5%) |
| $50,000 to $54,999 | 17,546 (4.3%) | 14,856 (4.2%) |
| $55,000 to $64,999 | 33,401 (8.2%) | 24,123 (6.9%) |
| $65,000 to $74,999 | 24,643 (6.0%) | 14,679 (4.2%) |
| $75,000 to $99,999 | 35,278 (8.7%) | 19,678 (5.6%) |
| $100,000+ | 43,268 (10.6%) | 18,796 (5.3%) |
| Total | 407,076 (100.0%) | 351,253 (100.0%) |
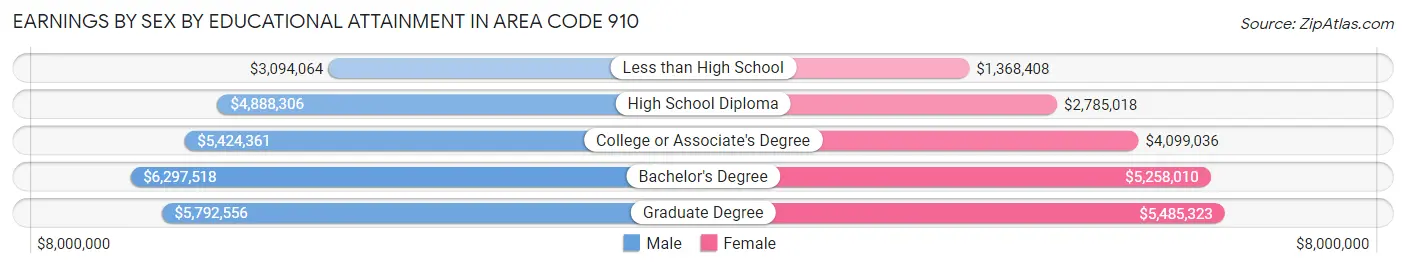
Earnings by Sex by Educational Attainment in Area Code 910
Average earnings in Area Code 910 are $5,874,057 for men and $4,486,774 for women, a difference of 23.6%. Men with an educational attainment of bachelor's degree enjoy the highest average annual earnings of $6,297,518, while those with less than high school education earn the least with $3,094,064. Women with an educational attainment of graduate degree earn the most with the average annual earnings of $5,485,323, while those with less than high school education have the smallest earnings of $1,368,408.
| Educational Attainment | Male Income | Female Income |
| Less than High School | $3,094,064 | $1,368,408 |
| High School Diploma | $4,888,306 | $2,785,018 |
| College or Associate's Degree | $5,424,361 | $4,099,036 |
| Bachelor's Degree | $6,297,518 | $5,258,010 |
| Graduate Degree | $5,792,556 | $5,485,323 |
| Total | $5,874,057 | $4,486,774 |
Family Income in Area Code 910
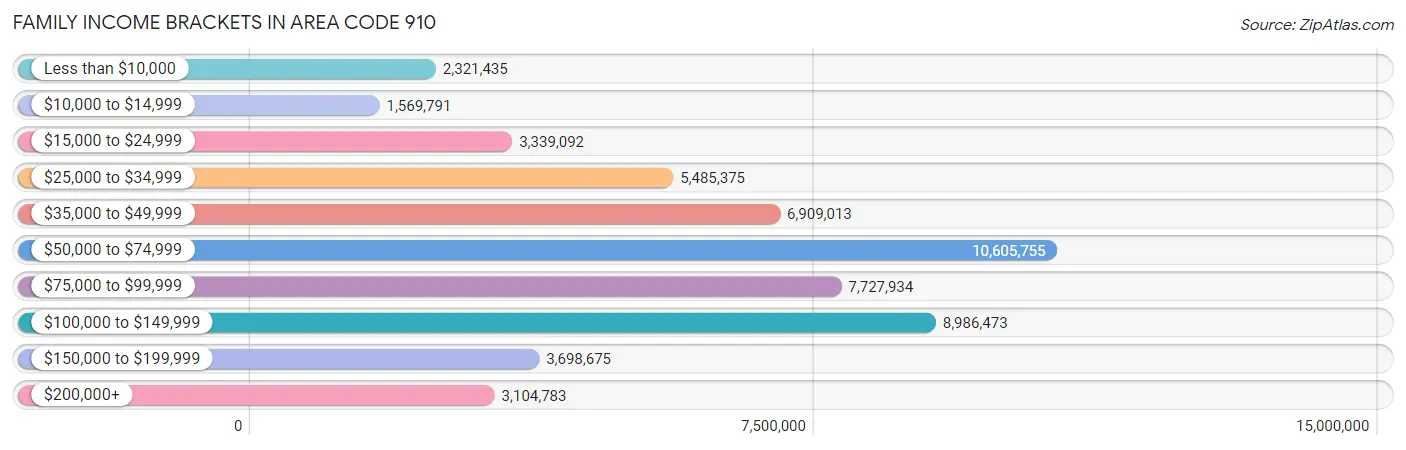
Family Income Brackets in Area Code 910
According to the Area Code 910 family income data, there are 10,605,755 families falling into the $50,000 to $74,999 income range, which is the most common income bracket and makes up 2,743.0% of all families. Conversely, the $10,000 to $14,999 income bracket is the least frequent group with only 1,569,791 families (406.0%) belonging to this category.
| Income Bracket | # Families | % Families |
| Less than $10,000 | 2,321,435 | 600.4% |
| $10,000 to $14,999 | 1,569,791 | 406.0% |
| $15,000 to $24,999 | 3,339,092 | 863.6% |
| $25,000 to $34,999 | 5,485,375 | 1,418.7% |
| $35,000 to $49,999 | 6,909,013 | 1,786.9% |
| $50,000 to $74,999 | 10,605,755 | 2,743.0% |
| $75,000 to $99,999 | 7,727,934 | 1,998.7% |
| $100,000 to $149,999 | 8,986,473 | 2,324.2% |
| $150,000 to $199,999 | 3,698,675 | 956.6% |
| $200,000+ | 3,104,783 | 803.0% |
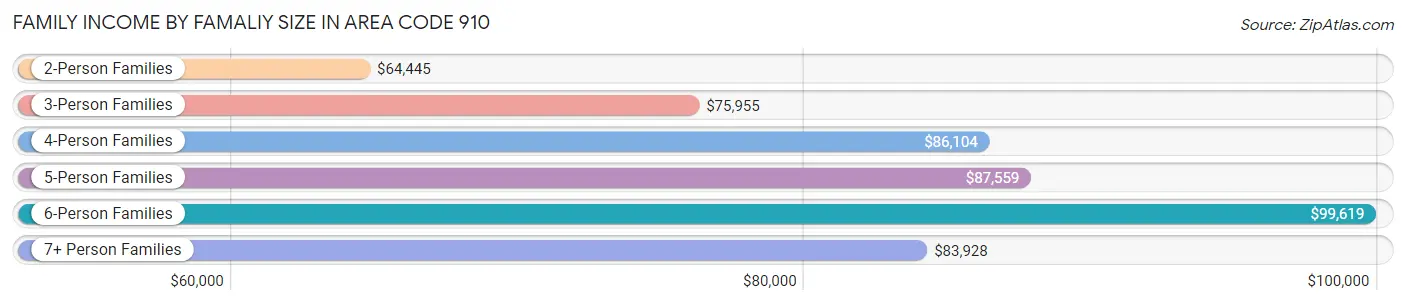
Family Income by Famaliy Size in Area Code 910
6-person families (9,674 | 2.5%) account for the highest median family income in Area Code 910 with $99,619 per family, while 2-person families (201,852 | 52.2%) have the highest median income of $32,222 per family member.
| Income Bracket | # Families | Median Income |
| 2-Person Families | 201,852 (52.2%) | $64,445 |
| 3-Person Families | 87,054 (22.5%) | $75,955 |
| 4-Person Families | 58,830 (15.2%) | $86,104 |
| 5-Person Families | 25,098 (6.5%) | $87,559 |
| 6-Person Families | 9,674 (2.5%) | $99,619 |
| 7+ Person Families | 4,140 (1.1%) | $83,928 |
| Total | 386,648 (100.0%) | $70,714 |
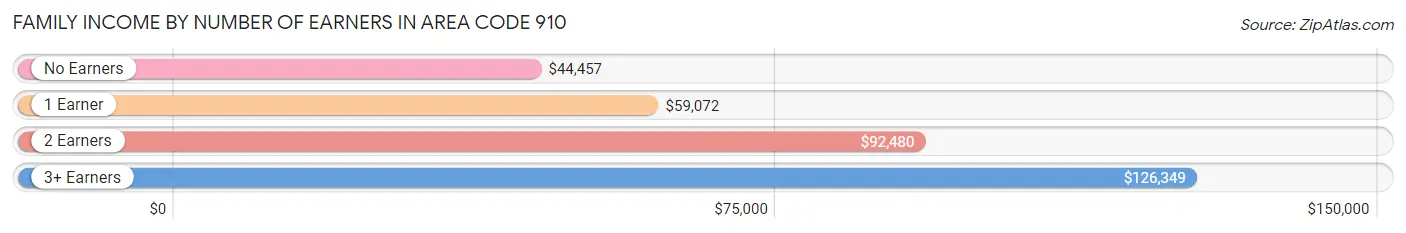
Family Income by Number of Earners in Area Code 910
The median family income in Area Code 910 is $70,714, with families comprising 3+ earners (28,131) having the highest median family income of $126,349, while families with no earners (76,453) have the lowest median family income of $44,457, accounting for 7.3% and 19.8% of families, respectively.
| Number of Earners | # Families | Median Income |
| No Earners | 76,453 (19.8%) | $44,457 |
| 1 Earner | 135,780 (35.1%) | $59,072 |
| 2 Earners | 146,284 (37.8%) | $92,480 |
| 3+ Earners | 28,131 (7.3%) | $126,349 |
| Total | 386,648 (100.0%) | $70,714 |
Household Income in Area Code 910
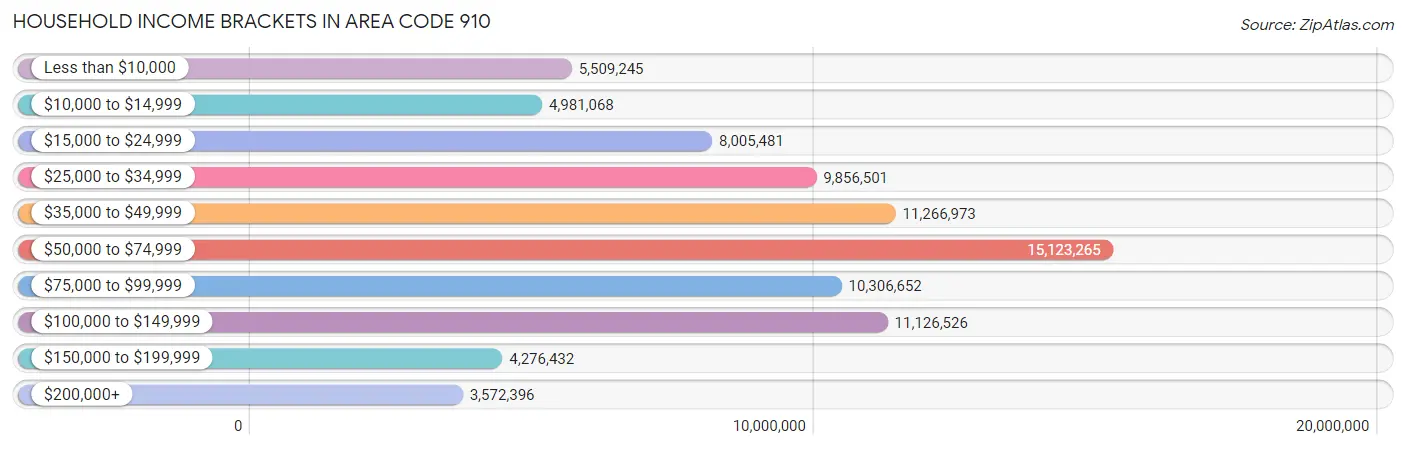
Household Income Brackets in Area Code 910
With 15,123,265 households falling in the category, the $50,000 to $74,999 income range is the most frequent in Area Code 910, accounting for 2,519.7% of all households. In contrast, only 3,572,396 households (595.2%) fall into the $200,000+ income bracket, making it the least populous group.
| Income Bracket | # Households | % Households |
| Less than $10,000 | 5,509,245 | 917.9% |
| $10,000 to $14,999 | 4,981,068 | 829.9% |
| $15,000 to $24,999 | 8,005,481 | 1,333.8% |
| $25,000 to $34,999 | 9,856,501 | 1,642.2% |
| $35,000 to $49,999 | 11,266,973 | 1,877.2% |
| $50,000 to $74,999 | 15,123,265 | 2,519.7% |
| $75,000 to $99,999 | 10,306,652 | 1,717.2% |
| $100,000 to $149,999 | 11,126,526 | 1,853.8% |
| $150,000 to $199,999 | 4,276,432 | 712.5% |
| $200,000+ | 3,572,396 | 595.2% |
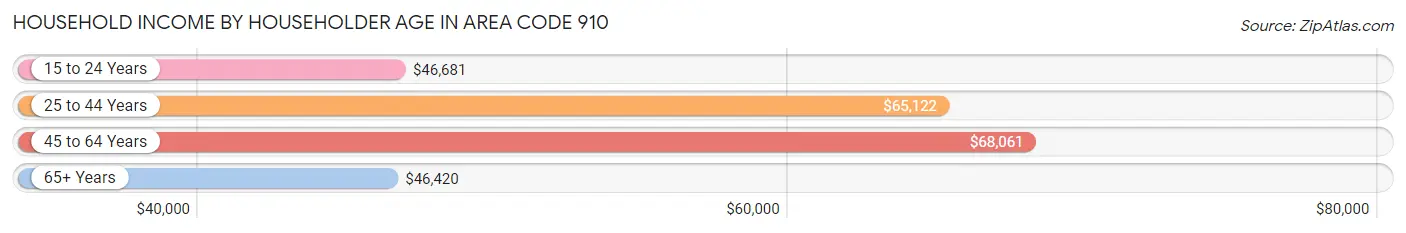
Household Income by Householder Age in Area Code 910
The median household income in Area Code 910 is $57,012, with the highest median household income of $68,061 found in the 45 to 64 years age bracket for the primary householder. A total of 205,174 households (34.2%) fall into this category. Meanwhile, the 65+ years age bracket for the primary householder has the lowest median household income of $46,420, with 170,158 households (28.3%) in this group.
| Income Bracket | # Households | Median Income |
| 15 to 24 Years | 35,266 (5.9%) | $46,681 |
| 25 to 44 Years | 189,603 (31.6%) | $65,122 |
| 45 to 64 Years | 205,174 (34.2%) | $68,061 |
| 65+ Years | 170,158 (28.3%) | $46,420 |
| Total | 600,201 (100.0%) | $57,012 |
Poverty in Area Code 910
Income Below Poverty by Sex and Age in Area Code 910
With 14.5% poverty level for males and 17.5% for females among the residents of Area Code 910, 5 year old males and 18 to 24 year old females are the most vulnerable to poverty, with 2,403 males (25.3%) and 17,316 females (25.8%) in their respective age groups living below the poverty level.
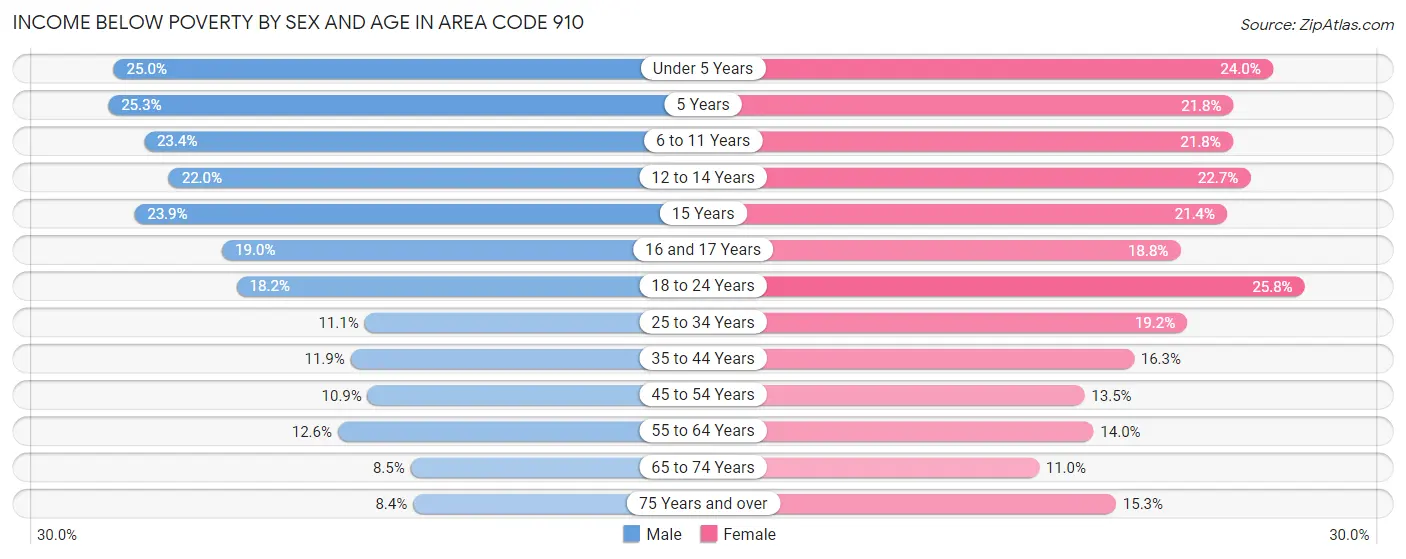
| Age Bracket | Male | Female |
| Under 5 Years | 11,966 (25.0%) | 10,951 (24.0%) |
| 5 Years | 2,403 (25.3%) | 1,995 (21.8%) |
| 6 to 11 Years | 13,589 (23.4%) | 11,881 (21.8%) |
| 12 to 14 Years | 6,206 (22.0%) | 6,208 (22.7%) |
| 15 Years | 2,279 (23.9%) | 1,984 (21.4%) |
| 16 and 17 Years | 3,513 (19.0%) | 3,360 (18.8%) |
| 18 to 24 Years | 13,579 (18.2%) | 17,316 (25.8%) |
| 25 to 34 Years | 11,213 (11.1%) | 19,442 (19.2%) |
| 35 to 44 Years | 10,451 (11.8%) | 14,935 (16.3%) |
| 45 to 54 Years | 8,926 (10.9%) | 11,969 (13.5%) |
| 55 to 64 Years | 11,148 (12.6%) | 14,144 (14.0%) |
| 65 to 74 Years | 6,399 (8.5%) | 9,586 (11.0%) |
| 75 Years and over | 3,547 (8.4%) | 8,921 (15.3%) |
| Total | 105,219 (14.5%) | 132,692 (17.5%) |
Income Above Poverty by Sex and Age in Area Code 910
According to the poverty statistics in Area Code 910, males aged 75 years and over and females aged 65 to 74 years are the age groups that are most secure financially, with 91.6% of males and 89.0% of females in these age groups living above the poverty line.
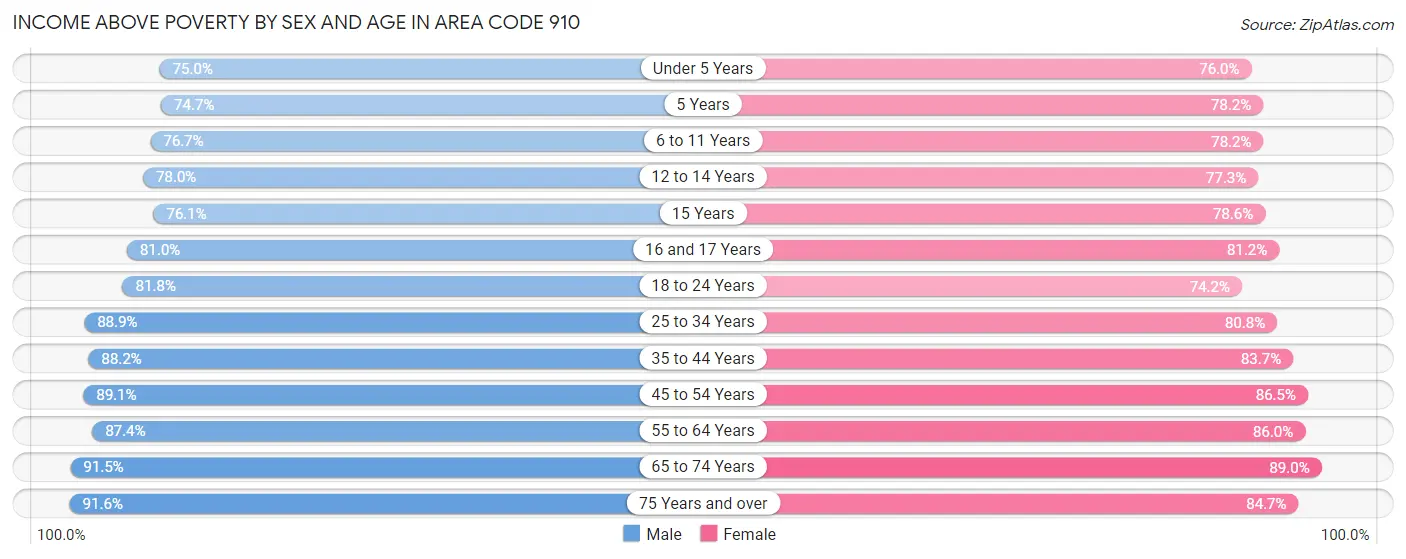
| Age Bracket | Male | Female |
| Under 5 Years | 35,826 (75.0%) | 34,705 (76.0%) |
| 5 Years | 7,080 (74.7%) | 7,155 (78.2%) |
| 6 to 11 Years | 44,619 (76.6%) | 42,711 (78.2%) |
| 12 to 14 Years | 22,040 (78.0%) | 21,105 (77.3%) |
| 15 Years | 7,260 (76.1%) | 7,270 (78.6%) |
| 16 and 17 Years | 14,974 (81.0%) | 14,478 (81.2%) |
| 18 to 24 Years | 61,076 (81.8%) | 49,914 (74.2%) |
| 25 to 34 Years | 90,093 (88.9%) | 81,695 (80.8%) |
| 35 to 44 Years | 77,706 (88.1%) | 76,922 (83.7%) |
| 45 to 54 Years | 72,998 (89.1%) | 76,641 (86.5%) |
| 55 to 64 Years | 77,627 (87.4%) | 86,781 (86.0%) |
| 65 to 74 Years | 68,797 (91.5%) | 77,816 (89.0%) |
| 75 Years and over | 38,819 (91.6%) | 49,533 (84.7%) |
| Total | 618,915 (85.5%) | 626,726 (82.5%) |
Income Below Poverty Among Married-Couple Families in Area Code 910
The poverty statistics for married-couple families in Area Code 910 show that 5.4% or 15,317 of the total 282,144 families live below the poverty line. Families with 5 or more children have the highest poverty rate of 24.1%, comprising of 371 families. On the other hand, families with no children have the lowest poverty rate of 4.1%, which includes 7,117 families.
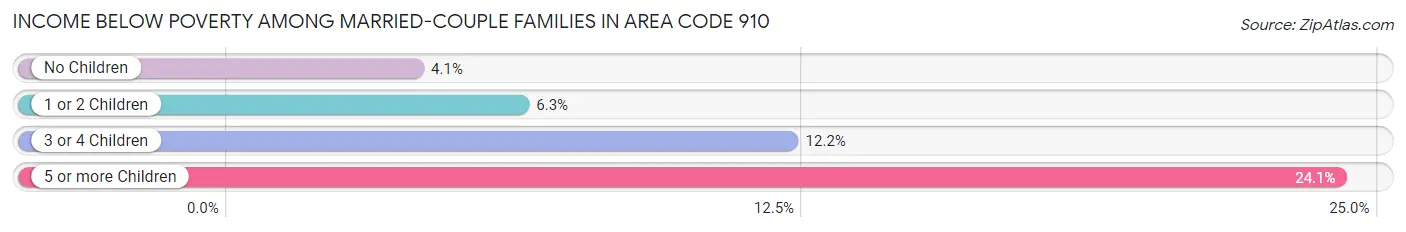
| Children | Above Poverty | Below Poverty |
| No Children | 168,694 (96.0%) | 7,117 (4.1%) |
| 1 or 2 Children | 79,219 (93.7%) | 5,364 (6.3%) |
| 3 or 4 Children | 17,748 (87.8%) | 2,465 (12.2%) |
| 5 or more Children | 1,166 (75.9%) | 371 (24.1%) |
| Total | 266,827 (94.6%) | 15,317 (5.4%) |
Income Below Poverty Among Single-Parent Households in Area Code 910
According to the poverty data in Area Code 910, 18.9% or 4,904 single-father households and 31.9% or 25,039 single-mother households are living below the poverty line. Among single-father households, those with 3 or 4 children have the highest poverty rate, with 796 households (38.7%) experiencing poverty. Likewise, among single-mother households, those with 5 or more children have the highest poverty rate, with 1,086 households (90.9%) falling below the poverty line.
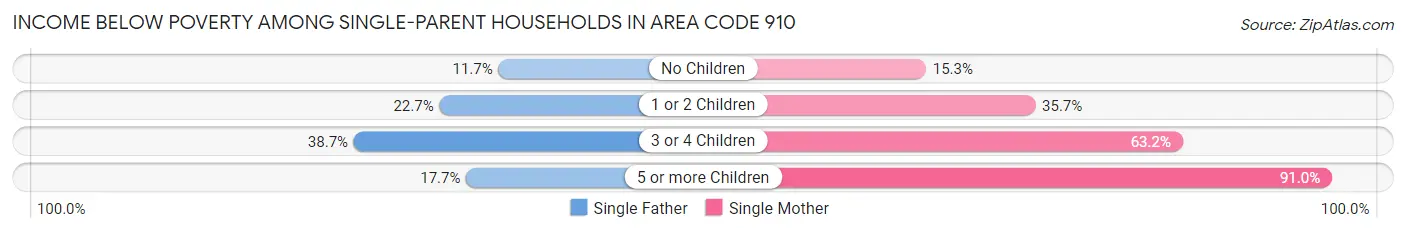
| Children | Single Father | Single Mother |
| No Children | 1,405 (11.7%) | 4,309 (15.3%) |
| 1 or 2 Children | 2,667 (22.7%) | 14,782 (35.7%) |
| 3 or 4 Children | 796 (38.7%) | 4,862 (63.1%) |
| 5 or more Children | 36 (17.7%) | 1,086 (90.9%) |
| Total | 4,904 (18.9%) | 25,039 (31.9%) |
Income Below Poverty Among Married-Couple vs Single-Parent Households in Area Code 910
The poverty data for Area Code 910 shows that 15,317 of the married-couple family households (5.4%) and 29,943 of the single-parent households (28.6%) are living below the poverty level. Within the married-couple family households, those with 5 or more children have the highest poverty rate, with 371 households (24.1%) falling below the poverty line. Among the single-parent households, those with 5 or more children have the highest poverty rate, with 1,122 household (80.3%) living below poverty.
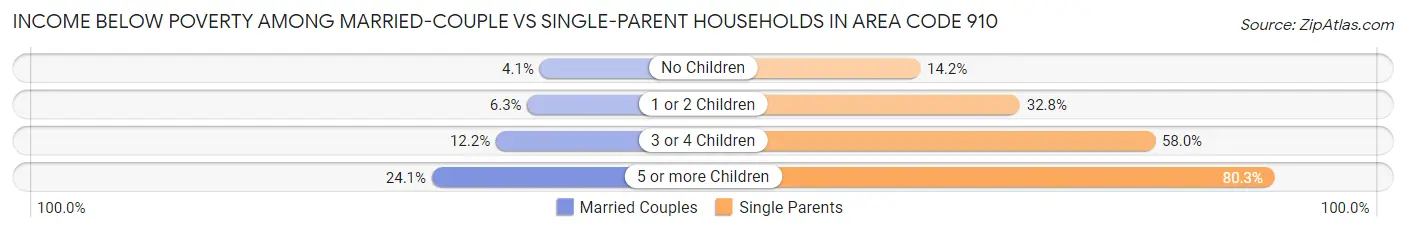
| Children | Married-Couple Families | Single-Parent Households |
| No Children | 7,117 (4.1%) | 5,714 (14.2%) |
| 1 or 2 Children | 5,364 (6.3%) | 17,449 (32.8%) |
| 3 or 4 Children | 2,465 (12.2%) | 5,658 (58.0%) |
| 5 or more Children | 371 (24.1%) | 1,122 (80.3%) |
| Total | 15,317 (5.4%) | 29,943 (28.6%) |
Race in Area Code 910
The most populous races in Area Code 910 are White / Caucasian (952,272 | 61.9%), Black / African American (337,547 | 21.9%), and Hispanic or Latino (153,522 | 10.0%).
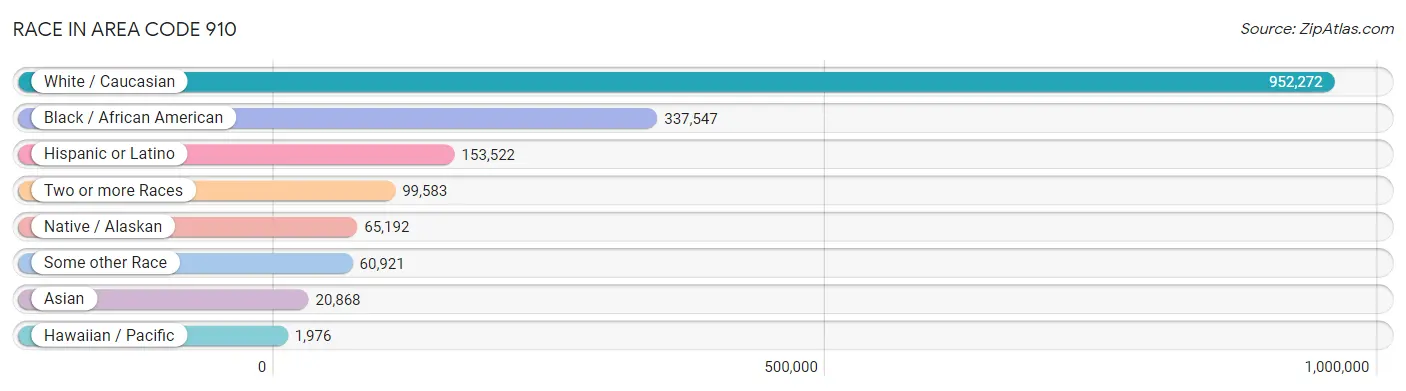
| Race | # Population | % Population |
| Asian | 20,868 | 1.4% |
| Black / African American | 337,547 | 21.9% |
| Hawaiian / Pacific | 1,976 | 0.1% |
| Hispanic or Latino | 153,522 | 10.0% |
| Native / Alaskan | 65,192 | 4.2% |
| White / Caucasian | 952,272 | 61.9% |
| Two or more Races | 99,583 | 6.5% |
| Some other Race | 60,921 | 4.0% |
| Total | 1,538,359 | 100.0% |
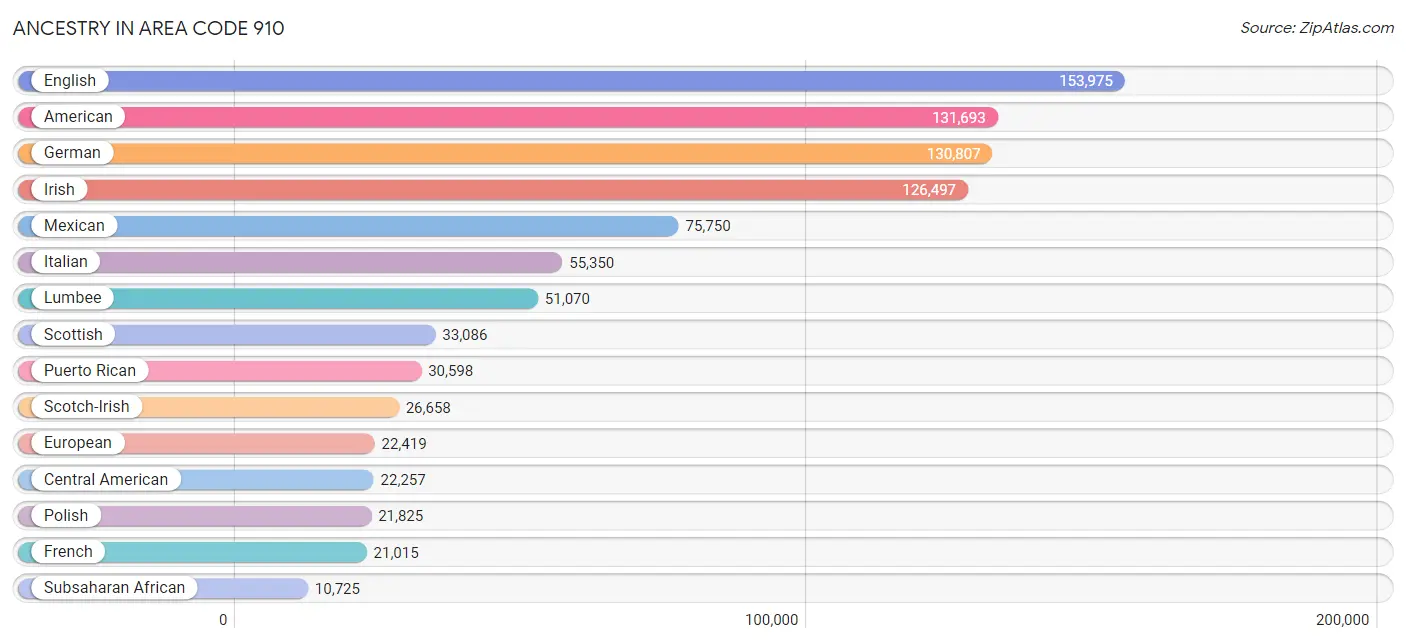
Ancestry in Area Code 910
The most populous ancestries reported in Area Code 910 are English (153,975 | 10.0%), American (131,693 | 8.6%), German (130,807 | 8.5%), Irish (126,497 | 8.2%), and Mexican (75,750 | 4.9%), together accounting for 40.2% of all Area Code 910 residents.
| Ancestry | # Population | % Population |
| Afghan | 133 | 0.0% |
| African | 7,026 | 0.5% |
| Alaska Native | 131 | 0.0% |
| Alaskan Athabascan | 22 | 0.0% |
| Albanian | 233 | 0.0% |
| Aleut | 3 | 0.0% |
| Alsatian | 10 | 0.0% |
| American | 131,693 | 8.6% |
| Apache | 505 | 0.0% |
| Arab | 5,462 | 0.4% |
| Argentinean | 338 | 0.0% |
| Armenian | 628 | 0.0% |
| Assyrian / Chaldean / Syriac | 8 | 0.0% |
| Australian | 155 | 0.0% |
| Austrian | 2,039 | 0.1% |
| Bahamian | 97 | 0.0% |
| Bangladeshi | 502 | 0.0% |
| Barbadian | 236 | 0.0% |
| Basque | 44 | 0.0% |
| Belgian | 428 | 0.0% |
| Belizean | 28 | 0.0% |
| Bermudan | 7 | 0.0% |
| Bhutanese | 3,938 | 0.3% |
| Blackfeet | 1,714 | 0.1% |
| Bolivian | 97 | 0.0% |
| Brazilian | 1,027 | 0.1% |
| British | 7,902 | 0.5% |
| British West Indian | 383 | 0.0% |
| Bulgarian | 168 | 0.0% |
| Burmese | 7,250 | 0.5% |
| Cajun | 133 | 0.0% |
| Cambodian | 83 | 0.0% |
| Canadian | 1,684 | 0.1% |
| Cape Verdean | 97 | 0.0% |
| Carpatho Rusyn | 12 | 0.0% |
| Celtic | 142 | 0.0% |
| Central American | 22,257 | 1.5% |
| Central American Indian | 1,449 | 0.1% |
| Cherokee | 9,862 | 0.6% |
| Cheyenne | 32 | 0.0% |
| Chickasaw | 366 | 0.0% |
| Chilean | 1,036 | 0.1% |
| Chinese | 178 | 0.0% |
| Chippewa | 503 | 0.0% |
| Choctaw | 255 | 0.0% |
| Colombian | 2,579 | 0.2% |
| Colville | 27 | 0.0% |
| Comanche | 113 | 0.0% |
| Costa Rican | 536 | 0.0% |
| Creek | 92 | 0.0% |
| Croatian | 691 | 0.0% |
| Crow | 3 | 0.0% |
| Cuban | 4,115 | 0.3% |
| Cypriot | 98 | 0.0% |
| Czech | 2,826 | 0.2% |
| Czechoslovakian | 527 | 0.0% |
| Danish | 2,883 | 0.2% |
| Delaware | 23 | 0.0% |
| Dominican | 3,822 | 0.3% |
| Dutch | 9,015 | 0.6% |
| Dutch West Indian | 173 | 0.0% |
| Eastern European | 2,822 | 0.2% |
| Ecuadorian | 1,280 | 0.1% |
| Egyptian | 465 | 0.0% |
| English | 153,975 | 10.0% |
| Estonian | 50 | 0.0% |
| Ethiopian | 248 | 0.0% |
| European | 22,419 | 1.5% |
| Filipino | 236 | 0.0% |
| Finnish | 1,163 | 0.1% |
| French | 21,015 | 1.4% |
| French American Indian | 174 | 0.0% |
| French Canadian | 6,125 | 0.4% |
| German | 130,807 | 8.5% |
| German Russian | 53 | 0.0% |
| Ghanaian | 529 | 0.0% |
| Greek | 3,489 | 0.2% |
| Guamanian / Chamorro | 1,010 | 0.1% |
| Guatemalan | 6,029 | 0.4% |
| Guyanese | 348 | 0.0% |
| Haitian | 2,782 | 0.2% |
| Honduran | 7,795 | 0.5% |
| Hopi | 53 | 0.0% |
| Houma | 79 | 0.0% |
| Hungarian | 4,955 | 0.3% |
| Icelander | 96 | 0.0% |
| Indian (Asian) | 5,673 | 0.4% |
| Indonesian | 289 | 0.0% |
| Inupiat | 52 | 0.0% |
| Iranian | 288 | 0.0% |
| Iraqi | 218 | 0.0% |
| Irish | 126,497 | 8.2% |
| Iroquois | 1,645 | 0.1% |
| Israeli | 208 | 0.0% |
| Italian | 55,350 | 3.6% |
| Jamaican | 4,637 | 0.3% |
| Japanese | 301 | 0.0% |
| Jordanian | 42 | 0.0% |
| Kenyan | 133 | 0.0% |
| Korean | 8,916 | 0.6% |
| Laotian | 190 | 0.0% |
| Latvian | 181 | 0.0% |
| Lebanese | 1,941 | 0.1% |
| Liberian | 154 | 0.0% |
| Lithuanian | 1,389 | 0.1% |
| Lumbee | 51,070 | 3.3% |
| Luxembourger | 73 | 0.0% |
| Macedonian | 107 | 0.0% |
| Malaysian | 560 | 0.0% |
| Maltese | 41 | 0.0% |
| Marshallese | 5 | 0.0% |
| Menominee | 54 | 0.0% |
| Mexican | 75,750 | 4.9% |
| Mexican American Indian | 1,373 | 0.1% |
| Mongolian | 16 | 0.0% |
| Moroccan | 480 | 0.0% |
| Native Hawaiian | 1,703 | 0.1% |
| Navajo | 556 | 0.0% |
| Nepalese | 31 | 0.0% |
| New Zealander | 146 | 0.0% |
| Nicaraguan | 537 | 0.0% |
| Nigerian | 1,156 | 0.1% |
| Northern European | 1,192 | 0.1% |
| Norwegian | 6,562 | 0.4% |
| Okinawan | 13 | 0.0% |
| Osage | 30 | 0.0% |
| Pakistani | 957 | 0.1% |
| Palestinian | 835 | 0.1% |
| Panamanian | 2,662 | 0.2% |
| Paraguayan | 128 | 0.0% |
| Pennsylvania German | 573 | 0.0% |
| Peruvian | 1,262 | 0.1% |
| Polish | 21,825 | 1.4% |
| Portuguese | 2,943 | 0.2% |
| Potawatomi | 19 | 0.0% |
| Pueblo | 26 | 0.0% |
| Puerto Rican | 30,598 | 2.0% |
| Puget Sound Salish | 16 | 0.0% |
| Romanian | 1,026 | 0.1% |
| Russian | 4,461 | 0.3% |
| Salvadoran | 4,404 | 0.3% |
| Samoan | 1,112 | 0.1% |
| Scandinavian | 4,118 | 0.3% |
| Scotch-Irish | 26,658 | 1.7% |
| Scottish | 33,086 | 2.1% |
| Seminole | 128 | 0.0% |
| Serbian | 218 | 0.0% |
| Shoshone | 74 | 0.0% |
| Sierra Leonean | 19 | 0.0% |
| Sioux | 595 | 0.0% |
| Slavic | 380 | 0.0% |
| Slovak | 1,995 | 0.1% |
| Slovene | 283 | 0.0% |
| Somali | 57 | 0.0% |
| South African | 410 | 0.0% |
| South American | 7,802 | 0.5% |
| South American Indian | 208 | 0.0% |
| Spaniard | 2,591 | 0.2% |
| Spanish | 2,036 | 0.1% |
| Spanish American | 140 | 0.0% |
| Spanish American Indian | 1 | 0.0% |
| Sri Lankan | 3,271 | 0.2% |
| Subsaharan African | 10,725 | 0.7% |
| Sudanese | 149 | 0.0% |
| Swedish | 8,096 | 0.5% |
| Swiss | 2,142 | 0.1% |
| Syrian | 517 | 0.0% |
| Thai | 3,584 | 0.2% |
| Tlingit-Haida | 1 | 0.0% |
| Tohono O'Odham | 56 | 0.0% |
| Tongan | 181 | 0.0% |
| Trinidadian and Tobagonian | 542 | 0.0% |
| Turkish | 638 | 0.0% |
| U.S. Virgin Islander | 41 | 0.0% |
| Ugandan | 37 | 0.0% |
| Ukrainian | 2,192 | 0.1% |
| Uruguayan | 58 | 0.0% |
| Ute | 60 | 0.0% |
| Venezuelan | 922 | 0.1% |
| Vietnamese | 65 | 0.0% |
| Welsh | 8,402 | 0.5% |
| West Indian | 1,288 | 0.1% |
| Yaqui | 19 | 0.0% |
| Yugoslavian | 330 | 0.0% |
| Zimbabwean | 17 | 0.0% | View All 185 Rows |
Immigrants in Area Code 910
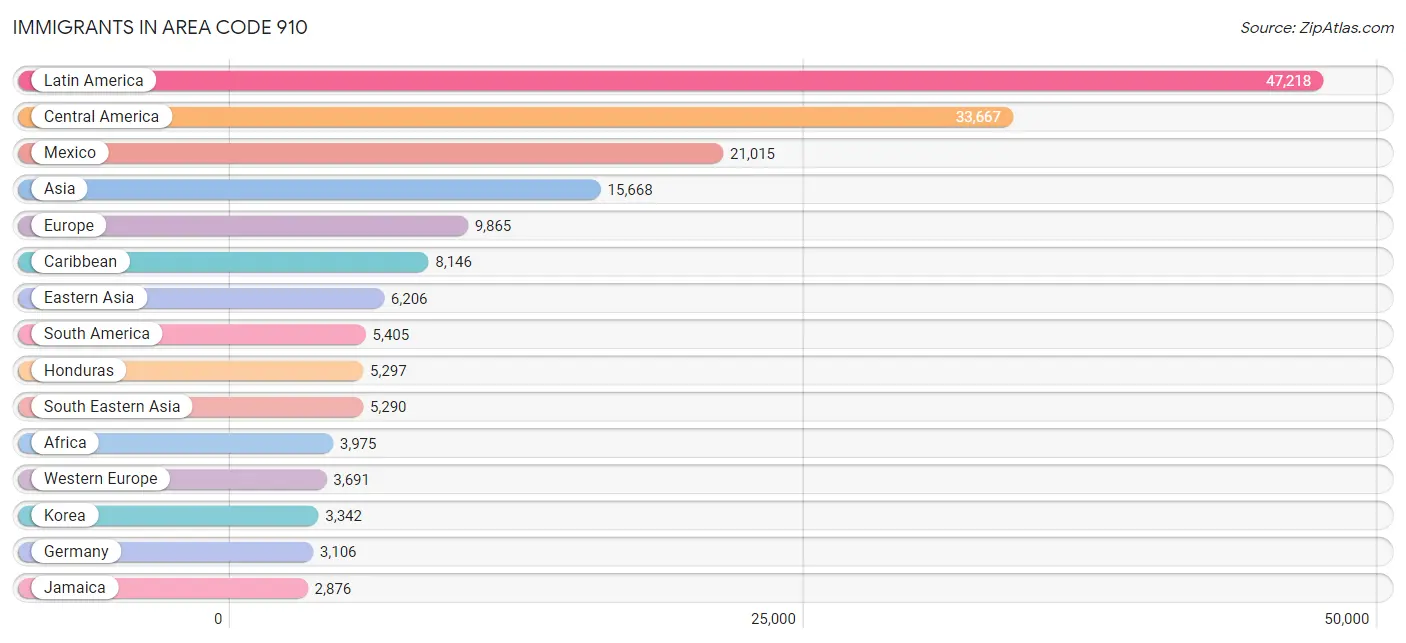
The most numerous immigrant groups reported in Area Code 910 came from Latin America (47,218 | 3.1%), Central America (33,667 | 2.2%), Mexico (21,015 | 1.4%), Asia (15,668 | 1.0%), and Europe (9,865 | 0.6%), together accounting for 8.3% of all Area Code 910 residents.
| Immigration Origin | # Population | % Population |
| Afghanistan | 250 | 0.0% |
| Africa | 3,975 | 0.3% |
| Albania | 62 | 0.0% |
| Argentina | 181 | 0.0% |
| Armenia | 48 | 0.0% |
| Asia | 15,668 | 1.0% |
| Australia | 190 | 0.0% |
| Austria | 118 | 0.0% |
| Azores | 22 | 0.0% |
| Bahamas | 72 | 0.0% |
| Bangladesh | 201 | 0.0% |
| Barbados | 314 | 0.0% |
| Belarus | 42 | 0.0% |
| Belgium | 45 | 0.0% |
| Belize | 1 | 0.0% |
| Bolivia | 50 | 0.0% |
| Bosnia and Herzegovina | 55 | 0.0% |
| Brazil | 961 | 0.1% |
| Bulgaria | 51 | 0.0% |
| Cambodia | 40 | 0.0% |
| Cameroon | 410 | 0.0% |
| Canada | 1,685 | 0.1% |
| Caribbean | 8,146 | 0.5% |
| Central America | 33,667 | 2.2% |
| Chile | 412 | 0.0% |
| China | 2,007 | 0.1% |
| Colombia | 1,408 | 0.1% |
| Costa Rica | 287 | 0.0% |
| Croatia | 30 | 0.0% |
| Cuba | 945 | 0.1% |
| Czechoslovakia | 246 | 0.0% |
| Denmark | 35 | 0.0% |
| Dominica | 33 | 0.0% |
| Dominican Republic | 1,380 | 0.1% |
| Eastern Africa | 618 | 0.0% |
| Eastern Asia | 6,206 | 0.4% |
| Eastern Europe | 2,302 | 0.2% |
| Ecuador | 514 | 0.0% |
| Egypt | 399 | 0.0% |
| El Salvador | 2,735 | 0.2% |
| England | 1,167 | 0.1% |
| Eritrea | 20 | 0.0% |
| Ethiopia | 96 | 0.0% |
| Europe | 9,865 | 0.6% |
| Fiji | 14 | 0.0% |
| France | 294 | 0.0% |
| Germany | 3,106 | 0.2% |
| Ghana | 531 | 0.0% |
| Greece | 265 | 0.0% |
| Grenada | 118 | 0.0% |
| Guatemala | 2,871 | 0.2% |
| Guyana | 388 | 0.0% |
| Haiti | 1,715 | 0.1% |
| Honduras | 5,297 | 0.3% |
| Hong Kong | 71 | 0.0% |
| Hungary | 94 | 0.0% |
| India | 1,669 | 0.1% |
| Indonesia | 149 | 0.0% |
| Iran | 39 | 0.0% |
| Iraq | 215 | 0.0% |
| Ireland | 175 | 0.0% |
| Israel | 85 | 0.0% |
| Italy | 509 | 0.0% |
| Jamaica | 2,876 | 0.2% |
| Japan | 804 | 0.1% |
| Jordan | 27 | 0.0% |
| Kazakhstan | 61 | 0.0% |
| Kenya | 179 | 0.0% |
| Korea | 3,342 | 0.2% |
| Kuwait | 14 | 0.0% |
| Laos | 218 | 0.0% |
| Latin America | 47,218 | 3.1% |
| Latvia | 101 | 0.0% |
| Lebanon | 137 | 0.0% |
| Liberia | 121 | 0.0% |
| Lithuania | 60 | 0.0% |
| Malaysia | 50 | 0.0% |
| Mexico | 21,015 | 1.4% |
| Micronesia | 89 | 0.0% |
| Middle Africa | 463 | 0.0% |
| Morocco | 90 | 0.0% |
| Nepal | 223 | 0.0% |
| Netherlands | 128 | 0.0% |
| Nicaragua | 232 | 0.0% |
| Nigeria | 435 | 0.0% |
| Northern Africa | 589 | 0.0% |
| Northern Europe | 2,828 | 0.2% |
| Norway | 45 | 0.0% |
| Oceania | 783 | 0.1% |
| Pakistan | 150 | 0.0% |
| Panama | 1,229 | 0.1% |
| Peru | 667 | 0.0% |
| Philippines | 2,853 | 0.2% |
| Poland | 222 | 0.0% |
| Portugal | 57 | 0.0% |
| Romania | 200 | 0.0% |
| Russia | 703 | 0.1% |
| Saudi Arabia | 38 | 0.0% |
| Scotland | 165 | 0.0% |
| Senegal | 48 | 0.0% |
| Serbia | 8 | 0.0% |
| Sierra Leone | 25 | 0.0% |
| Singapore | 17 | 0.0% |
| Somalia | 27 | 0.0% |
| South Africa | 612 | 0.0% |
| South America | 5,405 | 0.4% |
| South Central Asia | 2,653 | 0.2% |
| South Eastern Asia | 5,290 | 0.3% |
| Southern Europe | 1,017 | 0.1% |
| Spain | 130 | 0.0% |
| St. Vincent and the Grenadines | 7 | 0.0% |
| Sudan | 20 | 0.0% |
| Sweden | 134 | 0.0% |
| Syria | 24 | 0.0% |
| Taiwan | 236 | 0.0% |
| Thailand | 581 | 0.0% |
| Trinidad and Tobago | 456 | 0.0% |
| Turkey | 192 | 0.0% |
| Uganda | 20 | 0.0% |
| Ukraine | 303 | 0.0% |
| Uruguay | 28 | 0.0% |
| Uzbekistan | 25 | 0.0% |
| Venezuela | 680 | 0.0% |
| Vietnam | 1,317 | 0.1% |
| West Indies | 47 | 0.0% |
| Western Africa | 1,434 | 0.1% |
| Western Asia | 1,212 | 0.1% |
| Western Europe | 3,691 | 0.2% |
| Yemen | 293 | 0.0% |
| Zaire | 33 | 0.0% |
| Zimbabwe | 67 | 0.0% | View All 131 Rows |
Sex and Age in Area Code 910
Sex and Age in Area Code 910
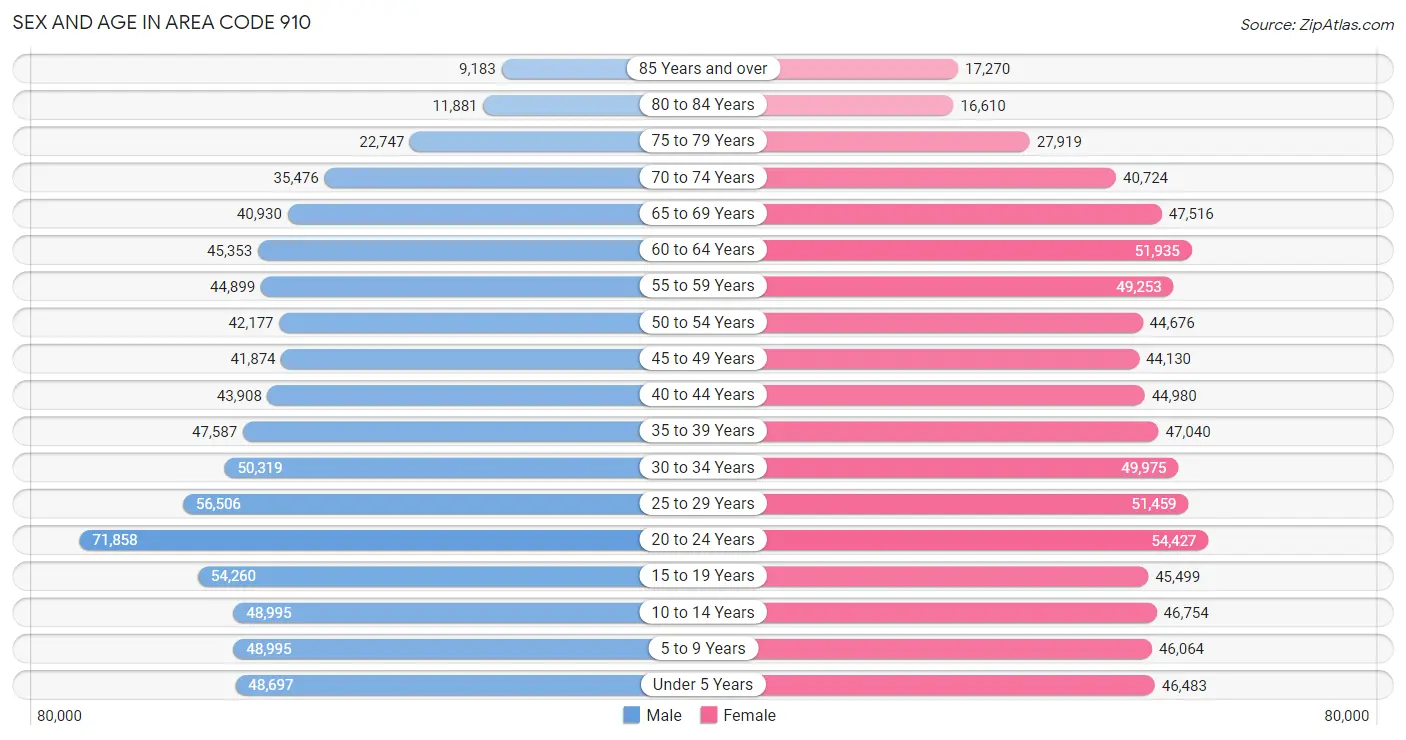
The most populous age groups in Area Code 910 are 20 to 24 Years (71,858 | 9.4%) for men and 20 to 24 Years (54,427 | 7.0%) for women.
| Age Bracket | Male | Female |
| Under 5 Years | 48,697 (6.4%) | 46,483 (6.0%) |
| 5 to 9 Years | 48,995 (6.4%) | 46,064 (6.0%) |
| 10 to 14 Years | 48,995 (6.4%) | 46,754 (6.0%) |
| 15 to 19 Years | 54,260 (7.1%) | 45,499 (5.9%) |
| 20 to 24 Years | 71,858 (9.4%) | 54,427 (7.0%) |
| 25 to 29 Years | 56,506 (7.4%) | 51,459 (6.7%) |
| 30 to 34 Years | 50,319 (6.6%) | 49,975 (6.5%) |
| 35 to 39 Years | 47,587 (6.2%) | 47,040 (6.1%) |
| 40 to 44 Years | 43,908 (5.7%) | 44,980 (5.8%) |
| 45 to 49 Years | 41,874 (5.5%) | 44,130 (5.7%) |
| 50 to 54 Years | 42,177 (5.5%) | 44,676 (5.8%) |
| 55 to 59 Years | 44,899 (5.9%) | 49,253 (6.4%) |
| 60 to 64 Years | 45,353 (5.9%) | 51,935 (6.7%) |
| 65 to 69 Years | 40,930 (5.3%) | 47,516 (6.1%) |
| 70 to 74 Years | 35,476 (4.6%) | 40,724 (5.3%) |
| 75 to 79 Years | 22,747 (3.0%) | 27,919 (3.6%) |
| 80 to 84 Years | 11,881 (1.5%) | 16,610 (2.1%) |
| 85 Years and over | 9,183 (1.2%) | 17,270 (2.2%) |
| Total | 765,645 (100.0%) | 772,714 (100.0%) |
Families and Households in Area Code 910
Median Family Size in Area Code 910
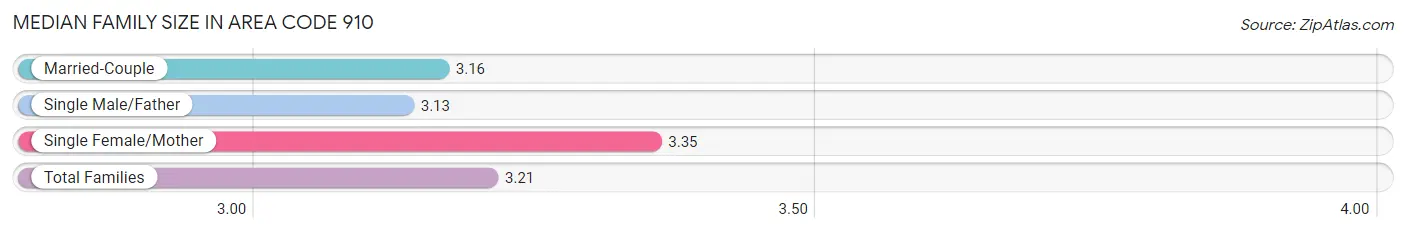
The median family size in Area Code 910 is 3.21 persons per family, with single female/mother families (78,516 | 20.3%) accounting for the largest median family size of 3.353 persons per family. On the other hand, single male/father families (25,988 | 6.7%) represent the smallest median family size with 3.13 persons per family.
| Family Type | # Families | Family Size |
| Married-Couple | 282,144 (73.0%) | 3.16 |
| Single Male/Father | 25,988 (6.7%) | 3.13 |
| Single Female/Mother | 78,516 (20.3%) | 3.35 |
| Total Families | 386,648 (100.0%) | 3.21 |
Median Household Size in Area Code 910
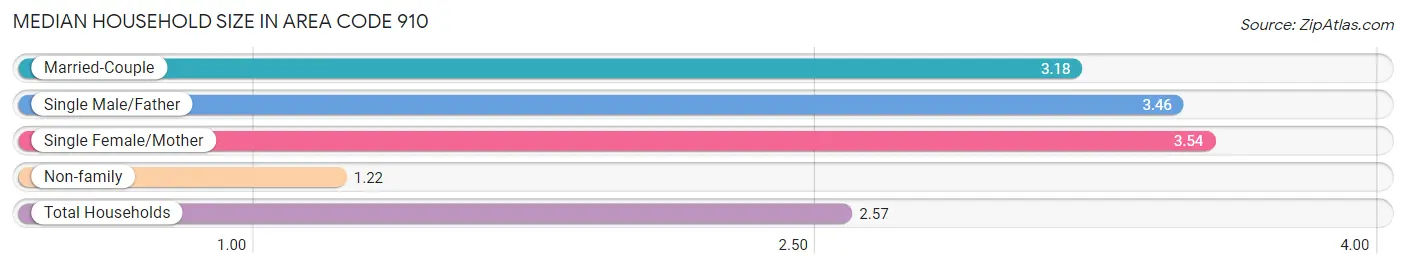
The median household size in Area Code 910 is 2.57 persons per household, with single female/mother households (78,516 | 13.1%) accounting for the largest median household size of 3.5406 persons per household. non-family households (213,553 | 35.6%) represent the smallest median household size with 1.22 persons per household.
| Household Type | # Households | Household Size |
| Married-Couple | 282,144 (47.0%) | 3.18 |
| Single Male/Father | 25,988 (4.3%) | 3.46 |
| Single Female/Mother | 78,516 (13.1%) | 3.54 |
| Non-family | 213,553 (35.6%) | 1.22 |
| Total Households | 600,201 (100.0%) | 2.57 |
Household Size by Marriage Status in Area Code 910
Out of a total of 600,201 households in Area Code 910, 386,648 (64.4%) are family households, while 213,553 (35.6%) are nonfamily households. The most numerous type of family households are 2-person households, comprising 189,892, and the most common type of nonfamily households are 1-person households, comprising 178,888.
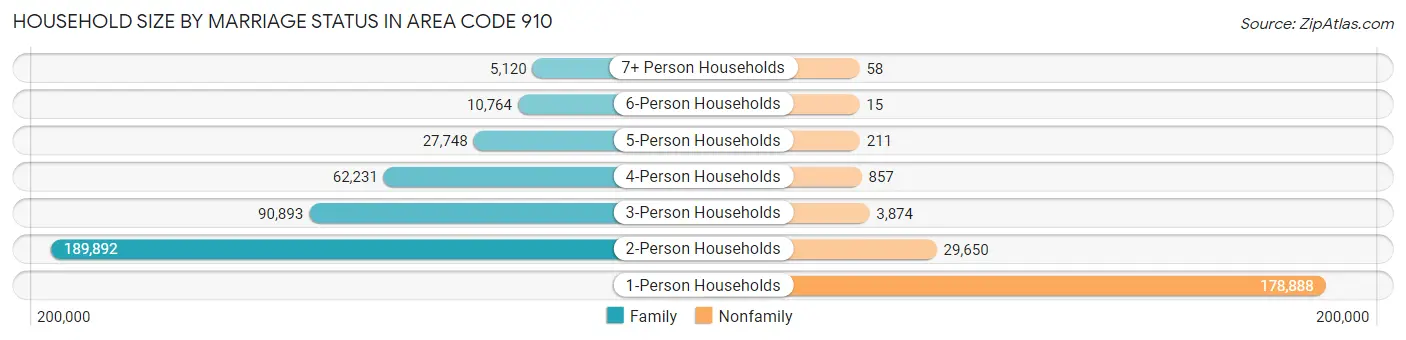
| Household Size | Family Households | Nonfamily Households |
| 1-Person Households | - | 178,888 (29.8%) |
| 2-Person Households | 189,892 (31.6%) | 29,650 (4.9%) |
| 3-Person Households | 90,893 (15.1%) | 3,874 (0.6%) |
| 4-Person Households | 62,231 (10.4%) | 857 (0.1%) |
| 5-Person Households | 27,748 (4.6%) | 211 (0.0%) |
| 6-Person Households | 10,764 (1.8%) | 15 (0.0%) |
| 7+ Person Households | 5,120 (0.9%) | 58 (0.0%) |
| Total | 386,648 (64.4%) | 213,553 (35.6%) |
Female Fertility in Area Code 910
Fertility by Age in Area Code 910
Average fertility rate in Area Code 910 is 72.0 births per 1,000 women. Women in the age bracket of 15 to 19 years have the highest fertility rate with 141.5 births per 1,000 women. Women in the age bracket of 20 to 34 years acount for 77.8% of all women with births.
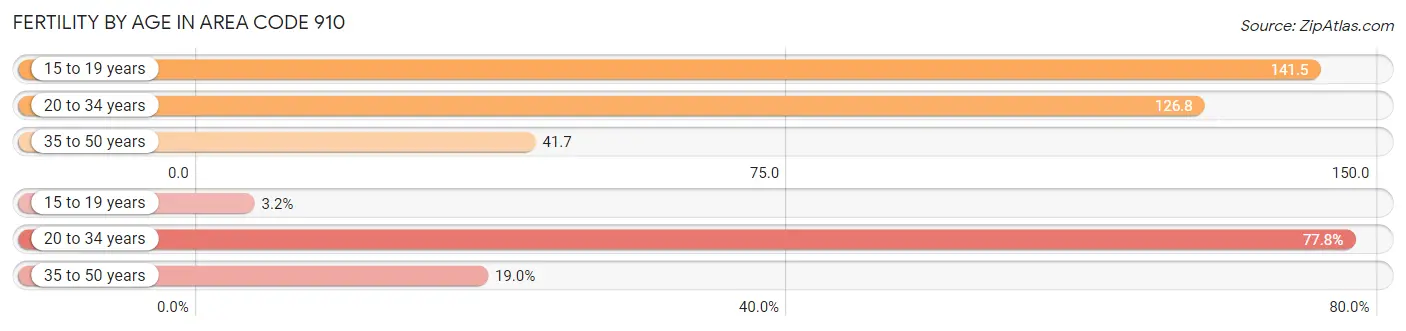
| Age Bracket | Women with Births | Births / 1,000 Women |
| 15 to 19 years | 612 (3.2%) | 141.5 |
| 20 to 34 years | 15,086 (77.8%) | 126.8 |
| 35 to 50 years | 3,682 (19.0%) | 41.7 |
| Total | 19,380 (100.0%) | 72.0 |
Fertility by Age by Marriage Status in Area Code 910
46.5% of women with births (19,380) in Area Code 910 are married. The highest percentage of unmarried women with births falls into 15 to 19 years age bracket with 95.6% of them unmarried at the time of birth, while the lowest percentage of unmarried women with births belong to 20 to 34 years age bracket with 55.3% of them unmarried.
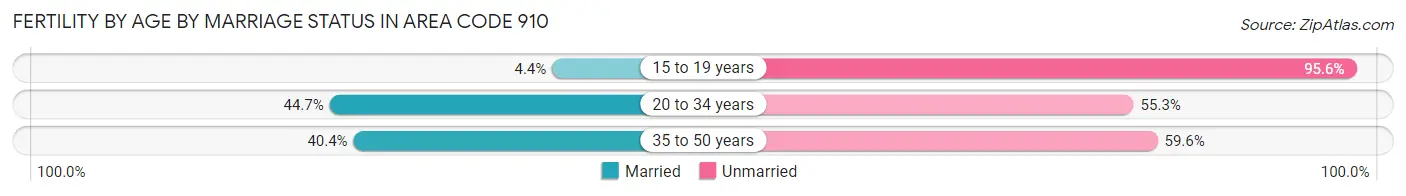
| Age Bracket | Married | Unmarried |
| 15 to 19 years | 27 (4.4%) | 585 (95.6%) |
| 20 to 34 years | 6,750 (44.7%) | 8,336 (55.3%) |
| 35 to 50 years | 1,488 (40.4%) | 2,194 (59.6%) |
| Total | 9,013 (46.5%) | 10,367 (53.5%) |
Fertility by Education in Area Code 910
Average fertility rate in Area Code 910 is 72.0 births per 1,000 women. Women with the education attainment of high school diploma have the highest fertility rate of 109.7 births per 1,000 women, while women with the education attainment of less than high school have the lowest fertility at 55.8 births per 1,000 women. Women with the education attainment of college or associate's degree represent 42.3% of all women with births.
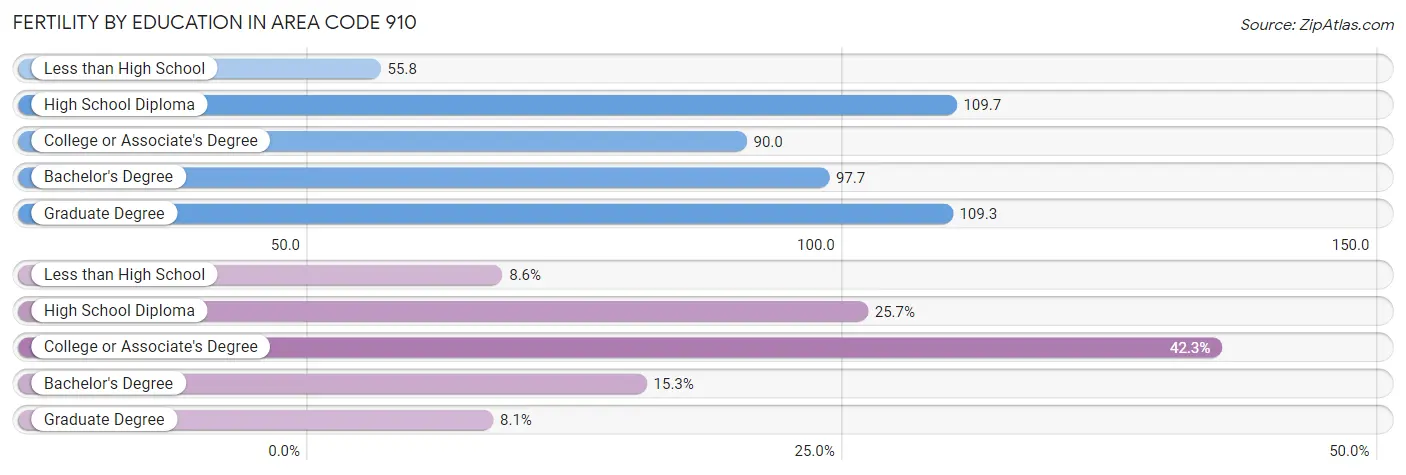
| Educational Attainment | Women with Births | Births / 1,000 Women |
| Less than High School | 1,661 (8.6%) | 55.8 |
| High School Diploma | 4,978 (25.7%) | 109.7 |
| College or Associate's Degree | 8,193 (42.3%) | 90.0 |
| Bachelor's Degree | 2,970 (15.3%) | 97.7 |
| Graduate Degree | 1,578 (8.1%) | 109.3 |
| Total | 19,380 (100.0%) | 72.0 |
Fertility by Education by Marriage Status in Area Code 910
53.5% of women with births in Area Code 910 are unmarried. Women with the educational attainment of bachelor's degree are most likely to be married with 57.6% of them married at childbirth, while women with the educational attainment of less than high school are least likely to be married with 83.1% of them unmarried at childbirth.
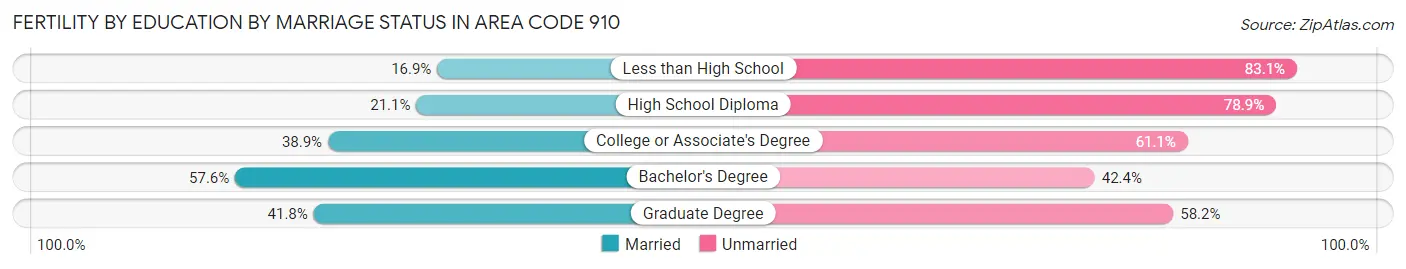
| Educational Attainment | Married | Unmarried |
| Less than High School | 280 (16.9%) | 1,381 (83.1%) |
| High School Diploma | 1,049 (21.1%) | 3,929 (78.9%) |
| College or Associate's Degree | 3,185 (38.9%) | 5,008 (61.1%) |
| Bachelor's Degree | 1,710 (57.6%) | 1,260 (42.4%) |
| Graduate Degree | 659 (41.8%) | 919 (58.2%) |
| Total | 9,013 (46.5%) | 10,367 (53.5%) |
Employment Characteristics in Area Code 910
Employment by Class of Employer in Area Code 910
Among the 675,872 employed individuals in Area Code 910, private company employees (400,500 | 59.3%), federal government employees (96,631 | 14.3%), and local government employees (42,278 | 6.3%) make up the most common classes of employment.
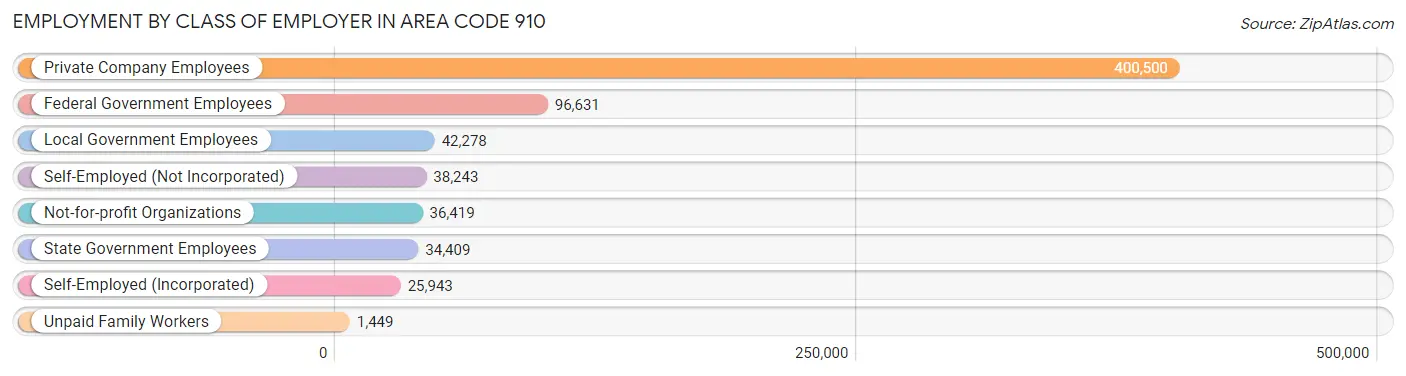
| Employer Class | # Employees | % Employees |
| Private Company Employees | 400,500 | 59.3% |
| Self-Employed (Incorporated) | 25,943 | 3.8% |
| Self-Employed (Not Incorporated) | 38,243 | 5.7% |
| Not-for-profit Organizations | 36,419 | 5.4% |
| Local Government Employees | 42,278 | 6.3% |
| State Government Employees | 34,409 | 5.1% |
| Federal Government Employees | 96,631 | 14.3% |
| Unpaid Family Workers | 1,449 | 0.2% |
| Total | 675,872 | 100.0% |
Employment Status by Age in Area Code 910
According to the labor force statistics for Area Code 910, out of the total population over 16 years of age (1,233,506), 56.6% or 698,288 individuals are in the labor force, with 7.3% or 51,254 of them unemployed. The age group with the highest labor force participation rate is 25 to 29 years, with 81.6% or 88,110 individuals in the labor force. Within the labor force, the 16 to 19 years age range has the highest percentage of unemployed individuals, with 2,043.0% or 703,037 of them being unemployed.
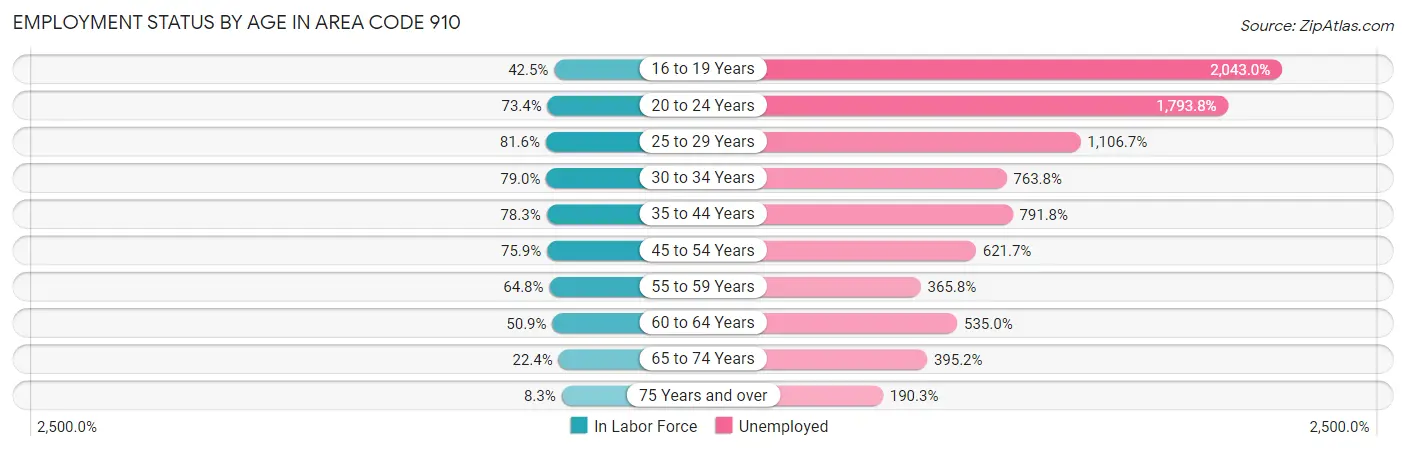
| Age Bracket | In Labor Force | Unemployed |
| 16 to 19 Years | 34,410 (42.5%) | 703,037 (2,043.0%) |
| 20 to 24 Years | 92,680 (73.4%) | 1,662,512 (1,793.8%) |
| 25 to 29 Years | 88,114 (81.6%) | 975,113 (1,106.7%) |
| 30 to 34 Years | 79,191 (79.0%) | 604,868 (763.8%) |
| 35 to 44 Years | 143,710 (78.3%) | 1,137,904 (791.8%) |
| 45 to 54 Years | 131,113 (75.8%) | 815,123 (621.7%) |
| 55 to 59 Years | 61,041 (64.8%) | 223,281 (365.8%) |
| 60 to 64 Years | 49,519 (50.9%) | 264,932 (535.0%) |
| 65 to 74 Years | 36,872 (22.4%) | 145,687 (395.2%) |
| 75 Years and over | 8,737 (8.3%) | 16,621 (190.3%) |
| Total | 698,269 (56.6%) | 51,287 (7.3%) |
Employment Status by Educational Attainment in Area Code 910
According to labor force statistics for Area Code 910, 72.0% of individuals (544,144) out of the total population between 25 and 64 years of age (756,071) are in the labor force, with 798.0% or 4,342,269 of them being unemployed. The group with the highest labor force participation rate are those with the educational attainment of bachelor's degree or higher, with 82.5% or 173,466 individuals in the labor force. Within the labor force, individuals with less than high school education have the highest percentage of unemployment, with 1,214.2% or 492,965 of them being unemployed.
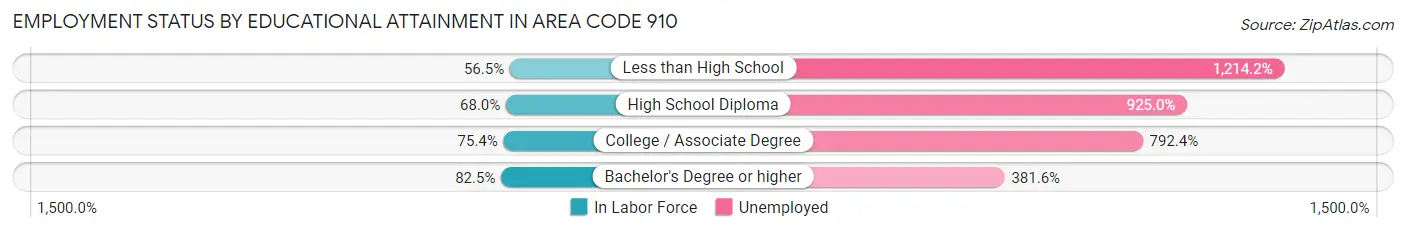
| Educational Attainment | In Labor Force | Unemployed |
| Less than High School | 40,604 (56.5%) | 873,131 (1,214.2%) |
| High School Diploma | 136,695 (68.0%) | 1,860,526 (925.0%) |
| College / Associate Degree | 205,480 (75.4%) | 2,160,550 (792.4%) |
| Bachelor's Degree or higher | 173,468 (82.5%) | 802,749 (381.6%) |
| Total | 544,141 (72.0%) | 6,033,447 (798.0%) |
Employment Occupations by Sex in Area Code 910
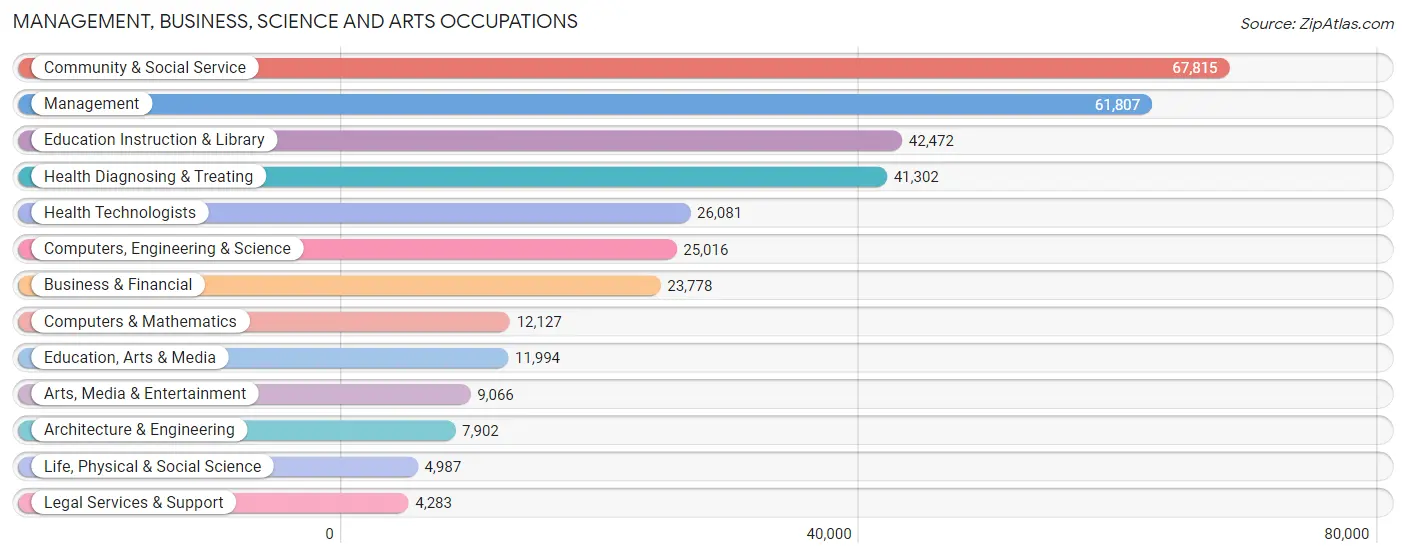
Management, Business, Science and Arts Occupations
The most common Management, Business, Science and Arts occupations in Area Code 910 are Community & Social Service (67,815 | 10.9%), Management (61,807 | 9.9%), Education Instruction & Library (42,472 | 6.8%), Health Diagnosing & Treating (41,302 | 6.6%), and Health Technologists (26,081 | 4.2%).
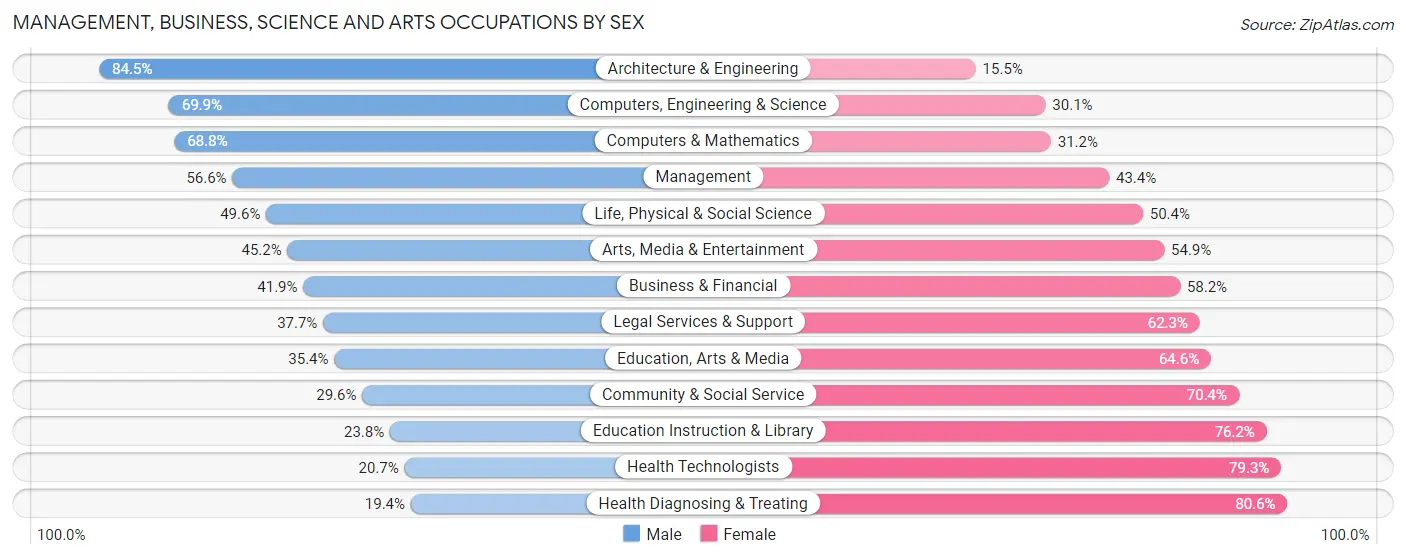
Management, Business, Science and Arts Occupations by Sex
Within the Management, Business, Science and Arts occupations in Area Code 910, the most male-oriented occupations are Architecture & Engineering (84.5%), Computers, Engineering & Science (69.9%), and Computers & Mathematics (68.8%), while the most female-oriented occupations are Health Diagnosing & Treating (80.6%), Health Technologists (79.3%), and Education Instruction & Library (76.2%).
| Occupation | Male | Female |
| Management | 35,009 (56.6%) | 26,798 (43.4%) |
| Business & Financial | 9,952 (41.8%) | 13,826 (58.2%) |
| Computers, Engineering & Science | 17,488 (69.9%) | 7,528 (30.1%) |
| Computers & Mathematics | 8,341 (68.8%) | 3,786 (31.2%) |
| Architecture & Engineering | 6,674 (84.5%) | 1,228 (15.5%) |
| Life, Physical & Social Science | 2,473 (49.6%) | 2,514 (50.4%) |
| Community & Social Service | 20,045 (29.6%) | 47,770 (70.4%) |
| Education, Arts & Media | 4,244 (35.4%) | 7,750 (64.6%) |
| Legal Services & Support | 1,615 (37.7%) | 2,668 (62.3%) |
| Education Instruction & Library | 10,093 (23.8%) | 32,379 (76.2%) |
| Arts, Media & Entertainment | 4,093 (45.2%) | 4,973 (54.8%) |
| Health Diagnosing & Treating | 8,024 (19.4%) | 33,278 (80.6%) |
| Health Technologists | 5,410 (20.7%) | 20,671 (79.3%) |
| Total (Category) | 90,518 (41.2%) | 129,200 (58.8%) |
| Total (Overall) | 311,988 (50.2%) | 309,854 (49.8%) |
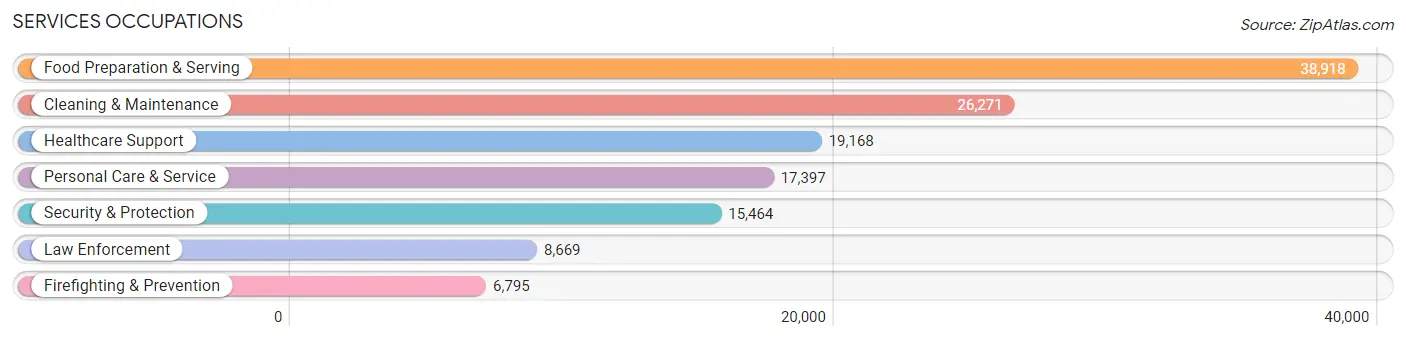
Services Occupations
The most common Services occupations in Area Code 910 are Food Preparation & Serving (38,918 | 6.3%), Cleaning & Maintenance (26,271 | 4.2%), Healthcare Support (19,168 | 3.1%), Personal Care & Service (17,397 | 2.8%), and Security & Protection (15,464 | 2.5%).
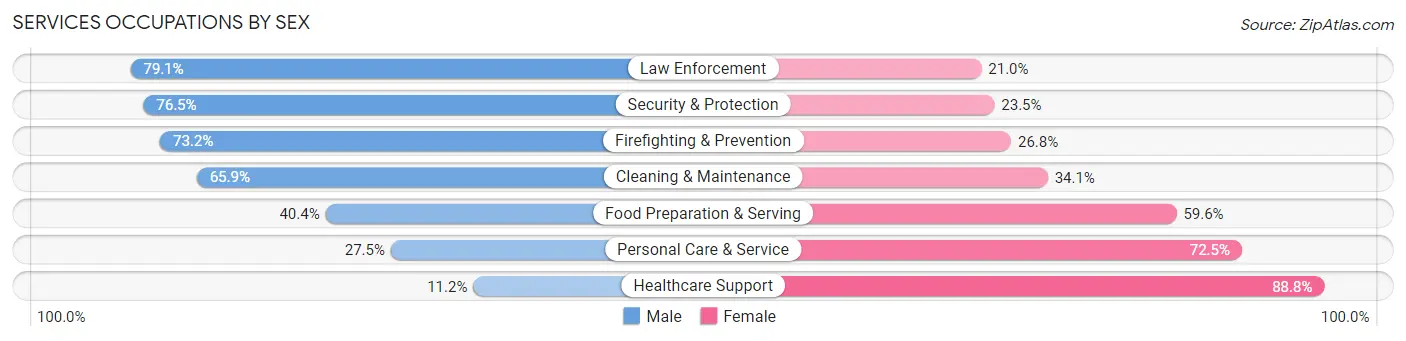
Services Occupations by Sex
Within the Services occupations in Area Code 910, the most male-oriented occupations are Law Enforcement (79.0%), Security & Protection (76.5%), and Firefighting & Prevention (73.2%), while the most female-oriented occupations are Healthcare Support (88.8%), Personal Care & Service (72.5%), and Food Preparation & Serving (59.6%).
| Occupation | Male | Female |
| Healthcare Support | 2,139 (11.2%) | 17,029 (88.8%) |
| Security & Protection | 11,825 (76.5%) | 3,639 (23.5%) |
| Firefighting & Prevention | 4,972 (73.2%) | 1,823 (26.8%) |
| Law Enforcement | 6,853 (79.0%) | 1,816 (20.9%) |
| Food Preparation & Serving | 15,730 (40.4%) | 23,188 (59.6%) |
| Cleaning & Maintenance | 17,316 (65.9%) | 8,955 (34.1%) |
| Personal Care & Service | 4,781 (27.5%) | 12,616 (72.5%) |
| Total (Category) | 51,791 (44.2%) | 65,427 (55.8%) |
| Total (Overall) | 311,988 (50.2%) | 309,854 (49.8%) |
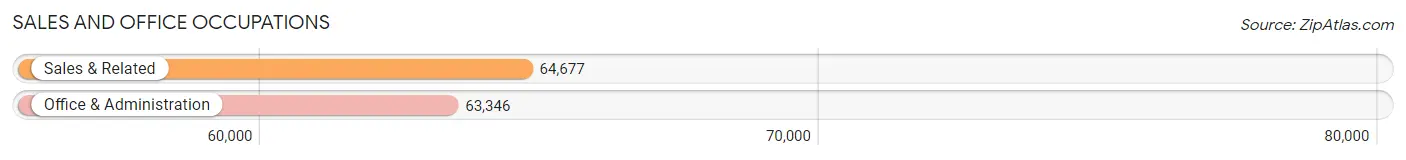
Sales and Office Occupations
The most common Sales and Office occupations in Area Code 910 are Sales & Related (64,677 | 10.4%), and Office & Administration (63,346 | 10.2%).
Sales and Office Occupations by Sex
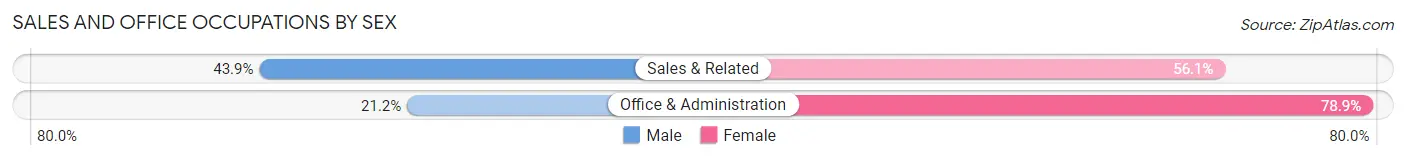
| Occupation | Male | Female |
| Sales & Related | 28,388 (43.9%) | 36,289 (56.1%) |
| Office & Administration | 13,398 (21.1%) | 49,948 (78.8%) |
| Total (Category) | 41,786 (32.6%) | 86,237 (67.4%) |
| Total (Overall) | 311,988 (50.2%) | 309,854 (49.8%) |
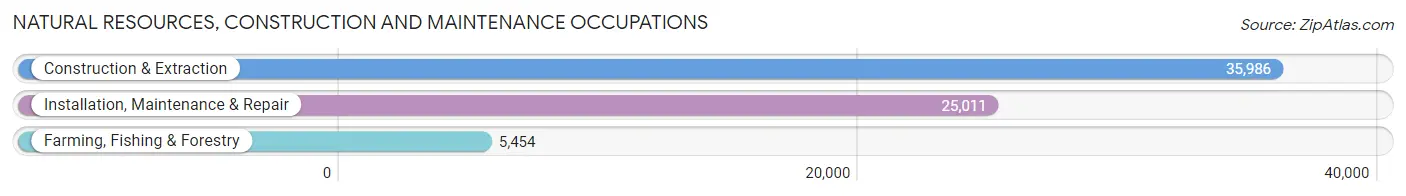
Natural Resources, Construction and Maintenance Occupations
The most common Natural Resources, Construction and Maintenance occupations in Area Code 910 are Construction & Extraction (35,986 | 5.8%), Installation, Maintenance & Repair (25,011 | 4.0%), and Farming, Fishing & Forestry (5,454 | 0.9%).
Natural Resources, Construction and Maintenance Occupations by Sex
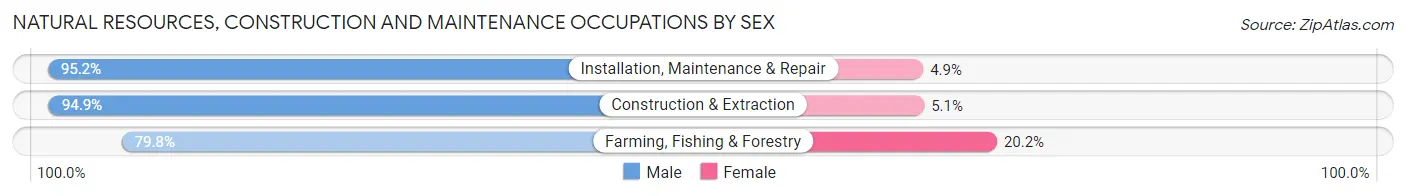
| Occupation | Male | Female |
| Farming, Fishing & Forestry | 4,353 (79.8%) | 1,101 (20.2%) |
| Construction & Extraction | 34,164 (94.9%) | 1,822 (5.1%) |
| Installation, Maintenance & Repair | 23,799 (95.2%) | 1,212 (4.9%) |
| Total (Category) | 62,316 (93.8%) | 4,135 (6.2%) |
| Total (Overall) | 311,988 (50.2%) | 309,854 (49.8%) |
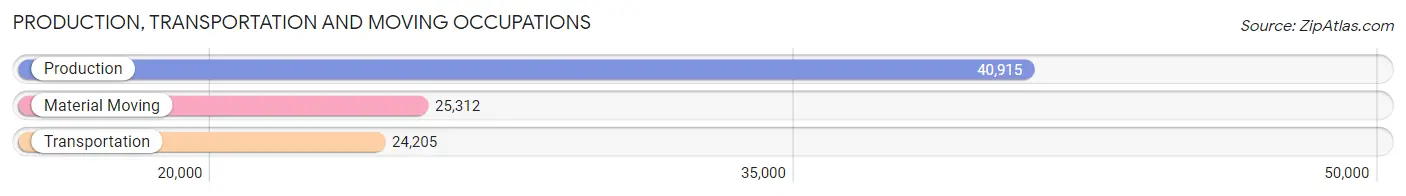
Production, Transportation and Moving Occupations
The most common Production, Transportation and Moving occupations in Area Code 910 are Production (40,915 | 6.6%), Material Moving (25,312 | 4.1%), and Transportation (24,205 | 3.9%).
Production, Transportation and Moving Occupations by Sex
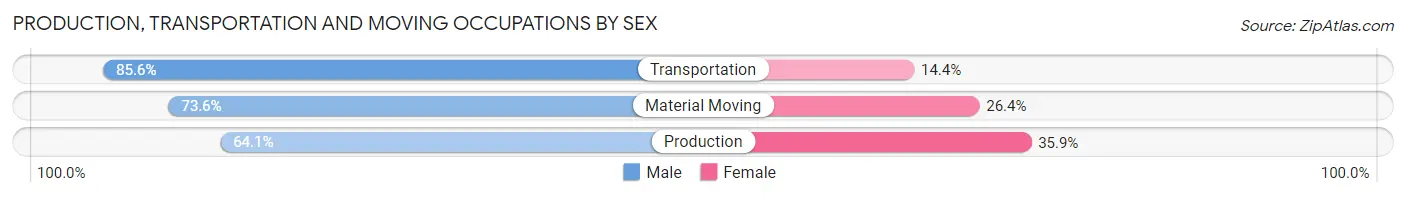
| Occupation | Male | Female |
| Production | 26,225 (64.1%) | 14,690 (35.9%) |
| Transportation | 20,718 (85.6%) | 3,487 (14.4%) |
| Material Moving | 18,634 (73.6%) | 6,678 (26.4%) |
| Total (Category) | 65,577 (72.5%) | 24,855 (27.5%) |
| Total (Overall) | 311,988 (50.2%) | 309,854 (49.8%) |
Employment Industries by Sex in Area Code 910
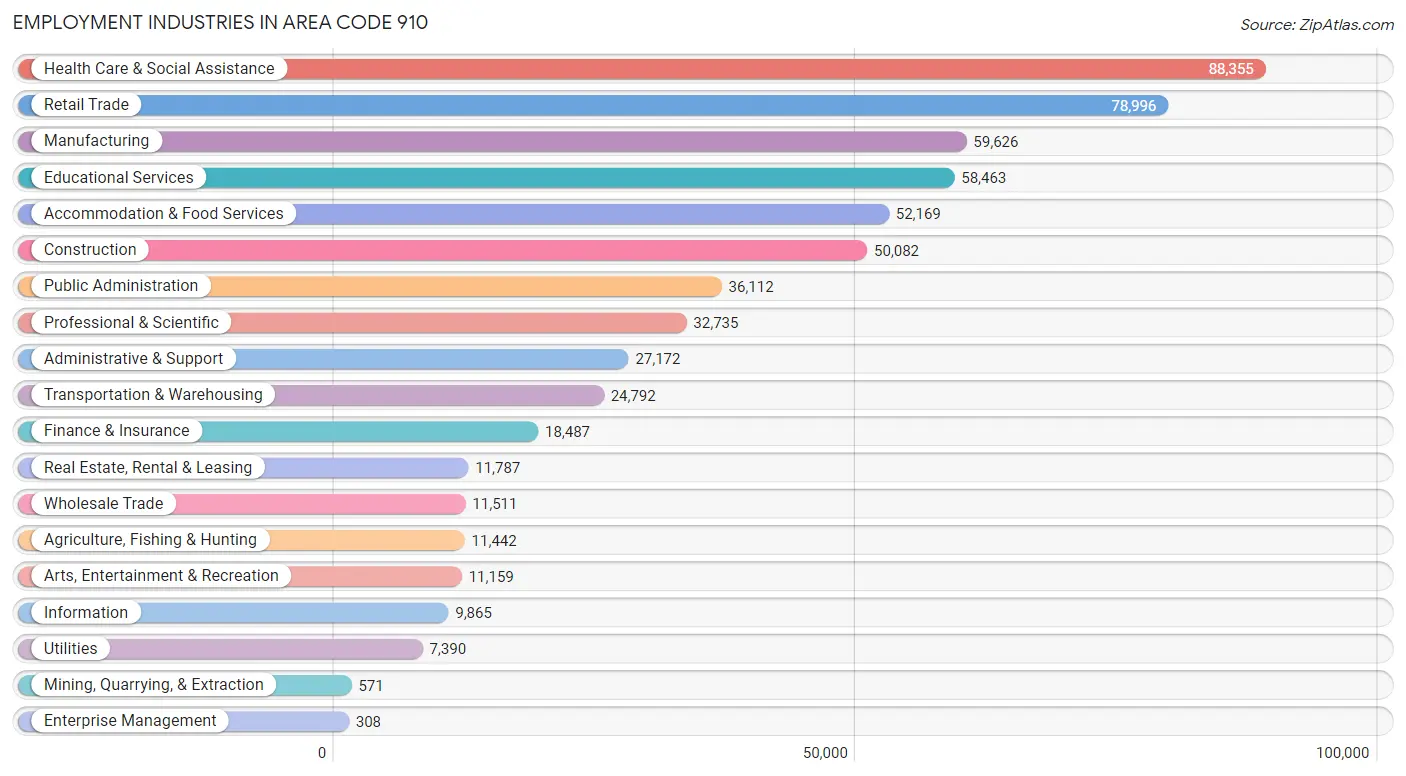
Employment Industries in Area Code 910
The major employment industries in Area Code 910 include Health Care & Social Assistance (88,355 | 14.2%), Retail Trade (78,996 | 12.7%), Manufacturing (59,626 | 9.6%), Educational Services (58,463 | 9.4%), and Accommodation & Food Services (52,169 | 8.4%).
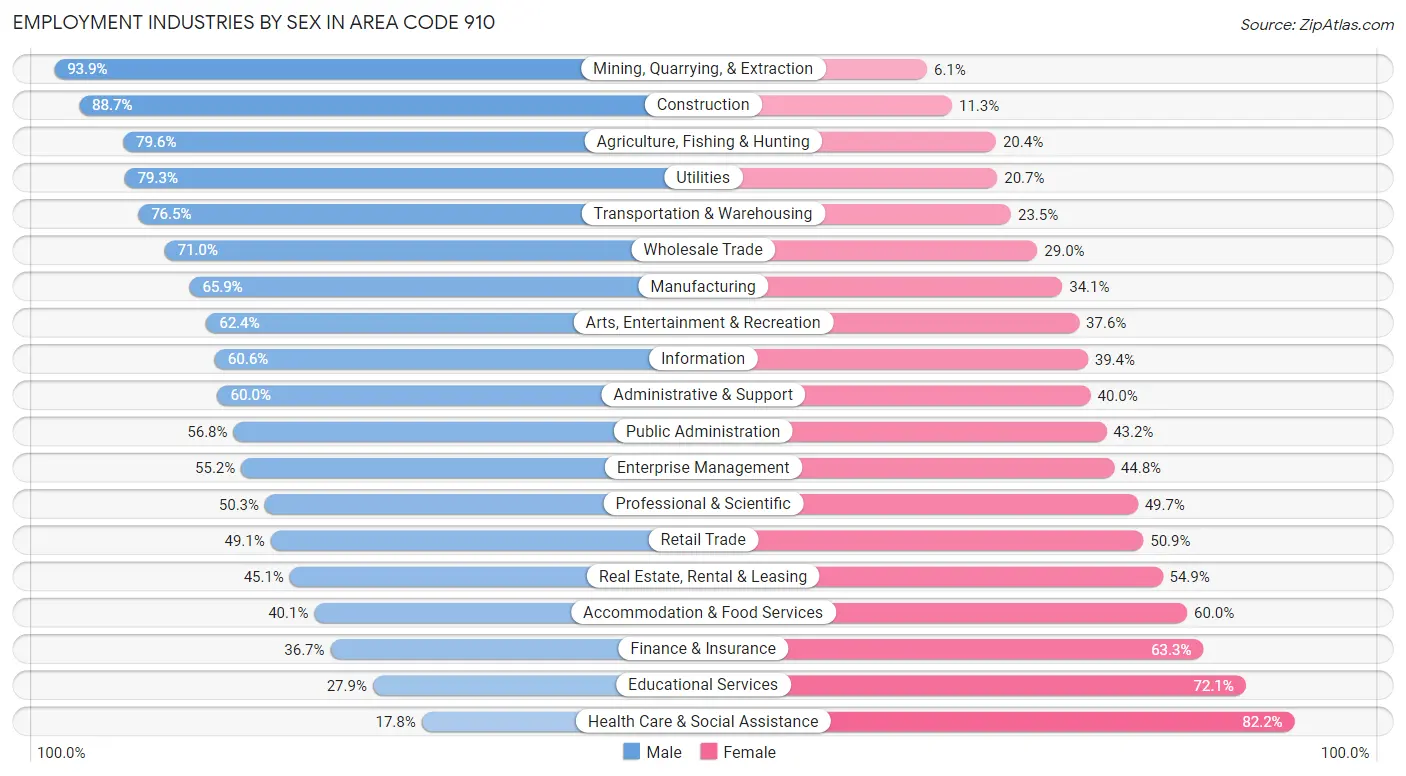
Employment Industries by Sex in Area Code 910
The Area Code 910 industries that see more men than women are Mining, Quarrying, & Extraction (93.9%), Construction (88.7%), and Agriculture, Fishing & Hunting (79.6%), whereas the industries that tend to have a higher number of women are Health Care & Social Assistance (82.2%), Educational Services (72.1%), and Finance & Insurance (63.3%).
| Industry | Male | Female |
| Agriculture, Fishing & Hunting | 9,108 (79.6%) | 2,334 (20.4%) |
| Mining, Quarrying, & Extraction | 536 (93.9%) | 35 (6.1%) |
| Construction | 44,424 (88.7%) | 5,658 (11.3%) |
| Manufacturing | 39,275 (65.9%) | 20,351 (34.1%) |
| Wholesale Trade | 8,176 (71.0%) | 3,335 (29.0%) |
| Retail Trade | 38,789 (49.1%) | 40,207 (50.9%) |
| Transportation & Warehousing | 18,960 (76.5%) | 5,832 (23.5%) |
| Utilities | 5,862 (79.3%) | 1,528 (20.7%) |
| Information | 5,978 (60.6%) | 3,887 (39.4%) |
| Finance & Insurance | 6,786 (36.7%) | 11,701 (63.3%) |
| Real Estate, Rental & Leasing | 5,319 (45.1%) | 6,468 (54.9%) |
| Professional & Scientific | 16,456 (50.3%) | 16,279 (49.7%) |
| Enterprise Management | 170 (55.2%) | 138 (44.8%) |
| Administrative & Support | 16,310 (60.0%) | 10,862 (40.0%) |
| Educational Services | 16,333 (27.9%) | 42,130 (72.1%) |
| Health Care & Social Assistance | 15,751 (17.8%) | 72,604 (82.2%) |
| Arts, Entertainment & Recreation | 6,961 (62.4%) | 4,198 (37.6%) |
| Accommodation & Food Services | 20,895 (40.1%) | 31,274 (60.0%) |
| Public Administration | 20,508 (56.8%) | 15,604 (43.2%) |
| Total | 311,988 (50.2%) | 309,854 (49.8%) |
Education in Area Code 910
School Enrollment in Area Code 910
The most common levels of schooling among the 364,936 students in Area Code 910 are college / undergraduate (85,985 | 23.6%), middle school (76,311 | 20.9%), and elementary school (72,935 | 20.0%).
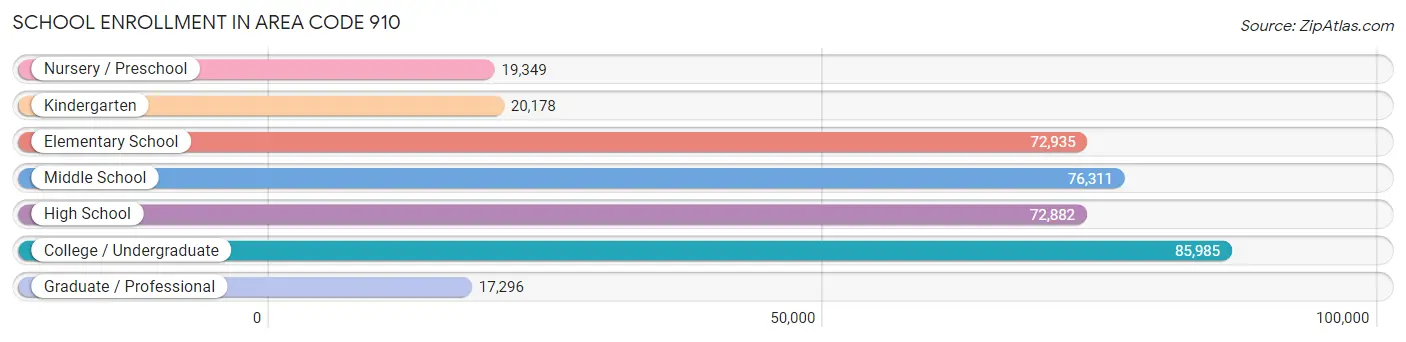
| School Level | # Students | % Students |
| Nursery / Preschool | 19,349 | 5.3% |
| Kindergarten | 20,178 | 5.5% |
| Elementary School | 72,935 | 20.0% |
| Middle School | 76,311 | 20.9% |
| High School | 72,882 | 20.0% |
| College / Undergraduate | 85,985 | 23.6% |
| Graduate / Professional | 17,296 | 4.7% |
| Total | 364,936 | 100.0% |
School Enrollment by Age by Funding Source in Area Code 910
Out of a total of 364,936 students who are enrolled in schools in Area Code 910, 52,637 (14.4%) attend a private institution, while the remaining 312,299 (85.6%) are enrolled in public schools. The age group of 3 to 4 year olds has the highest likelihood of being enrolled in private schools, with 5,674 (39.0% in the age bracket) enrolled. Conversely, the age group of 15 to 17 year olds has the lowest likelihood of being enrolled in a private school, with 48,660 (92.1% in the age bracket) attending a public institution.
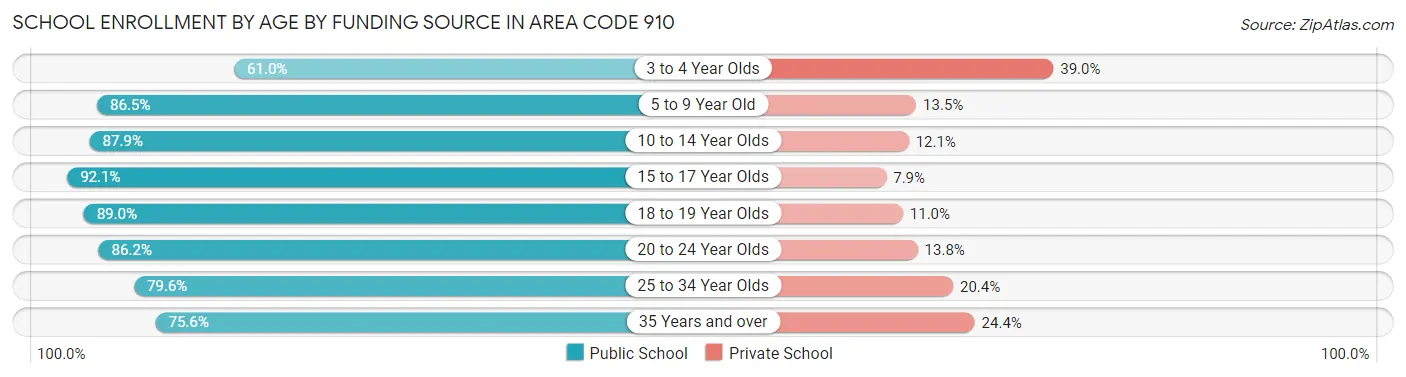
| Age Bracket | Public School | Private School |
| 3 to 4 Year Olds | 8,859 (61.0%) | 5,674 (39.0%) |
| 5 to 9 Year Old | 76,629 (86.5%) | 11,956 (13.5%) |
| 10 to 14 Year Olds | 81,833 (87.9%) | 11,280 (12.1%) |
| 15 to 17 Year Olds | 48,660 (92.1%) | 4,198 (7.9%) |
| 18 to 19 Year Olds | 23,108 (89.0%) | 2,861 (11.0%) |
| 20 to 24 Year Olds | 34,227 (86.2%) | 5,472 (13.8%) |
| 25 to 34 Year Olds | 21,113 (79.6%) | 5,402 (20.4%) |
| 35 Years and over | 17,890 (75.6%) | 5,774 (24.4%) |
| Total | 312,301 (85.6%) | 52,637 (14.4%) |
Educational Attainment by Field of Study in Area Code 910
Business (58,066 | 19.1%), education (46,848 | 15.4%), science & technology (31,748 | 10.4%), arts & humanities (27,928 | 9.2%), and social sciences (22,507 | 7.4%) are the most common fields of study among 303,971 individuals in Area Code 910 who have obtained a bachelor's degree or higher.
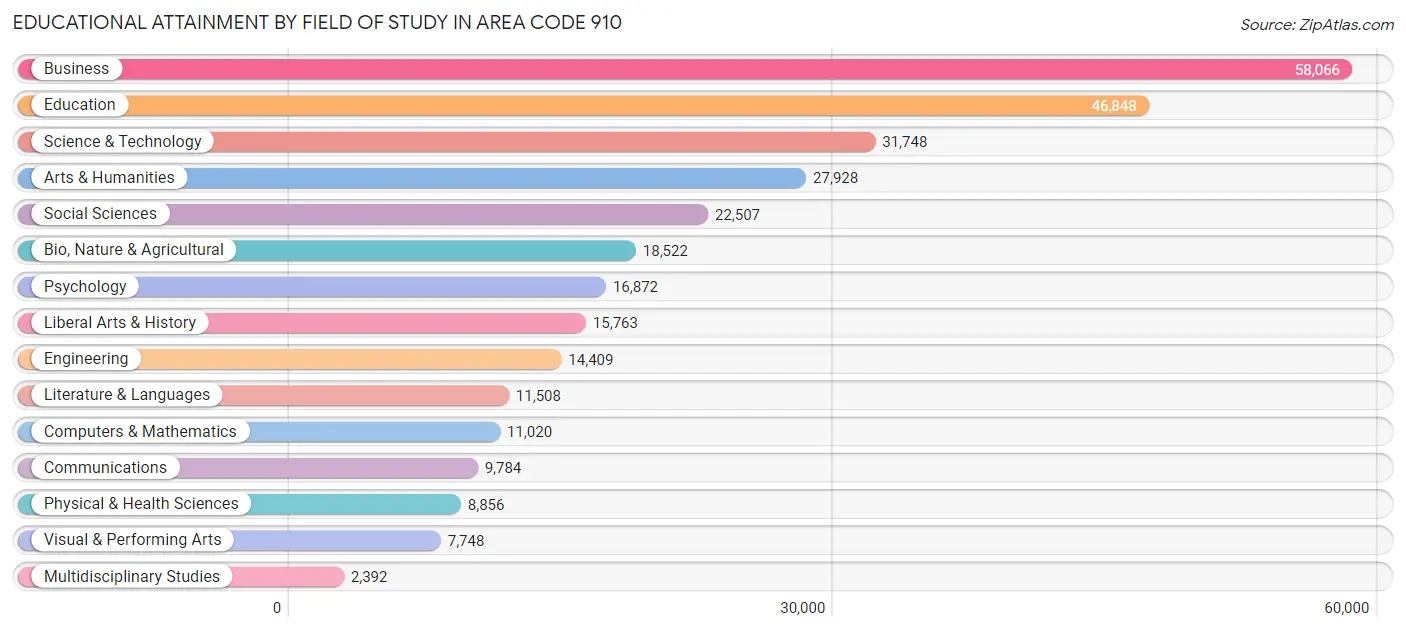
| Field of Study | # Graduates | % Graduates |
| Computers & Mathematics | 11,020 | 3.6% |
| Bio, Nature & Agricultural | 18,522 | 6.1% |
| Physical & Health Sciences | 8,856 | 2.9% |
| Psychology | 16,872 | 5.6% |
| Social Sciences | 22,507 | 7.4% |
| Engineering | 14,409 | 4.7% |
| Multidisciplinary Studies | 2,392 | 0.8% |
| Science & Technology | 31,748 | 10.4% |
| Business | 58,066 | 19.1% |
| Education | 46,848 | 15.4% |
| Literature & Languages | 11,508 | 3.8% |
| Liberal Arts & History | 15,763 | 5.2% |
| Visual & Performing Arts | 7,748 | 2.5% |
| Communications | 9,784 | 3.2% |
| Arts & Humanities | 27,928 | 9.2% |
| Total | 303,971 | 100.0% |
Transportation & Commute in Area Code 910
Vehicle Availability by Sex in Area Code 910
The most prevalent vehicle ownership categories in Area Code 910 are males with 2 vehicles (149,626, accounting for 43.3%) and females with 2 vehicles (121,507, making up 49.1%).
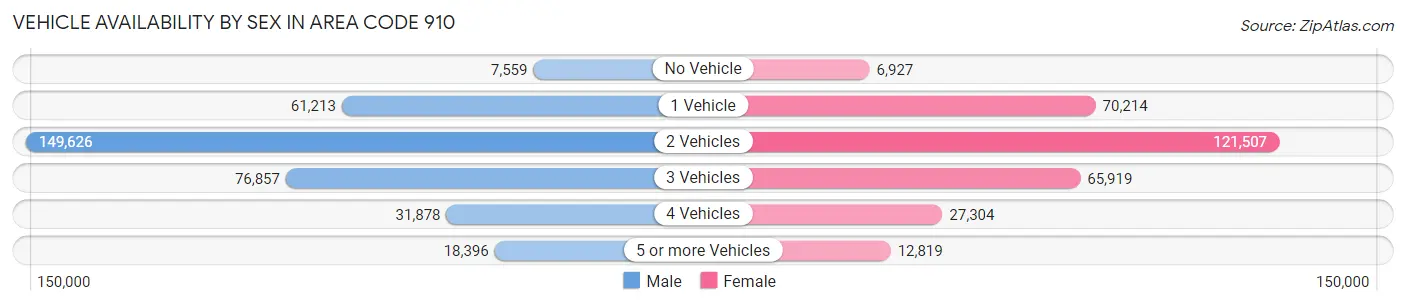
| Vehicles Available | Male | Female |
| No Vehicle | 7,559 (2.2%) | 6,927 (2.3%) |
| 1 Vehicle | 61,213 (17.7%) | 70,214 (23.0%) |
| 2 Vehicles | 149,626 (43.3%) | 121,507 (39.9%) |
| 3 Vehicles | 76,857 (22.2%) | 65,919 (21.6%) |
| 4 Vehicles | 31,878 (9.2%) | 27,304 (9.0%) |
| 5 or more Vehicles | 18,396 (5.3%) | 12,819 (4.2%) |
| Total | 345,529 (100.0%) | 304,690 (100.0%) |
Commute Time in Area Code 910
The most frequently occuring commute durations in Area Code 910 are 15 to 19 minutes (109,409 commuters, 17.6%), 20 to 24 minutes (93,610 commuters, 15.1%), and 10 to 14 minutes (90,997 commuters, 14.7%).
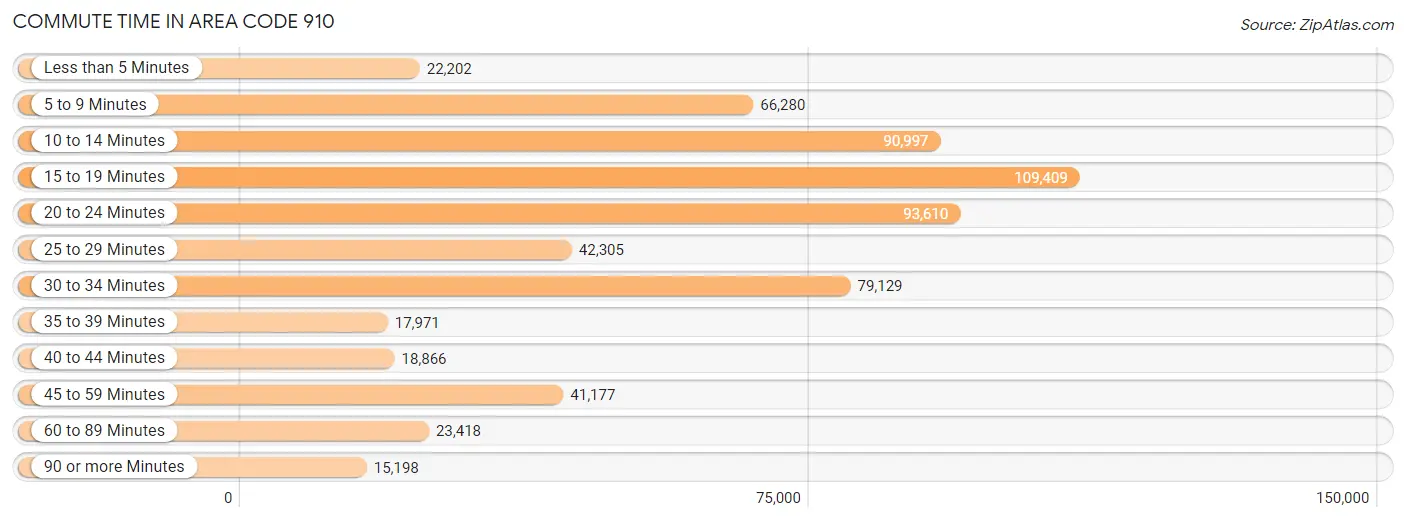
| Commute Time | # Commuters | % Commuters |
| Less than 5 Minutes | 22,202 | 3.6% |
| 5 to 9 Minutes | 66,280 | 10.7% |
| 10 to 14 Minutes | 90,997 | 14.7% |
| 15 to 19 Minutes | 109,409 | 17.6% |
| 20 to 24 Minutes | 93,610 | 15.1% |
| 25 to 29 Minutes | 42,305 | 6.8% |
| 30 to 34 Minutes | 79,129 | 12.8% |
| 35 to 39 Minutes | 17,971 | 2.9% |
| 40 to 44 Minutes | 18,866 | 3.0% |
| 45 to 59 Minutes | 41,177 | 6.6% |
| 60 to 89 Minutes | 23,418 | 3.8% |
| 90 or more Minutes | 15,198 | 2.5% |
Commute Time by Sex in Area Code 910
The most common commute times in Area Code 910 are 15 to 19 minutes (55,746 commuters, 16.3%) for males and 15 to 19 minutes (53,663 commuters, 19.3%) for females.
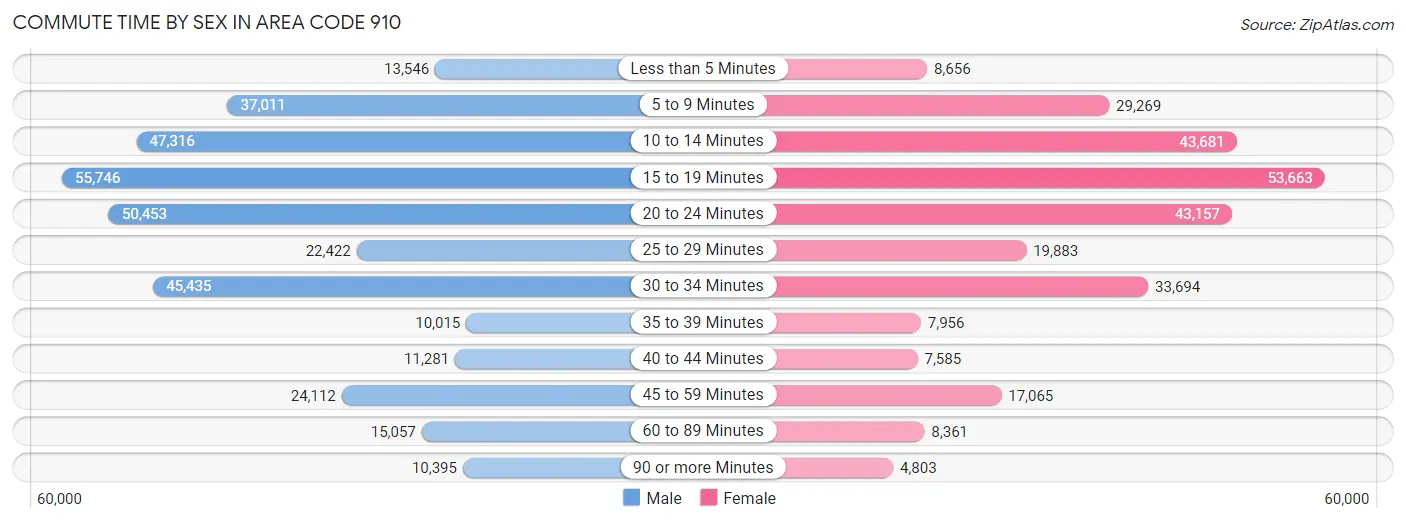
| Commute Time | Male | Female |
| Less than 5 Minutes | 13,546 (4.0%) | 8,656 (3.1%) |
| 5 to 9 Minutes | 37,011 (10.8%) | 29,269 (10.5%) |
| 10 to 14 Minutes | 47,316 (13.8%) | 43,681 (15.7%) |
| 15 to 19 Minutes | 55,746 (16.3%) | 53,663 (19.3%) |
| 20 to 24 Minutes | 50,453 (14.7%) | 43,157 (15.5%) |
| 25 to 29 Minutes | 22,422 (6.5%) | 19,883 (7.2%) |
| 30 to 34 Minutes | 45,435 (13.3%) | 33,694 (12.1%) |
| 35 to 39 Minutes | 10,015 (2.9%) | 7,956 (2.9%) |
| 40 to 44 Minutes | 11,281 (3.3%) | 7,585 (2.7%) |
| 45 to 59 Minutes | 24,112 (7.0%) | 17,065 (6.1%) |
| 60 to 89 Minutes | 15,057 (4.4%) | 8,361 (3.0%) |
| 90 or more Minutes | 10,395 (3.0%) | 4,803 (1.7%) |
Time of Departure to Work by Sex in Area Code 910
The most frequent times of departure to work in Area Code 910 are 7:00 AM to 7:29 AM (52,453, 15.3%) for males and 7:00 AM to 7:29 AM (46,393, 16.7%) for females.
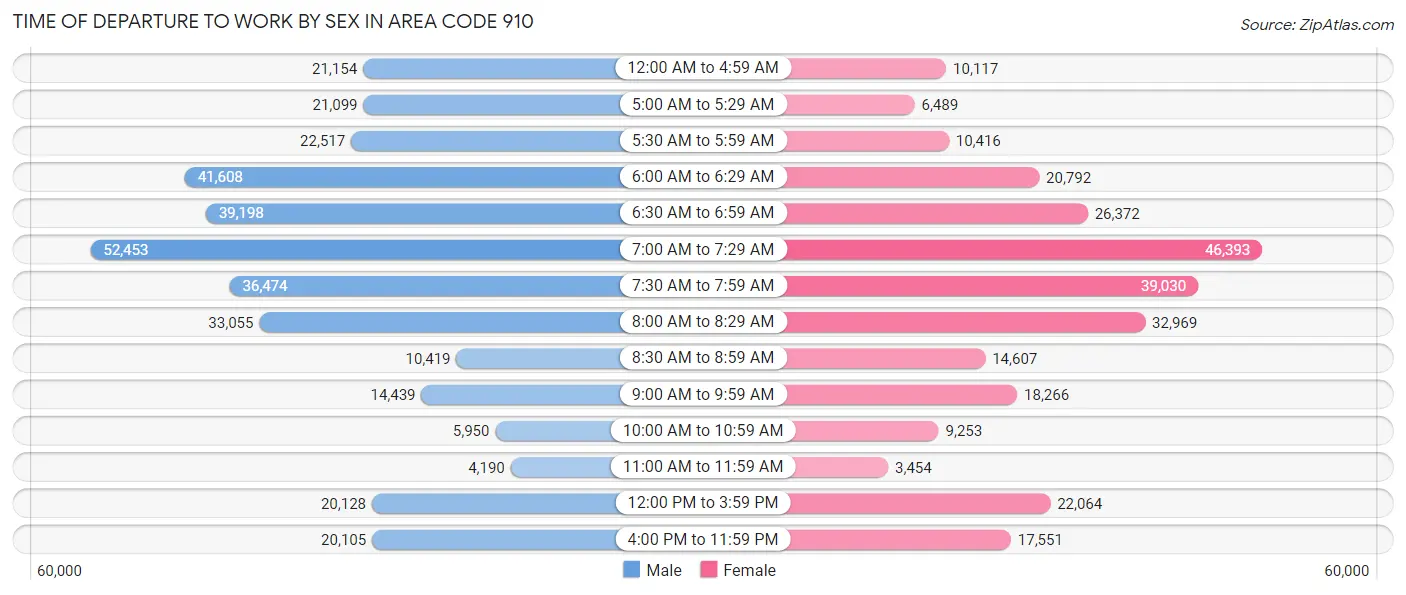
| Time of Departure | Male | Female |
| 12:00 AM to 4:59 AM | 21,154 (6.2%) | 10,117 (3.6%) |
| 5:00 AM to 5:29 AM | 21,099 (6.2%) | 6,489 (2.3%) |
| 5:30 AM to 5:59 AM | 22,517 (6.6%) | 10,416 (3.7%) |
| 6:00 AM to 6:29 AM | 41,608 (12.1%) | 20,792 (7.5%) |
| 6:30 AM to 6:59 AM | 39,198 (11.4%) | 26,372 (9.5%) |
| 7:00 AM to 7:29 AM | 52,453 (15.3%) | 46,393 (16.7%) |
| 7:30 AM to 7:59 AM | 36,474 (10.6%) | 39,030 (14.1%) |
| 8:00 AM to 8:29 AM | 33,055 (9.6%) | 32,969 (11.9%) |
| 8:30 AM to 8:59 AM | 10,419 (3.0%) | 14,607 (5.3%) |
| 9:00 AM to 9:59 AM | 14,439 (4.2%) | 18,266 (6.6%) |
| 10:00 AM to 10:59 AM | 5,950 (1.7%) | 9,253 (3.3%) |
| 11:00 AM to 11:59 AM | 4,190 (1.2%) | 3,454 (1.2%) |
| 12:00 PM to 3:59 PM | 20,128 (5.9%) | 22,064 (7.9%) |
| 4:00 PM to 11:59 PM | 20,105 (5.9%) | 17,551 (6.3%) |
| Total | 342,789 (100.0%) | 277,773 (100.0%) |
Housing Occupancy in Area Code 910
Occupancy by Ownership in Area Code 910
Of the total 600,201 dwellings in Area Code 910, owner-occupied units account for 391,480 (65.2%), while renter-occupied units make up 208,721 (34.8%).
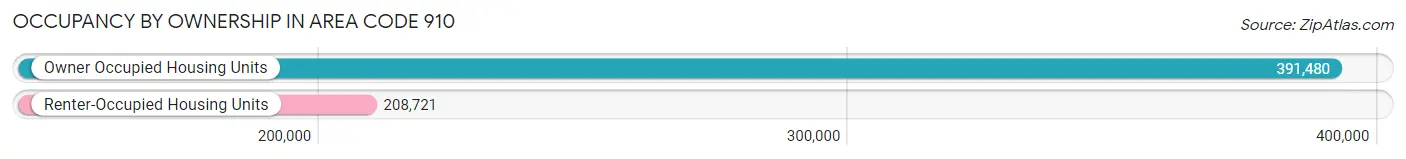
| Occupancy | # Housing Units | % Housing Units |
| Owner Occupied Housing Units | 391,480 | 65.2% |
| Renter-Occupied Housing Units | 208,721 | 34.8% |
| Total Occupied Housing Units | 600,201 | 100.0% |
Occupancy by Household Size in Area Code 910
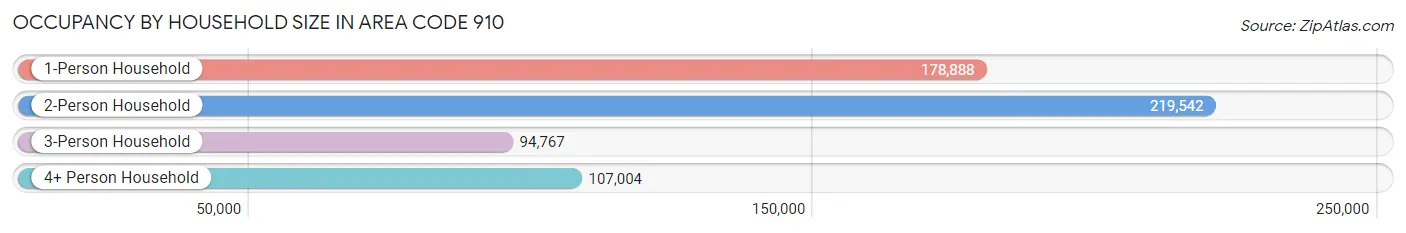
| Household Size | # Housing Units | % Housing Units |
| 1-Person Household | 178,888 | 29.8% |
| 2-Person Household | 219,542 | 36.6% |
| 3-Person Household | 94,767 | 15.8% |
| 4+ Person Household | 107,004 | 17.8% |
| Total Housing Units | 600,201 | 100.0% |
Occupancy by Ownership by Household Size in Area Code 910
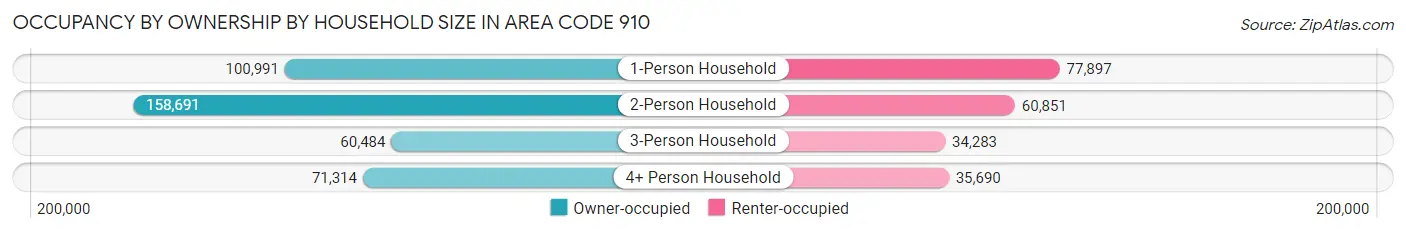
| Household Size | Owner-occupied | Renter-occupied |
| 1-Person Household | 100,991 (56.5%) | 77,897 (43.5%) |
| 2-Person Household | 158,691 (72.3%) | 60,851 (27.7%) |
| 3-Person Household | 60,484 (63.8%) | 34,283 (36.2%) |
| 4+ Person Household | 71,314 (66.6%) | 35,690 (33.4%) |
| Total Housing Units | 391,480 (65.2%) | 208,721 (34.8%) |
Occupancy by Educational Attainment in Area Code 910
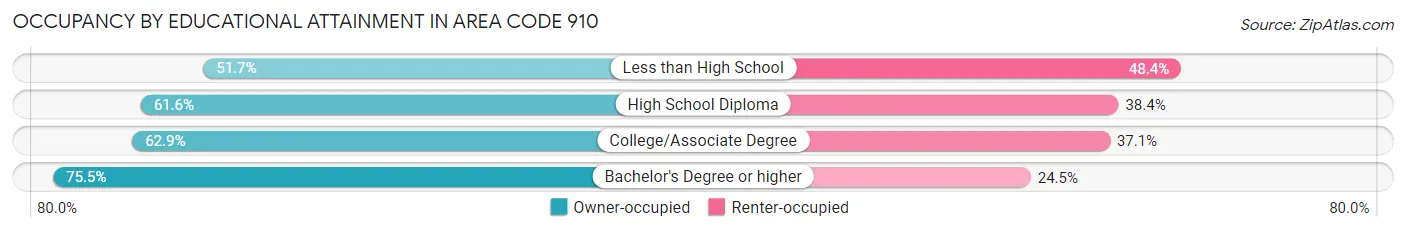
| Household Size | Owner-occupied | Renter-occupied |
| Less than High School | 28,251 (51.6%) | 26,441 (48.3%) |
| High School Diploma | 91,246 (61.6%) | 56,948 (38.4%) |
| College/Associate Degree | 139,837 (62.9%) | 82,394 (37.1%) |
| Bachelor's Degree or higher | 132,146 (75.5%) | 42,938 (24.5%) |
Occupancy by Age of Householder in Area Code 910
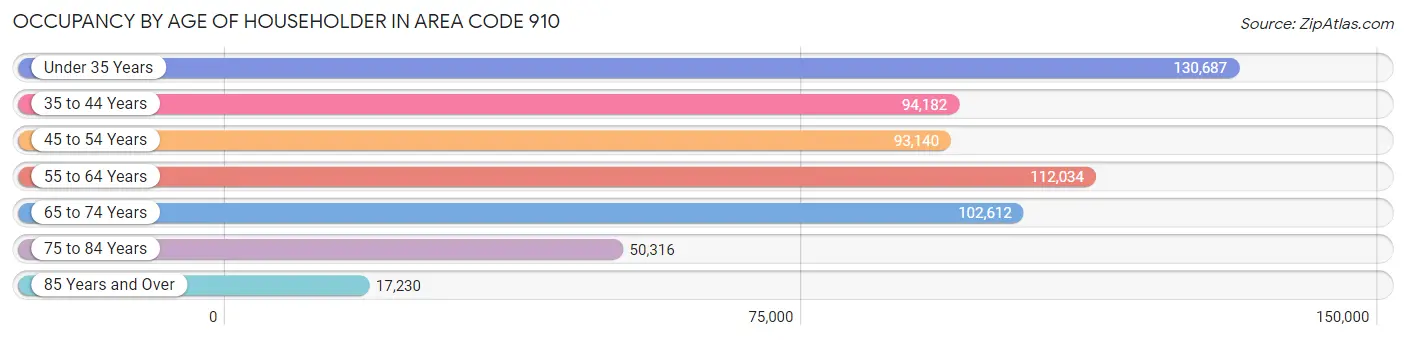
| Age Bracket | # Households | % Households |
| Under 35 Years | 130,687 | 21.8% |
| 35 to 44 Years | 94,182 | 15.7% |
| 45 to 54 Years | 93,140 | 15.5% |
| 55 to 64 Years | 112,034 | 18.7% |
| 65 to 74 Years | 102,612 | 17.1% |
| 75 to 84 Years | 50,316 | 8.4% |
| 85 Years and Over | 17,230 | 2.9% |
| Total | 600,201 | 100.0% |
Housing Finances in Area Code 910
Median Income by Occupancy in Area Code 910
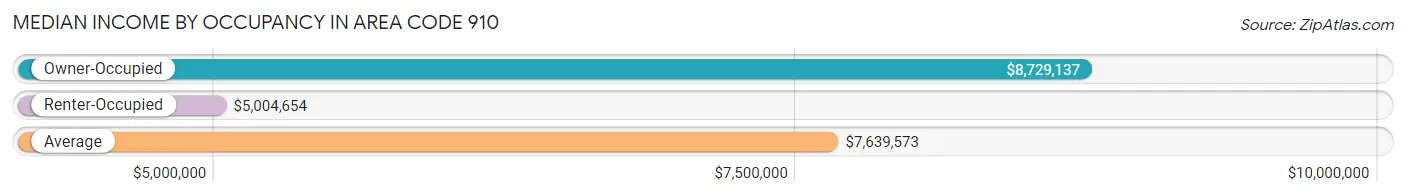
| Occupancy Type | # Households | Median Income |
| Owner-Occupied | 391,480 (65.2%) | $8,729,137 |
| Renter-Occupied | 208,721 (34.8%) | $5,004,654 |
| Average | 600,201 (100.0%) | $7,639,573 |
Occupancy by Householder Income Bracket in Area Code 910
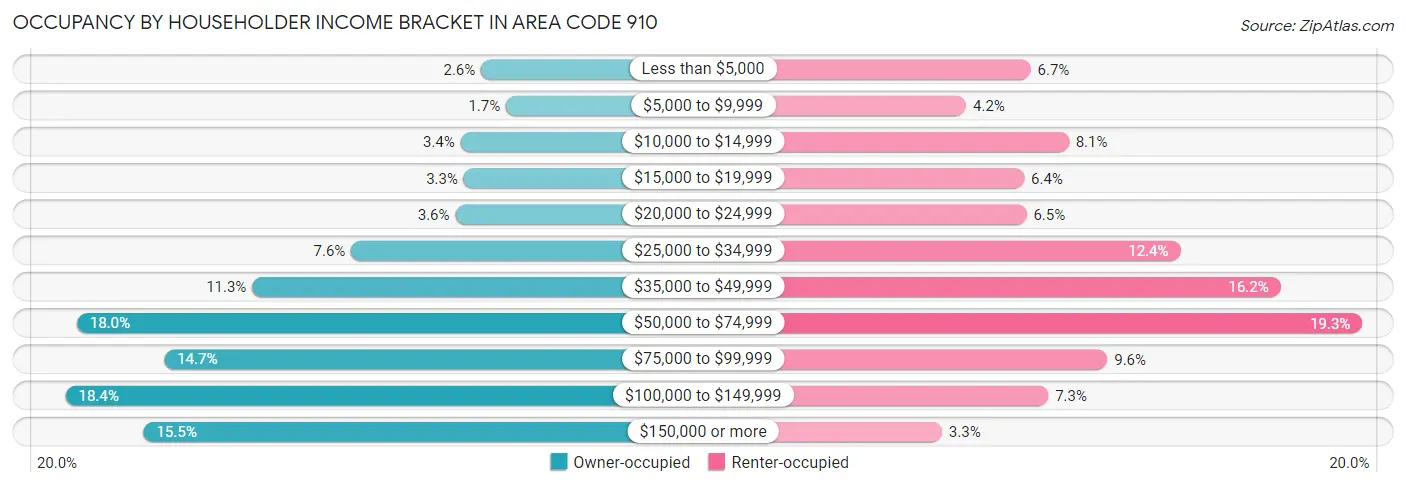
| Income Bracket | Owner-occupied | Renter-occupied |
| Less than $5,000 | 10,233 (2.6%) | 13,926 (6.7%) |
| $5,000 to $9,999 | 6,482 (1.7%) | 8,792 (4.2%) |
| $10,000 to $14,999 | 13,259 (3.4%) | 16,953 (8.1%) |
| $15,000 to $19,999 | 12,789 (3.3%) | 13,406 (6.4%) |
| $20,000 to $24,999 | 14,047 (3.6%) | 13,585 (6.5%) |
| $25,000 to $34,999 | 29,582 (7.6%) | 25,811 (12.4%) |
| $35,000 to $49,999 | 44,349 (11.3%) | 33,783 (16.2%) |
| $50,000 to $74,999 | 70,494 (18.0%) | 40,274 (19.3%) |
| $75,000 to $99,999 | 57,481 (14.7%) | 20,009 (9.6%) |
| $100,000 to $149,999 | 72,187 (18.4%) | 15,313 (7.3%) |
| $150,000 or more | 60,577 (15.5%) | 6,869 (3.3%) |
| Total | 391,480 (100.0%) | 208,721 (100.0%) |
Monthly Housing Cost Tiers in Area Code 910
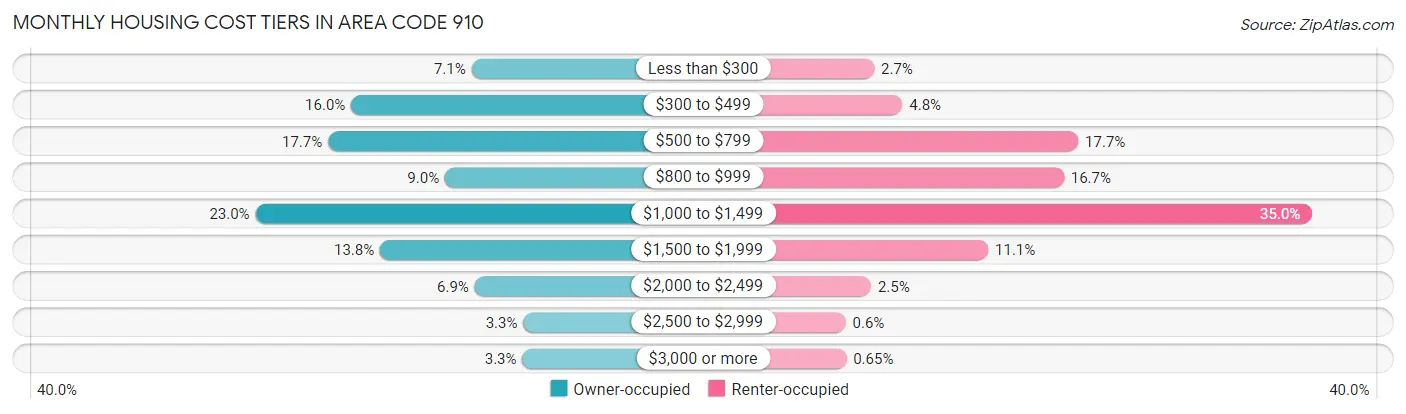
| Monthly Cost | Owner-occupied | Renter-occupied |
| Less than $300 | 27,705 (7.1%) | 5,639 (2.7%) |
| $300 to $499 | 62,439 (16.0%) | 9,986 (4.8%) |
| $500 to $799 | 69,082 (17.6%) | 36,998 (17.7%) |
| $800 to $999 | 35,391 (9.0%) | 34,787 (16.7%) |
| $1,000 to $1,499 | 90,048 (23.0%) | 72,975 (35.0%) |
| $1,500 to $1,999 | 54,117 (13.8%) | 23,170 (11.1%) |
| $2,000 to $2,499 | 26,822 (6.9%) | 5,161 (2.5%) |
| $2,500 to $2,999 | 12,792 (3.3%) | 1,248 (0.6%) |
| $3,000 or more | 13,084 (3.3%) | 1,350 (0.6%) |
| Total | 391,480 (100.0%) | 208,721 (100.0%) |
Physical Housing Characteristics in Area Code 910
Housing Structures in Area Code 910
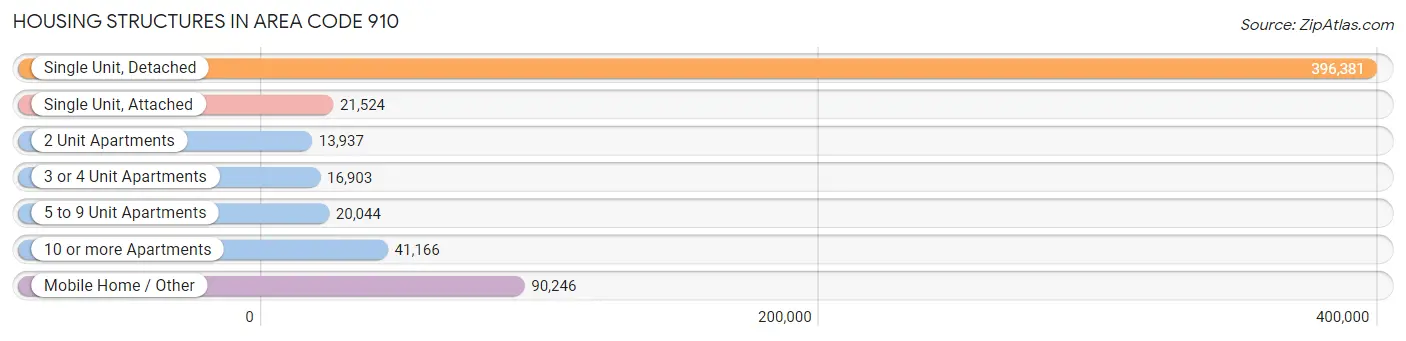
| Structure Type | # Housing Units | % Housing Units |
| Single Unit, Detached | 396,381 | 66.0% |
| Single Unit, Attached | 21,524 | 3.6% |
| 2 Unit Apartments | 13,937 | 2.3% |
| 3 or 4 Unit Apartments | 16,903 | 2.8% |
| 5 to 9 Unit Apartments | 20,044 | 3.3% |
| 10 or more Apartments | 41,166 | 6.9% |
| Mobile Home / Other | 90,246 | 15.0% |
| Total | 600,201 | 100.0% |
Housing Structures by Occupancy in Area Code 910
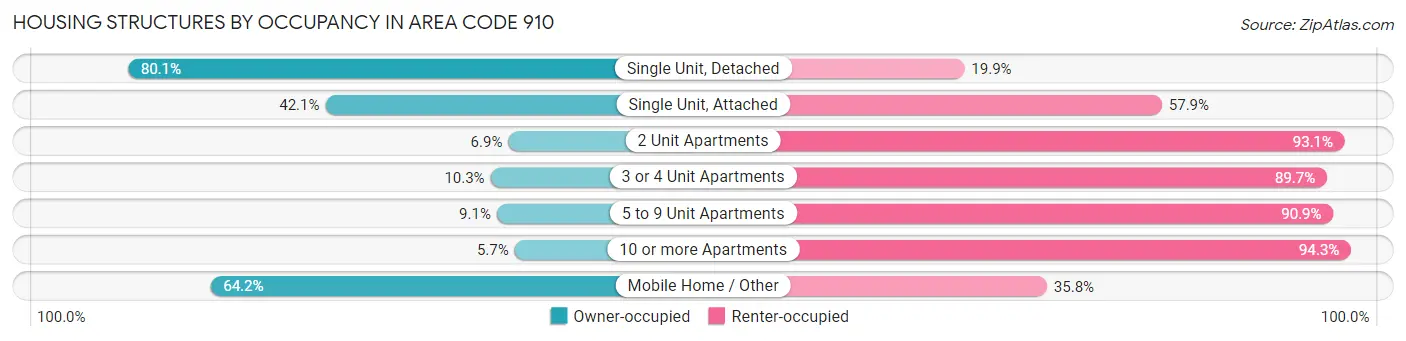
| Structure Type | Owner-occupied | Renter-occupied |
| Single Unit, Detached | 317,586 (80.1%) | 78,795 (19.9%) |
| Single Unit, Attached | 9,064 (42.1%) | 12,460 (57.9%) |
| 2 Unit Apartments | 959 (6.9%) | 12,978 (93.1%) |
| 3 or 4 Unit Apartments | 1,742 (10.3%) | 15,161 (89.7%) |
| 5 to 9 Unit Apartments | 1,822 (9.1%) | 18,222 (90.9%) |
| 10 or more Apartments | 2,336 (5.7%) | 38,830 (94.3%) |
| Mobile Home / Other | 57,971 (64.2%) | 32,275 (35.8%) |
| Total | 391,480 (65.2%) | 208,721 (34.8%) |
Housing Structures by Number of Rooms in Area Code 910
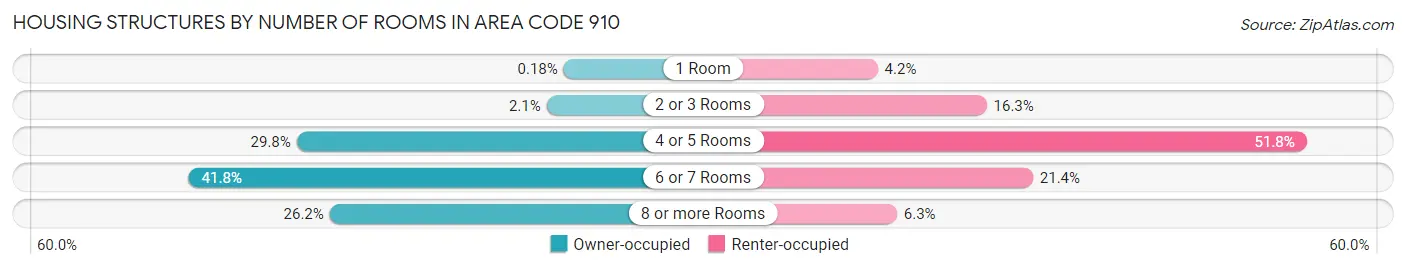
| Number of Rooms | Owner-occupied | Renter-occupied |
| 1 Room | 716 (0.2%) | 8,752 (4.2%) |
| 2 or 3 Rooms | 8,108 (2.1%) | 33,979 (16.3%) |
| 4 or 5 Rooms | 116,700 (29.8%) | 108,100 (51.8%) |
| 6 or 7 Rooms | 163,589 (41.8%) | 44,692 (21.4%) |
| 8 or more Rooms | 102,367 (26.2%) | 13,198 (6.3%) |
| Total | 391,480 (100.0%) | 208,721 (100.0%) |
Housing Structure by Heating Type in Area Code 910
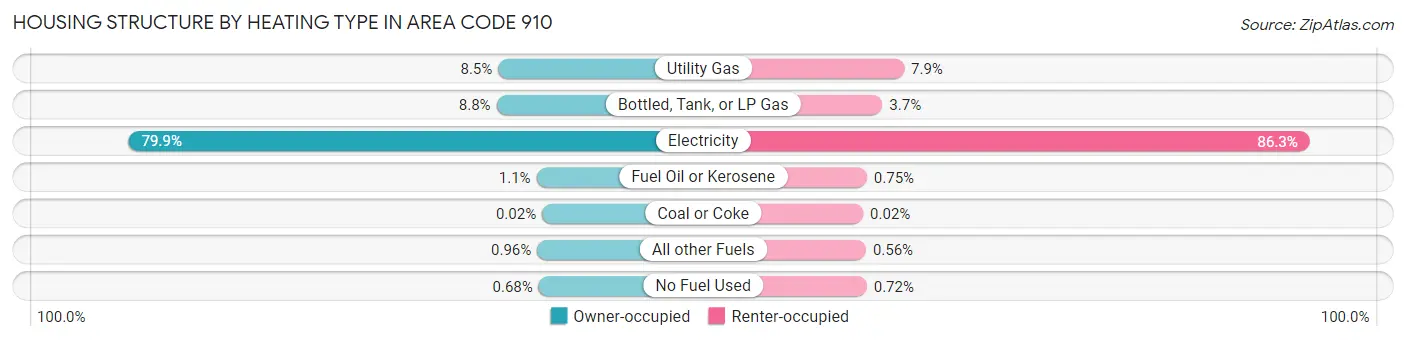
| Heating Type | Owner-occupied | Renter-occupied |
| Utility Gas | 33,282 (8.5%) | 16,555 (7.9%) |
| Bottled, Tank, or LP Gas | 34,545 (8.8%) | 7,800 (3.7%) |
| Electricity | 312,879 (79.9%) | 180,105 (86.3%) |
| Fuel Oil or Kerosene | 4,263 (1.1%) | 1,555 (0.7%) |
| Coal or Coke | 74 (0.0%) | 50 (0.0%) |
| All other Fuels | 3,771 (1.0%) | 1,159 (0.6%) |
| No Fuel Used | 2,666 (0.7%) | 1,497 (0.7%) |
| Total | 391,480 (100.0%) | 208,721 (100.0%) |
Household Vehicle Usage in Area Code 910
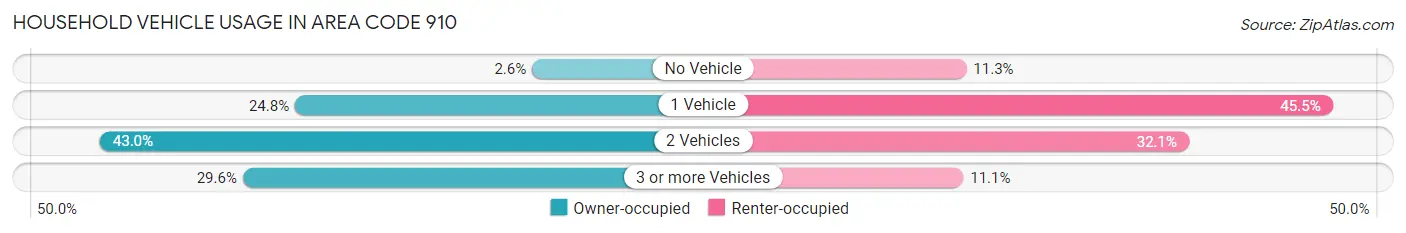
| Vehicles per Household | Owner-occupied | Renter-occupied |
| No Vehicle | 10,305 (2.6%) | 23,670 (11.3%) |
| 1 Vehicle | 96,920 (24.8%) | 94,996 (45.5%) |
| 2 Vehicles | 168,206 (43.0%) | 66,998 (32.1%) |
| 3 or more Vehicles | 116,049 (29.6%) | 23,057 (11.1%) |
| Total | 391,480 (100.0%) | 208,721 (100.0%) |
Real Estate & Mortgages in Area Code 910
Real Estate and Mortgage Overview in Area Code 910
| Characteristic | Without Mortgage | With Mortgage |
| Housing Units | 160,452 | 231,028 |
| Median Property Value | $20,030,000 | $25,099,600 |
| Median Household Income | $6,588,671 | $43,821 |
| Monthly Housing Costs | $61,754 | $12,731 |
| Real Estate Taxes | $152,823 | $5,451 |
Property Value by Mortgage Status in Area Code 910
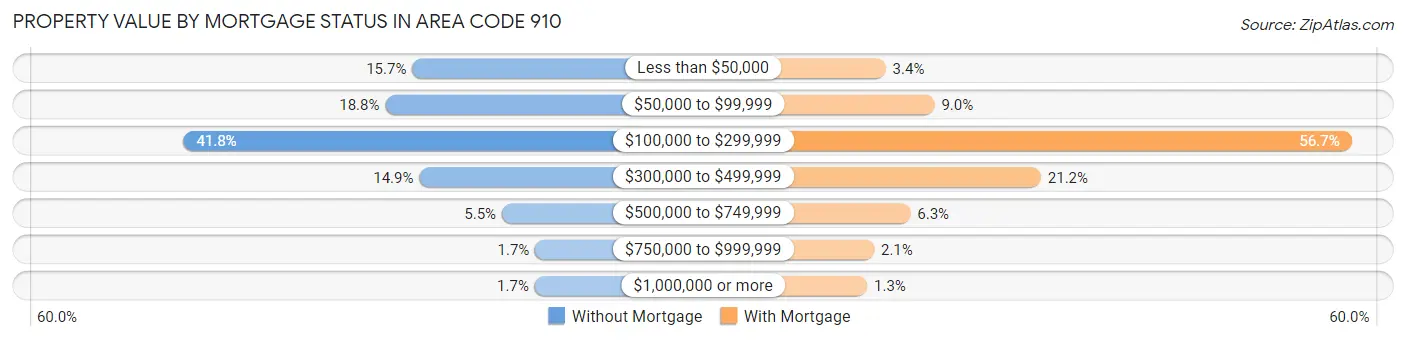
| Property Value | Without Mortgage | With Mortgage |
| Less than $50,000 | 25,189 (15.7%) | 7,942 (3.4%) |
| $50,000 to $99,999 | 30,137 (18.8%) | 20,831 (9.0%) |
| $100,000 to $299,999 | 67,126 (41.8%) | 130,937 (56.7%) |
| $300,000 to $499,999 | 23,887 (14.9%) | 48,925 (21.2%) |
| $500,000 to $749,999 | 8,750 (5.4%) | 14,453 (6.3%) |
| $750,000 to $999,999 | 2,641 (1.7%) | 4,880 (2.1%) |
| $1,000,000 or more | 2,722 (1.7%) | 3,060 (1.3%) |
| Total | 160,452 (100.0%) | 231,028 (100.0%) |
Household Income by Mortgage Status in Area Code 910
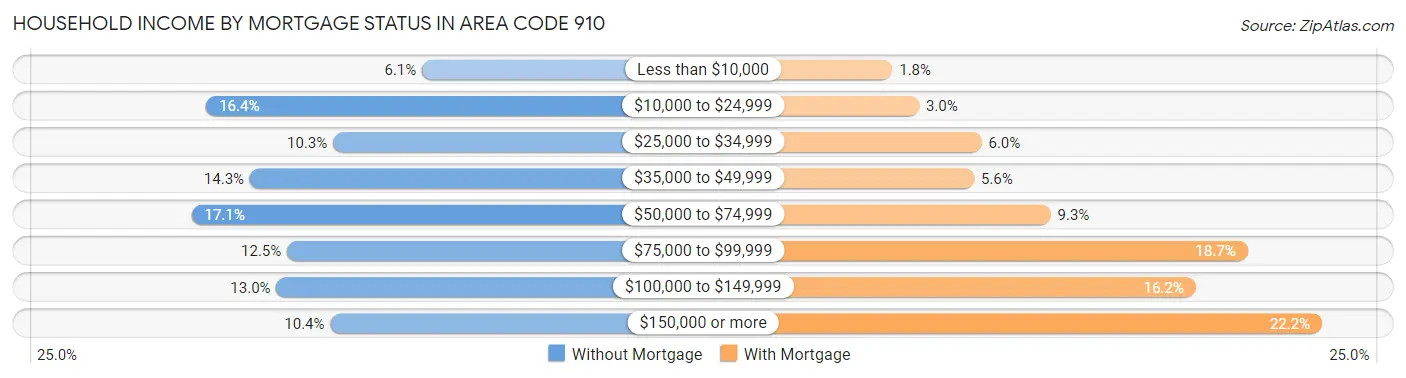
| Household Income | Without Mortgage | With Mortgage |
| Less than $10,000 | 9,734 (6.1%) | 4,035 (1.8%) |
| $10,000 to $24,999 | 26,235 (16.4%) | 6,981 (3.0%) |
| $25,000 to $34,999 | 16,542 (10.3%) | 13,860 (6.0%) |
| $35,000 to $49,999 | 22,892 (14.3%) | 13,040 (5.6%) |
| $50,000 to $74,999 | 27,363 (17.1%) | 21,457 (9.3%) |
| $75,000 to $99,999 | 20,057 (12.5%) | 43,131 (18.7%) |
| $100,000 to $149,999 | 20,873 (13.0%) | 37,424 (16.2%) |
| $150,000 or more | 16,756 (10.4%) | 51,314 (22.2%) |
| Total | 160,452 (100.0%) | 231,028 (100.0%) |
Property Value to Household Income Ratio in Area Code 910
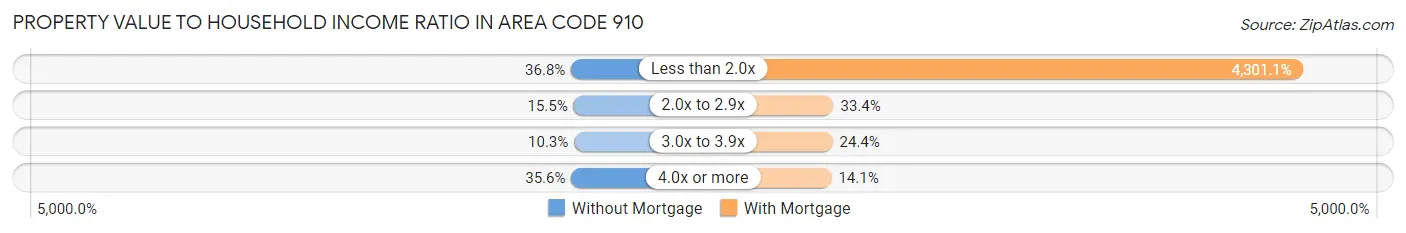
| Value-to-Income Ratio | Without Mortgage | With Mortgage |
| Less than 2.0x | 59,000 (36.8%) | 9,936,758 (4,301.1%) |
| 2.0x to 2.9x | 24,815 (15.5%) | 77,199 (33.4%) |
| 3.0x to 3.9x | 16,442 (10.2%) | 56,446 (24.4%) |
| 4.0x or more | 57,131 (35.6%) | 32,533 (14.1%) |
| Total | 160,452 (100.0%) | 231,028 (100.0%) |
Real Estate Taxes by Mortgage Status in Area Code 910
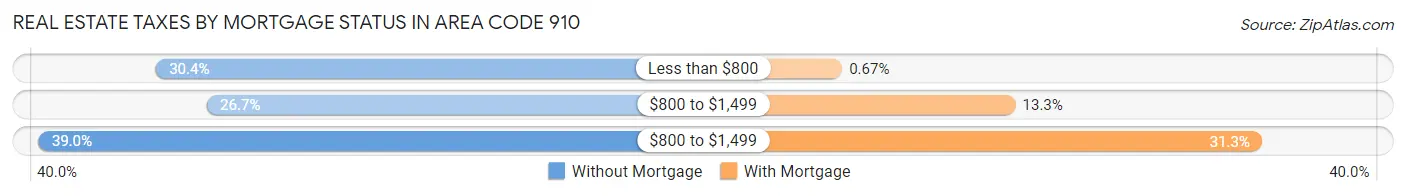
| Property Taxes | Without Mortgage | With Mortgage |
| Less than $800 | 48,746 (30.4%) | 1,539 (0.7%) |
| $800 to $1,499 | 42,794 (26.7%) | 30,826 (13.3%) |
| $800 to $1,499 | 62,509 (39.0%) | 72,347 (31.3%) |
| Total | 160,452 (100.0%) | 231,028 (100.0%) |
Health & Disability in Area Code 910
Health Insurance Coverage by Age in Area Code 910
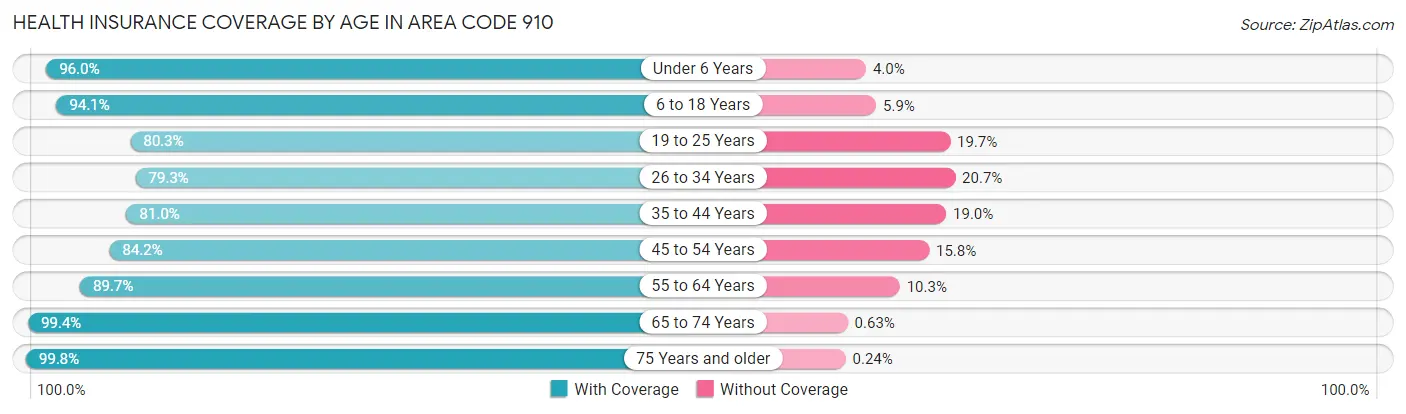
| Age Bracket | With Coverage | Without Coverage |
| Under 6 Years | 109,558 (96.0%) | 4,613 (4.0%) |
| 6 to 18 Years | 231,409 (94.1%) | 14,588 (5.9%) |
| 19 to 25 Years | 109,869 (80.3%) | 26,983 (19.7%) |
| 26 to 34 Years | 128,578 (79.3%) | 33,512 (20.7%) |
| 35 to 44 Years | 137,493 (81.0%) | 32,235 (19.0%) |
| 45 to 54 Years | 141,823 (84.2%) | 26,641 (15.8%) |
| 55 to 64 Years | 169,839 (89.7%) | 19,593 (10.3%) |
| 65 to 74 Years | 161,570 (99.4%) | 1,028 (0.6%) |
| 75 Years and older | 100,575 (99.8%) | 245 (0.2%) |
| Total | 1,290,714 (89.0%) | 159,438 (11.0%) |
Health Insurance Coverage by Citizenship Status in Area Code 910
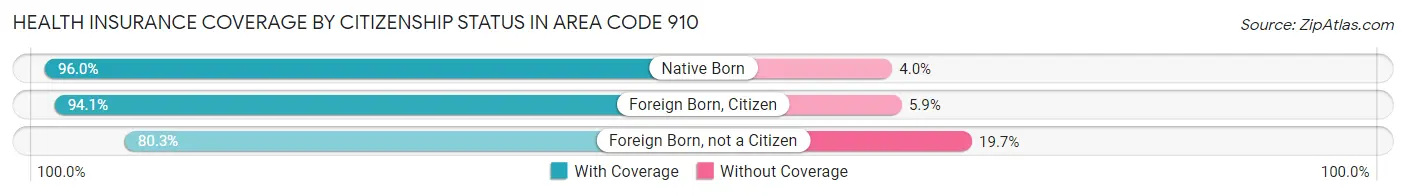
| Citizenship Status | With Coverage | Without Coverage |
| Native Born | 109,558 (96.0%) | 4,613 (4.0%) |
| Foreign Born, Citizen | 231,409 (94.1%) | 14,588 (5.9%) |
| Foreign Born, not a Citizen | 109,869 (80.3%) | 26,983 (19.7%) |
Health Insurance Coverage by Household Income in Area Code 910
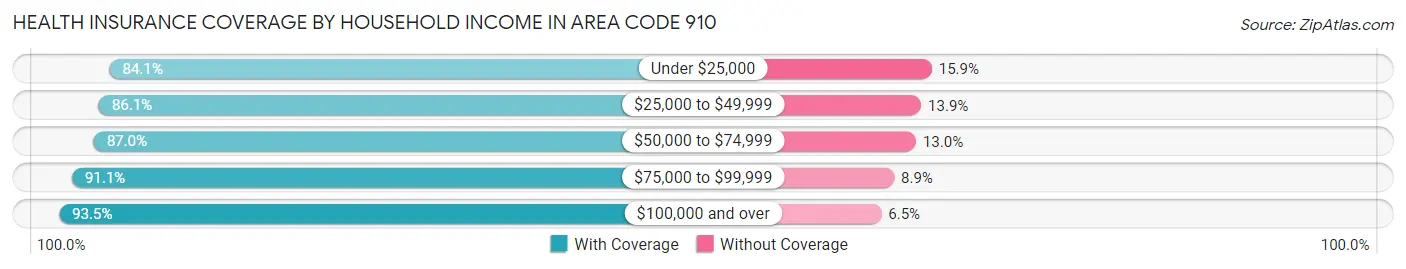
| Household Income | With Coverage | Without Coverage |
| Under $25,000 | 190,508 (84.1%) | 36,067 (15.9%) |
| $25,000 to $49,999 | 247,868 (86.1%) | 40,102 (13.9%) |
| $50,000 to $74,999 | 232,949 (87.0%) | 34,697 (13.0%) |
| $75,000 to $99,999 | 186,445 (91.1%) | 18,138 (8.9%) |
| $100,000 and over | 422,693 (93.5%) | 29,225 (6.5%) |
Public vs Private Health Insurance Coverage by Age in Area Code 910
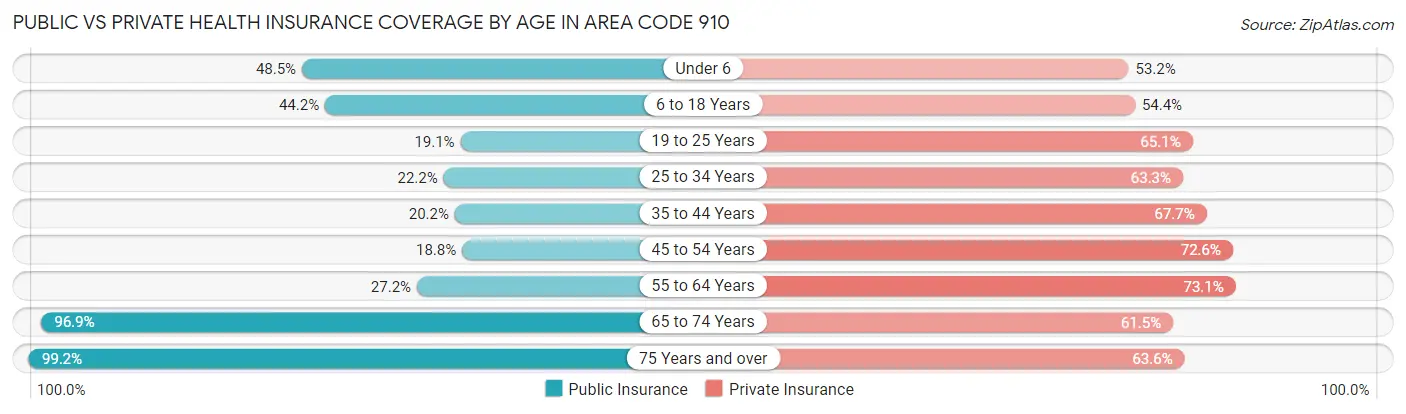
| Age Bracket | Public Insurance | Private Insurance |
| Under 6 | 55,399 (48.5%) | 60,767 (53.2%) |
| 6 to 18 Years | 108,841 (44.2%) | 133,846 (54.4%) |
| 19 to 25 Years | 26,144 (19.1%) | 89,078 (65.1%) |
| 25 to 34 Years | 36,041 (22.2%) | 102,598 (63.3%) |
| 35 to 44 Years | 34,202 (20.2%) | 114,914 (67.7%) |
| 45 to 54 Years | 31,688 (18.8%) | 122,259 (72.6%) |
| 55 to 64 Years | 51,479 (27.2%) | 138,440 (73.1%) |
| 65 to 74 Years | 157,555 (96.9%) | 99,970 (61.5%) |
| 75 Years and over | 100,010 (99.2%) | 64,122 (63.6%) |
| Total | 601,359 (41.5%) | 925,994 (63.8%) |
Disability Status by Sex by Age in Area Code 910
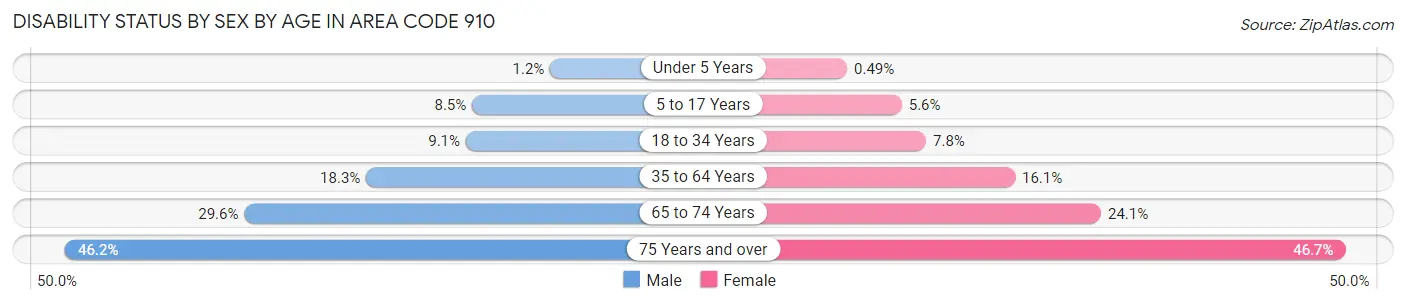
| Age Bracket | Male | Female |
| Under 5 Years | 596 (1.2%) | 229 (0.5%) |
| 5 to 17 Years | 10,672 (8.5%) | 6,677 (5.6%) |
| 18 to 34 Years | 13,500 (9.0%) | 13,223 (7.8%) |
| 35 to 64 Years | 45,272 (18.3%) | 45,044 (16.1%) |
| 65 to 74 Years | 22,269 (29.6%) | 21,028 (24.1%) |
| 75 Years and over | 19,591 (46.2%) | 27,315 (46.7%) |
Disability Class by Sex by Age in Area Code 910
Disability Class: Hearing Difficulty
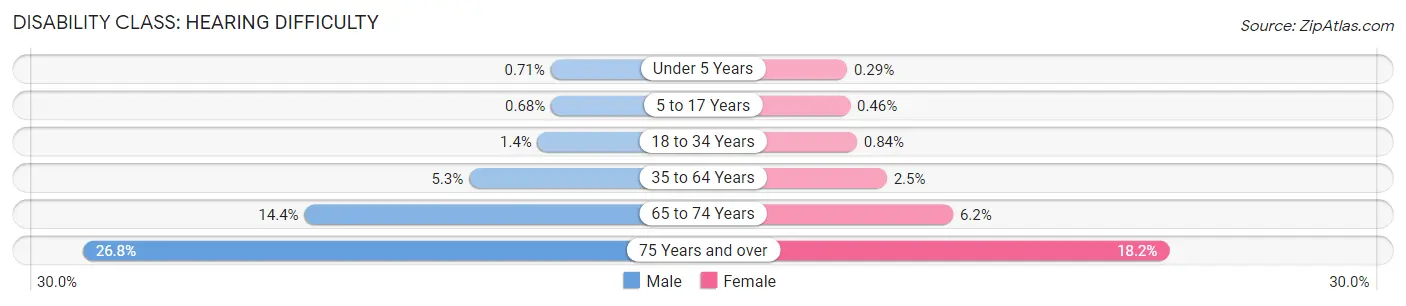
| Age Bracket | Male | Female |
| Under 5 Years | 348 (0.7%) | 135 (0.3%) |
| 5 to 17 Years | 857 (0.7%) | 548 (0.5%) |
| 18 to 34 Years | 2,140 (1.4%) | 1,414 (0.8%) |
| 35 to 64 Years | 12,998 (5.2%) | 6,997 (2.5%) |
| 65 to 74 Years | 10,840 (14.4%) | 5,411 (6.2%) |
| 75 Years and over | 11,338 (26.8%) | 10,656 (18.2%) |
Disability Class: Vision Difficulty
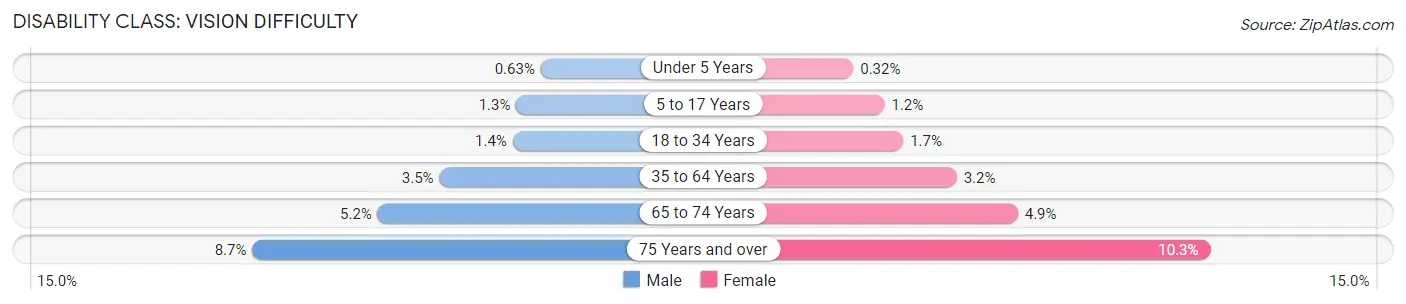
| Age Bracket | Male | Female |
| Under 5 Years | 306 (0.6%) | 147 (0.3%) |
| 5 to 17 Years | 1,650 (1.3%) | 1,425 (1.2%) |
| 18 to 34 Years | 2,106 (1.4%) | 2,885 (1.7%) |
| 35 to 64 Years | 8,527 (3.5%) | 8,972 (3.2%) |
| 65 to 74 Years | 3,890 (5.2%) | 4,281 (4.9%) |
| 75 Years and over | 3,671 (8.7%) | 5,997 (10.3%) |
Disability Class: Cognitive Difficulty
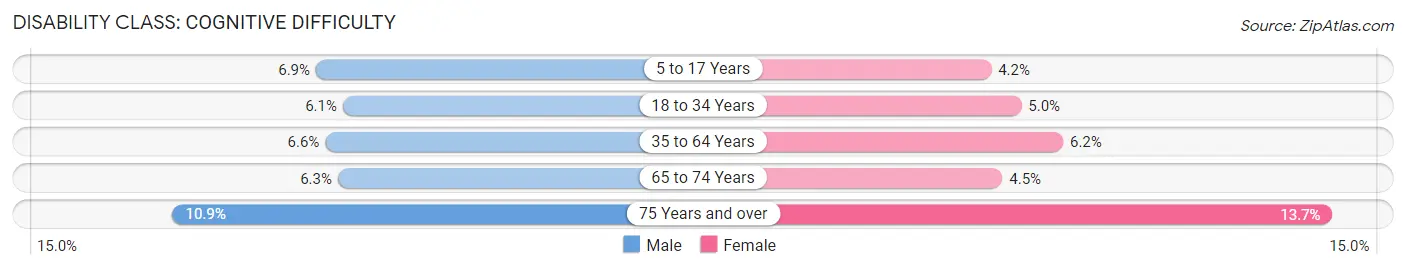
| Age Bracket | Male | Female |
| 5 to 17 Years | 8,674 (6.9%) | 4,991 (4.2%) |
| 18 to 34 Years | 9,160 (6.1%) | 8,448 (5.0%) |
| 35 to 64 Years | 16,400 (6.6%) | 17,255 (6.2%) |
| 65 to 74 Years | 4,724 (6.3%) | 3,905 (4.5%) |
| 75 Years and over | 4,611 (10.9%) | 7,987 (13.7%) |
Disability Class: Ambulatory Difficulty
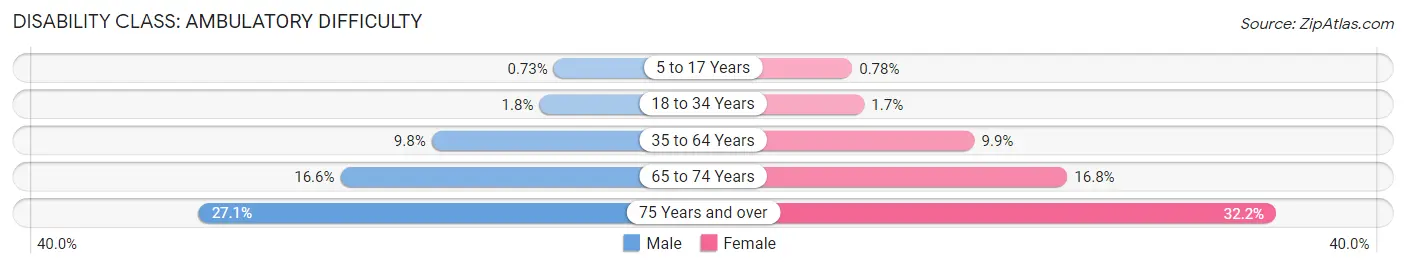
| Age Bracket | Male | Female |
| 5 to 17 Years | 914 (0.7%) | 937 (0.8%) |
| 18 to 34 Years | 2,670 (1.8%) | 2,839 (1.7%) |
| 35 to 64 Years | 24,230 (9.8%) | 27,620 (9.9%) |
| 65 to 74 Years | 12,454 (16.6%) | 14,640 (16.8%) |
| 75 Years and over | 11,469 (27.1%) | 18,838 (32.2%) |
Disability Class: Self-Care Difficulty
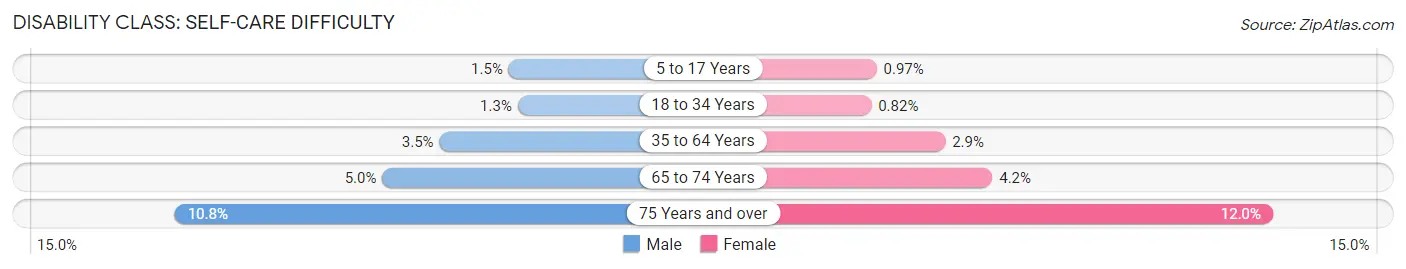
| Age Bracket | Male | Female |
| 5 to 17 Years | 1,920 (1.5%) | 1,164 (1.0%) |
| 18 to 34 Years | 1,892 (1.3%) | 1,382 (0.8%) |
| 35 to 64 Years | 8,531 (3.5%) | 8,074 (2.9%) |
| 65 to 74 Years | 3,791 (5.0%) | 3,662 (4.2%) |
| 75 Years and over | 4,586 (10.8%) | 7,012 (12.0%) |
Technology Access in Area Code 910
Computing Device Access in Area Code 910
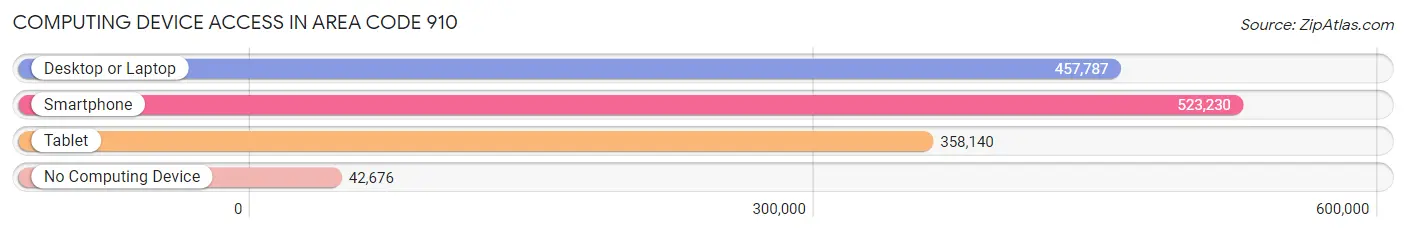
| Device Type | # Households | % Households |
| Desktop or Laptop | 457,787 | 76.3% |
| Smartphone | 523,230 | 87.2% |
| Tablet | 358,140 | 59.7% |
| No Computing Device | 42,676 | 7.1% |
| Total | 600,201 | 100.0% |
Internet Access in Area Code 910
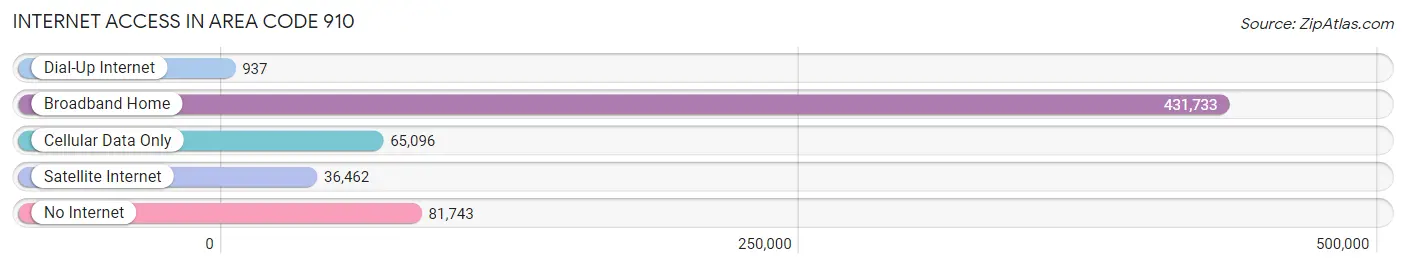
| Internet Type | # Households | % Households |
| Dial-Up Internet | 937 | 0.2% |
| Broadband Home | 431,733 | 71.9% |
| Cellular Data Only | 65,096 | 10.8% |
| Satellite Internet | 36,462 | 6.1% |
| No Internet | 81,743 | 13.6% |
| Total | 600,201 | 100.0% |
Area Code 910 Summary
Geography
Area code 910 is located in the southeastern part of North Carolina. It covers the counties of Bladen, Brunswick, Columbus, Cumberland, Duplin, New Hanover, Onslow, Pender, Robeson, Sampson, and Scotland. It also includes parts of Hoke and Harnett counties.
Social
Area code 910 is home to a diverse population of people from all walks of life. The area is known for its friendly and welcoming atmosphere, and its residents are proud of their heritage and culture.
Economics
Area code 910 is a major economic hub in the region. It is home to a number of large businesses, including the Port of Wilmington, the Wilmington International Airport, and the University of North Carolina at Wilmington. The area also has a thriving tourism industry, with many attractions such as the Cape Fear River, the USS North Carolina Battleship, and the Airlie Gardens.
Demographics
Area code 910 is home to a population of over 1.2 million people. The majority of the population is African American, followed by White, Hispanic, and Asian. The median household income is around $45,000, and the median age is around 35 years old.
Common Questions
What is Per Capita Income in Area Code 910?
Per Capita income in Area Code 910 is $30,002.
What is the Median Family Income in Area Code 910?
Median Family Income in Area Code 910 is $70,714.
What is the Median Household income in Area Code 910?
Median Household Income in Area Code 910 is $57,012.
What is Income or Wage Gap in Area Code 910?
Income or Wage Gap in Area Code 910 is 25.2%.
Women in Area Code 910 earn 74.8 cents for every dollar earned by a man.
What is Family Income Deficit in Area Code 910?
Family Income Deficit in Area Code 910 is $11,408.
Families that are below poverty line in Area Code 910 earn $11,408 less on average than the poverty threshold level.
What is Inequality or Gini Index in Area Code 910?
Inequality or Gini Index in Area Code 910 is 60.07.
What is the Total Population of Area Code 910?
Total Population of Area Code 910 is 1,538,359.
What is the Total Male Population of Area Code 910?
Total Male Population of Area Code 910 is 765,645.
What is the Total Female Population of Area Code 910?
Total Female Population of Area Code 910 is 772,714.
What is the Ratio of Males per 100 Females in Area Code 910?
There are 99.09 Males per 100 Females in Area Code 910.
What is the Ratio of Females per 100 Males in Area Code 910?
There are 100.92 Females per 100 Males in Area Code 910.
What is the Median Population Age in Area Code 910?
Median Population Age in Area Code 910 is 42.0 Years.
What is the Average Family Size in Area Code 910
Average Family Size in Area Code 910 is 3.2 People.
What is the Average Household Size in Area Code 910
Average Household Size in Area Code 910 is 2.6 People.
How Large is the Labor Force in Area Code 910?
There are 698,269 People in the Labor Forcein in Area Code 910.
What is the Percentage of People in the Labor Force in Area Code 910?
56.6% of People are in the Labor Force in Area Code 910.
What is the Unemployment Rate in Area Code 910?
Unemployment Rate in Area Code 910 is 7.3%.