Holly Springs, NC Map & Demographics
Holly Springs Map
Holly Springs Overview
$49,116
PER CAPITA INCOME
$139,203
AVG FAMILY INCOME
$127,755
AVG HOUSEHOLD INCOME
42.3%
WAGE / INCOME GAP [ % ]
57.7¢/ $1
WAGE / INCOME GAP [ $ ]
0.37
INEQUALITY / GINI INDEX
42,023
TOTAL POPULATION
20,303
MALE POPULATION
21,720
FEMALE POPULATION
93.48
MALES / 100 FEMALES
106.98
FEMALES / 100 MALES
35.7
MEDIAN AGE
3.4
AVG FAMILY SIZE
3.1
AVG HOUSEHOLD SIZE
21,788
LABOR FORCE [ PEOPLE ]
73.6%
PERCENT IN LABOR FORCE
3.5%
UNEMPLOYMENT RATE
Holly Springs Zip Codes
Holly Springs Area Codes
Income in Holly Springs
Income Overview in Holly Springs
Per Capita Income in Holly Springs is $49,116, while median incomes of families and households are $139,203 and $127,755 respectively.
| Characteristic | Number | Measure |
| Per Capita Income | 42,023 | $49,116 |
| Median Family Income | 11,242 | $139,203 |
| Mean Family Income | 11,242 | $162,557 |
| Median Household Income | 13,596 | $127,755 |
| Mean Household Income | 13,596 | $149,521 |
| Income Deficit | 11,242 | $0 |
| Wage / Income Gap (%) | 42,023 | 42.32% |
| Wage / Income Gap ($) | 42,023 | 57.68¢ per $1 |
| Gini / Inequality Index | 42,023 | 0.37 |
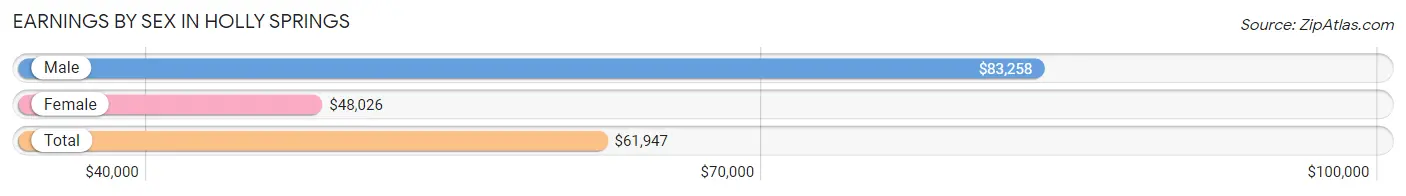
Earnings by Sex in Holly Springs
Average Earnings in Holly Springs are $61,947, $83,258 for men and $48,026 for women, a difference of 42.3%.
| Sex | Number | Average Earnings |
| Male | 12,067 (53.4%) | $83,258 |
| Female | 10,544 (46.6%) | $48,026 |
| Total | 22,611 (100.0%) | $61,947 |
Earnings by Sex by Income Bracket in Holly Springs
The most common earnings brackets in Holly Springs are $100,000+ for men (5,078 | 42.1%) and $100,000+ for women (2,045 | 19.4%).
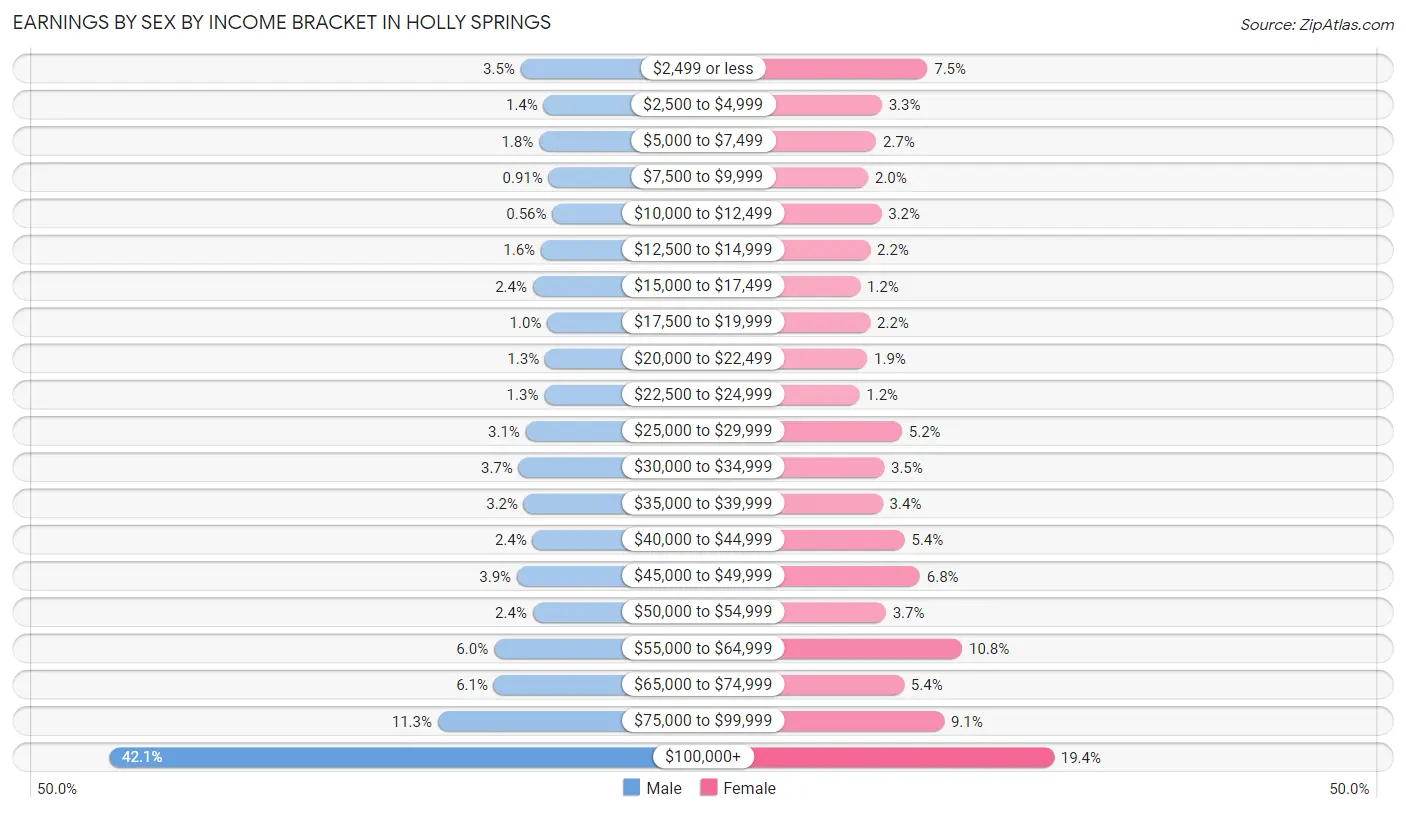
| Income | Male | Female |
| $2,499 or less | 426 (3.5%) | 795 (7.5%) |
| $2,500 to $4,999 | 167 (1.4%) | 345 (3.3%) |
| $5,000 to $7,499 | 218 (1.8%) | 289 (2.7%) |
| $7,500 to $9,999 | 110 (0.9%) | 210 (2.0%) |
| $10,000 to $12,499 | 68 (0.6%) | 341 (3.2%) |
| $12,500 to $14,999 | 197 (1.6%) | 230 (2.2%) |
| $15,000 to $17,499 | 289 (2.4%) | 131 (1.2%) |
| $17,500 to $19,999 | 126 (1.0%) | 230 (2.2%) |
| $20,000 to $22,499 | 151 (1.3%) | 200 (1.9%) |
| $22,500 to $24,999 | 159 (1.3%) | 124 (1.2%) |
| $25,000 to $29,999 | 369 (3.1%) | 544 (5.2%) |
| $30,000 to $34,999 | 449 (3.7%) | 368 (3.5%) |
| $35,000 to $39,999 | 390 (3.2%) | 354 (3.4%) |
| $40,000 to $44,999 | 292 (2.4%) | 570 (5.4%) |
| $45,000 to $49,999 | 468 (3.9%) | 721 (6.8%) |
| $50,000 to $54,999 | 290 (2.4%) | 385 (3.6%) |
| $55,000 to $64,999 | 728 (6.0%) | 1,139 (10.8%) |
| $65,000 to $74,999 | 730 (6.0%) | 564 (5.3%) |
| $75,000 to $99,999 | 1,362 (11.3%) | 959 (9.1%) |
| $100,000+ | 5,078 (42.1%) | 2,045 (19.4%) |
| Total | 12,067 (100.0%) | 10,544 (100.0%) |
Earnings by Sex by Educational Attainment in Holly Springs
Average earnings in Holly Springs are $92,316 for men and $55,287 for women, a difference of 40.1%. Men with an educational attainment of graduate degree enjoy the highest average annual earnings of $115,431, while those with less than high school education earn the least with $38,108. Women with an educational attainment of graduate degree earn the most with the average annual earnings of $62,821, while those with high school diploma education have the smallest earnings of $29,785.
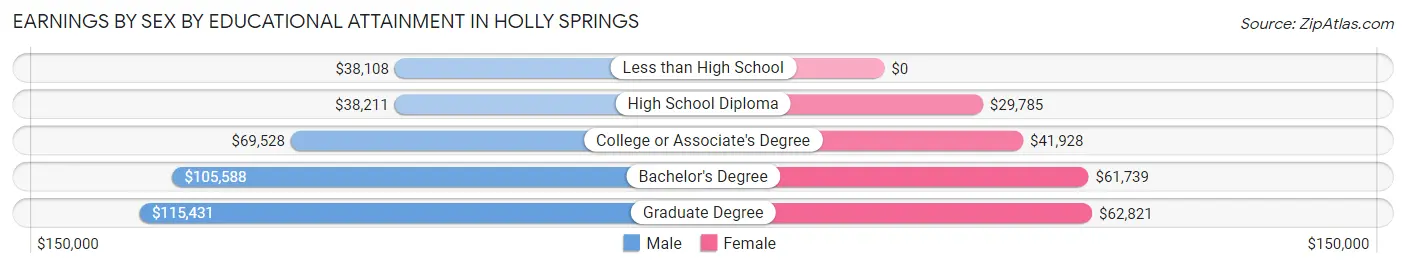
| Educational Attainment | Male Income | Female Income |
| Less than High School | $38,108 | $0 |
| High School Diploma | $38,211 | $29,785 |
| College or Associate's Degree | $69,528 | $41,928 |
| Bachelor's Degree | $105,588 | $61,739 |
| Graduate Degree | $115,431 | $62,821 |
| Total | $92,316 | $55,287 |
Family Income in Holly Springs
Family Income Brackets in Holly Springs
According to the Holly Springs family income data, there are 3,204 families falling into the $100,000 to $149,999 income range, which is the most common income bracket and makes up 28.5% of all families. Conversely, the less than $10,000 income bracket is the least frequent group with only 67 families (0.6%) belonging to this category.
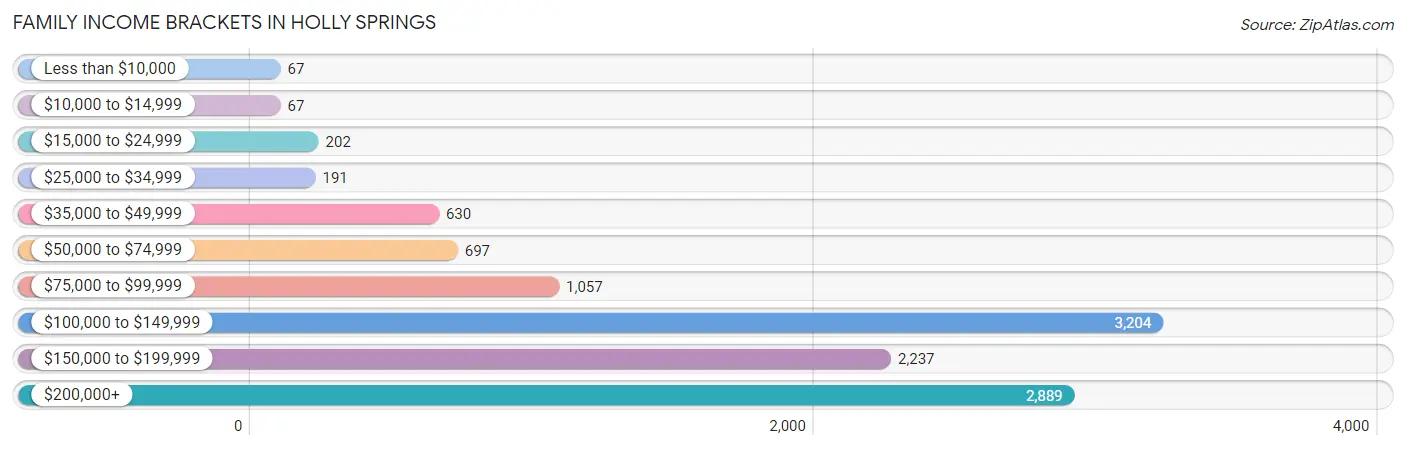
| Income Bracket | # Families | % Families |
| Less than $10,000 | 67 | 0.6% |
| $10,000 to $14,999 | 67 | 0.6% |
| $15,000 to $24,999 | 202 | 1.8% |
| $25,000 to $34,999 | 191 | 1.7% |
| $35,000 to $49,999 | 630 | 5.6% |
| $50,000 to $74,999 | 697 | 6.2% |
| $75,000 to $99,999 | 1,057 | 9.4% |
| $100,000 to $149,999 | 3,204 | 28.5% |
| $150,000 to $199,999 | 2,237 | 19.9% |
| $200,000+ | 2,889 | 25.7% |
Family Income by Famaliy Size in Holly Springs
6-person families (363 | 3.2%) account for the highest median family income in Holly Springs with $191,295 per family, while 2-person families (3,631 | 32.3%) have the highest median income of $58,416 per family member.
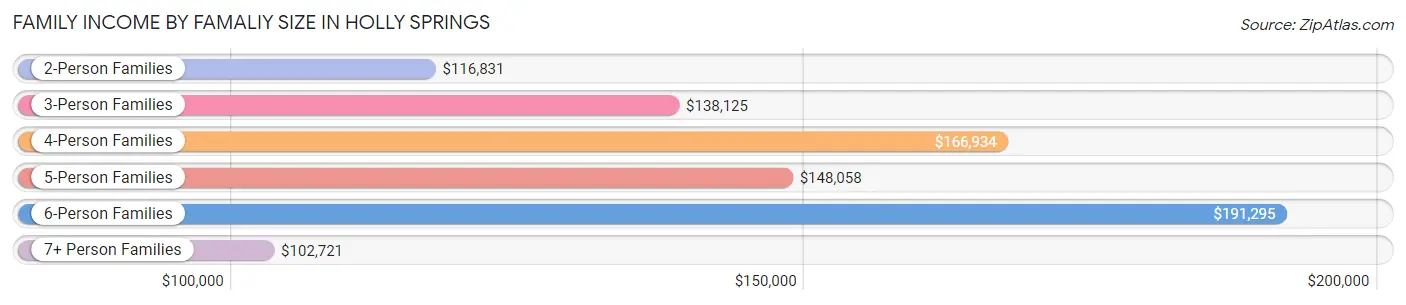
| Income Bracket | # Families | Median Income |
| 2-Person Families | 3,631 (32.3%) | $116,831 |
| 3-Person Families | 2,492 (22.2%) | $138,125 |
| 4-Person Families | 3,294 (29.3%) | $166,934 |
| 5-Person Families | 1,349 (12.0%) | $148,058 |
| 6-Person Families | 363 (3.2%) | $191,295 |
| 7+ Person Families | 113 (1.0%) | $102,721 |
| Total | 11,242 (100.0%) | $139,203 |
Family Income by Number of Earners in Holly Springs
The median family income in Holly Springs is $139,203, with families comprising 3+ earners (1,318) having the highest median family income of $185,577, while families with no earners (692) have the lowest median family income of $52,059, accounting for 11.7% and 6.2% of families, respectively.
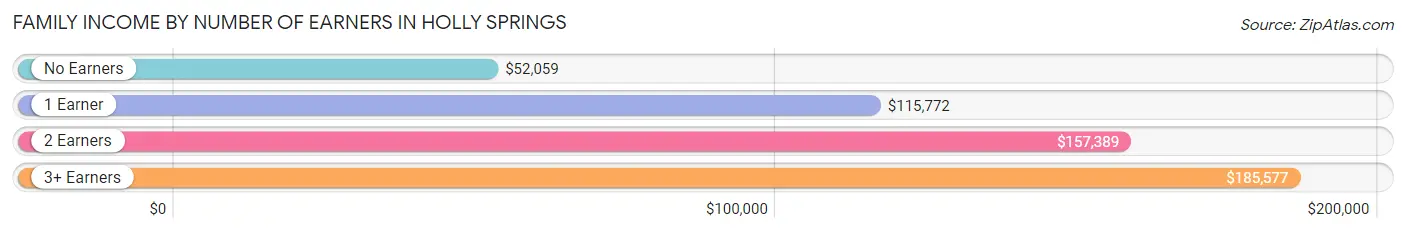
| Number of Earners | # Families | Median Income |
| No Earners | 692 (6.2%) | $52,059 |
| 1 Earner | 3,161 (28.1%) | $115,772 |
| 2 Earners | 6,071 (54.0%) | $157,389 |
| 3+ Earners | 1,318 (11.7%) | $185,577 |
| Total | 11,242 (100.0%) | $139,203 |
Household Income in Holly Springs
Household Income Brackets in Holly Springs
With 3,562 households falling in the category, the $100,000 to $149,999 income range is the most frequent in Holly Springs, accounting for 26.2% of all households. In contrast, only 122 households (0.9%) fall into the $10,000 to $14,999 income bracket, making it the least populous group.
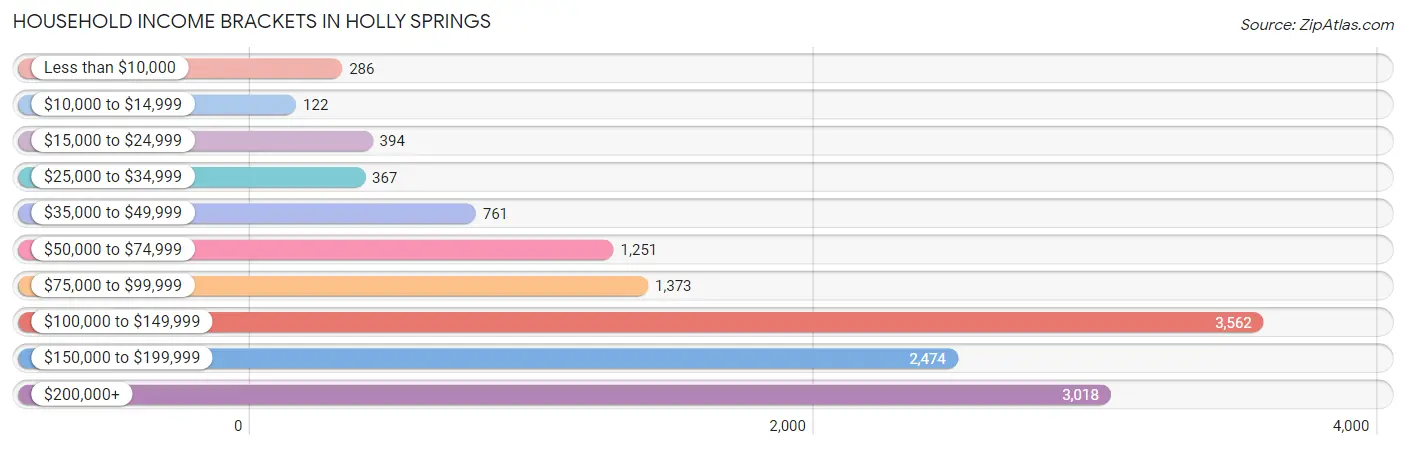
| Income Bracket | # Households | % Households |
| Less than $10,000 | 286 | 2.1% |
| $10,000 to $14,999 | 122 | 0.9% |
| $15,000 to $24,999 | 394 | 2.9% |
| $25,000 to $34,999 | 367 | 2.7% |
| $35,000 to $49,999 | 761 | 5.6% |
| $50,000 to $74,999 | 1,251 | 9.2% |
| $75,000 to $99,999 | 1,373 | 10.1% |
| $100,000 to $149,999 | 3,562 | 26.2% |
| $150,000 to $199,999 | 2,474 | 18.2% |
| $200,000+ | 3,018 | 22.2% |
Household Income by Householder Age in Holly Springs
The median household income in Holly Springs is $127,755, with the highest median household income of $138,076 found in the 25 to 44 years age bracket for the primary householder. A total of 5,760 households (42.4%) fall into this category. Meanwhile, the 15 to 24 years age bracket for the primary householder has the lowest median household income of $24,653, with 79 households (0.6%) in this group.
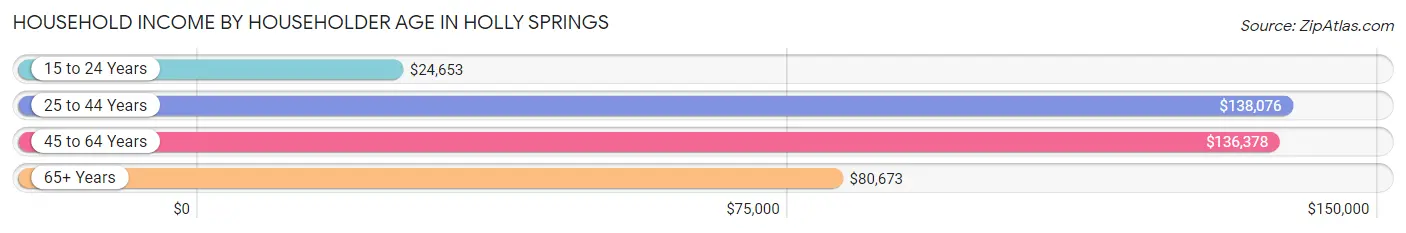
| Income Bracket | # Households | Median Income |
| 15 to 24 Years | 79 (0.6%) | $24,653 |
| 25 to 44 Years | 5,760 (42.4%) | $138,076 |
| 45 to 64 Years | 5,900 (43.4%) | $136,378 |
| 65+ Years | 1,857 (13.7%) | $80,673 |
| Total | 13,596 (100.0%) | $127,755 |
Poverty in Holly Springs
Income Below Poverty by Sex and Age in Holly Springs
With 2.5% poverty level for males and 7.0% for females among the residents of Holly Springs, 65 to 74 year old males and 45 to 54 year old females are the most vulnerable to poverty, with 134 males (12.5%) and 421 females (13.2%) in their respective age groups living below the poverty level.
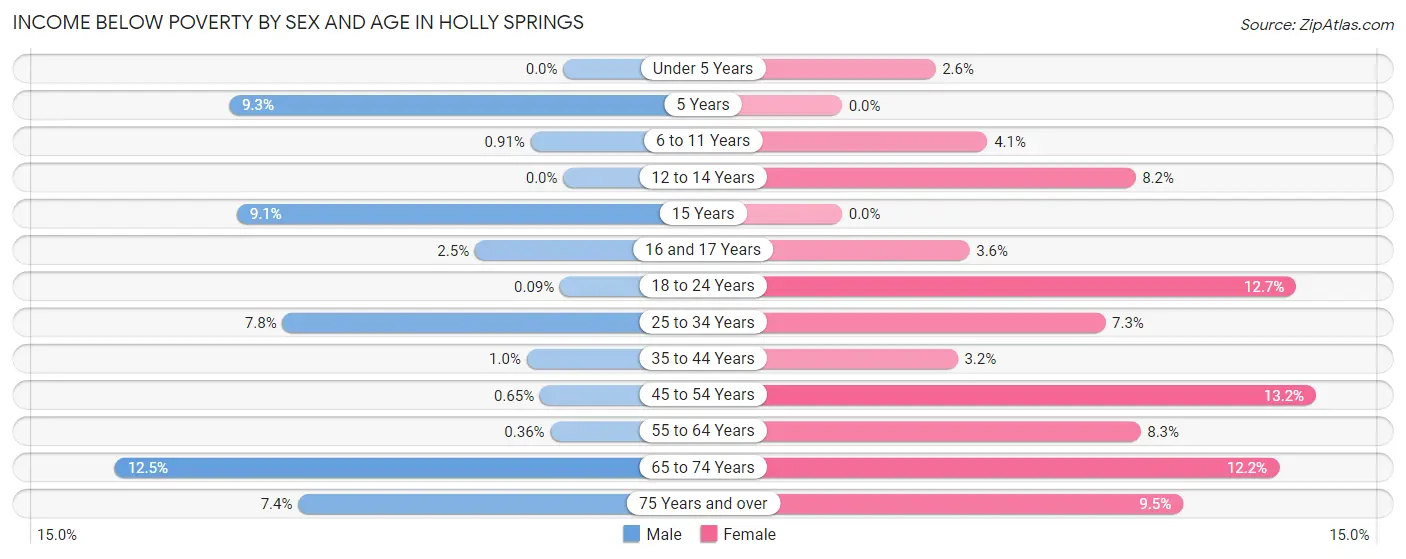
| Age Bracket | Male | Female |
| Under 5 Years | 0 (0.0%) | 37 (2.6%) |
| 5 Years | 35 (9.3%) | 0 (0.0%) |
| 6 to 11 Years | 20 (0.9%) | 113 (4.1%) |
| 12 to 14 Years | 0 (0.0%) | 138 (8.2%) |
| 15 Years | 43 (9.1%) | 0 (0.0%) |
| 16 and 17 Years | 18 (2.5%) | 33 (3.5%) |
| 18 to 24 Years | 1 (0.1%) | 116 (12.7%) |
| 25 to 34 Years | 161 (7.8%) | 178 (7.3%) |
| 35 to 44 Years | 36 (1.0%) | 129 (3.2%) |
| 45 to 54 Years | 23 (0.6%) | 421 (13.2%) |
| 55 to 64 Years | 7 (0.4%) | 156 (8.3%) |
| 65 to 74 Years | 134 (12.5%) | 158 (12.2%) |
| 75 Years and over | 34 (7.4%) | 46 (9.5%) |
| Total | 512 (2.5%) | 1,525 (7.0%) |
Income Above Poverty by Sex and Age in Holly Springs
According to the poverty statistics in Holly Springs, males aged under 5 years and females aged 5 years are the age groups that are most secure financially, with 100.0% of males and 100.0% of females in these age groups living above the poverty line.
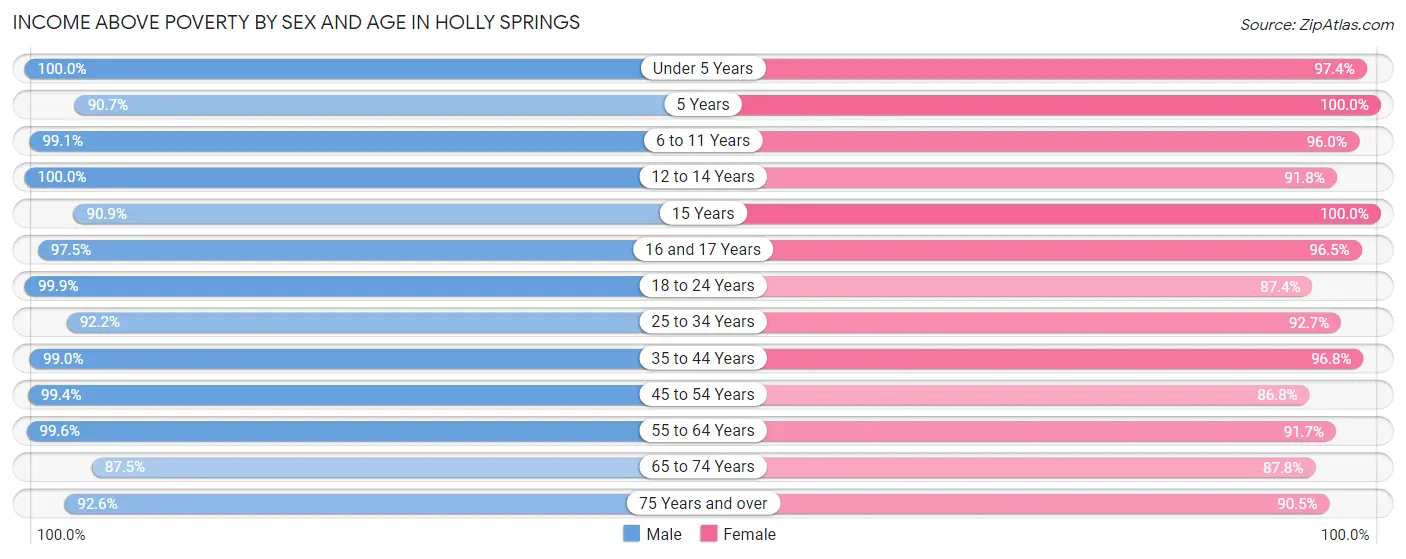
| Age Bracket | Male | Female |
| Under 5 Years | 1,360 (100.0%) | 1,387 (97.4%) |
| 5 Years | 341 (90.7%) | 294 (100.0%) |
| 6 to 11 Years | 2,167 (99.1%) | 2,676 (96.0%) |
| 12 to 14 Years | 1,405 (100.0%) | 1,552 (91.8%) |
| 15 Years | 430 (90.9%) | 333 (100.0%) |
| 16 and 17 Years | 715 (97.5%) | 896 (96.5%) |
| 18 to 24 Years | 1,170 (99.9%) | 801 (87.4%) |
| 25 to 34 Years | 1,897 (92.2%) | 2,249 (92.7%) |
| 35 to 44 Years | 3,480 (99.0%) | 3,872 (96.8%) |
| 45 to 54 Years | 3,506 (99.4%) | 2,768 (86.8%) |
| 55 to 64 Years | 1,932 (99.6%) | 1,722 (91.7%) |
| 65 to 74 Years | 939 (87.5%) | 1,140 (87.8%) |
| 75 Years and over | 427 (92.6%) | 438 (90.5%) |
| Total | 19,769 (97.5%) | 20,128 (93.0%) |
Income Below Poverty Among Married-Couple Families in Holly Springs
The poverty statistics for married-couple families in Holly Springs show that 1.7% or 159 of the total 9,483 families live below the poverty line. Families with no children have the highest poverty rate of 3.4%, comprising of 119 families. On the other hand, families with 3 or 4 children have the lowest poverty rate of 0.0%, which includes 0 families.
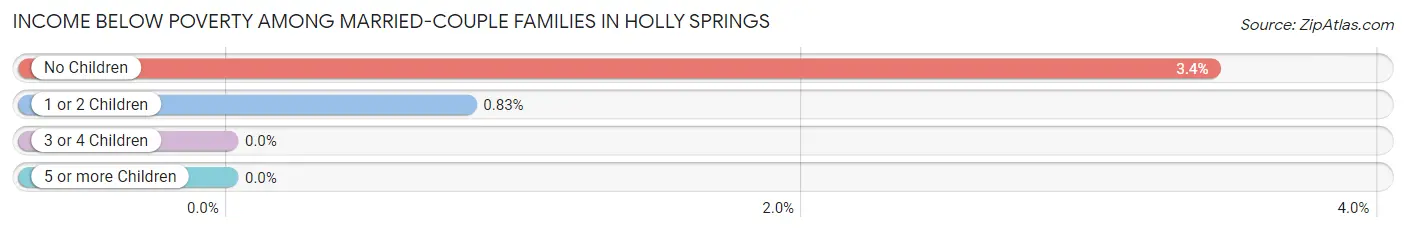
| Children | Above Poverty | Below Poverty |
| No Children | 3,363 (96.6%) | 119 (3.4%) |
| 1 or 2 Children | 4,758 (99.2%) | 40 (0.8%) |
| 3 or 4 Children | 1,108 (100.0%) | 0 (0.0%) |
| 5 or more Children | 95 (100.0%) | 0 (0.0%) |
| Total | 9,324 (98.3%) | 159 (1.7%) |
Income Below Poverty Among Single-Parent Households in Holly Springs
According to the poverty data in Holly Springs, 2.9% or 20 single-father households and 17.4% or 185 single-mother households are living below the poverty line. Among single-father households, those with 1 or 2 children have the highest poverty rate, with 20 households (7.3%) experiencing poverty. Likewise, among single-mother households, those with 3 or 4 children have the highest poverty rate, with 78 households (53.1%) falling below the poverty line.
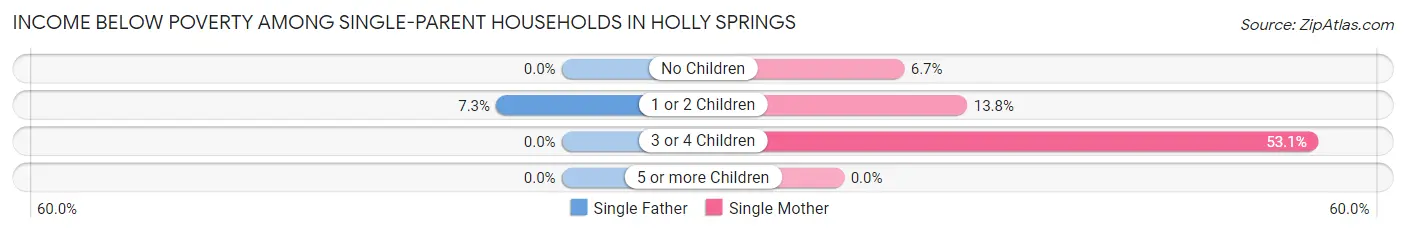
| Children | Single Father | Single Mother |
| No Children | 0 (0.0%) | 18 (6.7%) |
| 1 or 2 Children | 20 (7.3%) | 89 (13.8%) |
| 3 or 4 Children | 0 (0.0%) | 78 (53.1%) |
| 5 or more Children | 0 (0.0%) | 0 (0.0%) |
| Total | 20 (2.9%) | 185 (17.4%) |
Income Below Poverty Among Married-Couple vs Single-Parent Households in Holly Springs
The poverty data for Holly Springs shows that 159 of the married-couple family households (1.7%) and 205 of the single-parent households (11.7%) are living below the poverty level. Within the married-couple family households, those with no children have the highest poverty rate, with 119 households (3.4%) falling below the poverty line. Among the single-parent households, those with 3 or 4 children have the highest poverty rate, with 78 household (18.7%) living below poverty.
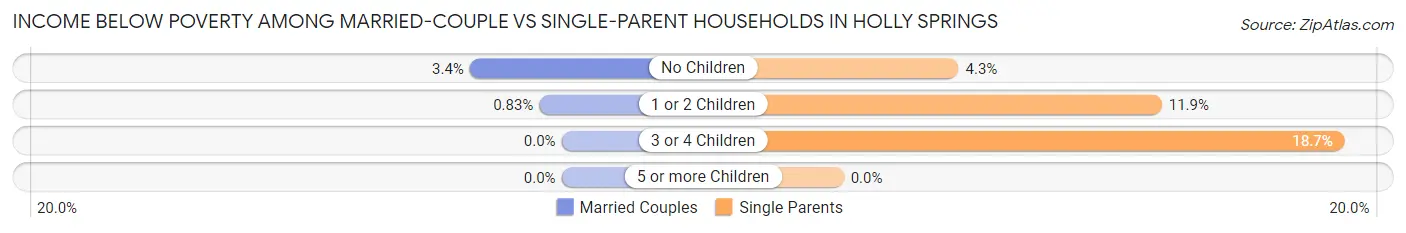
| Children | Married-Couple Families | Single-Parent Households |
| No Children | 119 (3.4%) | 18 (4.3%) |
| 1 or 2 Children | 40 (0.8%) | 109 (11.8%) |
| 3 or 4 Children | 0 (0.0%) | 78 (18.7%) |
| 5 or more Children | 0 (0.0%) | 0 (0.0%) |
| Total | 159 (1.7%) | 205 (11.7%) |
Race in Holly Springs
The most populous races in Holly Springs are White / Caucasian (31,659 | 75.3%), Black / African American (4,024 | 9.6%), and Hispanic or Latino (2,600 | 6.2%).
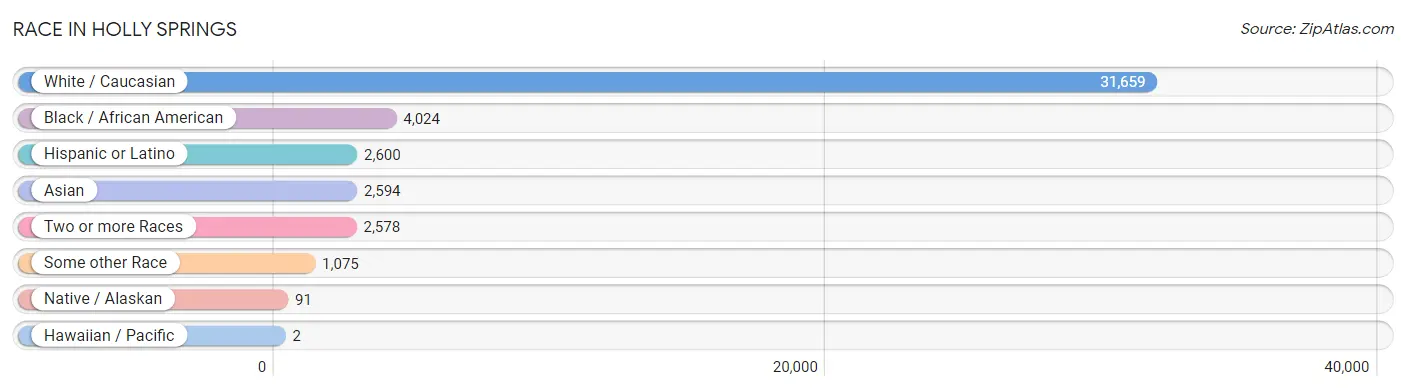
| Race | # Population | % Population |
| Asian | 2,594 | 6.2% |
| Black / African American | 4,024 | 9.6% |
| Hawaiian / Pacific | 2 | 0.0% |
| Hispanic or Latino | 2,600 | 6.2% |
| Native / Alaskan | 91 | 0.2% |
| White / Caucasian | 31,659 | 75.3% |
| Two or more Races | 2,578 | 6.1% |
| Some other Race | 1,075 | 2.6% |
| Total | 42,023 | 100.0% |
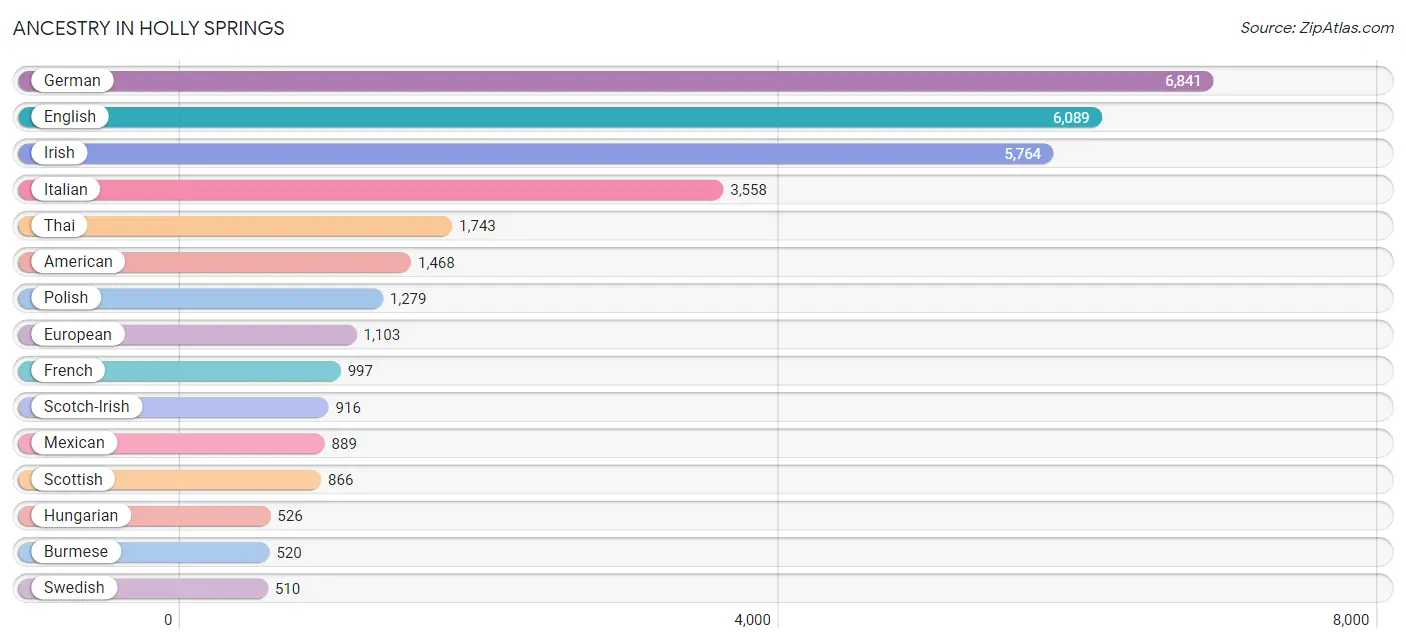
Ancestry in Holly Springs
The most populous ancestries reported in Holly Springs are German (6,841 | 16.3%), English (6,089 | 14.5%), Irish (5,764 | 13.7%), Italian (3,558 | 8.5%), and Thai (1,743 | 4.2%), together accounting for 57.1% of all Holly Springs residents.
| Ancestry | # Population | % Population |
| African | 58 | 0.1% |
| American | 1,468 | 3.5% |
| Apache | 10 | 0.0% |
| Arab | 344 | 0.8% |
| Argentinean | 71 | 0.2% |
| Armenian | 20 | 0.1% |
| Austrian | 116 | 0.3% |
| Belgian | 10 | 0.0% |
| Bhutanese | 216 | 0.5% |
| Blackfeet | 8 | 0.0% |
| Brazilian | 26 | 0.1% |
| British | 254 | 0.6% |
| Burmese | 520 | 1.2% |
| Cajun | 53 | 0.1% |
| Canadian | 67 | 0.2% |
| Celtic | 9 | 0.0% |
| Central American | 232 | 0.5% |
| Cherokee | 81 | 0.2% |
| Chilean | 10 | 0.0% |
| Chinese | 14 | 0.0% |
| Colombian | 268 | 0.6% |
| Costa Rican | 14 | 0.0% |
| Croatian | 9 | 0.0% |
| Cuban | 103 | 0.3% |
| Czech | 145 | 0.4% |
| Czechoslovakian | 12 | 0.0% |
| Danish | 28 | 0.1% |
| Dominican | 108 | 0.3% |
| Dutch | 312 | 0.7% |
| Eastern European | 160 | 0.4% |
| Ecuadorian | 98 | 0.2% |
| Egyptian | 67 | 0.2% |
| English | 6,089 | 14.5% |
| Ethiopian | 196 | 0.5% |
| European | 1,103 | 2.6% |
| Finnish | 9 | 0.0% |
| French | 997 | 2.4% |
| French Canadian | 230 | 0.5% |
| German | 6,841 | 16.3% |
| Greek | 319 | 0.8% |
| Guamanian / Chamorro | 2 | 0.0% |
| Guatemalan | 32 | 0.1% |
| Honduran | 21 | 0.1% |
| Hungarian | 526 | 1.3% |
| Icelander | 14 | 0.0% |
| Indian (Asian) | 496 | 1.2% |
| Iranian | 82 | 0.2% |
| Irish | 5,764 | 13.7% |
| Iroquois | 3 | 0.0% |
| Italian | 3,558 | 8.5% |
| Jamaican | 48 | 0.1% |
| Korean | 206 | 0.5% |
| Laotian | 73 | 0.2% |
| Lebanese | 97 | 0.2% |
| Lithuanian | 23 | 0.1% |
| Lumbee | 92 | 0.2% |
| Macedonian | 60 | 0.1% |
| Mexican | 889 | 2.1% |
| Mongolian | 17 | 0.0% |
| Moroccan | 83 | 0.2% |
| Native Hawaiian | 139 | 0.3% |
| Nicaraguan | 72 | 0.2% |
| Nigerian | 9 | 0.0% |
| Norwegian | 462 | 1.1% |
| Pakistani | 9 | 0.0% |
| Palestinian | 18 | 0.0% |
| Panamanian | 57 | 0.1% |
| Peruvian | 47 | 0.1% |
| Polish | 1,279 | 3.0% |
| Portuguese | 139 | 0.3% |
| Potawatomi | 20 | 0.1% |
| Puerto Rican | 308 | 0.7% |
| Romanian | 48 | 0.1% |
| Russian | 441 | 1.1% |
| Salvadoran | 36 | 0.1% |
| Scandinavian | 83 | 0.2% |
| Scotch-Irish | 916 | 2.2% |
| Scottish | 866 | 2.1% |
| Serbian | 99 | 0.2% |
| Slavic | 81 | 0.2% |
| Slovak | 181 | 0.4% |
| Slovene | 27 | 0.1% |
| South African | 65 | 0.2% |
| South American | 494 | 1.2% |
| Spaniard | 167 | 0.4% |
| Spanish | 68 | 0.2% |
| Sri Lankan | 124 | 0.3% |
| Subsaharan African | 345 | 0.8% |
| Swedish | 510 | 1.2% |
| Swiss | 192 | 0.5% |
| Thai | 1,743 | 4.2% |
| Turkish | 64 | 0.2% |
| Ukrainian | 44 | 0.1% |
| Welsh | 330 | 0.8% |
| Yugoslavian | 8 | 0.0% | View All 95 Rows |
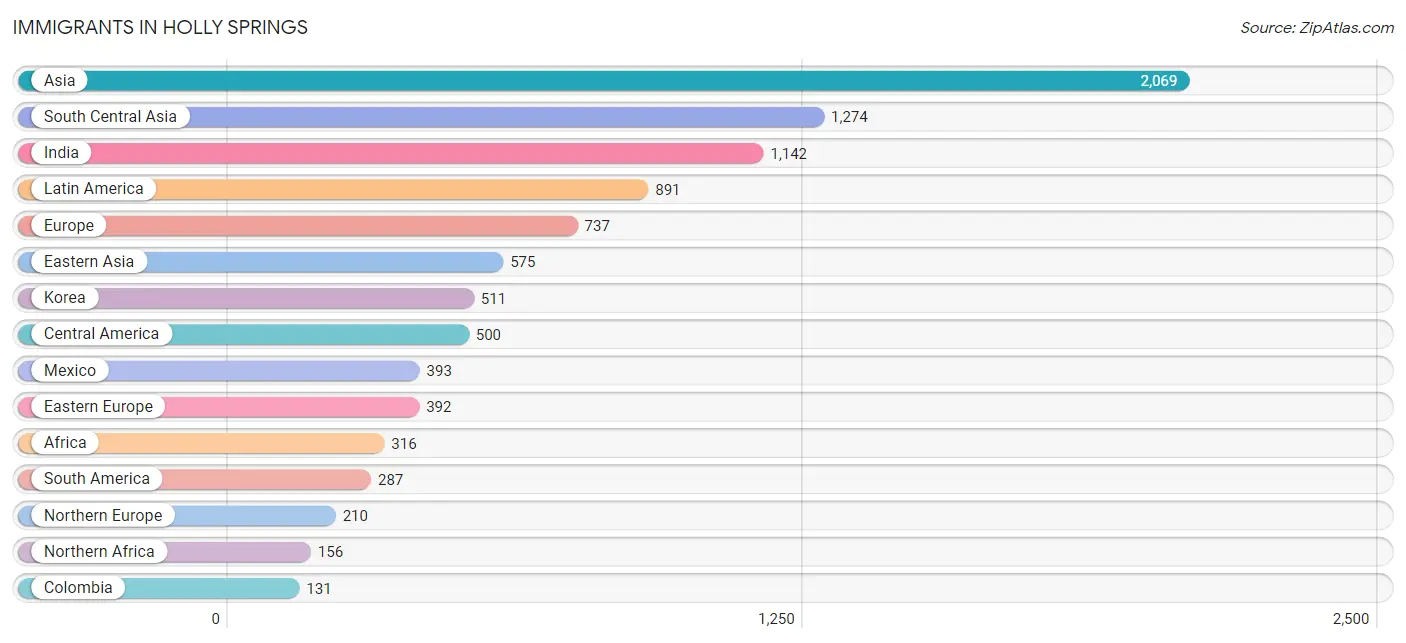
Immigrants in Holly Springs
The most numerous immigrant groups reported in Holly Springs came from Asia (2,069 | 4.9%), South Central Asia (1,274 | 3.0%), India (1,142 | 2.7%), Latin America (891 | 2.1%), and Europe (737 | 1.8%), together accounting for 14.5% of all Holly Springs residents.
| Immigration Origin | # Population | % Population |
| Africa | 316 | 0.7% |
| Argentina | 17 | 0.0% |
| Asia | 2,069 | 4.9% |
| Austria | 24 | 0.1% |
| Bangladesh | 10 | 0.0% |
| Bosnia and Herzegovina | 72 | 0.2% |
| Brazil | 36 | 0.1% |
| Canada | 92 | 0.2% |
| Caribbean | 104 | 0.3% |
| Central America | 500 | 1.2% |
| Chile | 10 | 0.0% |
| China | 51 | 0.1% |
| Colombia | 131 | 0.3% |
| Congo | 20 | 0.1% |
| Cuba | 31 | 0.1% |
| Denmark | 8 | 0.0% |
| Dominican Republic | 9 | 0.0% |
| Eastern Africa | 93 | 0.2% |
| Eastern Asia | 575 | 1.4% |
| Eastern Europe | 392 | 0.9% |
| Ecuador | 23 | 0.1% |
| Egypt | 70 | 0.2% |
| El Salvador | 25 | 0.1% |
| England | 25 | 0.1% |
| Ethiopia | 93 | 0.2% |
| Europe | 737 | 1.8% |
| Germany | 41 | 0.1% |
| Greece | 17 | 0.0% |
| Honduras | 21 | 0.1% |
| India | 1,142 | 2.7% |
| Indonesia | 37 | 0.1% |
| Iran | 48 | 0.1% |
| Iraq | 13 | 0.0% |
| Ireland | 12 | 0.0% |
| Italy | 21 | 0.1% |
| Jamaica | 54 | 0.1% |
| Japan | 13 | 0.0% |
| Korea | 511 | 1.2% |
| Kuwait | 36 | 0.1% |
| Laos | 18 | 0.0% |
| Latin America | 891 | 2.1% |
| Mexico | 393 | 0.9% |
| Middle Africa | 20 | 0.1% |
| Morocco | 86 | 0.2% |
| Nepal | 35 | 0.1% |
| Netherlands | 11 | 0.0% |
| Nicaragua | 24 | 0.1% |
| Northern Africa | 156 | 0.4% |
| Northern Europe | 210 | 0.5% |
| Pakistan | 14 | 0.0% |
| Panama | 37 | 0.1% |
| Peru | 47 | 0.1% |
| Poland | 59 | 0.1% |
| Romania | 32 | 0.1% |
| Russia | 124 | 0.3% |
| South Africa | 23 | 0.1% |
| South America | 287 | 0.7% |
| South Central Asia | 1,274 | 3.0% |
| South Eastern Asia | 118 | 0.3% |
| Southern Europe | 59 | 0.1% |
| Spain | 21 | 0.1% |
| Trinidad and Tobago | 10 | 0.0% |
| Turkey | 18 | 0.0% |
| Ukraine | 105 | 0.3% |
| Venezuela | 23 | 0.1% |
| Vietnam | 63 | 0.2% |
| Western Africa | 7 | 0.0% |
| Western Asia | 102 | 0.2% |
| Western Europe | 76 | 0.2% | View All 69 Rows |
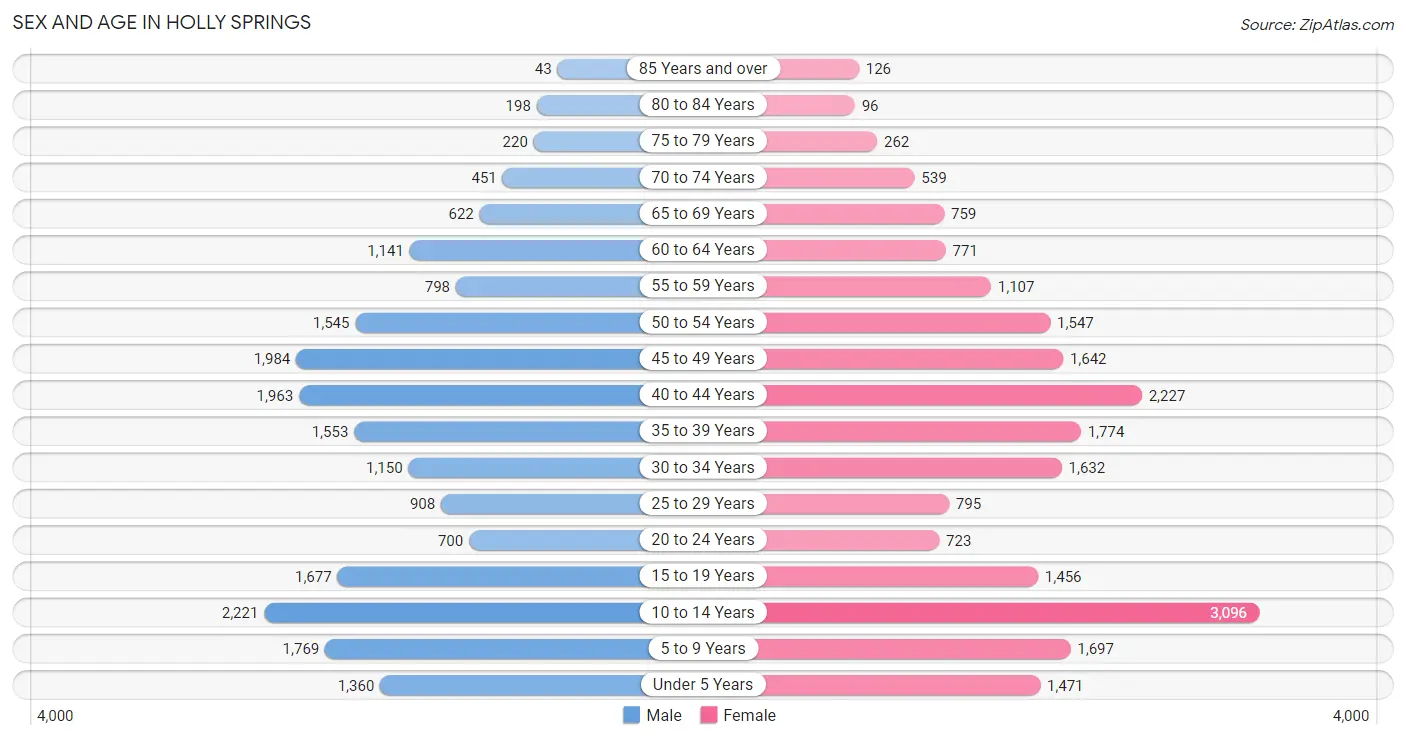
Sex and Age in Holly Springs
Sex and Age in Holly Springs
The most populous age groups in Holly Springs are 10 to 14 Years (2,221 | 10.9%) for men and 10 to 14 Years (3,096 | 14.2%) for women.
| Age Bracket | Male | Female |
| Under 5 Years | 1,360 (6.7%) | 1,471 (6.8%) |
| 5 to 9 Years | 1,769 (8.7%) | 1,697 (7.8%) |
| 10 to 14 Years | 2,221 (10.9%) | 3,096 (14.2%) |
| 15 to 19 Years | 1,677 (8.3%) | 1,456 (6.7%) |
| 20 to 24 Years | 700 (3.5%) | 723 (3.3%) |
| 25 to 29 Years | 908 (4.5%) | 795 (3.7%) |
| 30 to 34 Years | 1,150 (5.7%) | 1,632 (7.5%) |
| 35 to 39 Years | 1,553 (7.6%) | 1,774 (8.2%) |
| 40 to 44 Years | 1,963 (9.7%) | 2,227 (10.2%) |
| 45 to 49 Years | 1,984 (9.8%) | 1,642 (7.6%) |
| 50 to 54 Years | 1,545 (7.6%) | 1,547 (7.1%) |
| 55 to 59 Years | 798 (3.9%) | 1,107 (5.1%) |
| 60 to 64 Years | 1,141 (5.6%) | 771 (3.5%) |
| 65 to 69 Years | 622 (3.1%) | 759 (3.5%) |
| 70 to 74 Years | 451 (2.2%) | 539 (2.5%) |
| 75 to 79 Years | 220 (1.1%) | 262 (1.2%) |
| 80 to 84 Years | 198 (1.0%) | 96 (0.4%) |
| 85 Years and over | 43 (0.2%) | 126 (0.6%) |
| Total | 20,303 (100.0%) | 21,720 (100.0%) |
Families and Households in Holly Springs
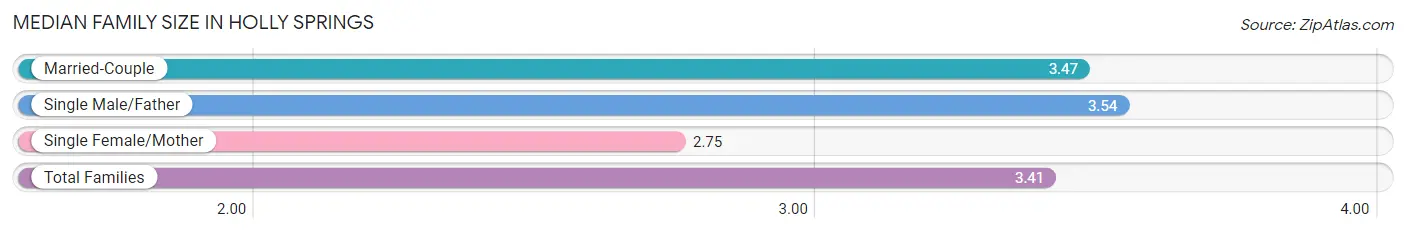
Median Family Size in Holly Springs
The median family size in Holly Springs is 3.41 persons per family, with single male/father families (697 | 6.2%) accounting for the largest median family size of 3.54 persons per family. On the other hand, single female/mother families (1,062 | 9.5%) represent the smallest median family size with 2.75 persons per family.
| Family Type | # Families | Family Size |
| Married-Couple | 9,483 (84.4%) | 3.47 |
| Single Male/Father | 697 (6.2%) | 3.54 |
| Single Female/Mother | 1,062 (9.5%) | 2.75 |
| Total Families | 11,242 (100.0%) | 3.41 |
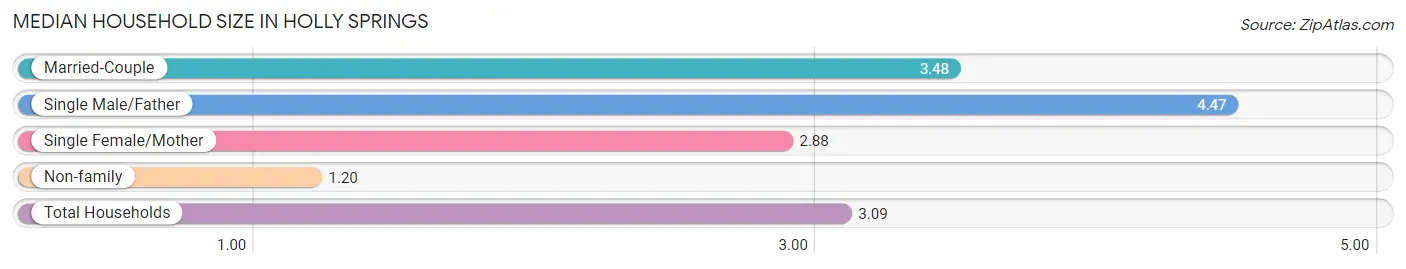
Median Household Size in Holly Springs
The median household size in Holly Springs is 3.09 persons per household, with single male/father households (697 | 5.1%) accounting for the largest median household size of 4.47 persons per household. non-family households (2,354 | 17.3%) represent the smallest median household size with 1.20 persons per household.
| Household Type | # Households | Household Size |
| Married-Couple | 9,483 (69.8%) | 3.48 |
| Single Male/Father | 697 (5.1%) | 4.47 |
| Single Female/Mother | 1,062 (7.8%) | 2.88 |
| Non-family | 2,354 (17.3%) | 1.20 |
| Total Households | 13,596 (100.0%) | 3.09 |
Household Size by Marriage Status in Holly Springs
Out of a total of 13,596 households in Holly Springs, 11,242 (82.7%) are family households, while 2,354 (17.3%) are nonfamily households. The most numerous type of family households are 2-person households, comprising 3,381, and the most common type of nonfamily households are 1-person households, comprising 1,976.
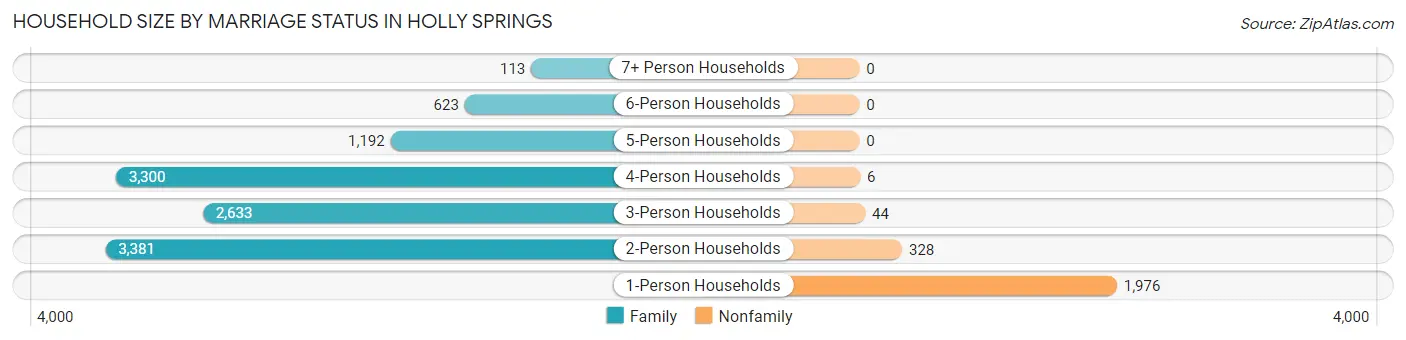
| Household Size | Family Households | Nonfamily Households |
| 1-Person Households | - | 1,976 (14.5%) |
| 2-Person Households | 3,381 (24.9%) | 328 (2.4%) |
| 3-Person Households | 2,633 (19.4%) | 44 (0.3%) |
| 4-Person Households | 3,300 (24.3%) | 6 (0.0%) |
| 5-Person Households | 1,192 (8.8%) | 0 (0.0%) |
| 6-Person Households | 623 (4.6%) | 0 (0.0%) |
| 7+ Person Households | 113 (0.8%) | 0 (0.0%) |
| Total | 11,242 (82.7%) | 2,354 (17.3%) |
Female Fertility in Holly Springs
Fertility by Age in Holly Springs
Average fertility rate in Holly Springs is 37.0 births per 1,000 women. Women in the age bracket of 20 to 34 years have the highest fertility rate with 71.0 births per 1,000 women. Women in the age bracket of 20 to 34 years acount for 58.4% of all women with births.
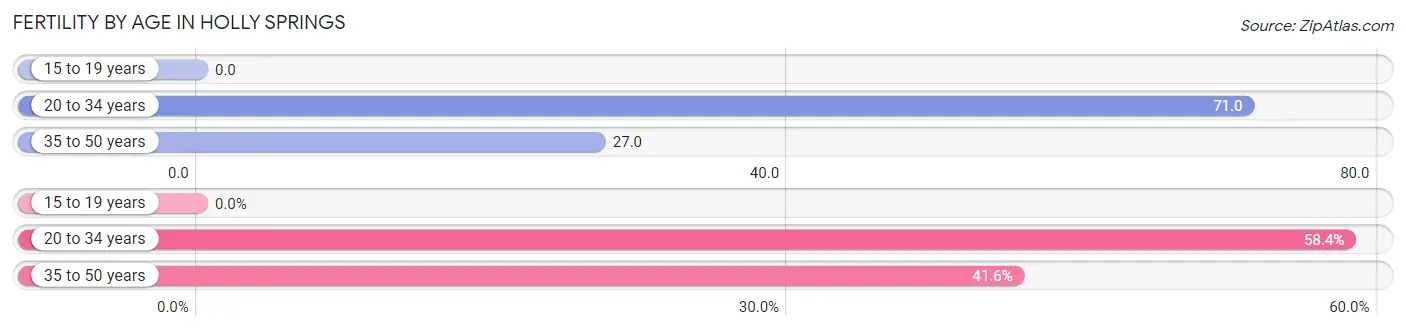
| Age Bracket | Women with Births | Births / 1,000 Women |
| 15 to 19 years | 0 (0.0%) | 0.0 |
| 20 to 34 years | 225 (58.4%) | 71.0 |
| 35 to 50 years | 160 (41.6%) | 27.0 |
| Total | 385 (100.0%) | 37.0 |
Fertility by Age by Marriage Status in Holly Springs
95.1% of women with births (385) in Holly Springs are married. The highest percentage of unmarried women with births falls into 20 to 34 years age bracket with 8.4% of them unmarried at the time of birth, while the lowest percentage of unmarried women with births belong to 35 to 50 years age bracket with 0.0% of them unmarried.
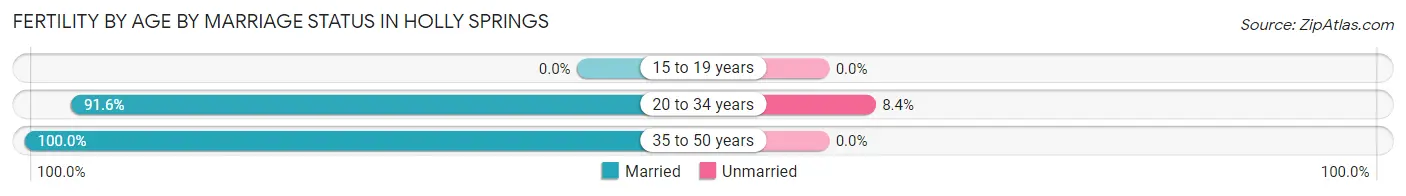
| Age Bracket | Married | Unmarried |
| 15 to 19 years | 0 (0.0%) | 0 (0.0%) |
| 20 to 34 years | 206 (91.6%) | 19 (8.4%) |
| 35 to 50 years | 160 (100.0%) | 0 (0.0%) |
| Total | 366 (95.1%) | 19 (4.9%) |
Fertility by Education in Holly Springs
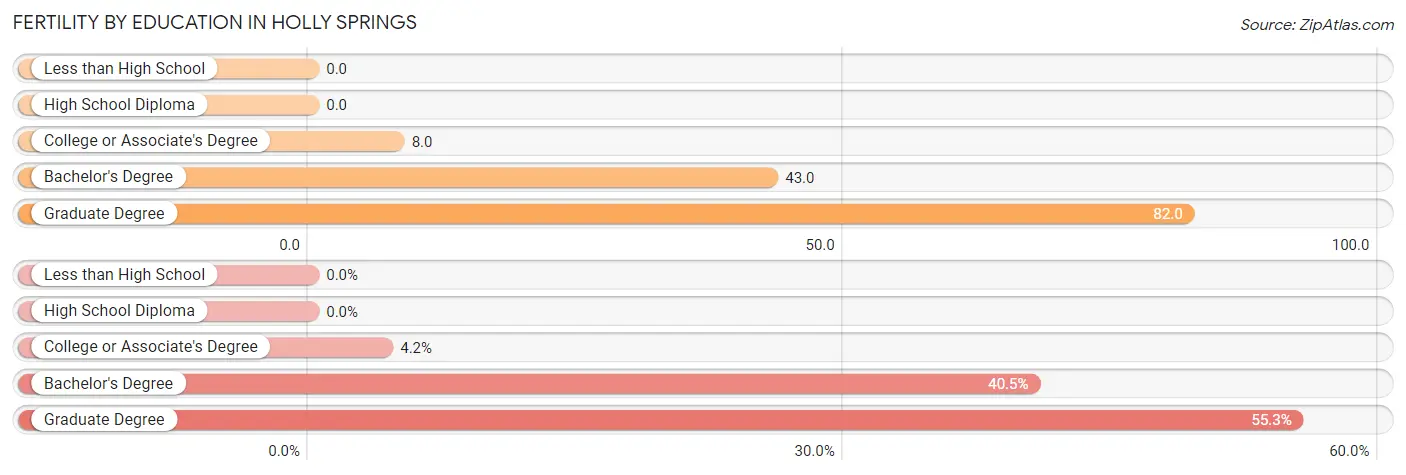
| Educational Attainment | Women with Births | Births / 1,000 Women |
| Less than High School | 0 (0.0%) | 0.0 |
| High School Diploma | 0 (0.0%) | 0.0 |
| College or Associate's Degree | 16 (4.2%) | 8.0 |
| Bachelor's Degree | 156 (40.5%) | 43.0 |
| Graduate Degree | 213 (55.3%) | 82.0 |
| Total | 385 (100.0%) | 37.0 |
Fertility by Education by Marriage Status in Holly Springs
4.9% of women with births in Holly Springs are unmarried. Women with the educational attainment of college or associate's degree are most likely to be married with 100.0% of them married at childbirth, while women with the educational attainment of bachelor's degree are least likely to be married with 12.2% of them unmarried at childbirth.
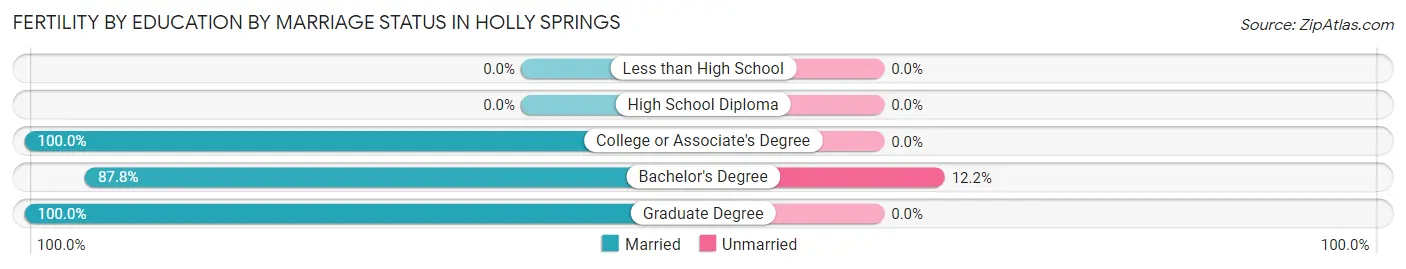
| Educational Attainment | Married | Unmarried |
| Less than High School | 0 (0.0%) | 0 (0.0%) |
| High School Diploma | 0 (0.0%) | 0 (0.0%) |
| College or Associate's Degree | 16 (100.0%) | 0 (0.0%) |
| Bachelor's Degree | 137 (87.8%) | 19 (12.2%) |
| Graduate Degree | 213 (100.0%) | 0 (0.0%) |
| Total | 366 (95.1%) | 19 (4.9%) |
Employment Characteristics in Holly Springs
Employment by Class of Employer in Holly Springs
Among the 20,799 employed individuals in Holly Springs, private company employees (14,324 | 68.9%), local government employees (1,626 | 7.8%), and not-for-profit organizations (1,343 | 6.5%) make up the most common classes of employment.
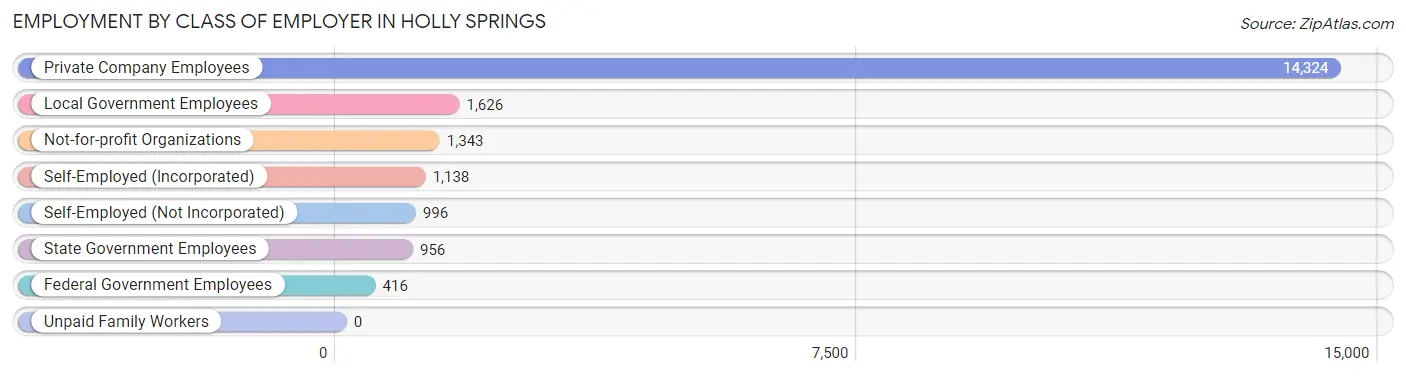
| Employer Class | # Employees | % Employees |
| Private Company Employees | 14,324 | 68.9% |
| Self-Employed (Incorporated) | 1,138 | 5.5% |
| Self-Employed (Not Incorporated) | 996 | 4.8% |
| Not-for-profit Organizations | 1,343 | 6.5% |
| Local Government Employees | 1,626 | 7.8% |
| State Government Employees | 956 | 4.6% |
| Federal Government Employees | 416 | 2.0% |
| Unpaid Family Workers | 0 | 0.0% |
| Total | 20,799 | 100.0% |
Employment Status by Age in Holly Springs
According to the labor force statistics for Holly Springs, out of the total population over 16 years of age (29,603), 73.6% or 21,788 individuals are in the labor force, with 3.5% or 763 of them unemployed. The age group with the highest labor force participation rate is 55 to 59 years, with 91.5% or 1,743 individuals in the labor force. Within the labor force, the 20 to 24 years age range has the highest percentage of unemployed individuals, with 12.7% or 146 of them being unemployed.
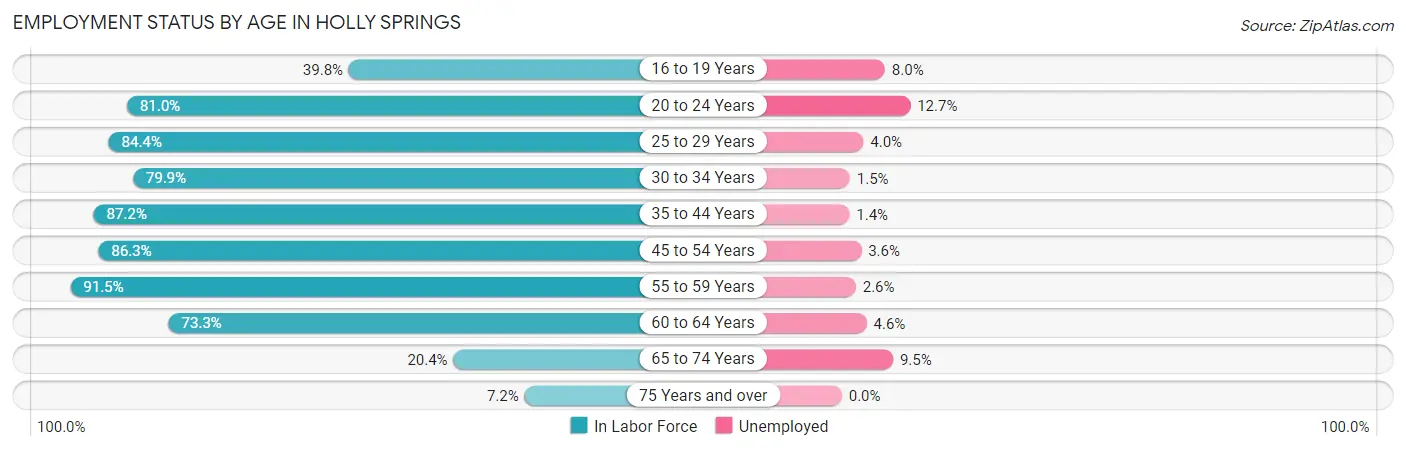
| Age Bracket | In Labor Force | Unemployed |
| 16 to 19 Years | 926 (39.8%) | 74 (8.0%) |
| 20 to 24 Years | 1,153 (81.0%) | 146 (12.7%) |
| 25 to 29 Years | 1,437 (84.4%) | 57 (4.0%) |
| 30 to 34 Years | 2,223 (79.9%) | 33 (1.5%) |
| 35 to 44 Years | 6,555 (87.2%) | 92 (1.4%) |
| 45 to 54 Years | 5,798 (86.3%) | 209 (3.6%) |
| 55 to 59 Years | 1,743 (91.5%) | 45 (2.6%) |
| 60 to 64 Years | 1,401 (73.3%) | 64 (4.6%) |
| 65 to 74 Years | 484 (20.4%) | 46 (9.5%) |
| 75 Years and over | 68 (7.2%) | 0 (0.0%) |
| Total | 21,788 (73.6%) | 763 (3.5%) |
Employment Status by Educational Attainment in Holly Springs
According to labor force statistics for Holly Springs, 85.0% of individuals (19,156) out of the total population between 25 and 64 years of age (22,537) are in the labor force, with 2.6% or 498 of them being unemployed. The group with the highest labor force participation rate are those with the educational attainment of bachelor's degree or higher, with 88.2% or 13,189 individuals in the labor force. Within the labor force, individuals with less than high school education have the highest percentage of unemployment, with 21.9% or 68 of them being unemployed.
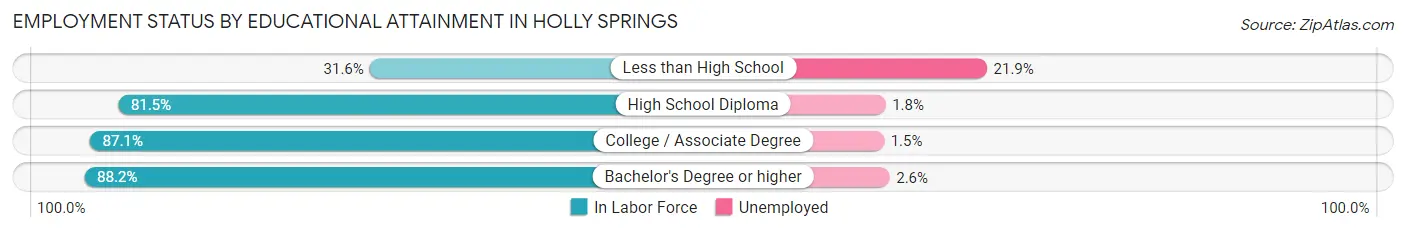
| Educational Attainment | In Labor Force | Unemployed |
| Less than High School | 311 (31.6%) | 215 (21.9%) |
| High School Diploma | 1,367 (81.5%) | 30 (1.8%) |
| College / Associate Degree | 4,288 (87.1%) | 74 (1.5%) |
| Bachelor's Degree or higher | 13,189 (88.2%) | 389 (2.6%) |
| Total | 19,156 (85.0%) | 586 (2.6%) |
Employment Occupations by Sex in Holly Springs
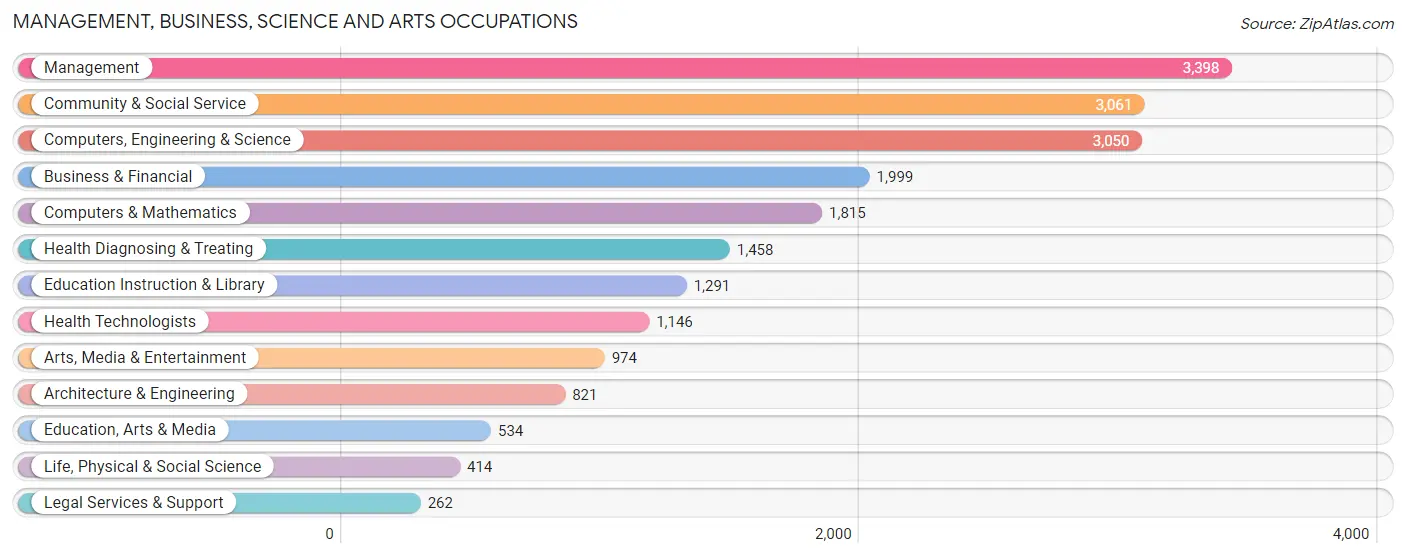
Management, Business, Science and Arts Occupations
The most common Management, Business, Science and Arts occupations in Holly Springs are Management (3,398 | 16.2%), Community & Social Service (3,061 | 14.6%), Computers, Engineering & Science (3,050 | 14.6%), Business & Financial (1,999 | 9.6%), and Computers & Mathematics (1,815 | 8.7%).
Management, Business, Science and Arts Occupations by Sex
Within the Management, Business, Science and Arts occupations in Holly Springs, the most male-oriented occupations are Computers & Mathematics (78.0%), Architecture & Engineering (77.7%), and Computers, Engineering & Science (76.4%), while the most female-oriented occupations are Health Diagnosing & Treating (82.9%), Education Instruction & Library (82.2%), and Health Technologists (79.1%).
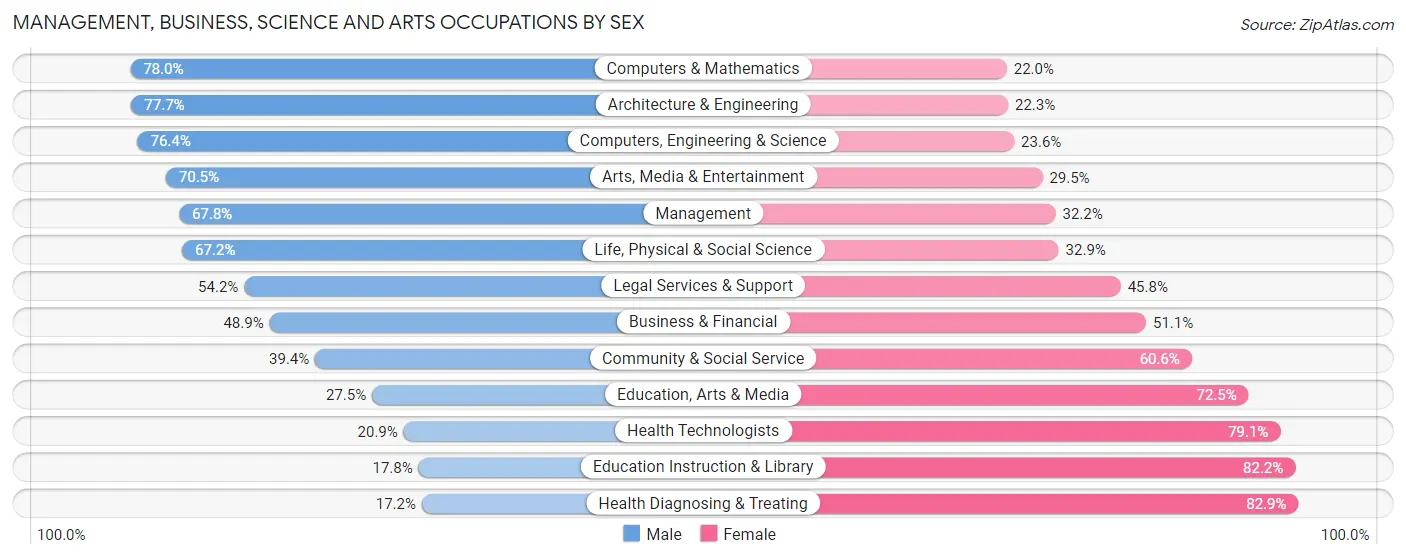
| Occupation | Male | Female |
| Management | 2,304 (67.8%) | 1,094 (32.2%) |
| Business & Financial | 978 (48.9%) | 1,021 (51.1%) |
| Computers, Engineering & Science | 2,331 (76.4%) | 719 (23.6%) |
| Computers & Mathematics | 1,415 (78.0%) | 400 (22.0%) |
| Architecture & Engineering | 638 (77.7%) | 183 (22.3%) |
| Life, Physical & Social Science | 278 (67.1%) | 136 (32.9%) |
| Community & Social Service | 1,206 (39.4%) | 1,855 (60.6%) |
| Education, Arts & Media | 147 (27.5%) | 387 (72.5%) |
| Legal Services & Support | 142 (54.2%) | 120 (45.8%) |
| Education Instruction & Library | 230 (17.8%) | 1,061 (82.2%) |
| Arts, Media & Entertainment | 687 (70.5%) | 287 (29.5%) |
| Health Diagnosing & Treating | 250 (17.2%) | 1,208 (82.9%) |
| Health Technologists | 240 (20.9%) | 906 (79.1%) |
| Total (Category) | 7,069 (54.5%) | 5,897 (45.5%) |
| Total (Overall) | 11,389 (54.4%) | 9,552 (45.6%) |
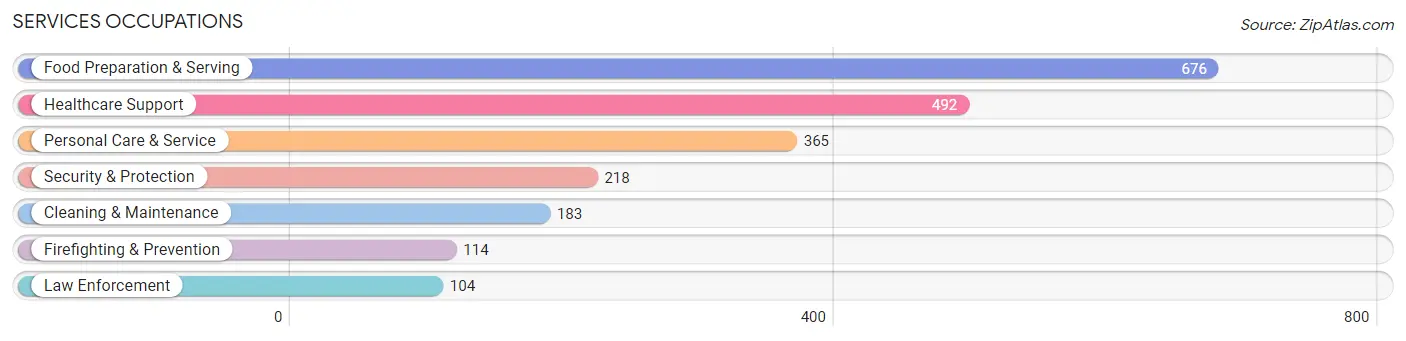
Services Occupations
The most common Services occupations in Holly Springs are Food Preparation & Serving (676 | 3.2%), Healthcare Support (492 | 2.4%), Personal Care & Service (365 | 1.7%), Security & Protection (218 | 1.0%), and Cleaning & Maintenance (183 | 0.9%).
Services Occupations by Sex
Within the Services occupations in Holly Springs, the most male-oriented occupations are Security & Protection (100.0%), Firefighting & Prevention (100.0%), and Law Enforcement (100.0%), while the most female-oriented occupations are Healthcare Support (94.5%), Personal Care & Service (91.2%), and Food Preparation & Serving (40.7%).
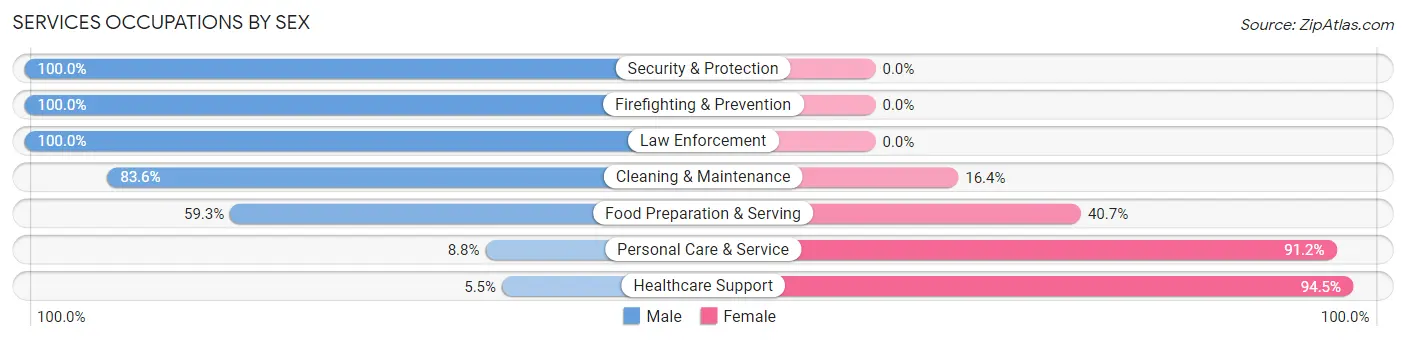
| Occupation | Male | Female |
| Healthcare Support | 27 (5.5%) | 465 (94.5%) |
| Security & Protection | 218 (100.0%) | 0 (0.0%) |
| Firefighting & Prevention | 114 (100.0%) | 0 (0.0%) |
| Law Enforcement | 104 (100.0%) | 0 (0.0%) |
| Food Preparation & Serving | 401 (59.3%) | 275 (40.7%) |
| Cleaning & Maintenance | 153 (83.6%) | 30 (16.4%) |
| Personal Care & Service | 32 (8.8%) | 333 (91.2%) |
| Total (Category) | 831 (43.0%) | 1,103 (57.0%) |
| Total (Overall) | 11,389 (54.4%) | 9,552 (45.6%) |
Sales and Office Occupations
The most common Sales and Office occupations in Holly Springs are Sales & Related (2,164 | 10.3%), and Office & Administration (1,755 | 8.4%).
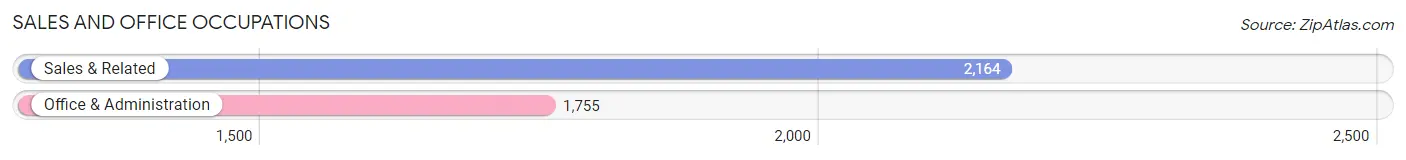
Sales and Office Occupations by Sex
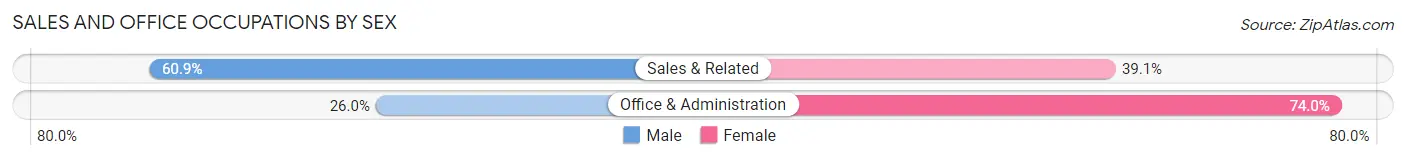
| Occupation | Male | Female |
| Sales & Related | 1,317 (60.9%) | 847 (39.1%) |
| Office & Administration | 456 (26.0%) | 1,299 (74.0%) |
| Total (Category) | 1,773 (45.2%) | 2,146 (54.8%) |
| Total (Overall) | 11,389 (54.4%) | 9,552 (45.6%) |
Natural Resources, Construction and Maintenance Occupations
The most common Natural Resources, Construction and Maintenance occupations in Holly Springs are Construction & Extraction (363 | 1.7%), and Installation, Maintenance & Repair (185 | 0.9%).
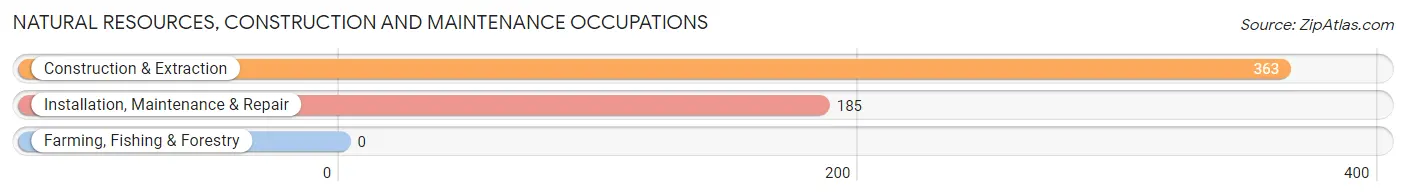
Natural Resources, Construction and Maintenance Occupations by Sex
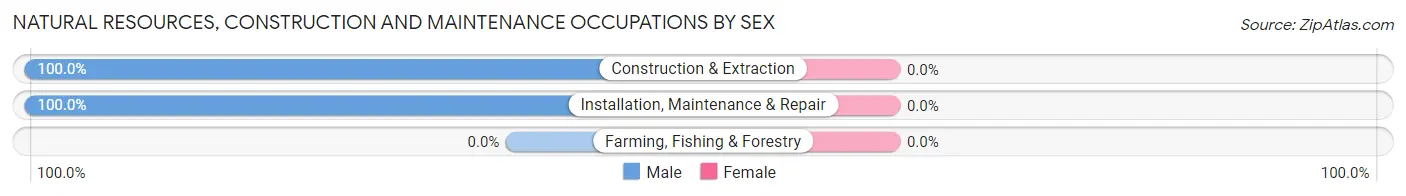
| Occupation | Male | Female |
| Farming, Fishing & Forestry | 0 (0.0%) | 0 (0.0%) |
| Construction & Extraction | 363 (100.0%) | 0 (0.0%) |
| Installation, Maintenance & Repair | 185 (100.0%) | 0 (0.0%) |
| Total (Category) | 548 (100.0%) | 0 (0.0%) |
| Total (Overall) | 11,389 (54.4%) | 9,552 (45.6%) |
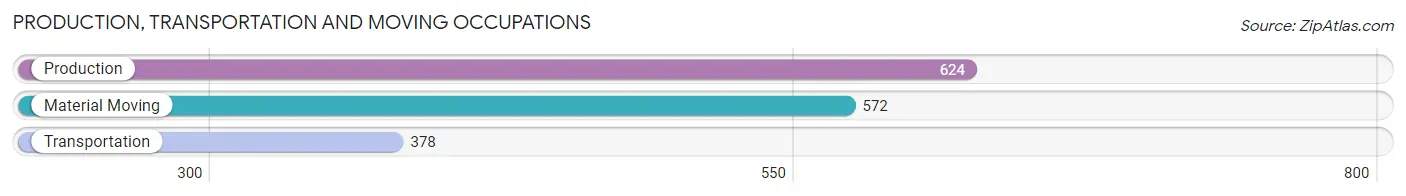
Production, Transportation and Moving Occupations
The most common Production, Transportation and Moving occupations in Holly Springs are Production (624 | 3.0%), Material Moving (572 | 2.7%), and Transportation (378 | 1.8%).
Production, Transportation and Moving Occupations by Sex
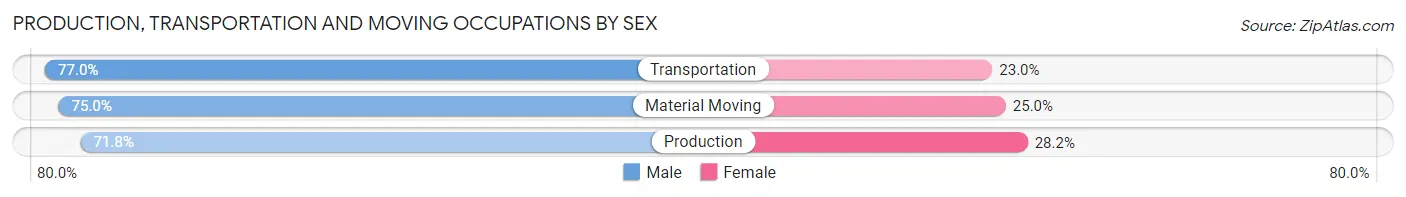
| Occupation | Male | Female |
| Production | 448 (71.8%) | 176 (28.2%) |
| Transportation | 291 (77.0%) | 87 (23.0%) |
| Material Moving | 429 (75.0%) | 143 (25.0%) |
| Total (Category) | 1,168 (74.2%) | 406 (25.8%) |
| Total (Overall) | 11,389 (54.4%) | 9,552 (45.6%) |
Employment Industries by Sex in Holly Springs
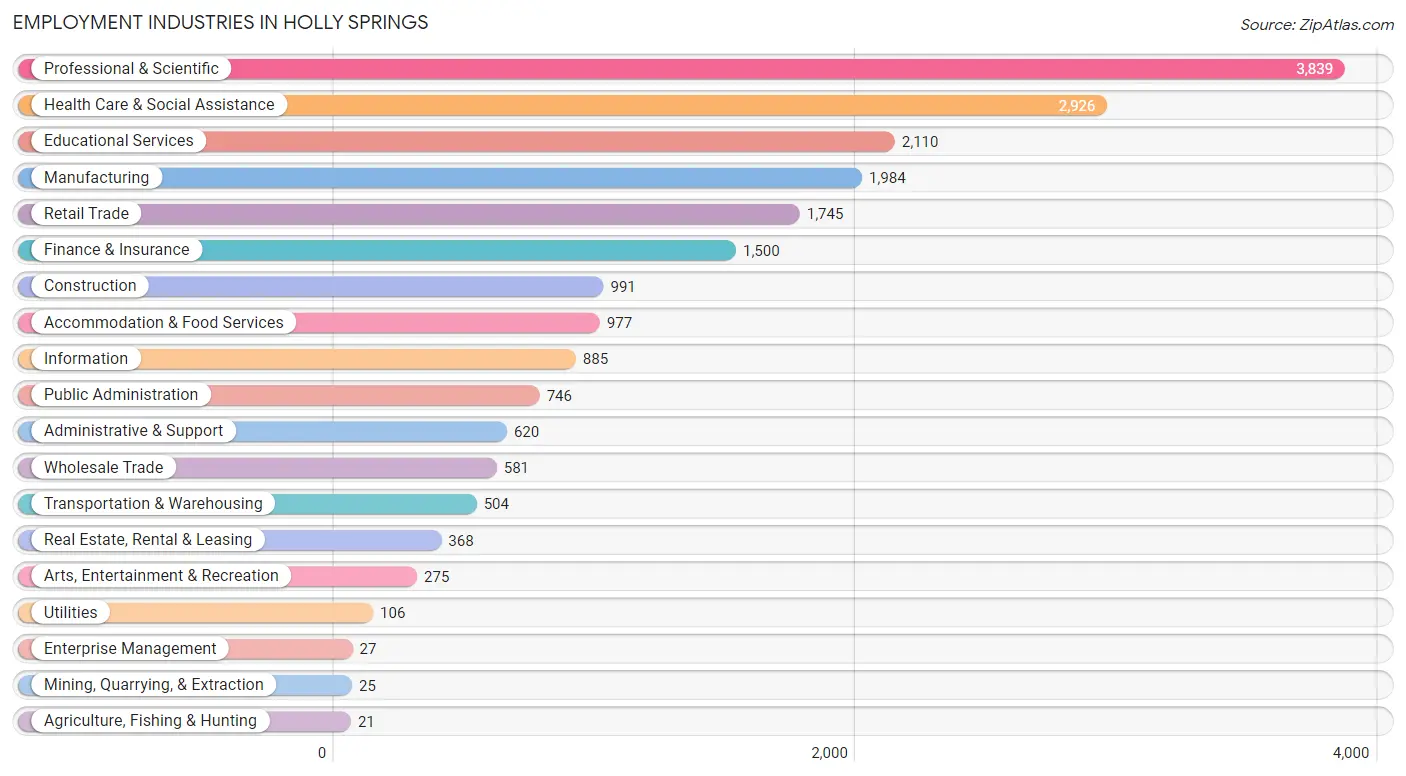
Employment Industries in Holly Springs
The major employment industries in Holly Springs include Professional & Scientific (3,839 | 18.3%), Health Care & Social Assistance (2,926 | 14.0%), Educational Services (2,110 | 10.1%), Manufacturing (1,984 | 9.5%), and Retail Trade (1,745 | 8.3%).
Employment Industries by Sex in Holly Springs
The Holly Springs industries that see more men than women are Mining, Quarrying, & Extraction (100.0%), Enterprise Management (100.0%), and Information (95.5%), whereas the industries that tend to have a higher number of women are Agriculture, Fishing & Hunting (100.0%), Health Care & Social Assistance (73.4%), and Educational Services (67.9%).
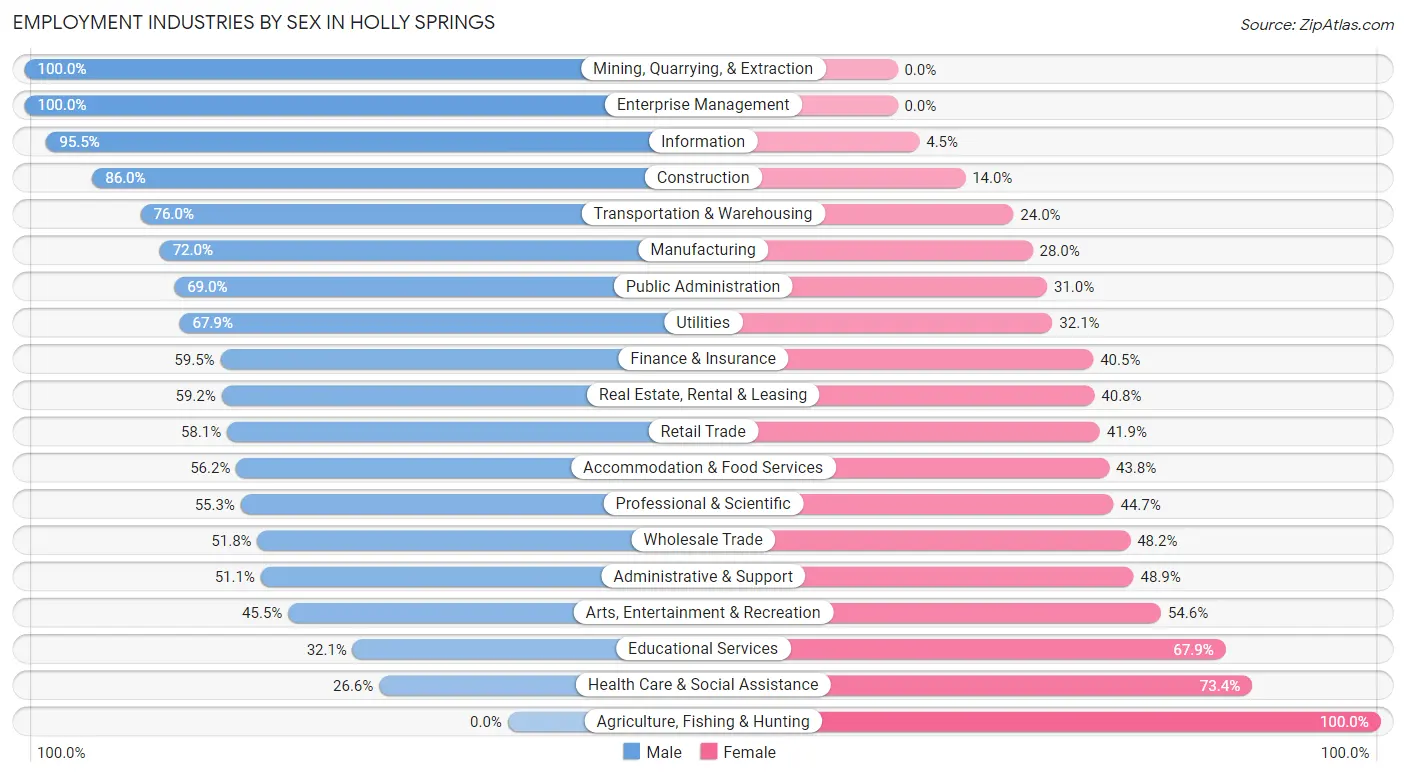
| Industry | Male | Female |
| Agriculture, Fishing & Hunting | 0 (0.0%) | 21 (100.0%) |
| Mining, Quarrying, & Extraction | 25 (100.0%) | 0 (0.0%) |
| Construction | 852 (86.0%) | 139 (14.0%) |
| Manufacturing | 1,429 (72.0%) | 555 (28.0%) |
| Wholesale Trade | 301 (51.8%) | 280 (48.2%) |
| Retail Trade | 1,014 (58.1%) | 731 (41.9%) |
| Transportation & Warehousing | 383 (76.0%) | 121 (24.0%) |
| Utilities | 72 (67.9%) | 34 (32.1%) |
| Information | 845 (95.5%) | 40 (4.5%) |
| Finance & Insurance | 892 (59.5%) | 608 (40.5%) |
| Real Estate, Rental & Leasing | 218 (59.2%) | 150 (40.8%) |
| Professional & Scientific | 2,122 (55.3%) | 1,717 (44.7%) |
| Enterprise Management | 27 (100.0%) | 0 (0.0%) |
| Administrative & Support | 317 (51.1%) | 303 (48.9%) |
| Educational Services | 677 (32.1%) | 1,433 (67.9%) |
| Health Care & Social Assistance | 779 (26.6%) | 2,147 (73.4%) |
| Arts, Entertainment & Recreation | 125 (45.5%) | 150 (54.5%) |
| Accommodation & Food Services | 549 (56.2%) | 428 (43.8%) |
| Public Administration | 515 (69.0%) | 231 (31.0%) |
| Total | 11,389 (54.4%) | 9,552 (45.6%) |
Education in Holly Springs
School Enrollment in Holly Springs
The most common levels of schooling among the 13,811 students in Holly Springs are middle school (4,187 | 30.3%), high school (2,932 | 21.2%), and elementary school (2,877 | 20.8%).
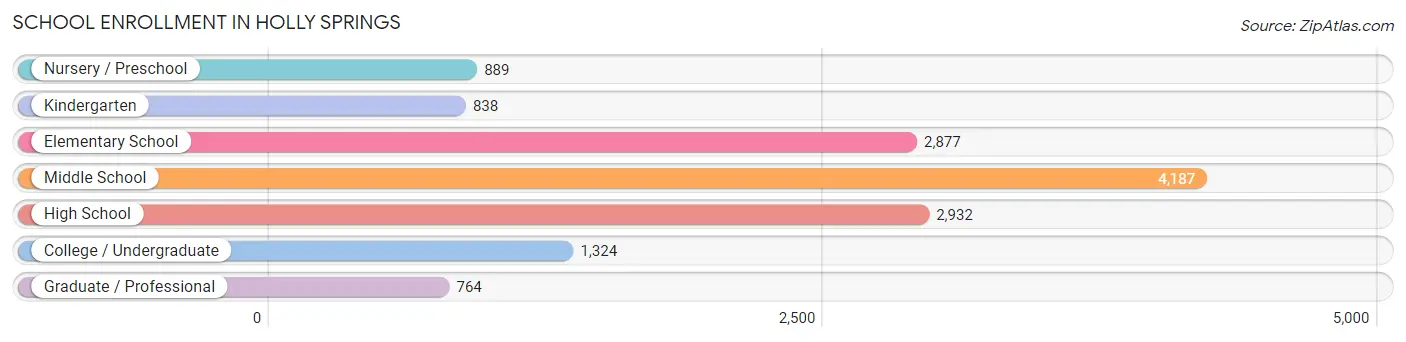
| School Level | # Students | % Students |
| Nursery / Preschool | 889 | 6.4% |
| Kindergarten | 838 | 6.1% |
| Elementary School | 2,877 | 20.8% |
| Middle School | 4,187 | 30.3% |
| High School | 2,932 | 21.2% |
| College / Undergraduate | 1,324 | 9.6% |
| Graduate / Professional | 764 | 5.5% |
| Total | 13,811 | 100.0% |
School Enrollment by Age by Funding Source in Holly Springs
Out of a total of 13,811 students who are enrolled in schools in Holly Springs, 1,630 (11.8%) attend a private institution, while the remaining 12,181 (88.2%) are enrolled in public schools. The age group of 3 to 4 year olds has the highest likelihood of being enrolled in private schools, with 527 (74.3% in the age bracket) enrolled. Conversely, the age group of 10 to 14 year olds has the lowest likelihood of being enrolled in a private school, with 4,994 (94.9% in the age bracket) attending a public institution.
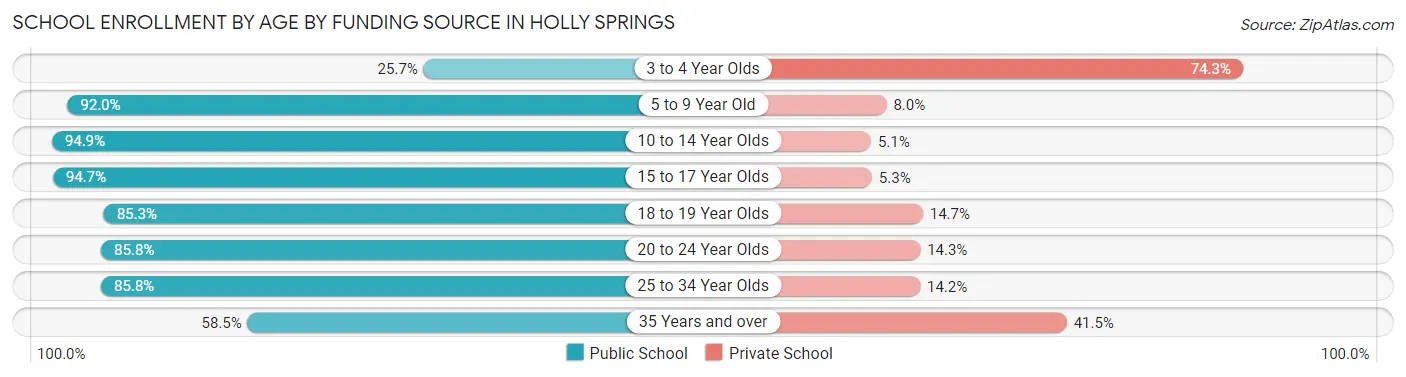
| Age Bracket | Public School | Private School |
| 3 to 4 Year Olds | 182 (25.7%) | 527 (74.3%) |
| 5 to 9 Year Old | 3,070 (92.0%) | 266 (8.0%) |
| 10 to 14 Year Olds | 4,994 (94.9%) | 267 (5.1%) |
| 15 to 17 Year Olds | 2,088 (94.7%) | 116 (5.3%) |
| 18 to 19 Year Olds | 486 (85.3%) | 84 (14.7%) |
| 20 to 24 Year Olds | 608 (85.8%) | 101 (14.2%) |
| 25 to 34 Year Olds | 476 (85.8%) | 79 (14.2%) |
| 35 Years and over | 273 (58.5%) | 194 (41.5%) |
| Total | 12,181 (88.2%) | 1,630 (11.8%) |
Educational Attainment by Field of Study in Holly Springs
Business (3,320 | 18.3%), education (1,823 | 10.0%), engineering (1,746 | 9.6%), science & technology (1,490 | 8.2%), and computers & mathematics (1,372 | 7.5%) are the most common fields of study among 18,184 individuals in Holly Springs who have obtained a bachelor's degree or higher.
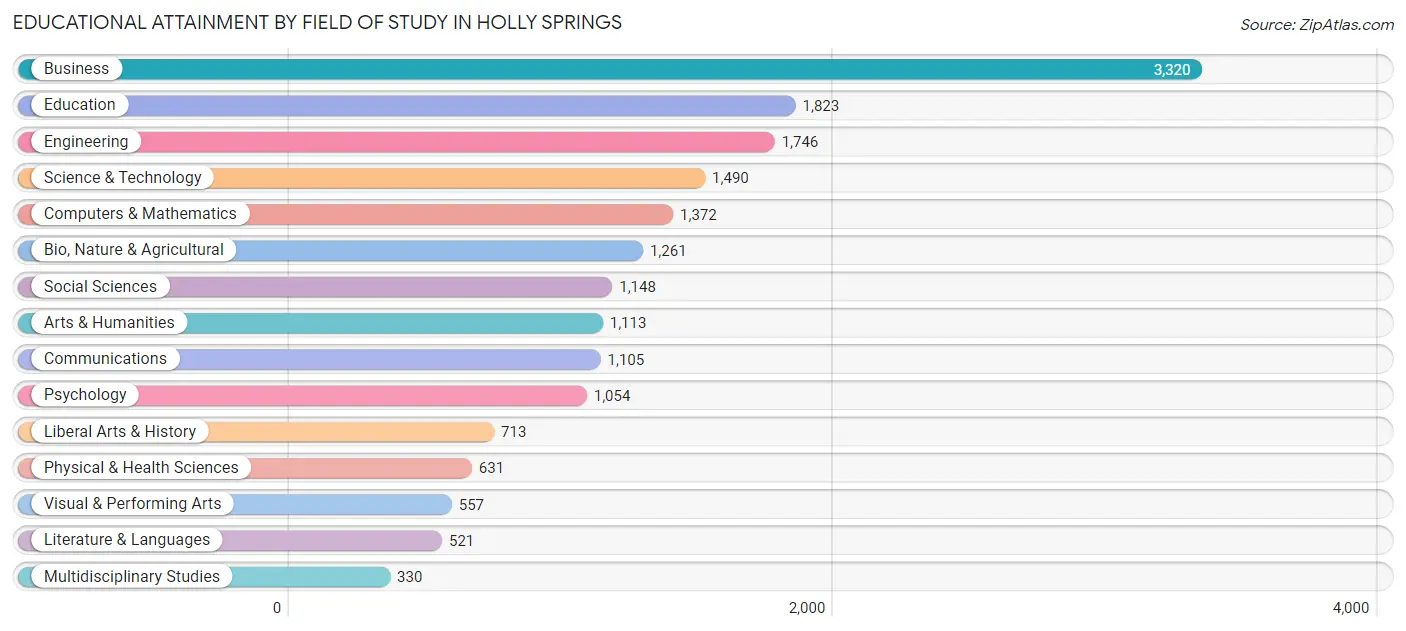
| Field of Study | # Graduates | % Graduates |
| Computers & Mathematics | 1,372 | 7.5% |
| Bio, Nature & Agricultural | 1,261 | 6.9% |
| Physical & Health Sciences | 631 | 3.5% |
| Psychology | 1,054 | 5.8% |
| Social Sciences | 1,148 | 6.3% |
| Engineering | 1,746 | 9.6% |
| Multidisciplinary Studies | 330 | 1.8% |
| Science & Technology | 1,490 | 8.2% |
| Business | 3,320 | 18.3% |
| Education | 1,823 | 10.0% |
| Literature & Languages | 521 | 2.9% |
| Liberal Arts & History | 713 | 3.9% |
| Visual & Performing Arts | 557 | 3.1% |
| Communications | 1,105 | 6.1% |
| Arts & Humanities | 1,113 | 6.1% |
| Total | 18,184 | 100.0% |
Transportation & Commute in Holly Springs
Vehicle Availability by Sex in Holly Springs
The most prevalent vehicle ownership categories in Holly Springs are males with 2 vehicles (5,990, accounting for 52.8%) and females with 2 vehicles (4,836, making up 63.4%).
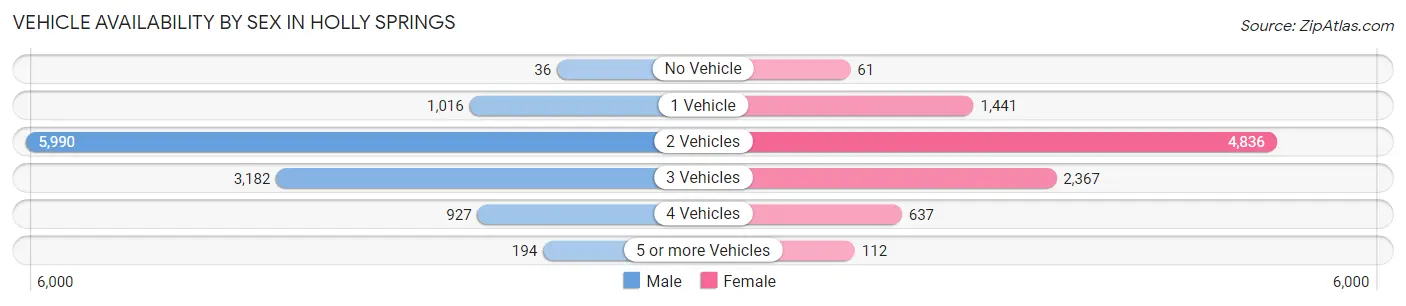
| Vehicles Available | Male | Female |
| No Vehicle | 36 (0.3%) | 61 (0.6%) |
| 1 Vehicle | 1,016 (9.0%) | 1,441 (15.2%) |
| 2 Vehicles | 5,990 (52.8%) | 4,836 (51.1%) |
| 3 Vehicles | 3,182 (28.1%) | 2,367 (25.0%) |
| 4 Vehicles | 927 (8.2%) | 637 (6.7%) |
| 5 or more Vehicles | 194 (1.7%) | 112 (1.2%) |
| Total | 11,345 (100.0%) | 9,454 (100.0%) |
Commute Time in Holly Springs
The most frequently occuring commute durations in Holly Springs are 30 to 34 minutes (3,420 commuters, 21.5%), 20 to 24 minutes (2,008 commuters, 12.7%), and 25 to 29 minutes (1,763 commuters, 11.1%).
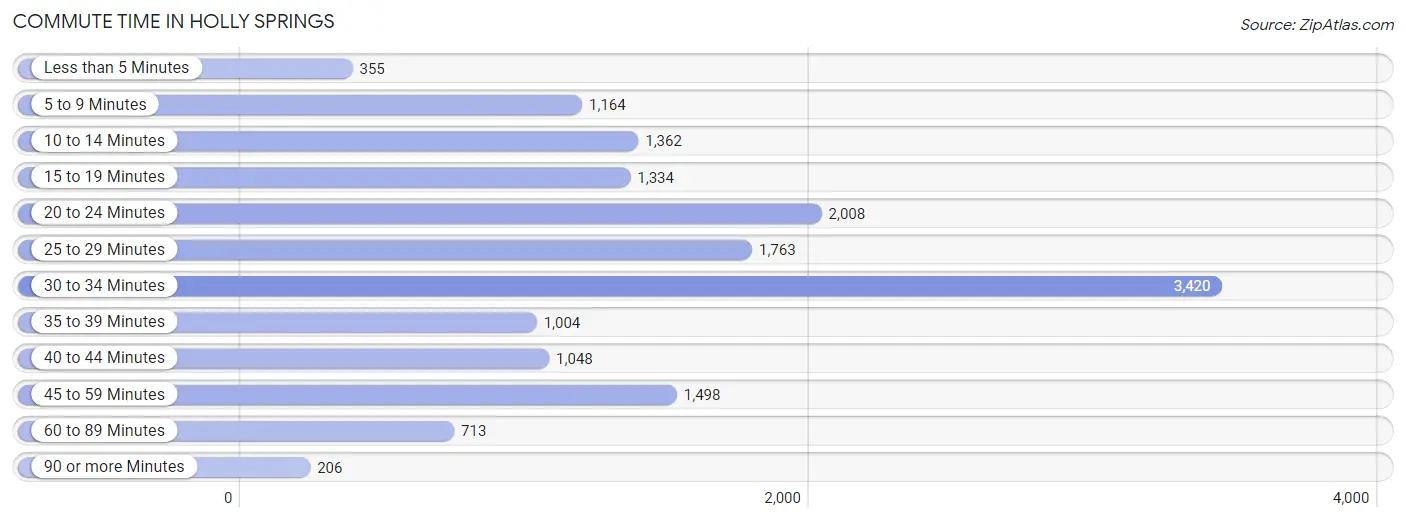
| Commute Time | # Commuters | % Commuters |
| Less than 5 Minutes | 355 | 2.2% |
| 5 to 9 Minutes | 1,164 | 7.3% |
| 10 to 14 Minutes | 1,362 | 8.6% |
| 15 to 19 Minutes | 1,334 | 8.4% |
| 20 to 24 Minutes | 2,008 | 12.7% |
| 25 to 29 Minutes | 1,763 | 11.1% |
| 30 to 34 Minutes | 3,420 | 21.5% |
| 35 to 39 Minutes | 1,004 | 6.3% |
| 40 to 44 Minutes | 1,048 | 6.6% |
| 45 to 59 Minutes | 1,498 | 9.4% |
| 60 to 89 Minutes | 713 | 4.5% |
| 90 or more Minutes | 206 | 1.3% |
Commute Time by Sex in Holly Springs
The most common commute times in Holly Springs are 30 to 34 minutes (2,155 commuters, 24.6%) for males and 30 to 34 minutes (1,265 commuters, 17.7%) for females.
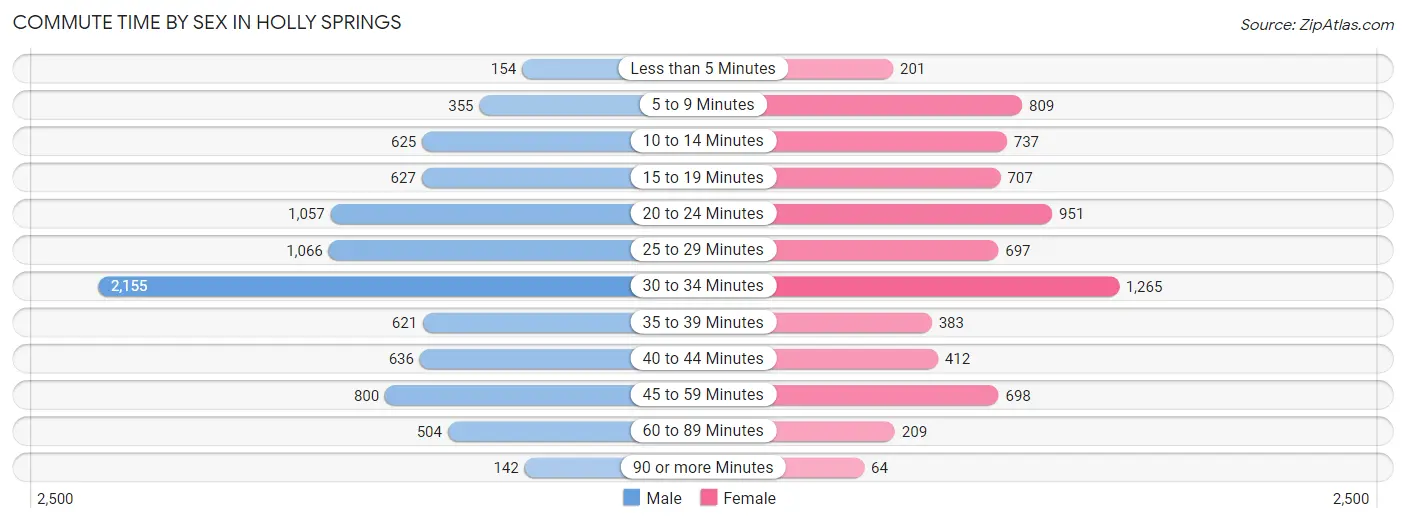
| Commute Time | Male | Female |
| Less than 5 Minutes | 154 (1.8%) | 201 (2.8%) |
| 5 to 9 Minutes | 355 (4.1%) | 809 (11.3%) |
| 10 to 14 Minutes | 625 (7.1%) | 737 (10.3%) |
| 15 to 19 Minutes | 627 (7.2%) | 707 (9.9%) |
| 20 to 24 Minutes | 1,057 (12.1%) | 951 (13.3%) |
| 25 to 29 Minutes | 1,066 (12.2%) | 697 (9.8%) |
| 30 to 34 Minutes | 2,155 (24.6%) | 1,265 (17.7%) |
| 35 to 39 Minutes | 621 (7.1%) | 383 (5.4%) |
| 40 to 44 Minutes | 636 (7.3%) | 412 (5.8%) |
| 45 to 59 Minutes | 800 (9.1%) | 698 (9.8%) |
| 60 to 89 Minutes | 504 (5.8%) | 209 (2.9%) |
| 90 or more Minutes | 142 (1.6%) | 64 (0.9%) |
Time of Departure to Work by Sex in Holly Springs
The most frequent times of departure to work in Holly Springs are 7:00 AM to 7:29 AM (1,747, 20.0%) for males and 7:30 AM to 7:59 AM (1,169, 16.4%) for females.
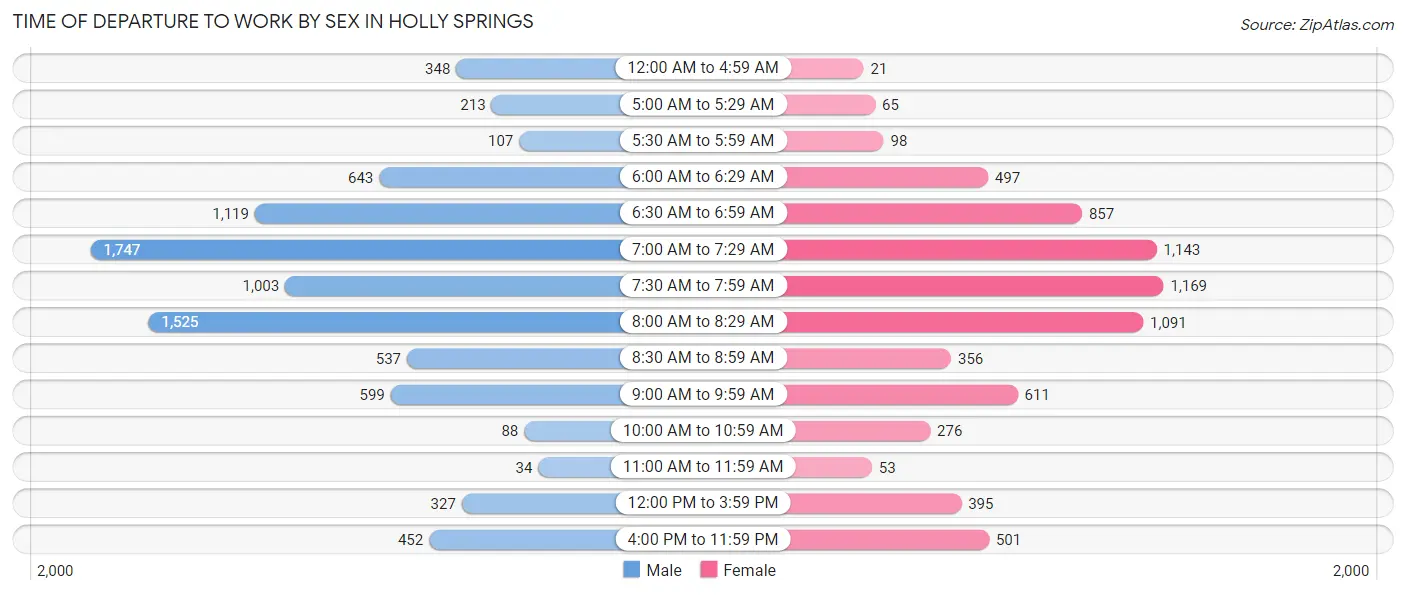
| Time of Departure | Male | Female |
| 12:00 AM to 4:59 AM | 348 (4.0%) | 21 (0.3%) |
| 5:00 AM to 5:29 AM | 213 (2.4%) | 65 (0.9%) |
| 5:30 AM to 5:59 AM | 107 (1.2%) | 98 (1.4%) |
| 6:00 AM to 6:29 AM | 643 (7.4%) | 497 (7.0%) |
| 6:30 AM to 6:59 AM | 1,119 (12.8%) | 857 (12.0%) |
| 7:00 AM to 7:29 AM | 1,747 (20.0%) | 1,143 (16.0%) |
| 7:30 AM to 7:59 AM | 1,003 (11.5%) | 1,169 (16.4%) |
| 8:00 AM to 8:29 AM | 1,525 (17.4%) | 1,091 (15.3%) |
| 8:30 AM to 8:59 AM | 537 (6.1%) | 356 (5.0%) |
| 9:00 AM to 9:59 AM | 599 (6.9%) | 611 (8.6%) |
| 10:00 AM to 10:59 AM | 88 (1.0%) | 276 (3.9%) |
| 11:00 AM to 11:59 AM | 34 (0.4%) | 53 (0.7%) |
| 12:00 PM to 3:59 PM | 327 (3.7%) | 395 (5.5%) |
| 4:00 PM to 11:59 PM | 452 (5.2%) | 501 (7.0%) |
| Total | 8,742 (100.0%) | 7,133 (100.0%) |
Housing Occupancy in Holly Springs
Occupancy by Ownership in Holly Springs
Of the total 13,596 dwellings in Holly Springs, owner-occupied units account for 11,179 (82.2%), while renter-occupied units make up 2,417 (17.8%).
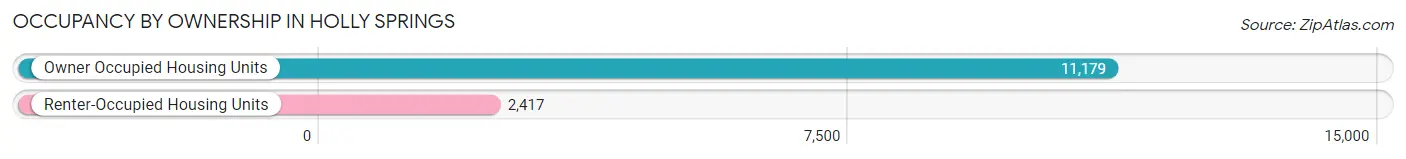
| Occupancy | # Housing Units | % Housing Units |
| Owner Occupied Housing Units | 11,179 | 82.2% |
| Renter-Occupied Housing Units | 2,417 | 17.8% |
| Total Occupied Housing Units | 13,596 | 100.0% |
Occupancy by Household Size in Holly Springs
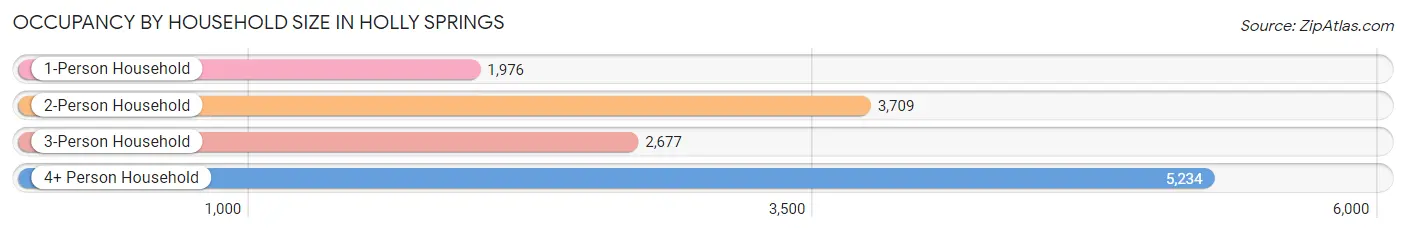
| Household Size | # Housing Units | % Housing Units |
| 1-Person Household | 1,976 | 14.5% |
| 2-Person Household | 3,709 | 27.3% |
| 3-Person Household | 2,677 | 19.7% |
| 4+ Person Household | 5,234 | 38.5% |
| Total Housing Units | 13,596 | 100.0% |
Occupancy by Ownership by Household Size in Holly Springs
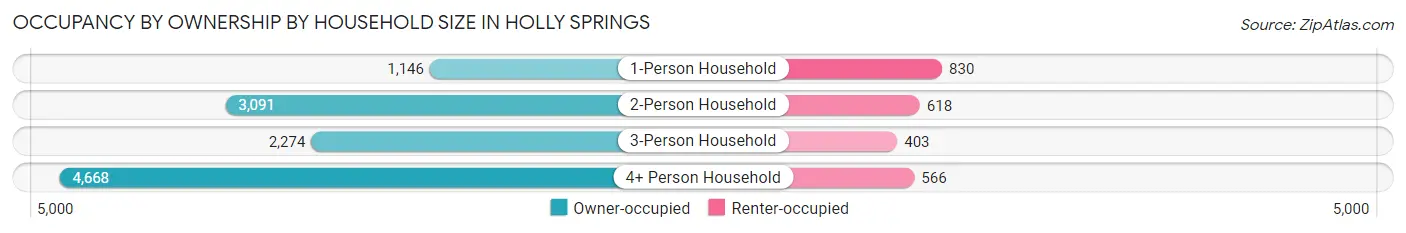
| Household Size | Owner-occupied | Renter-occupied |
| 1-Person Household | 1,146 (58.0%) | 830 (42.0%) |
| 2-Person Household | 3,091 (83.3%) | 618 (16.7%) |
| 3-Person Household | 2,274 (85.0%) | 403 (15.0%) |
| 4+ Person Household | 4,668 (89.2%) | 566 (10.8%) |
| Total Housing Units | 11,179 (82.2%) | 2,417 (17.8%) |
Occupancy by Educational Attainment in Holly Springs
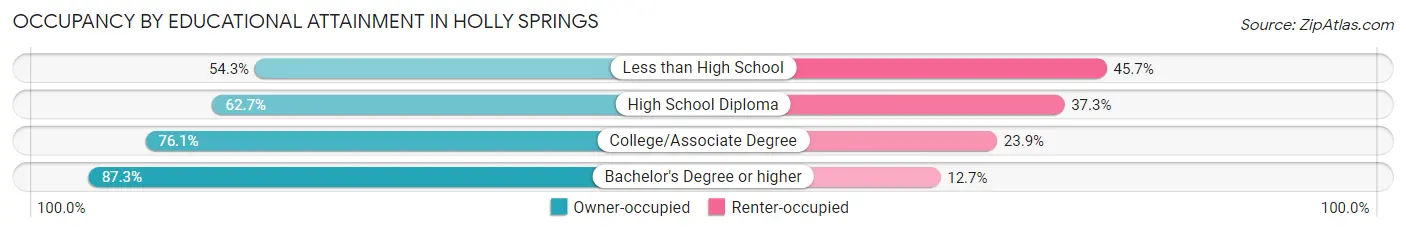
| Household Size | Owner-occupied | Renter-occupied |
| Less than High School | 182 (54.3%) | 153 (45.7%) |
| High School Diploma | 523 (62.7%) | 311 (37.3%) |
| College/Associate Degree | 2,526 (76.1%) | 795 (23.9%) |
| Bachelor's Degree or higher | 7,948 (87.3%) | 1,158 (12.7%) |
Occupancy by Age of Householder in Holly Springs
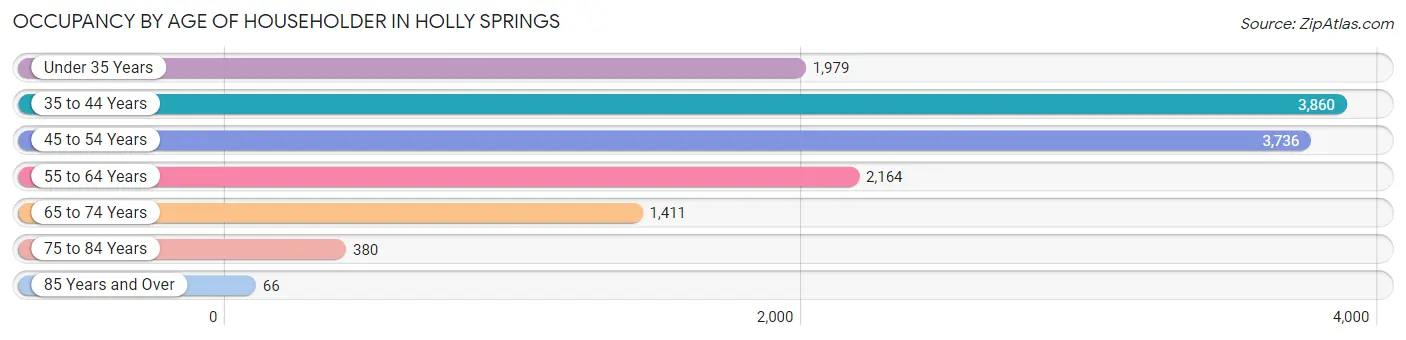
| Age Bracket | # Households | % Households |
| Under 35 Years | 1,979 | 14.6% |
| 35 to 44 Years | 3,860 | 28.4% |
| 45 to 54 Years | 3,736 | 27.5% |
| 55 to 64 Years | 2,164 | 15.9% |
| 65 to 74 Years | 1,411 | 10.4% |
| 75 to 84 Years | 380 | 2.8% |
| 85 Years and Over | 66 | 0.5% |
| Total | 13,596 | 100.0% |
Housing Finances in Holly Springs
Median Income by Occupancy in Holly Springs
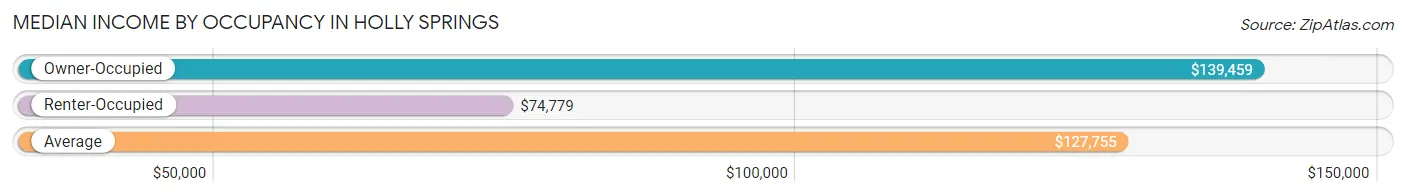
| Occupancy Type | # Households | Median Income |
| Owner-Occupied | 11,179 (82.2%) | $139,459 |
| Renter-Occupied | 2,417 (17.8%) | $74,779 |
| Average | 13,596 (100.0%) | $127,755 |
Occupancy by Householder Income Bracket in Holly Springs
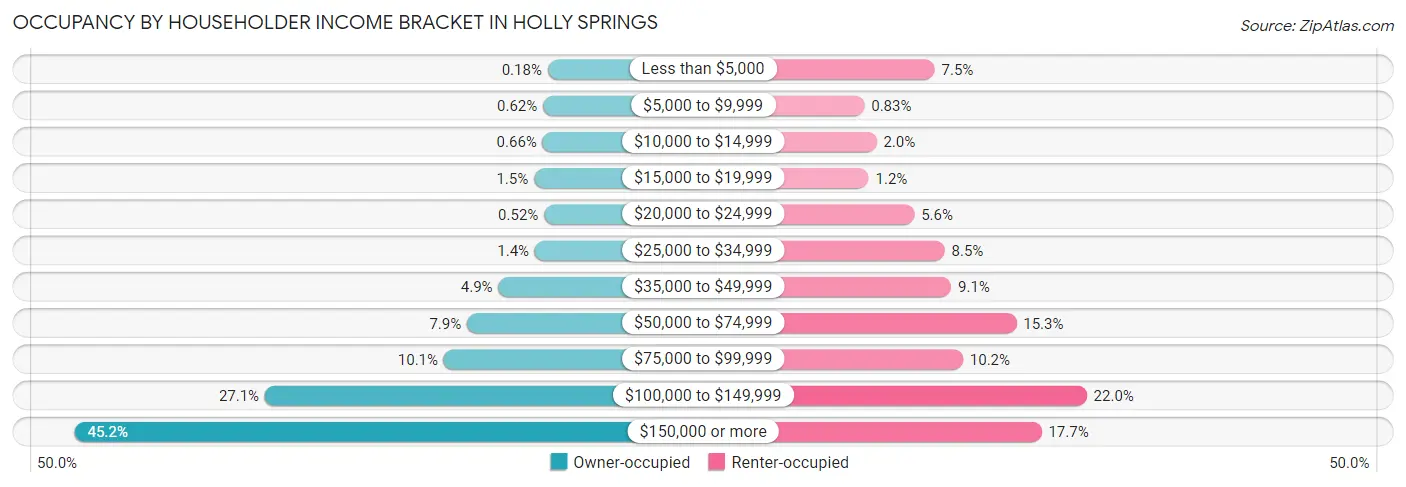
| Income Bracket | Owner-occupied | Renter-occupied |
| Less than $5,000 | 20 (0.2%) | 182 (7.5%) |
| $5,000 to $9,999 | 69 (0.6%) | 20 (0.8%) |
| $10,000 to $14,999 | 74 (0.7%) | 48 (2.0%) |
| $15,000 to $19,999 | 165 (1.5%) | 30 (1.2%) |
| $20,000 to $24,999 | 58 (0.5%) | 135 (5.6%) |
| $25,000 to $34,999 | 156 (1.4%) | 205 (8.5%) |
| $35,000 to $49,999 | 544 (4.9%) | 220 (9.1%) |
| $50,000 to $74,999 | 879 (7.9%) | 370 (15.3%) |
| $75,000 to $99,999 | 1,126 (10.1%) | 247 (10.2%) |
| $100,000 to $149,999 | 3,031 (27.1%) | 532 (22.0%) |
| $150,000 or more | 5,057 (45.2%) | 428 (17.7%) |
| Total | 11,179 (100.0%) | 2,417 (100.0%) |
Monthly Housing Cost Tiers in Holly Springs
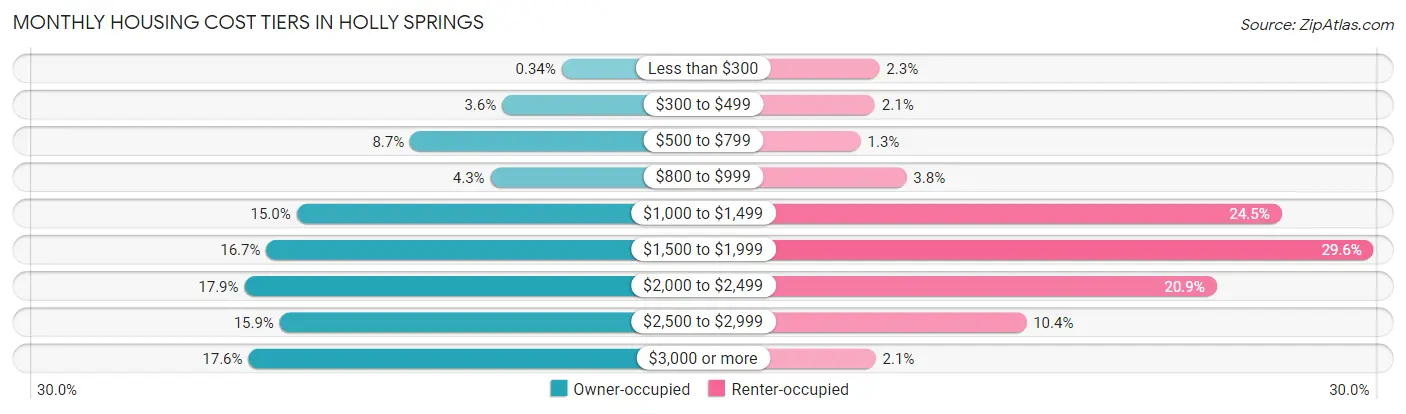
| Monthly Cost | Owner-occupied | Renter-occupied |
| Less than $300 | 38 (0.3%) | 56 (2.3%) |
| $300 to $499 | 406 (3.6%) | 50 (2.1%) |
| $500 to $799 | 974 (8.7%) | 31 (1.3%) |
| $800 to $999 | 477 (4.3%) | 92 (3.8%) |
| $1,000 to $1,499 | 1,675 (15.0%) | 593 (24.5%) |
| $1,500 to $1,999 | 1,861 (16.7%) | 716 (29.6%) |
| $2,000 to $2,499 | 1,997 (17.9%) | 506 (20.9%) |
| $2,500 to $2,999 | 1,779 (15.9%) | 252 (10.4%) |
| $3,000 or more | 1,972 (17.6%) | 51 (2.1%) |
| Total | 11,179 (100.0%) | 2,417 (100.0%) |
Physical Housing Characteristics in Holly Springs
Housing Structures in Holly Springs
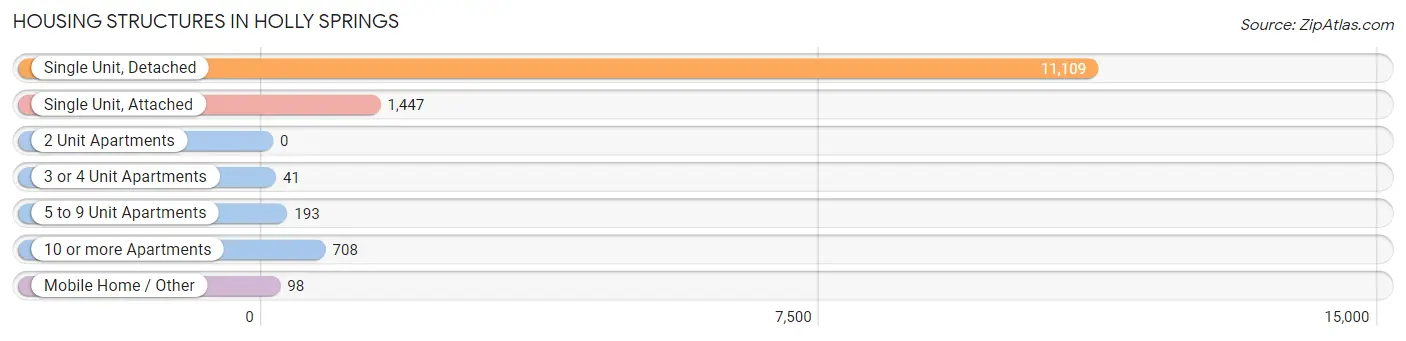
| Structure Type | # Housing Units | % Housing Units |
| Single Unit, Detached | 11,109 | 81.7% |
| Single Unit, Attached | 1,447 | 10.6% |
| 2 Unit Apartments | 0 | 0.0% |
| 3 or 4 Unit Apartments | 41 | 0.3% |
| 5 to 9 Unit Apartments | 193 | 1.4% |
| 10 or more Apartments | 708 | 5.2% |
| Mobile Home / Other | 98 | 0.7% |
| Total | 13,596 | 100.0% |
Housing Structures by Occupancy in Holly Springs
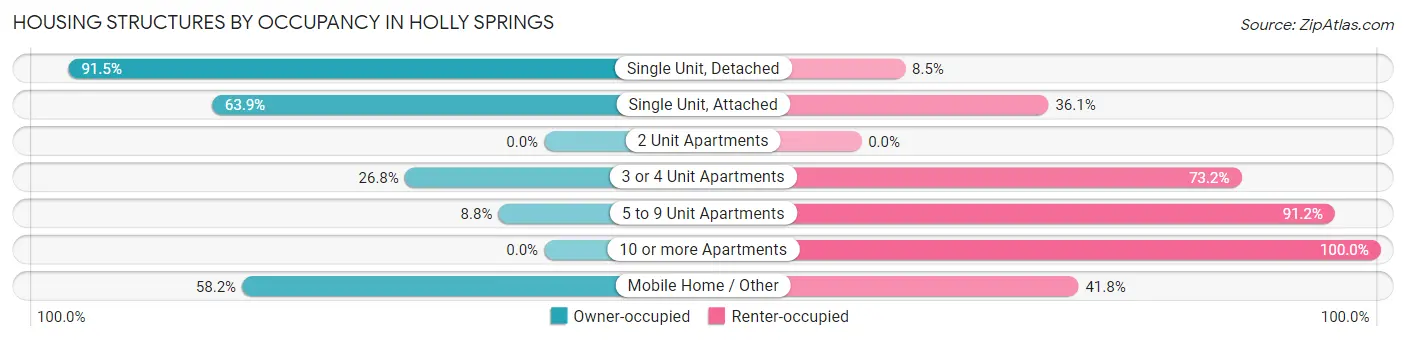
| Structure Type | Owner-occupied | Renter-occupied |
| Single Unit, Detached | 10,169 (91.5%) | 940 (8.5%) |
| Single Unit, Attached | 925 (63.9%) | 522 (36.1%) |
| 2 Unit Apartments | 0 (0.0%) | 0 (0.0%) |
| 3 or 4 Unit Apartments | 11 (26.8%) | 30 (73.2%) |
| 5 to 9 Unit Apartments | 17 (8.8%) | 176 (91.2%) |
| 10 or more Apartments | 0 (0.0%) | 708 (100.0%) |
| Mobile Home / Other | 57 (58.2%) | 41 (41.8%) |
| Total | 11,179 (82.2%) | 2,417 (17.8%) |
Housing Structures by Number of Rooms in Holly Springs
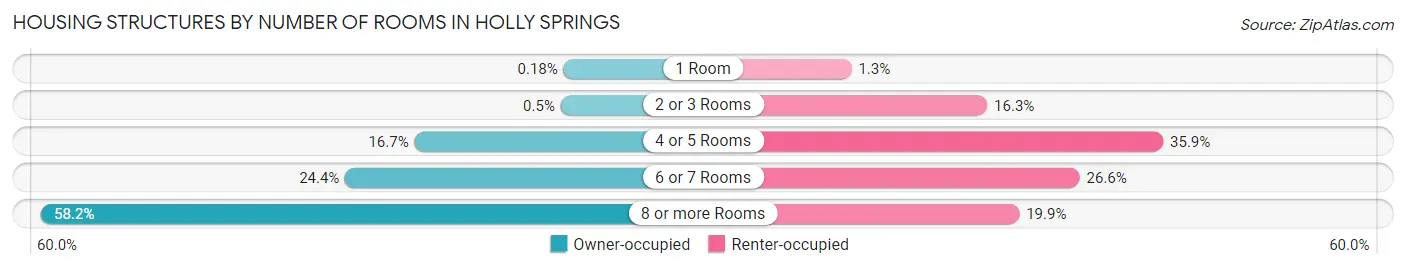
| Number of Rooms | Owner-occupied | Renter-occupied |
| 1 Room | 20 (0.2%) | 31 (1.3%) |
| 2 or 3 Rooms | 56 (0.5%) | 395 (16.3%) |
| 4 or 5 Rooms | 1,870 (16.7%) | 867 (35.9%) |
| 6 or 7 Rooms | 2,730 (24.4%) | 643 (26.6%) |
| 8 or more Rooms | 6,503 (58.2%) | 481 (19.9%) |
| Total | 11,179 (100.0%) | 2,417 (100.0%) |
Housing Structure by Heating Type in Holly Springs
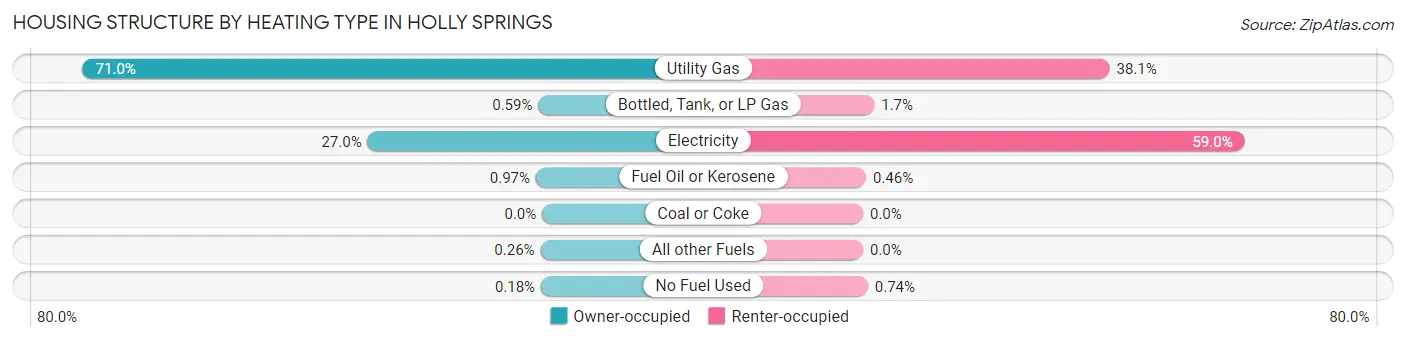
| Heating Type | Owner-occupied | Renter-occupied |
| Utility Gas | 7,939 (71.0%) | 921 (38.1%) |
| Bottled, Tank, or LP Gas | 66 (0.6%) | 42 (1.7%) |
| Electricity | 3,017 (27.0%) | 1,425 (59.0%) |
| Fuel Oil or Kerosene | 108 (1.0%) | 11 (0.5%) |
| Coal or Coke | 0 (0.0%) | 0 (0.0%) |
| All other Fuels | 29 (0.3%) | 0 (0.0%) |
| No Fuel Used | 20 (0.2%) | 18 (0.7%) |
| Total | 11,179 (100.0%) | 2,417 (100.0%) |
Household Vehicle Usage in Holly Springs
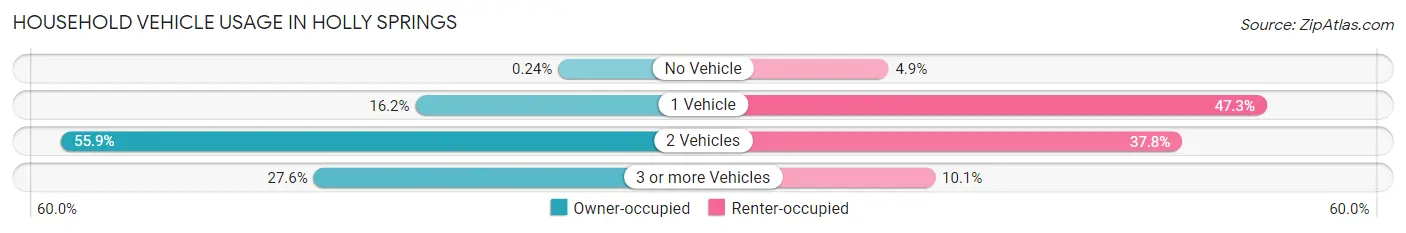
| Vehicles per Household | Owner-occupied | Renter-occupied |
| No Vehicle | 27 (0.2%) | 118 (4.9%) |
| 1 Vehicle | 1,814 (16.2%) | 1,142 (47.2%) |
| 2 Vehicles | 6,249 (55.9%) | 913 (37.8%) |
| 3 or more Vehicles | 3,089 (27.6%) | 244 (10.1%) |
| Total | 11,179 (100.0%) | 2,417 (100.0%) |
Real Estate & Mortgages in Holly Springs
Real Estate and Mortgage Overview in Holly Springs
| Characteristic | Without Mortgage | With Mortgage |
| Housing Units | 2,015 | 9,164 |
| Median Property Value | $480,200 | $446,100 |
| Median Household Income | $126,875 | $4,326 |
| Monthly Housing Costs | $689 | $1,972 |
| Real Estate Taxes | $3,372 | $88 |
Property Value by Mortgage Status in Holly Springs
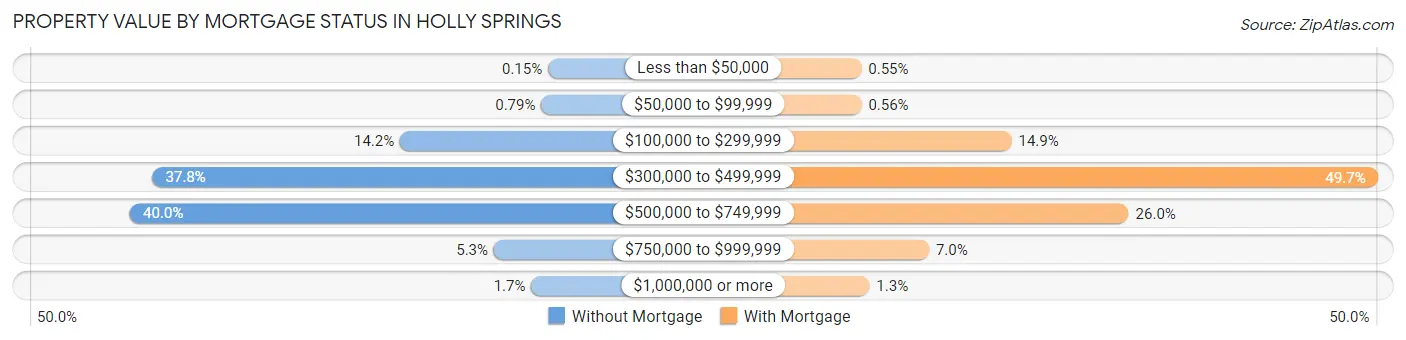
| Property Value | Without Mortgage | With Mortgage |
| Less than $50,000 | 3 (0.2%) | 50 (0.5%) |
| $50,000 to $99,999 | 16 (0.8%) | 51 (0.6%) |
| $100,000 to $299,999 | 287 (14.2%) | 1,362 (14.9%) |
| $300,000 to $499,999 | 762 (37.8%) | 4,555 (49.7%) |
| $500,000 to $749,999 | 805 (40.0%) | 2,384 (26.0%) |
| $750,000 to $999,999 | 107 (5.3%) | 641 (7.0%) |
| $1,000,000 or more | 35 (1.7%) | 121 (1.3%) |
| Total | 2,015 (100.0%) | 9,164 (100.0%) |
Household Income by Mortgage Status in Holly Springs
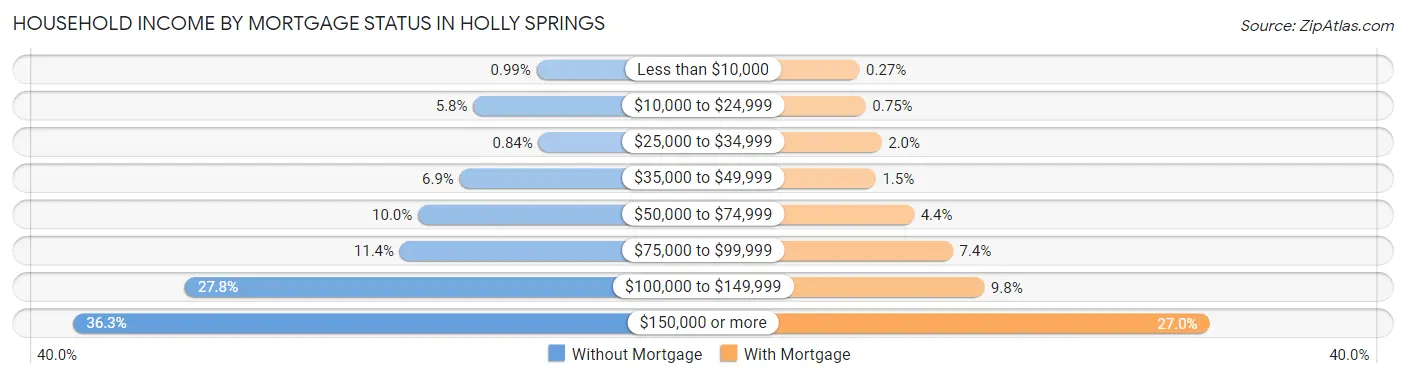
| Household Income | Without Mortgage | With Mortgage |
| Less than $10,000 | 20 (1.0%) | 25 (0.3%) |
| $10,000 to $24,999 | 117 (5.8%) | 69 (0.7%) |
| $25,000 to $34,999 | 17 (0.8%) | 180 (2.0%) |
| $35,000 to $49,999 | 138 (6.9%) | 139 (1.5%) |
| $50,000 to $74,999 | 202 (10.0%) | 406 (4.4%) |
| $75,000 to $99,999 | 230 (11.4%) | 677 (7.4%) |
| $100,000 to $149,999 | 560 (27.8%) | 896 (9.8%) |
| $150,000 or more | 731 (36.3%) | 2,471 (27.0%) |
| Total | 2,015 (100.0%) | 9,164 (100.0%) |
Property Value to Household Income Ratio in Holly Springs
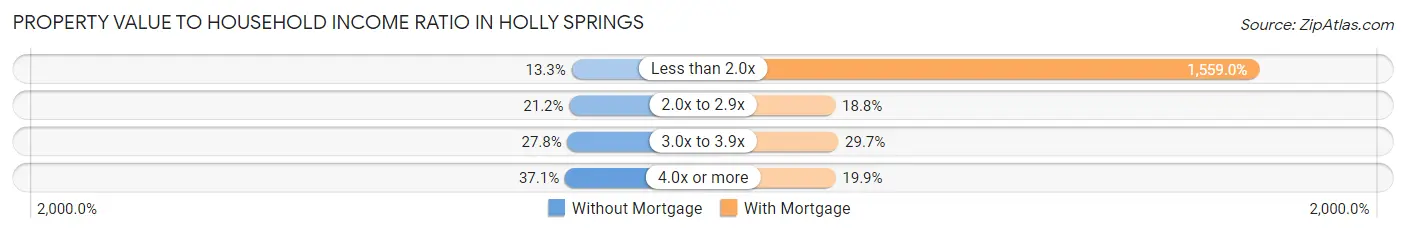
| Value-to-Income Ratio | Without Mortgage | With Mortgage |
| Less than 2.0x | 268 (13.3%) | 142,866 (1,559.0%) |
| 2.0x to 2.9x | 428 (21.2%) | 1,724 (18.8%) |
| 3.0x to 3.9x | 561 (27.8%) | 2,723 (29.7%) |
| 4.0x or more | 748 (37.1%) | 1,819 (19.9%) |
| Total | 2,015 (100.0%) | 9,164 (100.0%) |
Real Estate Taxes by Mortgage Status in Holly Springs
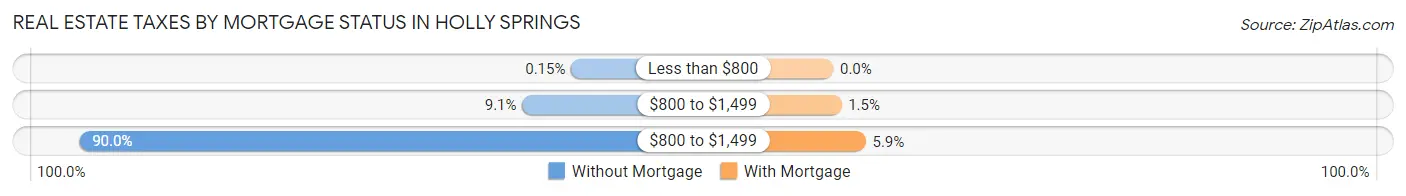
| Property Taxes | Without Mortgage | With Mortgage |
| Less than $800 | 3 (0.2%) | 0 (0.0%) |
| $800 to $1,499 | 183 (9.1%) | 137 (1.5%) |
| $800 to $1,499 | 1,814 (90.0%) | 543 (5.9%) |
| Total | 2,015 (100.0%) | 9,164 (100.0%) |
Health & Disability in Holly Springs
Health Insurance Coverage by Age in Holly Springs
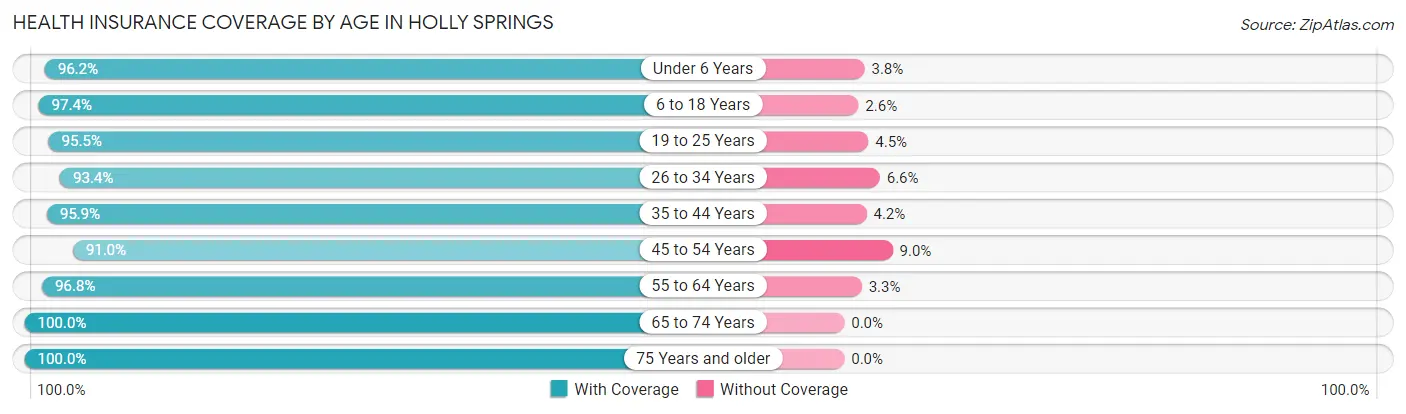
| Age Bracket | With Coverage | Without Coverage |
| Under 6 Years | 3,369 (96.2%) | 132 (3.8%) |
| 6 to 18 Years | 10,702 (97.4%) | 289 (2.6%) |
| 19 to 25 Years | 1,857 (95.5%) | 87 (4.5%) |
| 26 to 34 Years | 3,919 (93.4%) | 278 (6.6%) |
| 35 to 44 Years | 7,178 (95.9%) | 311 (4.2%) |
| 45 to 54 Years | 6,083 (91.0%) | 602 (9.0%) |
| 55 to 64 Years | 3,693 (96.8%) | 124 (3.3%) |
| 65 to 74 Years | 2,371 (100.0%) | 0 (0.0%) |
| 75 Years and older | 945 (100.0%) | 0 (0.0%) |
| Total | 40,117 (95.7%) | 1,823 (4.3%) |
Health Insurance Coverage by Citizenship Status in Holly Springs
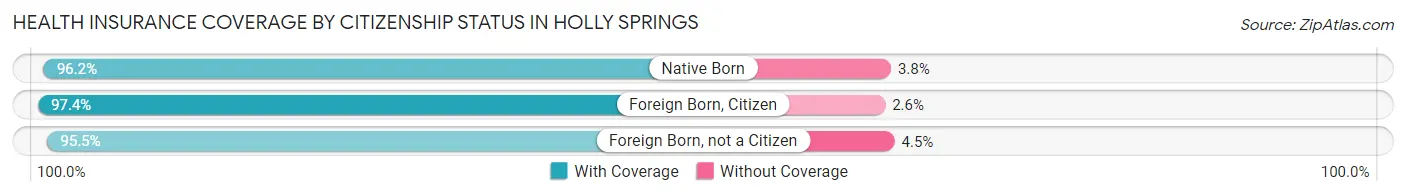
| Citizenship Status | With Coverage | Without Coverage |
| Native Born | 3,369 (96.2%) | 132 (3.8%) |
| Foreign Born, Citizen | 10,702 (97.4%) | 289 (2.6%) |
| Foreign Born, not a Citizen | 1,857 (95.5%) | 87 (4.5%) |
Health Insurance Coverage by Household Income in Holly Springs
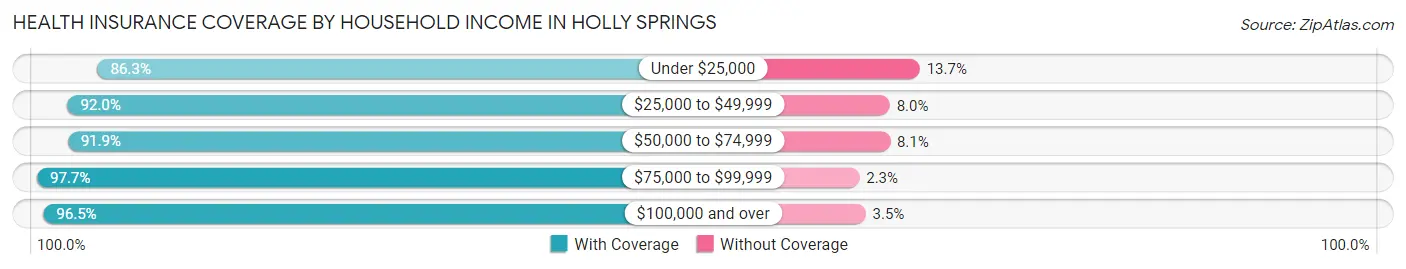
| Household Income | With Coverage | Without Coverage |
| Under $25,000 | 1,169 (86.3%) | 185 (13.7%) |
| $25,000 to $49,999 | 2,403 (92.0%) | 210 (8.0%) |
| $50,000 to $74,999 | 2,685 (91.9%) | 236 (8.1%) |
| $75,000 to $99,999 | 3,668 (97.7%) | 88 (2.3%) |
| $100,000 and over | 30,151 (96.5%) | 1,104 (3.5%) |
Public vs Private Health Insurance Coverage by Age in Holly Springs
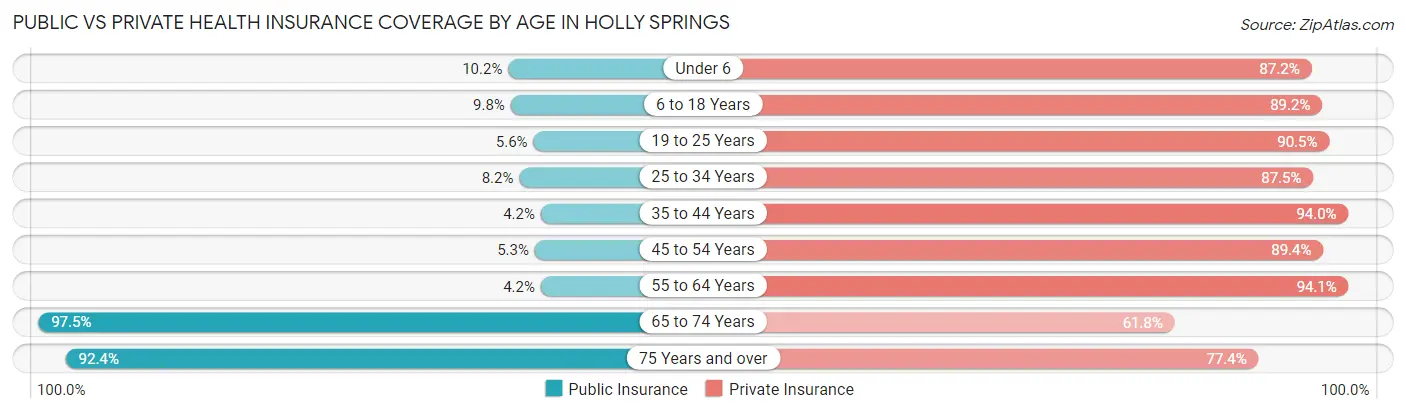
| Age Bracket | Public Insurance | Private Insurance |
| Under 6 | 358 (10.2%) | 3,053 (87.2%) |
| 6 to 18 Years | 1,075 (9.8%) | 9,801 (89.2%) |
| 19 to 25 Years | 108 (5.6%) | 1,759 (90.5%) |
| 25 to 34 Years | 343 (8.2%) | 3,673 (87.5%) |
| 35 to 44 Years | 313 (4.2%) | 7,043 (94.0%) |
| 45 to 54 Years | 354 (5.3%) | 5,974 (89.4%) |
| 55 to 64 Years | 160 (4.2%) | 3,591 (94.1%) |
| 65 to 74 Years | 2,311 (97.5%) | 1,465 (61.8%) |
| 75 Years and over | 873 (92.4%) | 731 (77.3%) |
| Total | 5,895 (14.1%) | 37,090 (88.4%) |
Disability Status by Sex by Age in Holly Springs
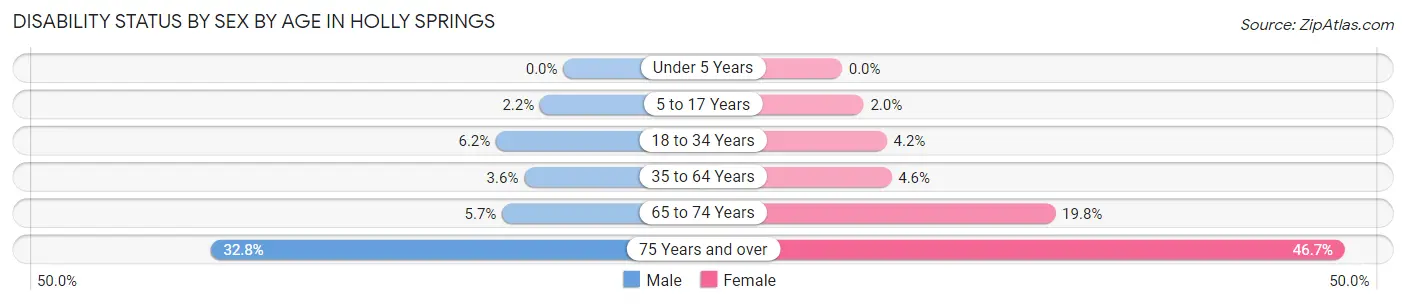
| Age Bracket | Male | Female |
| Under 5 Years | 0 (0.0%) | 0 (0.0%) |
| 5 to 17 Years | 112 (2.2%) | 122 (2.0%) |
| 18 to 34 Years | 200 (6.2%) | 139 (4.2%) |
| 35 to 64 Years | 324 (3.6%) | 416 (4.6%) |
| 65 to 74 Years | 61 (5.7%) | 257 (19.8%) |
| 75 Years and over | 151 (32.8%) | 226 (46.7%) |
Disability Class by Sex by Age in Holly Springs
Disability Class: Hearing Difficulty
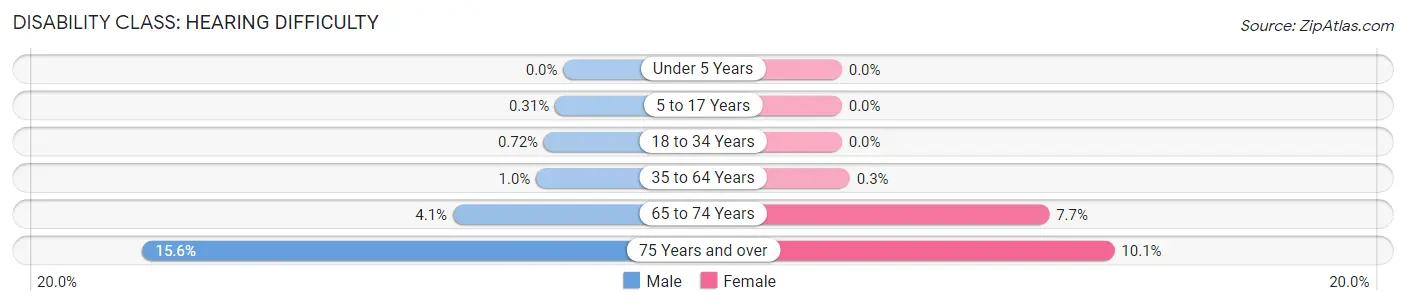
| Age Bracket | Male | Female |
| Under 5 Years | 0 (0.0%) | 0 (0.0%) |
| 5 to 17 Years | 16 (0.3%) | 0 (0.0%) |
| 18 to 34 Years | 23 (0.7%) | 0 (0.0%) |
| 35 to 64 Years | 90 (1.0%) | 27 (0.3%) |
| 65 to 74 Years | 44 (4.1%) | 100 (7.7%) |
| 75 Years and over | 72 (15.6%) | 49 (10.1%) |
Disability Class: Vision Difficulty
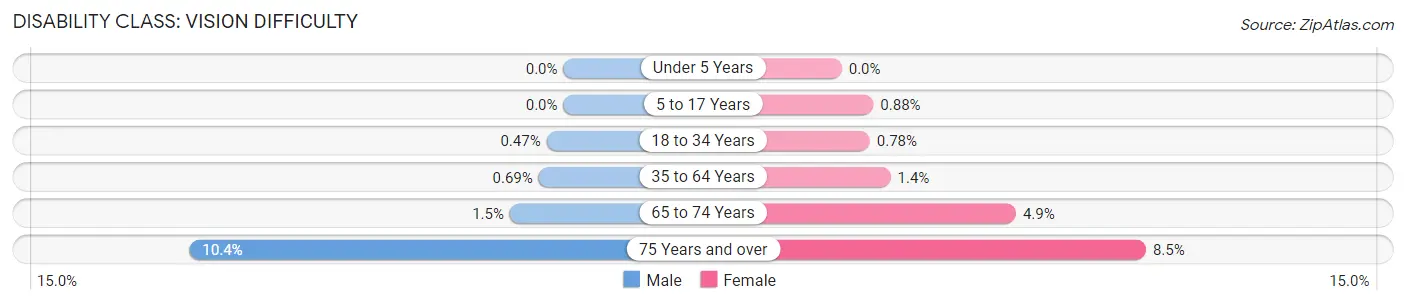
| Age Bracket | Male | Female |
| Under 5 Years | 0 (0.0%) | 0 (0.0%) |
| 5 to 17 Years | 0 (0.0%) | 53 (0.9%) |
| 18 to 34 Years | 15 (0.5%) | 26 (0.8%) |
| 35 to 64 Years | 62 (0.7%) | 123 (1.4%) |
| 65 to 74 Years | 16 (1.5%) | 63 (4.9%) |
| 75 Years and over | 48 (10.4%) | 41 (8.5%) |
Disability Class: Cognitive Difficulty
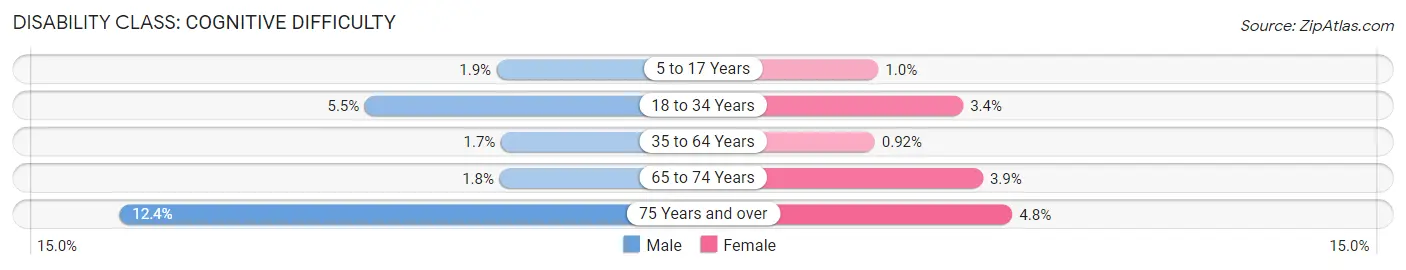
| Age Bracket | Male | Female |
| 5 to 17 Years | 96 (1.8%) | 62 (1.0%) |
| 18 to 34 Years | 177 (5.5%) | 113 (3.4%) |
| 35 to 64 Years | 154 (1.7%) | 83 (0.9%) |
| 65 to 74 Years | 19 (1.8%) | 51 (3.9%) |
| 75 Years and over | 57 (12.4%) | 23 (4.8%) |
Disability Class: Ambulatory Difficulty
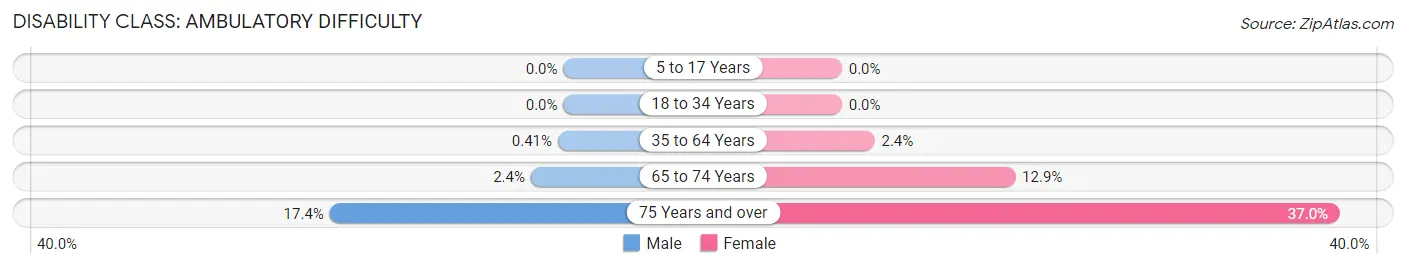
| Age Bracket | Male | Female |
| 5 to 17 Years | 0 (0.0%) | 0 (0.0%) |
| 18 to 34 Years | 0 (0.0%) | 0 (0.0%) |
| 35 to 64 Years | 37 (0.4%) | 220 (2.4%) |
| 65 to 74 Years | 26 (2.4%) | 167 (12.9%) |
| 75 Years and over | 80 (17.3%) | 179 (37.0%) |
Disability Class: Self-Care Difficulty
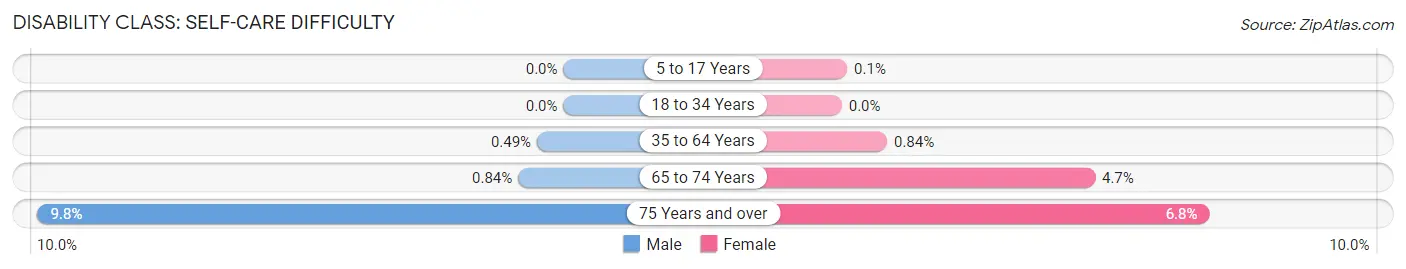
| Age Bracket | Male | Female |
| 5 to 17 Years | 0 (0.0%) | 6 (0.1%) |
| 18 to 34 Years | 0 (0.0%) | 0 (0.0%) |
| 35 to 64 Years | 44 (0.5%) | 76 (0.8%) |
| 65 to 74 Years | 9 (0.8%) | 61 (4.7%) |
| 75 Years and over | 45 (9.8%) | 33 (6.8%) |
Technology Access in Holly Springs
Computing Device Access in Holly Springs
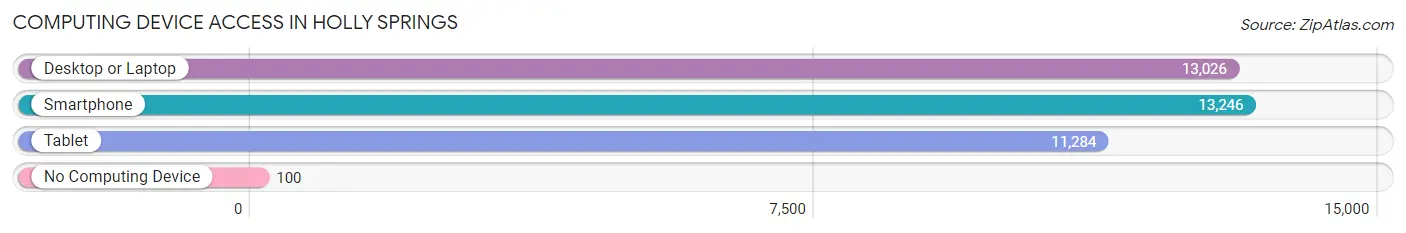
| Device Type | # Households | % Households |
| Desktop or Laptop | 13,026 | 95.8% |
| Smartphone | 13,246 | 97.4% |
| Tablet | 11,284 | 83.0% |
| No Computing Device | 100 | 0.7% |
| Total | 13,596 | 100.0% |
Internet Access in Holly Springs
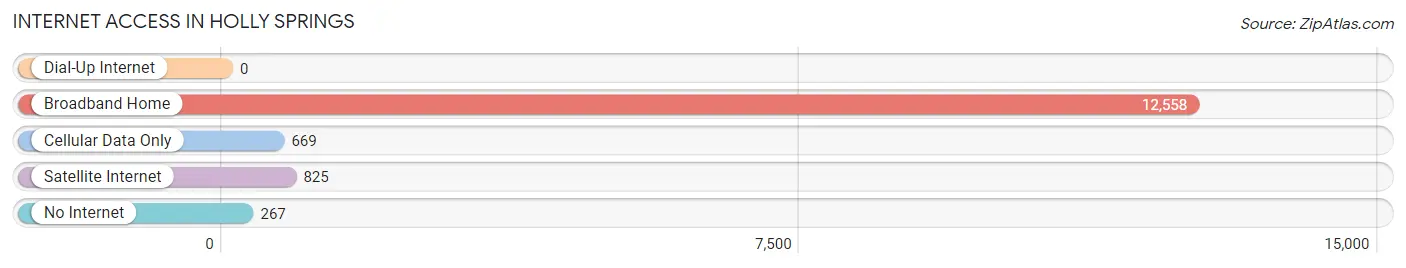
| Internet Type | # Households | % Households |
| Dial-Up Internet | 0 | 0.0% |
| Broadband Home | 12,558 | 92.4% |
| Cellular Data Only | 669 | 4.9% |
| Satellite Internet | 825 | 6.1% |
| No Internet | 267 | 2.0% |
| Total | 13,596 | 100.0% |
Holly Springs Summary
Holly Springs is a town located in Wake County, North Carolina. It is situated in the Research Triangle region of North Carolina, and is part of the Raleigh-Durham-Chapel Hill metropolitan area. The town has a population of approximately 30,000 people, and is known for its historic downtown area, which is home to a variety of shops, restaurants, and other businesses.
Geography
Holly Springs is located in the Piedmont region of North Carolina, and is situated in the Research Triangle region of the state. The town is located approximately 20 miles south of Raleigh, the state capital, and is bordered by Fuquay-Varina to the south, Apex to the west, and Cary to the east. The town is situated on the banks of the Neuse River, and is surrounded by rolling hills and forests.
The town has a total area of 16.2 square miles, of which 16.1 square miles is land and 0.1 square miles is water. The town is located at an elevation of approximately 400 feet above sea level.
History
Holly Springs was founded in 1854, and was named after the holly trees that grew in the area. The town was originally a farming community, and was home to a variety of crops, including cotton, tobacco, and corn. The town was also home to a number of mills, which were used to process the crops grown in the area.
In the late 19th century, the town began to experience a period of growth and development. The town was home to a number of businesses, including a cotton mill, a grist mill, and a sawmill. The town was also home to a number of churches, schools, and other institutions.
In the early 20th century, the town experienced a period of decline, as many of the businesses and mills closed. However, in the late 20th century, the town began to experience a period of revitalization, as new businesses and industries moved into the area.
Economy
Holly Springs is home to a variety of businesses and industries, including manufacturing, retail, and healthcare. The town is home to a number of large employers, including WakeMed Health & Hospitals, Wake County Public Schools, and the North Carolina Department of Transportation.
The town is also home to a number of small businesses, including restaurants, shops, and other businesses. The town is also home to a number of technology companies, including SAS Institute, Red Hat, and IBM.
Demographics
As of the 2010 census, the population of Holly Springs was 28,216. The racial makeup of the town was 73.3% White, 15.2% African American, 0.4% Native American, 5.2% Asian, 0.1% Pacific Islander, 3.2% from other races, and 2.7% from two or more races. Hispanic or Latino of any race were 8.2% of the population.
The median household income in Holly Springs was $76,845, and the median family income was $87,845. The per capita income for the town was $33,945. Approximately 8.2% of the population was below the poverty line.
Conclusion
Holly Springs is a town located in Wake County, North Carolina. It is situated in the Research Triangle region of the state, and is part of the Raleigh-Durham-Chapel Hill metropolitan area. The town has a population of approximately 30,000 people, and is known for its historic downtown area, which is home to a variety of shops, restaurants, and other businesses. The town is home to a variety of businesses and industries, including manufacturing, retail, and healthcare. The town has a diverse population, with a median household income of $76,845 and a median family income of $87,845. Holly Springs is a vibrant and growing community, and is an attractive place to live and work.
Common Questions
What is Per Capita Income in Holly Springs?
Per Capita income in Holly Springs is $49,116.
What is the Median Family Income in Holly Springs?
Median Family Income in Holly Springs is $139,203.
What is the Median Household income in Holly Springs?
Median Household Income in Holly Springs is $127,755.
What is Income or Wage Gap in Holly Springs?
Income or Wage Gap in Holly Springs is 42.3%.
Women in Holly Springs earn 57.7 cents for every dollar earned by a man.
What is Inequality or Gini Index in Holly Springs?
Inequality or Gini Index in Holly Springs is 0.37.
What is the Total Population of Holly Springs?
Total Population of Holly Springs is 42,023.
What is the Total Male Population of Holly Springs?
Total Male Population of Holly Springs is 20,303.
What is the Total Female Population of Holly Springs?
Total Female Population of Holly Springs is 21,720.
What is the Ratio of Males per 100 Females in Holly Springs?
There are 93.48 Males per 100 Females in Holly Springs.
What is the Ratio of Females per 100 Males in Holly Springs?
There are 106.98 Females per 100 Males in Holly Springs.
What is the Median Population Age in Holly Springs?
Median Population Age in Holly Springs is 35.7 Years.
What is the Average Family Size in Holly Springs
Average Family Size in Holly Springs is 3.4 People.
What is the Average Household Size in Holly Springs
Average Household Size in Holly Springs is 3.1 People.
How Large is the Labor Force in Holly Springs?
There are 21,788 People in the Labor Forcein in Holly Springs.
What is the Percentage of People in the Labor Force in Holly Springs?
73.6% of People are in the Labor Force in Holly Springs.
What is the Unemployment Rate in Holly Springs?
Unemployment Rate in Holly Springs is 3.5%.