Kannapolis, NC Map & Demographics
Kannapolis Map
Kannapolis Overview
$32,448
PER CAPITA INCOME
$77,589
AVG FAMILY INCOME
$66,487
AVG HOUSEHOLD INCOME
14.9%
WAGE / INCOME GAP [ % ]
85.1¢/ $1
WAGE / INCOME GAP [ $ ]
0.45
INEQUALITY / GINI INDEX
53,314
TOTAL POPULATION
26,650
MALE POPULATION
26,664
FEMALE POPULATION
99.95
MALES / 100 FEMALES
100.05
FEMALES / 100 MALES
37.0
MEDIAN AGE
3.4
AVG FAMILY SIZE
2.8
AVG HOUSEHOLD SIZE
26,796
LABOR FORCE [ PEOPLE ]
65.2%
PERCENT IN LABOR FORCE
6.1%
UNEMPLOYMENT RATE
Income in Kannapolis
Income Overview in Kannapolis
Per Capita Income in Kannapolis is $32,448, while median incomes of families and households are $77,589 and $66,487 respectively.
| Characteristic | Number | Measure |
| Per Capita Income | 53,314 | $32,448 |
| Median Family Income | 13,219 | $77,589 |
| Mean Family Income | 13,219 | $96,714 |
| Median Household Income | 19,026 | $66,487 |
| Mean Household Income | 19,026 | $85,714 |
| Income Deficit | 13,219 | $0 |
| Wage / Income Gap (%) | 53,314 | 14.89% |
| Wage / Income Gap ($) | 53,314 | 85.11¢ per $1 |
| Gini / Inequality Index | 53,314 | 0.45 |
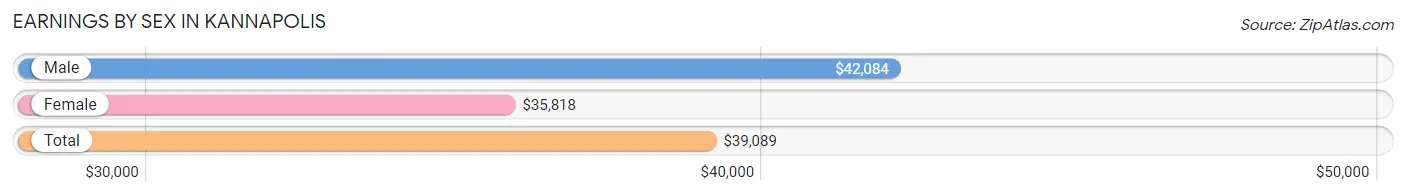
Earnings by Sex in Kannapolis
Average Earnings in Kannapolis are $39,089, $42,084 for men and $35,818 for women, a difference of 14.9%.
| Sex | Number | Average Earnings |
| Male | 14,427 (52.0%) | $42,084 |
| Female | 13,333 (48.0%) | $35,818 |
| Total | 27,760 (100.0%) | $39,089 |
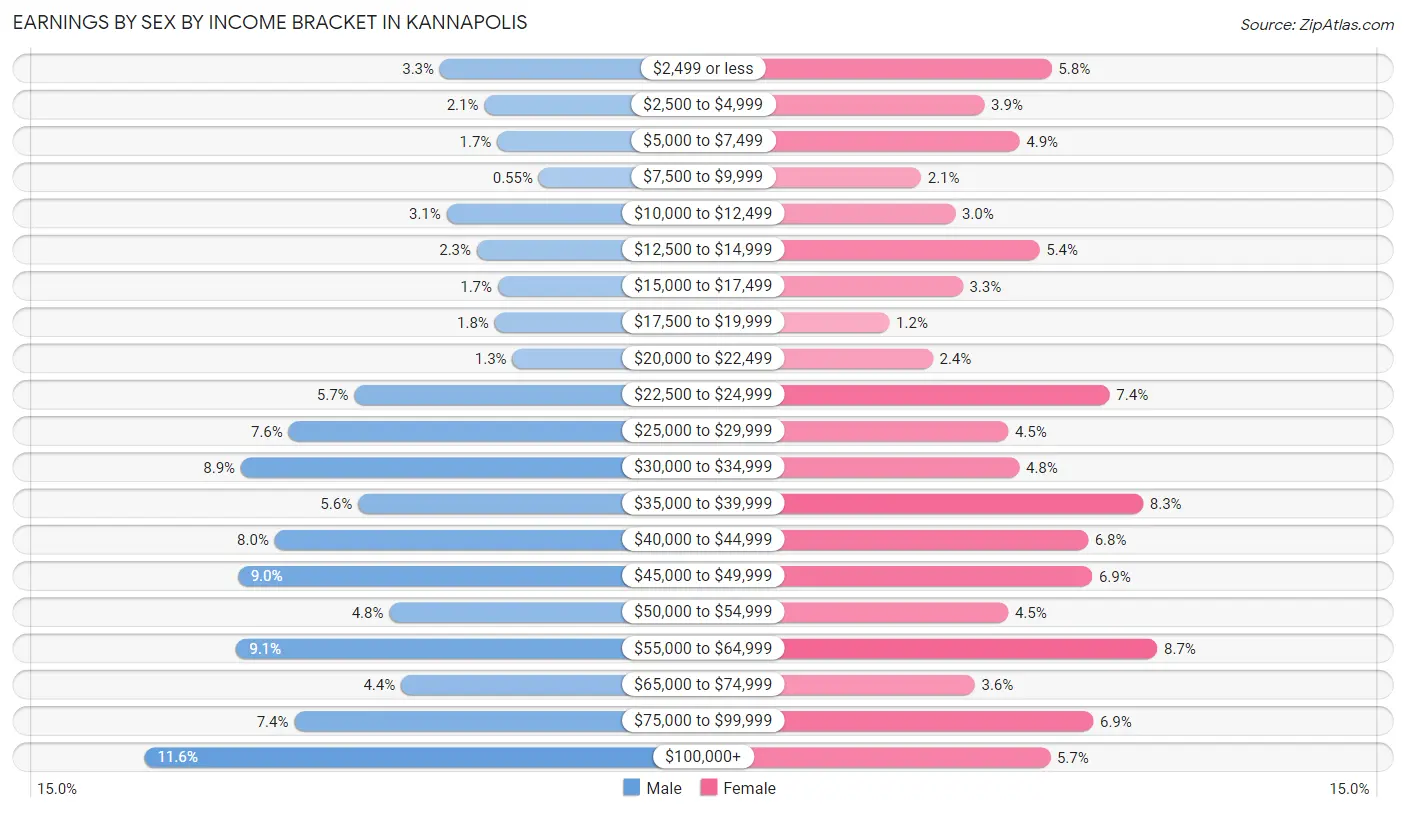
Earnings by Sex by Income Bracket in Kannapolis
The most common earnings brackets in Kannapolis are $100,000+ for men (1,678 | 11.6%) and $55,000 to $64,999 for women (1,162 | 8.7%).
| Income | Male | Female |
| $2,499 or less | 481 (3.3%) | 767 (5.8%) |
| $2,500 to $4,999 | 300 (2.1%) | 515 (3.9%) |
| $5,000 to $7,499 | 248 (1.7%) | 647 (4.9%) |
| $7,500 to $9,999 | 79 (0.5%) | 277 (2.1%) |
| $10,000 to $12,499 | 453 (3.1%) | 405 (3.0%) |
| $12,500 to $14,999 | 330 (2.3%) | 721 (5.4%) |
| $15,000 to $17,499 | 245 (1.7%) | 433 (3.3%) |
| $17,500 to $19,999 | 258 (1.8%) | 158 (1.2%) |
| $20,000 to $22,499 | 186 (1.3%) | 321 (2.4%) |
| $22,500 to $24,999 | 827 (5.7%) | 984 (7.4%) |
| $25,000 to $29,999 | 1,093 (7.6%) | 604 (4.5%) |
| $30,000 to $34,999 | 1,287 (8.9%) | 645 (4.8%) |
| $35,000 to $39,999 | 812 (5.6%) | 1,109 (8.3%) |
| $40,000 to $44,999 | 1,150 (8.0%) | 902 (6.8%) |
| $45,000 to $49,999 | 1,300 (9.0%) | 918 (6.9%) |
| $50,000 to $54,999 | 685 (4.8%) | 604 (4.5%) |
| $55,000 to $64,999 | 1,306 (9.0%) | 1,162 (8.7%) |
| $65,000 to $74,999 | 638 (4.4%) | 478 (3.6%) |
| $75,000 to $99,999 | 1,071 (7.4%) | 922 (6.9%) |
| $100,000+ | 1,678 (11.6%) | 761 (5.7%) |
| Total | 14,427 (100.0%) | 13,333 (100.0%) |
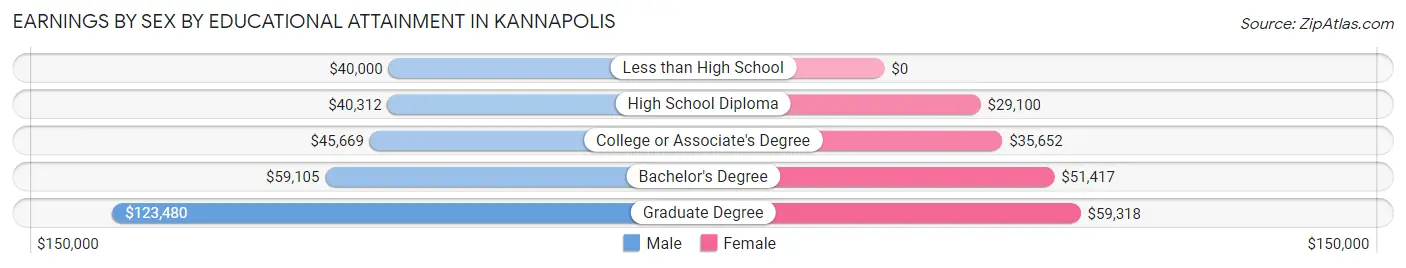
Earnings by Sex by Educational Attainment in Kannapolis
Average earnings in Kannapolis are $45,909 for men and $39,243 for women, a difference of 14.5%. Men with an educational attainment of graduate degree enjoy the highest average annual earnings of $123,480, while those with less than high school education earn the least with $40,000. Women with an educational attainment of graduate degree earn the most with the average annual earnings of $59,318, while those with high school diploma education have the smallest earnings of $29,100.
| Educational Attainment | Male Income | Female Income |
| Less than High School | $40,000 | $0 |
| High School Diploma | $40,312 | $29,100 |
| College or Associate's Degree | $45,669 | $35,652 |
| Bachelor's Degree | $59,105 | $51,417 |
| Graduate Degree | $123,480 | $59,318 |
| Total | $45,909 | $39,243 |
Family Income in Kannapolis
Family Income Brackets in Kannapolis
According to the Kannapolis family income data, there are 2,353 families falling into the $100,000 to $149,999 income range, which is the most common income bracket and makes up 17.8% of all families. Conversely, the less than $10,000 income bracket is the least frequent group with only 264 families (2.0%) belonging to this category.
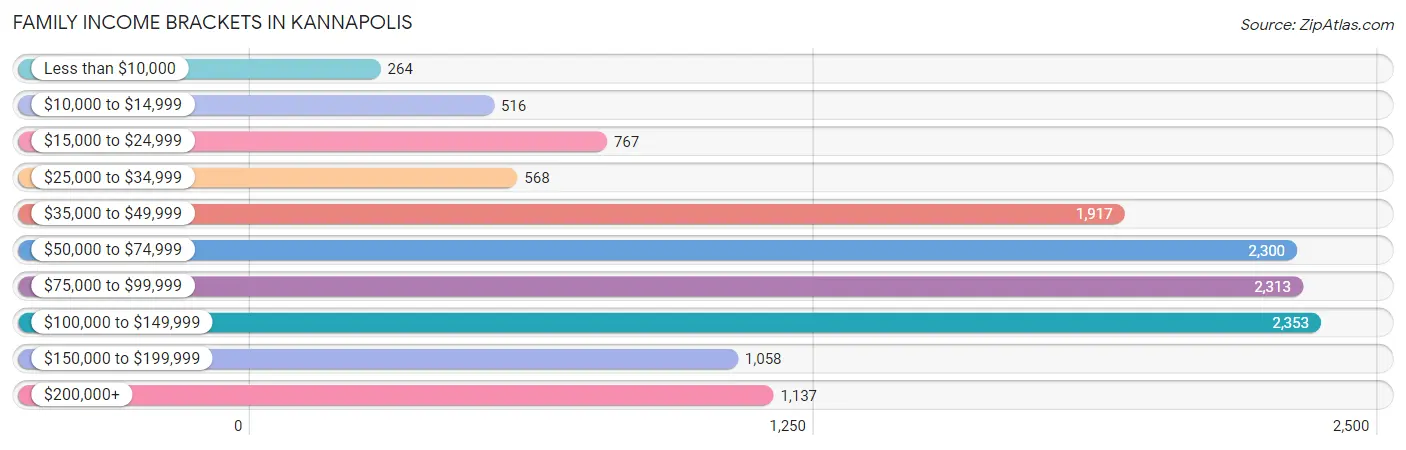
| Income Bracket | # Families | % Families |
| Less than $10,000 | 264 | 2.0% |
| $10,000 to $14,999 | 516 | 3.9% |
| $15,000 to $24,999 | 767 | 5.8% |
| $25,000 to $34,999 | 568 | 4.3% |
| $35,000 to $49,999 | 1,917 | 14.5% |
| $50,000 to $74,999 | 2,300 | 17.4% |
| $75,000 to $99,999 | 2,313 | 17.5% |
| $100,000 to $149,999 | 2,353 | 17.8% |
| $150,000 to $199,999 | 1,058 | 8.0% |
| $200,000+ | 1,137 | 8.6% |
Family Income by Famaliy Size in Kannapolis
4-person families (2,811 | 21.3%) account for the highest median family income in Kannapolis with $101,746 per family, while 2-person families (6,262 | 47.4%) have the highest median income of $33,758 per family member.
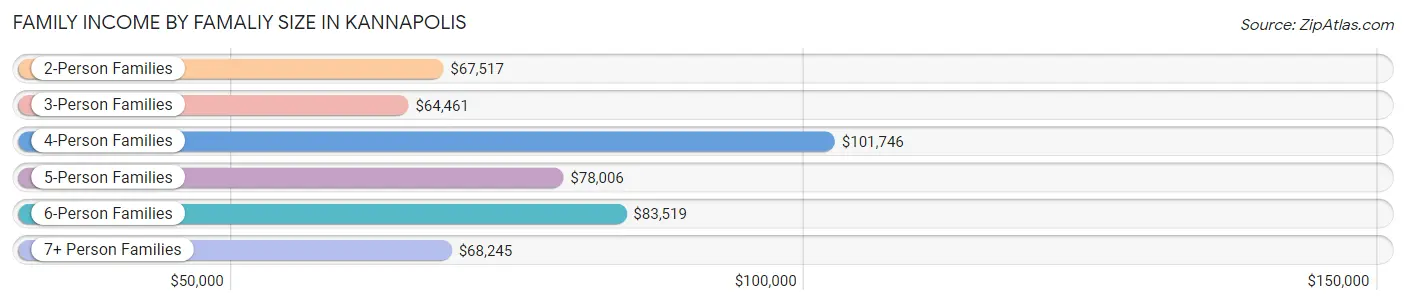
| Income Bracket | # Families | Median Income |
| 2-Person Families | 6,262 (47.4%) | $67,517 |
| 3-Person Families | 2,528 (19.1%) | $64,461 |
| 4-Person Families | 2,811 (21.3%) | $101,746 |
| 5-Person Families | 1,070 (8.1%) | $78,006 |
| 6-Person Families | 399 (3.0%) | $83,519 |
| 7+ Person Families | 149 (1.1%) | $68,245 |
| Total | 13,219 (100.0%) | $77,589 |
Family Income by Number of Earners in Kannapolis
The median family income in Kannapolis is $77,589, with families comprising 3+ earners (1,207) having the highest median family income of $154,792, while families with no earners (2,089) have the lowest median family income of $38,735, accounting for 9.1% and 15.8% of families, respectively.
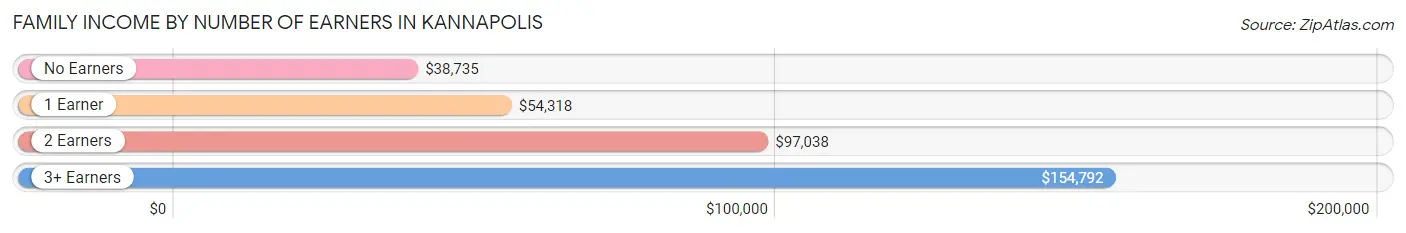
| Number of Earners | # Families | Median Income |
| No Earners | 2,089 (15.8%) | $38,735 |
| 1 Earner | 4,153 (31.4%) | $54,318 |
| 2 Earners | 5,770 (43.6%) | $97,038 |
| 3+ Earners | 1,207 (9.1%) | $154,792 |
| Total | 13,219 (100.0%) | $77,589 |
Household Income in Kannapolis
Household Income Brackets in Kannapolis
With 3,368 households falling in the category, the $50,000 to $74,999 income range is the most frequent in Kannapolis, accounting for 17.7% of all households. In contrast, only 761 households (4.0%) fall into the less than $10,000 income bracket, making it the least populous group.
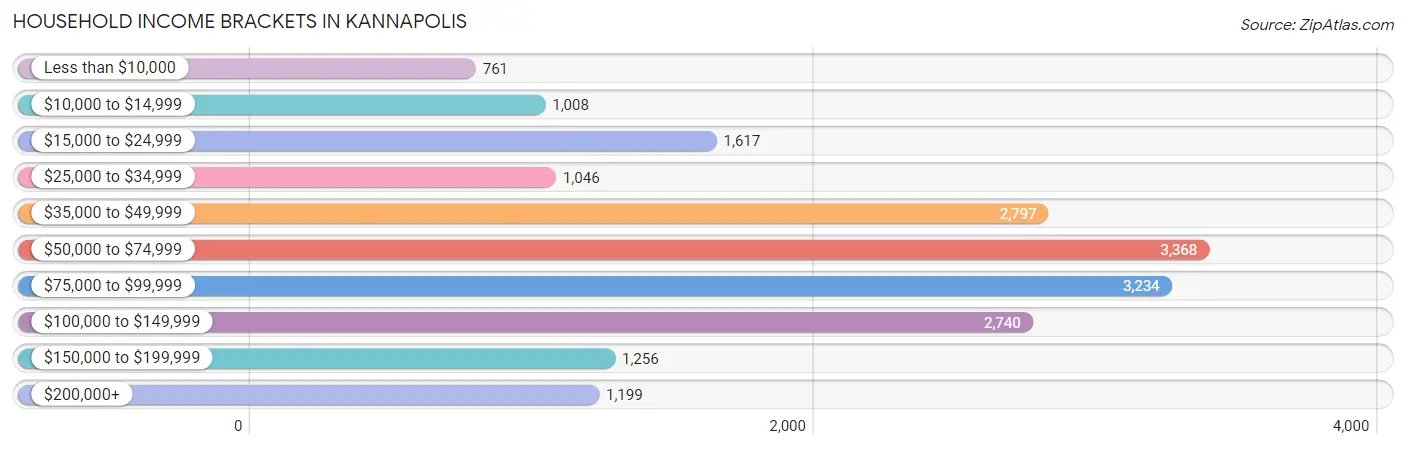
| Income Bracket | # Households | % Households |
| Less than $10,000 | 761 | 4.0% |
| $10,000 to $14,999 | 1,008 | 5.3% |
| $15,000 to $24,999 | 1,617 | 8.5% |
| $25,000 to $34,999 | 1,046 | 5.5% |
| $35,000 to $49,999 | 2,797 | 14.7% |
| $50,000 to $74,999 | 3,368 | 17.7% |
| $75,000 to $99,999 | 3,234 | 17.0% |
| $100,000 to $149,999 | 2,740 | 14.4% |
| $150,000 to $199,999 | 1,256 | 6.6% |
| $200,000+ | 1,199 | 6.3% |
Household Income by Householder Age in Kannapolis
The median household income in Kannapolis is $66,487, with the highest median household income of $75,237 found in the 25 to 44 years age bracket for the primary householder. A total of 7,606 households (40.0%) fall into this category. Meanwhile, the 65+ years age bracket for the primary householder has the lowest median household income of $43,364, with 4,291 households (22.6%) in this group.
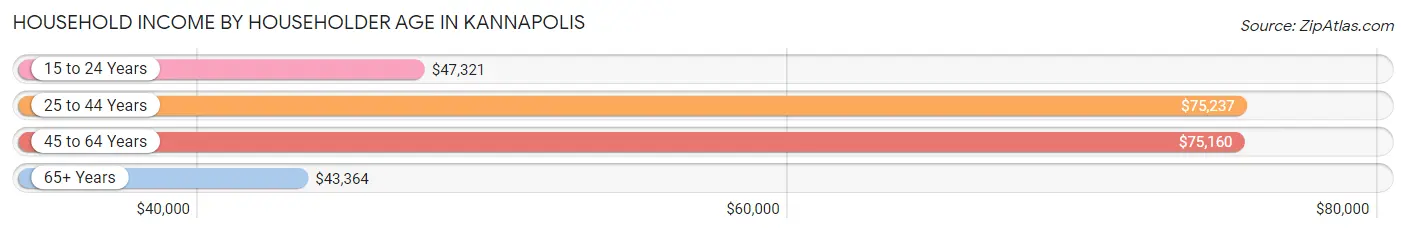
| Income Bracket | # Households | Median Income |
| 15 to 24 Years | 725 (3.8%) | $47,321 |
| 25 to 44 Years | 7,606 (40.0%) | $75,237 |
| 45 to 64 Years | 6,404 (33.7%) | $75,160 |
| 65+ Years | 4,291 (22.6%) | $43,364 |
| Total | 19,026 (100.0%) | $66,487 |
Poverty in Kannapolis
Income Below Poverty by Sex and Age in Kannapolis
With 9.0% poverty level for males and 14.3% for females among the residents of Kannapolis, 6 to 11 year old males and under 5 year old females are the most vulnerable to poverty, with 439 males (14.0%) and 478 females (28.3%) in their respective age groups living below the poverty level.
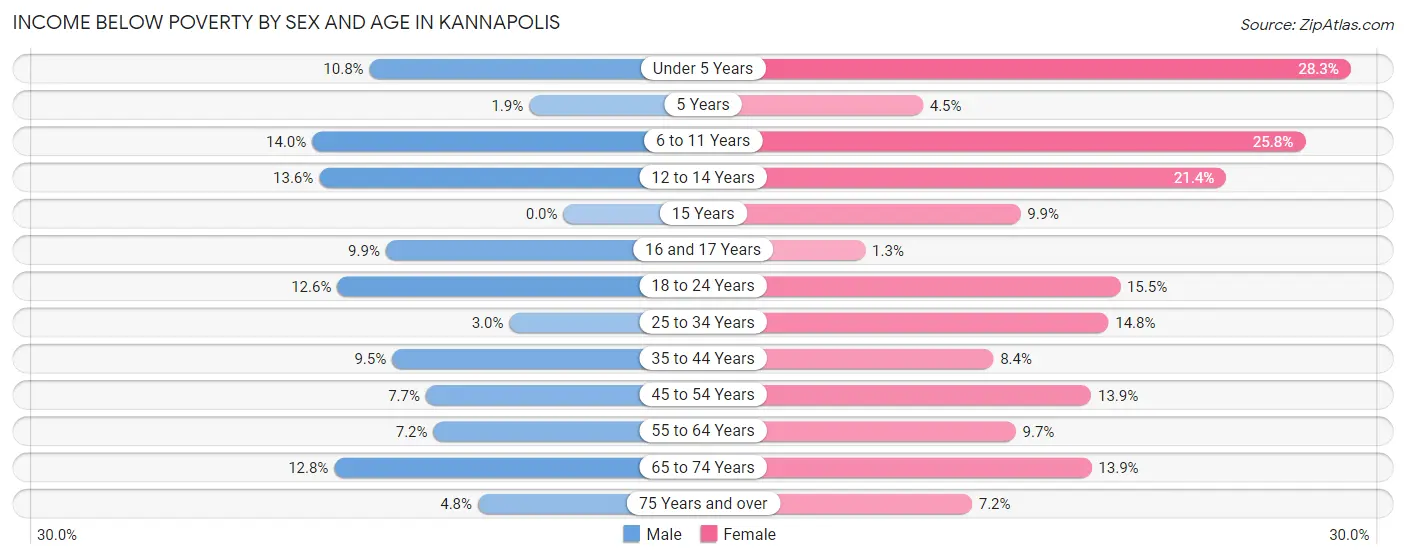
| Age Bracket | Male | Female |
| Under 5 Years | 183 (10.8%) | 478 (28.3%) |
| 5 Years | 6 (1.9%) | 17 (4.5%) |
| 6 to 11 Years | 439 (14.0%) | 625 (25.8%) |
| 12 to 14 Years | 102 (13.6%) | 259 (21.4%) |
| 15 Years | 0 (0.0%) | 16 (9.9%) |
| 16 and 17 Years | 84 (9.9%) | 8 (1.3%) |
| 18 to 24 Years | 290 (12.6%) | 281 (15.5%) |
| 25 to 34 Years | 107 (3.0%) | 564 (14.8%) |
| 35 to 44 Years | 328 (9.5%) | 354 (8.4%) |
| 45 to 54 Years | 321 (7.7%) | 395 (13.9%) |
| 55 to 64 Years | 204 (7.2%) | 293 (9.7%) |
| 65 to 74 Years | 283 (12.8%) | 401 (13.9%) |
| 75 Years and over | 44 (4.8%) | 105 (7.2%) |
| Total | 2,391 (9.0%) | 3,796 (14.3%) |
Income Above Poverty by Sex and Age in Kannapolis
According to the poverty statistics in Kannapolis, males aged 15 years and females aged 16 and 17 years are the age groups that are most secure financially, with 100.0% of males and 98.7% of females in these age groups living above the poverty line.
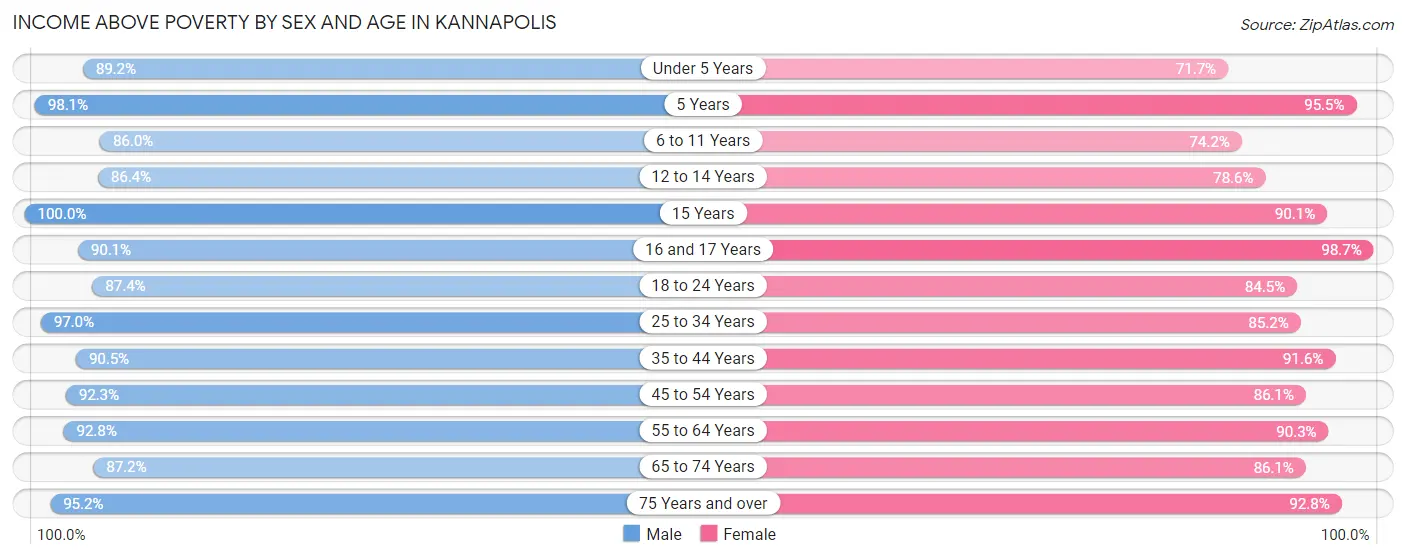
| Age Bracket | Male | Female |
| Under 5 Years | 1,512 (89.2%) | 1,209 (71.7%) |
| 5 Years | 308 (98.1%) | 360 (95.5%) |
| 6 to 11 Years | 2,699 (86.0%) | 1,798 (74.2%) |
| 12 to 14 Years | 648 (86.4%) | 951 (78.6%) |
| 15 Years | 298 (100.0%) | 145 (90.1%) |
| 16 and 17 Years | 765 (90.1%) | 607 (98.7%) |
| 18 to 24 Years | 2,013 (87.4%) | 1,533 (84.5%) |
| 25 to 34 Years | 3,447 (97.0%) | 3,236 (85.2%) |
| 35 to 44 Years | 3,109 (90.5%) | 3,846 (91.6%) |
| 45 to 54 Years | 3,871 (92.3%) | 2,450 (86.1%) |
| 55 to 64 Years | 2,615 (92.8%) | 2,735 (90.3%) |
| 65 to 74 Years | 1,934 (87.2%) | 2,483 (86.1%) |
| 75 Years and over | 881 (95.2%) | 1,346 (92.8%) |
| Total | 24,100 (91.0%) | 22,699 (85.7%) |
Income Below Poverty Among Married-Couple Families in Kannapolis
The poverty statistics for married-couple families in Kannapolis show that 2.5% or 240 of the total 9,419 families live below the poverty line. Families with 5 or more children have the highest poverty rate of 82.1%, comprising of 23 families. On the other hand, families with no children have the lowest poverty rate of 2.1%, which includes 113 families.
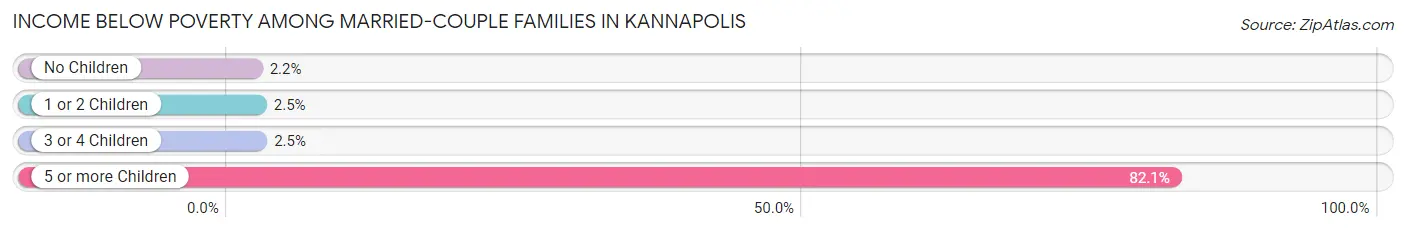
| Children | Above Poverty | Below Poverty |
| No Children | 5,141 (97.9%) | 113 (2.1%) |
| 1 or 2 Children | 3,303 (97.5%) | 85 (2.5%) |
| 3 or 4 Children | 730 (97.5%) | 19 (2.5%) |
| 5 or more Children | 5 (17.9%) | 23 (82.1%) |
| Total | 9,179 (97.5%) | 240 (2.5%) |
Income Below Poverty Among Single-Parent Households in Kannapolis
According to the poverty data in Kannapolis, 22.4% or 140 single-father households and 22.9% or 726 single-mother households are living below the poverty line. Among single-father households, those with no children have the highest poverty rate, with 131 households (35.8%) experiencing poverty. Likewise, among single-mother households, those with 5 or more children have the highest poverty rate, with 55 households (66.3%) falling below the poverty line.
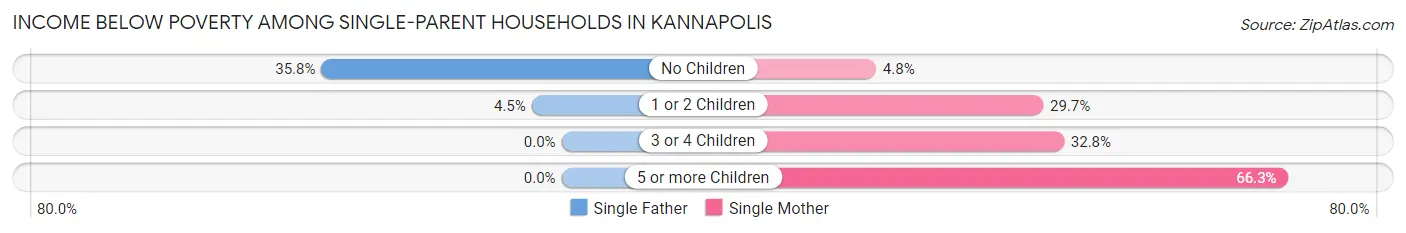
| Children | Single Father | Single Mother |
| No Children | 131 (35.8%) | 50 (4.8%) |
| 1 or 2 Children | 9 (4.5%) | 495 (29.7%) |
| 3 or 4 Children | 0 (0.0%) | 126 (32.8%) |
| 5 or more Children | 0 (0.0%) | 55 (66.3%) |
| Total | 140 (22.4%) | 726 (22.9%) |
Income Below Poverty Among Married-Couple vs Single-Parent Households in Kannapolis
The poverty data for Kannapolis shows that 240 of the married-couple family households (2.5%) and 866 of the single-parent households (22.8%) are living below the poverty level. Within the married-couple family households, those with 5 or more children have the highest poverty rate, with 23 households (82.1%) falling below the poverty line. Among the single-parent households, those with 5 or more children have the highest poverty rate, with 55 household (66.3%) living below poverty.
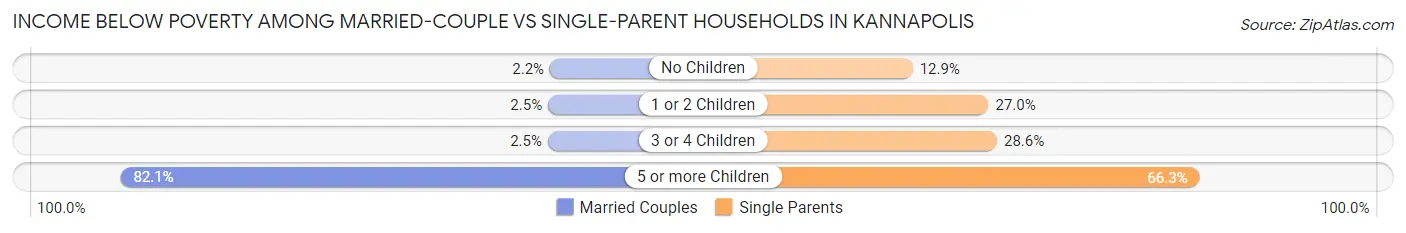
| Children | Married-Couple Families | Single-Parent Households |
| No Children | 113 (2.1%) | 181 (12.9%) |
| 1 or 2 Children | 85 (2.5%) | 504 (27.0%) |
| 3 or 4 Children | 19 (2.5%) | 126 (28.6%) |
| 5 or more Children | 23 (82.1%) | 55 (66.3%) |
| Total | 240 (2.5%) | 866 (22.8%) |
Race in Kannapolis
The most populous races in Kannapolis are White / Caucasian (33,428 | 62.7%), Black / African American (11,955 | 22.4%), and Hispanic or Latino (6,514 | 12.2%).
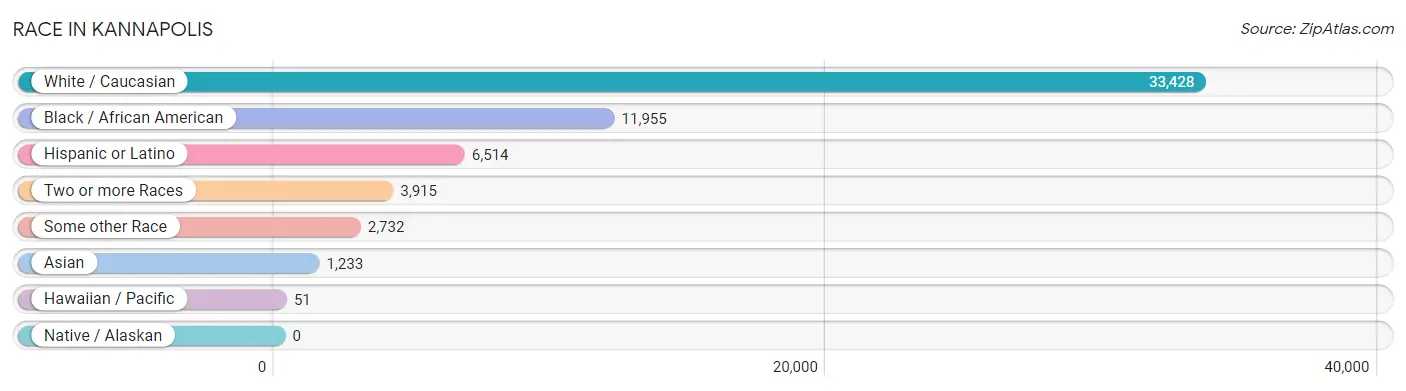
| Race | # Population | % Population |
| Asian | 1,233 | 2.3% |
| Black / African American | 11,955 | 22.4% |
| Hawaiian / Pacific | 51 | 0.1% |
| Hispanic or Latino | 6,514 | 12.2% |
| Native / Alaskan | 0 | 0.0% |
| White / Caucasian | 33,428 | 62.7% |
| Two or more Races | 3,915 | 7.3% |
| Some other Race | 2,732 | 5.1% |
| Total | 53,314 | 100.0% |
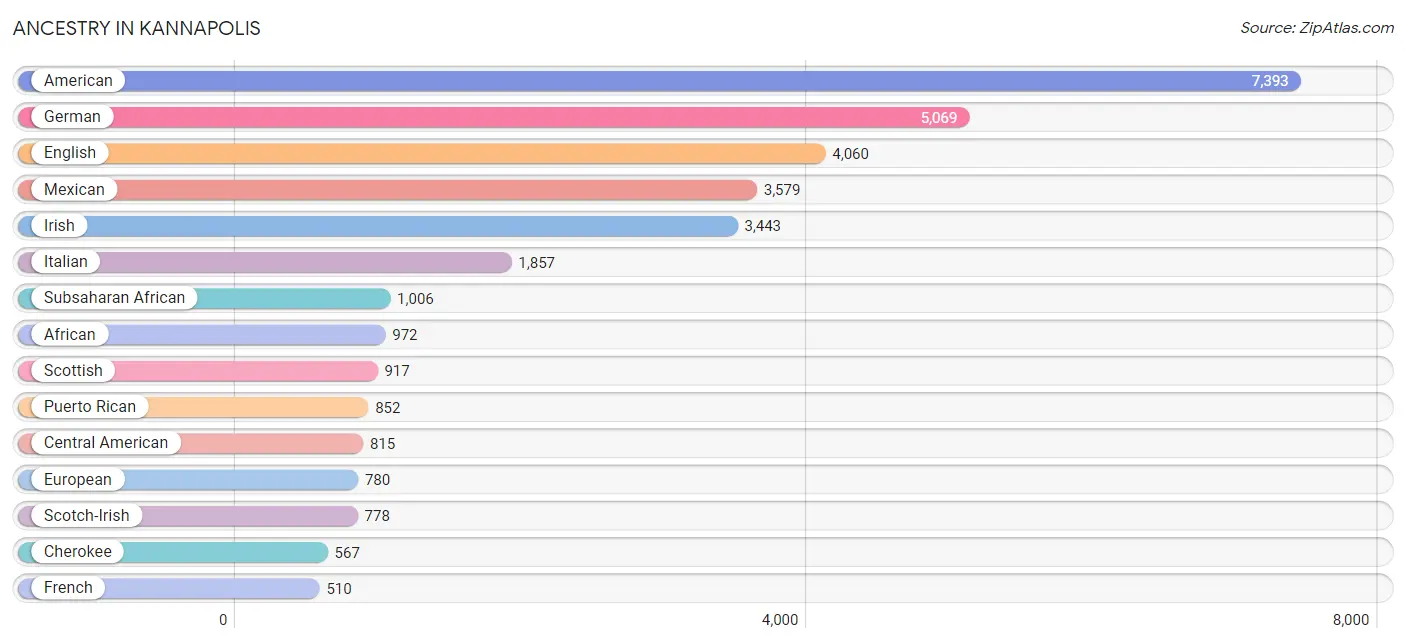
Ancestry in Kannapolis
The most populous ancestries reported in Kannapolis are American (7,393 | 13.9%), German (5,069 | 9.5%), English (4,060 | 7.6%), Mexican (3,579 | 6.7%), and Irish (3,443 | 6.5%), together accounting for 44.2% of all Kannapolis residents.
| Ancestry | # Population | % Population |
| African | 972 | 1.8% |
| American | 7,393 | 13.9% |
| Arab | 189 | 0.4% |
| Argentinean | 8 | 0.0% |
| Barbadian | 11 | 0.0% |
| Bhutanese | 40 | 0.1% |
| Blackfeet | 35 | 0.1% |
| Brazilian | 31 | 0.1% |
| British | 181 | 0.3% |
| British West Indian | 6 | 0.0% |
| Bulgarian | 26 | 0.1% |
| Burmese | 197 | 0.4% |
| Canadian | 21 | 0.0% |
| Central American | 815 | 1.5% |
| Cherokee | 567 | 1.1% |
| Choctaw | 15 | 0.0% |
| Colombian | 151 | 0.3% |
| Costa Rican | 143 | 0.3% |
| Cuban | 299 | 0.6% |
| Danish | 63 | 0.1% |
| Dominican | 65 | 0.1% |
| Dutch | 126 | 0.2% |
| Ecuadorian | 71 | 0.1% |
| Egyptian | 150 | 0.3% |
| English | 4,060 | 7.6% |
| European | 780 | 1.5% |
| Finnish | 18 | 0.0% |
| French | 510 | 1.0% |
| French American Indian | 273 | 0.5% |
| French Canadian | 72 | 0.1% |
| German | 5,069 | 9.5% |
| Greek | 23 | 0.0% |
| Guatemalan | 138 | 0.3% |
| Haitian | 216 | 0.4% |
| Honduran | 196 | 0.4% |
| Hungarian | 162 | 0.3% |
| Indian (Asian) | 410 | 0.8% |
| Iranian | 12 | 0.0% |
| Irish | 3,443 | 6.5% |
| Israeli | 14 | 0.0% |
| Italian | 1,857 | 3.5% |
| Jamaican | 309 | 0.6% |
| Kenyan | 34 | 0.1% |
| Korean | 345 | 0.6% |
| Lithuanian | 6 | 0.0% |
| Macedonian | 12 | 0.0% |
| Malaysian | 2 | 0.0% |
| Marshallese | 26 | 0.1% |
| Mexican | 3,579 | 6.7% |
| Native Hawaiian | 10 | 0.0% |
| Northern European | 31 | 0.1% |
| Norwegian | 117 | 0.2% |
| Paraguayan | 9 | 0.0% |
| Pennsylvania German | 18 | 0.0% |
| Peruvian | 40 | 0.1% |
| Polish | 404 | 0.8% |
| Portuguese | 62 | 0.1% |
| Puerto Rican | 852 | 1.6% |
| Romanian | 11 | 0.0% |
| Russian | 154 | 0.3% |
| Salvadoran | 338 | 0.6% |
| Scandinavian | 166 | 0.3% |
| Scotch-Irish | 778 | 1.5% |
| Scottish | 917 | 1.7% |
| Seminole | 10 | 0.0% |
| Slovak | 33 | 0.1% |
| Slovene | 279 | 0.5% |
| South American | 279 | 0.5% |
| Spaniard | 399 | 0.7% |
| Spanish | 31 | 0.1% |
| Sri Lankan | 57 | 0.1% |
| Subsaharan African | 1,006 | 1.9% |
| Swedish | 146 | 0.3% |
| Swiss | 28 | 0.1% |
| Thai | 510 | 1.0% |
| Ukrainian | 67 | 0.1% |
| Welsh | 131 | 0.3% |
| West Indian | 11 | 0.0% |
| Yugoslavian | 22 | 0.0% | View All 79 Rows |
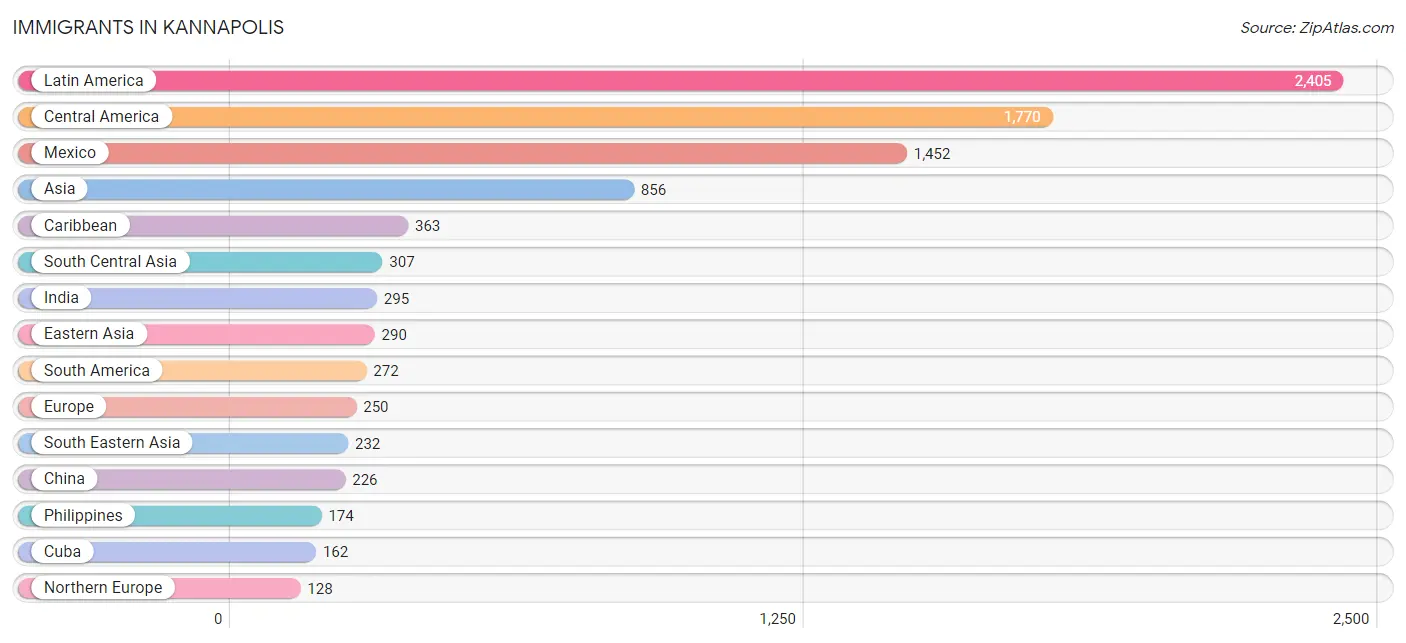
Immigrants in Kannapolis
The most numerous immigrant groups reported in Kannapolis came from Latin America (2,405 | 4.5%), Central America (1,770 | 3.3%), Mexico (1,452 | 2.7%), Asia (856 | 1.6%), and Caribbean (363 | 0.7%), together accounting for 12.8% of all Kannapolis residents.
| Immigration Origin | # Population | % Population |
| Africa | 72 | 0.1% |
| Argentina | 8 | 0.0% |
| Asia | 856 | 1.6% |
| Australia | 46 | 0.1% |
| Brazil | 92 | 0.2% |
| Caribbean | 363 | 0.7% |
| Central America | 1,770 | 3.3% |
| China | 226 | 0.4% |
| Colombia | 59 | 0.1% |
| Costa Rica | 75 | 0.1% |
| Cuba | 162 | 0.3% |
| Dominican Republic | 25 | 0.1% |
| Eastern Africa | 34 | 0.1% |
| Eastern Asia | 290 | 0.5% |
| Eastern Europe | 64 | 0.1% |
| Ecuador | 91 | 0.2% |
| Egypt | 38 | 0.1% |
| El Salvador | 114 | 0.2% |
| England | 24 | 0.1% |
| Europe | 250 | 0.5% |
| Germany | 6 | 0.0% |
| Guatemala | 42 | 0.1% |
| Haiti | 46 | 0.1% |
| Honduras | 67 | 0.1% |
| Hong Kong | 60 | 0.1% |
| Hungary | 20 | 0.0% |
| India | 295 | 0.5% |
| Iran | 12 | 0.0% |
| Italy | 26 | 0.1% |
| Jamaica | 124 | 0.2% |
| Kenya | 34 | 0.1% |
| Korea | 64 | 0.1% |
| Latin America | 2,405 | 4.5% |
| Mexico | 1,452 | 2.7% |
| Micronesia | 26 | 0.1% |
| Nicaragua | 20 | 0.0% |
| Northern Africa | 38 | 0.1% |
| Northern Europe | 128 | 0.2% |
| Oceania | 72 | 0.1% |
| Philippines | 174 | 0.3% |
| Russia | 10 | 0.0% |
| Scotland | 66 | 0.1% |
| South America | 272 | 0.5% |
| South Central Asia | 307 | 0.6% |
| South Eastern Asia | 232 | 0.4% |
| Southern Europe | 52 | 0.1% |
| Spain | 26 | 0.1% |
| Sweden | 15 | 0.0% |
| Vietnam | 57 | 0.1% |
| Western Asia | 27 | 0.1% |
| Western Europe | 6 | 0.0% | View All 51 Rows |
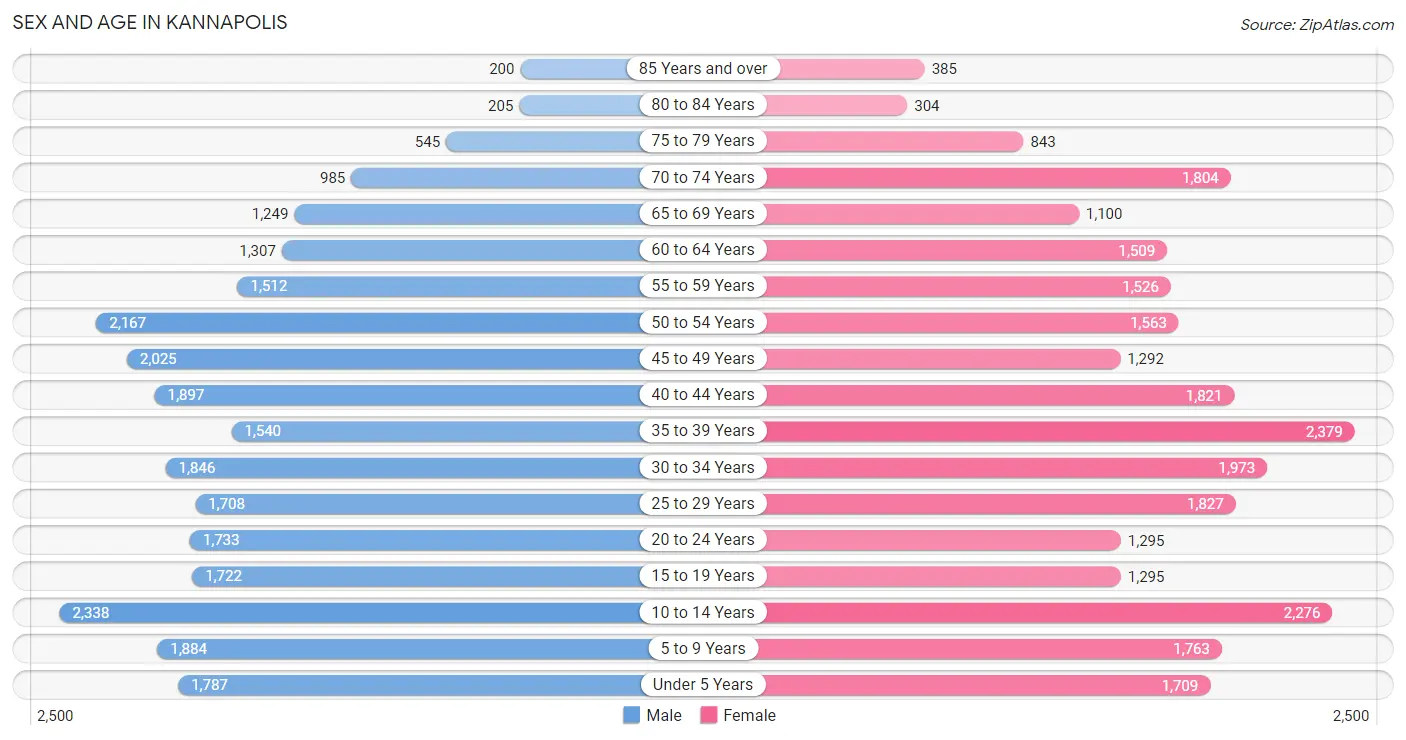
Sex and Age in Kannapolis
Sex and Age in Kannapolis
The most populous age groups in Kannapolis are 10 to 14 Years (2,338 | 8.8%) for men and 35 to 39 Years (2,379 | 8.9%) for women.
| Age Bracket | Male | Female |
| Under 5 Years | 1,787 (6.7%) | 1,709 (6.4%) |
| 5 to 9 Years | 1,884 (7.1%) | 1,763 (6.6%) |
| 10 to 14 Years | 2,338 (8.8%) | 2,276 (8.5%) |
| 15 to 19 Years | 1,722 (6.5%) | 1,295 (4.9%) |
| 20 to 24 Years | 1,733 (6.5%) | 1,295 (4.9%) |
| 25 to 29 Years | 1,708 (6.4%) | 1,827 (6.9%) |
| 30 to 34 Years | 1,846 (6.9%) | 1,973 (7.4%) |
| 35 to 39 Years | 1,540 (5.8%) | 2,379 (8.9%) |
| 40 to 44 Years | 1,897 (7.1%) | 1,821 (6.8%) |
| 45 to 49 Years | 2,025 (7.6%) | 1,292 (4.9%) |
| 50 to 54 Years | 2,167 (8.1%) | 1,563 (5.9%) |
| 55 to 59 Years | 1,512 (5.7%) | 1,526 (5.7%) |
| 60 to 64 Years | 1,307 (4.9%) | 1,509 (5.7%) |
| 65 to 69 Years | 1,249 (4.7%) | 1,100 (4.1%) |
| 70 to 74 Years | 985 (3.7%) | 1,804 (6.8%) |
| 75 to 79 Years | 545 (2.1%) | 843 (3.2%) |
| 80 to 84 Years | 205 (0.8%) | 304 (1.1%) |
| 85 Years and over | 200 (0.7%) | 385 (1.4%) |
| Total | 26,650 (100.0%) | 26,664 (100.0%) |
Families and Households in Kannapolis
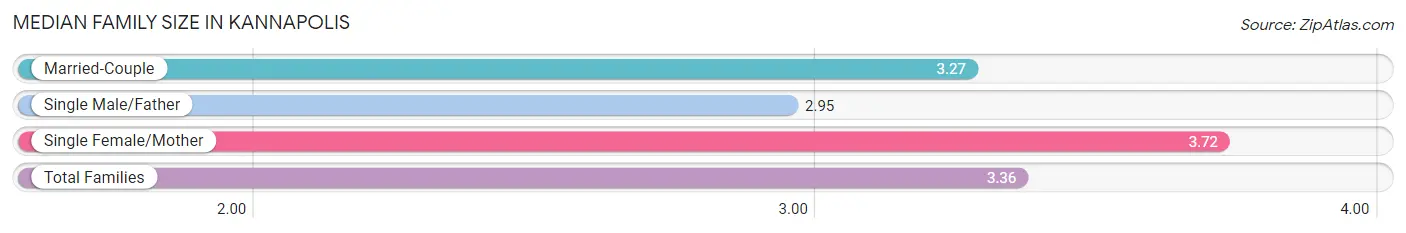
Median Family Size in Kannapolis
The median family size in Kannapolis is 3.36 persons per family, with single female/mother families (3,175 | 24.0%) accounting for the largest median family size of 3.72 persons per family. On the other hand, single male/father families (625 | 4.7%) represent the smallest median family size with 2.95 persons per family.
| Family Type | # Families | Family Size |
| Married-Couple | 9,419 (71.3%) | 3.27 |
| Single Male/Father | 625 (4.7%) | 2.95 |
| Single Female/Mother | 3,175 (24.0%) | 3.72 |
| Total Families | 13,219 (100.0%) | 3.36 |
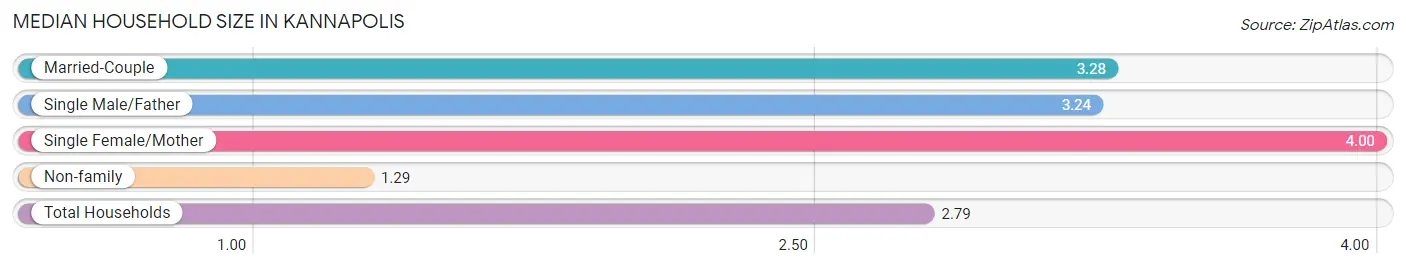
Median Household Size in Kannapolis
The median household size in Kannapolis is 2.79 persons per household, with single female/mother households (3,175 | 16.7%) accounting for the largest median household size of 4 persons per household. non-family households (5,807 | 30.5%) represent the smallest median household size with 1.29 persons per household.
| Household Type | # Households | Household Size |
| Married-Couple | 9,419 (49.5%) | 3.28 |
| Single Male/Father | 625 (3.3%) | 3.24 |
| Single Female/Mother | 3,175 (16.7%) | 4.00 |
| Non-family | 5,807 (30.5%) | 1.29 |
| Total Households | 19,026 (100.0%) | 2.79 |
Household Size by Marriage Status in Kannapolis
Out of a total of 19,026 households in Kannapolis, 13,219 (69.5%) are family households, while 5,807 (30.5%) are nonfamily households. The most numerous type of family households are 2-person households, comprising 5,986, and the most common type of nonfamily households are 1-person households, comprising 4,565.
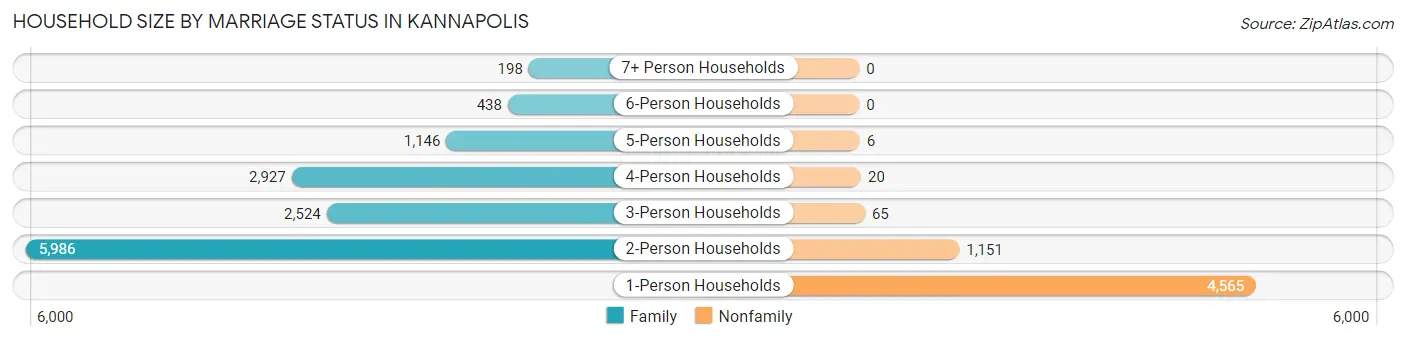
| Household Size | Family Households | Nonfamily Households |
| 1-Person Households | - | 4,565 (24.0%) |
| 2-Person Households | 5,986 (31.5%) | 1,151 (6.0%) |
| 3-Person Households | 2,524 (13.3%) | 65 (0.3%) |
| 4-Person Households | 2,927 (15.4%) | 20 (0.1%) |
| 5-Person Households | 1,146 (6.0%) | 6 (0.0%) |
| 6-Person Households | 438 (2.3%) | 0 (0.0%) |
| 7+ Person Households | 198 (1.0%) | 0 (0.0%) |
| Total | 13,219 (69.5%) | 5,807 (30.5%) |
Female Fertility in Kannapolis
Fertility by Age in Kannapolis
Average fertility rate in Kannapolis is 34.0 births per 1,000 women. Women in the age bracket of 20 to 34 years have the highest fertility rate with 58.0 births per 1,000 women. Women in the age bracket of 20 to 34 years acount for 71.8% of all women with births.
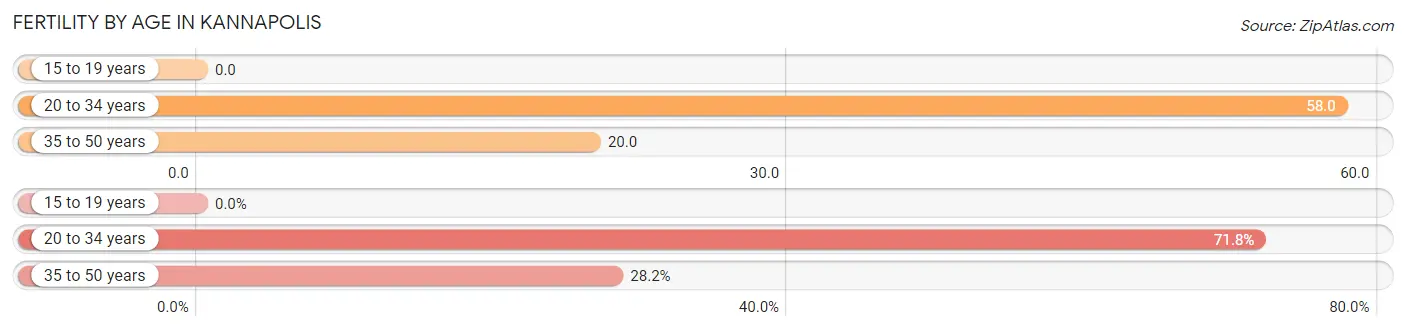
| Age Bracket | Women with Births | Births / 1,000 Women |
| 15 to 19 years | 0 (0.0%) | 0.0 |
| 20 to 34 years | 298 (71.8%) | 58.0 |
| 35 to 50 years | 117 (28.2%) | 20.0 |
| Total | 415 (100.0%) | 34.0 |
Fertility by Age by Marriage Status in Kannapolis
93.0% of women with births (415) in Kannapolis are married. The highest percentage of unmarried women with births falls into 20 to 34 years age bracket with 9.7% of them unmarried at the time of birth, while the lowest percentage of unmarried women with births belong to 35 to 50 years age bracket with 0.0% of them unmarried.
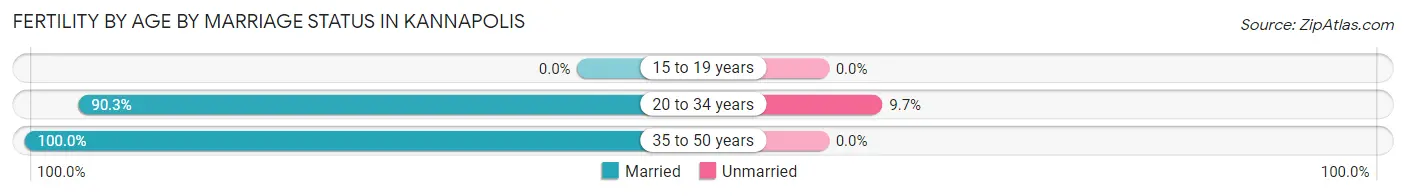
| Age Bracket | Married | Unmarried |
| 15 to 19 years | 0 (0.0%) | 0 (0.0%) |
| 20 to 34 years | 269 (90.3%) | 29 (9.7%) |
| 35 to 50 years | 117 (100.0%) | 0 (0.0%) |
| Total | 386 (93.0%) | 29 (7.0%) |
Fertility by Education in Kannapolis
Average fertility rate in Kannapolis is 34.0 births per 1,000 women. Women with the education attainment of graduate degree have the highest fertility rate of 64.0 births per 1,000 women, while women with the education attainment of high school diploma have the lowest fertility at 16.0 births per 1,000 women. Women with the education attainment of bachelor's degree represent 37.6% of all women with births.
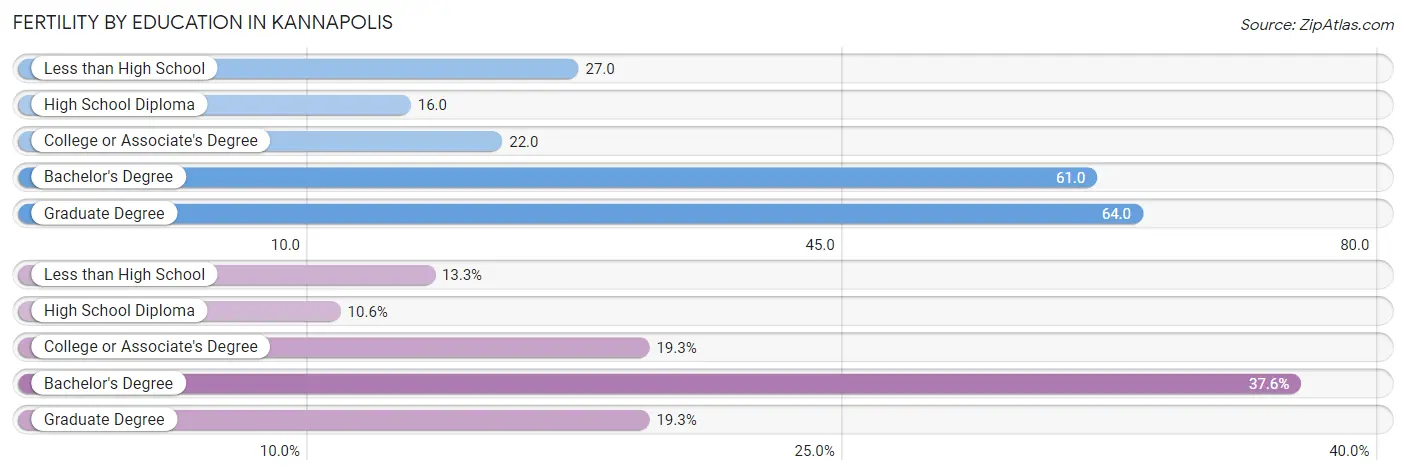
| Educational Attainment | Women with Births | Births / 1,000 Women |
| Less than High School | 55 (13.3%) | 27.0 |
| High School Diploma | 44 (10.6%) | 16.0 |
| College or Associate's Degree | 80 (19.3%) | 22.0 |
| Bachelor's Degree | 156 (37.6%) | 61.0 |
| Graduate Degree | 80 (19.3%) | 64.0 |
| Total | 415 (100.0%) | 34.0 |
Fertility by Education by Marriage Status in Kannapolis
7.0% of women with births in Kannapolis are unmarried. Women with the educational attainment of high school diploma are most likely to be married with 100.0% of them married at childbirth, while women with the educational attainment of less than high school are least likely to be married with 27.3% of them unmarried at childbirth.
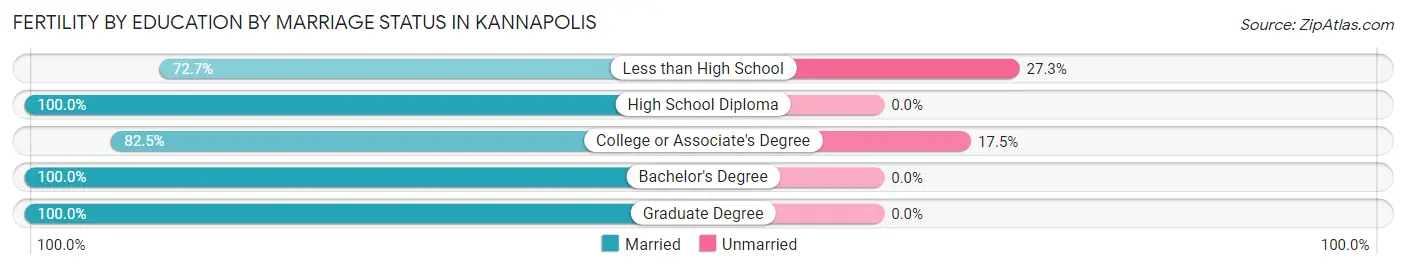
| Educational Attainment | Married | Unmarried |
| Less than High School | 40 (72.7%) | 15 (27.3%) |
| High School Diploma | 44 (100.0%) | 0 (0.0%) |
| College or Associate's Degree | 66 (82.5%) | 14 (17.5%) |
| Bachelor's Degree | 156 (100.0%) | 0 (0.0%) |
| Graduate Degree | 80 (100.0%) | 0 (0.0%) |
| Total | 386 (93.0%) | 29 (7.0%) |
Employment Characteristics in Kannapolis
Employment by Class of Employer in Kannapolis
Among the 24,806 employed individuals in Kannapolis, private company employees (17,888 | 72.1%), local government employees (1,813 | 7.3%), and not-for-profit organizations (1,530 | 6.2%) make up the most common classes of employment.
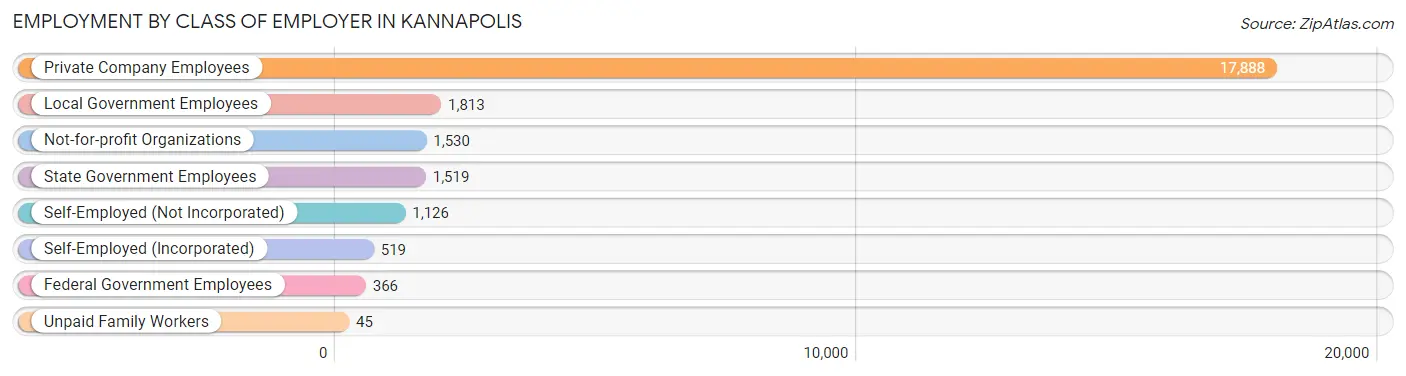
| Employer Class | # Employees | % Employees |
| Private Company Employees | 17,888 | 72.1% |
| Self-Employed (Incorporated) | 519 | 2.1% |
| Self-Employed (Not Incorporated) | 1,126 | 4.5% |
| Not-for-profit Organizations | 1,530 | 6.2% |
| Local Government Employees | 1,813 | 7.3% |
| State Government Employees | 1,519 | 6.1% |
| Federal Government Employees | 366 | 1.5% |
| Unpaid Family Workers | 45 | 0.2% |
| Total | 24,806 | 100.0% |
Employment Status by Age in Kannapolis
According to the labor force statistics for Kannapolis, out of the total population over 16 years of age (41,098), 65.2% or 26,796 individuals are in the labor force, with 6.1% or 1,635 of them unemployed. The age group with the highest labor force participation rate is 25 to 29 years, with 91.1% or 3,220 individuals in the labor force. Within the labor force, the 16 to 19 years age range has the highest percentage of unemployed individuals, with 17.8% or 207 of them being unemployed.
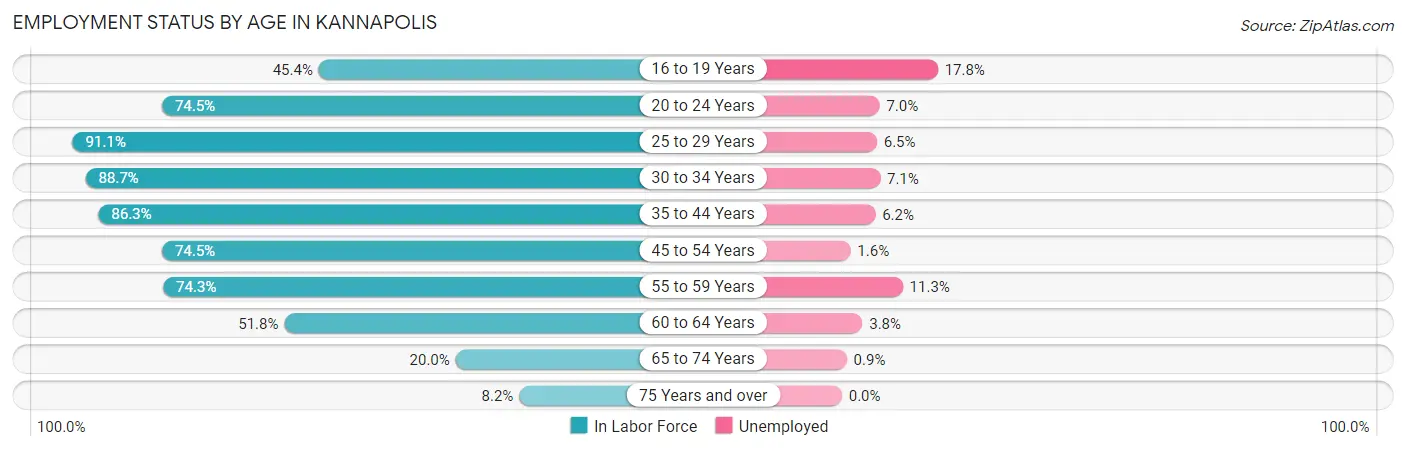
| Age Bracket | In Labor Force | Unemployed |
| 16 to 19 Years | 1,161 (45.4%) | 207 (17.8%) |
| 20 to 24 Years | 2,256 (74.5%) | 158 (7.0%) |
| 25 to 29 Years | 3,220 (91.1%) | 209 (6.5%) |
| 30 to 34 Years | 3,387 (88.7%) | 240 (7.1%) |
| 35 to 44 Years | 6,591 (86.3%) | 409 (6.2%) |
| 45 to 54 Years | 5,250 (74.5%) | 84 (1.6%) |
| 55 to 59 Years | 2,257 (74.3%) | 255 (11.3%) |
| 60 to 64 Years | 1,459 (51.8%) | 55 (3.8%) |
| 65 to 74 Years | 1,028 (20.0%) | 9 (0.9%) |
| 75 Years and over | 204 (8.2%) | 0 (0.0%) |
| Total | 26,796 (65.2%) | 1,635 (6.1%) |
Employment Status by Educational Attainment in Kannapolis
According to labor force statistics for Kannapolis, 79.5% of individuals (22,174) out of the total population between 25 and 64 years of age (27,892) are in the labor force, with 5.6% or 1,242 of them being unemployed. The group with the highest labor force participation rate are those with the educational attainment of bachelor's degree or higher, with 86.3% or 7,384 individuals in the labor force. Within the labor force, individuals with high school diploma education have the highest percentage of unemployment, with 9.7% or 553 of them being unemployed.
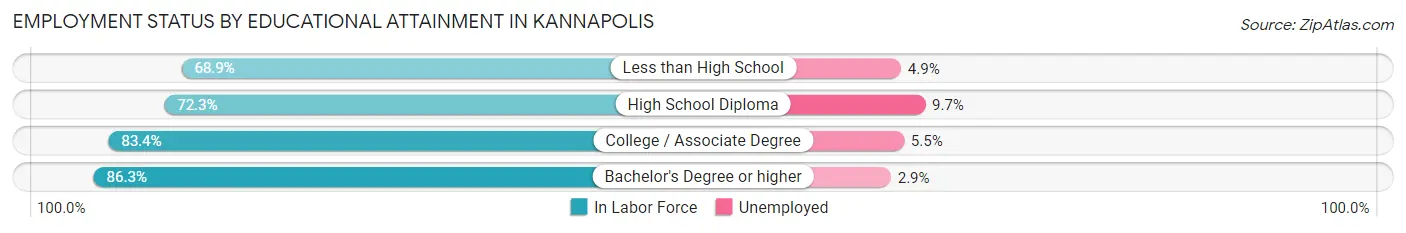
| Educational Attainment | In Labor Force | Unemployed |
| Less than High School | 2,243 (68.9%) | 159 (4.9%) |
| High School Diploma | 5,702 (72.3%) | 765 (9.7%) |
| College / Associate Degree | 6,835 (83.4%) | 451 (5.5%) |
| Bachelor's Degree or higher | 7,384 (86.3%) | 248 (2.9%) |
| Total | 22,174 (79.5%) | 1,562 (5.6%) |
Employment Occupations by Sex in Kannapolis
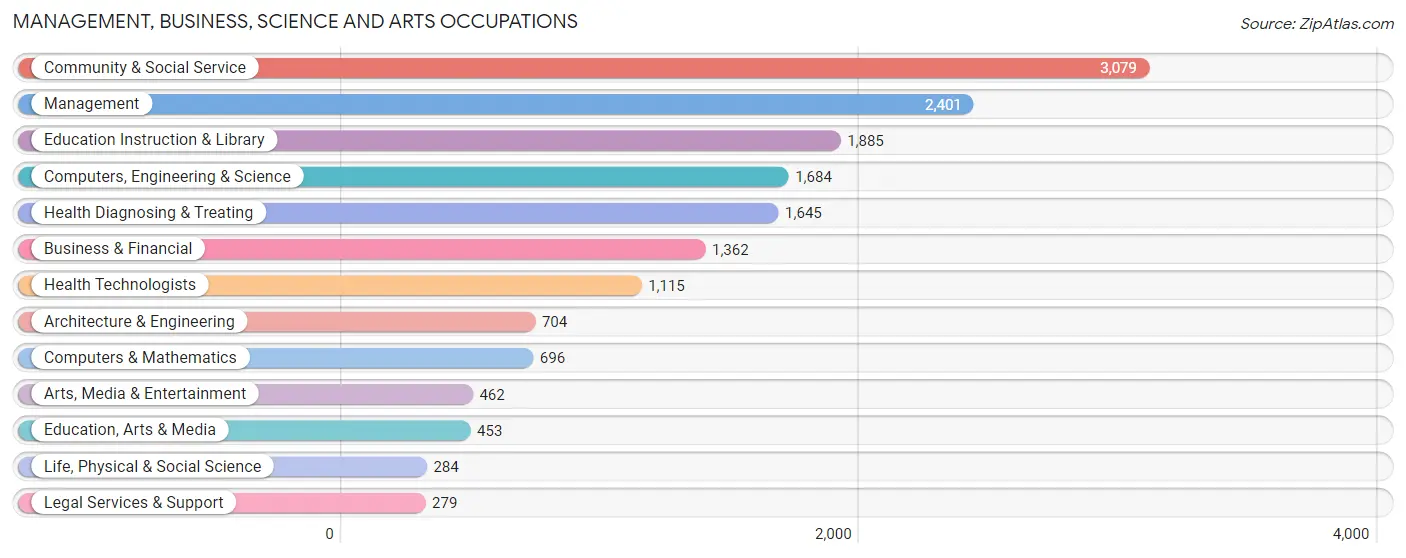
Management, Business, Science and Arts Occupations
The most common Management, Business, Science and Arts occupations in Kannapolis are Community & Social Service (3,079 | 12.2%), Management (2,401 | 9.6%), Education Instruction & Library (1,885 | 7.5%), Computers, Engineering & Science (1,684 | 6.7%), and Health Diagnosing & Treating (1,645 | 6.5%).
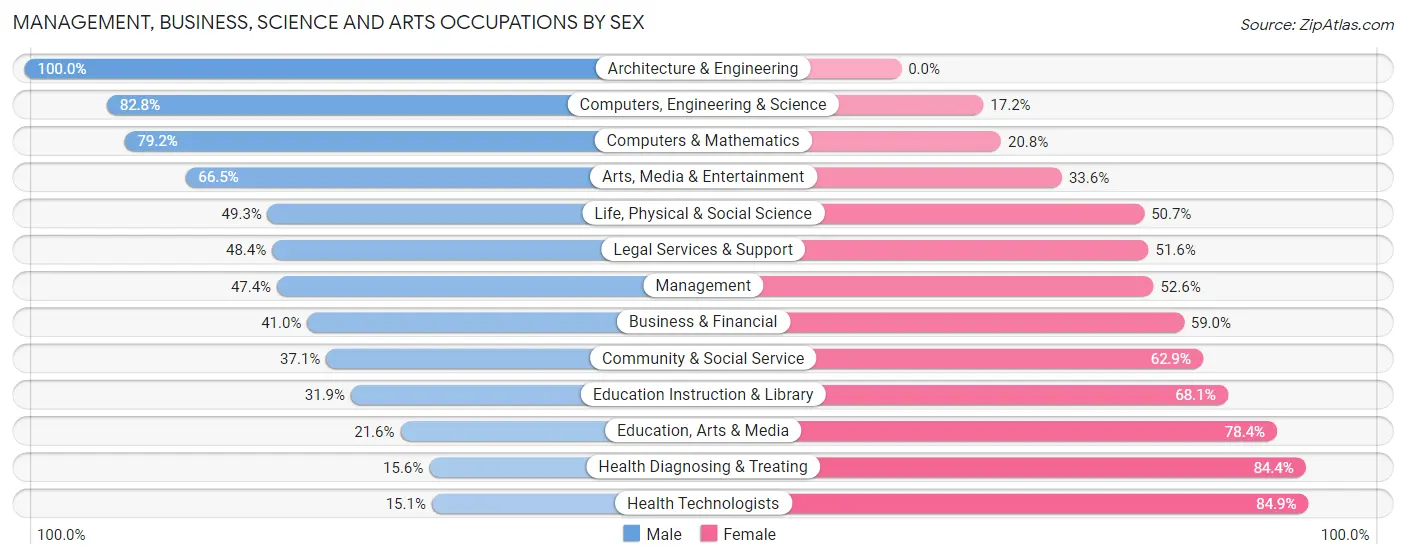
Management, Business, Science and Arts Occupations by Sex
Within the Management, Business, Science and Arts occupations in Kannapolis, the most male-oriented occupations are Architecture & Engineering (100.0%), Computers, Engineering & Science (82.8%), and Computers & Mathematics (79.2%), while the most female-oriented occupations are Health Technologists (84.9%), Health Diagnosing & Treating (84.4%), and Education, Arts & Media (78.4%).
| Occupation | Male | Female |
| Management | 1,137 (47.4%) | 1,264 (52.6%) |
| Business & Financial | 559 (41.0%) | 803 (59.0%) |
| Computers, Engineering & Science | 1,395 (82.8%) | 289 (17.2%) |
| Computers & Mathematics | 551 (79.2%) | 145 (20.8%) |
| Architecture & Engineering | 704 (100.0%) | 0 (0.0%) |
| Life, Physical & Social Science | 140 (49.3%) | 144 (50.7%) |
| Community & Social Service | 1,142 (37.1%) | 1,937 (62.9%) |
| Education, Arts & Media | 98 (21.6%) | 355 (78.4%) |
| Legal Services & Support | 135 (48.4%) | 144 (51.6%) |
| Education Instruction & Library | 602 (31.9%) | 1,283 (68.1%) |
| Arts, Media & Entertainment | 307 (66.4%) | 155 (33.6%) |
| Health Diagnosing & Treating | 257 (15.6%) | 1,388 (84.4%) |
| Health Technologists | 168 (15.1%) | 947 (84.9%) |
| Total (Category) | 4,490 (44.2%) | 5,681 (55.8%) |
| Total (Overall) | 13,190 (52.5%) | 11,949 (47.5%) |
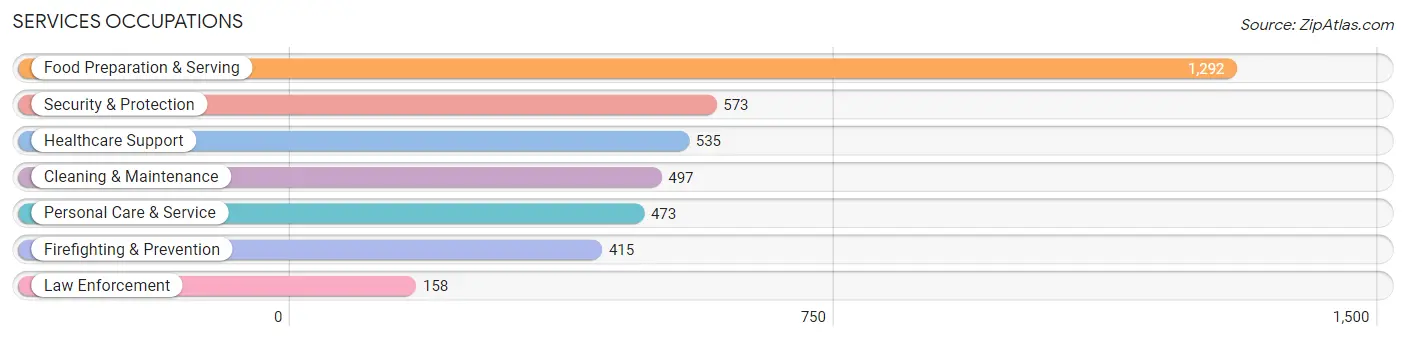
Services Occupations
The most common Services occupations in Kannapolis are Food Preparation & Serving (1,292 | 5.1%), Security & Protection (573 | 2.3%), Healthcare Support (535 | 2.1%), Cleaning & Maintenance (497 | 2.0%), and Personal Care & Service (473 | 1.9%).
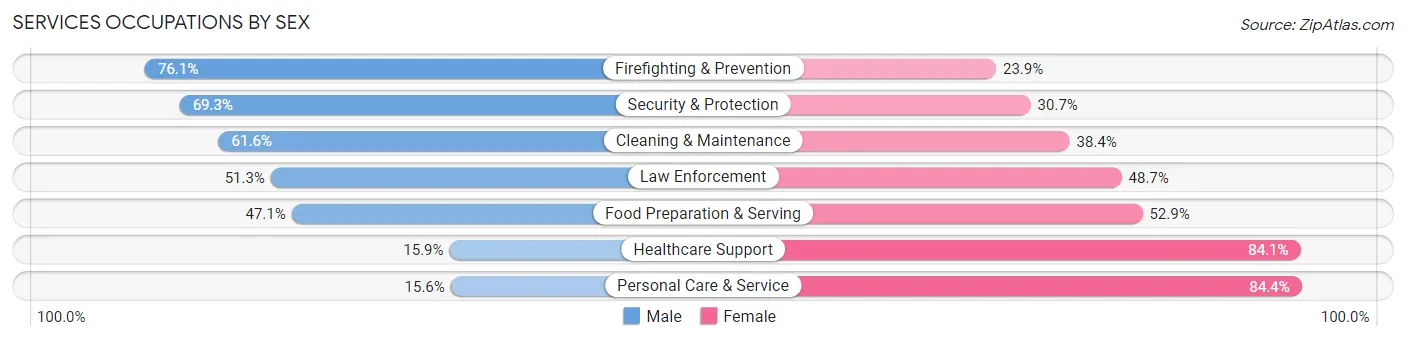
Services Occupations by Sex
Within the Services occupations in Kannapolis, the most male-oriented occupations are Firefighting & Prevention (76.1%), Security & Protection (69.3%), and Cleaning & Maintenance (61.6%), while the most female-oriented occupations are Personal Care & Service (84.4%), Healthcare Support (84.1%), and Food Preparation & Serving (52.9%).
| Occupation | Male | Female |
| Healthcare Support | 85 (15.9%) | 450 (84.1%) |
| Security & Protection | 397 (69.3%) | 176 (30.7%) |
| Firefighting & Prevention | 316 (76.1%) | 99 (23.9%) |
| Law Enforcement | 81 (51.3%) | 77 (48.7%) |
| Food Preparation & Serving | 609 (47.1%) | 683 (52.9%) |
| Cleaning & Maintenance | 306 (61.6%) | 191 (38.4%) |
| Personal Care & Service | 74 (15.6%) | 399 (84.4%) |
| Total (Category) | 1,471 (43.6%) | 1,899 (56.4%) |
| Total (Overall) | 13,190 (52.5%) | 11,949 (47.5%) |
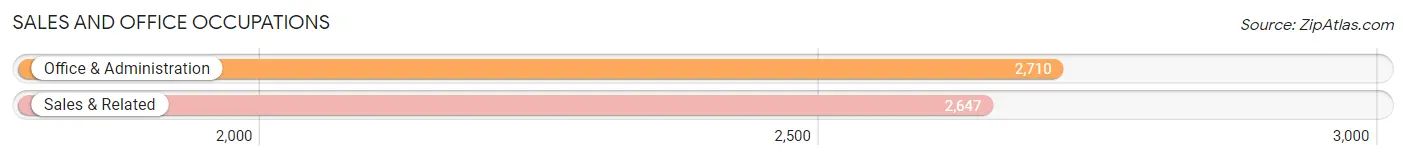
Sales and Office Occupations
The most common Sales and Office occupations in Kannapolis are Office & Administration (2,710 | 10.8%), and Sales & Related (2,647 | 10.5%).
Sales and Office Occupations by Sex
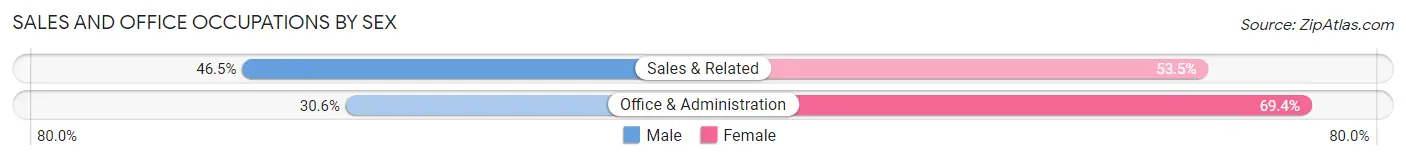
| Occupation | Male | Female |
| Sales & Related | 1,231 (46.5%) | 1,416 (53.5%) |
| Office & Administration | 829 (30.6%) | 1,881 (69.4%) |
| Total (Category) | 2,060 (38.5%) | 3,297 (61.6%) |
| Total (Overall) | 13,190 (52.5%) | 11,949 (47.5%) |
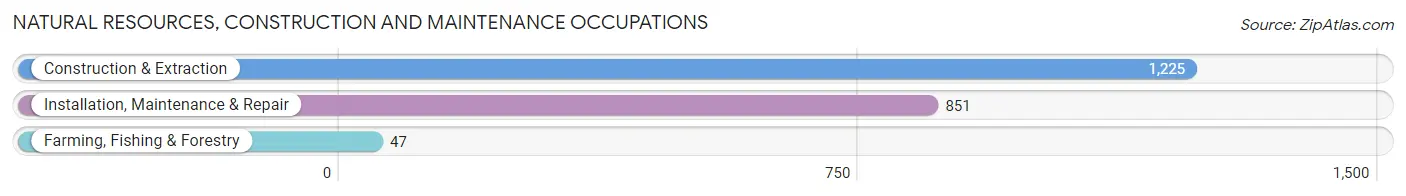
Natural Resources, Construction and Maintenance Occupations
The most common Natural Resources, Construction and Maintenance occupations in Kannapolis are Construction & Extraction (1,225 | 4.9%), Installation, Maintenance & Repair (851 | 3.4%), and Farming, Fishing & Forestry (47 | 0.2%).
Natural Resources, Construction and Maintenance Occupations by Sex
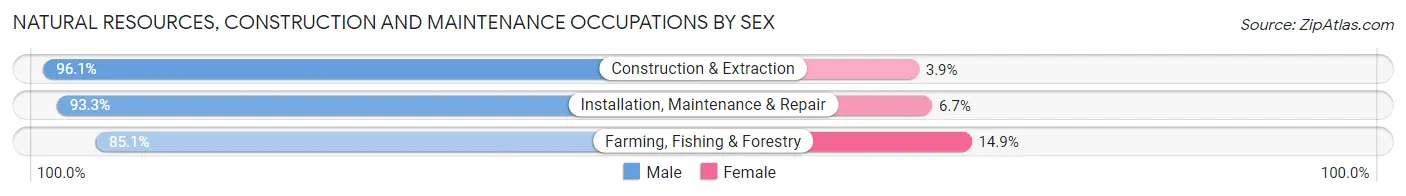
| Occupation | Male | Female |
| Farming, Fishing & Forestry | 40 (85.1%) | 7 (14.9%) |
| Construction & Extraction | 1,177 (96.1%) | 48 (3.9%) |
| Installation, Maintenance & Repair | 794 (93.3%) | 57 (6.7%) |
| Total (Category) | 2,011 (94.7%) | 112 (5.3%) |
| Total (Overall) | 13,190 (52.5%) | 11,949 (47.5%) |
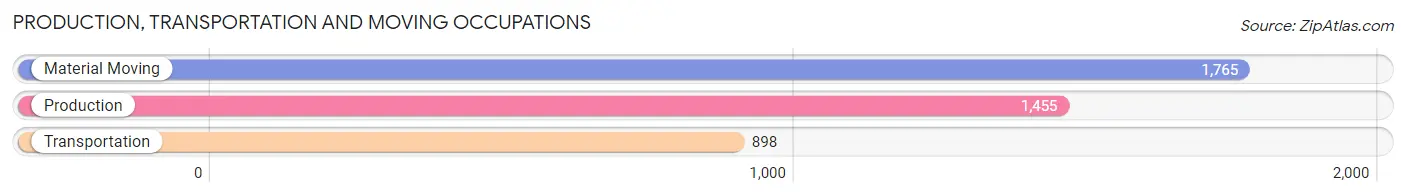
Production, Transportation and Moving Occupations
The most common Production, Transportation and Moving occupations in Kannapolis are Material Moving (1,765 | 7.0%), Production (1,455 | 5.8%), and Transportation (898 | 3.6%).
Production, Transportation and Moving Occupations by Sex
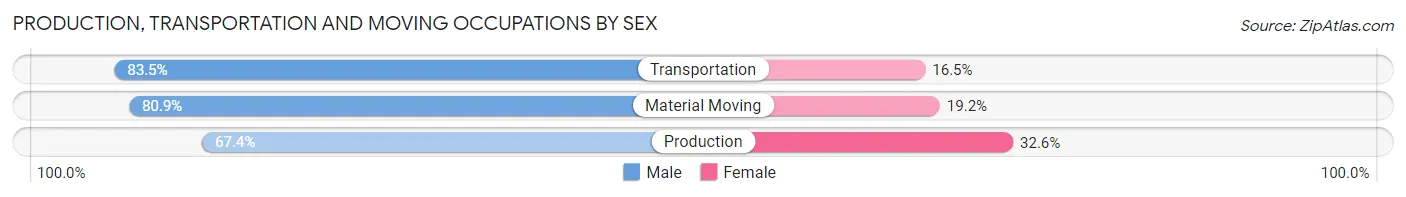
| Occupation | Male | Female |
| Production | 981 (67.4%) | 474 (32.6%) |
| Transportation | 750 (83.5%) | 148 (16.5%) |
| Material Moving | 1,427 (80.8%) | 338 (19.2%) |
| Total (Category) | 3,158 (76.7%) | 960 (23.3%) |
| Total (Overall) | 13,190 (52.5%) | 11,949 (47.5%) |
Employment Industries by Sex in Kannapolis
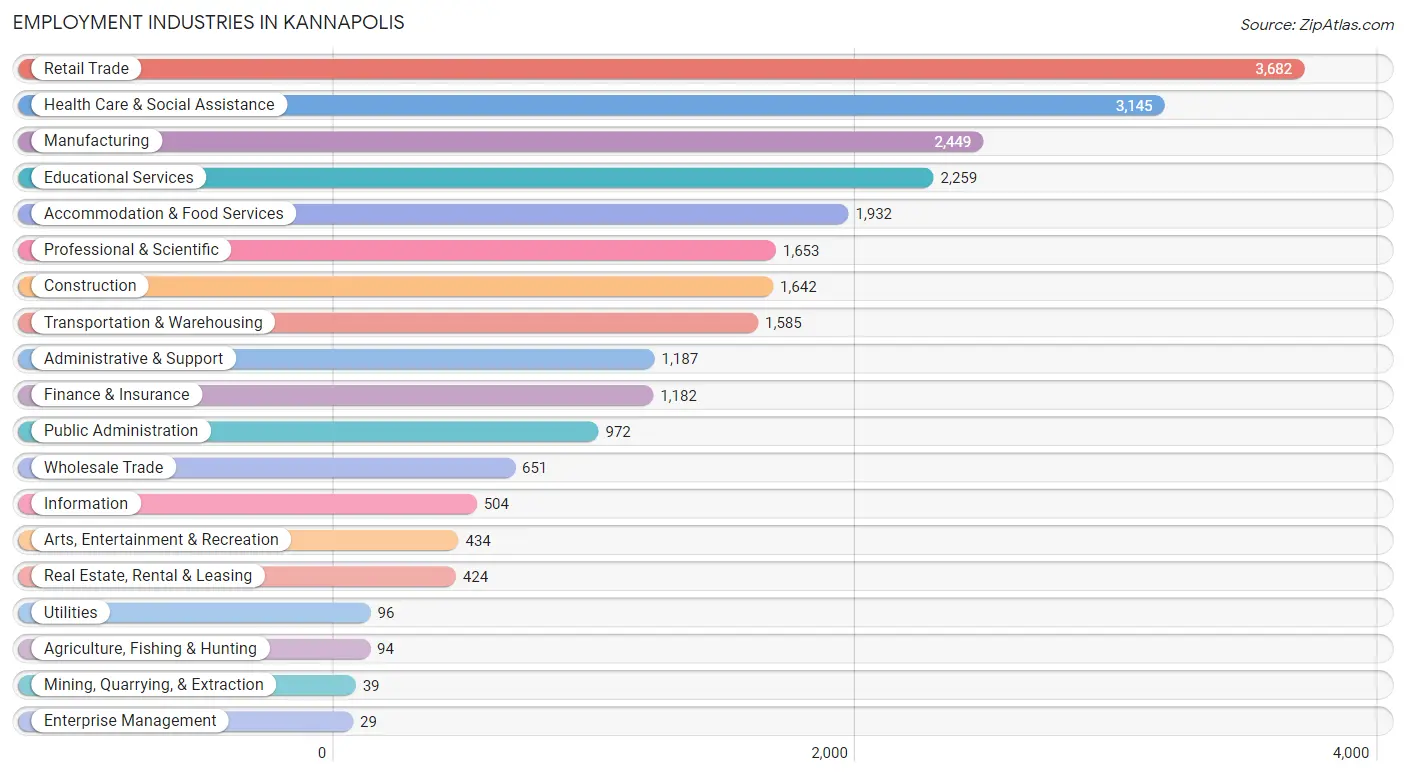
Employment Industries in Kannapolis
The major employment industries in Kannapolis include Retail Trade (3,682 | 14.6%), Health Care & Social Assistance (3,145 | 12.5%), Manufacturing (2,449 | 9.7%), Educational Services (2,259 | 9.0%), and Accommodation & Food Services (1,932 | 7.7%).
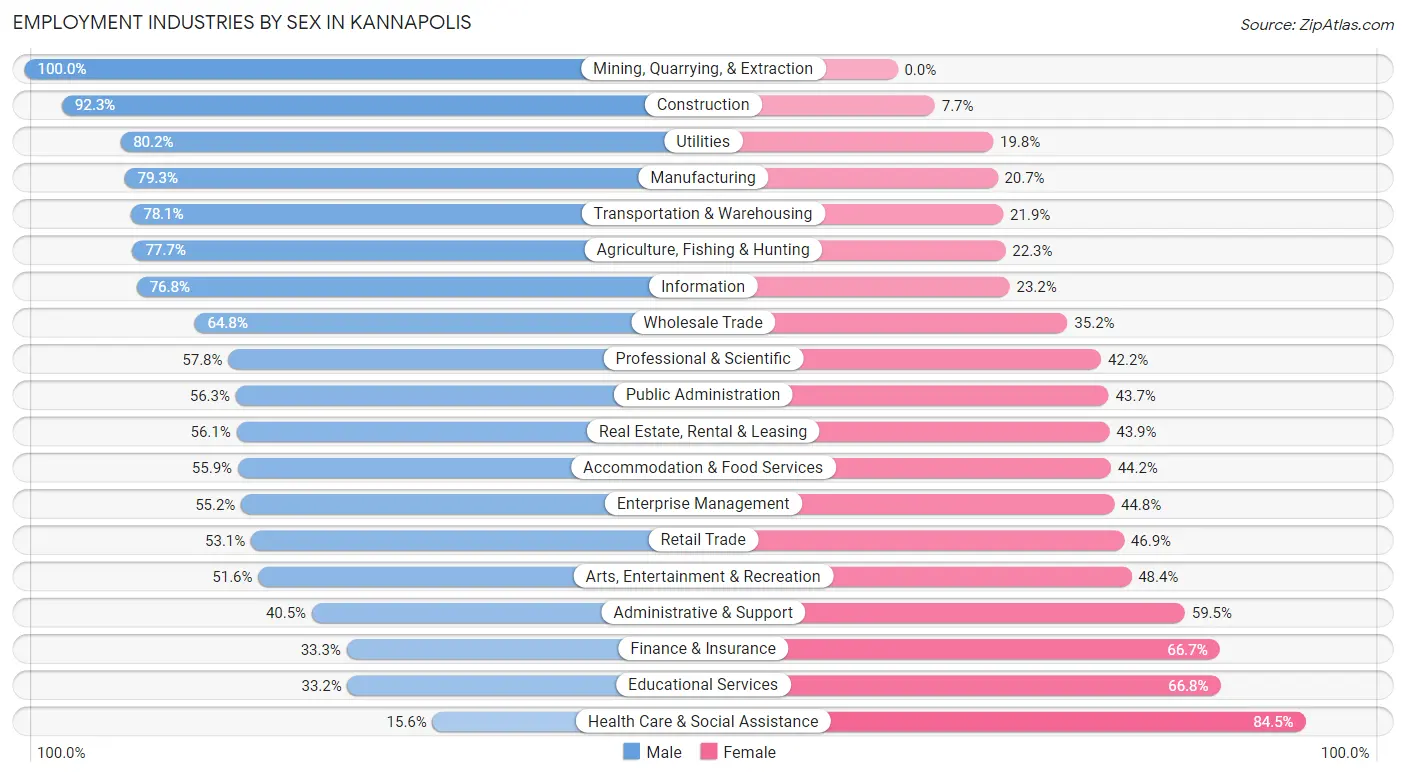
Employment Industries by Sex in Kannapolis
The Kannapolis industries that see more men than women are Mining, Quarrying, & Extraction (100.0%), Construction (92.3%), and Utilities (80.2%), whereas the industries that tend to have a higher number of women are Health Care & Social Assistance (84.5%), Educational Services (66.8%), and Finance & Insurance (66.7%).
| Industry | Male | Female |
| Agriculture, Fishing & Hunting | 73 (77.7%) | 21 (22.3%) |
| Mining, Quarrying, & Extraction | 39 (100.0%) | 0 (0.0%) |
| Construction | 1,515 (92.3%) | 127 (7.7%) |
| Manufacturing | 1,942 (79.3%) | 507 (20.7%) |
| Wholesale Trade | 422 (64.8%) | 229 (35.2%) |
| Retail Trade | 1,956 (53.1%) | 1,726 (46.9%) |
| Transportation & Warehousing | 1,238 (78.1%) | 347 (21.9%) |
| Utilities | 77 (80.2%) | 19 (19.8%) |
| Information | 387 (76.8%) | 117 (23.2%) |
| Finance & Insurance | 394 (33.3%) | 788 (66.7%) |
| Real Estate, Rental & Leasing | 238 (56.1%) | 186 (43.9%) |
| Professional & Scientific | 956 (57.8%) | 697 (42.2%) |
| Enterprise Management | 16 (55.2%) | 13 (44.8%) |
| Administrative & Support | 481 (40.5%) | 706 (59.5%) |
| Educational Services | 749 (33.2%) | 1,510 (66.8%) |
| Health Care & Social Assistance | 489 (15.5%) | 2,656 (84.5%) |
| Arts, Entertainment & Recreation | 224 (51.6%) | 210 (48.4%) |
| Accommodation & Food Services | 1,079 (55.8%) | 853 (44.2%) |
| Public Administration | 547 (56.3%) | 425 (43.7%) |
| Total | 13,190 (52.5%) | 11,949 (47.5%) |
Education in Kannapolis
School Enrollment in Kannapolis
The most common levels of schooling among the 13,812 students in Kannapolis are middle school (3,520 | 25.5%), elementary school (3,423 | 24.8%), and high school (2,751 | 19.9%).
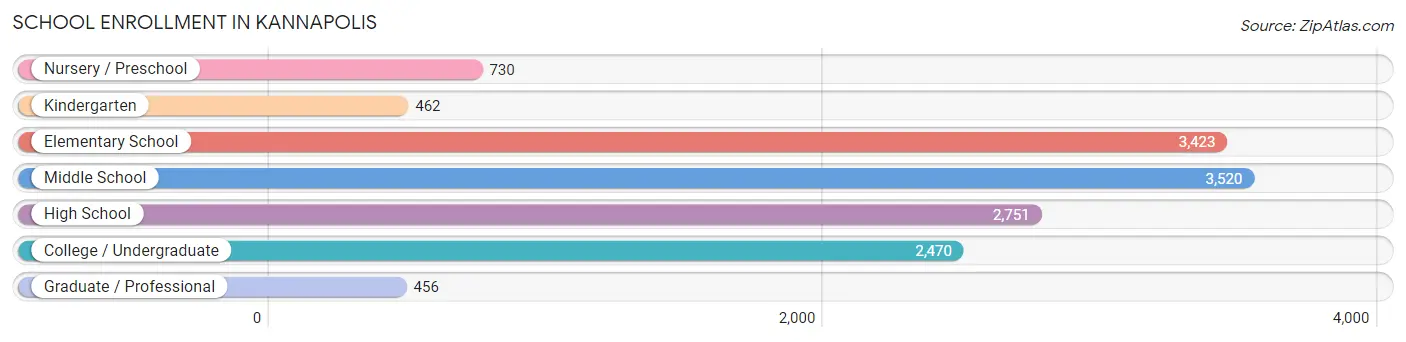
| School Level | # Students | % Students |
| Nursery / Preschool | 730 | 5.3% |
| Kindergarten | 462 | 3.3% |
| Elementary School | 3,423 | 24.8% |
| Middle School | 3,520 | 25.5% |
| High School | 2,751 | 19.9% |
| College / Undergraduate | 2,470 | 17.9% |
| Graduate / Professional | 456 | 3.3% |
| Total | 13,812 | 100.0% |
School Enrollment by Age by Funding Source in Kannapolis
Out of a total of 13,812 students who are enrolled in schools in Kannapolis, 1,547 (11.2%) attend a private institution, while the remaining 12,265 (88.8%) are enrolled in public schools. The age group of 3 to 4 year olds has the highest likelihood of being enrolled in private schools, with 190 (33.9% in the age bracket) enrolled. Conversely, the age group of 10 to 14 year olds has the lowest likelihood of being enrolled in a private school, with 4,279 (94.5% in the age bracket) attending a public institution.
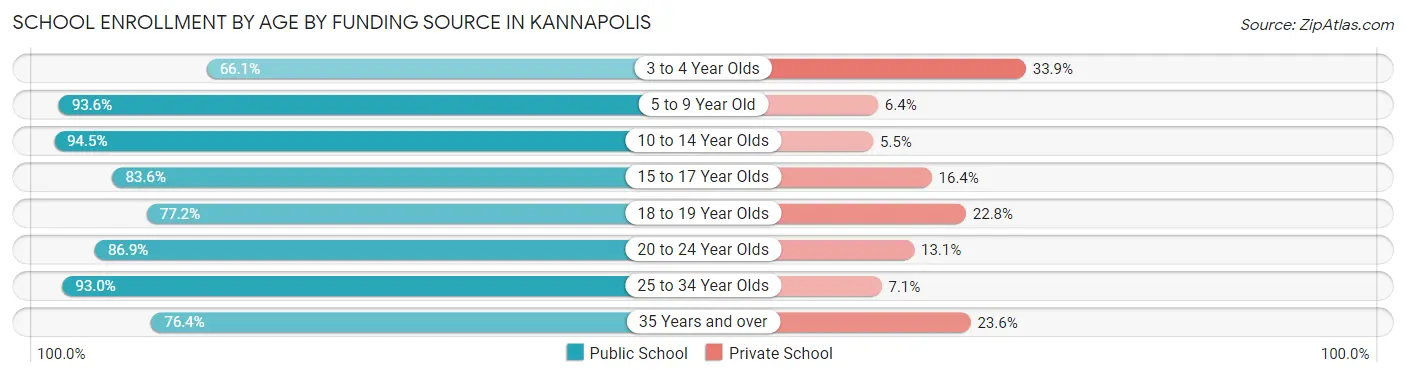
| Age Bracket | Public School | Private School |
| 3 to 4 Year Olds | 370 (66.1%) | 190 (33.9%) |
| 5 to 9 Year Old | 3,111 (93.6%) | 212 (6.4%) |
| 10 to 14 Year Olds | 4,279 (94.5%) | 248 (5.5%) |
| 15 to 17 Year Olds | 1,608 (83.6%) | 315 (16.4%) |
| 18 to 19 Year Olds | 621 (77.2%) | 183 (22.8%) |
| 20 to 24 Year Olds | 802 (86.9%) | 121 (13.1%) |
| 25 to 34 Year Olds | 751 (92.9%) | 57 (7.0%) |
| 35 Years and over | 721 (76.4%) | 223 (23.6%) |
| Total | 12,265 (88.8%) | 1,547 (11.2%) |
Educational Attainment by Field of Study in Kannapolis
Business (1,915 | 18.0%), education (1,667 | 15.7%), science & technology (1,159 | 10.9%), engineering (722 | 6.8%), and liberal arts & history (674 | 6.3%) are the most common fields of study among 10,627 individuals in Kannapolis who have obtained a bachelor's degree or higher.
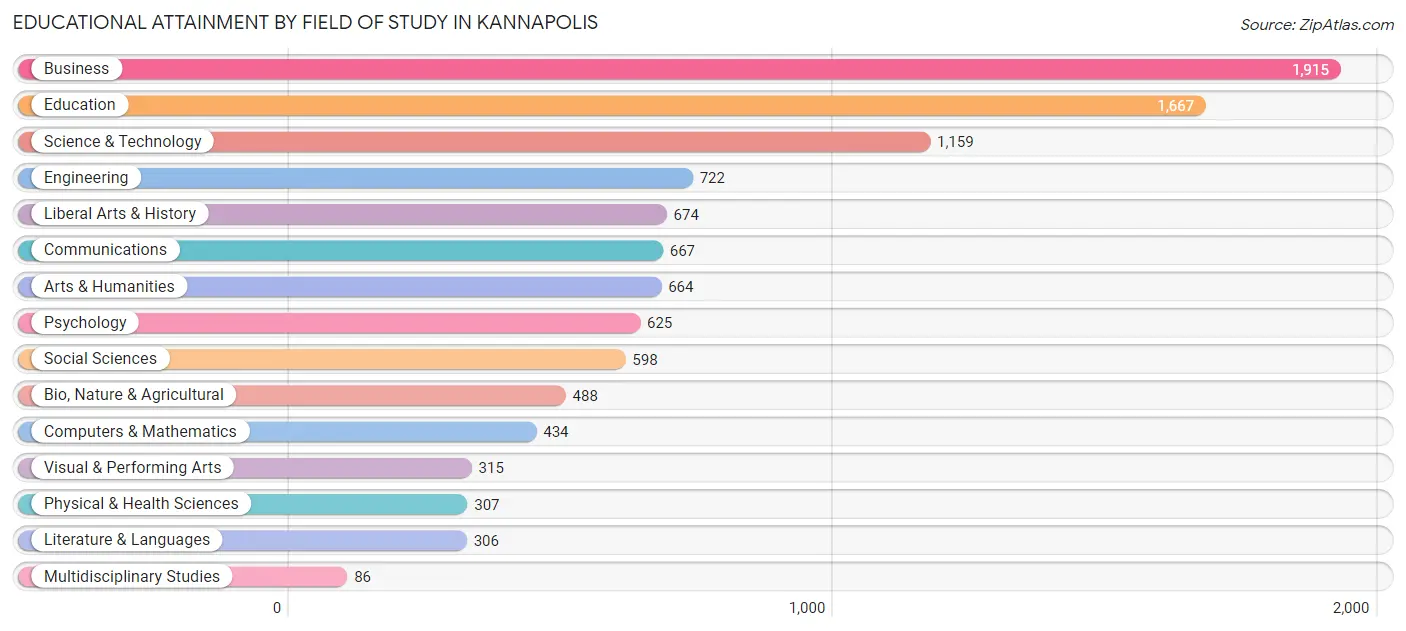
| Field of Study | # Graduates | % Graduates |
| Computers & Mathematics | 434 | 4.1% |
| Bio, Nature & Agricultural | 488 | 4.6% |
| Physical & Health Sciences | 307 | 2.9% |
| Psychology | 625 | 5.9% |
| Social Sciences | 598 | 5.6% |
| Engineering | 722 | 6.8% |
| Multidisciplinary Studies | 86 | 0.8% |
| Science & Technology | 1,159 | 10.9% |
| Business | 1,915 | 18.0% |
| Education | 1,667 | 15.7% |
| Literature & Languages | 306 | 2.9% |
| Liberal Arts & History | 674 | 6.3% |
| Visual & Performing Arts | 315 | 3.0% |
| Communications | 667 | 6.3% |
| Arts & Humanities | 664 | 6.2% |
| Total | 10,627 | 100.0% |
Transportation & Commute in Kannapolis
Vehicle Availability by Sex in Kannapolis
The most prevalent vehicle ownership categories in Kannapolis are males with 2 vehicles (7,194, accounting for 55.5%) and females with 2 vehicles (5,837, making up 60.8%).
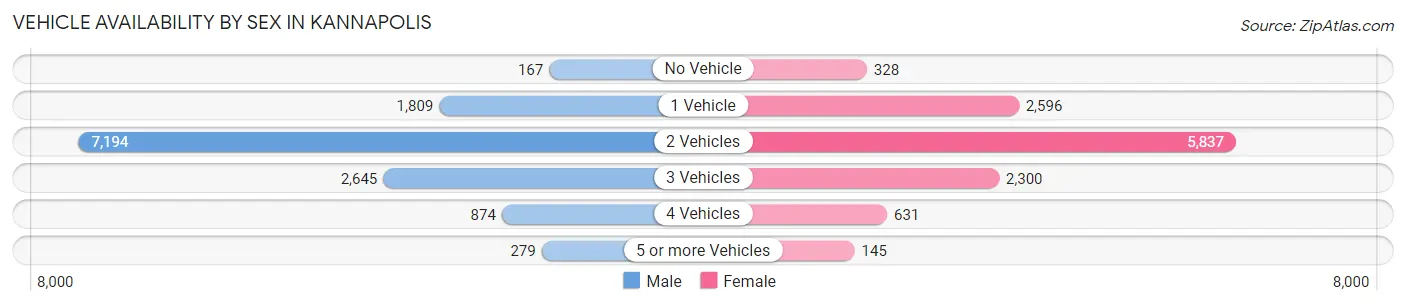
| Vehicles Available | Male | Female |
| No Vehicle | 167 (1.3%) | 328 (2.8%) |
| 1 Vehicle | 1,809 (14.0%) | 2,596 (21.9%) |
| 2 Vehicles | 7,194 (55.5%) | 5,837 (49.3%) |
| 3 Vehicles | 2,645 (20.4%) | 2,300 (19.4%) |
| 4 Vehicles | 874 (6.7%) | 631 (5.3%) |
| 5 or more Vehicles | 279 (2.1%) | 145 (1.2%) |
| Total | 12,968 (100.0%) | 11,837 (100.0%) |
Commute Time in Kannapolis
The most frequently occuring commute durations in Kannapolis are 30 to 34 minutes (4,104 commuters, 18.3%), 15 to 19 minutes (3,397 commuters, 15.1%), and 20 to 24 minutes (3,045 commuters, 13.6%).
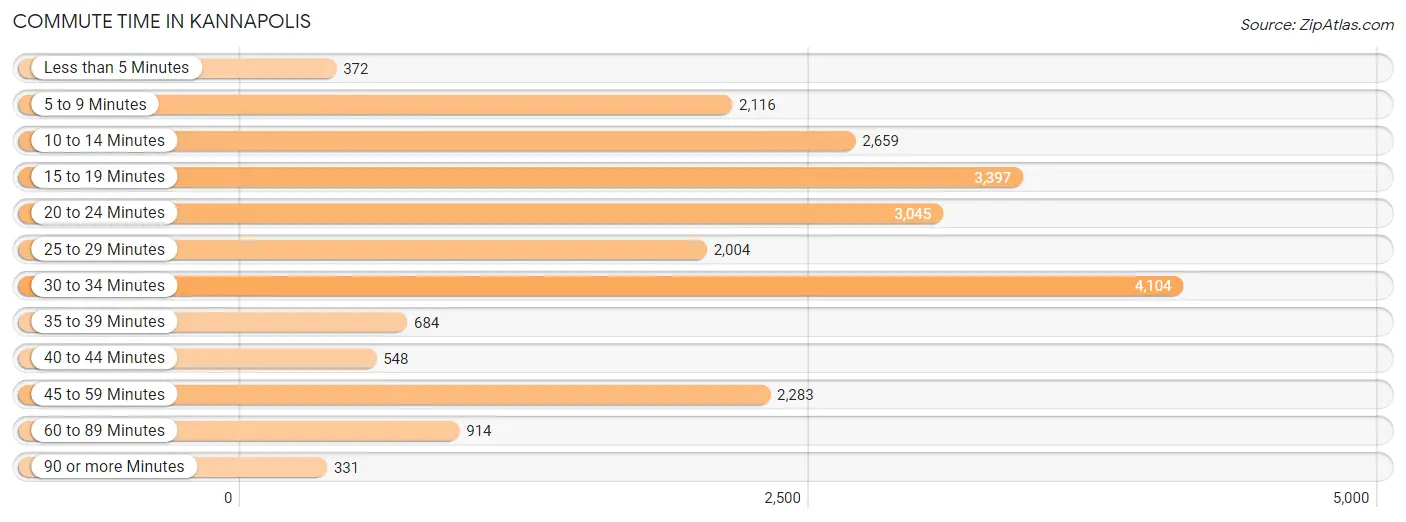
| Commute Time | # Commuters | % Commuters |
| Less than 5 Minutes | 372 | 1.7% |
| 5 to 9 Minutes | 2,116 | 9.4% |
| 10 to 14 Minutes | 2,659 | 11.8% |
| 15 to 19 Minutes | 3,397 | 15.1% |
| 20 to 24 Minutes | 3,045 | 13.6% |
| 25 to 29 Minutes | 2,004 | 8.9% |
| 30 to 34 Minutes | 4,104 | 18.3% |
| 35 to 39 Minutes | 684 | 3.0% |
| 40 to 44 Minutes | 548 | 2.4% |
| 45 to 59 Minutes | 2,283 | 10.2% |
| 60 to 89 Minutes | 914 | 4.1% |
| 90 or more Minutes | 331 | 1.5% |
Commute Time by Sex in Kannapolis
The most common commute times in Kannapolis are 30 to 34 minutes (2,620 commuters, 21.7%) for males and 15 to 19 minutes (1,663 commuters, 16.0%) for females.
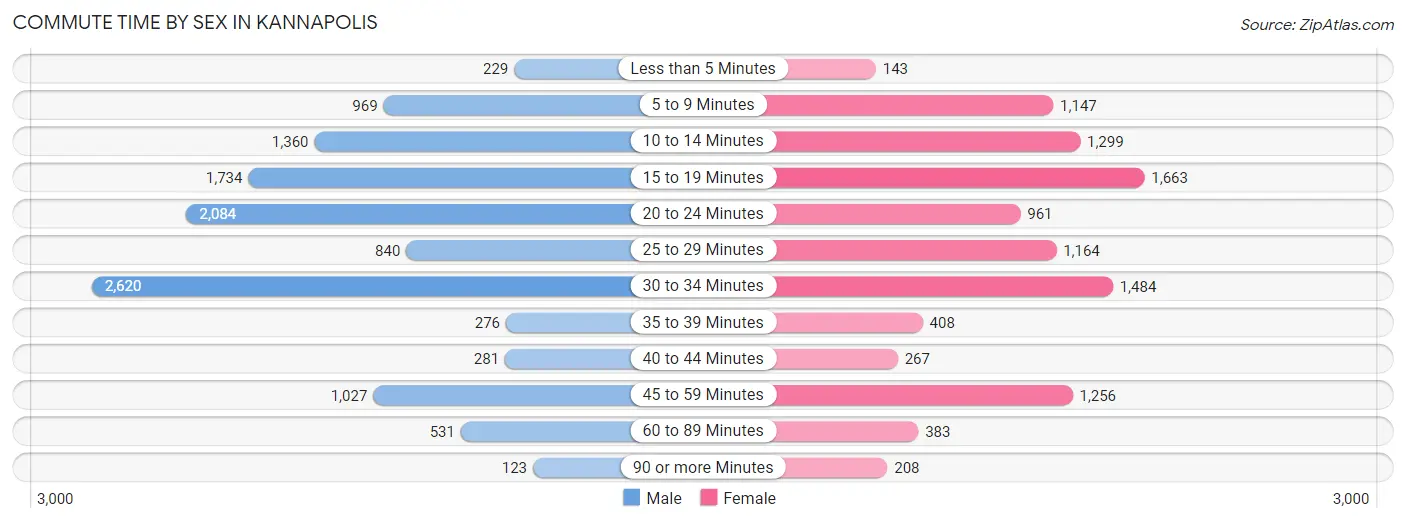
| Commute Time | Male | Female |
| Less than 5 Minutes | 229 (1.9%) | 143 (1.4%) |
| 5 to 9 Minutes | 969 (8.0%) | 1,147 (11.1%) |
| 10 to 14 Minutes | 1,360 (11.3%) | 1,299 (12.5%) |
| 15 to 19 Minutes | 1,734 (14.4%) | 1,663 (16.0%) |
| 20 to 24 Minutes | 2,084 (17.3%) | 961 (9.3%) |
| 25 to 29 Minutes | 840 (7.0%) | 1,164 (11.2%) |
| 30 to 34 Minutes | 2,620 (21.7%) | 1,484 (14.3%) |
| 35 to 39 Minutes | 276 (2.3%) | 408 (3.9%) |
| 40 to 44 Minutes | 281 (2.3%) | 267 (2.6%) |
| 45 to 59 Minutes | 1,027 (8.5%) | 1,256 (12.1%) |
| 60 to 89 Minutes | 531 (4.4%) | 383 (3.7%) |
| 90 or more Minutes | 123 (1.0%) | 208 (2.0%) |
Time of Departure to Work by Sex in Kannapolis
The most frequent times of departure to work in Kannapolis are 7:30 AM to 7:59 AM (1,578, 13.1%) for males and 7:00 AM to 7:29 AM (1,554, 15.0%) for females.
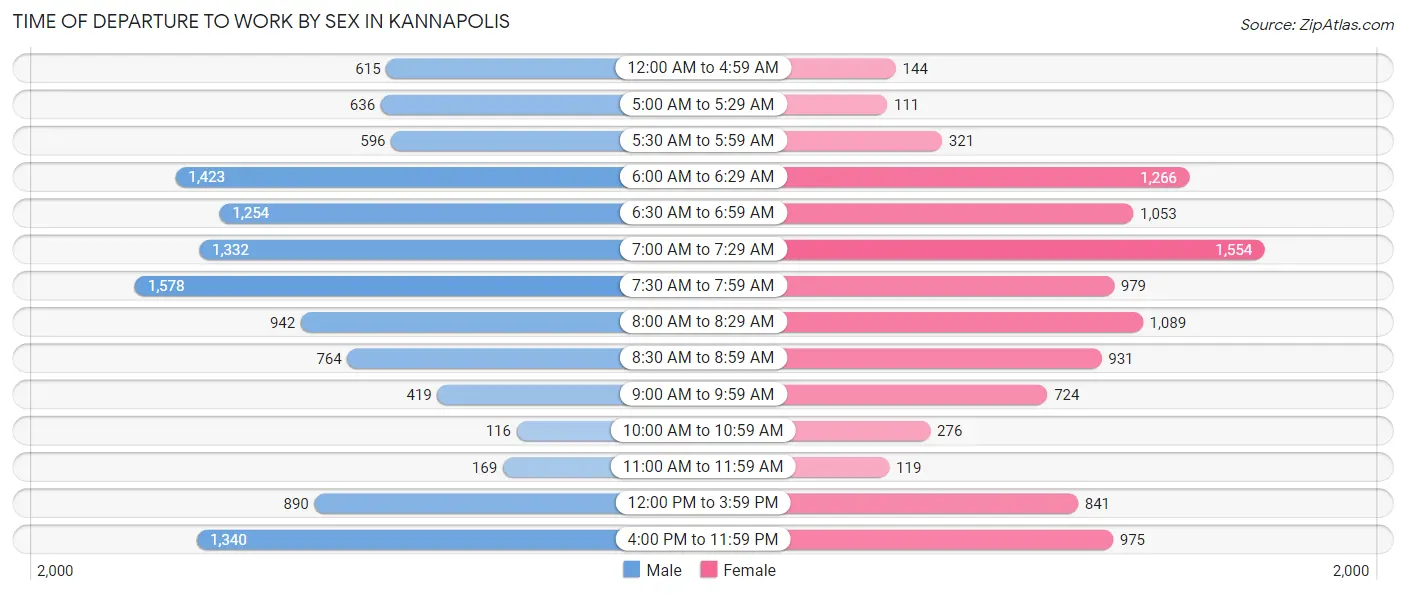
| Time of Departure | Male | Female |
| 12:00 AM to 4:59 AM | 615 (5.1%) | 144 (1.4%) |
| 5:00 AM to 5:29 AM | 636 (5.3%) | 111 (1.1%) |
| 5:30 AM to 5:59 AM | 596 (4.9%) | 321 (3.1%) |
| 6:00 AM to 6:29 AM | 1,423 (11.8%) | 1,266 (12.2%) |
| 6:30 AM to 6:59 AM | 1,254 (10.4%) | 1,053 (10.1%) |
| 7:00 AM to 7:29 AM | 1,332 (11.0%) | 1,554 (15.0%) |
| 7:30 AM to 7:59 AM | 1,578 (13.1%) | 979 (9.4%) |
| 8:00 AM to 8:29 AM | 942 (7.8%) | 1,089 (10.5%) |
| 8:30 AM to 8:59 AM | 764 (6.3%) | 931 (9.0%) |
| 9:00 AM to 9:59 AM | 419 (3.5%) | 724 (7.0%) |
| 10:00 AM to 10:59 AM | 116 (1.0%) | 276 (2.7%) |
| 11:00 AM to 11:59 AM | 169 (1.4%) | 119 (1.1%) |
| 12:00 PM to 3:59 PM | 890 (7.4%) | 841 (8.1%) |
| 4:00 PM to 11:59 PM | 1,340 (11.1%) | 975 (9.4%) |
| Total | 12,074 (100.0%) | 10,383 (100.0%) |
Housing Occupancy in Kannapolis
Occupancy by Ownership in Kannapolis
Of the total 19,026 dwellings in Kannapolis, owner-occupied units account for 11,895 (62.5%), while renter-occupied units make up 7,131 (37.5%).
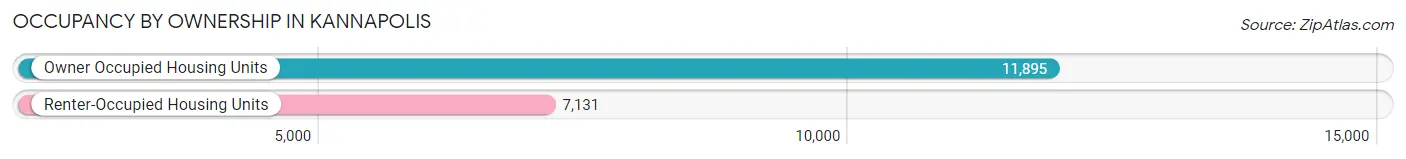
| Occupancy | # Housing Units | % Housing Units |
| Owner Occupied Housing Units | 11,895 | 62.5% |
| Renter-Occupied Housing Units | 7,131 | 37.5% |
| Total Occupied Housing Units | 19,026 | 100.0% |
Occupancy by Household Size in Kannapolis
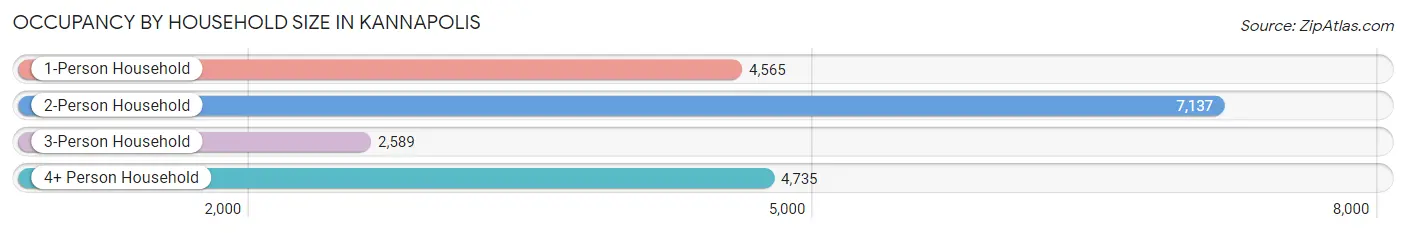
| Household Size | # Housing Units | % Housing Units |
| 1-Person Household | 4,565 | 24.0% |
| 2-Person Household | 7,137 | 37.5% |
| 3-Person Household | 2,589 | 13.6% |
| 4+ Person Household | 4,735 | 24.9% |
| Total Housing Units | 19,026 | 100.0% |
Occupancy by Ownership by Household Size in Kannapolis
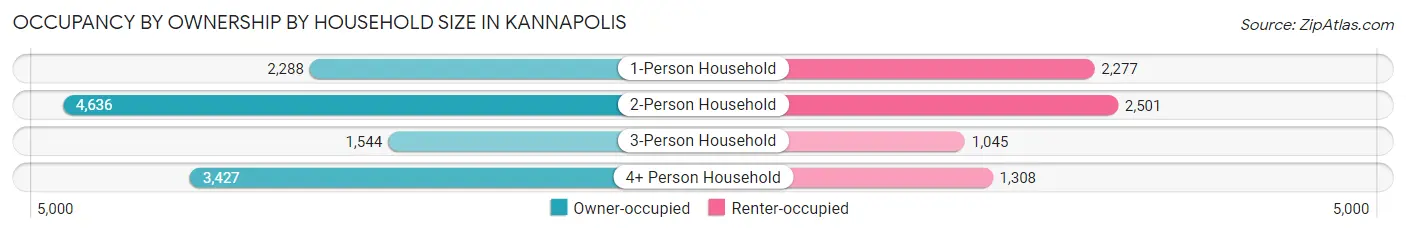
| Household Size | Owner-occupied | Renter-occupied |
| 1-Person Household | 2,288 (50.1%) | 2,277 (49.9%) |
| 2-Person Household | 4,636 (65.0%) | 2,501 (35.0%) |
| 3-Person Household | 1,544 (59.6%) | 1,045 (40.4%) |
| 4+ Person Household | 3,427 (72.4%) | 1,308 (27.6%) |
| Total Housing Units | 11,895 (62.5%) | 7,131 (37.5%) |
Occupancy by Educational Attainment in Kannapolis
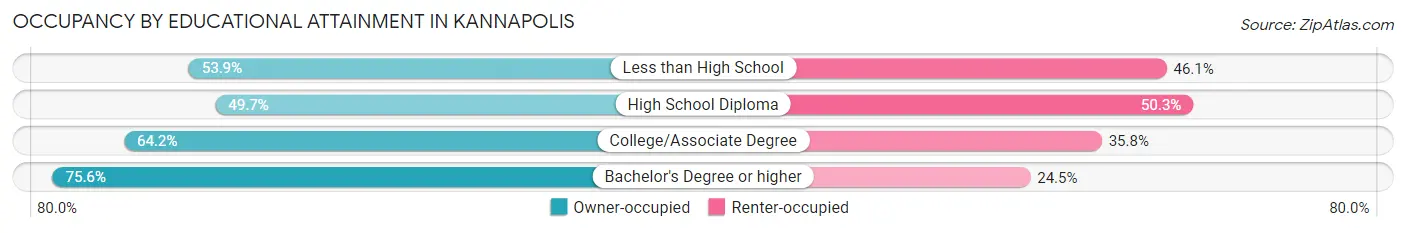
| Household Size | Owner-occupied | Renter-occupied |
| Less than High School | 1,074 (53.9%) | 917 (46.1%) |
| High School Diploma | 2,544 (49.7%) | 2,572 (50.3%) |
| College/Associate Degree | 4,125 (64.2%) | 2,298 (35.8%) |
| Bachelor's Degree or higher | 4,152 (75.5%) | 1,344 (24.4%) |
Occupancy by Age of Householder in Kannapolis
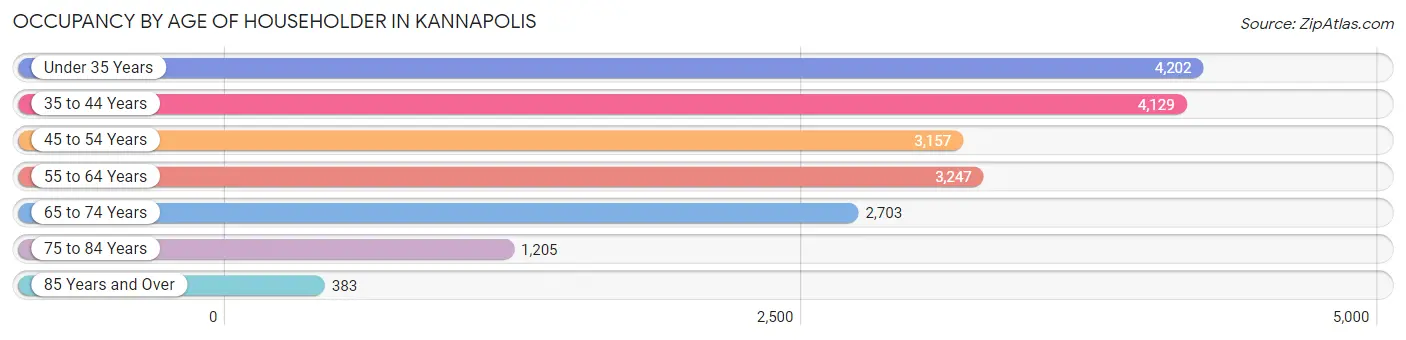
| Age Bracket | # Households | % Households |
| Under 35 Years | 4,202 | 22.1% |
| 35 to 44 Years | 4,129 | 21.7% |
| 45 to 54 Years | 3,157 | 16.6% |
| 55 to 64 Years | 3,247 | 17.1% |
| 65 to 74 Years | 2,703 | 14.2% |
| 75 to 84 Years | 1,205 | 6.3% |
| 85 Years and Over | 383 | 2.0% |
| Total | 19,026 | 100.0% |
Housing Finances in Kannapolis
Median Income by Occupancy in Kannapolis
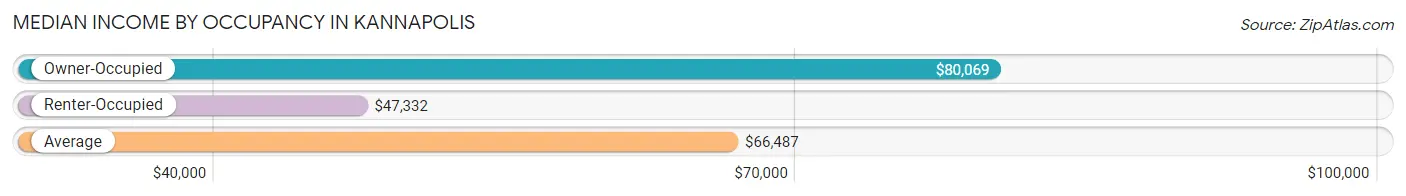
| Occupancy Type | # Households | Median Income |
| Owner-Occupied | 11,895 (62.5%) | $80,069 |
| Renter-Occupied | 7,131 (37.5%) | $47,332 |
| Average | 19,026 (100.0%) | $66,487 |
Occupancy by Householder Income Bracket in Kannapolis
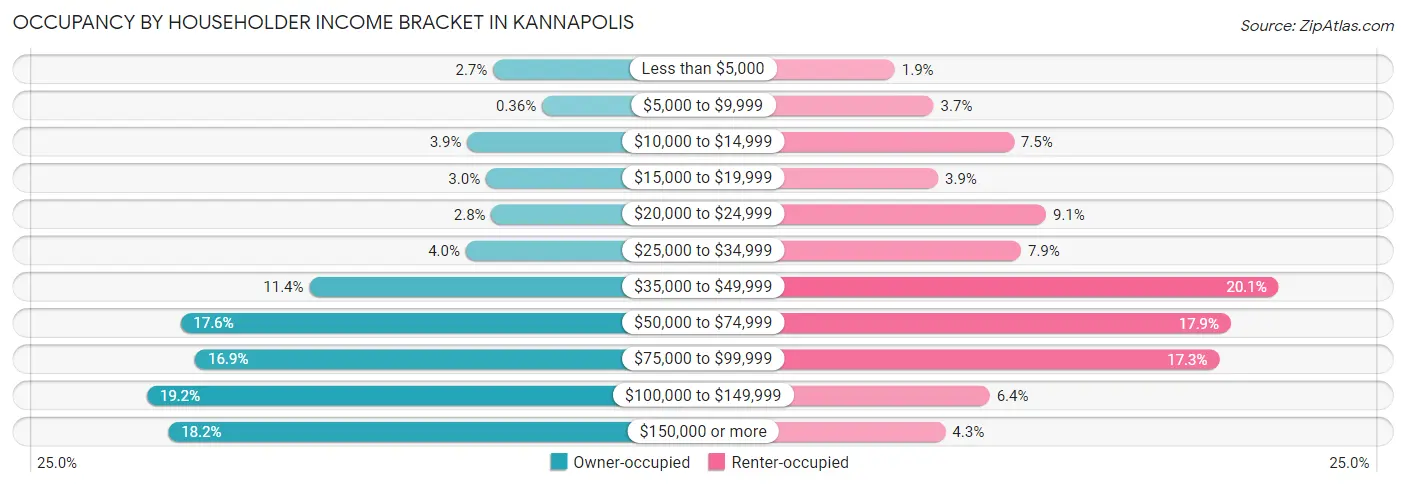
| Income Bracket | Owner-occupied | Renter-occupied |
| Less than $5,000 | 320 (2.7%) | 133 (1.9%) |
| $5,000 to $9,999 | 43 (0.4%) | 265 (3.7%) |
| $10,000 to $14,999 | 466 (3.9%) | 538 (7.5%) |
| $15,000 to $19,999 | 360 (3.0%) | 280 (3.9%) |
| $20,000 to $24,999 | 330 (2.8%) | 647 (9.1%) |
| $25,000 to $34,999 | 475 (4.0%) | 562 (7.9%) |
| $35,000 to $49,999 | 1,361 (11.4%) | 1,436 (20.1%) |
| $50,000 to $74,999 | 2,091 (17.6%) | 1,274 (17.9%) |
| $75,000 to $99,999 | 2,008 (16.9%) | 1,235 (17.3%) |
| $100,000 to $149,999 | 2,281 (19.2%) | 456 (6.4%) |
| $150,000 or more | 2,160 (18.2%) | 305 (4.3%) |
| Total | 11,895 (100.0%) | 7,131 (100.0%) |
Monthly Housing Cost Tiers in Kannapolis
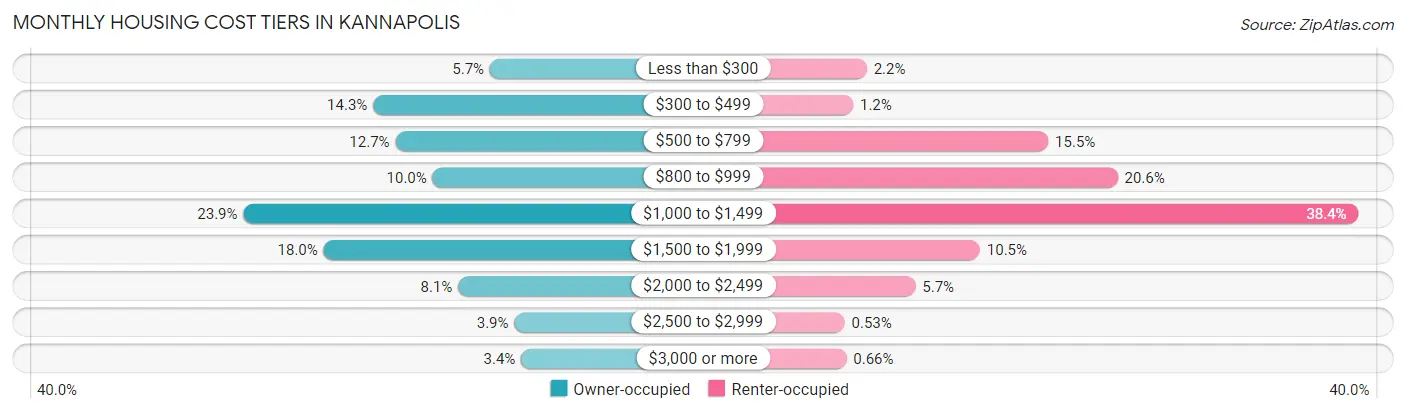
| Monthly Cost | Owner-occupied | Renter-occupied |
| Less than $300 | 682 (5.7%) | 154 (2.2%) |
| $300 to $499 | 1,704 (14.3%) | 82 (1.1%) |
| $500 to $799 | 1,509 (12.7%) | 1,107 (15.5%) |
| $800 to $999 | 1,184 (10.0%) | 1,471 (20.6%) |
| $1,000 to $1,499 | 2,842 (23.9%) | 2,736 (38.4%) |
| $1,500 to $1,999 | 2,139 (18.0%) | 748 (10.5%) |
| $2,000 to $2,499 | 960 (8.1%) | 409 (5.7%) |
| $2,500 to $2,999 | 467 (3.9%) | 38 (0.5%) |
| $3,000 or more | 408 (3.4%) | 47 (0.7%) |
| Total | 11,895 (100.0%) | 7,131 (100.0%) |
Physical Housing Characteristics in Kannapolis
Housing Structures in Kannapolis
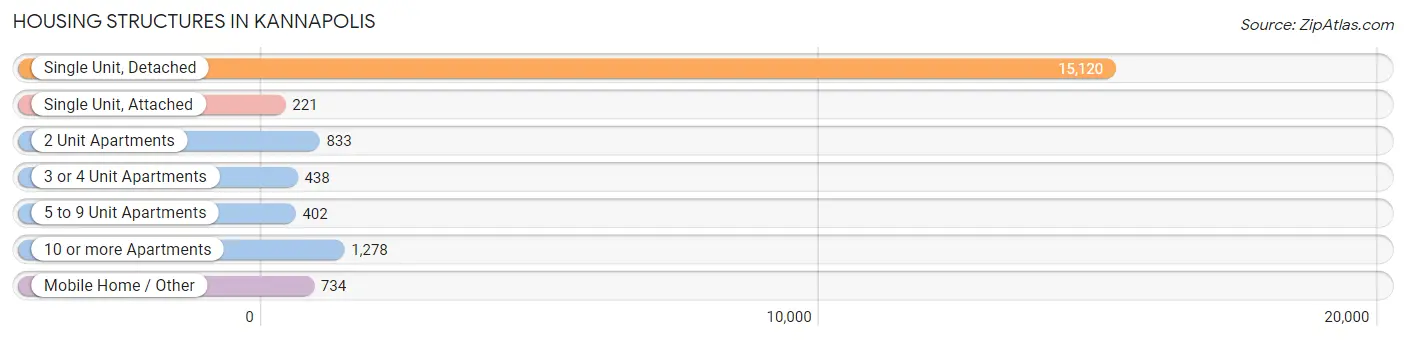
| Structure Type | # Housing Units | % Housing Units |
| Single Unit, Detached | 15,120 | 79.5% |
| Single Unit, Attached | 221 | 1.2% |
| 2 Unit Apartments | 833 | 4.4% |
| 3 or 4 Unit Apartments | 438 | 2.3% |
| 5 to 9 Unit Apartments | 402 | 2.1% |
| 10 or more Apartments | 1,278 | 6.7% |
| Mobile Home / Other | 734 | 3.9% |
| Total | 19,026 | 100.0% |
Housing Structures by Occupancy in Kannapolis
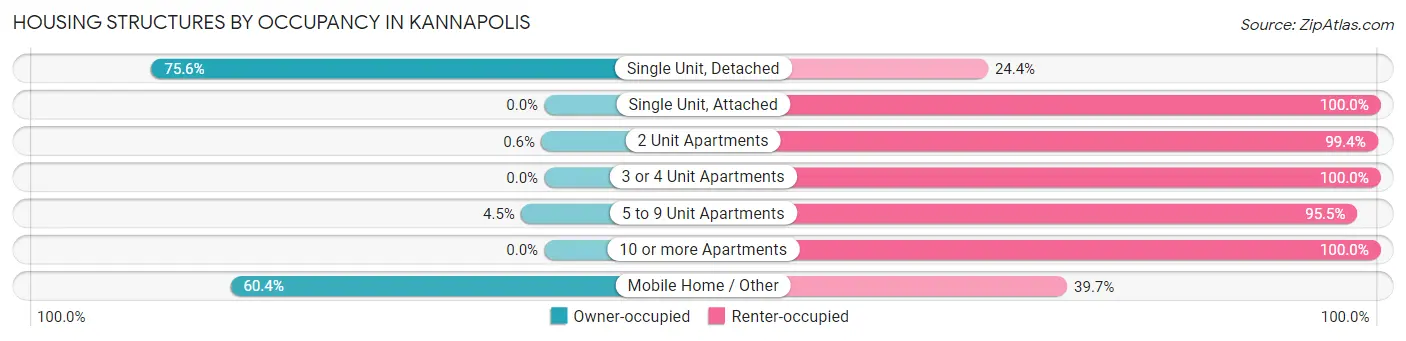
| Structure Type | Owner-occupied | Renter-occupied |
| Single Unit, Detached | 11,429 (75.6%) | 3,691 (24.4%) |
| Single Unit, Attached | 0 (0.0%) | 221 (100.0%) |
| 2 Unit Apartments | 5 (0.6%) | 828 (99.4%) |
| 3 or 4 Unit Apartments | 0 (0.0%) | 438 (100.0%) |
| 5 to 9 Unit Apartments | 18 (4.5%) | 384 (95.5%) |
| 10 or more Apartments | 0 (0.0%) | 1,278 (100.0%) |
| Mobile Home / Other | 443 (60.4%) | 291 (39.7%) |
| Total | 11,895 (62.5%) | 7,131 (37.5%) |
Housing Structures by Number of Rooms in Kannapolis
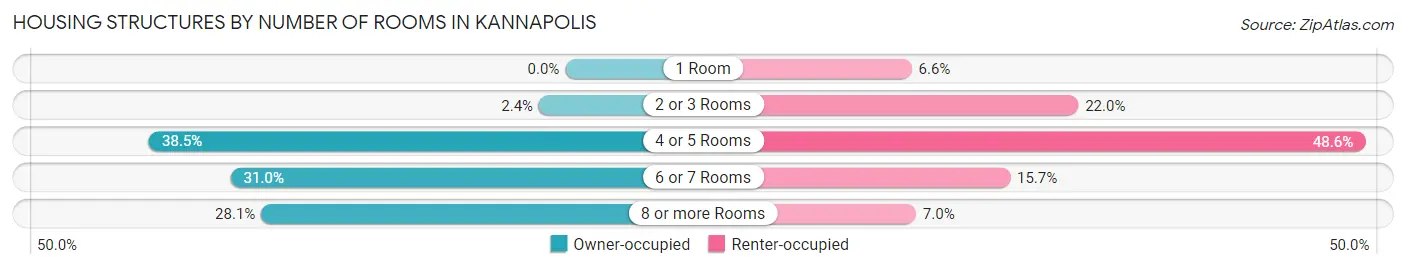
| Number of Rooms | Owner-occupied | Renter-occupied |
| 1 Room | 0 (0.0%) | 473 (6.6%) |
| 2 or 3 Rooms | 289 (2.4%) | 1,572 (22.0%) |
| 4 or 5 Rooms | 4,579 (38.5%) | 3,463 (48.6%) |
| 6 or 7 Rooms | 3,682 (30.9%) | 1,122 (15.7%) |
| 8 or more Rooms | 3,345 (28.1%) | 501 (7.0%) |
| Total | 11,895 (100.0%) | 7,131 (100.0%) |
Housing Structure by Heating Type in Kannapolis
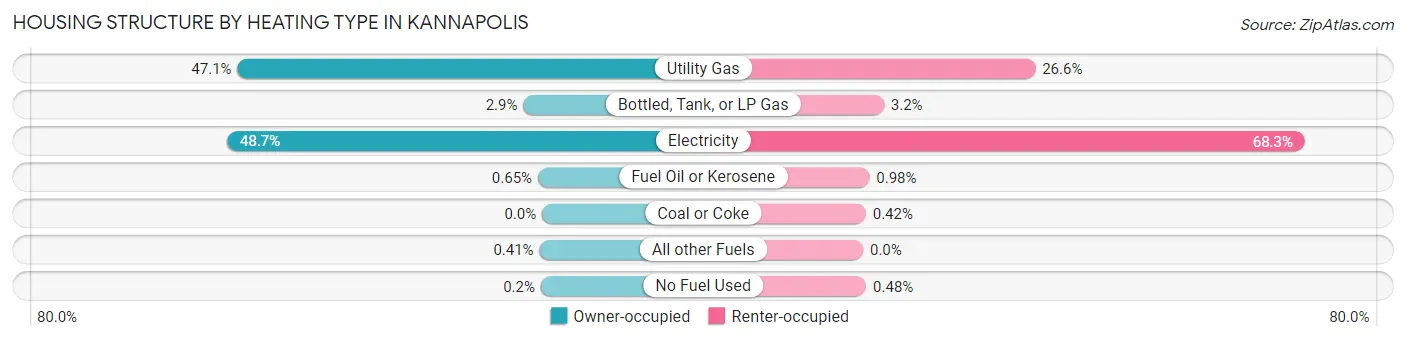
| Heating Type | Owner-occupied | Renter-occupied |
| Utility Gas | 5,603 (47.1%) | 1,898 (26.6%) |
| Bottled, Tank, or LP Gas | 346 (2.9%) | 229 (3.2%) |
| Electricity | 5,796 (48.7%) | 4,870 (68.3%) |
| Fuel Oil or Kerosene | 77 (0.6%) | 70 (1.0%) |
| Coal or Coke | 0 (0.0%) | 30 (0.4%) |
| All other Fuels | 49 (0.4%) | 0 (0.0%) |
| No Fuel Used | 24 (0.2%) | 34 (0.5%) |
| Total | 11,895 (100.0%) | 7,131 (100.0%) |
Household Vehicle Usage in Kannapolis
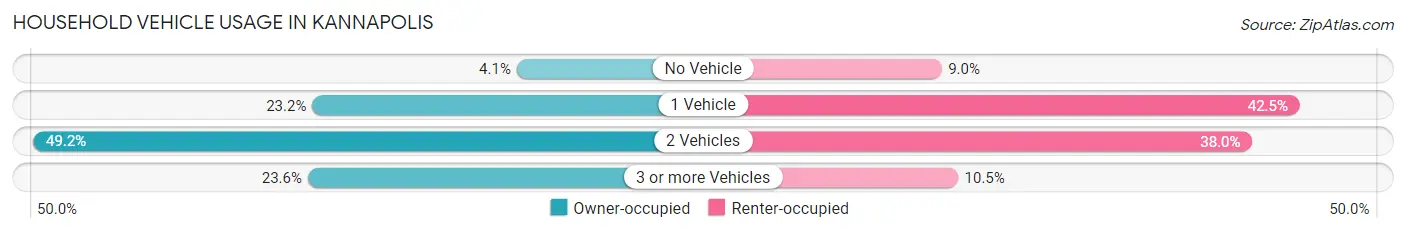
| Vehicles per Household | Owner-occupied | Renter-occupied |
| No Vehicle | 483 (4.1%) | 641 (9.0%) |
| 1 Vehicle | 2,754 (23.2%) | 3,028 (42.5%) |
| 2 Vehicles | 5,855 (49.2%) | 2,712 (38.0%) |
| 3 or more Vehicles | 2,803 (23.6%) | 750 (10.5%) |
| Total | 11,895 (100.0%) | 7,131 (100.0%) |
Real Estate & Mortgages in Kannapolis
Real Estate and Mortgage Overview in Kannapolis
| Characteristic | Without Mortgage | With Mortgage |
| Housing Units | 3,522 | 8,373 |
| Median Property Value | $164,200 | $223,500 |
| Median Household Income | $49,700 | $1,781 |
| Monthly Housing Costs | $435 | $398 |
| Real Estate Taxes | $1,567 | $51 |
Property Value by Mortgage Status in Kannapolis
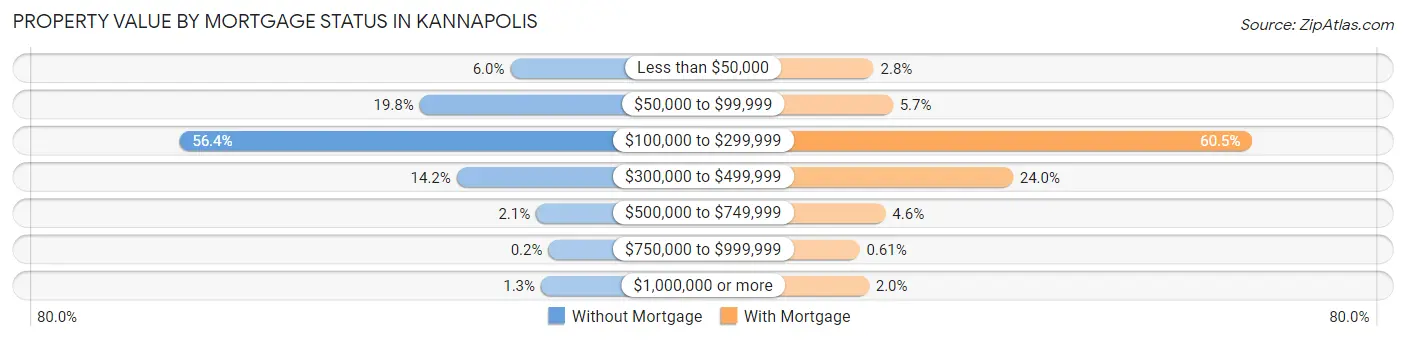
| Property Value | Without Mortgage | With Mortgage |
| Less than $50,000 | 211 (6.0%) | 230 (2.8%) |
| $50,000 to $99,999 | 698 (19.8%) | 474 (5.7%) |
| $100,000 to $299,999 | 1,987 (56.4%) | 5,062 (60.5%) |
| $300,000 to $499,999 | 499 (14.2%) | 2,006 (24.0%) |
| $500,000 to $749,999 | 73 (2.1%) | 381 (4.5%) |
| $750,000 to $999,999 | 7 (0.2%) | 51 (0.6%) |
| $1,000,000 or more | 47 (1.3%) | 169 (2.0%) |
| Total | 3,522 (100.0%) | 8,373 (100.0%) |
Household Income by Mortgage Status in Kannapolis
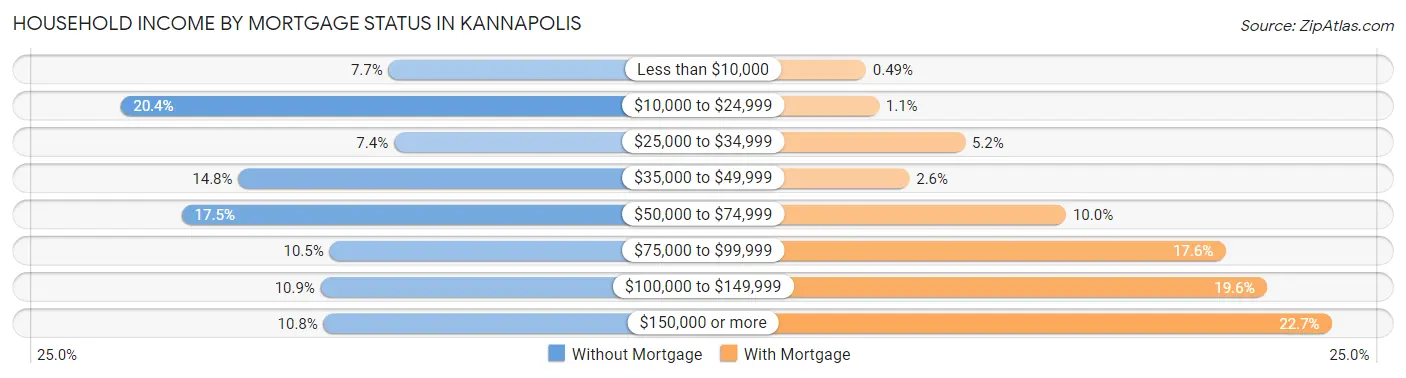
| Household Income | Without Mortgage | With Mortgage |
| Less than $10,000 | 270 (7.7%) | 41 (0.5%) |
| $10,000 to $24,999 | 720 (20.4%) | 93 (1.1%) |
| $25,000 to $34,999 | 261 (7.4%) | 436 (5.2%) |
| $35,000 to $49,999 | 522 (14.8%) | 214 (2.6%) |
| $50,000 to $74,999 | 617 (17.5%) | 839 (10.0%) |
| $75,000 to $99,999 | 369 (10.5%) | 1,474 (17.6%) |
| $100,000 to $149,999 | 384 (10.9%) | 1,639 (19.6%) |
| $150,000 or more | 379 (10.8%) | 1,897 (22.7%) |
| Total | 3,522 (100.0%) | 8,373 (100.0%) |
Property Value to Household Income Ratio in Kannapolis
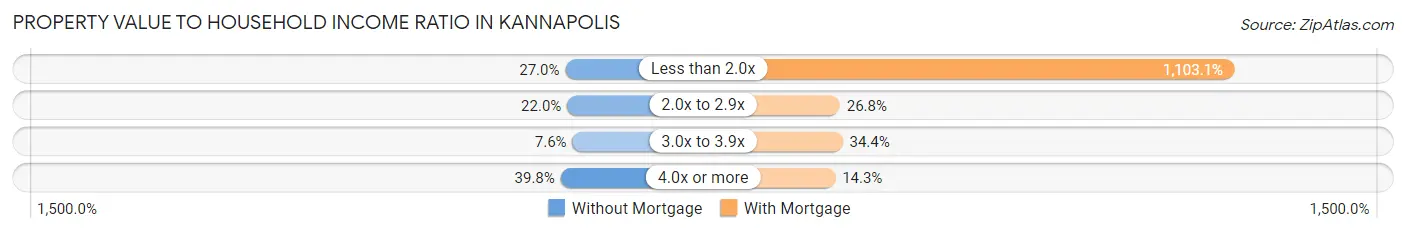
| Value-to-Income Ratio | Without Mortgage | With Mortgage |
| Less than 2.0x | 952 (27.0%) | 92,361 (1,103.1%) |
| 2.0x to 2.9x | 773 (22.0%) | 2,247 (26.8%) |
| 3.0x to 3.9x | 267 (7.6%) | 2,883 (34.4%) |
| 4.0x or more | 1,402 (39.8%) | 1,200 (14.3%) |
| Total | 3,522 (100.0%) | 8,373 (100.0%) |
Real Estate Taxes by Mortgage Status in Kannapolis
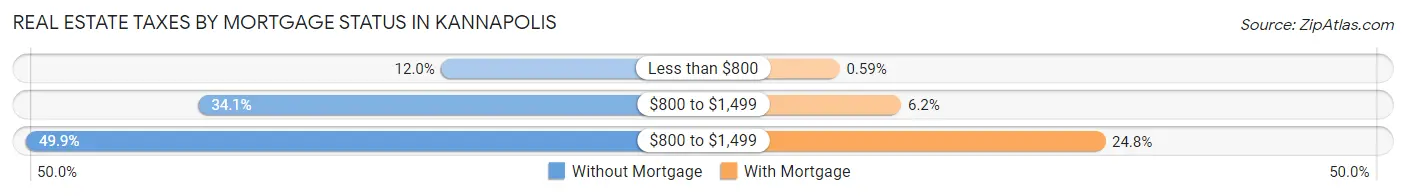
| Property Taxes | Without Mortgage | With Mortgage |
| Less than $800 | 423 (12.0%) | 49 (0.6%) |
| $800 to $1,499 | 1,202 (34.1%) | 520 (6.2%) |
| $800 to $1,499 | 1,756 (49.9%) | 2,080 (24.8%) |
| Total | 3,522 (100.0%) | 8,373 (100.0%) |
Health & Disability in Kannapolis
Health Insurance Coverage by Age in Kannapolis
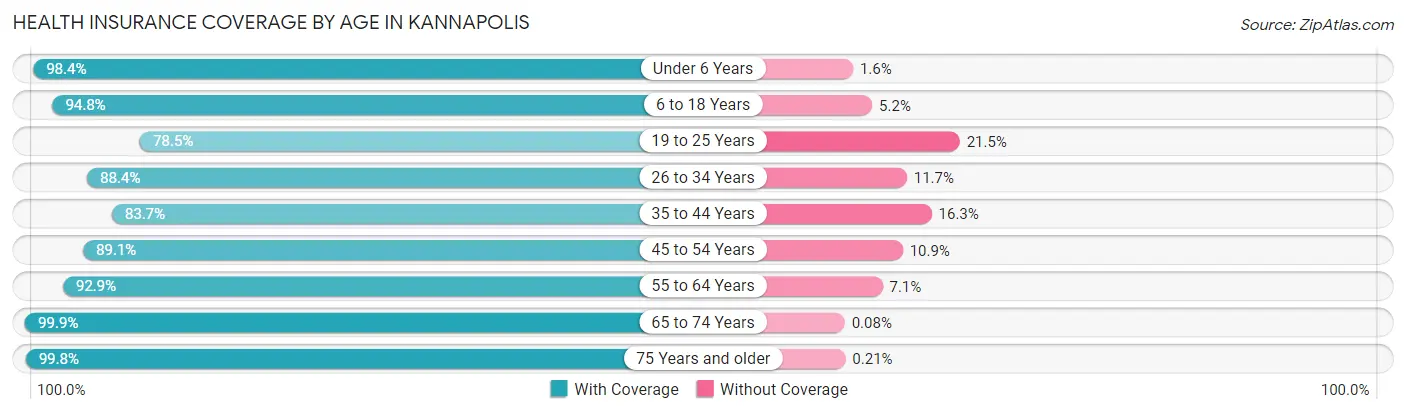
| Age Bracket | With Coverage | Without Coverage |
| Under 6 Years | 4,119 (98.4%) | 68 (1.6%) |
| 6 to 18 Years | 9,564 (94.8%) | 525 (5.2%) |
| 19 to 25 Years | 3,388 (78.5%) | 929 (21.5%) |
| 26 to 34 Years | 5,773 (88.3%) | 761 (11.7%) |
| 35 to 44 Years | 6,368 (83.7%) | 1,238 (16.3%) |
| 45 to 54 Years | 6,271 (89.1%) | 766 (10.9%) |
| 55 to 64 Years | 5,430 (92.9%) | 417 (7.1%) |
| 65 to 74 Years | 5,097 (99.9%) | 4 (0.1%) |
| 75 Years and older | 2,371 (99.8%) | 5 (0.2%) |
| Total | 48,381 (91.1%) | 4,713 (8.9%) |
Health Insurance Coverage by Citizenship Status in Kannapolis
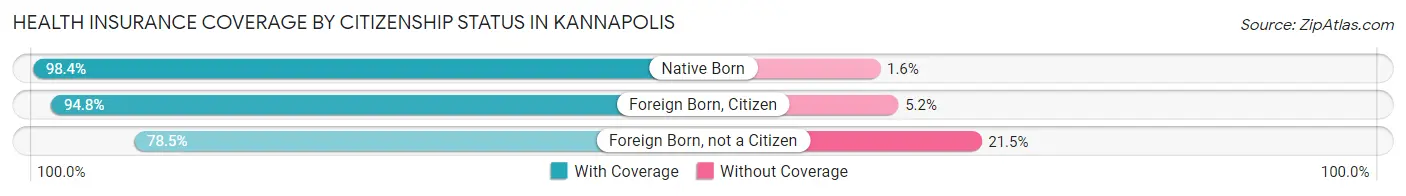
| Citizenship Status | With Coverage | Without Coverage |
| Native Born | 4,119 (98.4%) | 68 (1.6%) |
| Foreign Born, Citizen | 9,564 (94.8%) | 525 (5.2%) |
| Foreign Born, not a Citizen | 3,388 (78.5%) | 929 (21.5%) |
Health Insurance Coverage by Household Income in Kannapolis
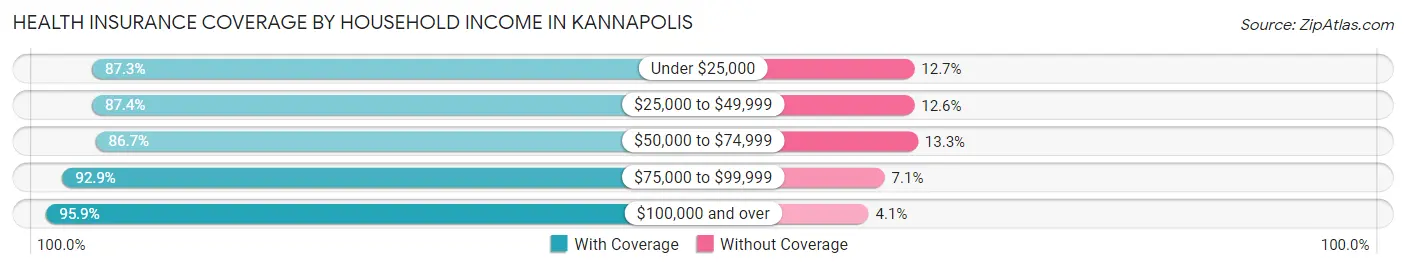
| Household Income | With Coverage | Without Coverage |
| Under $25,000 | 6,031 (87.3%) | 874 (12.7%) |
| $25,000 to $49,999 | 8,119 (87.4%) | 1,175 (12.6%) |
| $50,000 to $74,999 | 7,658 (86.7%) | 1,177 (13.3%) |
| $75,000 to $99,999 | 10,543 (92.9%) | 804 (7.1%) |
| $100,000 and over | 15,994 (95.9%) | 680 (4.1%) |
Public vs Private Health Insurance Coverage by Age in Kannapolis
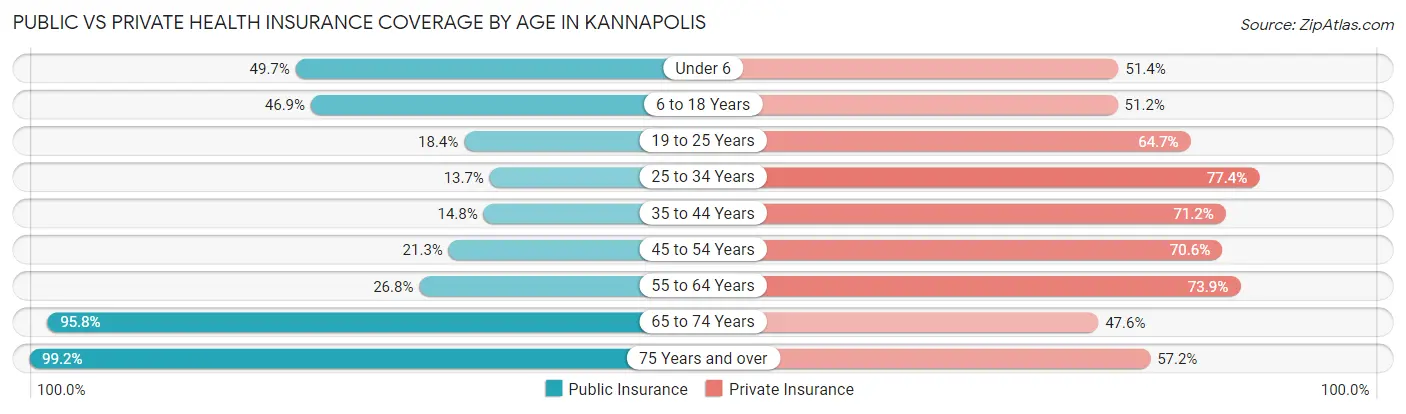
| Age Bracket | Public Insurance | Private Insurance |
| Under 6 | 2,081 (49.7%) | 2,151 (51.4%) |
| 6 to 18 Years | 4,729 (46.9%) | 5,166 (51.2%) |
| 19 to 25 Years | 795 (18.4%) | 2,793 (64.7%) |
| 25 to 34 Years | 893 (13.7%) | 5,059 (77.4%) |
| 35 to 44 Years | 1,127 (14.8%) | 5,418 (71.2%) |
| 45 to 54 Years | 1,498 (21.3%) | 4,965 (70.6%) |
| 55 to 64 Years | 1,564 (26.8%) | 4,321 (73.9%) |
| 65 to 74 Years | 4,887 (95.8%) | 2,428 (47.6%) |
| 75 Years and over | 2,356 (99.2%) | 1,360 (57.2%) |
| Total | 19,930 (37.5%) | 33,661 (63.4%) |
Disability Status by Sex by Age in Kannapolis
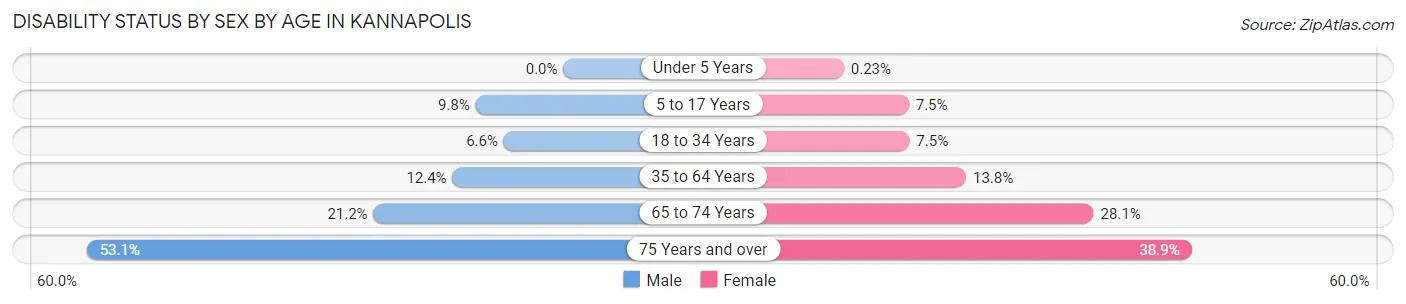
| Age Bracket | Male | Female |
| Under 5 Years | 0 (0.0%) | 4 (0.2%) |
| 5 to 17 Years | 525 (9.8%) | 359 (7.5%) |
| 18 to 34 Years | 387 (6.6%) | 423 (7.5%) |
| 35 to 64 Years | 1,286 (12.3%) | 1,394 (13.8%) |
| 65 to 74 Years | 469 (21.1%) | 809 (28.1%) |
| 75 Years and over | 491 (53.1%) | 565 (38.9%) |
Disability Class by Sex by Age in Kannapolis
Disability Class: Hearing Difficulty
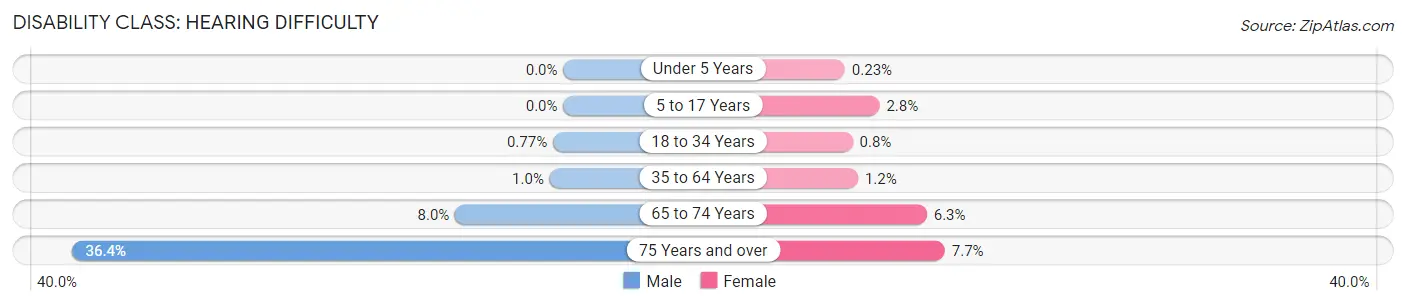
| Age Bracket | Male | Female |
| Under 5 Years | 0 (0.0%) | 4 (0.2%) |
| 5 to 17 Years | 0 (0.0%) | 135 (2.8%) |
| 18 to 34 Years | 45 (0.8%) | 45 (0.8%) |
| 35 to 64 Years | 105 (1.0%) | 121 (1.2%) |
| 65 to 74 Years | 178 (8.0%) | 182 (6.3%) |
| 75 Years and over | 337 (36.4%) | 111 (7.6%) |
Disability Class: Vision Difficulty
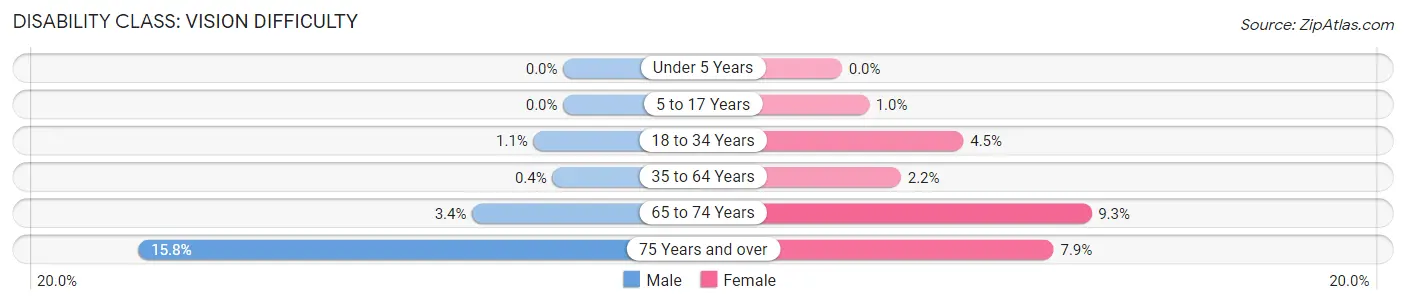
| Age Bracket | Male | Female |
| Under 5 Years | 0 (0.0%) | 0 (0.0%) |
| 5 to 17 Years | 0 (0.0%) | 48 (1.0%) |
| 18 to 34 Years | 64 (1.1%) | 253 (4.5%) |
| 35 to 64 Years | 42 (0.4%) | 221 (2.2%) |
| 65 to 74 Years | 75 (3.4%) | 267 (9.3%) |
| 75 Years and over | 146 (15.8%) | 114 (7.9%) |
Disability Class: Cognitive Difficulty
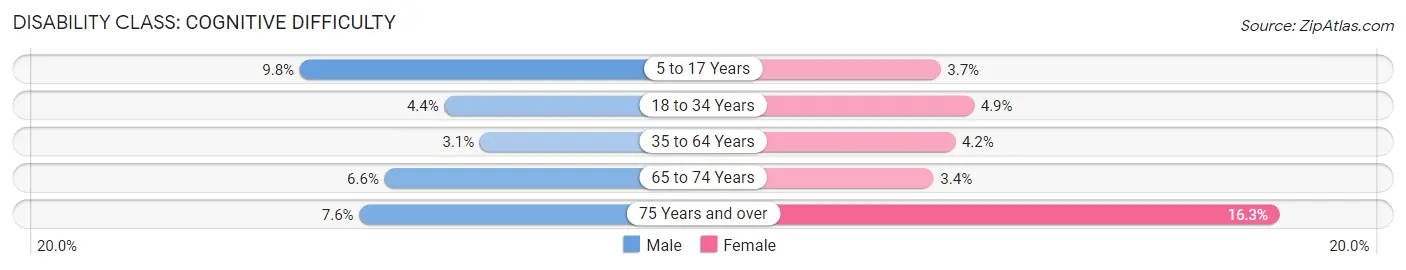
| Age Bracket | Male | Female |
| 5 to 17 Years | 525 (9.8%) | 176 (3.7%) |
| 18 to 34 Years | 257 (4.4%) | 275 (4.9%) |
| 35 to 64 Years | 322 (3.1%) | 423 (4.2%) |
| 65 to 74 Years | 147 (6.6%) | 98 (3.4%) |
| 75 Years and over | 70 (7.6%) | 236 (16.3%) |
Disability Class: Ambulatory Difficulty
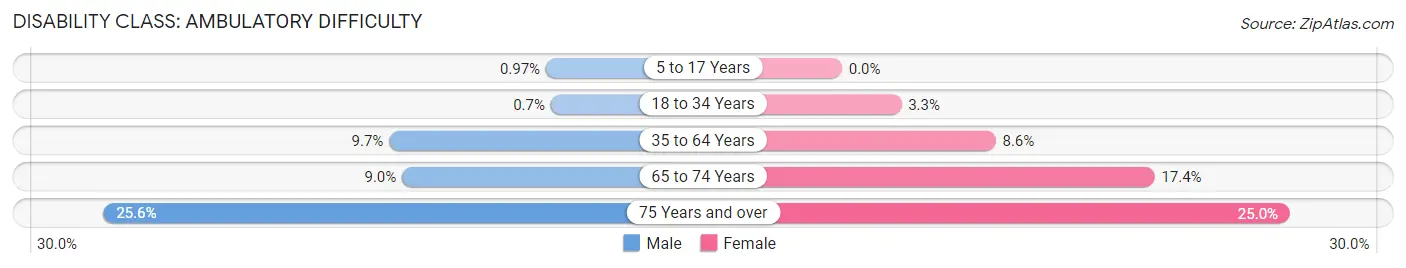
| Age Bracket | Male | Female |
| 5 to 17 Years | 52 (1.0%) | 0 (0.0%) |
| 18 to 34 Years | 41 (0.7%) | 186 (3.3%) |
| 35 to 64 Years | 1,010 (9.7%) | 862 (8.6%) |
| 65 to 74 Years | 199 (9.0%) | 502 (17.4%) |
| 75 Years and over | 237 (25.6%) | 362 (24.9%) |
Disability Class: Self-Care Difficulty
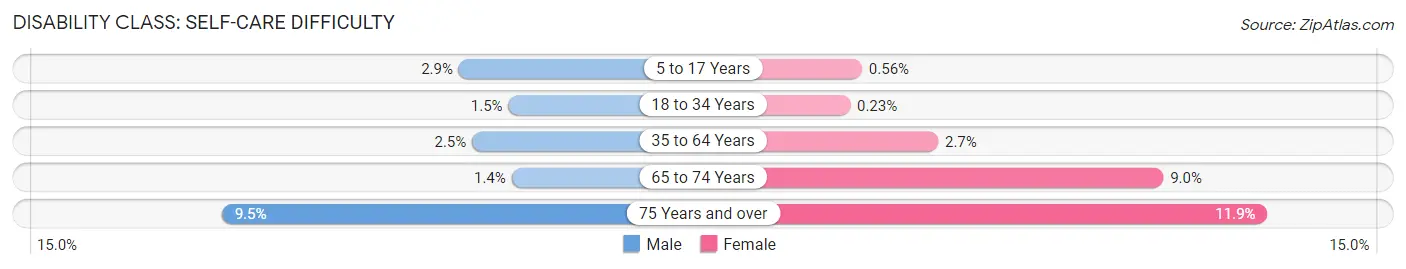
| Age Bracket | Male | Female |
| 5 to 17 Years | 156 (2.9%) | 27 (0.6%) |
| 18 to 34 Years | 89 (1.5%) | 13 (0.2%) |
| 35 to 64 Years | 265 (2.5%) | 270 (2.7%) |
| 65 to 74 Years | 32 (1.4%) | 258 (8.9%) |
| 75 Years and over | 88 (9.5%) | 172 (11.8%) |
Technology Access in Kannapolis
Computing Device Access in Kannapolis
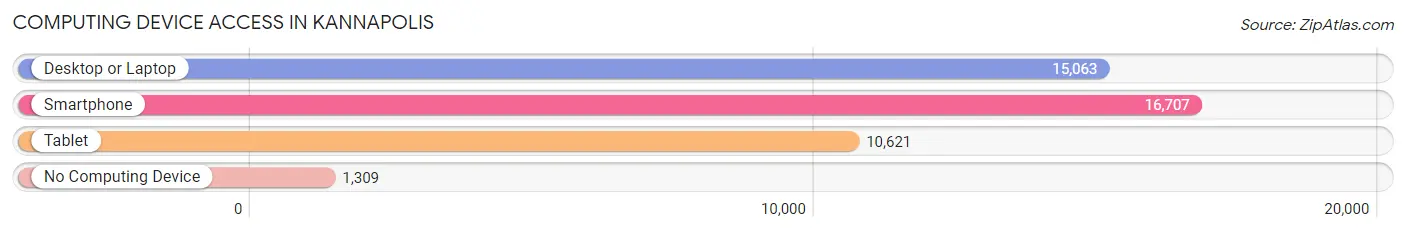
| Device Type | # Households | % Households |
| Desktop or Laptop | 15,063 | 79.2% |
| Smartphone | 16,707 | 87.8% |
| Tablet | 10,621 | 55.8% |
| No Computing Device | 1,309 | 6.9% |
| Total | 19,026 | 100.0% |
Internet Access in Kannapolis
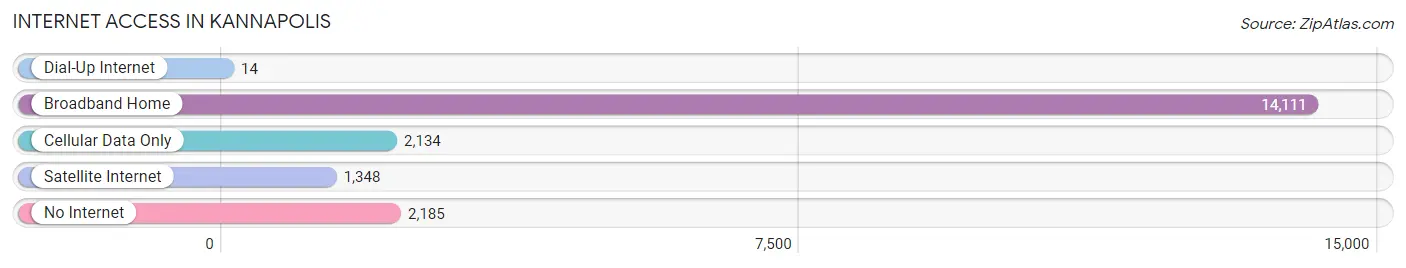
| Internet Type | # Households | % Households |
| Dial-Up Internet | 14 | 0.1% |
| Broadband Home | 14,111 | 74.2% |
| Cellular Data Only | 2,134 | 11.2% |
| Satellite Internet | 1,348 | 7.1% |
| No Internet | 2,185 | 11.5% |
| Total | 19,026 | 100.0% |
Kannapolis Summary
Kannapolis, North Carolina is a small city located in Cabarrus County, approximately 25 miles northeast of Charlotte. The city was founded in 1906 by textile magnate James William Cannon, who named it after himself. Kannapolis is home to the North Carolina Research Campus, a public-private venture that focuses on biotechnology and nutrition research. The city has a population of approximately 44,000 people and is part of the Charlotte metropolitan area.
Geography
Kannapolis is located in the Piedmont region of North Carolina, in the foothills of the Blue Ridge Mountains. The city is situated on the banks of the Rocky River, which flows through the city and is a major source of recreation for the area. The city is located in the heart of Cabarrus County, and is bordered by Concord to the north, Harrisburg to the east, and China Grove to the south. The city covers an area of approximately 16 square miles.
Climate
Kannapolis has a humid subtropical climate, with hot, humid summers and mild winters. The average annual temperature is around 61°F, with an average high of around 87°F in the summer and an average low of around 35°F in the winter. The city receives an average of 48 inches of precipitation per year, with most of it falling in the summer months.
Demographics
As of the 2010 census, Kannapolis had a population of 43,738 people. The racial makeup of the city was 79.2% White, 14.3% African American, 0.4% Native American, 1.7% Asian, 0.1% Pacific Islander, 2.2% from other races, and 2.1% from two or more races. Hispanic or Latino of any race were 5.2% of the population.
Economy
Kannapolis is home to the North Carolina Research Campus, a public-private venture that focuses on biotechnology and nutrition research. The city is also home to several major employers, including the Cabarrus County Schools, Cabarrus Health Alliance, and the Kannapolis City Schools. The city is also home to several manufacturing companies, including Continental Tire, and the Kannapolis Intimidators, a minor league baseball team.
History
Kannapolis was founded in 1906 by textile magnate James William Cannon, who named it after himself. The city was originally a planned community, with Cannon providing housing and other amenities for his workers. The city grew rapidly in the early 20th century, and by the 1950s it was the largest city in Cabarrus County. In the late 20th century, the city began to decline as the textile industry moved overseas. In 2006, the North Carolina Research Campus was established in Kannapolis, providing a major boost to the local economy. Today, Kannapolis is a thriving city with a diverse economy and a vibrant culture.
Common Questions
What is Per Capita Income in Kannapolis?
Per Capita income in Kannapolis is $32,448.
What is the Median Family Income in Kannapolis?
Median Family Income in Kannapolis is $77,589.
What is the Median Household income in Kannapolis?
Median Household Income in Kannapolis is $66,487.
What is Income or Wage Gap in Kannapolis?
Income or Wage Gap in Kannapolis is 14.9%.
Women in Kannapolis earn 85.1 cents for every dollar earned by a man.
What is Inequality or Gini Index in Kannapolis?
Inequality or Gini Index in Kannapolis is 0.45.
What is the Total Population of Kannapolis?
Total Population of Kannapolis is 53,314.
What is the Total Male Population of Kannapolis?
Total Male Population of Kannapolis is 26,650.
What is the Total Female Population of Kannapolis?
Total Female Population of Kannapolis is 26,664.
What is the Ratio of Males per 100 Females in Kannapolis?
There are 99.95 Males per 100 Females in Kannapolis.
What is the Ratio of Females per 100 Males in Kannapolis?
There are 100.05 Females per 100 Males in Kannapolis.
What is the Median Population Age in Kannapolis?
Median Population Age in Kannapolis is 37.0 Years.
What is the Average Family Size in Kannapolis
Average Family Size in Kannapolis is 3.4 People.
What is the Average Household Size in Kannapolis
Average Household Size in Kannapolis is 2.8 People.
How Large is the Labor Force in Kannapolis?
There are 26,796 People in the Labor Forcein in Kannapolis.
What is the Percentage of People in the Labor Force in Kannapolis?
65.2% of People are in the Labor Force in Kannapolis.
What is the Unemployment Rate in Kannapolis?
Unemployment Rate in Kannapolis is 6.1%.