La Plata, NM Map & Demographics
La Plata Map
La Plata Overview
$28,234
PER CAPITA INCOME
$51,885
AVG FAMILY INCOME
$53,056
AVG HOUSEHOLD INCOME
55.1%
WAGE / INCOME GAP [ % ]
44.9¢/ $1
WAGE / INCOME GAP [ $ ]
0.51
INEQUALITY / GINI INDEX
2,063
TOTAL POPULATION
1,033
MALE POPULATION
1,030
FEMALE POPULATION
100.29
MALES / 100 FEMALES
99.71
FEMALES / 100 MALES
45.3
MEDIAN AGE
2.9
AVG FAMILY SIZE
2.7
AVG HOUSEHOLD SIZE
738
LABOR FORCE [ PEOPLE ]
45.5%
PERCENT IN LABOR FORCE
8.5%
UNEMPLOYMENT RATE
La Plata Zip Codes
La Plata Area Codes
Income in La Plata
Income Overview in La Plata
Per Capita Income in La Plata is $28,234, while median incomes of families and households are $51,885 and $53,056 respectively.
| Characteristic | Number | Measure |
| Per Capita Income | 2,063 | $28,234 |
| Median Family Income | 615 | $51,885 |
| Mean Family Income | 615 | $75,576 |
| Median Household Income | 760 | $53,056 |
| Mean Household Income | 760 | $73,594 |
| Income Deficit | 615 | $0 |
| Wage / Income Gap (%) | 2,063 | 55.12% |
| Wage / Income Gap ($) | 2,063 | 44.88¢ per $1 |
| Gini / Inequality Index | 2,063 | 0.51 |
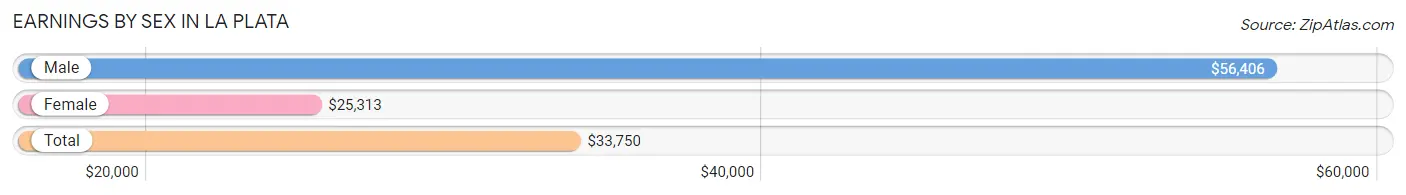
Earnings by Sex in La Plata
Average Earnings in La Plata are $33,750, $56,406 for men and $25,313 for women, a difference of 55.1%.
| Sex | Number | Average Earnings |
| Male | 351 (43.6%) | $56,406 |
| Female | 454 (56.4%) | $25,313 |
| Total | 805 (100.0%) | $33,750 |
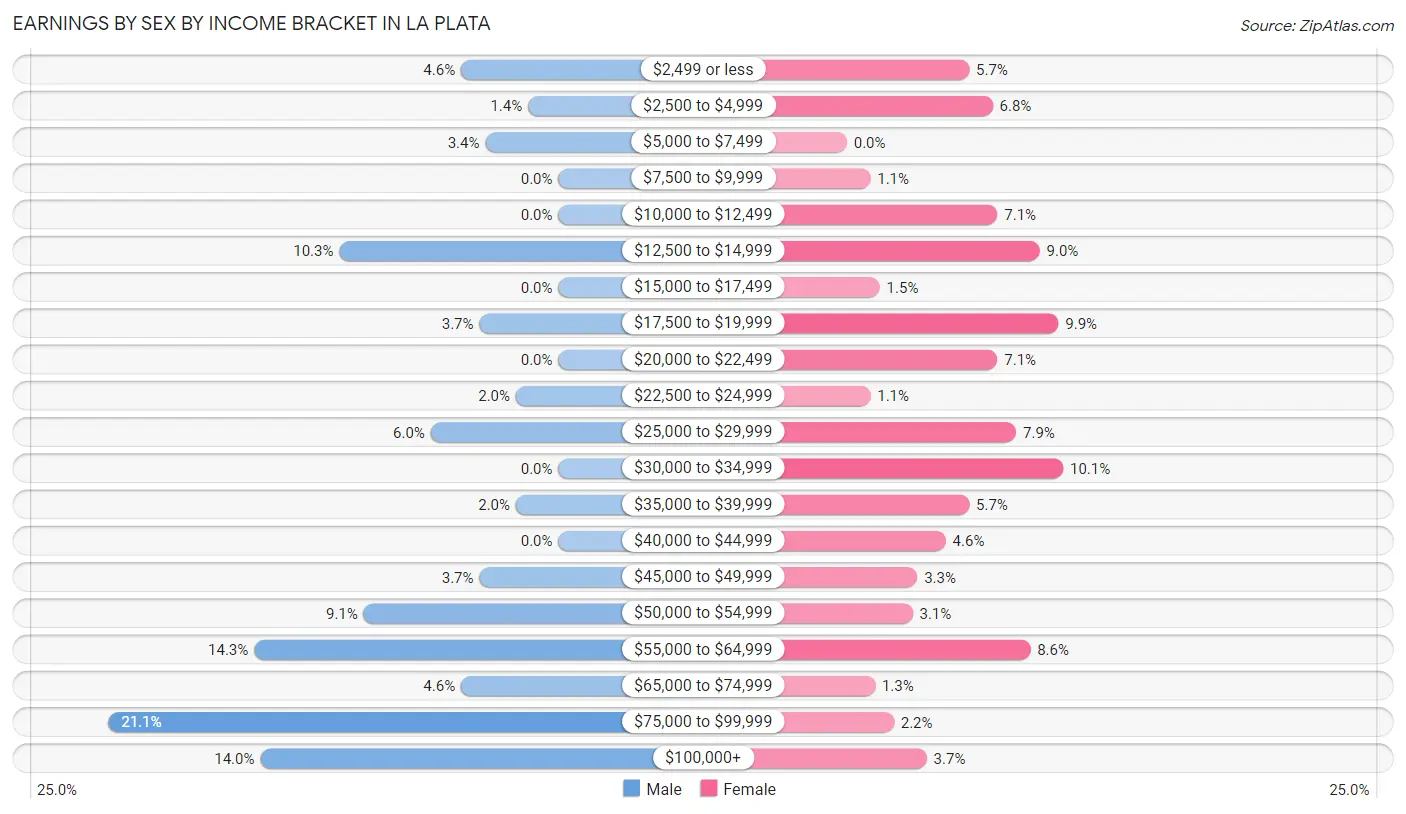
Earnings by Sex by Income Bracket in La Plata
The most common earnings brackets in La Plata are $75,000 to $99,999 for men (74 | 21.1%) and $30,000 to $34,999 for women (46 | 10.1%).
| Income | Male | Female |
| $2,499 or less | 16 (4.6%) | 26 (5.7%) |
| $2,500 to $4,999 | 5 (1.4%) | 31 (6.8%) |
| $5,000 to $7,499 | 12 (3.4%) | 0 (0.0%) |
| $7,500 to $9,999 | 0 (0.0%) | 5 (1.1%) |
| $10,000 to $12,499 | 0 (0.0%) | 32 (7.0%) |
| $12,500 to $14,999 | 36 (10.3%) | 41 (9.0%) |
| $15,000 to $17,499 | 0 (0.0%) | 7 (1.5%) |
| $17,500 to $19,999 | 13 (3.7%) | 45 (9.9%) |
| $20,000 to $22,499 | 0 (0.0%) | 32 (7.0%) |
| $22,500 to $24,999 | 7 (2.0%) | 5 (1.1%) |
| $25,000 to $29,999 | 21 (6.0%) | 36 (7.9%) |
| $30,000 to $34,999 | 0 (0.0%) | 46 (10.1%) |
| $35,000 to $39,999 | 7 (2.0%) | 26 (5.7%) |
| $40,000 to $44,999 | 0 (0.0%) | 21 (4.6%) |
| $45,000 to $49,999 | 13 (3.7%) | 15 (3.3%) |
| $50,000 to $54,999 | 32 (9.1%) | 14 (3.1%) |
| $55,000 to $64,999 | 50 (14.2%) | 39 (8.6%) |
| $65,000 to $74,999 | 16 (4.6%) | 6 (1.3%) |
| $75,000 to $99,999 | 74 (21.1%) | 10 (2.2%) |
| $100,000+ | 49 (14.0%) | 17 (3.7%) |
| Total | 351 (100.0%) | 454 (100.0%) |
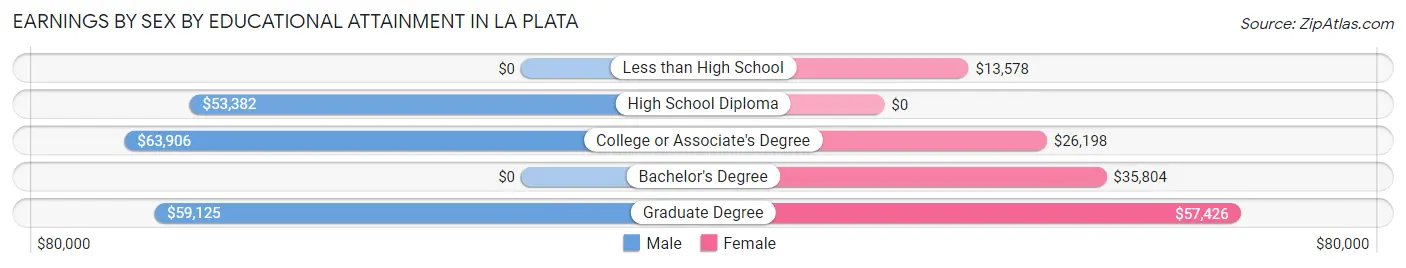
Earnings by Sex by Educational Attainment in La Plata
Average earnings in La Plata are $56,823 for men and $26,771 for women, a difference of 52.9%. Men with an educational attainment of college or associate's degree enjoy the highest average annual earnings of $63,906, while those with high school diploma education earn the least with $53,382. Women with an educational attainment of graduate degree earn the most with the average annual earnings of $57,426, while those with less than high school education have the smallest earnings of $13,578.
| Educational Attainment | Male Income | Female Income |
| Less than High School | - | - |
| High School Diploma | $53,382 | $0 |
| College or Associate's Degree | $63,906 | $26,198 |
| Bachelor's Degree | - | - |
| Graduate Degree | $59,125 | $57,426 |
| Total | $56,823 | $26,771 |
Family Income in La Plata
Family Income Brackets in La Plata
According to the La Plata family income data, there are 131 families falling into the $50,000 to $74,999 income range, which is the most common income bracket and makes up 21.3% of all families. Conversely, the $15,000 to $24,999 income bracket is the least frequent group with only 31 families (5.0%) belonging to this category.
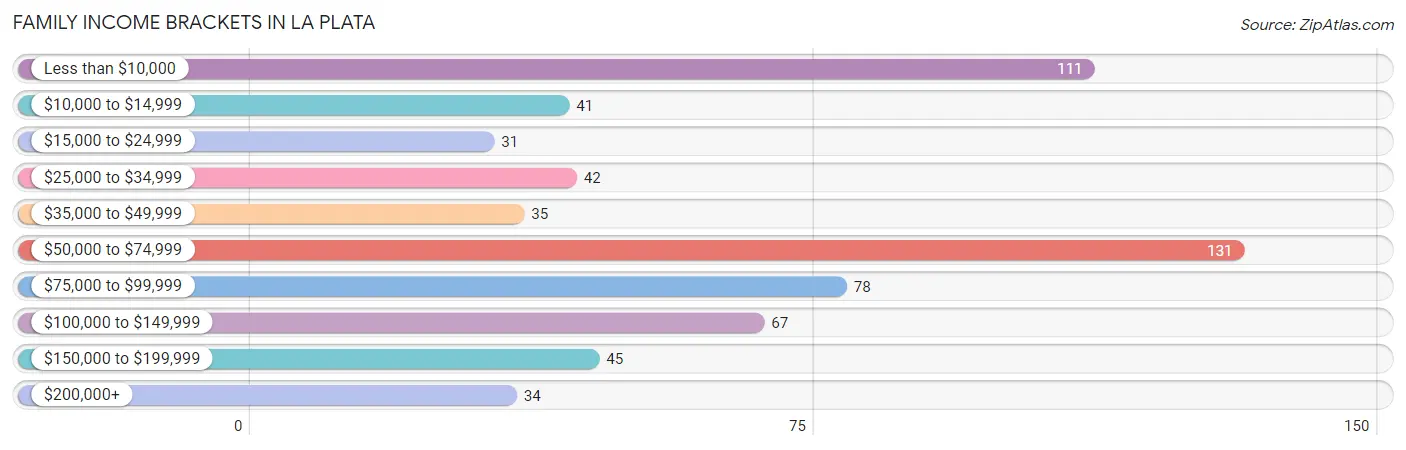
| Income Bracket | # Families | % Families |
| Less than $10,000 | 111 | 18.0% |
| $10,000 to $14,999 | 41 | 6.7% |
| $15,000 to $24,999 | 31 | 5.0% |
| $25,000 to $34,999 | 42 | 6.8% |
| $35,000 to $49,999 | 35 | 5.7% |
| $50,000 to $74,999 | 131 | 21.3% |
| $75,000 to $99,999 | 78 | 12.7% |
| $100,000 to $149,999 | 67 | 10.9% |
| $150,000 to $199,999 | 45 | 7.3% |
| $200,000+ | 34 | 5.5% |
Family Income by Famaliy Size in La Plata
4-person families (77 | 12.5%) account for the highest median family income in La Plata with $79,750 per family, while 2-person families (376 | 61.1%) have the highest median income of $25,495 per family member.
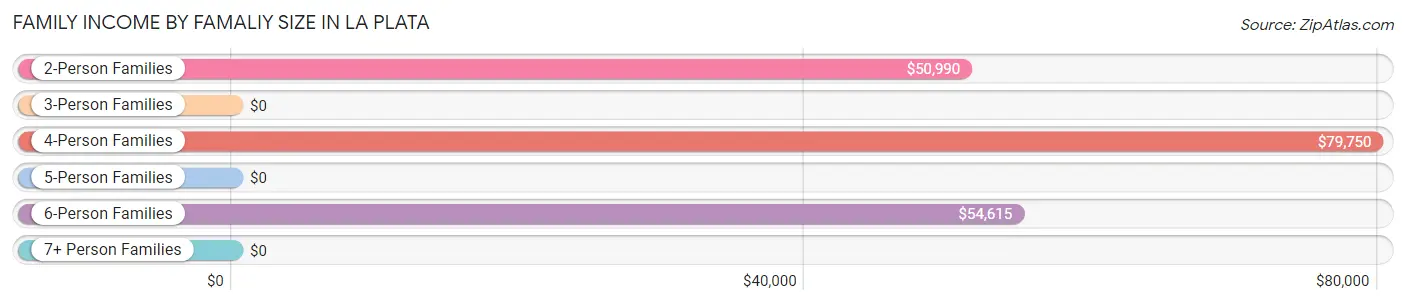
| Income Bracket | # Families | Median Income |
| 2-Person Families | 376 (61.1%) | $50,990 |
| 3-Person Families | 87 (14.1%) | $0 |
| 4-Person Families | 77 (12.5%) | $79,750 |
| 5-Person Families | 53 (8.6%) | $0 |
| 6-Person Families | 22 (3.6%) | $54,615 |
| 7+ Person Families | 0 (0.0%) | $0 |
| Total | 615 (100.0%) | $51,885 |
Family Income by Number of Earners in La Plata
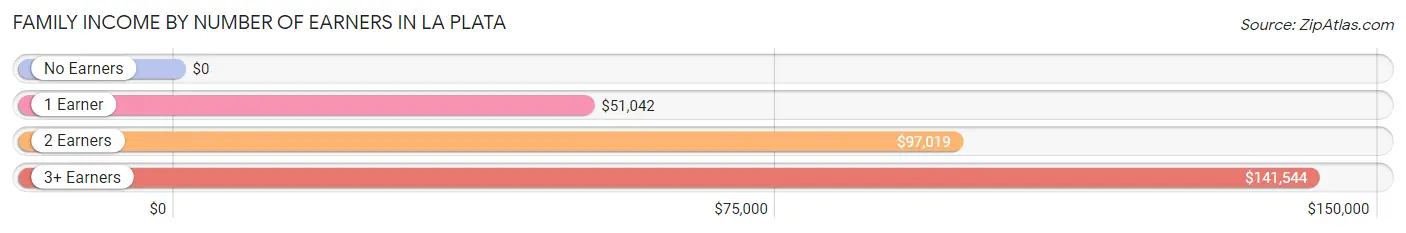
| Number of Earners | # Families | Median Income |
| No Earners | 201 (32.7%) | $0 |
| 1 Earner | 248 (40.3%) | $51,042 |
| 2 Earners | 125 (20.3%) | $97,019 |
| 3+ Earners | 41 (6.7%) | $141,544 |
| Total | 615 (100.0%) | $51,885 |
Household Income in La Plata
Household Income Brackets in La Plata
With 174 households falling in the category, the $50,000 to $74,999 income range is the most frequent in La Plata, accounting for 22.9% of all households. In contrast, only 34 households (4.5%) fall into the $200,000+ income bracket, making it the least populous group.
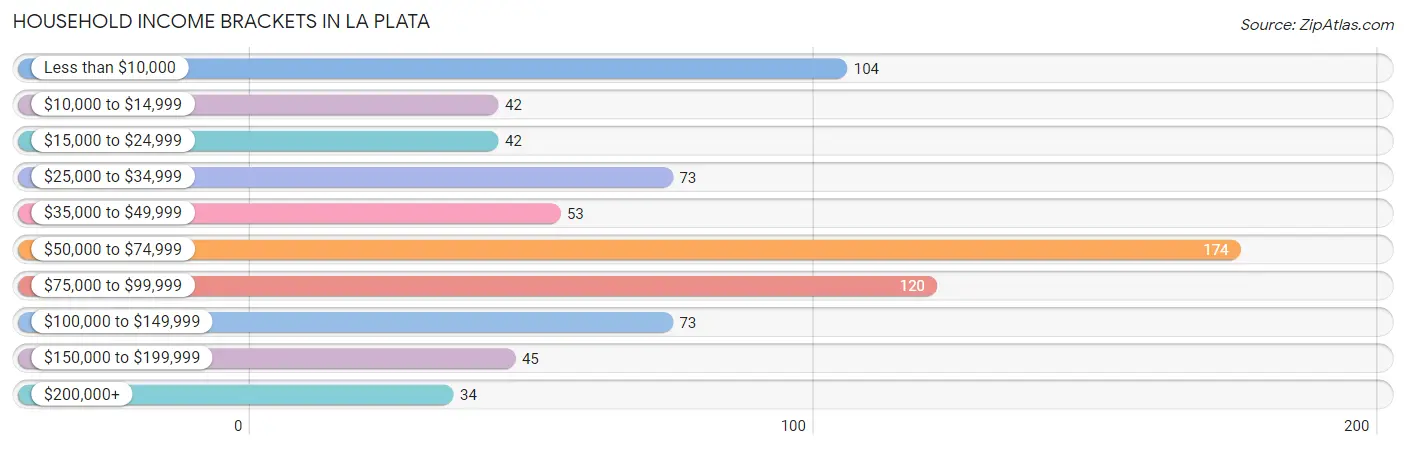
| Income Bracket | # Households | % Households |
| Less than $10,000 | 104 | 13.7% |
| $10,000 to $14,999 | 42 | 5.5% |
| $15,000 to $24,999 | 42 | 5.5% |
| $25,000 to $34,999 | 73 | 9.6% |
| $35,000 to $49,999 | 53 | 7.0% |
| $50,000 to $74,999 | 174 | 22.9% |
| $75,000 to $99,999 | 120 | 15.8% |
| $100,000 to $149,999 | 73 | 9.6% |
| $150,000 to $199,999 | 45 | 5.9% |
| $200,000+ | 34 | 4.5% |
Household Income by Householder Age in La Plata
The median household income in La Plata is $53,056, with the highest median household income of $84,479 found in the 45 to 64 years age bracket for the primary householder. A total of 221 households (29.1%) fall into this category.
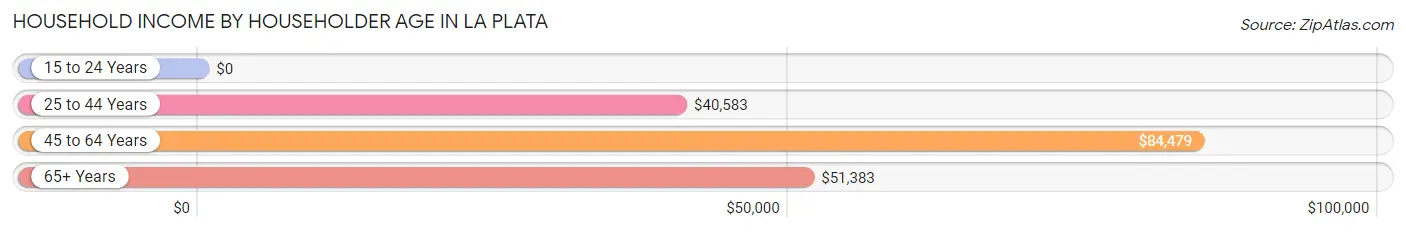
| Income Bracket | # Households | Median Income |
| 15 to 24 Years | 0 (0.0%) | $0 |
| 25 to 44 Years | 221 (29.1%) | $40,583 |
| 45 to 64 Years | 221 (29.1%) | $84,479 |
| 65+ Years | 318 (41.8%) | $51,383 |
| Total | 760 (100.0%) | $53,056 |
Poverty in La Plata
Income Below Poverty by Sex and Age in La Plata
With 26.5% poverty level for males and 28.5% for females among the residents of La Plata, 16 and 17 year old males and 25 to 34 year old females are the most vulnerable to poverty, with 8 males (50.0%) and 47 females (48.0%) in their respective age groups living below the poverty level.
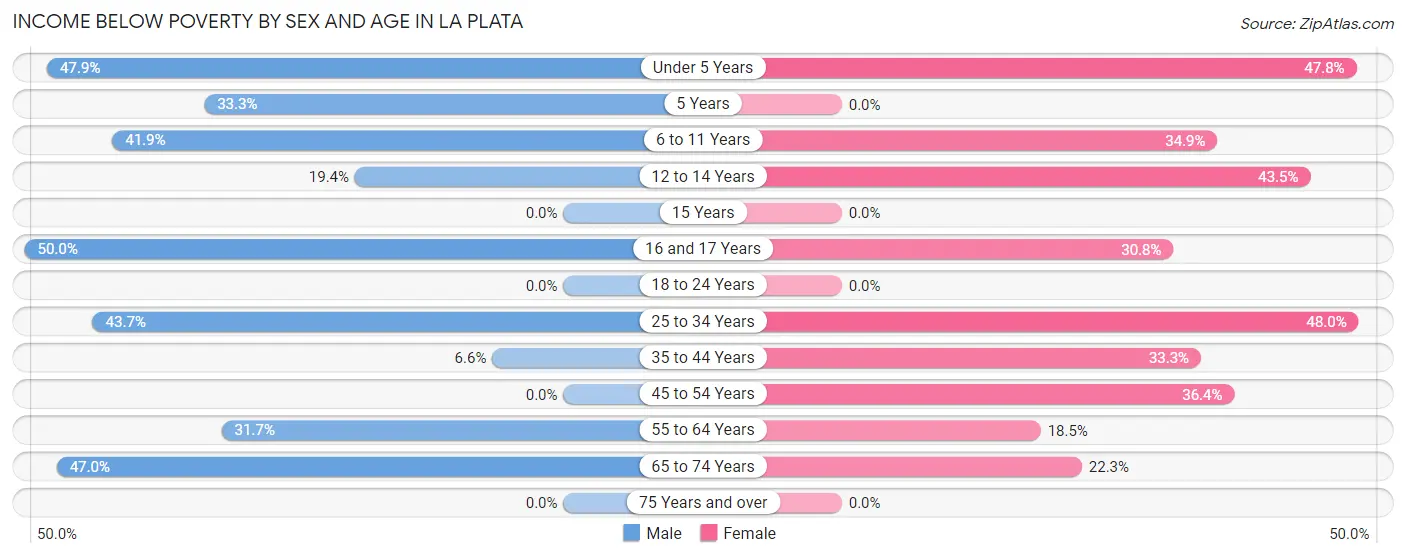
| Age Bracket | Male | Female |
| Under 5 Years | 23 (47.9%) | 32 (47.8%) |
| 5 Years | 11 (33.3%) | 0 (0.0%) |
| 6 to 11 Years | 36 (41.9%) | 23 (34.8%) |
| 12 to 14 Years | 12 (19.4%) | 10 (43.5%) |
| 15 Years | 0 (0.0%) | 0 (0.0%) |
| 16 and 17 Years | 8 (50.0%) | 8 (30.8%) |
| 18 to 24 Years | 0 (0.0%) | 0 (0.0%) |
| 25 to 34 Years | 38 (43.7%) | 47 (48.0%) |
| 35 to 44 Years | 7 (6.6%) | 52 (33.3%) |
| 45 to 54 Years | 0 (0.0%) | 55 (36.4%) |
| 55 to 64 Years | 59 (31.7%) | 24 (18.5%) |
| 65 to 74 Years | 79 (47.0%) | 43 (22.3%) |
| 75 Years and over | 0 (0.0%) | 0 (0.0%) |
| Total | 273 (26.5%) | 294 (28.5%) |
Income Above Poverty by Sex and Age in La Plata
According to the poverty statistics in La Plata, males aged 15 years and females aged 5 years are the age groups that are most secure financially, with 100.0% of males and 100.0% of females in these age groups living above the poverty line.
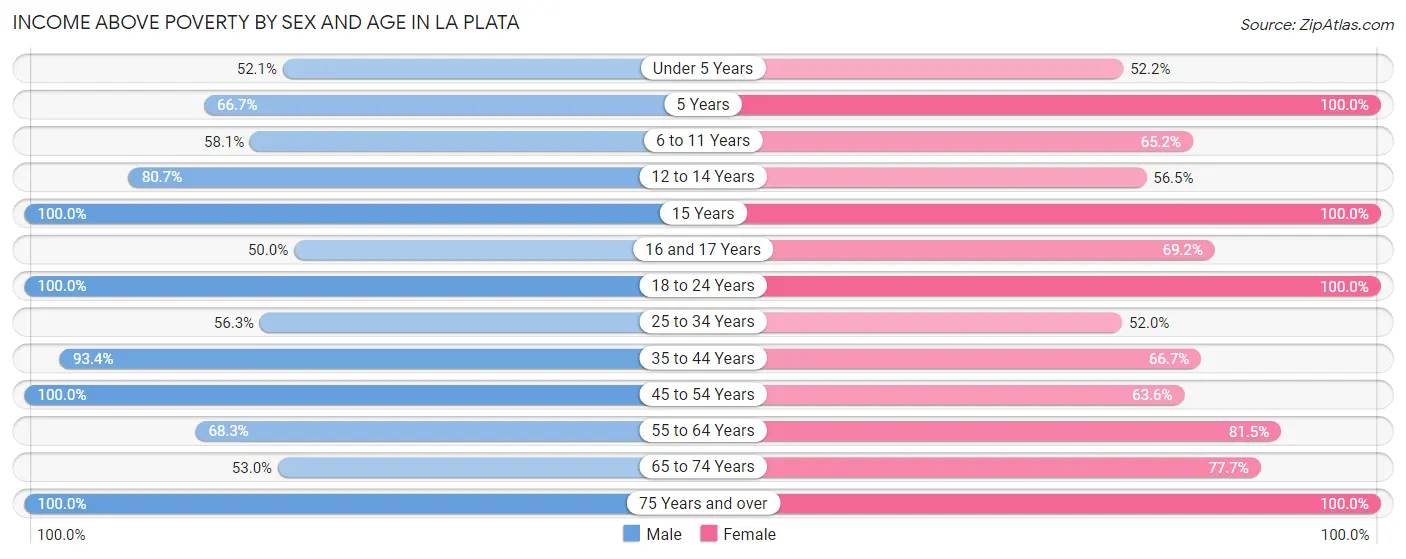
| Age Bracket | Male | Female |
| Under 5 Years | 25 (52.1%) | 35 (52.2%) |
| 5 Years | 22 (66.7%) | 3 (100.0%) |
| 6 to 11 Years | 50 (58.1%) | 43 (65.1%) |
| 12 to 14 Years | 50 (80.6%) | 13 (56.5%) |
| 15 Years | 33 (100.0%) | 17 (100.0%) |
| 16 and 17 Years | 8 (50.0%) | 18 (69.2%) |
| 18 to 24 Years | 41 (100.0%) | 28 (100.0%) |
| 25 to 34 Years | 49 (56.3%) | 51 (52.0%) |
| 35 to 44 Years | 99 (93.4%) | 104 (66.7%) |
| 45 to 54 Years | 78 (100.0%) | 96 (63.6%) |
| 55 to 64 Years | 127 (68.3%) | 106 (81.5%) |
| 65 to 74 Years | 89 (53.0%) | 150 (77.7%) |
| 75 Years and over | 85 (100.0%) | 72 (100.0%) |
| Total | 756 (73.5%) | 736 (71.5%) |
Income Below Poverty Among Married-Couple Families in La Plata
The poverty statistics for married-couple families in La Plata show that 21.9% or 89 of the total 407 families live below the poverty line. Families with no children have the highest poverty rate of 26.2%, comprising of 79 families. On the other hand, families with 1 or 2 children have the lowest poverty rate of 0.0%, which includes 0 families.
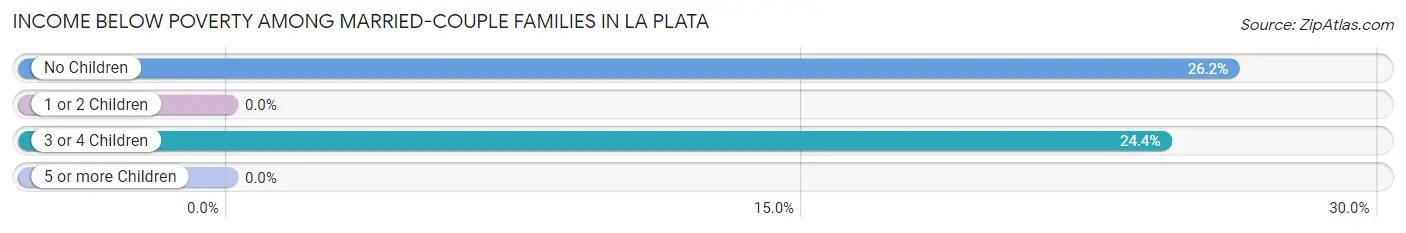
| Children | Above Poverty | Below Poverty |
| No Children | 223 (73.8%) | 79 (26.2%) |
| 1 or 2 Children | 64 (100.0%) | 0 (0.0%) |
| 3 or 4 Children | 31 (75.6%) | 10 (24.4%) |
| 5 or more Children | 0 (0.0%) | 0 (0.0%) |
| Total | 318 (78.1%) | 89 (21.9%) |
Income Below Poverty Among Single-Parent Households in La Plata
According to the poverty data in La Plata, 31.6% or 12 single-father households and 40.6% or 69 single-mother households are living below the poverty line. Among single-father households, those with 3 or 4 children have the highest poverty rate, with 12 households (52.2%) experiencing poverty. Likewise, among single-mother households, those with 3 or 4 children have the highest poverty rate, with 18 households (100.0%) falling below the poverty line.
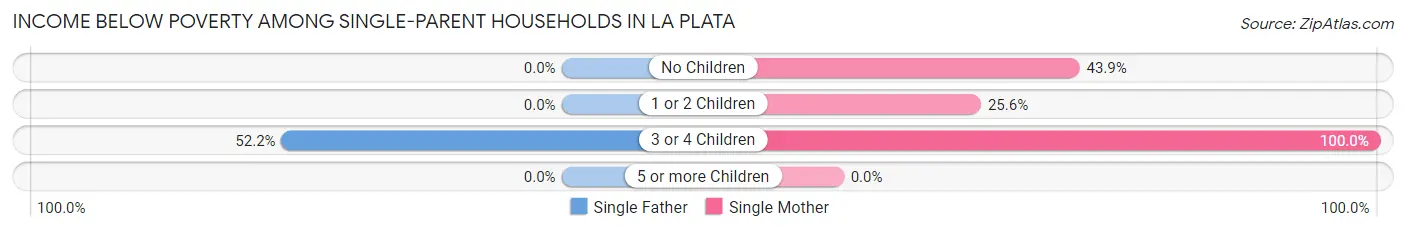
| Children | Single Father | Single Mother |
| No Children | 0 (0.0%) | 29 (43.9%) |
| 1 or 2 Children | 0 (0.0%) | 22 (25.6%) |
| 3 or 4 Children | 12 (52.2%) | 18 (100.0%) |
| 5 or more Children | 0 (0.0%) | 0 (0.0%) |
| Total | 12 (31.6%) | 69 (40.6%) |
Income Below Poverty Among Married-Couple vs Single-Parent Households in La Plata
The poverty data for La Plata shows that 89 of the married-couple family households (21.9%) and 81 of the single-parent households (38.9%) are living below the poverty level. Within the married-couple family households, those with no children have the highest poverty rate, with 79 households (26.2%) falling below the poverty line. Among the single-parent households, those with 3 or 4 children have the highest poverty rate, with 30 household (73.2%) living below poverty.
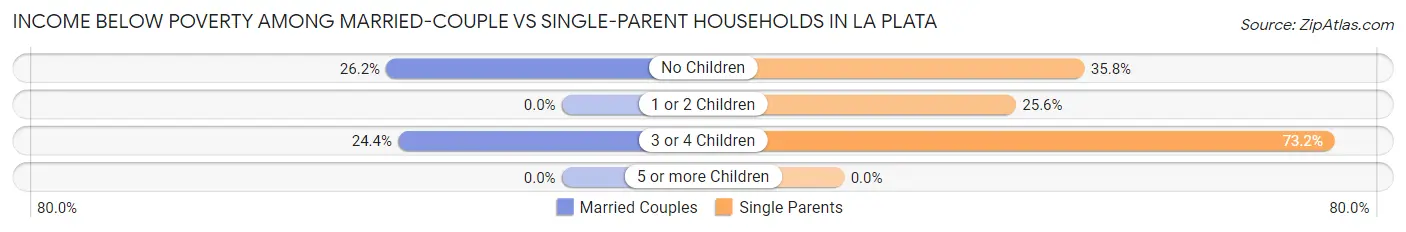
| Children | Married-Couple Families | Single-Parent Households |
| No Children | 79 (26.2%) | 29 (35.8%) |
| 1 or 2 Children | 0 (0.0%) | 22 (25.6%) |
| 3 or 4 Children | 10 (24.4%) | 30 (73.2%) |
| 5 or more Children | 0 (0.0%) | 0 (0.0%) |
| Total | 89 (21.9%) | 81 (38.9%) |
Race in La Plata
The most populous races in La Plata are White / Caucasian (1,519 | 73.6%), Hispanic or Latino (502 | 24.3%), and Native / Alaskan (264 | 12.8%).
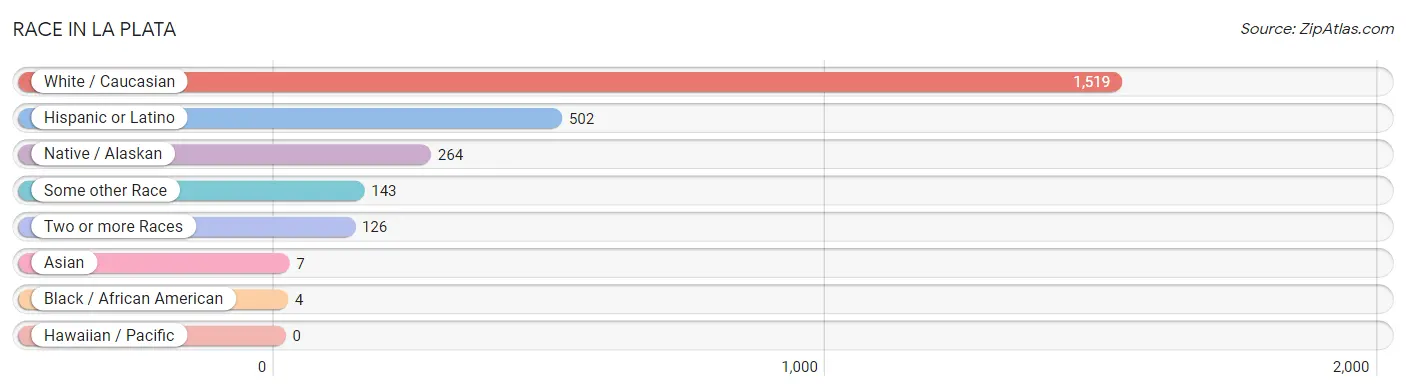
| Race | # Population | % Population |
| Asian | 7 | 0.3% |
| Black / African American | 4 | 0.2% |
| Hawaiian / Pacific | 0 | 0.0% |
| Hispanic or Latino | 502 | 24.3% |
| Native / Alaskan | 264 | 12.8% |
| White / Caucasian | 1,519 | 73.6% |
| Two or more Races | 126 | 6.1% |
| Some other Race | 143 | 6.9% |
| Total | 2,063 | 100.0% |
Ancestry in La Plata
The most populous ancestries reported in La Plata are Mexican (347 | 16.8%), American (242 | 11.7%), German (225 | 10.9%), Navajo (202 | 9.8%), and Irish (116 | 5.6%), together accounting for 54.9% of all La Plata residents.
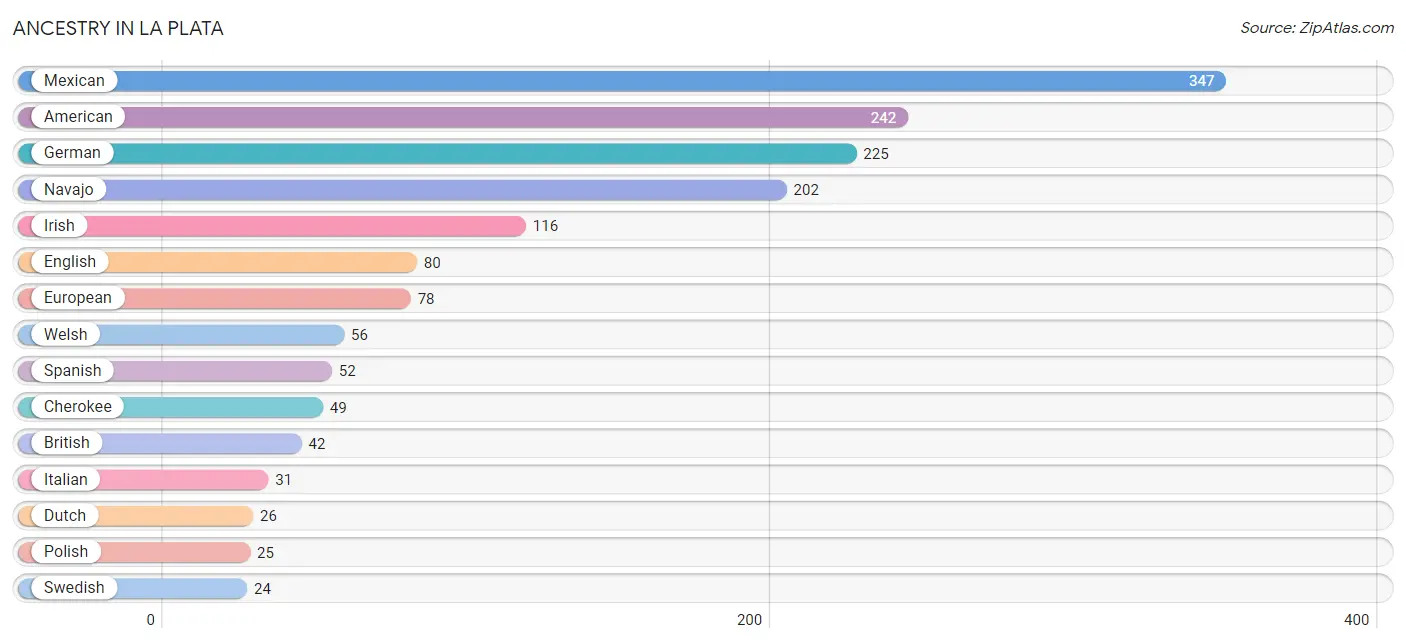
| Ancestry | # Population | % Population |
| American | 242 | 11.7% |
| Arab | 6 | 0.3% |
| Austrian | 5 | 0.2% |
| British | 42 | 2.0% |
| Cherokee | 49 | 2.4% |
| Choctaw | 11 | 0.5% |
| Danish | 9 | 0.4% |
| Dutch | 26 | 1.3% |
| English | 80 | 3.9% |
| European | 78 | 3.8% |
| French | 17 | 0.8% |
| German | 225 | 10.9% |
| Indian (Asian) | 13 | 0.6% |
| Irish | 116 | 5.6% |
| Italian | 31 | 1.5% |
| Lebanese | 6 | 0.3% |
| Mexican | 347 | 16.8% |
| Navajo | 202 | 9.8% |
| Northern European | 13 | 0.6% |
| Polish | 25 | 1.2% |
| Scandinavian | 5 | 0.2% |
| Scotch-Irish | 6 | 0.3% |
| Scottish | 17 | 0.8% |
| Slovene | 6 | 0.3% |
| Spanish | 52 | 2.5% |
| Swedish | 24 | 1.2% |
| Ukrainian | 4 | 0.2% |
| Welsh | 56 | 2.7% | View All 28 Rows |
Immigrants in La Plata
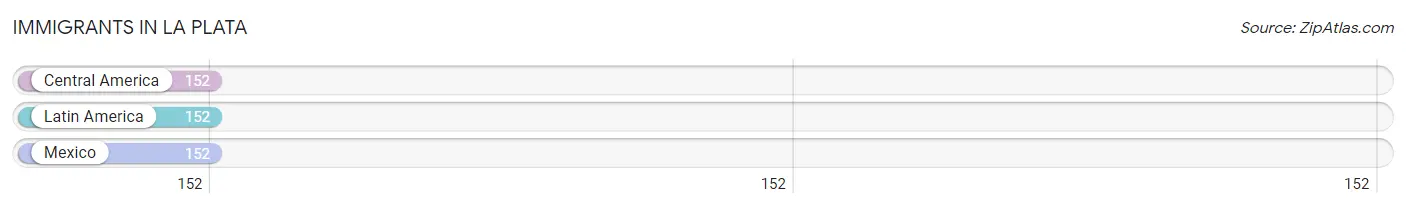
The most numerous immigrant groups reported in La Plata came from Central America (152 | 7.4%), Latin America (152 | 7.4%), and Mexico (152 | 7.4%), together accounting for 22.1% of all La Plata residents.
| Immigration Origin | # Population | % Population |
| Central America | 152 | 7.4% |
| Latin America | 152 | 7.4% |
| Mexico | 152 | 7.4% | View All 3 Rows |
Sex and Age in La Plata
Sex and Age in La Plata
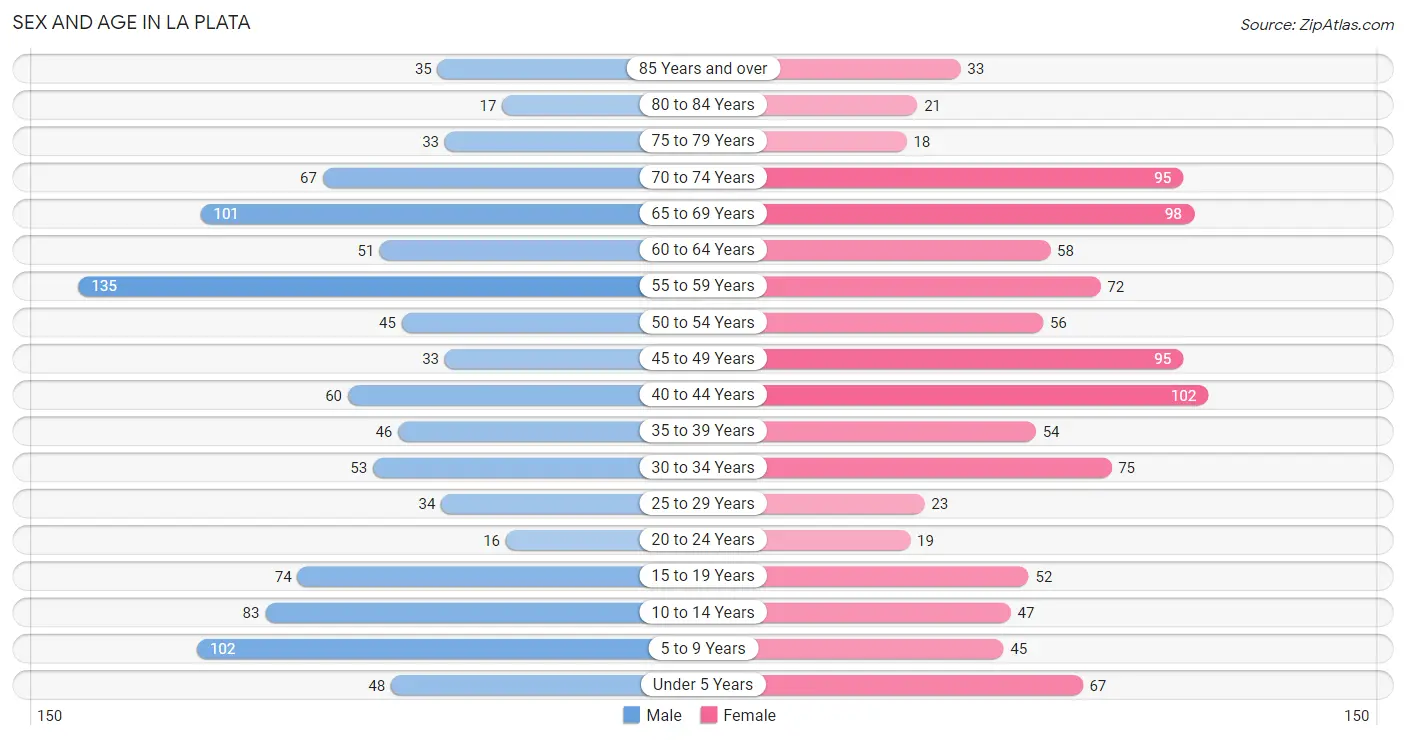
The most populous age groups in La Plata are 55 to 59 Years (135 | 13.1%) for men and 40 to 44 Years (102 | 9.9%) for women.
| Age Bracket | Male | Female |
| Under 5 Years | 48 (4.6%) | 67 (6.5%) |
| 5 to 9 Years | 102 (9.9%) | 45 (4.4%) |
| 10 to 14 Years | 83 (8.0%) | 47 (4.6%) |
| 15 to 19 Years | 74 (7.2%) | 52 (5.1%) |
| 20 to 24 Years | 16 (1.5%) | 19 (1.8%) |
| 25 to 29 Years | 34 (3.3%) | 23 (2.2%) |
| 30 to 34 Years | 53 (5.1%) | 75 (7.3%) |
| 35 to 39 Years | 46 (4.4%) | 54 (5.2%) |
| 40 to 44 Years | 60 (5.8%) | 102 (9.9%) |
| 45 to 49 Years | 33 (3.2%) | 95 (9.2%) |
| 50 to 54 Years | 45 (4.4%) | 56 (5.4%) |
| 55 to 59 Years | 135 (13.1%) | 72 (7.0%) |
| 60 to 64 Years | 51 (4.9%) | 58 (5.6%) |
| 65 to 69 Years | 101 (9.8%) | 98 (9.5%) |
| 70 to 74 Years | 67 (6.5%) | 95 (9.2%) |
| 75 to 79 Years | 33 (3.2%) | 18 (1.8%) |
| 80 to 84 Years | 17 (1.7%) | 21 (2.0%) |
| 85 Years and over | 35 (3.4%) | 33 (3.2%) |
| Total | 1,033 (100.0%) | 1,030 (100.0%) |
Families and Households in La Plata
Median Family Size in La Plata
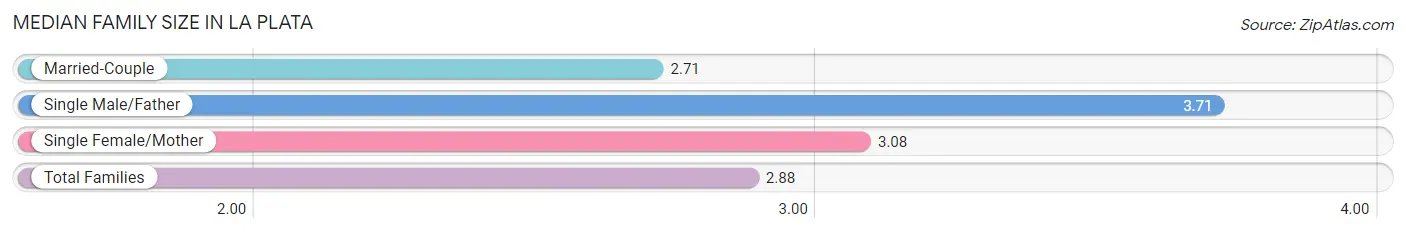
The median family size in La Plata is 2.88 persons per family, with single male/father families (38 | 6.2%) accounting for the largest median family size of 3.71 persons per family. On the other hand, married-couple families (407 | 66.2%) represent the smallest median family size with 2.71 persons per family.
| Family Type | # Families | Family Size |
| Married-Couple | 407 (66.2%) | 2.71 |
| Single Male/Father | 38 (6.2%) | 3.71 |
| Single Female/Mother | 170 (27.6%) | 3.08 |
| Total Families | 615 (100.0%) | 2.88 |
Median Household Size in La Plata
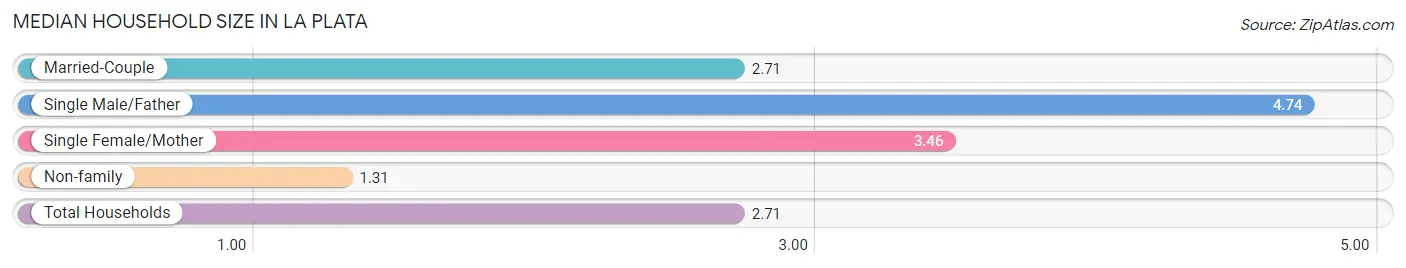
The median household size in La Plata is 2.71 persons per household, with single male/father households (38 | 5.0%) accounting for the largest median household size of 4.74 persons per household. non-family households (145 | 19.1%) represent the smallest median household size with 1.31 persons per household.
| Household Type | # Households | Household Size |
| Married-Couple | 407 (53.5%) | 2.71 |
| Single Male/Father | 38 (5.0%) | 4.74 |
| Single Female/Mother | 170 (22.4%) | 3.46 |
| Non-family | 145 (19.1%) | 1.31 |
| Total Households | 760 (100.0%) | 2.71 |
Household Size by Marriage Status in La Plata
Out of a total of 760 households in La Plata, 615 (80.9%) are family households, while 145 (19.1%) are nonfamily households. The most numerous type of family households are 2-person households, comprising 322, and the most common type of nonfamily households are 1-person households, comprising 105.
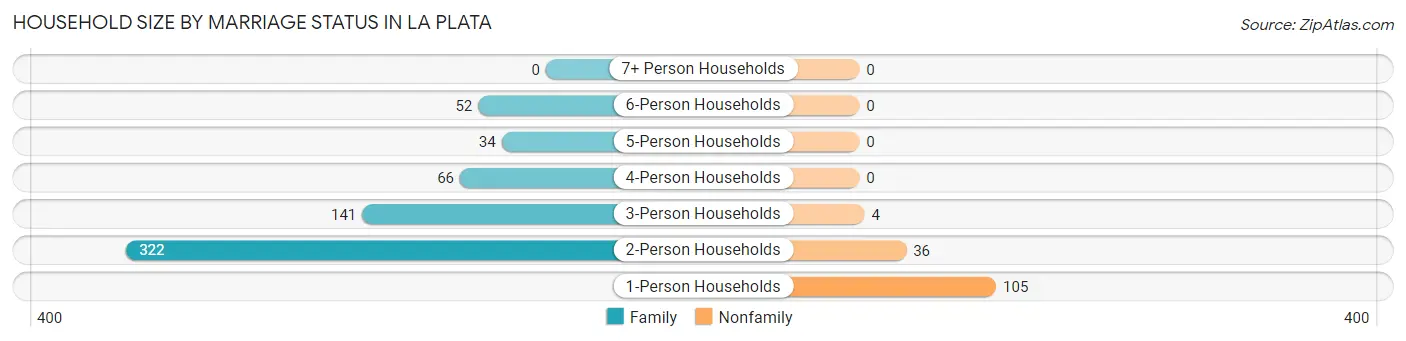
| Household Size | Family Households | Nonfamily Households |
| 1-Person Households | - | 105 (13.8%) |
| 2-Person Households | 322 (42.4%) | 36 (4.7%) |
| 3-Person Households | 141 (18.5%) | 4 (0.5%) |
| 4-Person Households | 66 (8.7%) | 0 (0.0%) |
| 5-Person Households | 34 (4.5%) | 0 (0.0%) |
| 6-Person Households | 52 (6.8%) | 0 (0.0%) |
| 7+ Person Households | 0 (0.0%) | 0 (0.0%) |
| Total | 615 (80.9%) | 145 (19.1%) |
Female Fertility in La Plata
Fertility by Age in La Plata
Average fertility rate in La Plata is 73.0 births per 1,000 women. Women in the age bracket of 20 to 34 years have the highest fertility rate with 188.0 births per 1,000 women. Women in the age bracket of 20 to 34 years acount for 68.8% of all women with births.
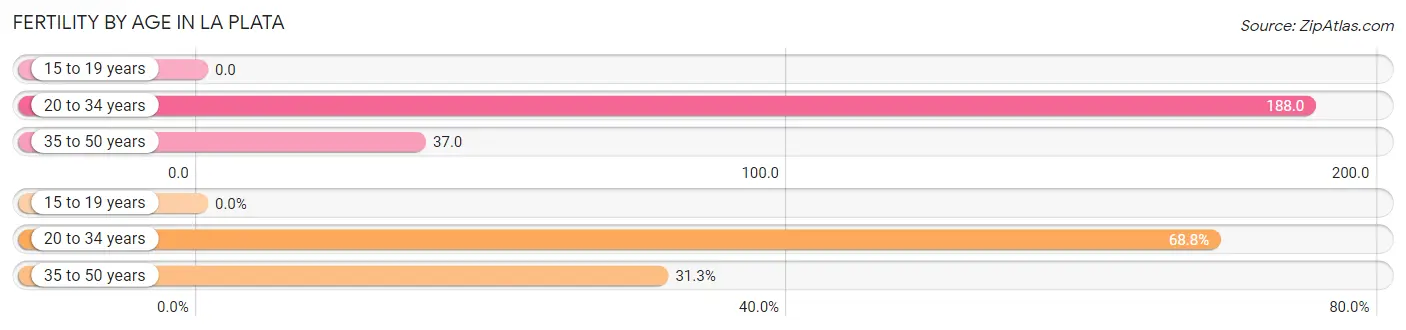
| Age Bracket | Women with Births | Births / 1,000 Women |
| 15 to 19 years | 0 (0.0%) | 0.0 |
| 20 to 34 years | 22 (68.8%) | 188.0 |
| 35 to 50 years | 10 (31.2%) | 37.0 |
| Total | 32 (100.0%) | 73.0 |
Fertility by Age by Marriage Status in La Plata
81.2% of women with births (32) in La Plata are married. The highest percentage of unmarried women with births falls into 20 to 34 years age bracket with 27.3% of them unmarried at the time of birth, while the lowest percentage of unmarried women with births belong to 35 to 50 years age bracket with 0.0% of them unmarried.
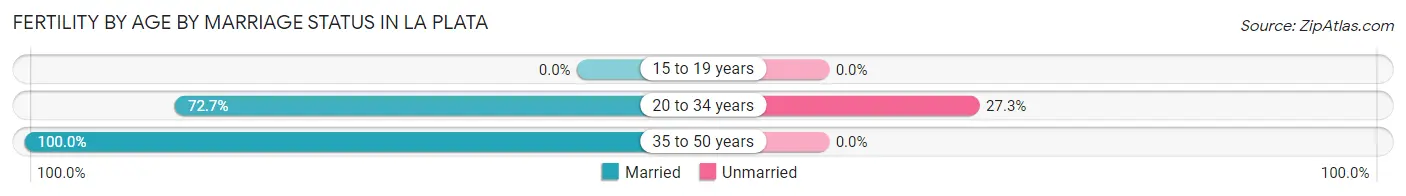
| Age Bracket | Married | Unmarried |
| 15 to 19 years | 0 (0.0%) | 0 (0.0%) |
| 20 to 34 years | 16 (72.7%) | 6 (27.3%) |
| 35 to 50 years | 10 (100.0%) | 0 (0.0%) |
| Total | 26 (81.2%) | 6 (18.8%) |
Fertility by Education in La Plata
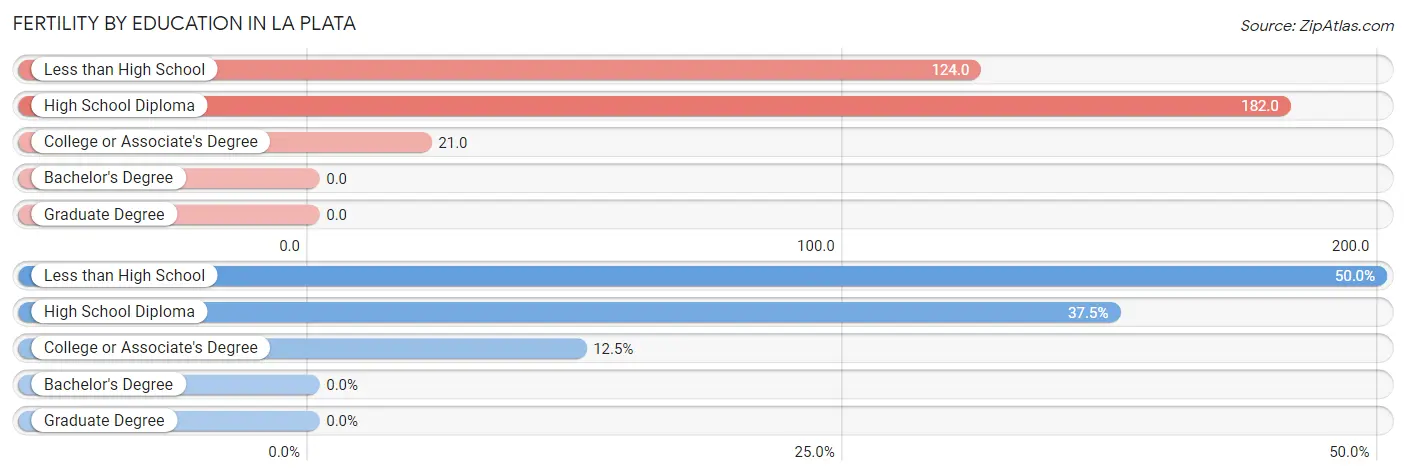
| Educational Attainment | Women with Births | Births / 1,000 Women |
| Less than High School | 16 (50.0%) | 124.0 |
| High School Diploma | 12 (37.5%) | 182.0 |
| College or Associate's Degree | 4 (12.5%) | 21.0 |
| Bachelor's Degree | 0 (0.0%) | 0.0 |
| Graduate Degree | 0 (0.0%) | 0.0 |
| Total | 32 (100.0%) | 73.0 |
Fertility by Education by Marriage Status in La Plata
18.8% of women with births in La Plata are unmarried. Women with the educational attainment of high school diploma are most likely to be married with 100.0% of them married at childbirth, while women with the educational attainment of less than high school are least likely to be married with 37.5% of them unmarried at childbirth.
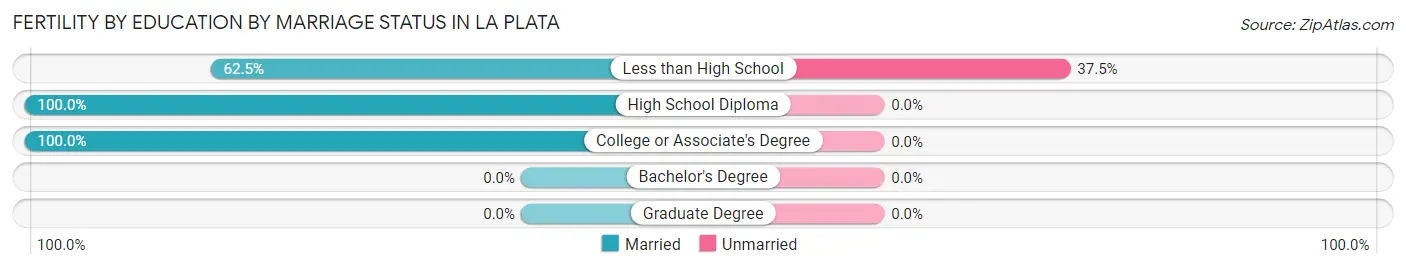
| Educational Attainment | Married | Unmarried |
| Less than High School | 10 (62.5%) | 6 (37.5%) |
| High School Diploma | 12 (100.0%) | 0 (0.0%) |
| College or Associate's Degree | 4 (100.0%) | 0 (0.0%) |
| Bachelor's Degree | 0 (0.0%) | 0 (0.0%) |
| Graduate Degree | 0 (0.0%) | 0 (0.0%) |
| Total | 26 (81.2%) | 6 (18.8%) |
Employment Characteristics in La Plata
Employment by Class of Employer in La Plata
Among the 675 employed individuals in La Plata, private company employees (444 | 65.8%), state government employees (64 | 9.5%), and local government employees (55 | 8.2%) make up the most common classes of employment.
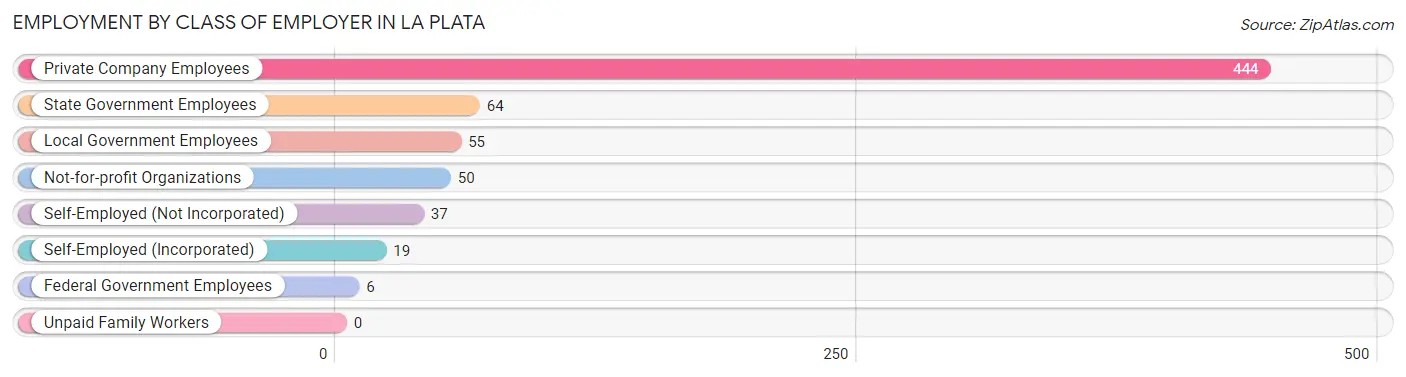
| Employer Class | # Employees | % Employees |
| Private Company Employees | 444 | 65.8% |
| Self-Employed (Incorporated) | 19 | 2.8% |
| Self-Employed (Not Incorporated) | 37 | 5.5% |
| Not-for-profit Organizations | 50 | 7.4% |
| Local Government Employees | 55 | 8.2% |
| State Government Employees | 64 | 9.5% |
| Federal Government Employees | 6 | 0.9% |
| Unpaid Family Workers | 0 | 0.0% |
| Total | 675 | 100.0% |
Employment Status by Age in La Plata
According to the labor force statistics for La Plata, out of the total population over 16 years of age (1,621), 45.5% or 738 individuals are in the labor force, with 8.5% or 63 of them unemployed. The age group with the highest labor force participation rate is 20 to 24 years, with 85.7% or 30 individuals in the labor force. Within the labor force, the 16 to 19 years age range has the highest percentage of unemployed individuals, with 38.1% or 8 of them being unemployed.
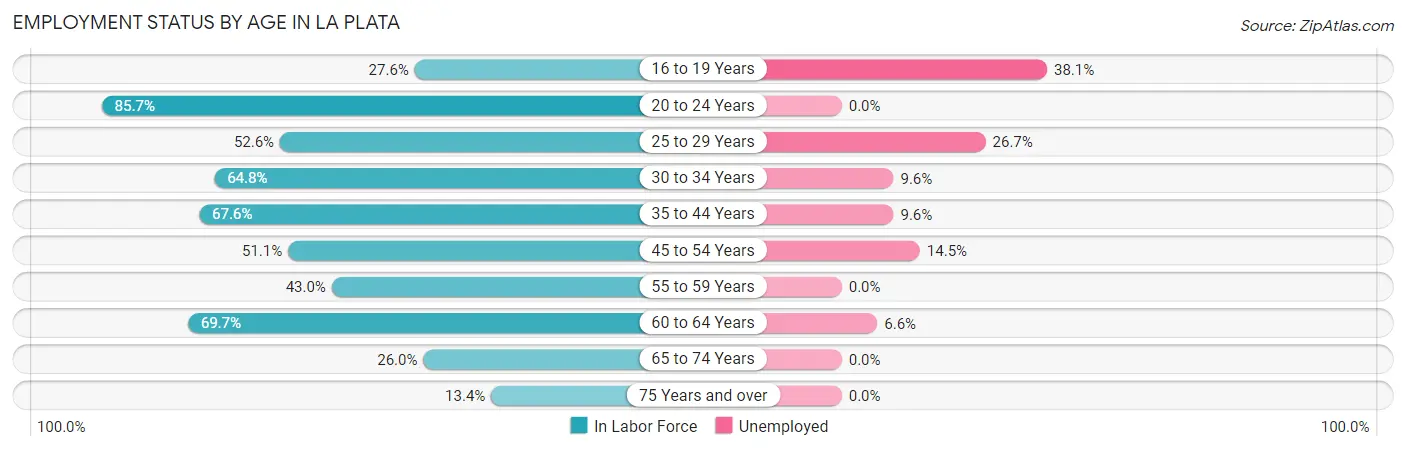
| Age Bracket | In Labor Force | Unemployed |
| 16 to 19 Years | 21 (27.6%) | 8 (38.1%) |
| 20 to 24 Years | 30 (85.7%) | 0 (0.0%) |
| 25 to 29 Years | 30 (52.6%) | 8 (26.7%) |
| 30 to 34 Years | 83 (64.8%) | 8 (9.6%) |
| 35 to 44 Years | 177 (67.6%) | 17 (9.6%) |
| 45 to 54 Years | 117 (51.1%) | 17 (14.5%) |
| 55 to 59 Years | 89 (43.0%) | 0 (0.0%) |
| 60 to 64 Years | 76 (69.7%) | 5 (6.6%) |
| 65 to 74 Years | 94 (26.0%) | 0 (0.0%) |
| 75 Years and over | 21 (13.4%) | 0 (0.0%) |
| Total | 738 (45.5%) | 63 (8.5%) |
Employment Status by Educational Attainment in La Plata
According to labor force statistics for La Plata, 57.7% of individuals (572) out of the total population between 25 and 64 years of age (992) are in the labor force, with 9.6% or 55 of them being unemployed. The group with the highest labor force participation rate are those with the educational attainment of bachelor's degree or higher, with 88.7% or 110 individuals in the labor force. Within the labor force, individuals with less than high school education have the highest percentage of unemployment, with 48.1% or 26 of them being unemployed.
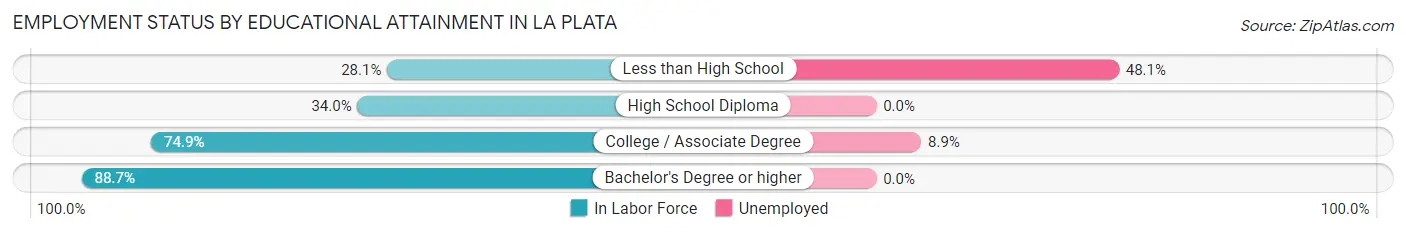
| Educational Attainment | In Labor Force | Unemployed |
| Less than High School | 54 (28.1%) | 92 (48.1%) |
| High School Diploma | 82 (34.0%) | 0 (0.0%) |
| College / Associate Degree | 326 (74.9%) | 39 (8.9%) |
| Bachelor's Degree or higher | 110 (88.7%) | 0 (0.0%) |
| Total | 572 (57.7%) | 95 (9.6%) |
Employment Occupations by Sex in La Plata
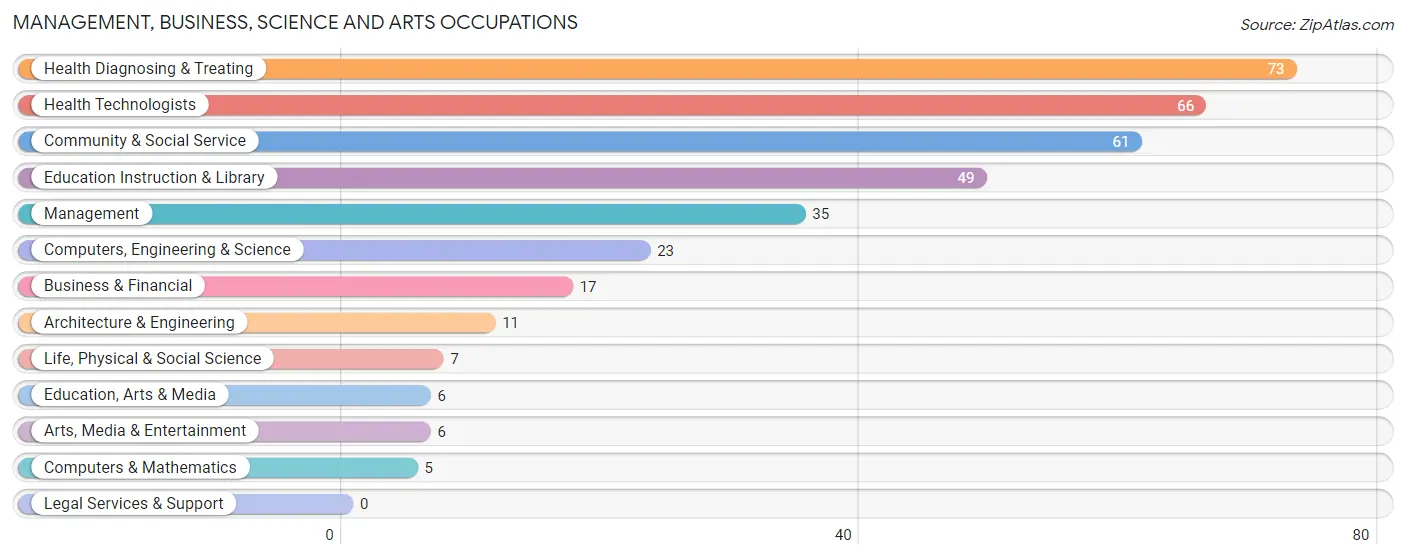
Management, Business, Science and Arts Occupations
The most common Management, Business, Science and Arts occupations in La Plata are Health Diagnosing & Treating (73 | 10.8%), Health Technologists (66 | 9.8%), Community & Social Service (61 | 9.0%), Education Instruction & Library (49 | 7.3%), and Management (35 | 5.2%).
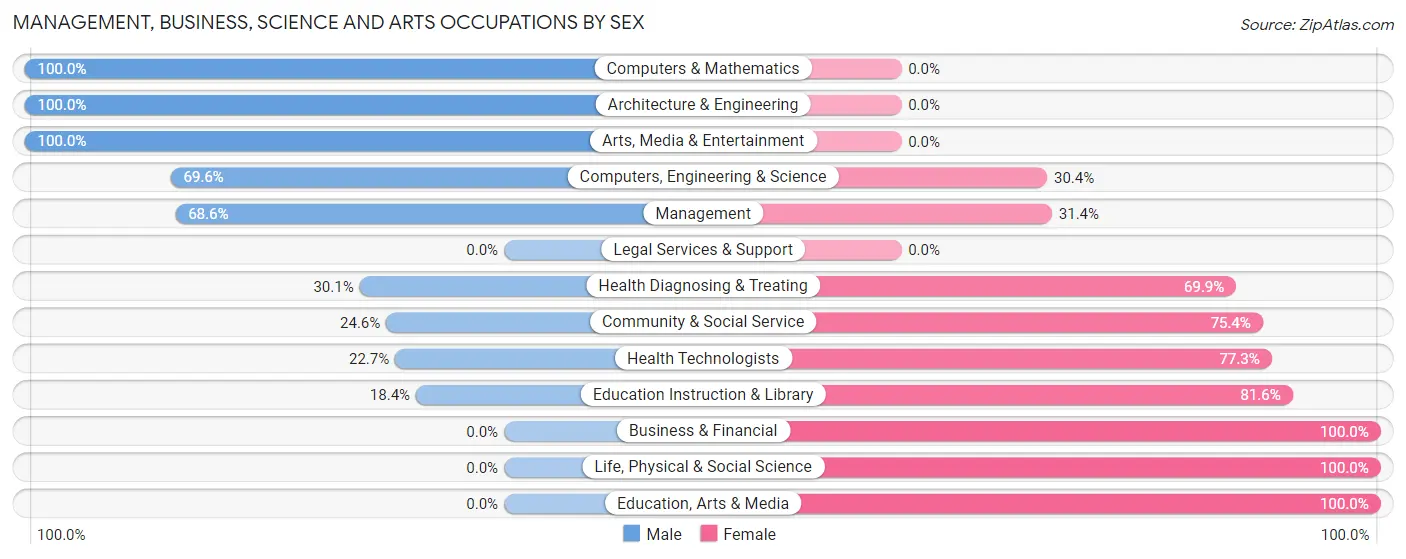
Management, Business, Science and Arts Occupations by Sex
Within the Management, Business, Science and Arts occupations in La Plata, the most male-oriented occupations are Computers & Mathematics (100.0%), Architecture & Engineering (100.0%), and Arts, Media & Entertainment (100.0%), while the most female-oriented occupations are Business & Financial (100.0%), Life, Physical & Social Science (100.0%), and Education, Arts & Media (100.0%).
| Occupation | Male | Female |
| Management | 24 (68.6%) | 11 (31.4%) |
| Business & Financial | 0 (0.0%) | 17 (100.0%) |
| Computers, Engineering & Science | 16 (69.6%) | 7 (30.4%) |
| Computers & Mathematics | 5 (100.0%) | 0 (0.0%) |
| Architecture & Engineering | 11 (100.0%) | 0 (0.0%) |
| Life, Physical & Social Science | 0 (0.0%) | 7 (100.0%) |
| Community & Social Service | 15 (24.6%) | 46 (75.4%) |
| Education, Arts & Media | 0 (0.0%) | 6 (100.0%) |
| Legal Services & Support | 0 (0.0%) | 0 (0.0%) |
| Education Instruction & Library | 9 (18.4%) | 40 (81.6%) |
| Arts, Media & Entertainment | 6 (100.0%) | 0 (0.0%) |
| Health Diagnosing & Treating | 22 (30.1%) | 51 (69.9%) |
| Health Technologists | 15 (22.7%) | 51 (77.3%) |
| Total (Category) | 77 (36.8%) | 132 (63.2%) |
| Total (Overall) | 309 (45.8%) | 366 (54.2%) |
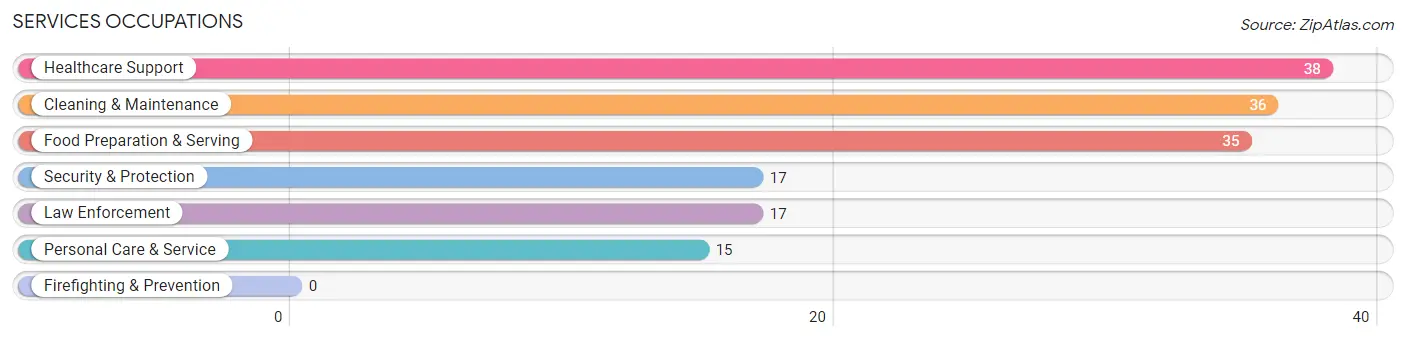
Services Occupations
The most common Services occupations in La Plata are Healthcare Support (38 | 5.6%), Cleaning & Maintenance (36 | 5.3%), Food Preparation & Serving (35 | 5.2%), Security & Protection (17 | 2.5%), and Law Enforcement (17 | 2.5%).
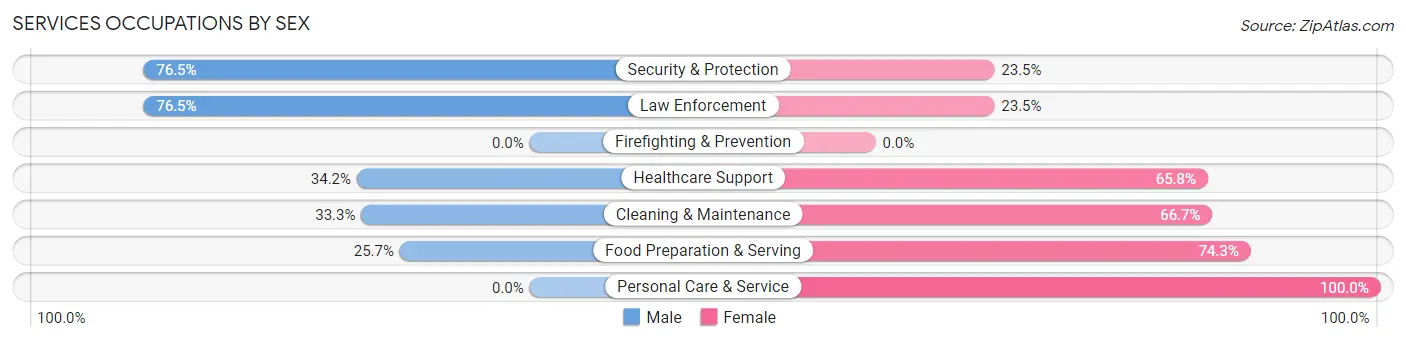
Services Occupations by Sex
Within the Services occupations in La Plata, the most male-oriented occupations are Security & Protection (76.5%), Law Enforcement (76.5%), and Healthcare Support (34.2%), while the most female-oriented occupations are Personal Care & Service (100.0%), Food Preparation & Serving (74.3%), and Cleaning & Maintenance (66.7%).
| Occupation | Male | Female |
| Healthcare Support | 13 (34.2%) | 25 (65.8%) |
| Security & Protection | 13 (76.5%) | 4 (23.5%) |
| Firefighting & Prevention | 0 (0.0%) | 0 (0.0%) |
| Law Enforcement | 13 (76.5%) | 4 (23.5%) |
| Food Preparation & Serving | 9 (25.7%) | 26 (74.3%) |
| Cleaning & Maintenance | 12 (33.3%) | 24 (66.7%) |
| Personal Care & Service | 0 (0.0%) | 15 (100.0%) |
| Total (Category) | 47 (33.3%) | 94 (66.7%) |
| Total (Overall) | 309 (45.8%) | 366 (54.2%) |
Sales and Office Occupations
The most common Sales and Office occupations in La Plata are Sales & Related (86 | 12.7%), and Office & Administration (53 | 7.9%).

Sales and Office Occupations by Sex

| Occupation | Male | Female |
| Sales & Related | 30 (34.9%) | 56 (65.1%) |
| Office & Administration | 11 (20.7%) | 42 (79.2%) |
| Total (Category) | 41 (29.5%) | 98 (70.5%) |
| Total (Overall) | 309 (45.8%) | 366 (54.2%) |
Natural Resources, Construction and Maintenance Occupations
The most common Natural Resources, Construction and Maintenance occupations in La Plata are Construction & Extraction (78 | 11.6%), and Installation, Maintenance & Repair (43 | 6.4%).
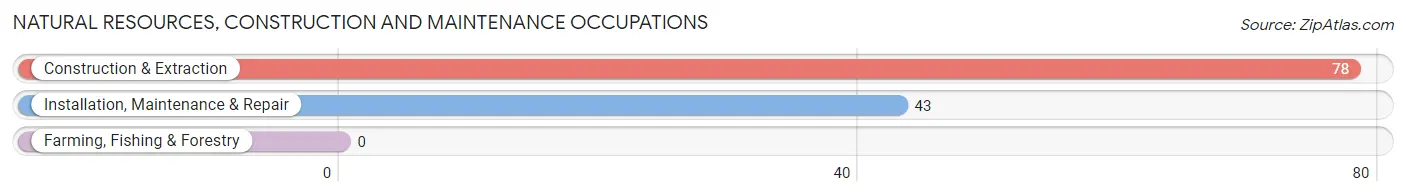
Natural Resources, Construction and Maintenance Occupations by Sex

| Occupation | Male | Female |
| Farming, Fishing & Forestry | 0 (0.0%) | 0 (0.0%) |
| Construction & Extraction | 78 (100.0%) | 0 (0.0%) |
| Installation, Maintenance & Repair | 38 (88.4%) | 5 (11.6%) |
| Total (Category) | 116 (95.9%) | 5 (4.1%) |
| Total (Overall) | 309 (45.8%) | 366 (54.2%) |
Production, Transportation and Moving Occupations
The most common Production, Transportation and Moving occupations in La Plata are Transportation (33 | 4.9%), Material Moving (28 | 4.2%), and Production (4 | 0.6%).
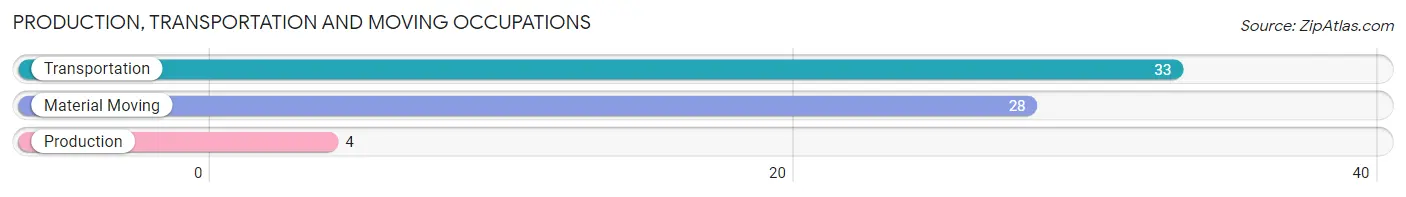
Production, Transportation and Moving Occupations by Sex
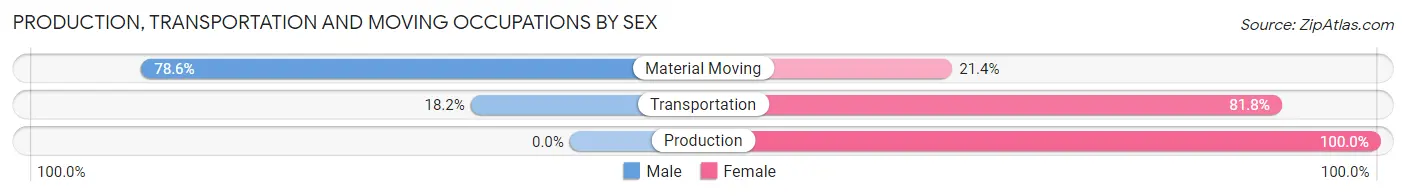
| Occupation | Male | Female |
| Production | 0 (0.0%) | 4 (100.0%) |
| Transportation | 6 (18.2%) | 27 (81.8%) |
| Material Moving | 22 (78.6%) | 6 (21.4%) |
| Total (Category) | 28 (43.1%) | 37 (56.9%) |
| Total (Overall) | 309 (45.8%) | 366 (54.2%) |
Employment Industries by Sex in La Plata
Employment Industries in La Plata
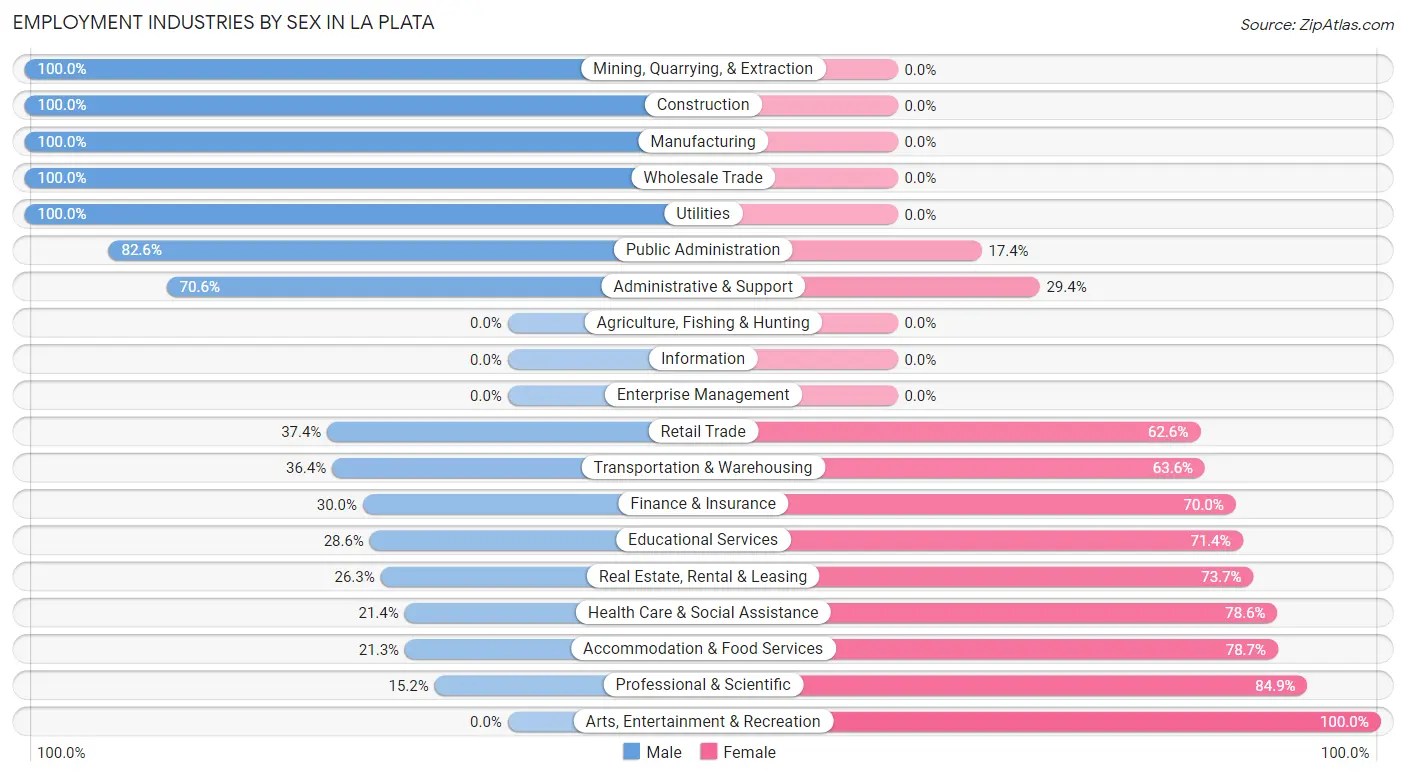
The major employment industries in La Plata include Health Care & Social Assistance (103 | 15.3%), Retail Trade (99 | 14.7%), Educational Services (70 | 10.4%), Construction (58 | 8.6%), and Accommodation & Food Services (47 | 7.0%).
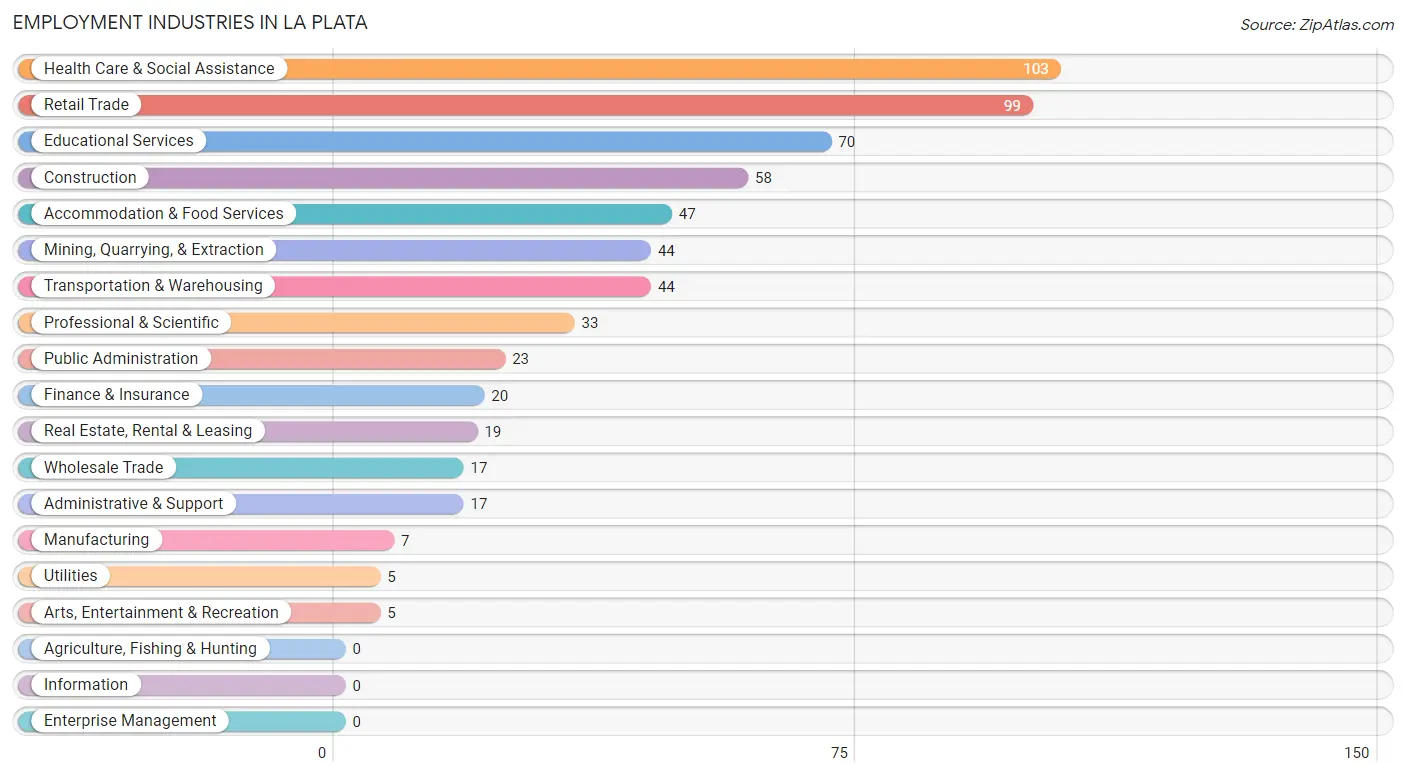
Employment Industries by Sex in La Plata
The La Plata industries that see more men than women are Mining, Quarrying, & Extraction (100.0%), Construction (100.0%), and Manufacturing (100.0%), whereas the industries that tend to have a higher number of women are Arts, Entertainment & Recreation (100.0%), Professional & Scientific (84.9%), and Accommodation & Food Services (78.7%).
| Industry | Male | Female |
| Agriculture, Fishing & Hunting | 0 (0.0%) | 0 (0.0%) |
| Mining, Quarrying, & Extraction | 44 (100.0%) | 0 (0.0%) |
| Construction | 58 (100.0%) | 0 (0.0%) |
| Manufacturing | 7 (100.0%) | 0 (0.0%) |
| Wholesale Trade | 17 (100.0%) | 0 (0.0%) |
| Retail Trade | 37 (37.4%) | 62 (62.6%) |
| Transportation & Warehousing | 16 (36.4%) | 28 (63.6%) |
| Utilities | 5 (100.0%) | 0 (0.0%) |
| Information | 0 (0.0%) | 0 (0.0%) |
| Finance & Insurance | 6 (30.0%) | 14 (70.0%) |
| Real Estate, Rental & Leasing | 5 (26.3%) | 14 (73.7%) |
| Professional & Scientific | 5 (15.1%) | 28 (84.9%) |
| Enterprise Management | 0 (0.0%) | 0 (0.0%) |
| Administrative & Support | 12 (70.6%) | 5 (29.4%) |
| Educational Services | 20 (28.6%) | 50 (71.4%) |
| Health Care & Social Assistance | 22 (21.4%) | 81 (78.6%) |
| Arts, Entertainment & Recreation | 0 (0.0%) | 5 (100.0%) |
| Accommodation & Food Services | 10 (21.3%) | 37 (78.7%) |
| Public Administration | 19 (82.6%) | 4 (17.4%) |
| Total | 309 (45.8%) | 366 (54.2%) |
Education in La Plata
School Enrollment in La Plata
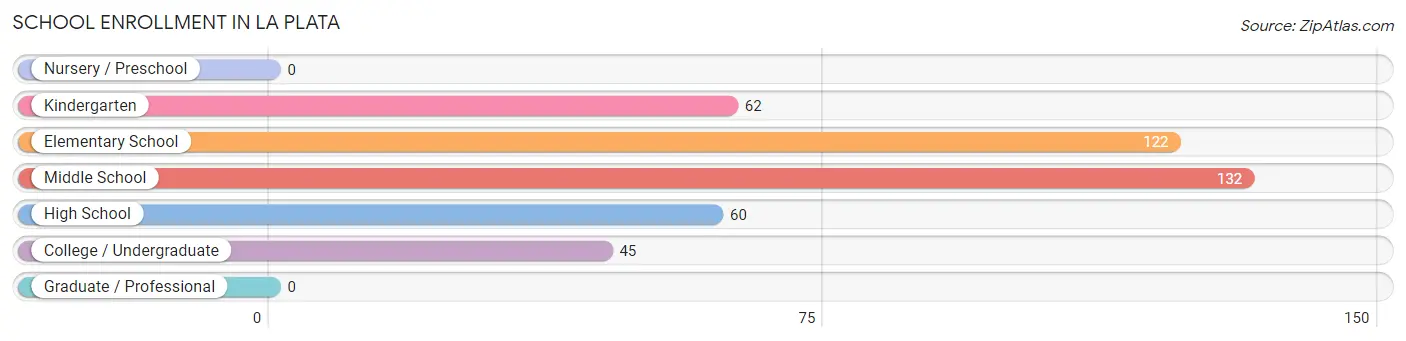
The most common levels of schooling among the 421 students in La Plata are middle school (132 | 31.4%), elementary school (122 | 29.0%), and kindergarten (62 | 14.7%).
| School Level | # Students | % Students |
| Nursery / Preschool | 0 | 0.0% |
| Kindergarten | 62 | 14.7% |
| Elementary School | 122 | 29.0% |
| Middle School | 132 | 31.4% |
| High School | 60 | 14.2% |
| College / Undergraduate | 45 | 10.7% |
| Graduate / Professional | 0 | 0.0% |
| Total | 421 | 100.0% |
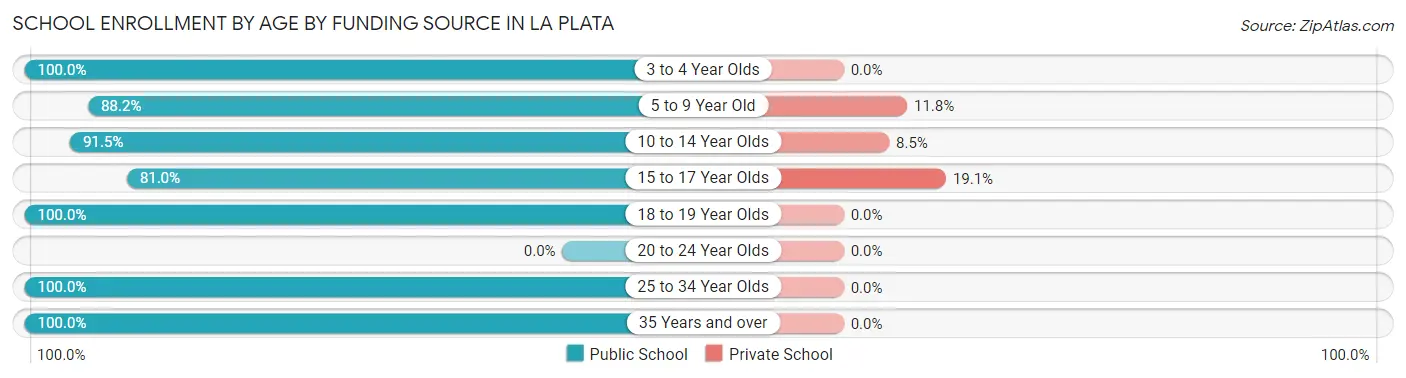
School Enrollment by Age by Funding Source in La Plata
Out of a total of 421 students who are enrolled in schools in La Plata, 40 (9.5%) attend a private institution, while the remaining 381 (90.5%) are enrolled in public schools. The age group of 15 to 17 year olds has the highest likelihood of being enrolled in private schools, with 12 (19.1% in the age bracket) enrolled. Conversely, the age group of 3 to 4 year olds has the lowest likelihood of being enrolled in a private school, with 24 (100.0% in the age bracket) attending a public institution.
| Age Bracket | Public School | Private School |
| 3 to 4 Year Olds | 24 (100.0%) | 0 (0.0%) |
| 5 to 9 Year Old | 127 (88.2%) | 17 (11.8%) |
| 10 to 14 Year Olds | 119 (91.5%) | 11 (8.5%) |
| 15 to 17 Year Olds | 51 (80.9%) | 12 (19.1%) |
| 18 to 19 Year Olds | 34 (100.0%) | 0 (0.0%) |
| 20 to 24 Year Olds | 0 (0.0%) | 0 (0.0%) |
| 25 to 34 Year Olds | 4 (100.0%) | 0 (0.0%) |
| 35 Years and over | 22 (100.0%) | 0 (0.0%) |
| Total | 381 (90.5%) | 40 (9.5%) |
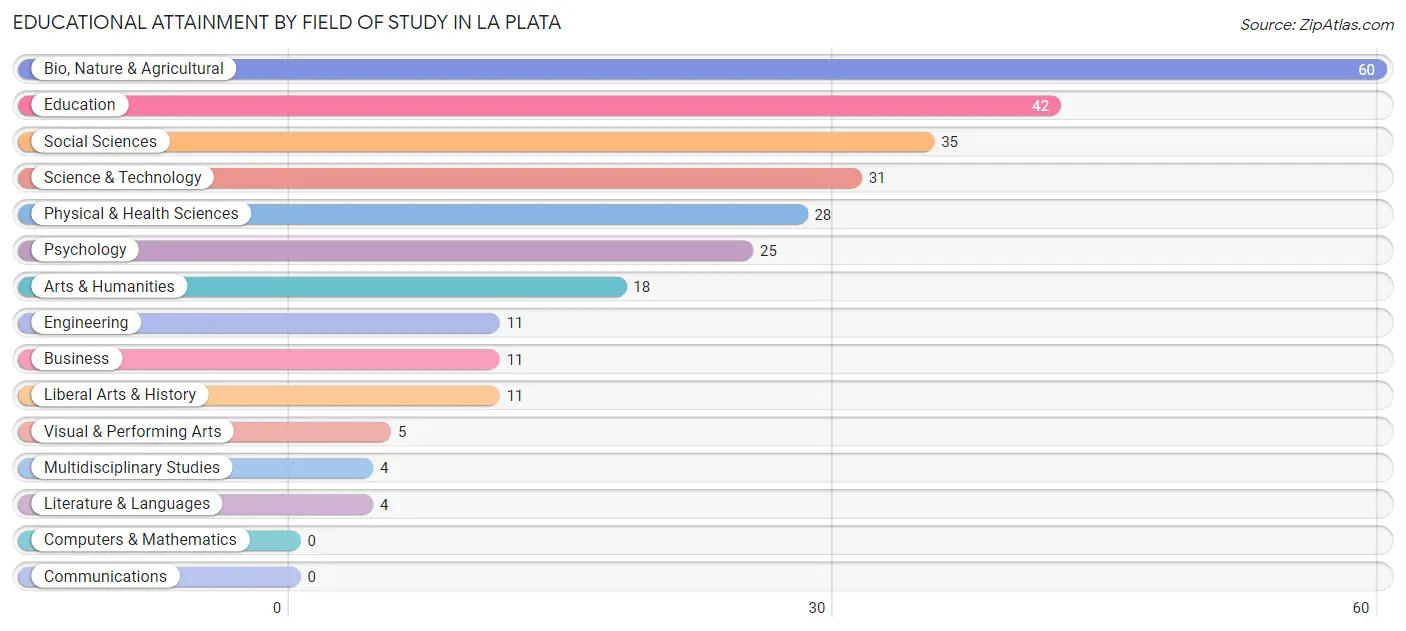
Educational Attainment by Field of Study in La Plata
Bio, nature & agricultural (60 | 21.0%), education (42 | 14.7%), social sciences (35 | 12.3%), science & technology (31 | 10.9%), and physical & health sciences (28 | 9.8%) are the most common fields of study among 285 individuals in La Plata who have obtained a bachelor's degree or higher.
| Field of Study | # Graduates | % Graduates |
| Computers & Mathematics | 0 | 0.0% |
| Bio, Nature & Agricultural | 60 | 21.0% |
| Physical & Health Sciences | 28 | 9.8% |
| Psychology | 25 | 8.8% |
| Social Sciences | 35 | 12.3% |
| Engineering | 11 | 3.9% |
| Multidisciplinary Studies | 4 | 1.4% |
| Science & Technology | 31 | 10.9% |
| Business | 11 | 3.9% |
| Education | 42 | 14.7% |
| Literature & Languages | 4 | 1.4% |
| Liberal Arts & History | 11 | 3.9% |
| Visual & Performing Arts | 5 | 1.8% |
| Communications | 0 | 0.0% |
| Arts & Humanities | 18 | 6.3% |
| Total | 285 | 100.0% |
Transportation & Commute in La Plata
Vehicle Availability by Sex in La Plata
The most prevalent vehicle ownership categories in La Plata are males with 3 vehicles (119, accounting for 38.5%) and females with 3 vehicles (84, making up 32.5%).
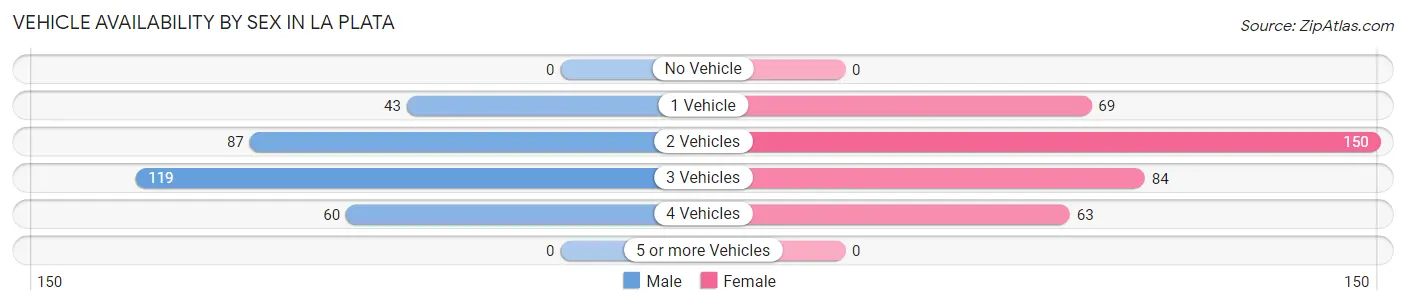
| Vehicles Available | Male | Female |
| No Vehicle | 0 (0.0%) | 0 (0.0%) |
| 1 Vehicle | 43 (13.9%) | 69 (18.9%) |
| 2 Vehicles | 87 (28.2%) | 150 (41.0%) |
| 3 Vehicles | 119 (38.5%) | 84 (23.0%) |
| 4 Vehicles | 60 (19.4%) | 63 (17.2%) |
| 5 or more Vehicles | 0 (0.0%) | 0 (0.0%) |
| Total | 309 (100.0%) | 366 (100.0%) |
Commute Time in La Plata
The most frequently occuring commute durations in La Plata are 30 to 34 minutes (162 commuters, 25.6%), 20 to 24 minutes (130 commuters, 20.5%), and 15 to 19 minutes (106 commuters, 16.8%).
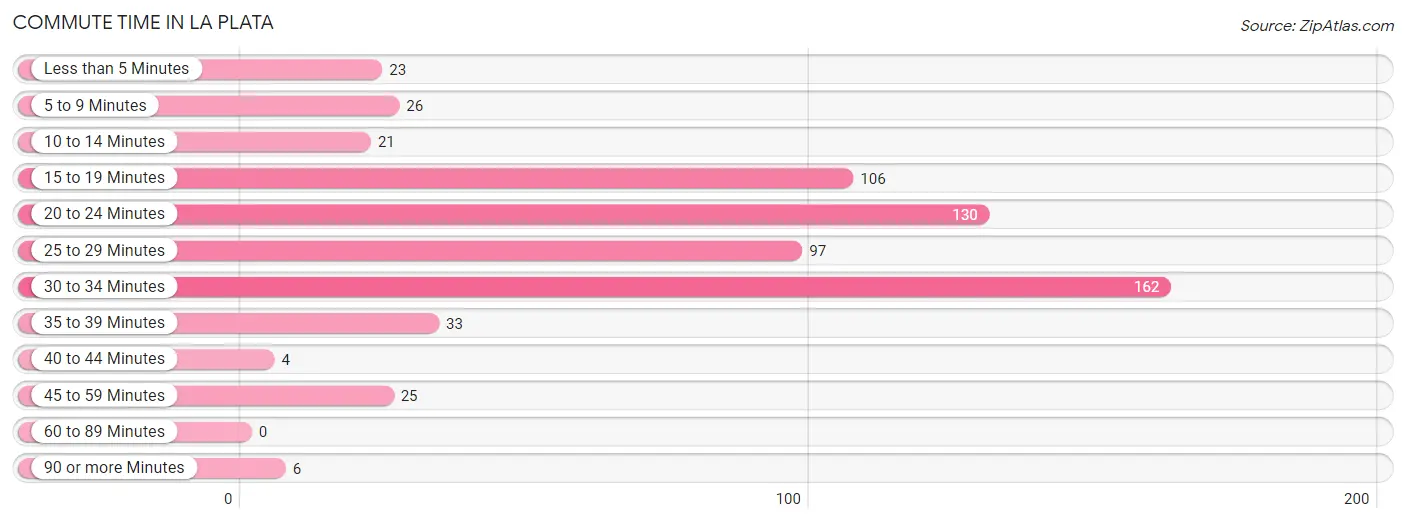
| Commute Time | # Commuters | % Commuters |
| Less than 5 Minutes | 23 | 3.6% |
| 5 to 9 Minutes | 26 | 4.1% |
| 10 to 14 Minutes | 21 | 3.3% |
| 15 to 19 Minutes | 106 | 16.8% |
| 20 to 24 Minutes | 130 | 20.5% |
| 25 to 29 Minutes | 97 | 15.3% |
| 30 to 34 Minutes | 162 | 25.6% |
| 35 to 39 Minutes | 33 | 5.2% |
| 40 to 44 Minutes | 4 | 0.6% |
| 45 to 59 Minutes | 25 | 4.0% |
| 60 to 89 Minutes | 0 | 0.0% |
| 90 or more Minutes | 6 | 0.9% |
Commute Time by Sex in La Plata
The most common commute times in La Plata are 30 to 34 minutes (87 commuters, 30.7%) for males and 30 to 34 minutes (75 commuters, 21.4%) for females.
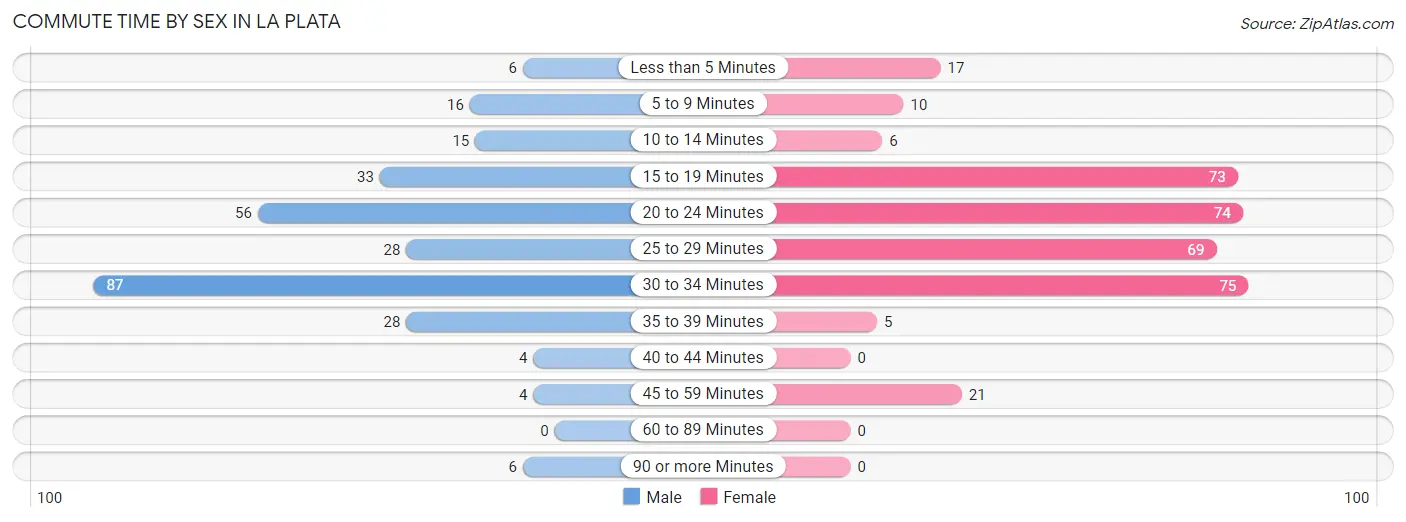
| Commute Time | Male | Female |
| Less than 5 Minutes | 6 (2.1%) | 17 (4.9%) |
| 5 to 9 Minutes | 16 (5.7%) | 10 (2.9%) |
| 10 to 14 Minutes | 15 (5.3%) | 6 (1.7%) |
| 15 to 19 Minutes | 33 (11.7%) | 73 (20.9%) |
| 20 to 24 Minutes | 56 (19.8%) | 74 (21.1%) |
| 25 to 29 Minutes | 28 (9.9%) | 69 (19.7%) |
| 30 to 34 Minutes | 87 (30.7%) | 75 (21.4%) |
| 35 to 39 Minutes | 28 (9.9%) | 5 (1.4%) |
| 40 to 44 Minutes | 4 (1.4%) | 0 (0.0%) |
| 45 to 59 Minutes | 4 (1.4%) | 21 (6.0%) |
| 60 to 89 Minutes | 0 (0.0%) | 0 (0.0%) |
| 90 or more Minutes | 6 (2.1%) | 0 (0.0%) |
Time of Departure to Work by Sex in La Plata
The most frequent times of departure to work in La Plata are 6:00 AM to 6:29 AM (67, 23.7%) for males and 7:30 AM to 7:59 AM (116, 33.1%) for females.
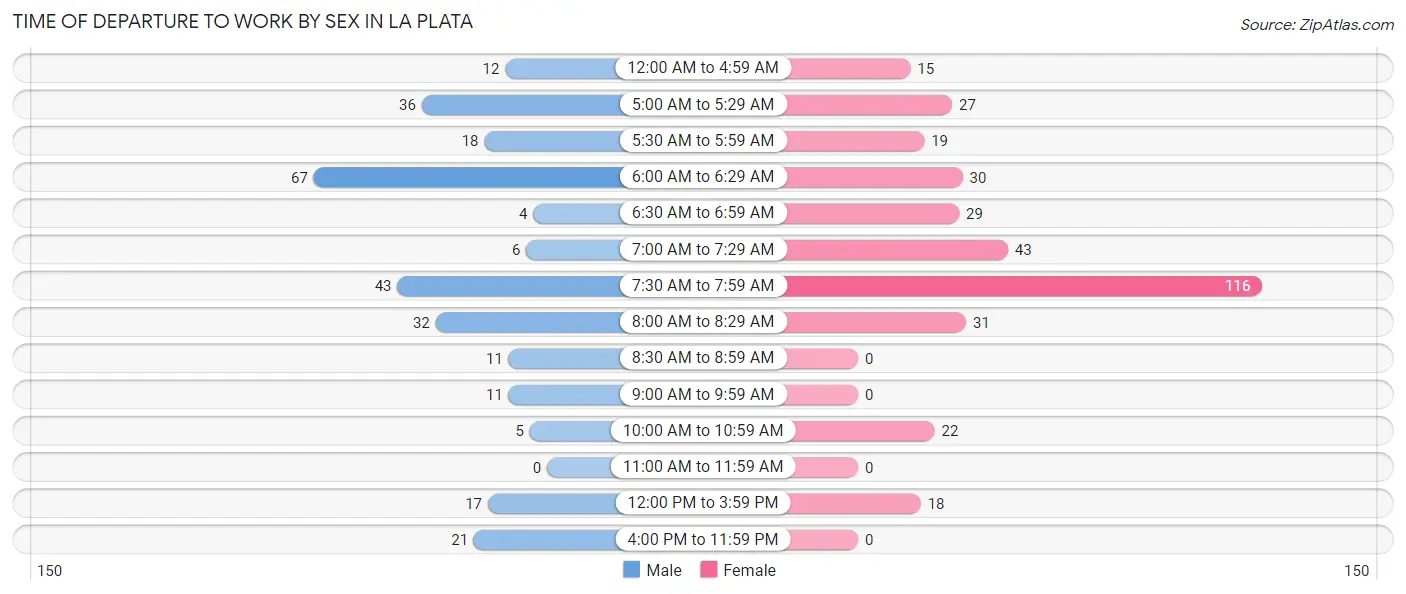
| Time of Departure | Male | Female |
| 12:00 AM to 4:59 AM | 12 (4.2%) | 15 (4.3%) |
| 5:00 AM to 5:29 AM | 36 (12.7%) | 27 (7.7%) |
| 5:30 AM to 5:59 AM | 18 (6.4%) | 19 (5.4%) |
| 6:00 AM to 6:29 AM | 67 (23.7%) | 30 (8.6%) |
| 6:30 AM to 6:59 AM | 4 (1.4%) | 29 (8.3%) |
| 7:00 AM to 7:29 AM | 6 (2.1%) | 43 (12.3%) |
| 7:30 AM to 7:59 AM | 43 (15.2%) | 116 (33.1%) |
| 8:00 AM to 8:29 AM | 32 (11.3%) | 31 (8.9%) |
| 8:30 AM to 8:59 AM | 11 (3.9%) | 0 (0.0%) |
| 9:00 AM to 9:59 AM | 11 (3.9%) | 0 (0.0%) |
| 10:00 AM to 10:59 AM | 5 (1.8%) | 22 (6.3%) |
| 11:00 AM to 11:59 AM | 0 (0.0%) | 0 (0.0%) |
| 12:00 PM to 3:59 PM | 17 (6.0%) | 18 (5.1%) |
| 4:00 PM to 11:59 PM | 21 (7.4%) | 0 (0.0%) |
| Total | 283 (100.0%) | 350 (100.0%) |
Housing Occupancy in La Plata
Occupancy by Ownership in La Plata
Of the total 760 dwellings in La Plata, owner-occupied units account for 663 (87.2%), while renter-occupied units make up 97 (12.8%).
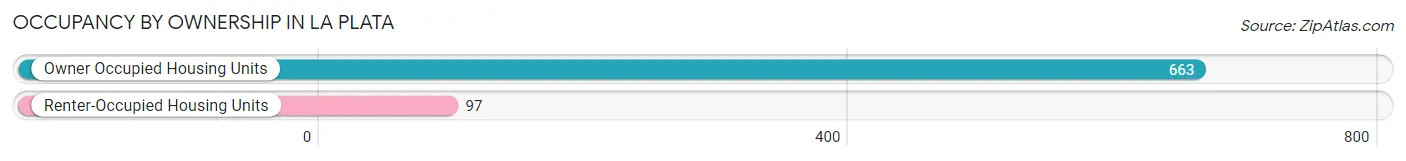
| Occupancy | # Housing Units | % Housing Units |
| Owner Occupied Housing Units | 663 | 87.2% |
| Renter-Occupied Housing Units | 97 | 12.8% |
| Total Occupied Housing Units | 760 | 100.0% |
Occupancy by Household Size in La Plata
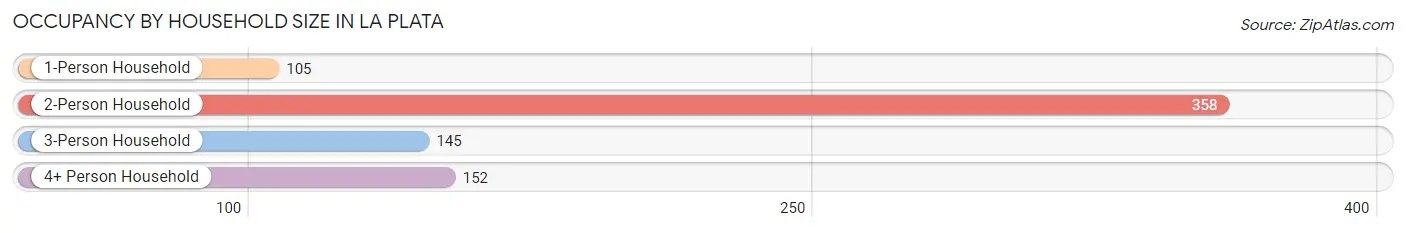
| Household Size | # Housing Units | % Housing Units |
| 1-Person Household | 105 | 13.8% |
| 2-Person Household | 358 | 47.1% |
| 3-Person Household | 145 | 19.1% |
| 4+ Person Household | 152 | 20.0% |
| Total Housing Units | 760 | 100.0% |
Occupancy by Ownership by Household Size in La Plata
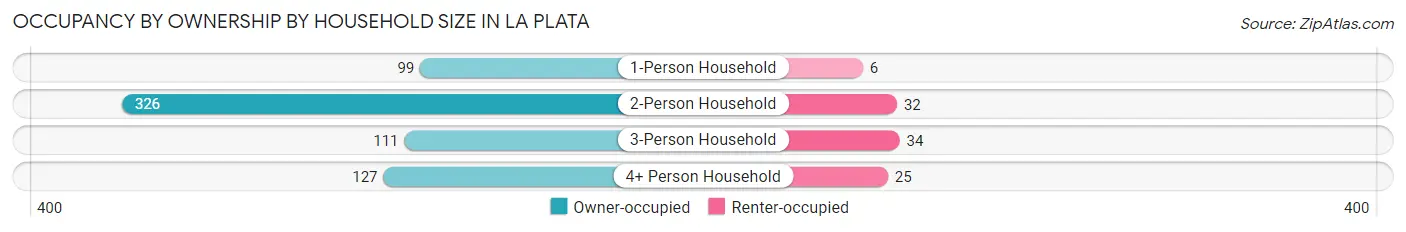
| Household Size | Owner-occupied | Renter-occupied |
| 1-Person Household | 99 (94.3%) | 6 (5.7%) |
| 2-Person Household | 326 (91.1%) | 32 (8.9%) |
| 3-Person Household | 111 (76.5%) | 34 (23.4%) |
| 4+ Person Household | 127 (83.6%) | 25 (16.5%) |
| Total Housing Units | 663 (87.2%) | 97 (12.8%) |
Occupancy by Educational Attainment in La Plata
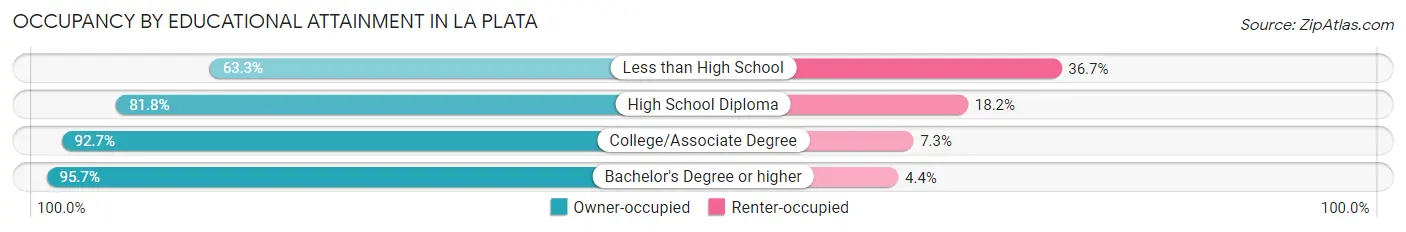
| Household Size | Owner-occupied | Renter-occupied |
| Less than High School | 50 (63.3%) | 29 (36.7%) |
| High School Diploma | 162 (81.8%) | 36 (18.2%) |
| College/Associate Degree | 341 (92.7%) | 27 (7.3%) |
| Bachelor's Degree or higher | 110 (95.7%) | 5 (4.3%) |
Occupancy by Age of Householder in La Plata
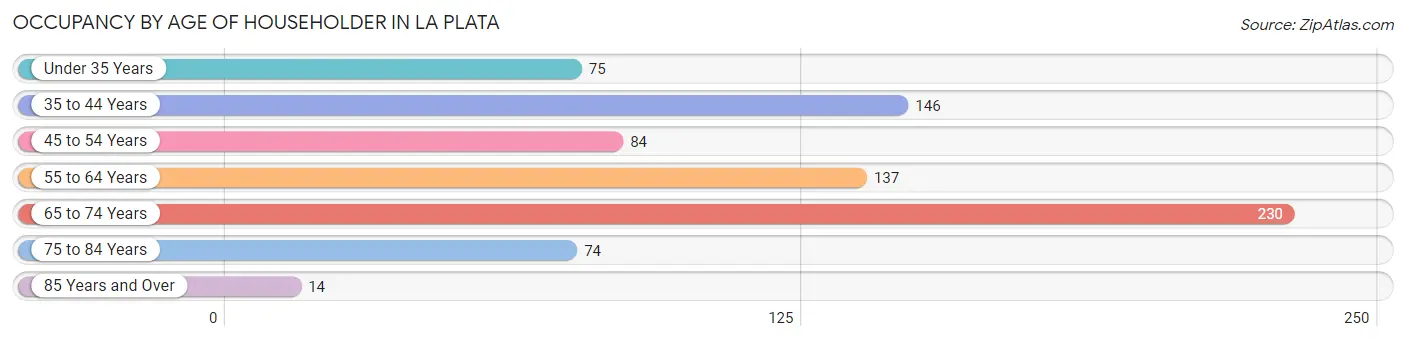
| Age Bracket | # Households | % Households |
| Under 35 Years | 75 | 9.9% |
| 35 to 44 Years | 146 | 19.2% |
| 45 to 54 Years | 84 | 11.1% |
| 55 to 64 Years | 137 | 18.0% |
| 65 to 74 Years | 230 | 30.3% |
| 75 to 84 Years | 74 | 9.7% |
| 85 Years and Over | 14 | 1.8% |
| Total | 760 | 100.0% |
Housing Finances in La Plata
Median Income by Occupancy in La Plata
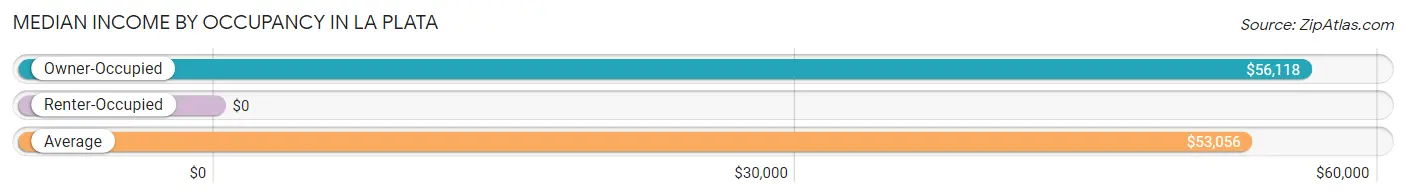
| Occupancy Type | # Households | Median Income |
| Owner-Occupied | 663 (87.2%) | $56,118 |
| Renter-Occupied | 97 (12.8%) | $0 |
| Average | 760 (100.0%) | $53,056 |
Occupancy by Householder Income Bracket in La Plata
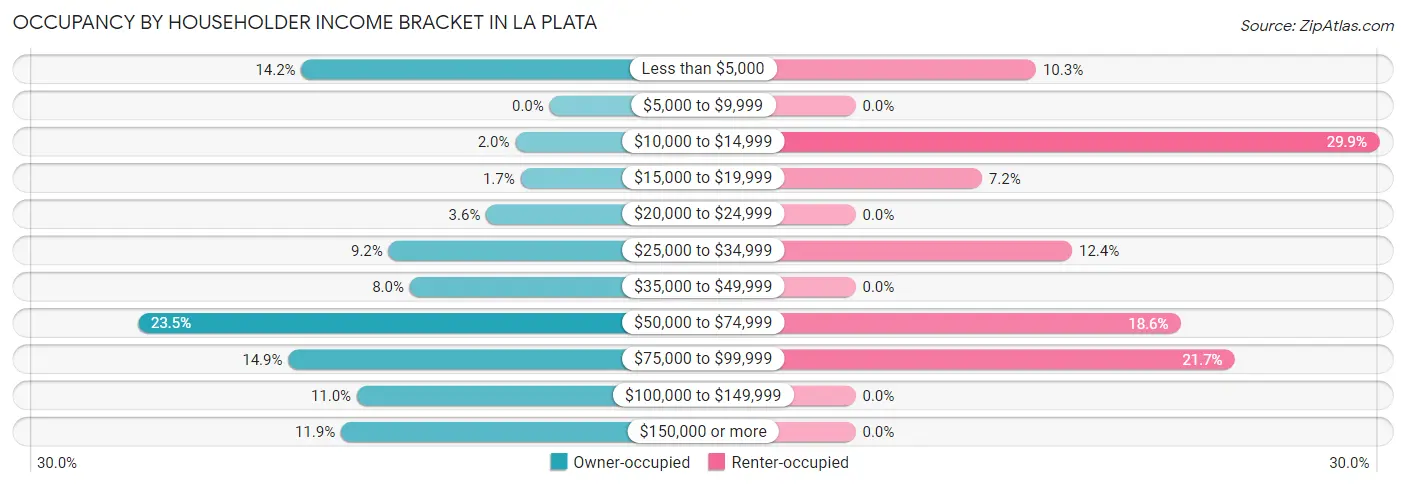
| Income Bracket | Owner-occupied | Renter-occupied |
| Less than $5,000 | 94 (14.2%) | 10 (10.3%) |
| $5,000 to $9,999 | 0 (0.0%) | 0 (0.0%) |
| $10,000 to $14,999 | 13 (2.0%) | 29 (29.9%) |
| $15,000 to $19,999 | 11 (1.7%) | 7 (7.2%) |
| $20,000 to $24,999 | 24 (3.6%) | 0 (0.0%) |
| $25,000 to $34,999 | 61 (9.2%) | 12 (12.4%) |
| $35,000 to $49,999 | 53 (8.0%) | 0 (0.0%) |
| $50,000 to $74,999 | 156 (23.5%) | 18 (18.6%) |
| $75,000 to $99,999 | 99 (14.9%) | 21 (21.6%) |
| $100,000 to $149,999 | 73 (11.0%) | 0 (0.0%) |
| $150,000 or more | 79 (11.9%) | 0 (0.0%) |
| Total | 663 (100.0%) | 97 (100.0%) |
Monthly Housing Cost Tiers in La Plata
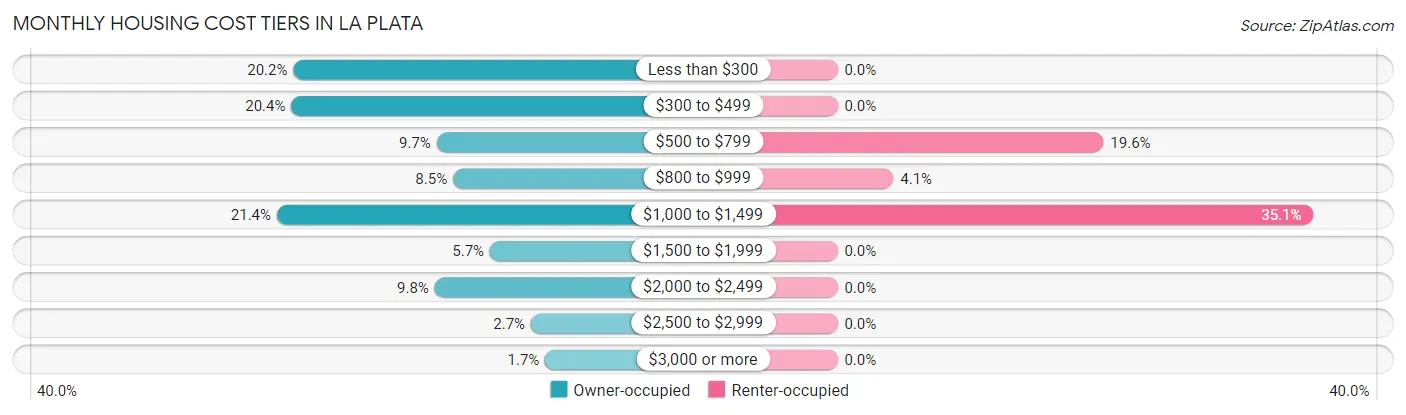
| Monthly Cost | Owner-occupied | Renter-occupied |
| Less than $300 | 134 (20.2%) | 0 (0.0%) |
| $300 to $499 | 135 (20.4%) | 0 (0.0%) |
| $500 to $799 | 64 (9.7%) | 19 (19.6%) |
| $800 to $999 | 56 (8.5%) | 4 (4.1%) |
| $1,000 to $1,499 | 142 (21.4%) | 34 (35.0%) |
| $1,500 to $1,999 | 38 (5.7%) | 0 (0.0%) |
| $2,000 to $2,499 | 65 (9.8%) | 0 (0.0%) |
| $2,500 to $2,999 | 18 (2.7%) | 0 (0.0%) |
| $3,000 or more | 11 (1.7%) | 0 (0.0%) |
| Total | 663 (100.0%) | 97 (100.0%) |
Physical Housing Characteristics in La Plata
Housing Structures in La Plata
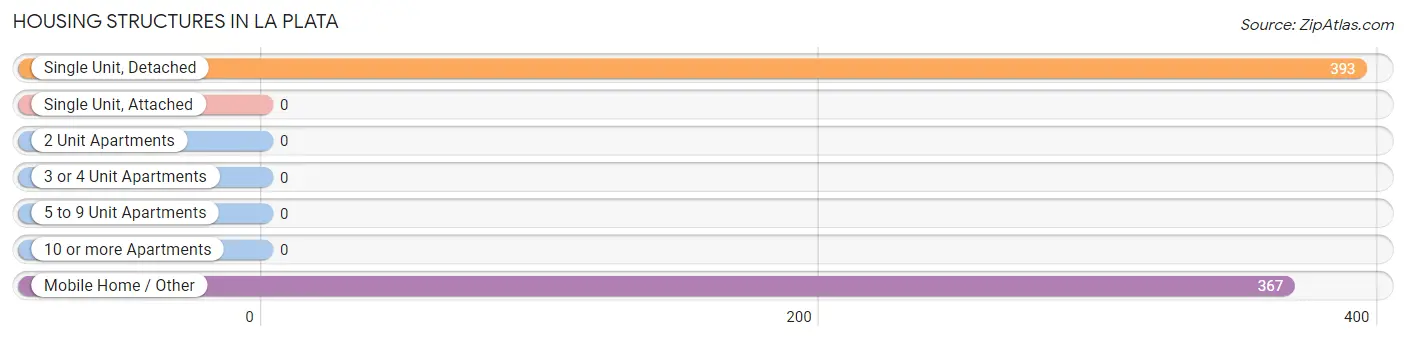
| Structure Type | # Housing Units | % Housing Units |
| Single Unit, Detached | 393 | 51.7% |
| Single Unit, Attached | 0 | 0.0% |
| 2 Unit Apartments | 0 | 0.0% |
| 3 or 4 Unit Apartments | 0 | 0.0% |
| 5 to 9 Unit Apartments | 0 | 0.0% |
| 10 or more Apartments | 0 | 0.0% |
| Mobile Home / Other | 367 | 48.3% |
| Total | 760 | 100.0% |
Housing Structures by Occupancy in La Plata
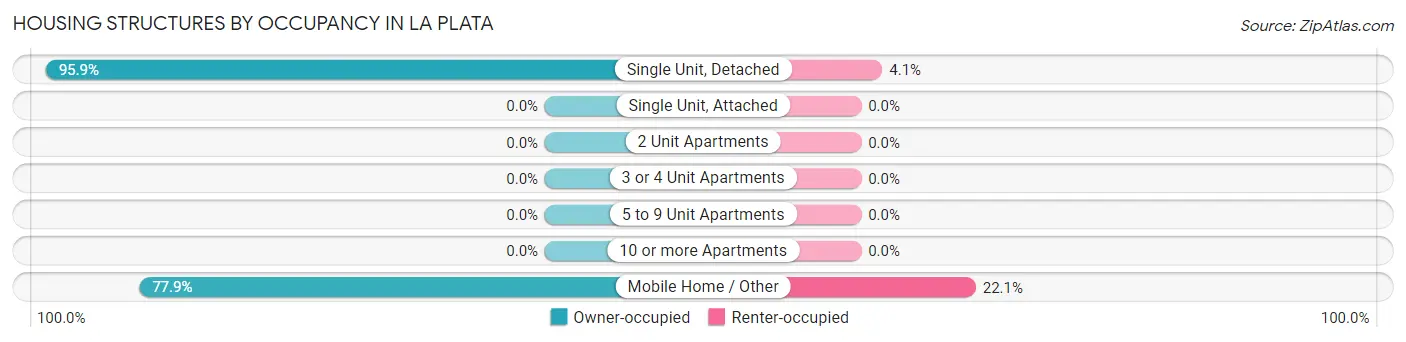
| Structure Type | Owner-occupied | Renter-occupied |
| Single Unit, Detached | 377 (95.9%) | 16 (4.1%) |
| Single Unit, Attached | 0 (0.0%) | 0 (0.0%) |
| 2 Unit Apartments | 0 (0.0%) | 0 (0.0%) |
| 3 or 4 Unit Apartments | 0 (0.0%) | 0 (0.0%) |
| 5 to 9 Unit Apartments | 0 (0.0%) | 0 (0.0%) |
| 10 or more Apartments | 0 (0.0%) | 0 (0.0%) |
| Mobile Home / Other | 286 (77.9%) | 81 (22.1%) |
| Total | 663 (87.2%) | 97 (12.8%) |
Housing Structures by Number of Rooms in La Plata
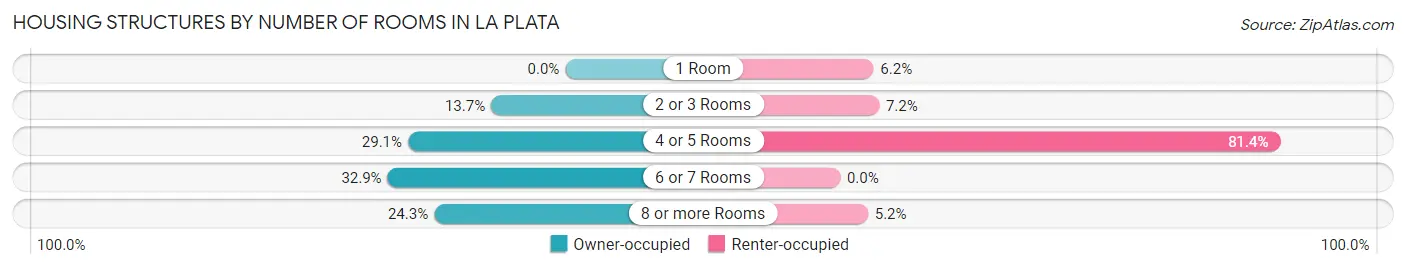
| Number of Rooms | Owner-occupied | Renter-occupied |
| 1 Room | 0 (0.0%) | 6 (6.2%) |
| 2 or 3 Rooms | 91 (13.7%) | 7 (7.2%) |
| 4 or 5 Rooms | 193 (29.1%) | 79 (81.4%) |
| 6 or 7 Rooms | 218 (32.9%) | 0 (0.0%) |
| 8 or more Rooms | 161 (24.3%) | 5 (5.1%) |
| Total | 663 (100.0%) | 97 (100.0%) |
Housing Structure by Heating Type in La Plata
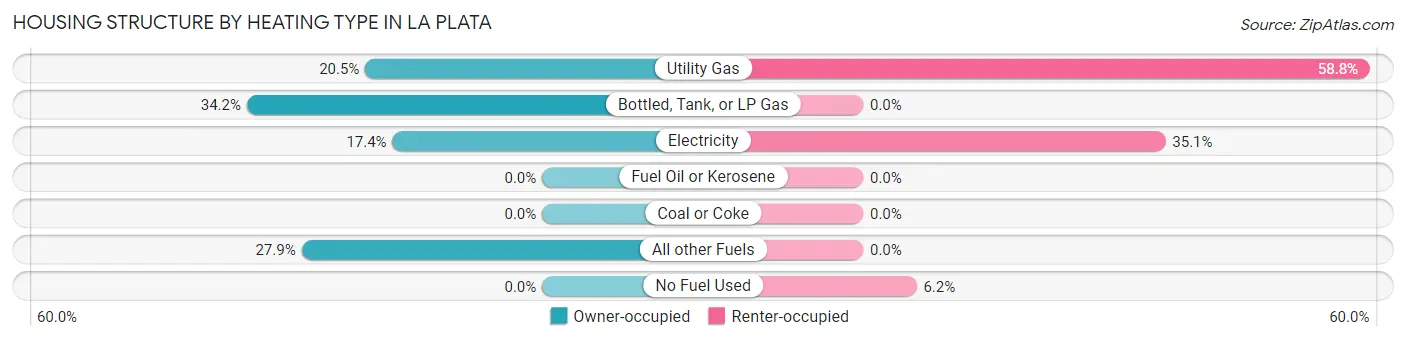
| Heating Type | Owner-occupied | Renter-occupied |
| Utility Gas | 136 (20.5%) | 57 (58.8%) |
| Bottled, Tank, or LP Gas | 227 (34.2%) | 0 (0.0%) |
| Electricity | 115 (17.3%) | 34 (35.0%) |
| Fuel Oil or Kerosene | 0 (0.0%) | 0 (0.0%) |
| Coal or Coke | 0 (0.0%) | 0 (0.0%) |
| All other Fuels | 185 (27.9%) | 0 (0.0%) |
| No Fuel Used | 0 (0.0%) | 6 (6.2%) |
| Total | 663 (100.0%) | 97 (100.0%) |
Household Vehicle Usage in La Plata
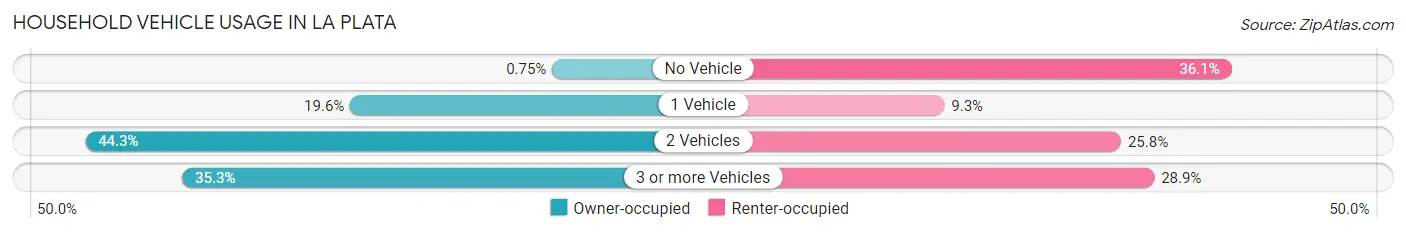
| Vehicles per Household | Owner-occupied | Renter-occupied |
| No Vehicle | 5 (0.7%) | 35 (36.1%) |
| 1 Vehicle | 130 (19.6%) | 9 (9.3%) |
| 2 Vehicles | 294 (44.3%) | 25 (25.8%) |
| 3 or more Vehicles | 234 (35.3%) | 28 (28.9%) |
| Total | 663 (100.0%) | 97 (100.0%) |
Real Estate & Mortgages in La Plata
Real Estate and Mortgage Overview in La Plata
| Characteristic | Without Mortgage | With Mortgage |
| Housing Units | 329 | 334 |
| Median Property Value | $157,600 | $195,700 |
| Median Household Income | $50,293 | $41 |
| Monthly Housing Costs | $325 | $11 |
| Real Estate Taxes | $1,094 | $23 |
Property Value by Mortgage Status in La Plata
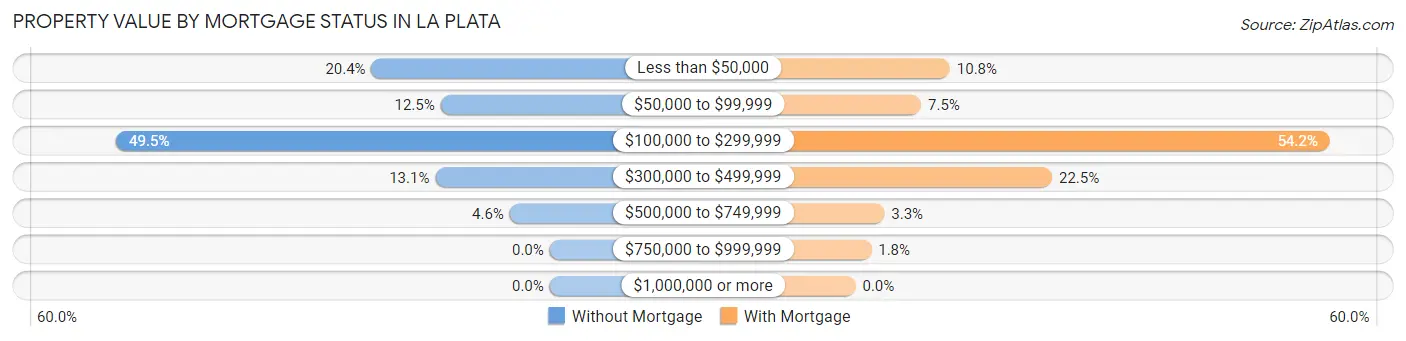
| Property Value | Without Mortgage | With Mortgage |
| Less than $50,000 | 67 (20.4%) | 36 (10.8%) |
| $50,000 to $99,999 | 41 (12.5%) | 25 (7.5%) |
| $100,000 to $299,999 | 163 (49.5%) | 181 (54.2%) |
| $300,000 to $499,999 | 43 (13.1%) | 75 (22.5%) |
| $500,000 to $749,999 | 15 (4.6%) | 11 (3.3%) |
| $750,000 to $999,999 | 0 (0.0%) | 6 (1.8%) |
| $1,000,000 or more | 0 (0.0%) | 0 (0.0%) |
| Total | 329 (100.0%) | 334 (100.0%) |
Household Income by Mortgage Status in La Plata
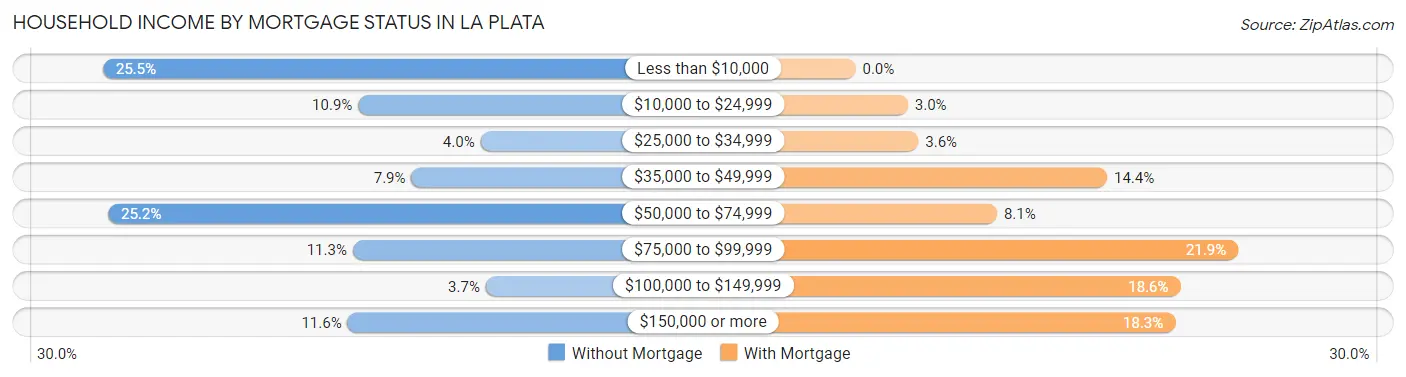
| Household Income | Without Mortgage | With Mortgage |
| Less than $10,000 | 84 (25.5%) | 0 (0.0%) |
| $10,000 to $24,999 | 36 (10.9%) | 10 (3.0%) |
| $25,000 to $34,999 | 13 (4.0%) | 12 (3.6%) |
| $35,000 to $49,999 | 26 (7.9%) | 48 (14.4%) |
| $50,000 to $74,999 | 83 (25.2%) | 27 (8.1%) |
| $75,000 to $99,999 | 37 (11.3%) | 73 (21.9%) |
| $100,000 to $149,999 | 12 (3.6%) | 62 (18.6%) |
| $150,000 or more | 38 (11.6%) | 61 (18.3%) |
| Total | 329 (100.0%) | 334 (100.0%) |
Property Value to Household Income Ratio in La Plata
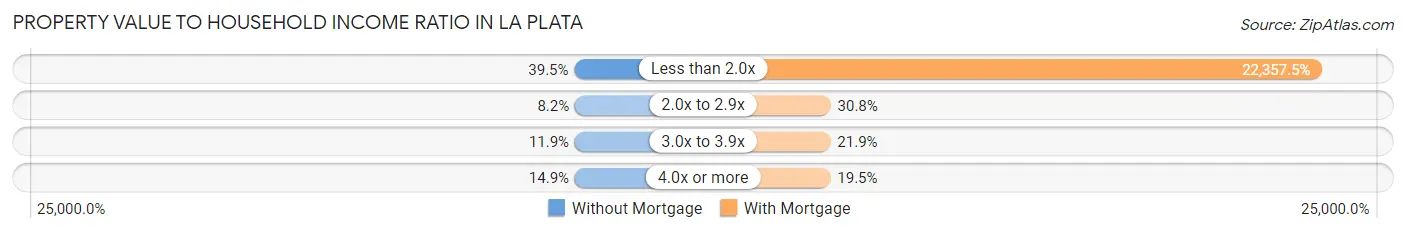
| Value-to-Income Ratio | Without Mortgage | With Mortgage |
| Less than 2.0x | 130 (39.5%) | 74,674 (22,357.5%) |
| 2.0x to 2.9x | 27 (8.2%) | 103 (30.8%) |
| 3.0x to 3.9x | 39 (11.8%) | 73 (21.9%) |
| 4.0x or more | 49 (14.9%) | 65 (19.5%) |
| Total | 329 (100.0%) | 334 (100.0%) |
Real Estate Taxes by Mortgage Status in La Plata

| Property Taxes | Without Mortgage | With Mortgage |
| Less than $800 | 73 (22.2%) | 0 (0.0%) |
| $800 to $1,499 | 65 (19.8%) | 120 (35.9%) |
| $800 to $1,499 | 60 (18.2%) | 75 (22.5%) |
| Total | 329 (100.0%) | 334 (100.0%) |
Health & Disability in La Plata
Health Insurance Coverage by Age in La Plata
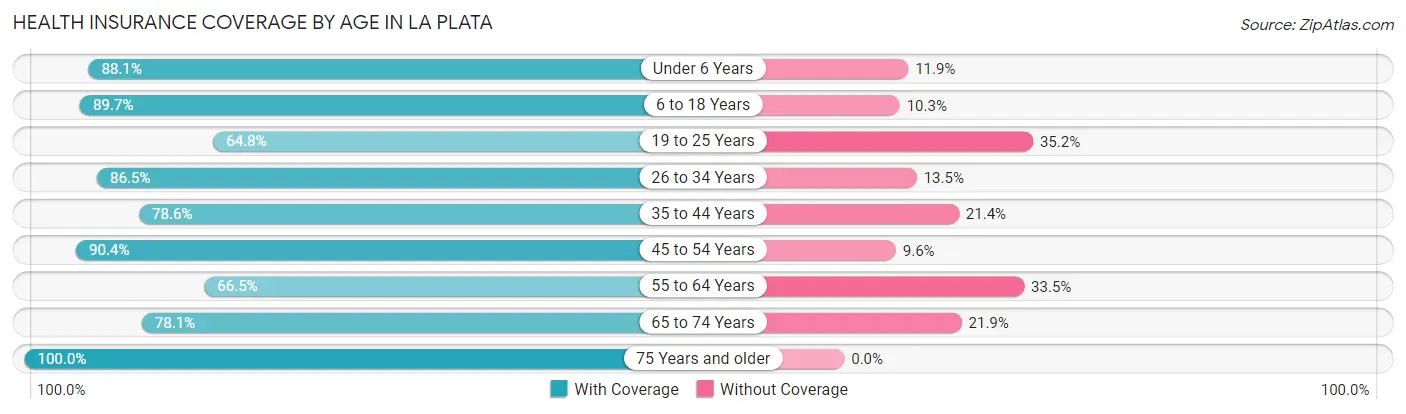
| Age Bracket | With Coverage | Without Coverage |
| Under 6 Years | 133 (88.1%) | 18 (11.9%) |
| 6 to 18 Years | 312 (89.7%) | 36 (10.3%) |
| 19 to 25 Years | 35 (64.8%) | 19 (35.2%) |
| 26 to 34 Years | 160 (86.5%) | 25 (13.5%) |
| 35 to 44 Years | 206 (78.6%) | 56 (21.4%) |
| 45 to 54 Years | 207 (90.4%) | 22 (9.6%) |
| 55 to 64 Years | 210 (66.5%) | 106 (33.5%) |
| 65 to 74 Years | 282 (78.1%) | 79 (21.9%) |
| 75 Years and older | 157 (100.0%) | 0 (0.0%) |
| Total | 1,702 (82.5%) | 361 (17.5%) |
Health Insurance Coverage by Citizenship Status in La Plata

| Citizenship Status | With Coverage | Without Coverage |
| Native Born | 133 (88.1%) | 18 (11.9%) |
| Foreign Born, Citizen | 312 (89.7%) | 36 (10.3%) |
| Foreign Born, not a Citizen | 35 (64.8%) | 19 (35.2%) |
Health Insurance Coverage by Household Income in La Plata

| Household Income | With Coverage | Without Coverage |
| Under $25,000 | 250 (68.1%) | 117 (31.9%) |
| $25,000 to $49,999 | 312 (83.0%) | 64 (17.0%) |
| $50,000 to $74,999 | 474 (76.3%) | 147 (23.7%) |
| $75,000 to $99,999 | 293 (100.0%) | 0 (0.0%) |
| $100,000 and over | 373 (91.9%) | 33 (8.1%) |
Public vs Private Health Insurance Coverage by Age in La Plata
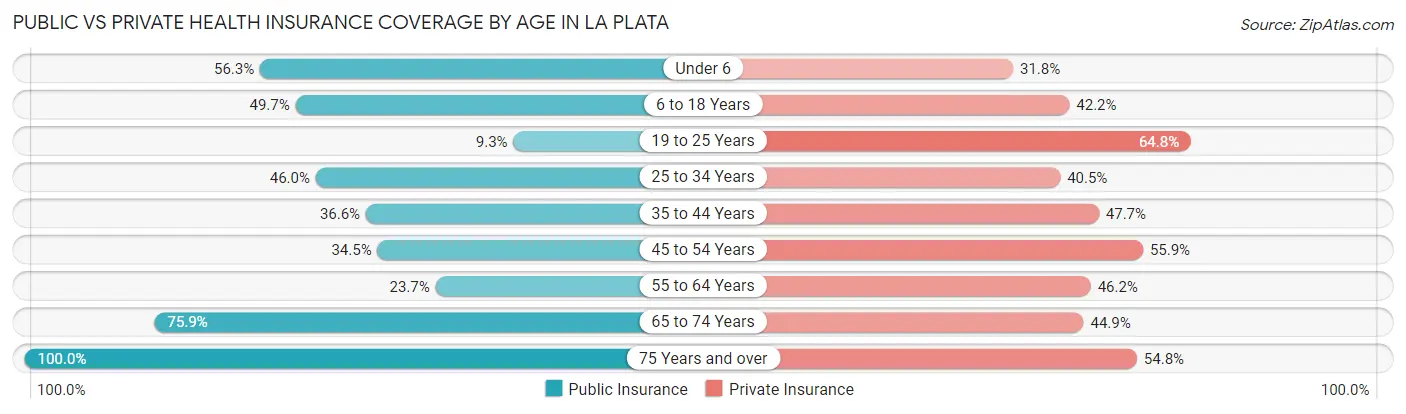
| Age Bracket | Public Insurance | Private Insurance |
| Under 6 | 85 (56.3%) | 48 (31.8%) |
| 6 to 18 Years | 173 (49.7%) | 147 (42.2%) |
| 19 to 25 Years | 5 (9.3%) | 35 (64.8%) |
| 25 to 34 Years | 85 (46.0%) | 75 (40.5%) |
| 35 to 44 Years | 96 (36.6%) | 125 (47.7%) |
| 45 to 54 Years | 79 (34.5%) | 128 (55.9%) |
| 55 to 64 Years | 75 (23.7%) | 146 (46.2%) |
| 65 to 74 Years | 274 (75.9%) | 162 (44.9%) |
| 75 Years and over | 157 (100.0%) | 86 (54.8%) |
| Total | 1,029 (49.9%) | 952 (46.2%) |
Disability Status by Sex by Age in La Plata
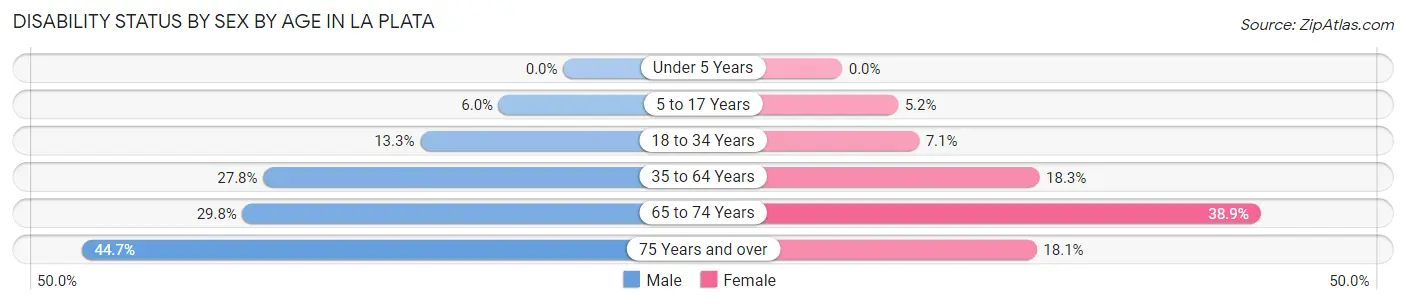
| Age Bracket | Male | Female |
| Under 5 Years | 0 (0.0%) | 0 (0.0%) |
| 5 to 17 Years | 14 (6.0%) | 7 (5.2%) |
| 18 to 34 Years | 17 (13.3%) | 9 (7.1%) |
| 35 to 64 Years | 103 (27.8%) | 80 (18.3%) |
| 65 to 74 Years | 50 (29.8%) | 75 (38.9%) |
| 75 Years and over | 38 (44.7%) | 13 (18.1%) |
Disability Class by Sex by Age in La Plata
Disability Class: Hearing Difficulty
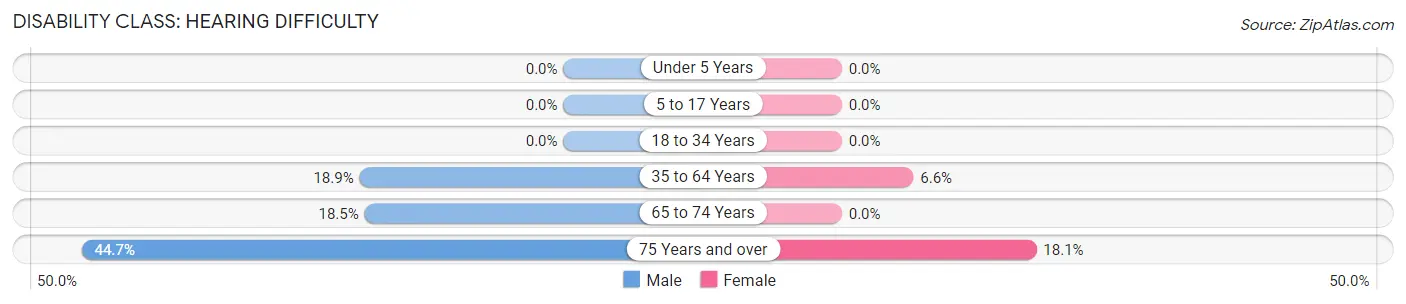
| Age Bracket | Male | Female |
| Under 5 Years | 0 (0.0%) | 0 (0.0%) |
| 5 to 17 Years | 0 (0.0%) | 0 (0.0%) |
| 18 to 34 Years | 0 (0.0%) | 0 (0.0%) |
| 35 to 64 Years | 70 (18.9%) | 29 (6.6%) |
| 65 to 74 Years | 31 (18.4%) | 0 (0.0%) |
| 75 Years and over | 38 (44.7%) | 13 (18.1%) |
Disability Class: Vision Difficulty
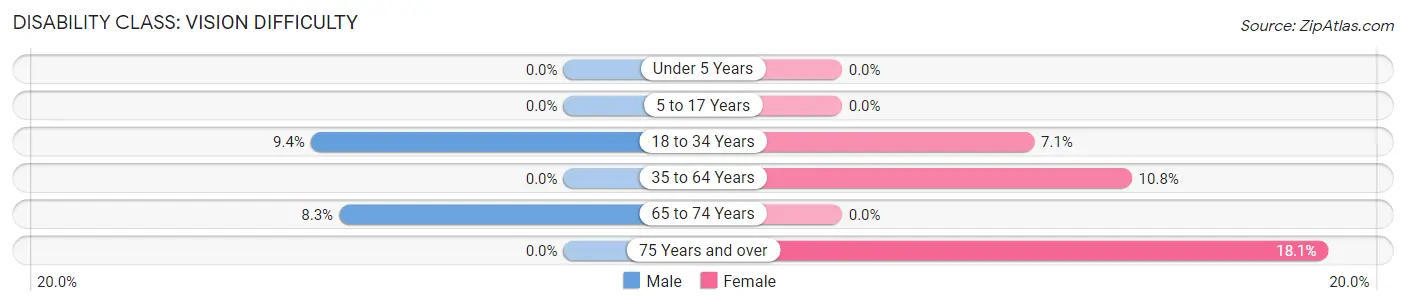
| Age Bracket | Male | Female |
| Under 5 Years | 0 (0.0%) | 0 (0.0%) |
| 5 to 17 Years | 0 (0.0%) | 0 (0.0%) |
| 18 to 34 Years | 12 (9.4%) | 9 (7.1%) |
| 35 to 64 Years | 0 (0.0%) | 47 (10.8%) |
| 65 to 74 Years | 14 (8.3%) | 0 (0.0%) |
| 75 Years and over | 0 (0.0%) | 13 (18.1%) |
Disability Class: Cognitive Difficulty
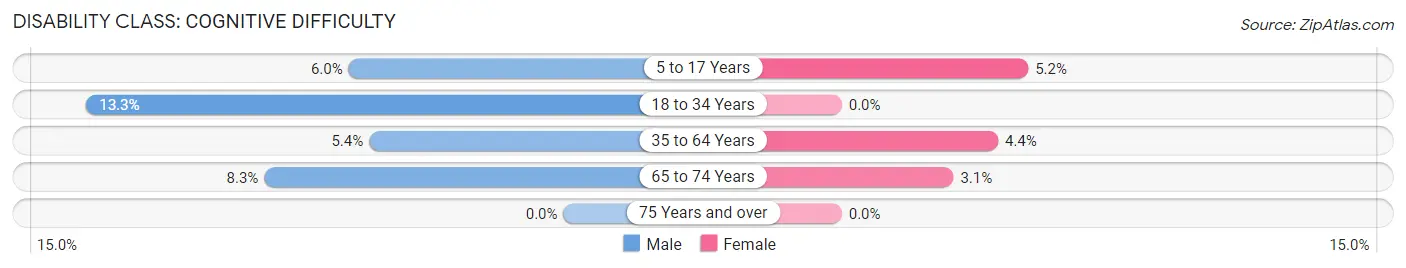
| Age Bracket | Male | Female |
| 5 to 17 Years | 14 (6.0%) | 7 (5.2%) |
| 18 to 34 Years | 17 (13.3%) | 0 (0.0%) |
| 35 to 64 Years | 20 (5.4%) | 19 (4.3%) |
| 65 to 74 Years | 14 (8.3%) | 6 (3.1%) |
| 75 Years and over | 0 (0.0%) | 0 (0.0%) |
Disability Class: Ambulatory Difficulty
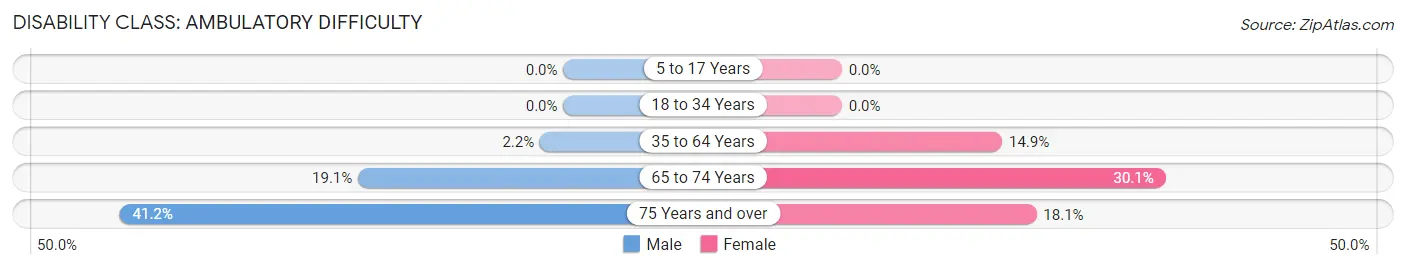
| Age Bracket | Male | Female |
| 5 to 17 Years | 0 (0.0%) | 0 (0.0%) |
| 18 to 34 Years | 0 (0.0%) | 0 (0.0%) |
| 35 to 64 Years | 8 (2.2%) | 65 (14.9%) |
| 65 to 74 Years | 32 (19.1%) | 58 (30.0%) |
| 75 Years and over | 35 (41.2%) | 13 (18.1%) |
Disability Class: Self-Care Difficulty
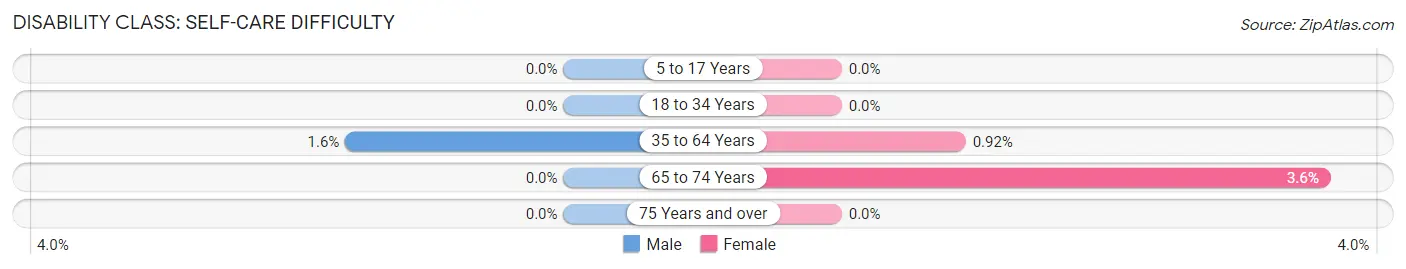
| Age Bracket | Male | Female |
| 5 to 17 Years | 0 (0.0%) | 0 (0.0%) |
| 18 to 34 Years | 0 (0.0%) | 0 (0.0%) |
| 35 to 64 Years | 6 (1.6%) | 4 (0.9%) |
| 65 to 74 Years | 0 (0.0%) | 7 (3.6%) |
| 75 Years and over | 0 (0.0%) | 0 (0.0%) |
Technology Access in La Plata
Computing Device Access in La Plata
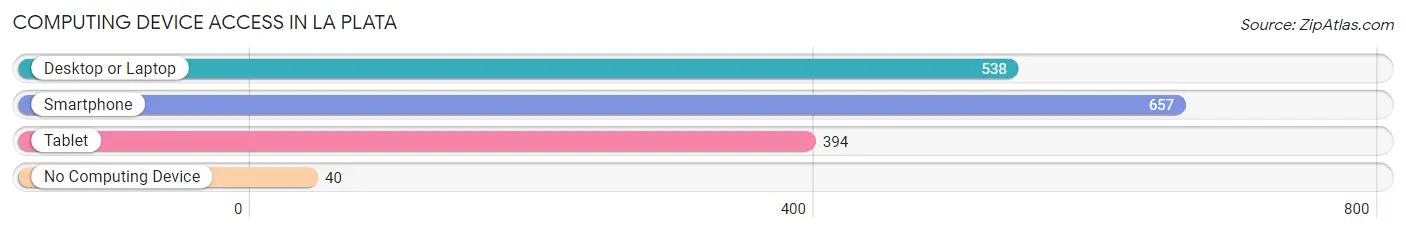
| Device Type | # Households | % Households |
| Desktop or Laptop | 538 | 70.8% |
| Smartphone | 657 | 86.5% |
| Tablet | 394 | 51.8% |
| No Computing Device | 40 | 5.3% |
| Total | 760 | 100.0% |
Internet Access in La Plata
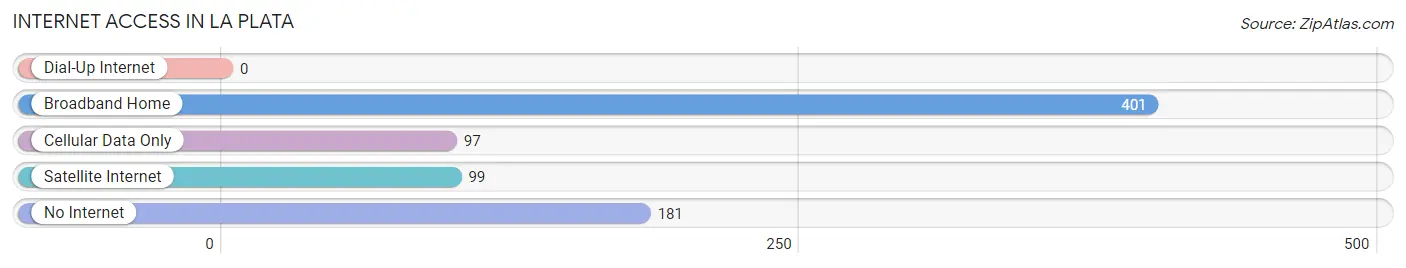
| Internet Type | # Households | % Households |
| Dial-Up Internet | 0 | 0.0% |
| Broadband Home | 401 | 52.8% |
| Cellular Data Only | 97 | 12.8% |
| Satellite Internet | 99 | 13.0% |
| No Internet | 181 | 23.8% |
| Total | 760 | 100.0% |
La Plata Summary
La Plata is a small unincorporated community located in the San Juan County of New Mexico. It is situated in the northwest corner of the state, near the Arizona border. The town is located in the Chaco Canyon region, which is known for its rich cultural and archaeological history. La Plata is home to a small population of approximately 200 people, and is a popular destination for tourists and outdoor enthusiasts.
History
The area around La Plata has been inhabited for thousands of years. The earliest known inhabitants were the Anasazi, who lived in the area from around 1000 BC to 1300 AD. The Anasazi left behind a rich cultural legacy, including the ruins of their villages and the remains of their pottery.
In the late 1800s, the area was settled by Anglo-American settlers. The town of La Plata was established in 1891, and was named after the nearby La Plata River. The town quickly grew, and by the early 1900s it had become a bustling center of commerce and industry.
Geography
La Plata is located in the northwest corner of New Mexico, near the Arizona border. The town is situated in the Chaco Canyon region, which is known for its rich cultural and archaeological history. The town is located at an elevation of 5,000 feet, and is surrounded by the San Juan Mountains. The climate in La Plata is semi-arid, with hot summers and cold winters.
Economy
The economy of La Plata is largely based on tourism and outdoor recreation. The town is a popular destination for hikers, campers, and other outdoor enthusiasts. The nearby Chaco Canyon National Historic Park is a major draw for tourists, and the town also hosts a number of festivals and events throughout the year.
In addition to tourism, La Plata is also home to a number of small businesses, including restaurants, shops, and other services. The town is also home to a number of ranches and farms, which produce a variety of crops and livestock.
Demographics
As of the 2010 census, the population of La Plata was approximately 200 people. The town is predominantly white, with a small Hispanic population. The median household income in La Plata is $35,000, and the median age is 44 years. The town has a high rate of poverty, with nearly one-third of the population living below the poverty line.
Common Questions
What is Per Capita Income in La Plata?
Per Capita income in La Plata is $28,234.
What is the Median Family Income in La Plata?
Median Family Income in La Plata is $51,885.
What is the Median Household income in La Plata?
Median Household Income in La Plata is $53,056.
What is Income or Wage Gap in La Plata?
Income or Wage Gap in La Plata is 55.1%.
Women in La Plata earn 44.9 cents for every dollar earned by a man.
What is Inequality or Gini Index in La Plata?
Inequality or Gini Index in La Plata is 0.51.
What is the Total Population of La Plata?
Total Population of La Plata is 2,063.
What is the Total Male Population of La Plata?
Total Male Population of La Plata is 1,033.
What is the Total Female Population of La Plata?
Total Female Population of La Plata is 1,030.
What is the Ratio of Males per 100 Females in La Plata?
There are 100.29 Males per 100 Females in La Plata.
What is the Ratio of Females per 100 Males in La Plata?
There are 99.71 Females per 100 Males in La Plata.
What is the Median Population Age in La Plata?
Median Population Age in La Plata is 45.3 Years.
What is the Average Family Size in La Plata
Average Family Size in La Plata is 2.9 People.
What is the Average Household Size in La Plata
Average Household Size in La Plata is 2.7 People.
How Large is the Labor Force in La Plata?
There are 738 People in the Labor Forcein in La Plata.
What is the Percentage of People in the Labor Force in La Plata?
45.5% of People are in the Labor Force in La Plata.
What is the Unemployment Rate in La Plata?
Unemployment Rate in La Plata is 8.5%.