North Hobbs, NM Map & Demographics
North Hobbs Map
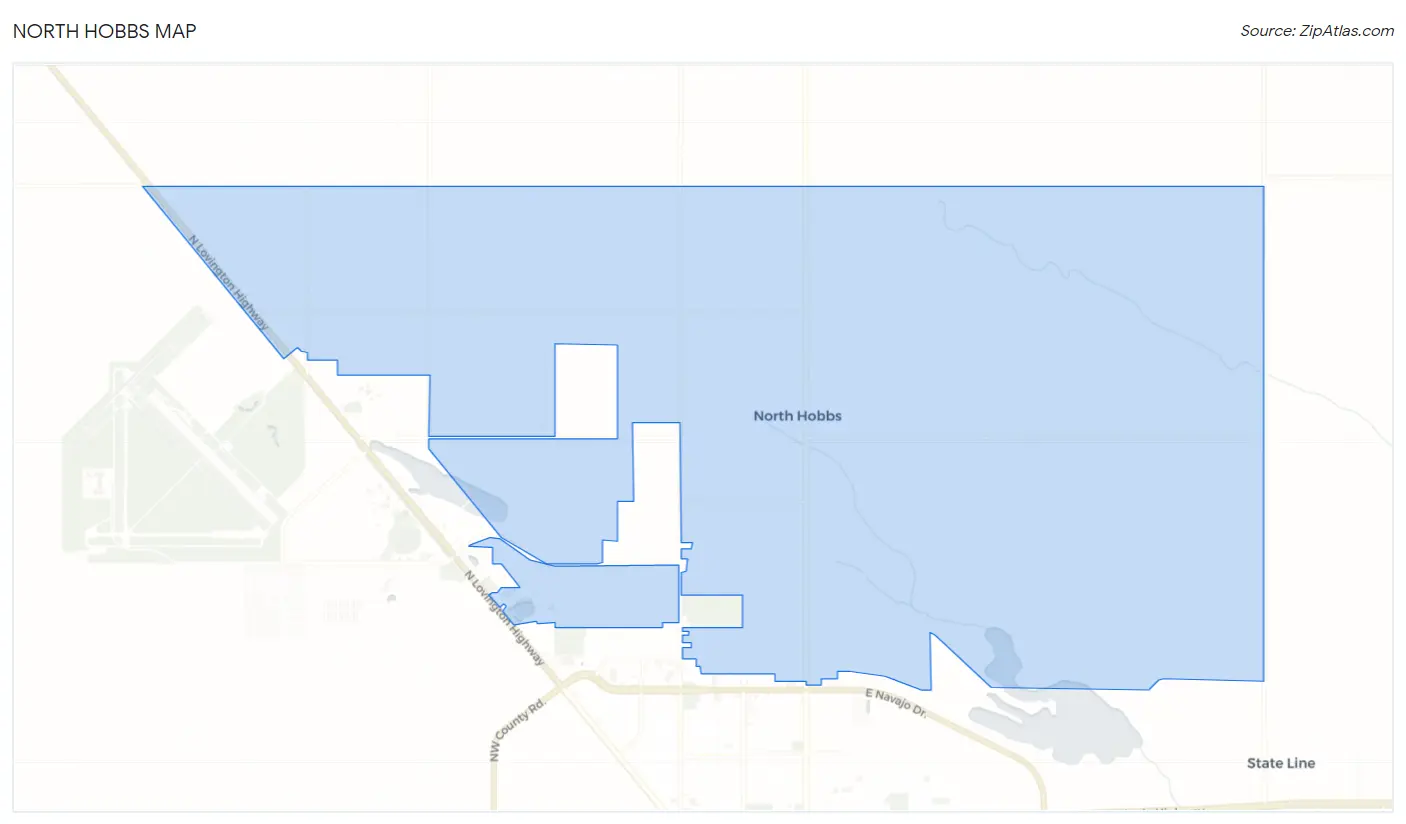
North Hobbs Overview
$32,384
PER CAPITA INCOME
$86,028
AVG FAMILY INCOME
$78,608
AVG HOUSEHOLD INCOME
52.3%
WAGE / INCOME GAP [ % ]
47.7¢/ $1
WAGE / INCOME GAP [ $ ]
0.48
INEQUALITY / GINI INDEX
5,863
TOTAL POPULATION
2,908
MALE POPULATION
2,955
FEMALE POPULATION
98.41
MALES / 100 FEMALES
101.62
FEMALES / 100 MALES
36.2
MEDIAN AGE
3.6
AVG FAMILY SIZE
3.1
AVG HOUSEHOLD SIZE
2,661
LABOR FORCE [ PEOPLE ]
60.0%
PERCENT IN LABOR FORCE
11.3%
UNEMPLOYMENT RATE
Income in North Hobbs
Income Overview in North Hobbs
Per Capita Income in North Hobbs is $32,384, while median incomes of families and households are $86,028 and $78,608 respectively.
| Characteristic | Number | Measure |
| Per Capita Income | 5,863 | $32,384 |
| Median Family Income | 1,385 | $86,028 |
| Mean Family Income | 1,385 | $107,551 |
| Median Household Income | 1,915 | $78,608 |
| Mean Household Income | 1,915 | $92,101 |
| Income Deficit | 1,385 | $0 |
| Wage / Income Gap (%) | 5,863 | 52.27% |
| Wage / Income Gap ($) | 5,863 | 47.73¢ per $1 |
| Gini / Inequality Index | 5,863 | 0.48 |
Earnings by Sex in North Hobbs
Average Earnings in North Hobbs are $49,391, $66,563 for men and $31,771 for women, a difference of 52.3%.
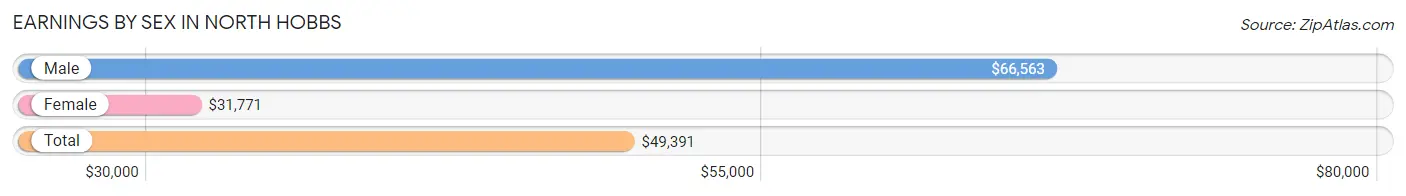
| Sex | Number | Average Earnings |
| Male | 1,501 (56.5%) | $66,563 |
| Female | 1,158 (43.5%) | $31,771 |
| Total | 2,659 (100.0%) | $49,391 |
Earnings by Sex by Income Bracket in North Hobbs
The most common earnings brackets in North Hobbs are $100,000+ for men (318 | 21.2%) and $75,000 to $99,999 for women (163 | 14.1%).
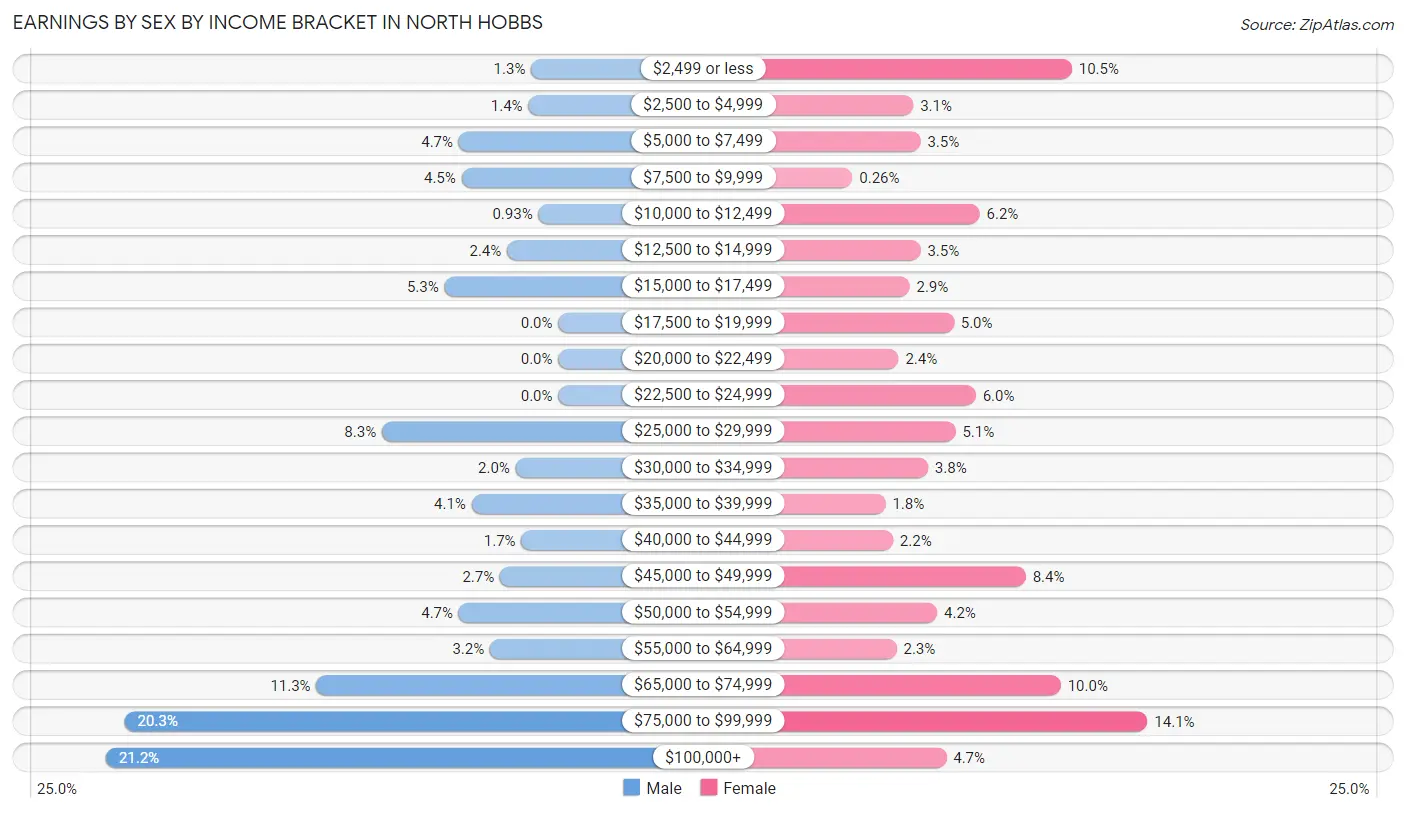
| Income | Male | Female |
| $2,499 or less | 19 (1.3%) | 122 (10.5%) |
| $2,500 to $4,999 | 21 (1.4%) | 36 (3.1%) |
| $5,000 to $7,499 | 70 (4.7%) | 40 (3.5%) |
| $7,500 to $9,999 | 68 (4.5%) | 3 (0.3%) |
| $10,000 to $12,499 | 14 (0.9%) | 72 (6.2%) |
| $12,500 to $14,999 | 36 (2.4%) | 40 (3.5%) |
| $15,000 to $17,499 | 80 (5.3%) | 34 (2.9%) |
| $17,500 to $19,999 | 0 (0.0%) | 58 (5.0%) |
| $20,000 to $22,499 | 0 (0.0%) | 28 (2.4%) |
| $22,500 to $24,999 | 0 (0.0%) | 70 (6.0%) |
| $25,000 to $29,999 | 124 (8.3%) | 59 (5.1%) |
| $30,000 to $34,999 | 30 (2.0%) | 44 (3.8%) |
| $35,000 to $39,999 | 61 (4.1%) | 21 (1.8%) |
| $40,000 to $44,999 | 26 (1.7%) | 25 (2.2%) |
| $45,000 to $49,999 | 41 (2.7%) | 97 (8.4%) |
| $50,000 to $54,999 | 70 (4.7%) | 49 (4.2%) |
| $55,000 to $64,999 | 48 (3.2%) | 27 (2.3%) |
| $65,000 to $74,999 | 170 (11.3%) | 116 (10.0%) |
| $75,000 to $99,999 | 305 (20.3%) | 163 (14.1%) |
| $100,000+ | 318 (21.2%) | 54 (4.7%) |
| Total | 1,501 (100.0%) | 1,158 (100.0%) |
Earnings by Sex by Educational Attainment in North Hobbs
Average earnings in North Hobbs are $71,107 for men and $39,875 for women, a difference of 43.9%. Men with an educational attainment of graduate degree enjoy the highest average annual earnings of $102,250, while those with bachelor's degree education earn the least with $51,058. Women with an educational attainment of graduate degree earn the most with the average annual earnings of $76,667, while those with high school diploma education have the smallest earnings of $23,444.
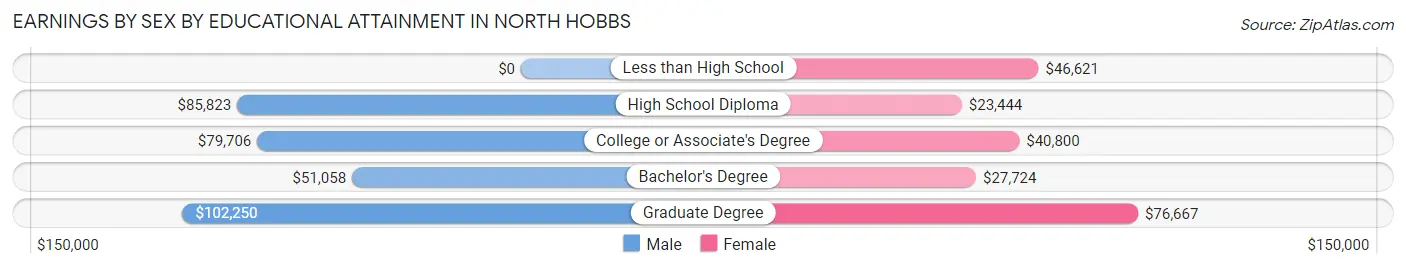
| Educational Attainment | Male Income | Female Income |
| Less than High School | - | - |
| High School Diploma | $85,823 | $23,444 |
| College or Associate's Degree | $79,706 | $40,800 |
| Bachelor's Degree | $51,058 | $27,724 |
| Graduate Degree | $102,250 | $76,667 |
| Total | $71,107 | $39,875 |
Family Income in North Hobbs
Family Income Brackets in North Hobbs
According to the North Hobbs family income data, there are 319 families falling into the $75,000 to $99,999 income range, which is the most common income bracket and makes up 23.0% of all families.
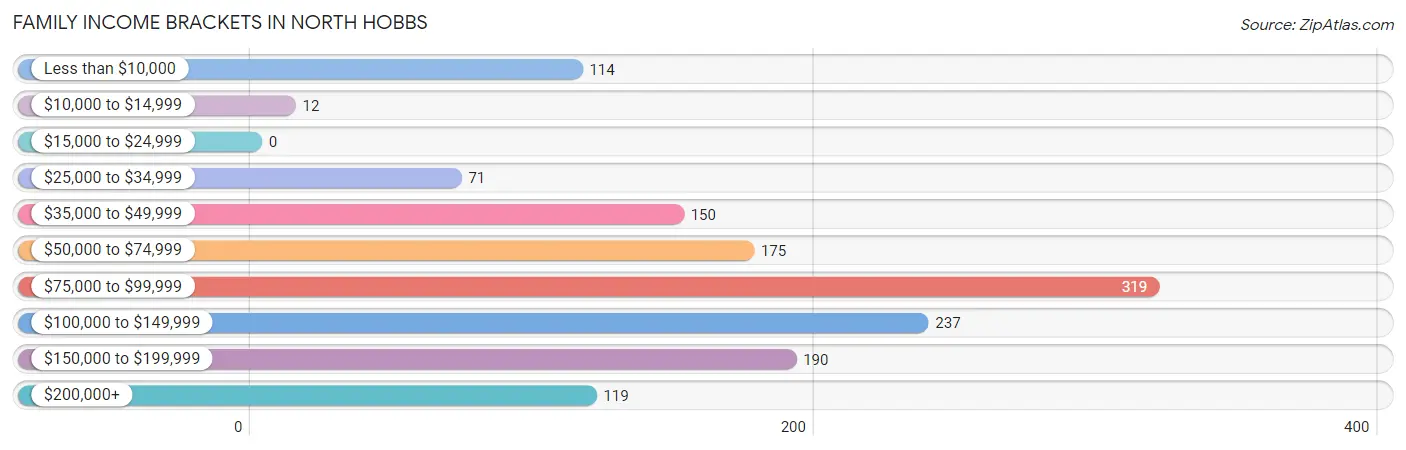
| Income Bracket | # Families | % Families |
| Less than $10,000 | 114 | 8.2% |
| $10,000 to $14,999 | 12 | 0.9% |
| $15,000 to $24,999 | 0 | 0.0% |
| $25,000 to $34,999 | 71 | 5.1% |
| $35,000 to $49,999 | 150 | 10.8% |
| $50,000 to $74,999 | 175 | 12.6% |
| $75,000 to $99,999 | 319 | 23.0% |
| $100,000 to $149,999 | 237 | 17.1% |
| $150,000 to $199,999 | 190 | 13.7% |
| $200,000+ | 119 | 8.6% |
Family Income by Famaliy Size in North Hobbs
7+ person families (70 | 5.1%) account for the highest median family income in North Hobbs with $103,676 per family, while 2-person families (727 | 52.5%) have the highest median income of $41,840 per family member.
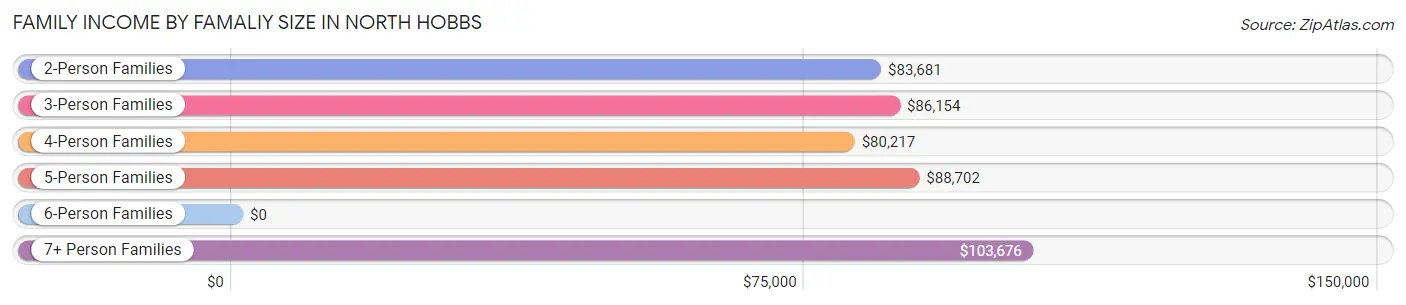
| Income Bracket | # Families | Median Income |
| 2-Person Families | 727 (52.5%) | $83,681 |
| 3-Person Families | 236 (17.0%) | $86,154 |
| 4-Person Families | 218 (15.7%) | $80,217 |
| 5-Person Families | 133 (9.6%) | $88,702 |
| 6-Person Families | 1 (0.1%) | $0 |
| 7+ Person Families | 70 (5.1%) | $103,676 |
| Total | 1,385 (100.0%) | $86,028 |
Family Income by Number of Earners in North Hobbs
The median family income in North Hobbs is $86,028, with families comprising 3+ earners (105) having the highest median family income of $110,368, while families with no earners (231) have the lowest median family income of $29,421, accounting for 7.6% and 16.7% of families, respectively.
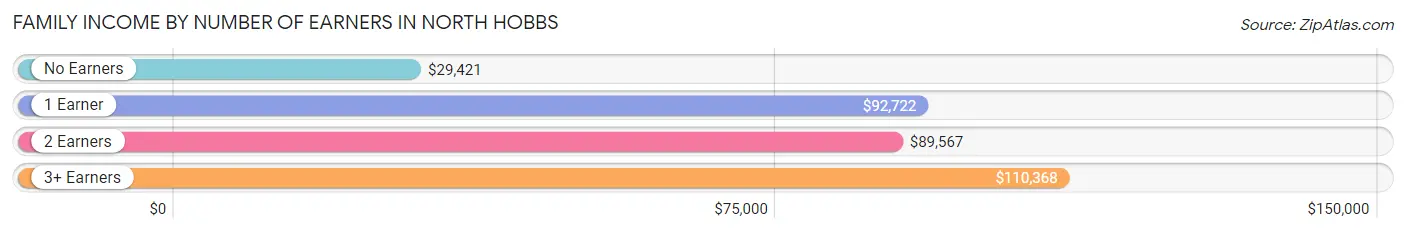
| Number of Earners | # Families | Median Income |
| No Earners | 231 (16.7%) | $29,421 |
| 1 Earner | 468 (33.8%) | $92,722 |
| 2 Earners | 581 (41.9%) | $89,567 |
| 3+ Earners | 105 (7.6%) | $110,368 |
| Total | 1,385 (100.0%) | $86,028 |
Household Income in North Hobbs
Household Income Brackets in North Hobbs
With 379 households falling in the category, the $75,000 to $99,999 income range is the most frequent in North Hobbs, accounting for 19.8% of all households. In contrast, only 73 households (3.8%) fall into the $10,000 to $14,999 income bracket, making it the least populous group.
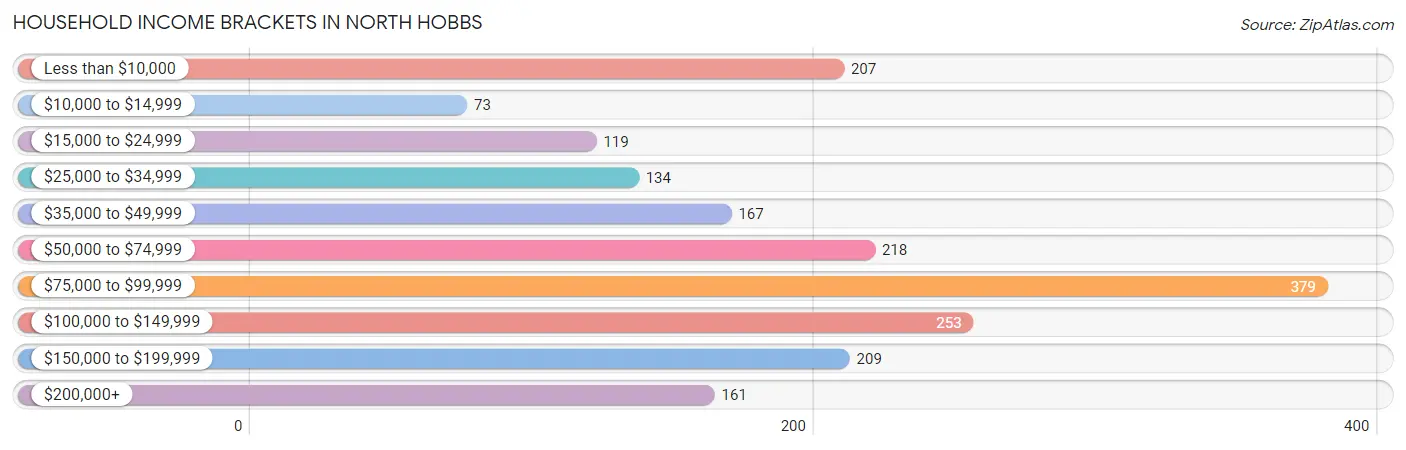
| Income Bracket | # Households | % Households |
| Less than $10,000 | 207 | 10.8% |
| $10,000 to $14,999 | 73 | 3.8% |
| $15,000 to $24,999 | 119 | 6.2% |
| $25,000 to $34,999 | 134 | 7.0% |
| $35,000 to $49,999 | 167 | 8.7% |
| $50,000 to $74,999 | 218 | 11.4% |
| $75,000 to $99,999 | 379 | 19.8% |
| $100,000 to $149,999 | 253 | 13.2% |
| $150,000 to $199,999 | 209 | 10.9% |
| $200,000+ | 161 | 8.4% |
Household Income by Householder Age in North Hobbs
The median household income in North Hobbs is $78,608, with the highest median household income of $87,981 found in the 45 to 64 years age bracket for the primary householder. A total of 782 households (40.8%) fall into this category. Meanwhile, the 15 to 24 years age bracket for the primary householder has the lowest median household income of $0, with 49 households (2.6%) in this group.
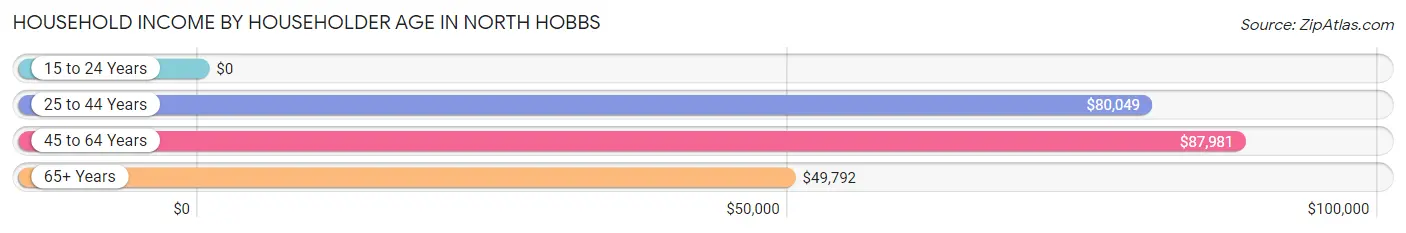
| Income Bracket | # Households | Median Income |
| 15 to 24 Years | 49 (2.6%) | $0 |
| 25 to 44 Years | 660 (34.5%) | $80,049 |
| 45 to 64 Years | 782 (40.8%) | $87,981 |
| 65+ Years | 424 (22.1%) | $49,792 |
| Total | 1,915 (100.0%) | $78,608 |
Poverty in North Hobbs
Income Below Poverty by Sex and Age in North Hobbs
With 13.7% poverty level for males and 17.2% for females among the residents of North Hobbs, 15 year old males and 15 year old females are the most vulnerable to poverty, with 10 males (52.6%) and 82 females (59.9%) in their respective age groups living below the poverty level.
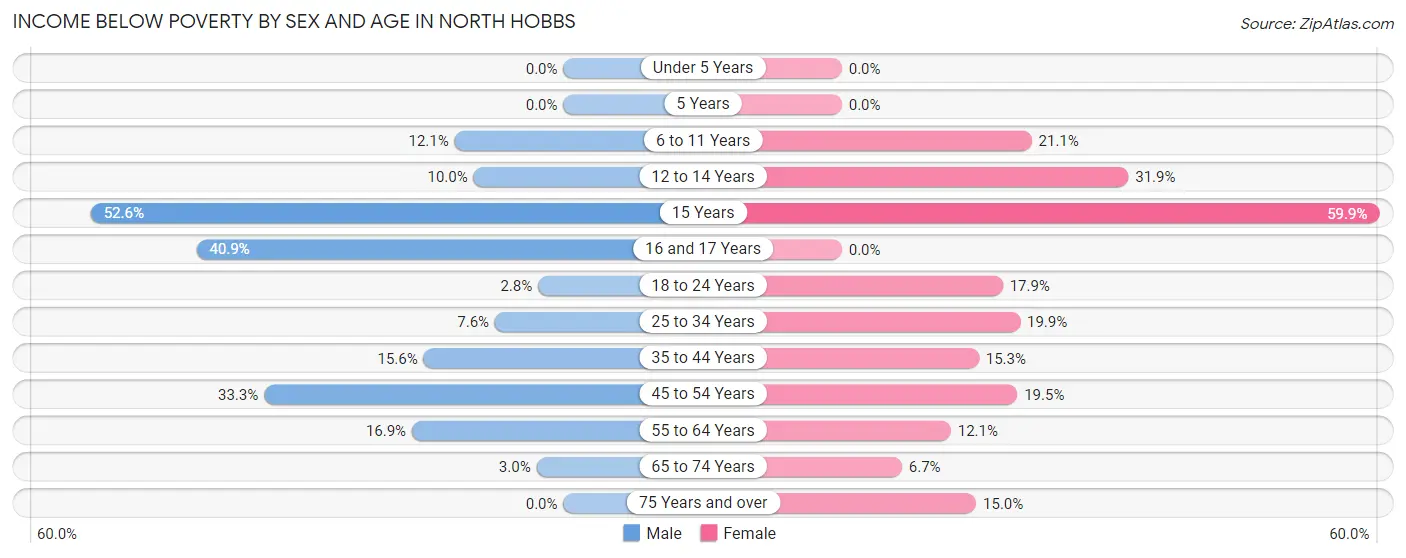
| Age Bracket | Male | Female |
| Under 5 Years | 0 (0.0%) | 0 (0.0%) |
| 5 Years | 0 (0.0%) | 0 (0.0%) |
| 6 to 11 Years | 40 (12.1%) | 37 (21.1%) |
| 12 to 14 Years | 16 (10.0%) | 45 (31.9%) |
| 15 Years | 10 (52.6%) | 82 (59.9%) |
| 16 and 17 Years | 38 (40.9%) | 0 (0.0%) |
| 18 to 24 Years | 7 (2.8%) | 50 (17.9%) |
| 25 to 34 Years | 32 (7.6%) | 52 (19.9%) |
| 35 to 44 Years | 45 (15.6%) | 74 (15.3%) |
| 45 to 54 Years | 130 (33.3%) | 77 (19.5%) |
| 55 to 64 Years | 73 (16.9%) | 47 (12.1%) |
| 65 to 74 Years | 6 (3.0%) | 16 (6.7%) |
| 75 Years and over | 0 (0.0%) | 19 (15.0%) |
| Total | 397 (13.7%) | 499 (17.2%) |
Income Above Poverty by Sex and Age in North Hobbs
According to the poverty statistics in North Hobbs, males aged under 5 years and females aged under 5 years are the age groups that are most secure financially, with 100.0% of males and 100.0% of females in these age groups living above the poverty line.
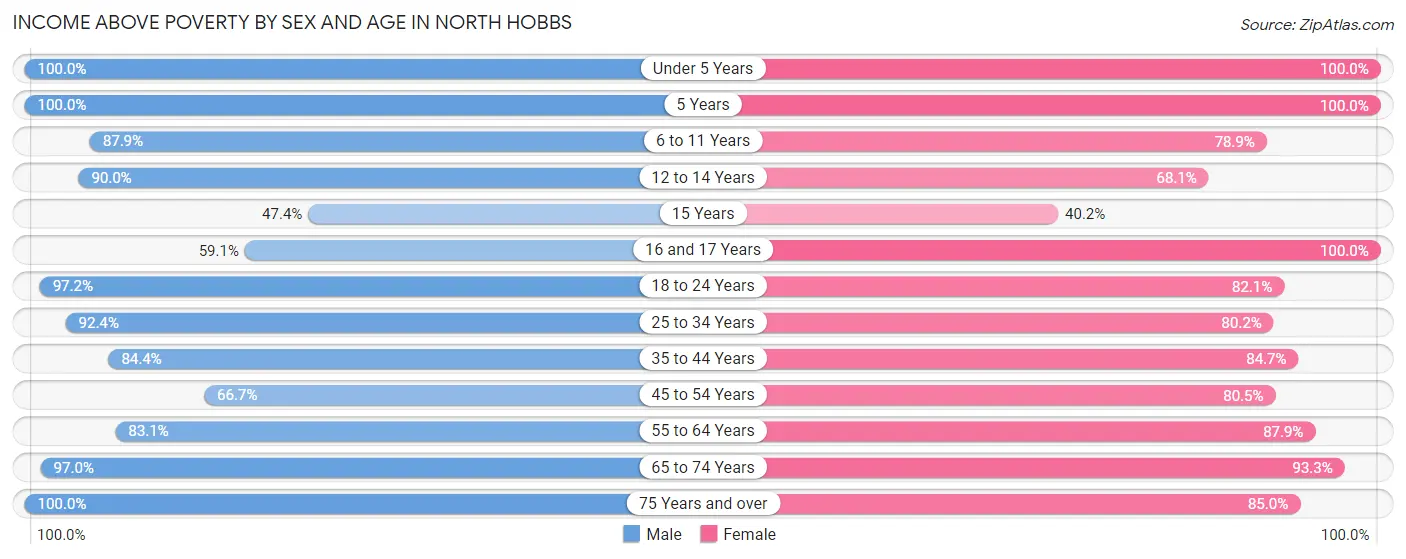
| Age Bracket | Male | Female |
| Under 5 Years | 158 (100.0%) | 108 (100.0%) |
| 5 Years | 68 (100.0%) | 73 (100.0%) |
| 6 to 11 Years | 290 (87.9%) | 138 (78.9%) |
| 12 to 14 Years | 144 (90.0%) | 96 (68.1%) |
| 15 Years | 9 (47.4%) | 55 (40.2%) |
| 16 and 17 Years | 55 (59.1%) | 89 (100.0%) |
| 18 to 24 Years | 241 (97.2%) | 229 (82.1%) |
| 25 to 34 Years | 388 (92.4%) | 210 (80.1%) |
| 35 to 44 Years | 244 (84.4%) | 411 (84.7%) |
| 45 to 54 Years | 260 (66.7%) | 317 (80.5%) |
| 55 to 64 Years | 360 (83.1%) | 340 (87.9%) |
| 65 to 74 Years | 195 (97.0%) | 223 (93.3%) |
| 75 Years and over | 99 (100.0%) | 108 (85.0%) |
| Total | 2,511 (86.4%) | 2,397 (82.8%) |
Income Below Poverty Among Married-Couple Families in North Hobbs
The poverty statistics for married-couple families in North Hobbs show that 9.5% or 107 of the total 1,126 families live below the poverty line. Families with 3 or 4 children have the highest poverty rate of 23.5%, comprising of 23 families. On the other hand, families with 5 or more children have the lowest poverty rate of 0.0%, which includes 0 families.
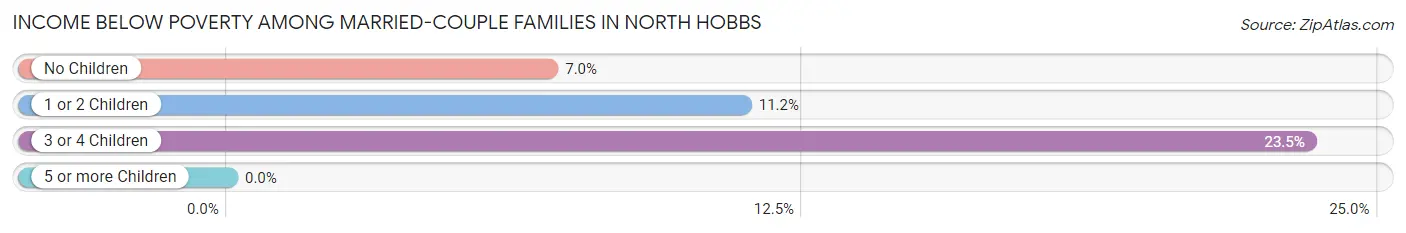
| Children | Above Poverty | Below Poverty |
| No Children | 641 (93.0%) | 48 (7.0%) |
| 1 or 2 Children | 286 (88.8%) | 36 (11.2%) |
| 3 or 4 Children | 75 (76.5%) | 23 (23.5%) |
| 5 or more Children | 17 (100.0%) | 0 (0.0%) |
| Total | 1,019 (90.5%) | 107 (9.5%) |
Income Below Poverty Among Single-Parent Households in North Hobbs
According to the poverty data in North Hobbs, 11.5% or 9 single-father households and 17.7% or 32 single-mother households are living below the poverty line. Among single-father households, those with 1 or 2 children have the highest poverty rate, with 9 households (19.6%) experiencing poverty. Likewise, among single-mother households, those with 1 or 2 children have the highest poverty rate, with 22 households (31.0%) falling below the poverty line.
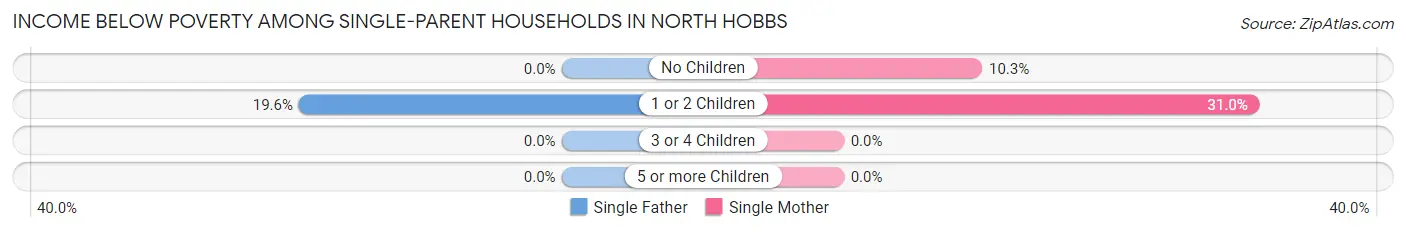
| Children | Single Father | Single Mother |
| No Children | 0 (0.0%) | 10 (10.3%) |
| 1 or 2 Children | 9 (19.6%) | 22 (31.0%) |
| 3 or 4 Children | 0 (0.0%) | 0 (0.0%) |
| 5 or more Children | 0 (0.0%) | 0 (0.0%) |
| Total | 9 (11.5%) | 32 (17.7%) |
Income Below Poverty Among Married-Couple vs Single-Parent Households in North Hobbs
The poverty data for North Hobbs shows that 107 of the married-couple family households (9.5%) and 41 of the single-parent households (15.8%) are living below the poverty level. Within the married-couple family households, those with 3 or 4 children have the highest poverty rate, with 23 households (23.5%) falling below the poverty line. Among the single-parent households, those with 1 or 2 children have the highest poverty rate, with 31 household (26.5%) living below poverty.
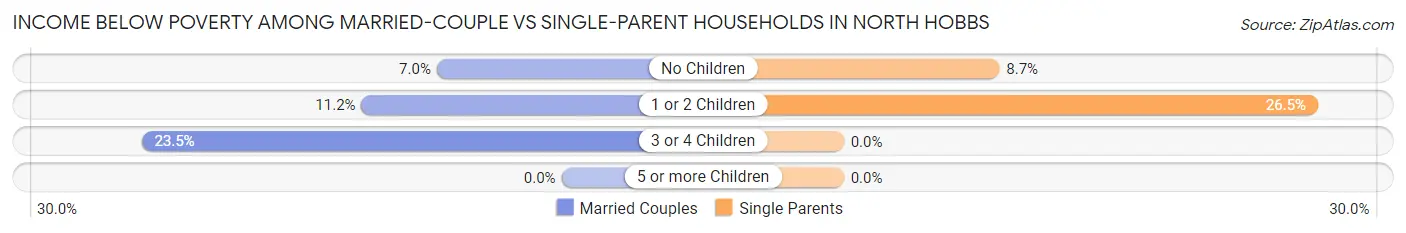
| Children | Married-Couple Families | Single-Parent Households |
| No Children | 48 (7.0%) | 10 (8.7%) |
| 1 or 2 Children | 36 (11.2%) | 31 (26.5%) |
| 3 or 4 Children | 23 (23.5%) | 0 (0.0%) |
| 5 or more Children | 0 (0.0%) | 0 (0.0%) |
| Total | 107 (9.5%) | 41 (15.8%) |
Race in North Hobbs
The most populous races in North Hobbs are White / Caucasian (4,428 | 75.5%), Hispanic or Latino (2,985 | 50.9%), and Two or more Races (965 | 16.5%).
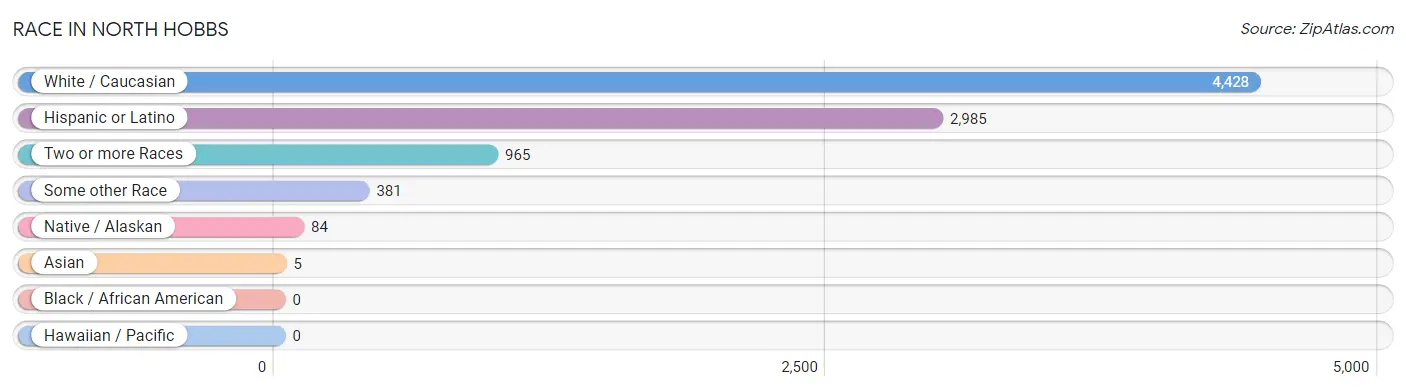
| Race | # Population | % Population |
| Asian | 5 | 0.1% |
| Black / African American | 0 | 0.0% |
| Hawaiian / Pacific | 0 | 0.0% |
| Hispanic or Latino | 2,985 | 50.9% |
| Native / Alaskan | 84 | 1.4% |
| White / Caucasian | 4,428 | 75.5% |
| Two or more Races | 965 | 16.5% |
| Some other Race | 381 | 6.5% |
| Total | 5,863 | 100.0% |
Ancestry in North Hobbs
The most populous ancestries reported in North Hobbs are Mexican (2,381 | 40.6%), American (745 | 12.7%), English (480 | 8.2%), Irish (411 | 7.0%), and German (294 | 5.0%), together accounting for 73.5% of all North Hobbs residents.
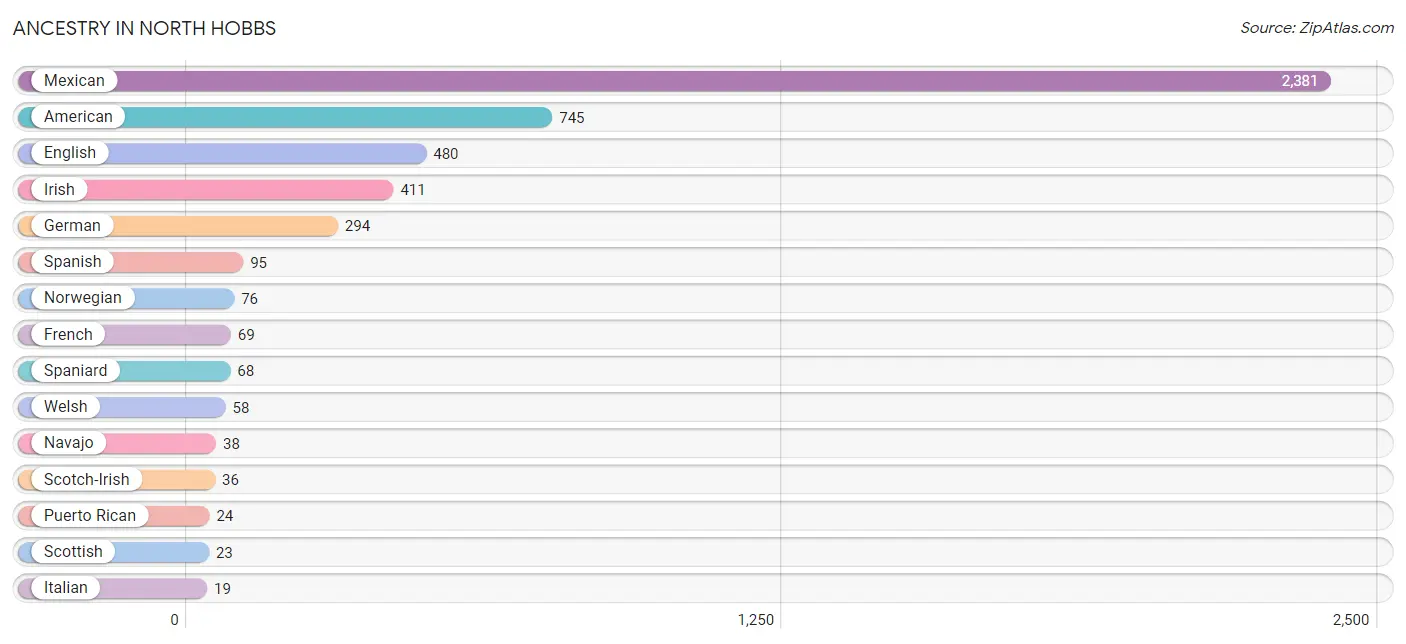
| Ancestry | # Population | % Population |
| American | 745 | 12.7% |
| Arab | 14 | 0.2% |
| Bhutanese | 5 | 0.1% |
| British | 14 | 0.2% |
| Central American | 16 | 0.3% |
| Central American Indian | 16 | 0.3% |
| Cherokee | 13 | 0.2% |
| Cuban | 10 | 0.2% |
| Dominican | 3 | 0.1% |
| Dutch | 12 | 0.2% |
| Dutch West Indian | 15 | 0.3% |
| English | 480 | 8.2% |
| European | 18 | 0.3% |
| French | 69 | 1.2% |
| German | 294 | 5.0% |
| Guatemalan | 16 | 0.3% |
| Irish | 411 | 7.0% |
| Italian | 19 | 0.3% |
| Jordanian | 14 | 0.2% |
| Mexican | 2,381 | 40.6% |
| Navajo | 38 | 0.6% |
| Norwegian | 76 | 1.3% |
| Puerto Rican | 24 | 0.4% |
| Russian | 6 | 0.1% |
| Scandinavian | 16 | 0.3% |
| Scotch-Irish | 36 | 0.6% |
| Scottish | 23 | 0.4% |
| Spaniard | 68 | 1.2% |
| Spanish | 95 | 1.6% |
| Swiss | 3 | 0.1% |
| Welsh | 58 | 1.0% | View All 31 Rows |
Immigrants in North Hobbs
The most numerous immigrant groups reported in North Hobbs came from Latin America (790 | 13.5%), Central America (787 | 13.4%), Mexico (771 | 13.2%), Canada (34 | 0.6%), and Guatemala (16 | 0.3%), together accounting for 40.9% of all North Hobbs residents.
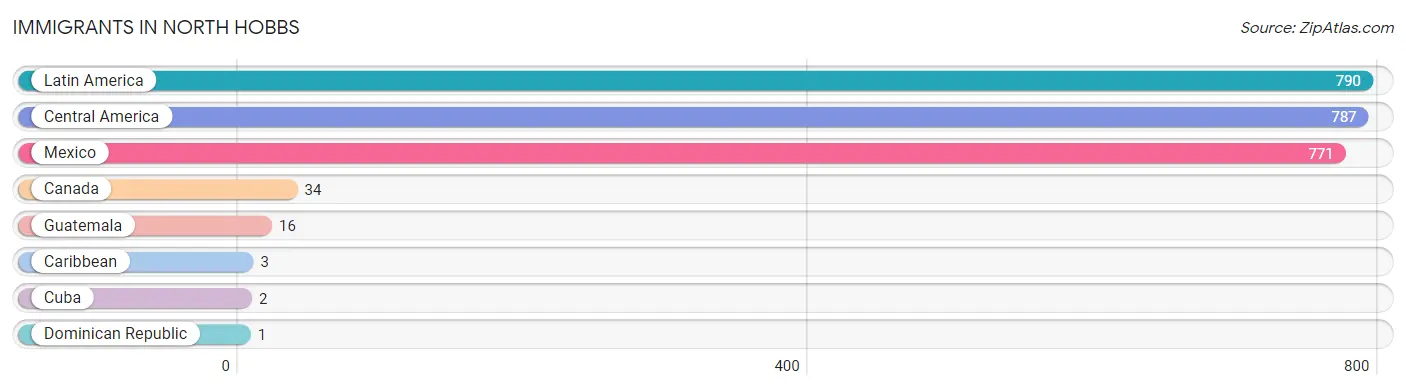
| Immigration Origin | # Population | % Population |
| Canada | 34 | 0.6% |
| Caribbean | 3 | 0.1% |
| Central America | 787 | 13.4% |
| Cuba | 2 | 0.0% |
| Dominican Republic | 1 | 0.0% |
| Guatemala | 16 | 0.3% |
| Latin America | 790 | 13.5% |
| Mexico | 771 | 13.2% | View All 8 Rows |
Sex and Age in North Hobbs
Sex and Age in North Hobbs
The most populous age groups in North Hobbs are 30 to 34 Years (303 | 10.4%) for men and 35 to 39 Years (347 | 11.7%) for women.
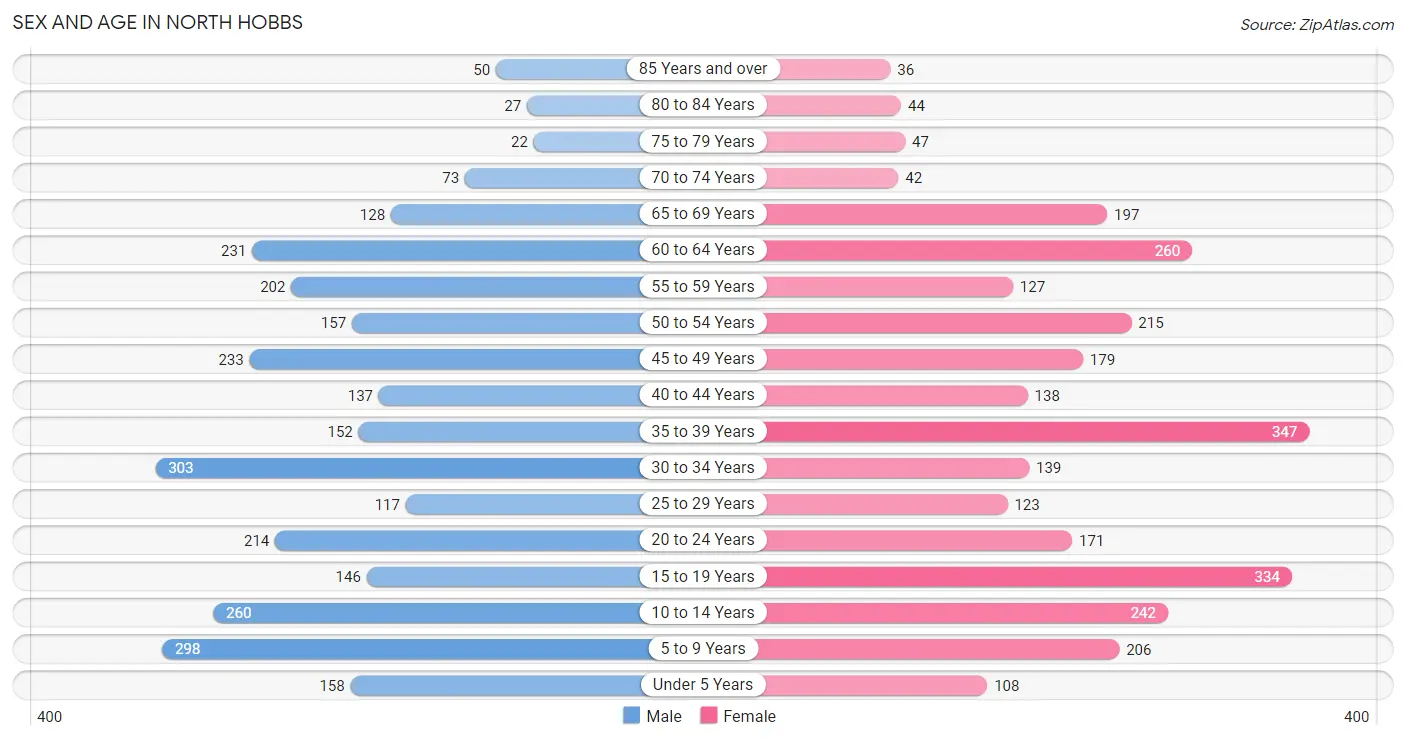
| Age Bracket | Male | Female |
| Under 5 Years | 158 (5.4%) | 108 (3.6%) |
| 5 to 9 Years | 298 (10.2%) | 206 (7.0%) |
| 10 to 14 Years | 260 (8.9%) | 242 (8.2%) |
| 15 to 19 Years | 146 (5.0%) | 334 (11.3%) |
| 20 to 24 Years | 214 (7.4%) | 171 (5.8%) |
| 25 to 29 Years | 117 (4.0%) | 123 (4.2%) |
| 30 to 34 Years | 303 (10.4%) | 139 (4.7%) |
| 35 to 39 Years | 152 (5.2%) | 347 (11.7%) |
| 40 to 44 Years | 137 (4.7%) | 138 (4.7%) |
| 45 to 49 Years | 233 (8.0%) | 179 (6.1%) |
| 50 to 54 Years | 157 (5.4%) | 215 (7.3%) |
| 55 to 59 Years | 202 (7.0%) | 127 (4.3%) |
| 60 to 64 Years | 231 (7.9%) | 260 (8.8%) |
| 65 to 69 Years | 128 (4.4%) | 197 (6.7%) |
| 70 to 74 Years | 73 (2.5%) | 42 (1.4%) |
| 75 to 79 Years | 22 (0.8%) | 47 (1.6%) |
| 80 to 84 Years | 27 (0.9%) | 44 (1.5%) |
| 85 Years and over | 50 (1.7%) | 36 (1.2%) |
| Total | 2,908 (100.0%) | 2,955 (100.0%) |
Families and Households in North Hobbs
Median Family Size in North Hobbs
The median family size in North Hobbs is 3.57 persons per family, with single male/father families (78 | 5.6%) accounting for the largest median family size of 4.73 persons per family. On the other hand, married-couple families (1,126 | 81.3%) represent the smallest median family size with 3.49 persons per family.
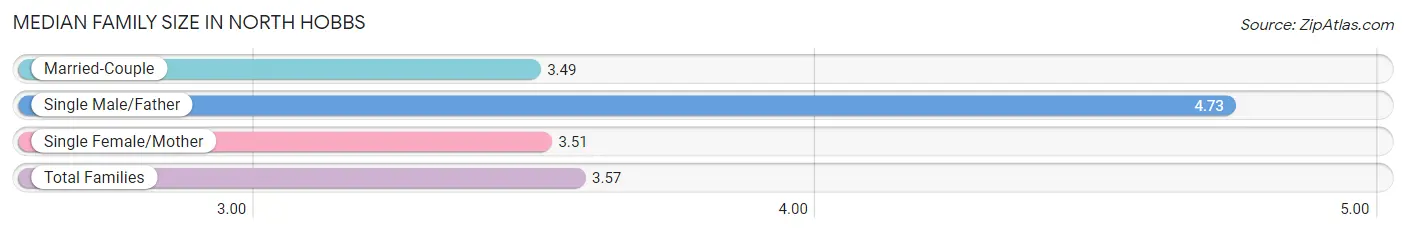
| Family Type | # Families | Family Size |
| Married-Couple | 1,126 (81.3%) | 3.49 |
| Single Male/Father | 78 (5.6%) | 4.73 |
| Single Female/Mother | 181 (13.1%) | 3.51 |
| Total Families | 1,385 (100.0%) | 3.57 |
Median Household Size in North Hobbs
The median household size in North Hobbs is 3.06 persons per household, with single male/father households (78 | 4.1%) accounting for the largest median household size of 5.87 persons per household. non-family households (530 | 27.7%) represent the smallest median household size with 1.50 persons per household.
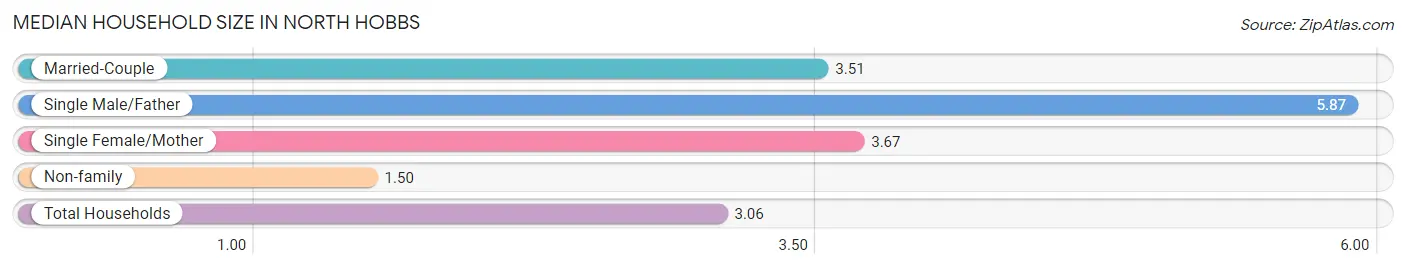
| Household Type | # Households | Household Size |
| Married-Couple | 1,126 (58.8%) | 3.51 |
| Single Male/Father | 78 (4.1%) | 5.87 |
| Single Female/Mother | 181 (9.5%) | 3.67 |
| Non-family | 530 (27.7%) | 1.50 |
| Total Households | 1,915 (100.0%) | 3.06 |
Household Size by Marriage Status in North Hobbs
Out of a total of 1,915 households in North Hobbs, 1,385 (72.3%) are family households, while 530 (27.7%) are nonfamily households. The most numerous type of family households are 2-person households, comprising 719, and the most common type of nonfamily households are 1-person households, comprising 405.
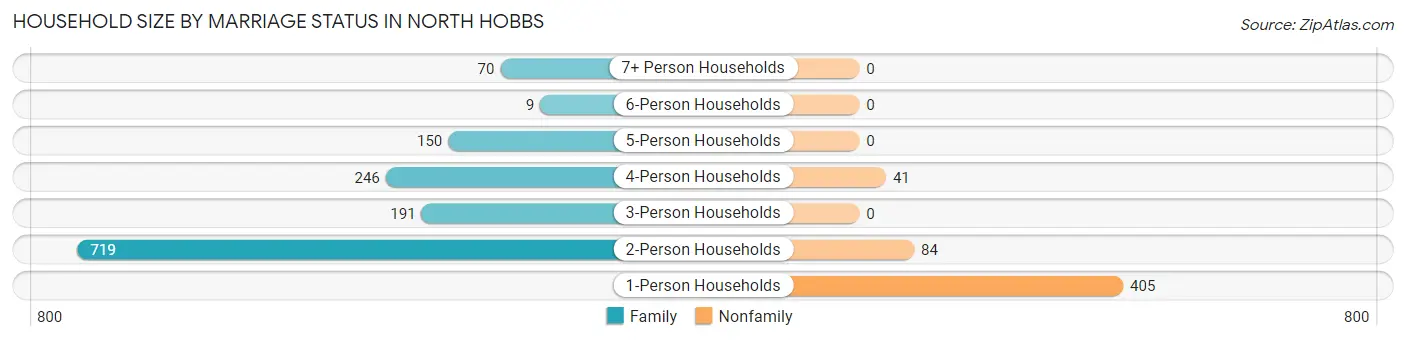
| Household Size | Family Households | Nonfamily Households |
| 1-Person Households | - | 405 (21.1%) |
| 2-Person Households | 719 (37.6%) | 84 (4.4%) |
| 3-Person Households | 191 (10.0%) | 0 (0.0%) |
| 4-Person Households | 246 (12.9%) | 41 (2.1%) |
| 5-Person Households | 150 (7.8%) | 0 (0.0%) |
| 6-Person Households | 9 (0.5%) | 0 (0.0%) |
| 7+ Person Households | 70 (3.7%) | 0 (0.0%) |
| Total | 1,385 (72.3%) | 530 (27.7%) |
Female Fertility in North Hobbs
Fertility by Age in North Hobbs
Average fertility rate in North Hobbs is 84.0 births per 1,000 women. Women in the age bracket of 20 to 34 years have the highest fertility rate with 109.0 births per 1,000 women. Women in the age bracket of 20 to 34 years acount for 38.2% of all women with births.
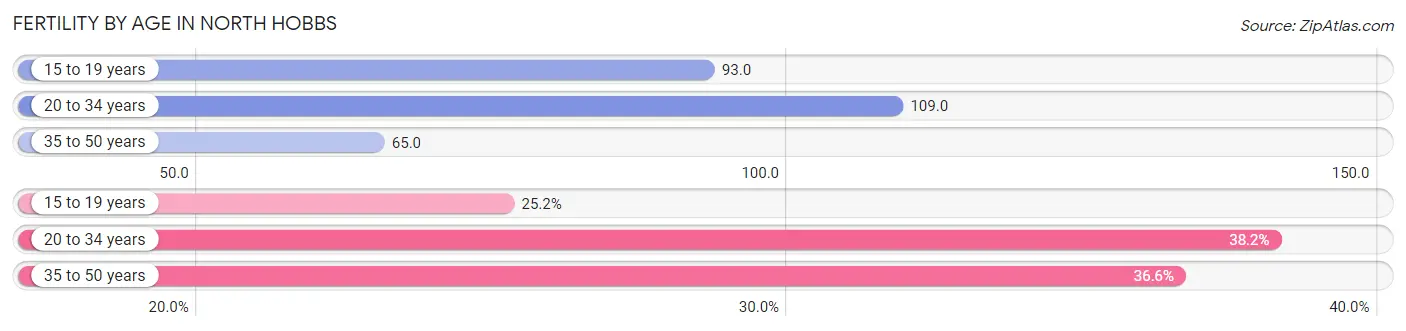
| Age Bracket | Women with Births | Births / 1,000 Women |
| 15 to 19 years | 31 (25.2%) | 93.0 |
| 20 to 34 years | 47 (38.2%) | 109.0 |
| 35 to 50 years | 45 (36.6%) | 65.0 |
| Total | 123 (100.0%) | 84.0 |
Fertility by Age by Marriage Status in North Hobbs
55.3% of women with births (123) in North Hobbs are married. The highest percentage of unmarried women with births falls into 35 to 50 years age bracket with 62.2% of them unmarried at the time of birth, while the lowest percentage of unmarried women with births belong to 15 to 19 years age bracket with 0.0% of them unmarried.
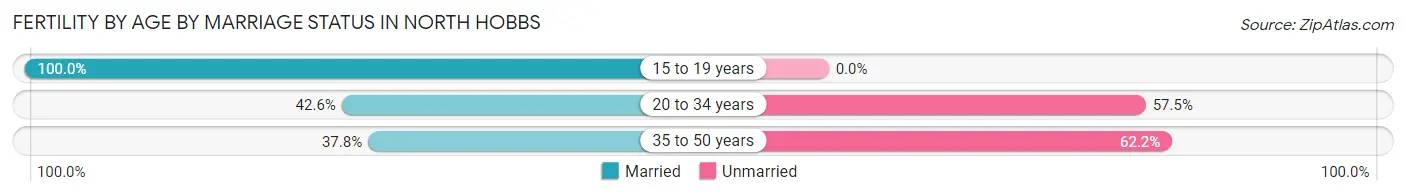
| Age Bracket | Married | Unmarried |
| 15 to 19 years | 31 (100.0%) | 0 (0.0%) |
| 20 to 34 years | 20 (42.5%) | 27 (57.5%) |
| 35 to 50 years | 17 (37.8%) | 28 (62.2%) |
| Total | 68 (55.3%) | 55 (44.7%) |
Fertility by Education in North Hobbs
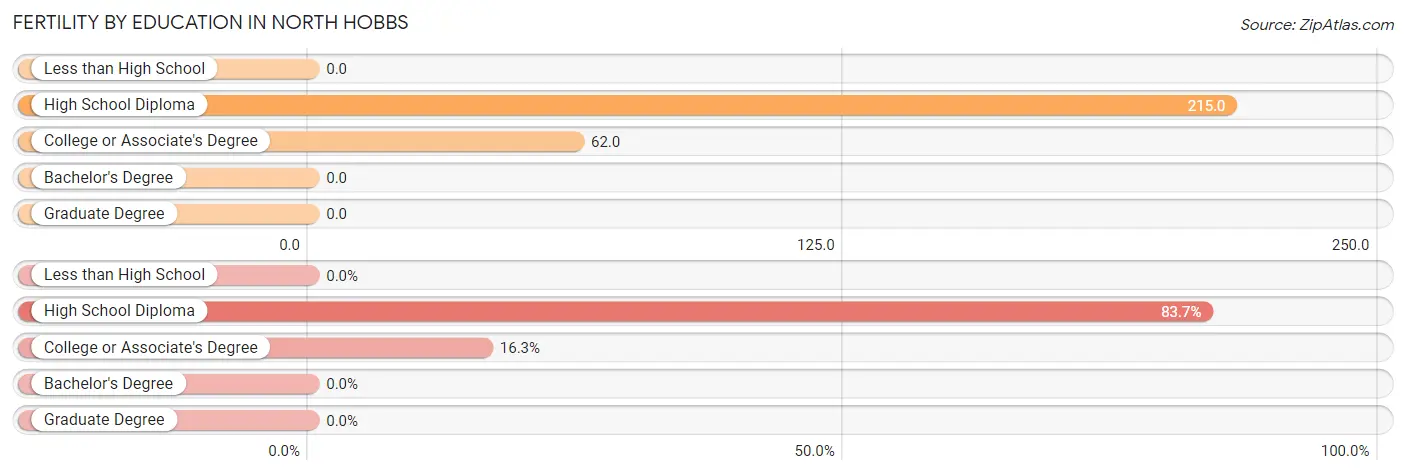
| Educational Attainment | Women with Births | Births / 1,000 Women |
| Less than High School | 0 (0.0%) | 0.0 |
| High School Diploma | 103 (83.7%) | 215.0 |
| College or Associate's Degree | 20 (16.3%) | 62.0 |
| Bachelor's Degree | 0 (0.0%) | 0.0 |
| Graduate Degree | 0 (0.0%) | 0.0 |
| Total | 123 (100.0%) | 84.0 |
Fertility by Education by Marriage Status in North Hobbs
44.7% of women with births in North Hobbs are unmarried. Women with the educational attainment of college or associate's degree are most likely to be married with 100.0% of them married at childbirth, while women with the educational attainment of high school diploma are least likely to be married with 53.4% of them unmarried at childbirth.
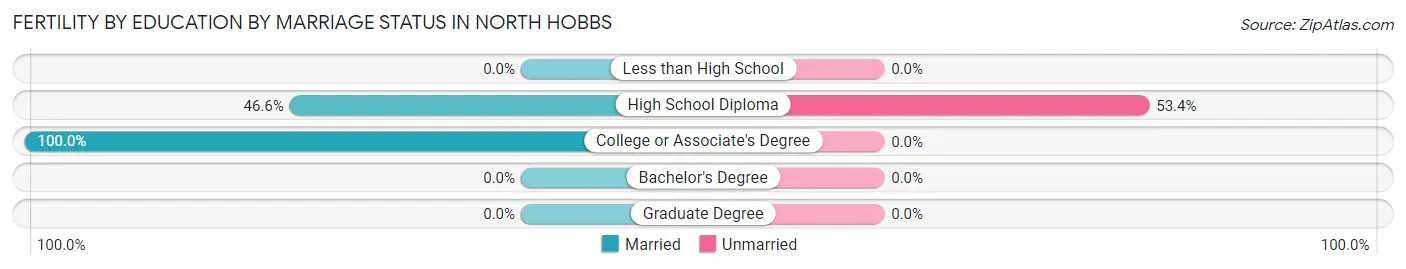
| Educational Attainment | Married | Unmarried |
| Less than High School | 0 (0.0%) | 0 (0.0%) |
| High School Diploma | 48 (46.6%) | 55 (53.4%) |
| College or Associate's Degree | 20 (100.0%) | 0 (0.0%) |
| Bachelor's Degree | 0 (0.0%) | 0 (0.0%) |
| Graduate Degree | 0 (0.0%) | 0 (0.0%) |
| Total | 68 (55.3%) | 55 (44.7%) |
Employment Characteristics in North Hobbs
Employment by Class of Employer in North Hobbs
Among the 2,311 employed individuals in North Hobbs, private company employees (1,602 | 69.3%), local government employees (259 | 11.2%), and self-employed (not incorporated) (204 | 8.8%) make up the most common classes of employment.
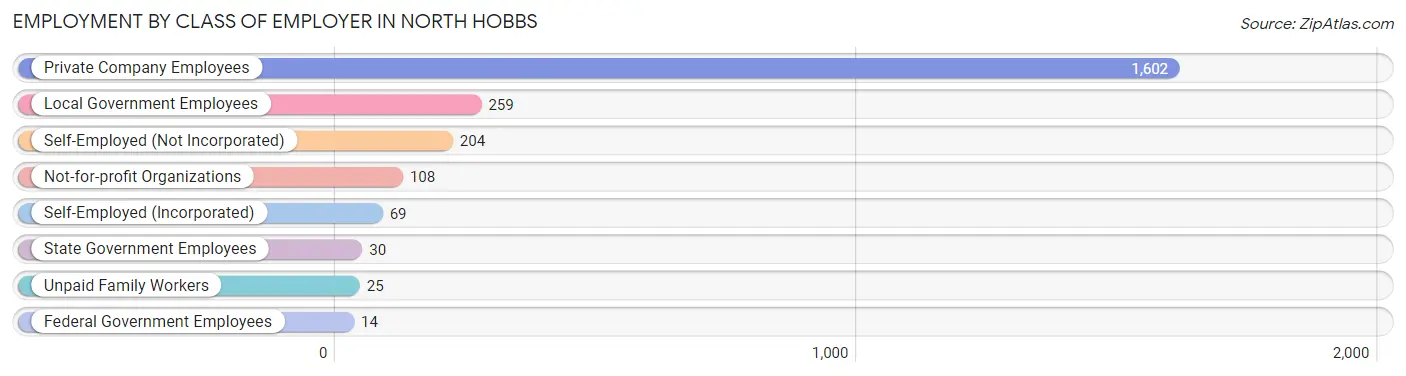
| Employer Class | # Employees | % Employees |
| Private Company Employees | 1,602 | 69.3% |
| Self-Employed (Incorporated) | 69 | 3.0% |
| Self-Employed (Not Incorporated) | 204 | 8.8% |
| Not-for-profit Organizations | 108 | 4.7% |
| Local Government Employees | 259 | 11.2% |
| State Government Employees | 30 | 1.3% |
| Federal Government Employees | 14 | 0.6% |
| Unpaid Family Workers | 25 | 1.1% |
| Total | 2,311 | 100.0% |
Employment Status by Age in North Hobbs
According to the labor force statistics for North Hobbs, out of the total population over 16 years of age (4,435), 60.0% or 2,661 individuals are in the labor force, with 11.3% or 301 of them unemployed. The age group with the highest labor force participation rate is 30 to 34 years, with 80.8% or 357 individuals in the labor force. Within the labor force, the 16 to 19 years age range has the highest percentage of unemployed individuals, with 65.9% or 85 of them being unemployed.
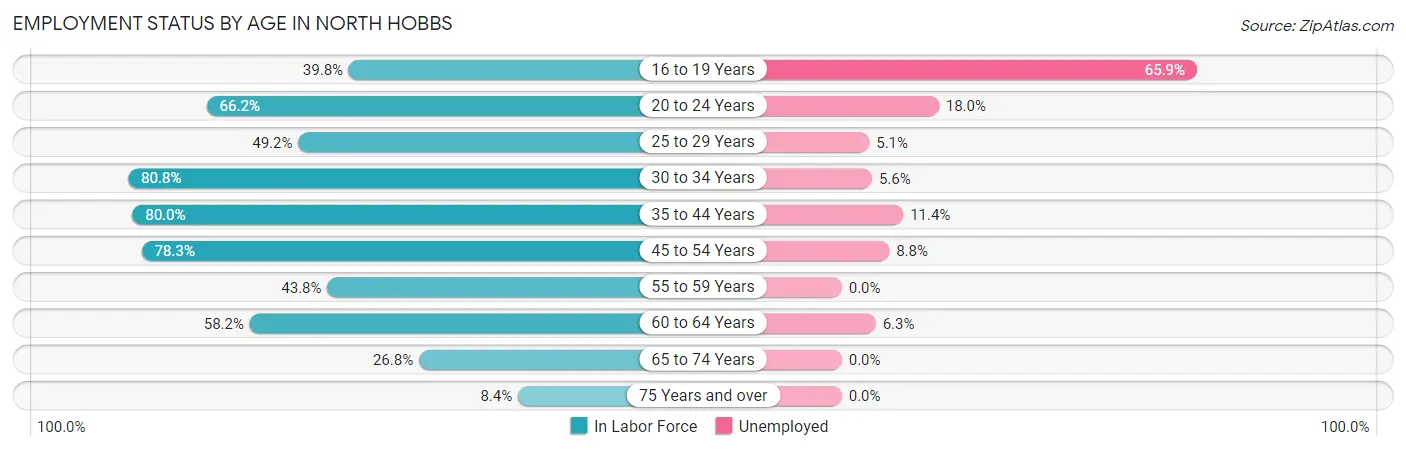
| Age Bracket | In Labor Force | Unemployed |
| 16 to 19 Years | 129 (39.8%) | 85 (65.9%) |
| 20 to 24 Years | 255 (66.2%) | 46 (18.0%) |
| 25 to 29 Years | 118 (49.2%) | 6 (5.1%) |
| 30 to 34 Years | 357 (80.8%) | 20 (5.6%) |
| 35 to 44 Years | 619 (80.0%) | 71 (11.4%) |
| 45 to 54 Years | 614 (78.3%) | 54 (8.8%) |
| 55 to 59 Years | 144 (43.8%) | 0 (0.0%) |
| 60 to 64 Years | 286 (58.2%) | 18 (6.3%) |
| 65 to 74 Years | 118 (26.8%) | 0 (0.0%) |
| 75 Years and over | 19 (8.4%) | 0 (0.0%) |
| Total | 2,661 (60.0%) | 301 (11.3%) |
Employment Status by Educational Attainment in North Hobbs
According to labor force statistics for North Hobbs, 69.9% of individuals (2,139) out of the total population between 25 and 64 years of age (3,060) are in the labor force, with 7.9% or 169 of them being unemployed. The group with the highest labor force participation rate are those with the educational attainment of college / associate degree, with 79.9% or 587 individuals in the labor force. Within the labor force, individuals with high school diploma education have the highest percentage of unemployment, with 13.1% or 111 of them being unemployed.
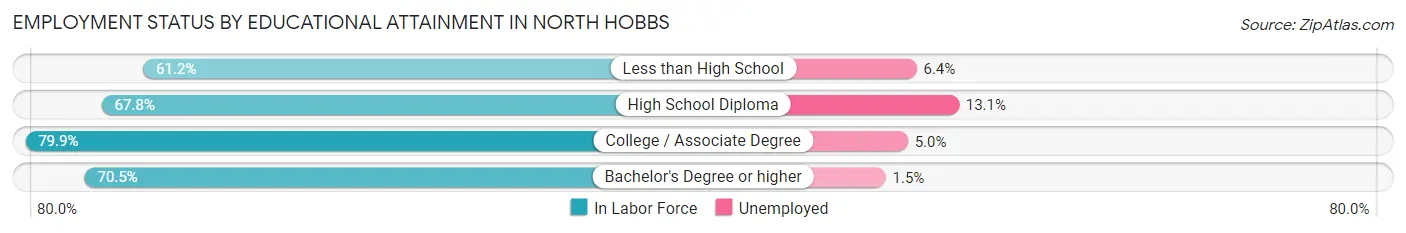
| Educational Attainment | In Labor Force | Unemployed |
| Less than High School | 359 (61.2%) | 38 (6.4%) |
| High School Diploma | 850 (67.8%) | 164 (13.1%) |
| College / Associate Degree | 587 (79.9%) | 37 (5.0%) |
| Bachelor's Degree or higher | 342 (70.5%) | 7 (1.5%) |
| Total | 2,139 (69.9%) | 242 (7.9%) |
Employment Occupations by Sex in North Hobbs
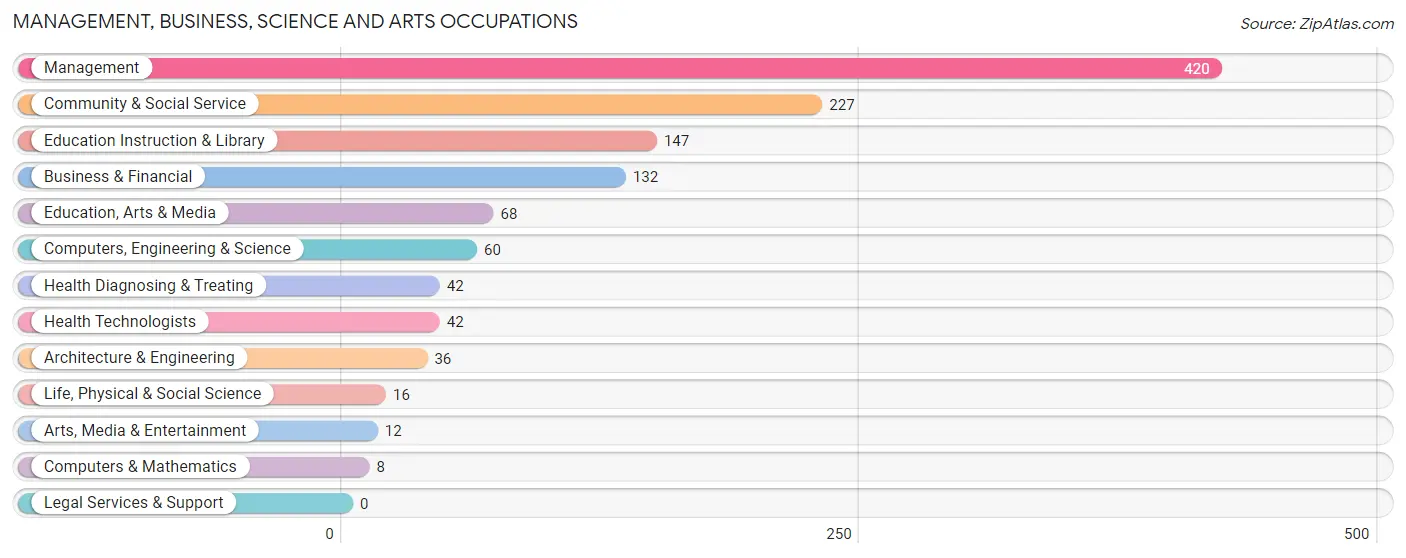
Management, Business, Science and Arts Occupations
The most common Management, Business, Science and Arts occupations in North Hobbs are Management (420 | 17.8%), Community & Social Service (227 | 9.6%), Education Instruction & Library (147 | 6.2%), Business & Financial (132 | 5.6%), and Education, Arts & Media (68 | 2.9%).
Management, Business, Science and Arts Occupations by Sex
Within the Management, Business, Science and Arts occupations in North Hobbs, the most male-oriented occupations are Architecture & Engineering (100.0%), Life, Physical & Social Science (100.0%), and Arts, Media & Entertainment (100.0%), while the most female-oriented occupations are Computers & Mathematics (100.0%), Education Instruction & Library (95.2%), and Community & Social Service (84.1%).
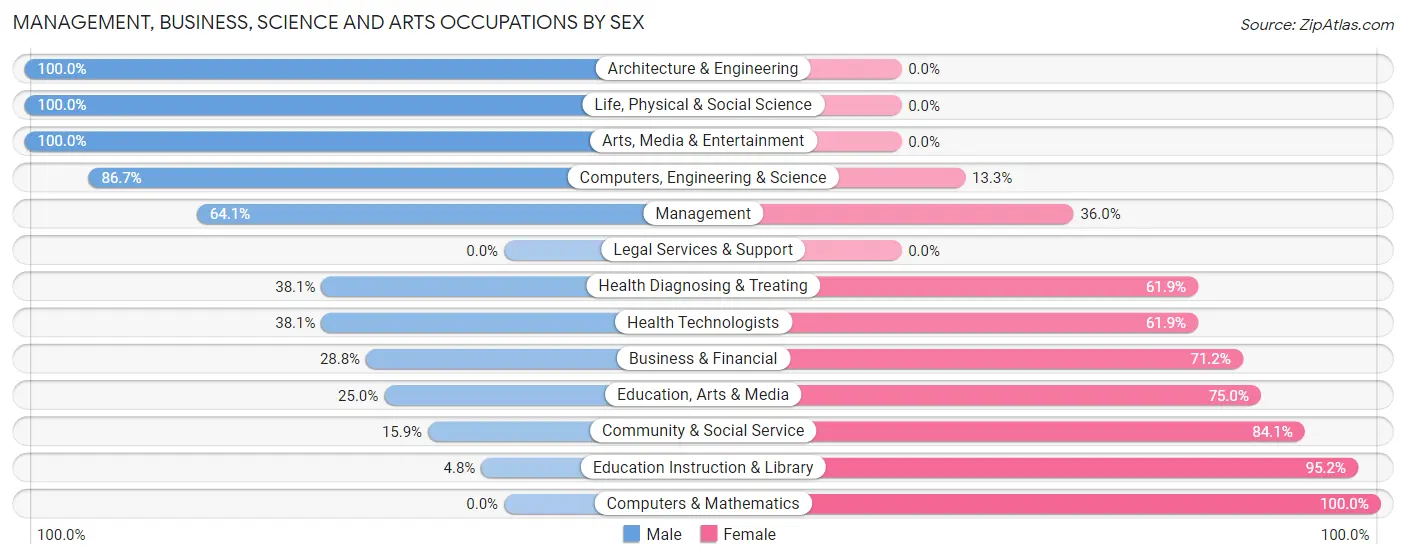
| Occupation | Male | Female |
| Management | 269 (64.0%) | 151 (35.9%) |
| Business & Financial | 38 (28.8%) | 94 (71.2%) |
| Computers, Engineering & Science | 52 (86.7%) | 8 (13.3%) |
| Computers & Mathematics | 0 (0.0%) | 8 (100.0%) |
| Architecture & Engineering | 36 (100.0%) | 0 (0.0%) |
| Life, Physical & Social Science | 16 (100.0%) | 0 (0.0%) |
| Community & Social Service | 36 (15.9%) | 191 (84.1%) |
| Education, Arts & Media | 17 (25.0%) | 51 (75.0%) |
| Legal Services & Support | 0 (0.0%) | 0 (0.0%) |
| Education Instruction & Library | 7 (4.8%) | 140 (95.2%) |
| Arts, Media & Entertainment | 12 (100.0%) | 0 (0.0%) |
| Health Diagnosing & Treating | 16 (38.1%) | 26 (61.9%) |
| Health Technologists | 16 (38.1%) | 26 (61.9%) |
| Total (Category) | 411 (46.7%) | 470 (53.3%) |
| Total (Overall) | 1,289 (54.8%) | 1,065 (45.2%) |
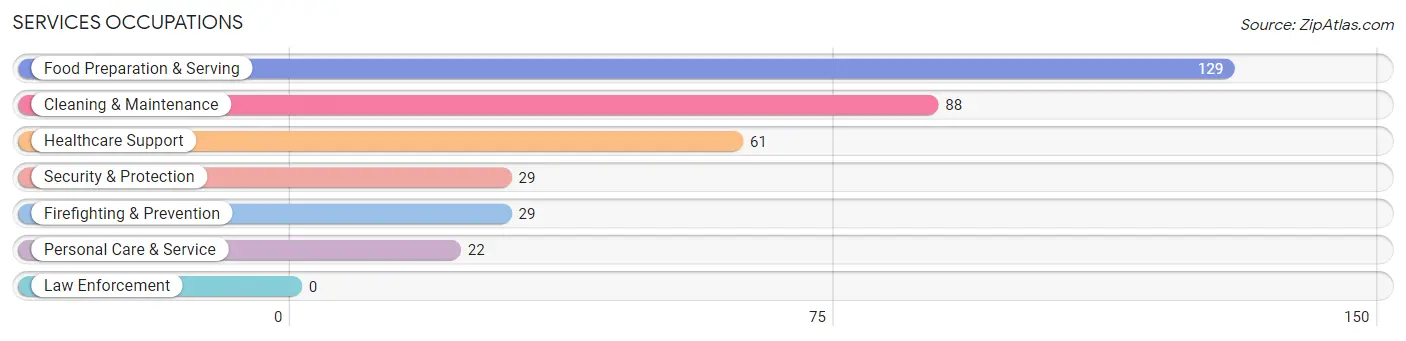
Services Occupations
The most common Services occupations in North Hobbs are Food Preparation & Serving (129 | 5.5%), Cleaning & Maintenance (88 | 3.7%), Healthcare Support (61 | 2.6%), Security & Protection (29 | 1.2%), and Firefighting & Prevention (29 | 1.2%).
Services Occupations by Sex
Within the Services occupations in North Hobbs, the most male-oriented occupations are Food Preparation & Serving (58.9%), Healthcare Support (16.4%), and Security & Protection (13.8%), while the most female-oriented occupations are Cleaning & Maintenance (100.0%), Personal Care & Service (100.0%), and Security & Protection (86.2%).
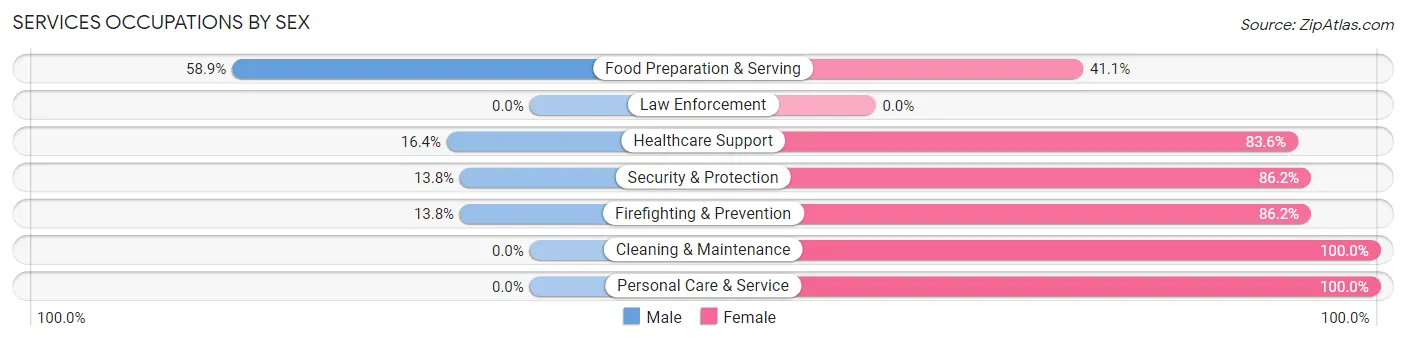
| Occupation | Male | Female |
| Healthcare Support | 10 (16.4%) | 51 (83.6%) |
| Security & Protection | 4 (13.8%) | 25 (86.2%) |
| Firefighting & Prevention | 4 (13.8%) | 25 (86.2%) |
| Law Enforcement | 0 (0.0%) | 0 (0.0%) |
| Food Preparation & Serving | 76 (58.9%) | 53 (41.1%) |
| Cleaning & Maintenance | 0 (0.0%) | 88 (100.0%) |
| Personal Care & Service | 0 (0.0%) | 22 (100.0%) |
| Total (Category) | 90 (27.4%) | 239 (72.6%) |
| Total (Overall) | 1,289 (54.8%) | 1,065 (45.2%) |
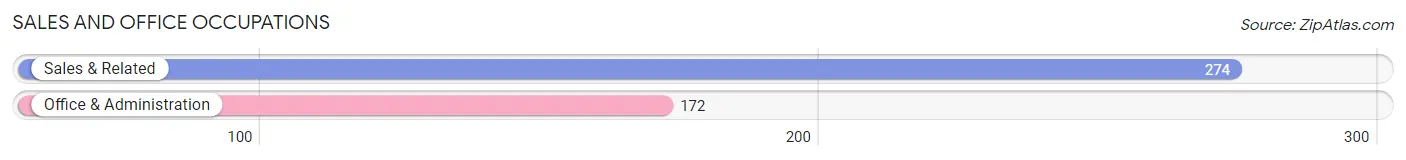
Sales and Office Occupations
The most common Sales and Office occupations in North Hobbs are Sales & Related (274 | 11.6%), and Office & Administration (172 | 7.3%).
Sales and Office Occupations by Sex
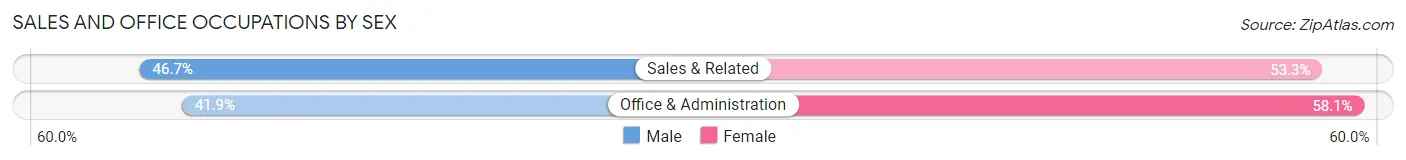
| Occupation | Male | Female |
| Sales & Related | 128 (46.7%) | 146 (53.3%) |
| Office & Administration | 72 (41.9%) | 100 (58.1%) |
| Total (Category) | 200 (44.8%) | 246 (55.2%) |
| Total (Overall) | 1,289 (54.8%) | 1,065 (45.2%) |
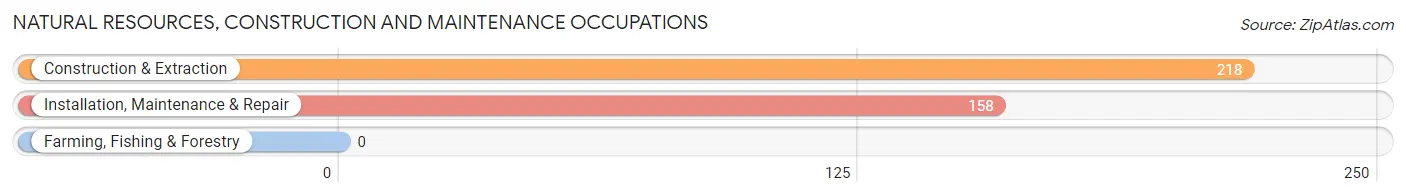
Natural Resources, Construction and Maintenance Occupations
The most common Natural Resources, Construction and Maintenance occupations in North Hobbs are Construction & Extraction (218 | 9.3%), and Installation, Maintenance & Repair (158 | 6.7%).
Natural Resources, Construction and Maintenance Occupations by Sex
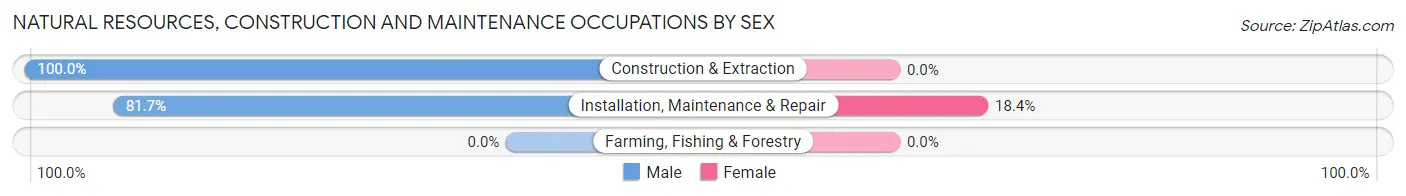
| Occupation | Male | Female |
| Farming, Fishing & Forestry | 0 (0.0%) | 0 (0.0%) |
| Construction & Extraction | 218 (100.0%) | 0 (0.0%) |
| Installation, Maintenance & Repair | 129 (81.7%) | 29 (18.3%) |
| Total (Category) | 347 (92.3%) | 29 (7.7%) |
| Total (Overall) | 1,289 (54.8%) | 1,065 (45.2%) |
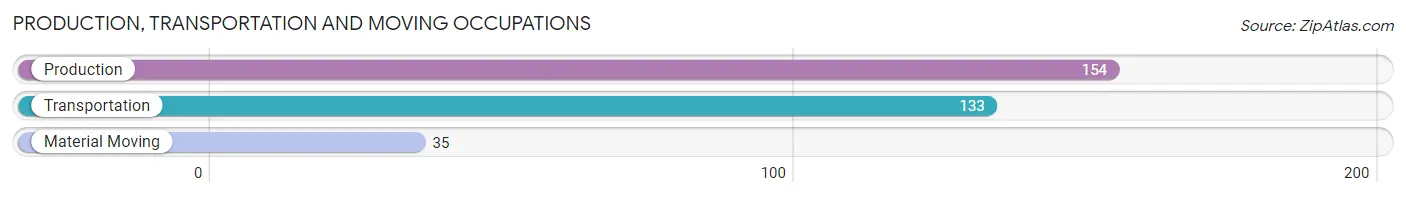
Production, Transportation and Moving Occupations
The most common Production, Transportation and Moving occupations in North Hobbs are Production (154 | 6.5%), Transportation (133 | 5.7%), and Material Moving (35 | 1.5%).
Production, Transportation and Moving Occupations by Sex
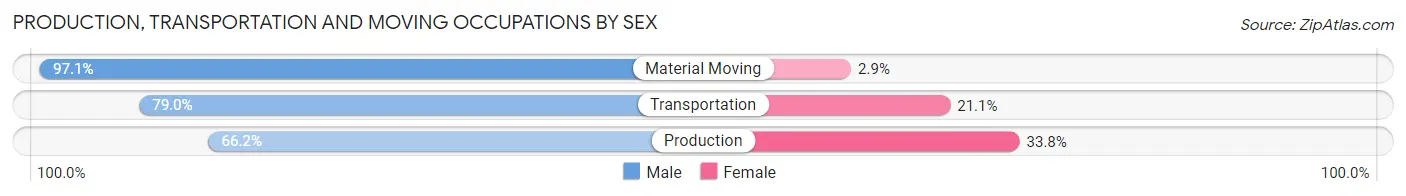
| Occupation | Male | Female |
| Production | 102 (66.2%) | 52 (33.8%) |
| Transportation | 105 (78.9%) | 28 (21.0%) |
| Material Moving | 34 (97.1%) | 1 (2.9%) |
| Total (Category) | 241 (74.8%) | 81 (25.2%) |
| Total (Overall) | 1,289 (54.8%) | 1,065 (45.2%) |
Employment Industries by Sex in North Hobbs
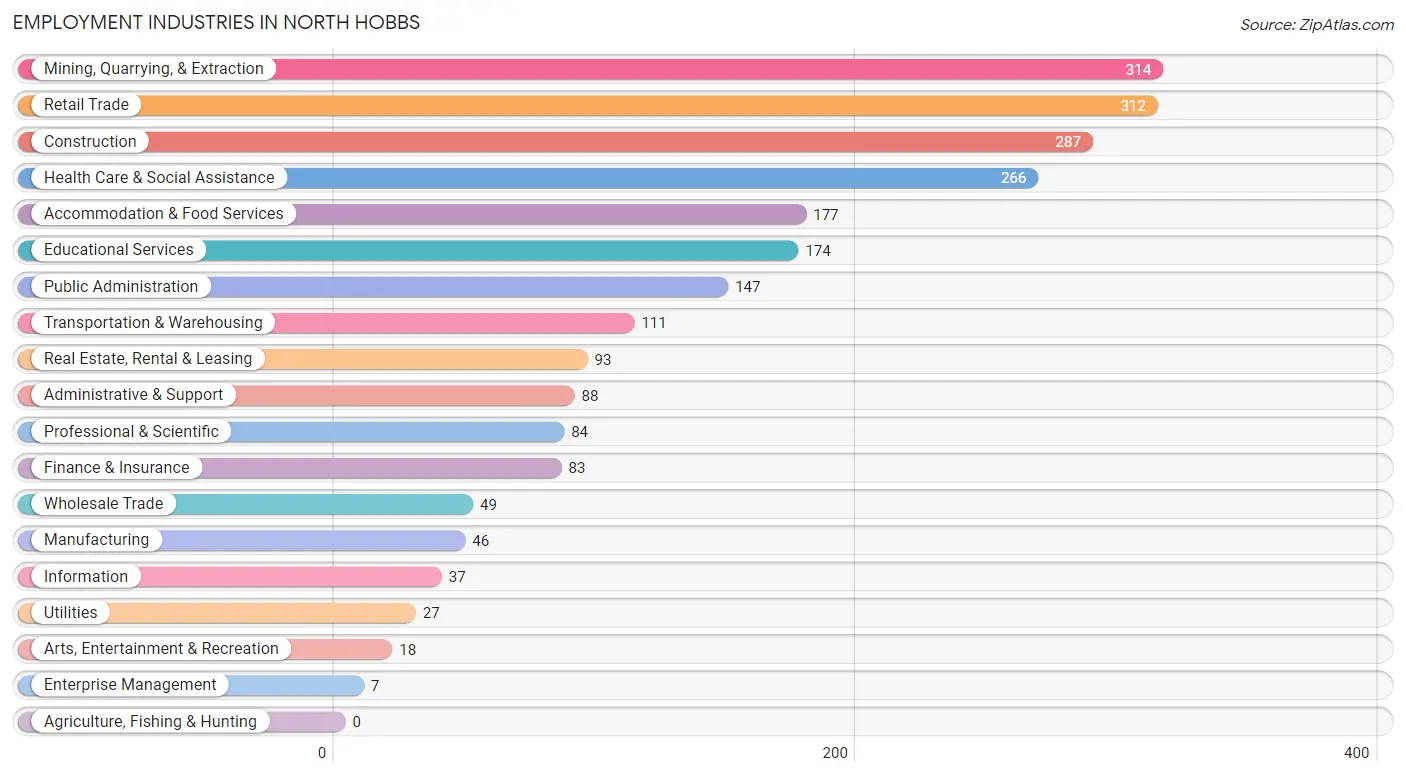
Employment Industries in North Hobbs
The major employment industries in North Hobbs include Mining, Quarrying, & Extraction (314 | 13.3%), Retail Trade (312 | 13.3%), Construction (287 | 12.2%), Health Care & Social Assistance (266 | 11.3%), and Accommodation & Food Services (177 | 7.5%).
Employment Industries by Sex in North Hobbs
The North Hobbs industries that see more men than women are Wholesale Trade (100.0%), Utilities (100.0%), and Construction (98.3%), whereas the industries that tend to have a higher number of women are Enterprise Management (100.0%), Educational Services (85.1%), and Information (83.8%).
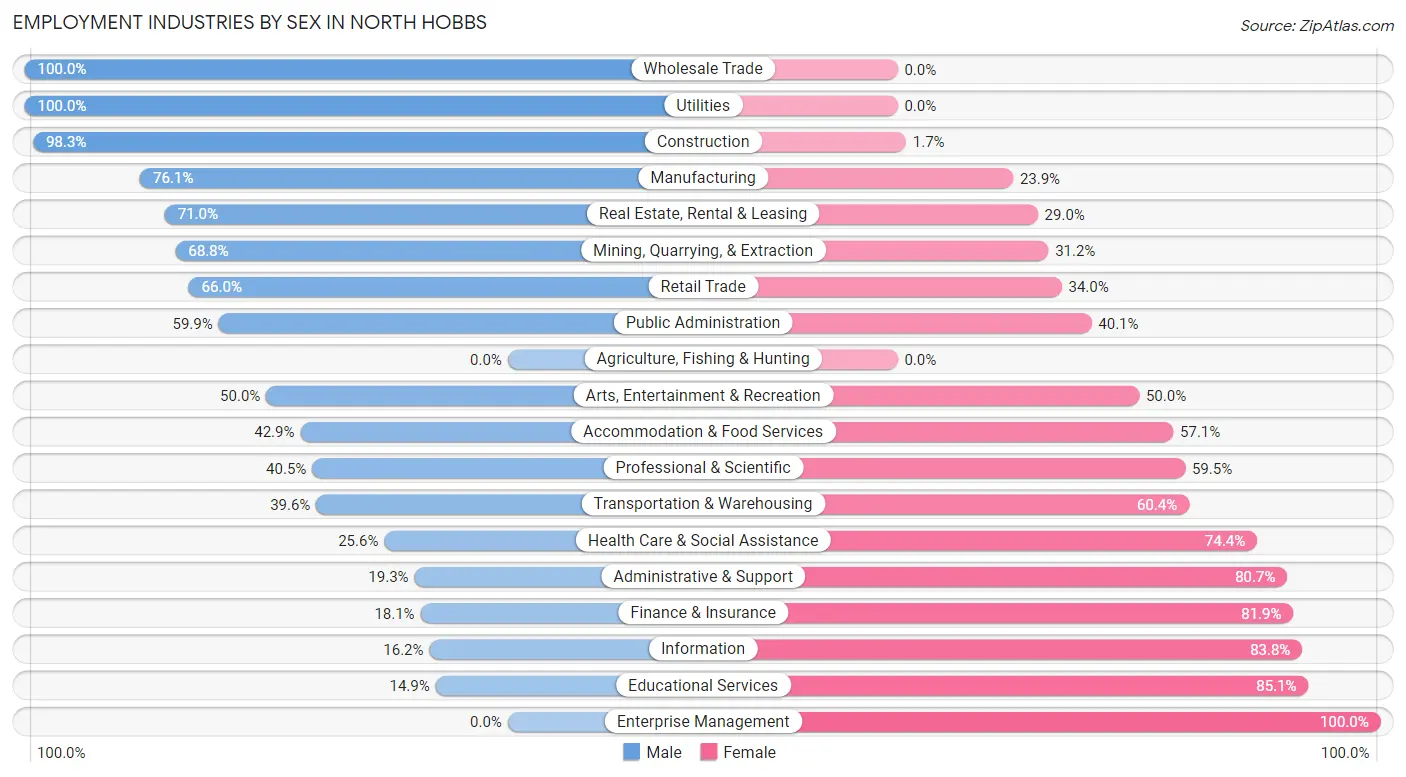
| Industry | Male | Female |
| Agriculture, Fishing & Hunting | 0 (0.0%) | 0 (0.0%) |
| Mining, Quarrying, & Extraction | 216 (68.8%) | 98 (31.2%) |
| Construction | 282 (98.3%) | 5 (1.7%) |
| Manufacturing | 35 (76.1%) | 11 (23.9%) |
| Wholesale Trade | 49 (100.0%) | 0 (0.0%) |
| Retail Trade | 206 (66.0%) | 106 (34.0%) |
| Transportation & Warehousing | 44 (39.6%) | 67 (60.4%) |
| Utilities | 27 (100.0%) | 0 (0.0%) |
| Information | 6 (16.2%) | 31 (83.8%) |
| Finance & Insurance | 15 (18.1%) | 68 (81.9%) |
| Real Estate, Rental & Leasing | 66 (71.0%) | 27 (29.0%) |
| Professional & Scientific | 34 (40.5%) | 50 (59.5%) |
| Enterprise Management | 0 (0.0%) | 7 (100.0%) |
| Administrative & Support | 17 (19.3%) | 71 (80.7%) |
| Educational Services | 26 (14.9%) | 148 (85.1%) |
| Health Care & Social Assistance | 68 (25.6%) | 198 (74.4%) |
| Arts, Entertainment & Recreation | 9 (50.0%) | 9 (50.0%) |
| Accommodation & Food Services | 76 (42.9%) | 101 (57.1%) |
| Public Administration | 88 (59.9%) | 59 (40.1%) |
| Total | 1,289 (54.8%) | 1,065 (45.2%) |
Education in North Hobbs
School Enrollment in North Hobbs
The most common levels of schooling among the 1,414 students in North Hobbs are high school (470 | 33.2%), middle school (403 | 28.5%), and elementary school (251 | 17.7%).
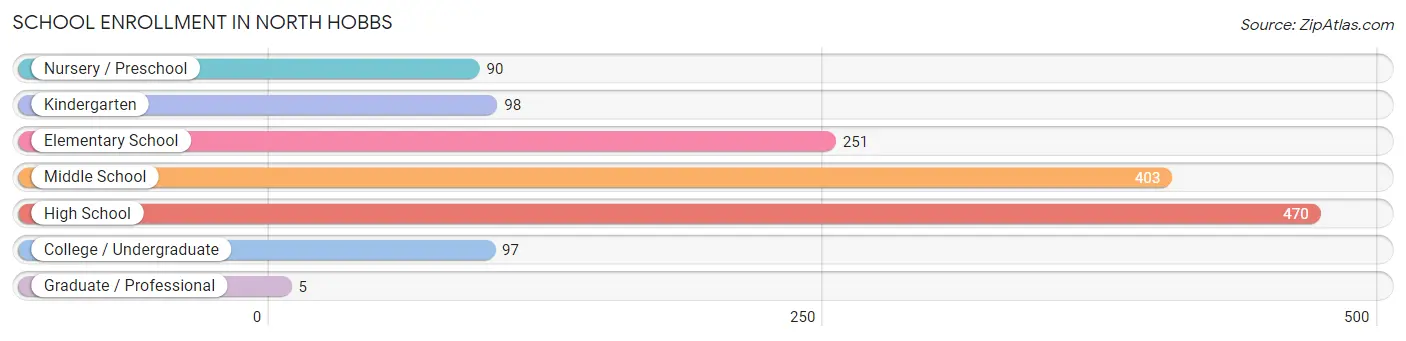
| School Level | # Students | % Students |
| Nursery / Preschool | 90 | 6.4% |
| Kindergarten | 98 | 6.9% |
| Elementary School | 251 | 17.7% |
| Middle School | 403 | 28.5% |
| High School | 470 | 33.2% |
| College / Undergraduate | 97 | 6.9% |
| Graduate / Professional | 5 | 0.4% |
| Total | 1,414 | 100.0% |
School Enrollment by Age by Funding Source in North Hobbs
Out of a total of 1,414 students who are enrolled in schools in North Hobbs, 351 (24.8%) attend a private institution, while the remaining 1,063 (75.2%) are enrolled in public schools. The age group of 20 to 24 year olds has the highest likelihood of being enrolled in private schools, with 63 (95.5% in the age bracket) enrolled. Conversely, the age group of 3 to 4 year olds has the lowest likelihood of being enrolled in a private school, with 62 (100.0% in the age bracket) attending a public institution.
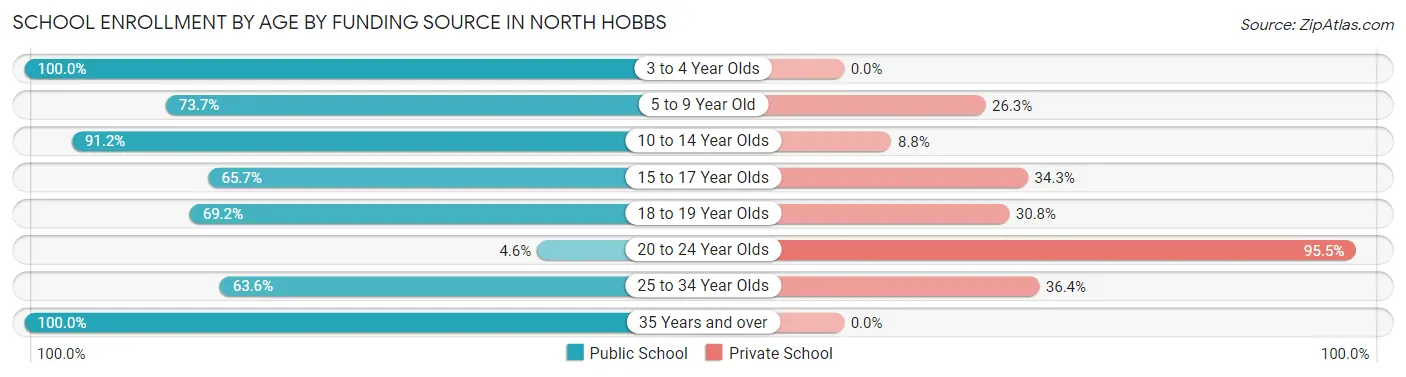
| Age Bracket | Public School | Private School |
| 3 to 4 Year Olds | 62 (100.0%) | 0 (0.0%) |
| 5 to 9 Year Old | 263 (73.7%) | 94 (26.3%) |
| 10 to 14 Year Olds | 403 (91.2%) | 39 (8.8%) |
| 15 to 17 Year Olds | 211 (65.7%) | 110 (34.3%) |
| 18 to 19 Year Olds | 72 (69.2%) | 32 (30.8%) |
| 20 to 24 Year Olds | 3 (4.5%) | 63 (95.5%) |
| 25 to 34 Year Olds | 21 (63.6%) | 12 (36.4%) |
| 35 Years and over | 29 (100.0%) | 0 (0.0%) |
| Total | 1,063 (75.2%) | 351 (24.8%) |
Educational Attainment by Field of Study in North Hobbs
Science & technology (168 | 24.8%), business (131 | 19.3%), education (90 | 13.3%), liberal arts & history (64 | 9.4%), and arts & humanities (58 | 8.6%) are the most common fields of study among 678 individuals in North Hobbs who have obtained a bachelor's degree or higher.
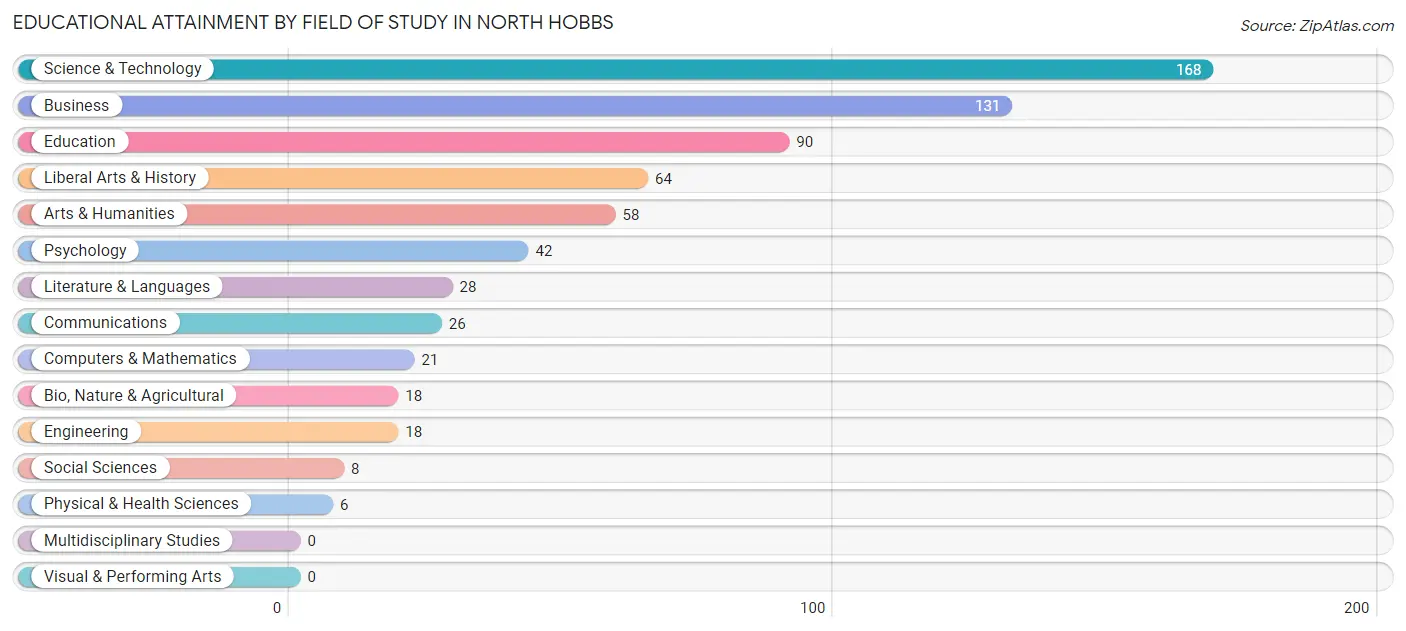
| Field of Study | # Graduates | % Graduates |
| Computers & Mathematics | 21 | 3.1% |
| Bio, Nature & Agricultural | 18 | 2.6% |
| Physical & Health Sciences | 6 | 0.9% |
| Psychology | 42 | 6.2% |
| Social Sciences | 8 | 1.2% |
| Engineering | 18 | 2.6% |
| Multidisciplinary Studies | 0 | 0.0% |
| Science & Technology | 168 | 24.8% |
| Business | 131 | 19.3% |
| Education | 90 | 13.3% |
| Literature & Languages | 28 | 4.1% |
| Liberal Arts & History | 64 | 9.4% |
| Visual & Performing Arts | 0 | 0.0% |
| Communications | 26 | 3.8% |
| Arts & Humanities | 58 | 8.6% |
| Total | 678 | 100.0% |
Transportation & Commute in North Hobbs
Vehicle Availability by Sex in North Hobbs
The most prevalent vehicle ownership categories in North Hobbs are males with 2 vehicles (651, accounting for 50.3%) and females with 2 vehicles (475, making up 64.1%).
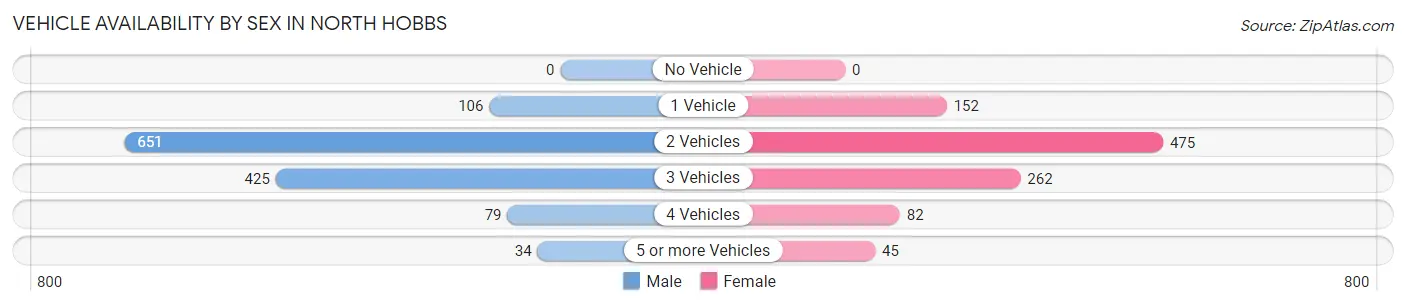
| Vehicles Available | Male | Female |
| No Vehicle | 0 (0.0%) | 0 (0.0%) |
| 1 Vehicle | 106 (8.2%) | 152 (15.0%) |
| 2 Vehicles | 651 (50.3%) | 475 (46.8%) |
| 3 Vehicles | 425 (32.8%) | 262 (25.8%) |
| 4 Vehicles | 79 (6.1%) | 82 (8.1%) |
| 5 or more Vehicles | 34 (2.6%) | 45 (4.4%) |
| Total | 1,295 (100.0%) | 1,016 (100.0%) |
Commute Time in North Hobbs
The most frequently occuring commute durations in North Hobbs are 15 to 19 minutes (758 commuters, 33.3%), 10 to 14 minutes (468 commuters, 20.5%), and 20 to 24 minutes (411 commuters, 18.0%).
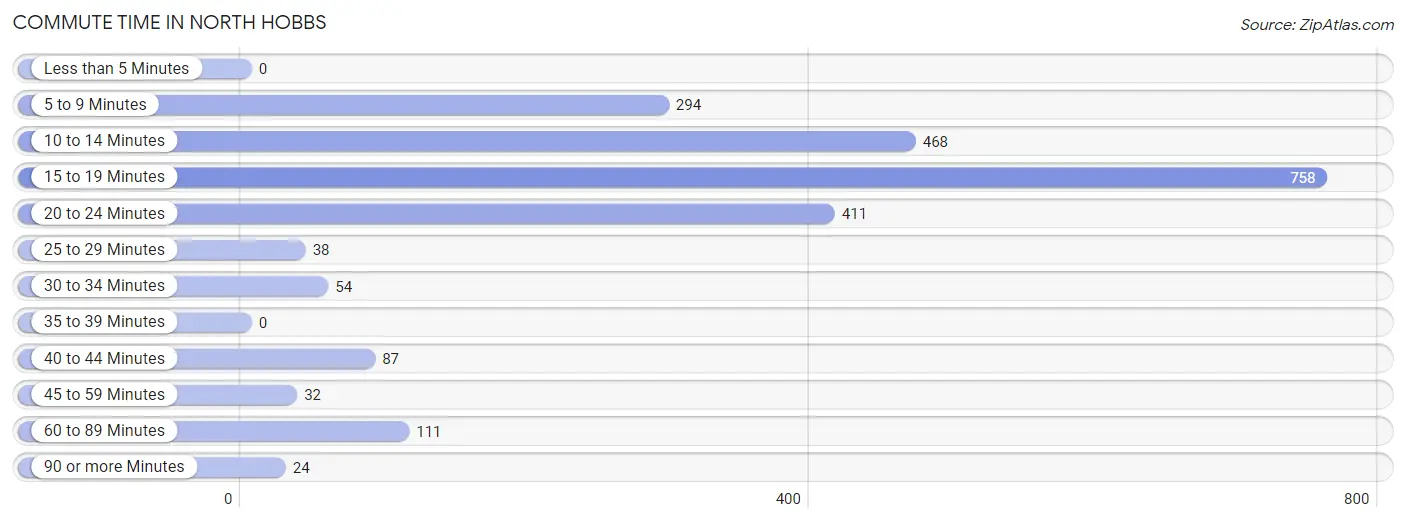
| Commute Time | # Commuters | % Commuters |
| Less than 5 Minutes | 0 | 0.0% |
| 5 to 9 Minutes | 294 | 12.9% |
| 10 to 14 Minutes | 468 | 20.5% |
| 15 to 19 Minutes | 758 | 33.3% |
| 20 to 24 Minutes | 411 | 18.0% |
| 25 to 29 Minutes | 38 | 1.7% |
| 30 to 34 Minutes | 54 | 2.4% |
| 35 to 39 Minutes | 0 | 0.0% |
| 40 to 44 Minutes | 87 | 3.8% |
| 45 to 59 Minutes | 32 | 1.4% |
| 60 to 89 Minutes | 111 | 4.9% |
| 90 or more Minutes | 24 | 1.1% |
Commute Time by Sex in North Hobbs
The most common commute times in North Hobbs are 15 to 19 minutes (442 commuters, 34.5%) for males and 15 to 19 minutes (316 commuters, 31.7%) for females.
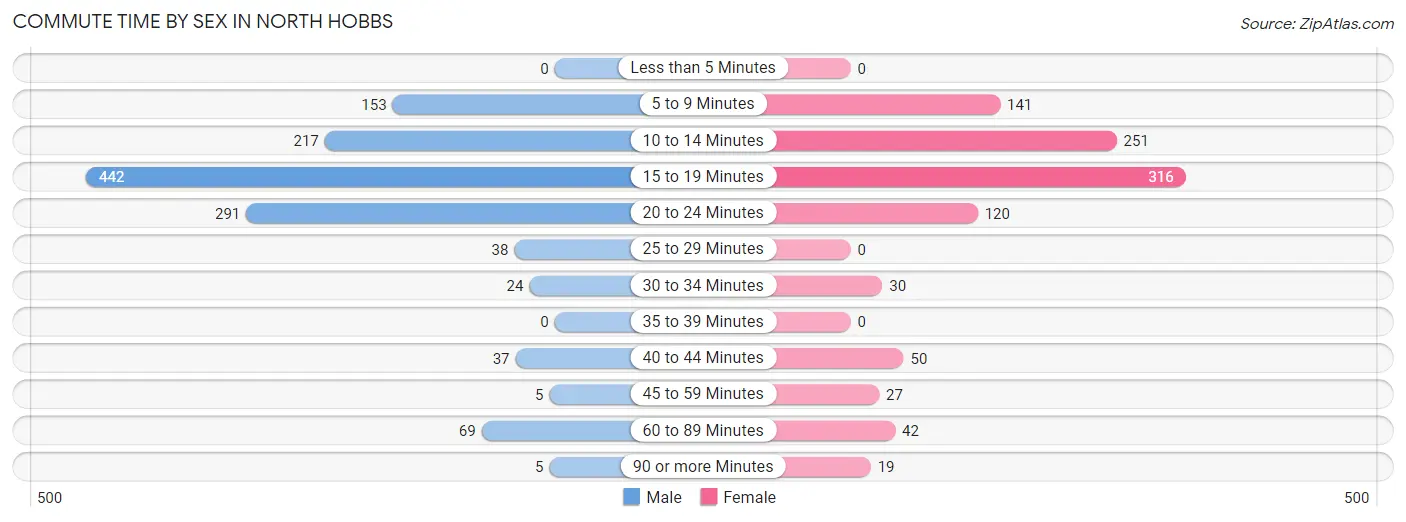
| Commute Time | Male | Female |
| Less than 5 Minutes | 0 (0.0%) | 0 (0.0%) |
| 5 to 9 Minutes | 153 (11.9%) | 141 (14.2%) |
| 10 to 14 Minutes | 217 (16.9%) | 251 (25.2%) |
| 15 to 19 Minutes | 442 (34.5%) | 316 (31.7%) |
| 20 to 24 Minutes | 291 (22.7%) | 120 (12.0%) |
| 25 to 29 Minutes | 38 (3.0%) | 0 (0.0%) |
| 30 to 34 Minutes | 24 (1.9%) | 30 (3.0%) |
| 35 to 39 Minutes | 0 (0.0%) | 0 (0.0%) |
| 40 to 44 Minutes | 37 (2.9%) | 50 (5.0%) |
| 45 to 59 Minutes | 5 (0.4%) | 27 (2.7%) |
| 60 to 89 Minutes | 69 (5.4%) | 42 (4.2%) |
| 90 or more Minutes | 5 (0.4%) | 19 (1.9%) |
Time of Departure to Work by Sex in North Hobbs
The most frequent times of departure to work in North Hobbs are 6:30 AM to 6:59 AM (309, 24.1%) for males and 7:30 AM to 7:59 AM (235, 23.6%) for females.
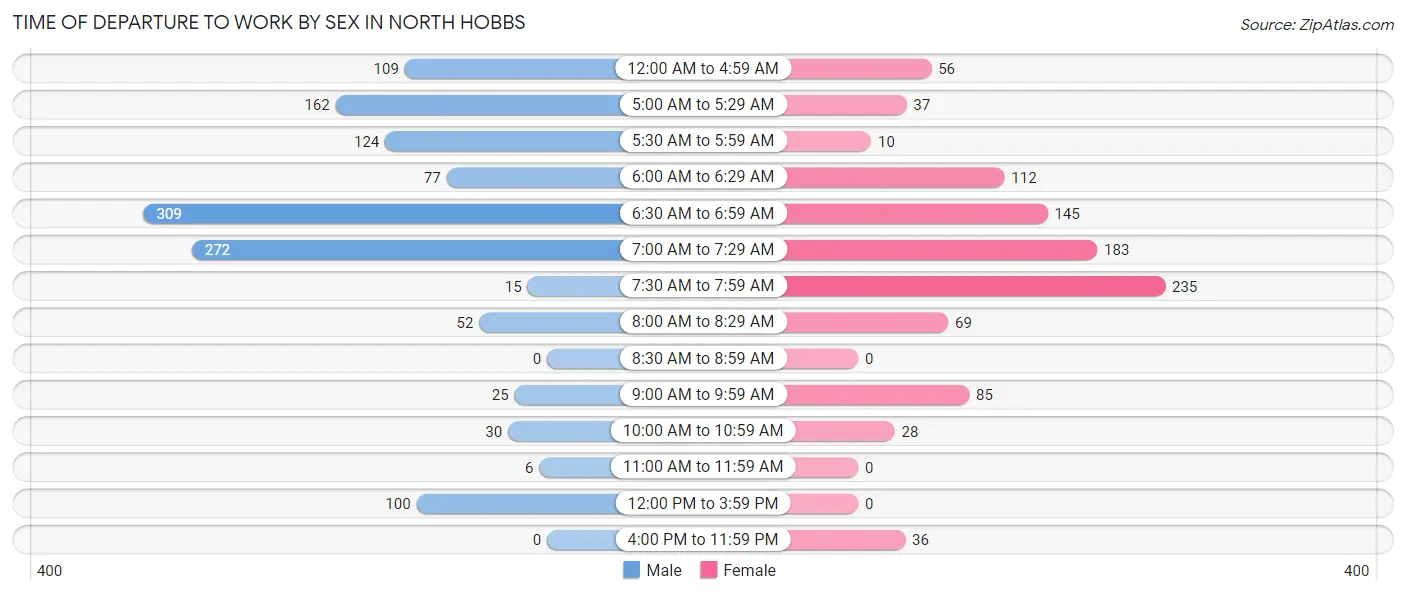
| Time of Departure | Male | Female |
| 12:00 AM to 4:59 AM | 109 (8.5%) | 56 (5.6%) |
| 5:00 AM to 5:29 AM | 162 (12.7%) | 37 (3.7%) |
| 5:30 AM to 5:59 AM | 124 (9.7%) | 10 (1.0%) |
| 6:00 AM to 6:29 AM | 77 (6.0%) | 112 (11.2%) |
| 6:30 AM to 6:59 AM | 309 (24.1%) | 145 (14.6%) |
| 7:00 AM to 7:29 AM | 272 (21.2%) | 183 (18.4%) |
| 7:30 AM to 7:59 AM | 15 (1.2%) | 235 (23.6%) |
| 8:00 AM to 8:29 AM | 52 (4.1%) | 69 (6.9%) |
| 8:30 AM to 8:59 AM | 0 (0.0%) | 0 (0.0%) |
| 9:00 AM to 9:59 AM | 25 (1.9%) | 85 (8.5%) |
| 10:00 AM to 10:59 AM | 30 (2.3%) | 28 (2.8%) |
| 11:00 AM to 11:59 AM | 6 (0.5%) | 0 (0.0%) |
| 12:00 PM to 3:59 PM | 100 (7.8%) | 0 (0.0%) |
| 4:00 PM to 11:59 PM | 0 (0.0%) | 36 (3.6%) |
| Total | 1,281 (100.0%) | 996 (100.0%) |
Housing Occupancy in North Hobbs
Occupancy by Ownership in North Hobbs
Of the total 1,915 dwellings in North Hobbs, owner-occupied units account for 1,566 (81.8%), while renter-occupied units make up 349 (18.2%).
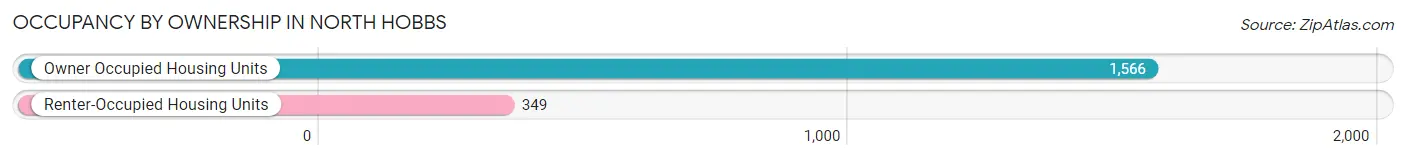
| Occupancy | # Housing Units | % Housing Units |
| Owner Occupied Housing Units | 1,566 | 81.8% |
| Renter-Occupied Housing Units | 349 | 18.2% |
| Total Occupied Housing Units | 1,915 | 100.0% |
Occupancy by Household Size in North Hobbs
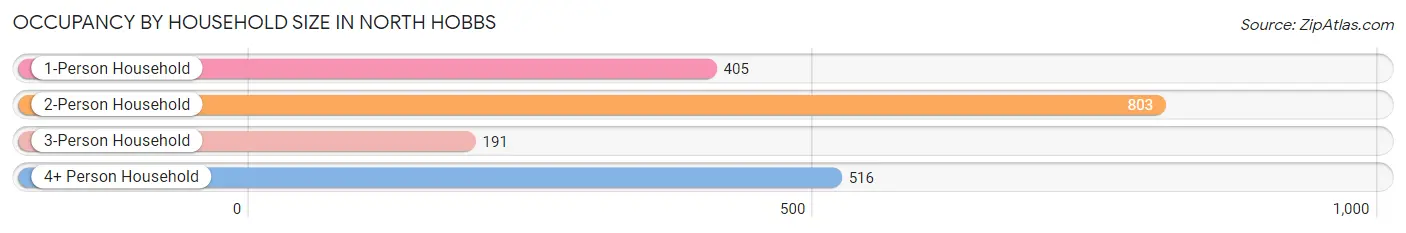
| Household Size | # Housing Units | % Housing Units |
| 1-Person Household | 405 | 21.1% |
| 2-Person Household | 803 | 41.9% |
| 3-Person Household | 191 | 10.0% |
| 4+ Person Household | 516 | 27.0% |
| Total Housing Units | 1,915 | 100.0% |
Occupancy by Ownership by Household Size in North Hobbs
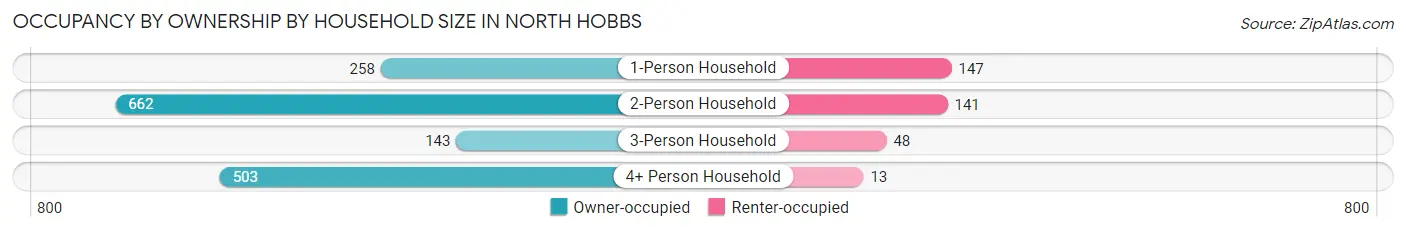
| Household Size | Owner-occupied | Renter-occupied |
| 1-Person Household | 258 (63.7%) | 147 (36.3%) |
| 2-Person Household | 662 (82.4%) | 141 (17.6%) |
| 3-Person Household | 143 (74.9%) | 48 (25.1%) |
| 4+ Person Household | 503 (97.5%) | 13 (2.5%) |
| Total Housing Units | 1,566 (81.8%) | 349 (18.2%) |
Occupancy by Educational Attainment in North Hobbs
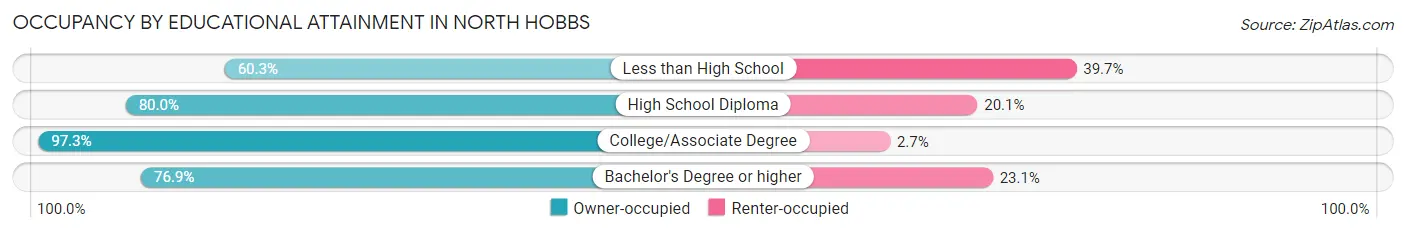
| Household Size | Owner-occupied | Renter-occupied |
| Less than High School | 152 (60.3%) | 100 (39.7%) |
| High School Diploma | 606 (79.9%) | 152 (20.1%) |
| College/Associate Degree | 535 (97.3%) | 15 (2.7%) |
| Bachelor's Degree or higher | 273 (76.9%) | 82 (23.1%) |
Occupancy by Age of Householder in North Hobbs
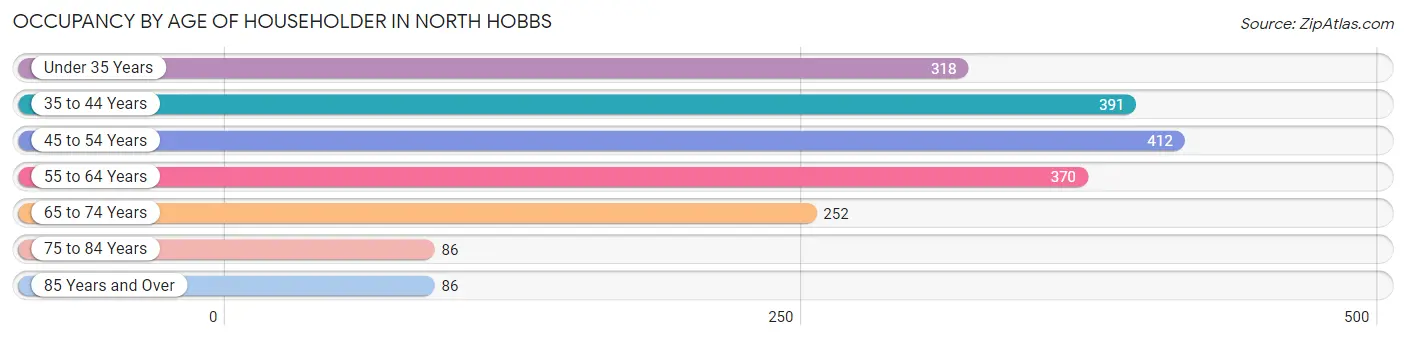
| Age Bracket | # Households | % Households |
| Under 35 Years | 318 | 16.6% |
| 35 to 44 Years | 391 | 20.4% |
| 45 to 54 Years | 412 | 21.5% |
| 55 to 64 Years | 370 | 19.3% |
| 65 to 74 Years | 252 | 13.2% |
| 75 to 84 Years | 86 | 4.5% |
| 85 Years and Over | 86 | 4.5% |
| Total | 1,915 | 100.0% |
Housing Finances in North Hobbs
Median Income by Occupancy in North Hobbs
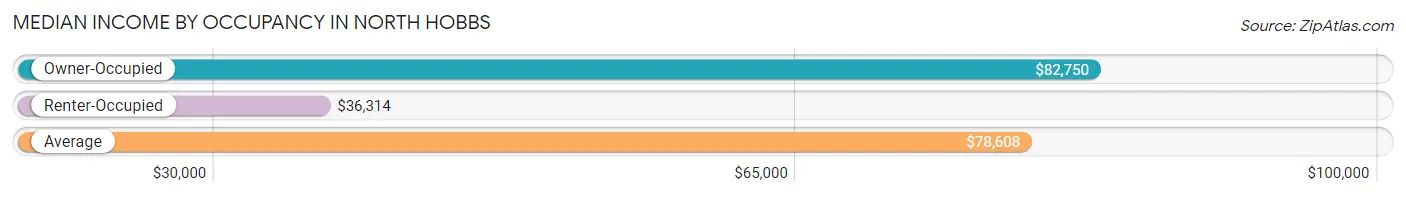
| Occupancy Type | # Households | Median Income |
| Owner-Occupied | 1,566 (81.8%) | $82,750 |
| Renter-Occupied | 349 (18.2%) | $36,314 |
| Average | 1,915 (100.0%) | $78,608 |
Occupancy by Householder Income Bracket in North Hobbs
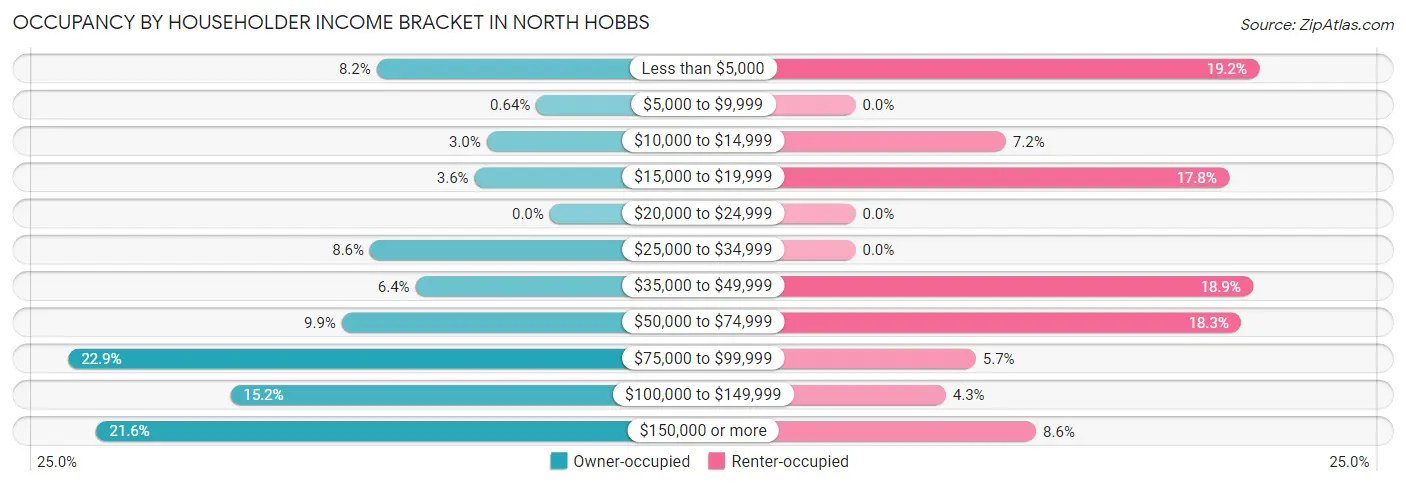
| Income Bracket | Owner-occupied | Renter-occupied |
| Less than $5,000 | 129 (8.2%) | 67 (19.2%) |
| $5,000 to $9,999 | 10 (0.6%) | 0 (0.0%) |
| $10,000 to $14,999 | 47 (3.0%) | 25 (7.2%) |
| $15,000 to $19,999 | 56 (3.6%) | 62 (17.8%) |
| $20,000 to $24,999 | 0 (0.0%) | 0 (0.0%) |
| $25,000 to $34,999 | 134 (8.6%) | 0 (0.0%) |
| $35,000 to $49,999 | 100 (6.4%) | 66 (18.9%) |
| $50,000 to $74,999 | 155 (9.9%) | 64 (18.3%) |
| $75,000 to $99,999 | 359 (22.9%) | 20 (5.7%) |
| $100,000 to $149,999 | 238 (15.2%) | 15 (4.3%) |
| $150,000 or more | 338 (21.6%) | 30 (8.6%) |
| Total | 1,566 (100.0%) | 349 (100.0%) |
Monthly Housing Cost Tiers in North Hobbs
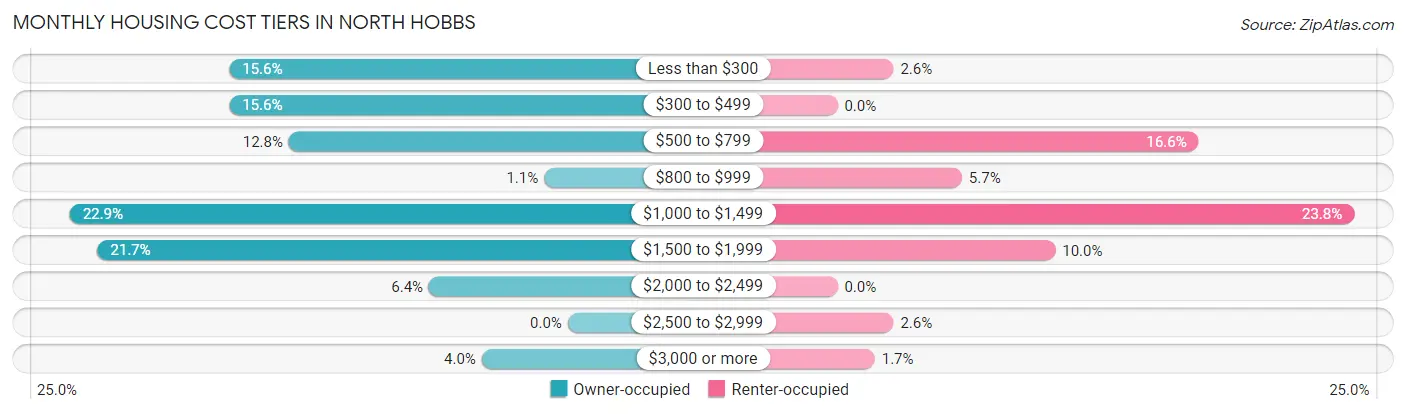
| Monthly Cost | Owner-occupied | Renter-occupied |
| Less than $300 | 244 (15.6%) | 9 (2.6%) |
| $300 to $499 | 244 (15.6%) | 0 (0.0%) |
| $500 to $799 | 201 (12.8%) | 58 (16.6%) |
| $800 to $999 | 17 (1.1%) | 20 (5.7%) |
| $1,000 to $1,499 | 359 (22.9%) | 83 (23.8%) |
| $1,500 to $1,999 | 339 (21.6%) | 35 (10.0%) |
| $2,000 to $2,499 | 100 (6.4%) | 0 (0.0%) |
| $2,500 to $2,999 | 0 (0.0%) | 9 (2.6%) |
| $3,000 or more | 62 (4.0%) | 6 (1.7%) |
| Total | 1,566 (100.0%) | 349 (100.0%) |
Physical Housing Characteristics in North Hobbs
Housing Structures in North Hobbs
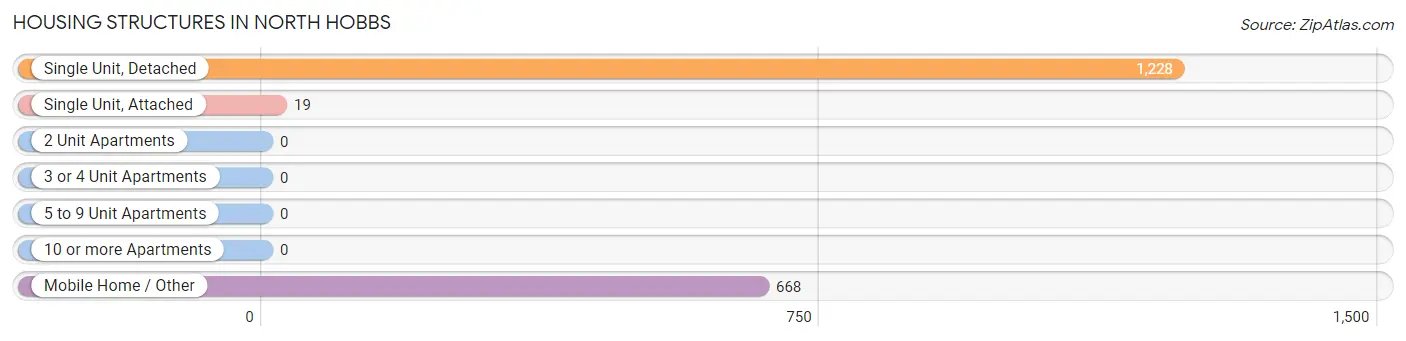
| Structure Type | # Housing Units | % Housing Units |
| Single Unit, Detached | 1,228 | 64.1% |
| Single Unit, Attached | 19 | 1.0% |
| 2 Unit Apartments | 0 | 0.0% |
| 3 or 4 Unit Apartments | 0 | 0.0% |
| 5 to 9 Unit Apartments | 0 | 0.0% |
| 10 or more Apartments | 0 | 0.0% |
| Mobile Home / Other | 668 | 34.9% |
| Total | 1,915 | 100.0% |
Housing Structures by Occupancy in North Hobbs
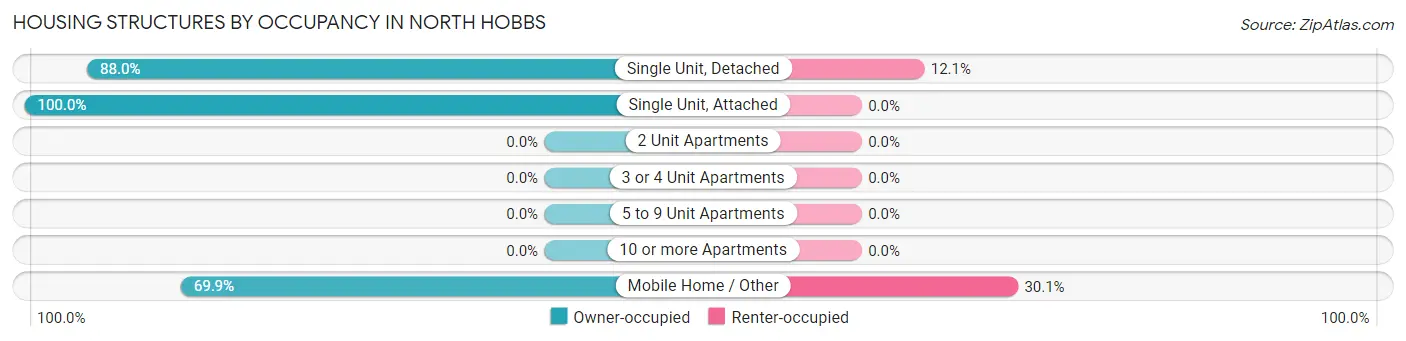
| Structure Type | Owner-occupied | Renter-occupied |
| Single Unit, Detached | 1,080 (87.9%) | 148 (12.0%) |
| Single Unit, Attached | 19 (100.0%) | 0 (0.0%) |
| 2 Unit Apartments | 0 (0.0%) | 0 (0.0%) |
| 3 or 4 Unit Apartments | 0 (0.0%) | 0 (0.0%) |
| 5 to 9 Unit Apartments | 0 (0.0%) | 0 (0.0%) |
| 10 or more Apartments | 0 (0.0%) | 0 (0.0%) |
| Mobile Home / Other | 467 (69.9%) | 201 (30.1%) |
| Total | 1,566 (81.8%) | 349 (18.2%) |
Housing Structures by Number of Rooms in North Hobbs
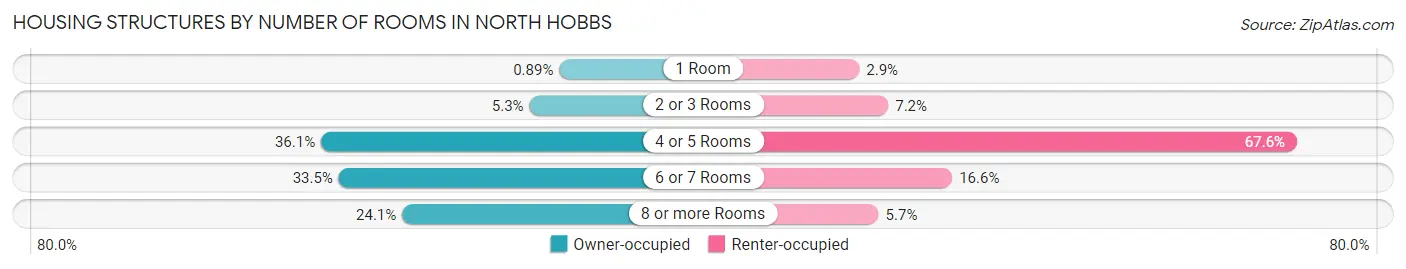
| Number of Rooms | Owner-occupied | Renter-occupied |
| 1 Room | 14 (0.9%) | 10 (2.9%) |
| 2 or 3 Rooms | 83 (5.3%) | 25 (7.2%) |
| 4 or 5 Rooms | 566 (36.1%) | 236 (67.6%) |
| 6 or 7 Rooms | 525 (33.5%) | 58 (16.6%) |
| 8 or more Rooms | 378 (24.1%) | 20 (5.7%) |
| Total | 1,566 (100.0%) | 349 (100.0%) |
Housing Structure by Heating Type in North Hobbs
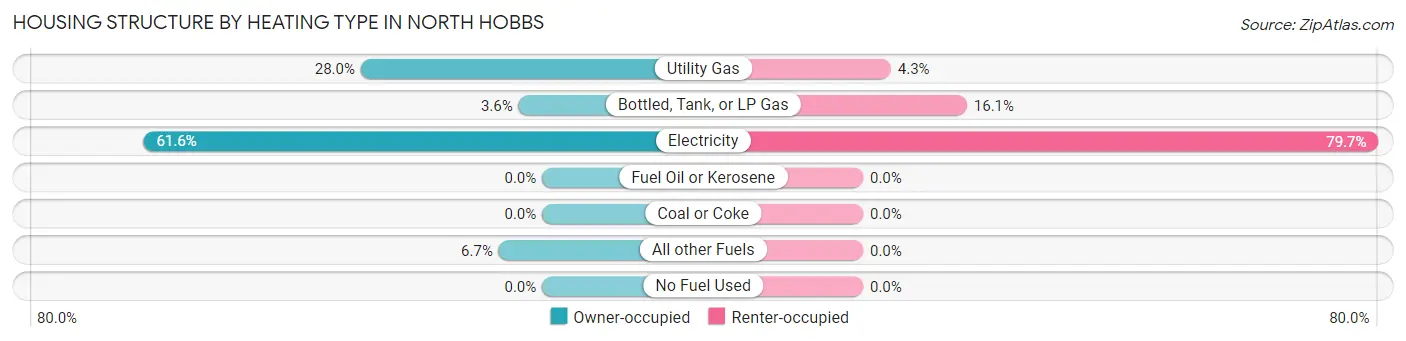
| Heating Type | Owner-occupied | Renter-occupied |
| Utility Gas | 439 (28.0%) | 15 (4.3%) |
| Bottled, Tank, or LP Gas | 57 (3.6%) | 56 (16.1%) |
| Electricity | 965 (61.6%) | 278 (79.7%) |
| Fuel Oil or Kerosene | 0 (0.0%) | 0 (0.0%) |
| Coal or Coke | 0 (0.0%) | 0 (0.0%) |
| All other Fuels | 105 (6.7%) | 0 (0.0%) |
| No Fuel Used | 0 (0.0%) | 0 (0.0%) |
| Total | 1,566 (100.0%) | 349 (100.0%) |
Household Vehicle Usage in North Hobbs
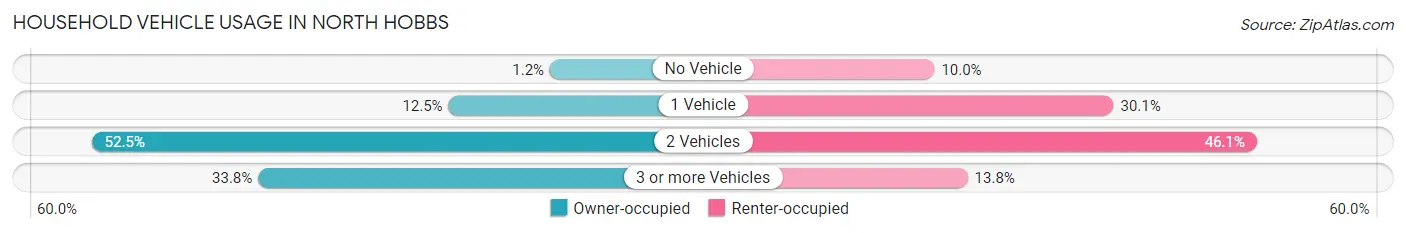
| Vehicles per Household | Owner-occupied | Renter-occupied |
| No Vehicle | 18 (1.1%) | 35 (10.0%) |
| 1 Vehicle | 196 (12.5%) | 105 (30.1%) |
| 2 Vehicles | 822 (52.5%) | 161 (46.1%) |
| 3 or more Vehicles | 530 (33.8%) | 48 (13.8%) |
| Total | 1,566 (100.0%) | 349 (100.0%) |
Real Estate & Mortgages in North Hobbs
Real Estate and Mortgage Overview in North Hobbs
| Characteristic | Without Mortgage | With Mortgage |
| Housing Units | 722 | 844 |
| Median Property Value | $143,300 | $234,600 |
| Median Household Income | $56,974 | $232 |
| Monthly Housing Costs | $396 | $62 |
| Real Estate Taxes | $576 | $13 |
Property Value by Mortgage Status in North Hobbs
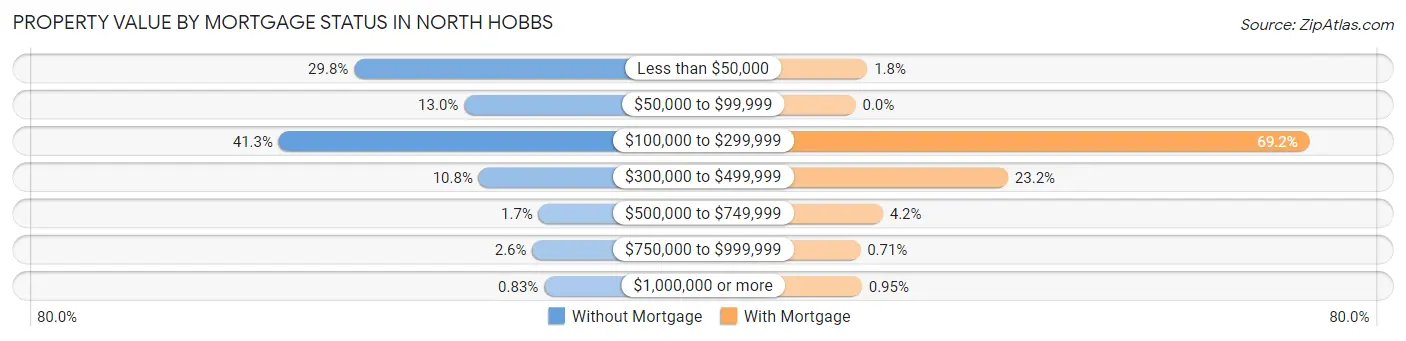
| Property Value | Without Mortgage | With Mortgage |
| Less than $50,000 | 215 (29.8%) | 15 (1.8%) |
| $50,000 to $99,999 | 94 (13.0%) | 0 (0.0%) |
| $100,000 to $299,999 | 298 (41.3%) | 584 (69.2%) |
| $300,000 to $499,999 | 78 (10.8%) | 196 (23.2%) |
| $500,000 to $749,999 | 12 (1.7%) | 35 (4.2%) |
| $750,000 to $999,999 | 19 (2.6%) | 6 (0.7%) |
| $1,000,000 or more | 6 (0.8%) | 8 (0.9%) |
| Total | 722 (100.0%) | 844 (100.0%) |
Household Income by Mortgage Status in North Hobbs
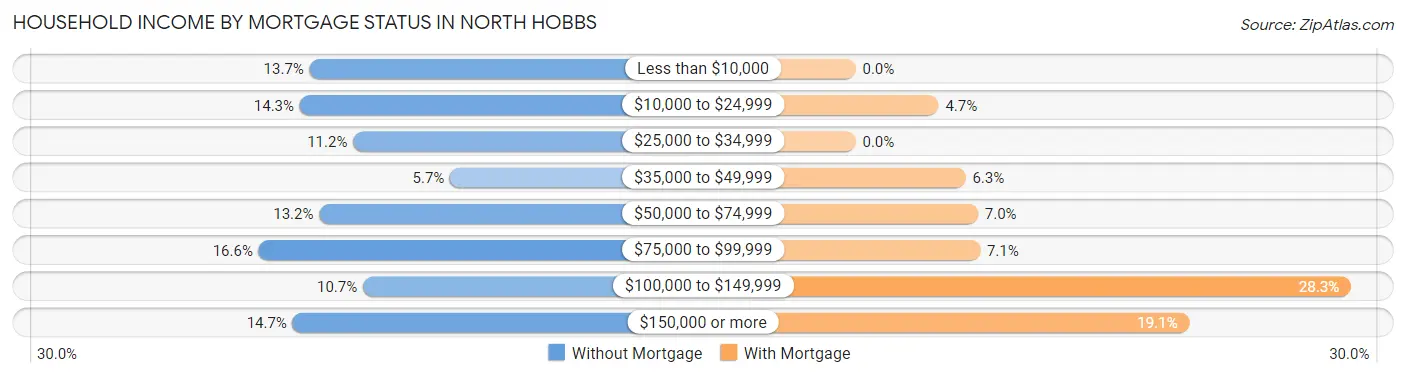
| Household Income | Without Mortgage | With Mortgage |
| Less than $10,000 | 99 (13.7%) | 0 (0.0%) |
| $10,000 to $24,999 | 103 (14.3%) | 40 (4.7%) |
| $25,000 to $34,999 | 81 (11.2%) | 0 (0.0%) |
| $35,000 to $49,999 | 41 (5.7%) | 53 (6.3%) |
| $50,000 to $74,999 | 95 (13.2%) | 59 (7.0%) |
| $75,000 to $99,999 | 120 (16.6%) | 60 (7.1%) |
| $100,000 to $149,999 | 77 (10.7%) | 239 (28.3%) |
| $150,000 or more | 106 (14.7%) | 161 (19.1%) |
| Total | 722 (100.0%) | 844 (100.0%) |
Property Value to Household Income Ratio in North Hobbs
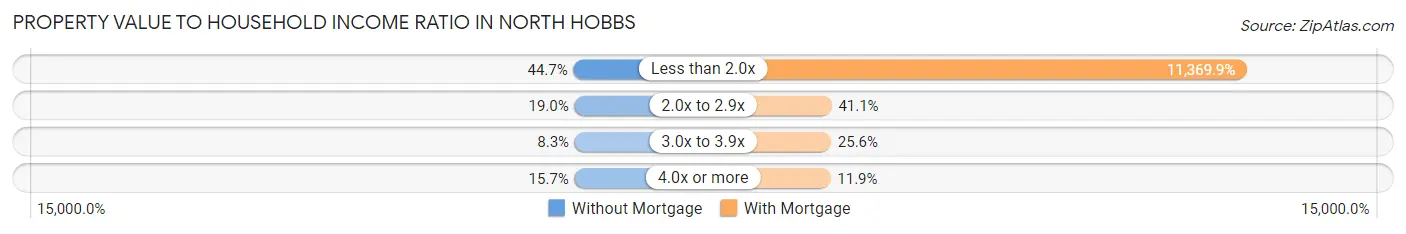
| Value-to-Income Ratio | Without Mortgage | With Mortgage |
| Less than 2.0x | 323 (44.7%) | 95,962 (11,369.9%) |
| 2.0x to 2.9x | 137 (19.0%) | 347 (41.1%) |
| 3.0x to 3.9x | 60 (8.3%) | 216 (25.6%) |
| 4.0x or more | 113 (15.7%) | 100 (11.8%) |
| Total | 722 (100.0%) | 844 (100.0%) |
Real Estate Taxes by Mortgage Status in North Hobbs
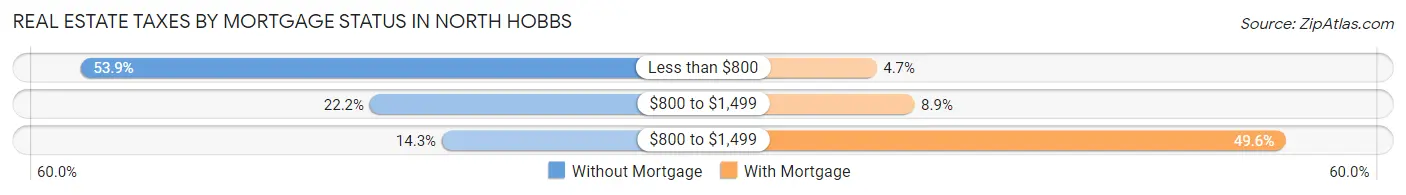
| Property Taxes | Without Mortgage | With Mortgage |
| Less than $800 | 389 (53.9%) | 40 (4.7%) |
| $800 to $1,499 | 160 (22.2%) | 75 (8.9%) |
| $800 to $1,499 | 103 (14.3%) | 419 (49.6%) |
| Total | 722 (100.0%) | 844 (100.0%) |
Health & Disability in North Hobbs
Health Insurance Coverage by Age in North Hobbs
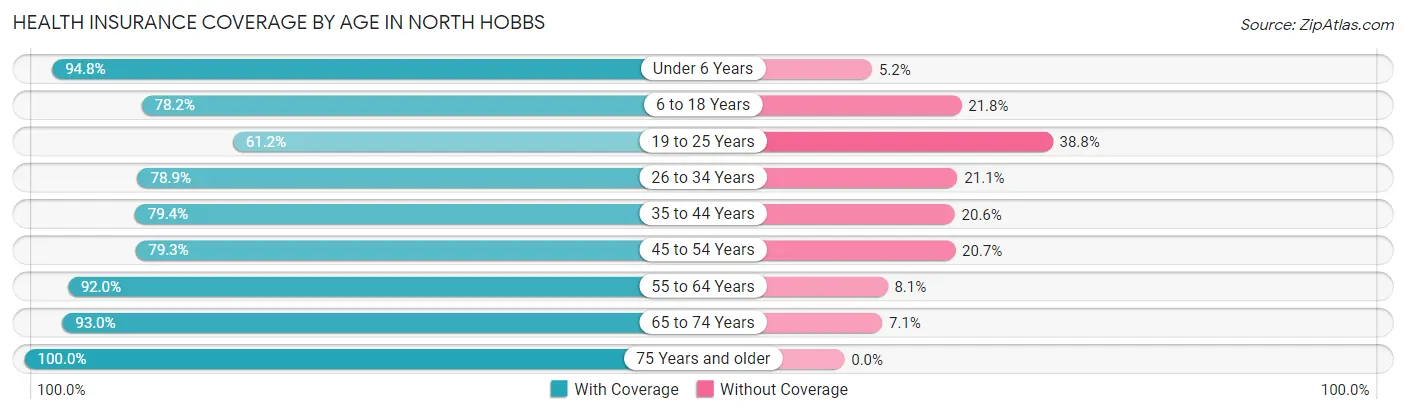
| Age Bracket | With Coverage | Without Coverage |
| Under 6 Years | 386 (94.8%) | 21 (5.2%) |
| 6 to 18 Years | 1,046 (78.2%) | 292 (21.8%) |
| 19 to 25 Years | 274 (61.2%) | 174 (38.8%) |
| 26 to 34 Years | 494 (78.9%) | 132 (21.1%) |
| 35 to 44 Years | 610 (79.4%) | 158 (20.6%) |
| 45 to 54 Years | 622 (79.3%) | 162 (20.7%) |
| 55 to 64 Years | 754 (91.9%) | 66 (8.1%) |
| 65 to 74 Years | 409 (92.9%) | 31 (7.0%) |
| 75 Years and older | 226 (100.0%) | 0 (0.0%) |
| Total | 4,821 (82.3%) | 1,036 (17.7%) |
Health Insurance Coverage by Citizenship Status in North Hobbs
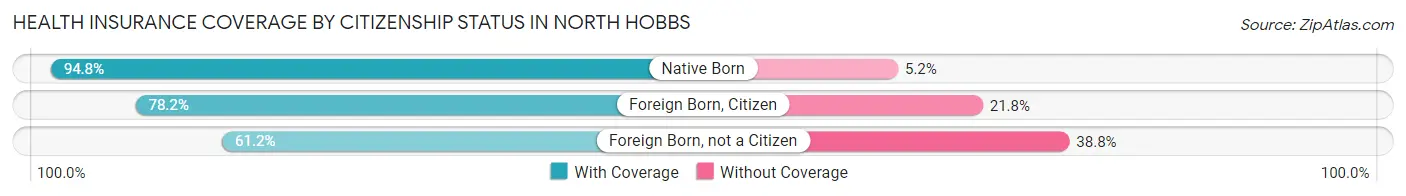
| Citizenship Status | With Coverage | Without Coverage |
| Native Born | 386 (94.8%) | 21 (5.2%) |
| Foreign Born, Citizen | 1,046 (78.2%) | 292 (21.8%) |
| Foreign Born, not a Citizen | 274 (61.2%) | 174 (38.8%) |
Health Insurance Coverage by Household Income in North Hobbs
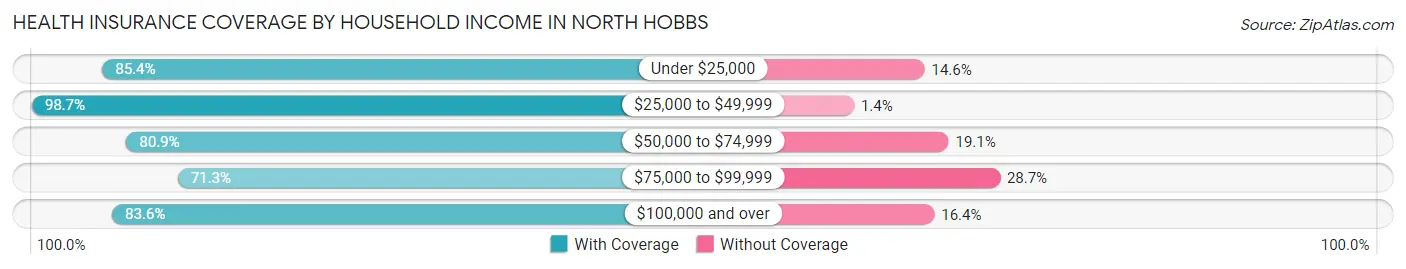
| Household Income | With Coverage | Without Coverage |
| Under $25,000 | 522 (85.4%) | 89 (14.6%) |
| $25,000 to $49,999 | 801 (98.7%) | 11 (1.3%) |
| $50,000 to $74,999 | 662 (80.9%) | 156 (19.1%) |
| $75,000 to $99,999 | 1,086 (71.3%) | 437 (28.7%) |
| $100,000 and over | 1,750 (83.6%) | 343 (16.4%) |
Public vs Private Health Insurance Coverage by Age in North Hobbs
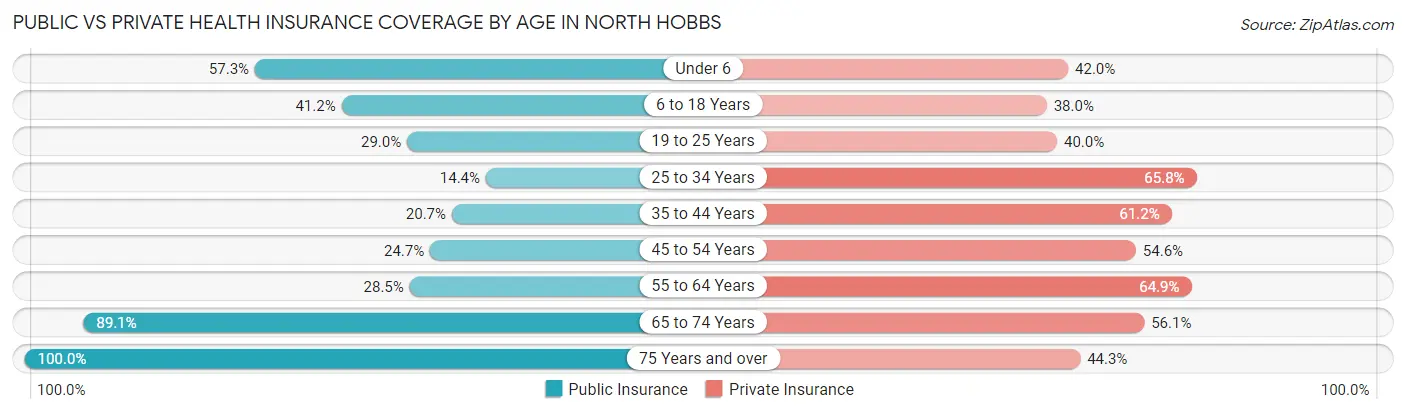
| Age Bracket | Public Insurance | Private Insurance |
| Under 6 | 233 (57.3%) | 171 (42.0%) |
| 6 to 18 Years | 551 (41.2%) | 509 (38.0%) |
| 19 to 25 Years | 130 (29.0%) | 179 (40.0%) |
| 25 to 34 Years | 90 (14.4%) | 412 (65.8%) |
| 35 to 44 Years | 159 (20.7%) | 470 (61.2%) |
| 45 to 54 Years | 194 (24.7%) | 428 (54.6%) |
| 55 to 64 Years | 234 (28.5%) | 532 (64.9%) |
| 65 to 74 Years | 392 (89.1%) | 247 (56.1%) |
| 75 Years and over | 226 (100.0%) | 100 (44.3%) |
| Total | 2,209 (37.7%) | 3,048 (52.0%) |
Disability Status by Sex by Age in North Hobbs
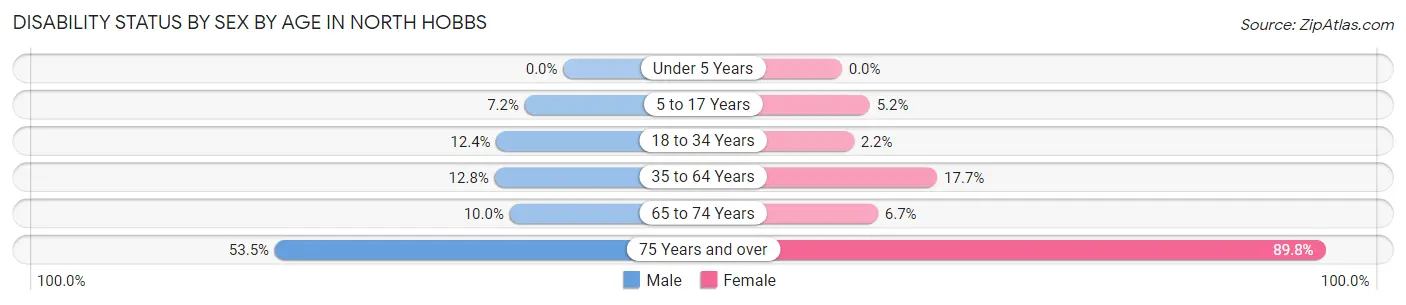
| Age Bracket | Male | Female |
| Under 5 Years | 0 (0.0%) | 0 (0.0%) |
| 5 to 17 Years | 48 (7.2%) | 35 (5.2%) |
| 18 to 34 Years | 83 (12.4%) | 12 (2.2%) |
| 35 to 64 Years | 141 (12.8%) | 224 (17.7%) |
| 65 to 74 Years | 20 (10.0%) | 16 (6.7%) |
| 75 Years and over | 53 (53.5%) | 114 (89.8%) |
Disability Class by Sex by Age in North Hobbs
Disability Class: Hearing Difficulty
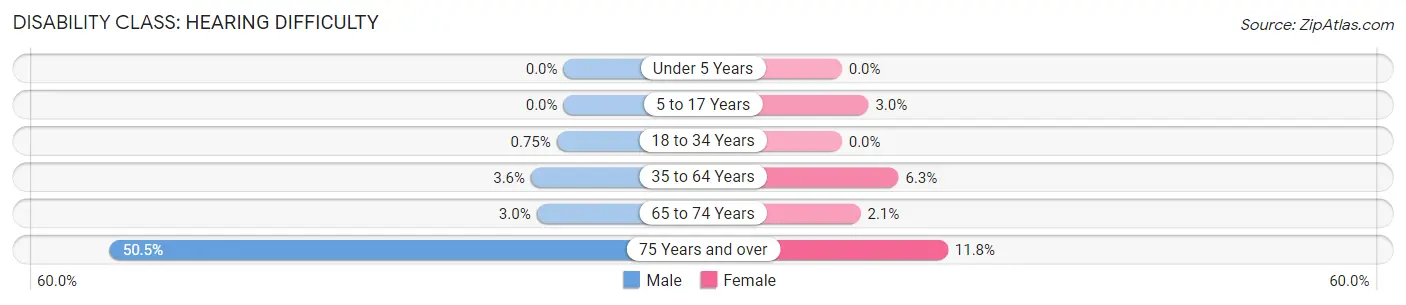
| Age Bracket | Male | Female |
| Under 5 Years | 0 (0.0%) | 0 (0.0%) |
| 5 to 17 Years | 0 (0.0%) | 20 (3.0%) |
| 18 to 34 Years | 5 (0.7%) | 0 (0.0%) |
| 35 to 64 Years | 40 (3.6%) | 80 (6.3%) |
| 65 to 74 Years | 6 (3.0%) | 5 (2.1%) |
| 75 Years and over | 50 (50.5%) | 15 (11.8%) |
Disability Class: Vision Difficulty
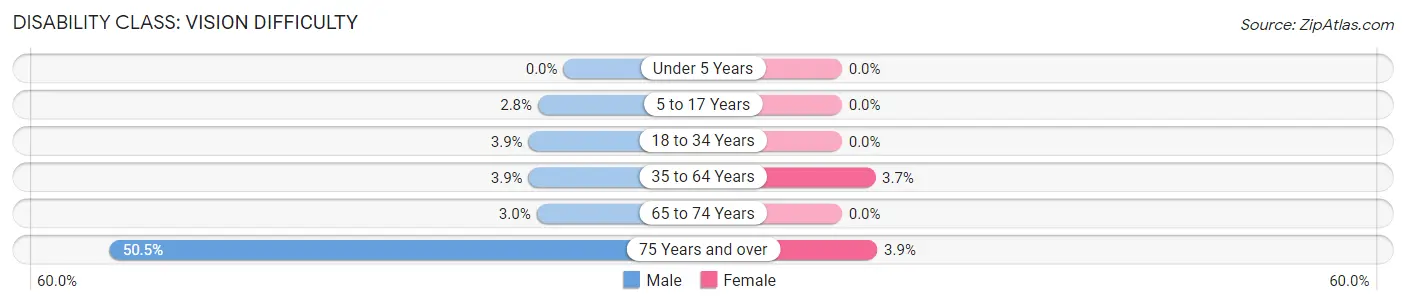
| Age Bracket | Male | Female |
| Under 5 Years | 0 (0.0%) | 0 (0.0%) |
| 5 to 17 Years | 19 (2.8%) | 0 (0.0%) |
| 18 to 34 Years | 26 (3.9%) | 0 (0.0%) |
| 35 to 64 Years | 43 (3.9%) | 47 (3.7%) |
| 65 to 74 Years | 6 (3.0%) | 0 (0.0%) |
| 75 Years and over | 50 (50.5%) | 5 (3.9%) |
Disability Class: Cognitive Difficulty
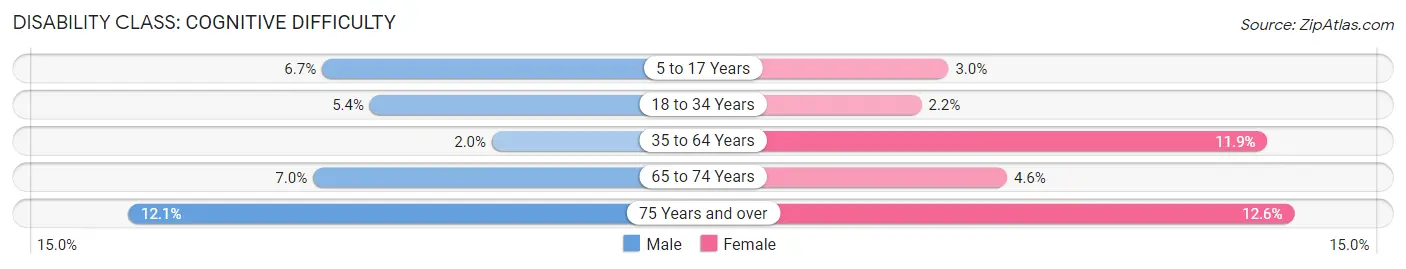
| Age Bracket | Male | Female |
| 5 to 17 Years | 45 (6.7%) | 20 (3.0%) |
| 18 to 34 Years | 36 (5.4%) | 12 (2.2%) |
| 35 to 64 Years | 22 (2.0%) | 150 (11.8%) |
| 65 to 74 Years | 14 (7.0%) | 11 (4.6%) |
| 75 Years and over | 12 (12.1%) | 16 (12.6%) |
Disability Class: Ambulatory Difficulty
| Age Bracket | Male | Female |
| 5 to 17 Years | 16 (2.4%) | 20 (3.0%) |
| 18 to 34 Years | 22 (3.3%) | 0 (0.0%) |
| 35 to 64 Years | 63 (5.7%) | 150 (11.8%) |
| 65 to 74 Years | 14 (7.0%) | 11 (4.6%) |
| 75 Years and over | 41 (41.4%) | 99 (77.9%) |
Disability Class: Self-Care Difficulty
| Age Bracket | Male | Female |
| 5 to 17 Years | 16 (2.4%) | 35 (5.2%) |
| 18 to 34 Years | 0 (0.0%) | 0 (0.0%) |
| 35 to 64 Years | 16 (1.5%) | 41 (3.2%) |
| 65 to 74 Years | 14 (7.0%) | 0 (0.0%) |
| 75 Years and over | 40 (40.4%) | 16 (12.6%) |
Technology Access in North Hobbs
Computing Device Access in North Hobbs
| Device Type | # Households | % Households |
| Desktop or Laptop | 1,507 | 78.7% |
| Smartphone | 1,666 | 87.0% |
| Tablet | 1,246 | 65.1% |
| No Computing Device | 134 | 7.0% |
| Total | 1,915 | 100.0% |
Internet Access in North Hobbs
| Internet Type | # Households | % Households |
| Dial-Up Internet | 0 | 0.0% |
| Broadband Home | 1,205 | 62.9% |
| Cellular Data Only | 230 | 12.0% |
| Satellite Internet | 167 | 8.7% |
| No Internet | 363 | 19.0% |
| Total | 1,915 | 100.0% |
North Hobbs Summary
Hobbs, New Mexico is a city located in Lea County, New Mexico, United States. The city is located in the northern part of the state, and is the county seat of Lea County. The city is located in the Permian Basin, and is the largest city in the region. The city is home to a population of approximately 35,000 people, and is the largest city in the region.
History
Hobbs was founded in 1906 by James Hobbs, a rancher from Texas. The city was originally named Hobbs Station, and was a stop on the Santa Fe Railroad. The city was incorporated in 1909, and the name was changed to Hobbs. The city grew rapidly in the early 20th century, and by the 1950s, it had become a major center for oil production. The city was also home to a large military base, which was closed in the 1990s.
Geography
Hobbs is located in the northern part of New Mexico, in the Permian Basin. The city is located at an elevation of 3,890 feet, and is situated on the Pecos River. The city is located in the Chihuahuan Desert, and is surrounded by desert terrain. The city is located near the Texas border, and is approximately 200 miles from Albuquerque.
Economy
Hobbs is a major center for oil production, and is home to several major oil companies. The city is also home to a large number of manufacturing and industrial businesses, as well as a number of retail stores. The city is also home to a large number of agricultural businesses, and is a major center for cotton production. The city is also home to a large number of service businesses, including healthcare, education, and hospitality.
Demographics
Hobbs has a population of approximately 35,000 people, and is the largest city in the region. The city has a diverse population, with a large Hispanic population, as well as a significant African American population. The city also has a large number of Native American residents, as well as a significant number of immigrants from other countries. The median household income in the city is approximately $40,000, and the median home value is approximately $100,000. The city has a low unemployment rate, and a high rate of educational attainment.
Hobbs is a vibrant and diverse city, with a rich history and a strong economy. The city is home to a large number of businesses, and is a major center for oil production. The city is also home to a diverse population, with a large Hispanic population, as well as a significant African American population. The city is also home to a large number of service businesses, and is a major center for cotton production. The city is a great place to live, work, and play, and is a great place to call home.
Common Questions
What is Per Capita Income in North Hobbs?
Per Capita income in North Hobbs is $32,384.
What is the Median Family Income in North Hobbs?
Median Family Income in North Hobbs is $86,028.
What is the Median Household income in North Hobbs?
Median Household Income in North Hobbs is $78,608.
What is Income or Wage Gap in North Hobbs?
Income or Wage Gap in North Hobbs is 52.3%.
Women in North Hobbs earn 47.7 cents for every dollar earned by a man.
What is Inequality or Gini Index in North Hobbs?
Inequality or Gini Index in North Hobbs is 0.48.
What is the Total Population of North Hobbs?
Total Population of North Hobbs is 5,863.
What is the Total Male Population of North Hobbs?
Total Male Population of North Hobbs is 2,908.
What is the Total Female Population of North Hobbs?
Total Female Population of North Hobbs is 2,955.
What is the Ratio of Males per 100 Females in North Hobbs?
There are 98.41 Males per 100 Females in North Hobbs.
What is the Ratio of Females per 100 Males in North Hobbs?
There are 101.62 Females per 100 Males in North Hobbs.
What is the Median Population Age in North Hobbs?
Median Population Age in North Hobbs is 36.2 Years.
What is the Average Family Size in North Hobbs
Average Family Size in North Hobbs is 3.6 People.
What is the Average Household Size in North Hobbs
Average Household Size in North Hobbs is 3.1 People.
How Large is the Labor Force in North Hobbs?
There are 2,661 People in the Labor Forcein in North Hobbs.
What is the Percentage of People in the Labor Force in North Hobbs?
60.0% of People are in the Labor Force in North Hobbs.
What is the Unemployment Rate in North Hobbs?
Unemployment Rate in North Hobbs is 11.3%.