Chama, NM Map & Demographics
Chama Map
Chama Overview
$27,305
PER CAPITA INCOME
$61,736
AVG FAMILY INCOME
$40,521
AVG HOUSEHOLD INCOME
46.8%
WAGE / INCOME GAP [ % ]
53.2¢/ $1
WAGE / INCOME GAP [ $ ]
0.44
INEQUALITY / GINI INDEX
801
TOTAL POPULATION
450
MALE POPULATION
351
FEMALE POPULATION
128.21
MALES / 100 FEMALES
78.00
FEMALES / 100 MALES
59.1
MEDIAN AGE
2.7
AVG FAMILY SIZE
2.0
AVG HOUSEHOLD SIZE
357
LABOR FORCE [ PEOPLE ]
47.0%
PERCENT IN LABOR FORCE
18.2%
UNEMPLOYMENT RATE
Chama Zip Codes
Chama Area Codes
Income in Chama
Income Overview in Chama
Per Capita Income in Chama is $27,305, while median incomes of families and households are $61,736 and $40,521 respectively.
| Characteristic | Number | Measure |
| Per Capita Income | 801 | $27,305 |
| Median Family Income | 213 | $61,736 |
| Mean Family Income | 213 | $64,678 |
| Median Household Income | 390 | $40,521 |
| Mean Household Income | 390 | $52,936 |
| Income Deficit | 213 | $0 |
| Wage / Income Gap (%) | 801 | 46.79% |
| Wage / Income Gap ($) | 801 | 53.21¢ per $1 |
| Gini / Inequality Index | 801 | 0.44 |
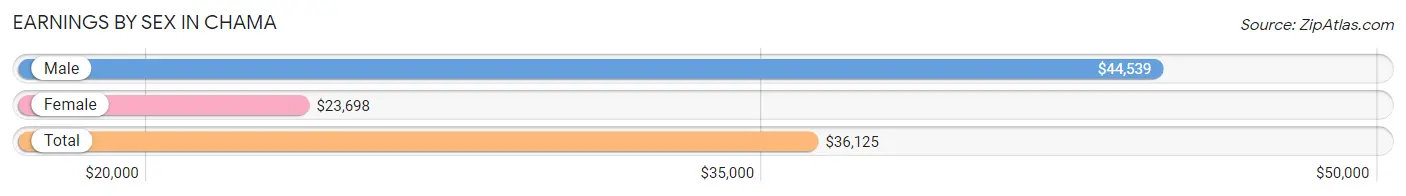
Earnings by Sex in Chama
Average Earnings in Chama are $36,125, $44,539 for men and $23,698 for women, a difference of 46.8%.
| Sex | Number | Average Earnings |
| Male | 221 (61.7%) | $44,539 |
| Female | 137 (38.3%) | $23,698 |
| Total | 358 (100.0%) | $36,125 |
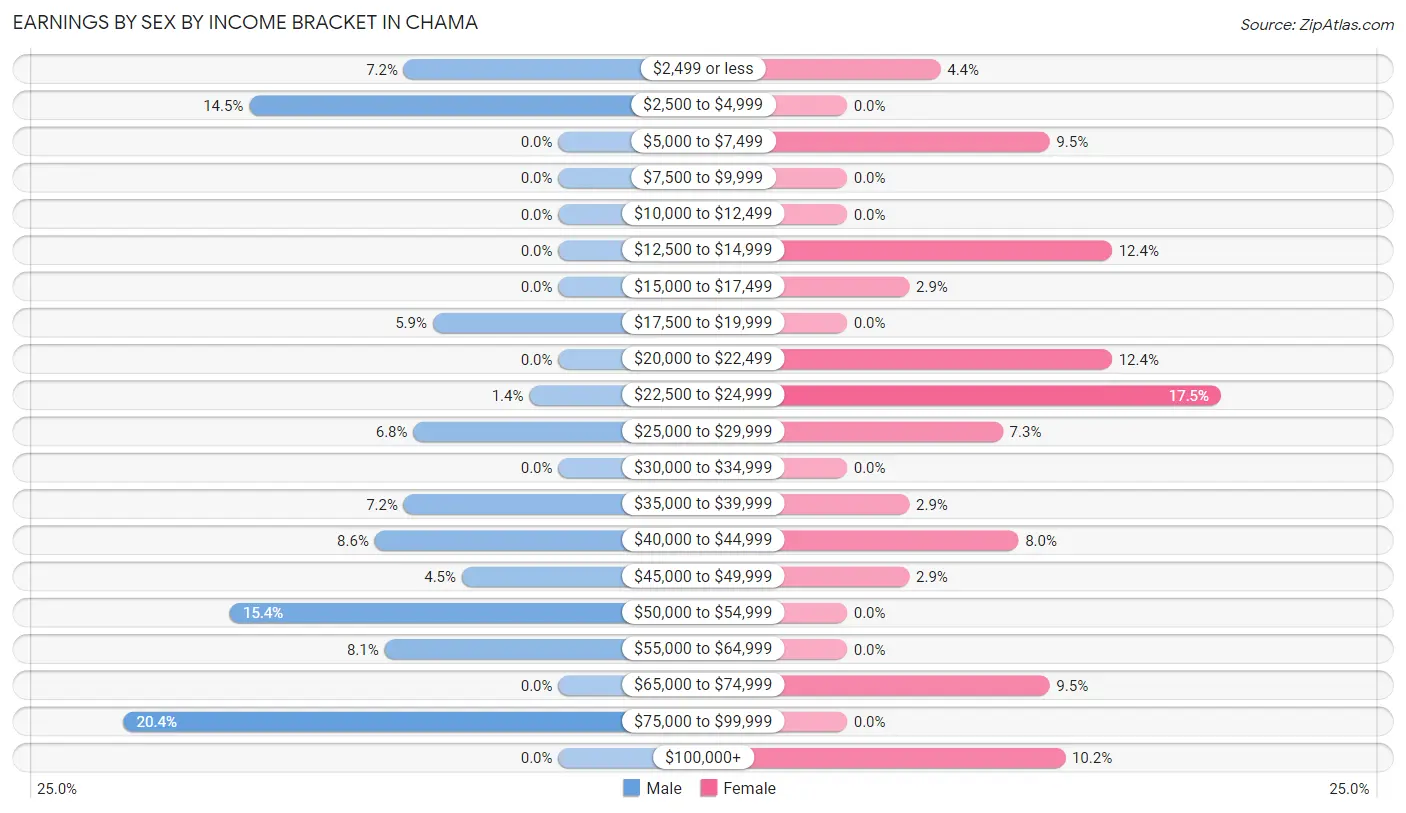
Earnings by Sex by Income Bracket in Chama
The most common earnings brackets in Chama are $75,000 to $99,999 for men (45 | 20.4%) and $22,500 to $24,999 for women (24 | 17.5%).
| Income | Male | Female |
| $2,499 or less | 16 (7.2%) | 6 (4.4%) |
| $2,500 to $4,999 | 32 (14.5%) | 0 (0.0%) |
| $5,000 to $7,499 | 0 (0.0%) | 13 (9.5%) |
| $7,500 to $9,999 | 0 (0.0%) | 0 (0.0%) |
| $10,000 to $12,499 | 0 (0.0%) | 0 (0.0%) |
| $12,500 to $14,999 | 0 (0.0%) | 17 (12.4%) |
| $15,000 to $17,499 | 0 (0.0%) | 4 (2.9%) |
| $17,500 to $19,999 | 13 (5.9%) | 0 (0.0%) |
| $20,000 to $22,499 | 0 (0.0%) | 17 (12.4%) |
| $22,500 to $24,999 | 3 (1.4%) | 24 (17.5%) |
| $25,000 to $29,999 | 15 (6.8%) | 10 (7.3%) |
| $30,000 to $34,999 | 0 (0.0%) | 0 (0.0%) |
| $35,000 to $39,999 | 16 (7.2%) | 4 (2.9%) |
| $40,000 to $44,999 | 19 (8.6%) | 11 (8.0%) |
| $45,000 to $49,999 | 10 (4.5%) | 4 (2.9%) |
| $50,000 to $54,999 | 34 (15.4%) | 0 (0.0%) |
| $55,000 to $64,999 | 18 (8.1%) | 0 (0.0%) |
| $65,000 to $74,999 | 0 (0.0%) | 13 (9.5%) |
| $75,000 to $99,999 | 45 (20.4%) | 0 (0.0%) |
| $100,000+ | 0 (0.0%) | 14 (10.2%) |
| Total | 221 (100.0%) | 137 (100.0%) |
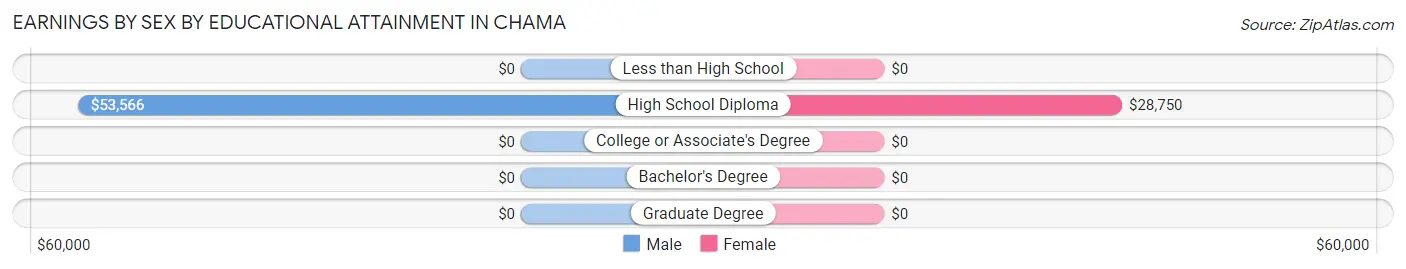
Earnings by Sex by Educational Attainment in Chama
Average earnings in Chama are $52,684 for men and $23,802 for women, a difference of 54.8%. Men with an educational attainment of high school diploma enjoy the highest average annual earnings of $53,566, while those with high school diploma education earn the least with $53,566. Women with an educational attainment of high school diploma earn the most with the average annual earnings of $28,750, while those with high school diploma education have the smallest earnings of $28,750.
| Educational Attainment | Male Income | Female Income |
| Less than High School | - | - |
| High School Diploma | $53,566 | $28,750 |
| College or Associate's Degree | - | - |
| Bachelor's Degree | - | - |
| Graduate Degree | - | - |
| Total | $52,684 | $23,802 |
Family Income in Chama
Family Income Brackets in Chama
According to the Chama family income data, there are 64 families falling into the $50,000 to $74,999 income range, which is the most common income bracket and makes up 30.0% of all families.
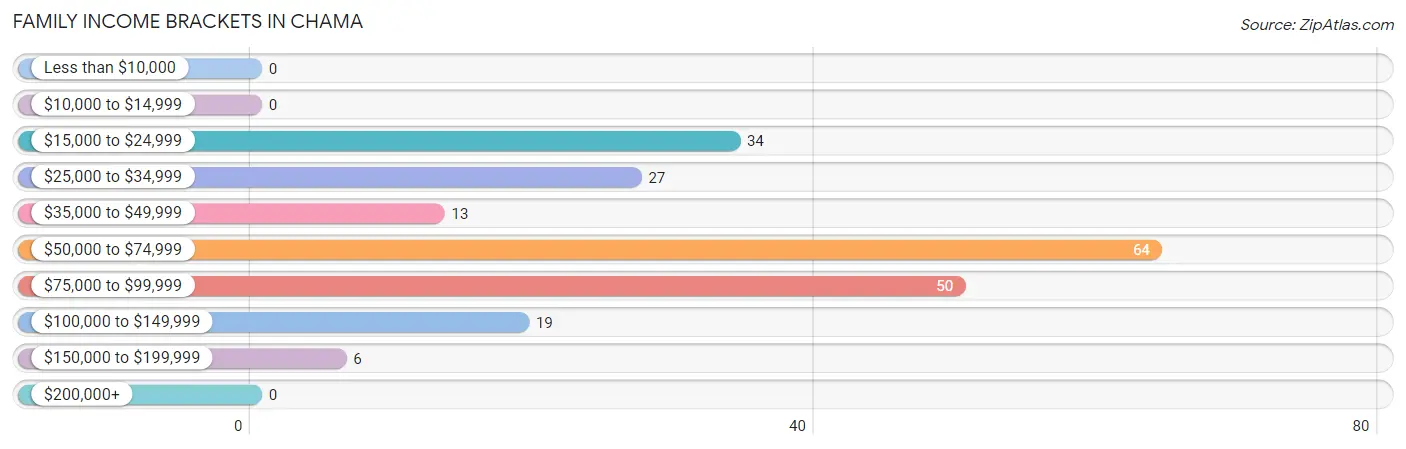
| Income Bracket | # Families | % Families |
| Less than $10,000 | 0 | 0.0% |
| $10,000 to $14,999 | 0 | 0.0% |
| $15,000 to $24,999 | 34 | 16.0% |
| $25,000 to $34,999 | 27 | 12.7% |
| $35,000 to $49,999 | 13 | 6.1% |
| $50,000 to $74,999 | 64 | 30.0% |
| $75,000 to $99,999 | 50 | 23.5% |
| $100,000 to $149,999 | 19 | 8.9% |
| $150,000 to $199,999 | 6 | 2.8% |
| $200,000+ | 0 | 0.0% |
Family Income by Famaliy Size in Chama
2-person families (164 | 77.0%) account for the highest median family income in Chama with $57,727 per family, while 2-person families (164 | 77.0%) have the highest median income of $28,864 per family member.
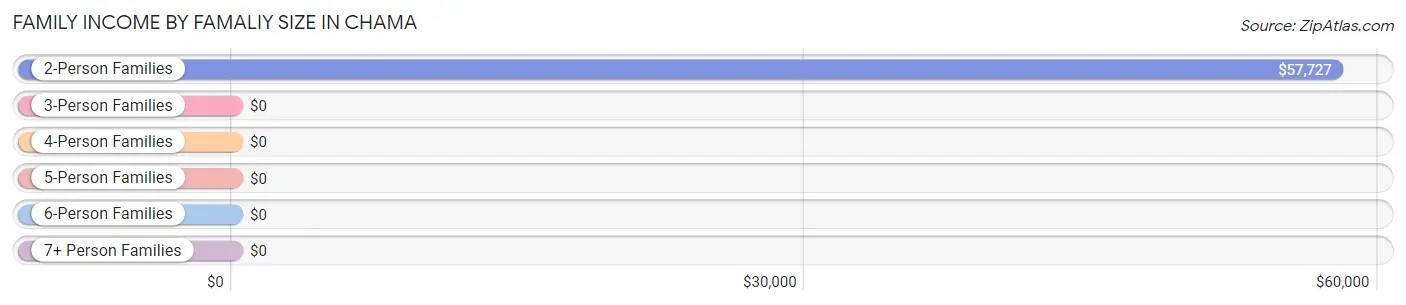
| Income Bracket | # Families | Median Income |
| 2-Person Families | 164 (77.0%) | $57,727 |
| 3-Person Families | 13 (6.1%) | $0 |
| 4-Person Families | 34 (16.0%) | $0 |
| 5-Person Families | 2 (0.9%) | $0 |
| 6-Person Families | 0 (0.0%) | $0 |
| 7+ Person Families | 0 (0.0%) | $0 |
| Total | 213 (100.0%) | $61,736 |
Family Income by Number of Earners in Chama
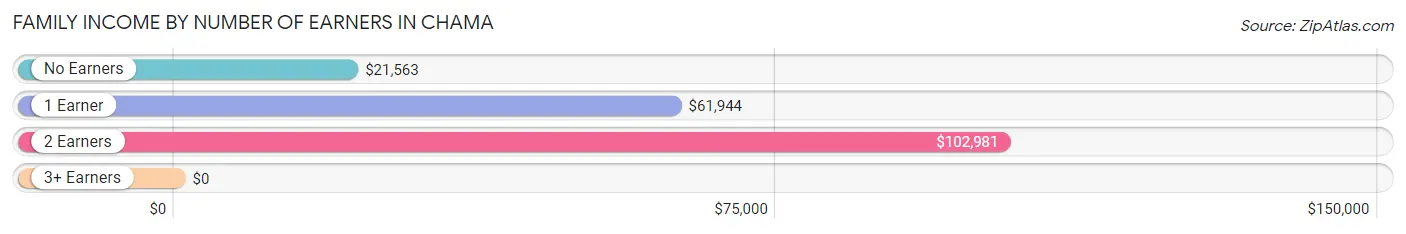
| Number of Earners | # Families | Median Income |
| No Earners | 50 (23.5%) | $21,563 |
| 1 Earner | 84 (39.4%) | $61,944 |
| 2 Earners | 45 (21.1%) | $102,981 |
| 3+ Earners | 34 (16.0%) | $0 |
| Total | 213 (100.0%) | $61,736 |
Household Income in Chama
Household Income Brackets in Chama
With 90 households falling in the category, the $15,000 to $24,999 income range is the most frequent in Chama, accounting for 23.1% of all households. In contrast, only 6 households (1.5%) fall into the $150,000 to $199,999 income bracket, making it the least populous group.
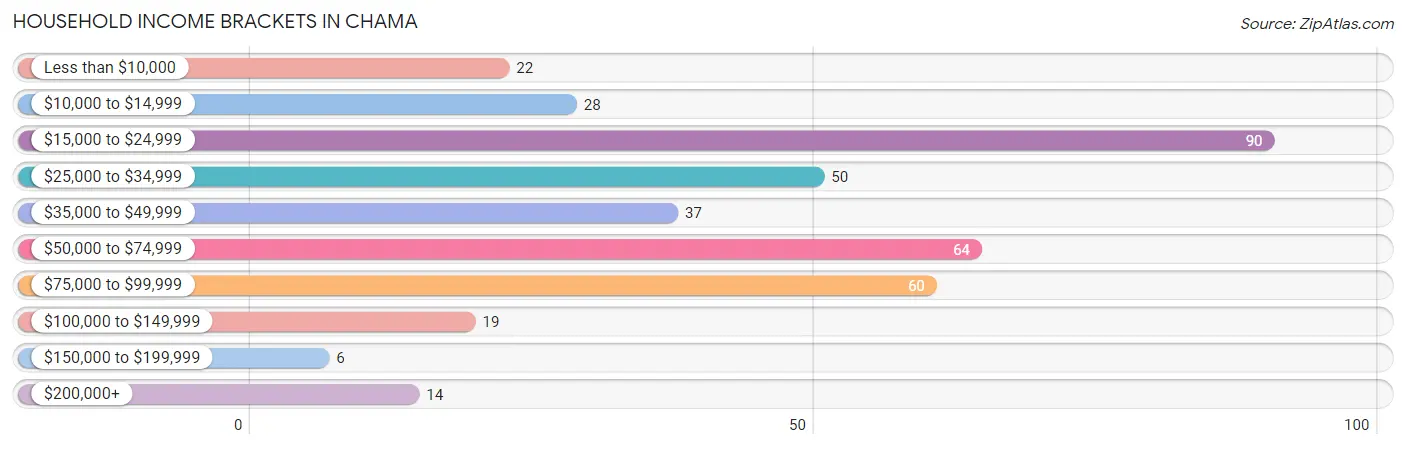
| Income Bracket | # Households | % Households |
| Less than $10,000 | 22 | 5.6% |
| $10,000 to $14,999 | 28 | 7.2% |
| $15,000 to $24,999 | 90 | 23.1% |
| $25,000 to $34,999 | 50 | 12.8% |
| $35,000 to $49,999 | 37 | 9.5% |
| $50,000 to $74,999 | 64 | 16.4% |
| $75,000 to $99,999 | 60 | 15.4% |
| $100,000 to $149,999 | 19 | 4.9% |
| $150,000 to $199,999 | 6 | 1.5% |
| $200,000+ | 14 | 3.6% |
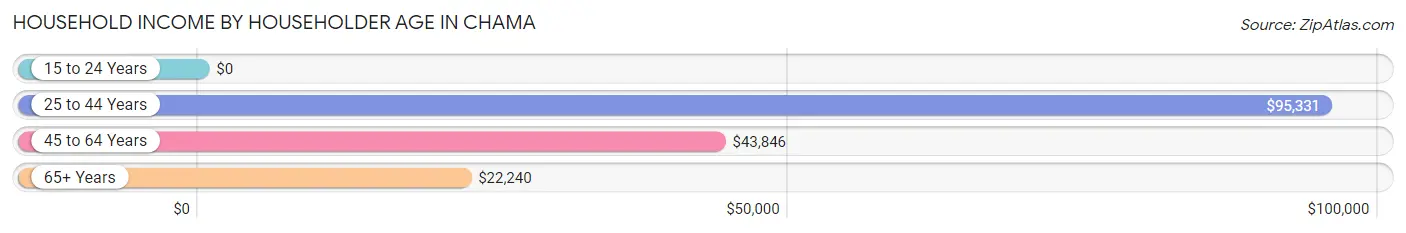
Household Income by Householder Age in Chama
The median household income in Chama is $40,521, with the highest median household income of $95,331 found in the 25 to 44 years age bracket for the primary householder. A total of 59 households (15.1%) fall into this category.
| Income Bracket | # Households | Median Income |
| 15 to 24 Years | 0 (0.0%) | $0 |
| 25 to 44 Years | 59 (15.1%) | $95,331 |
| 45 to 64 Years | 208 (53.3%) | $43,846 |
| 65+ Years | 123 (31.5%) | $22,240 |
| Total | 390 (100.0%) | $40,521 |
Poverty in Chama
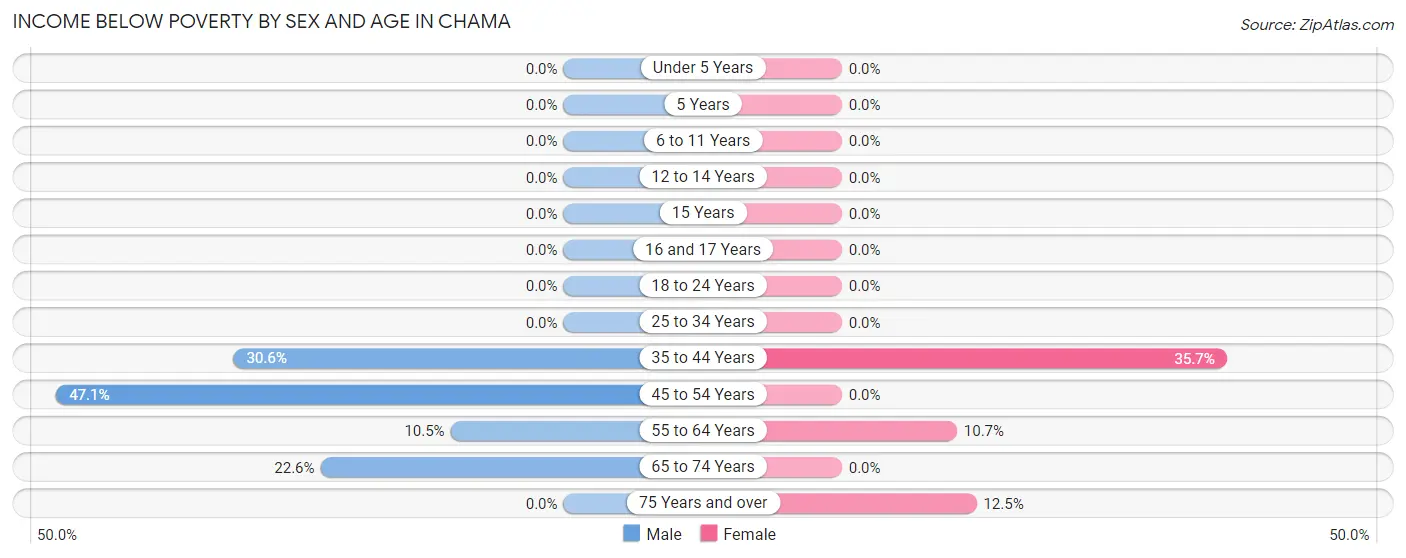
Income Below Poverty by Sex and Age in Chama
With 14.4% poverty level for males and 8.6% for females among the residents of Chama, 45 to 54 year old males and 35 to 44 year old females are the most vulnerable to poverty, with 16 males (47.1%) and 15 females (35.7%) in their respective age groups living below the poverty level.
| Age Bracket | Male | Female |
| Under 5 Years | 0 (0.0%) | 0 (0.0%) |
| 5 Years | 0 (0.0%) | 0 (0.0%) |
| 6 to 11 Years | 0 (0.0%) | 0 (0.0%) |
| 12 to 14 Years | 0 (0.0%) | 0 (0.0%) |
| 15 Years | 0 (0.0%) | 0 (0.0%) |
| 16 and 17 Years | 0 (0.0%) | 0 (0.0%) |
| 18 to 24 Years | 0 (0.0%) | 0 (0.0%) |
| 25 to 34 Years | 0 (0.0%) | 0 (0.0%) |
| 35 to 44 Years | 15 (30.6%) | 15 (35.7%) |
| 45 to 54 Years | 16 (47.1%) | 0 (0.0%) |
| 55 to 64 Years | 11 (10.5%) | 11 (10.7%) |
| 65 to 74 Years | 23 (22.6%) | 0 (0.0%) |
| 75 Years and over | 0 (0.0%) | 4 (12.5%) |
| Total | 65 (14.4%) | 30 (8.6%) |
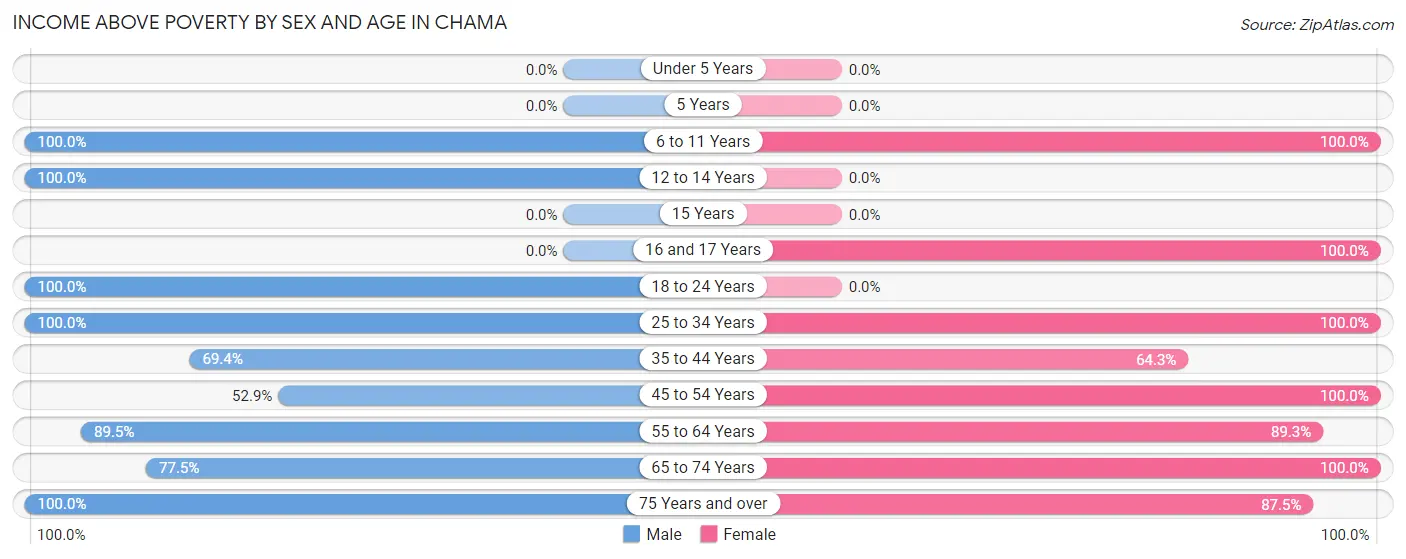
Income Above Poverty by Sex and Age in Chama
According to the poverty statistics in Chama, males aged 6 to 11 years and females aged 6 to 11 years are the age groups that are most secure financially, with 100.0% of males and 100.0% of females in these age groups living above the poverty line.
| Age Bracket | Male | Female |
| Under 5 Years | 0 (0.0%) | 0 (0.0%) |
| 5 Years | 0 (0.0%) | 0 (0.0%) |
| 6 to 11 Years | 9 (100.0%) | 8 (100.0%) |
| 12 to 14 Years | 24 (100.0%) | 0 (0.0%) |
| 15 Years | 0 (0.0%) | 0 (0.0%) |
| 16 and 17 Years | 0 (0.0%) | 2 (100.0%) |
| 18 to 24 Years | 62 (100.0%) | 0 (0.0%) |
| 25 to 34 Years | 10 (100.0%) | 63 (100.0%) |
| 35 to 44 Years | 34 (69.4%) | 27 (64.3%) |
| 45 to 54 Years | 18 (52.9%) | 53 (100.0%) |
| 55 to 64 Years | 94 (89.5%) | 92 (89.3%) |
| 65 to 74 Years | 79 (77.4%) | 48 (100.0%) |
| 75 Years and over | 55 (100.0%) | 28 (87.5%) |
| Total | 385 (85.6%) | 321 (91.4%) |
Income Below Poverty Among Married-Couple Families in Chama
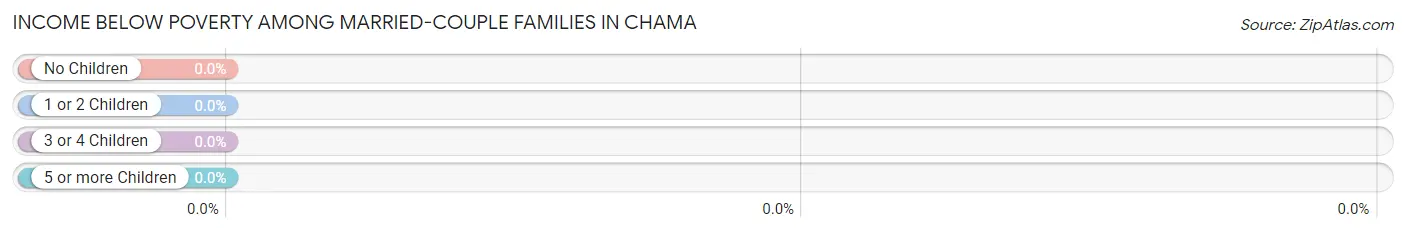
| Children | Above Poverty | Below Poverty |
| No Children | 140 (100.0%) | 0 (0.0%) |
| 1 or 2 Children | 36 (100.0%) | 0 (0.0%) |
| 3 or 4 Children | 0 (0.0%) | 0 (0.0%) |
| 5 or more Children | 0 (0.0%) | 0 (0.0%) |
| Total | 176 (100.0%) | 0 (0.0%) |
Income Below Poverty Among Single-Parent Households in Chama
| Children | Single Father | Single Mother |
| No Children | 0 (0.0%) | 0 (0.0%) |
| 1 or 2 Children | 0 (0.0%) | 0 (0.0%) |
| 3 or 4 Children | 0 (0.0%) | 0 (0.0%) |
| 5 or more Children | 0 (0.0%) | 0 (0.0%) |
| Total | 0 (0.0%) | 0 (0.0%) |
Income Below Poverty Among Married-Couple vs Single-Parent Households in Chama
| Children | Married-Couple Families | Single-Parent Households |
| No Children | 0 (0.0%) | 0 (0.0%) |
| 1 or 2 Children | 0 (0.0%) | 0 (0.0%) |
| 3 or 4 Children | 0 (0.0%) | 0 (0.0%) |
| 5 or more Children | 0 (0.0%) | 0 (0.0%) |
| Total | 0 (0.0%) | 0 (0.0%) |
Race in Chama
The most populous races in Chama are Hispanic or Latino (648 | 80.9%), Some other Race (497 | 62.1%), and White / Caucasian (290 | 36.2%).
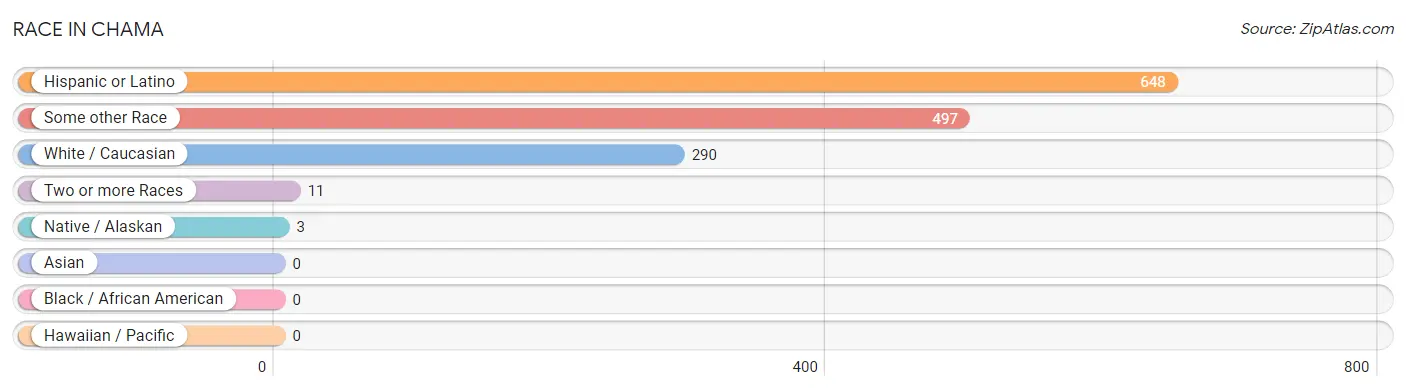
| Race | # Population | % Population |
| Asian | 0 | 0.0% |
| Black / African American | 0 | 0.0% |
| Hawaiian / Pacific | 0 | 0.0% |
| Hispanic or Latino | 648 | 80.9% |
| Native / Alaskan | 3 | 0.4% |
| White / Caucasian | 290 | 36.2% |
| Two or more Races | 11 | 1.4% |
| Some other Race | 497 | 62.1% |
| Total | 801 | 100.0% |
Ancestry in Chama
The most populous ancestries reported in Chama are Mexican (96 | 12.0%), German (76 | 9.5%), Spanish (75 | 9.4%), English (37 | 4.6%), and Scotch-Irish (25 | 3.1%), together accounting for 38.6% of all Chama residents.
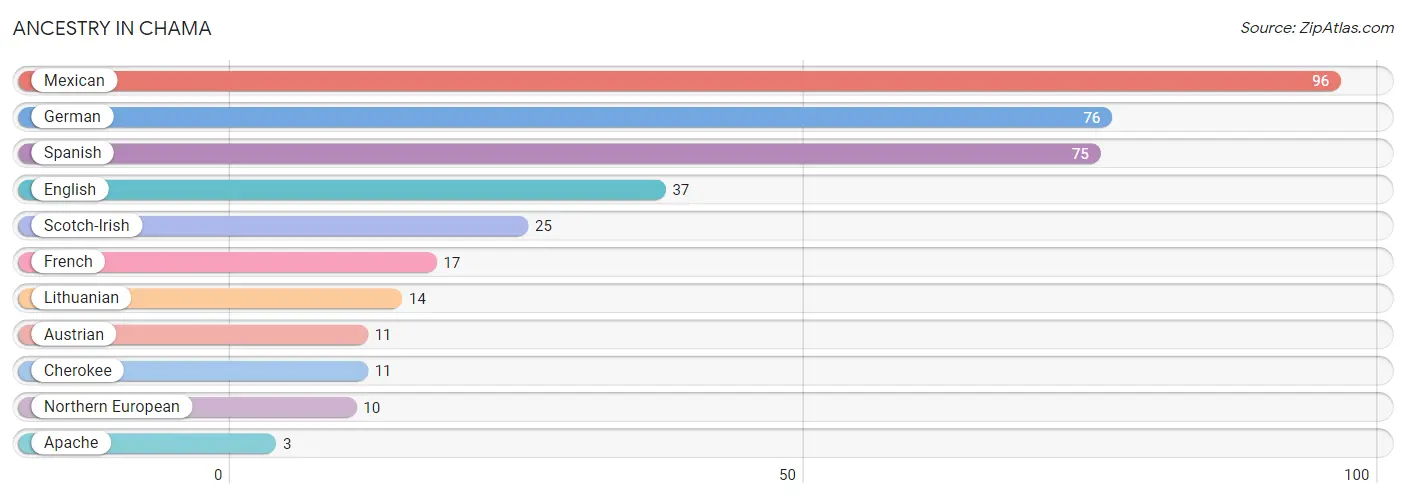
| Ancestry | # Population | % Population |
| Apache | 3 | 0.4% |
| Austrian | 11 | 1.4% |
| Cherokee | 11 | 1.4% |
| English | 37 | 4.6% |
| French | 17 | 2.1% |
| German | 76 | 9.5% |
| Lithuanian | 14 | 1.8% |
| Mexican | 96 | 12.0% |
| Northern European | 10 | 1.3% |
| Scotch-Irish | 25 | 3.1% |
| Spanish | 75 | 9.4% | View All 11 Rows |
Immigrants in Chama

| Immigration Origin | # Population | % Population | View All 0 Rows |
Sex and Age in Chama
Sex and Age in Chama
The most populous age groups in Chama are 65 to 69 Years (64 | 14.2%) for men and 60 to 64 Years (75 | 21.4%) for women.
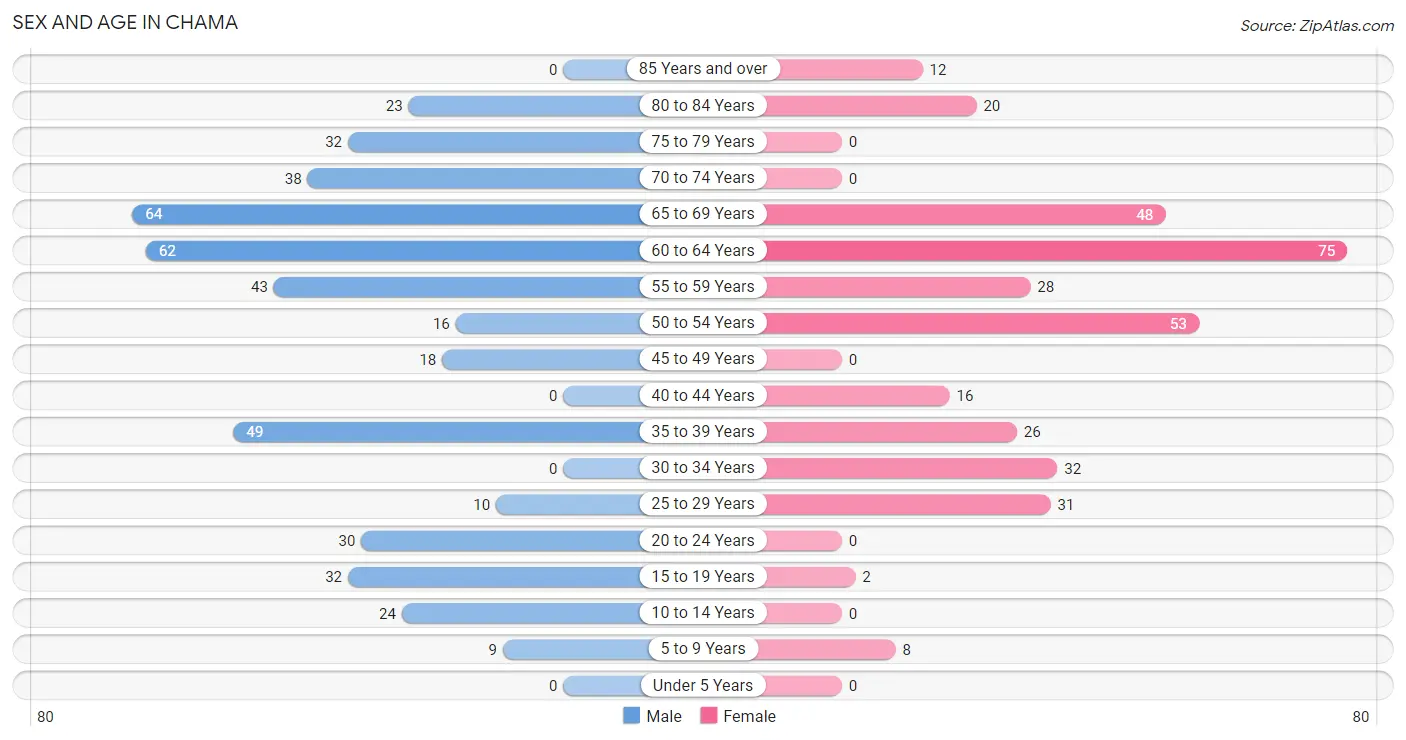
| Age Bracket | Male | Female |
| Under 5 Years | 0 (0.0%) | 0 (0.0%) |
| 5 to 9 Years | 9 (2.0%) | 8 (2.3%) |
| 10 to 14 Years | 24 (5.3%) | 0 (0.0%) |
| 15 to 19 Years | 32 (7.1%) | 2 (0.6%) |
| 20 to 24 Years | 30 (6.7%) | 0 (0.0%) |
| 25 to 29 Years | 10 (2.2%) | 31 (8.8%) |
| 30 to 34 Years | 0 (0.0%) | 32 (9.1%) |
| 35 to 39 Years | 49 (10.9%) | 26 (7.4%) |
| 40 to 44 Years | 0 (0.0%) | 16 (4.6%) |
| 45 to 49 Years | 18 (4.0%) | 0 (0.0%) |
| 50 to 54 Years | 16 (3.6%) | 53 (15.1%) |
| 55 to 59 Years | 43 (9.6%) | 28 (8.0%) |
| 60 to 64 Years | 62 (13.8%) | 75 (21.4%) |
| 65 to 69 Years | 64 (14.2%) | 48 (13.7%) |
| 70 to 74 Years | 38 (8.4%) | 0 (0.0%) |
| 75 to 79 Years | 32 (7.1%) | 0 (0.0%) |
| 80 to 84 Years | 23 (5.1%) | 20 (5.7%) |
| 85 Years and over | 0 (0.0%) | 12 (3.4%) |
| Total | 450 (100.0%) | 351 (100.0%) |
Families and Households in Chama
Median Family Size in Chama
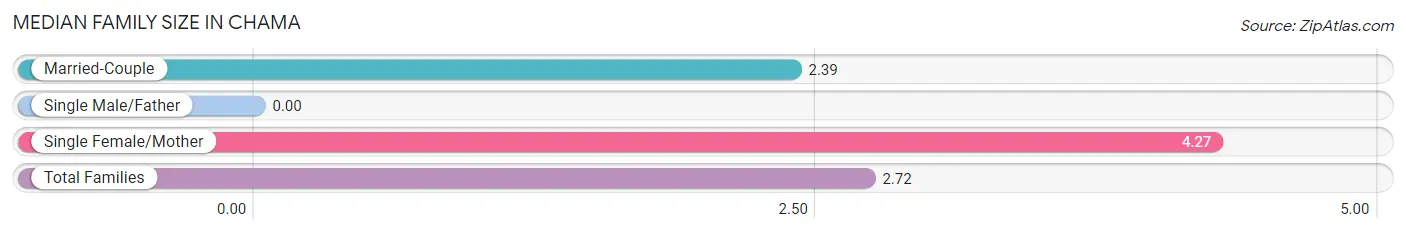
| Family Type | # Families | Family Size |
| Married-Couple | 176 (82.6%) | 2.39 |
| Single Male/Father | 0 (0.0%) | - |
| Single Female/Mother | 37 (17.4%) | 4.27 |
| Total Families | 213 (100.0%) | 2.72 |
Median Household Size in Chama
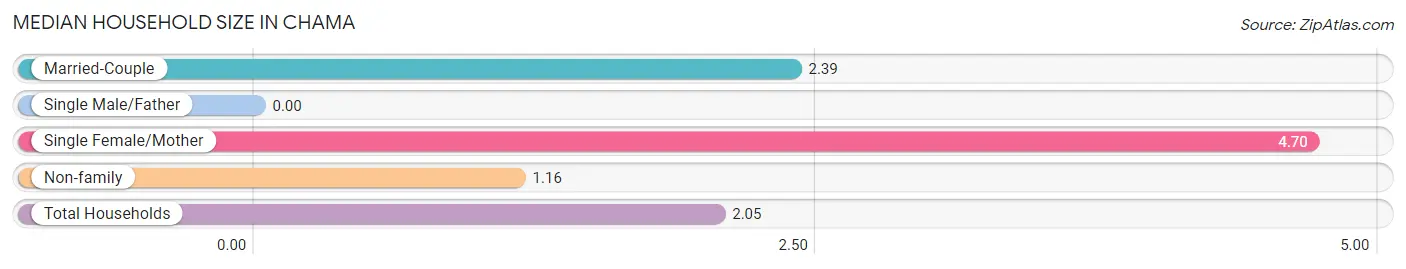
| Household Type | # Households | Household Size |
| Married-Couple | 176 (45.1%) | 2.39 |
| Single Male/Father | 0 (0.0%) | - |
| Single Female/Mother | 37 (9.5%) | 4.70 |
| Non-family | 177 (45.4%) | 1.16 |
| Total Households | 390 (100.0%) | 2.05 |
Household Size by Marriage Status in Chama
Out of a total of 390 households in Chama, 213 (54.6%) are family households, while 177 (45.4%) are nonfamily households. The most numerous type of family households are 2-person households, comprising 151, and the most common type of nonfamily households are 1-person households, comprising 152.
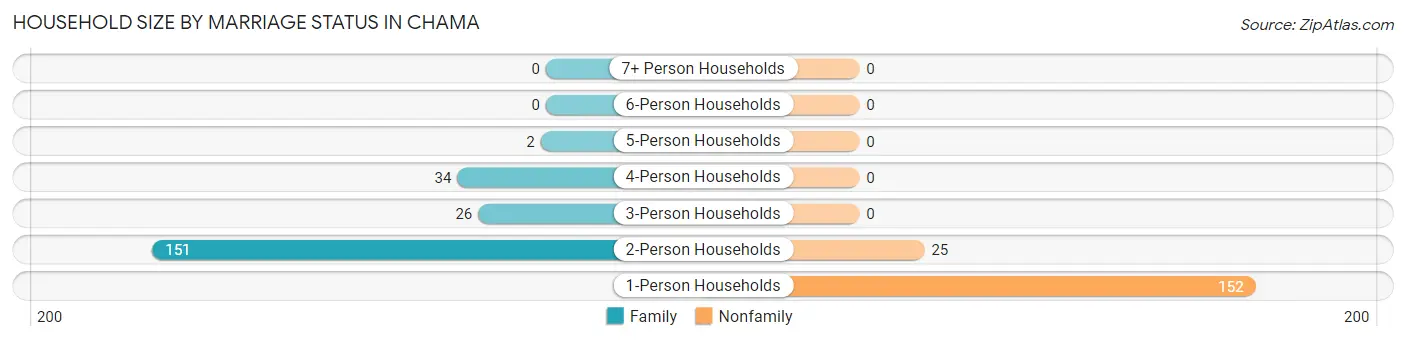
| Household Size | Family Households | Nonfamily Households |
| 1-Person Households | - | 152 (39.0%) |
| 2-Person Households | 151 (38.7%) | 25 (6.4%) |
| 3-Person Households | 26 (6.7%) | 0 (0.0%) |
| 4-Person Households | 34 (8.7%) | 0 (0.0%) |
| 5-Person Households | 2 (0.5%) | 0 (0.0%) |
| 6-Person Households | 0 (0.0%) | 0 (0.0%) |
| 7+ Person Households | 0 (0.0%) | 0 (0.0%) |
| Total | 213 (54.6%) | 177 (45.4%) |
Female Fertility in Chama
Fertility by Age in Chama
| Age Bracket | Women with Births | Births / 1,000 Women |
| 15 to 19 years | 0 (0.0%) | 0.0 |
| 20 to 34 years | 0 (0.0%) | 0.0 |
| 35 to 50 years | 0 (0.0%) | 0.0 |
| Total | 0 (0.0%) | 0.0 |
Fertility by Age by Marriage Status in Chama
| Age Bracket | Married | Unmarried |
| 15 to 19 years | 0 (0.0%) | 0 (0.0%) |
| 20 to 34 years | 0 (0.0%) | 0 (0.0%) |
| 35 to 50 years | 0 (0.0%) | 0 (0.0%) |
| Total | 0 (0.0%) | 0 (0.0%) |
Fertility by Education in Chama
| Educational Attainment | Women with Births | Births / 1,000 Women |
| Less than High School | 0 (0.0%) | 0.0 |
| High School Diploma | 0 (0.0%) | 0.0 |
| College or Associate's Degree | 0 (0.0%) | 0.0 |
| Bachelor's Degree | 0 (0.0%) | 0.0 |
| Graduate Degree | 0 (0.0%) | 0.0 |
| Total | 0 (0.0%) | 0.0 |
Fertility by Education by Marriage Status in Chama
| Educational Attainment | Married | Unmarried |
| Less than High School | 0 (0.0%) | 0 (0.0%) |
| High School Diploma | 0 (0.0%) | 0 (0.0%) |
| College or Associate's Degree | 0 (0.0%) | 0 (0.0%) |
| Bachelor's Degree | 0 (0.0%) | 0 (0.0%) |
| Graduate Degree | 0 (0.0%) | 0 (0.0%) |
| Total | 0 (0.0%) | 0 (0.0%) |
Employment Characteristics in Chama
Employment by Class of Employer in Chama
Among the 292 employed individuals in Chama, private company employees (183 | 62.7%), state government employees (43 | 14.7%), and federal government employees (19 | 6.5%) make up the most common classes of employment.
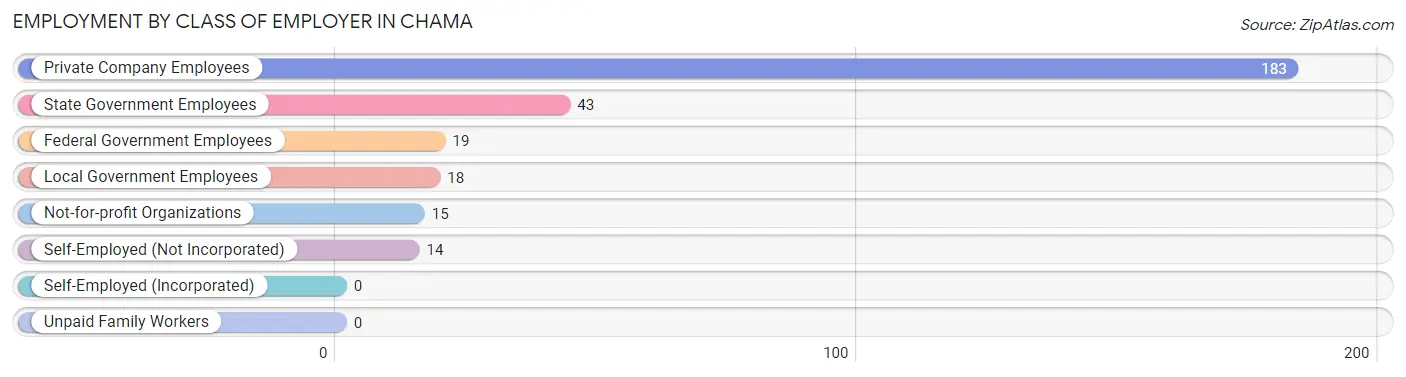
| Employer Class | # Employees | % Employees |
| Private Company Employees | 183 | 62.7% |
| Self-Employed (Incorporated) | 0 | 0.0% |
| Self-Employed (Not Incorporated) | 14 | 4.8% |
| Not-for-profit Organizations | 15 | 5.1% |
| Local Government Employees | 18 | 6.2% |
| State Government Employees | 43 | 14.7% |
| Federal Government Employees | 19 | 6.5% |
| Unpaid Family Workers | 0 | 0.0% |
| Total | 292 | 100.0% |
Employment Status by Age in Chama
According to the labor force statistics for Chama, out of the total population over 16 years of age (760), 47.0% or 357 individuals are in the labor force, with 18.2% or 65 of them unemployed. The age group with the highest labor force participation rate is 16 to 19 years, with 100.0% or 34 individuals in the labor force. Within the labor force, the 16 to 19 years age range has the highest percentage of unemployed individuals, with 94.1% or 32 of them being unemployed.
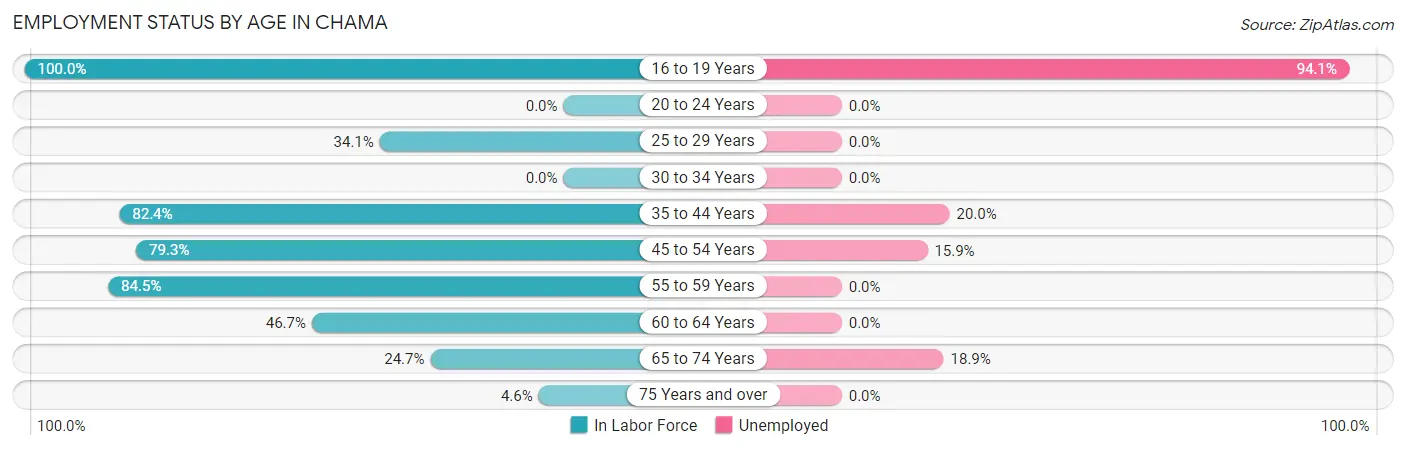
| Age Bracket | In Labor Force | Unemployed |
| 16 to 19 Years | 34 (100.0%) | 32 (94.1%) |
| 20 to 24 Years | 0 (0.0%) | 0 (0.0%) |
| 25 to 29 Years | 14 (34.1%) | 0 (0.0%) |
| 30 to 34 Years | 0 (0.0%) | 0 (0.0%) |
| 35 to 44 Years | 75 (82.4%) | 15 (20.0%) |
| 45 to 54 Years | 69 (79.3%) | 11 (15.9%) |
| 55 to 59 Years | 60 (84.5%) | 0 (0.0%) |
| 60 to 64 Years | 64 (46.7%) | 0 (0.0%) |
| 65 to 74 Years | 37 (24.7%) | 7 (18.9%) |
| 75 Years and over | 4 (4.6%) | 0 (0.0%) |
| Total | 357 (47.0%) | 65 (18.2%) |
Employment Status by Educational Attainment in Chama
According to labor force statistics for Chama, 61.4% of individuals (282) out of the total population between 25 and 64 years of age (459) are in the labor force, with 9.2% or 26 of them being unemployed. The group with the highest labor force participation rate are those with the educational attainment of bachelor's degree or higher, with 80.0% or 44 individuals in the labor force. Within the labor force, individuals with bachelor's degree or higher education have the highest percentage of unemployment, with 25.0% or 11 of them being unemployed.
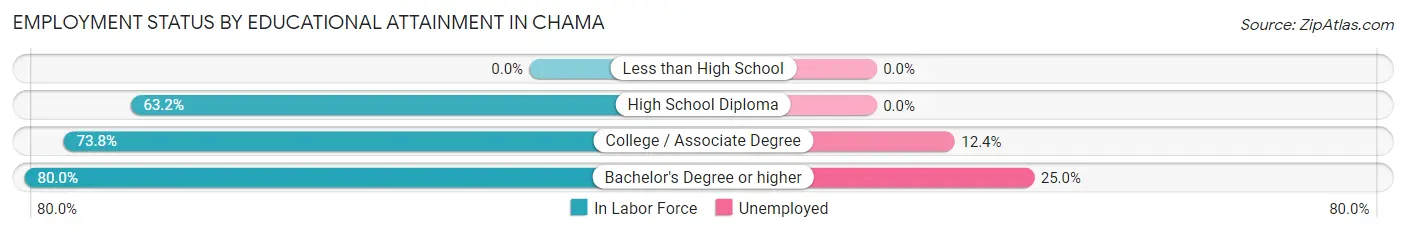
| Educational Attainment | In Labor Force | Unemployed |
| Less than High School | 0 (0.0%) | 0 (0.0%) |
| High School Diploma | 117 (63.2%) | 0 (0.0%) |
| College / Associate Degree | 121 (73.8%) | 20 (12.4%) |
| Bachelor's Degree or higher | 44 (80.0%) | 14 (25.0%) |
| Total | 282 (61.4%) | 42 (9.2%) |
Employment Occupations by Sex in Chama
Management, Business, Science and Arts Occupations
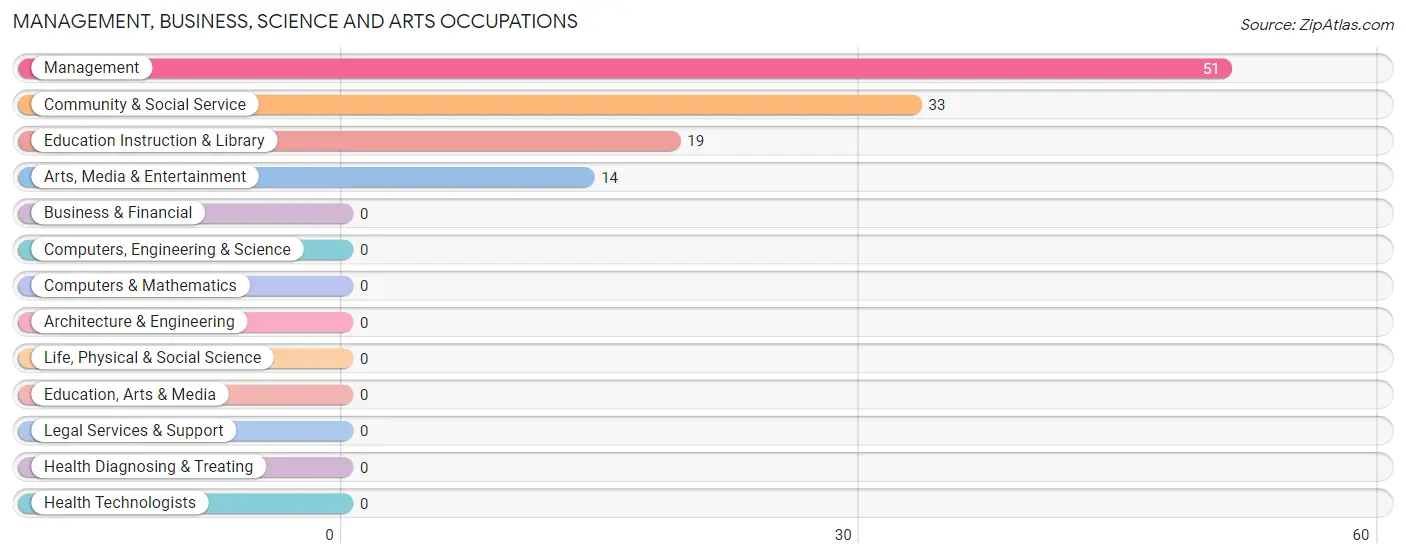
The most common Management, Business, Science and Arts occupations in Chama are Management (51 | 17.5%), Community & Social Service (33 | 11.3%), Education Instruction & Library (19 | 6.5%), and Arts, Media & Entertainment (14 | 4.8%).
Management, Business, Science and Arts Occupations by Sex
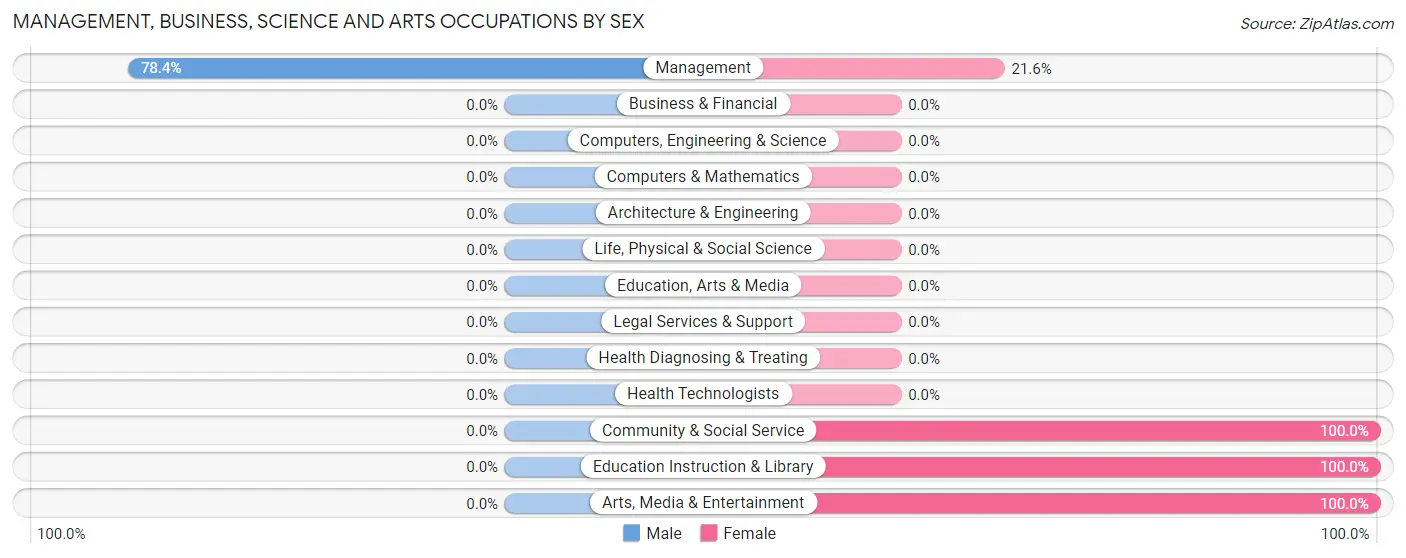
| Occupation | Male | Female |
| Management | 40 (78.4%) | 11 (21.6%) |
| Business & Financial | 0 (0.0%) | 0 (0.0%) |
| Computers, Engineering & Science | 0 (0.0%) | 0 (0.0%) |
| Computers & Mathematics | 0 (0.0%) | 0 (0.0%) |
| Architecture & Engineering | 0 (0.0%) | 0 (0.0%) |
| Life, Physical & Social Science | 0 (0.0%) | 0 (0.0%) |
| Community & Social Service | 0 (0.0%) | 33 (100.0%) |
| Education, Arts & Media | 0 (0.0%) | 0 (0.0%) |
| Legal Services & Support | 0 (0.0%) | 0 (0.0%) |
| Education Instruction & Library | 0 (0.0%) | 19 (100.0%) |
| Arts, Media & Entertainment | 0 (0.0%) | 14 (100.0%) |
| Health Diagnosing & Treating | 0 (0.0%) | 0 (0.0%) |
| Health Technologists | 0 (0.0%) | 0 (0.0%) |
| Total (Category) | 40 (47.6%) | 44 (52.4%) |
| Total (Overall) | 155 (53.1%) | 137 (46.9%) |
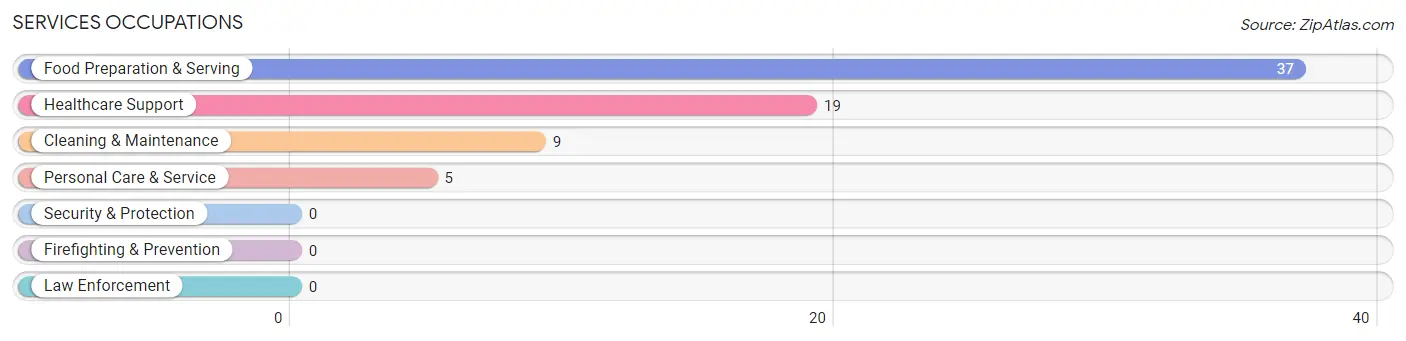
Services Occupations
The most common Services occupations in Chama are Food Preparation & Serving (37 | 12.7%), Healthcare Support (19 | 6.5%), Cleaning & Maintenance (9 | 3.1%), and Personal Care & Service (5 | 1.7%).
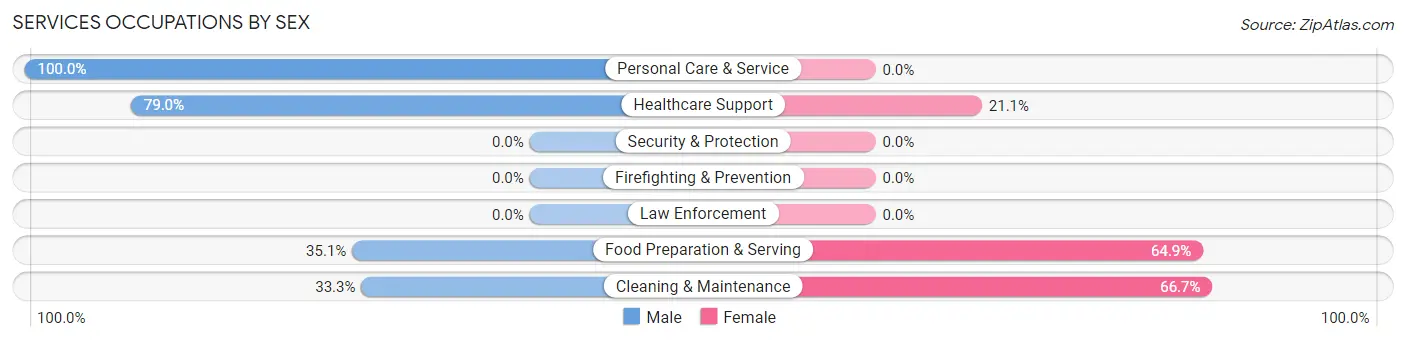
Services Occupations by Sex
Within the Services occupations in Chama, the most male-oriented occupations are Personal Care & Service (100.0%), Healthcare Support (78.9%), and Food Preparation & Serving (35.1%), while the most female-oriented occupations are Cleaning & Maintenance (66.7%), Food Preparation & Serving (64.9%), and Healthcare Support (21.0%).
| Occupation | Male | Female |
| Healthcare Support | 15 (78.9%) | 4 (21.0%) |
| Security & Protection | 0 (0.0%) | 0 (0.0%) |
| Firefighting & Prevention | 0 (0.0%) | 0 (0.0%) |
| Law Enforcement | 0 (0.0%) | 0 (0.0%) |
| Food Preparation & Serving | 13 (35.1%) | 24 (64.9%) |
| Cleaning & Maintenance | 3 (33.3%) | 6 (66.7%) |
| Personal Care & Service | 5 (100.0%) | 0 (0.0%) |
| Total (Category) | 36 (51.4%) | 34 (48.6%) |
| Total (Overall) | 155 (53.1%) | 137 (46.9%) |
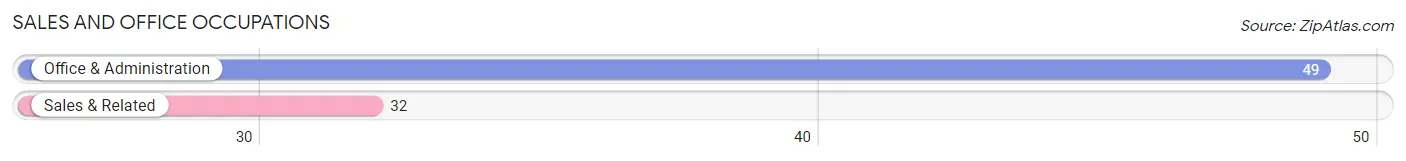
Sales and Office Occupations
The most common Sales and Office occupations in Chama are Office & Administration (49 | 16.8%), and Sales & Related (32 | 11.0%).
Sales and Office Occupations by Sex
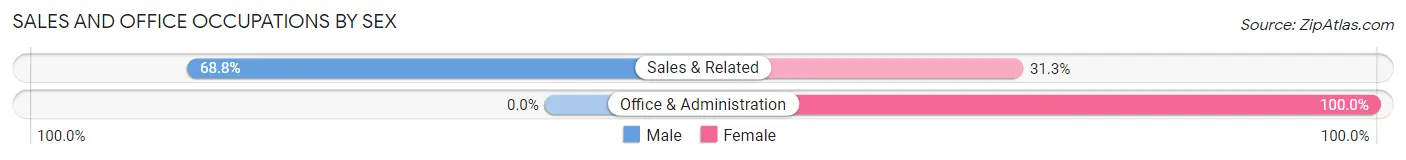
| Occupation | Male | Female |
| Sales & Related | 22 (68.8%) | 10 (31.2%) |
| Office & Administration | 0 (0.0%) | 49 (100.0%) |
| Total (Category) | 22 (27.2%) | 59 (72.8%) |
| Total (Overall) | 155 (53.1%) | 137 (46.9%) |
Natural Resources, Construction and Maintenance Occupations
The most common Natural Resources, Construction and Maintenance occupations in Chama are Installation, Maintenance & Repair (29 | 9.9%), and Construction & Extraction (28 | 9.6%).
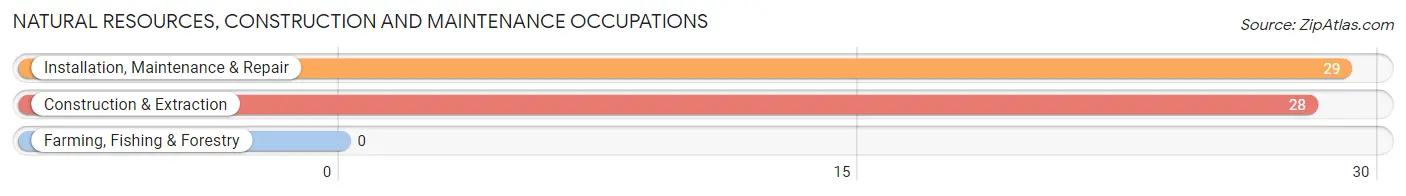
Natural Resources, Construction and Maintenance Occupations by Sex
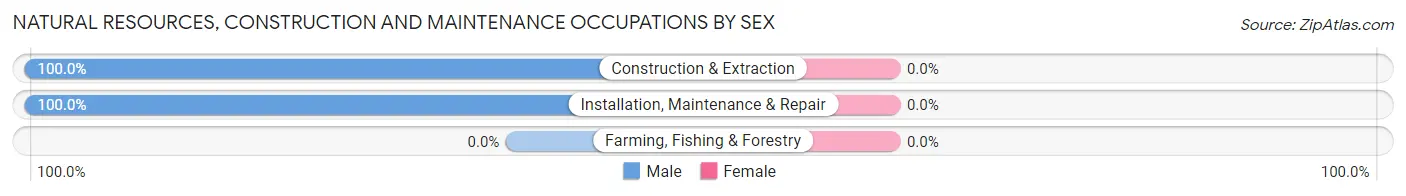
| Occupation | Male | Female |
| Farming, Fishing & Forestry | 0 (0.0%) | 0 (0.0%) |
| Construction & Extraction | 28 (100.0%) | 0 (0.0%) |
| Installation, Maintenance & Repair | 29 (100.0%) | 0 (0.0%) |
| Total (Category) | 57 (100.0%) | 0 (0.0%) |
| Total (Overall) | 155 (53.1%) | 137 (46.9%) |
Production, Transportation and Moving Occupations
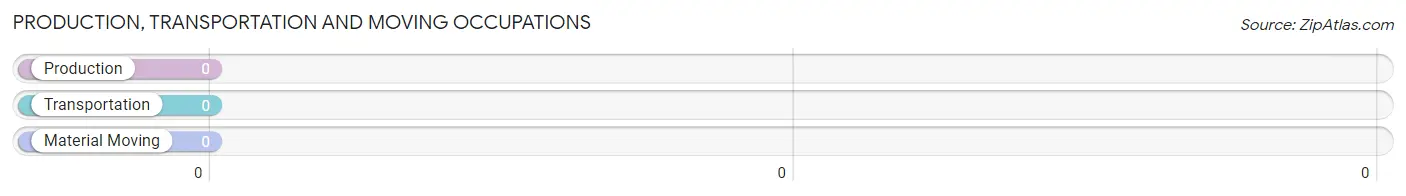
Production, Transportation and Moving Occupations by Sex
| Occupation | Male | Female |
| Production | 0 (0.0%) | 0 (0.0%) |
| Transportation | 0 (0.0%) | 0 (0.0%) |
| Material Moving | 0 (0.0%) | 0 (0.0%) |
| Total (Category) | 0 (0.0%) | 0 (0.0%) |
| Total (Overall) | 155 (53.1%) | 137 (46.9%) |
Employment Industries by Sex in Chama
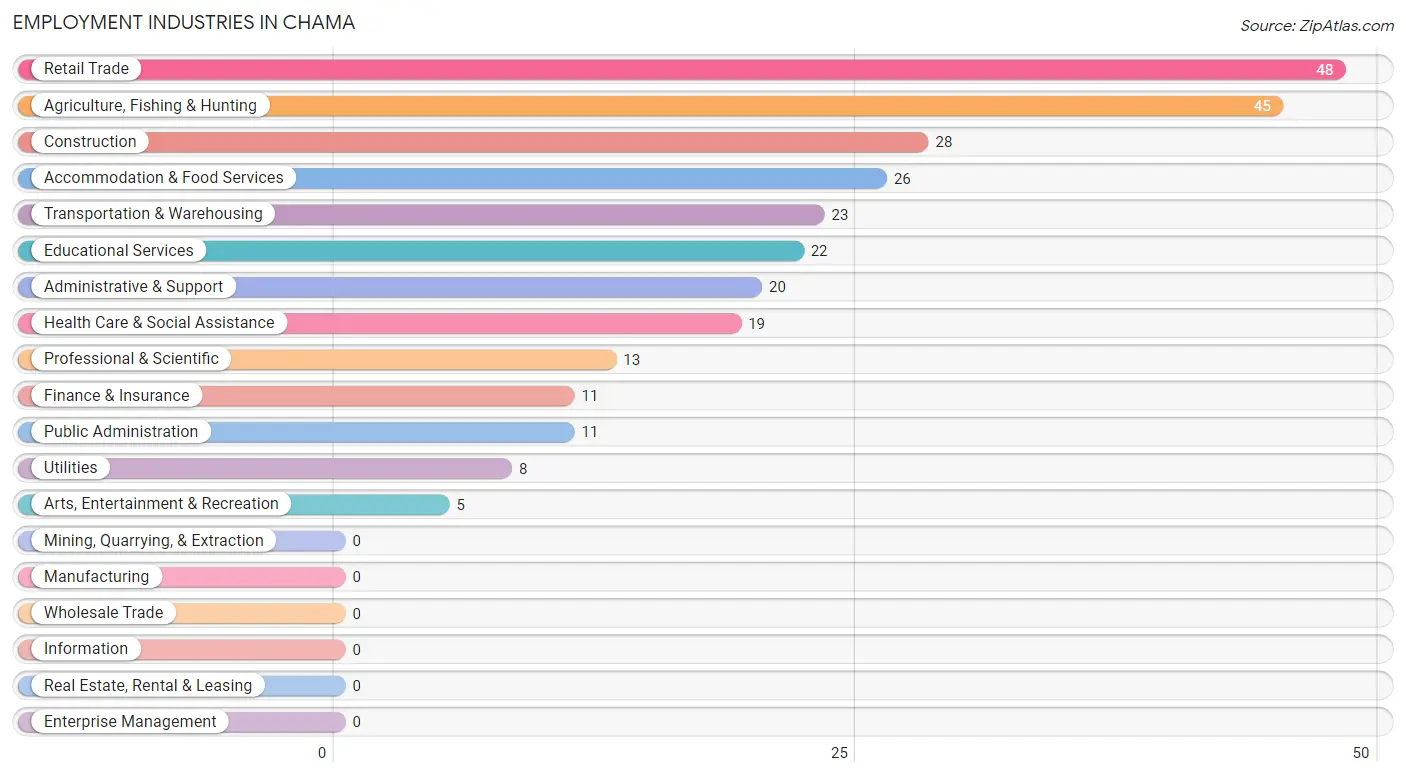
Employment Industries in Chama
The major employment industries in Chama include Retail Trade (48 | 16.4%), Agriculture, Fishing & Hunting (45 | 15.4%), Construction (28 | 9.6%), Accommodation & Food Services (26 | 8.9%), and Transportation & Warehousing (23 | 7.9%).
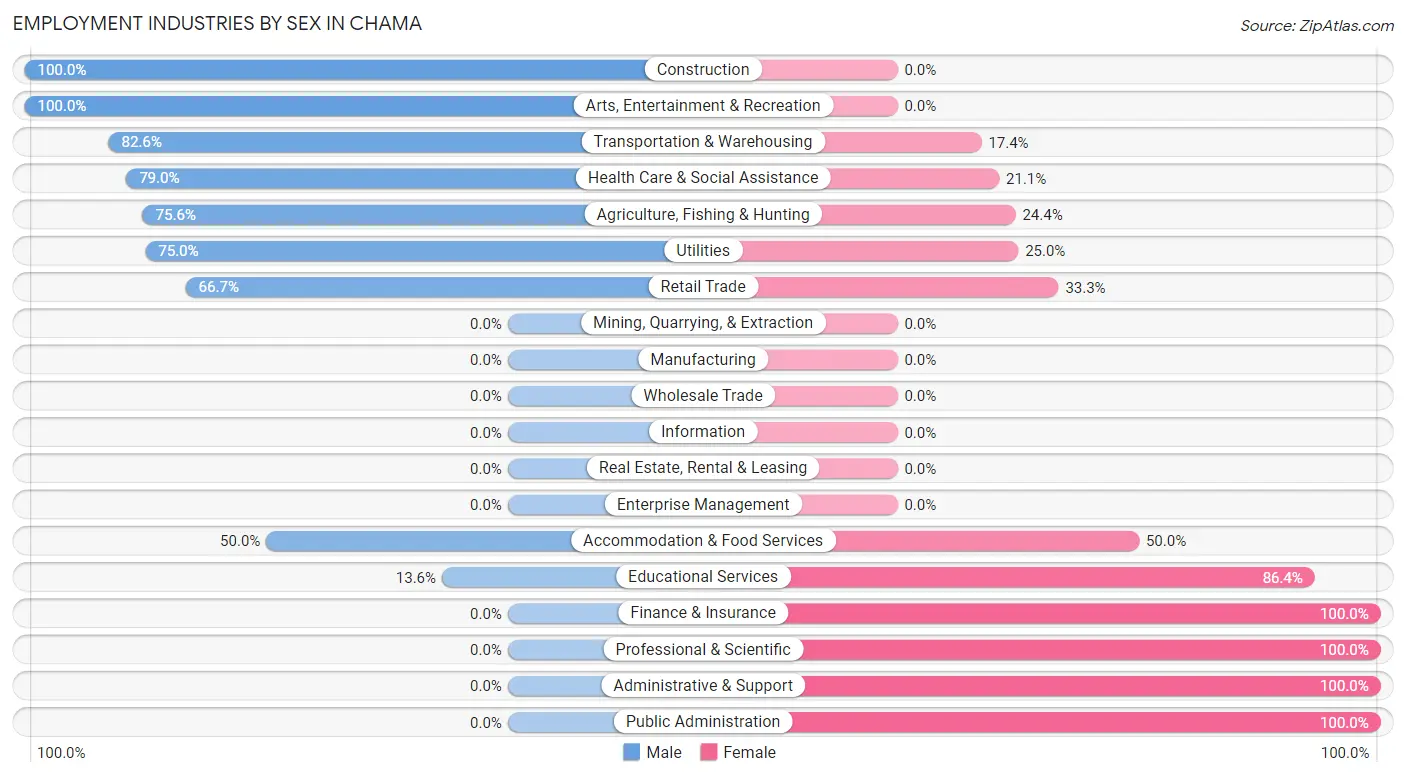
Employment Industries by Sex in Chama
The Chama industries that see more men than women are Construction (100.0%), Arts, Entertainment & Recreation (100.0%), and Transportation & Warehousing (82.6%), whereas the industries that tend to have a higher number of women are Finance & Insurance (100.0%), Professional & Scientific (100.0%), and Administrative & Support (100.0%).
| Industry | Male | Female |
| Agriculture, Fishing & Hunting | 34 (75.6%) | 11 (24.4%) |
| Mining, Quarrying, & Extraction | 0 (0.0%) | 0 (0.0%) |
| Construction | 28 (100.0%) | 0 (0.0%) |
| Manufacturing | 0 (0.0%) | 0 (0.0%) |
| Wholesale Trade | 0 (0.0%) | 0 (0.0%) |
| Retail Trade | 32 (66.7%) | 16 (33.3%) |
| Transportation & Warehousing | 19 (82.6%) | 4 (17.4%) |
| Utilities | 6 (75.0%) | 2 (25.0%) |
| Information | 0 (0.0%) | 0 (0.0%) |
| Finance & Insurance | 0 (0.0%) | 11 (100.0%) |
| Real Estate, Rental & Leasing | 0 (0.0%) | 0 (0.0%) |
| Professional & Scientific | 0 (0.0%) | 13 (100.0%) |
| Enterprise Management | 0 (0.0%) | 0 (0.0%) |
| Administrative & Support | 0 (0.0%) | 20 (100.0%) |
| Educational Services | 3 (13.6%) | 19 (86.4%) |
| Health Care & Social Assistance | 15 (78.9%) | 4 (21.0%) |
| Arts, Entertainment & Recreation | 5 (100.0%) | 0 (0.0%) |
| Accommodation & Food Services | 13 (50.0%) | 13 (50.0%) |
| Public Administration | 0 (0.0%) | 11 (100.0%) |
| Total | 155 (53.1%) | 137 (46.9%) |
Education in Chama
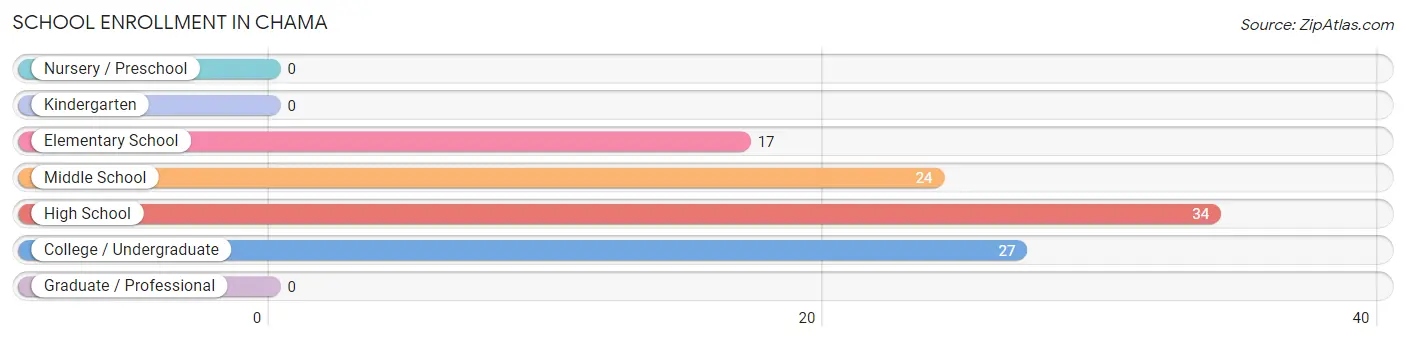
School Enrollment in Chama
The most common levels of schooling among the 102 students in Chama are high school (34 | 33.3%), college / undergraduate (27 | 26.5%), and middle school (24 | 23.5%).
| School Level | # Students | % Students |
| Nursery / Preschool | 0 | 0.0% |
| Kindergarten | 0 | 0.0% |
| Elementary School | 17 | 16.7% |
| Middle School | 24 | 23.5% |
| High School | 34 | 33.3% |
| College / Undergraduate | 27 | 26.5% |
| Graduate / Professional | 0 | 0.0% |
| Total | 102 | 100.0% |
School Enrollment by Age by Funding Source in Chama
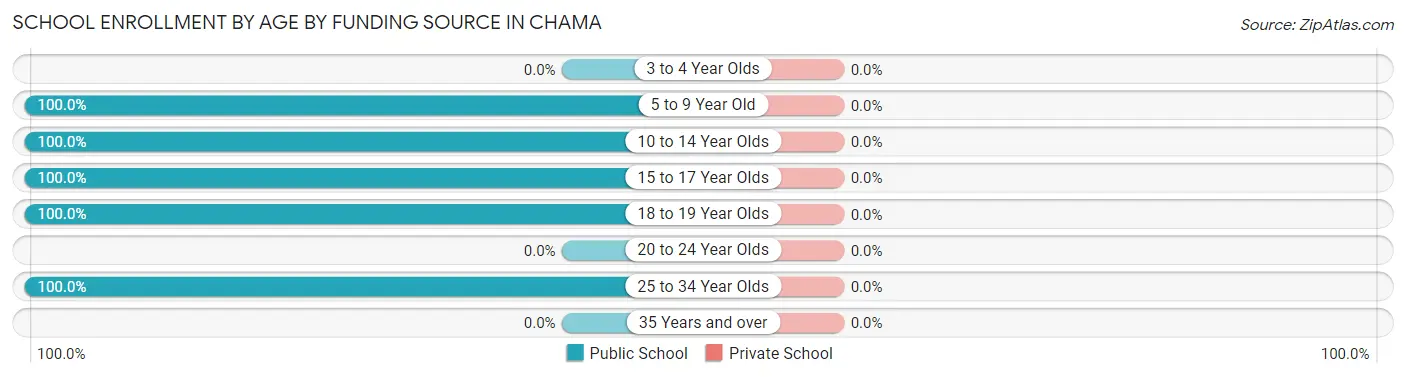
| Age Bracket | Public School | Private School |
| 3 to 4 Year Olds | 0 (0.0%) | 0 (0.0%) |
| 5 to 9 Year Old | 17 (100.0%) | 0 (0.0%) |
| 10 to 14 Year Olds | 24 (100.0%) | 0 (0.0%) |
| 15 to 17 Year Olds | 2 (100.0%) | 0 (0.0%) |
| 18 to 19 Year Olds | 32 (100.0%) | 0 (0.0%) |
| 20 to 24 Year Olds | 0 (0.0%) | 0 (0.0%) |
| 25 to 34 Year Olds | 27 (100.0%) | 0 (0.0%) |
| 35 Years and over | 0 (0.0%) | 0 (0.0%) |
| Total | 102 (100.0%) | 0 (0.0%) |
Educational Attainment by Field of Study in Chama
Business (40 | 32.5%), education (40 | 32.5%), bio, nature & agricultural (15 | 12.2%), physical & health sciences (14 | 11.4%), and psychology (14 | 11.4%) are the most common fields of study among 123 individuals in Chama who have obtained a bachelor's degree or higher.
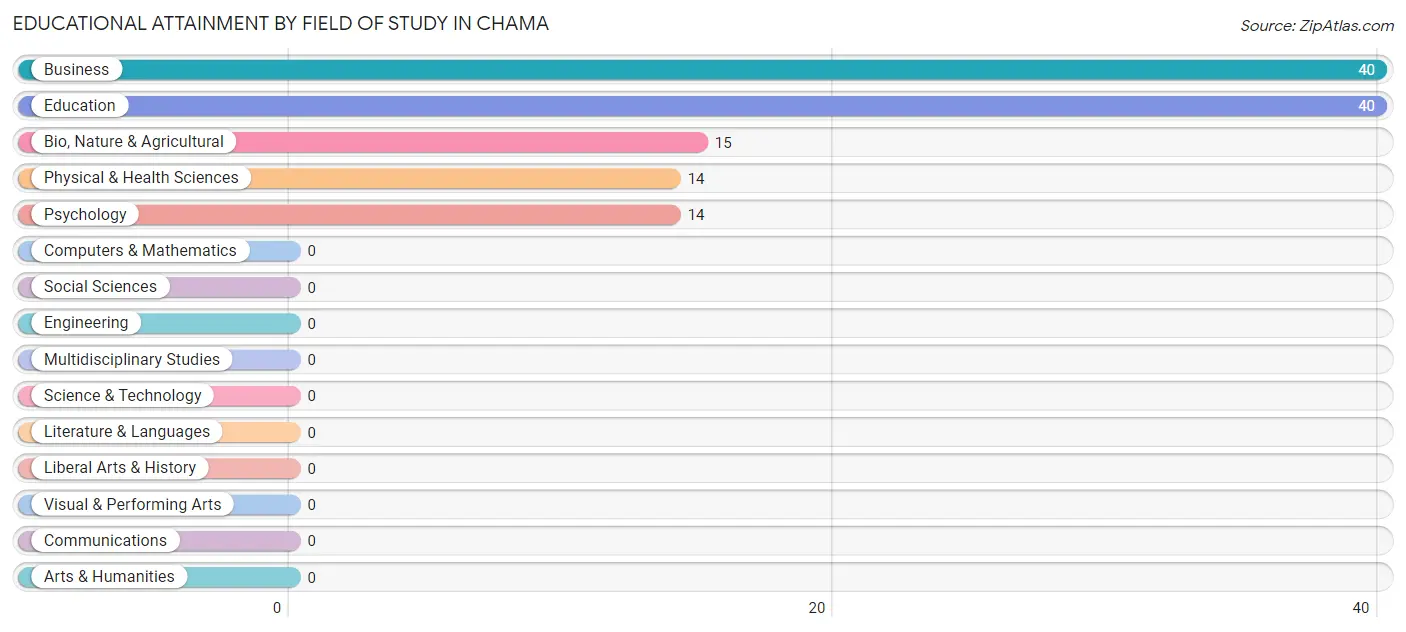
| Field of Study | # Graduates | % Graduates |
| Computers & Mathematics | 0 | 0.0% |
| Bio, Nature & Agricultural | 15 | 12.2% |
| Physical & Health Sciences | 14 | 11.4% |
| Psychology | 14 | 11.4% |
| Social Sciences | 0 | 0.0% |
| Engineering | 0 | 0.0% |
| Multidisciplinary Studies | 0 | 0.0% |
| Science & Technology | 0 | 0.0% |
| Business | 40 | 32.5% |
| Education | 40 | 32.5% |
| Literature & Languages | 0 | 0.0% |
| Liberal Arts & History | 0 | 0.0% |
| Visual & Performing Arts | 0 | 0.0% |
| Communications | 0 | 0.0% |
| Arts & Humanities | 0 | 0.0% |
| Total | 123 | 100.0% |
Transportation & Commute in Chama
Vehicle Availability by Sex in Chama
The most prevalent vehicle ownership categories in Chama are males with 2 vehicles (61, accounting for 39.4%) and females with 2 vehicles (16, making up 44.5%).
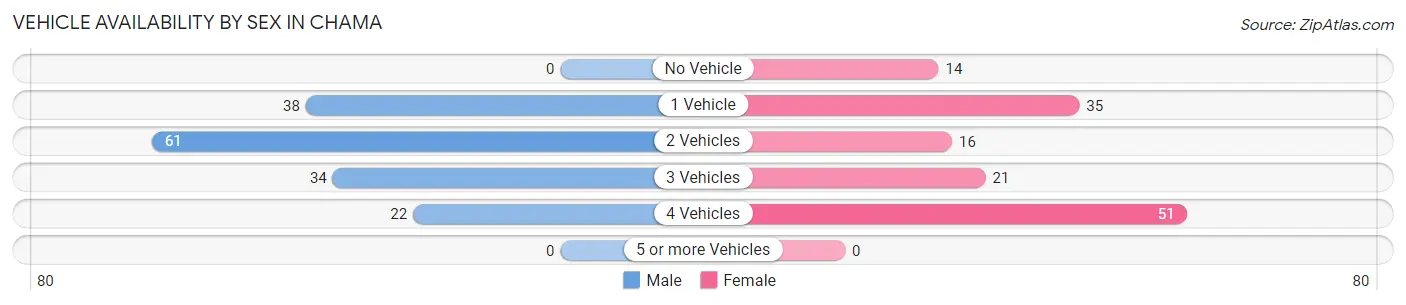
| Vehicles Available | Male | Female |
| No Vehicle | 0 (0.0%) | 14 (10.2%) |
| 1 Vehicle | 38 (24.5%) | 35 (25.6%) |
| 2 Vehicles | 61 (39.4%) | 16 (11.7%) |
| 3 Vehicles | 34 (21.9%) | 21 (15.3%) |
| 4 Vehicles | 22 (14.2%) | 51 (37.2%) |
| 5 or more Vehicles | 0 (0.0%) | 0 (0.0%) |
| Total | 155 (100.0%) | 137 (100.0%) |
Commute Time in Chama
The most frequently occuring commute durations in Chama are 5 to 9 minutes (106 commuters, 38.1%), 10 to 14 minutes (84 commuters, 30.2%), and less than 5 minutes (34 commuters, 12.2%).
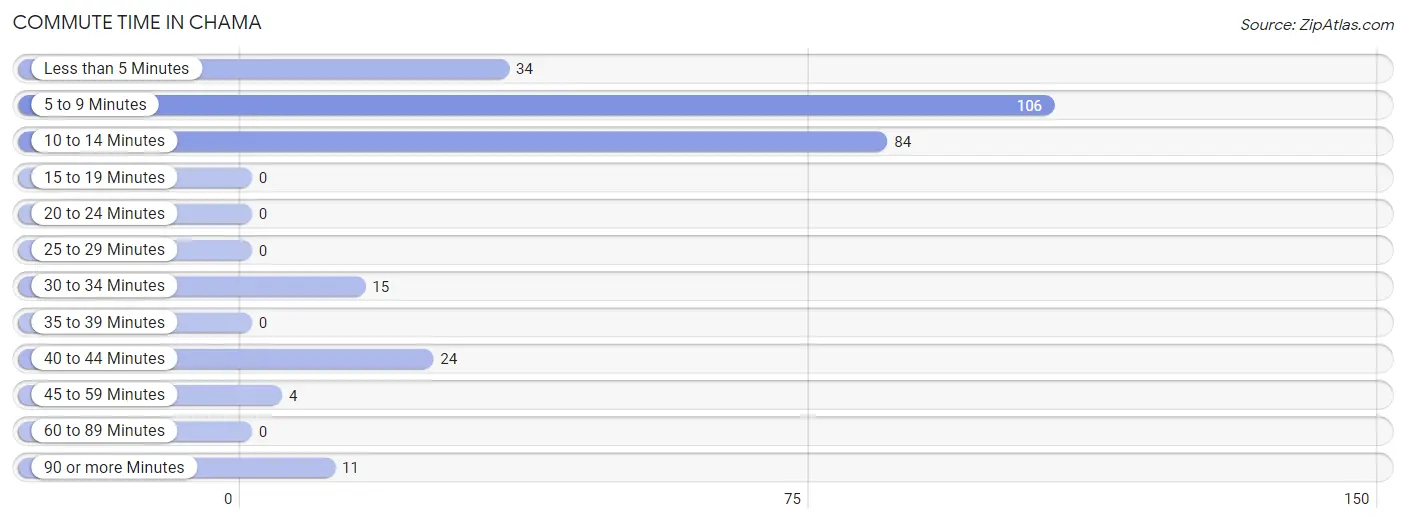
| Commute Time | # Commuters | % Commuters |
| Less than 5 Minutes | 34 | 12.2% |
| 5 to 9 Minutes | 106 | 38.1% |
| 10 to 14 Minutes | 84 | 30.2% |
| 15 to 19 Minutes | 0 | 0.0% |
| 20 to 24 Minutes | 0 | 0.0% |
| 25 to 29 Minutes | 0 | 0.0% |
| 30 to 34 Minutes | 15 | 5.4% |
| 35 to 39 Minutes | 0 | 0.0% |
| 40 to 44 Minutes | 24 | 8.6% |
| 45 to 59 Minutes | 4 | 1.4% |
| 60 to 89 Minutes | 0 | 0.0% |
| 90 or more Minutes | 11 | 4.0% |
Commute Time by Sex in Chama
The most common commute times in Chama are 5 to 9 minutes (78 commuters, 50.3%) for males and 10 to 14 minutes (40 commuters, 32.5%) for females.
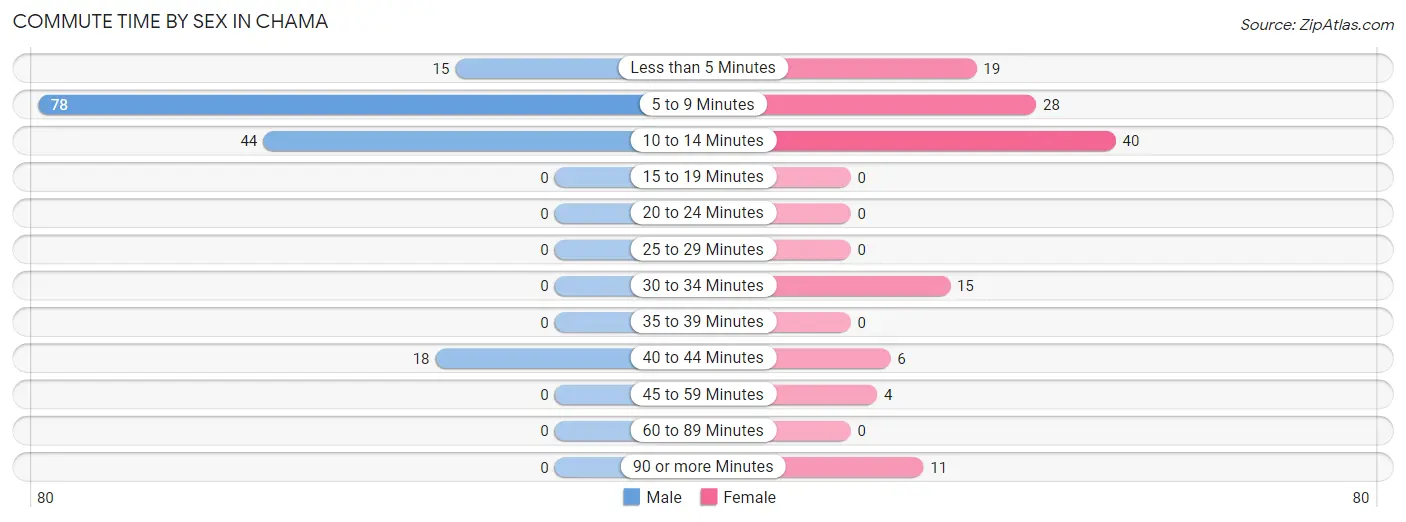
| Commute Time | Male | Female |
| Less than 5 Minutes | 15 (9.7%) | 19 (15.4%) |
| 5 to 9 Minutes | 78 (50.3%) | 28 (22.8%) |
| 10 to 14 Minutes | 44 (28.4%) | 40 (32.5%) |
| 15 to 19 Minutes | 0 (0.0%) | 0 (0.0%) |
| 20 to 24 Minutes | 0 (0.0%) | 0 (0.0%) |
| 25 to 29 Minutes | 0 (0.0%) | 0 (0.0%) |
| 30 to 34 Minutes | 0 (0.0%) | 15 (12.2%) |
| 35 to 39 Minutes | 0 (0.0%) | 0 (0.0%) |
| 40 to 44 Minutes | 18 (11.6%) | 6 (4.9%) |
| 45 to 59 Minutes | 0 (0.0%) | 4 (3.3%) |
| 60 to 89 Minutes | 0 (0.0%) | 0 (0.0%) |
| 90 or more Minutes | 0 (0.0%) | 11 (8.9%) |
Time of Departure to Work by Sex in Chama
The most frequent times of departure to work in Chama are 7:00 AM to 7:29 AM (61, 39.4%) for males and 8:30 AM to 8:59 AM (36, 29.3%) for females.
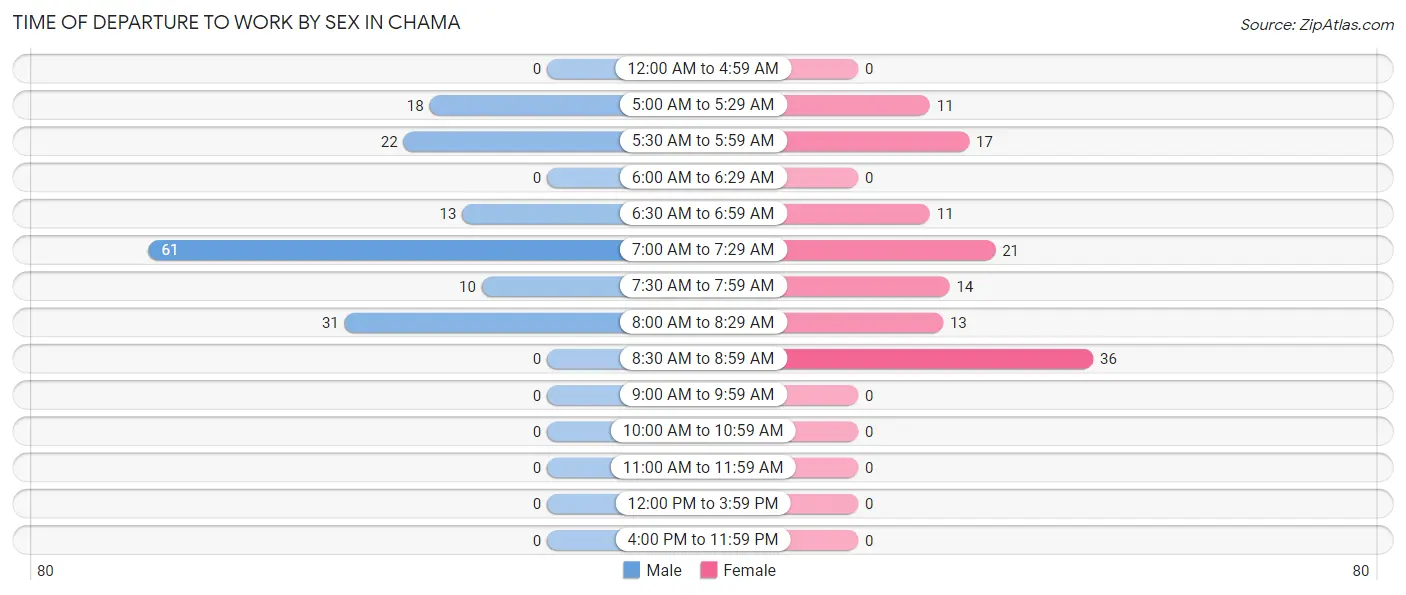
| Time of Departure | Male | Female |
| 12:00 AM to 4:59 AM | 0 (0.0%) | 0 (0.0%) |
| 5:00 AM to 5:29 AM | 18 (11.6%) | 11 (8.9%) |
| 5:30 AM to 5:59 AM | 22 (14.2%) | 17 (13.8%) |
| 6:00 AM to 6:29 AM | 0 (0.0%) | 0 (0.0%) |
| 6:30 AM to 6:59 AM | 13 (8.4%) | 11 (8.9%) |
| 7:00 AM to 7:29 AM | 61 (39.4%) | 21 (17.1%) |
| 7:30 AM to 7:59 AM | 10 (6.5%) | 14 (11.4%) |
| 8:00 AM to 8:29 AM | 31 (20.0%) | 13 (10.6%) |
| 8:30 AM to 8:59 AM | 0 (0.0%) | 36 (29.3%) |
| 9:00 AM to 9:59 AM | 0 (0.0%) | 0 (0.0%) |
| 10:00 AM to 10:59 AM | 0 (0.0%) | 0 (0.0%) |
| 11:00 AM to 11:59 AM | 0 (0.0%) | 0 (0.0%) |
| 12:00 PM to 3:59 PM | 0 (0.0%) | 0 (0.0%) |
| 4:00 PM to 11:59 PM | 0 (0.0%) | 0 (0.0%) |
| Total | 155 (100.0%) | 123 (100.0%) |
Housing Occupancy in Chama
Occupancy by Ownership in Chama
Of the total 390 dwellings in Chama, owner-occupied units account for 311 (79.7%), while renter-occupied units make up 79 (20.3%).
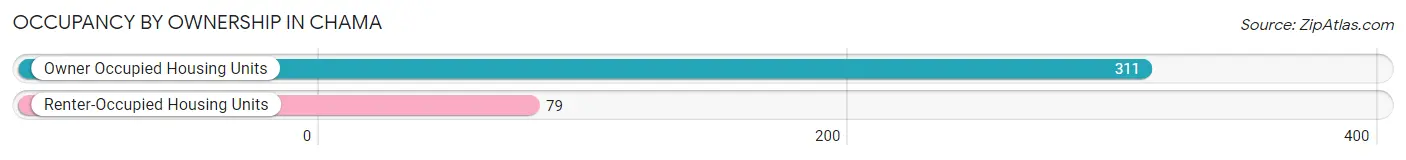
| Occupancy | # Housing Units | % Housing Units |
| Owner Occupied Housing Units | 311 | 79.7% |
| Renter-Occupied Housing Units | 79 | 20.3% |
| Total Occupied Housing Units | 390 | 100.0% |
Occupancy by Household Size in Chama
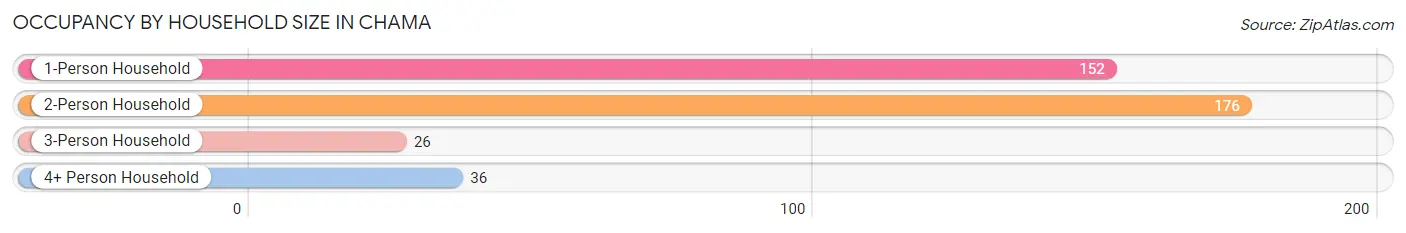
| Household Size | # Housing Units | % Housing Units |
| 1-Person Household | 152 | 39.0% |
| 2-Person Household | 176 | 45.1% |
| 3-Person Household | 26 | 6.7% |
| 4+ Person Household | 36 | 9.2% |
| Total Housing Units | 390 | 100.0% |
Occupancy by Ownership by Household Size in Chama
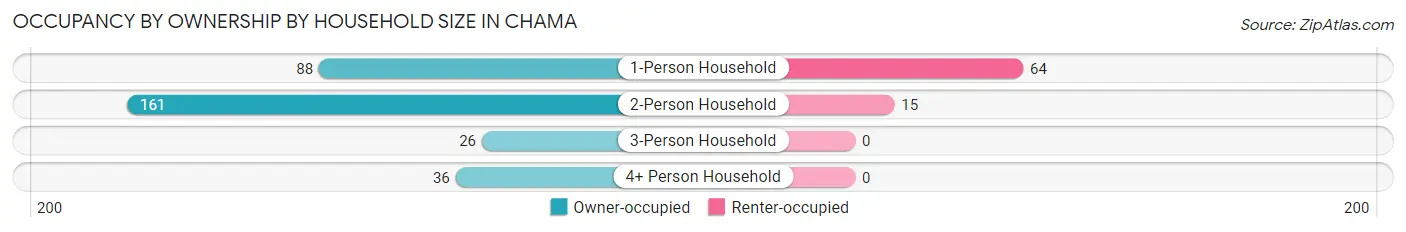
| Household Size | Owner-occupied | Renter-occupied |
| 1-Person Household | 88 (57.9%) | 64 (42.1%) |
| 2-Person Household | 161 (91.5%) | 15 (8.5%) |
| 3-Person Household | 26 (100.0%) | 0 (0.0%) |
| 4+ Person Household | 36 (100.0%) | 0 (0.0%) |
| Total Housing Units | 311 (79.7%) | 79 (20.3%) |
Occupancy by Educational Attainment in Chama
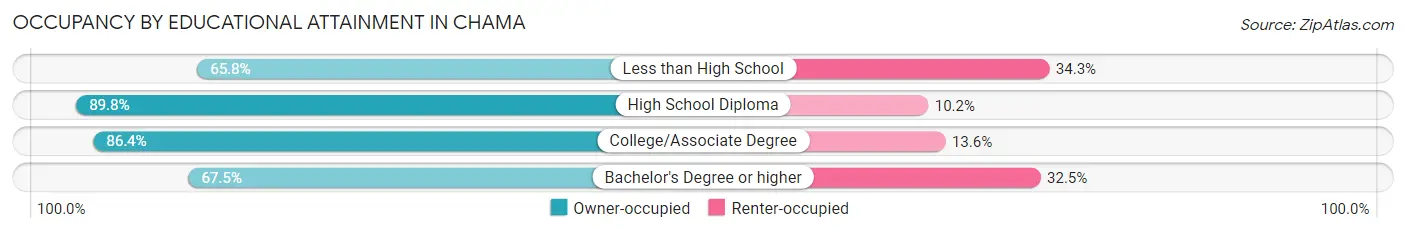
| Household Size | Owner-occupied | Renter-occupied |
| Less than High School | 48 (65.7%) | 25 (34.3%) |
| High School Diploma | 114 (89.8%) | 13 (10.2%) |
| College/Associate Degree | 95 (86.4%) | 15 (13.6%) |
| Bachelor's Degree or higher | 54 (67.5%) | 26 (32.5%) |
Occupancy by Age of Householder in Chama
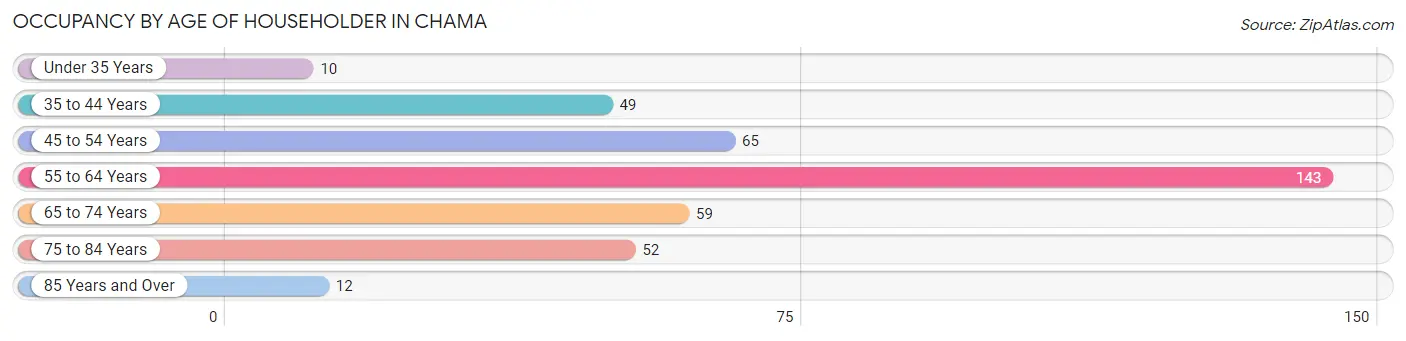
| Age Bracket | # Households | % Households |
| Under 35 Years | 10 | 2.6% |
| 35 to 44 Years | 49 | 12.6% |
| 45 to 54 Years | 65 | 16.7% |
| 55 to 64 Years | 143 | 36.7% |
| 65 to 74 Years | 59 | 15.1% |
| 75 to 84 Years | 52 | 13.3% |
| 85 Years and Over | 12 | 3.1% |
| Total | 390 | 100.0% |
Housing Finances in Chama
Median Income by Occupancy in Chama
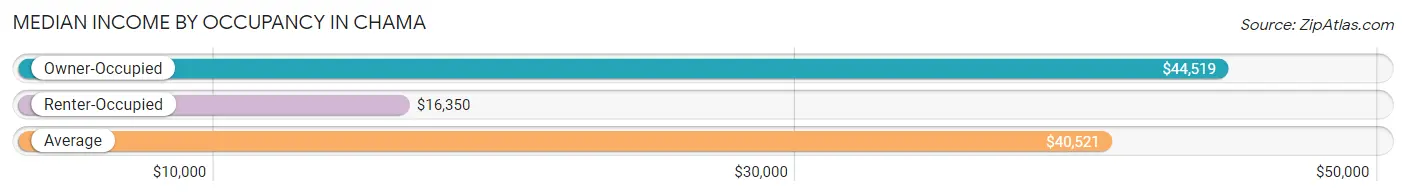
| Occupancy Type | # Households | Median Income |
| Owner-Occupied | 311 (79.7%) | $44,519 |
| Renter-Occupied | 79 (20.3%) | $16,350 |
| Average | 390 (100.0%) | $40,521 |
Occupancy by Householder Income Bracket in Chama
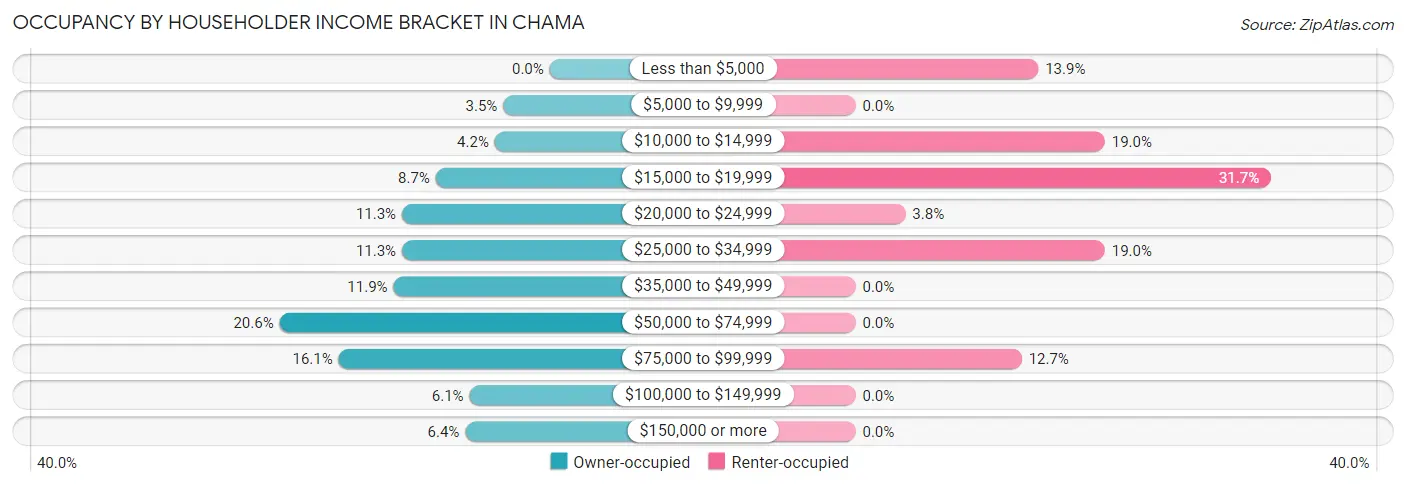
| Income Bracket | Owner-occupied | Renter-occupied |
| Less than $5,000 | 0 (0.0%) | 11 (13.9%) |
| $5,000 to $9,999 | 11 (3.5%) | 0 (0.0%) |
| $10,000 to $14,999 | 13 (4.2%) | 15 (19.0%) |
| $15,000 to $19,999 | 27 (8.7%) | 25 (31.7%) |
| $20,000 to $24,999 | 35 (11.3%) | 3 (3.8%) |
| $25,000 to $34,999 | 35 (11.3%) | 15 (19.0%) |
| $35,000 to $49,999 | 37 (11.9%) | 0 (0.0%) |
| $50,000 to $74,999 | 64 (20.6%) | 0 (0.0%) |
| $75,000 to $99,999 | 50 (16.1%) | 10 (12.7%) |
| $100,000 to $149,999 | 19 (6.1%) | 0 (0.0%) |
| $150,000 or more | 20 (6.4%) | 0 (0.0%) |
| Total | 311 (100.0%) | 79 (100.0%) |
Monthly Housing Cost Tiers in Chama
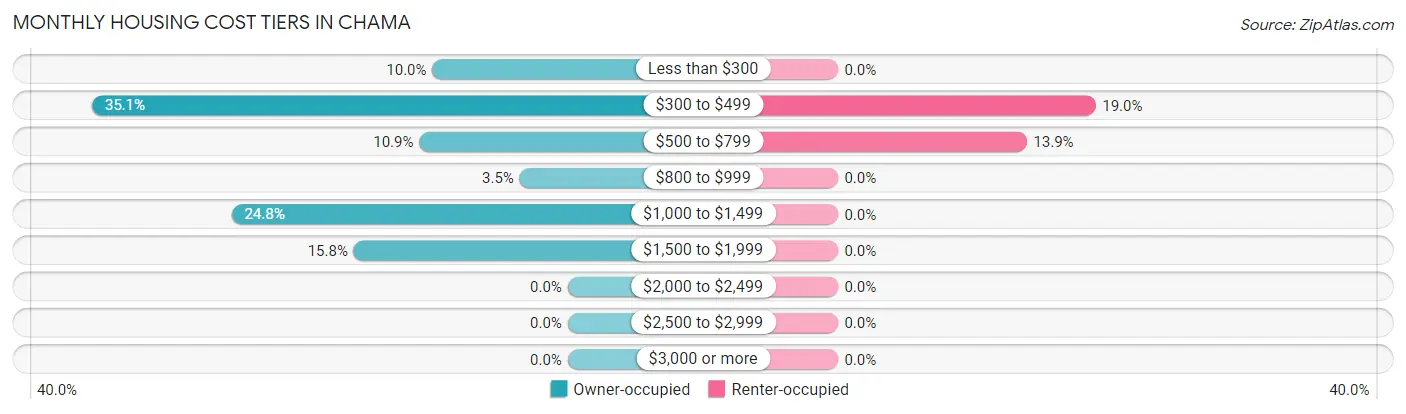
| Monthly Cost | Owner-occupied | Renter-occupied |
| Less than $300 | 31 (10.0%) | 0 (0.0%) |
| $300 to $499 | 109 (35.0%) | 15 (19.0%) |
| $500 to $799 | 34 (10.9%) | 11 (13.9%) |
| $800 to $999 | 11 (3.5%) | 0 (0.0%) |
| $1,000 to $1,499 | 77 (24.8%) | 0 (0.0%) |
| $1,500 to $1,999 | 49 (15.8%) | 0 (0.0%) |
| $2,000 to $2,499 | 0 (0.0%) | 0 (0.0%) |
| $2,500 to $2,999 | 0 (0.0%) | 0 (0.0%) |
| $3,000 or more | 0 (0.0%) | 0 (0.0%) |
| Total | 311 (100.0%) | 79 (100.0%) |
Physical Housing Characteristics in Chama
Housing Structures in Chama
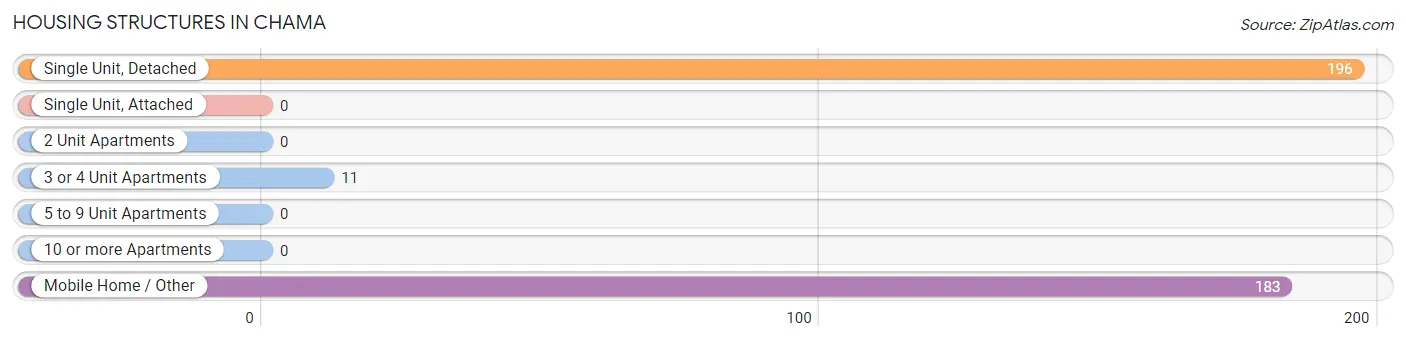
| Structure Type | # Housing Units | % Housing Units |
| Single Unit, Detached | 196 | 50.3% |
| Single Unit, Attached | 0 | 0.0% |
| 2 Unit Apartments | 0 | 0.0% |
| 3 or 4 Unit Apartments | 11 | 2.8% |
| 5 to 9 Unit Apartments | 0 | 0.0% |
| 10 or more Apartments | 0 | 0.0% |
| Mobile Home / Other | 183 | 46.9% |
| Total | 390 | 100.0% |
Housing Structures by Occupancy in Chama
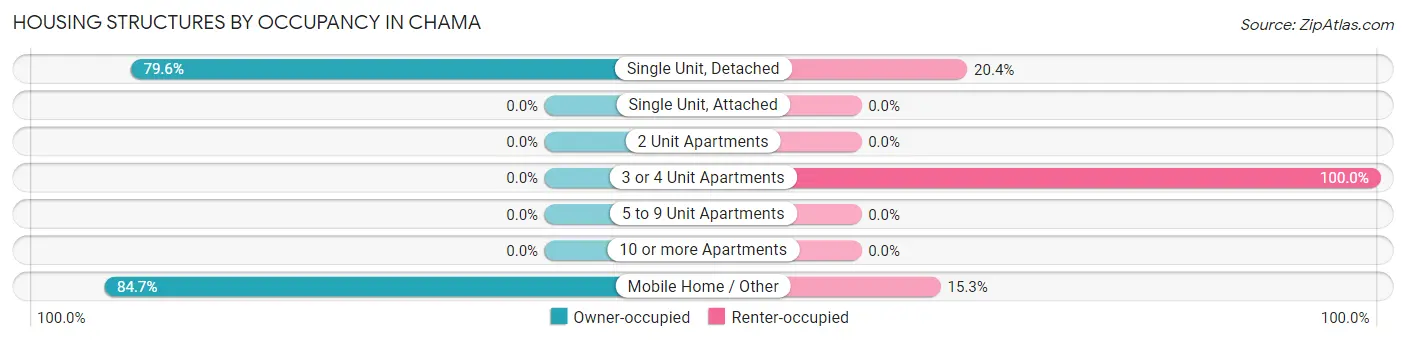
| Structure Type | Owner-occupied | Renter-occupied |
| Single Unit, Detached | 156 (79.6%) | 40 (20.4%) |
| Single Unit, Attached | 0 (0.0%) | 0 (0.0%) |
| 2 Unit Apartments | 0 (0.0%) | 0 (0.0%) |
| 3 or 4 Unit Apartments | 0 (0.0%) | 11 (100.0%) |
| 5 to 9 Unit Apartments | 0 (0.0%) | 0 (0.0%) |
| 10 or more Apartments | 0 (0.0%) | 0 (0.0%) |
| Mobile Home / Other | 155 (84.7%) | 28 (15.3%) |
| Total | 311 (79.7%) | 79 (20.3%) |
Housing Structures by Number of Rooms in Chama
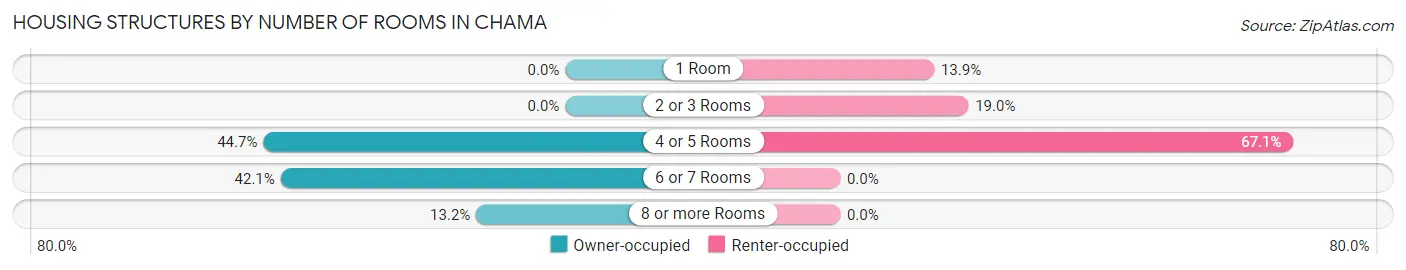
| Number of Rooms | Owner-occupied | Renter-occupied |
| 1 Room | 0 (0.0%) | 11 (13.9%) |
| 2 or 3 Rooms | 0 (0.0%) | 15 (19.0%) |
| 4 or 5 Rooms | 139 (44.7%) | 53 (67.1%) |
| 6 or 7 Rooms | 131 (42.1%) | 0 (0.0%) |
| 8 or more Rooms | 41 (13.2%) | 0 (0.0%) |
| Total | 311 (100.0%) | 79 (100.0%) |
Housing Structure by Heating Type in Chama
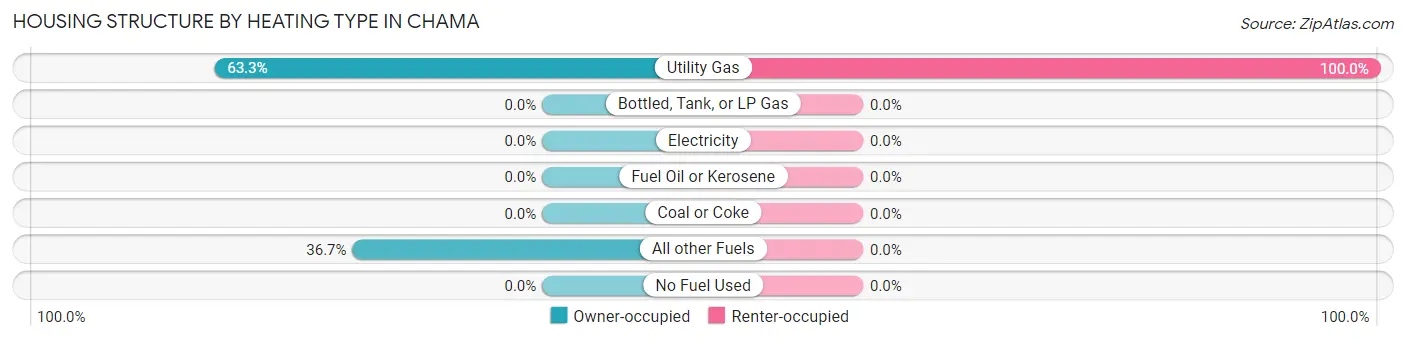
| Heating Type | Owner-occupied | Renter-occupied |
| Utility Gas | 197 (63.3%) | 79 (100.0%) |
| Bottled, Tank, or LP Gas | 0 (0.0%) | 0 (0.0%) |
| Electricity | 0 (0.0%) | 0 (0.0%) |
| Fuel Oil or Kerosene | 0 (0.0%) | 0 (0.0%) |
| Coal or Coke | 0 (0.0%) | 0 (0.0%) |
| All other Fuels | 114 (36.7%) | 0 (0.0%) |
| No Fuel Used | 0 (0.0%) | 0 (0.0%) |
| Total | 311 (100.0%) | 79 (100.0%) |
Household Vehicle Usage in Chama
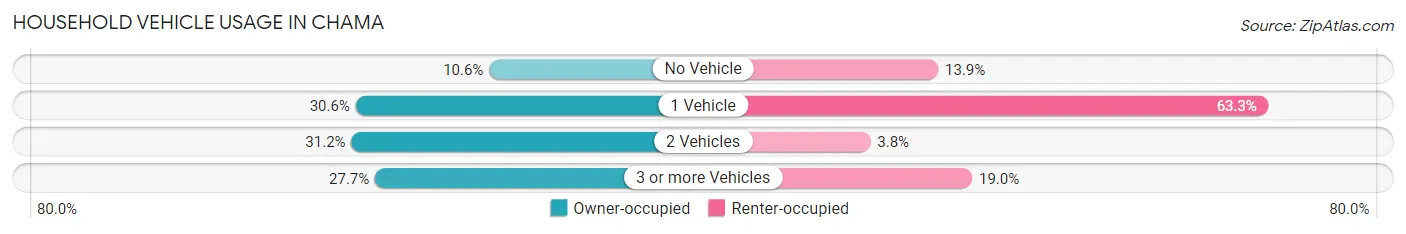
| Vehicles per Household | Owner-occupied | Renter-occupied |
| No Vehicle | 33 (10.6%) | 11 (13.9%) |
| 1 Vehicle | 95 (30.5%) | 50 (63.3%) |
| 2 Vehicles | 97 (31.2%) | 3 (3.8%) |
| 3 or more Vehicles | 86 (27.7%) | 15 (19.0%) |
| Total | 311 (100.0%) | 79 (100.0%) |
Real Estate & Mortgages in Chama
Real Estate and Mortgage Overview in Chama
| Characteristic | Without Mortgage | With Mortgage |
| Housing Units | 161 | 150 |
| Median Property Value | $97,400 | $189,000 |
| Median Household Income | $26,776 | $14 |
| Monthly Housing Costs | $417 | $0 |
| Real Estate Taxes | $558 | $18 |
Property Value by Mortgage Status in Chama
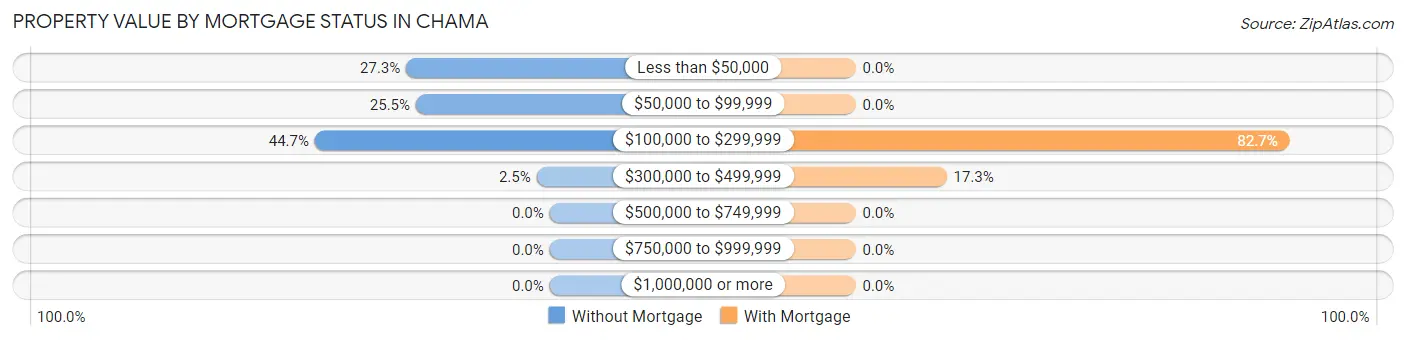
| Property Value | Without Mortgage | With Mortgage |
| Less than $50,000 | 44 (27.3%) | 0 (0.0%) |
| $50,000 to $99,999 | 41 (25.5%) | 0 (0.0%) |
| $100,000 to $299,999 | 72 (44.7%) | 124 (82.7%) |
| $300,000 to $499,999 | 4 (2.5%) | 26 (17.3%) |
| $500,000 to $749,999 | 0 (0.0%) | 0 (0.0%) |
| $750,000 to $999,999 | 0 (0.0%) | 0 (0.0%) |
| $1,000,000 or more | 0 (0.0%) | 0 (0.0%) |
| Total | 161 (100.0%) | 150 (100.0%) |
Household Income by Mortgage Status in Chama
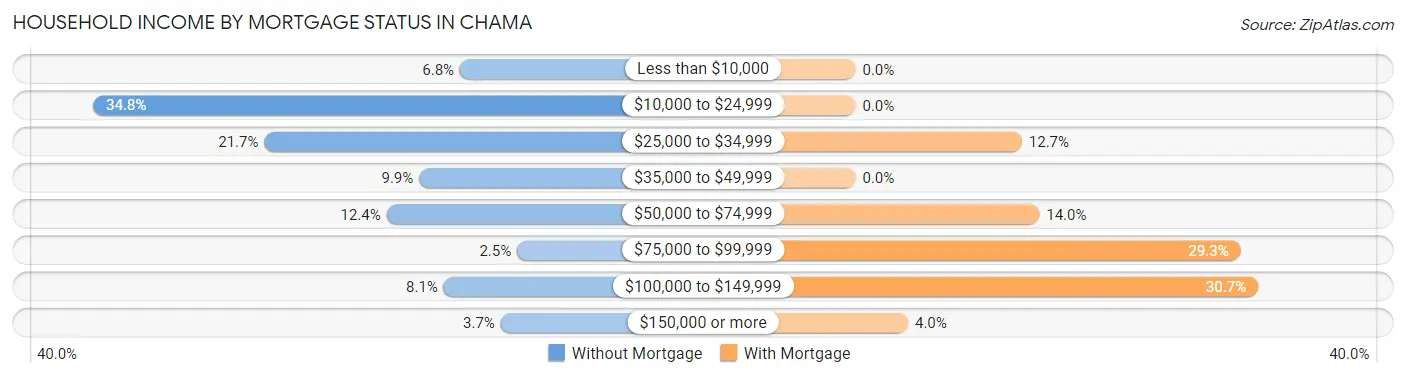
| Household Income | Without Mortgage | With Mortgage |
| Less than $10,000 | 11 (6.8%) | 0 (0.0%) |
| $10,000 to $24,999 | 56 (34.8%) | 0 (0.0%) |
| $25,000 to $34,999 | 35 (21.7%) | 19 (12.7%) |
| $35,000 to $49,999 | 16 (9.9%) | 0 (0.0%) |
| $50,000 to $74,999 | 20 (12.4%) | 21 (14.0%) |
| $75,000 to $99,999 | 4 (2.5%) | 44 (29.3%) |
| $100,000 to $149,999 | 13 (8.1%) | 46 (30.7%) |
| $150,000 or more | 6 (3.7%) | 6 (4.0%) |
| Total | 161 (100.0%) | 150 (100.0%) |
Property Value to Household Income Ratio in Chama
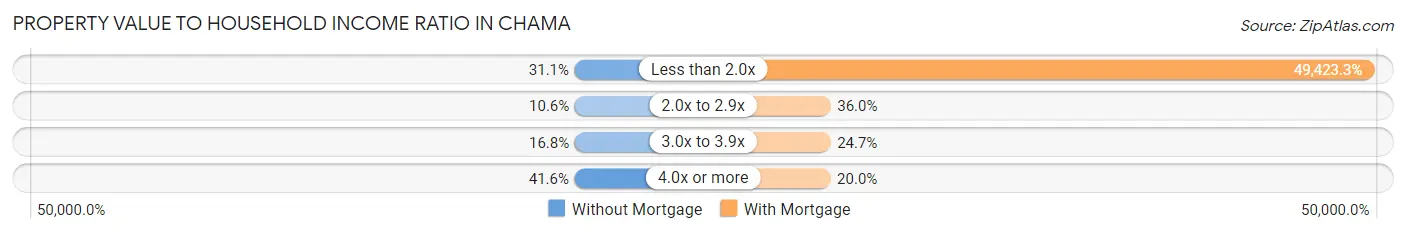
| Value-to-Income Ratio | Without Mortgage | With Mortgage |
| Less than 2.0x | 50 (31.1%) | 74,135 (49,423.3%) |
| 2.0x to 2.9x | 17 (10.6%) | 54 (36.0%) |
| 3.0x to 3.9x | 27 (16.8%) | 37 (24.7%) |
| 4.0x or more | 67 (41.6%) | 30 (20.0%) |
| Total | 161 (100.0%) | 150 (100.0%) |
Real Estate Taxes by Mortgage Status in Chama
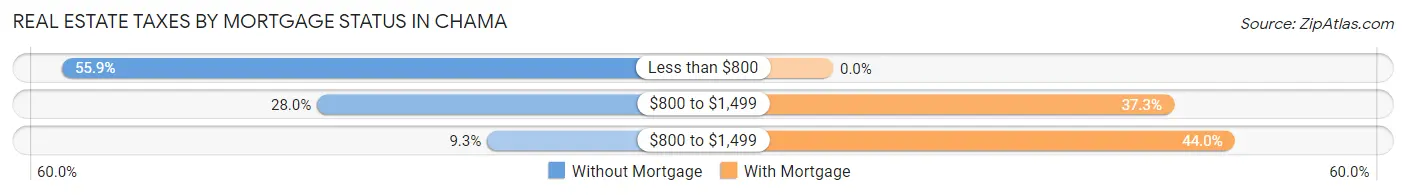
| Property Taxes | Without Mortgage | With Mortgage |
| Less than $800 | 90 (55.9%) | 0 (0.0%) |
| $800 to $1,499 | 45 (28.0%) | 56 (37.3%) |
| $800 to $1,499 | 15 (9.3%) | 66 (44.0%) |
| Total | 161 (100.0%) | 150 (100.0%) |
Health & Disability in Chama
Health Insurance Coverage by Age in Chama
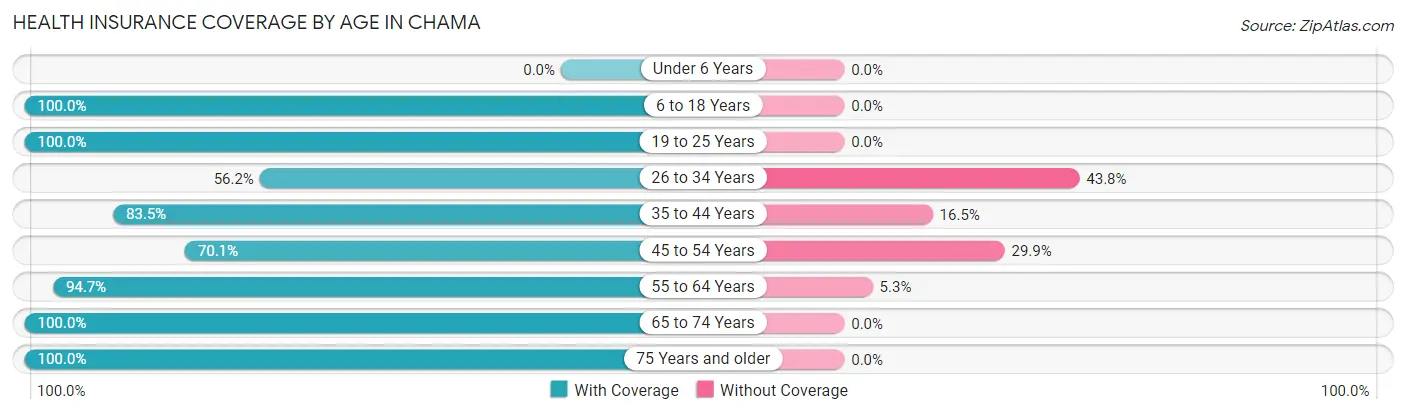
| Age Bracket | With Coverage | Without Coverage |
| Under 6 Years | 0 (0.0%) | 0 (0.0%) |
| 6 to 18 Years | 75 (100.0%) | 0 (0.0%) |
| 19 to 25 Years | 30 (100.0%) | 0 (0.0%) |
| 26 to 34 Years | 41 (56.2%) | 32 (43.8%) |
| 35 to 44 Years | 76 (83.5%) | 15 (16.5%) |
| 45 to 54 Years | 61 (70.1%) | 26 (29.9%) |
| 55 to 64 Years | 197 (94.7%) | 11 (5.3%) |
| 65 to 74 Years | 150 (100.0%) | 0 (0.0%) |
| 75 Years and older | 87 (100.0%) | 0 (0.0%) |
| Total | 717 (89.5%) | 84 (10.5%) |
Health Insurance Coverage by Citizenship Status in Chama
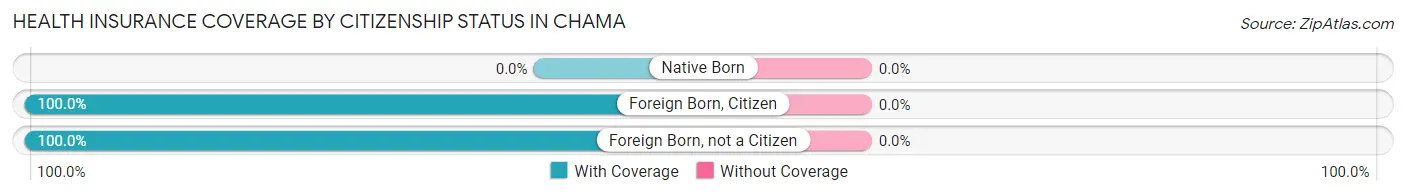
| Citizenship Status | With Coverage | Without Coverage |
| Native Born | 0 (0.0%) | 0 (0.0%) |
| Foreign Born, Citizen | 75 (100.0%) | 0 (0.0%) |
| Foreign Born, not a Citizen | 30 (100.0%) | 0 (0.0%) |
Health Insurance Coverage by Household Income in Chama
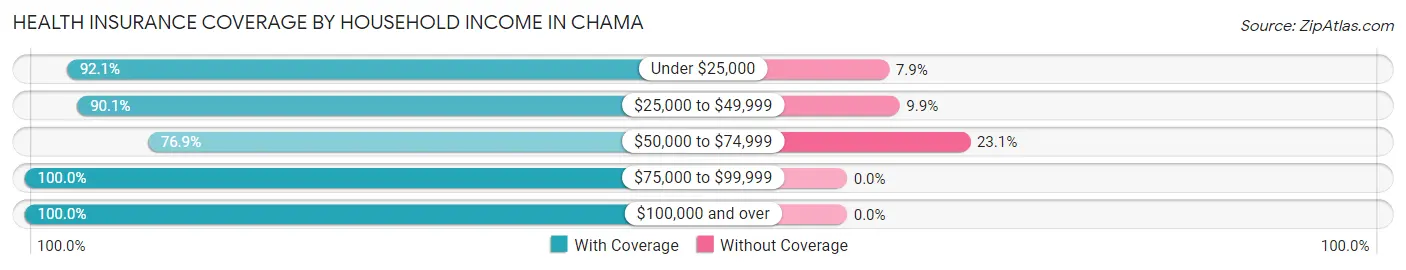
| Household Income | With Coverage | Without Coverage |
| Under $25,000 | 175 (92.1%) | 15 (7.9%) |
| $25,000 to $49,999 | 192 (90.1%) | 21 (9.9%) |
| $50,000 to $74,999 | 160 (76.9%) | 48 (23.1%) |
| $75,000 to $99,999 | 118 (100.0%) | 0 (0.0%) |
| $100,000 and over | 72 (100.0%) | 0 (0.0%) |
Public vs Private Health Insurance Coverage by Age in Chama
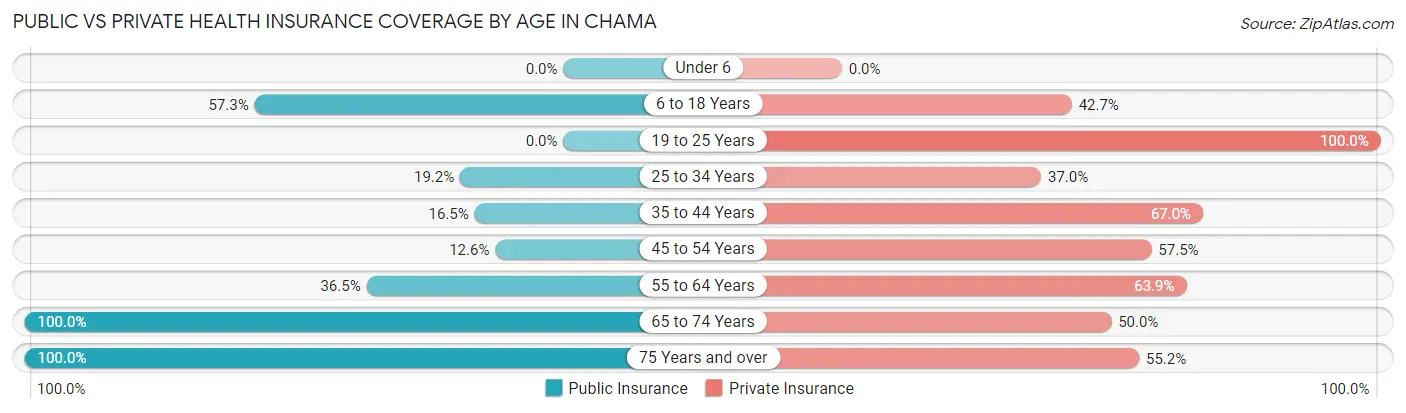
| Age Bracket | Public Insurance | Private Insurance |
| Under 6 | 0 (0.0%) | 0 (0.0%) |
| 6 to 18 Years | 43 (57.3%) | 32 (42.7%) |
| 19 to 25 Years | 0 (0.0%) | 30 (100.0%) |
| 25 to 34 Years | 14 (19.2%) | 27 (37.0%) |
| 35 to 44 Years | 15 (16.5%) | 61 (67.0%) |
| 45 to 54 Years | 11 (12.6%) | 50 (57.5%) |
| 55 to 64 Years | 76 (36.5%) | 133 (63.9%) |
| 65 to 74 Years | 150 (100.0%) | 75 (50.0%) |
| 75 Years and over | 87 (100.0%) | 48 (55.2%) |
| Total | 396 (49.4%) | 456 (56.9%) |
Disability Status by Sex by Age in Chama
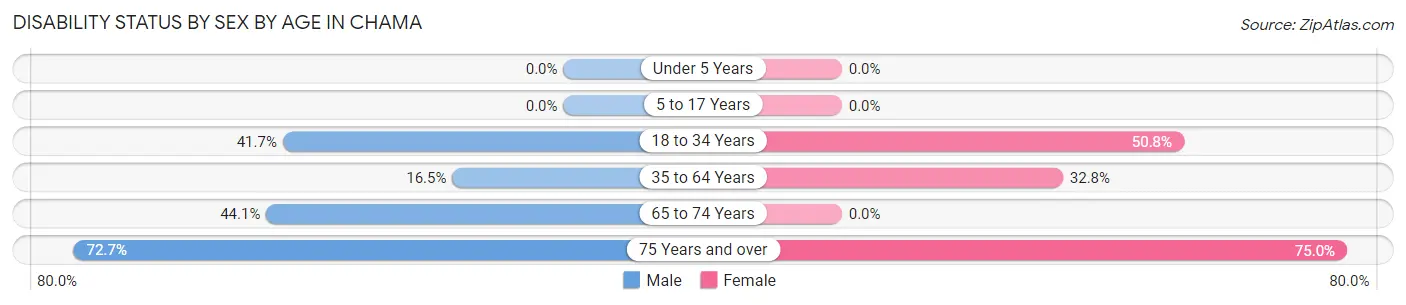
| Age Bracket | Male | Female |
| Under 5 Years | 0 (0.0%) | 0 (0.0%) |
| 5 to 17 Years | 0 (0.0%) | 0 (0.0%) |
| 18 to 34 Years | 30 (41.7%) | 32 (50.8%) |
| 35 to 64 Years | 31 (16.5%) | 65 (32.8%) |
| 65 to 74 Years | 45 (44.1%) | 0 (0.0%) |
| 75 Years and over | 40 (72.7%) | 24 (75.0%) |
Disability Class by Sex by Age in Chama
Disability Class: Hearing Difficulty
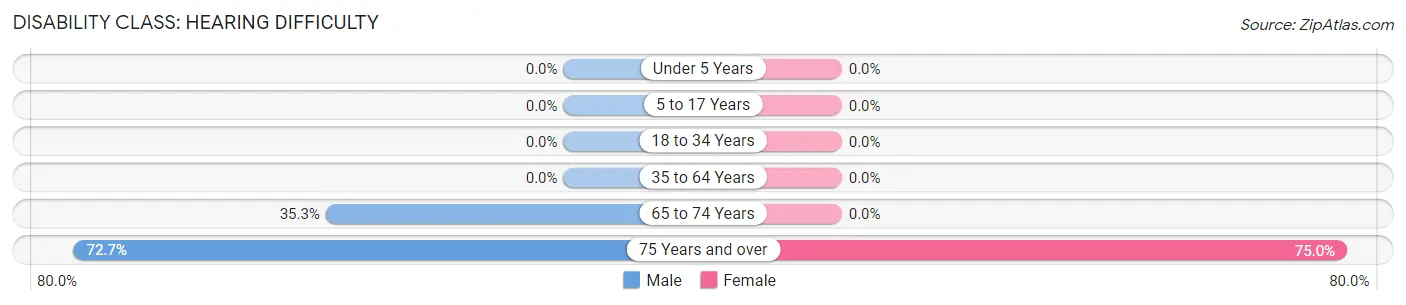
| Age Bracket | Male | Female |
| Under 5 Years | 0 (0.0%) | 0 (0.0%) |
| 5 to 17 Years | 0 (0.0%) | 0 (0.0%) |
| 18 to 34 Years | 0 (0.0%) | 0 (0.0%) |
| 35 to 64 Years | 0 (0.0%) | 0 (0.0%) |
| 65 to 74 Years | 36 (35.3%) | 0 (0.0%) |
| 75 Years and over | 40 (72.7%) | 24 (75.0%) |
Disability Class: Vision Difficulty
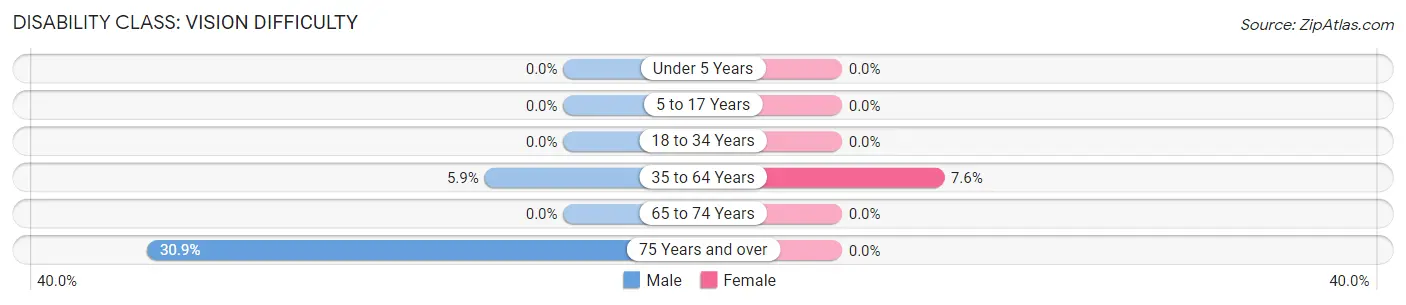
| Age Bracket | Male | Female |
| Under 5 Years | 0 (0.0%) | 0 (0.0%) |
| 5 to 17 Years | 0 (0.0%) | 0 (0.0%) |
| 18 to 34 Years | 0 (0.0%) | 0 (0.0%) |
| 35 to 64 Years | 11 (5.9%) | 15 (7.6%) |
| 65 to 74 Years | 0 (0.0%) | 0 (0.0%) |
| 75 Years and over | 17 (30.9%) | 0 (0.0%) |
Disability Class: Cognitive Difficulty
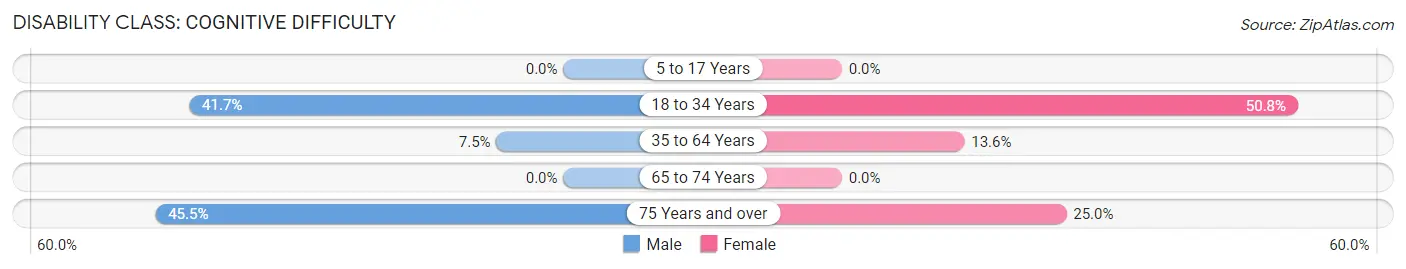
| Age Bracket | Male | Female |
| 5 to 17 Years | 0 (0.0%) | 0 (0.0%) |
| 18 to 34 Years | 30 (41.7%) | 32 (50.8%) |
| 35 to 64 Years | 14 (7.4%) | 27 (13.6%) |
| 65 to 74 Years | 0 (0.0%) | 0 (0.0%) |
| 75 Years and over | 25 (45.5%) | 8 (25.0%) |
Disability Class: Ambulatory Difficulty
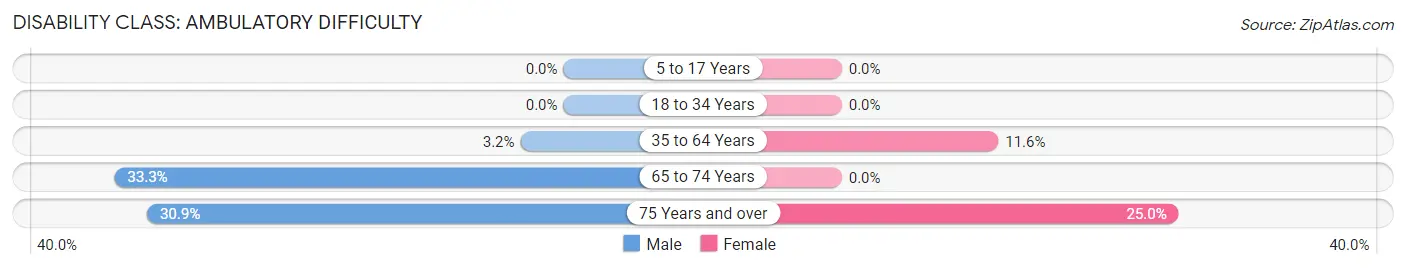
| Age Bracket | Male | Female |
| 5 to 17 Years | 0 (0.0%) | 0 (0.0%) |
| 18 to 34 Years | 0 (0.0%) | 0 (0.0%) |
| 35 to 64 Years | 6 (3.2%) | 23 (11.6%) |
| 65 to 74 Years | 34 (33.3%) | 0 (0.0%) |
| 75 Years and over | 17 (30.9%) | 8 (25.0%) |
Disability Class: Self-Care Difficulty
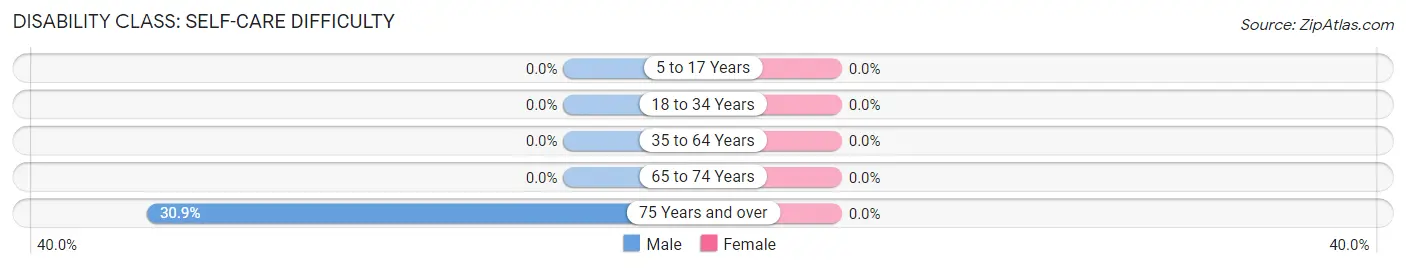
| Age Bracket | Male | Female |
| 5 to 17 Years | 0 (0.0%) | 0 (0.0%) |
| 18 to 34 Years | 0 (0.0%) | 0 (0.0%) |
| 35 to 64 Years | 0 (0.0%) | 0 (0.0%) |
| 65 to 74 Years | 0 (0.0%) | 0 (0.0%) |
| 75 Years and over | 17 (30.9%) | 0 (0.0%) |
Technology Access in Chama
Computing Device Access in Chama
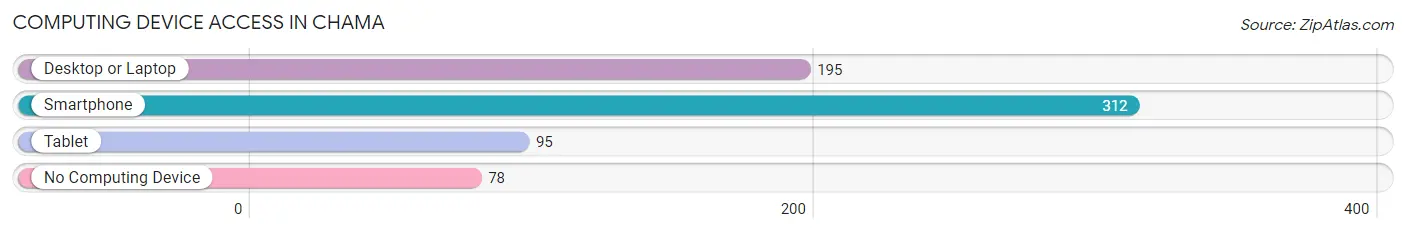
| Device Type | # Households | % Households |
| Desktop or Laptop | 195 | 50.0% |
| Smartphone | 312 | 80.0% |
| Tablet | 95 | 24.4% |
| No Computing Device | 78 | 20.0% |
| Total | 390 | 100.0% |
Internet Access in Chama
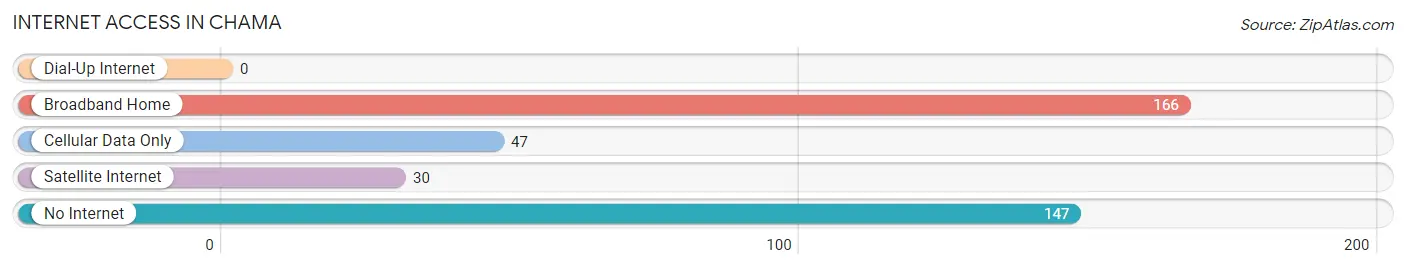
| Internet Type | # Households | % Households |
| Dial-Up Internet | 0 | 0.0% |
| Broadband Home | 166 | 42.6% |
| Cellular Data Only | 47 | 12.0% |
| Satellite Internet | 30 | 7.7% |
| No Internet | 147 | 37.7% |
| Total | 390 | 100.0% |
Chama Summary
Chama, New Mexico is a small town located in the northern part of the state, near the Colorado border. It is situated in the San Juan Mountains, and is the county seat of Rio Arriba County. The town has a population of 1,022 people, according to the 2010 census.
History
Chama was founded in 1880 by the Denver and Rio Grande Railroad. The town was named after the Chama River, which runs through the area. The railroad was built to connect the mining towns of Silverton and Durango, Colorado with the rest of the country. The railroad was a major factor in the development of the town, and it remains an important part of the local economy.
Geography
Chama is located in the northern part of New Mexico, near the Colorado border. It is situated in the San Juan Mountains, at an elevation of 7,835 feet. The town is surrounded by the Chama River, which runs through the area. The climate is semi-arid, with hot summers and cold winters.
Economy
The economy of Chama is largely based on tourism and agriculture. The town is a popular destination for outdoor recreation, such as fishing, hunting, and camping. The nearby Cumbres & Toltec Scenic Railroad is a popular tourist attraction, and the town is also home to several art galleries and museums. Agriculture is also an important part of the local economy, with the main crops being hay, alfalfa, and wheat.
Demographics
According to the 2010 census, Chama has a population of 1,022 people. The racial makeup of the town is predominantly white (90.2%), with a small Hispanic population (7.2%). The median household income is $31,250, and the median age is 44. The town has a high rate of poverty, with 28.3% of the population living below the poverty line.
Chama is a small town with a rich history and a unique culture. It is a popular destination for outdoor recreation, and the local economy is largely based on tourism and agriculture. The town has a diverse population, with a majority of white residents and a small Hispanic population. Despite its small size, Chama is an important part of the local economy and culture.
Common Questions
What is Per Capita Income in Chama?
Per Capita income in Chama is $27,305.
What is the Median Family Income in Chama?
Median Family Income in Chama is $61,736.
What is the Median Household income in Chama?
Median Household Income in Chama is $40,521.
What is Income or Wage Gap in Chama?
Income or Wage Gap in Chama is 46.8%.
Women in Chama earn 53.2 cents for every dollar earned by a man.
What is Inequality or Gini Index in Chama?
Inequality or Gini Index in Chama is 0.44.
What is the Total Population of Chama?
Total Population of Chama is 801.
What is the Total Male Population of Chama?
Total Male Population of Chama is 450.
What is the Total Female Population of Chama?
Total Female Population of Chama is 351.
What is the Ratio of Males per 100 Females in Chama?
There are 128.21 Males per 100 Females in Chama.
What is the Ratio of Females per 100 Males in Chama?
There are 78.00 Females per 100 Males in Chama.
What is the Median Population Age in Chama?
Median Population Age in Chama is 59.1 Years.
What is the Average Family Size in Chama
Average Family Size in Chama is 2.7 People.
What is the Average Household Size in Chama
Average Household Size in Chama is 2.0 People.
How Large is the Labor Force in Chama?
There are 357 People in the Labor Forcein in Chama.
What is the Percentage of People in the Labor Force in Chama?
47.0% of People are in the Labor Force in Chama.
What is the Unemployment Rate in Chama?
Unemployment Rate in Chama is 18.2%.