Zuni Pueblo, NM Map & Demographics
Zuni Pueblo Map
Zuni Pueblo Overview
$16,236
PER CAPITA INCOME
$42,723
AVG FAMILY INCOME
$43,594
AVG HOUSEHOLD INCOME
2.6%
WAGE / INCOME GAP [ % ]
97.4¢/ $1
WAGE / INCOME GAP [ $ ]
$12,718
FAMILY INCOME DEFICIT
0.49
INEQUALITY / GINI INDEX
6,789
TOTAL POPULATION
3,271
MALE POPULATION
3,518
FEMALE POPULATION
92.98
MALES / 100 FEMALES
107.55
FEMALES / 100 MALES
34.0
MEDIAN AGE
5.0
AVG FAMILY SIZE
4.5
AVG HOUSEHOLD SIZE
2,509
LABOR FORCE [ PEOPLE ]
48.0%
PERCENT IN LABOR FORCE
14.2%
UNEMPLOYMENT RATE
Income in Zuni Pueblo
Income Overview in Zuni Pueblo
Per Capita Income in Zuni Pueblo is $16,236, while median incomes of families and households are $42,723 and $43,594 respectively.
| Characteristic | Number | Measure |
| Per Capita Income | 6,789 | $16,236 |
| Median Family Income | 1,269 | $42,723 |
| Mean Family Income | 1,269 | $58,759 |
| Median Household Income | 1,507 | $43,594 |
| Mean Household Income | 1,507 | $58,035 |
| Income Deficit | 1,269 | $12,718 |
| Wage / Income Gap (%) | 6,789 | 2.62% |
| Wage / Income Gap ($) | 6,789 | 97.38¢ per $1 |
| Gini / Inequality Index | 6,789 | 0.49 |
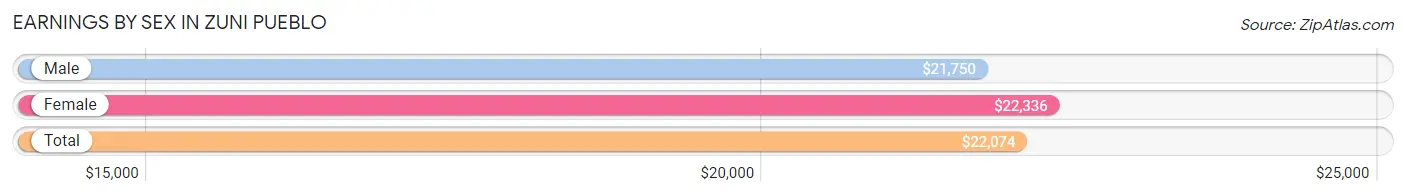
Earnings by Sex in Zuni Pueblo
Average Earnings in Zuni Pueblo are $22,074, $21,750 for men and $22,336 for women, a difference of 2.6%.
| Sex | Number | Average Earnings |
| Male | 1,190 (45.6%) | $21,750 |
| Female | 1,419 (54.4%) | $22,336 |
| Total | 2,609 (100.0%) | $22,074 |
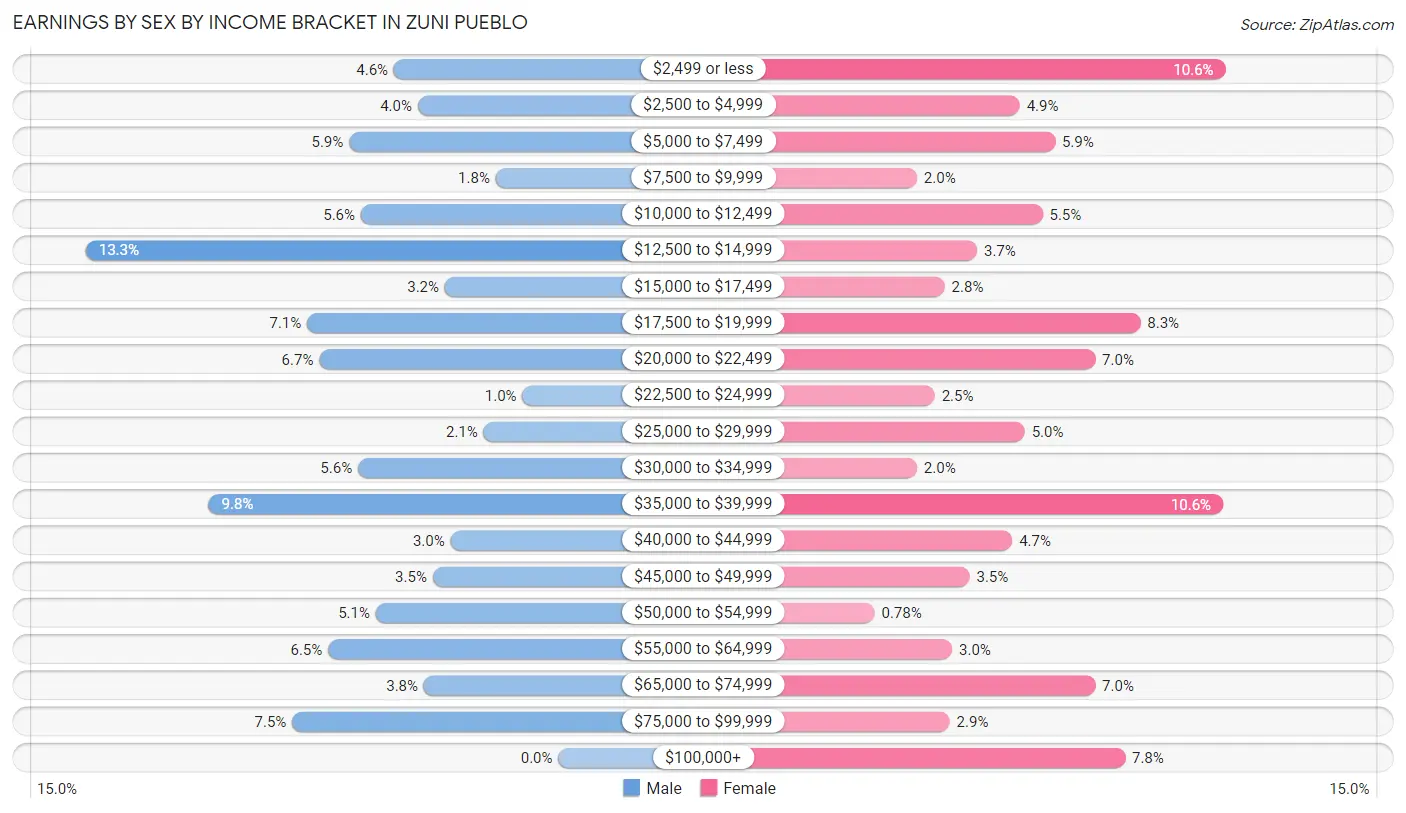
Earnings by Sex by Income Bracket in Zuni Pueblo
The most common earnings brackets in Zuni Pueblo are $12,500 to $14,999 for men (158 | 13.3%) and $2,499 or less for women (151 | 10.6%).
| Income | Male | Female |
| $2,499 or less | 55 (4.6%) | 151 (10.6%) |
| $2,500 to $4,999 | 47 (4.0%) | 69 (4.9%) |
| $5,000 to $7,499 | 70 (5.9%) | 83 (5.9%) |
| $7,500 to $9,999 | 21 (1.8%) | 28 (2.0%) |
| $10,000 to $12,499 | 66 (5.6%) | 78 (5.5%) |
| $12,500 to $14,999 | 158 (13.3%) | 52 (3.7%) |
| $15,000 to $17,499 | 38 (3.2%) | 39 (2.8%) |
| $17,500 to $19,999 | 84 (7.1%) | 117 (8.3%) |
| $20,000 to $22,499 | 80 (6.7%) | 99 (7.0%) |
| $22,500 to $24,999 | 12 (1.0%) | 35 (2.5%) |
| $25,000 to $29,999 | 25 (2.1%) | 71 (5.0%) |
| $30,000 to $34,999 | 67 (5.6%) | 28 (2.0%) |
| $35,000 to $39,999 | 117 (9.8%) | 150 (10.6%) |
| $40,000 to $44,999 | 36 (3.0%) | 66 (4.6%) |
| $45,000 to $49,999 | 42 (3.5%) | 49 (3.5%) |
| $50,000 to $54,999 | 61 (5.1%) | 11 (0.8%) |
| $55,000 to $64,999 | 77 (6.5%) | 42 (3.0%) |
| $65,000 to $74,999 | 45 (3.8%) | 99 (7.0%) |
| $75,000 to $99,999 | 89 (7.5%) | 41 (2.9%) |
| $100,000+ | 0 (0.0%) | 111 (7.8%) |
| Total | 1,190 (100.0%) | 1,419 (100.0%) |
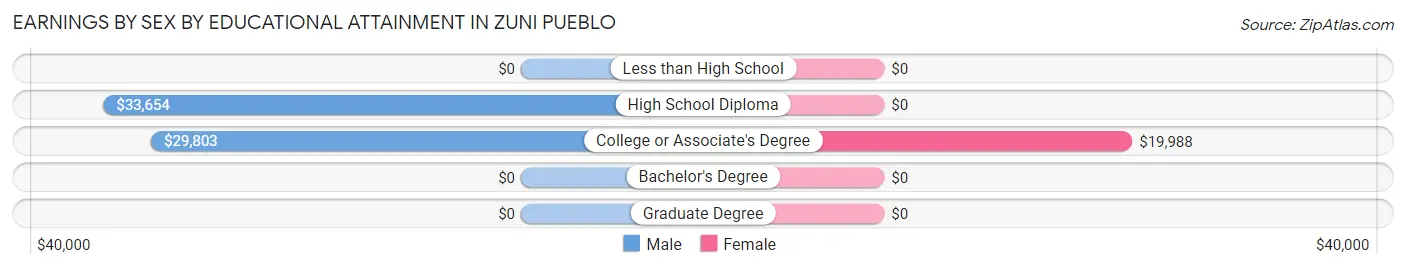
Earnings by Sex by Educational Attainment in Zuni Pueblo
Average earnings in Zuni Pueblo are $33,111 for men and $21,833 for women, a difference of 34.1%. Men with an educational attainment of high school diploma enjoy the highest average annual earnings of $33,654, while those with college or associate's degree education earn the least with $29,803. Women with an educational attainment of college or associate's degree earn the most with the average annual earnings of $19,988, while those with college or associate's degree education have the smallest earnings of $19,988.
| Educational Attainment | Male Income | Female Income |
| Less than High School | - | - |
| High School Diploma | $33,654 | $0 |
| College or Associate's Degree | $29,803 | $19,988 |
| Bachelor's Degree | - | - |
| Graduate Degree | - | - |
| Total | $33,111 | $21,833 |
Family Income in Zuni Pueblo
Family Income Brackets in Zuni Pueblo
According to the Zuni Pueblo family income data, there are 209 families falling into the $50,000 to $74,999 income range, which is the most common income bracket and makes up 16.5% of all families. Conversely, the $150,000 to $199,999 income bracket is the least frequent group with only 36 families (2.8%) belonging to this category.
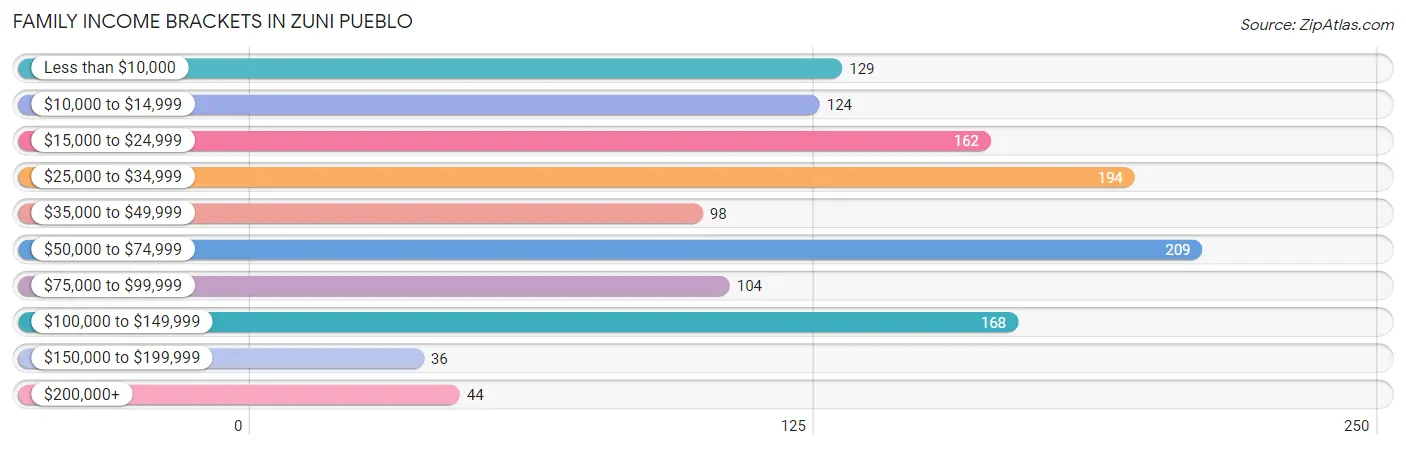
| Income Bracket | # Families | % Families |
| Less than $10,000 | 129 | 10.2% |
| $10,000 to $14,999 | 124 | 9.8% |
| $15,000 to $24,999 | 162 | 12.8% |
| $25,000 to $34,999 | 194 | 15.3% |
| $35,000 to $49,999 | 98 | 7.7% |
| $50,000 to $74,999 | 209 | 16.5% |
| $75,000 to $99,999 | 104 | 8.2% |
| $100,000 to $149,999 | 168 | 13.2% |
| $150,000 to $199,999 | 36 | 2.8% |
| $200,000+ | 44 | 3.5% |
Family Income by Famaliy Size in Zuni Pueblo
6-person families (91 | 7.2%) account for the highest median family income in Zuni Pueblo with $168,264 per family, while 6-person families (91 | 7.2%) have the highest median income of $28,044 per family member.
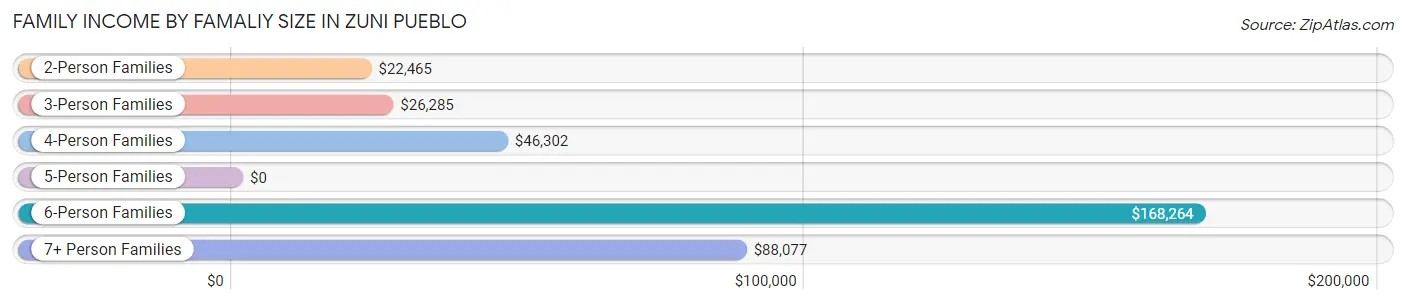
| Income Bracket | # Families | Median Income |
| 2-Person Families | 359 (28.3%) | $22,465 |
| 3-Person Families | 369 (29.1%) | $26,285 |
| 4-Person Families | 181 (14.3%) | $46,302 |
| 5-Person Families | 97 (7.6%) | $0 |
| 6-Person Families | 91 (7.2%) | $168,264 |
| 7+ Person Families | 172 (13.6%) | $88,077 |
| Total | 1,269 (100.0%) | $42,723 |
Family Income by Number of Earners in Zuni Pueblo
The median family income in Zuni Pueblo is $42,723, with families comprising 3+ earners (178) having the highest median family income of $106,190, while families with no earners (328) have the lowest median family income of $17,083, accounting for 14.0% and 25.9% of families, respectively.
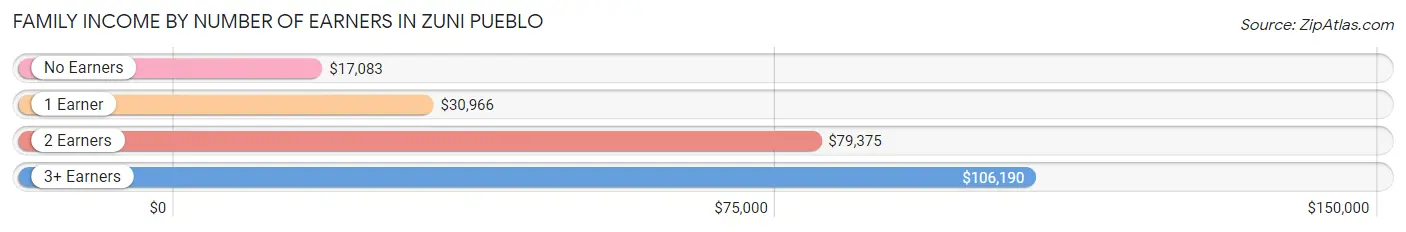
| Number of Earners | # Families | Median Income |
| No Earners | 328 (25.9%) | $17,083 |
| 1 Earner | 459 (36.2%) | $30,966 |
| 2 Earners | 304 (24.0%) | $79,375 |
| 3+ Earners | 178 (14.0%) | $106,190 |
| Total | 1,269 (100.0%) | $42,723 |
Household Income in Zuni Pueblo
Household Income Brackets in Zuni Pueblo
With 280 households falling in the category, the $50,000 to $74,999 income range is the most frequent in Zuni Pueblo, accounting for 18.6% of all households. In contrast, only 35 households (2.3%) fall into the $150,000 to $199,999 income bracket, making it the least populous group.
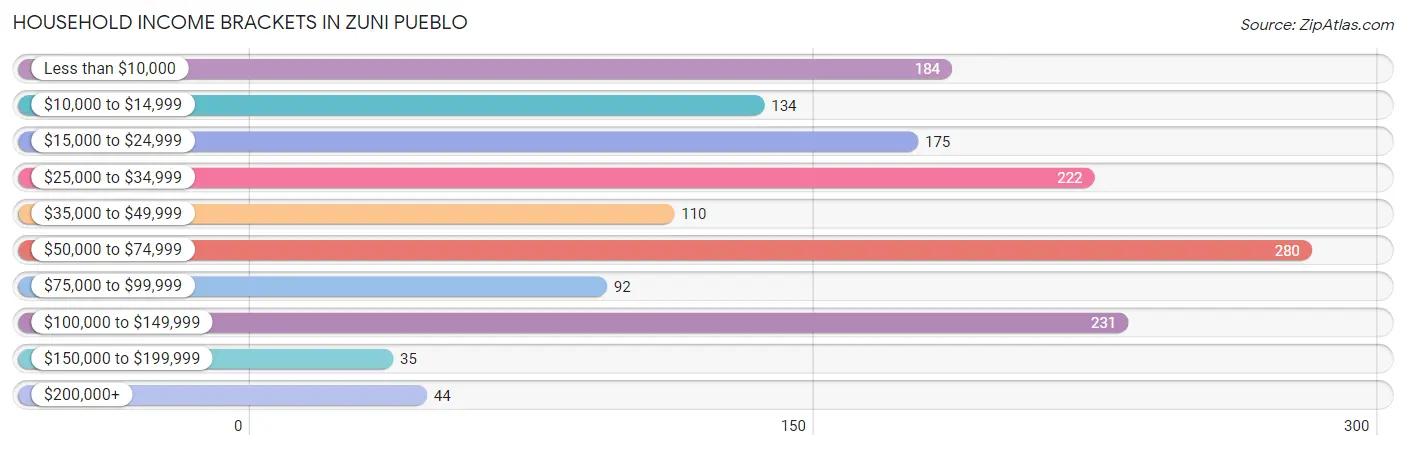
| Income Bracket | # Households | % Households |
| Less than $10,000 | 184 | 12.2% |
| $10,000 to $14,999 | 134 | 8.9% |
| $15,000 to $24,999 | 175 | 11.6% |
| $25,000 to $34,999 | 222 | 14.7% |
| $35,000 to $49,999 | 110 | 7.3% |
| $50,000 to $74,999 | 280 | 18.6% |
| $75,000 to $99,999 | 92 | 6.1% |
| $100,000 to $149,999 | 231 | 15.3% |
| $150,000 to $199,999 | 35 | 2.3% |
| $200,000+ | 44 | 2.9% |
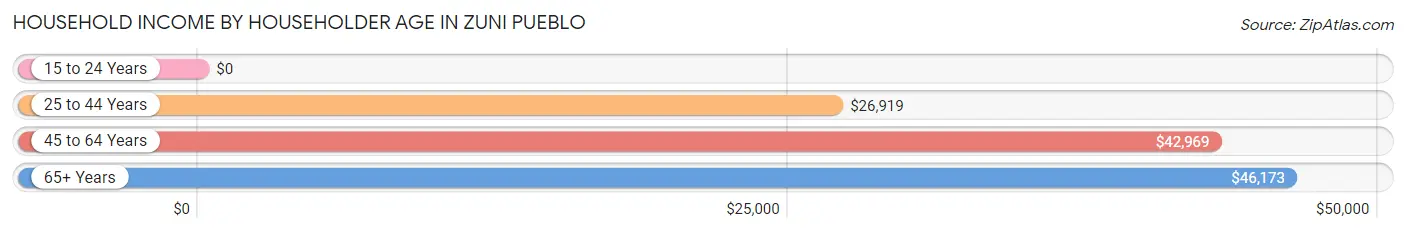
Household Income by Householder Age in Zuni Pueblo
The median household income in Zuni Pueblo is $43,594, with the highest median household income of $46,173 found in the 65+ years age bracket for the primary householder. A total of 456 households (30.3%) fall into this category.
| Income Bracket | # Households | Median Income |
| 15 to 24 Years | 0 (0.0%) | $0 |
| 25 to 44 Years | 178 (11.8%) | $26,919 |
| 45 to 64 Years | 873 (57.9%) | $42,969 |
| 65+ Years | 456 (30.3%) | $46,173 |
| Total | 1,507 (100.0%) | $43,594 |
Poverty in Zuni Pueblo
Income Below Poverty by Sex and Age in Zuni Pueblo
With 27.0% poverty level for males and 33.5% for females among the residents of Zuni Pueblo, 55 to 64 year old males and 5 year old females are the most vulnerable to poverty, with 205 males (53.1%) and 30 females (63.8%) in their respective age groups living below the poverty level.
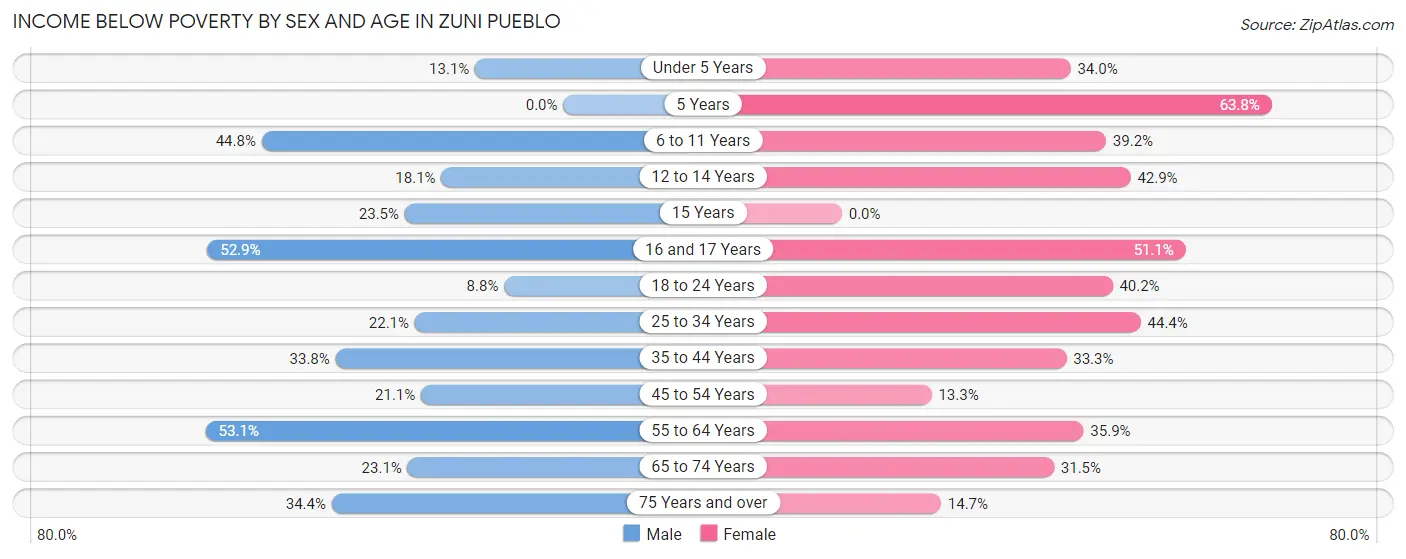
| Age Bracket | Male | Female |
| Under 5 Years | 33 (13.1%) | 18 (34.0%) |
| 5 Years | 0 (0.0%) | 30 (63.8%) |
| 6 to 11 Years | 146 (44.8%) | 151 (39.2%) |
| 12 to 14 Years | 46 (18.1%) | 42 (42.9%) |
| 15 Years | 16 (23.5%) | 0 (0.0%) |
| 16 and 17 Years | 37 (52.9%) | 72 (51.1%) |
| 18 to 24 Years | 36 (8.8%) | 166 (40.2%) |
| 25 to 34 Years | 84 (22.1%) | 205 (44.4%) |
| 35 to 44 Years | 93 (33.8%) | 147 (33.3%) |
| 45 to 54 Years | 113 (21.1%) | 67 (13.3%) |
| 55 to 64 Years | 205 (53.1%) | 141 (35.9%) |
| 65 to 74 Years | 46 (23.1%) | 114 (31.5%) |
| 75 Years and over | 22 (34.4%) | 25 (14.7%) |
| Total | 877 (27.0%) | 1,178 (33.5%) |
Income Above Poverty by Sex and Age in Zuni Pueblo
According to the poverty statistics in Zuni Pueblo, males aged 5 years and females aged 15 years are the age groups that are most secure financially, with 100.0% of males and 100.0% of females in these age groups living above the poverty line.
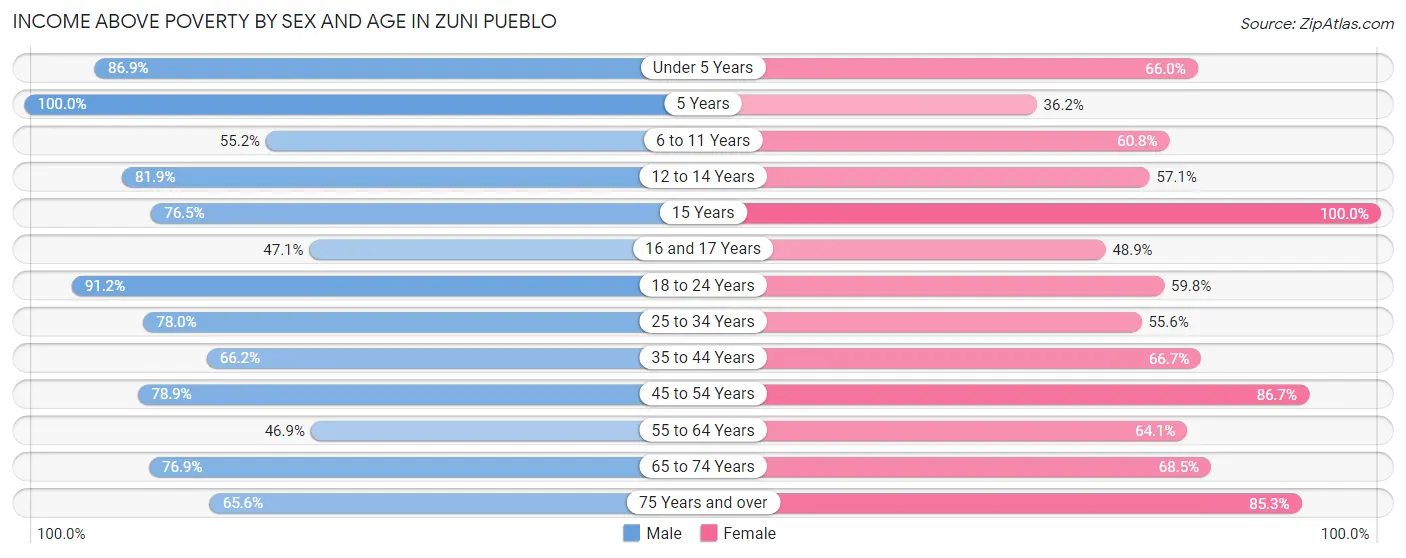
| Age Bracket | Male | Female |
| Under 5 Years | 219 (86.9%) | 35 (66.0%) |
| 5 Years | 28 (100.0%) | 17 (36.2%) |
| 6 to 11 Years | 180 (55.2%) | 234 (60.8%) |
| 12 to 14 Years | 208 (81.9%) | 56 (57.1%) |
| 15 Years | 52 (76.5%) | 50 (100.0%) |
| 16 and 17 Years | 33 (47.1%) | 69 (48.9%) |
| 18 to 24 Years | 374 (91.2%) | 247 (59.8%) |
| 25 to 34 Years | 297 (77.9%) | 257 (55.6%) |
| 35 to 44 Years | 182 (66.2%) | 294 (66.7%) |
| 45 to 54 Years | 422 (78.9%) | 436 (86.7%) |
| 55 to 64 Years | 181 (46.9%) | 252 (64.1%) |
| 65 to 74 Years | 153 (76.9%) | 248 (68.5%) |
| 75 Years and over | 42 (65.6%) | 145 (85.3%) |
| Total | 2,371 (73.0%) | 2,340 (66.5%) |
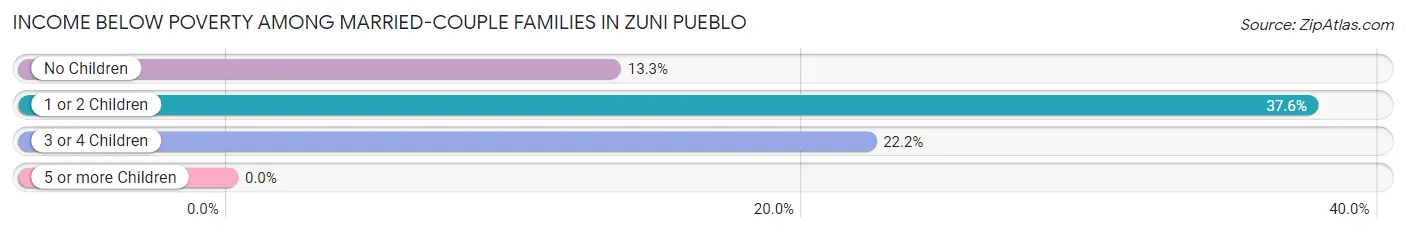
Income Below Poverty Among Married-Couple Families in Zuni Pueblo
The poverty statistics for married-couple families in Zuni Pueblo show that 20.6% or 90 of the total 437 families live below the poverty line. Families with 1 or 2 children have the highest poverty rate of 37.6%, comprising of 38 families. On the other hand, families with 5 or more children have the lowest poverty rate of 0.0%, which includes 0 families.
| Children | Above Poverty | Below Poverty |
| No Children | 169 (86.7%) | 26 (13.3%) |
| 1 or 2 Children | 63 (62.4%) | 38 (37.6%) |
| 3 or 4 Children | 91 (77.8%) | 26 (22.2%) |
| 5 or more Children | 24 (100.0%) | 0 (0.0%) |
| Total | 347 (79.4%) | 90 (20.6%) |
Income Below Poverty Among Single-Parent Households in Zuni Pueblo
According to the poverty data in Zuni Pueblo, 41.9% or 88 single-father households and 37.5% or 233 single-mother households are living below the poverty line. Among single-father households, those with 3 or 4 children have the highest poverty rate, with 20 households (62.5%) experiencing poverty. Likewise, among single-mother households, those with 3 or 4 children have the highest poverty rate, with 39 households (69.6%) falling below the poverty line.
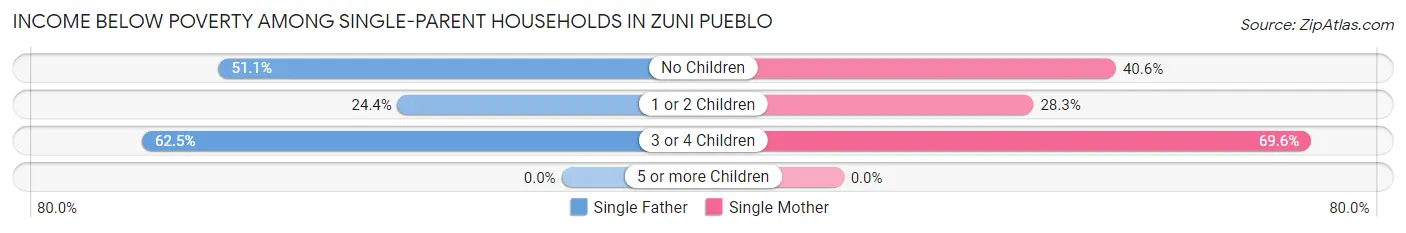
| Children | Single Father | Single Mother |
| No Children | 47 (51.1%) | 112 (40.6%) |
| 1 or 2 Children | 21 (24.4%) | 82 (28.3%) |
| 3 or 4 Children | 20 (62.5%) | 39 (69.6%) |
| 5 or more Children | 0 (0.0%) | 0 (0.0%) |
| Total | 88 (41.9%) | 233 (37.5%) |
Income Below Poverty Among Married-Couple vs Single-Parent Households in Zuni Pueblo
The poverty data for Zuni Pueblo shows that 90 of the married-couple family households (20.6%) and 321 of the single-parent households (38.6%) are living below the poverty level. Within the married-couple family households, those with 1 or 2 children have the highest poverty rate, with 38 households (37.6%) falling below the poverty line. Among the single-parent households, those with 3 or 4 children have the highest poverty rate, with 59 household (67.0%) living below poverty.
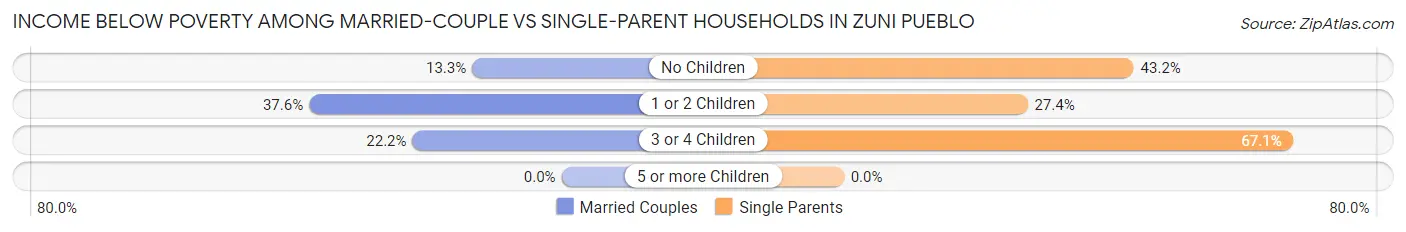
| Children | Married-Couple Families | Single-Parent Households |
| No Children | 26 (13.3%) | 159 (43.2%) |
| 1 or 2 Children | 38 (37.6%) | 103 (27.4%) |
| 3 or 4 Children | 26 (22.2%) | 59 (67.0%) |
| 5 or more Children | 0 (0.0%) | 0 (0.0%) |
| Total | 90 (20.6%) | 321 (38.6%) |
Race in Zuni Pueblo
The most populous races in Zuni Pueblo are Native / Alaskan (6,638 | 97.8%), Hispanic or Latino (132 | 1.9%), and Two or more Races (77 | 1.1%).
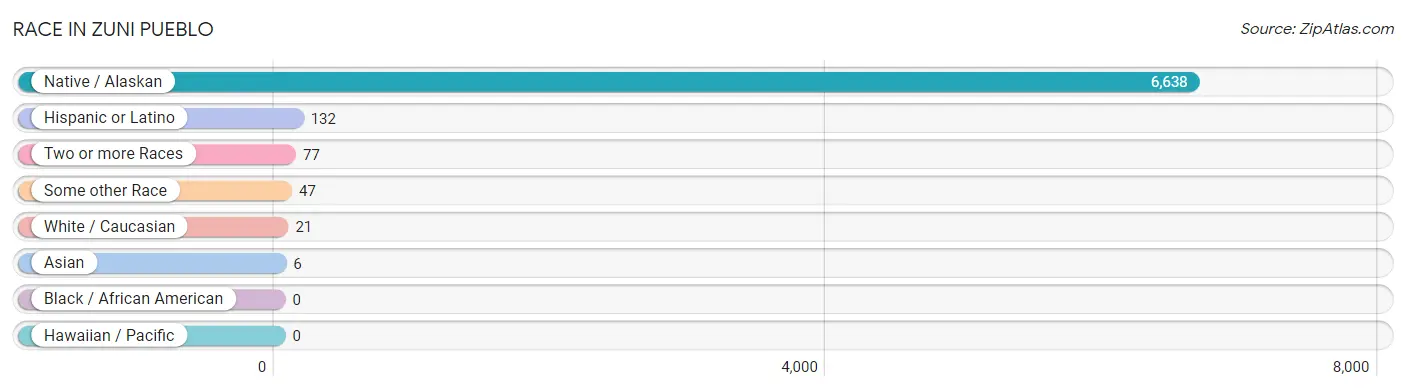
| Race | # Population | % Population |
| Asian | 6 | 0.1% |
| Black / African American | 0 | 0.0% |
| Hawaiian / Pacific | 0 | 0.0% |
| Hispanic or Latino | 132 | 1.9% |
| Native / Alaskan | 6,638 | 97.8% |
| White / Caucasian | 21 | 0.3% |
| Two or more Races | 77 | 1.1% |
| Some other Race | 47 | 0.7% |
| Total | 6,789 | 100.0% |
Ancestry in Zuni Pueblo
The most populous ancestries reported in Zuni Pueblo are Pueblo (6,599 | 97.2%), Navajo (188 | 2.8%), Puerto Rican (43 | 0.6%), Mexican (39 | 0.6%), and American (18 | 0.3%), together accounting for 101.4% of all Zuni Pueblo residents.
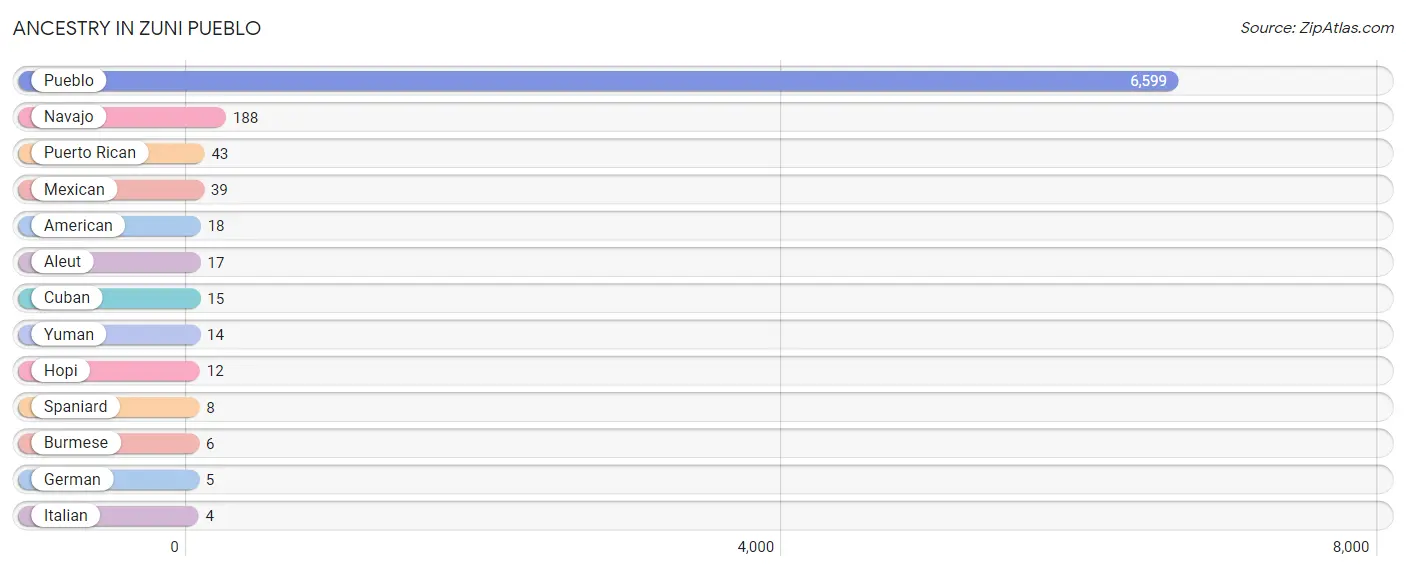
| Ancestry | # Population | % Population |
| Aleut | 17 | 0.3% |
| American | 18 | 0.3% |
| Burmese | 6 | 0.1% |
| Cuban | 15 | 0.2% |
| German | 5 | 0.1% |
| Hopi | 12 | 0.2% |
| Italian | 4 | 0.1% |
| Mexican | 39 | 0.6% |
| Navajo | 188 | 2.8% |
| Pueblo | 6,599 | 97.2% |
| Puerto Rican | 43 | 0.6% |
| Spaniard | 8 | 0.1% |
| Yuman | 14 | 0.2% | View All 13 Rows |
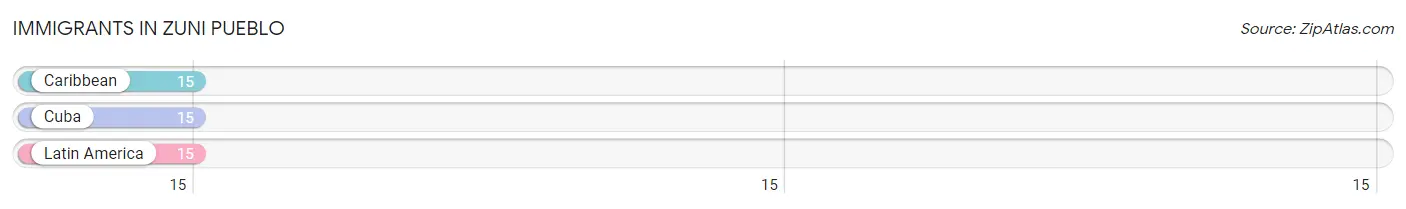
Immigrants in Zuni Pueblo
The most numerous immigrant groups reported in Zuni Pueblo came from Caribbean (15 | 0.2%), Cuba (15 | 0.2%), and Latin America (15 | 0.2%), together accounting for 0.7% of all Zuni Pueblo residents.
| Immigration Origin | # Population | % Population |
| Caribbean | 15 | 0.2% |
| Cuba | 15 | 0.2% |
| Latin America | 15 | 0.2% | View All 3 Rows |
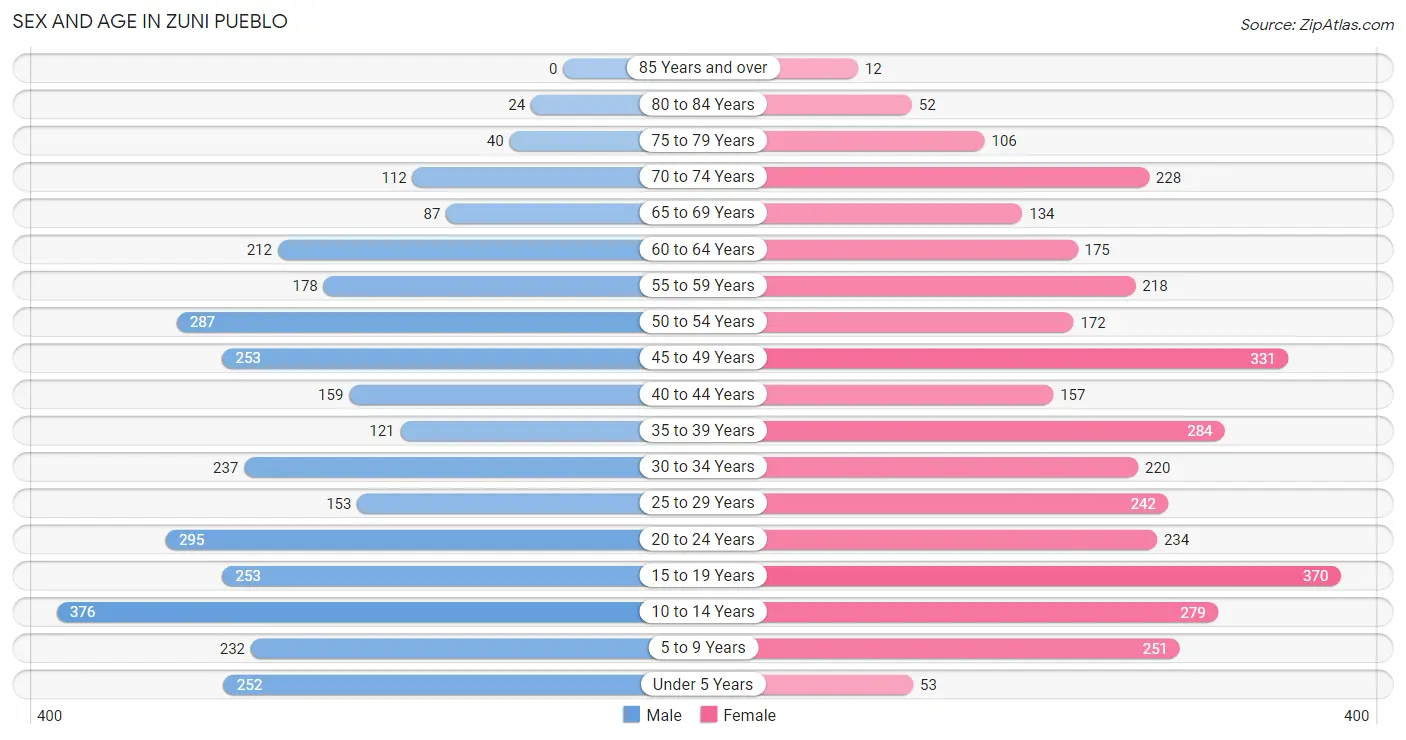
Sex and Age in Zuni Pueblo
Sex and Age in Zuni Pueblo
The most populous age groups in Zuni Pueblo are 10 to 14 Years (376 | 11.5%) for men and 15 to 19 Years (370 | 10.5%) for women.
| Age Bracket | Male | Female |
| Under 5 Years | 252 (7.7%) | 53 (1.5%) |
| 5 to 9 Years | 232 (7.1%) | 251 (7.1%) |
| 10 to 14 Years | 376 (11.5%) | 279 (7.9%) |
| 15 to 19 Years | 253 (7.7%) | 370 (10.5%) |
| 20 to 24 Years | 295 (9.0%) | 234 (6.7%) |
| 25 to 29 Years | 153 (4.7%) | 242 (6.9%) |
| 30 to 34 Years | 237 (7.2%) | 220 (6.2%) |
| 35 to 39 Years | 121 (3.7%) | 284 (8.1%) |
| 40 to 44 Years | 159 (4.9%) | 157 (4.5%) |
| 45 to 49 Years | 253 (7.7%) | 331 (9.4%) |
| 50 to 54 Years | 287 (8.8%) | 172 (4.9%) |
| 55 to 59 Years | 178 (5.4%) | 218 (6.2%) |
| 60 to 64 Years | 212 (6.5%) | 175 (5.0%) |
| 65 to 69 Years | 87 (2.7%) | 134 (3.8%) |
| 70 to 74 Years | 112 (3.4%) | 228 (6.5%) |
| 75 to 79 Years | 40 (1.2%) | 106 (3.0%) |
| 80 to 84 Years | 24 (0.7%) | 52 (1.5%) |
| 85 Years and over | 0 (0.0%) | 12 (0.3%) |
| Total | 3,271 (100.0%) | 3,518 (100.0%) |
Families and Households in Zuni Pueblo
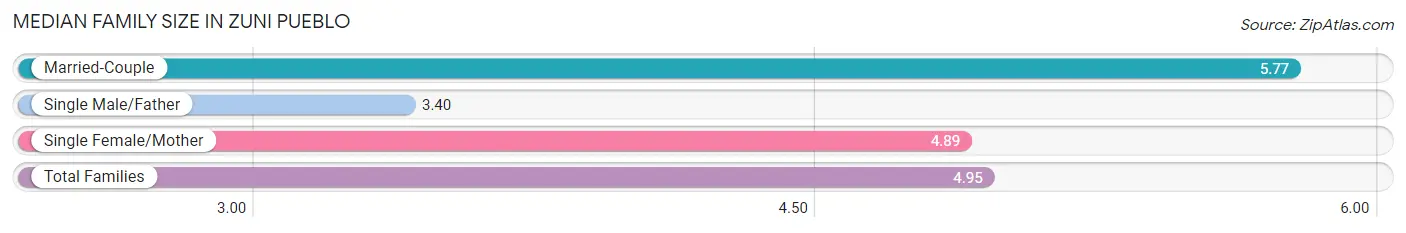
Median Family Size in Zuni Pueblo
The median family size in Zuni Pueblo is 4.95 persons per family, with married-couple families (437 | 34.4%) accounting for the largest median family size of 5.77 persons per family. On the other hand, single male/father families (210 | 16.6%) represent the smallest median family size with 3.40 persons per family.
| Family Type | # Families | Family Size |
| Married-Couple | 437 (34.4%) | 5.77 |
| Single Male/Father | 210 (16.6%) | 3.40 |
| Single Female/Mother | 622 (49.0%) | 4.89 |
| Total Families | 1,269 (100.0%) | 4.95 |
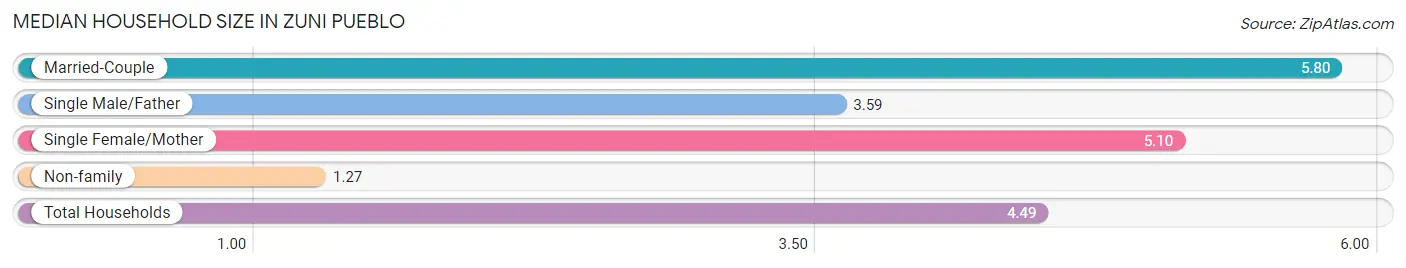
Median Household Size in Zuni Pueblo
The median household size in Zuni Pueblo is 4.49 persons per household, with married-couple households (437 | 29.0%) accounting for the largest median household size of 5.8 persons per household. non-family households (238 | 15.8%) represent the smallest median household size with 1.27 persons per household.
| Household Type | # Households | Household Size |
| Married-Couple | 437 (29.0%) | 5.80 |
| Single Male/Father | 210 (13.9%) | 3.59 |
| Single Female/Mother | 622 (41.3%) | 5.10 |
| Non-family | 238 (15.8%) | 1.27 |
| Total Households | 1,507 (100.0%) | 4.49 |
Household Size by Marriage Status in Zuni Pueblo
Out of a total of 1,507 households in Zuni Pueblo, 1,269 (84.2%) are family households, while 238 (15.8%) are nonfamily households. The most numerous type of family households are 3-person households, comprising 366, and the most common type of nonfamily households are 1-person households, comprising 183.
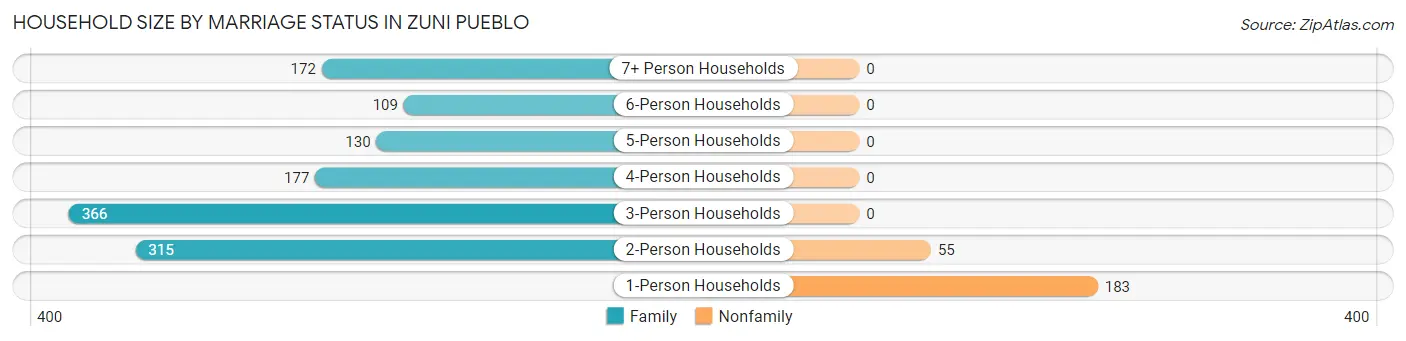
| Household Size | Family Households | Nonfamily Households |
| 1-Person Households | - | 183 (12.1%) |
| 2-Person Households | 315 (20.9%) | 55 (3.6%) |
| 3-Person Households | 366 (24.3%) | 0 (0.0%) |
| 4-Person Households | 177 (11.7%) | 0 (0.0%) |
| 5-Person Households | 130 (8.6%) | 0 (0.0%) |
| 6-Person Households | 109 (7.2%) | 0 (0.0%) |
| 7+ Person Households | 172 (11.4%) | 0 (0.0%) |
| Total | 1,269 (84.2%) | 238 (15.8%) |
Female Fertility in Zuni Pueblo
Fertility by Age in Zuni Pueblo
Average fertility rate in Zuni Pueblo is 49.0 births per 1,000 women. Women in the age bracket of 20 to 34 years have the highest fertility rate with 115.0 births per 1,000 women. Women in the age bracket of 20 to 34 years acount for 87.9% of all women with births.
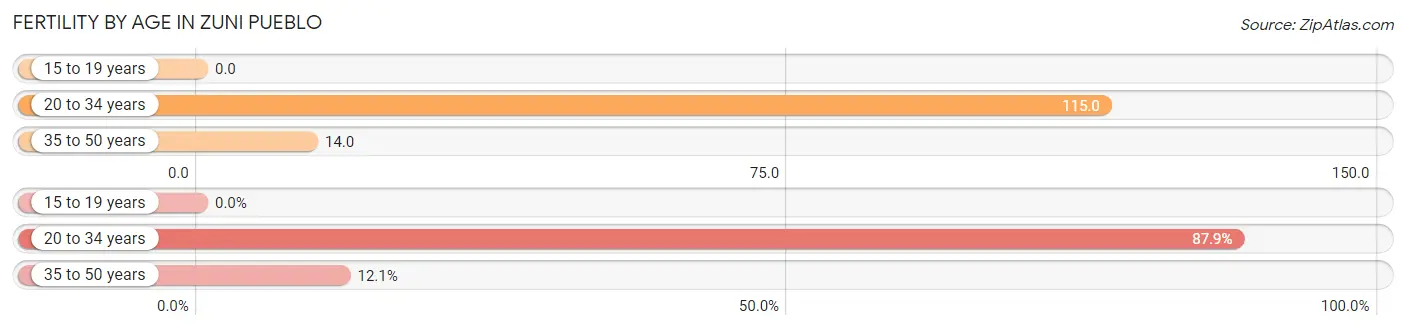
| Age Bracket | Women with Births | Births / 1,000 Women |
| 15 to 19 years | 0 (0.0%) | 0.0 |
| 20 to 34 years | 80 (87.9%) | 115.0 |
| 35 to 50 years | 11 (12.1%) | 14.0 |
| Total | 91 (100.0%) | 49.0 |
Fertility by Age by Marriage Status in Zuni Pueblo
12.1% of women with births (91) in Zuni Pueblo are married. The highest percentage of unmarried women with births falls into 20 to 34 years age bracket with 100.0% of them unmarried at the time of birth, while the lowest percentage of unmarried women with births belong to 35 to 50 years age bracket with 0.0% of them unmarried.
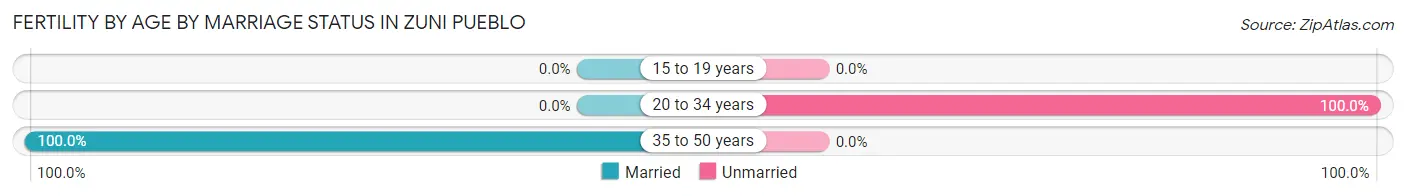
| Age Bracket | Married | Unmarried |
| 15 to 19 years | 0 (0.0%) | 0 (0.0%) |
| 20 to 34 years | 0 (0.0%) | 80 (100.0%) |
| 35 to 50 years | 11 (100.0%) | 0 (0.0%) |
| Total | 11 (12.1%) | 80 (87.9%) |
Fertility by Education in Zuni Pueblo
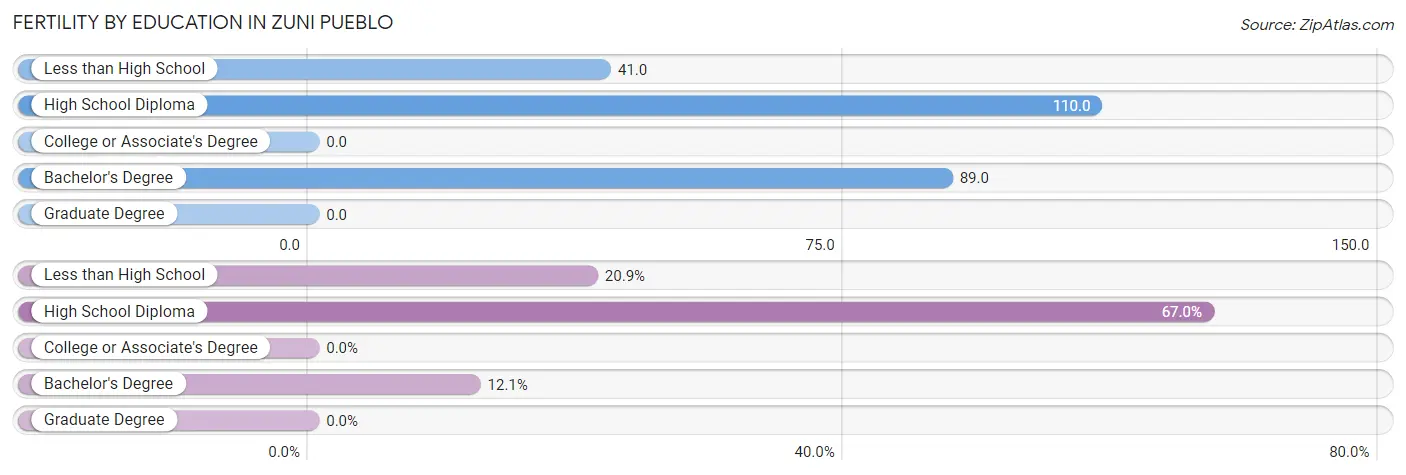
| Educational Attainment | Women with Births | Births / 1,000 Women |
| Less than High School | 19 (20.9%) | 41.0 |
| High School Diploma | 61 (67.0%) | 110.0 |
| College or Associate's Degree | 0 (0.0%) | 0.0 |
| Bachelor's Degree | 11 (12.1%) | 89.0 |
| Graduate Degree | 0 (0.0%) | 0.0 |
| Total | 91 (100.0%) | 49.0 |
Fertility by Education by Marriage Status in Zuni Pueblo
87.9% of women with births in Zuni Pueblo are unmarried. Women with the educational attainment of bachelor's degree are most likely to be married with 100.0% of them married at childbirth, while women with the educational attainment of less than high school are least likely to be married with 100.0% of them unmarried at childbirth.
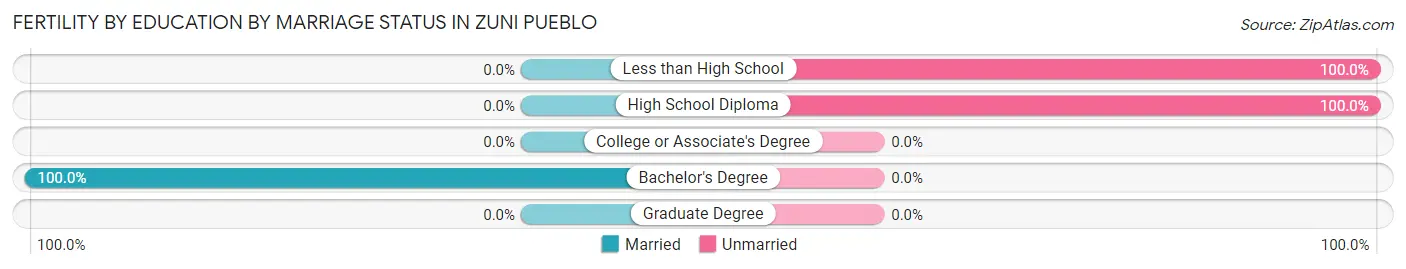
| Educational Attainment | Married | Unmarried |
| Less than High School | 0 (0.0%) | 19 (100.0%) |
| High School Diploma | 0 (0.0%) | 61 (100.0%) |
| College or Associate's Degree | 0 (0.0%) | 0 (0.0%) |
| Bachelor's Degree | 11 (100.0%) | 0 (0.0%) |
| Graduate Degree | 0 (0.0%) | 0 (0.0%) |
| Total | 11 (12.1%) | 80 (87.9%) |
Employment Characteristics in Zuni Pueblo
Employment by Class of Employer in Zuni Pueblo
Among the 2,138 employed individuals in Zuni Pueblo, private company employees (684 | 32.0%), self-employed (not incorporated) (479 | 22.4%), and local government employees (440 | 20.6%) make up the most common classes of employment.
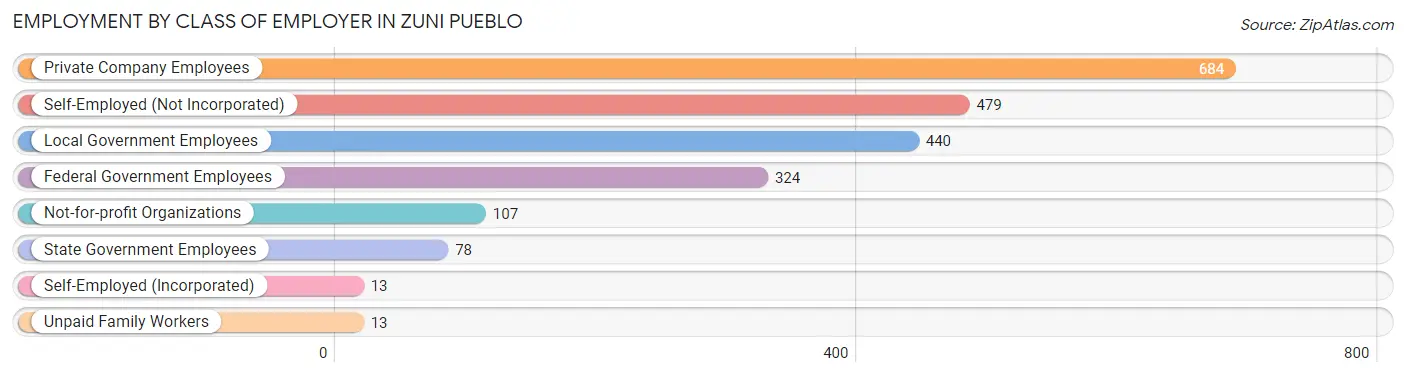
| Employer Class | # Employees | % Employees |
| Private Company Employees | 684 | 32.0% |
| Self-Employed (Incorporated) | 13 | 0.6% |
| Self-Employed (Not Incorporated) | 479 | 22.4% |
| Not-for-profit Organizations | 107 | 5.0% |
| Local Government Employees | 440 | 20.6% |
| State Government Employees | 78 | 3.6% |
| Federal Government Employees | 324 | 15.1% |
| Unpaid Family Workers | 13 | 0.6% |
| Total | 2,138 | 100.0% |
Employment Status by Age in Zuni Pueblo
According to the labor force statistics for Zuni Pueblo, out of the total population over 16 years of age (5,228), 48.0% or 2,509 individuals are in the labor force, with 14.2% or 356 of them unemployed. The age group with the highest labor force participation rate is 45 to 54 years, with 70.9% or 739 individuals in the labor force. Within the labor force, the 25 to 29 years age range has the highest percentage of unemployed individuals, with 25.6% or 46 of them being unemployed.
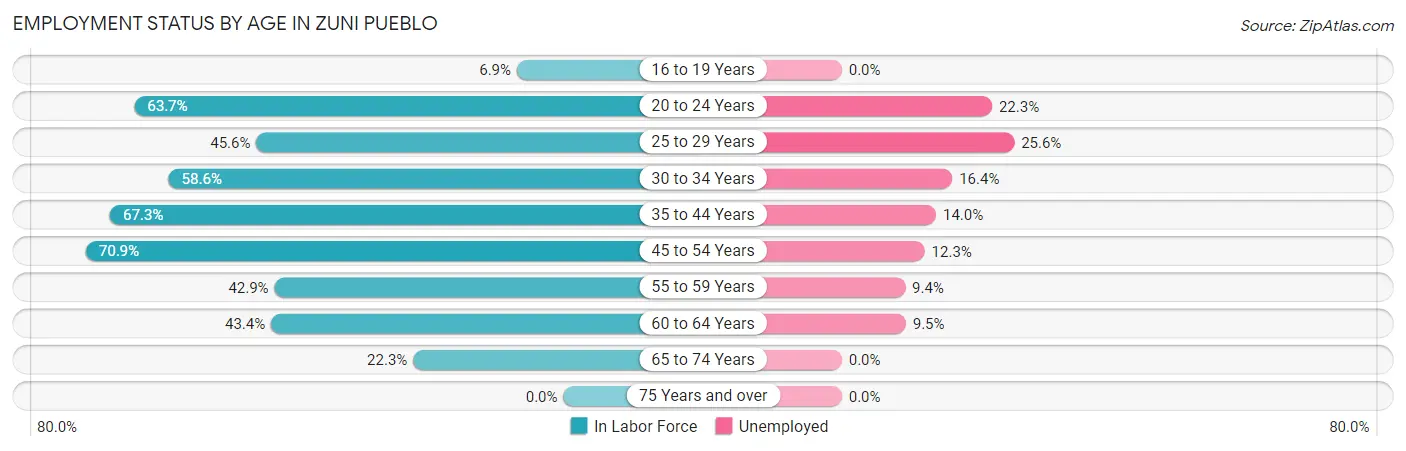
| Age Bracket | In Labor Force | Unemployed |
| 16 to 19 Years | 35 (6.9%) | 0 (0.0%) |
| 20 to 24 Years | 337 (63.7%) | 75 (22.3%) |
| 25 to 29 Years | 180 (45.6%) | 46 (25.6%) |
| 30 to 34 Years | 268 (58.6%) | 44 (16.4%) |
| 35 to 44 Years | 485 (67.3%) | 68 (14.0%) |
| 45 to 54 Years | 739 (70.9%) | 91 (12.3%) |
| 55 to 59 Years | 170 (42.9%) | 16 (9.4%) |
| 60 to 64 Years | 168 (43.4%) | 16 (9.5%) |
| 65 to 74 Years | 125 (22.3%) | 0 (0.0%) |
| 75 Years and over | 0 (0.0%) | 0 (0.0%) |
| Total | 2,509 (48.0%) | 356 (14.2%) |
Employment Status by Educational Attainment in Zuni Pueblo
According to labor force statistics for Zuni Pueblo, 59.2% of individuals (2,012) out of the total population between 25 and 64 years of age (3,399) are in the labor force, with 14.0% or 282 of them being unemployed. The group with the highest labor force participation rate are those with the educational attainment of bachelor's degree or higher, with 97.1% or 201 individuals in the labor force. Within the labor force, individuals with high school diploma education have the highest percentage of unemployment, with 18.2% or 139 of them being unemployed.
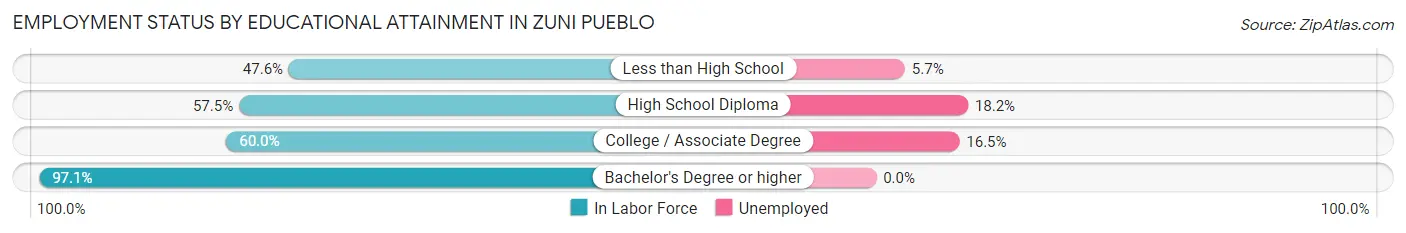
| Educational Attainment | In Labor Force | Unemployed |
| Less than High School | 280 (47.6%) | 34 (5.7%) |
| High School Diploma | 765 (57.5%) | 242 (18.2%) |
| College / Associate Degree | 764 (60.0%) | 210 (16.5%) |
| Bachelor's Degree or higher | 201 (97.1%) | 0 (0.0%) |
| Total | 2,012 (59.2%) | 476 (14.0%) |
Employment Occupations by Sex in Zuni Pueblo
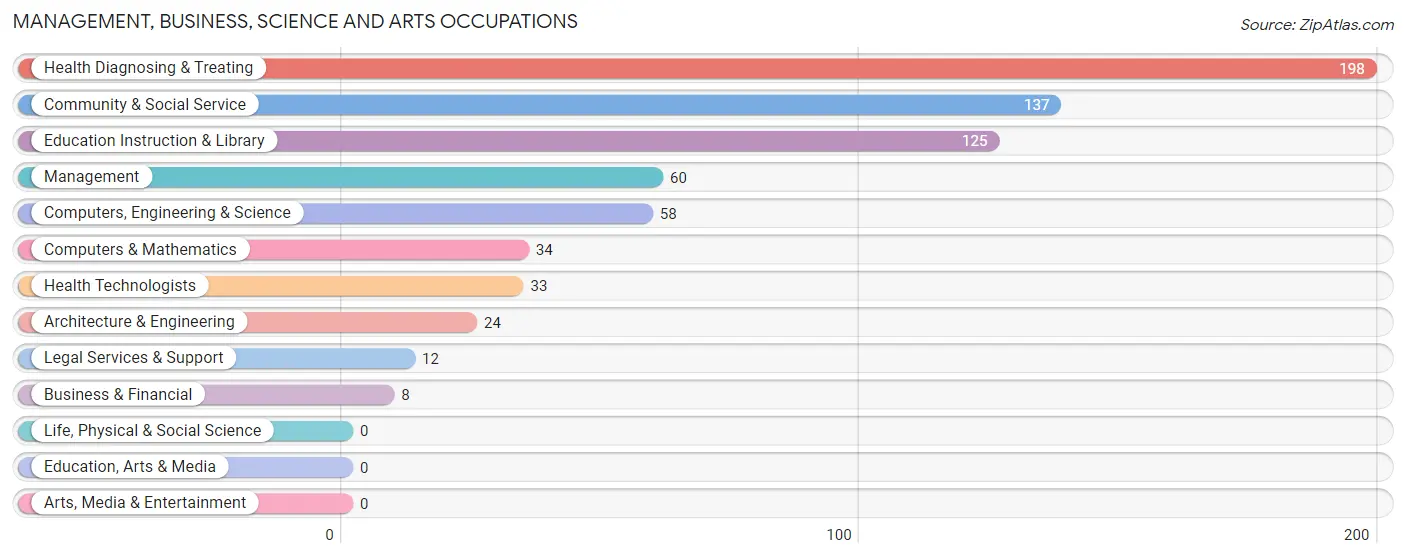
Management, Business, Science and Arts Occupations
The most common Management, Business, Science and Arts occupations in Zuni Pueblo are Health Diagnosing & Treating (198 | 9.2%), Community & Social Service (137 | 6.4%), Education Instruction & Library (125 | 5.8%), Management (60 | 2.8%), and Computers, Engineering & Science (58 | 2.7%).
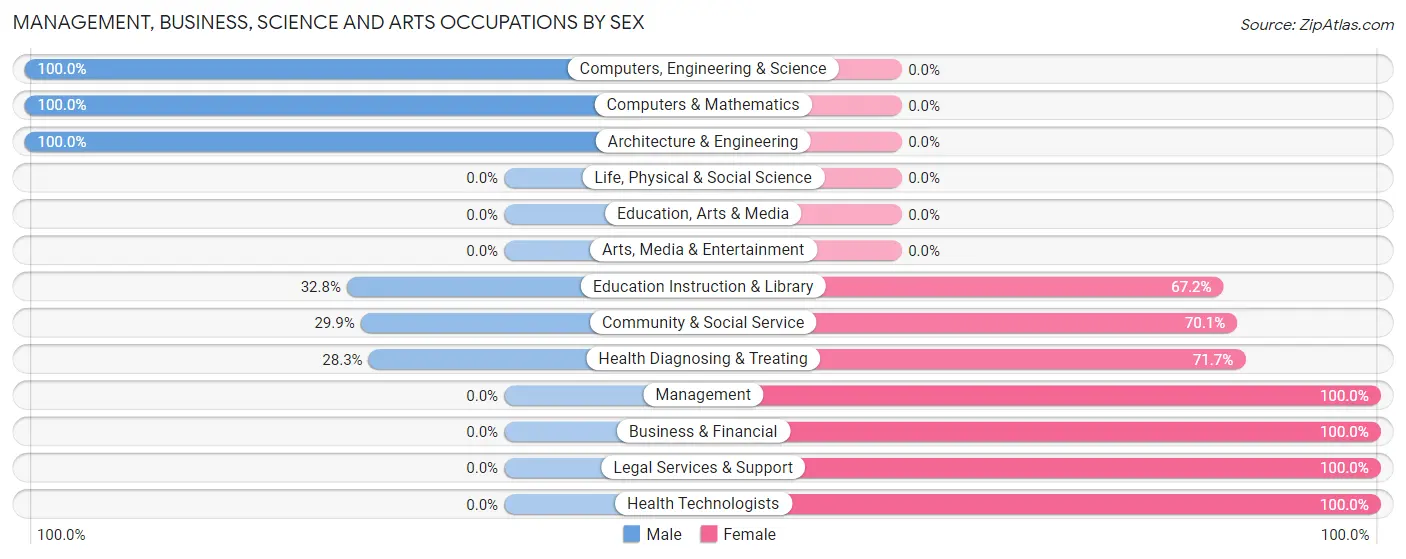
Management, Business, Science and Arts Occupations by Sex
Within the Management, Business, Science and Arts occupations in Zuni Pueblo, the most male-oriented occupations are Computers, Engineering & Science (100.0%), Computers & Mathematics (100.0%), and Architecture & Engineering (100.0%), while the most female-oriented occupations are Management (100.0%), Business & Financial (100.0%), and Legal Services & Support (100.0%).
| Occupation | Male | Female |
| Management | 0 (0.0%) | 60 (100.0%) |
| Business & Financial | 0 (0.0%) | 8 (100.0%) |
| Computers, Engineering & Science | 58 (100.0%) | 0 (0.0%) |
| Computers & Mathematics | 34 (100.0%) | 0 (0.0%) |
| Architecture & Engineering | 24 (100.0%) | 0 (0.0%) |
| Life, Physical & Social Science | 0 (0.0%) | 0 (0.0%) |
| Community & Social Service | 41 (29.9%) | 96 (70.1%) |
| Education, Arts & Media | 0 (0.0%) | 0 (0.0%) |
| Legal Services & Support | 0 (0.0%) | 12 (100.0%) |
| Education Instruction & Library | 41 (32.8%) | 84 (67.2%) |
| Arts, Media & Entertainment | 0 (0.0%) | 0 (0.0%) |
| Health Diagnosing & Treating | 56 (28.3%) | 142 (71.7%) |
| Health Technologists | 0 (0.0%) | 33 (100.0%) |
| Total (Category) | 155 (33.6%) | 306 (66.4%) |
| Total (Overall) | 895 (41.6%) | 1,257 (58.4%) |
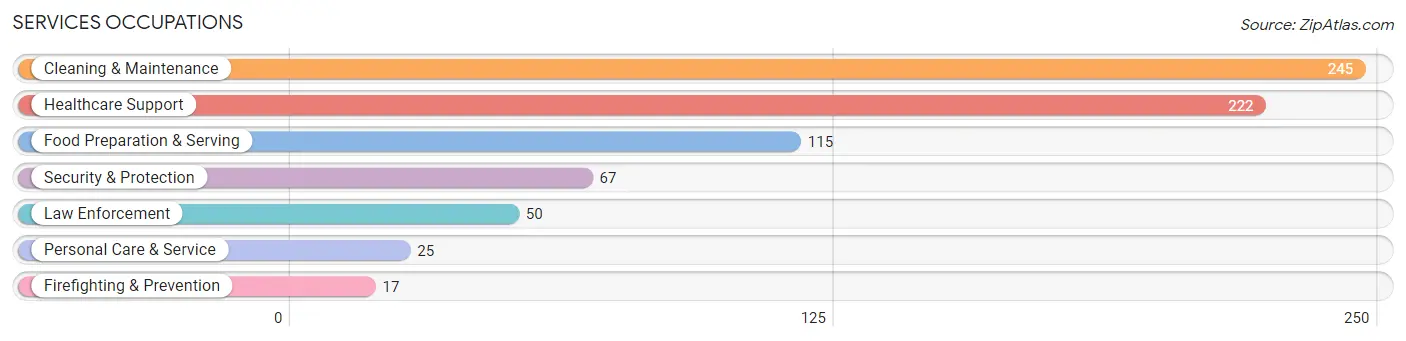
Services Occupations
The most common Services occupations in Zuni Pueblo are Cleaning & Maintenance (245 | 11.4%), Healthcare Support (222 | 10.3%), Food Preparation & Serving (115 | 5.3%), Security & Protection (67 | 3.1%), and Law Enforcement (50 | 2.3%).
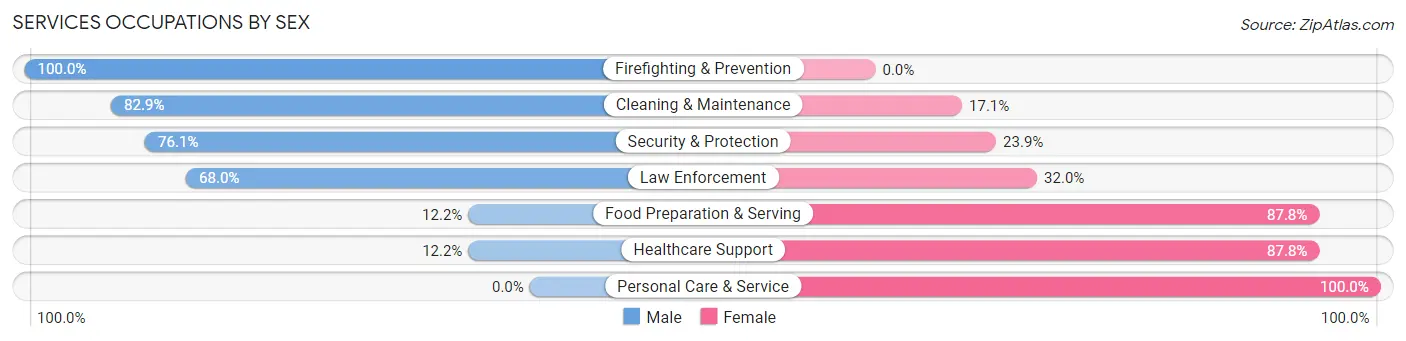
Services Occupations by Sex
Within the Services occupations in Zuni Pueblo, the most male-oriented occupations are Firefighting & Prevention (100.0%), Cleaning & Maintenance (82.9%), and Security & Protection (76.1%), while the most female-oriented occupations are Personal Care & Service (100.0%), Healthcare Support (87.8%), and Food Preparation & Serving (87.8%).
| Occupation | Male | Female |
| Healthcare Support | 27 (12.2%) | 195 (87.8%) |
| Security & Protection | 51 (76.1%) | 16 (23.9%) |
| Firefighting & Prevention | 17 (100.0%) | 0 (0.0%) |
| Law Enforcement | 34 (68.0%) | 16 (32.0%) |
| Food Preparation & Serving | 14 (12.2%) | 101 (87.8%) |
| Cleaning & Maintenance | 203 (82.9%) | 42 (17.1%) |
| Personal Care & Service | 0 (0.0%) | 25 (100.0%) |
| Total (Category) | 295 (43.8%) | 379 (56.2%) |
| Total (Overall) | 895 (41.6%) | 1,257 (58.4%) |
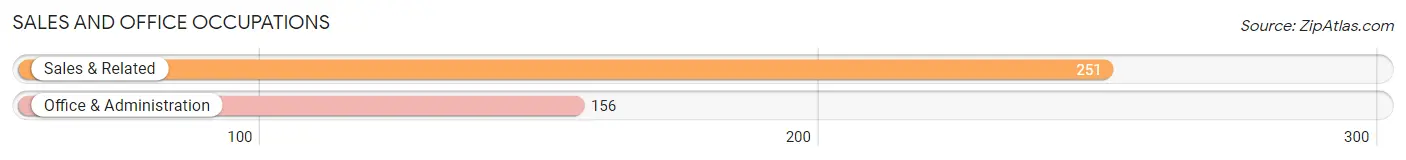
Sales and Office Occupations
The most common Sales and Office occupations in Zuni Pueblo are Sales & Related (251 | 11.7%), and Office & Administration (156 | 7.2%).
Sales and Office Occupations by Sex
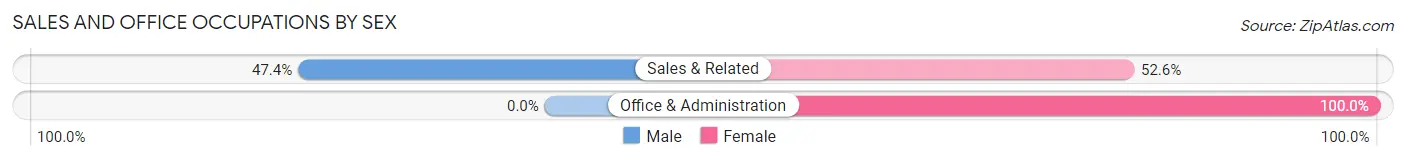
| Occupation | Male | Female |
| Sales & Related | 119 (47.4%) | 132 (52.6%) |
| Office & Administration | 0 (0.0%) | 156 (100.0%) |
| Total (Category) | 119 (29.2%) | 288 (70.8%) |
| Total (Overall) | 895 (41.6%) | 1,257 (58.4%) |
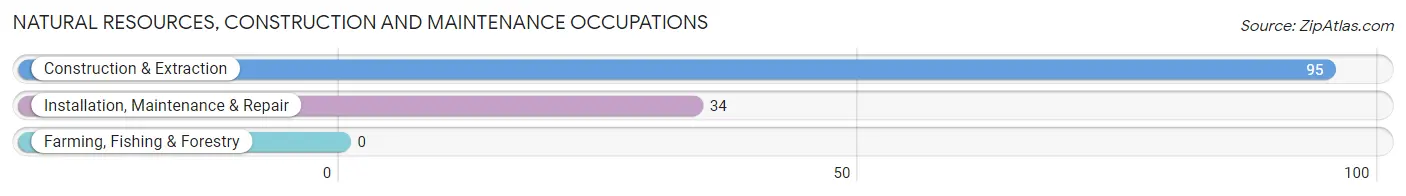
Natural Resources, Construction and Maintenance Occupations
The most common Natural Resources, Construction and Maintenance occupations in Zuni Pueblo are Construction & Extraction (95 | 4.4%), and Installation, Maintenance & Repair (34 | 1.6%).
Natural Resources, Construction and Maintenance Occupations by Sex
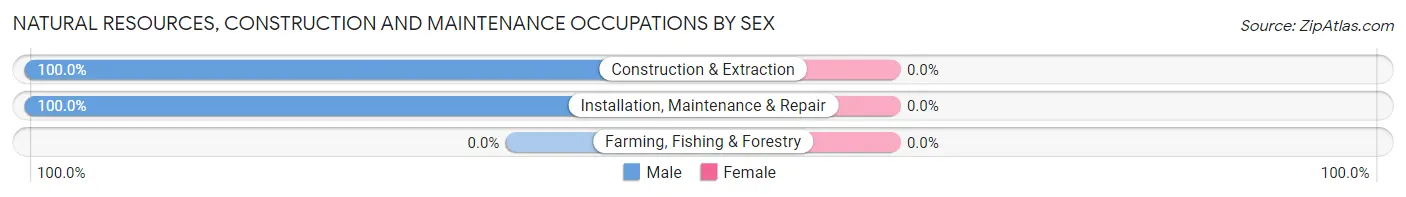
| Occupation | Male | Female |
| Farming, Fishing & Forestry | 0 (0.0%) | 0 (0.0%) |
| Construction & Extraction | 95 (100.0%) | 0 (0.0%) |
| Installation, Maintenance & Repair | 34 (100.0%) | 0 (0.0%) |
| Total (Category) | 129 (100.0%) | 0 (0.0%) |
| Total (Overall) | 895 (41.6%) | 1,257 (58.4%) |
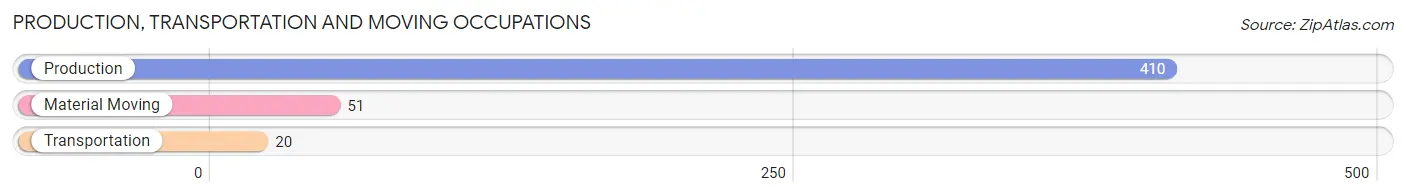
Production, Transportation and Moving Occupations
The most common Production, Transportation and Moving occupations in Zuni Pueblo are Production (410 | 19.1%), Material Moving (51 | 2.4%), and Transportation (20 | 0.9%).
Production, Transportation and Moving Occupations by Sex
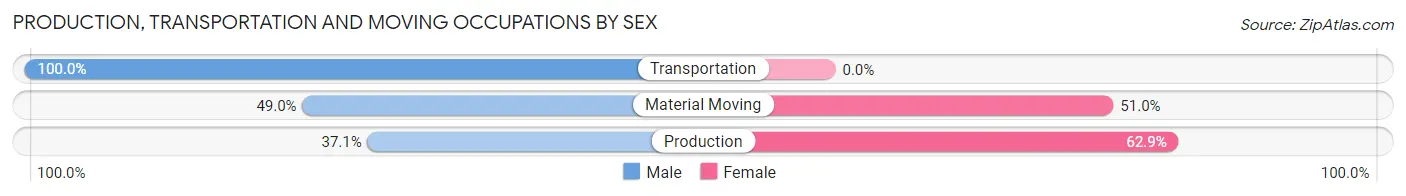
| Occupation | Male | Female |
| Production | 152 (37.1%) | 258 (62.9%) |
| Transportation | 20 (100.0%) | 0 (0.0%) |
| Material Moving | 25 (49.0%) | 26 (51.0%) |
| Total (Category) | 197 (41.0%) | 284 (59.0%) |
| Total (Overall) | 895 (41.6%) | 1,257 (58.4%) |
Employment Industries by Sex in Zuni Pueblo
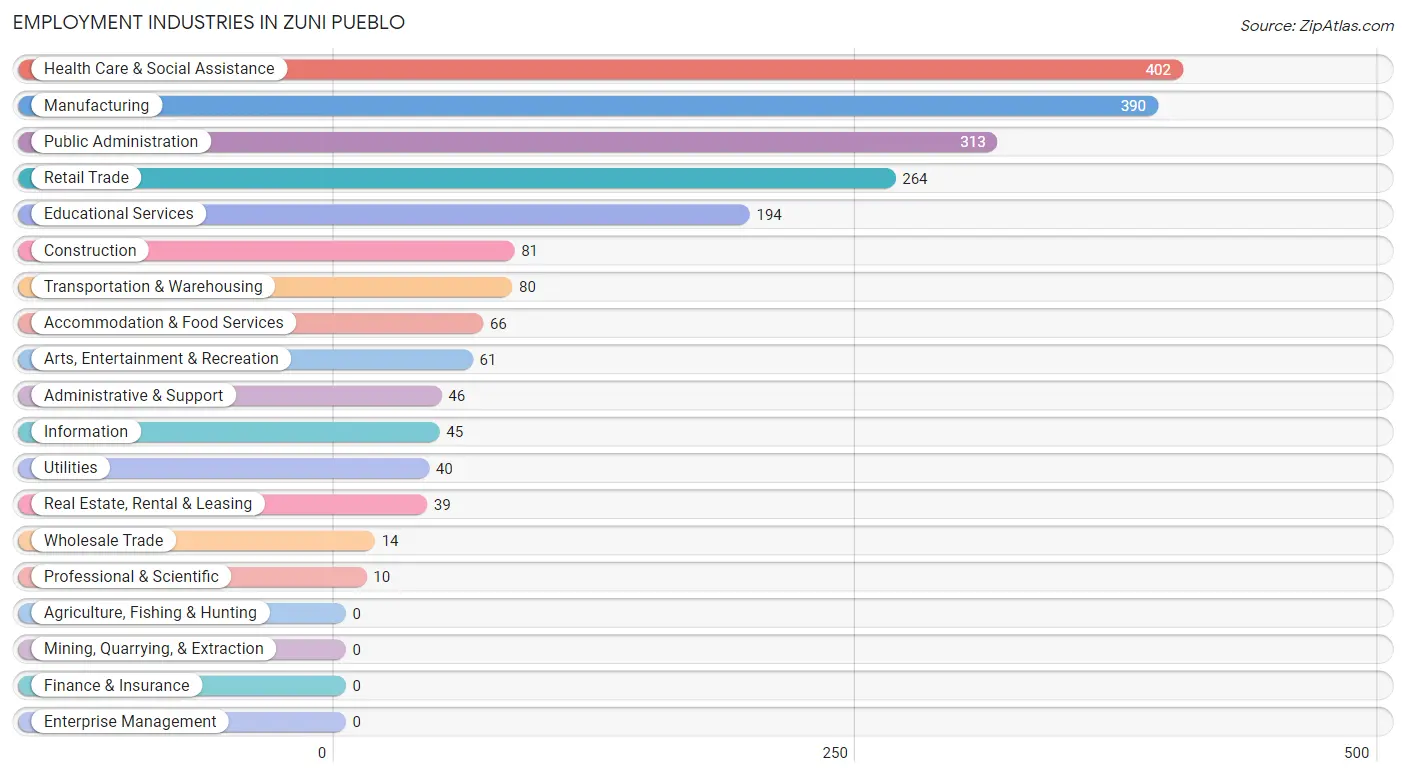
Employment Industries in Zuni Pueblo
The major employment industries in Zuni Pueblo include Health Care & Social Assistance (402 | 18.7%), Manufacturing (390 | 18.1%), Public Administration (313 | 14.5%), Retail Trade (264 | 12.3%), and Educational Services (194 | 9.0%).
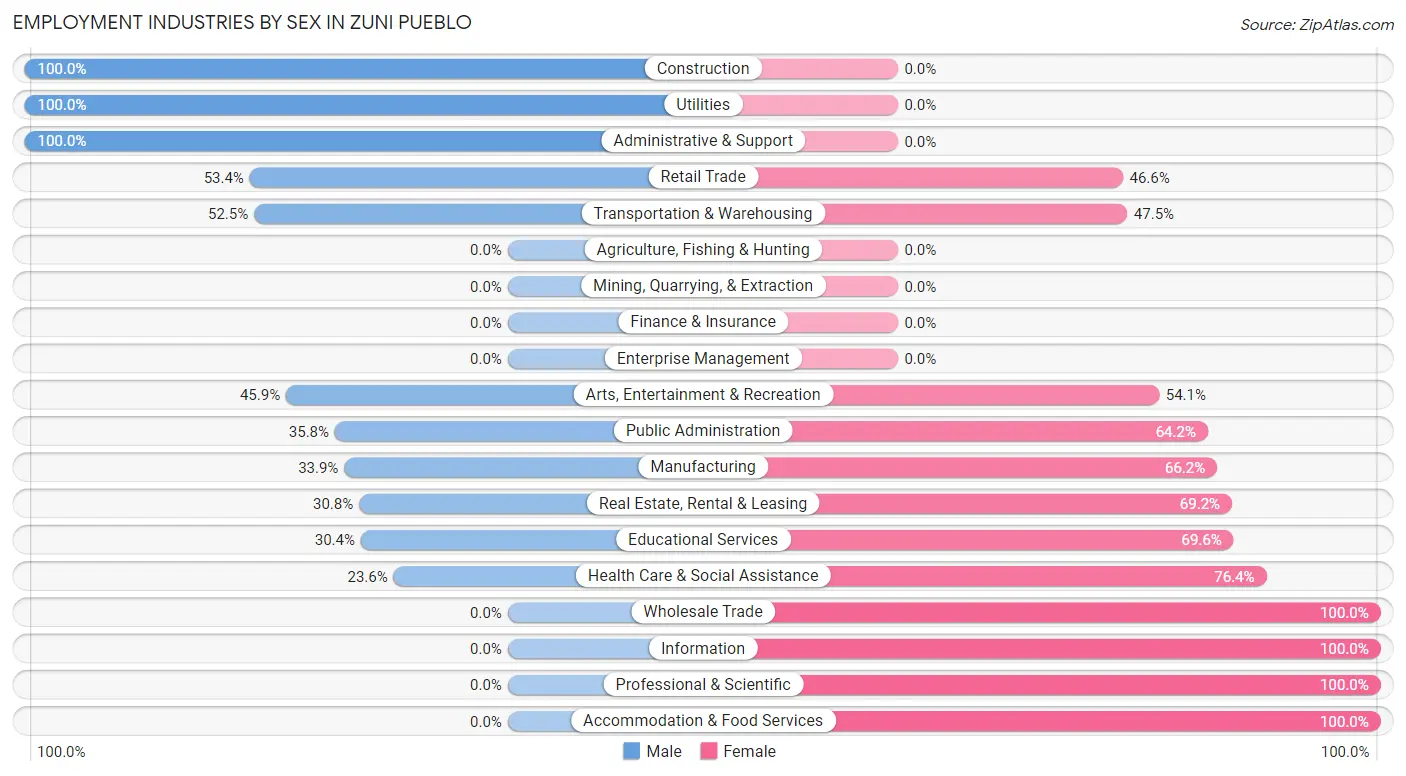
Employment Industries by Sex in Zuni Pueblo
The Zuni Pueblo industries that see more men than women are Construction (100.0%), Utilities (100.0%), and Administrative & Support (100.0%), whereas the industries that tend to have a higher number of women are Wholesale Trade (100.0%), Information (100.0%), and Professional & Scientific (100.0%).
| Industry | Male | Female |
| Agriculture, Fishing & Hunting | 0 (0.0%) | 0 (0.0%) |
| Mining, Quarrying, & Extraction | 0 (0.0%) | 0 (0.0%) |
| Construction | 81 (100.0%) | 0 (0.0%) |
| Manufacturing | 132 (33.9%) | 258 (66.1%) |
| Wholesale Trade | 0 (0.0%) | 14 (100.0%) |
| Retail Trade | 141 (53.4%) | 123 (46.6%) |
| Transportation & Warehousing | 42 (52.5%) | 38 (47.5%) |
| Utilities | 40 (100.0%) | 0 (0.0%) |
| Information | 0 (0.0%) | 45 (100.0%) |
| Finance & Insurance | 0 (0.0%) | 0 (0.0%) |
| Real Estate, Rental & Leasing | 12 (30.8%) | 27 (69.2%) |
| Professional & Scientific | 0 (0.0%) | 10 (100.0%) |
| Enterprise Management | 0 (0.0%) | 0 (0.0%) |
| Administrative & Support | 46 (100.0%) | 0 (0.0%) |
| Educational Services | 59 (30.4%) | 135 (69.6%) |
| Health Care & Social Assistance | 95 (23.6%) | 307 (76.4%) |
| Arts, Entertainment & Recreation | 28 (45.9%) | 33 (54.1%) |
| Accommodation & Food Services | 0 (0.0%) | 66 (100.0%) |
| Public Administration | 112 (35.8%) | 201 (64.2%) |
| Total | 895 (41.6%) | 1,257 (58.4%) |
Education in Zuni Pueblo
School Enrollment in Zuni Pueblo
The most common levels of schooling among the 1,802 students in Zuni Pueblo are middle school (529 | 29.4%), high school (471 | 26.1%), and elementary school (427 | 23.7%).
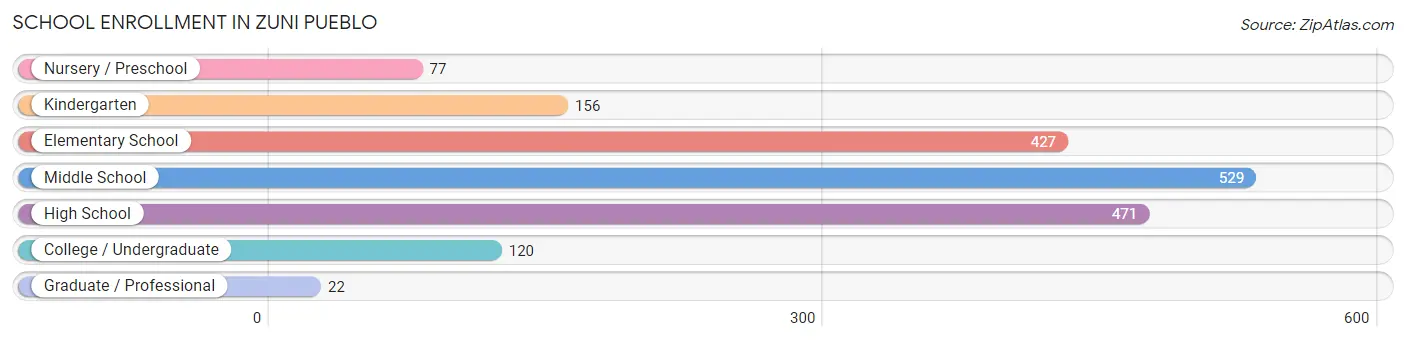
| School Level | # Students | % Students |
| Nursery / Preschool | 77 | 4.3% |
| Kindergarten | 156 | 8.7% |
| Elementary School | 427 | 23.7% |
| Middle School | 529 | 29.4% |
| High School | 471 | 26.1% |
| College / Undergraduate | 120 | 6.7% |
| Graduate / Professional | 22 | 1.2% |
| Total | 1,802 | 100.0% |
School Enrollment by Age by Funding Source in Zuni Pueblo
Out of a total of 1,802 students who are enrolled in schools in Zuni Pueblo, 14 (0.8%) attend a private institution, while the remaining 1,788 (99.2%) are enrolled in public schools. The age group of 5 to 9 year old has the highest likelihood of being enrolled in private schools, with 15 (3.2% in the age bracket) enrolled. Conversely, the age group of 3 to 4 year olds has the lowest likelihood of being enrolled in a private school, with 106 (100.0% in the age bracket) attending a public institution.
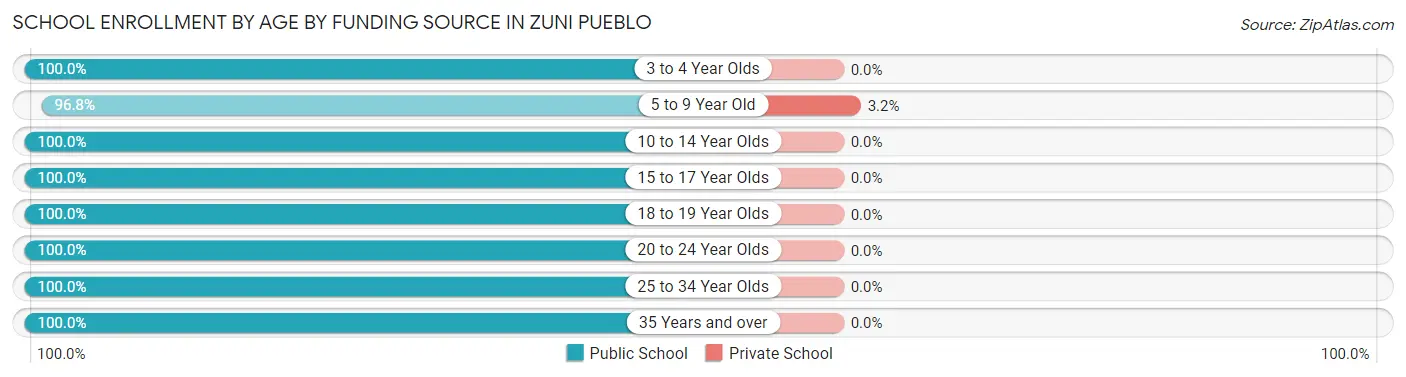
| Age Bracket | Public School | Private School |
| 3 to 4 Year Olds | 106 (100.0%) | 0 (0.0%) |
| 5 to 9 Year Old | 458 (96.8%) | 15 (3.2%) |
| 10 to 14 Year Olds | 646 (100.0%) | 0 (0.0%) |
| 15 to 17 Year Olds | 317 (100.0%) | 0 (0.0%) |
| 18 to 19 Year Olds | 96 (100.0%) | 0 (0.0%) |
| 20 to 24 Year Olds | 46 (100.0%) | 0 (0.0%) |
| 25 to 34 Year Olds | 39 (100.0%) | 0 (0.0%) |
| 35 Years and over | 79 (100.0%) | 0 (0.0%) |
| Total | 1,788 (99.2%) | 14 (0.8%) |
Educational Attainment by Field of Study in Zuni Pueblo
Science & technology (70 | 33.8%), computers & mathematics (34 | 16.4%), education (29 | 14.0%), engineering (21 | 10.1%), and bio, nature & agricultural (16 | 7.7%) are the most common fields of study among 207 individuals in Zuni Pueblo who have obtained a bachelor's degree or higher.
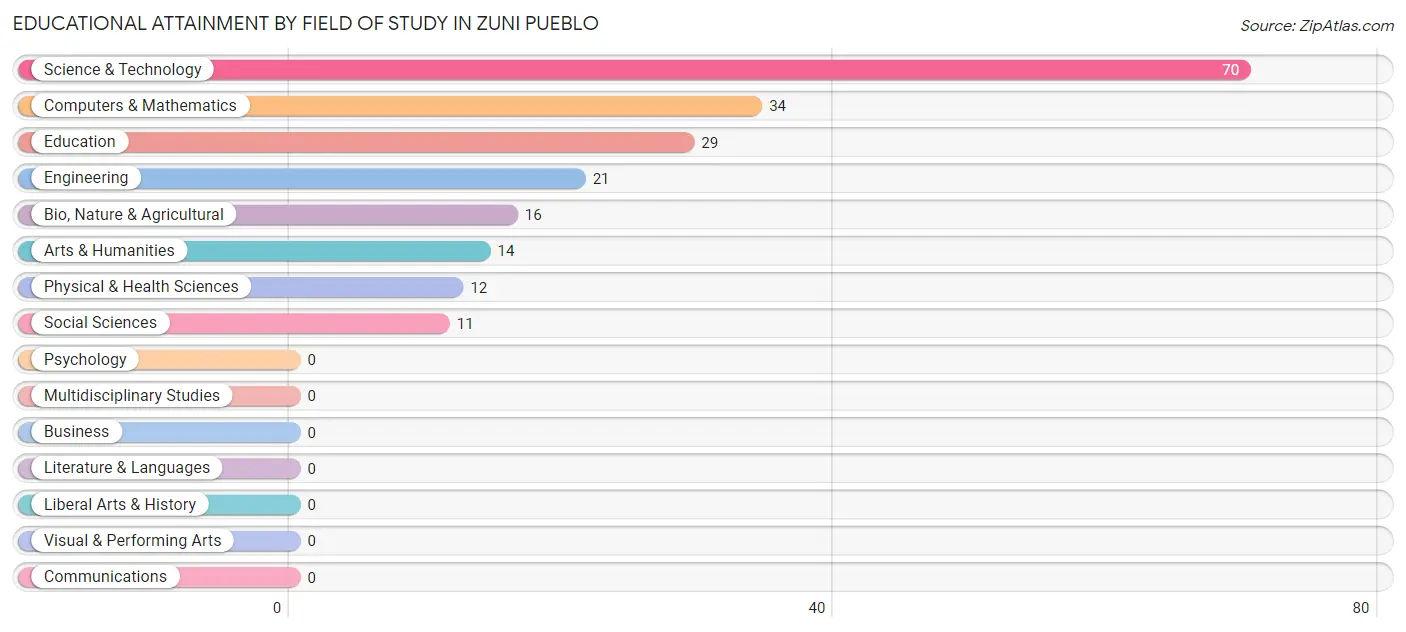
| Field of Study | # Graduates | % Graduates |
| Computers & Mathematics | 34 | 16.4% |
| Bio, Nature & Agricultural | 16 | 7.7% |
| Physical & Health Sciences | 12 | 5.8% |
| Psychology | 0 | 0.0% |
| Social Sciences | 11 | 5.3% |
| Engineering | 21 | 10.1% |
| Multidisciplinary Studies | 0 | 0.0% |
| Science & Technology | 70 | 33.8% |
| Business | 0 | 0.0% |
| Education | 29 | 14.0% |
| Literature & Languages | 0 | 0.0% |
| Liberal Arts & History | 0 | 0.0% |
| Visual & Performing Arts | 0 | 0.0% |
| Communications | 0 | 0.0% |
| Arts & Humanities | 14 | 6.8% |
| Total | 207 | 100.0% |
Transportation & Commute in Zuni Pueblo
Vehicle Availability by Sex in Zuni Pueblo
The most prevalent vehicle ownership categories in Zuni Pueblo are males with 2 vehicles (290, accounting for 32.9%) and females with 2 vehicles (272, making up 23.1%).
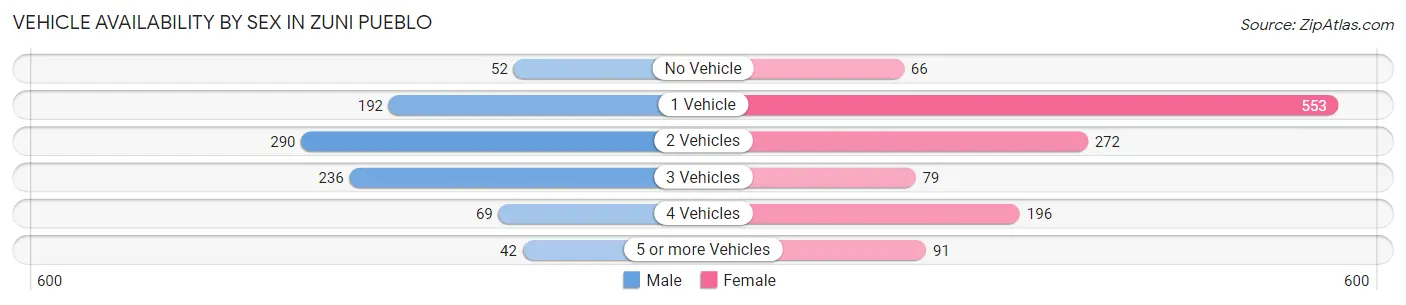
| Vehicles Available | Male | Female |
| No Vehicle | 52 (5.9%) | 66 (5.2%) |
| 1 Vehicle | 192 (21.8%) | 553 (44.0%) |
| 2 Vehicles | 290 (32.9%) | 272 (21.6%) |
| 3 Vehicles | 236 (26.8%) | 79 (6.3%) |
| 4 Vehicles | 69 (7.8%) | 196 (15.6%) |
| 5 or more Vehicles | 42 (4.8%) | 91 (7.2%) |
| Total | 881 (100.0%) | 1,257 (100.0%) |
Commute Time in Zuni Pueblo
The most frequently occuring commute durations in Zuni Pueblo are 5 to 9 minutes (431 commuters, 27.6%), 10 to 14 minutes (247 commuters, 15.8%), and 15 to 19 minutes (209 commuters, 13.4%).
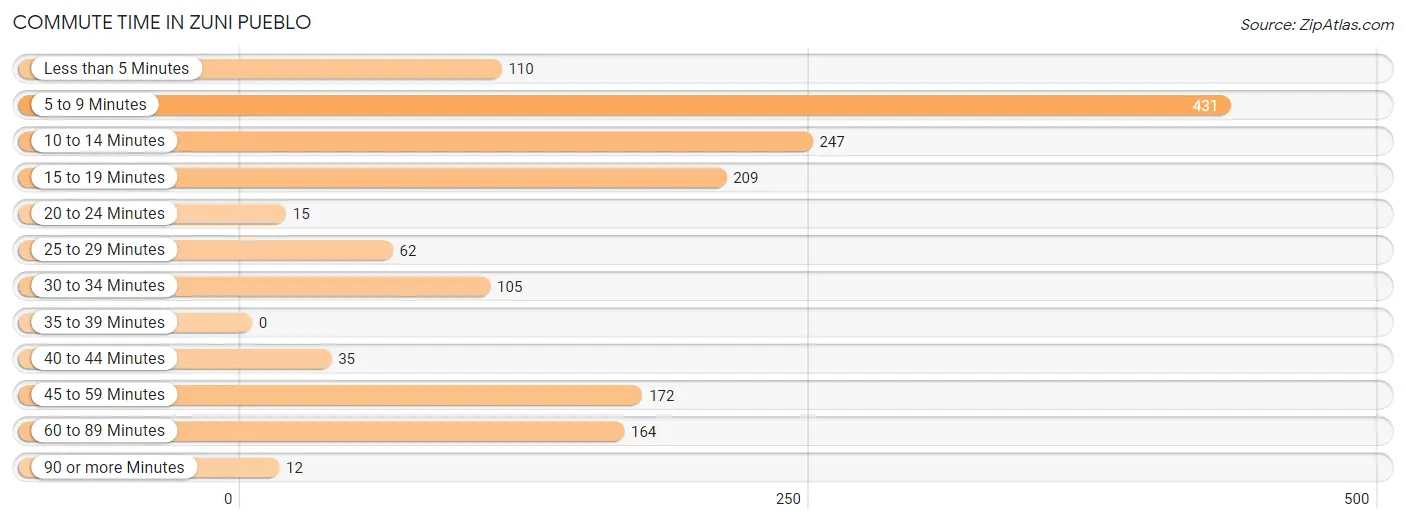
| Commute Time | # Commuters | % Commuters |
| Less than 5 Minutes | 110 | 7.0% |
| 5 to 9 Minutes | 431 | 27.6% |
| 10 to 14 Minutes | 247 | 15.8% |
| 15 to 19 Minutes | 209 | 13.4% |
| 20 to 24 Minutes | 15 | 1.0% |
| 25 to 29 Minutes | 62 | 4.0% |
| 30 to 34 Minutes | 105 | 6.7% |
| 35 to 39 Minutes | 0 | 0.0% |
| 40 to 44 Minutes | 35 | 2.2% |
| 45 to 59 Minutes | 172 | 11.0% |
| 60 to 89 Minutes | 164 | 10.5% |
| 90 or more Minutes | 12 | 0.8% |
Commute Time by Sex in Zuni Pueblo
The most common commute times in Zuni Pueblo are 5 to 9 minutes (282 commuters, 40.0%) for males and 15 to 19 minutes (197 commuters, 23.0%) for females.
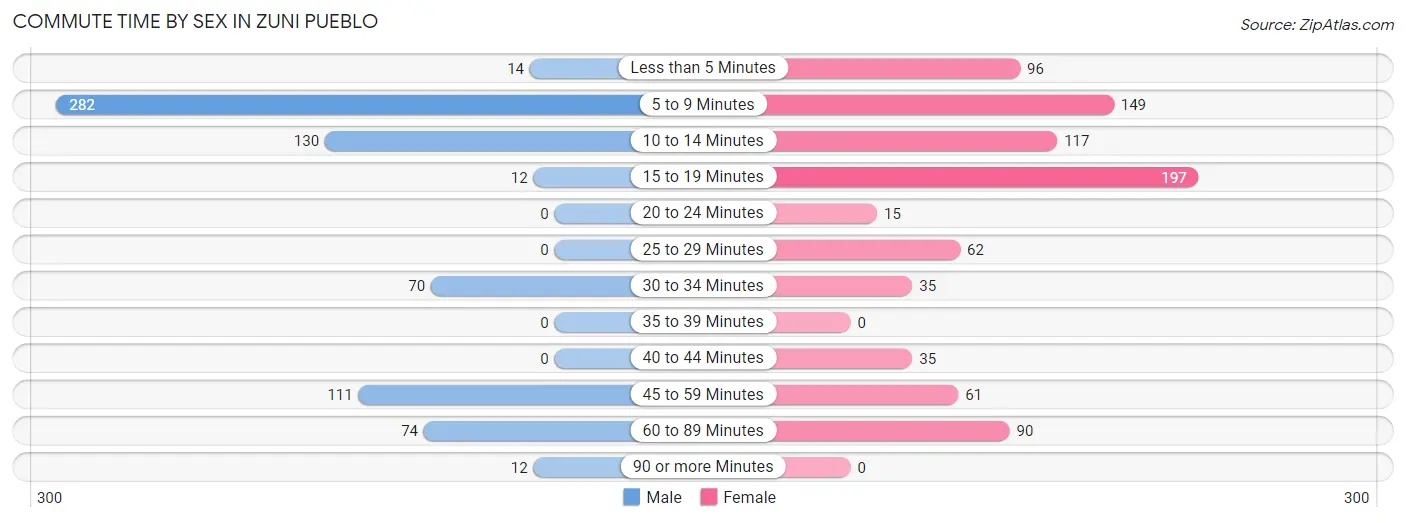
| Commute Time | Male | Female |
| Less than 5 Minutes | 14 (2.0%) | 96 (11.2%) |
| 5 to 9 Minutes | 282 (40.0%) | 149 (17.4%) |
| 10 to 14 Minutes | 130 (18.4%) | 117 (13.7%) |
| 15 to 19 Minutes | 12 (1.7%) | 197 (23.0%) |
| 20 to 24 Minutes | 0 (0.0%) | 15 (1.8%) |
| 25 to 29 Minutes | 0 (0.0%) | 62 (7.2%) |
| 30 to 34 Minutes | 70 (9.9%) | 35 (4.1%) |
| 35 to 39 Minutes | 0 (0.0%) | 0 (0.0%) |
| 40 to 44 Minutes | 0 (0.0%) | 35 (4.1%) |
| 45 to 59 Minutes | 111 (15.7%) | 61 (7.1%) |
| 60 to 89 Minutes | 74 (10.5%) | 90 (10.5%) |
| 90 or more Minutes | 12 (1.7%) | 0 (0.0%) |
Time of Departure to Work by Sex in Zuni Pueblo
The most frequent times of departure to work in Zuni Pueblo are 7:30 AM to 7:59 AM (234, 33.2%) for males and 7:30 AM to 7:59 AM (315, 36.8%) for females.
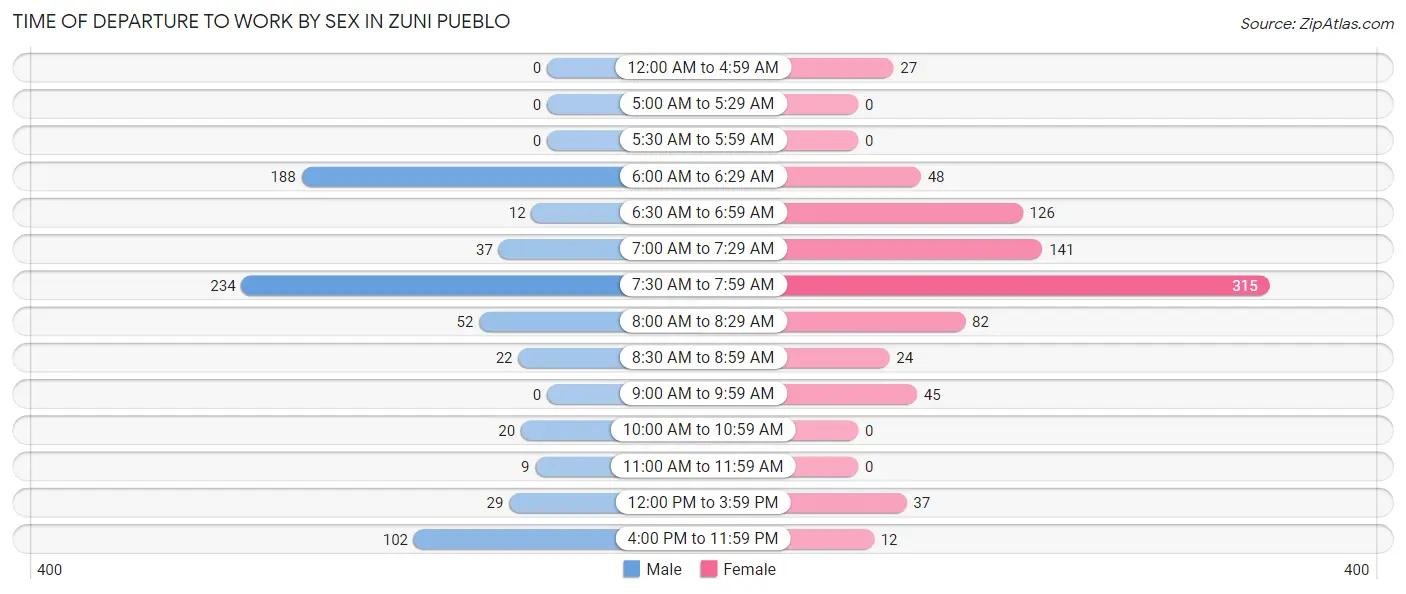
| Time of Departure | Male | Female |
| 12:00 AM to 4:59 AM | 0 (0.0%) | 27 (3.2%) |
| 5:00 AM to 5:29 AM | 0 (0.0%) | 0 (0.0%) |
| 5:30 AM to 5:59 AM | 0 (0.0%) | 0 (0.0%) |
| 6:00 AM to 6:29 AM | 188 (26.7%) | 48 (5.6%) |
| 6:30 AM to 6:59 AM | 12 (1.7%) | 126 (14.7%) |
| 7:00 AM to 7:29 AM | 37 (5.2%) | 141 (16.5%) |
| 7:30 AM to 7:59 AM | 234 (33.2%) | 315 (36.8%) |
| 8:00 AM to 8:29 AM | 52 (7.4%) | 82 (9.6%) |
| 8:30 AM to 8:59 AM | 22 (3.1%) | 24 (2.8%) |
| 9:00 AM to 9:59 AM | 0 (0.0%) | 45 (5.2%) |
| 10:00 AM to 10:59 AM | 20 (2.8%) | 0 (0.0%) |
| 11:00 AM to 11:59 AM | 9 (1.3%) | 0 (0.0%) |
| 12:00 PM to 3:59 PM | 29 (4.1%) | 37 (4.3%) |
| 4:00 PM to 11:59 PM | 102 (14.5%) | 12 (1.4%) |
| Total | 705 (100.0%) | 857 (100.0%) |
Housing Occupancy in Zuni Pueblo
Occupancy by Ownership in Zuni Pueblo
Of the total 1,507 dwellings in Zuni Pueblo, owner-occupied units account for 1,438 (95.4%), while renter-occupied units make up 69 (4.6%).
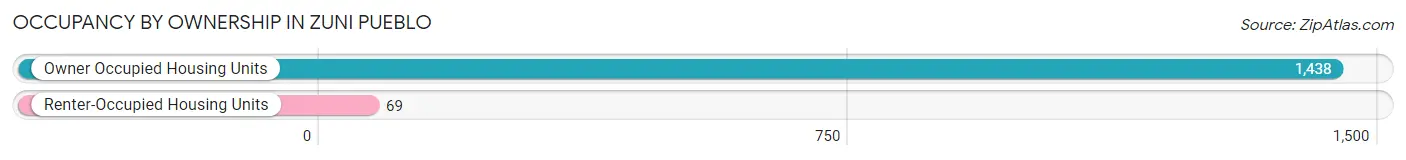
| Occupancy | # Housing Units | % Housing Units |
| Owner Occupied Housing Units | 1,438 | 95.4% |
| Renter-Occupied Housing Units | 69 | 4.6% |
| Total Occupied Housing Units | 1,507 | 100.0% |
Occupancy by Household Size in Zuni Pueblo
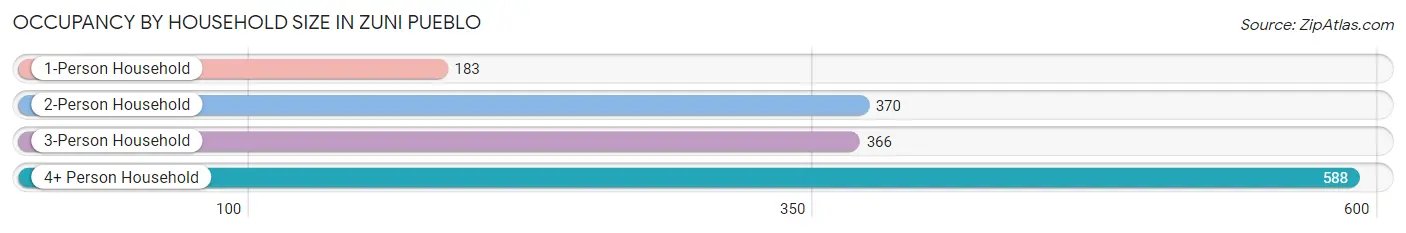
| Household Size | # Housing Units | % Housing Units |
| 1-Person Household | 183 | 12.1% |
| 2-Person Household | 370 | 24.5% |
| 3-Person Household | 366 | 24.3% |
| 4+ Person Household | 588 | 39.0% |
| Total Housing Units | 1,507 | 100.0% |
Occupancy by Ownership by Household Size in Zuni Pueblo
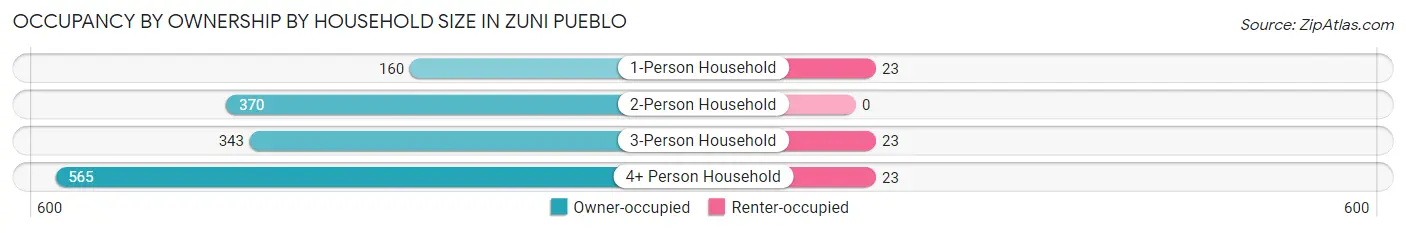
| Household Size | Owner-occupied | Renter-occupied |
| 1-Person Household | 160 (87.4%) | 23 (12.6%) |
| 2-Person Household | 370 (100.0%) | 0 (0.0%) |
| 3-Person Household | 343 (93.7%) | 23 (6.3%) |
| 4+ Person Household | 565 (96.1%) | 23 (3.9%) |
| Total Housing Units | 1,438 (95.4%) | 69 (4.6%) |
Occupancy by Educational Attainment in Zuni Pueblo
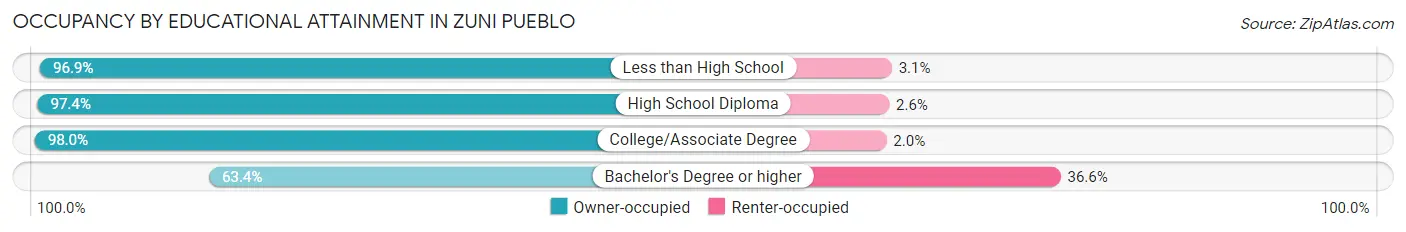
| Household Size | Owner-occupied | Renter-occupied |
| Less than High School | 346 (96.9%) | 11 (3.1%) |
| High School Diploma | 455 (97.4%) | 12 (2.6%) |
| College/Associate Degree | 578 (98.0%) | 12 (2.0%) |
| Bachelor's Degree or higher | 59 (63.4%) | 34 (36.6%) |
Occupancy by Age of Householder in Zuni Pueblo
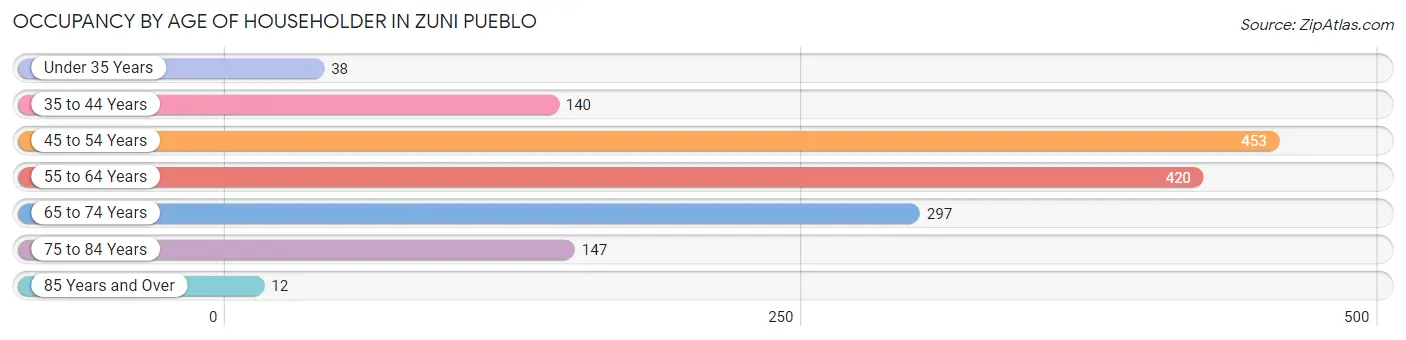
| Age Bracket | # Households | % Households |
| Under 35 Years | 38 | 2.5% |
| 35 to 44 Years | 140 | 9.3% |
| 45 to 54 Years | 453 | 30.1% |
| 55 to 64 Years | 420 | 27.9% |
| 65 to 74 Years | 297 | 19.7% |
| 75 to 84 Years | 147 | 9.8% |
| 85 Years and Over | 12 | 0.8% |
| Total | 1,507 | 100.0% |
Housing Finances in Zuni Pueblo
Median Income by Occupancy in Zuni Pueblo
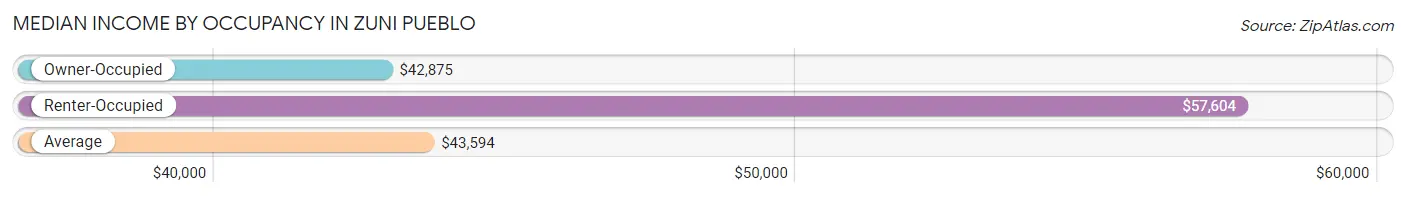
| Occupancy Type | # Households | Median Income |
| Owner-Occupied | 1,438 (95.4%) | $42,875 |
| Renter-Occupied | 69 (4.6%) | $57,604 |
| Average | 1,507 (100.0%) | $43,594 |
Occupancy by Householder Income Bracket in Zuni Pueblo
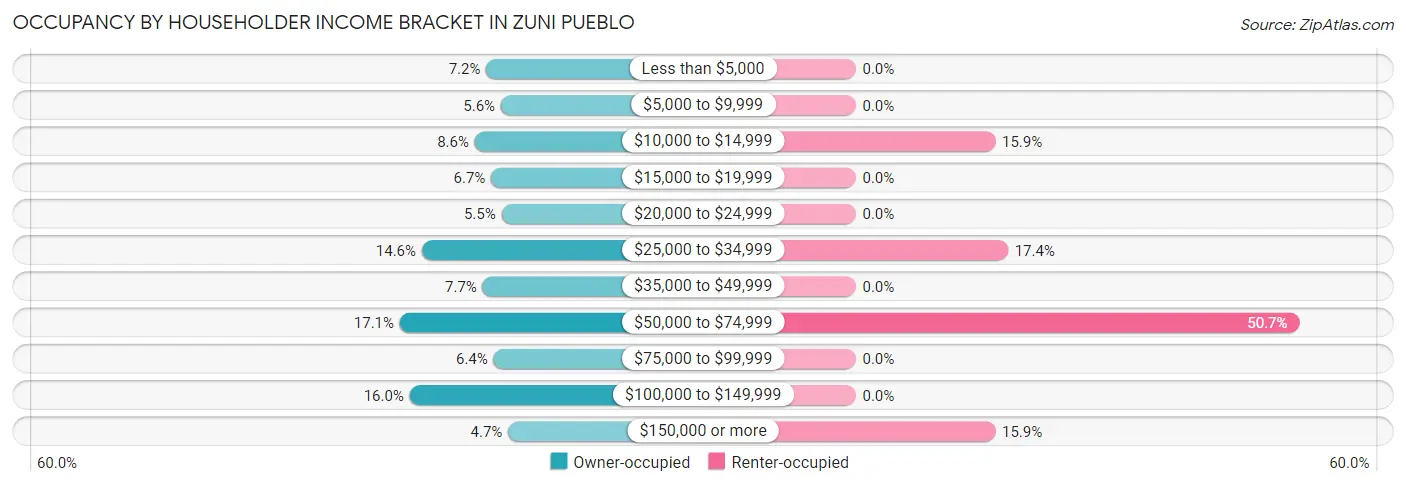
| Income Bracket | Owner-occupied | Renter-occupied |
| Less than $5,000 | 104 (7.2%) | 0 (0.0%) |
| $5,000 to $9,999 | 80 (5.6%) | 0 (0.0%) |
| $10,000 to $14,999 | 123 (8.6%) | 11 (15.9%) |
| $15,000 to $19,999 | 96 (6.7%) | 0 (0.0%) |
| $20,000 to $24,999 | 79 (5.5%) | 0 (0.0%) |
| $25,000 to $34,999 | 210 (14.6%) | 12 (17.4%) |
| $35,000 to $49,999 | 110 (7.6%) | 0 (0.0%) |
| $50,000 to $74,999 | 246 (17.1%) | 35 (50.7%) |
| $75,000 to $99,999 | 92 (6.4%) | 0 (0.0%) |
| $100,000 to $149,999 | 230 (16.0%) | 0 (0.0%) |
| $150,000 or more | 68 (4.7%) | 11 (15.9%) |
| Total | 1,438 (100.0%) | 69 (100.0%) |
Monthly Housing Cost Tiers in Zuni Pueblo
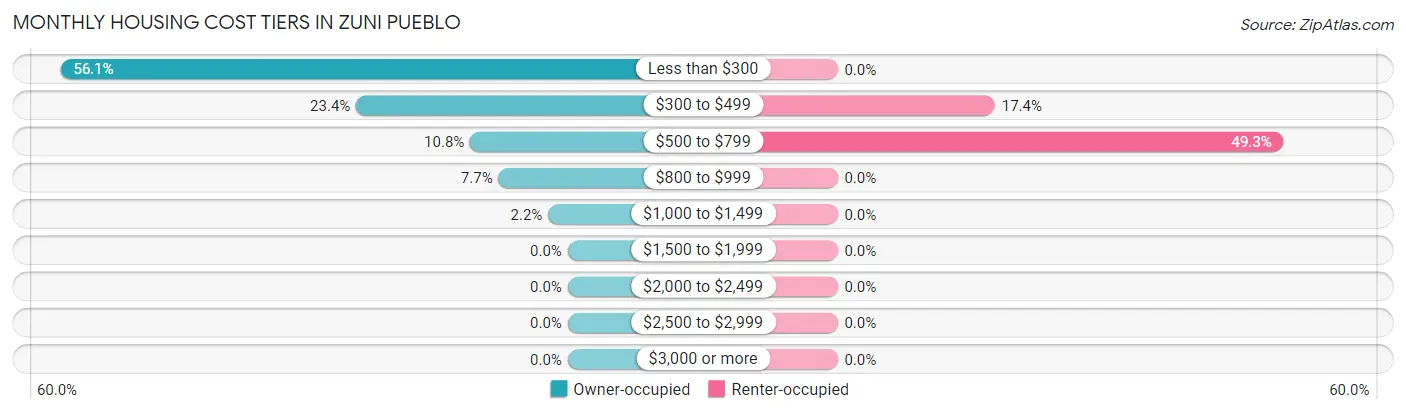
| Monthly Cost | Owner-occupied | Renter-occupied |
| Less than $300 | 806 (56.0%) | 0 (0.0%) |
| $300 to $499 | 336 (23.4%) | 12 (17.4%) |
| $500 to $799 | 155 (10.8%) | 34 (49.3%) |
| $800 to $999 | 110 (7.6%) | 0 (0.0%) |
| $1,000 to $1,499 | 31 (2.2%) | 0 (0.0%) |
| $1,500 to $1,999 | 0 (0.0%) | 0 (0.0%) |
| $2,000 to $2,499 | 0 (0.0%) | 0 (0.0%) |
| $2,500 to $2,999 | 0 (0.0%) | 0 (0.0%) |
| $3,000 or more | 0 (0.0%) | 0 (0.0%) |
| Total | 1,438 (100.0%) | 69 (100.0%) |
Physical Housing Characteristics in Zuni Pueblo
Housing Structures in Zuni Pueblo
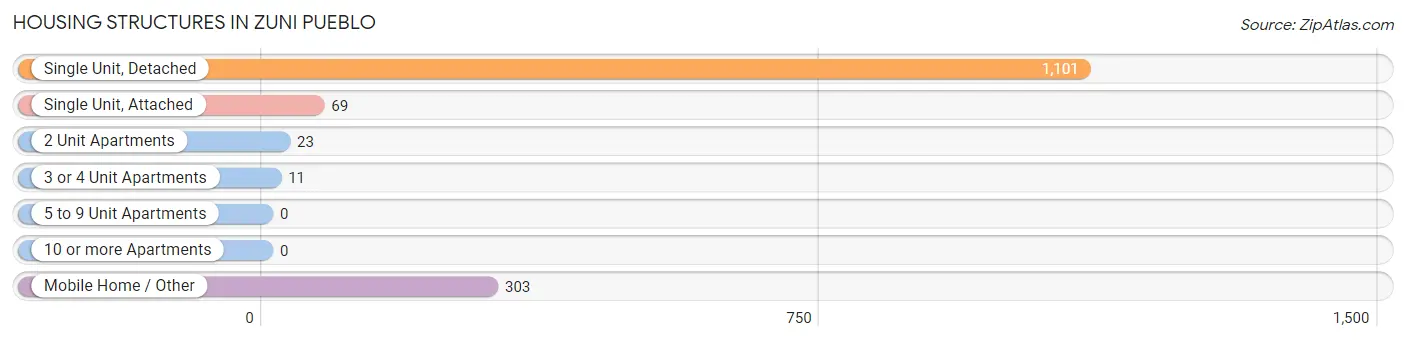
| Structure Type | # Housing Units | % Housing Units |
| Single Unit, Detached | 1,101 | 73.1% |
| Single Unit, Attached | 69 | 4.6% |
| 2 Unit Apartments | 23 | 1.5% |
| 3 or 4 Unit Apartments | 11 | 0.7% |
| 5 to 9 Unit Apartments | 0 | 0.0% |
| 10 or more Apartments | 0 | 0.0% |
| Mobile Home / Other | 303 | 20.1% |
| Total | 1,507 | 100.0% |
Housing Structures by Occupancy in Zuni Pueblo
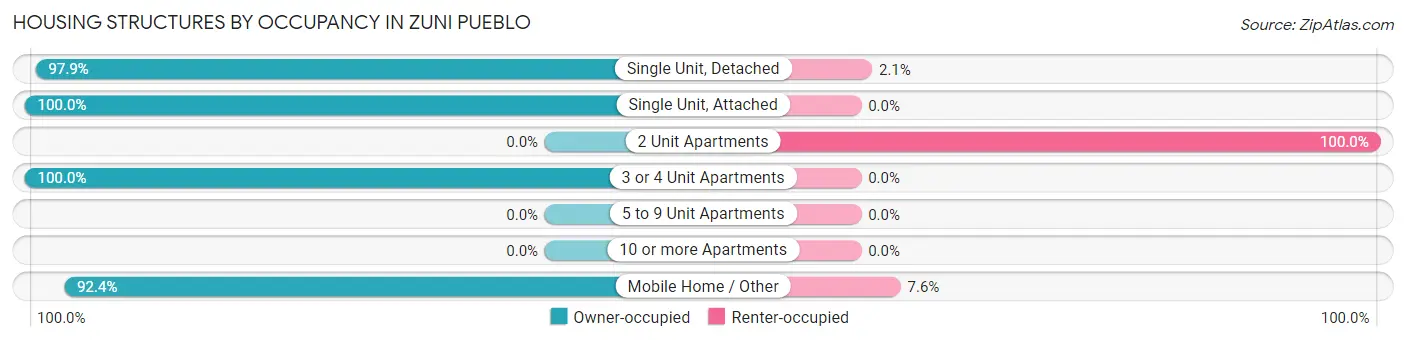
| Structure Type | Owner-occupied | Renter-occupied |
| Single Unit, Detached | 1,078 (97.9%) | 23 (2.1%) |
| Single Unit, Attached | 69 (100.0%) | 0 (0.0%) |
| 2 Unit Apartments | 0 (0.0%) | 23 (100.0%) |
| 3 or 4 Unit Apartments | 11 (100.0%) | 0 (0.0%) |
| 5 to 9 Unit Apartments | 0 (0.0%) | 0 (0.0%) |
| 10 or more Apartments | 0 (0.0%) | 0 (0.0%) |
| Mobile Home / Other | 280 (92.4%) | 23 (7.6%) |
| Total | 1,438 (95.4%) | 69 (4.6%) |
Housing Structures by Number of Rooms in Zuni Pueblo
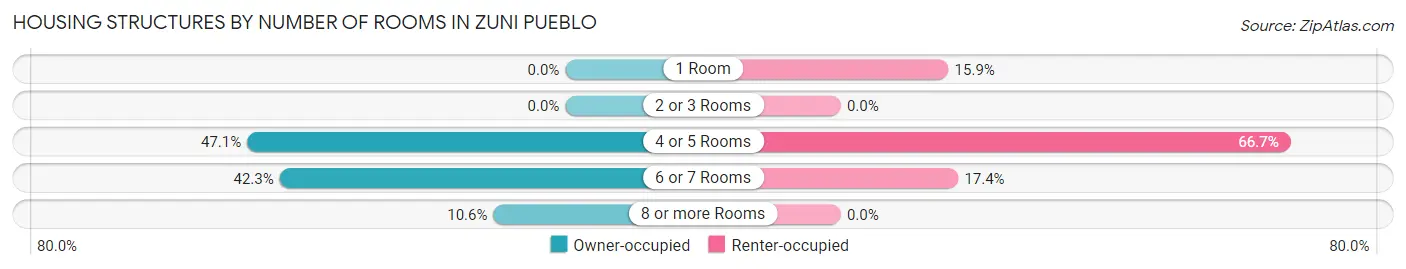
| Number of Rooms | Owner-occupied | Renter-occupied |
| 1 Room | 0 (0.0%) | 11 (15.9%) |
| 2 or 3 Rooms | 0 (0.0%) | 0 (0.0%) |
| 4 or 5 Rooms | 677 (47.1%) | 46 (66.7%) |
| 6 or 7 Rooms | 608 (42.3%) | 12 (17.4%) |
| 8 or more Rooms | 153 (10.6%) | 0 (0.0%) |
| Total | 1,438 (100.0%) | 69 (100.0%) |
Housing Structure by Heating Type in Zuni Pueblo
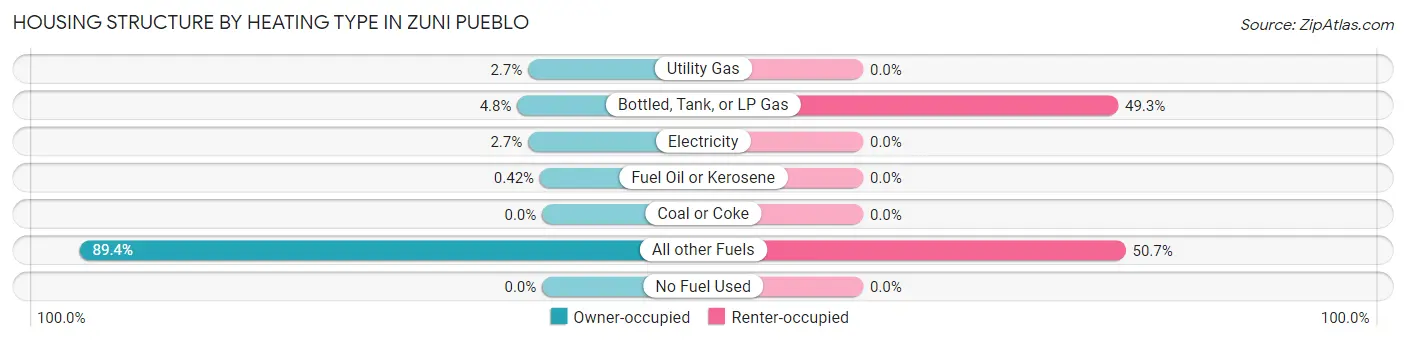
| Heating Type | Owner-occupied | Renter-occupied |
| Utility Gas | 39 (2.7%) | 0 (0.0%) |
| Bottled, Tank, or LP Gas | 69 (4.8%) | 34 (49.3%) |
| Electricity | 39 (2.7%) | 0 (0.0%) |
| Fuel Oil or Kerosene | 6 (0.4%) | 0 (0.0%) |
| Coal or Coke | 0 (0.0%) | 0 (0.0%) |
| All other Fuels | 1,285 (89.4%) | 35 (50.7%) |
| No Fuel Used | 0 (0.0%) | 0 (0.0%) |
| Total | 1,438 (100.0%) | 69 (100.0%) |
Household Vehicle Usage in Zuni Pueblo
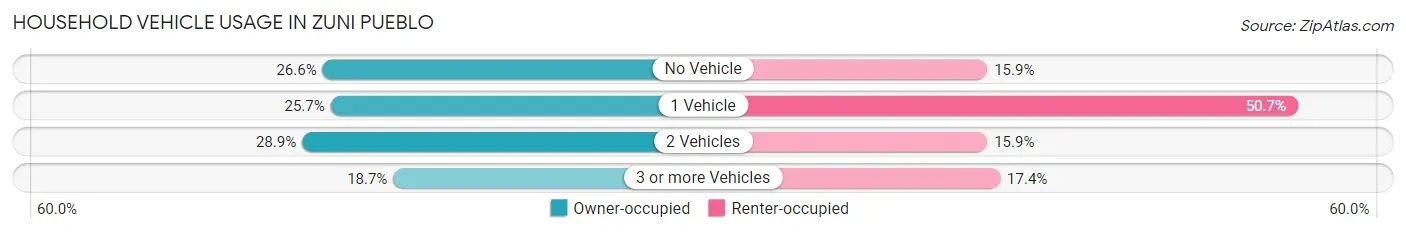
| Vehicles per Household | Owner-occupied | Renter-occupied |
| No Vehicle | 383 (26.6%) | 11 (15.9%) |
| 1 Vehicle | 370 (25.7%) | 35 (50.7%) |
| 2 Vehicles | 416 (28.9%) | 11 (15.9%) |
| 3 or more Vehicles | 269 (18.7%) | 12 (17.4%) |
| Total | 1,438 (100.0%) | 69 (100.0%) |
Real Estate & Mortgages in Zuni Pueblo
Real Estate and Mortgage Overview in Zuni Pueblo
| Characteristic | Without Mortgage | With Mortgage |
| Housing Units | 1,189 | 249 |
| Median Property Value | $71,200 | $83,700 |
| Median Household Income | $46,151 | $33 |
| Monthly Housing Costs | $232 | $0 |
| Real Estate Taxes | $199 | $237 |
Property Value by Mortgage Status in Zuni Pueblo
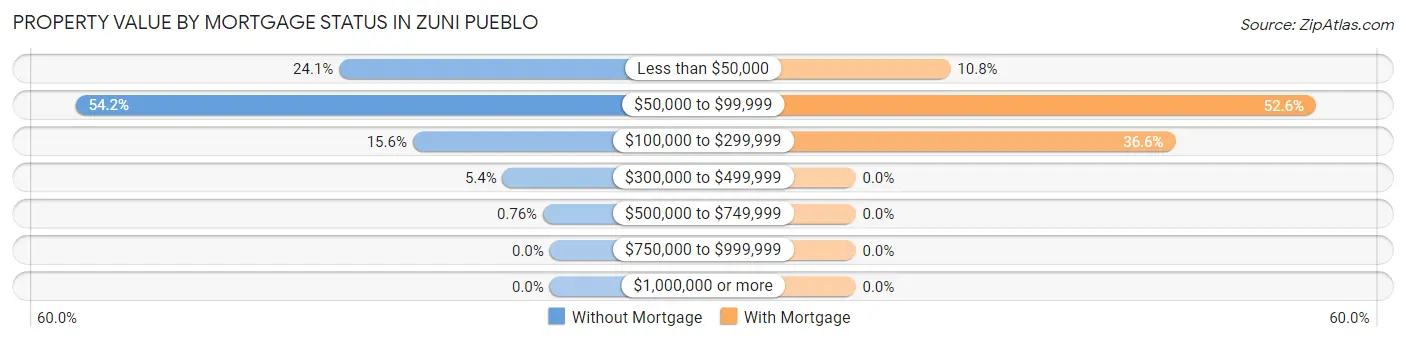
| Property Value | Without Mortgage | With Mortgage |
| Less than $50,000 | 286 (24.0%) | 27 (10.8%) |
| $50,000 to $99,999 | 644 (54.2%) | 131 (52.6%) |
| $100,000 to $299,999 | 186 (15.6%) | 91 (36.5%) |
| $300,000 to $499,999 | 64 (5.4%) | 0 (0.0%) |
| $500,000 to $749,999 | 9 (0.8%) | 0 (0.0%) |
| $750,000 to $999,999 | 0 (0.0%) | 0 (0.0%) |
| $1,000,000 or more | 0 (0.0%) | 0 (0.0%) |
| Total | 1,189 (100.0%) | 249 (100.0%) |
Household Income by Mortgage Status in Zuni Pueblo
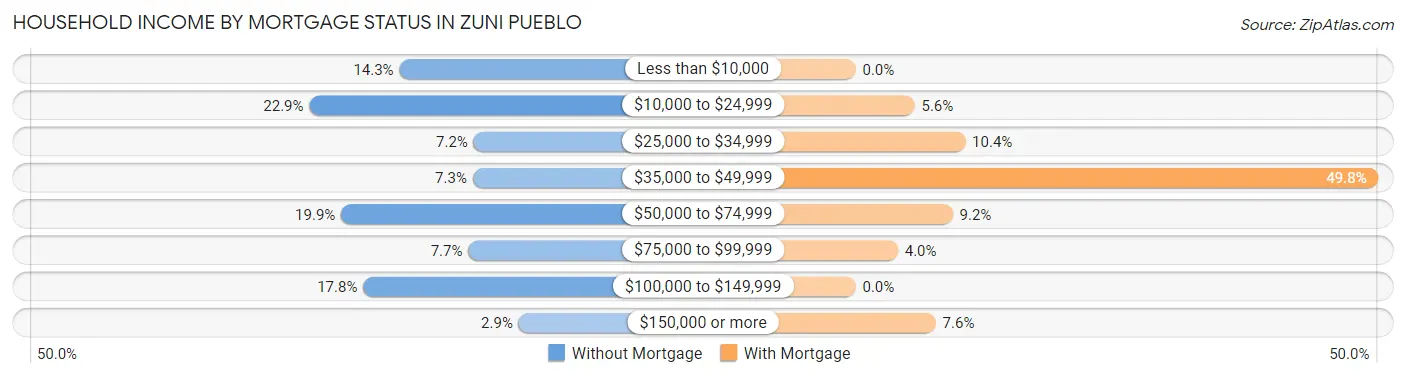
| Household Income | Without Mortgage | With Mortgage |
| Less than $10,000 | 170 (14.3%) | 0 (0.0%) |
| $10,000 to $24,999 | 272 (22.9%) | 14 (5.6%) |
| $25,000 to $34,999 | 86 (7.2%) | 26 (10.4%) |
| $35,000 to $49,999 | 87 (7.3%) | 124 (49.8%) |
| $50,000 to $74,999 | 236 (19.9%) | 23 (9.2%) |
| $75,000 to $99,999 | 92 (7.7%) | 10 (4.0%) |
| $100,000 to $149,999 | 211 (17.7%) | 0 (0.0%) |
| $150,000 or more | 35 (2.9%) | 19 (7.6%) |
| Total | 1,189 (100.0%) | 249 (100.0%) |
Property Value to Household Income Ratio in Zuni Pueblo
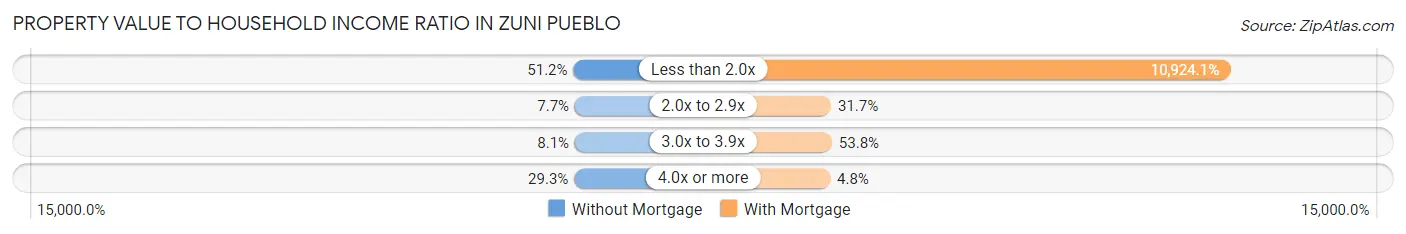
| Value-to-Income Ratio | Without Mortgage | With Mortgage |
| Less than 2.0x | 609 (51.2%) | 27,201 (10,924.1%) |
| 2.0x to 2.9x | 91 (7.6%) | 79 (31.7%) |
| 3.0x to 3.9x | 96 (8.1%) | 134 (53.8%) |
| 4.0x or more | 348 (29.3%) | 12 (4.8%) |
| Total | 1,189 (100.0%) | 249 (100.0%) |
Real Estate Taxes by Mortgage Status in Zuni Pueblo
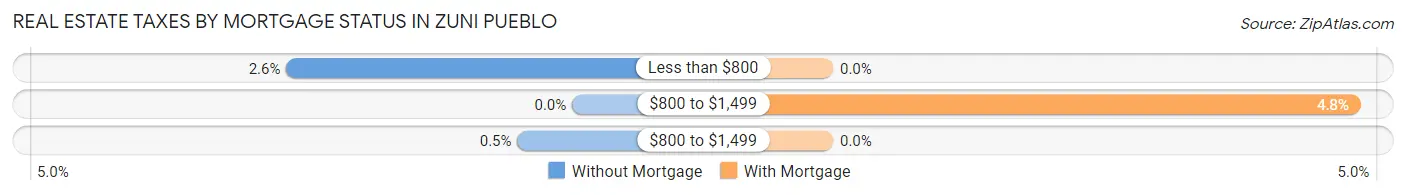
| Property Taxes | Without Mortgage | With Mortgage |
| Less than $800 | 31 (2.6%) | 0 (0.0%) |
| $800 to $1,499 | 0 (0.0%) | 12 (4.8%) |
| $800 to $1,499 | 6 (0.5%) | 0 (0.0%) |
| Total | 1,189 (100.0%) | 249 (100.0%) |
Health & Disability in Zuni Pueblo
Health Insurance Coverage by Age in Zuni Pueblo
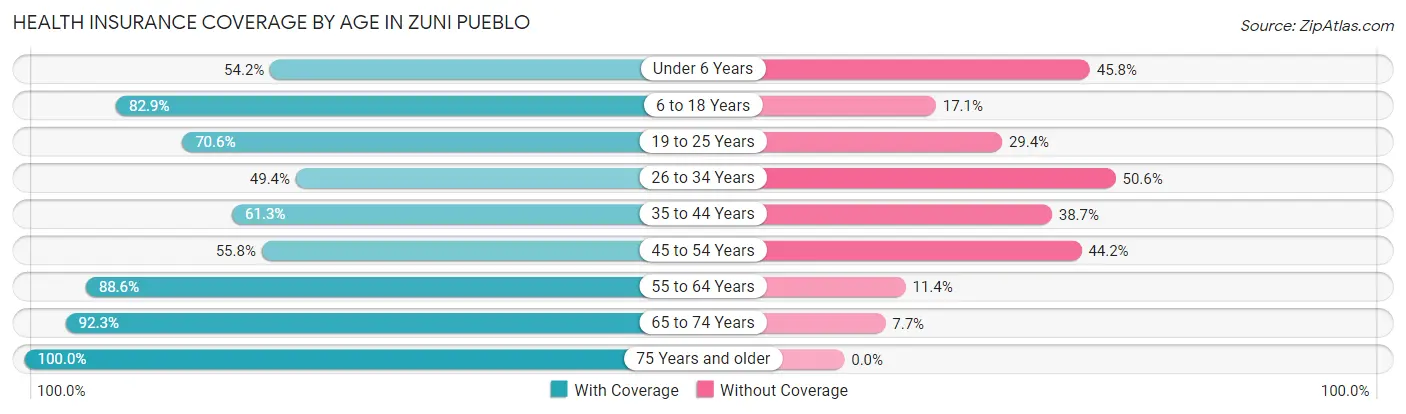
| Age Bracket | With Coverage | Without Coverage |
| Under 6 Years | 206 (54.2%) | 174 (45.8%) |
| 6 to 18 Years | 1,278 (82.9%) | 263 (17.1%) |
| 19 to 25 Years | 581 (70.6%) | 242 (29.4%) |
| 26 to 34 Years | 343 (49.4%) | 351 (50.6%) |
| 35 to 44 Years | 439 (61.3%) | 277 (38.7%) |
| 45 to 54 Years | 579 (55.8%) | 459 (44.2%) |
| 55 to 64 Years | 690 (88.6%) | 89 (11.4%) |
| 65 to 74 Years | 518 (92.3%) | 43 (7.7%) |
| 75 Years and older | 234 (100.0%) | 0 (0.0%) |
| Total | 4,868 (72.0%) | 1,898 (28.1%) |
Health Insurance Coverage by Citizenship Status in Zuni Pueblo
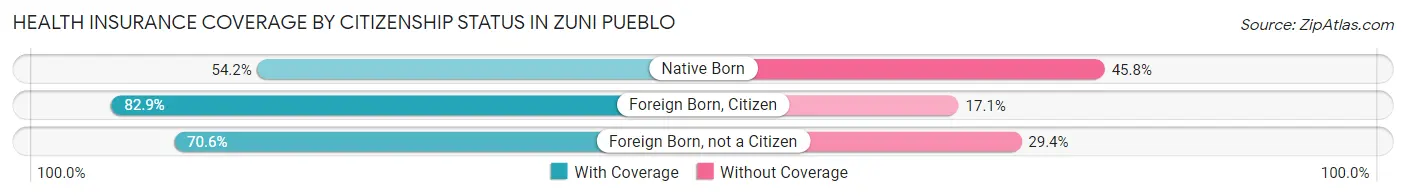
| Citizenship Status | With Coverage | Without Coverage |
| Native Born | 206 (54.2%) | 174 (45.8%) |
| Foreign Born, Citizen | 1,278 (82.9%) | 263 (17.1%) |
| Foreign Born, not a Citizen | 581 (70.6%) | 242 (29.4%) |
Health Insurance Coverage by Household Income in Zuni Pueblo
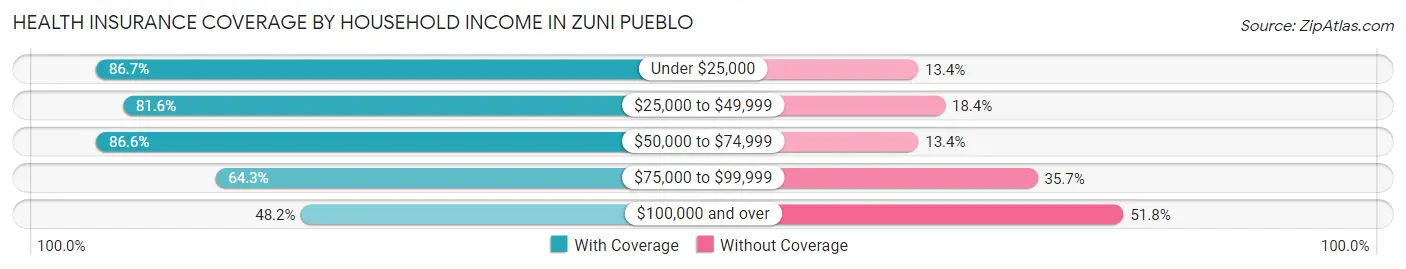
| Household Income | With Coverage | Without Coverage |
| Under $25,000 | 1,331 (86.7%) | 205 (13.4%) |
| $25,000 to $49,999 | 1,160 (81.6%) | 262 (18.4%) |
| $50,000 to $74,999 | 1,002 (86.6%) | 155 (13.4%) |
| $75,000 to $99,999 | 392 (64.3%) | 218 (35.7%) |
| $100,000 and over | 983 (48.2%) | 1,058 (51.8%) |
Public vs Private Health Insurance Coverage by Age in Zuni Pueblo
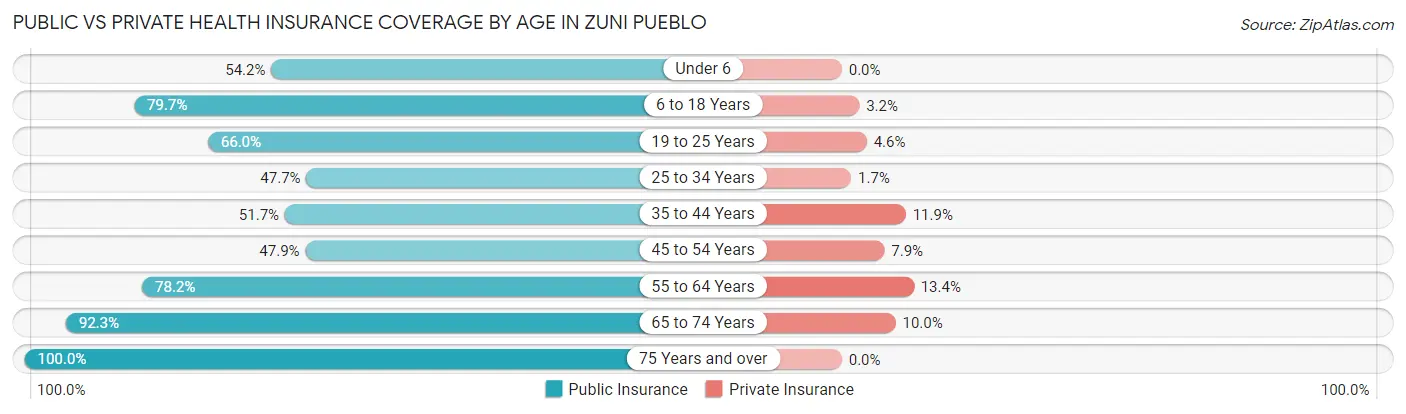
| Age Bracket | Public Insurance | Private Insurance |
| Under 6 | 206 (54.2%) | 0 (0.0%) |
| 6 to 18 Years | 1,228 (79.7%) | 50 (3.2%) |
| 19 to 25 Years | 543 (66.0%) | 38 (4.6%) |
| 25 to 34 Years | 331 (47.7%) | 12 (1.7%) |
| 35 to 44 Years | 370 (51.7%) | 85 (11.9%) |
| 45 to 54 Years | 497 (47.9%) | 82 (7.9%) |
| 55 to 64 Years | 609 (78.2%) | 104 (13.4%) |
| 65 to 74 Years | 518 (92.3%) | 56 (10.0%) |
| 75 Years and over | 234 (100.0%) | 0 (0.0%) |
| Total | 4,536 (67.0%) | 427 (6.3%) |
Disability Status by Sex by Age in Zuni Pueblo
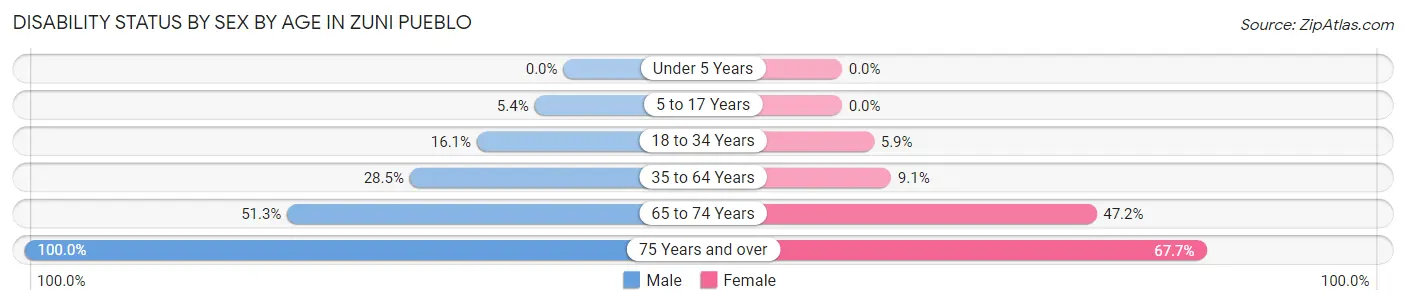
| Age Bracket | Male | Female |
| Under 5 Years | 0 (0.0%) | 0 (0.0%) |
| 5 to 17 Years | 40 (5.4%) | 0 (0.0%) |
| 18 to 34 Years | 127 (16.1%) | 52 (5.9%) |
| 35 to 64 Years | 341 (28.5%) | 122 (9.1%) |
| 65 to 74 Years | 102 (51.3%) | 171 (47.2%) |
| 75 Years and over | 64 (100.0%) | 115 (67.6%) |
Disability Class by Sex by Age in Zuni Pueblo
Disability Class: Hearing Difficulty
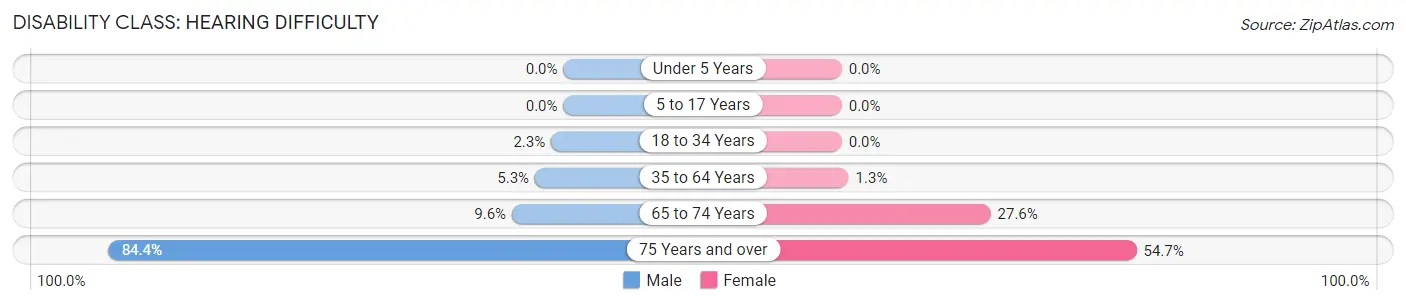
| Age Bracket | Male | Female |
| Under 5 Years | 0 (0.0%) | 0 (0.0%) |
| 5 to 17 Years | 0 (0.0%) | 0 (0.0%) |
| 18 to 34 Years | 18 (2.3%) | 0 (0.0%) |
| 35 to 64 Years | 63 (5.3%) | 17 (1.3%) |
| 65 to 74 Years | 19 (9.6%) | 100 (27.6%) |
| 75 Years and over | 54 (84.4%) | 93 (54.7%) |
Disability Class: Vision Difficulty
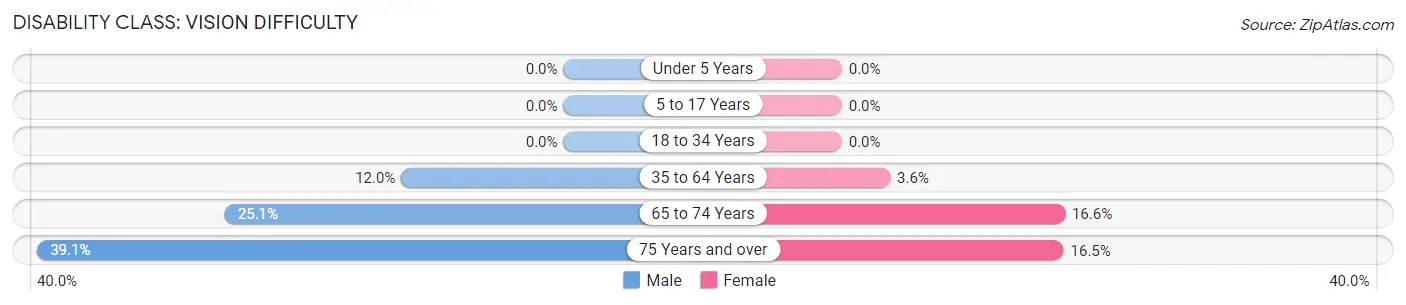
| Age Bracket | Male | Female |
| Under 5 Years | 0 (0.0%) | 0 (0.0%) |
| 5 to 17 Years | 0 (0.0%) | 0 (0.0%) |
| 18 to 34 Years | 0 (0.0%) | 0 (0.0%) |
| 35 to 64 Years | 144 (12.0%) | 48 (3.6%) |
| 65 to 74 Years | 50 (25.1%) | 60 (16.6%) |
| 75 Years and over | 25 (39.1%) | 28 (16.5%) |
Disability Class: Cognitive Difficulty
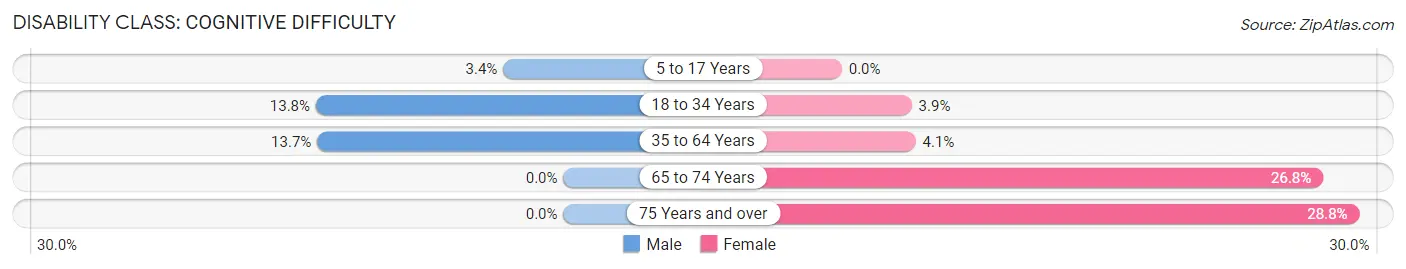
| Age Bracket | Male | Female |
| 5 to 17 Years | 25 (3.4%) | 0 (0.0%) |
| 18 to 34 Years | 109 (13.8%) | 34 (3.9%) |
| 35 to 64 Years | 164 (13.7%) | 55 (4.1%) |
| 65 to 74 Years | 0 (0.0%) | 97 (26.8%) |
| 75 Years and over | 0 (0.0%) | 49 (28.8%) |
Disability Class: Ambulatory Difficulty
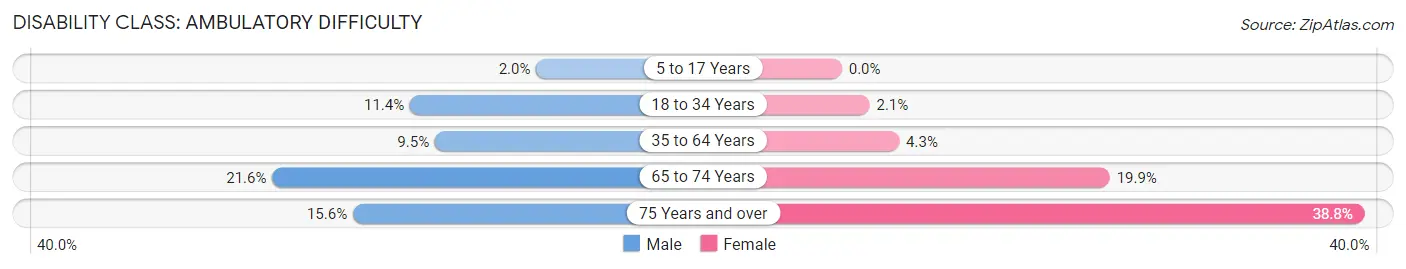
| Age Bracket | Male | Female |
| 5 to 17 Years | 15 (2.0%) | 0 (0.0%) |
| 18 to 34 Years | 90 (11.4%) | 18 (2.1%) |
| 35 to 64 Years | 114 (9.5%) | 57 (4.3%) |
| 65 to 74 Years | 43 (21.6%) | 72 (19.9%) |
| 75 Years and over | 10 (15.6%) | 66 (38.8%) |
Disability Class: Self-Care Difficulty
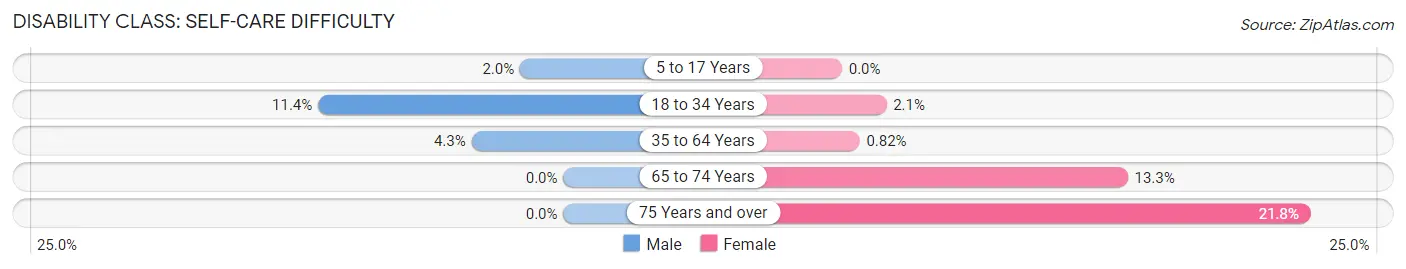
| Age Bracket | Male | Female |
| 5 to 17 Years | 15 (2.0%) | 0 (0.0%) |
| 18 to 34 Years | 90 (11.4%) | 18 (2.1%) |
| 35 to 64 Years | 51 (4.3%) | 11 (0.8%) |
| 65 to 74 Years | 0 (0.0%) | 48 (13.3%) |
| 75 Years and over | 0 (0.0%) | 37 (21.8%) |
Technology Access in Zuni Pueblo
Computing Device Access in Zuni Pueblo
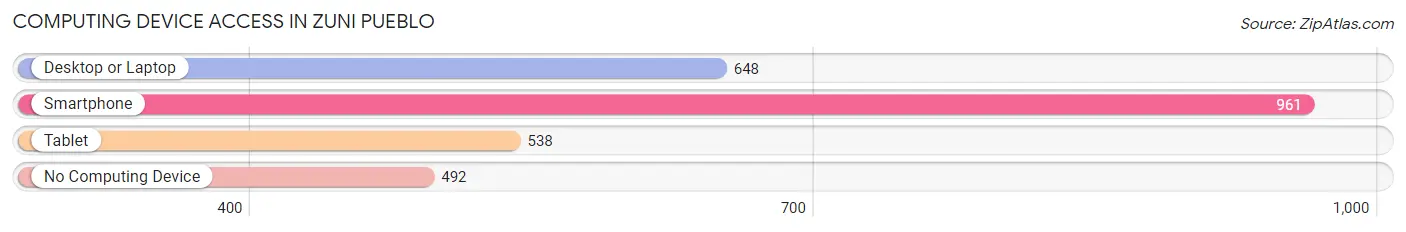
| Device Type | # Households | % Households |
| Desktop or Laptop | 648 | 43.0% |
| Smartphone | 961 | 63.8% |
| Tablet | 538 | 35.7% |
| No Computing Device | 492 | 32.7% |
| Total | 1,507 | 100.0% |
Internet Access in Zuni Pueblo
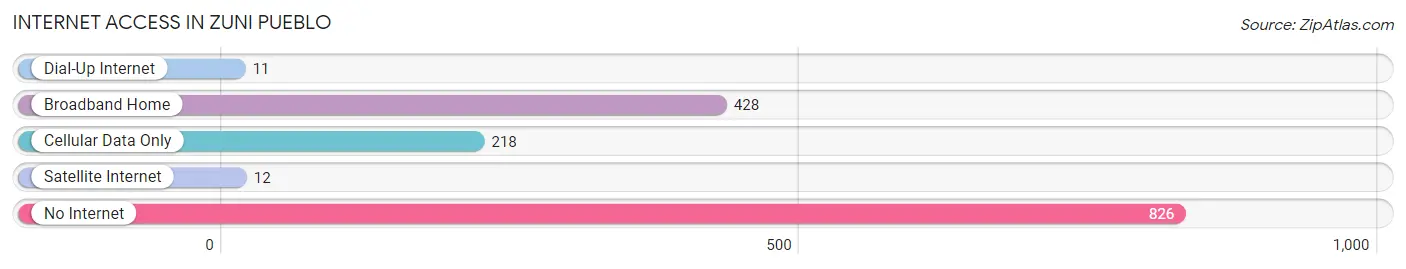
| Internet Type | # Households | % Households |
| Dial-Up Internet | 11 | 0.7% |
| Broadband Home | 428 | 28.4% |
| Cellular Data Only | 218 | 14.5% |
| Satellite Internet | 12 | 0.8% |
| No Internet | 826 | 54.8% |
| Total | 1,507 | 100.0% |
Zuni Pueblo Summary
Zuni Pueblo is a Native American reservation located in western New Mexico, United States. It is the largest of the 19 Pueblos of New Mexico and is home to the Zuni people, a federally recognized tribe of Native Americans. The Zuni Pueblo is located in the Zuni River Valley, approximately 60 miles southwest of Gallup, New Mexico. The reservation is approximately 1,200 square miles in size and is bordered by the Navajo Nation to the north, the Hopi Reservation to the east, and the Ramah Navajo Reservation to the south.
History
The Zuni people have lived in the Zuni River Valley for centuries, and archaeological evidence suggests that the Zuni have been in the area since at least the 12th century. The Zuni people are believed to be descendants of the Anasazi, a prehistoric Native American culture that flourished in the Four Corners region of the United States. The Zuni people have a rich cultural history and have maintained many of their traditional customs and beliefs.
The Zuni Pueblo was established in 1877, when the United States government created the Zuni Reservation. The reservation was created to protect the Zuni people from encroachment by non-Native Americans. The reservation was originally much larger than it is today, but it was reduced in size in the early 20th century.
Geography
The Zuni Pueblo is located in the Zuni River Valley in western New Mexico. The reservation is approximately 1,200 square miles in size and is bordered by the Navajo Nation to the north, the Hopi Reservation to the east, and the Ramah Navajo Reservation to the south. The Zuni River runs through the reservation and is the main source of water for the Zuni people.
The Zuni Pueblo is located in a semi-arid climate, with hot summers and cold winters. The average annual temperature is approximately 60°F, and the average annual precipitation is approximately 10 inches.
Economy
The Zuni Pueblo is a rural, agricultural community. The main sources of income for the Zuni people are farming, ranching, and tourism. The Zuni people grow a variety of crops, including corn, beans, squash, and melons. The Zuni people also raise livestock, including sheep, goats, and cattle.
The Zuni Pueblo is also home to a number of tourist attractions, including the Zuni Cultural Center, the Zuni Museum, and the Zuni Arts and Crafts Center. The Zuni people also produce a variety of traditional arts and crafts, including jewelry, pottery, and textiles.
Demographics
As of the 2010 census, the population of the Zuni Pueblo was 10,228. The population is predominantly Native American, with approximately 95% of the population identifying as Zuni. The median age of the population is 28.5 years, and the median household income is $25,000. The unemployment rate is approximately 10%.
Conclusion
The Zuni Pueblo is a Native American reservation located in western New Mexico, United States. It is the largest of the 19 Pueblos of New Mexico and is home to the Zuni people, a federally recognized tribe of Native Americans. The Zuni Pueblo is located in the Zuni River Valley and is approximately 1,200 square miles in size. The Zuni people have a rich cultural history and have maintained many of their traditional customs and beliefs. The main sources of income for the Zuni people are farming, ranching, and tourism. As of the 2010 census, the population of the Zuni Pueblo was 10,228. The population is predominantly Native American, with approximately 95% of the population identifying as Zuni.
Common Questions
What is Per Capita Income in Zuni Pueblo?
Per Capita income in Zuni Pueblo is $16,236.
What is the Median Family Income in Zuni Pueblo?
Median Family Income in Zuni Pueblo is $42,723.
What is the Median Household income in Zuni Pueblo?
Median Household Income in Zuni Pueblo is $43,594.
What is Income or Wage Gap in Zuni Pueblo?
Income or Wage Gap in Zuni Pueblo is 2.6%.
Women in Zuni Pueblo earn 97.4 cents for every dollar earned by a man.
What is Family Income Deficit in Zuni Pueblo?
Family Income Deficit in Zuni Pueblo is $12,718.
Families that are below poverty line in Zuni Pueblo earn $12,718 less on average than the poverty threshold level.
What is Inequality or Gini Index in Zuni Pueblo?
Inequality or Gini Index in Zuni Pueblo is 0.49.
What is the Total Population of Zuni Pueblo?
Total Population of Zuni Pueblo is 6,789.
What is the Total Male Population of Zuni Pueblo?
Total Male Population of Zuni Pueblo is 3,271.
What is the Total Female Population of Zuni Pueblo?
Total Female Population of Zuni Pueblo is 3,518.
What is the Ratio of Males per 100 Females in Zuni Pueblo?
There are 92.98 Males per 100 Females in Zuni Pueblo.
What is the Ratio of Females per 100 Males in Zuni Pueblo?
There are 107.55 Females per 100 Males in Zuni Pueblo.
What is the Median Population Age in Zuni Pueblo?
Median Population Age in Zuni Pueblo is 34.0 Years.
What is the Average Family Size in Zuni Pueblo
Average Family Size in Zuni Pueblo is 5.0 People.
What is the Average Household Size in Zuni Pueblo
Average Household Size in Zuni Pueblo is 4.5 People.
How Large is the Labor Force in Zuni Pueblo?
There are 2,509 People in the Labor Forcein in Zuni Pueblo.
What is the Percentage of People in the Labor Force in Zuni Pueblo?
48.0% of People are in the Labor Force in Zuni Pueblo.
What is the Unemployment Rate in Zuni Pueblo?
Unemployment Rate in Zuni Pueblo is 14.2%.