Cuyamungue Grant, NM Map & Demographics
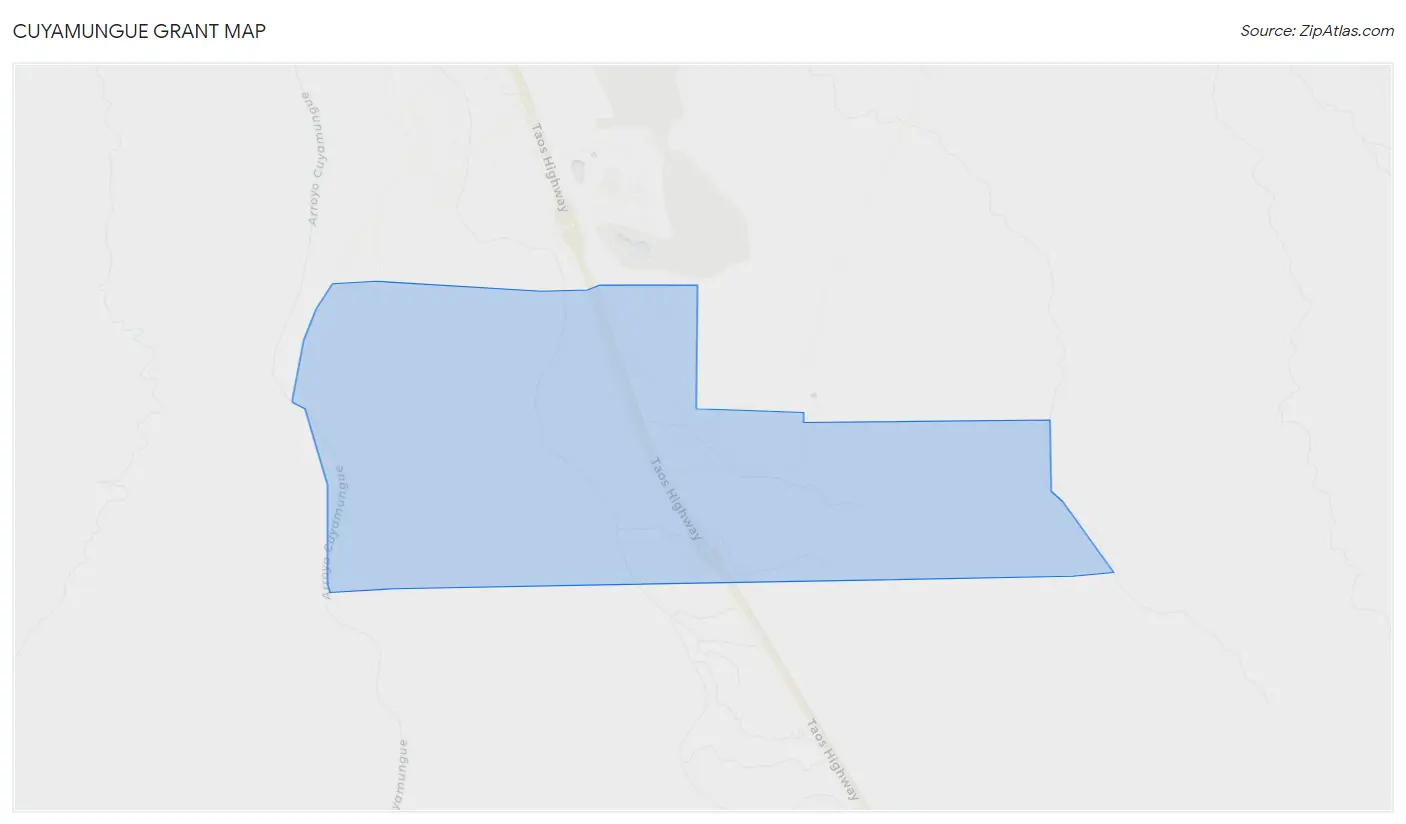
Cuyamungue Grant Map
Cuyamungue Grant Overview
$33,551
PER CAPITA INCOME
$101,042
AVG FAMILY INCOME
$91,094
AVG HOUSEHOLD INCOME
62.1%
WAGE / INCOME GAP [ % ]
37.9¢/ $1
WAGE / INCOME GAP [ $ ]
0.31
INEQUALITY / GINI INDEX
361
TOTAL POPULATION
172
MALE POPULATION
189
FEMALE POPULATION
91.01
MALES / 100 FEMALES
109.88
FEMALES / 100 MALES
33.6
MEDIAN AGE
3.3
AVG FAMILY SIZE
2.9
AVG HOUSEHOLD SIZE
257
LABOR FORCE [ PEOPLE ]
82.9%
PERCENT IN LABOR FORCE
7.0%
UNEMPLOYMENT RATE
Income in Cuyamungue Grant
Income Overview in Cuyamungue Grant
Per Capita Income in Cuyamungue Grant is $33,551, while median incomes of families and households are $101,042 and $91,094 respectively.
| Characteristic | Number | Measure |
| Per Capita Income | 361 | $33,551 |
| Median Family Income | 89 | $101,042 |
| Mean Family Income | 89 | $90,538 |
| Median Household Income | 125 | $91,094 |
| Mean Household Income | 125 | $81,734 |
| Income Deficit | 89 | $0 |
| Wage / Income Gap (%) | 361 | 62.14% |
| Wage / Income Gap ($) | 361 | 37.86¢ per $1 |
| Gini / Inequality Index | 361 | 0.31 |
Earnings by Sex in Cuyamungue Grant
Average Earnings in Cuyamungue Grant are $35,913, $16,326 for men and $43,125 for women, a difference of 62.1%.
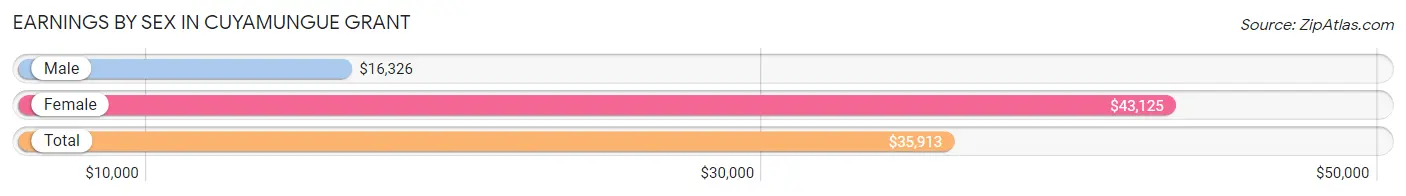
| Sex | Number | Average Earnings |
| Male | 99 (40.1%) | $16,326 |
| Female | 148 (59.9%) | $43,125 |
| Total | 247 (100.0%) | $35,913 |
Earnings by Sex by Income Bracket in Cuyamungue Grant
The most common earnings brackets in Cuyamungue Grant are $15,000 to $17,499 for men (33 | 33.3%) and $50,000 to $54,999 for women (65 | 43.9%).
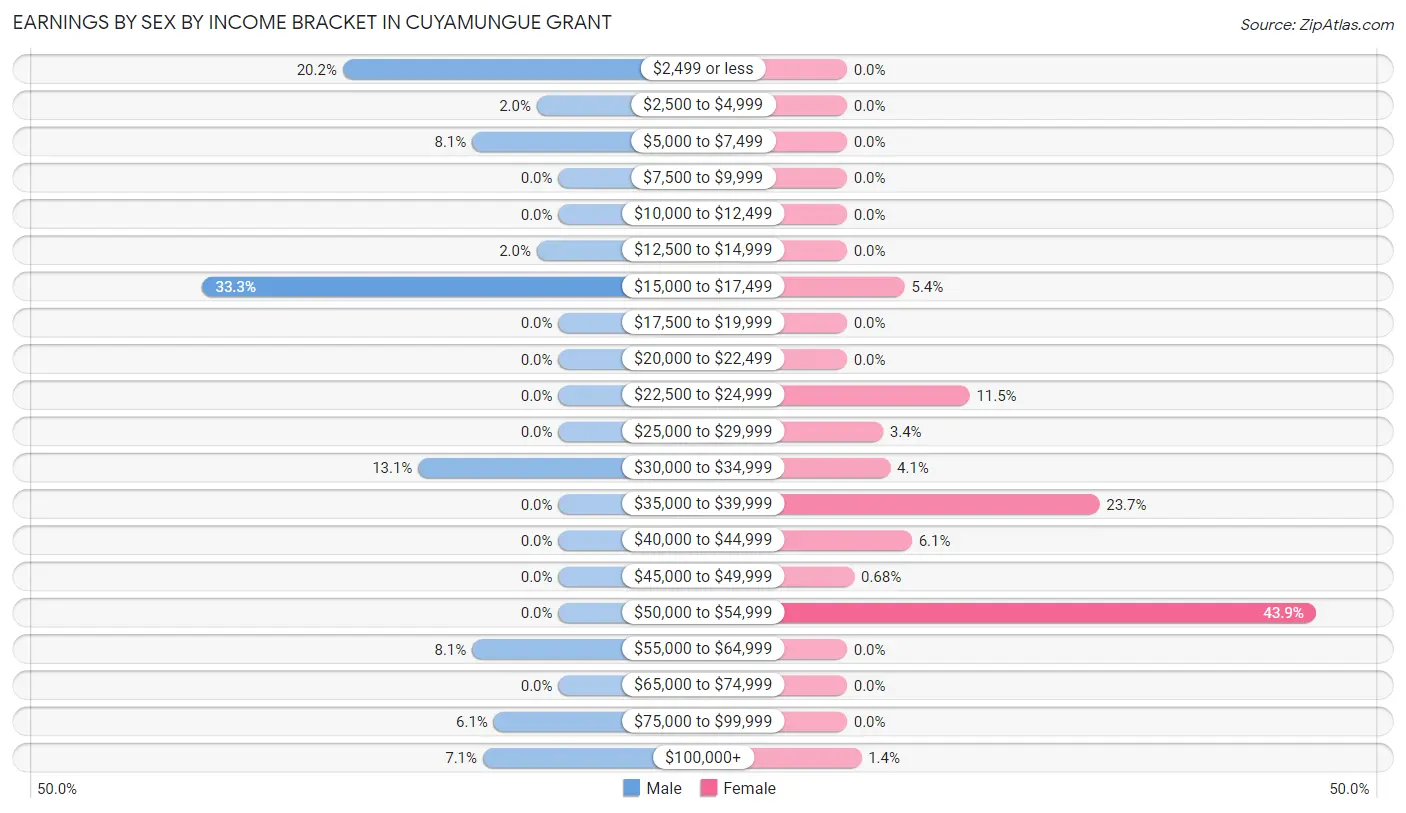
| Income | Male | Female |
| $2,499 or less | 20 (20.2%) | 0 (0.0%) |
| $2,500 to $4,999 | 2 (2.0%) | 0 (0.0%) |
| $5,000 to $7,499 | 8 (8.1%) | 0 (0.0%) |
| $7,500 to $9,999 | 0 (0.0%) | 0 (0.0%) |
| $10,000 to $12,499 | 0 (0.0%) | 0 (0.0%) |
| $12,500 to $14,999 | 2 (2.0%) | 0 (0.0%) |
| $15,000 to $17,499 | 33 (33.3%) | 8 (5.4%) |
| $17,500 to $19,999 | 0 (0.0%) | 0 (0.0%) |
| $20,000 to $22,499 | 0 (0.0%) | 0 (0.0%) |
| $22,500 to $24,999 | 0 (0.0%) | 17 (11.5%) |
| $25,000 to $29,999 | 0 (0.0%) | 5 (3.4%) |
| $30,000 to $34,999 | 13 (13.1%) | 6 (4.1%) |
| $35,000 to $39,999 | 0 (0.0%) | 35 (23.6%) |
| $40,000 to $44,999 | 0 (0.0%) | 9 (6.1%) |
| $45,000 to $49,999 | 0 (0.0%) | 1 (0.7%) |
| $50,000 to $54,999 | 0 (0.0%) | 65 (43.9%) |
| $55,000 to $64,999 | 8 (8.1%) | 0 (0.0%) |
| $65,000 to $74,999 | 0 (0.0%) | 0 (0.0%) |
| $75,000 to $99,999 | 6 (6.1%) | 0 (0.0%) |
| $100,000+ | 7 (7.1%) | 2 (1.3%) |
| Total | 99 (100.0%) | 148 (100.0%) |
Earnings by Sex by Educational Attainment in Cuyamungue Grant
Average earnings in Cuyamungue Grant are $16,629 for men and $50,417 for women, a difference of 67.0%. Men with an educational attainment of high school diploma enjoy the highest average annual earnings of $16,742, while those with high school diploma education earn the least with $16,742. Women with an educational attainment of high school diploma earn the most with the average annual earnings of $50,560, while those with college or associate's degree education have the smallest earnings of $32,292.
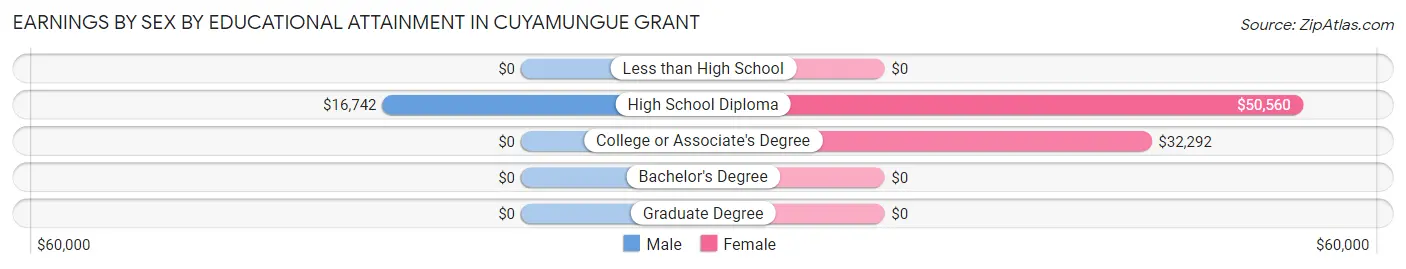
| Educational Attainment | Male Income | Female Income |
| Less than High School | - | - |
| High School Diploma | $16,742 | $50,560 |
| College or Associate's Degree | - | - |
| Bachelor's Degree | - | - |
| Graduate Degree | - | - |
| Total | $16,629 | $50,417 |
Family Income in Cuyamungue Grant
Family Income Brackets in Cuyamungue Grant
According to the Cuyamungue Grant family income data, there are 39 families falling into the $100,000 to $149,999 income range, which is the most common income bracket and makes up 43.8% of all families.
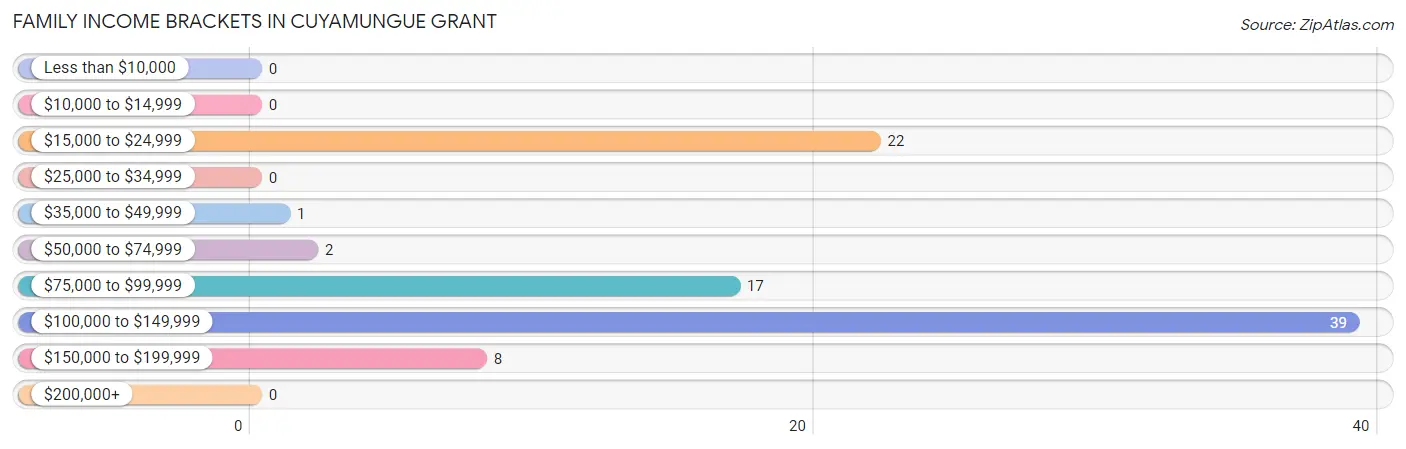
| Income Bracket | # Families | % Families |
| Less than $10,000 | 0 | 0.0% |
| $10,000 to $14,999 | 0 | 0.0% |
| $15,000 to $24,999 | 22 | 24.7% |
| $25,000 to $34,999 | 0 | 0.0% |
| $35,000 to $49,999 | 1 | 1.1% |
| $50,000 to $74,999 | 2 | 2.2% |
| $75,000 to $99,999 | 17 | 19.1% |
| $100,000 to $149,999 | 39 | 43.8% |
| $150,000 to $199,999 | 8 | 9.0% |
| $200,000+ | 0 | 0.0% |
Family Income by Famaliy Size in Cuyamungue Grant
2-person families (37 | 41.6%) account for the highest median family income in Cuyamungue Grant with $106,250 per family, while 2-person families (37 | 41.6%) have the highest median income of $53,125 per family member.
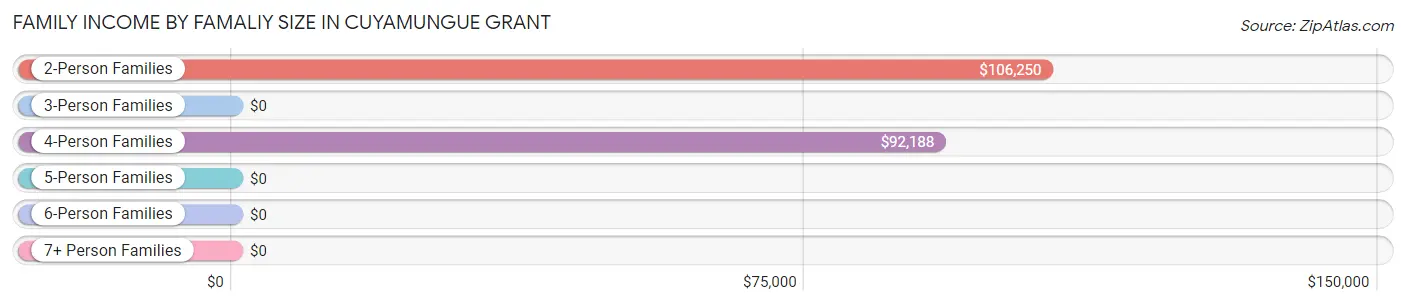
| Income Bracket | # Families | Median Income |
| 2-Person Families | 37 (41.6%) | $106,250 |
| 3-Person Families | 30 (33.7%) | $0 |
| 4-Person Families | 22 (24.7%) | $92,188 |
| 5-Person Families | 0 (0.0%) | $0 |
| 6-Person Families | 0 (0.0%) | $0 |
| 7+ Person Families | 0 (0.0%) | $0 |
| Total | 89 (100.0%) | $101,042 |
Family Income by Number of Earners in Cuyamungue Grant
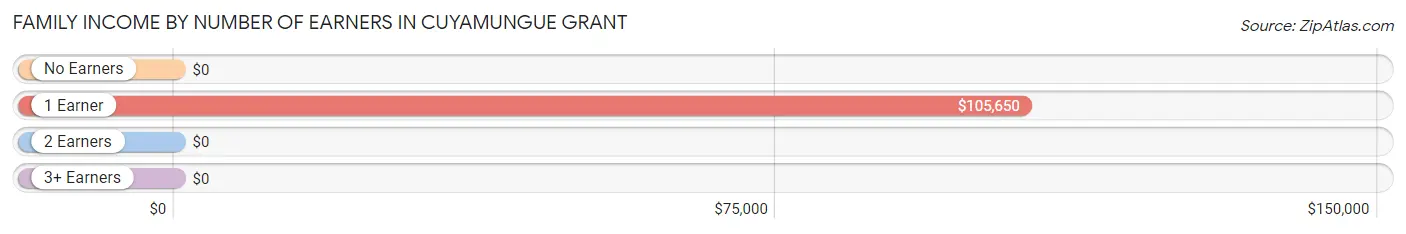
| Number of Earners | # Families | Median Income |
| No Earners | 0 (0.0%) | $0 |
| 1 Earner | 41 (46.1%) | $105,650 |
| 2 Earners | 40 (44.9%) | $0 |
| 3+ Earners | 8 (9.0%) | $0 |
| Total | 89 (100.0%) | $101,042 |
Household Income in Cuyamungue Grant
Household Income Brackets in Cuyamungue Grant
With 33 households falling in the category, the $100,000 to $149,999 income range is the most frequent in Cuyamungue Grant, accounting for 26.4% of all households.
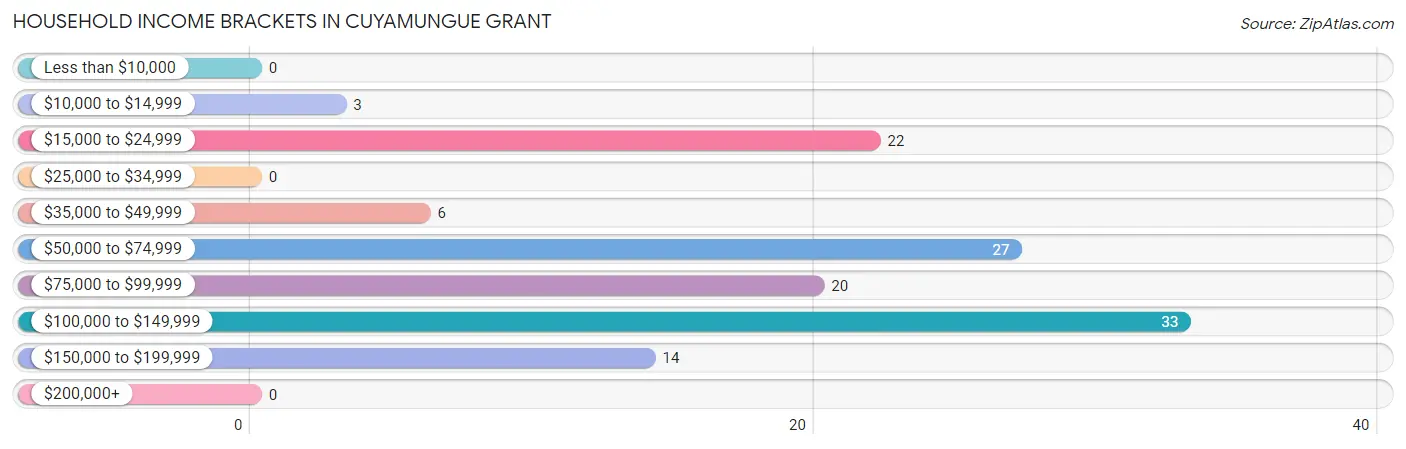
| Income Bracket | # Households | % Households |
| Less than $10,000 | 0 | 0.0% |
| $10,000 to $14,999 | 3 | 2.4% |
| $15,000 to $24,999 | 22 | 17.6% |
| $25,000 to $34,999 | 0 | 0.0% |
| $35,000 to $49,999 | 6 | 4.8% |
| $50,000 to $74,999 | 27 | 21.6% |
| $75,000 to $99,999 | 20 | 16.0% |
| $100,000 to $149,999 | 33 | 26.4% |
| $150,000 to $199,999 | 14 | 11.2% |
| $200,000+ | 0 | 0.0% |
Household Income by Householder Age in Cuyamungue Grant
The median household income in Cuyamungue Grant is $91,094, with the highest median household income of $141,094 found in the 45 to 64 years age bracket for the primary householder. A total of 37 households (29.6%) fall into this category. Meanwhile, the 15 to 24 years age bracket for the primary householder has the lowest median household income of $0, with 26 households (20.8%) in this group.
| Income Bracket | # Households | Median Income |
| 15 to 24 Years | 26 (20.8%) | $0 |
| 25 to 44 Years | 31 (24.8%) | $0 |
| 45 to 64 Years | 37 (29.6%) | $141,094 |
| 65+ Years | 31 (24.8%) | $105,950 |
| Total | 125 (100.0%) | $91,094 |
Poverty in Cuyamungue Grant
Income Below Poverty by Sex and Age in Cuyamungue Grant
With 2.3% poverty level for males and 4.2% for females among the residents of Cuyamungue Grant, 6 to 11 year old males and 45 to 54 year old females are the most vulnerable to poverty, with 2 males (8.0%) and 6 females (24.0%) in their respective age groups living below the poverty level.
| Age Bracket | Male | Female |
| Under 5 Years | 0 (0.0%) | 0 (0.0%) |
| 5 Years | 0 (0.0%) | 0 (0.0%) |
| 6 to 11 Years | 2 (8.0%) | 2 (22.2%) |
| 12 to 14 Years | 0 (0.0%) | 0 (0.0%) |
| 15 Years | 0 (0.0%) | 0 (0.0%) |
| 16 and 17 Years | 0 (0.0%) | 0 (0.0%) |
| 18 to 24 Years | 0 (0.0%) | 0 (0.0%) |
| 25 to 34 Years | 0 (0.0%) | 0 (0.0%) |
| 35 to 44 Years | 0 (0.0%) | 0 (0.0%) |
| 45 to 54 Years | 0 (0.0%) | 6 (24.0%) |
| 55 to 64 Years | 2 (6.7%) | 0 (0.0%) |
| 65 to 74 Years | 0 (0.0%) | 0 (0.0%) |
| 75 Years and over | 0 (0.0%) | 0 (0.0%) |
| Total | 4 (2.3%) | 8 (4.2%) |
Income Above Poverty by Sex and Age in Cuyamungue Grant
According to the poverty statistics in Cuyamungue Grant, males aged under 5 years and females aged under 5 years are the age groups that are most secure financially, with 100.0% of males and 100.0% of females in these age groups living above the poverty line.
| Age Bracket | Male | Female |
| Under 5 Years | 10 (100.0%) | 7 (100.0%) |
| 5 Years | 0 (0.0%) | 0 (0.0%) |
| 6 to 11 Years | 23 (92.0%) | 7 (77.8%) |
| 12 to 14 Years | 0 (0.0%) | 0 (0.0%) |
| 15 Years | 0 (0.0%) | 0 (0.0%) |
| 16 and 17 Years | 0 (0.0%) | 10 (100.0%) |
| 18 to 24 Years | 8 (100.0%) | 35 (100.0%) |
| 25 to 34 Years | 55 (100.0%) | 24 (100.0%) |
| 35 to 44 Years | 0 (0.0%) | 60 (100.0%) |
| 45 to 54 Years | 18 (100.0%) | 19 (76.0%) |
| 55 to 64 Years | 28 (93.3%) | 14 (100.0%) |
| 65 to 74 Years | 1 (100.0%) | 5 (100.0%) |
| 75 Years and over | 25 (100.0%) | 0 (0.0%) |
| Total | 168 (97.7%) | 181 (95.8%) |
Income Below Poverty Among Married-Couple Families in Cuyamungue Grant
The poverty statistics for married-couple families in Cuyamungue Grant show that 2.5% or 2 of the total 80 families live below the poverty line. Families with 1 or 2 children have the highest poverty rate of 5.0%, comprising of 2 families. On the other hand, families with no children have the lowest poverty rate of 0.0%, which includes 0 families.
| Children | Above Poverty | Below Poverty |
| No Children | 40 (100.0%) | 0 (0.0%) |
| 1 or 2 Children | 38 (95.0%) | 2 (5.0%) |
| 3 or 4 Children | 0 (0.0%) | 0 (0.0%) |
| 5 or more Children | 0 (0.0%) | 0 (0.0%) |
| Total | 78 (97.5%) | 2 (2.5%) |
Income Below Poverty Among Single-Parent Households in Cuyamungue Grant
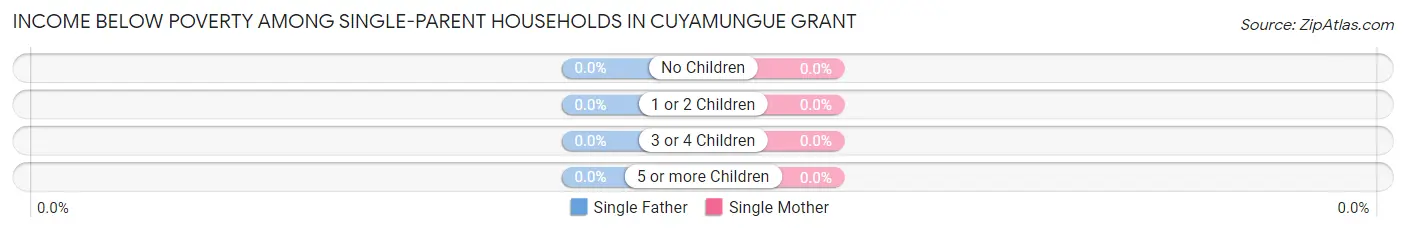
| Children | Single Father | Single Mother |
| No Children | 0 (0.0%) | 0 (0.0%) |
| 1 or 2 Children | 0 (0.0%) | 0 (0.0%) |
| 3 or 4 Children | 0 (0.0%) | 0 (0.0%) |
| 5 or more Children | 0 (0.0%) | 0 (0.0%) |
| Total | 0 (0.0%) | 0 (0.0%) |
Income Below Poverty Among Married-Couple vs Single-Parent Households in Cuyamungue Grant
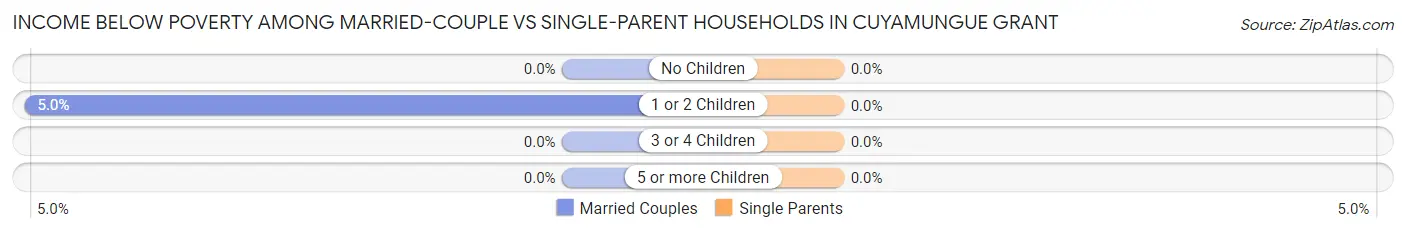
| Children | Married-Couple Families | Single-Parent Households |
| No Children | 0 (0.0%) | 0 (0.0%) |
| 1 or 2 Children | 2 (5.0%) | 0 (0.0%) |
| 3 or 4 Children | 0 (0.0%) | 0 (0.0%) |
| 5 or more Children | 0 (0.0%) | 0 (0.0%) |
| Total | 2 (2.5%) | 0 (0.0%) |
Race in Cuyamungue Grant
The most populous races in Cuyamungue Grant are Hispanic or Latino (250 | 69.3%), White / Caucasian (152 | 42.1%), and Some other Race (114 | 31.6%).
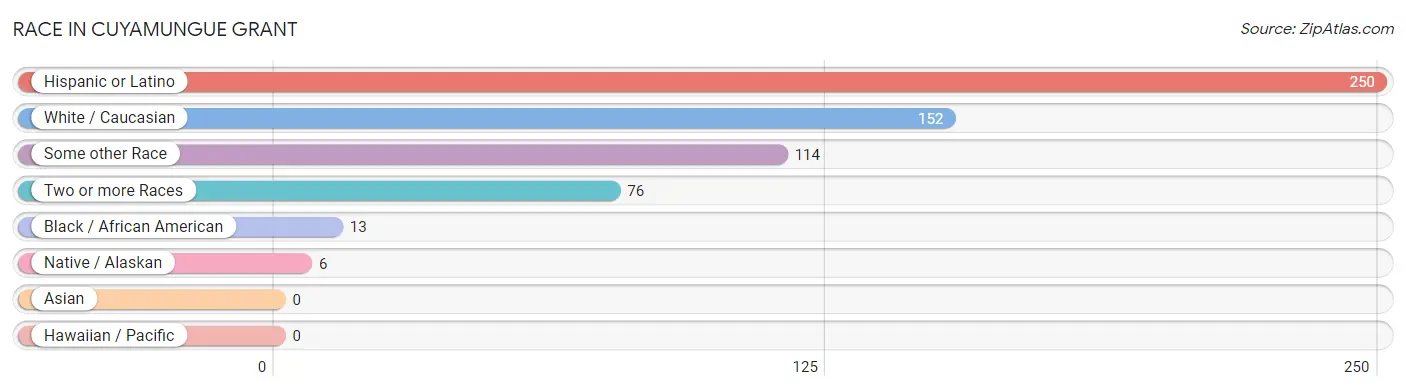
| Race | # Population | % Population |
| Asian | 0 | 0.0% |
| Black / African American | 13 | 3.6% |
| Hawaiian / Pacific | 0 | 0.0% |
| Hispanic or Latino | 250 | 69.3% |
| Native / Alaskan | 6 | 1.7% |
| White / Caucasian | 152 | 42.1% |
| Two or more Races | 76 | 21.0% |
| Some other Race | 114 | 31.6% |
| Total | 361 | 100.0% |
Ancestry in Cuyamungue Grant
The most populous ancestries reported in Cuyamungue Grant are Mexican (151 | 41.8%), English (58 | 16.1%), Irish (36 | 10.0%), Central American (26 | 7.2%), and Guatemalan (26 | 7.2%), together accounting for 82.3% of all Cuyamungue Grant residents.
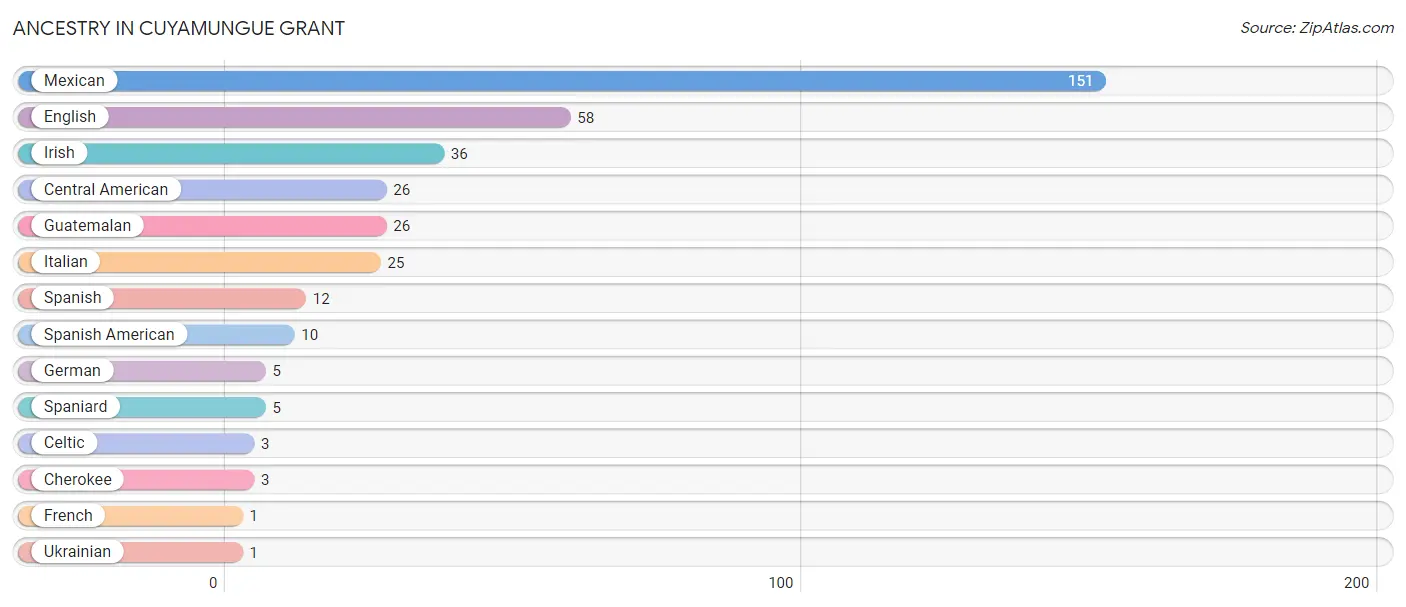
| Ancestry | # Population | % Population |
| Celtic | 3 | 0.8% |
| Central American | 26 | 7.2% |
| Cherokee | 3 | 0.8% |
| English | 58 | 16.1% |
| French | 1 | 0.3% |
| German | 5 | 1.4% |
| Guatemalan | 26 | 7.2% |
| Irish | 36 | 10.0% |
| Italian | 25 | 6.9% |
| Mexican | 151 | 41.8% |
| Spaniard | 5 | 1.4% |
| Spanish | 12 | 3.3% |
| Spanish American | 10 | 2.8% |
| Ukrainian | 1 | 0.3% | View All 14 Rows |
Immigrants in Cuyamungue Grant
The most numerous immigrant groups reported in Cuyamungue Grant came from Central America (67 | 18.6%), Latin America (67 | 18.6%), Mexico (67 | 18.6%), England (58 | 16.1%), and Europe (58 | 16.1%), together accounting for 87.8% of all Cuyamungue Grant residents.
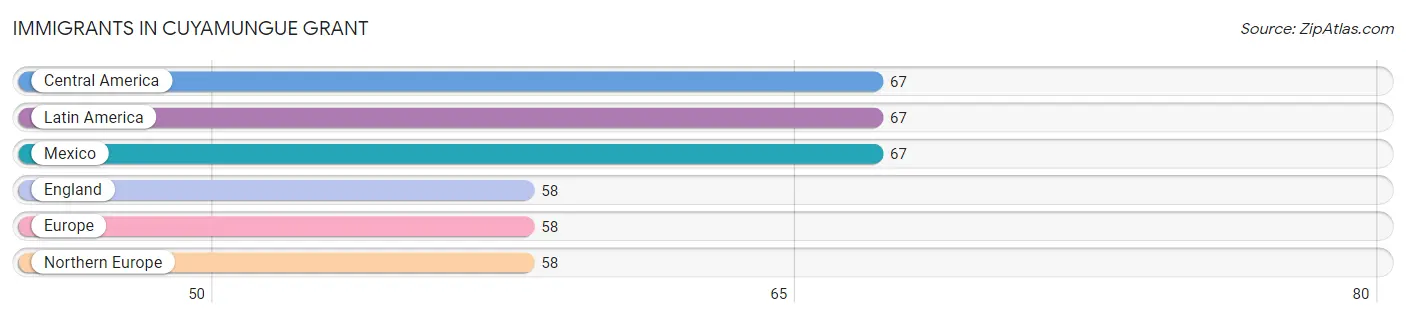
| Immigration Origin | # Population | % Population |
| Central America | 67 | 18.6% |
| England | 58 | 16.1% |
| Europe | 58 | 16.1% |
| Latin America | 67 | 18.6% |
| Mexico | 67 | 18.6% |
| Northern Europe | 58 | 16.1% | View All 6 Rows |
Sex and Age in Cuyamungue Grant
Sex and Age in Cuyamungue Grant
The most populous age groups in Cuyamungue Grant are 30 to 34 Years (30 | 17.4%) for men and 40 to 44 Years (58 | 30.7%) for women.
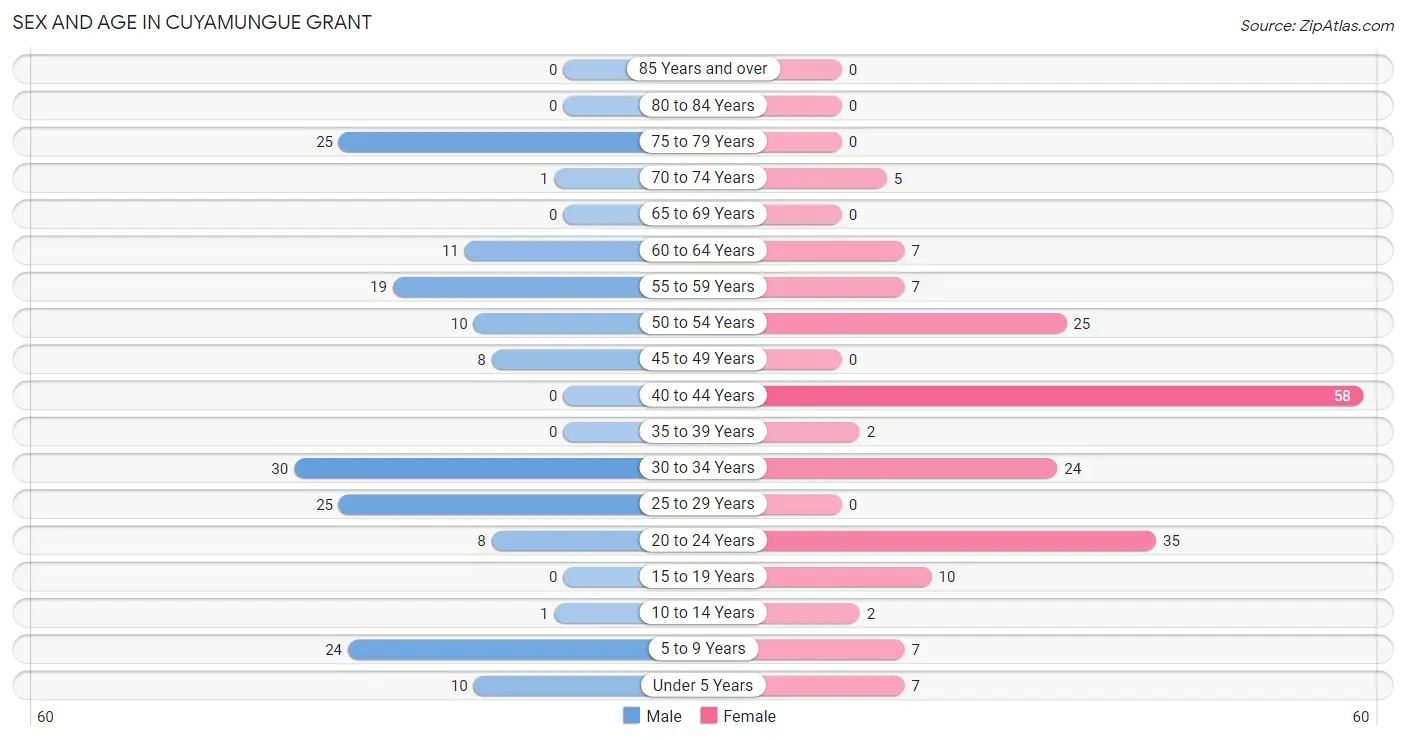
| Age Bracket | Male | Female |
| Under 5 Years | 10 (5.8%) | 7 (3.7%) |
| 5 to 9 Years | 24 (14.0%) | 7 (3.7%) |
| 10 to 14 Years | 1 (0.6%) | 2 (1.1%) |
| 15 to 19 Years | 0 (0.0%) | 10 (5.3%) |
| 20 to 24 Years | 8 (4.6%) | 35 (18.5%) |
| 25 to 29 Years | 25 (14.5%) | 0 (0.0%) |
| 30 to 34 Years | 30 (17.4%) | 24 (12.7%) |
| 35 to 39 Years | 0 (0.0%) | 2 (1.1%) |
| 40 to 44 Years | 0 (0.0%) | 58 (30.7%) |
| 45 to 49 Years | 8 (4.6%) | 0 (0.0%) |
| 50 to 54 Years | 10 (5.8%) | 25 (13.2%) |
| 55 to 59 Years | 19 (11.1%) | 7 (3.7%) |
| 60 to 64 Years | 11 (6.4%) | 7 (3.7%) |
| 65 to 69 Years | 0 (0.0%) | 0 (0.0%) |
| 70 to 74 Years | 1 (0.6%) | 5 (2.6%) |
| 75 to 79 Years | 25 (14.5%) | 0 (0.0%) |
| 80 to 84 Years | 0 (0.0%) | 0 (0.0%) |
| 85 Years and over | 0 (0.0%) | 0 (0.0%) |
| Total | 172 (100.0%) | 189 (100.0%) |
Families and Households in Cuyamungue Grant
Median Family Size in Cuyamungue Grant
The median family size in Cuyamungue Grant is 3.27 persons per family, with single female/mother families (3 | 3.4%) accounting for the largest median family size of 4.67 persons per family. On the other hand, single male/father families (6 | 6.7%) represent the smallest median family size with 2.33 persons per family.
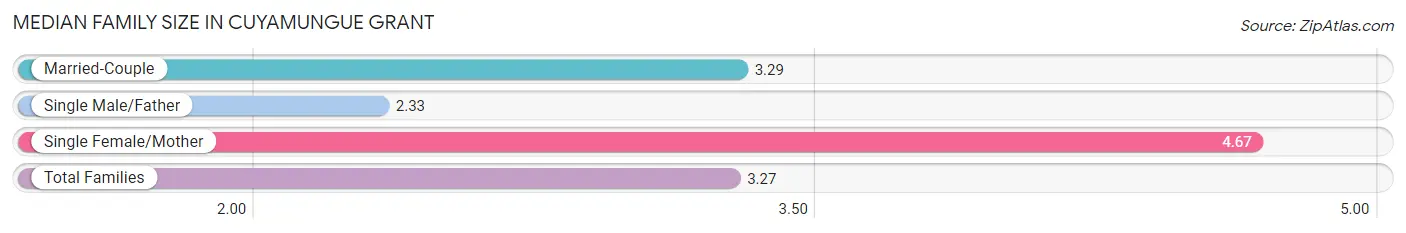
| Family Type | # Families | Family Size |
| Married-Couple | 80 (89.9%) | 3.29 |
| Single Male/Father | 6 (6.7%) | 2.33 |
| Single Female/Mother | 3 (3.4%) | 4.67 |
| Total Families | 89 (100.0%) | 3.27 |
Median Household Size in Cuyamungue Grant
The median household size in Cuyamungue Grant is 2.89 persons per household, with single female/mother households (3 | 2.4%) accounting for the largest median household size of 5.33 persons per household. non-family households (36 | 28.8%) represent the smallest median household size with 1.75 persons per household.
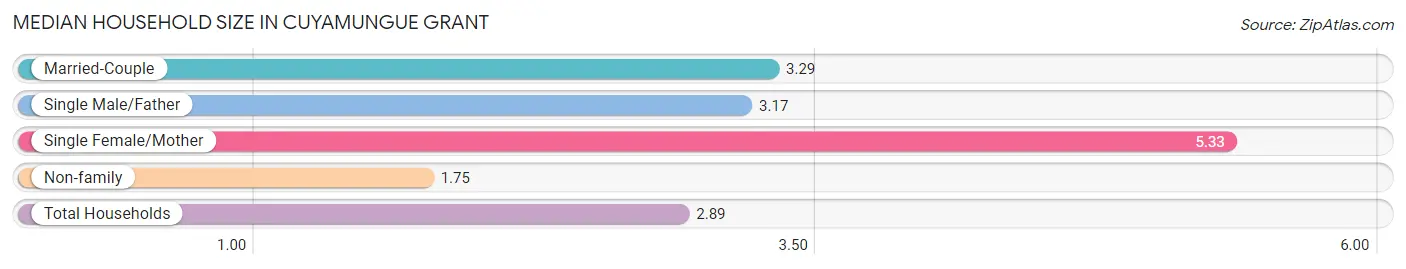
| Household Type | # Households | Household Size |
| Married-Couple | 80 (64.0%) | 3.29 |
| Single Male/Father | 6 (4.8%) | 3.17 |
| Single Female/Mother | 3 (2.4%) | 5.33 |
| Non-family | 36 (28.8%) | 1.75 |
| Total Households | 125 (100.0%) | 2.89 |
Household Size by Marriage Status in Cuyamungue Grant
Out of a total of 125 households in Cuyamungue Grant, 89 (71.2%) are family households, while 36 (28.8%) are nonfamily households. The most numerous type of family households are 3-person households, comprising 36, and the most common type of nonfamily households are 2-person households, comprising 27.
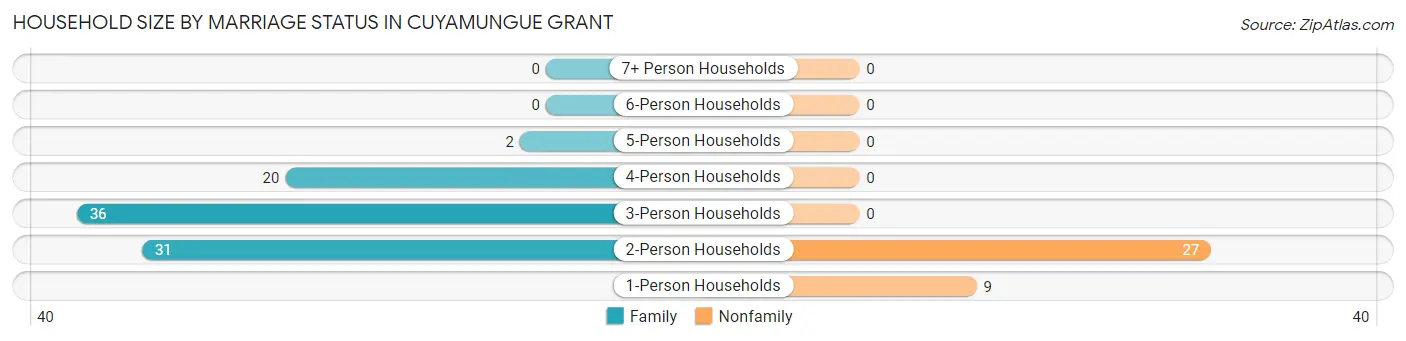
| Household Size | Family Households | Nonfamily Households |
| 1-Person Households | - | 9 (7.2%) |
| 2-Person Households | 31 (24.8%) | 27 (21.6%) |
| 3-Person Households | 36 (28.8%) | 0 (0.0%) |
| 4-Person Households | 20 (16.0%) | 0 (0.0%) |
| 5-Person Households | 2 (1.6%) | 0 (0.0%) |
| 6-Person Households | 0 (0.0%) | 0 (0.0%) |
| 7+ Person Households | 0 (0.0%) | 0 (0.0%) |
| Total | 89 (71.2%) | 36 (28.8%) |
Female Fertility in Cuyamungue Grant
Fertility by Age in Cuyamungue Grant
Average fertility rate in Cuyamungue Grant is 41.0 births per 1,000 women. Women in the age bracket of 20 to 34 years have the highest fertility rate with 102.0 births per 1,000 women. Women in the age bracket of 20 to 34 years acount for 100.0% of all women with births.
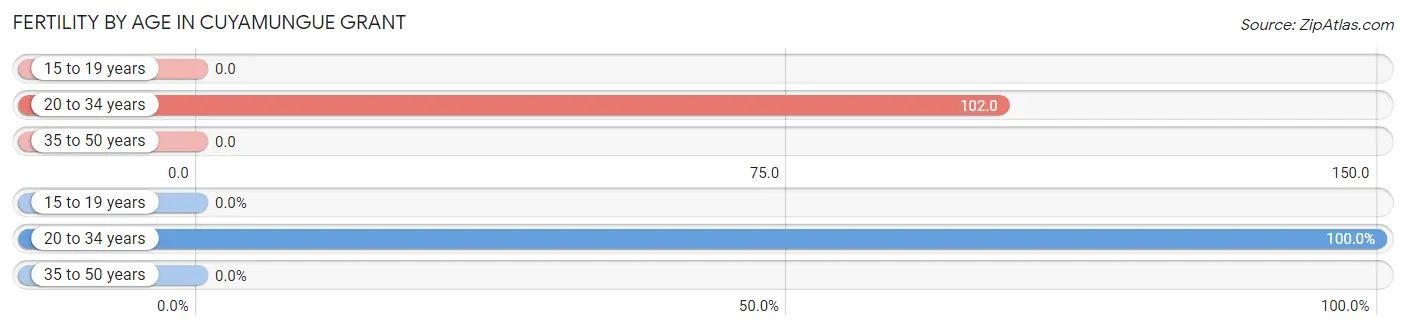
| Age Bracket | Women with Births | Births / 1,000 Women |
| 15 to 19 years | 0 (0.0%) | 0.0 |
| 20 to 34 years | 6 (100.0%) | 102.0 |
| 35 to 50 years | 0 (0.0%) | 0.0 |
| Total | 6 (100.0%) | 41.0 |
Fertility by Age by Marriage Status in Cuyamungue Grant
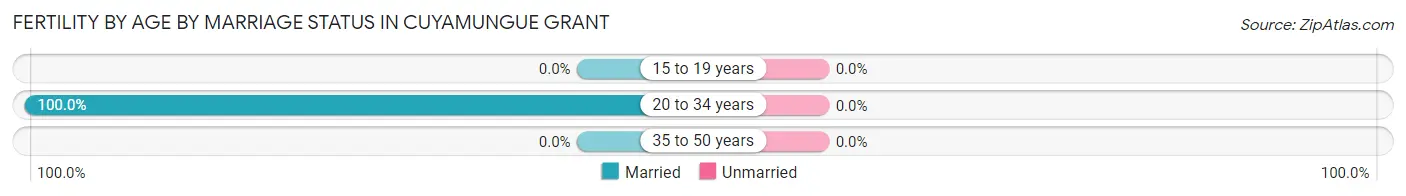
| Age Bracket | Married | Unmarried |
| 15 to 19 years | 0 (0.0%) | 0 (0.0%) |
| 20 to 34 years | 6 (100.0%) | 0 (0.0%) |
| 35 to 50 years | 0 (0.0%) | 0 (0.0%) |
| Total | 6 (100.0%) | 0 (0.0%) |
Fertility by Education in Cuyamungue Grant
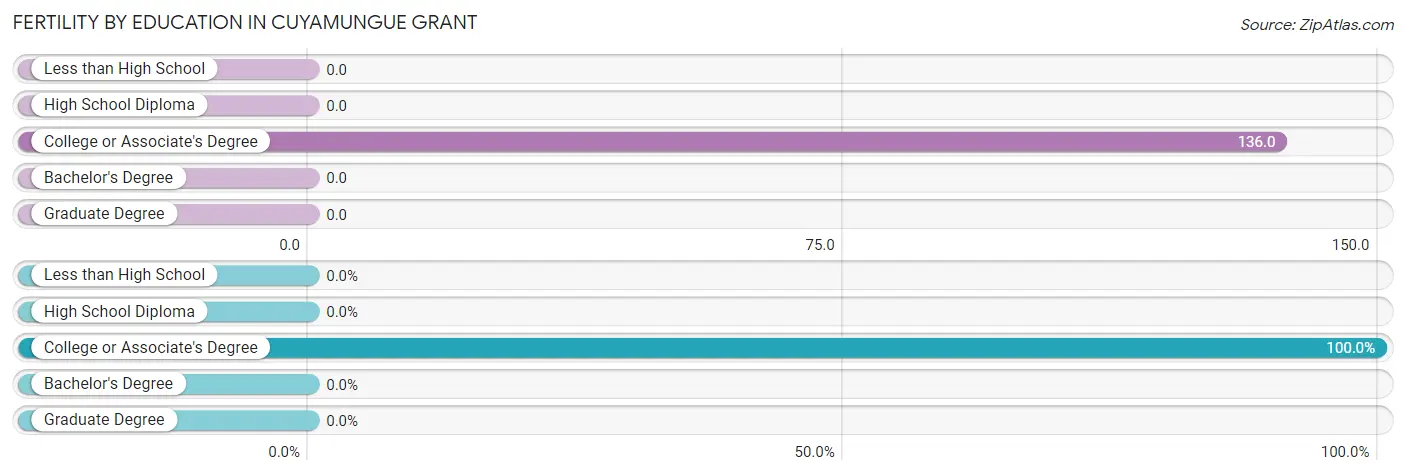
| Educational Attainment | Women with Births | Births / 1,000 Women |
| Less than High School | 0 (0.0%) | 0.0 |
| High School Diploma | 0 (0.0%) | 0.0 |
| College or Associate's Degree | 6 (100.0%) | 136.0 |
| Bachelor's Degree | 0 (0.0%) | 0.0 |
| Graduate Degree | 0 (0.0%) | 0.0 |
| Total | 6 (100.0%) | 41.0 |
Fertility by Education by Marriage Status in Cuyamungue Grant
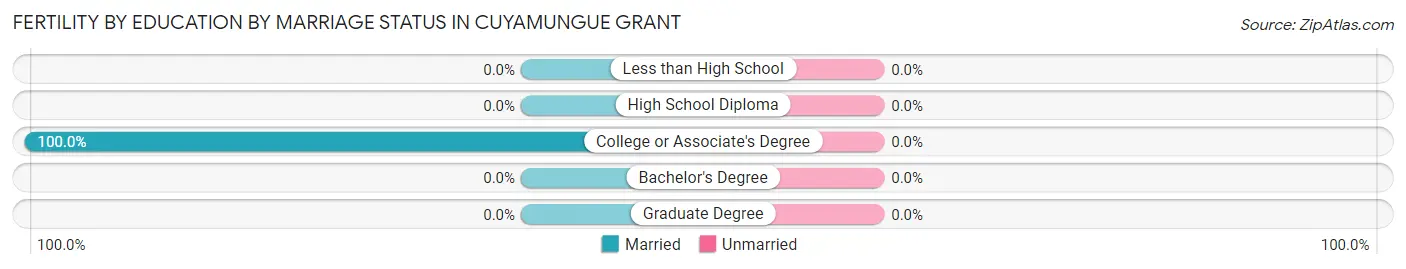
| Educational Attainment | Married | Unmarried |
| Less than High School | 0 (0.0%) | 0 (0.0%) |
| High School Diploma | 0 (0.0%) | 0 (0.0%) |
| College or Associate's Degree | 6 (100.0%) | 0 (0.0%) |
| Bachelor's Degree | 0 (0.0%) | 0 (0.0%) |
| Graduate Degree | 0 (0.0%) | 0 (0.0%) |
| Total | 6 (100.0%) | 0 (0.0%) |
Employment Characteristics in Cuyamungue Grant
Employment by Class of Employer in Cuyamungue Grant
Among the 228 employed individuals in Cuyamungue Grant, private company employees (124 | 54.4%), self-employed (not incorporated) (40 | 17.5%), and local government employees (27 | 11.8%) make up the most common classes of employment.
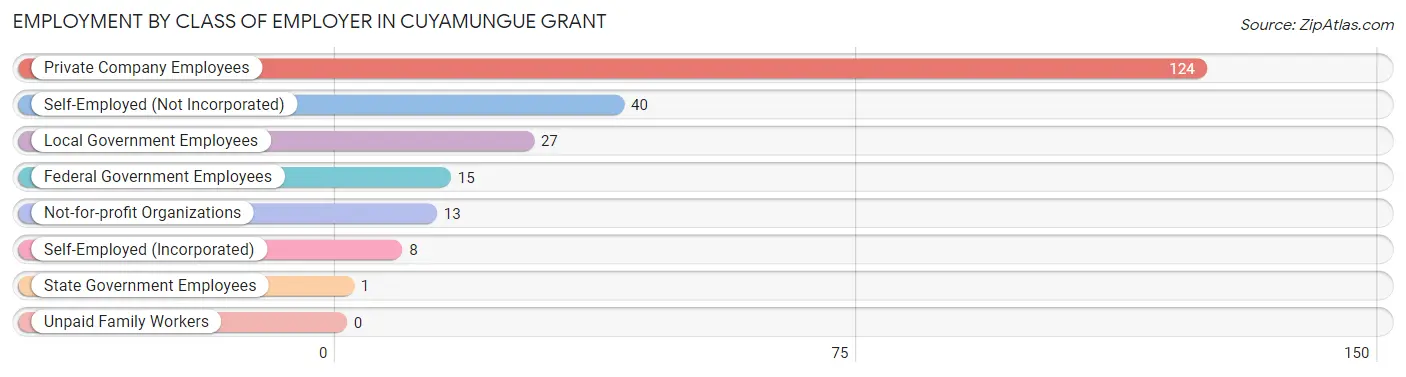
| Employer Class | # Employees | % Employees |
| Private Company Employees | 124 | 54.4% |
| Self-Employed (Incorporated) | 8 | 3.5% |
| Self-Employed (Not Incorporated) | 40 | 17.5% |
| Not-for-profit Organizations | 13 | 5.7% |
| Local Government Employees | 27 | 11.8% |
| State Government Employees | 1 | 0.4% |
| Federal Government Employees | 15 | 6.6% |
| Unpaid Family Workers | 0 | 0.0% |
| Total | 228 | 100.0% |
Employment Status by Age in Cuyamungue Grant
According to the labor force statistics for Cuyamungue Grant, out of the total population over 16 years of age (310), 82.9% or 257 individuals are in the labor force, with 7.0% or 18 of them unemployed. The age group with the highest labor force participation rate is 20 to 24 years, with 100.0% or 43 individuals in the labor force. Within the labor force, the 45 to 54 years age range has the highest percentage of unemployed individuals, with 35.7% or 10 of them being unemployed.
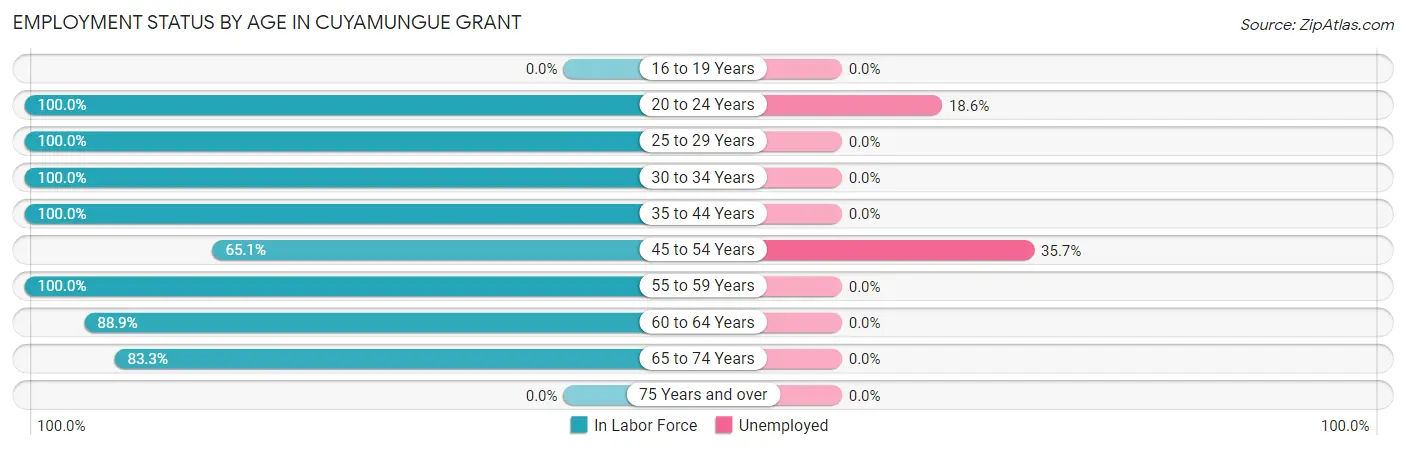
| Age Bracket | In Labor Force | Unemployed |
| 16 to 19 Years | 0 (0.0%) | 0 (0.0%) |
| 20 to 24 Years | 43 (100.0%) | 8 (18.6%) |
| 25 to 29 Years | 25 (100.0%) | 0 (0.0%) |
| 30 to 34 Years | 54 (100.0%) | 0 (0.0%) |
| 35 to 44 Years | 60 (100.0%) | 0 (0.0%) |
| 45 to 54 Years | 28 (65.1%) | 10 (35.7%) |
| 55 to 59 Years | 26 (100.0%) | 0 (0.0%) |
| 60 to 64 Years | 16 (88.9%) | 0 (0.0%) |
| 65 to 74 Years | 5 (83.3%) | 0 (0.0%) |
| 75 Years and over | 0 (0.0%) | 0 (0.0%) |
| Total | 257 (82.9%) | 18 (7.0%) |
Employment Status by Educational Attainment in Cuyamungue Grant
According to labor force statistics for Cuyamungue Grant, 92.5% of individuals (209) out of the total population between 25 and 64 years of age (226) are in the labor force, with 4.8% or 10 of them being unemployed. The group with the highest labor force participation rate are those with the educational attainment of less than high school, with 100.0% or 2 individuals in the labor force. Within the labor force, individuals with high school diploma education have the highest percentage of unemployment, with 7.1% or 10 of them being unemployed.
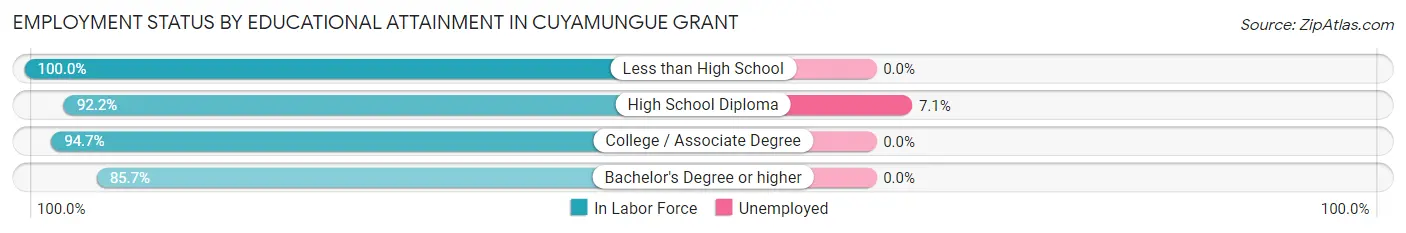
| Educational Attainment | In Labor Force | Unemployed |
| Less than High School | 2 (100.0%) | 0 (0.0%) |
| High School Diploma | 141 (92.2%) | 11 (7.1%) |
| College / Associate Degree | 54 (94.7%) | 0 (0.0%) |
| Bachelor's Degree or higher | 12 (85.7%) | 0 (0.0%) |
| Total | 209 (92.5%) | 11 (4.8%) |
Employment Occupations by Sex in Cuyamungue Grant
Management, Business, Science and Arts Occupations
The most common Management, Business, Science and Arts occupations in Cuyamungue Grant are Management (47 | 19.7%), Community & Social Service (7 | 2.9%), Legal Services & Support (7 | 2.9%), Health Diagnosing & Treating (6 | 2.5%), and Health Technologists (6 | 2.5%).
Management, Business, Science and Arts Occupations by Sex
| Occupation | Male | Female |
| Management | 27 (57.5%) | 20 (42.5%) |
| Business & Financial | 0 (0.0%) | 0 (0.0%) |
| Computers, Engineering & Science | 0 (0.0%) | 1 (100.0%) |
| Computers & Mathematics | 0 (0.0%) | 0 (0.0%) |
| Architecture & Engineering | 0 (0.0%) | 0 (0.0%) |
| Life, Physical & Social Science | 0 (0.0%) | 1 (100.0%) |
| Community & Social Service | 0 (0.0%) | 7 (100.0%) |
| Education, Arts & Media | 0 (0.0%) | 0 (0.0%) |
| Legal Services & Support | 0 (0.0%) | 7 (100.0%) |
| Education Instruction & Library | 0 (0.0%) | 0 (0.0%) |
| Arts, Media & Entertainment | 0 (0.0%) | 0 (0.0%) |
| Health Diagnosing & Treating | 0 (0.0%) | 6 (100.0%) |
| Health Technologists | 0 (0.0%) | 6 (100.0%) |
| Total (Category) | 27 (44.3%) | 34 (55.7%) |
| Total (Overall) | 91 (38.1%) | 148 (61.9%) |
Services Occupations
The most common Services occupations in Cuyamungue Grant are Healthcare Support (21 | 8.8%), Security & Protection (8 | 3.4%), Firefighting & Prevention (8 | 3.4%), and Food Preparation & Serving (2 | 0.8%).
Services Occupations by Sex
| Occupation | Male | Female |
| Healthcare Support | 13 (61.9%) | 8 (38.1%) |
| Security & Protection | 8 (100.0%) | 0 (0.0%) |
| Firefighting & Prevention | 8 (100.0%) | 0 (0.0%) |
| Law Enforcement | 0 (0.0%) | 0 (0.0%) |
| Food Preparation & Serving | 2 (100.0%) | 0 (0.0%) |
| Cleaning & Maintenance | 0 (0.0%) | 0 (0.0%) |
| Personal Care & Service | 0 (0.0%) | 0 (0.0%) |
| Total (Category) | 23 (74.2%) | 8 (25.8%) |
| Total (Overall) | 91 (38.1%) | 148 (61.9%) |
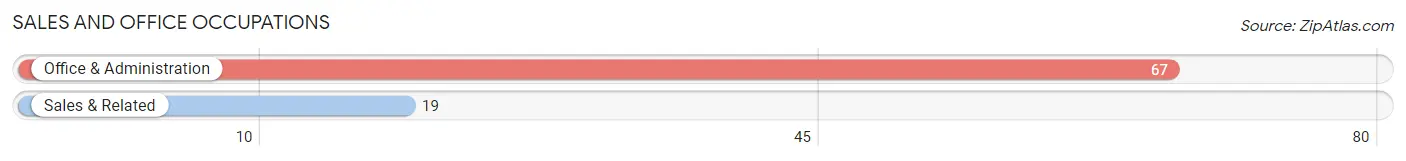
Sales and Office Occupations
The most common Sales and Office occupations in Cuyamungue Grant are Office & Administration (67 | 28.0%), and Sales & Related (19 | 8.0%).
Sales and Office Occupations by Sex
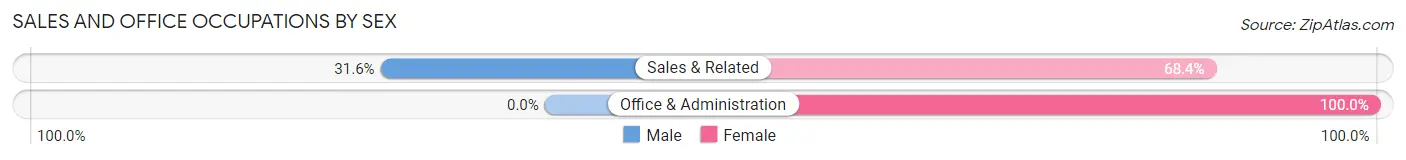
| Occupation | Male | Female |
| Sales & Related | 6 (31.6%) | 13 (68.4%) |
| Office & Administration | 0 (0.0%) | 67 (100.0%) |
| Total (Category) | 6 (7.0%) | 80 (93.0%) |
| Total (Overall) | 91 (38.1%) | 148 (61.9%) |
Natural Resources, Construction and Maintenance Occupations
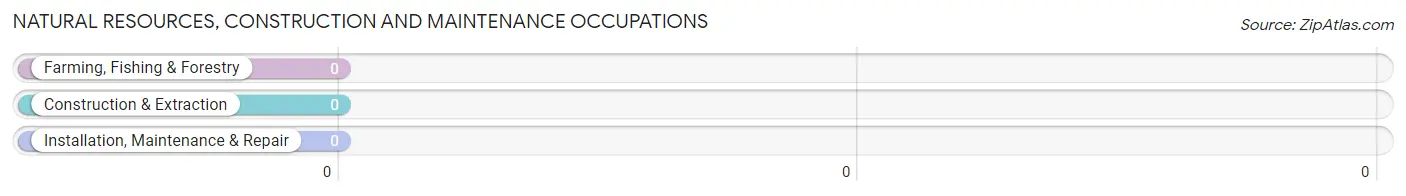
Natural Resources, Construction and Maintenance Occupations by Sex

| Occupation | Male | Female |
| Farming, Fishing & Forestry | 0 (0.0%) | 0 (0.0%) |
| Construction & Extraction | 0 (0.0%) | 0 (0.0%) |
| Installation, Maintenance & Repair | 0 (0.0%) | 0 (0.0%) |
| Total (Category) | 0 (0.0%) | 0 (0.0%) |
| Total (Overall) | 91 (38.1%) | 148 (61.9%) |
Production, Transportation and Moving Occupations
The most common Production, Transportation and Moving occupations in Cuyamungue Grant are Production (26 | 10.9%), Material Moving (25 | 10.5%), and Transportation (10 | 4.2%).
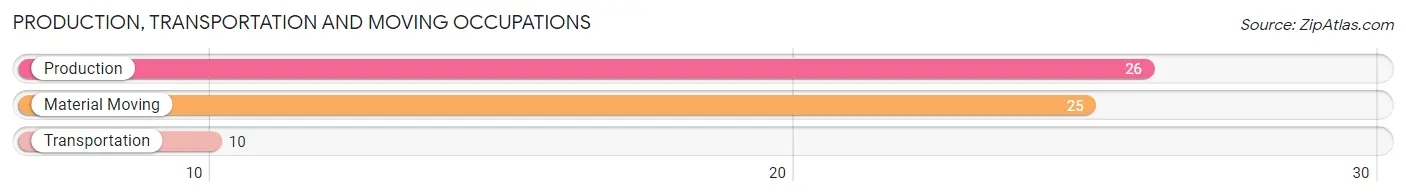
Production, Transportation and Moving Occupations by Sex
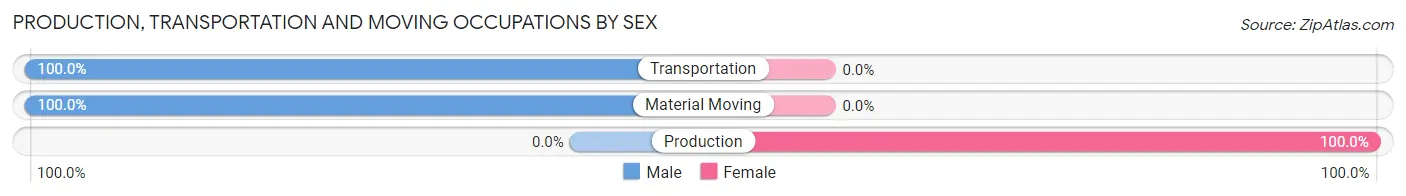
| Occupation | Male | Female |
| Production | 0 (0.0%) | 26 (100.0%) |
| Transportation | 10 (100.0%) | 0 (0.0%) |
| Material Moving | 25 (100.0%) | 0 (0.0%) |
| Total (Category) | 35 (57.4%) | 26 (42.6%) |
| Total (Overall) | 91 (38.1%) | 148 (61.9%) |
Employment Industries by Sex in Cuyamungue Grant
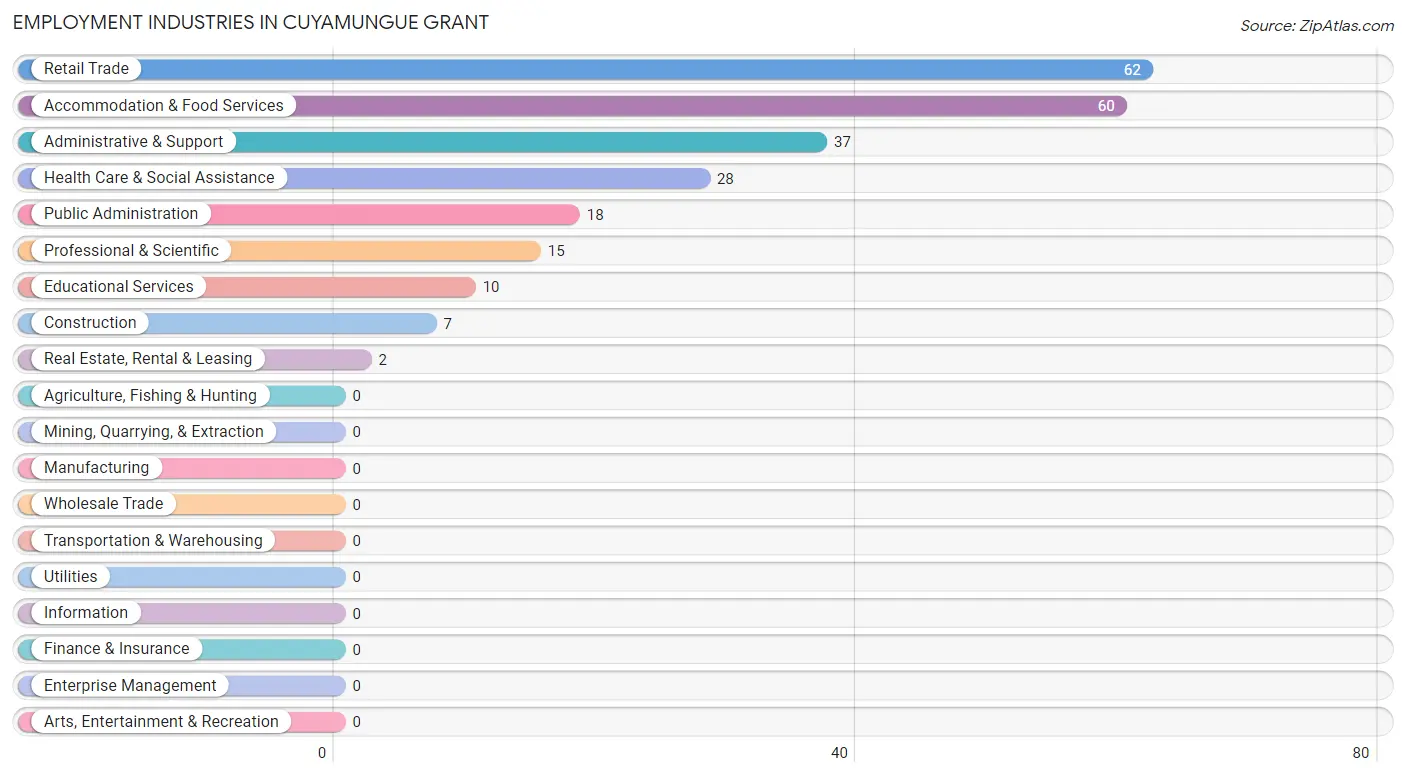
Employment Industries in Cuyamungue Grant
The major employment industries in Cuyamungue Grant include Retail Trade (62 | 25.9%), Accommodation & Food Services (60 | 25.1%), Administrative & Support (37 | 15.5%), Health Care & Social Assistance (28 | 11.7%), and Public Administration (18 | 7.5%).
Employment Industries by Sex in Cuyamungue Grant
The Cuyamungue Grant industries that see more men than women are Construction (100.0%), Educational Services (100.0%), and Administrative & Support (54.0%), whereas the industries that tend to have a higher number of women are Real Estate, Rental & Leasing (100.0%), Public Administration (100.0%), and Accommodation & Food Services (96.7%).
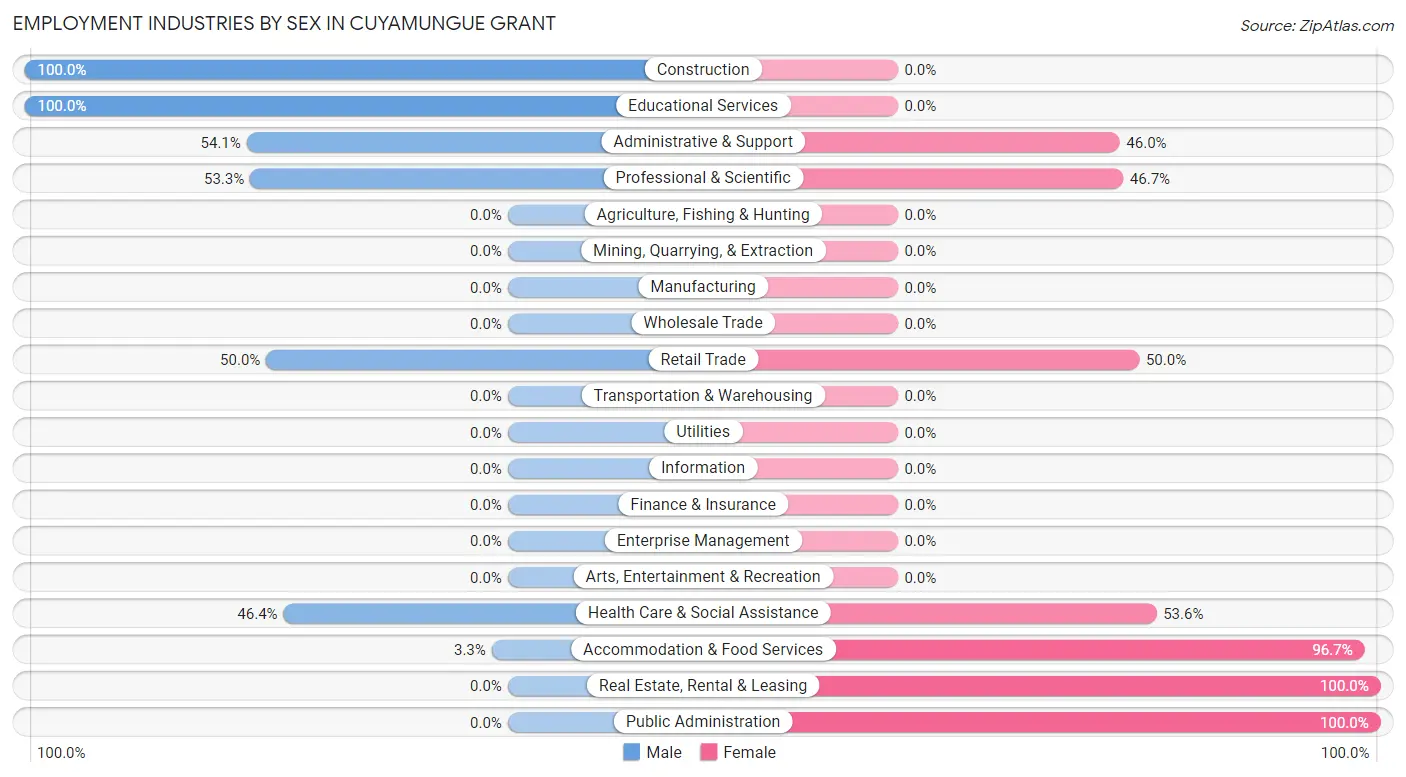
| Industry | Male | Female |
| Agriculture, Fishing & Hunting | 0 (0.0%) | 0 (0.0%) |
| Mining, Quarrying, & Extraction | 0 (0.0%) | 0 (0.0%) |
| Construction | 7 (100.0%) | 0 (0.0%) |
| Manufacturing | 0 (0.0%) | 0 (0.0%) |
| Wholesale Trade | 0 (0.0%) | 0 (0.0%) |
| Retail Trade | 31 (50.0%) | 31 (50.0%) |
| Transportation & Warehousing | 0 (0.0%) | 0 (0.0%) |
| Utilities | 0 (0.0%) | 0 (0.0%) |
| Information | 0 (0.0%) | 0 (0.0%) |
| Finance & Insurance | 0 (0.0%) | 0 (0.0%) |
| Real Estate, Rental & Leasing | 0 (0.0%) | 2 (100.0%) |
| Professional & Scientific | 8 (53.3%) | 7 (46.7%) |
| Enterprise Management | 0 (0.0%) | 0 (0.0%) |
| Administrative & Support | 20 (54.0%) | 17 (46.0%) |
| Educational Services | 10 (100.0%) | 0 (0.0%) |
| Health Care & Social Assistance | 13 (46.4%) | 15 (53.6%) |
| Arts, Entertainment & Recreation | 0 (0.0%) | 0 (0.0%) |
| Accommodation & Food Services | 2 (3.3%) | 58 (96.7%) |
| Public Administration | 0 (0.0%) | 18 (100.0%) |
| Total | 91 (38.1%) | 148 (61.9%) |
Education in Cuyamungue Grant
School Enrollment in Cuyamungue Grant
The most common levels of schooling among the 55 students in Cuyamungue Grant are elementary school (31 | 56.4%), high school (10 | 18.2%), and college / undergraduate (9 | 16.4%).
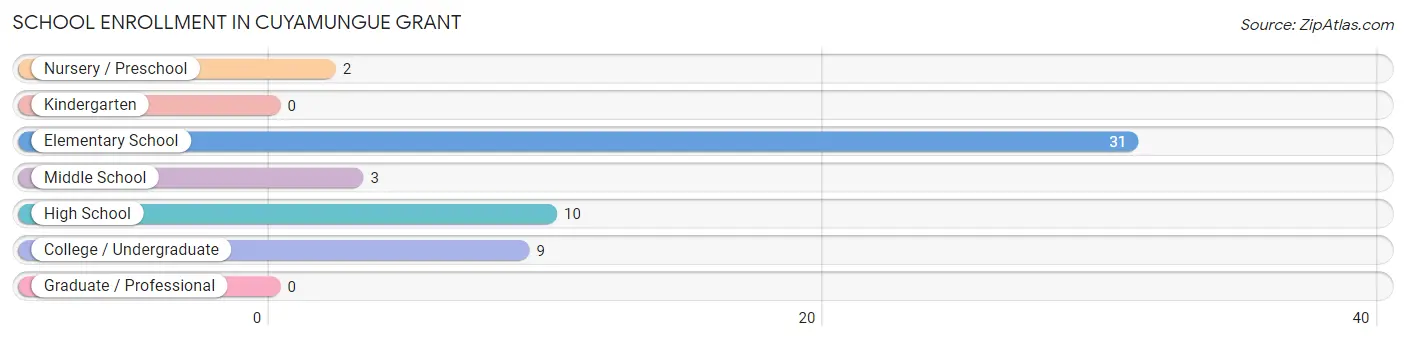
| School Level | # Students | % Students |
| Nursery / Preschool | 2 | 3.6% |
| Kindergarten | 0 | 0.0% |
| Elementary School | 31 | 56.4% |
| Middle School | 3 | 5.4% |
| High School | 10 | 18.2% |
| College / Undergraduate | 9 | 16.4% |
| Graduate / Professional | 0 | 0.0% |
| Total | 55 | 100.0% |
School Enrollment by Age by Funding Source in Cuyamungue Grant
| Age Bracket | Public School | Private School |
| 3 to 4 Year Olds | 2 (100.0%) | 0 (0.0%) |
| 5 to 9 Year Old | 31 (100.0%) | 0 (0.0%) |
| 10 to 14 Year Olds | 3 (100.0%) | 0 (0.0%) |
| 15 to 17 Year Olds | 10 (100.0%) | 0 (0.0%) |
| 18 to 19 Year Olds | 0 (0.0%) | 0 (0.0%) |
| 20 to 24 Year Olds | 8 (100.0%) | 0 (0.0%) |
| 25 to 34 Year Olds | 1 (100.0%) | 0 (0.0%) |
| 35 Years and over | 0 (0.0%) | 0 (0.0%) |
| Total | 55 (100.0%) | 0 (0.0%) |
Educational Attainment by Field of Study in Cuyamungue Grant
Psychology (6 | 40.0%), arts & humanities (5 | 33.3%), business (2 | 13.3%), engineering (1 | 6.7%), and visual & performing arts (1 | 6.7%) are the most common fields of study among 15 individuals in Cuyamungue Grant who have obtained a bachelor's degree or higher.
| Field of Study | # Graduates | % Graduates |
| Computers & Mathematics | 0 | 0.0% |
| Bio, Nature & Agricultural | 0 | 0.0% |
| Physical & Health Sciences | 0 | 0.0% |
| Psychology | 6 | 40.0% |
| Social Sciences | 0 | 0.0% |
| Engineering | 1 | 6.7% |
| Multidisciplinary Studies | 0 | 0.0% |
| Science & Technology | 0 | 0.0% |
| Business | 2 | 13.3% |
| Education | 0 | 0.0% |
| Literature & Languages | 0 | 0.0% |
| Liberal Arts & History | 0 | 0.0% |
| Visual & Performing Arts | 1 | 6.7% |
| Communications | 0 | 0.0% |
| Arts & Humanities | 5 | 33.3% |
| Total | 15 | 100.0% |
Transportation & Commute in Cuyamungue Grant
Vehicle Availability by Sex in Cuyamungue Grant
The most prevalent vehicle ownership categories in Cuyamungue Grant are males with 2 vehicles (32, accounting for 35.2%) and females with 2 vehicles (93, making up 23.4%).
| Vehicles Available | Male | Female |
| No Vehicle | 0 (0.0%) | 0 (0.0%) |
| 1 Vehicle | 8 (8.8%) | 6 (4.4%) |
| 2 Vehicles | 32 (35.2%) | 93 (67.9%) |
| 3 Vehicles | 30 (33.0%) | 36 (26.3%) |
| 4 Vehicles | 21 (23.1%) | 2 (1.5%) |
| 5 or more Vehicles | 0 (0.0%) | 0 (0.0%) |
| Total | 91 (100.0%) | 137 (100.0%) |
Commute Time in Cuyamungue Grant
The most frequently occuring commute durations in Cuyamungue Grant are 25 to 29 minutes (75 commuters, 32.9%), 30 to 34 minutes (59 commuters, 25.9%), and 15 to 19 minutes (53 commuters, 23.3%).
| Commute Time | # Commuters | % Commuters |
| Less than 5 Minutes | 5 | 2.2% |
| 5 to 9 Minutes | 21 | 9.2% |
| 10 to 14 Minutes | 0 | 0.0% |
| 15 to 19 Minutes | 53 | 23.3% |
| 20 to 24 Minutes | 2 | 0.9% |
| 25 to 29 Minutes | 75 | 32.9% |
| 30 to 34 Minutes | 59 | 25.9% |
| 35 to 39 Minutes | 9 | 4.0% |
| 40 to 44 Minutes | 0 | 0.0% |
| 45 to 59 Minutes | 2 | 0.9% |
| 60 to 89 Minutes | 2 | 0.9% |
| 90 or more Minutes | 0 | 0.0% |
Commute Time by Sex in Cuyamungue Grant
The most common commute times in Cuyamungue Grant are 15 to 19 minutes (36 commuters, 39.6%) for males and 25 to 29 minutes (75 commuters, 54.7%) for females.
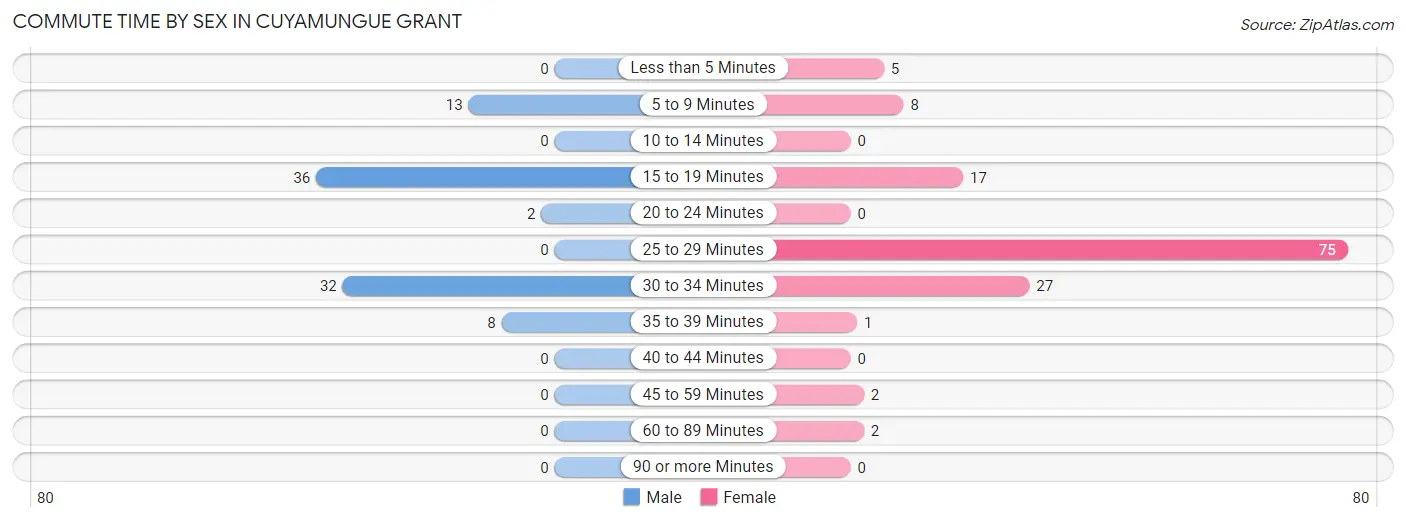
| Commute Time | Male | Female |
| Less than 5 Minutes | 0 (0.0%) | 5 (3.6%) |
| 5 to 9 Minutes | 13 (14.3%) | 8 (5.8%) |
| 10 to 14 Minutes | 0 (0.0%) | 0 (0.0%) |
| 15 to 19 Minutes | 36 (39.6%) | 17 (12.4%) |
| 20 to 24 Minutes | 2 (2.2%) | 0 (0.0%) |
| 25 to 29 Minutes | 0 (0.0%) | 75 (54.7%) |
| 30 to 34 Minutes | 32 (35.2%) | 27 (19.7%) |
| 35 to 39 Minutes | 8 (8.8%) | 1 (0.7%) |
| 40 to 44 Minutes | 0 (0.0%) | 0 (0.0%) |
| 45 to 59 Minutes | 0 (0.0%) | 2 (1.5%) |
| 60 to 89 Minutes | 0 (0.0%) | 2 (1.5%) |
| 90 or more Minutes | 0 (0.0%) | 0 (0.0%) |
Time of Departure to Work by Sex in Cuyamungue Grant
The most frequent times of departure to work in Cuyamungue Grant are 7:00 AM to 7:29 AM (29, 31.9%) for males and 7:30 AM to 7:59 AM (96, 70.1%) for females.
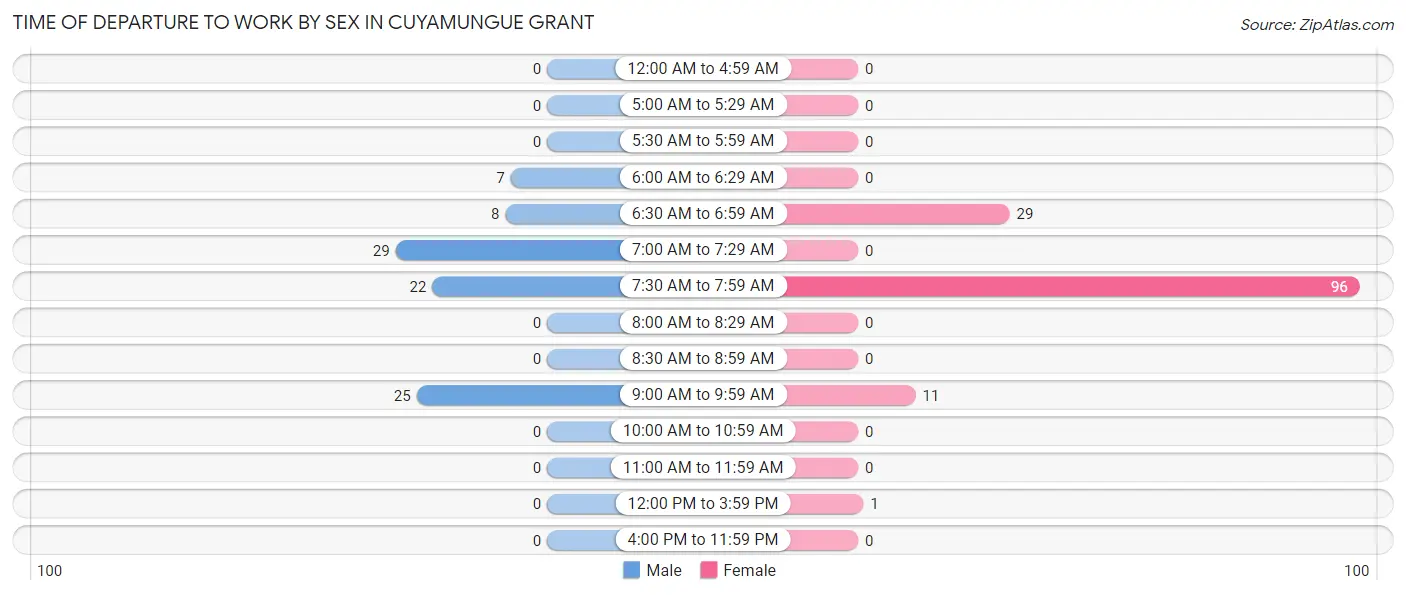
| Time of Departure | Male | Female |
| 12:00 AM to 4:59 AM | 0 (0.0%) | 0 (0.0%) |
| 5:00 AM to 5:29 AM | 0 (0.0%) | 0 (0.0%) |
| 5:30 AM to 5:59 AM | 0 (0.0%) | 0 (0.0%) |
| 6:00 AM to 6:29 AM | 7 (7.7%) | 0 (0.0%) |
| 6:30 AM to 6:59 AM | 8 (8.8%) | 29 (21.2%) |
| 7:00 AM to 7:29 AM | 29 (31.9%) | 0 (0.0%) |
| 7:30 AM to 7:59 AM | 22 (24.2%) | 96 (70.1%) |
| 8:00 AM to 8:29 AM | 0 (0.0%) | 0 (0.0%) |
| 8:30 AM to 8:59 AM | 0 (0.0%) | 0 (0.0%) |
| 9:00 AM to 9:59 AM | 25 (27.5%) | 11 (8.0%) |
| 10:00 AM to 10:59 AM | 0 (0.0%) | 0 (0.0%) |
| 11:00 AM to 11:59 AM | 0 (0.0%) | 0 (0.0%) |
| 12:00 PM to 3:59 PM | 0 (0.0%) | 1 (0.7%) |
| 4:00 PM to 11:59 PM | 0 (0.0%) | 0 (0.0%) |
| Total | 91 (100.0%) | 137 (100.0%) |
Housing Occupancy in Cuyamungue Grant
Occupancy by Ownership in Cuyamungue Grant
Of the total 125 dwellings in Cuyamungue Grant, owner-occupied units account for 97 (77.6%), while renter-occupied units make up 28 (22.4%).
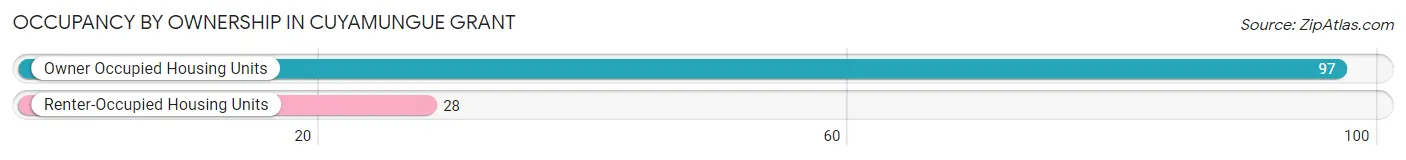
| Occupancy | # Housing Units | % Housing Units |
| Owner Occupied Housing Units | 97 | 77.6% |
| Renter-Occupied Housing Units | 28 | 22.4% |
| Total Occupied Housing Units | 125 | 100.0% |
Occupancy by Household Size in Cuyamungue Grant
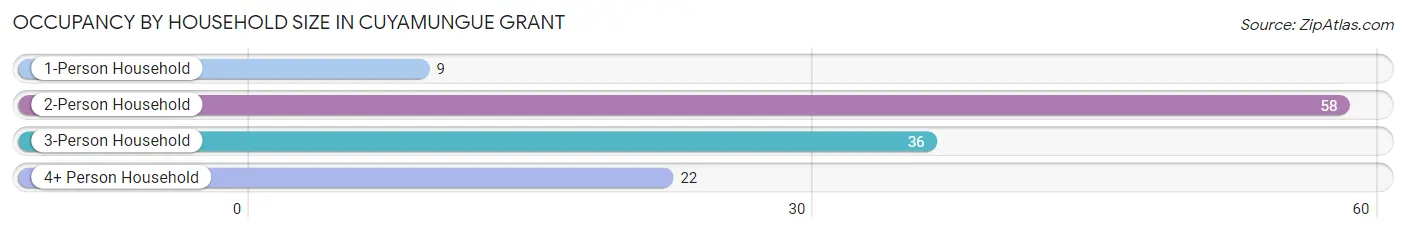
| Household Size | # Housing Units | % Housing Units |
| 1-Person Household | 9 | 7.2% |
| 2-Person Household | 58 | 46.4% |
| 3-Person Household | 36 | 28.8% |
| 4+ Person Household | 22 | 17.6% |
| Total Housing Units | 125 | 100.0% |
Occupancy by Ownership by Household Size in Cuyamungue Grant
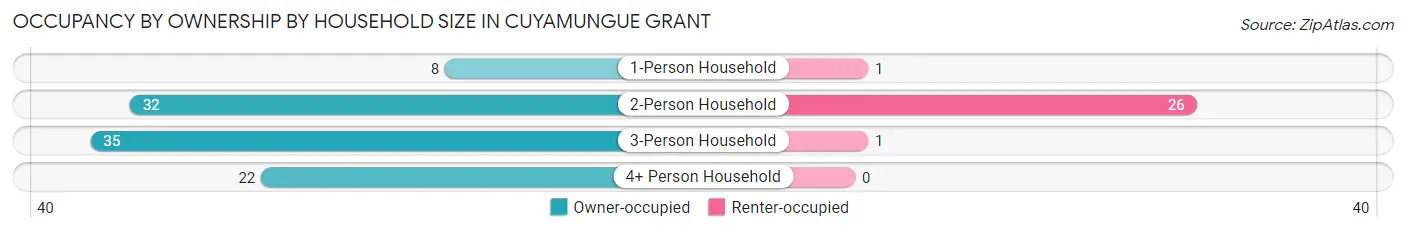
| Household Size | Owner-occupied | Renter-occupied |
| 1-Person Household | 8 (88.9%) | 1 (11.1%) |
| 2-Person Household | 32 (55.2%) | 26 (44.8%) |
| 3-Person Household | 35 (97.2%) | 1 (2.8%) |
| 4+ Person Household | 22 (100.0%) | 0 (0.0%) |
| Total Housing Units | 97 (77.6%) | 28 (22.4%) |
Occupancy by Educational Attainment in Cuyamungue Grant
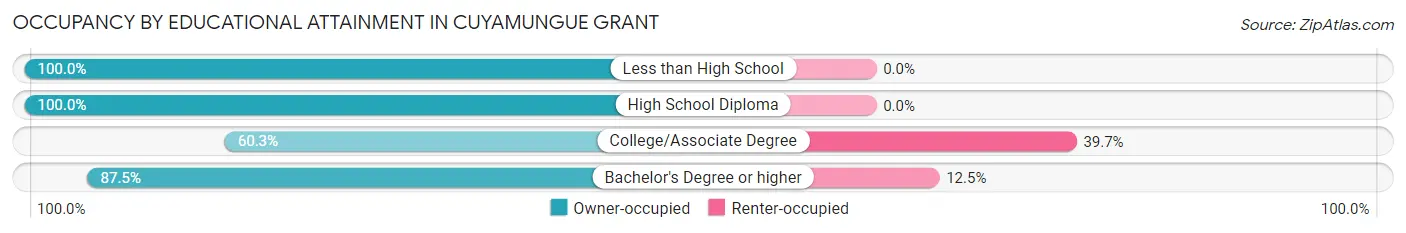
| Household Size | Owner-occupied | Renter-occupied |
| Less than High School | 2 (100.0%) | 0 (0.0%) |
| High School Diploma | 47 (100.0%) | 0 (0.0%) |
| College/Associate Degree | 41 (60.3%) | 27 (39.7%) |
| Bachelor's Degree or higher | 7 (87.5%) | 1 (12.5%) |
Occupancy by Age of Householder in Cuyamungue Grant
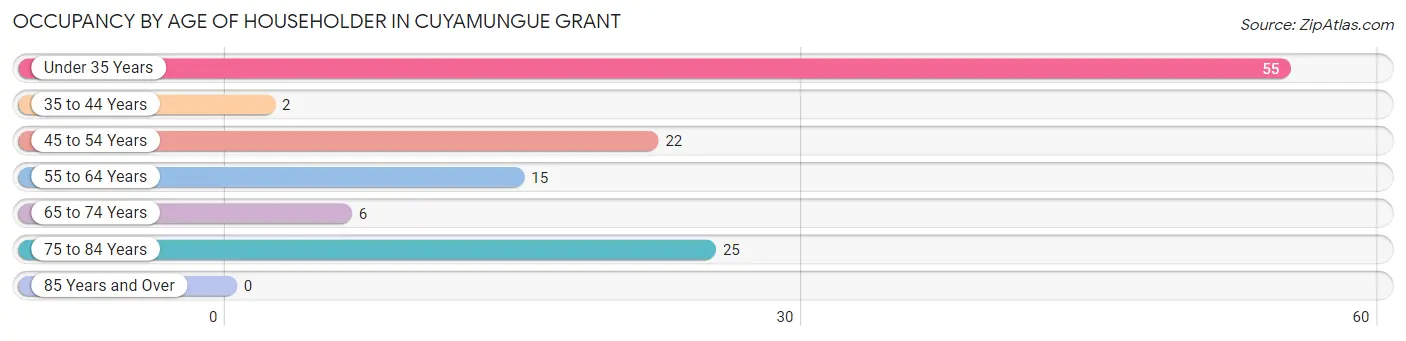
| Age Bracket | # Households | % Households |
| Under 35 Years | 55 | 44.0% |
| 35 to 44 Years | 2 | 1.6% |
| 45 to 54 Years | 22 | 17.6% |
| 55 to 64 Years | 15 | 12.0% |
| 65 to 74 Years | 6 | 4.8% |
| 75 to 84 Years | 25 | 20.0% |
| 85 Years and Over | 0 | 0.0% |
| Total | 125 | 100.0% |
Housing Finances in Cuyamungue Grant
Median Income by Occupancy in Cuyamungue Grant
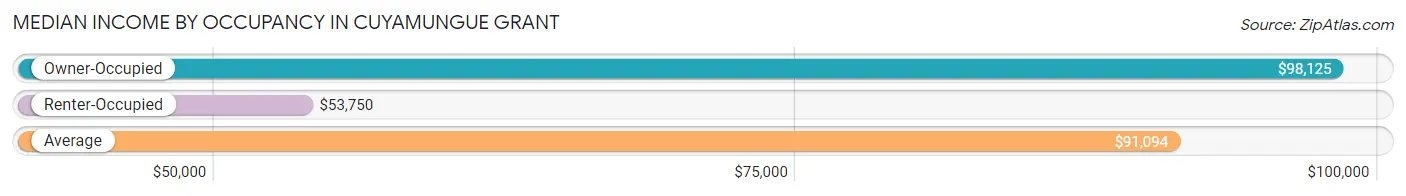
| Occupancy Type | # Households | Median Income |
| Owner-Occupied | 97 (77.6%) | $98,125 |
| Renter-Occupied | 28 (22.4%) | $53,750 |
| Average | 125 (100.0%) | $91,094 |
Occupancy by Householder Income Bracket in Cuyamungue Grant
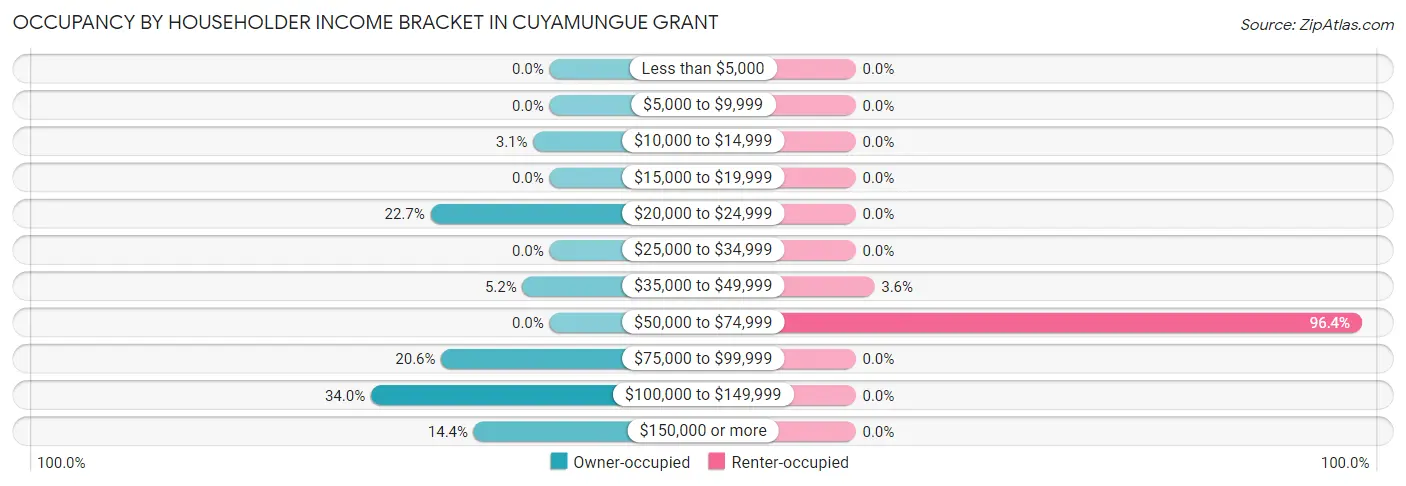
| Income Bracket | Owner-occupied | Renter-occupied |
| Less than $5,000 | 0 (0.0%) | 0 (0.0%) |
| $5,000 to $9,999 | 0 (0.0%) | 0 (0.0%) |
| $10,000 to $14,999 | 3 (3.1%) | 0 (0.0%) |
| $15,000 to $19,999 | 0 (0.0%) | 0 (0.0%) |
| $20,000 to $24,999 | 22 (22.7%) | 0 (0.0%) |
| $25,000 to $34,999 | 0 (0.0%) | 0 (0.0%) |
| $35,000 to $49,999 | 5 (5.1%) | 1 (3.6%) |
| $50,000 to $74,999 | 0 (0.0%) | 27 (96.4%) |
| $75,000 to $99,999 | 20 (20.6%) | 0 (0.0%) |
| $100,000 to $149,999 | 33 (34.0%) | 0 (0.0%) |
| $150,000 or more | 14 (14.4%) | 0 (0.0%) |
| Total | 97 (100.0%) | 28 (100.0%) |
Monthly Housing Cost Tiers in Cuyamungue Grant
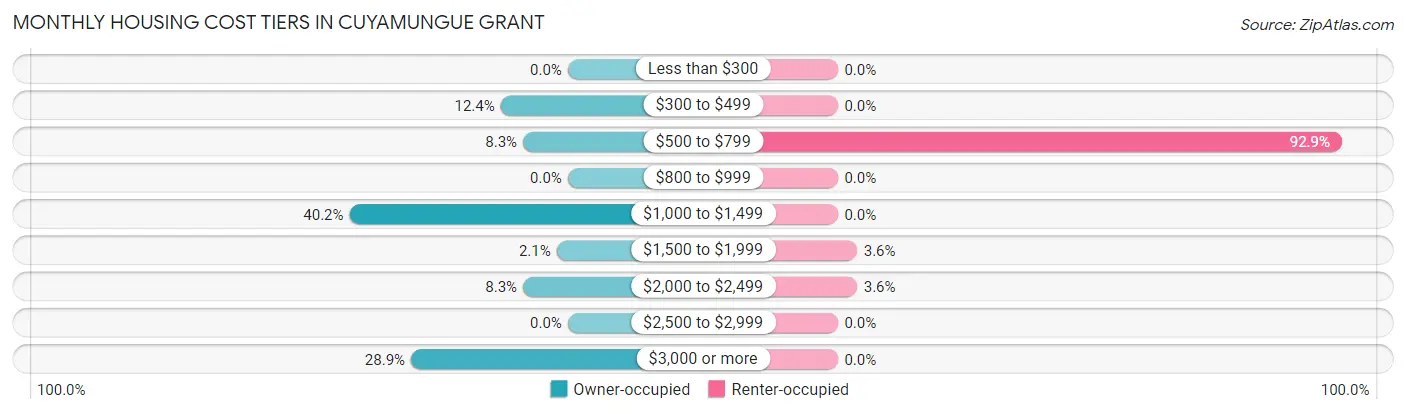
| Monthly Cost | Owner-occupied | Renter-occupied |
| Less than $300 | 0 (0.0%) | 0 (0.0%) |
| $300 to $499 | 12 (12.4%) | 0 (0.0%) |
| $500 to $799 | 8 (8.3%) | 26 (92.9%) |
| $800 to $999 | 0 (0.0%) | 0 (0.0%) |
| $1,000 to $1,499 | 39 (40.2%) | 0 (0.0%) |
| $1,500 to $1,999 | 2 (2.1%) | 1 (3.6%) |
| $2,000 to $2,499 | 8 (8.3%) | 1 (3.6%) |
| $2,500 to $2,999 | 0 (0.0%) | 0 (0.0%) |
| $3,000 or more | 28 (28.9%) | 0 (0.0%) |
| Total | 97 (100.0%) | 28 (100.0%) |
Physical Housing Characteristics in Cuyamungue Grant
Housing Structures in Cuyamungue Grant
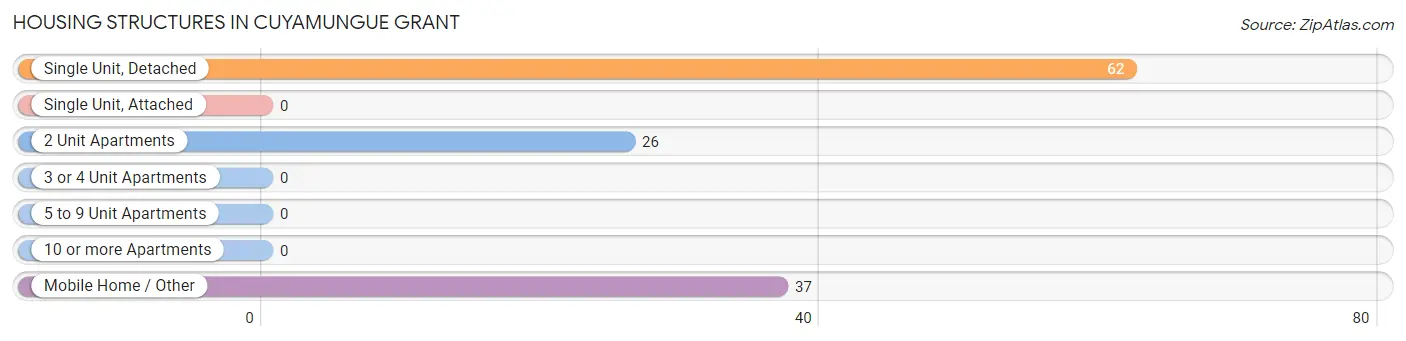
| Structure Type | # Housing Units | % Housing Units |
| Single Unit, Detached | 62 | 49.6% |
| Single Unit, Attached | 0 | 0.0% |
| 2 Unit Apartments | 26 | 20.8% |
| 3 or 4 Unit Apartments | 0 | 0.0% |
| 5 to 9 Unit Apartments | 0 | 0.0% |
| 10 or more Apartments | 0 | 0.0% |
| Mobile Home / Other | 37 | 29.6% |
| Total | 125 | 100.0% |
Housing Structures by Occupancy in Cuyamungue Grant
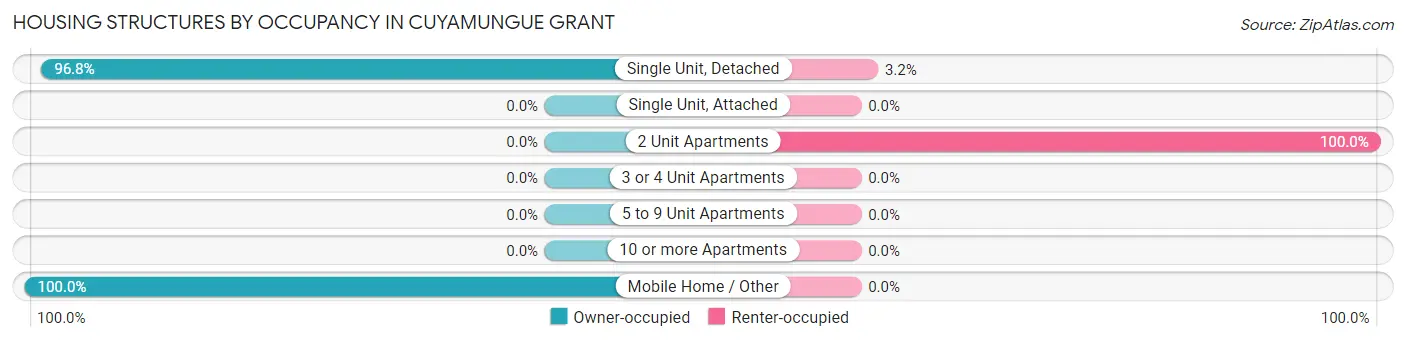
| Structure Type | Owner-occupied | Renter-occupied |
| Single Unit, Detached | 60 (96.8%) | 2 (3.2%) |
| Single Unit, Attached | 0 (0.0%) | 0 (0.0%) |
| 2 Unit Apartments | 0 (0.0%) | 26 (100.0%) |
| 3 or 4 Unit Apartments | 0 (0.0%) | 0 (0.0%) |
| 5 to 9 Unit Apartments | 0 (0.0%) | 0 (0.0%) |
| 10 or more Apartments | 0 (0.0%) | 0 (0.0%) |
| Mobile Home / Other | 37 (100.0%) | 0 (0.0%) |
| Total | 97 (77.6%) | 28 (22.4%) |
Housing Structures by Number of Rooms in Cuyamungue Grant
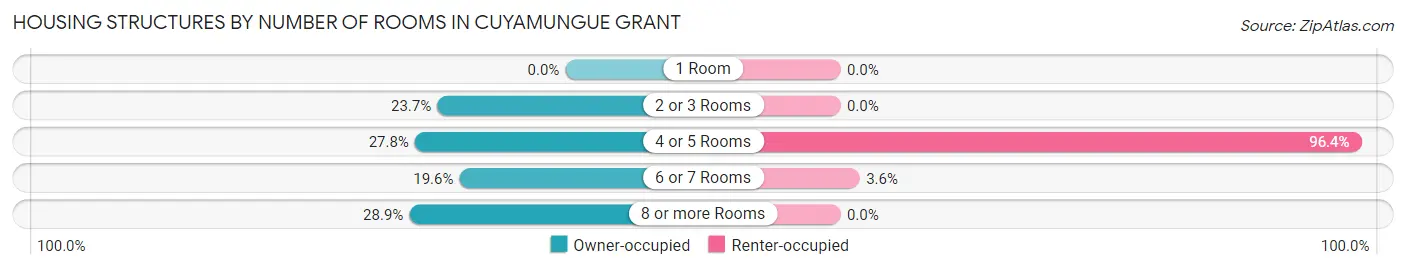
| Number of Rooms | Owner-occupied | Renter-occupied |
| 1 Room | 0 (0.0%) | 0 (0.0%) |
| 2 or 3 Rooms | 23 (23.7%) | 0 (0.0%) |
| 4 or 5 Rooms | 27 (27.8%) | 27 (96.4%) |
| 6 or 7 Rooms | 19 (19.6%) | 1 (3.6%) |
| 8 or more Rooms | 28 (28.9%) | 0 (0.0%) |
| Total | 97 (100.0%) | 28 (100.0%) |
Housing Structure by Heating Type in Cuyamungue Grant
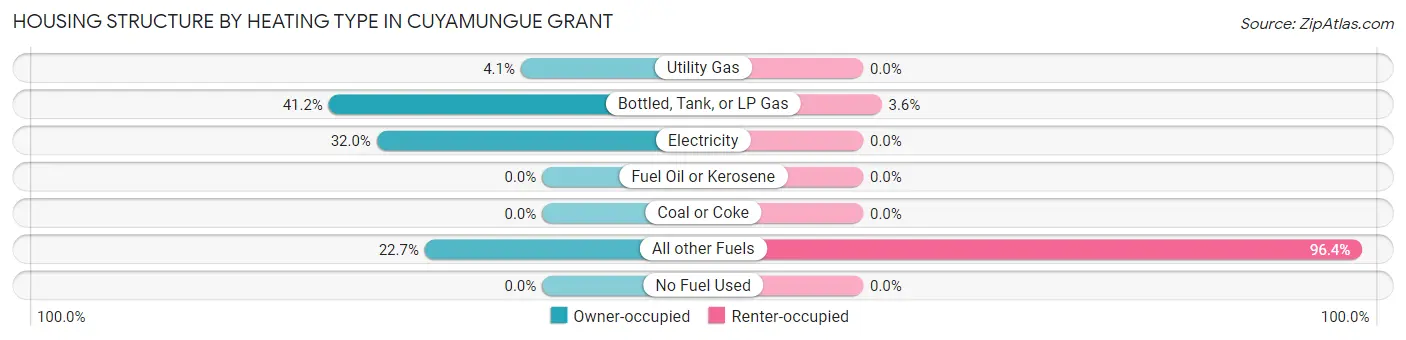
| Heating Type | Owner-occupied | Renter-occupied |
| Utility Gas | 4 (4.1%) | 0 (0.0%) |
| Bottled, Tank, or LP Gas | 40 (41.2%) | 1 (3.6%) |
| Electricity | 31 (32.0%) | 0 (0.0%) |
| Fuel Oil or Kerosene | 0 (0.0%) | 0 (0.0%) |
| Coal or Coke | 0 (0.0%) | 0 (0.0%) |
| All other Fuels | 22 (22.7%) | 27 (96.4%) |
| No Fuel Used | 0 (0.0%) | 0 (0.0%) |
| Total | 97 (100.0%) | 28 (100.0%) |
Household Vehicle Usage in Cuyamungue Grant
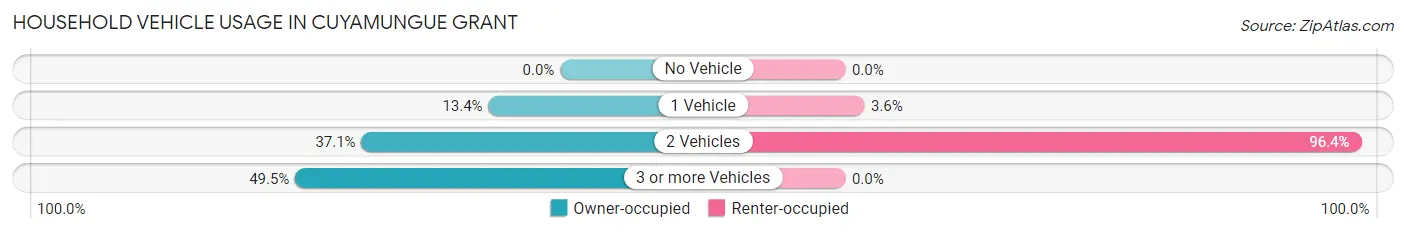
| Vehicles per Household | Owner-occupied | Renter-occupied |
| No Vehicle | 0 (0.0%) | 0 (0.0%) |
| 1 Vehicle | 13 (13.4%) | 1 (3.6%) |
| 2 Vehicles | 36 (37.1%) | 27 (96.4%) |
| 3 or more Vehicles | 48 (49.5%) | 0 (0.0%) |
| Total | 97 (100.0%) | 28 (100.0%) |
Real Estate & Mortgages in Cuyamungue Grant
Real Estate and Mortgage Overview in Cuyamungue Grant
| Characteristic | Without Mortgage | With Mortgage |
| Housing Units | 20 | 77 |
| Median Property Value | - | - |
| Median Household Income | $91,875 | $14 |
| Monthly Housing Costs | $450 | $28 |
| Real Estate Taxes | $1,417 | $2 |
Property Value by Mortgage Status in Cuyamungue Grant
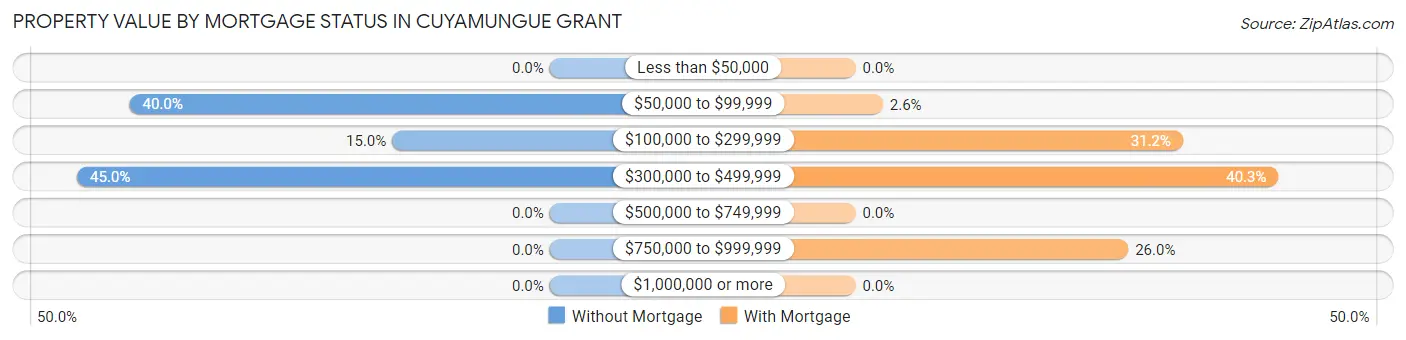
| Property Value | Without Mortgage | With Mortgage |
| Less than $50,000 | 0 (0.0%) | 0 (0.0%) |
| $50,000 to $99,999 | 8 (40.0%) | 2 (2.6%) |
| $100,000 to $299,999 | 3 (15.0%) | 24 (31.2%) |
| $300,000 to $499,999 | 9 (45.0%) | 31 (40.3%) |
| $500,000 to $749,999 | 0 (0.0%) | 0 (0.0%) |
| $750,000 to $999,999 | 0 (0.0%) | 20 (26.0%) |
| $1,000,000 or more | 0 (0.0%) | 0 (0.0%) |
| Total | 20 (100.0%) | 77 (100.0%) |
Household Income by Mortgage Status in Cuyamungue Grant
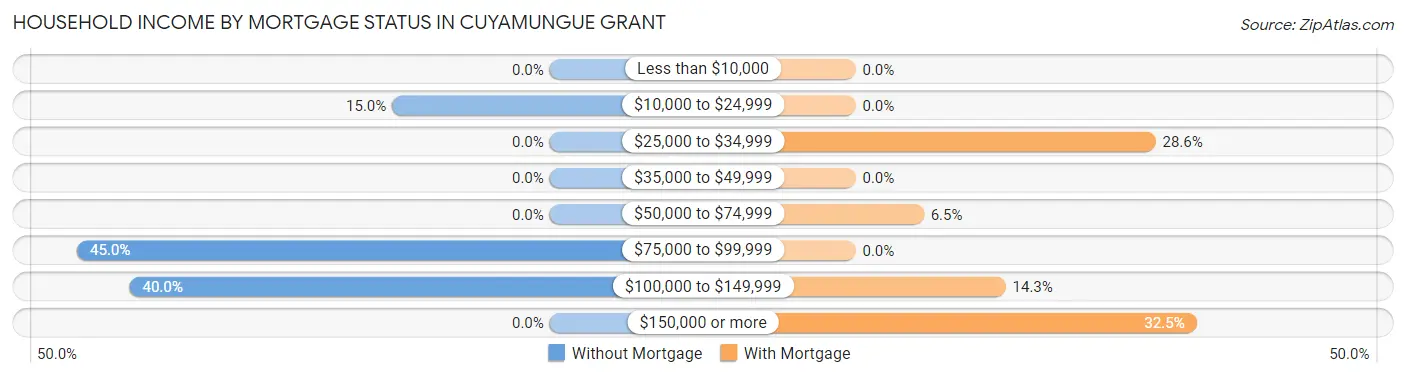
| Household Income | Without Mortgage | With Mortgage |
| Less than $10,000 | 0 (0.0%) | 0 (0.0%) |
| $10,000 to $24,999 | 3 (15.0%) | 0 (0.0%) |
| $25,000 to $34,999 | 0 (0.0%) | 22 (28.6%) |
| $35,000 to $49,999 | 0 (0.0%) | 0 (0.0%) |
| $50,000 to $74,999 | 0 (0.0%) | 5 (6.5%) |
| $75,000 to $99,999 | 9 (45.0%) | 0 (0.0%) |
| $100,000 to $149,999 | 8 (40.0%) | 11 (14.3%) |
| $150,000 or more | 0 (0.0%) | 25 (32.5%) |
| Total | 20 (100.0%) | 77 (100.0%) |
Property Value to Household Income Ratio in Cuyamungue Grant
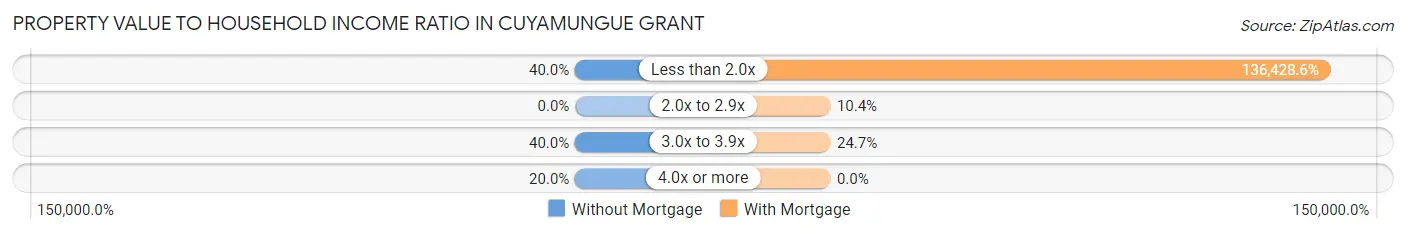
| Value-to-Income Ratio | Without Mortgage | With Mortgage |
| Less than 2.0x | 8 (40.0%) | 105,050 (136,428.6%) |
| 2.0x to 2.9x | 0 (0.0%) | 8 (10.4%) |
| 3.0x to 3.9x | 8 (40.0%) | 19 (24.7%) |
| 4.0x or more | 4 (20.0%) | 0 (0.0%) |
| Total | 20 (100.0%) | 77 (100.0%) |
Real Estate Taxes by Mortgage Status in Cuyamungue Grant
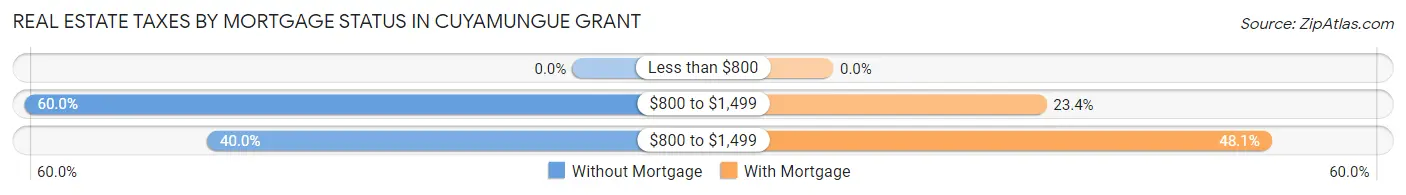
| Property Taxes | Without Mortgage | With Mortgage |
| Less than $800 | 0 (0.0%) | 0 (0.0%) |
| $800 to $1,499 | 12 (60.0%) | 18 (23.4%) |
| $800 to $1,499 | 8 (40.0%) | 37 (48.0%) |
| Total | 20 (100.0%) | 77 (100.0%) |
Health & Disability in Cuyamungue Grant
Health Insurance Coverage by Age in Cuyamungue Grant
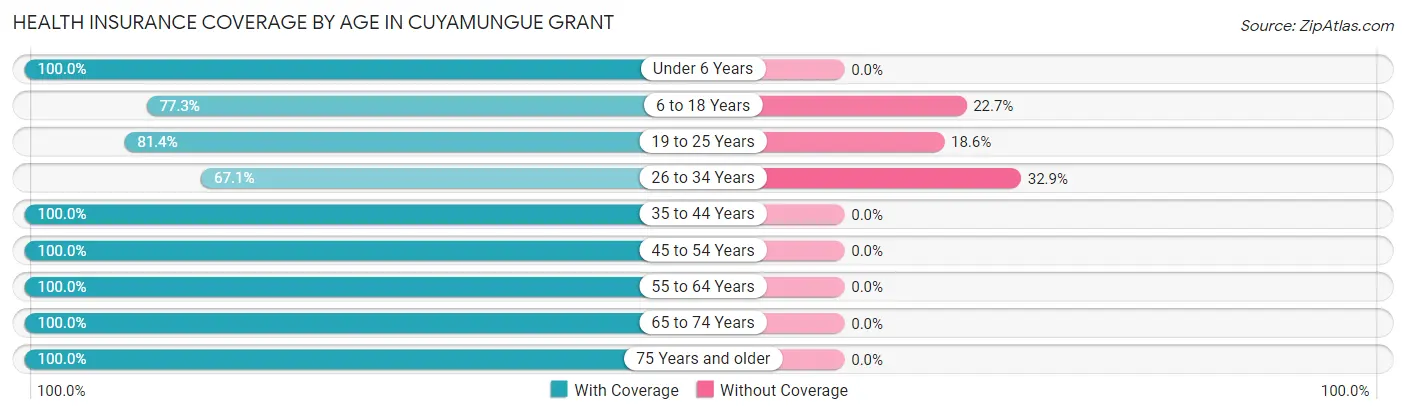
| Age Bracket | With Coverage | Without Coverage |
| Under 6 Years | 17 (100.0%) | 0 (0.0%) |
| 6 to 18 Years | 34 (77.3%) | 10 (22.7%) |
| 19 to 25 Years | 35 (81.4%) | 8 (18.6%) |
| 26 to 34 Years | 53 (67.1%) | 26 (32.9%) |
| 35 to 44 Years | 60 (100.0%) | 0 (0.0%) |
| 45 to 54 Years | 43 (100.0%) | 0 (0.0%) |
| 55 to 64 Years | 44 (100.0%) | 0 (0.0%) |
| 65 to 74 Years | 6 (100.0%) | 0 (0.0%) |
| 75 Years and older | 25 (100.0%) | 0 (0.0%) |
| Total | 317 (87.8%) | 44 (12.2%) |
Health Insurance Coverage by Citizenship Status in Cuyamungue Grant
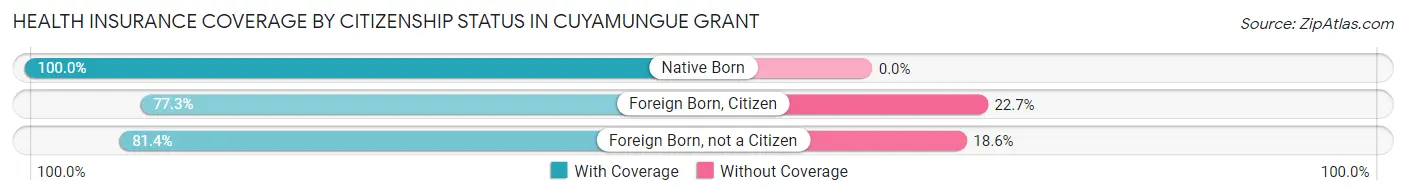
| Citizenship Status | With Coverage | Without Coverage |
| Native Born | 17 (100.0%) | 0 (0.0%) |
| Foreign Born, Citizen | 34 (77.3%) | 10 (22.7%) |
| Foreign Born, not a Citizen | 35 (81.4%) | 8 (18.6%) |
Health Insurance Coverage by Household Income in Cuyamungue Grant
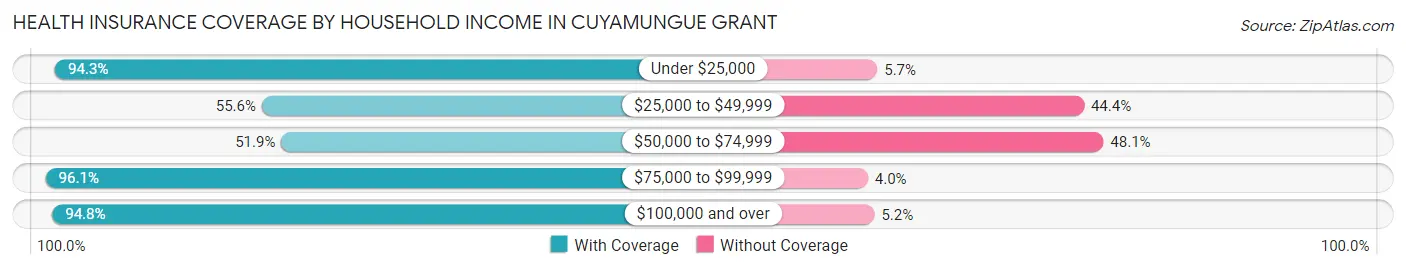
| Household Income | With Coverage | Without Coverage |
| Under $25,000 | 66 (94.3%) | 4 (5.7%) |
| $25,000 to $49,999 | 5 (55.6%) | 4 (44.4%) |
| $50,000 to $74,999 | 27 (51.9%) | 25 (48.1%) |
| $75,000 to $99,999 | 73 (96.1%) | 3 (4.0%) |
| $100,000 and over | 146 (94.8%) | 8 (5.2%) |
Public vs Private Health Insurance Coverage by Age in Cuyamungue Grant
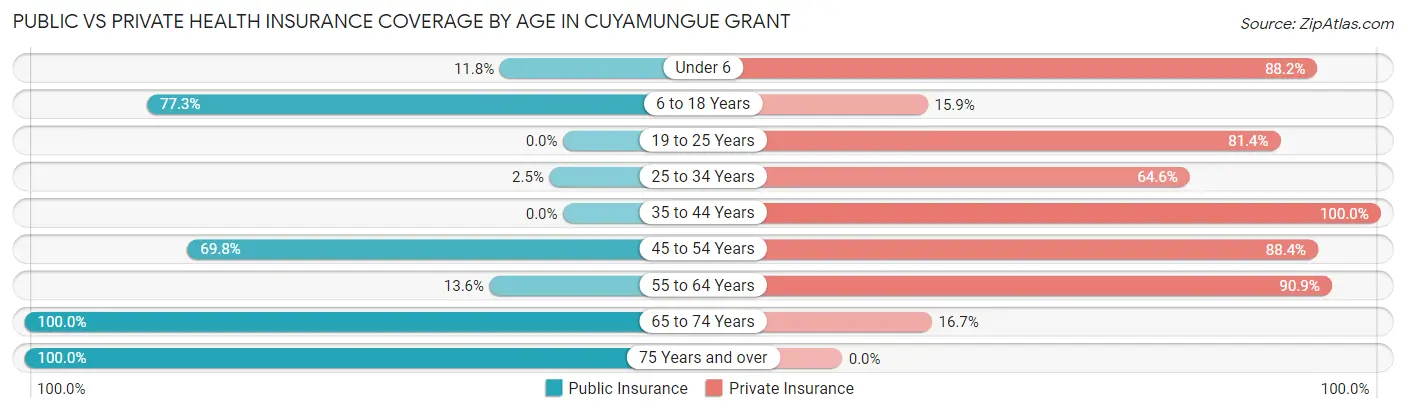
| Age Bracket | Public Insurance | Private Insurance |
| Under 6 | 2 (11.8%) | 15 (88.2%) |
| 6 to 18 Years | 34 (77.3%) | 7 (15.9%) |
| 19 to 25 Years | 0 (0.0%) | 35 (81.4%) |
| 25 to 34 Years | 2 (2.5%) | 51 (64.6%) |
| 35 to 44 Years | 0 (0.0%) | 60 (100.0%) |
| 45 to 54 Years | 30 (69.8%) | 38 (88.4%) |
| 55 to 64 Years | 6 (13.6%) | 40 (90.9%) |
| 65 to 74 Years | 6 (100.0%) | 1 (16.7%) |
| 75 Years and over | 25 (100.0%) | 0 (0.0%) |
| Total | 105 (29.1%) | 247 (68.4%) |
Disability Status by Sex by Age in Cuyamungue Grant
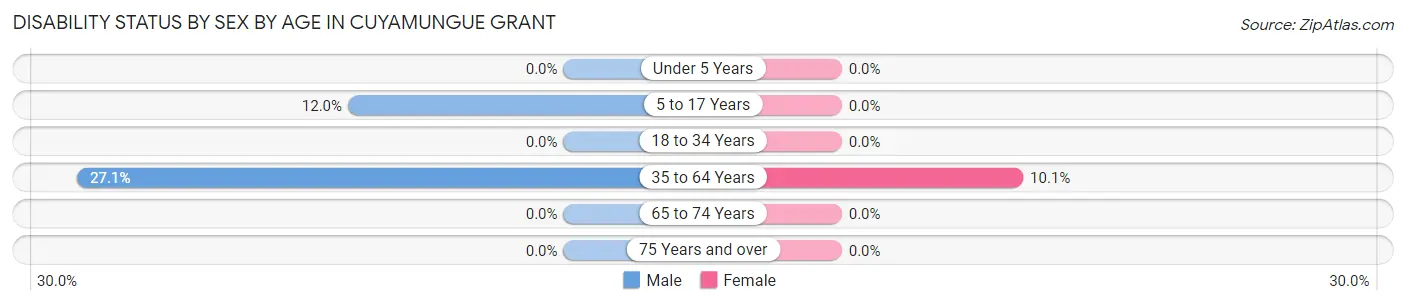
| Age Bracket | Male | Female |
| Under 5 Years | 0 (0.0%) | 0 (0.0%) |
| 5 to 17 Years | 3 (12.0%) | 0 (0.0%) |
| 18 to 34 Years | 0 (0.0%) | 0 (0.0%) |
| 35 to 64 Years | 13 (27.1%) | 10 (10.1%) |
| 65 to 74 Years | 0 (0.0%) | 0 (0.0%) |
| 75 Years and over | 0 (0.0%) | 0 (0.0%) |
Disability Class by Sex by Age in Cuyamungue Grant
Disability Class: Hearing Difficulty
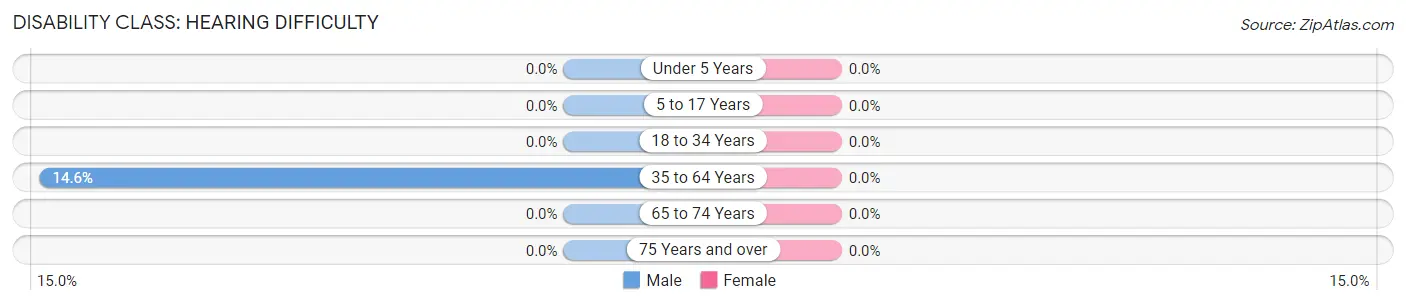
| Age Bracket | Male | Female |
| Under 5 Years | 0 (0.0%) | 0 (0.0%) |
| 5 to 17 Years | 0 (0.0%) | 0 (0.0%) |
| 18 to 34 Years | 0 (0.0%) | 0 (0.0%) |
| 35 to 64 Years | 7 (14.6%) | 0 (0.0%) |
| 65 to 74 Years | 0 (0.0%) | 0 (0.0%) |
| 75 Years and over | 0 (0.0%) | 0 (0.0%) |
Disability Class: Vision Difficulty
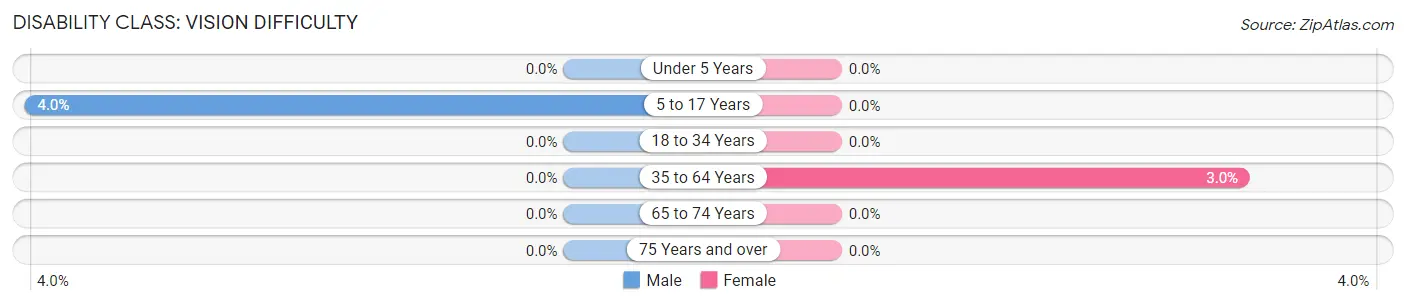
| Age Bracket | Male | Female |
| Under 5 Years | 0 (0.0%) | 0 (0.0%) |
| 5 to 17 Years | 1 (4.0%) | 0 (0.0%) |
| 18 to 34 Years | 0 (0.0%) | 0 (0.0%) |
| 35 to 64 Years | 0 (0.0%) | 3 (3.0%) |
| 65 to 74 Years | 0 (0.0%) | 0 (0.0%) |
| 75 Years and over | 0 (0.0%) | 0 (0.0%) |
Disability Class: Cognitive Difficulty
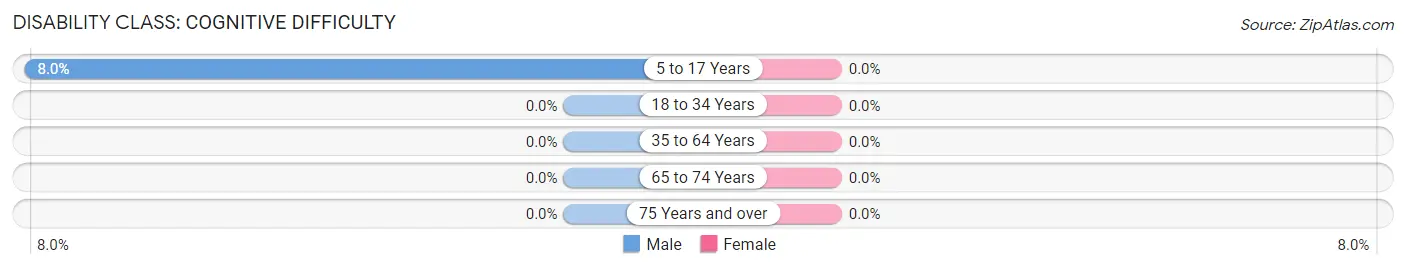
| Age Bracket | Male | Female |
| 5 to 17 Years | 2 (8.0%) | 0 (0.0%) |
| 18 to 34 Years | 0 (0.0%) | 0 (0.0%) |
| 35 to 64 Years | 0 (0.0%) | 0 (0.0%) |
| 65 to 74 Years | 0 (0.0%) | 0 (0.0%) |
| 75 Years and over | 0 (0.0%) | 0 (0.0%) |
Disability Class: Ambulatory Difficulty
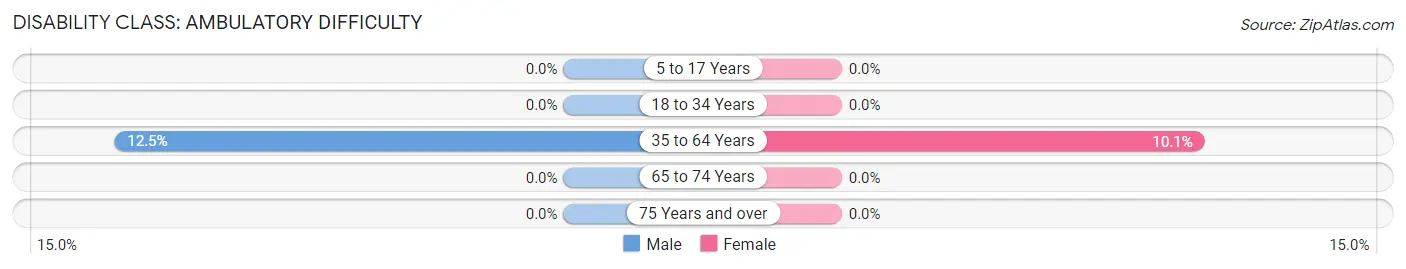
| Age Bracket | Male | Female |
| 5 to 17 Years | 0 (0.0%) | 0 (0.0%) |
| 18 to 34 Years | 0 (0.0%) | 0 (0.0%) |
| 35 to 64 Years | 6 (12.5%) | 10 (10.1%) |
| 65 to 74 Years | 0 (0.0%) | 0 (0.0%) |
| 75 Years and over | 0 (0.0%) | 0 (0.0%) |
Disability Class: Self-Care Difficulty
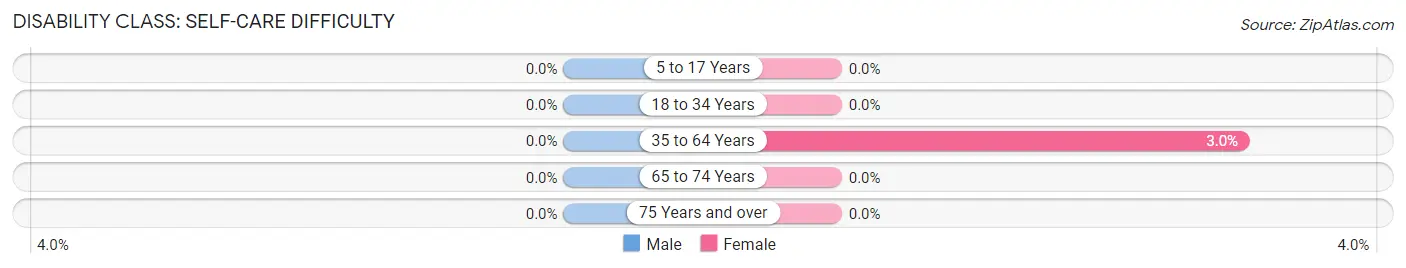
| Age Bracket | Male | Female |
| 5 to 17 Years | 0 (0.0%) | 0 (0.0%) |
| 18 to 34 Years | 0 (0.0%) | 0 (0.0%) |
| 35 to 64 Years | 0 (0.0%) | 3 (3.0%) |
| 65 to 74 Years | 0 (0.0%) | 0 (0.0%) |
| 75 Years and over | 0 (0.0%) | 0 (0.0%) |
Technology Access in Cuyamungue Grant
Computing Device Access in Cuyamungue Grant
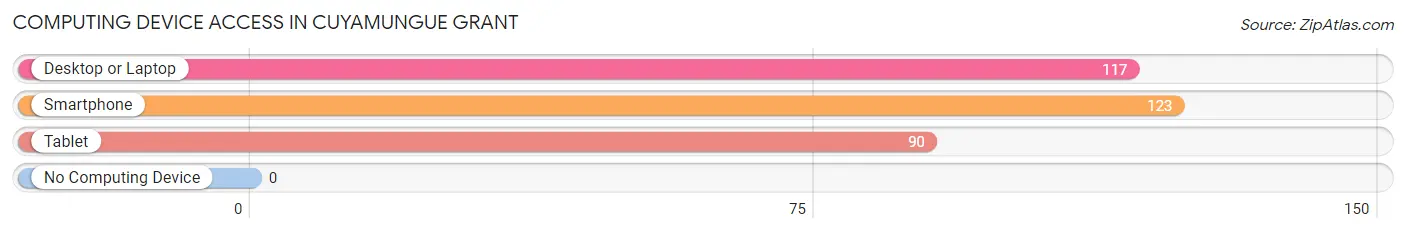
| Device Type | # Households | % Households |
| Desktop or Laptop | 117 | 93.6% |
| Smartphone | 123 | 98.4% |
| Tablet | 90 | 72.0% |
| No Computing Device | 0 | 0.0% |
| Total | 125 | 100.0% |
Internet Access in Cuyamungue Grant
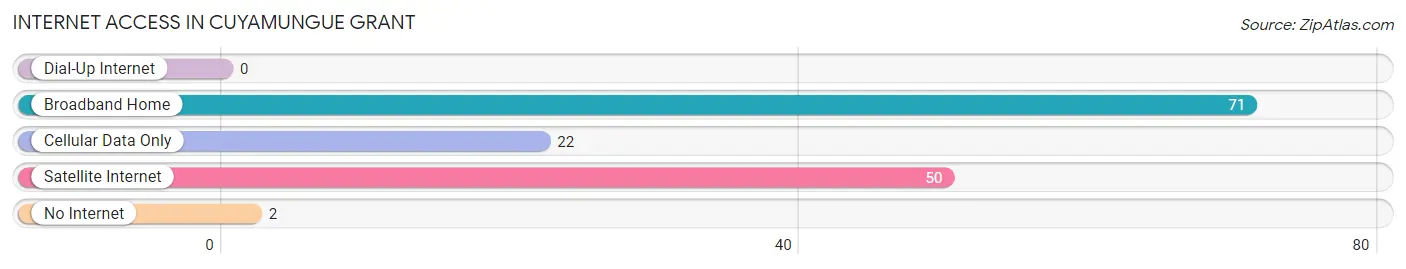
| Internet Type | # Households | % Households |
| Dial-Up Internet | 0 | 0.0% |
| Broadband Home | 71 | 56.8% |
| Cellular Data Only | 22 | 17.6% |
| Satellite Internet | 50 | 40.0% |
| No Internet | 2 | 1.6% |
| Total | 125 | 100.0% |
Cuyamungue Grant Summary
Cuyamungue Grant is a small unincorporated community located in Santa Fe County, New Mexico. It is situated in the foothills of the Sangre de Cristo Mountains, approximately 20 miles north of Santa Fe. The area is known for its rural beauty and is home to a variety of wildlife, including deer, elk, and antelope.
History
The area now known as Cuyamungue Grant was originally inhabited by the Tewa Indians, who lived in the area for centuries before the arrival of the Spanish in the 16th century. The Spanish established a mission in the area in 1610, and the Tewa were forced to relocate to the nearby Pecos Pueblo. In 1848, the Treaty of Guadalupe Hidalgo was signed, which ceded the area to the United States.
In 1876, the United States government granted the area to the Cuyamungue Land Grant, which was established to provide land for the Tewa Indians. The grant was named after the nearby Cuyamungue River, which was named by the Spanish for the Tewa word for “place of the deer”. The grant was intended to provide the Tewa with a place to live and farm, but the land was not suitable for farming and the Tewa were unable to make a living.
In the early 1900s, the area was settled by non-Native Americans, primarily of Spanish and Mexican descent. The settlers established small farms and ranches, and the area began to develop. In the 1950s, the area was annexed by Santa Fe County, and the community of Cuyamungue Grant was established.
Geography
Cuyamungue Grant is located in the foothills of the Sangre de Cristo Mountains, approximately 20 miles north of Santa Fe. The area is characterized by rolling hills, grassy meadows, and pine forests. The Cuyamungue River runs through the area, and the nearby Pecos River provides additional water for the area.
The climate in Cuyamungue Grant is semi-arid, with hot summers and cold winters. The average annual temperature is approximately 55 degrees Fahrenheit, and the average annual precipitation is approximately 12 inches.
Economy
The economy of Cuyamungue Grant is primarily based on agriculture and ranching. The area is home to several small farms and ranches, which produce a variety of crops, including alfalfa, hay, and corn. The area is also home to several small businesses, including a gas station, a grocery store, and a restaurant.
Demographics
As of the 2010 census, the population of Cuyamungue Grant was 1,093. The population is primarily of Hispanic or Latino descent, and the majority of the population speaks Spanish as their primary language. The median household income is approximately $35,000, and the median home value is approximately $150,000.
Conclusion
Cuyamungue Grant is a small unincorporated community located in Santa Fe County, New Mexico. The area is known for its rural beauty and is home to a variety of wildlife. The area was originally inhabited by the Tewa Indians, and was later granted to the Tewa by the United States government. The economy of Cuyamungue Grant is primarily based on agriculture and ranching, and the population is primarily of Hispanic or Latino descent.
Common Questions
What is Per Capita Income in Cuyamungue Grant?
Per Capita income in Cuyamungue Grant is $33,551.
What is the Median Family Income in Cuyamungue Grant?
Median Family Income in Cuyamungue Grant is $101,042.
What is the Median Household income in Cuyamungue Grant?
Median Household Income in Cuyamungue Grant is $91,094.
What is Income or Wage Gap in Cuyamungue Grant?
Income or Wage Gap in Cuyamungue Grant is 62.1%.
Women in Cuyamungue Grant earn 37.9 cents for every dollar earned by a man.
What is Inequality or Gini Index in Cuyamungue Grant?
Inequality or Gini Index in Cuyamungue Grant is 0.31.
What is the Total Population of Cuyamungue Grant?
Total Population of Cuyamungue Grant is 361.
What is the Total Male Population of Cuyamungue Grant?
Total Male Population of Cuyamungue Grant is 172.
What is the Total Female Population of Cuyamungue Grant?
Total Female Population of Cuyamungue Grant is 189.
What is the Ratio of Males per 100 Females in Cuyamungue Grant?
There are 91.01 Males per 100 Females in Cuyamungue Grant.
What is the Ratio of Females per 100 Males in Cuyamungue Grant?
There are 109.88 Females per 100 Males in Cuyamungue Grant.
What is the Median Population Age in Cuyamungue Grant?
Median Population Age in Cuyamungue Grant is 33.6 Years.
What is the Average Family Size in Cuyamungue Grant
Average Family Size in Cuyamungue Grant is 3.3 People.
What is the Average Household Size in Cuyamungue Grant
Average Household Size in Cuyamungue Grant is 2.9 People.
How Large is the Labor Force in Cuyamungue Grant?
There are 257 People in the Labor Forcein in Cuyamungue Grant.
What is the Percentage of People in the Labor Force in Cuyamungue Grant?
82.9% of People are in the Labor Force in Cuyamungue Grant.
What is the Unemployment Rate in Cuyamungue Grant?
Unemployment Rate in Cuyamungue Grant is 7.0%.