Keeler Farm, NM Map & Demographics
Keeler Farm Map
Keeler Farm Overview
$17,779
PER CAPITA INCOME
$36,615
AVG FAMILY INCOME
$49,231
AVG HOUSEHOLD INCOME
73.6%
WAGE / INCOME GAP [ % ]
26.4¢/ $1
WAGE / INCOME GAP [ $ ]
0.38
INEQUALITY / GINI INDEX
1,716
TOTAL POPULATION
975
MALE POPULATION
741
FEMALE POPULATION
131.58
MALES / 100 FEMALES
76.00
FEMALES / 100 MALES
27.9
MEDIAN AGE
5.0
AVG FAMILY SIZE
3.5
AVG HOUSEHOLD SIZE
503
LABOR FORCE [ PEOPLE ]
45.8%
PERCENT IN LABOR FORCE
21.3%
UNEMPLOYMENT RATE
Income in Keeler Farm
Income Overview in Keeler Farm
Per Capita Income in Keeler Farm is $17,779, while median incomes of families and households are $36,615 and $49,231 respectively.
| Characteristic | Number | Measure |
| Per Capita Income | 1,716 | $17,779 |
| Median Family Income | 283 | $36,615 |
| Mean Family Income | 283 | $56,548 |
| Median Household Income | 490 | $49,231 |
| Mean Household Income | 490 | $57,017 |
| Income Deficit | 283 | $0 |
| Wage / Income Gap (%) | 1,716 | 73.62% |
| Wage / Income Gap ($) | 1,716 | 26.38¢ per $1 |
| Gini / Inequality Index | 1,716 | 0.38 |
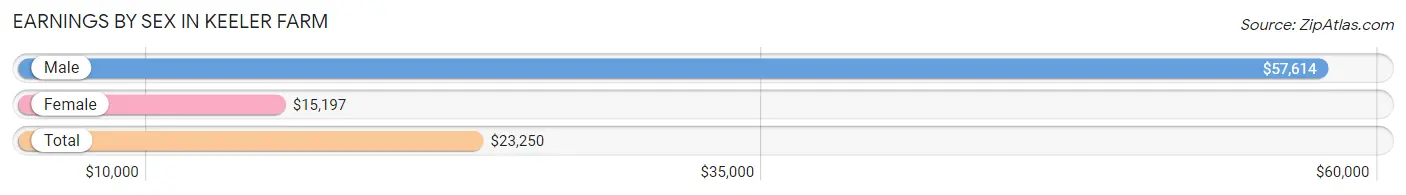
Earnings by Sex in Keeler Farm
Average Earnings in Keeler Farm are $23,250, $57,614 for men and $15,197 for women, a difference of 73.6%.
| Sex | Number | Average Earnings |
| Male | 287 (47.9%) | $57,614 |
| Female | 312 (52.1%) | $15,197 |
| Total | 599 (100.0%) | $23,250 |
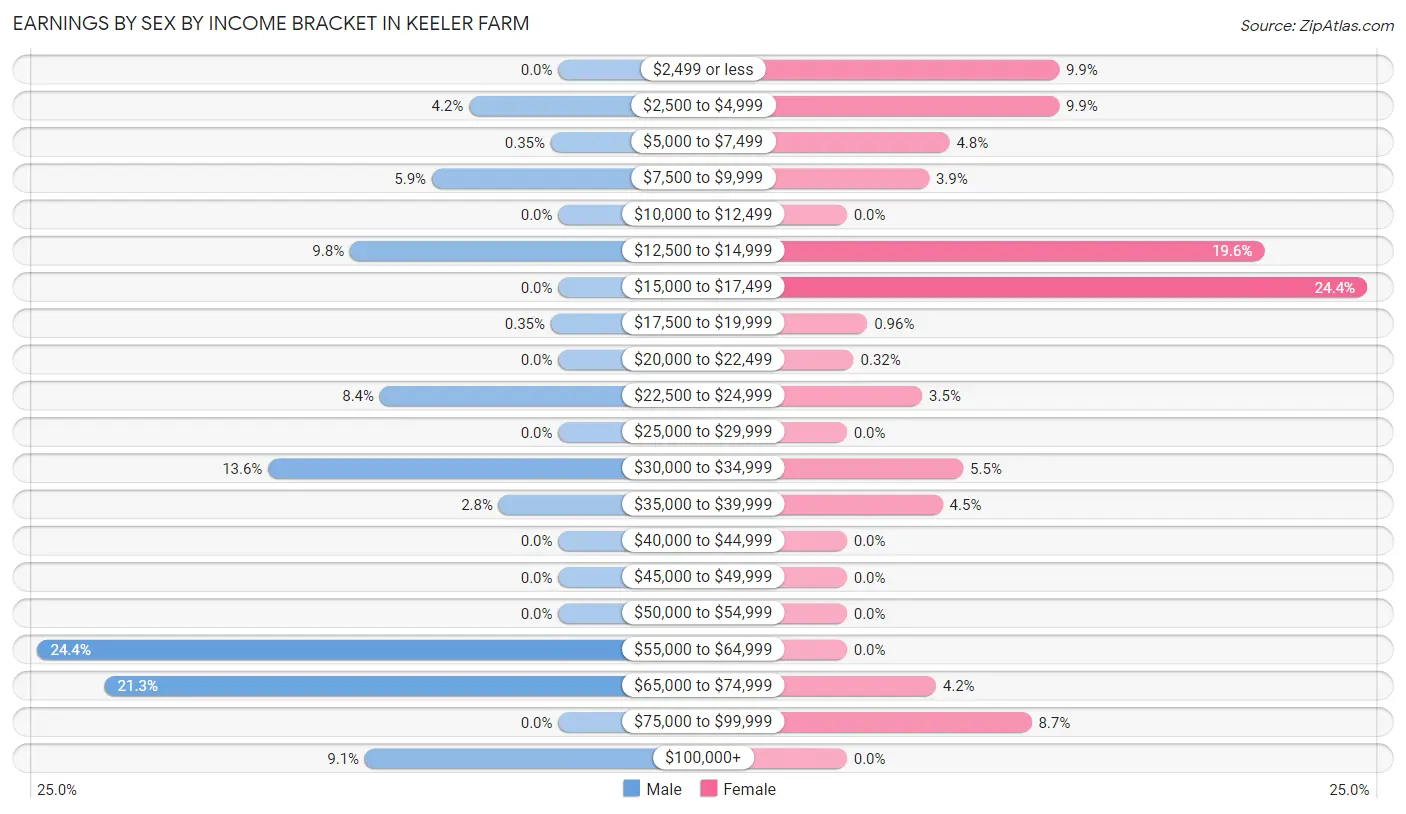
Earnings by Sex by Income Bracket in Keeler Farm
The most common earnings brackets in Keeler Farm are $55,000 to $64,999 for men (70 | 24.4%) and $15,000 to $17,499 for women (76 | 24.4%).
| Income | Male | Female |
| $2,499 or less | 0 (0.0%) | 31 (9.9%) |
| $2,500 to $4,999 | 12 (4.2%) | 31 (9.9%) |
| $5,000 to $7,499 | 1 (0.4%) | 15 (4.8%) |
| $7,500 to $9,999 | 17 (5.9%) | 12 (3.8%) |
| $10,000 to $12,499 | 0 (0.0%) | 0 (0.0%) |
| $12,500 to $14,999 | 28 (9.8%) | 61 (19.6%) |
| $15,000 to $17,499 | 0 (0.0%) | 76 (24.4%) |
| $17,500 to $19,999 | 1 (0.4%) | 3 (1.0%) |
| $20,000 to $22,499 | 0 (0.0%) | 1 (0.3%) |
| $22,500 to $24,999 | 24 (8.4%) | 11 (3.5%) |
| $25,000 to $29,999 | 0 (0.0%) | 0 (0.0%) |
| $30,000 to $34,999 | 39 (13.6%) | 17 (5.4%) |
| $35,000 to $39,999 | 8 (2.8%) | 14 (4.5%) |
| $40,000 to $44,999 | 0 (0.0%) | 0 (0.0%) |
| $45,000 to $49,999 | 0 (0.0%) | 0 (0.0%) |
| $50,000 to $54,999 | 0 (0.0%) | 0 (0.0%) |
| $55,000 to $64,999 | 70 (24.4%) | 0 (0.0%) |
| $65,000 to $74,999 | 61 (21.2%) | 13 (4.2%) |
| $75,000 to $99,999 | 0 (0.0%) | 27 (8.6%) |
| $100,000+ | 26 (9.1%) | 0 (0.0%) |
| Total | 287 (100.0%) | 312 (100.0%) |
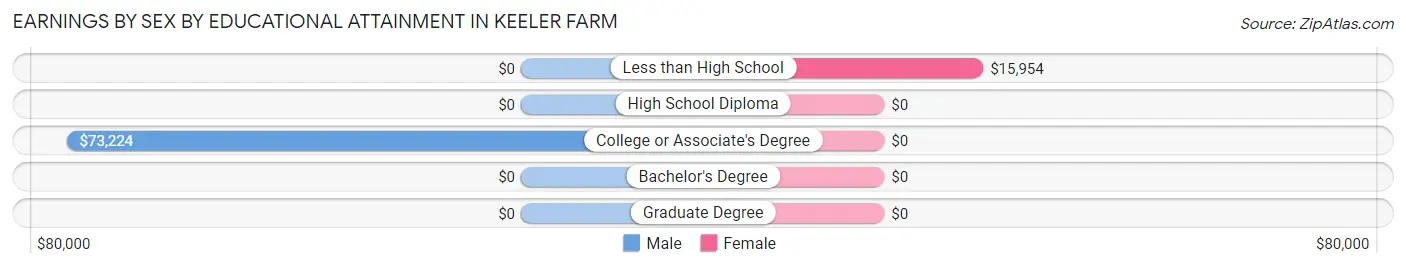
Earnings by Sex by Educational Attainment in Keeler Farm
Average earnings in Keeler Farm are $58,295 for men and $15,888 for women, a difference of 72.8%. Men with an educational attainment of college or associate's degree enjoy the highest average annual earnings of $73,224, while those with college or associate's degree education earn the least with $73,224. Women with an educational attainment of less than high school earn the most with the average annual earnings of $15,954, while those with less than high school education have the smallest earnings of $15,954.
| Educational Attainment | Male Income | Female Income |
| Less than High School | - | - |
| High School Diploma | - | - |
| College or Associate's Degree | $73,224 | $0 |
| Bachelor's Degree | - | - |
| Graduate Degree | - | - |
| Total | $58,295 | $15,888 |
Family Income in Keeler Farm
Family Income Brackets in Keeler Farm
According to the Keeler Farm family income data, there are 64 families falling into the $15,000 to $24,999 income range, which is the most common income bracket and makes up 22.6% of all families.
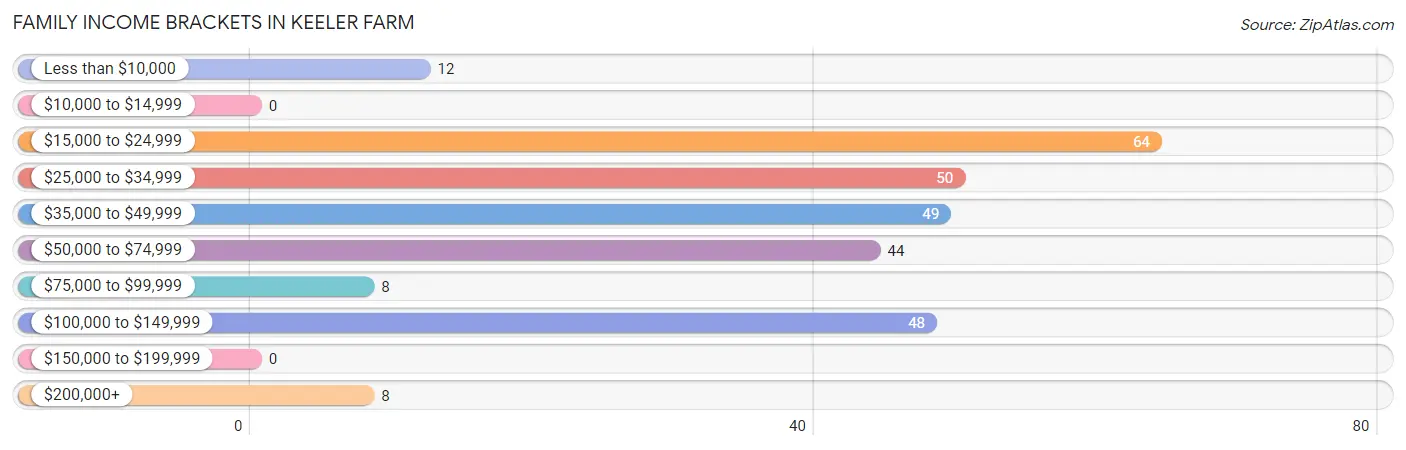
| Income Bracket | # Families | % Families |
| Less than $10,000 | 12 | 4.2% |
| $10,000 to $14,999 | 0 | 0.0% |
| $15,000 to $24,999 | 64 | 22.6% |
| $25,000 to $34,999 | 50 | 17.7% |
| $35,000 to $49,999 | 49 | 17.3% |
| $50,000 to $74,999 | 44 | 15.5% |
| $75,000 to $99,999 | 8 | 2.8% |
| $100,000 to $149,999 | 48 | 17.0% |
| $150,000 to $199,999 | 0 | 0.0% |
| $200,000+ | 8 | 2.8% |
Family Income by Famaliy Size in Keeler Farm
4-person families (56 | 19.8%) account for the highest median family income in Keeler Farm with $52,222 per family, while 4-person families (56 | 19.8%) have the highest median income of $13,056 per family member.
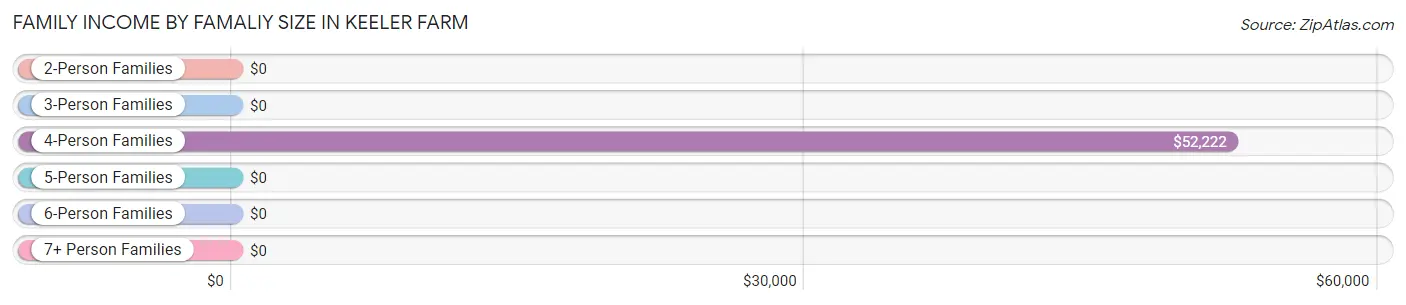
| Income Bracket | # Families | Median Income |
| 2-Person Families | 69 (24.4%) | $0 |
| 3-Person Families | 74 (26.2%) | $0 |
| 4-Person Families | 56 (19.8%) | $52,222 |
| 5-Person Families | 9 (3.2%) | $0 |
| 6-Person Families | 71 (25.1%) | $0 |
| 7+ Person Families | 4 (1.4%) | $0 |
| Total | 283 (100.0%) | $36,615 |
Family Income by Number of Earners in Keeler Farm
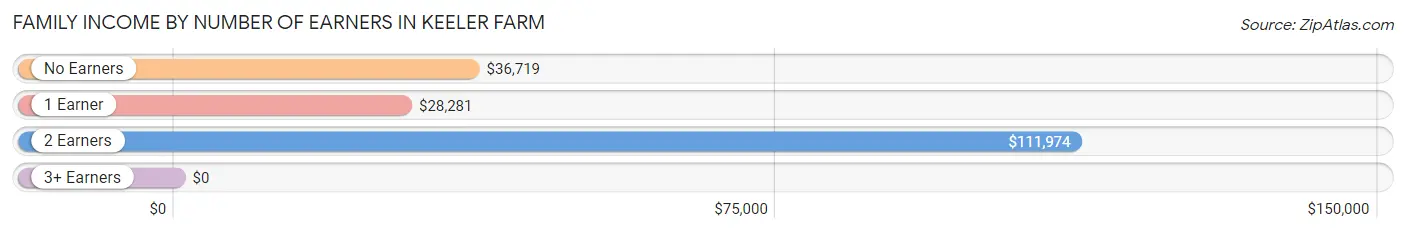
| Number of Earners | # Families | Median Income |
| No Earners | 35 (12.4%) | $36,719 |
| 1 Earner | 160 (56.5%) | $28,281 |
| 2 Earners | 58 (20.5%) | $111,974 |
| 3+ Earners | 30 (10.6%) | $0 |
| Total | 283 (100.0%) | $36,615 |
Household Income in Keeler Farm
Household Income Brackets in Keeler Farm
With 163 households falling in the category, the $50,000 to $74,999 income range is the most frequent in Keeler Farm, accounting for 33.3% of all households.
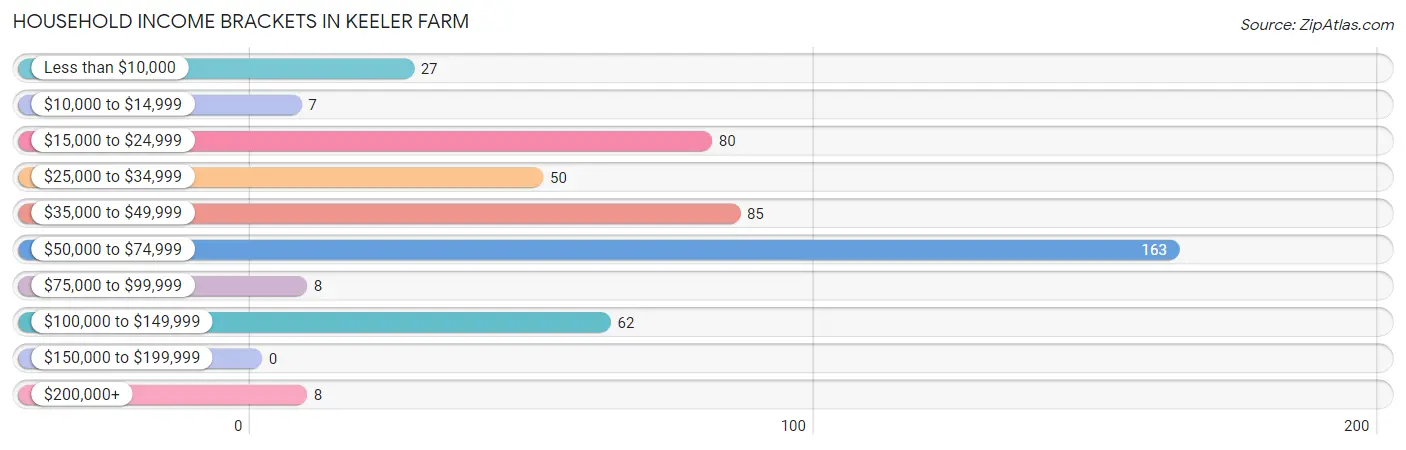
| Income Bracket | # Households | % Households |
| Less than $10,000 | 27 | 5.5% |
| $10,000 to $14,999 | 7 | 1.4% |
| $15,000 to $24,999 | 80 | 16.3% |
| $25,000 to $34,999 | 50 | 10.2% |
| $35,000 to $49,999 | 85 | 17.3% |
| $50,000 to $74,999 | 163 | 33.3% |
| $75,000 to $99,999 | 8 | 1.6% |
| $100,000 to $149,999 | 62 | 12.7% |
| $150,000 to $199,999 | 0 | 0.0% |
| $200,000+ | 8 | 1.6% |
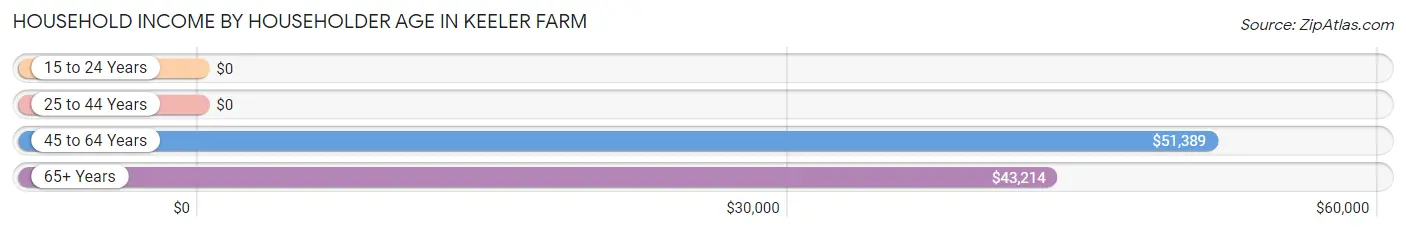
Household Income by Householder Age in Keeler Farm
The median household income in Keeler Farm is $49,231, with the highest median household income of $51,389 found in the 45 to 64 years age bracket for the primary householder. A total of 130 households (26.5%) fall into this category.
| Income Bracket | # Households | Median Income |
| 15 to 24 Years | 0 (0.0%) | $0 |
| 25 to 44 Years | 220 (44.9%) | $0 |
| 45 to 64 Years | 130 (26.5%) | $51,389 |
| 65+ Years | 140 (28.6%) | $43,214 |
| Total | 490 (100.0%) | $49,231 |
Poverty in Keeler Farm
Income Below Poverty by Sex and Age in Keeler Farm
With 35.8% poverty level for males and 35.2% for females among the residents of Keeler Farm, under 5 year old males and under 5 year old females are the most vulnerable to poverty, with 16 males (100.0%) and 153 females (81.8%) in their respective age groups living below the poverty level.
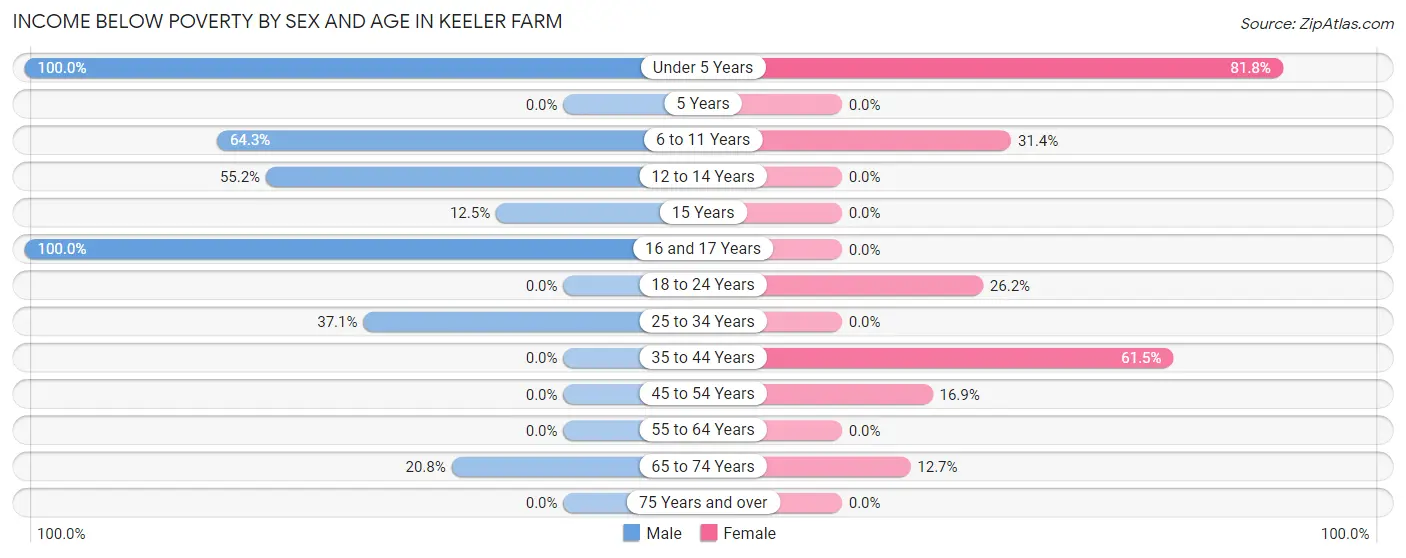
| Age Bracket | Male | Female |
| Under 5 Years | 16 (100.0%) | 153 (81.8%) |
| 5 Years | 0 (0.0%) | 0 (0.0%) |
| 6 to 11 Years | 135 (64.3%) | 11 (31.4%) |
| 12 to 14 Years | 69 (55.2%) | 0 (0.0%) |
| 15 Years | 2 (12.5%) | 0 (0.0%) |
| 16 and 17 Years | 77 (100.0%) | 0 (0.0%) |
| 18 to 24 Years | 0 (0.0%) | 11 (26.2%) |
| 25 to 34 Years | 39 (37.1%) | 0 (0.0%) |
| 35 to 44 Years | 0 (0.0%) | 64 (61.5%) |
| 45 to 54 Years | 0 (0.0%) | 15 (16.9%) |
| 55 to 64 Years | 0 (0.0%) | 0 (0.0%) |
| 65 to 74 Years | 11 (20.7%) | 7 (12.7%) |
| 75 Years and over | 0 (0.0%) | 0 (0.0%) |
| Total | 349 (35.8%) | 261 (35.2%) |
Income Above Poverty by Sex and Age in Keeler Farm
According to the poverty statistics in Keeler Farm, males aged 18 to 24 years and females aged 12 to 14 years are the age groups that are most secure financially, with 100.0% of males and 100.0% of females in these age groups living above the poverty line.
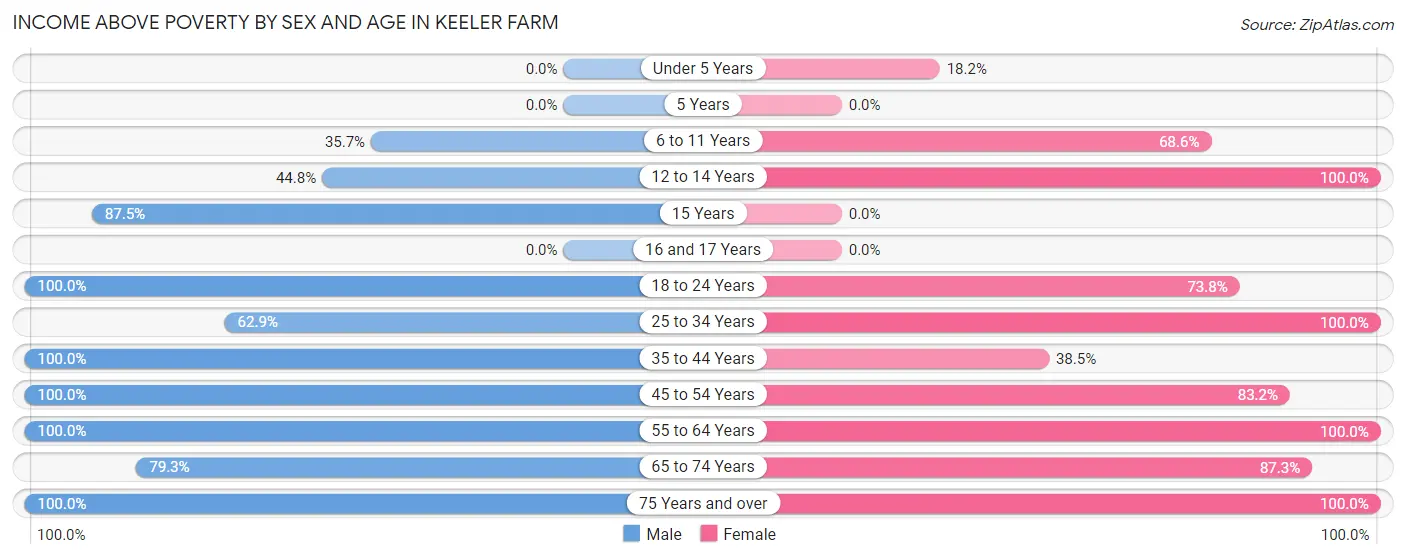
| Age Bracket | Male | Female |
| Under 5 Years | 0 (0.0%) | 34 (18.2%) |
| 5 Years | 0 (0.0%) | 0 (0.0%) |
| 6 to 11 Years | 75 (35.7%) | 24 (68.6%) |
| 12 to 14 Years | 56 (44.8%) | 28 (100.0%) |
| 15 Years | 14 (87.5%) | 0 (0.0%) |
| 16 and 17 Years | 0 (0.0%) | 0 (0.0%) |
| 18 to 24 Years | 30 (100.0%) | 31 (73.8%) |
| 25 to 34 Years | 66 (62.9%) | 141 (100.0%) |
| 35 to 44 Years | 73 (100.0%) | 40 (38.5%) |
| 45 to 54 Years | 86 (100.0%) | 74 (83.2%) |
| 55 to 64 Years | 50 (100.0%) | 43 (100.0%) |
| 65 to 74 Years | 42 (79.2%) | 48 (87.3%) |
| 75 Years and over | 134 (100.0%) | 17 (100.0%) |
| Total | 626 (64.2%) | 480 (64.8%) |
Income Below Poverty Among Married-Couple Families in Keeler Farm
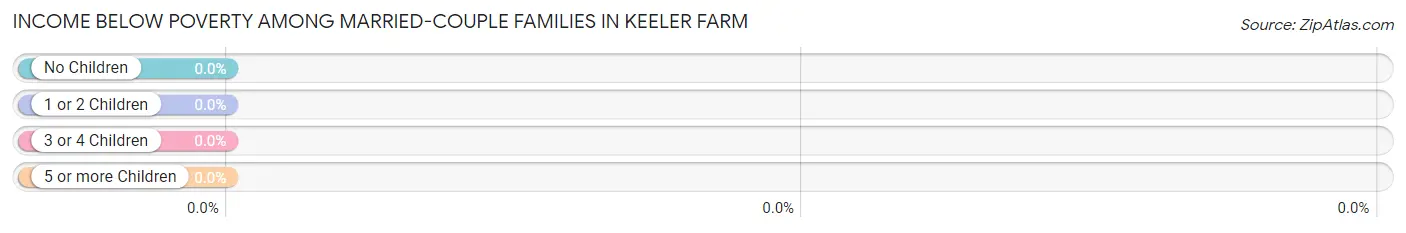
| Children | Above Poverty | Below Poverty |
| No Children | 72 (100.0%) | 0 (0.0%) |
| 1 or 2 Children | 37 (100.0%) | 0 (0.0%) |
| 3 or 4 Children | 8 (100.0%) | 0 (0.0%) |
| 5 or more Children | 0 (0.0%) | 0 (0.0%) |
| Total | 117 (100.0%) | 0 (0.0%) |
Income Below Poverty Among Single-Parent Households in Keeler Farm
According to the poverty data in Keeler Farm, 14.5% or 12 single-father households and 77.1% or 64 single-mother households are living below the poverty line. Among single-father households, those with 3 or 4 children have the highest poverty rate, with 12 households (100.0%) experiencing poverty. Likewise, among single-mother households, those with 3 or 4 children have the highest poverty rate, with 1 households (100.0%) falling below the poverty line.
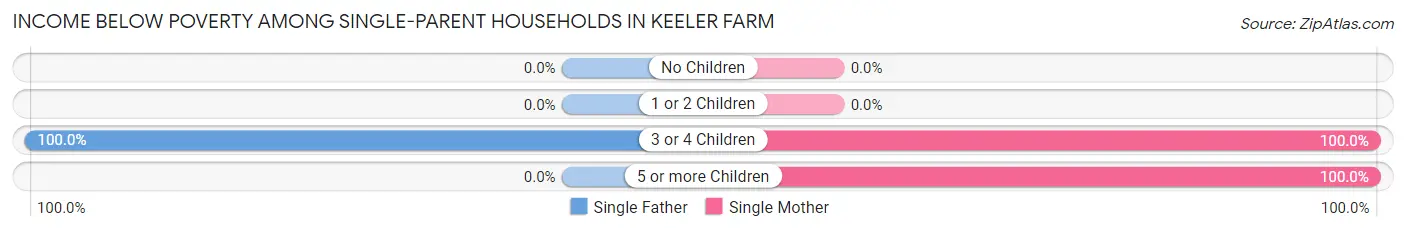
| Children | Single Father | Single Mother |
| No Children | 0 (0.0%) | 0 (0.0%) |
| 1 or 2 Children | 0 (0.0%) | 0 (0.0%) |
| 3 or 4 Children | 12 (100.0%) | 1 (100.0%) |
| 5 or more Children | 0 (0.0%) | 63 (100.0%) |
| Total | 12 (14.5%) | 64 (77.1%) |
Income Below Poverty Among Married-Couple vs Single-Parent Households in Keeler Farm
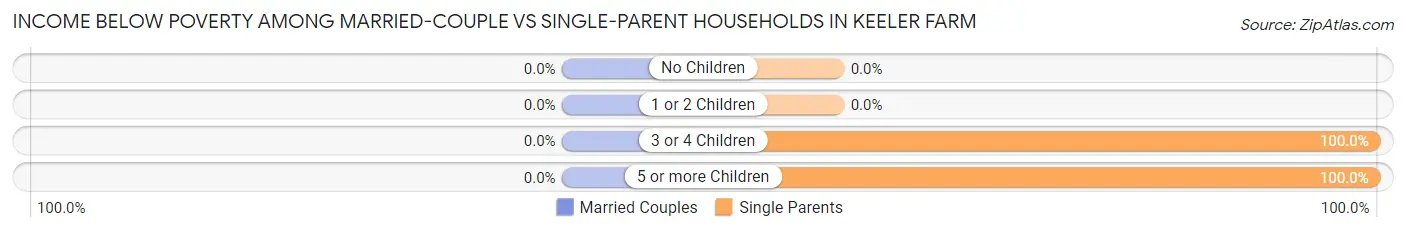
| Children | Married-Couple Families | Single-Parent Households |
| No Children | 0 (0.0%) | 0 (0.0%) |
| 1 or 2 Children | 0 (0.0%) | 0 (0.0%) |
| 3 or 4 Children | 0 (0.0%) | 13 (100.0%) |
| 5 or more Children | 0 (0.0%) | 63 (100.0%) |
| Total | 0 (0.0%) | 76 (45.8%) |
Race in Keeler Farm
The most populous races in Keeler Farm are White / Caucasian (1,109 | 64.6%), Hispanic or Latino (989 | 57.6%), and Two or more Races (552 | 32.2%).
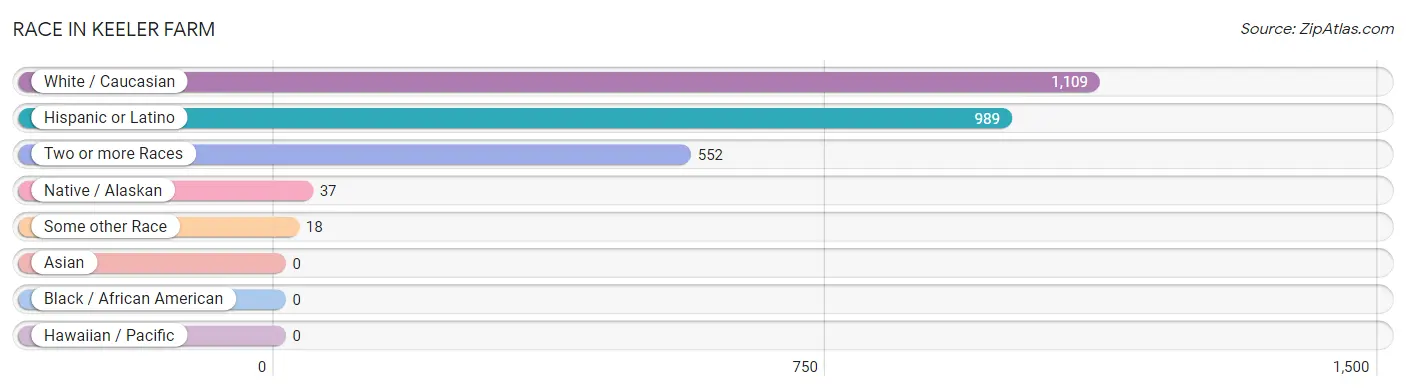
| Race | # Population | % Population |
| Asian | 0 | 0.0% |
| Black / African American | 0 | 0.0% |
| Hawaiian / Pacific | 0 | 0.0% |
| Hispanic or Latino | 989 | 57.6% |
| Native / Alaskan | 37 | 2.2% |
| White / Caucasian | 1,109 | 64.6% |
| Two or more Races | 552 | 32.2% |
| Some other Race | 18 | 1.1% |
| Total | 1,716 | 100.0% |
Ancestry in Keeler Farm
The most populous ancestries reported in Keeler Farm are Mexican (989 | 57.6%), Irish (266 | 15.5%), English (186 | 10.8%), German (100 | 5.8%), and American (75 | 4.4%), together accounting for 94.2% of all Keeler Farm residents.
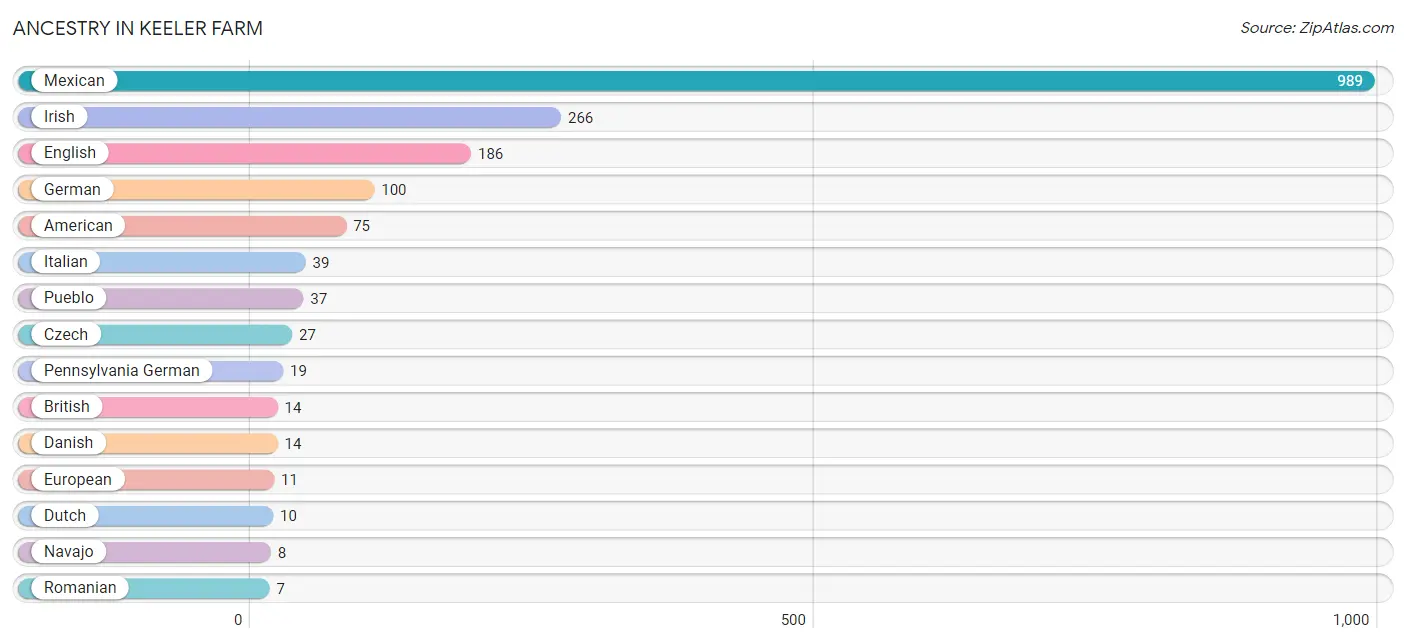
| Ancestry | # Population | % Population |
| American | 75 | 4.4% |
| Blackfeet | 1 | 0.1% |
| British | 14 | 0.8% |
| Cherokee | 1 | 0.1% |
| Choctaw | 1 | 0.1% |
| Czech | 27 | 1.6% |
| Danish | 14 | 0.8% |
| Dutch | 10 | 0.6% |
| English | 186 | 10.8% |
| European | 11 | 0.6% |
| German | 100 | 5.8% |
| Irish | 266 | 15.5% |
| Italian | 39 | 2.3% |
| Mexican | 989 | 57.6% |
| Navajo | 8 | 0.5% |
| Pennsylvania German | 19 | 1.1% |
| Pueblo | 37 | 2.2% |
| Romanian | 7 | 0.4% |
| Russian | 2 | 0.1% | View All 19 Rows |
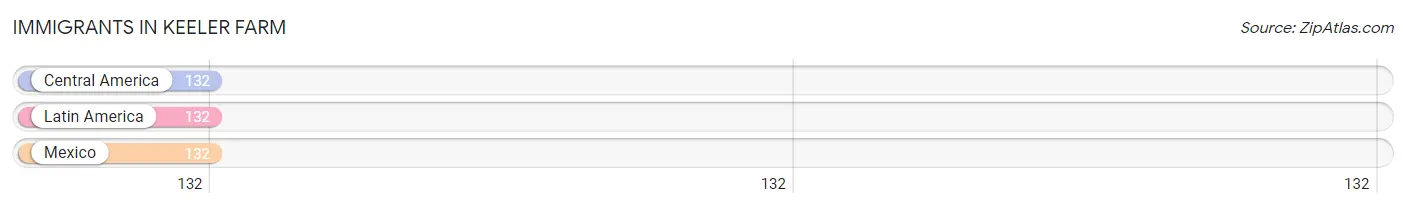
Immigrants in Keeler Farm
The most numerous immigrant groups reported in Keeler Farm came from Central America (132 | 7.7%), Latin America (132 | 7.7%), and Mexico (132 | 7.7%), together accounting for 23.1% of all Keeler Farm residents.
| Immigration Origin | # Population | % Population |
| Central America | 132 | 7.7% |
| Latin America | 132 | 7.7% |
| Mexico | 132 | 7.7% | View All 3 Rows |
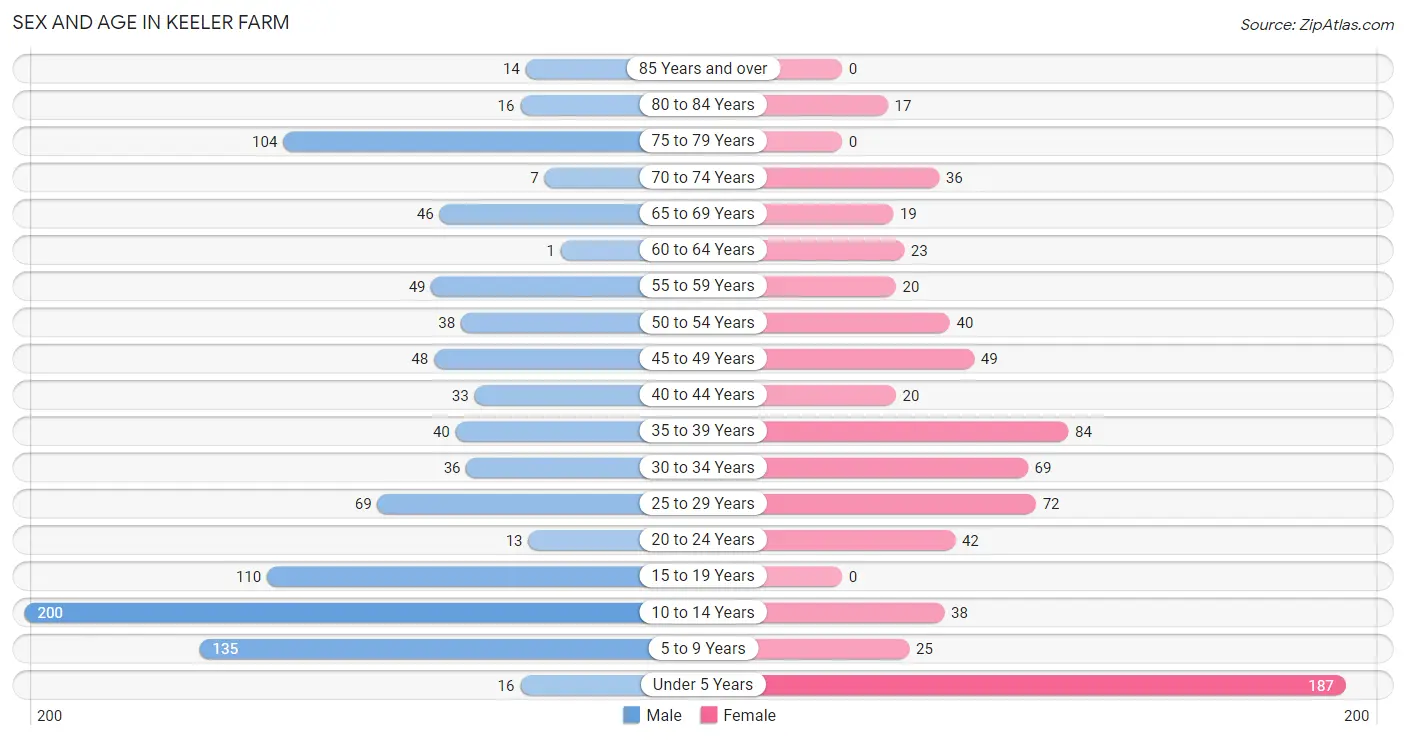
Sex and Age in Keeler Farm
Sex and Age in Keeler Farm
The most populous age groups in Keeler Farm are 10 to 14 Years (200 | 20.5%) for men and Under 5 Years (187 | 25.2%) for women.
| Age Bracket | Male | Female |
| Under 5 Years | 16 (1.6%) | 187 (25.2%) |
| 5 to 9 Years | 135 (13.9%) | 25 (3.4%) |
| 10 to 14 Years | 200 (20.5%) | 38 (5.1%) |
| 15 to 19 Years | 110 (11.3%) | 0 (0.0%) |
| 20 to 24 Years | 13 (1.3%) | 42 (5.7%) |
| 25 to 29 Years | 69 (7.1%) | 72 (9.7%) |
| 30 to 34 Years | 36 (3.7%) | 69 (9.3%) |
| 35 to 39 Years | 40 (4.1%) | 84 (11.3%) |
| 40 to 44 Years | 33 (3.4%) | 20 (2.7%) |
| 45 to 49 Years | 48 (4.9%) | 49 (6.6%) |
| 50 to 54 Years | 38 (3.9%) | 40 (5.4%) |
| 55 to 59 Years | 49 (5.0%) | 20 (2.7%) |
| 60 to 64 Years | 1 (0.1%) | 23 (3.1%) |
| 65 to 69 Years | 46 (4.7%) | 19 (2.6%) |
| 70 to 74 Years | 7 (0.7%) | 36 (4.9%) |
| 75 to 79 Years | 104 (10.7%) | 0 (0.0%) |
| 80 to 84 Years | 16 (1.6%) | 17 (2.3%) |
| 85 Years and over | 14 (1.4%) | 0 (0.0%) |
| Total | 975 (100.0%) | 741 (100.0%) |
Families and Households in Keeler Farm
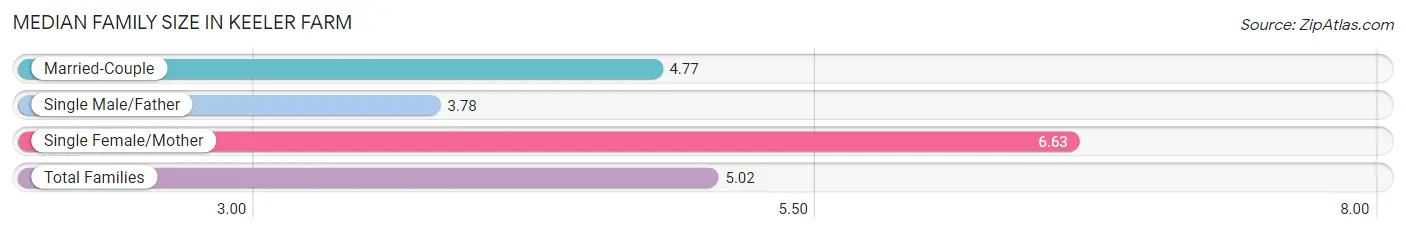
Median Family Size in Keeler Farm
The median family size in Keeler Farm is 5.02 persons per family, with single female/mother families (83 | 29.3%) accounting for the largest median family size of 6.63 persons per family. On the other hand, single male/father families (83 | 29.3%) represent the smallest median family size with 3.78 persons per family.
| Family Type | # Families | Family Size |
| Married-Couple | 117 (41.3%) | 4.77 |
| Single Male/Father | 83 (29.3%) | 3.78 |
| Single Female/Mother | 83 (29.3%) | 6.63 |
| Total Families | 283 (100.0%) | 5.02 |
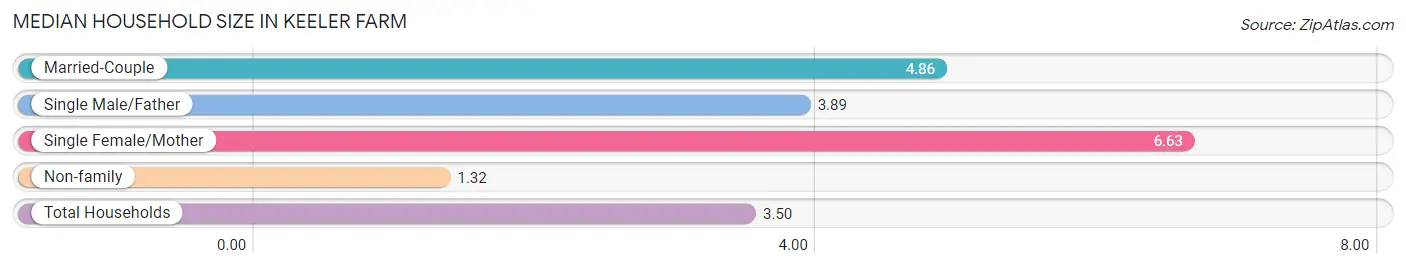
Median Household Size in Keeler Farm
The median household size in Keeler Farm is 3.50 persons per household, with single female/mother households (83 | 16.9%) accounting for the largest median household size of 6.63 persons per household. non-family households (207 | 42.2%) represent the smallest median household size with 1.32 persons per household.
| Household Type | # Households | Household Size |
| Married-Couple | 117 (23.9%) | 4.86 |
| Single Male/Father | 83 (16.9%) | 3.89 |
| Single Female/Mother | 83 (16.9%) | 6.63 |
| Non-family | 207 (42.2%) | 1.32 |
| Total Households | 490 (100.0%) | 3.50 |
Household Size by Marriage Status in Keeler Farm
Out of a total of 490 households in Keeler Farm, 283 (57.8%) are family households, while 207 (42.2%) are nonfamily households. The most numerous type of family households are 3-person households, comprising 84, and the most common type of nonfamily households are 1-person households, comprising 166.
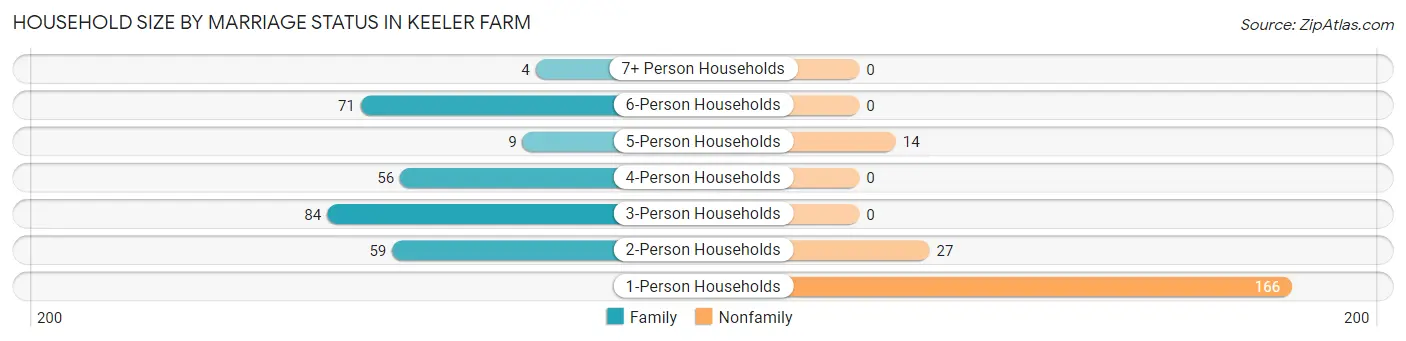
| Household Size | Family Households | Nonfamily Households |
| 1-Person Households | - | 166 (33.9%) |
| 2-Person Households | 59 (12.0%) | 27 (5.5%) |
| 3-Person Households | 84 (17.1%) | 0 (0.0%) |
| 4-Person Households | 56 (11.4%) | 0 (0.0%) |
| 5-Person Households | 9 (1.8%) | 14 (2.9%) |
| 6-Person Households | 71 (14.5%) | 0 (0.0%) |
| 7+ Person Households | 4 (0.8%) | 0 (0.0%) |
| Total | 283 (57.8%) | 207 (42.2%) |
Female Fertility in Keeler Farm
Fertility by Age in Keeler Farm
| Age Bracket | Women with Births | Births / 1,000 Women |
| 15 to 19 years | 0 (0.0%) | 0.0 |
| 20 to 34 years | 0 (0.0%) | 0.0 |
| 35 to 50 years | 0 (0.0%) | 0.0 |
| Total | 0 (0.0%) | 0.0 |
Fertility by Age by Marriage Status in Keeler Farm
| Age Bracket | Married | Unmarried |
| 15 to 19 years | 0 (0.0%) | 0 (0.0%) |
| 20 to 34 years | 0 (0.0%) | 0 (0.0%) |
| 35 to 50 years | 0 (0.0%) | 0 (0.0%) |
| Total | 0 (0.0%) | 0 (0.0%) |
Fertility by Education in Keeler Farm
| Educational Attainment | Women with Births | Births / 1,000 Women |
| Less than High School | 0 (0.0%) | 0.0 |
| High School Diploma | 0 (0.0%) | 0.0 |
| College or Associate's Degree | 0 (0.0%) | 0.0 |
| Bachelor's Degree | 0 (0.0%) | 0.0 |
| Graduate Degree | 0 (0.0%) | 0.0 |
| Total | 0 (0.0%) | 0.0 |
Fertility by Education by Marriage Status in Keeler Farm
| Educational Attainment | Married | Unmarried |
| Less than High School | 0 (0.0%) | 0 (0.0%) |
| High School Diploma | 0 (0.0%) | 0 (0.0%) |
| College or Associate's Degree | 0 (0.0%) | 0 (0.0%) |
| Bachelor's Degree | 0 (0.0%) | 0 (0.0%) |
| Graduate Degree | 0 (0.0%) | 0 (0.0%) |
| Total | 0 (0.0%) | 0 (0.0%) |
Employment Characteristics in Keeler Farm
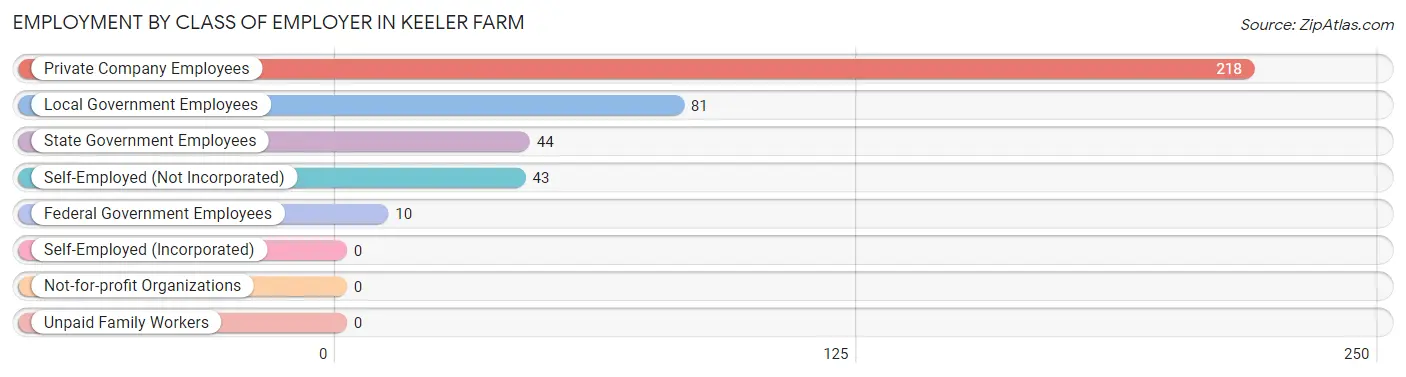
Employment by Class of Employer in Keeler Farm
Among the 396 employed individuals in Keeler Farm, private company employees (218 | 55.0%), local government employees (81 | 20.4%), and state government employees (44 | 11.1%) make up the most common classes of employment.
| Employer Class | # Employees | % Employees |
| Private Company Employees | 218 | 55.0% |
| Self-Employed (Incorporated) | 0 | 0.0% |
| Self-Employed (Not Incorporated) | 43 | 10.9% |
| Not-for-profit Organizations | 0 | 0.0% |
| Local Government Employees | 81 | 20.4% |
| State Government Employees | 44 | 11.1% |
| Federal Government Employees | 10 | 2.5% |
| Unpaid Family Workers | 0 | 0.0% |
| Total | 396 | 100.0% |
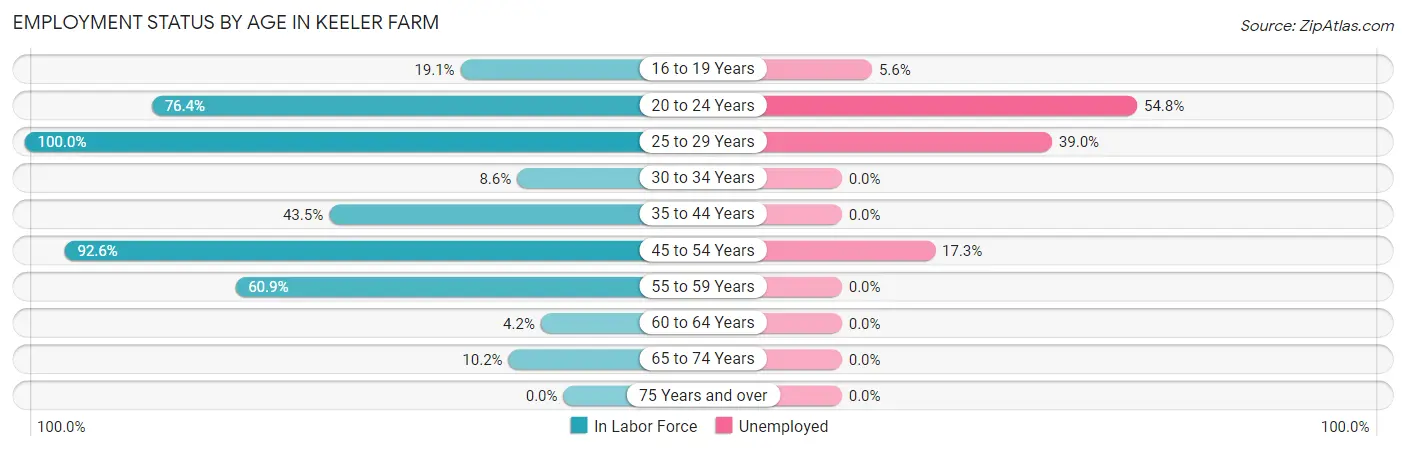
Employment Status by Age in Keeler Farm
According to the labor force statistics for Keeler Farm, out of the total population over 16 years of age (1,099), 45.8% or 503 individuals are in the labor force, with 21.3% or 107 of them unemployed. The age group with the highest labor force participation rate is 25 to 29 years, with 100.0% or 141 individuals in the labor force. Within the labor force, the 20 to 24 years age range has the highest percentage of unemployed individuals, with 54.8% or 23 of them being unemployed.
| Age Bracket | In Labor Force | Unemployed |
| 16 to 19 Years | 18 (19.1%) | 1 (5.6%) |
| 20 to 24 Years | 42 (76.4%) | 23 (54.8%) |
| 25 to 29 Years | 141 (100.0%) | 55 (39.0%) |
| 30 to 34 Years | 9 (8.6%) | 0 (0.0%) |
| 35 to 44 Years | 77 (43.5%) | 0 (0.0%) |
| 45 to 54 Years | 162 (92.6%) | 28 (17.3%) |
| 55 to 59 Years | 42 (60.9%) | 0 (0.0%) |
| 60 to 64 Years | 1 (4.2%) | 0 (0.0%) |
| 65 to 74 Years | 11 (10.2%) | 0 (0.0%) |
| 75 Years and over | 0 (0.0%) | 0 (0.0%) |
| Total | 503 (45.8%) | 107 (21.3%) |
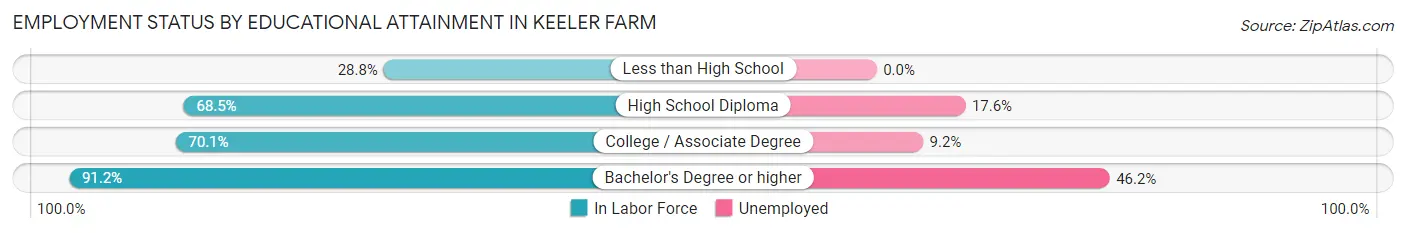
Employment Status by Educational Attainment in Keeler Farm
According to labor force statistics for Keeler Farm, 62.5% of individuals (432) out of the total population between 25 and 64 years of age (691) are in the labor force, with 19.2% or 83 of them being unemployed. The group with the highest labor force participation rate are those with the educational attainment of bachelor's degree or higher, with 91.2% or 93 individuals in the labor force. Within the labor force, individuals with bachelor's degree or higher education have the highest percentage of unemployment, with 46.2% or 43 of them being unemployed.
| Educational Attainment | In Labor Force | Unemployed |
| Less than High School | 49 (28.8%) | 0 (0.0%) |
| High School Diploma | 159 (68.5%) | 41 (17.6%) |
| College / Associate Degree | 131 (70.1%) | 17 (9.2%) |
| Bachelor's Degree or higher | 93 (91.2%) | 47 (46.2%) |
| Total | 432 (62.5%) | 133 (19.2%) |
Employment Occupations by Sex in Keeler Farm
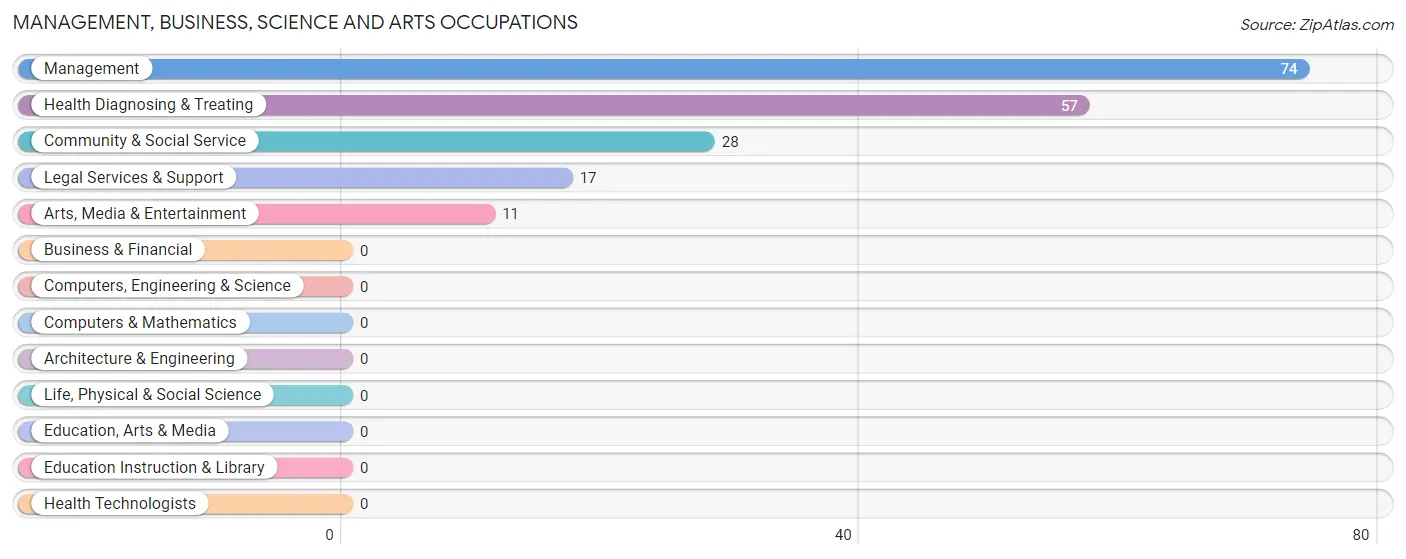
Management, Business, Science and Arts Occupations
The most common Management, Business, Science and Arts occupations in Keeler Farm are Management (74 | 18.7%), Health Diagnosing & Treating (57 | 14.4%), Community & Social Service (28 | 7.1%), Legal Services & Support (17 | 4.3%), and Arts, Media & Entertainment (11 | 2.8%).
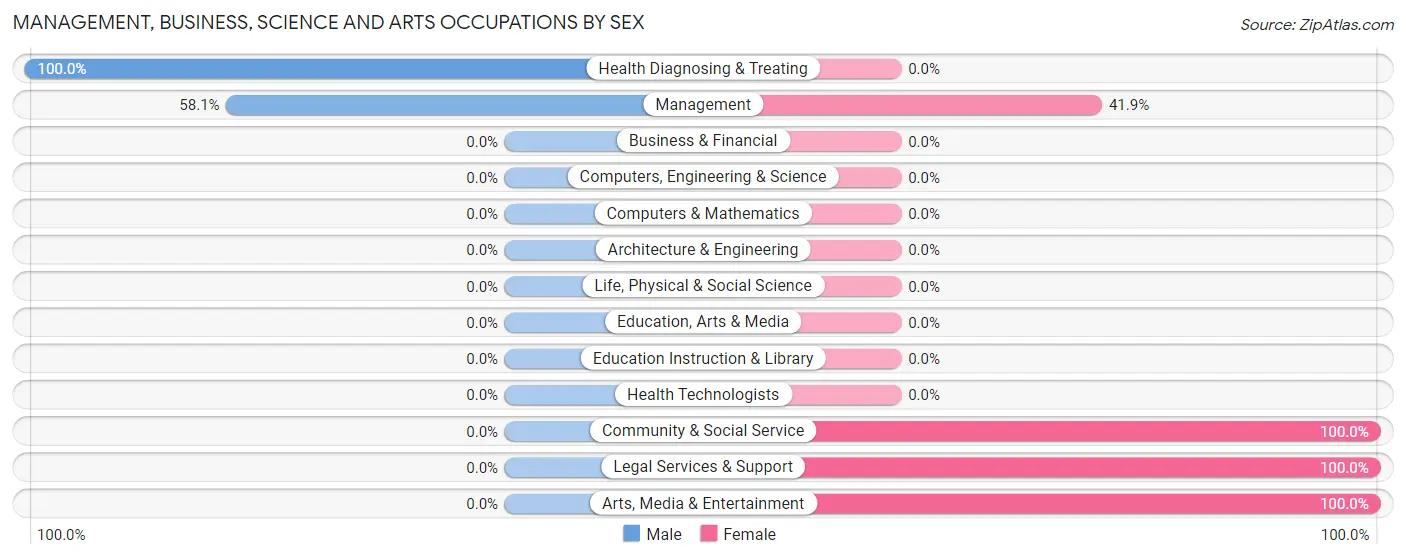
Management, Business, Science and Arts Occupations by Sex
Within the Management, Business, Science and Arts occupations in Keeler Farm, the most male-oriented occupations are Health Diagnosing & Treating (100.0%), and Management (58.1%), while the most female-oriented occupations are Community & Social Service (100.0%), Legal Services & Support (100.0%), and Arts, Media & Entertainment (100.0%).
| Occupation | Male | Female |
| Management | 43 (58.1%) | 31 (41.9%) |
| Business & Financial | 0 (0.0%) | 0 (0.0%) |
| Computers, Engineering & Science | 0 (0.0%) | 0 (0.0%) |
| Computers & Mathematics | 0 (0.0%) | 0 (0.0%) |
| Architecture & Engineering | 0 (0.0%) | 0 (0.0%) |
| Life, Physical & Social Science | 0 (0.0%) | 0 (0.0%) |
| Community & Social Service | 0 (0.0%) | 28 (100.0%) |
| Education, Arts & Media | 0 (0.0%) | 0 (0.0%) |
| Legal Services & Support | 0 (0.0%) | 17 (100.0%) |
| Education Instruction & Library | 0 (0.0%) | 0 (0.0%) |
| Arts, Media & Entertainment | 0 (0.0%) | 11 (100.0%) |
| Health Diagnosing & Treating | 57 (100.0%) | 0 (0.0%) |
| Health Technologists | 0 (0.0%) | 0 (0.0%) |
| Total (Category) | 100 (62.9%) | 59 (37.1%) |
| Total (Overall) | 233 (58.8%) | 163 (41.2%) |
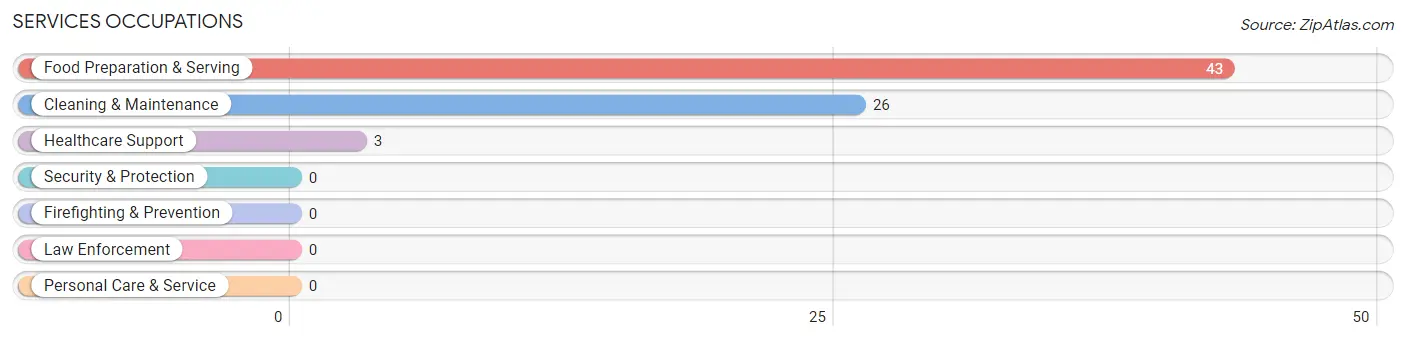
Services Occupations
The most common Services occupations in Keeler Farm are Food Preparation & Serving (43 | 10.9%), Cleaning & Maintenance (26 | 6.6%), and Healthcare Support (3 | 0.8%).
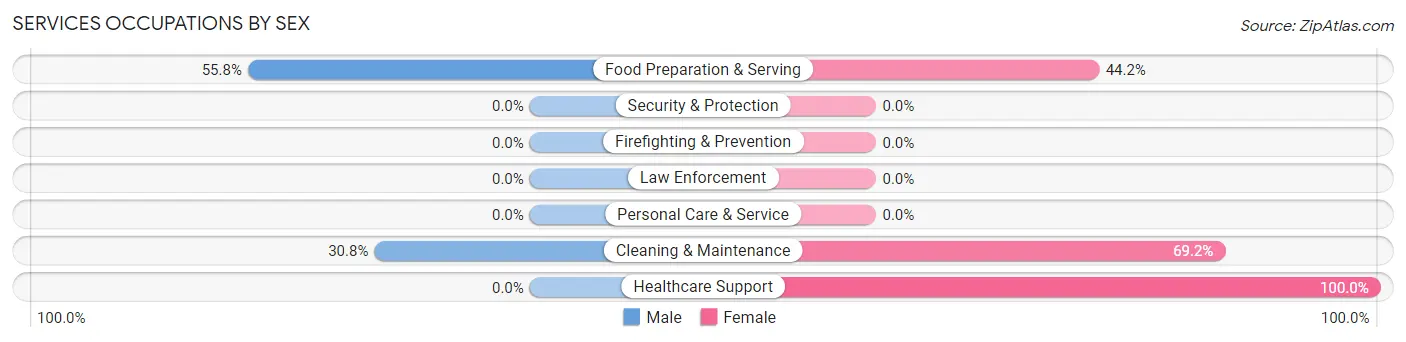
Services Occupations by Sex
Within the Services occupations in Keeler Farm, the most male-oriented occupations are Food Preparation & Serving (55.8%), and Cleaning & Maintenance (30.8%), while the most female-oriented occupations are Healthcare Support (100.0%), Cleaning & Maintenance (69.2%), and Food Preparation & Serving (44.2%).
| Occupation | Male | Female |
| Healthcare Support | 0 (0.0%) | 3 (100.0%) |
| Security & Protection | 0 (0.0%) | 0 (0.0%) |
| Firefighting & Prevention | 0 (0.0%) | 0 (0.0%) |
| Law Enforcement | 0 (0.0%) | 0 (0.0%) |
| Food Preparation & Serving | 24 (55.8%) | 19 (44.2%) |
| Cleaning & Maintenance | 8 (30.8%) | 18 (69.2%) |
| Personal Care & Service | 0 (0.0%) | 0 (0.0%) |
| Total (Category) | 32 (44.4%) | 40 (55.6%) |
| Total (Overall) | 233 (58.8%) | 163 (41.2%) |
Sales and Office Occupations
The most common Sales and Office occupations in Keeler Farm are Sales & Related (56 | 14.1%), and Office & Administration (24 | 6.1%).
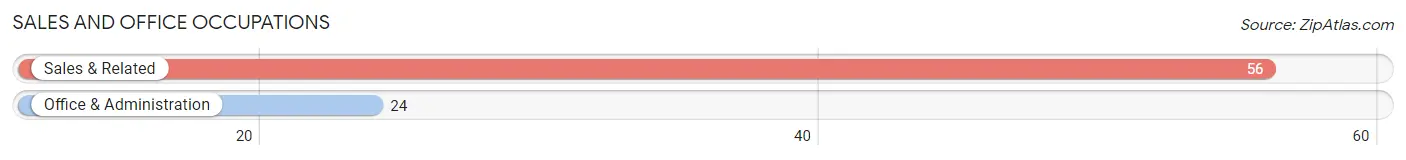
Sales and Office Occupations by Sex
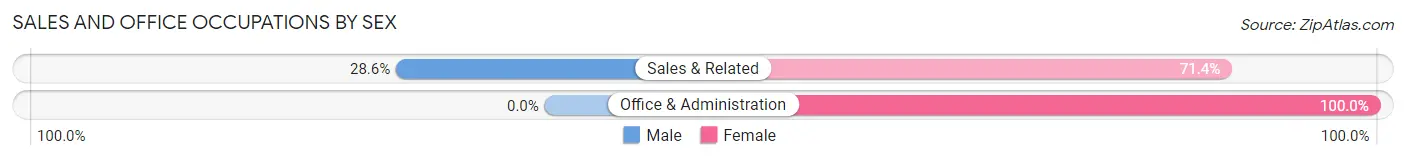
| Occupation | Male | Female |
| Sales & Related | 16 (28.6%) | 40 (71.4%) |
| Office & Administration | 0 (0.0%) | 24 (100.0%) |
| Total (Category) | 16 (20.0%) | 64 (80.0%) |
| Total (Overall) | 233 (58.8%) | 163 (41.2%) |
Natural Resources, Construction and Maintenance Occupations
The most common Natural Resources, Construction and Maintenance occupations in Keeler Farm are Construction & Extraction (69 | 17.4%), and Installation, Maintenance & Repair (15 | 3.8%).
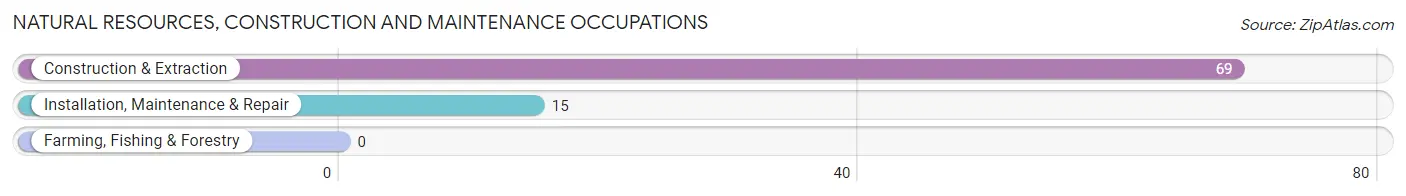
Natural Resources, Construction and Maintenance Occupations by Sex
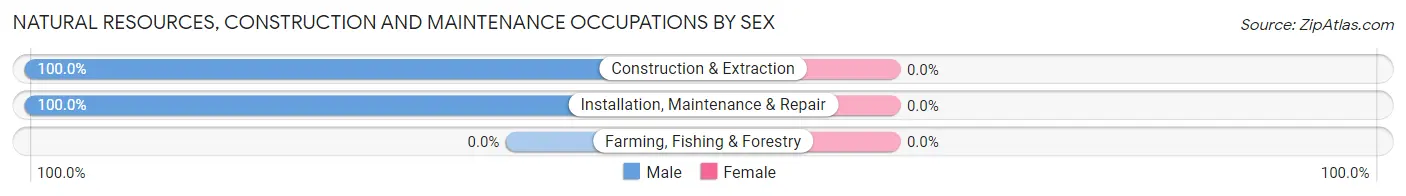
| Occupation | Male | Female |
| Farming, Fishing & Forestry | 0 (0.0%) | 0 (0.0%) |
| Construction & Extraction | 69 (100.0%) | 0 (0.0%) |
| Installation, Maintenance & Repair | 15 (100.0%) | 0 (0.0%) |
| Total (Category) | 84 (100.0%) | 0 (0.0%) |
| Total (Overall) | 233 (58.8%) | 163 (41.2%) |
Production, Transportation and Moving Occupations
The most common Production, Transportation and Moving occupations in Keeler Farm are , and Transportation (1 | 0.3%).
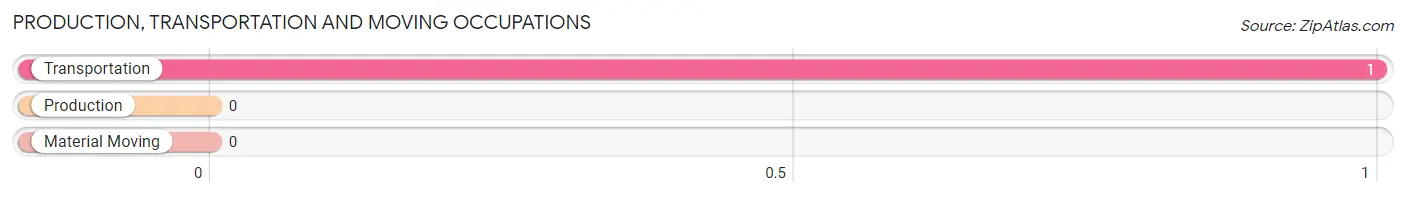
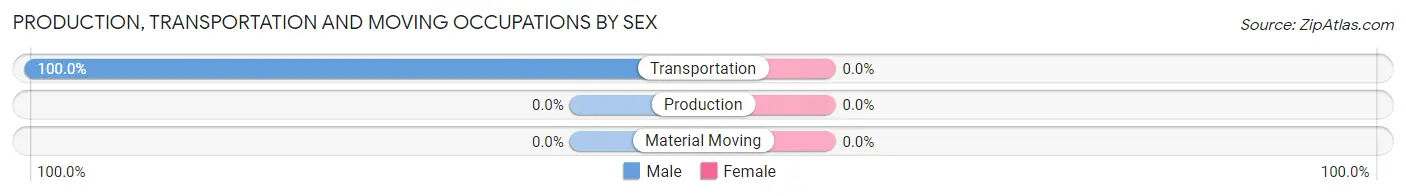
Production, Transportation and Moving Occupations by Sex
| Occupation | Male | Female |
| Production | 0 (0.0%) | 0 (0.0%) |
| Transportation | 1 (100.0%) | 0 (0.0%) |
| Material Moving | 0 (0.0%) | 0 (0.0%) |
| Total (Category) | 1 (100.0%) | 0 (0.0%) |
| Total (Overall) | 233 (58.8%) | 163 (41.2%) |
Employment Industries by Sex in Keeler Farm
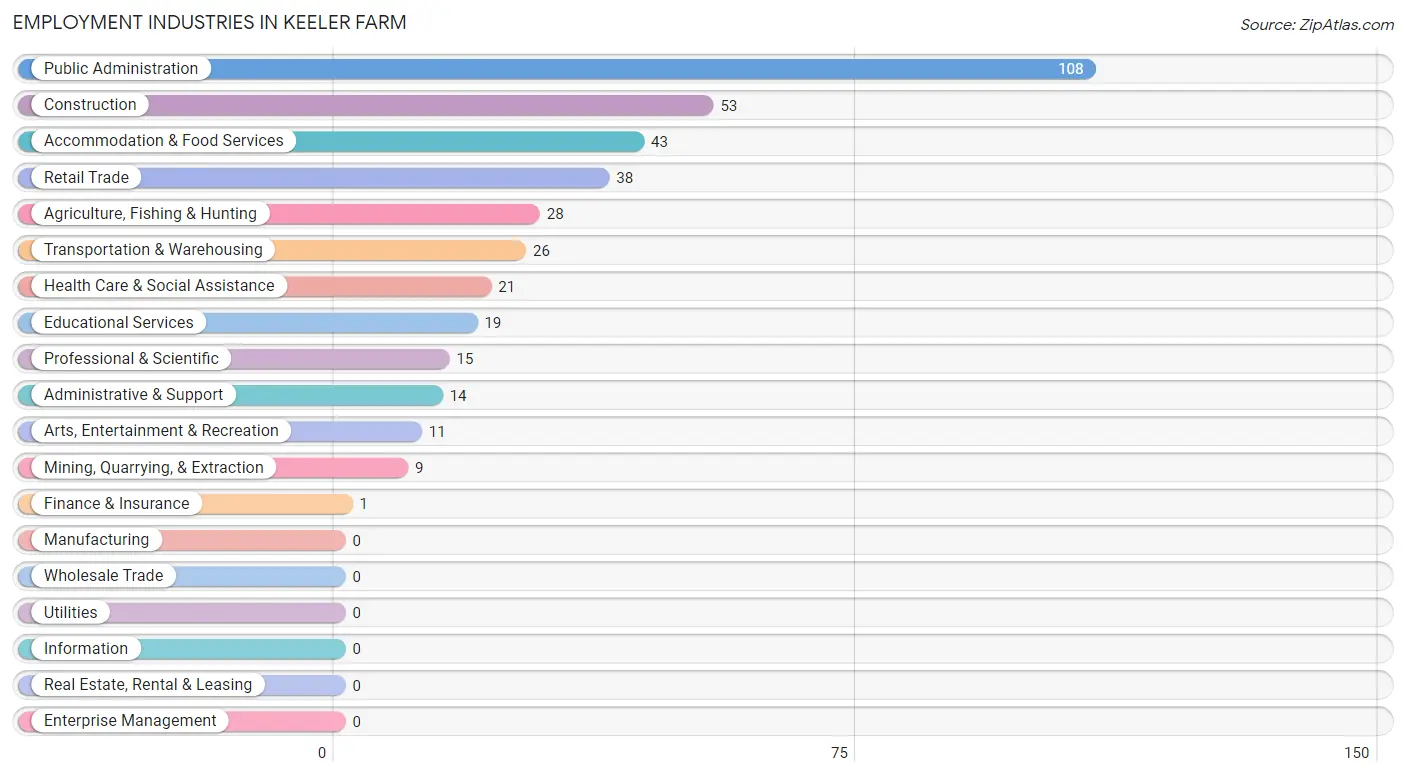
Employment Industries in Keeler Farm
The major employment industries in Keeler Farm include Public Administration (108 | 27.3%), Construction (53 | 13.4%), Accommodation & Food Services (43 | 10.9%), Retail Trade (38 | 9.6%), and Agriculture, Fishing & Hunting (28 | 7.1%).
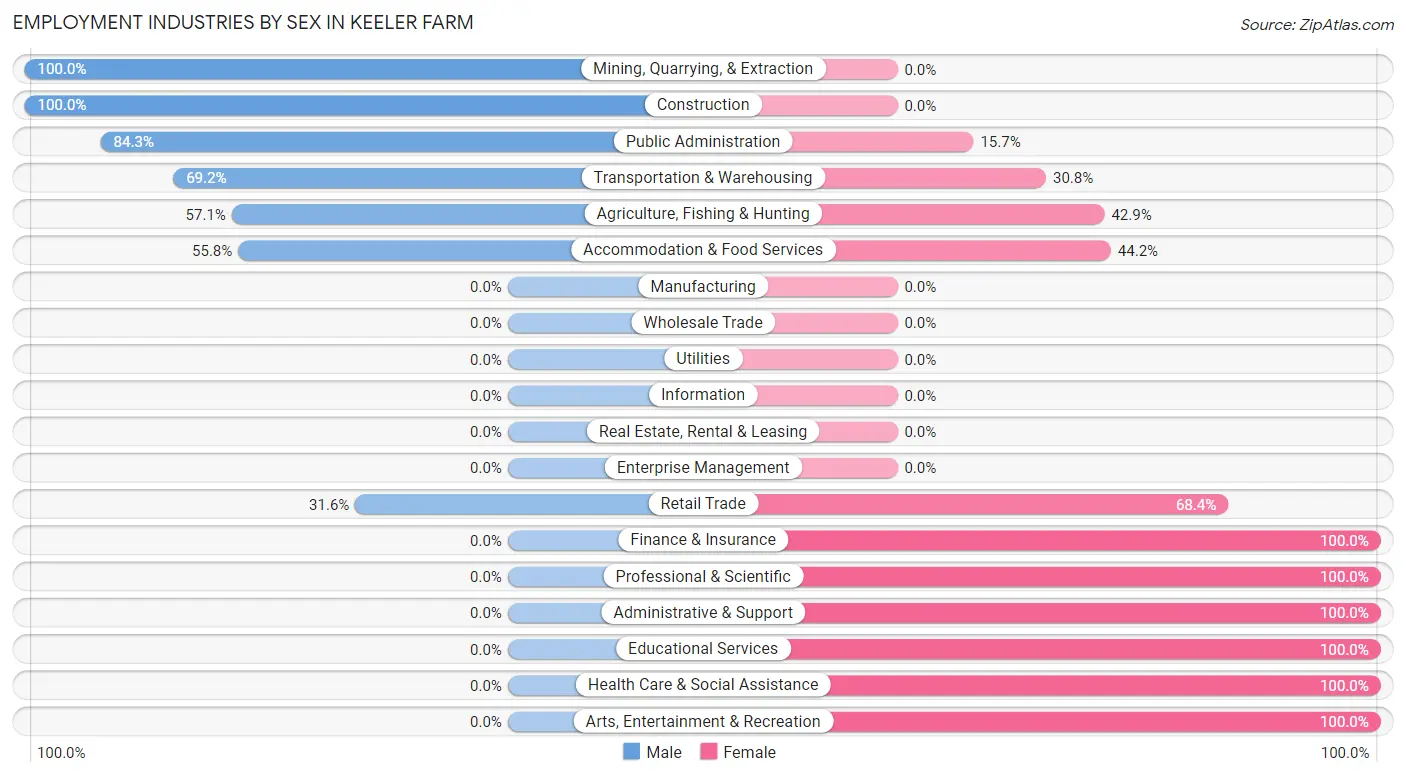
Employment Industries by Sex in Keeler Farm
The Keeler Farm industries that see more men than women are Mining, Quarrying, & Extraction (100.0%), Construction (100.0%), and Public Administration (84.3%), whereas the industries that tend to have a higher number of women are Finance & Insurance (100.0%), Professional & Scientific (100.0%), and Administrative & Support (100.0%).
| Industry | Male | Female |
| Agriculture, Fishing & Hunting | 16 (57.1%) | 12 (42.9%) |
| Mining, Quarrying, & Extraction | 9 (100.0%) | 0 (0.0%) |
| Construction | 53 (100.0%) | 0 (0.0%) |
| Manufacturing | 0 (0.0%) | 0 (0.0%) |
| Wholesale Trade | 0 (0.0%) | 0 (0.0%) |
| Retail Trade | 12 (31.6%) | 26 (68.4%) |
| Transportation & Warehousing | 18 (69.2%) | 8 (30.8%) |
| Utilities | 0 (0.0%) | 0 (0.0%) |
| Information | 0 (0.0%) | 0 (0.0%) |
| Finance & Insurance | 0 (0.0%) | 1 (100.0%) |
| Real Estate, Rental & Leasing | 0 (0.0%) | 0 (0.0%) |
| Professional & Scientific | 0 (0.0%) | 15 (100.0%) |
| Enterprise Management | 0 (0.0%) | 0 (0.0%) |
| Administrative & Support | 0 (0.0%) | 14 (100.0%) |
| Educational Services | 0 (0.0%) | 19 (100.0%) |
| Health Care & Social Assistance | 0 (0.0%) | 21 (100.0%) |
| Arts, Entertainment & Recreation | 0 (0.0%) | 11 (100.0%) |
| Accommodation & Food Services | 24 (55.8%) | 19 (44.2%) |
| Public Administration | 91 (84.3%) | 17 (15.7%) |
| Total | 233 (58.8%) | 163 (41.2%) |
Education in Keeler Farm
School Enrollment in Keeler Farm
The most common levels of schooling among the 562 students in Keeler Farm are high school (183 | 32.6%), elementary school (168 | 29.9%), and middle school (139 | 24.7%).
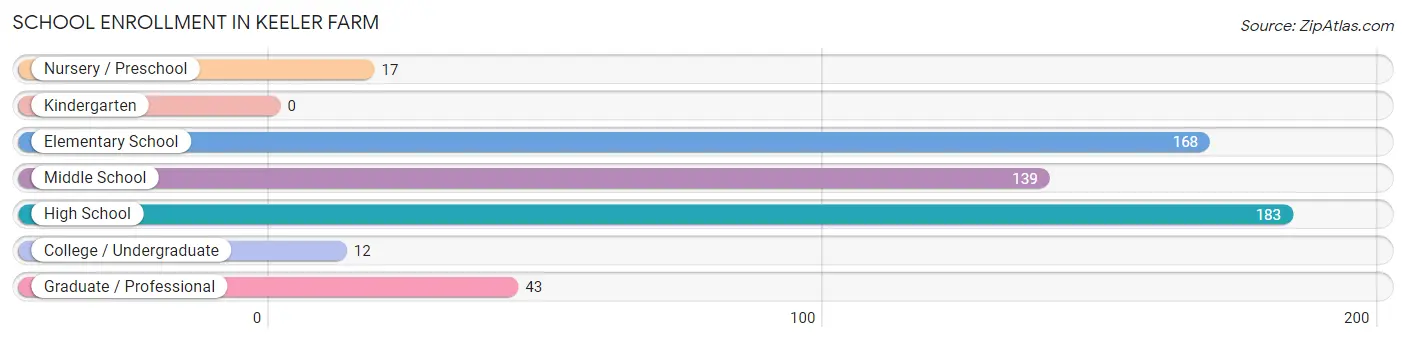
| School Level | # Students | % Students |
| Nursery / Preschool | 17 | 3.0% |
| Kindergarten | 0 | 0.0% |
| Elementary School | 168 | 29.9% |
| Middle School | 139 | 24.7% |
| High School | 183 | 32.6% |
| College / Undergraduate | 12 | 2.1% |
| Graduate / Professional | 43 | 7.6% |
| Total | 562 | 100.0% |
School Enrollment by Age by Funding Source in Keeler Farm
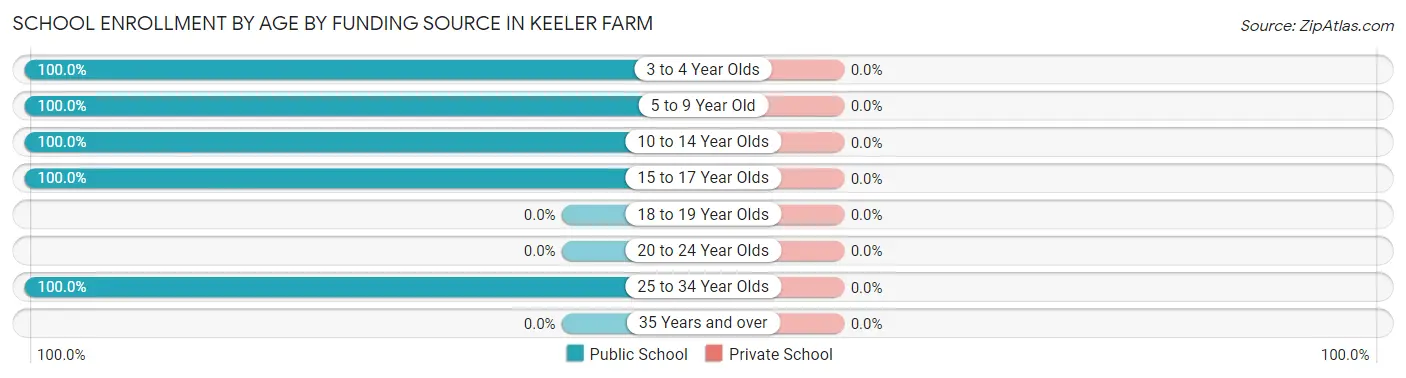
| Age Bracket | Public School | Private School |
| 3 to 4 Year Olds | 17 (100.0%) | 0 (0.0%) |
| 5 to 9 Year Old | 160 (100.0%) | 0 (0.0%) |
| 10 to 14 Year Olds | 238 (100.0%) | 0 (0.0%) |
| 15 to 17 Year Olds | 92 (100.0%) | 0 (0.0%) |
| 18 to 19 Year Olds | 0 (0.0%) | 0 (0.0%) |
| 20 to 24 Year Olds | 0 (0.0%) | 0 (0.0%) |
| 25 to 34 Year Olds | 55 (100.0%) | 0 (0.0%) |
| 35 Years and over | 0 (0.0%) | 0 (0.0%) |
| Total | 562 (100.0%) | 0 (0.0%) |
Educational Attainment by Field of Study in Keeler Farm
Arts & humanities (43 | 35.2%), education (28 | 23.0%), liberal arts & history (23 | 18.9%), engineering (17 | 13.9%), and science & technology (11 | 9.0%) are the most common fields of study among 122 individuals in Keeler Farm who have obtained a bachelor's degree or higher.
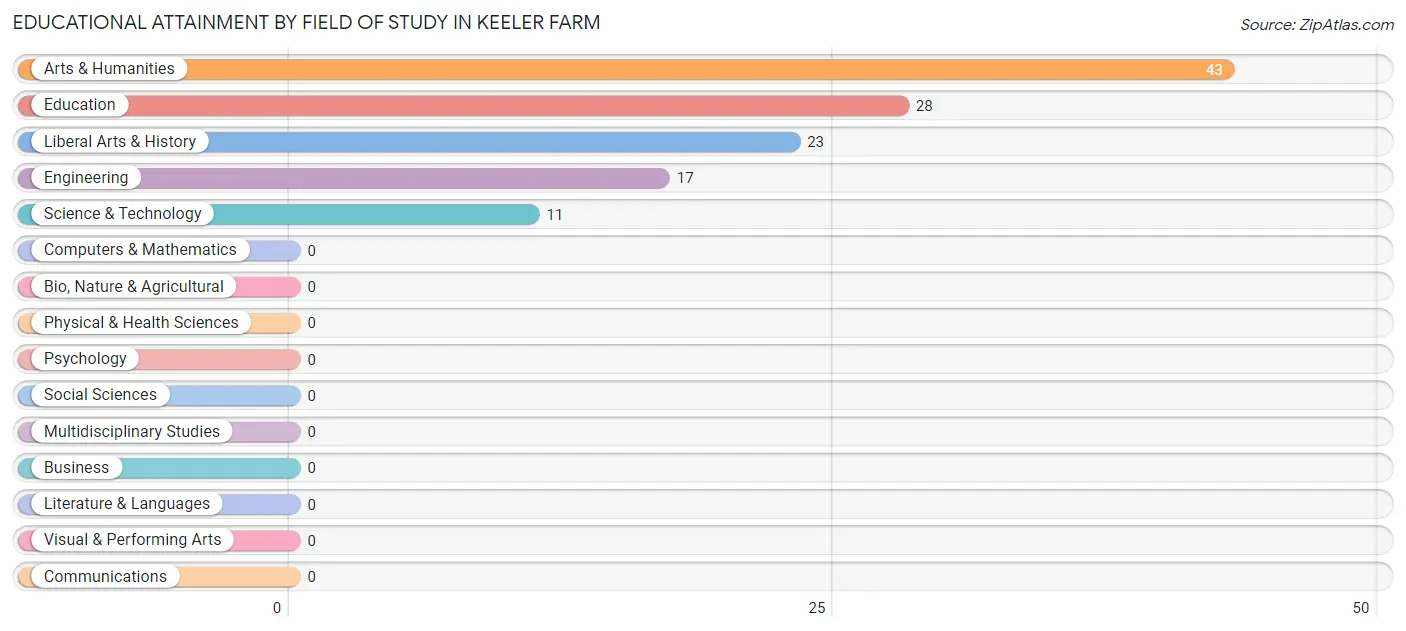
| Field of Study | # Graduates | % Graduates |
| Computers & Mathematics | 0 | 0.0% |
| Bio, Nature & Agricultural | 0 | 0.0% |
| Physical & Health Sciences | 0 | 0.0% |
| Psychology | 0 | 0.0% |
| Social Sciences | 0 | 0.0% |
| Engineering | 17 | 13.9% |
| Multidisciplinary Studies | 0 | 0.0% |
| Science & Technology | 11 | 9.0% |
| Business | 0 | 0.0% |
| Education | 28 | 23.0% |
| Literature & Languages | 0 | 0.0% |
| Liberal Arts & History | 23 | 18.9% |
| Visual & Performing Arts | 0 | 0.0% |
| Communications | 0 | 0.0% |
| Arts & Humanities | 43 | 35.2% |
| Total | 122 | 100.0% |
Transportation & Commute in Keeler Farm
Vehicle Availability by Sex in Keeler Farm
The most prevalent vehicle ownership categories in Keeler Farm are males with 2 vehicles (112, accounting for 48.1%) and females with 2 vehicles (38, making up 68.7%).
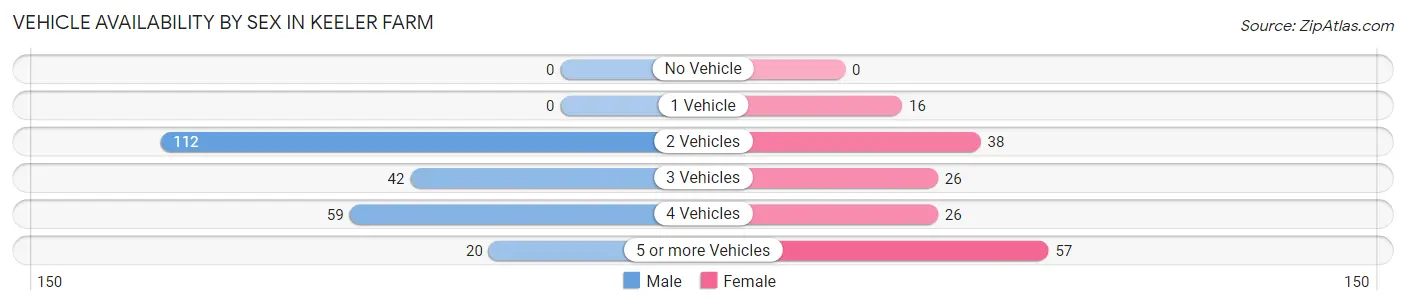
| Vehicles Available | Male | Female |
| No Vehicle | 0 (0.0%) | 0 (0.0%) |
| 1 Vehicle | 0 (0.0%) | 16 (9.8%) |
| 2 Vehicles | 112 (48.1%) | 38 (23.3%) |
| 3 Vehicles | 42 (18.0%) | 26 (16.0%) |
| 4 Vehicles | 59 (25.3%) | 26 (16.0%) |
| 5 or more Vehicles | 20 (8.6%) | 57 (35.0%) |
| Total | 233 (100.0%) | 163 (100.0%) |
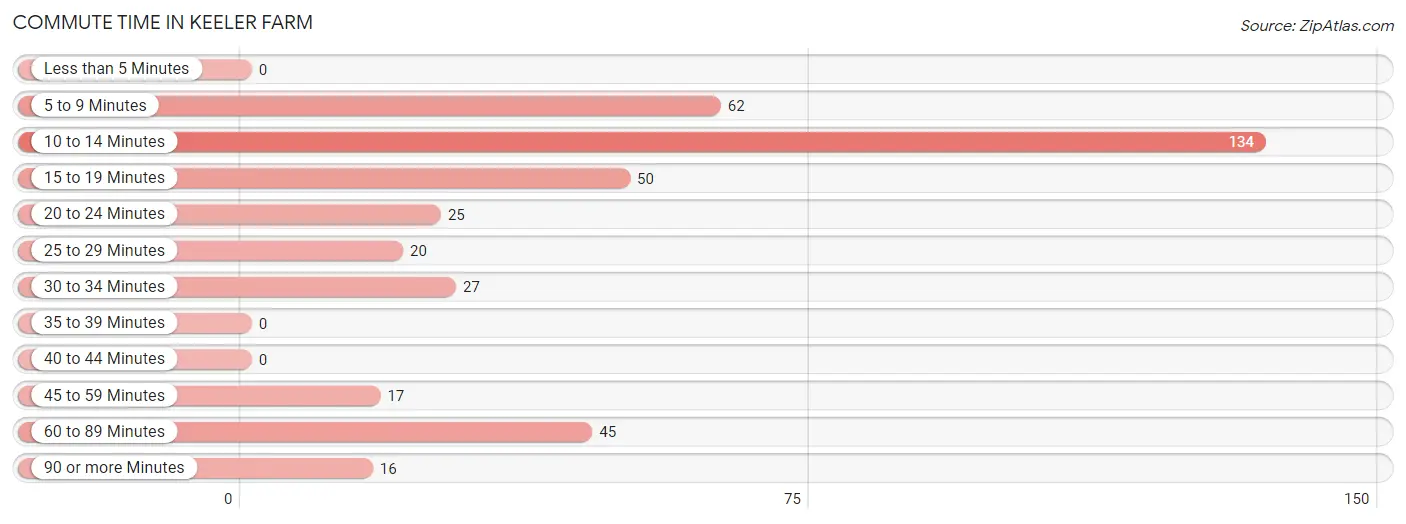
Commute Time in Keeler Farm
The most frequently occuring commute durations in Keeler Farm are 10 to 14 minutes (134 commuters, 33.8%), 5 to 9 minutes (62 commuters, 15.7%), and 15 to 19 minutes (50 commuters, 12.6%).
| Commute Time | # Commuters | % Commuters |
| Less than 5 Minutes | 0 | 0.0% |
| 5 to 9 Minutes | 62 | 15.7% |
| 10 to 14 Minutes | 134 | 33.8% |
| 15 to 19 Minutes | 50 | 12.6% |
| 20 to 24 Minutes | 25 | 6.3% |
| 25 to 29 Minutes | 20 | 5.1% |
| 30 to 34 Minutes | 27 | 6.8% |
| 35 to 39 Minutes | 0 | 0.0% |
| 40 to 44 Minutes | 0 | 0.0% |
| 45 to 59 Minutes | 17 | 4.3% |
| 60 to 89 Minutes | 45 | 11.4% |
| 90 or more Minutes | 16 | 4.0% |
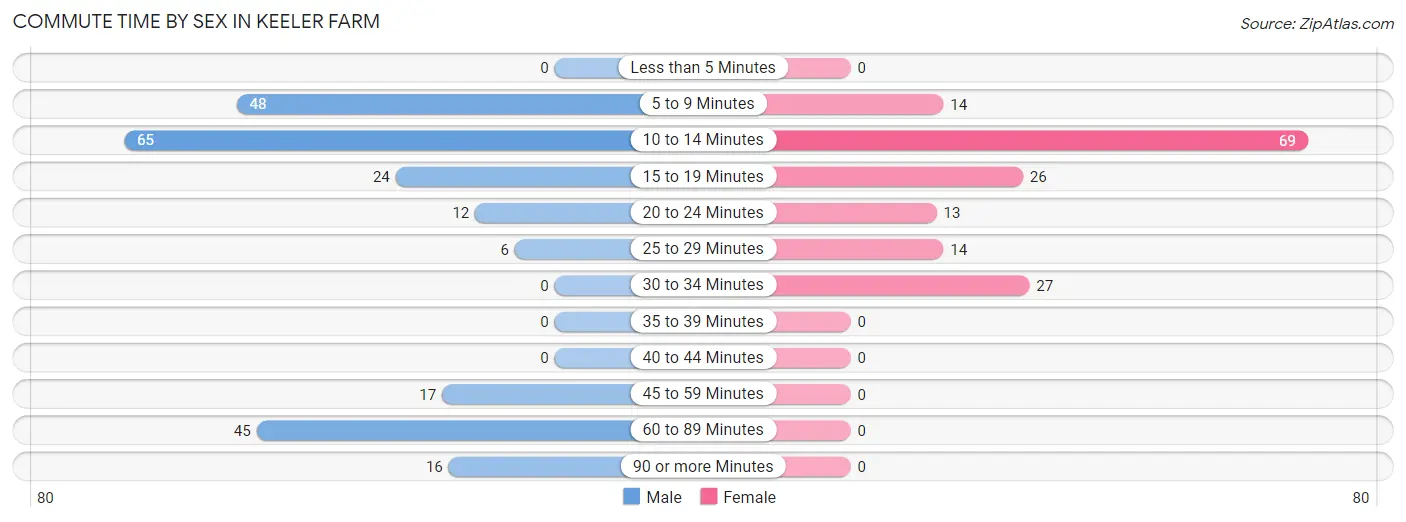
Commute Time by Sex in Keeler Farm
The most common commute times in Keeler Farm are 10 to 14 minutes (65 commuters, 27.9%) for males and 10 to 14 minutes (69 commuters, 42.3%) for females.
| Commute Time | Male | Female |
| Less than 5 Minutes | 0 (0.0%) | 0 (0.0%) |
| 5 to 9 Minutes | 48 (20.6%) | 14 (8.6%) |
| 10 to 14 Minutes | 65 (27.9%) | 69 (42.3%) |
| 15 to 19 Minutes | 24 (10.3%) | 26 (16.0%) |
| 20 to 24 Minutes | 12 (5.1%) | 13 (8.0%) |
| 25 to 29 Minutes | 6 (2.6%) | 14 (8.6%) |
| 30 to 34 Minutes | 0 (0.0%) | 27 (16.6%) |
| 35 to 39 Minutes | 0 (0.0%) | 0 (0.0%) |
| 40 to 44 Minutes | 0 (0.0%) | 0 (0.0%) |
| 45 to 59 Minutes | 17 (7.3%) | 0 (0.0%) |
| 60 to 89 Minutes | 45 (19.3%) | 0 (0.0%) |
| 90 or more Minutes | 16 (6.9%) | 0 (0.0%) |
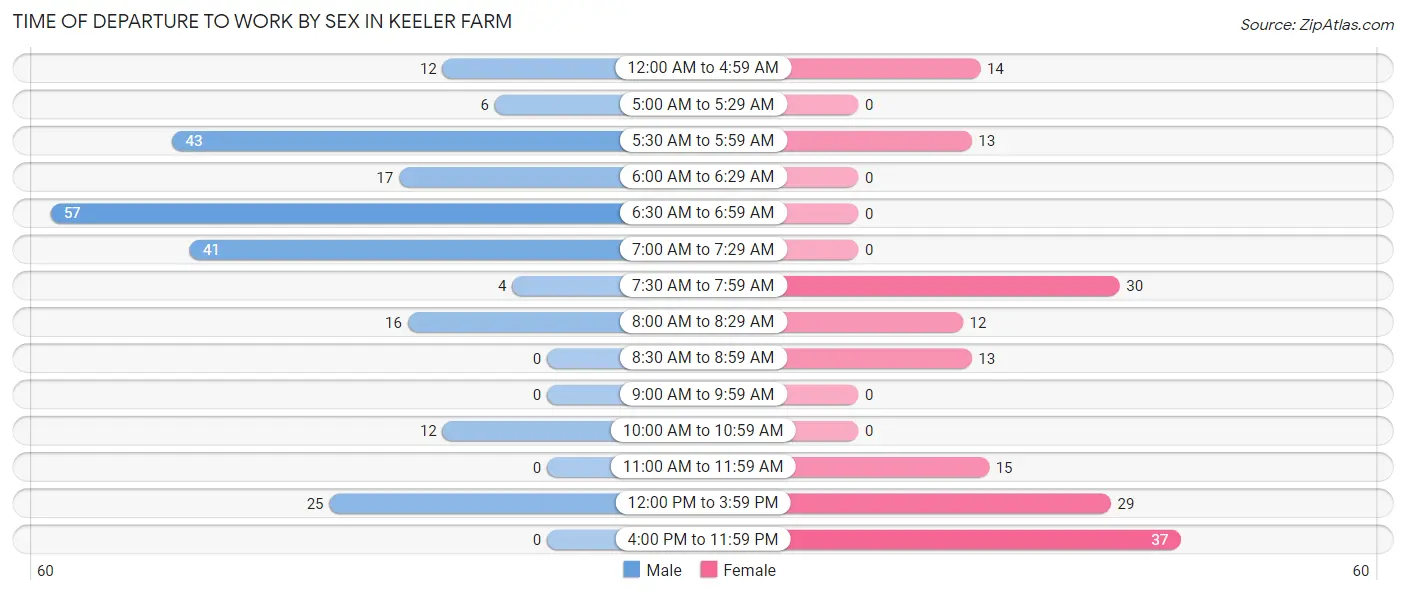
Time of Departure to Work by Sex in Keeler Farm
The most frequent times of departure to work in Keeler Farm are 6:30 AM to 6:59 AM (57, 24.5%) for males and 4:00 PM to 11:59 PM (37, 22.7%) for females.
| Time of Departure | Male | Female |
| 12:00 AM to 4:59 AM | 12 (5.1%) | 14 (8.6%) |
| 5:00 AM to 5:29 AM | 6 (2.6%) | 0 (0.0%) |
| 5:30 AM to 5:59 AM | 43 (18.4%) | 13 (8.0%) |
| 6:00 AM to 6:29 AM | 17 (7.3%) | 0 (0.0%) |
| 6:30 AM to 6:59 AM | 57 (24.5%) | 0 (0.0%) |
| 7:00 AM to 7:29 AM | 41 (17.6%) | 0 (0.0%) |
| 7:30 AM to 7:59 AM | 4 (1.7%) | 30 (18.4%) |
| 8:00 AM to 8:29 AM | 16 (6.9%) | 12 (7.4%) |
| 8:30 AM to 8:59 AM | 0 (0.0%) | 13 (8.0%) |
| 9:00 AM to 9:59 AM | 0 (0.0%) | 0 (0.0%) |
| 10:00 AM to 10:59 AM | 12 (5.1%) | 0 (0.0%) |
| 11:00 AM to 11:59 AM | 0 (0.0%) | 15 (9.2%) |
| 12:00 PM to 3:59 PM | 25 (10.7%) | 29 (17.8%) |
| 4:00 PM to 11:59 PM | 0 (0.0%) | 37 (22.7%) |
| Total | 233 (100.0%) | 163 (100.0%) |
Housing Occupancy in Keeler Farm
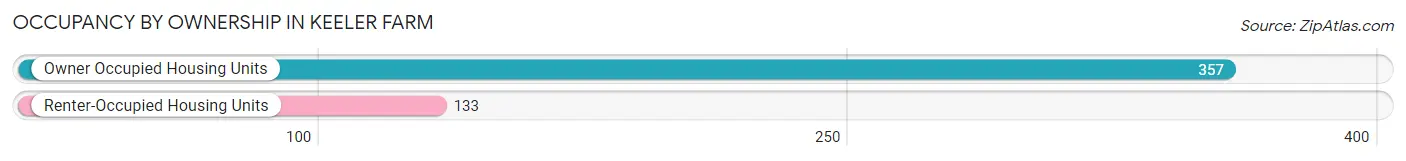
Occupancy by Ownership in Keeler Farm
Of the total 490 dwellings in Keeler Farm, owner-occupied units account for 357 (72.9%), while renter-occupied units make up 133 (27.1%).
| Occupancy | # Housing Units | % Housing Units |
| Owner Occupied Housing Units | 357 | 72.9% |
| Renter-Occupied Housing Units | 133 | 27.1% |
| Total Occupied Housing Units | 490 | 100.0% |
Occupancy by Household Size in Keeler Farm
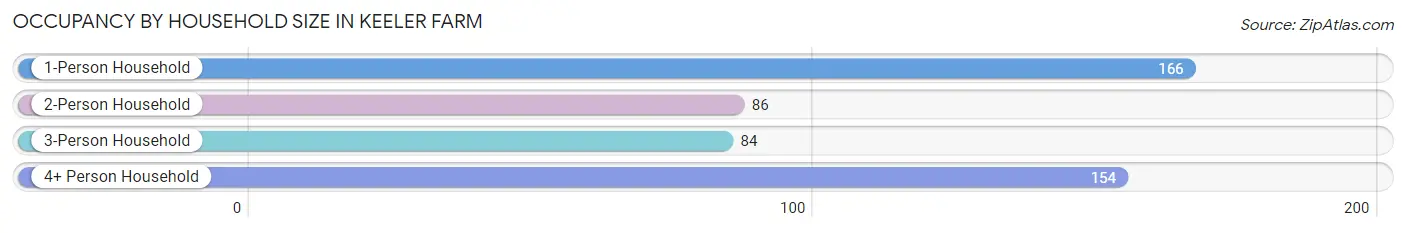
| Household Size | # Housing Units | % Housing Units |
| 1-Person Household | 166 | 33.9% |
| 2-Person Household | 86 | 17.5% |
| 3-Person Household | 84 | 17.1% |
| 4+ Person Household | 154 | 31.4% |
| Total Housing Units | 490 | 100.0% |
Occupancy by Ownership by Household Size in Keeler Farm
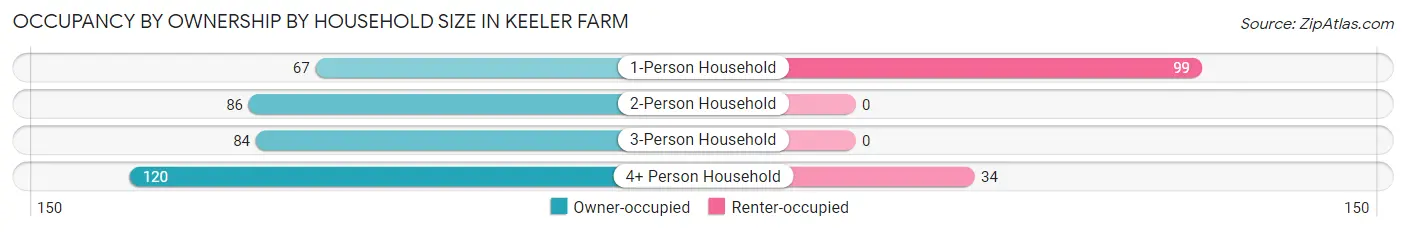
| Household Size | Owner-occupied | Renter-occupied |
| 1-Person Household | 67 (40.4%) | 99 (59.6%) |
| 2-Person Household | 86 (100.0%) | 0 (0.0%) |
| 3-Person Household | 84 (100.0%) | 0 (0.0%) |
| 4+ Person Household | 120 (77.9%) | 34 (22.1%) |
| Total Housing Units | 357 (72.9%) | 133 (27.1%) |
Occupancy by Educational Attainment in Keeler Farm
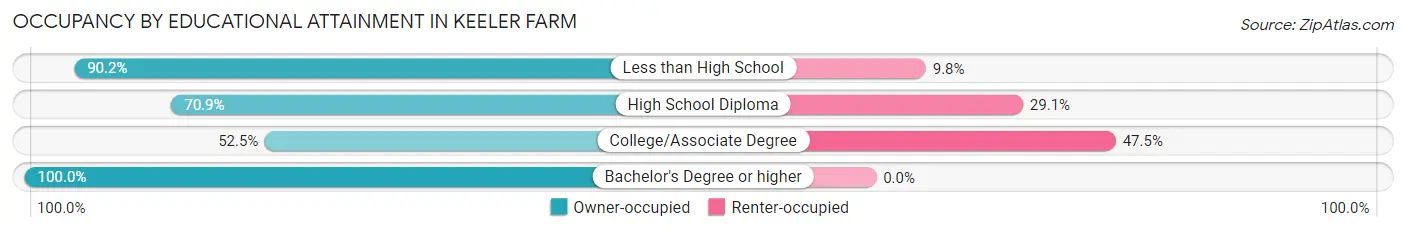
| Household Size | Owner-occupied | Renter-occupied |
| Less than High School | 110 (90.2%) | 12 (9.8%) |
| High School Diploma | 156 (70.9%) | 64 (29.1%) |
| College/Associate Degree | 63 (52.5%) | 57 (47.5%) |
| Bachelor's Degree or higher | 28 (100.0%) | 0 (0.0%) |
Occupancy by Age of Householder in Keeler Farm
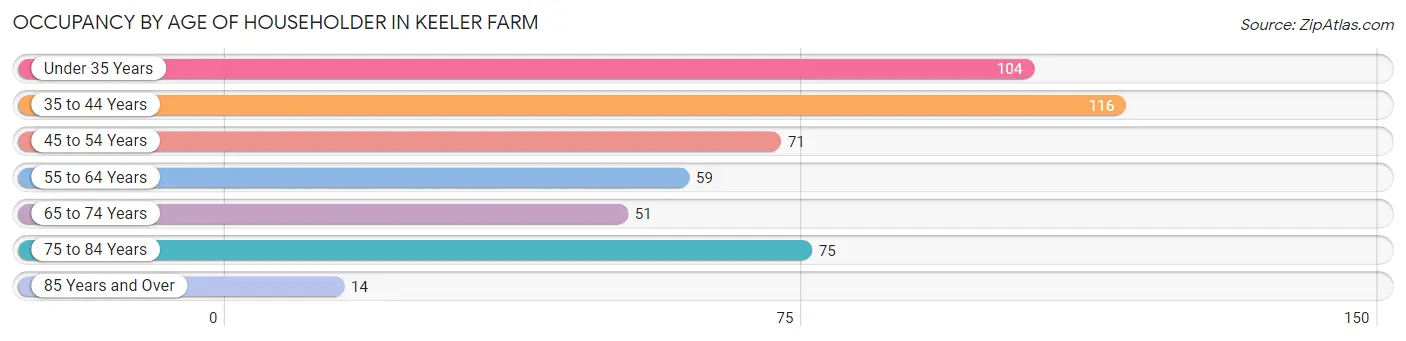
| Age Bracket | # Households | % Households |
| Under 35 Years | 104 | 21.2% |
| 35 to 44 Years | 116 | 23.7% |
| 45 to 54 Years | 71 | 14.5% |
| 55 to 64 Years | 59 | 12.0% |
| 65 to 74 Years | 51 | 10.4% |
| 75 to 84 Years | 75 | 15.3% |
| 85 Years and Over | 14 | 2.9% |
| Total | 490 | 100.0% |
Housing Finances in Keeler Farm
Median Income by Occupancy in Keeler Farm
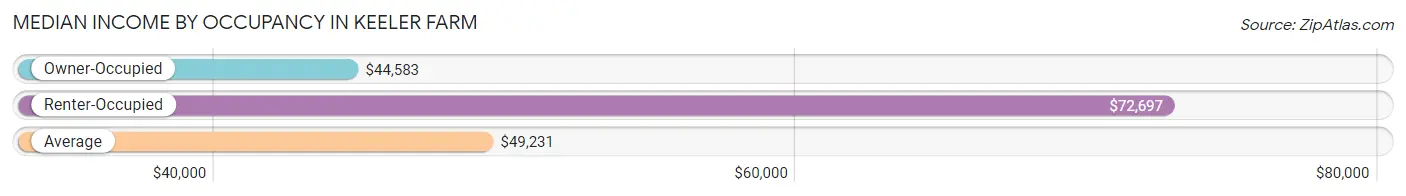
| Occupancy Type | # Households | Median Income |
| Owner-Occupied | 357 (72.9%) | $44,583 |
| Renter-Occupied | 133 (27.1%) | $72,697 |
| Average | 490 (100.0%) | $49,231 |
Occupancy by Householder Income Bracket in Keeler Farm
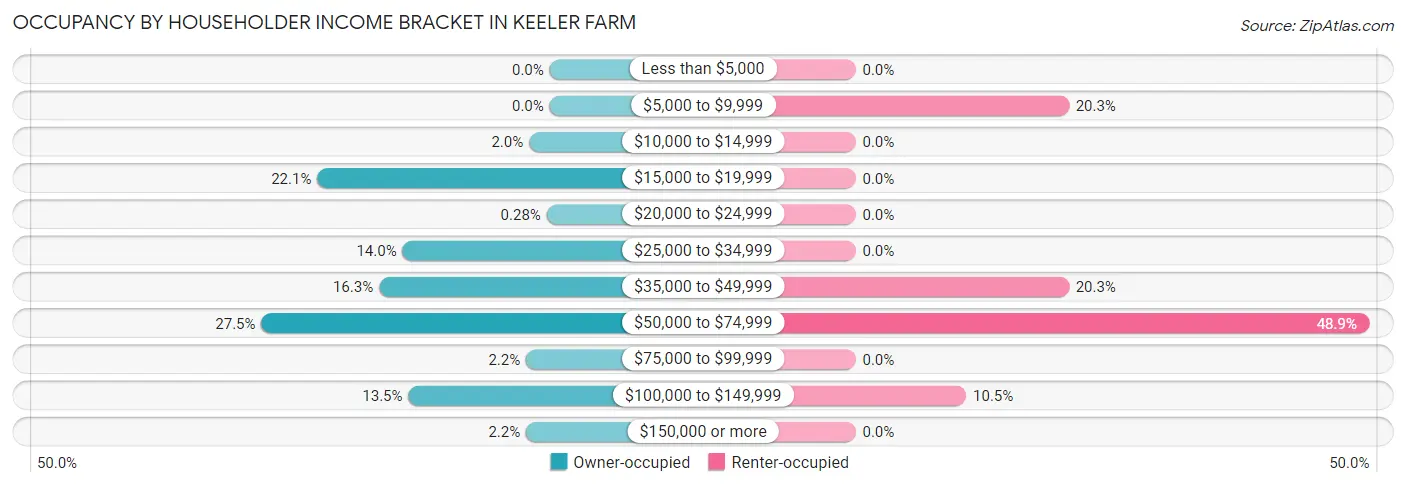
| Income Bracket | Owner-occupied | Renter-occupied |
| Less than $5,000 | 0 (0.0%) | 0 (0.0%) |
| $5,000 to $9,999 | 0 (0.0%) | 27 (20.3%) |
| $10,000 to $14,999 | 7 (2.0%) | 0 (0.0%) |
| $15,000 to $19,999 | 79 (22.1%) | 0 (0.0%) |
| $20,000 to $24,999 | 1 (0.3%) | 0 (0.0%) |
| $25,000 to $34,999 | 50 (14.0%) | 0 (0.0%) |
| $35,000 to $49,999 | 58 (16.3%) | 27 (20.3%) |
| $50,000 to $74,999 | 98 (27.5%) | 65 (48.9%) |
| $75,000 to $99,999 | 8 (2.2%) | 0 (0.0%) |
| $100,000 to $149,999 | 48 (13.5%) | 14 (10.5%) |
| $150,000 or more | 8 (2.2%) | 0 (0.0%) |
| Total | 357 (100.0%) | 133 (100.0%) |
Monthly Housing Cost Tiers in Keeler Farm
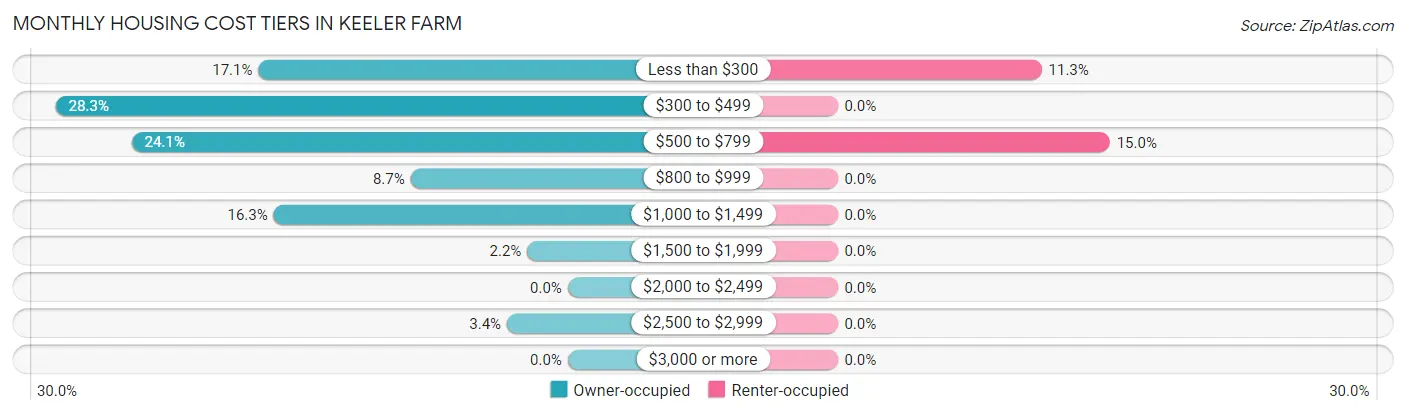
| Monthly Cost | Owner-occupied | Renter-occupied |
| Less than $300 | 61 (17.1%) | 15 (11.3%) |
| $300 to $499 | 101 (28.3%) | 0 (0.0%) |
| $500 to $799 | 86 (24.1%) | 20 (15.0%) |
| $800 to $999 | 31 (8.7%) | 0 (0.0%) |
| $1,000 to $1,499 | 58 (16.3%) | 0 (0.0%) |
| $1,500 to $1,999 | 8 (2.2%) | 0 (0.0%) |
| $2,000 to $2,499 | 0 (0.0%) | 0 (0.0%) |
| $2,500 to $2,999 | 12 (3.4%) | 0 (0.0%) |
| $3,000 or more | 0 (0.0%) | 0 (0.0%) |
| Total | 357 (100.0%) | 133 (100.0%) |
Physical Housing Characteristics in Keeler Farm
Housing Structures in Keeler Farm
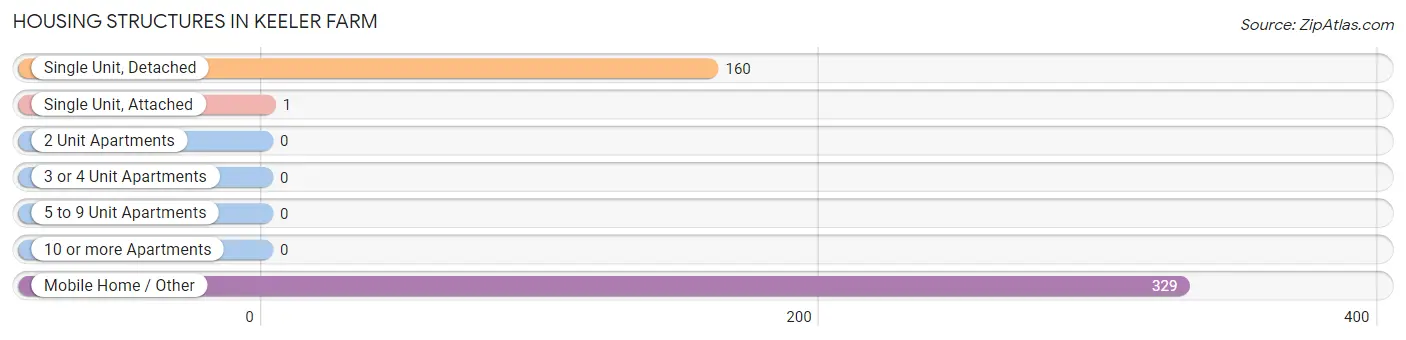
| Structure Type | # Housing Units | % Housing Units |
| Single Unit, Detached | 160 | 32.7% |
| Single Unit, Attached | 1 | 0.2% |
| 2 Unit Apartments | 0 | 0.0% |
| 3 or 4 Unit Apartments | 0 | 0.0% |
| 5 to 9 Unit Apartments | 0 | 0.0% |
| 10 or more Apartments | 0 | 0.0% |
| Mobile Home / Other | 329 | 67.1% |
| Total | 490 | 100.0% |
Housing Structures by Occupancy in Keeler Farm
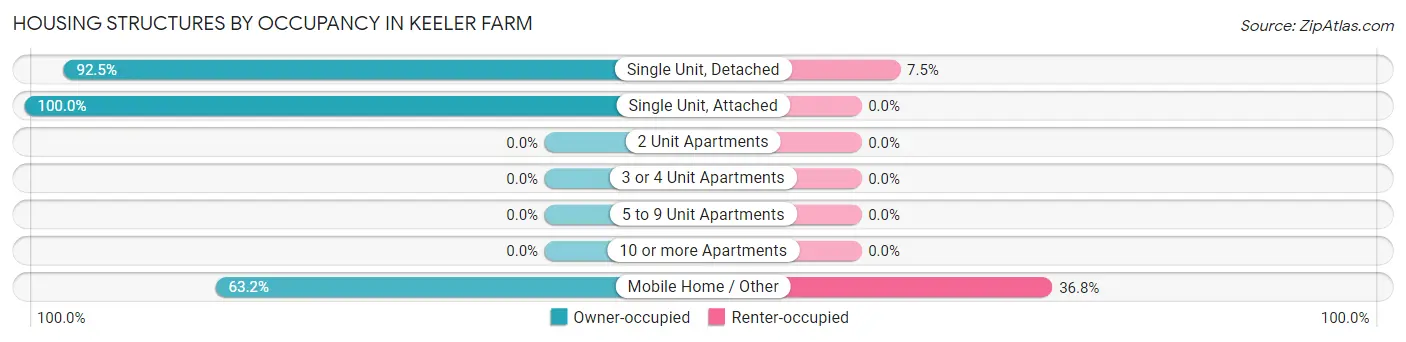
| Structure Type | Owner-occupied | Renter-occupied |
| Single Unit, Detached | 148 (92.5%) | 12 (7.5%) |
| Single Unit, Attached | 1 (100.0%) | 0 (0.0%) |
| 2 Unit Apartments | 0 (0.0%) | 0 (0.0%) |
| 3 or 4 Unit Apartments | 0 (0.0%) | 0 (0.0%) |
| 5 to 9 Unit Apartments | 0 (0.0%) | 0 (0.0%) |
| 10 or more Apartments | 0 (0.0%) | 0 (0.0%) |
| Mobile Home / Other | 208 (63.2%) | 121 (36.8%) |
| Total | 357 (72.9%) | 133 (27.1%) |
Housing Structures by Number of Rooms in Keeler Farm
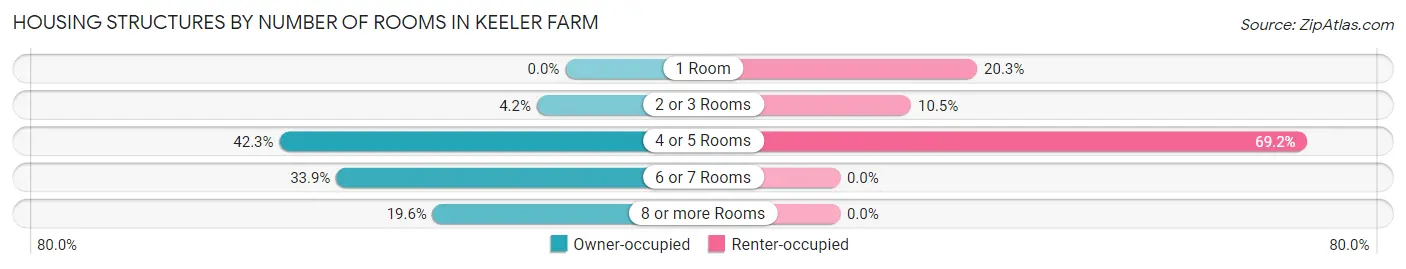
| Number of Rooms | Owner-occupied | Renter-occupied |
| 1 Room | 0 (0.0%) | 27 (20.3%) |
| 2 or 3 Rooms | 15 (4.2%) | 14 (10.5%) |
| 4 or 5 Rooms | 151 (42.3%) | 92 (69.2%) |
| 6 or 7 Rooms | 121 (33.9%) | 0 (0.0%) |
| 8 or more Rooms | 70 (19.6%) | 0 (0.0%) |
| Total | 357 (100.0%) | 133 (100.0%) |
Housing Structure by Heating Type in Keeler Farm
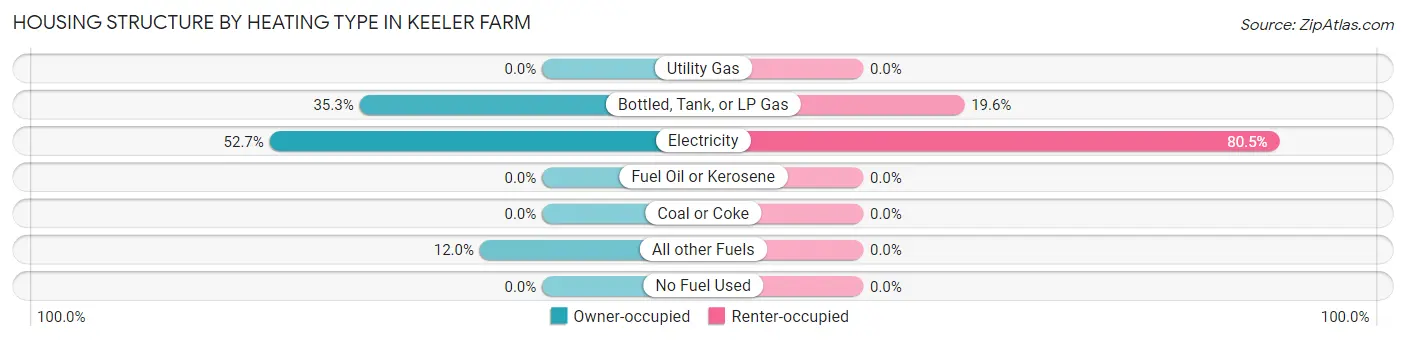
| Heating Type | Owner-occupied | Renter-occupied |
| Utility Gas | 0 (0.0%) | 0 (0.0%) |
| Bottled, Tank, or LP Gas | 126 (35.3%) | 26 (19.6%) |
| Electricity | 188 (52.7%) | 107 (80.4%) |
| Fuel Oil or Kerosene | 0 (0.0%) | 0 (0.0%) |
| Coal or Coke | 0 (0.0%) | 0 (0.0%) |
| All other Fuels | 43 (12.0%) | 0 (0.0%) |
| No Fuel Used | 0 (0.0%) | 0 (0.0%) |
| Total | 357 (100.0%) | 133 (100.0%) |
Household Vehicle Usage in Keeler Farm
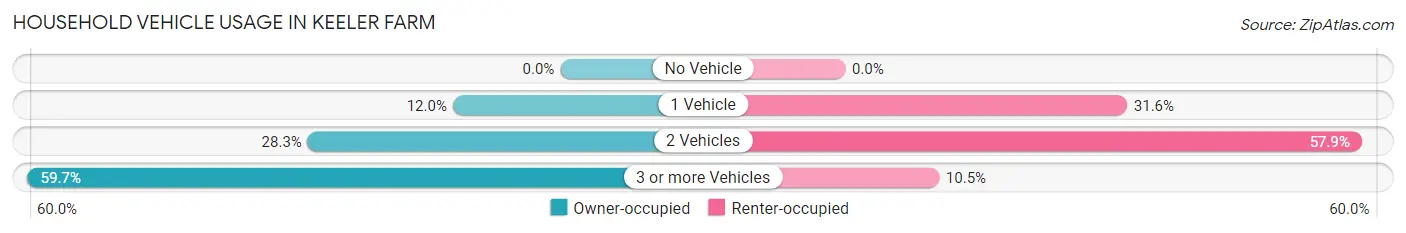
| Vehicles per Household | Owner-occupied | Renter-occupied |
| No Vehicle | 0 (0.0%) | 0 (0.0%) |
| 1 Vehicle | 43 (12.0%) | 42 (31.6%) |
| 2 Vehicles | 101 (28.3%) | 77 (57.9%) |
| 3 or more Vehicles | 213 (59.7%) | 14 (10.5%) |
| Total | 357 (100.0%) | 133 (100.0%) |
Real Estate & Mortgages in Keeler Farm
Real Estate and Mortgage Overview in Keeler Farm
| Characteristic | Without Mortgage | With Mortgage |
| Housing Units | 252 | 105 |
| Median Property Value | $135,800 | $105,500 |
| Median Household Income | $37,292 | $0 |
| Monthly Housing Costs | $393 | $0 |
| Real Estate Taxes | $621 | $0 |
Property Value by Mortgage Status in Keeler Farm
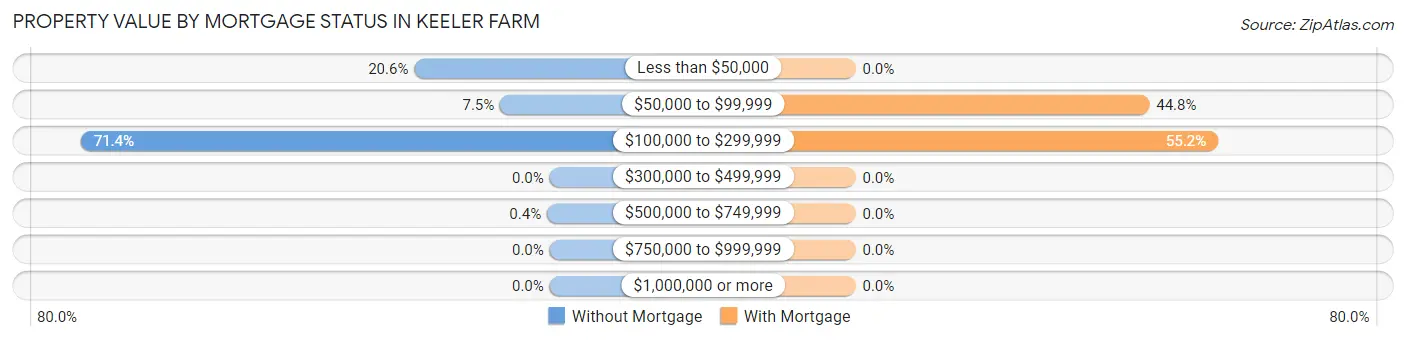
| Property Value | Without Mortgage | With Mortgage |
| Less than $50,000 | 52 (20.6%) | 0 (0.0%) |
| $50,000 to $99,999 | 19 (7.5%) | 47 (44.8%) |
| $100,000 to $299,999 | 180 (71.4%) | 58 (55.2%) |
| $300,000 to $499,999 | 0 (0.0%) | 0 (0.0%) |
| $500,000 to $749,999 | 1 (0.4%) | 0 (0.0%) |
| $750,000 to $999,999 | 0 (0.0%) | 0 (0.0%) |
| $1,000,000 or more | 0 (0.0%) | 0 (0.0%) |
| Total | 252 (100.0%) | 105 (100.0%) |
Household Income by Mortgage Status in Keeler Farm
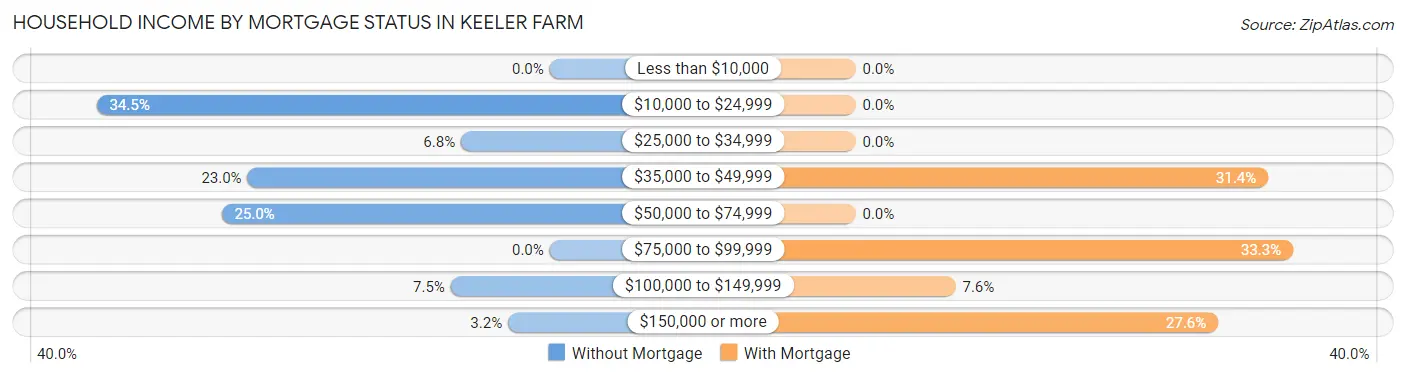
| Household Income | Without Mortgage | With Mortgage |
| Less than $10,000 | 0 (0.0%) | 0 (0.0%) |
| $10,000 to $24,999 | 87 (34.5%) | 0 (0.0%) |
| $25,000 to $34,999 | 17 (6.8%) | 0 (0.0%) |
| $35,000 to $49,999 | 58 (23.0%) | 33 (31.4%) |
| $50,000 to $74,999 | 63 (25.0%) | 0 (0.0%) |
| $75,000 to $99,999 | 0 (0.0%) | 35 (33.3%) |
| $100,000 to $149,999 | 19 (7.5%) | 8 (7.6%) |
| $150,000 or more | 8 (3.2%) | 29 (27.6%) |
| Total | 252 (100.0%) | 105 (100.0%) |
Property Value to Household Income Ratio in Keeler Farm
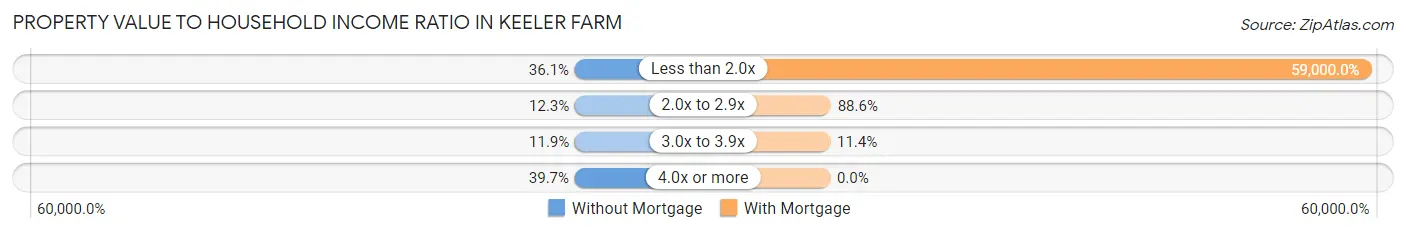
| Value-to-Income Ratio | Without Mortgage | With Mortgage |
| Less than 2.0x | 91 (36.1%) | 61,950 (59,000.0%) |
| 2.0x to 2.9x | 31 (12.3%) | 93 (88.6%) |
| 3.0x to 3.9x | 30 (11.9%) | 12 (11.4%) |
| 4.0x or more | 100 (39.7%) | 0 (0.0%) |
| Total | 252 (100.0%) | 105 (100.0%) |
Real Estate Taxes by Mortgage Status in Keeler Farm
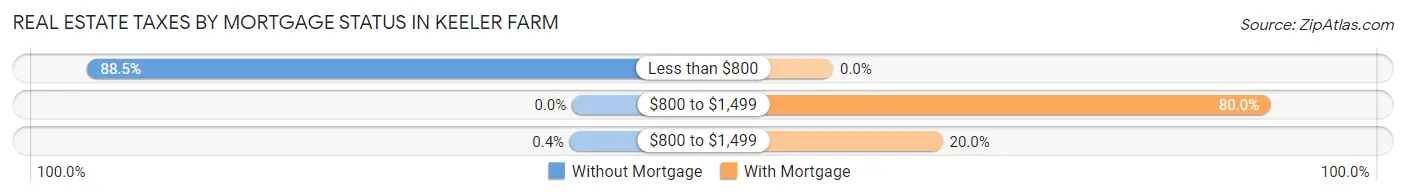
| Property Taxes | Without Mortgage | With Mortgage |
| Less than $800 | 223 (88.5%) | 0 (0.0%) |
| $800 to $1,499 | 0 (0.0%) | 84 (80.0%) |
| $800 to $1,499 | 1 (0.4%) | 21 (20.0%) |
| Total | 252 (100.0%) | 105 (100.0%) |
Health & Disability in Keeler Farm
Health Insurance Coverage by Age in Keeler Farm
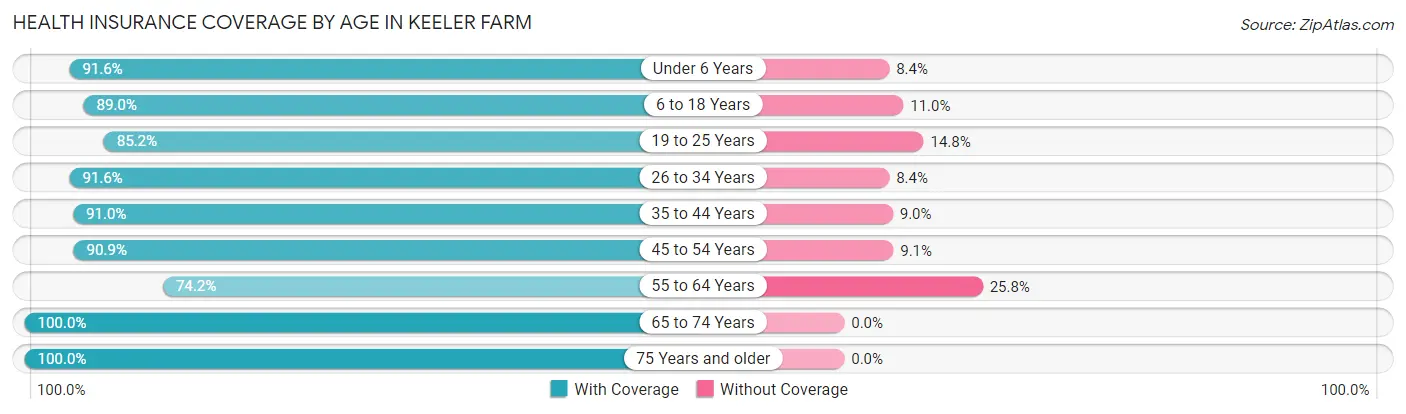
| Age Bracket | With Coverage | Without Coverage |
| Under 6 Years | 186 (91.6%) | 17 (8.4%) |
| 6 to 18 Years | 437 (89.0%) | 54 (11.0%) |
| 19 to 25 Years | 98 (85.2%) | 17 (14.8%) |
| 26 to 34 Years | 186 (91.6%) | 17 (8.4%) |
| 35 to 44 Years | 161 (91.0%) | 16 (9.0%) |
| 45 to 54 Years | 159 (90.9%) | 16 (9.1%) |
| 55 to 64 Years | 69 (74.2%) | 24 (25.8%) |
| 65 to 74 Years | 108 (100.0%) | 0 (0.0%) |
| 75 Years and older | 151 (100.0%) | 0 (0.0%) |
| Total | 1,555 (90.6%) | 161 (9.4%) |
Health Insurance Coverage by Citizenship Status in Keeler Farm
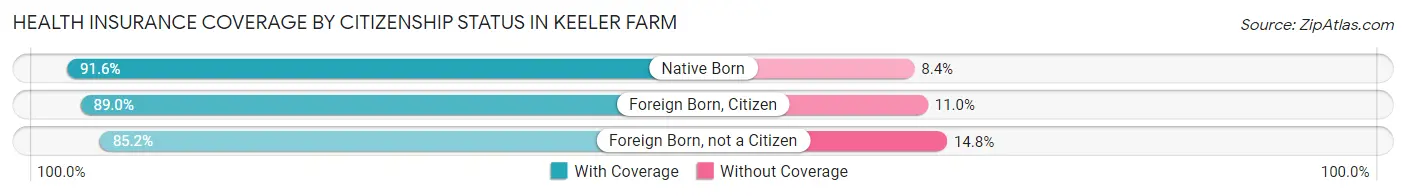
| Citizenship Status | With Coverage | Without Coverage |
| Native Born | 186 (91.6%) | 17 (8.4%) |
| Foreign Born, Citizen | 437 (89.0%) | 54 (11.0%) |
| Foreign Born, not a Citizen | 98 (85.2%) | 17 (14.8%) |
Health Insurance Coverage by Household Income in Keeler Farm
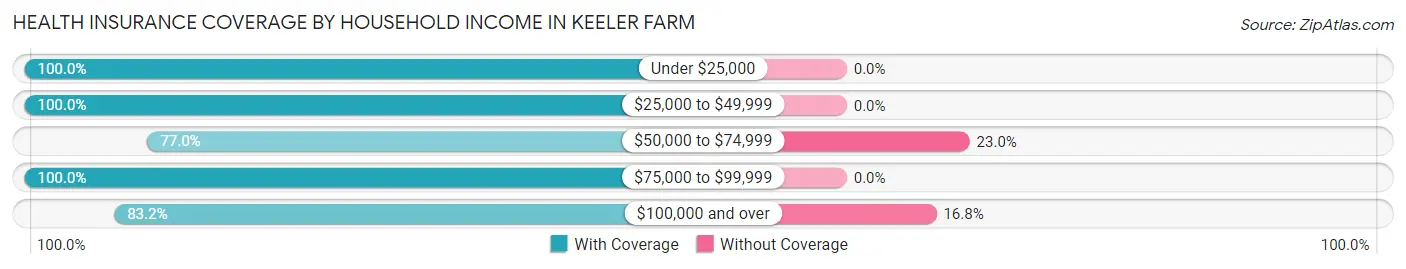
| Household Income | With Coverage | Without Coverage |
| Under $25,000 | 573 (100.0%) | 0 (0.0%) |
| $25,000 to $49,999 | 287 (100.0%) | 0 (0.0%) |
| $50,000 to $74,999 | 321 (77.0%) | 96 (23.0%) |
| $75,000 to $99,999 | 52 (100.0%) | 0 (0.0%) |
| $100,000 and over | 322 (83.2%) | 65 (16.8%) |
Public vs Private Health Insurance Coverage by Age in Keeler Farm
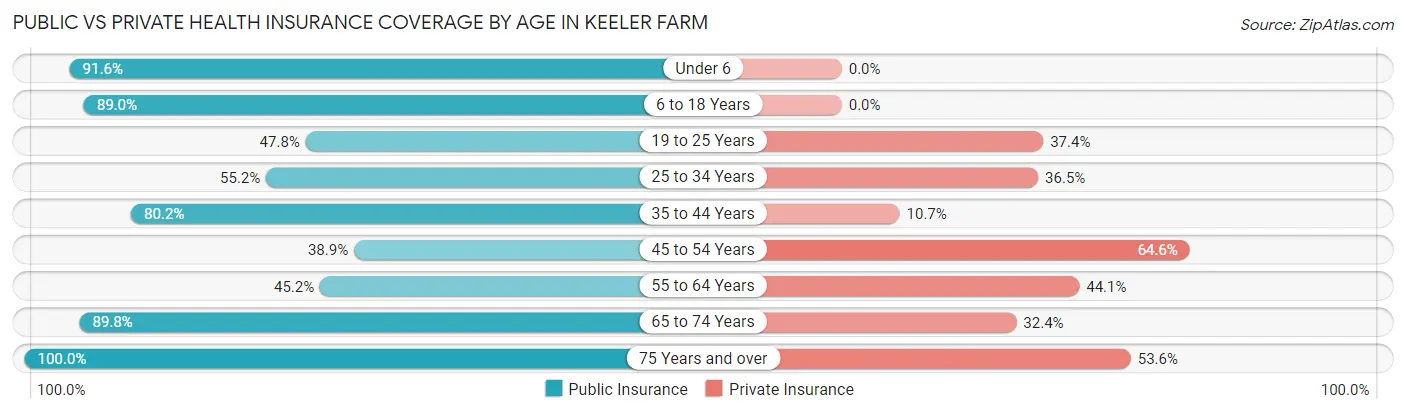
| Age Bracket | Public Insurance | Private Insurance |
| Under 6 | 186 (91.6%) | 0 (0.0%) |
| 6 to 18 Years | 437 (89.0%) | 0 (0.0%) |
| 19 to 25 Years | 55 (47.8%) | 43 (37.4%) |
| 25 to 34 Years | 112 (55.2%) | 74 (36.4%) |
| 35 to 44 Years | 142 (80.2%) | 19 (10.7%) |
| 45 to 54 Years | 68 (38.9%) | 113 (64.6%) |
| 55 to 64 Years | 42 (45.2%) | 41 (44.1%) |
| 65 to 74 Years | 97 (89.8%) | 35 (32.4%) |
| 75 Years and over | 151 (100.0%) | 81 (53.6%) |
| Total | 1,290 (75.2%) | 406 (23.7%) |
Disability Status by Sex by Age in Keeler Farm
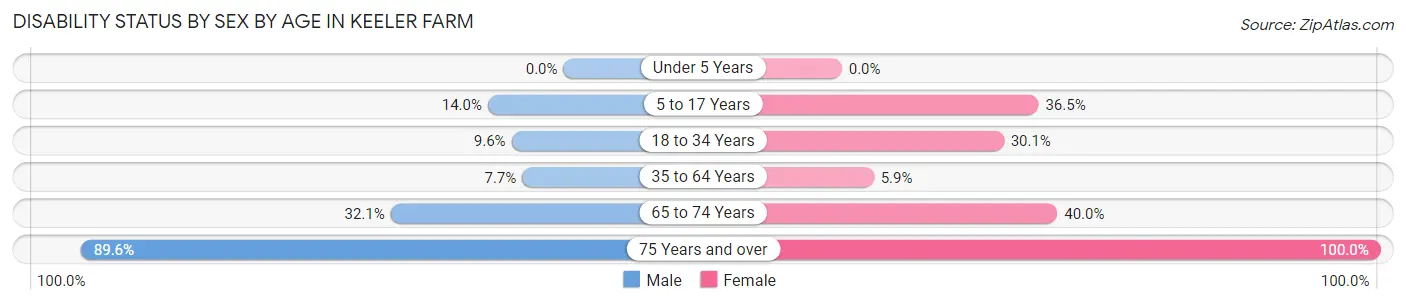
| Age Bracket | Male | Female |
| Under 5 Years | 0 (0.0%) | 0 (0.0%) |
| 5 to 17 Years | 60 (14.0%) | 23 (36.5%) |
| 18 to 34 Years | 13 (9.6%) | 55 (30.0%) |
| 35 to 64 Years | 16 (7.7%) | 14 (5.9%) |
| 65 to 74 Years | 17 (32.1%) | 22 (40.0%) |
| 75 Years and over | 120 (89.5%) | 17 (100.0%) |
Disability Class by Sex by Age in Keeler Farm
Disability Class: Hearing Difficulty
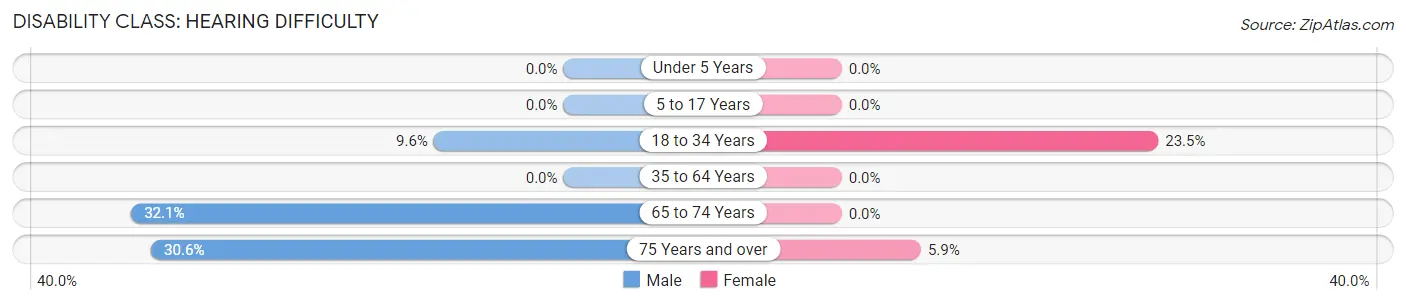
| Age Bracket | Male | Female |
| Under 5 Years | 0 (0.0%) | 0 (0.0%) |
| 5 to 17 Years | 0 (0.0%) | 0 (0.0%) |
| 18 to 34 Years | 13 (9.6%) | 43 (23.5%) |
| 35 to 64 Years | 0 (0.0%) | 0 (0.0%) |
| 65 to 74 Years | 17 (32.1%) | 0 (0.0%) |
| 75 Years and over | 41 (30.6%) | 1 (5.9%) |
Disability Class: Vision Difficulty
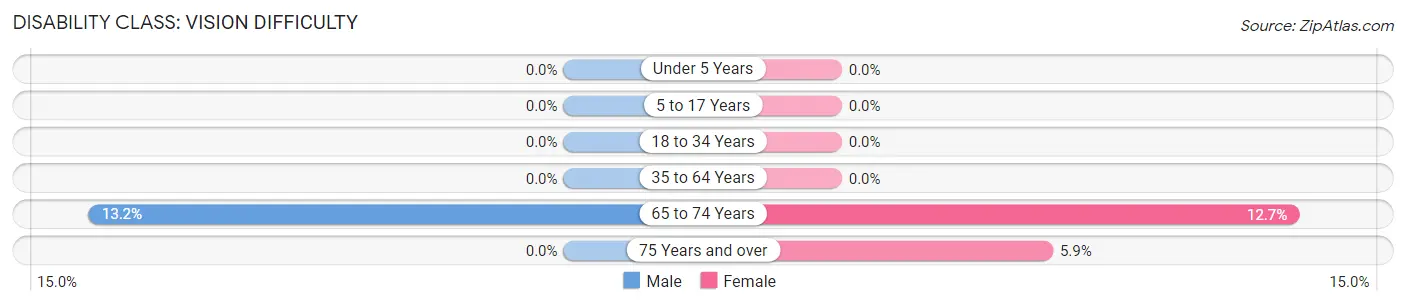
| Age Bracket | Male | Female |
| Under 5 Years | 0 (0.0%) | 0 (0.0%) |
| 5 to 17 Years | 0 (0.0%) | 0 (0.0%) |
| 18 to 34 Years | 0 (0.0%) | 0 (0.0%) |
| 35 to 64 Years | 0 (0.0%) | 0 (0.0%) |
| 65 to 74 Years | 7 (13.2%) | 7 (12.7%) |
| 75 Years and over | 0 (0.0%) | 1 (5.9%) |
Disability Class: Cognitive Difficulty
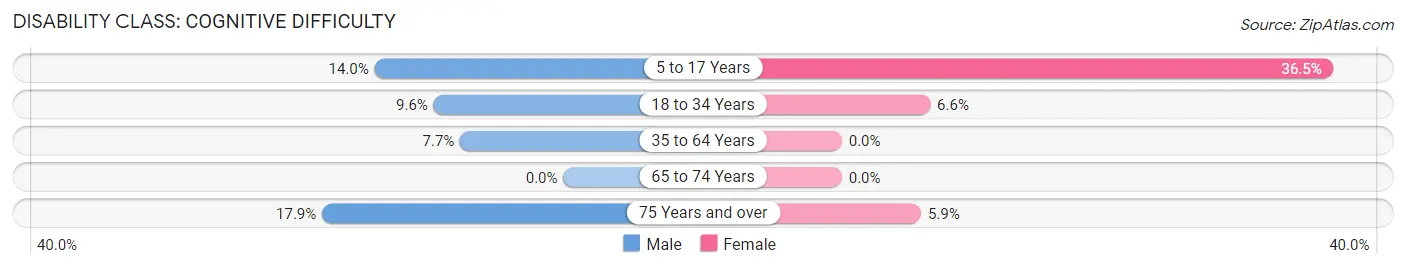
| Age Bracket | Male | Female |
| 5 to 17 Years | 60 (14.0%) | 23 (36.5%) |
| 18 to 34 Years | 13 (9.6%) | 12 (6.6%) |
| 35 to 64 Years | 16 (7.7%) | 0 (0.0%) |
| 65 to 74 Years | 0 (0.0%) | 0 (0.0%) |
| 75 Years and over | 24 (17.9%) | 1 (5.9%) |
Disability Class: Ambulatory Difficulty
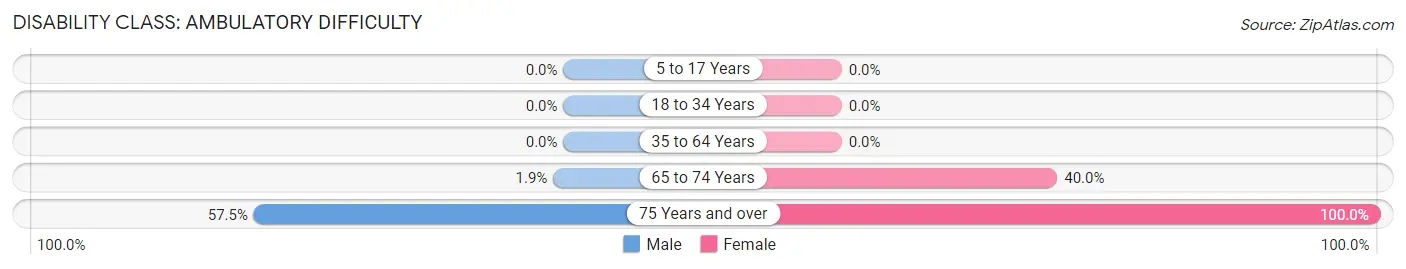
| Age Bracket | Male | Female |
| 5 to 17 Years | 0 (0.0%) | 0 (0.0%) |
| 18 to 34 Years | 0 (0.0%) | 0 (0.0%) |
| 35 to 64 Years | 0 (0.0%) | 0 (0.0%) |
| 65 to 74 Years | 1 (1.9%) | 22 (40.0%) |
| 75 Years and over | 77 (57.5%) | 17 (100.0%) |
Disability Class: Self-Care Difficulty
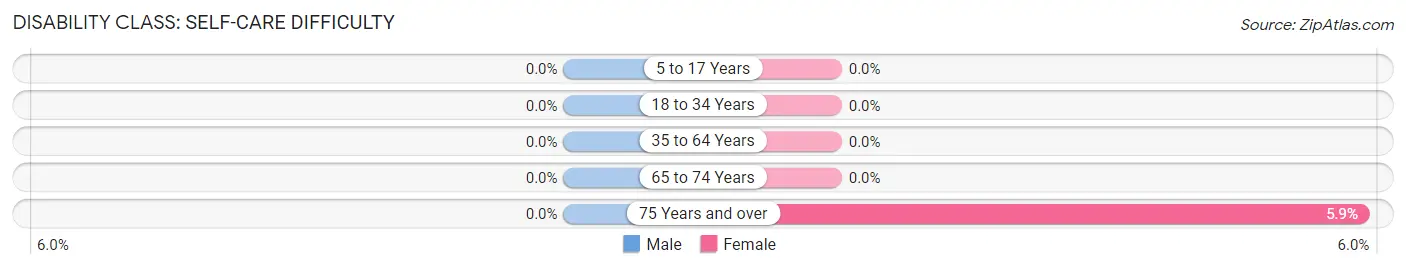
| Age Bracket | Male | Female |
| 5 to 17 Years | 0 (0.0%) | 0 (0.0%) |
| 18 to 34 Years | 0 (0.0%) | 0 (0.0%) |
| 35 to 64 Years | 0 (0.0%) | 0 (0.0%) |
| 65 to 74 Years | 0 (0.0%) | 0 (0.0%) |
| 75 Years and over | 0 (0.0%) | 1 (5.9%) |
Technology Access in Keeler Farm
Computing Device Access in Keeler Farm
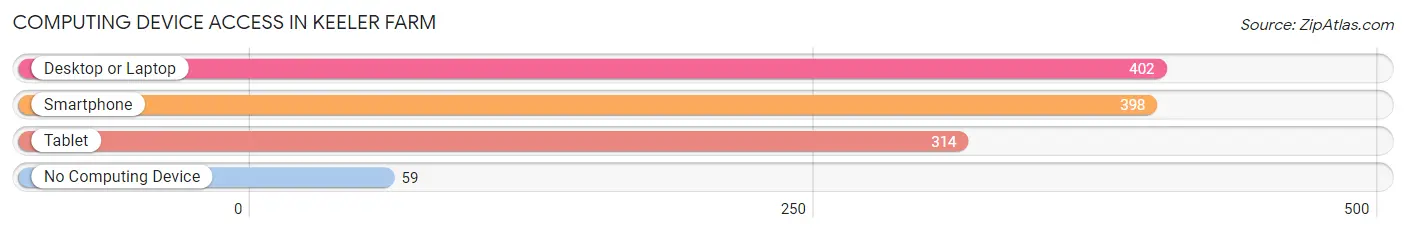
| Device Type | # Households | % Households |
| Desktop or Laptop | 402 | 82.0% |
| Smartphone | 398 | 81.2% |
| Tablet | 314 | 64.1% |
| No Computing Device | 59 | 12.0% |
| Total | 490 | 100.0% |
Internet Access in Keeler Farm
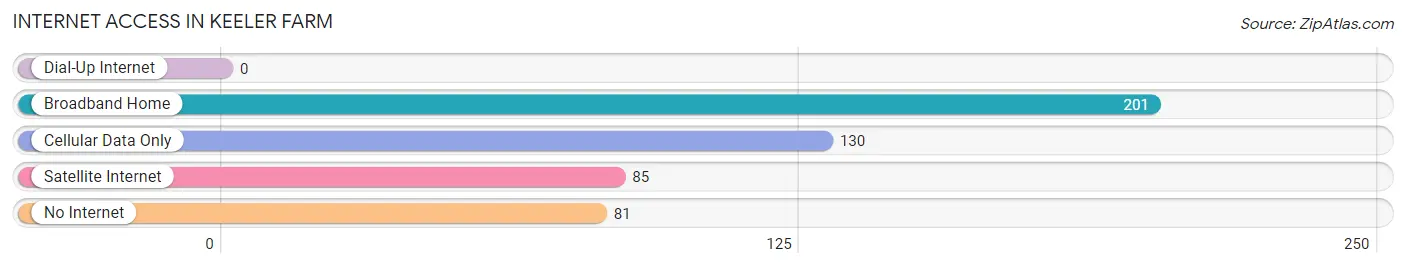
| Internet Type | # Households | % Households |
| Dial-Up Internet | 0 | 0.0% |
| Broadband Home | 201 | 41.0% |
| Cellular Data Only | 130 | 26.5% |
| Satellite Internet | 85 | 17.3% |
| No Internet | 81 | 16.5% |
| Total | 490 | 100.0% |
Keeler Farm Summary
Keeler Farm is a small rural community located in the state of New Mexico. It is situated in the southeastern corner of the state, near the border with Texas. The community is located in the Chaves County, and is part of the Roswell Micropolitan Statistical Area. The population of Keeler Farm was estimated to be around 1,000 people in 2020.
History
Keeler Farm was founded in the late 19th century by a family of farmers from the Midwest. The family, led by John Keeler, moved to the area in search of better land and a better life. The family settled in the area and began to farm the land. The family was successful in their endeavors and the community of Keeler Farm was established.
The community of Keeler Farm has remained relatively small and isolated throughout its history. The population of the community has remained relatively stable over the years, with only a few changes in population. The community has remained largely agricultural, with the majority of the population engaged in farming and ranching.
Geography
Keeler Farm is located in the southeastern corner of New Mexico, near the border with Texas. The community is situated in the Chaves County, and is part of the Roswell Micropolitan Statistical Area. The community is located in a semi-arid region of the state, with an average annual precipitation of around 12 inches. The area is characterized by rolling hills and flat plains, with the majority of the land being used for agricultural purposes.
The climate of the area is generally mild, with temperatures ranging from the low 30s in the winter to the high 90s in the summer. The area is prone to occasional droughts, but is generally considered to be a relatively safe and stable environment.
Economy
The economy of Keeler Farm is largely based on agriculture. The majority of the population is engaged in farming and ranching, with the majority of the land being used for agricultural purposes. The community is also home to a few small businesses, such as a grocery store, a gas station, and a few restaurants.
The community is also home to a few small manufacturing businesses, such as a furniture factory and a metal fabrication shop. The community is also home to a few small service businesses, such as a barber shop and a beauty salon.
Demographics
The population of Keeler Farm was estimated to be around 1,000 people in 2020. The majority of the population is of Hispanic or Latino origin, with the majority of the population being of Mexican descent. The population is also largely rural, with the majority of the population living in rural areas. The median household income in the community is around $30,000, and the median home value is around $100,000. The unemployment rate in the community is around 5%, which is slightly higher than the national average.
Common Questions
What is Per Capita Income in Keeler Farm?
Per Capita income in Keeler Farm is $17,779.
What is the Median Family Income in Keeler Farm?
Median Family Income in Keeler Farm is $36,615.
What is the Median Household income in Keeler Farm?
Median Household Income in Keeler Farm is $49,231.
What is Income or Wage Gap in Keeler Farm?
Income or Wage Gap in Keeler Farm is 73.6%.
Women in Keeler Farm earn 26.4 cents for every dollar earned by a man.
What is Inequality or Gini Index in Keeler Farm?
Inequality or Gini Index in Keeler Farm is 0.38.
What is the Total Population of Keeler Farm?
Total Population of Keeler Farm is 1,716.
What is the Total Male Population of Keeler Farm?
Total Male Population of Keeler Farm is 975.
What is the Total Female Population of Keeler Farm?
Total Female Population of Keeler Farm is 741.
What is the Ratio of Males per 100 Females in Keeler Farm?
There are 131.58 Males per 100 Females in Keeler Farm.
What is the Ratio of Females per 100 Males in Keeler Farm?
There are 76.00 Females per 100 Males in Keeler Farm.
What is the Median Population Age in Keeler Farm?
Median Population Age in Keeler Farm is 27.9 Years.
What is the Average Family Size in Keeler Farm
Average Family Size in Keeler Farm is 5.0 People.
What is the Average Household Size in Keeler Farm
Average Household Size in Keeler Farm is 3.5 People.
How Large is the Labor Force in Keeler Farm?
There are 503 People in the Labor Forcein in Keeler Farm.
What is the Percentage of People in the Labor Force in Keeler Farm?
45.8% of People are in the Labor Force in Keeler Farm.
What is the Unemployment Rate in Keeler Farm?
Unemployment Rate in Keeler Farm is 21.3%.