Rio Communities, NM Map & Demographics
Rio Communities Map
Rio Communities Overview
$25,143
PER CAPITA INCOME
$69,643
AVG FAMILY INCOME
$45,179
AVG HOUSEHOLD INCOME
0.43
INEQUALITY / GINI INDEX
4,913
TOTAL POPULATION
2,117
MALE POPULATION
2,796
FEMALE POPULATION
75.72
MALES / 100 FEMALES
132.07
FEMALES / 100 MALES
51.9
MEDIAN AGE
3.3
AVG FAMILY SIZE
2.6
AVG HOUSEHOLD SIZE
1,942
LABOR FORCE [ PEOPLE ]
44.8%
PERCENT IN LABOR FORCE
14.5%
UNEMPLOYMENT RATE
Rio Communities Area Codes
Income in Rio Communities
Income Overview in Rio Communities
Per Capita Income in Rio Communities is $25,143, while median incomes of families and households are $69,643 and $45,179 respectively.
| Characteristic | Number | Measure |
| Per Capita Income | 4,913 | $25,143 |
| Median Family Income | 1,252 | $69,643 |
| Mean Family Income | 1,252 | $69,464 |
| Median Household Income | 1,897 | $45,179 |
| Mean Household Income | 1,897 | $59,310 |
| Income Deficit | 1,252 | $0 |
| Wage / Income Gap (%) | 4,913 | 0.00% |
| Wage / Income Gap ($) | 4,913 | 100.00¢ per $1 |
| Gini / Inequality Index | 4,913 | 0.43 |
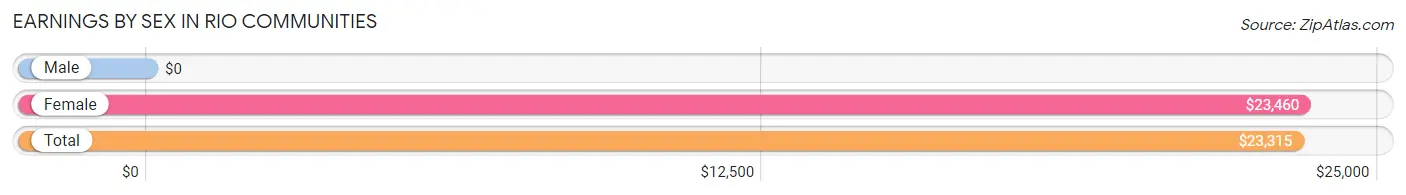
Earnings by Sex in Rio Communities
| Sex | Number | Average Earnings |
| Male | 976 (47.3%) | $0 |
| Female | 1,087 (52.7%) | $23,460 |
| Total | 2,063 (100.0%) | $23,315 |
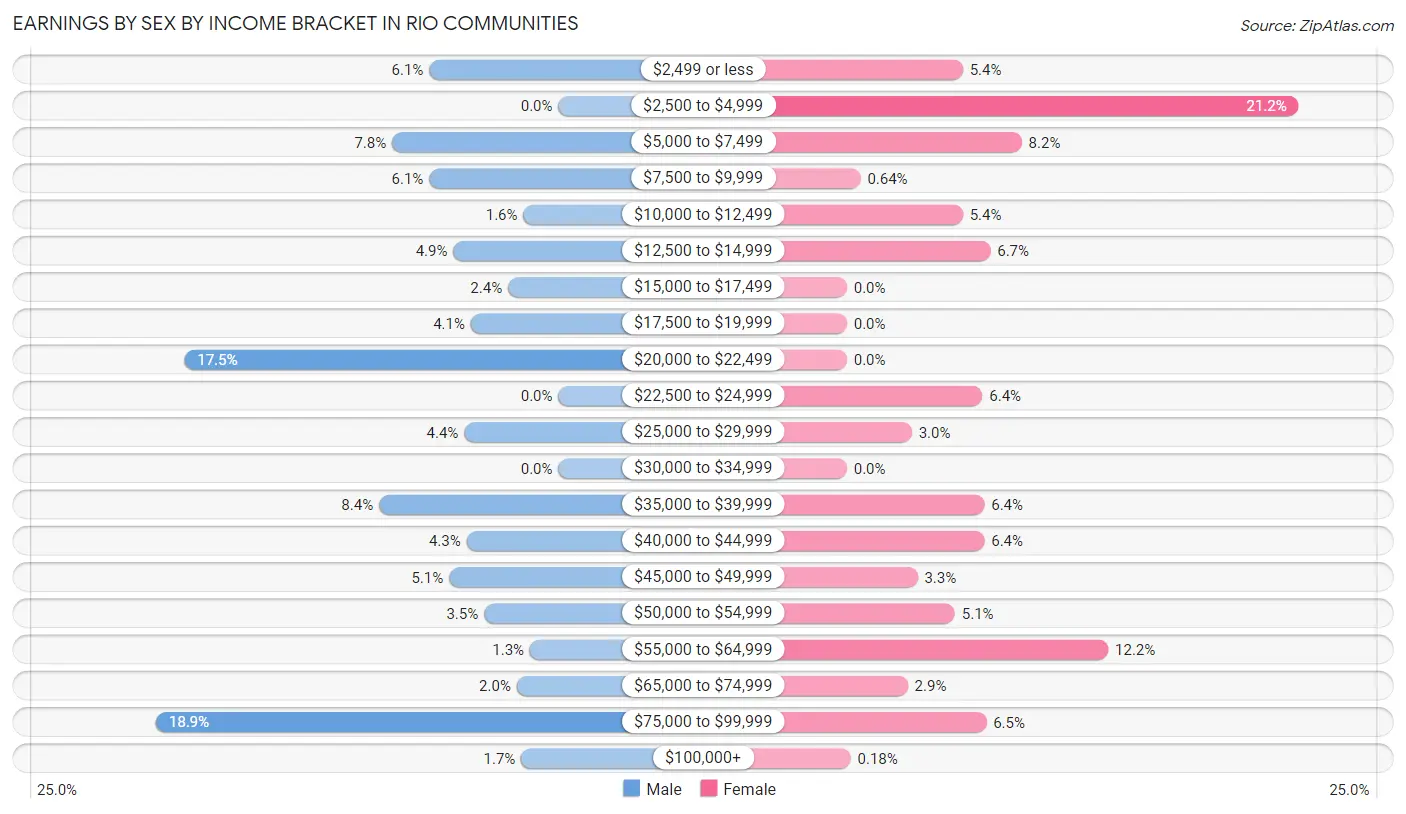
Earnings by Sex by Income Bracket in Rio Communities
The most common earnings brackets in Rio Communities are $75,000 to $99,999 for men (184 | 18.9%) and $2,500 to $4,999 for women (230 | 21.2%).
| Income | Male | Female |
| $2,499 or less | 59 (6.0%) | 59 (5.4%) |
| $2,500 to $4,999 | 0 (0.0%) | 230 (21.2%) |
| $5,000 to $7,499 | 76 (7.8%) | 89 (8.2%) |
| $7,500 to $9,999 | 59 (6.0%) | 7 (0.6%) |
| $10,000 to $12,499 | 16 (1.6%) | 59 (5.4%) |
| $12,500 to $14,999 | 48 (4.9%) | 73 (6.7%) |
| $15,000 to $17,499 | 23 (2.4%) | 0 (0.0%) |
| $17,500 to $19,999 | 40 (4.1%) | 0 (0.0%) |
| $20,000 to $22,499 | 171 (17.5%) | 0 (0.0%) |
| $22,500 to $24,999 | 0 (0.0%) | 69 (6.4%) |
| $25,000 to $29,999 | 43 (4.4%) | 33 (3.0%) |
| $30,000 to $34,999 | 0 (0.0%) | 0 (0.0%) |
| $35,000 to $39,999 | 82 (8.4%) | 70 (6.4%) |
| $40,000 to $44,999 | 42 (4.3%) | 70 (6.4%) |
| $45,000 to $49,999 | 50 (5.1%) | 36 (3.3%) |
| $50,000 to $54,999 | 34 (3.5%) | 55 (5.1%) |
| $55,000 to $64,999 | 13 (1.3%) | 133 (12.2%) |
| $65,000 to $74,999 | 19 (1.9%) | 31 (2.9%) |
| $75,000 to $99,999 | 184 (18.9%) | 71 (6.5%) |
| $100,000+ | 17 (1.7%) | 2 (0.2%) |
| Total | 976 (100.0%) | 1,087 (100.0%) |
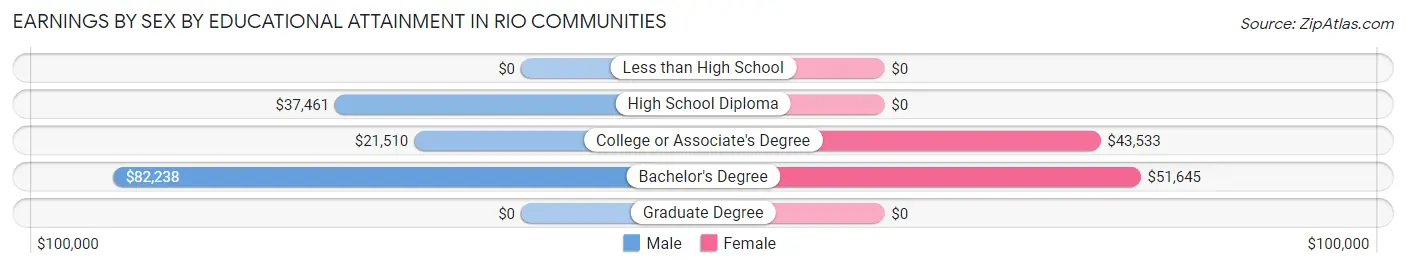
Earnings by Sex by Educational Attainment in Rio Communities
Average earnings in Rio Communities are $36,052 for men and $40,186 for women, a difference of 10.3%. Men with an educational attainment of bachelor's degree enjoy the highest average annual earnings of $82,238, while those with college or associate's degree education earn the least with $21,510. Women with an educational attainment of bachelor's degree earn the most with the average annual earnings of $51,645, while those with college or associate's degree education have the smallest earnings of $43,533.
| Educational Attainment | Male Income | Female Income |
| Less than High School | - | - |
| High School Diploma | $37,461 | $0 |
| College or Associate's Degree | $21,510 | $43,533 |
| Bachelor's Degree | $82,238 | $51,645 |
| Graduate Degree | - | - |
| Total | $36,052 | $40,186 |
Family Income in Rio Communities
Family Income Brackets in Rio Communities
According to the Rio Communities family income data, there are 240 families falling into the $100,000 to $149,999 income range, which is the most common income bracket and makes up 19.2% of all families. Conversely, the $200,000+ income bracket is the least frequent group with only 3 families (0.2%) belonging to this category.
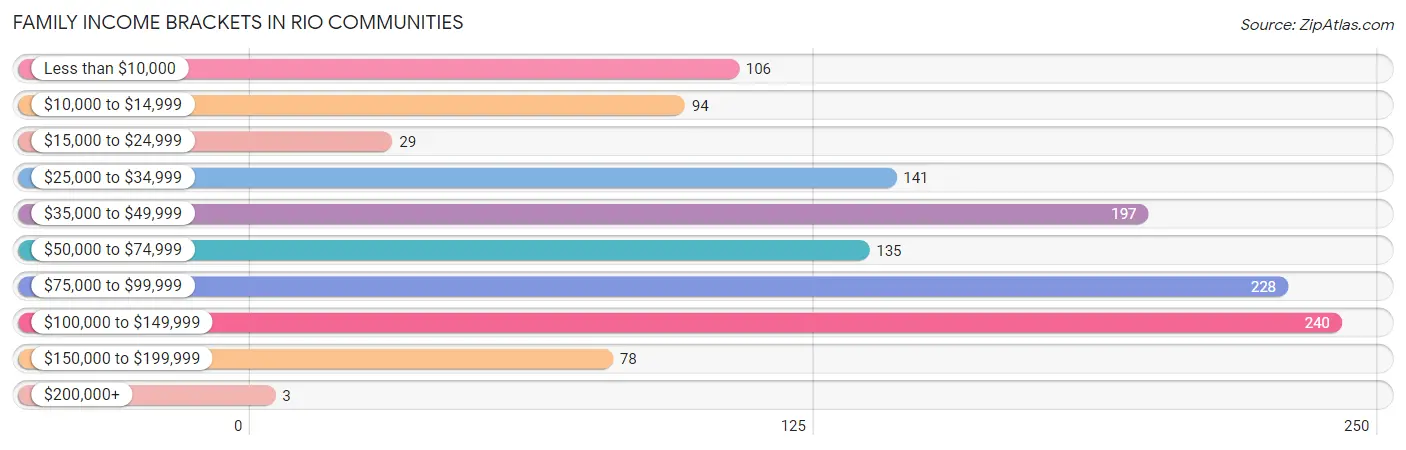
| Income Bracket | # Families | % Families |
| Less than $10,000 | 106 | 8.5% |
| $10,000 to $14,999 | 94 | 7.5% |
| $15,000 to $24,999 | 29 | 2.3% |
| $25,000 to $34,999 | 141 | 11.3% |
| $35,000 to $49,999 | 197 | 15.7% |
| $50,000 to $74,999 | 135 | 10.8% |
| $75,000 to $99,999 | 228 | 18.2% |
| $100,000 to $149,999 | 240 | 19.2% |
| $150,000 to $199,999 | 78 | 6.2% |
| $200,000+ | 3 | 0.2% |
Family Income by Famaliy Size in Rio Communities
5-person families (55 | 4.4%) account for the highest median family income in Rio Communities with $91,350 per family, while 2-person families (740 | 59.1%) have the highest median income of $36,716 per family member.
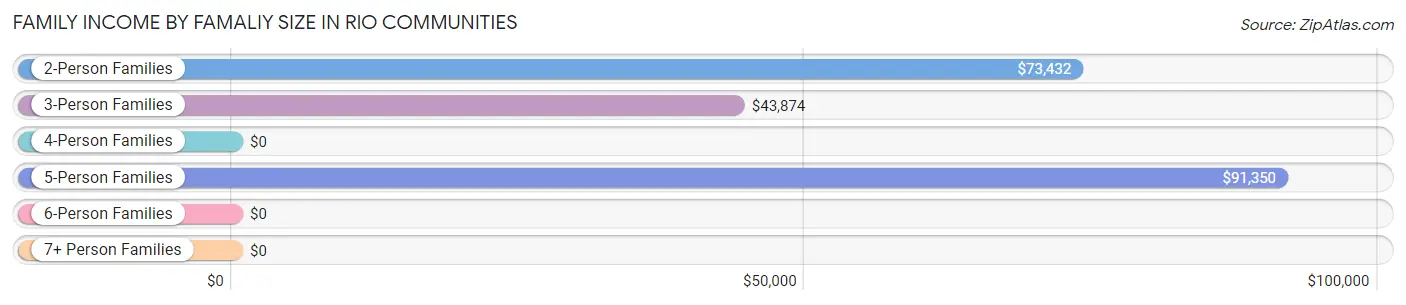
| Income Bracket | # Families | Median Income |
| 2-Person Families | 740 (59.1%) | $73,432 |
| 3-Person Families | 338 (27.0%) | $43,874 |
| 4-Person Families | 68 (5.4%) | $0 |
| 5-Person Families | 55 (4.4%) | $91,350 |
| 6-Person Families | 51 (4.1%) | $0 |
| 7+ Person Families | 0 (0.0%) | $0 |
| Total | 1,252 (100.0%) | $69,643 |
Family Income by Number of Earners in Rio Communities
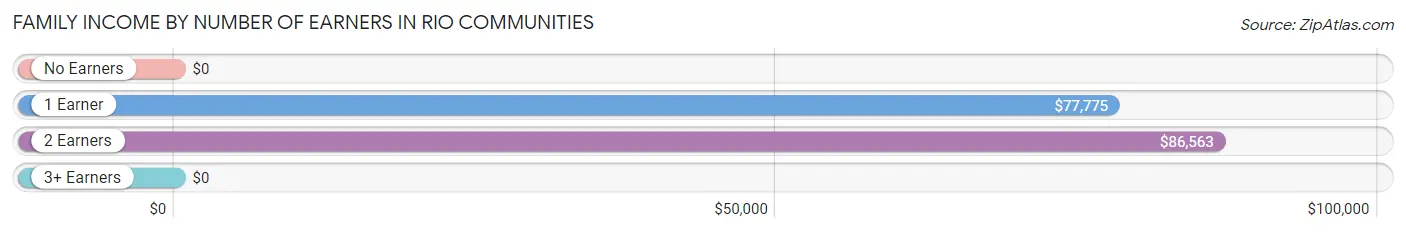
| Number of Earners | # Families | Median Income |
| No Earners | 386 (30.8%) | $0 |
| 1 Earner | 526 (42.0%) | $77,775 |
| 2 Earners | 306 (24.4%) | $86,563 |
| 3+ Earners | 34 (2.7%) | $0 |
| Total | 1,252 (100.0%) | $69,643 |
Household Income in Rio Communities
Household Income Brackets in Rio Communities
With 309 households falling in the category, the $75,000 to $99,999 income range is the most frequent in Rio Communities, accounting for 16.3% of all households. In contrast, only 4 households (0.2%) fall into the $200,000+ income bracket, making it the least populous group.
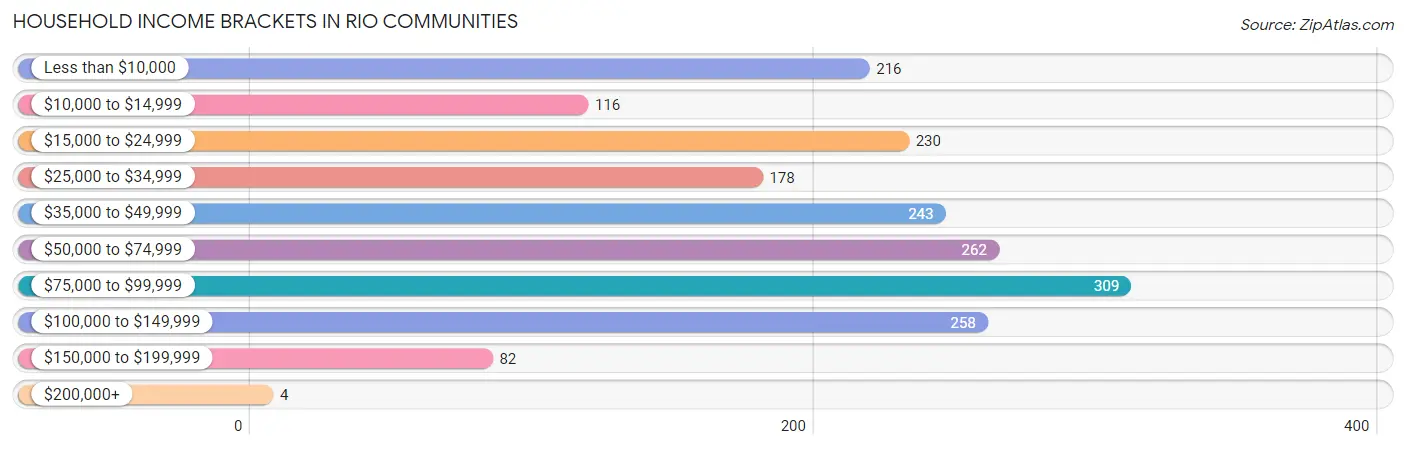
| Income Bracket | # Households | % Households |
| Less than $10,000 | 216 | 11.4% |
| $10,000 to $14,999 | 116 | 6.1% |
| $15,000 to $24,999 | 230 | 12.1% |
| $25,000 to $34,999 | 178 | 9.4% |
| $35,000 to $49,999 | 243 | 12.8% |
| $50,000 to $74,999 | 262 | 13.8% |
| $75,000 to $99,999 | 309 | 16.3% |
| $100,000 to $149,999 | 258 | 13.6% |
| $150,000 to $199,999 | 82 | 4.3% |
| $200,000+ | 4 | 0.2% |
Household Income by Householder Age in Rio Communities
The median household income in Rio Communities is $45,179, with the highest median household income of $68,750 found in the 25 to 44 years age bracket for the primary householder. A total of 277 households (14.6%) fall into this category.
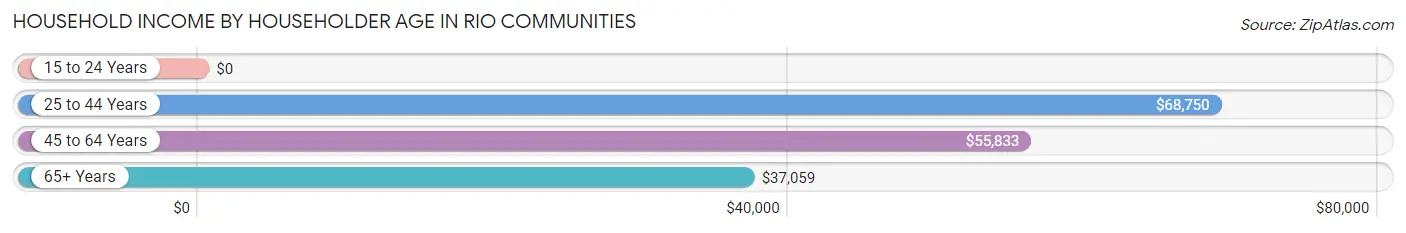
| Income Bracket | # Households | Median Income |
| 15 to 24 Years | 0 (0.0%) | $0 |
| 25 to 44 Years | 277 (14.6%) | $68,750 |
| 45 to 64 Years | 850 (44.8%) | $55,833 |
| 65+ Years | 770 (40.6%) | $37,059 |
| Total | 1,897 (100.0%) | $45,179 |
Poverty in Rio Communities
Income Below Poverty by Sex and Age in Rio Communities
With 13.2% poverty level for males and 19.8% for females among the residents of Rio Communities, 18 to 24 year old males and 65 to 74 year old females are the most vulnerable to poverty, with 144 males (52.9%) and 110 females (44.5%) in their respective age groups living below the poverty level.
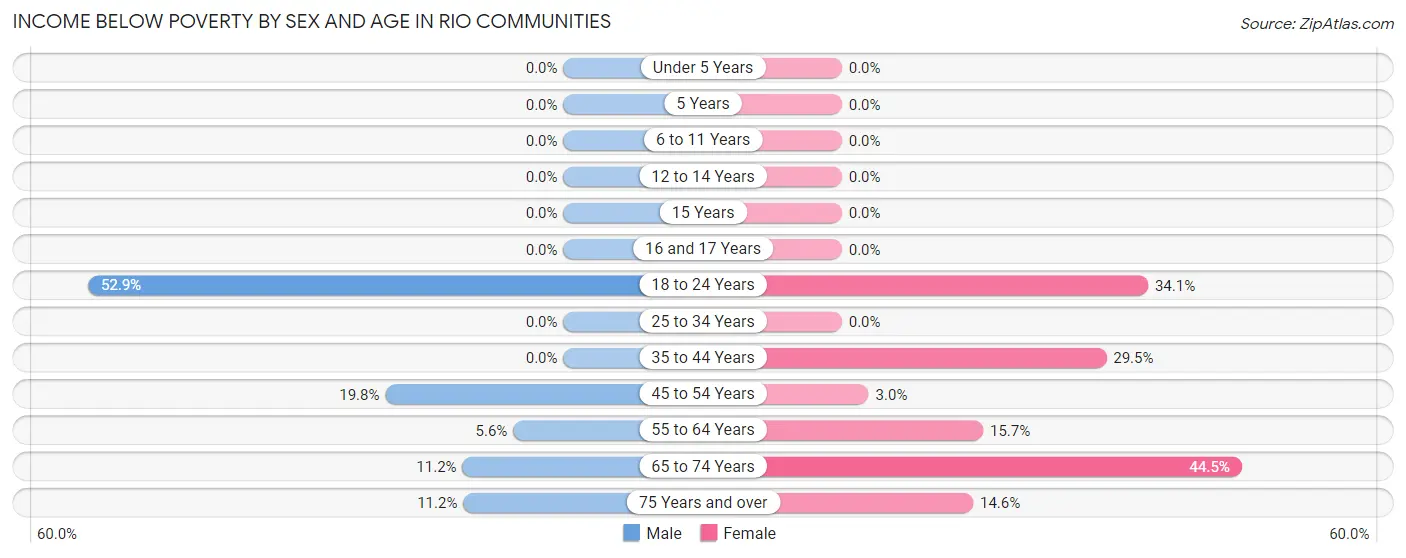
| Age Bracket | Male | Female |
| Under 5 Years | 0 (0.0%) | 0 (0.0%) |
| 5 Years | 0 (0.0%) | 0 (0.0%) |
| 6 to 11 Years | 0 (0.0%) | 0 (0.0%) |
| 12 to 14 Years | 0 (0.0%) | 0 (0.0%) |
| 15 Years | 0 (0.0%) | 0 (0.0%) |
| 16 and 17 Years | 0 (0.0%) | 0 (0.0%) |
| 18 to 24 Years | 144 (52.9%) | 177 (34.1%) |
| 25 to 34 Years | 0 (0.0%) | 0 (0.0%) |
| 35 to 44 Years | 0 (0.0%) | 76 (29.5%) |
| 45 to 54 Years | 46 (19.8%) | 4 (3.0%) |
| 55 to 64 Years | 16 (5.6%) | 120 (15.7%) |
| 65 to 74 Years | 40 (11.2%) | 110 (44.5%) |
| 75 Years and over | 33 (11.2%) | 63 (14.6%) |
| Total | 279 (13.2%) | 550 (19.8%) |
Income Above Poverty by Sex and Age in Rio Communities
According to the poverty statistics in Rio Communities, males aged under 5 years and females aged under 5 years are the age groups that are most secure financially, with 100.0% of males and 100.0% of females in these age groups living above the poverty line.
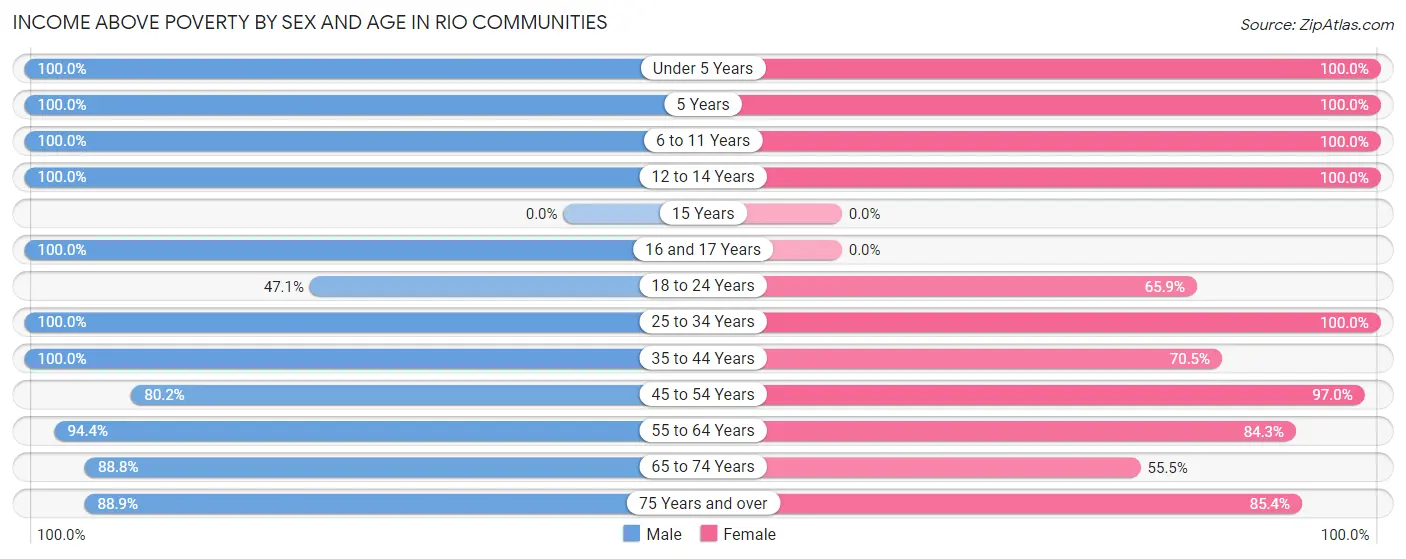
| Age Bracket | Male | Female |
| Under 5 Years | 58 (100.0%) | 46 (100.0%) |
| 5 Years | 38 (100.0%) | 30 (100.0%) |
| 6 to 11 Years | 85 (100.0%) | 128 (100.0%) |
| 12 to 14 Years | 64 (100.0%) | 111 (100.0%) |
| 15 Years | 0 (0.0%) | 0 (0.0%) |
| 16 and 17 Years | 50 (100.0%) | 0 (0.0%) |
| 18 to 24 Years | 128 (47.1%) | 342 (65.9%) |
| 25 to 34 Years | 168 (100.0%) | 110 (100.0%) |
| 35 to 44 Years | 212 (100.0%) | 182 (70.5%) |
| 45 to 54 Years | 186 (80.2%) | 130 (97.0%) |
| 55 to 64 Years | 270 (94.4%) | 643 (84.3%) |
| 65 to 74 Years | 316 (88.8%) | 137 (55.5%) |
| 75 Years and over | 263 (88.8%) | 368 (85.4%) |
| Total | 1,838 (86.8%) | 2,227 (80.2%) |
Income Below Poverty Among Married-Couple Families in Rio Communities
The poverty statistics for married-couple families in Rio Communities show that 8.5% or 73 of the total 864 families live below the poverty line. Families with no children have the highest poverty rate of 10.7%, comprising of 73 families. On the other hand, families with 1 or 2 children have the lowest poverty rate of 0.0%, which includes 0 families.
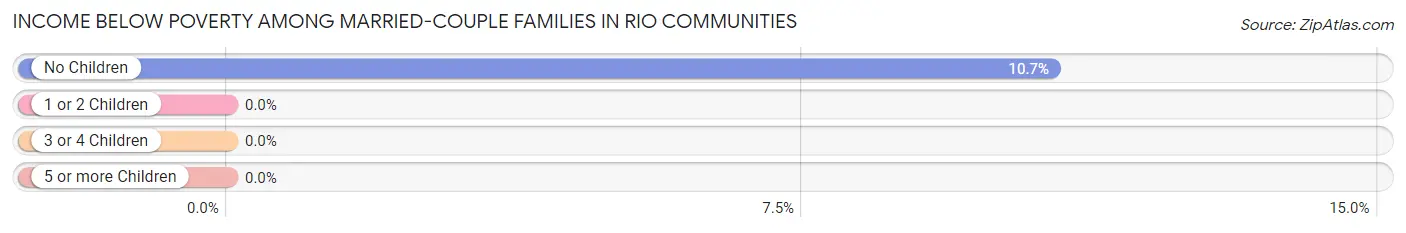
| Children | Above Poverty | Below Poverty |
| No Children | 607 (89.3%) | 73 (10.7%) |
| 1 or 2 Children | 121 (100.0%) | 0 (0.0%) |
| 3 or 4 Children | 63 (100.0%) | 0 (0.0%) |
| 5 or more Children | 0 (0.0%) | 0 (0.0%) |
| Total | 791 (91.5%) | 73 (8.5%) |
Income Below Poverty Among Single-Parent Households in Rio Communities
According to the poverty data in Rio Communities, 11.2% or 16 single-father households and 57.1% or 140 single-mother households are living below the poverty line. Among single-father households, those with no children have the highest poverty rate, with 16 households (16.0%) experiencing poverty. Likewise, among single-mother households, those with no children have the highest poverty rate, with 140 households (57.1%) falling below the poverty line.
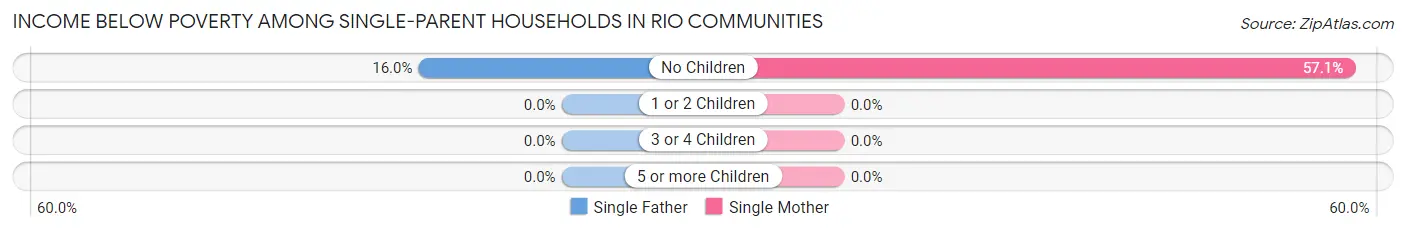
| Children | Single Father | Single Mother |
| No Children | 16 (16.0%) | 140 (57.1%) |
| 1 or 2 Children | 0 (0.0%) | 0 (0.0%) |
| 3 or 4 Children | 0 (0.0%) | 0 (0.0%) |
| 5 or more Children | 0 (0.0%) | 0 (0.0%) |
| Total | 16 (11.2%) | 140 (57.1%) |
Income Below Poverty Among Married-Couple vs Single-Parent Households in Rio Communities
The poverty data for Rio Communities shows that 73 of the married-couple family households (8.5%) and 156 of the single-parent households (40.2%) are living below the poverty level. Within the married-couple family households, those with no children have the highest poverty rate, with 73 households (10.7%) falling below the poverty line. Among the single-parent households, those with no children have the highest poverty rate, with 156 household (45.2%) living below poverty.
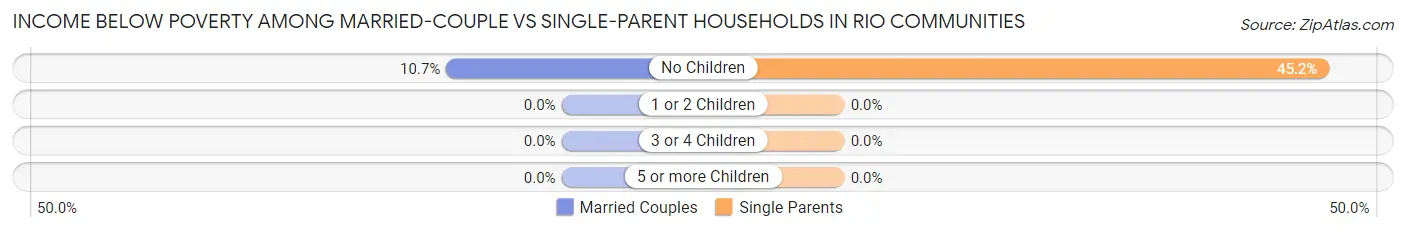
| Children | Married-Couple Families | Single-Parent Households |
| No Children | 73 (10.7%) | 156 (45.2%) |
| 1 or 2 Children | 0 (0.0%) | 0 (0.0%) |
| 3 or 4 Children | 0 (0.0%) | 0 (0.0%) |
| 5 or more Children | 0 (0.0%) | 0 (0.0%) |
| Total | 73 (8.5%) | 156 (40.2%) |
Race in Rio Communities
The most populous races in Rio Communities are White / Caucasian (3,441 | 70.0%), Hispanic or Latino (2,305 | 46.9%), and Some other Race (695 | 14.1%).
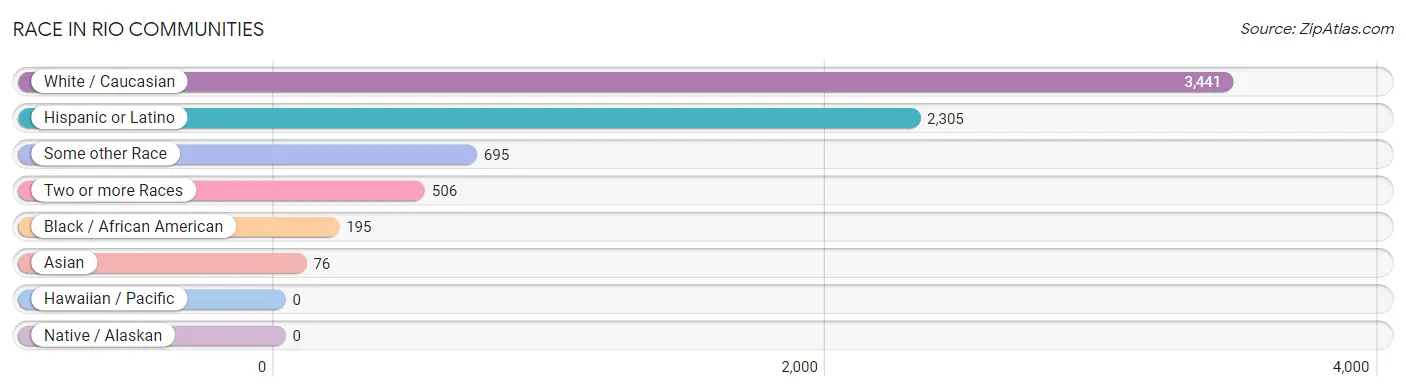
| Race | # Population | % Population |
| Asian | 76 | 1.5% |
| Black / African American | 195 | 4.0% |
| Hawaiian / Pacific | 0 | 0.0% |
| Hispanic or Latino | 2,305 | 46.9% |
| Native / Alaskan | 0 | 0.0% |
| White / Caucasian | 3,441 | 70.0% |
| Two or more Races | 506 | 10.3% |
| Some other Race | 695 | 14.1% |
| Total | 4,913 | 100.0% |
Ancestry in Rio Communities
The most populous ancestries reported in Rio Communities are Mexican (1,296 | 26.4%), German (525 | 10.7%), English (396 | 8.1%), Irish (393 | 8.0%), and Spanish (384 | 7.8%), together accounting for 61.0% of all Rio Communities residents.
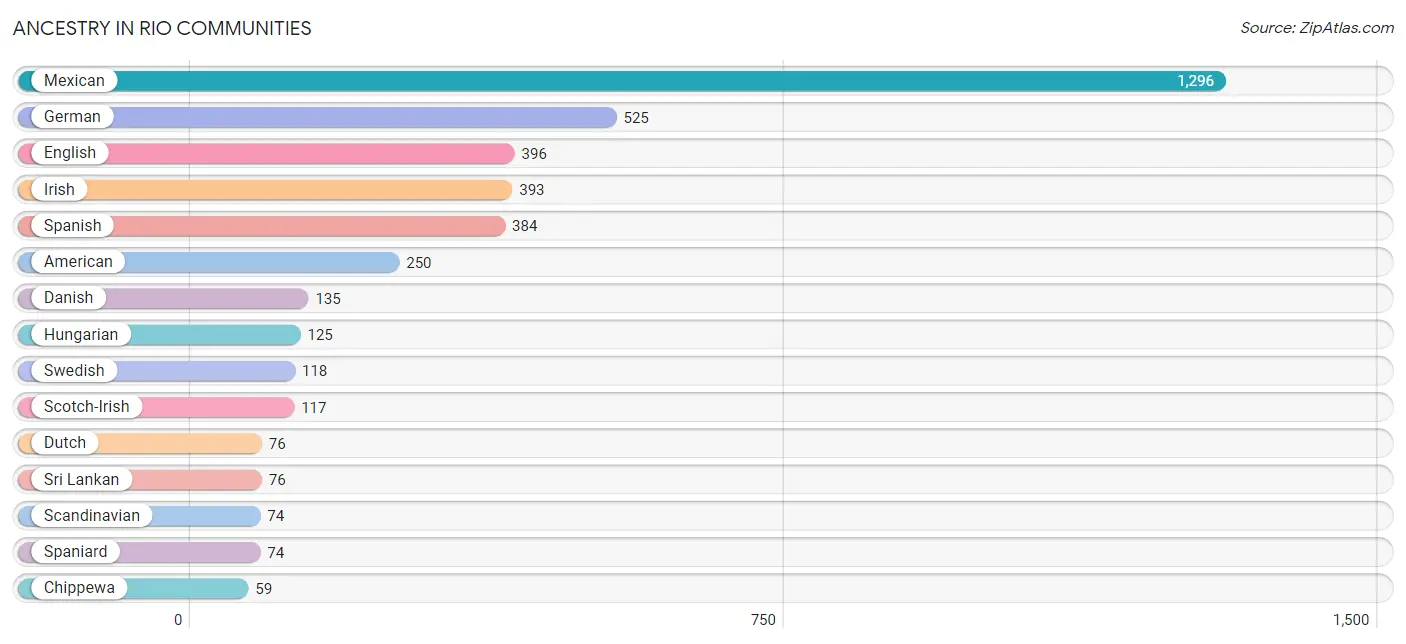
| Ancestry | # Population | % Population |
| American | 250 | 5.1% |
| Belgian | 11 | 0.2% |
| British | 24 | 0.5% |
| Chippewa | 59 | 1.2% |
| Czechoslovakian | 19 | 0.4% |
| Danish | 135 | 2.8% |
| Dutch | 76 | 1.5% |
| English | 396 | 8.1% |
| French | 21 | 0.4% |
| German | 525 | 10.7% |
| Hungarian | 125 | 2.5% |
| Irish | 393 | 8.0% |
| Italian | 30 | 0.6% |
| Latvian | 20 | 0.4% |
| Mexican | 1,296 | 26.4% |
| Norwegian | 23 | 0.5% |
| Polish | 22 | 0.4% |
| Romanian | 32 | 0.6% |
| Russian | 18 | 0.4% |
| Scandinavian | 74 | 1.5% |
| Scotch-Irish | 117 | 2.4% |
| Scottish | 40 | 0.8% |
| Spaniard | 74 | 1.5% |
| Spanish | 384 | 7.8% |
| Sri Lankan | 76 | 1.5% |
| Swedish | 118 | 2.4% |
| Swiss | 27 | 0.5% |
| Ukrainian | 42 | 0.9% |
| Welsh | 39 | 0.8% | View All 29 Rows |
Immigrants in Rio Communities
The most numerous immigrant groups reported in Rio Communities came from Europe (78 | 1.6%), Asia (76 | 1.5%), South Eastern Asia (76 | 1.5%), Vietnam (76 | 1.5%), and Central America (73 | 1.5%), together accounting for 7.7% of all Rio Communities residents.
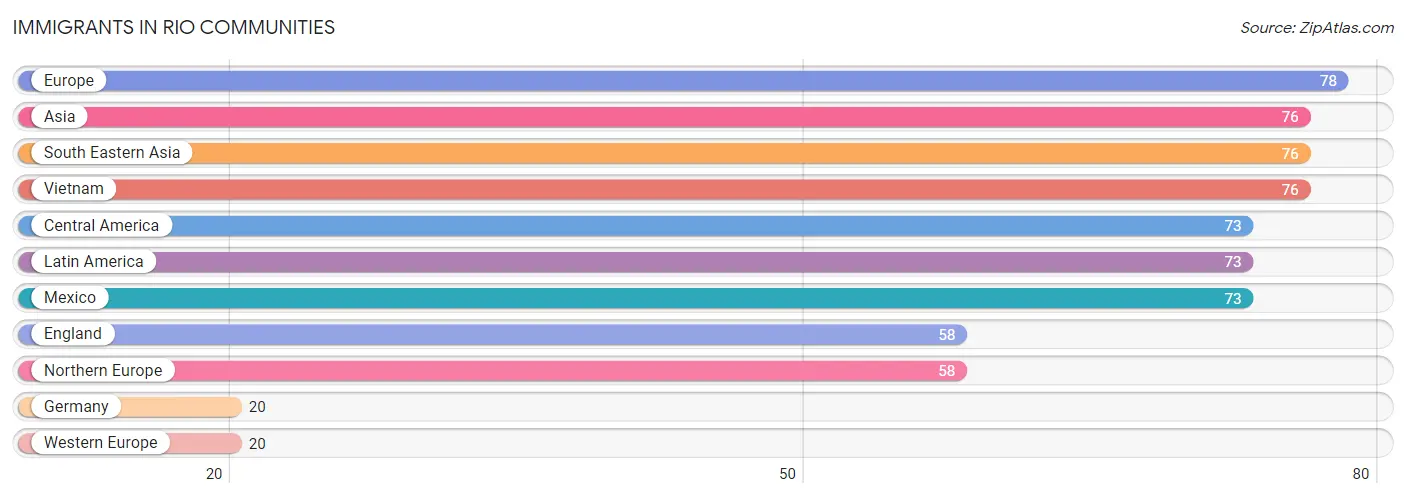
| Immigration Origin | # Population | % Population |
| Asia | 76 | 1.5% |
| Central America | 73 | 1.5% |
| England | 58 | 1.2% |
| Europe | 78 | 1.6% |
| Germany | 20 | 0.4% |
| Latin America | 73 | 1.5% |
| Mexico | 73 | 1.5% |
| Northern Europe | 58 | 1.2% |
| South Eastern Asia | 76 | 1.5% |
| Vietnam | 76 | 1.5% |
| Western Europe | 20 | 0.4% | View All 11 Rows |
Sex and Age in Rio Communities
Sex and Age in Rio Communities
The most populous age groups in Rio Communities are 55 to 59 Years (230 | 10.9%) for men and 20 to 24 Years (448 | 16.0%) for women.
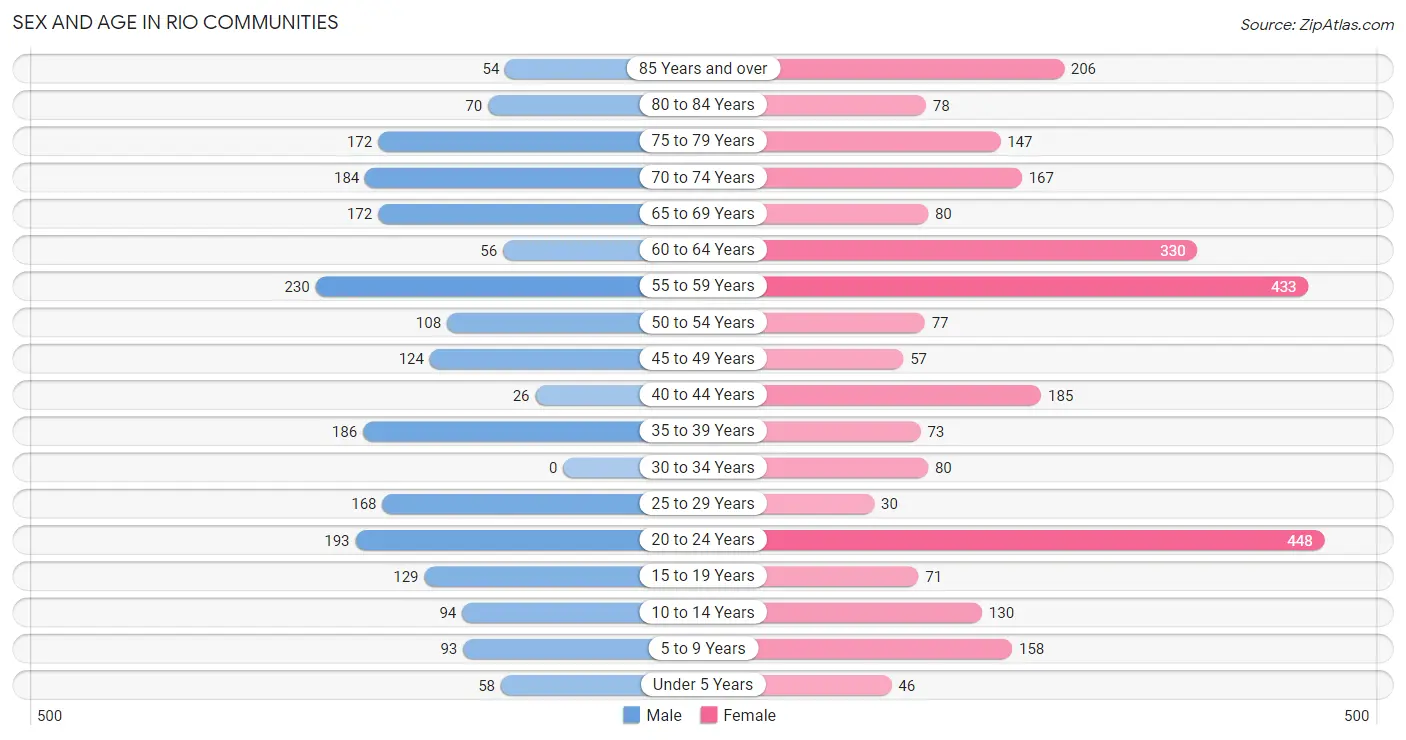
| Age Bracket | Male | Female |
| Under 5 Years | 58 (2.7%) | 46 (1.7%) |
| 5 to 9 Years | 93 (4.4%) | 158 (5.7%) |
| 10 to 14 Years | 94 (4.4%) | 130 (4.6%) |
| 15 to 19 Years | 129 (6.1%) | 71 (2.5%) |
| 20 to 24 Years | 193 (9.1%) | 448 (16.0%) |
| 25 to 29 Years | 168 (7.9%) | 30 (1.1%) |
| 30 to 34 Years | 0 (0.0%) | 80 (2.9%) |
| 35 to 39 Years | 186 (8.8%) | 73 (2.6%) |
| 40 to 44 Years | 26 (1.2%) | 185 (6.6%) |
| 45 to 49 Years | 124 (5.9%) | 57 (2.0%) |
| 50 to 54 Years | 108 (5.1%) | 77 (2.8%) |
| 55 to 59 Years | 230 (10.9%) | 433 (15.5%) |
| 60 to 64 Years | 56 (2.6%) | 330 (11.8%) |
| 65 to 69 Years | 172 (8.1%) | 80 (2.9%) |
| 70 to 74 Years | 184 (8.7%) | 167 (6.0%) |
| 75 to 79 Years | 172 (8.1%) | 147 (5.3%) |
| 80 to 84 Years | 70 (3.3%) | 78 (2.8%) |
| 85 Years and over | 54 (2.5%) | 206 (7.4%) |
| Total | 2,117 (100.0%) | 2,796 (100.0%) |
Families and Households in Rio Communities
Median Family Size in Rio Communities
The median family size in Rio Communities is 3.29 persons per family, with single male/father families (143 | 11.4%) accounting for the largest median family size of 3.44 persons per family. On the other hand, single female/mother families (245 | 19.6%) represent the smallest median family size with 3.26 persons per family.
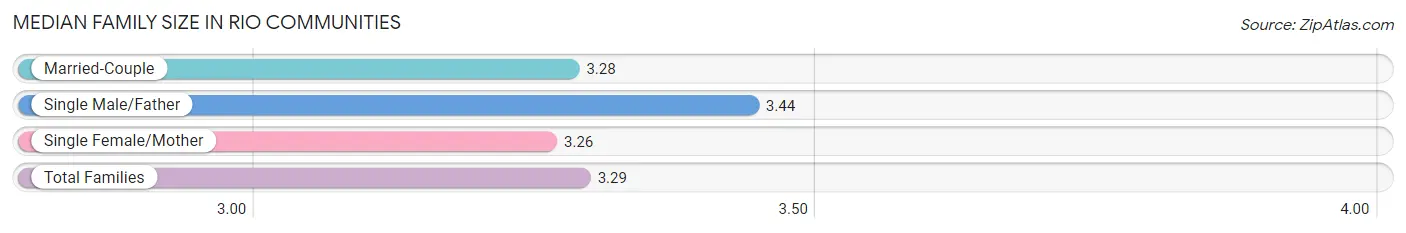
| Family Type | # Families | Family Size |
| Married-Couple | 864 (69.0%) | 3.28 |
| Single Male/Father | 143 (11.4%) | 3.44 |
| Single Female/Mother | 245 (19.6%) | 3.26 |
| Total Families | 1,252 (100.0%) | 3.29 |
Median Household Size in Rio Communities
The median household size in Rio Communities is 2.59 persons per household, with single male/father households (143 | 7.5%) accounting for the largest median household size of 3.86 persons per household. non-family households (645 | 34.0%) represent the smallest median household size with 1.09 persons per household.
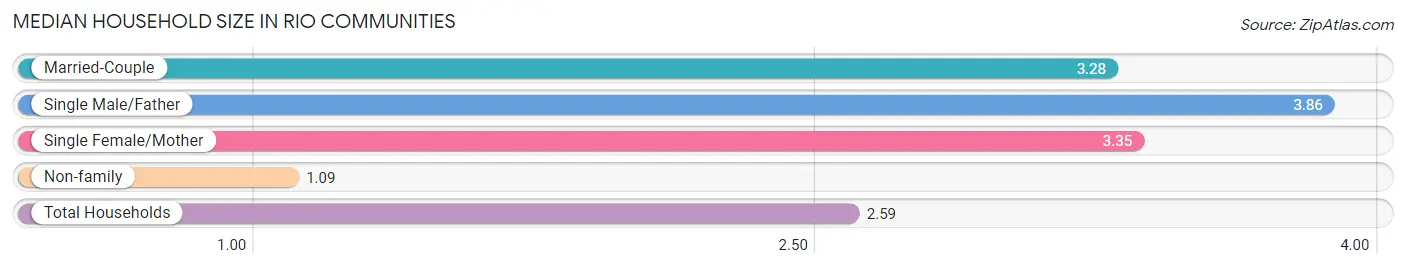
| Household Type | # Households | Household Size |
| Married-Couple | 864 (45.6%) | 3.28 |
| Single Male/Father | 143 (7.5%) | 3.86 |
| Single Female/Mother | 245 (12.9%) | 3.35 |
| Non-family | 645 (34.0%) | 1.09 |
| Total Households | 1,897 (100.0%) | 2.59 |
Household Size by Marriage Status in Rio Communities
Out of a total of 1,897 households in Rio Communities, 1,252 (66.0%) are family households, while 645 (34.0%) are nonfamily households. The most numerous type of family households are 2-person households, comprising 716, and the most common type of nonfamily households are 1-person households, comprising 600.
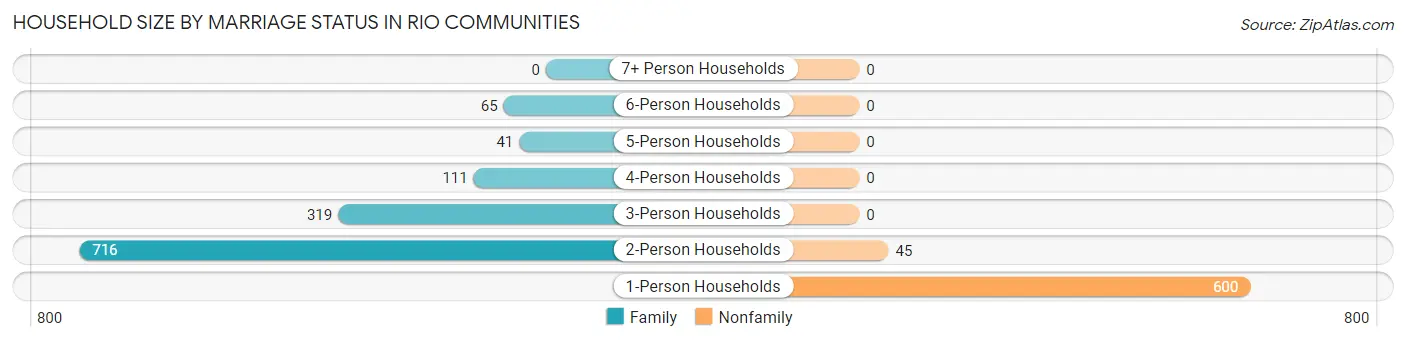
| Household Size | Family Households | Nonfamily Households |
| 1-Person Households | - | 600 (31.6%) |
| 2-Person Households | 716 (37.7%) | 45 (2.4%) |
| 3-Person Households | 319 (16.8%) | 0 (0.0%) |
| 4-Person Households | 111 (5.9%) | 0 (0.0%) |
| 5-Person Households | 41 (2.2%) | 0 (0.0%) |
| 6-Person Households | 65 (3.4%) | 0 (0.0%) |
| 7+ Person Households | 0 (0.0%) | 0 (0.0%) |
| Total | 1,252 (66.0%) | 645 (34.0%) |
Female Fertility in Rio Communities
Fertility by Age in Rio Communities
Average fertility rate in Rio Communities is 68.0 births per 1,000 women. Women in the age bracket of 35 to 50 years have the highest fertility rate with 114.0 births per 1,000 women. Women in the age bracket of 35 to 50 years acount for 56.2% of all women with births.
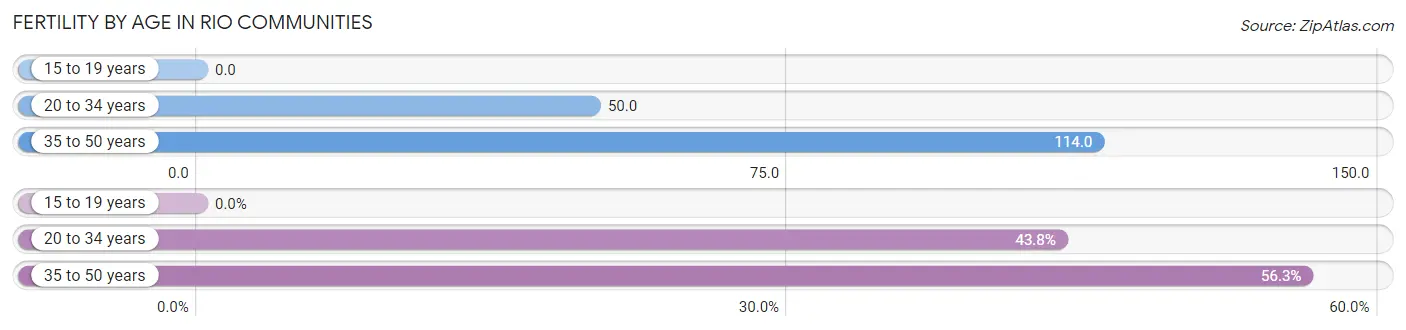
| Age Bracket | Women with Births | Births / 1,000 Women |
| 15 to 19 years | 0 (0.0%) | 0.0 |
| 20 to 34 years | 28 (43.8%) | 50.0 |
| 35 to 50 years | 36 (56.2%) | 114.0 |
| Total | 64 (100.0%) | 68.0 |
Fertility by Age by Marriage Status in Rio Communities
56.2% of women with births (64) in Rio Communities are married. The highest percentage of unmarried women with births falls into 20 to 34 years age bracket with 100.0% of them unmarried at the time of birth, while the lowest percentage of unmarried women with births belong to 35 to 50 years age bracket with 0.0% of them unmarried.
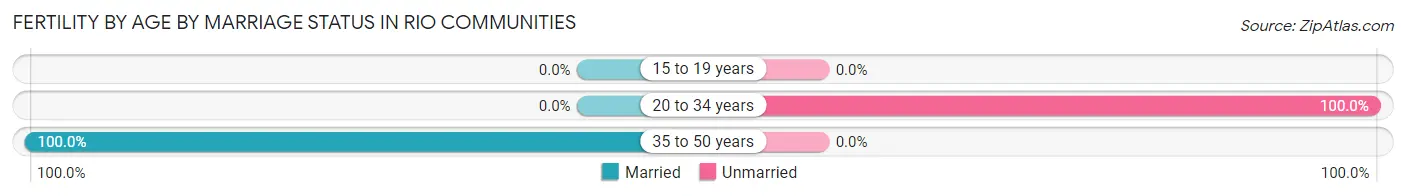
| Age Bracket | Married | Unmarried |
| 15 to 19 years | 0 (0.0%) | 0 (0.0%) |
| 20 to 34 years | 0 (0.0%) | 28 (100.0%) |
| 35 to 50 years | 36 (100.0%) | 0 (0.0%) |
| Total | 36 (56.2%) | 28 (43.8%) |
Fertility by Education in Rio Communities
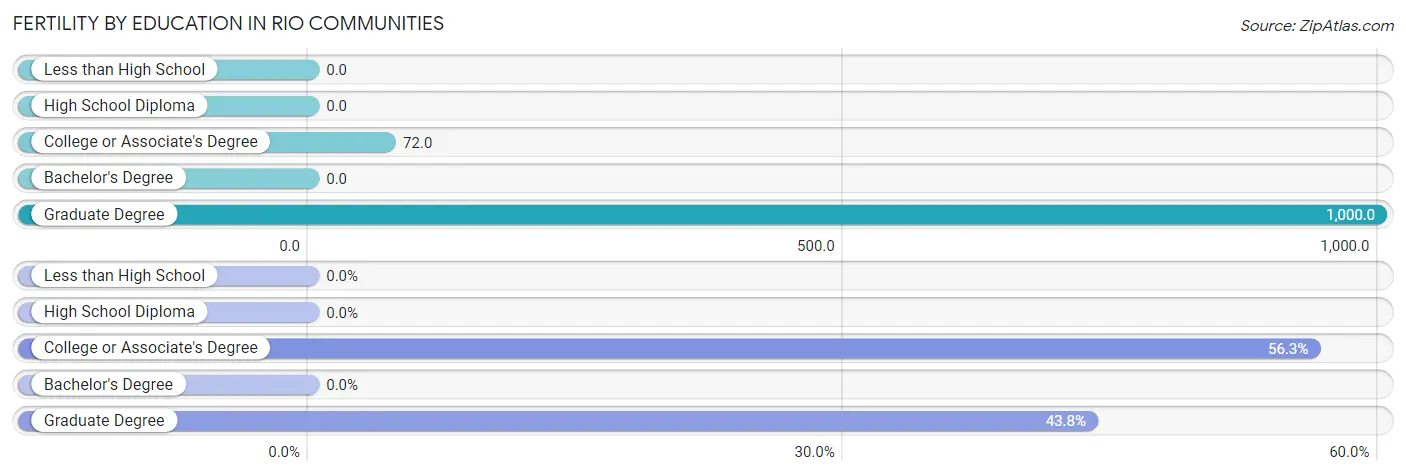
| Educational Attainment | Women with Births | Births / 1,000 Women |
| Less than High School | 0 (0.0%) | 0.0 |
| High School Diploma | 0 (0.0%) | 0.0 |
| College or Associate's Degree | 36 (56.2%) | 72.0 |
| Bachelor's Degree | 0 (0.0%) | 0.0 |
| Graduate Degree | 28 (43.8%) | 1,000.0 |
| Total | 64 (100.0%) | 68.0 |
Fertility by Education by Marriage Status in Rio Communities
43.8% of women with births in Rio Communities are unmarried. Women with the educational attainment of college or associate's degree are most likely to be married with 100.0% of them married at childbirth, while women with the educational attainment of graduate degree are least likely to be married with 100.0% of them unmarried at childbirth.
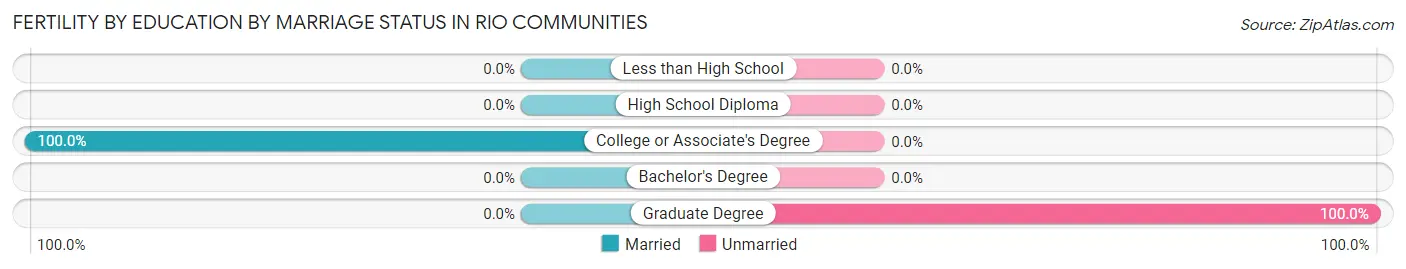
| Educational Attainment | Married | Unmarried |
| Less than High School | 0 (0.0%) | 0 (0.0%) |
| High School Diploma | 0 (0.0%) | 0 (0.0%) |
| College or Associate's Degree | 36 (100.0%) | 0 (0.0%) |
| Bachelor's Degree | 0 (0.0%) | 0 (0.0%) |
| Graduate Degree | 0 (0.0%) | 28 (100.0%) |
| Total | 36 (56.2%) | 28 (43.8%) |
Employment Characteristics in Rio Communities
Employment by Class of Employer in Rio Communities
Among the 1,658 employed individuals in Rio Communities, private company employees (925 | 55.8%), local government employees (223 | 13.5%), and self-employed (not incorporated) (209 | 12.6%) make up the most common classes of employment.
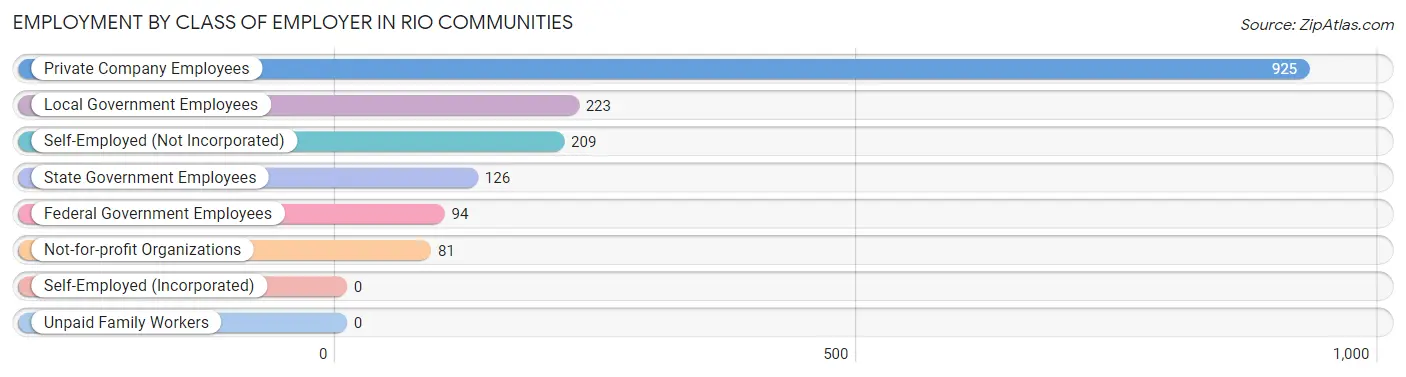
| Employer Class | # Employees | % Employees |
| Private Company Employees | 925 | 55.8% |
| Self-Employed (Incorporated) | 0 | 0.0% |
| Self-Employed (Not Incorporated) | 209 | 12.6% |
| Not-for-profit Organizations | 81 | 4.9% |
| Local Government Employees | 223 | 13.5% |
| State Government Employees | 126 | 7.6% |
| Federal Government Employees | 94 | 5.7% |
| Unpaid Family Workers | 0 | 0.0% |
| Total | 1,658 | 100.0% |
Employment Status by Age in Rio Communities
According to the labor force statistics for Rio Communities, out of the total population over 16 years of age (4,334), 44.8% or 1,942 individuals are in the labor force, with 14.5% or 282 of them unemployed. The age group with the highest labor force participation rate is 30 to 34 years, with 100.0% or 80 individuals in the labor force. Within the labor force, the 20 to 24 years age range has the highest percentage of unemployed individuals, with 56.5% or 218 of them being unemployed.
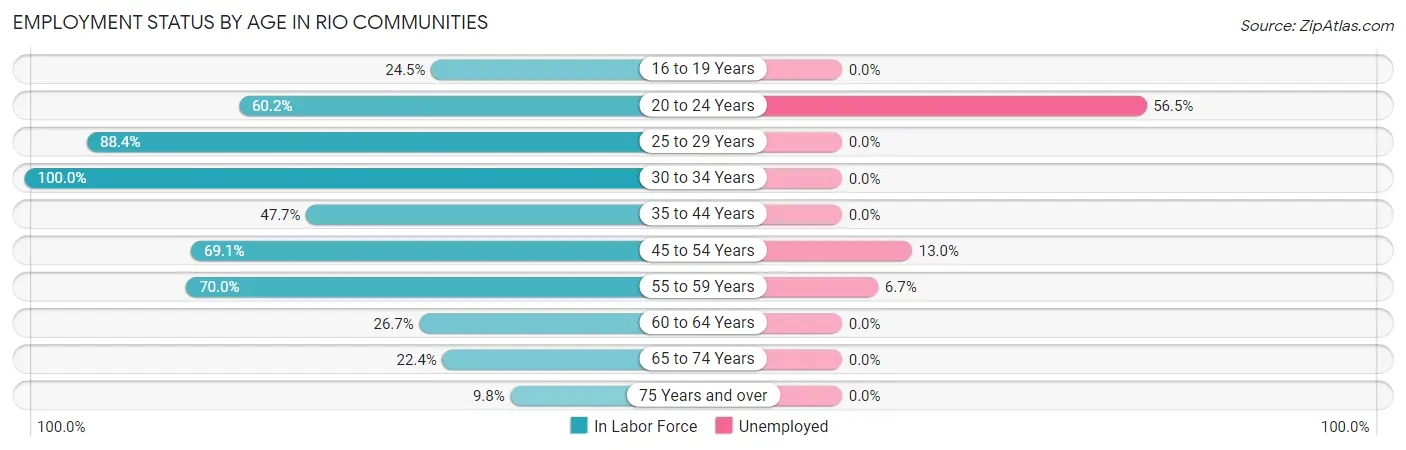
| Age Bracket | In Labor Force | Unemployed |
| 16 to 19 Years | 49 (24.5%) | 0 (0.0%) |
| 20 to 24 Years | 386 (60.2%) | 218 (56.5%) |
| 25 to 29 Years | 175 (88.4%) | 0 (0.0%) |
| 30 to 34 Years | 80 (100.0%) | 0 (0.0%) |
| 35 to 44 Years | 224 (47.7%) | 0 (0.0%) |
| 45 to 54 Years | 253 (69.1%) | 33 (13.0%) |
| 55 to 59 Years | 464 (70.0%) | 31 (6.7%) |
| 60 to 64 Years | 103 (26.7%) | 0 (0.0%) |
| 65 to 74 Years | 135 (22.4%) | 0 (0.0%) |
| 75 Years and over | 71 (9.8%) | 0 (0.0%) |
| Total | 1,942 (44.8%) | 282 (14.5%) |
Employment Status by Educational Attainment in Rio Communities
According to labor force statistics for Rio Communities, 60.1% of individuals (1,300) out of the total population between 25 and 64 years of age (2,163) are in the labor force, with 4.9% or 64 of them being unemployed. The group with the highest labor force participation rate are those with the educational attainment of bachelor's degree or higher, with 68.9% or 219 individuals in the labor force. Within the labor force, individuals with bachelor's degree or higher education have the highest percentage of unemployment, with 8.2% or 18 of them being unemployed.
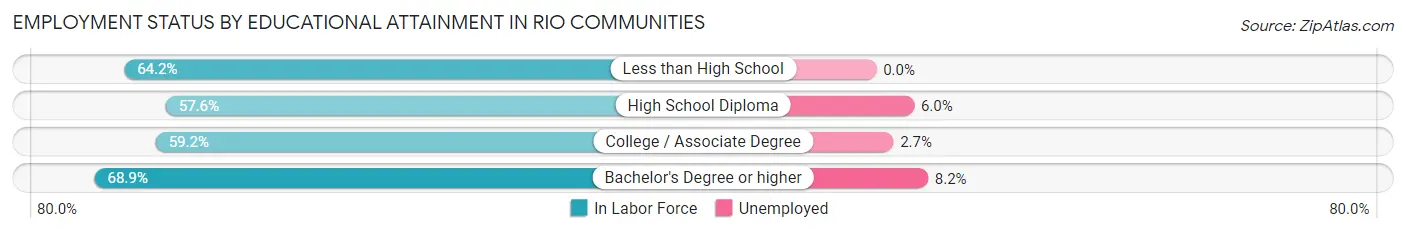
| Educational Attainment | In Labor Force | Unemployed |
| Less than High School | 43 (64.2%) | 0 (0.0%) |
| High School Diploma | 548 (57.6%) | 57 (6.0%) |
| College / Associate Degree | 489 (59.2%) | 22 (2.7%) |
| Bachelor's Degree or higher | 219 (68.9%) | 26 (8.2%) |
| Total | 1,300 (60.1%) | 106 (4.9%) |
Employment Occupations by Sex in Rio Communities
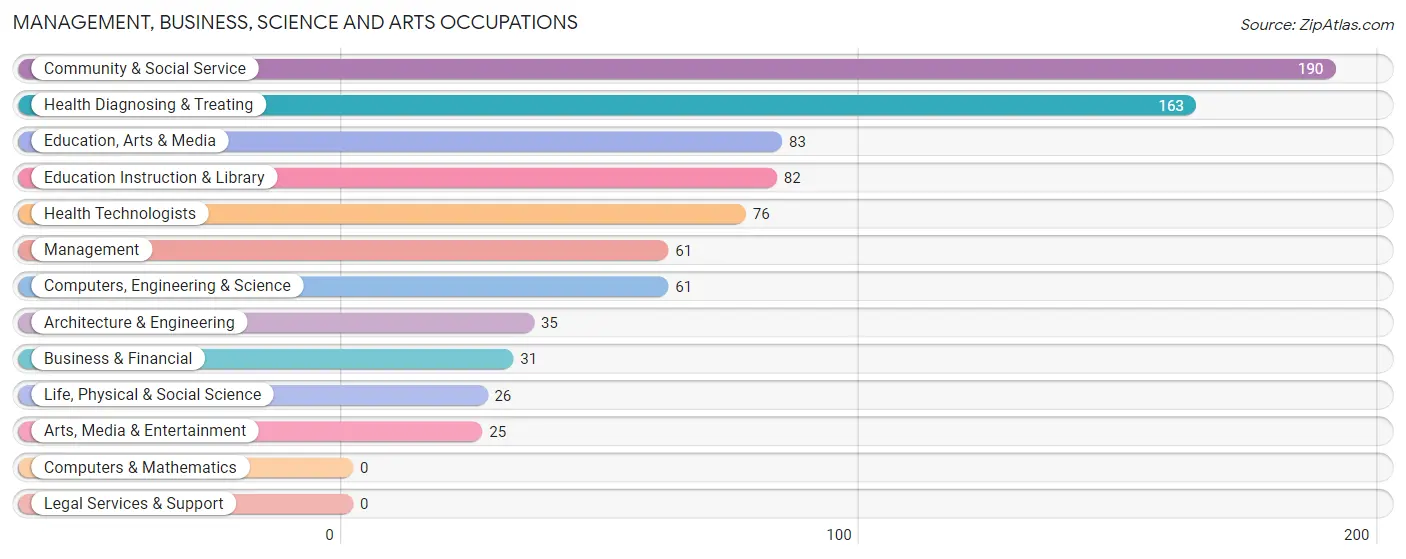
Management, Business, Science and Arts Occupations
The most common Management, Business, Science and Arts occupations in Rio Communities are Community & Social Service (190 | 11.5%), Health Diagnosing & Treating (163 | 9.8%), Education, Arts & Media (83 | 5.0%), Education Instruction & Library (82 | 5.0%), and Health Technologists (76 | 4.6%).
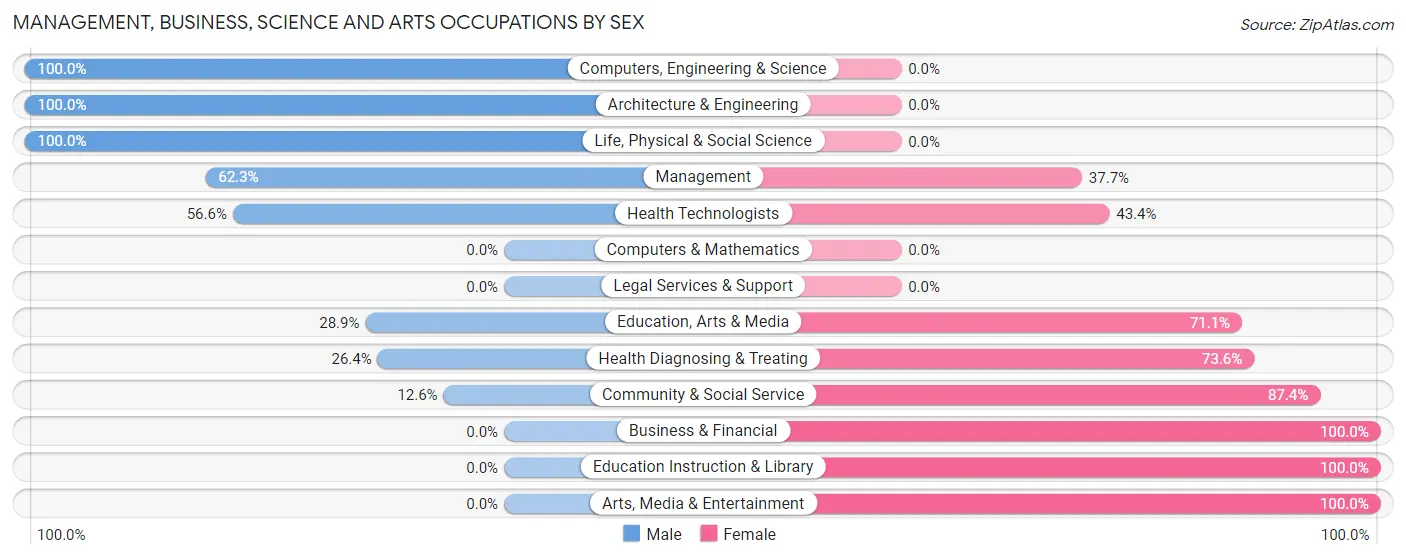
Management, Business, Science and Arts Occupations by Sex
Within the Management, Business, Science and Arts occupations in Rio Communities, the most male-oriented occupations are Computers, Engineering & Science (100.0%), Architecture & Engineering (100.0%), and Life, Physical & Social Science (100.0%), while the most female-oriented occupations are Business & Financial (100.0%), Education Instruction & Library (100.0%), and Arts, Media & Entertainment (100.0%).
| Occupation | Male | Female |
| Management | 38 (62.3%) | 23 (37.7%) |
| Business & Financial | 0 (0.0%) | 31 (100.0%) |
| Computers, Engineering & Science | 61 (100.0%) | 0 (0.0%) |
| Computers & Mathematics | 0 (0.0%) | 0 (0.0%) |
| Architecture & Engineering | 35 (100.0%) | 0 (0.0%) |
| Life, Physical & Social Science | 26 (100.0%) | 0 (0.0%) |
| Community & Social Service | 24 (12.6%) | 166 (87.4%) |
| Education, Arts & Media | 24 (28.9%) | 59 (71.1%) |
| Legal Services & Support | 0 (0.0%) | 0 (0.0%) |
| Education Instruction & Library | 0 (0.0%) | 82 (100.0%) |
| Arts, Media & Entertainment | 0 (0.0%) | 25 (100.0%) |
| Health Diagnosing & Treating | 43 (26.4%) | 120 (73.6%) |
| Health Technologists | 43 (56.6%) | 33 (43.4%) |
| Total (Category) | 166 (32.8%) | 340 (67.2%) |
| Total (Overall) | 831 (50.1%) | 827 (49.9%) |
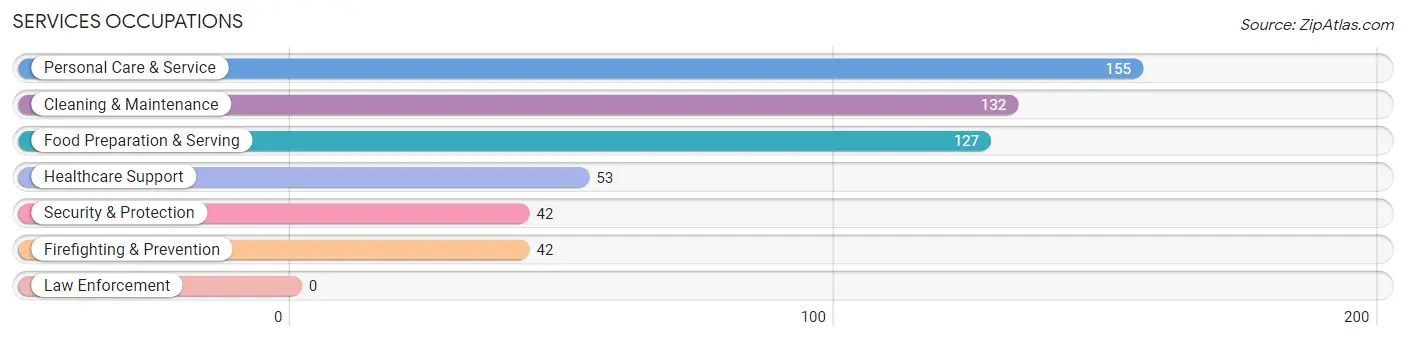
Services Occupations
The most common Services occupations in Rio Communities are Personal Care & Service (155 | 9.3%), Cleaning & Maintenance (132 | 8.0%), Food Preparation & Serving (127 | 7.7%), Healthcare Support (53 | 3.2%), and Security & Protection (42 | 2.5%).
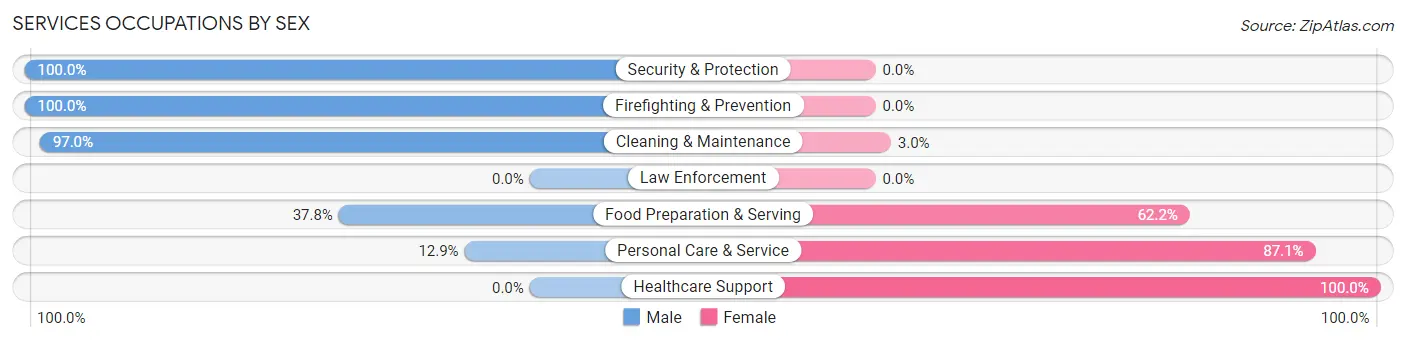
Services Occupations by Sex
Within the Services occupations in Rio Communities, the most male-oriented occupations are Security & Protection (100.0%), Firefighting & Prevention (100.0%), and Cleaning & Maintenance (97.0%), while the most female-oriented occupations are Healthcare Support (100.0%), Personal Care & Service (87.1%), and Food Preparation & Serving (62.2%).
| Occupation | Male | Female |
| Healthcare Support | 0 (0.0%) | 53 (100.0%) |
| Security & Protection | 42 (100.0%) | 0 (0.0%) |
| Firefighting & Prevention | 42 (100.0%) | 0 (0.0%) |
| Law Enforcement | 0 (0.0%) | 0 (0.0%) |
| Food Preparation & Serving | 48 (37.8%) | 79 (62.2%) |
| Cleaning & Maintenance | 128 (97.0%) | 4 (3.0%) |
| Personal Care & Service | 20 (12.9%) | 135 (87.1%) |
| Total (Category) | 238 (46.8%) | 271 (53.2%) |
| Total (Overall) | 831 (50.1%) | 827 (49.9%) |
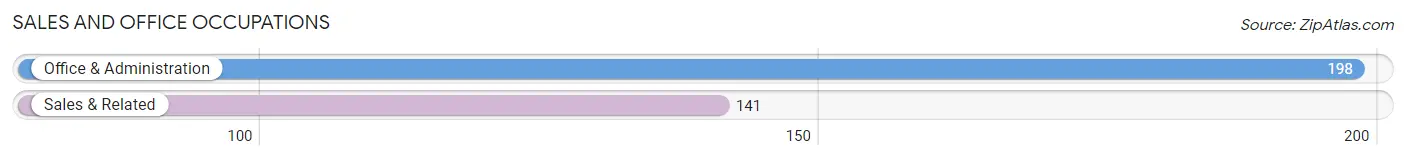
Sales and Office Occupations
The most common Sales and Office occupations in Rio Communities are Office & Administration (198 | 11.9%), and Sales & Related (141 | 8.5%).
Sales and Office Occupations by Sex
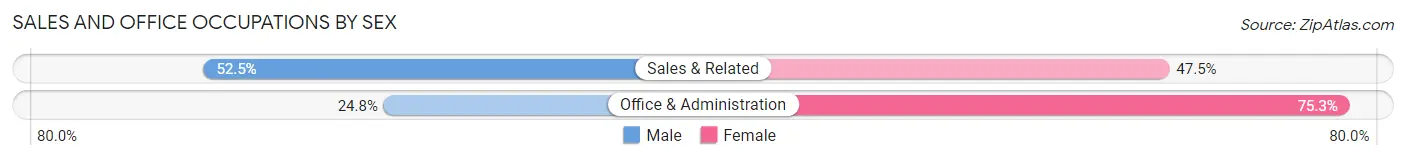
| Occupation | Male | Female |
| Sales & Related | 74 (52.5%) | 67 (47.5%) |
| Office & Administration | 49 (24.7%) | 149 (75.2%) |
| Total (Category) | 123 (36.3%) | 216 (63.7%) |
| Total (Overall) | 831 (50.1%) | 827 (49.9%) |
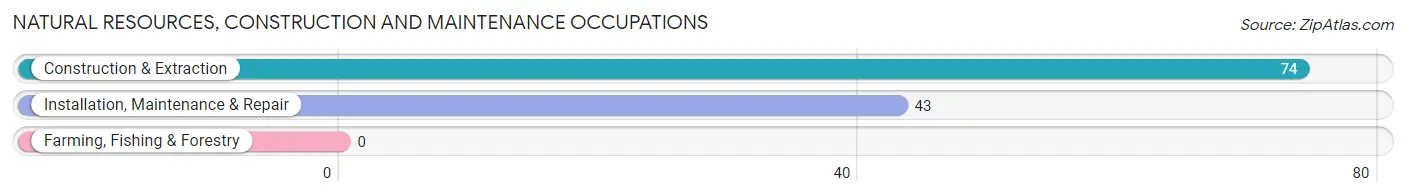
Natural Resources, Construction and Maintenance Occupations
The most common Natural Resources, Construction and Maintenance occupations in Rio Communities are Construction & Extraction (74 | 4.5%), and Installation, Maintenance & Repair (43 | 2.6%).
Natural Resources, Construction and Maintenance Occupations by Sex
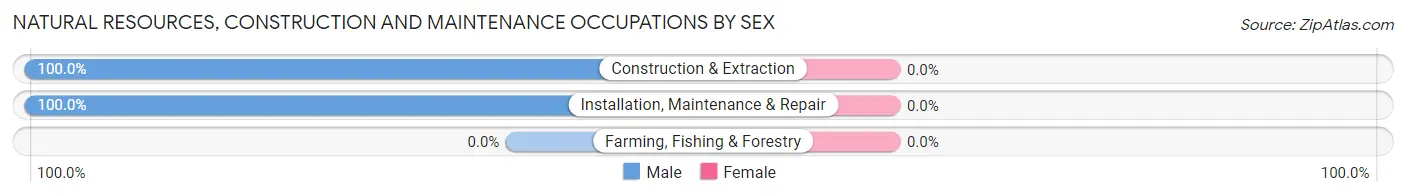
| Occupation | Male | Female |
| Farming, Fishing & Forestry | 0 (0.0%) | 0 (0.0%) |
| Construction & Extraction | 74 (100.0%) | 0 (0.0%) |
| Installation, Maintenance & Repair | 43 (100.0%) | 0 (0.0%) |
| Total (Category) | 117 (100.0%) | 0 (0.0%) |
| Total (Overall) | 831 (50.1%) | 827 (49.9%) |
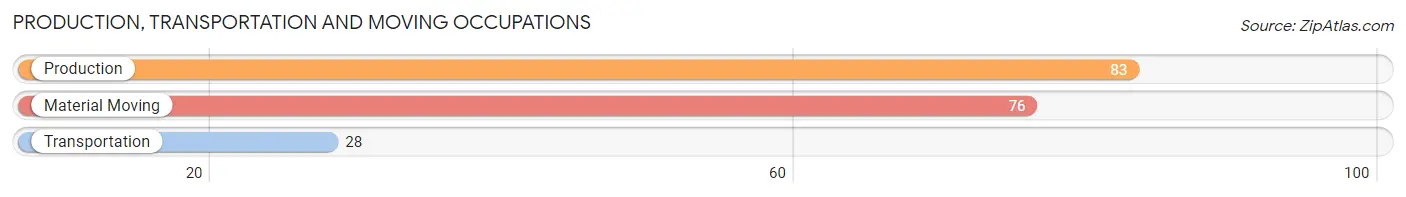
Production, Transportation and Moving Occupations
The most common Production, Transportation and Moving occupations in Rio Communities are Production (83 | 5.0%), Material Moving (76 | 4.6%), and Transportation (28 | 1.7%).
Production, Transportation and Moving Occupations by Sex
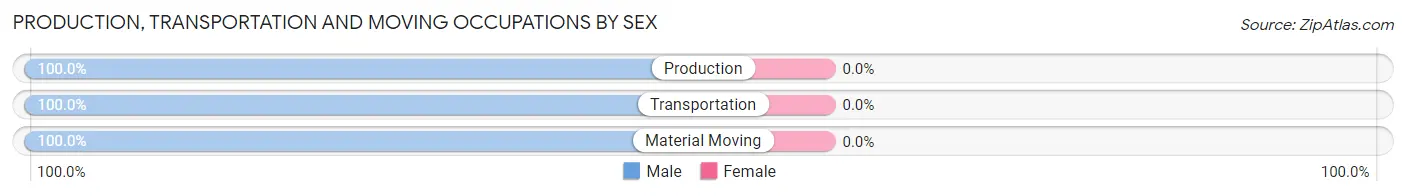
| Occupation | Male | Female |
| Production | 83 (100.0%) | 0 (0.0%) |
| Transportation | 28 (100.0%) | 0 (0.0%) |
| Material Moving | 76 (100.0%) | 0 (0.0%) |
| Total (Category) | 187 (100.0%) | 0 (0.0%) |
| Total (Overall) | 831 (50.1%) | 827 (49.9%) |
Employment Industries by Sex in Rio Communities
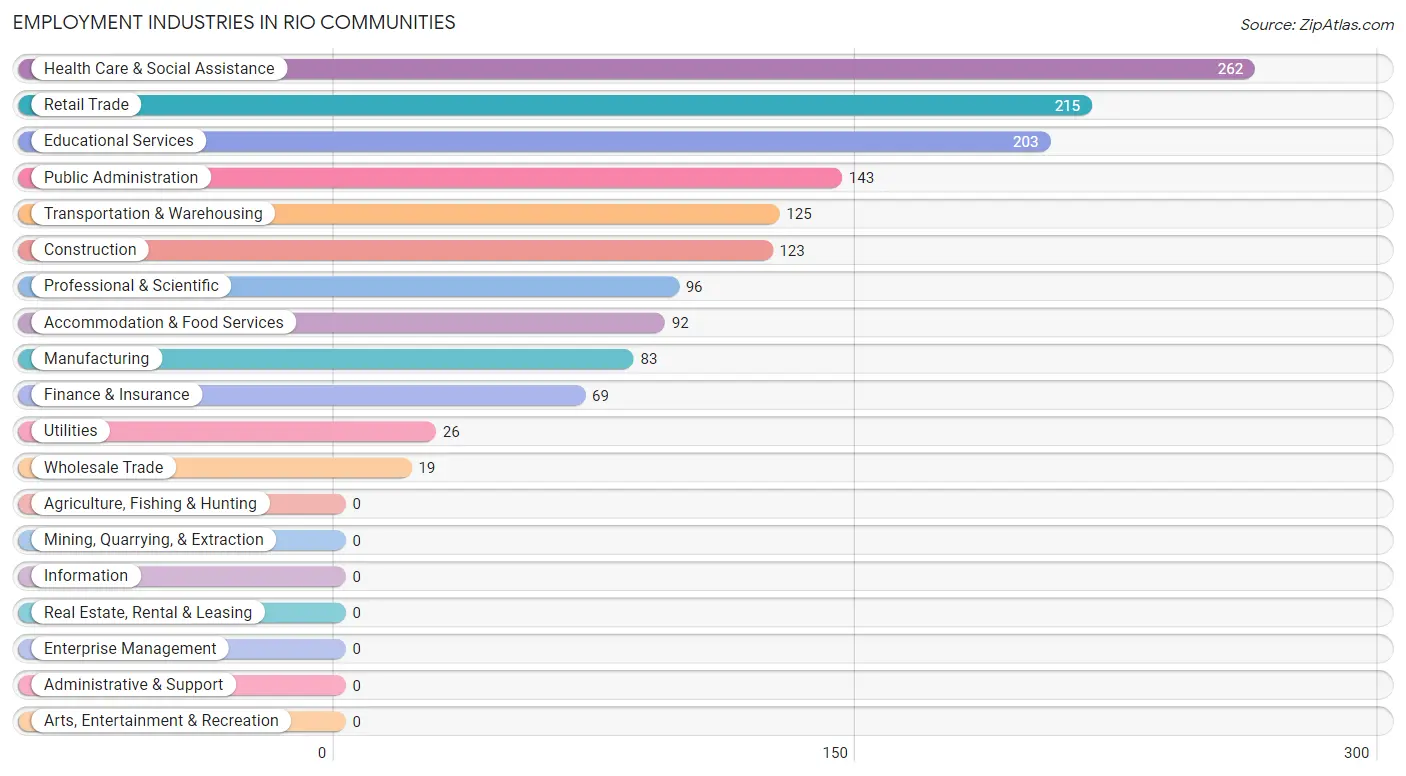
Employment Industries in Rio Communities
The major employment industries in Rio Communities include Health Care & Social Assistance (262 | 15.8%), Retail Trade (215 | 13.0%), Educational Services (203 | 12.2%), Public Administration (143 | 8.6%), and Transportation & Warehousing (125 | 7.5%).
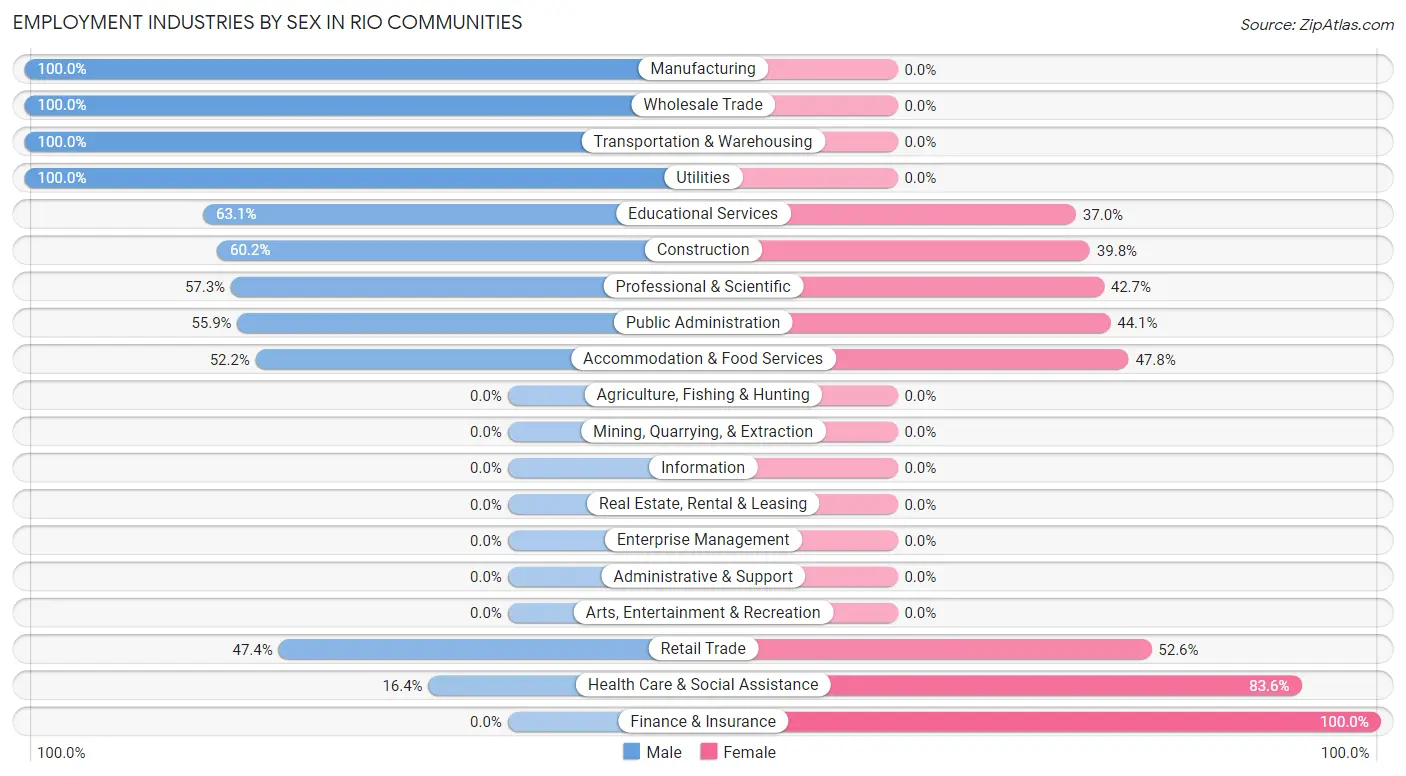
Employment Industries by Sex in Rio Communities
The Rio Communities industries that see more men than women are Manufacturing (100.0%), Wholesale Trade (100.0%), and Transportation & Warehousing (100.0%), whereas the industries that tend to have a higher number of women are Finance & Insurance (100.0%), Health Care & Social Assistance (83.6%), and Retail Trade (52.6%).
| Industry | Male | Female |
| Agriculture, Fishing & Hunting | 0 (0.0%) | 0 (0.0%) |
| Mining, Quarrying, & Extraction | 0 (0.0%) | 0 (0.0%) |
| Construction | 74 (60.2%) | 49 (39.8%) |
| Manufacturing | 83 (100.0%) | 0 (0.0%) |
| Wholesale Trade | 19 (100.0%) | 0 (0.0%) |
| Retail Trade | 102 (47.4%) | 113 (52.6%) |
| Transportation & Warehousing | 125 (100.0%) | 0 (0.0%) |
| Utilities | 26 (100.0%) | 0 (0.0%) |
| Information | 0 (0.0%) | 0 (0.0%) |
| Finance & Insurance | 0 (0.0%) | 69 (100.0%) |
| Real Estate, Rental & Leasing | 0 (0.0%) | 0 (0.0%) |
| Professional & Scientific | 55 (57.3%) | 41 (42.7%) |
| Enterprise Management | 0 (0.0%) | 0 (0.0%) |
| Administrative & Support | 0 (0.0%) | 0 (0.0%) |
| Educational Services | 128 (63.0%) | 75 (36.9%) |
| Health Care & Social Assistance | 43 (16.4%) | 219 (83.6%) |
| Arts, Entertainment & Recreation | 0 (0.0%) | 0 (0.0%) |
| Accommodation & Food Services | 48 (52.2%) | 44 (47.8%) |
| Public Administration | 80 (55.9%) | 63 (44.1%) |
| Total | 831 (50.1%) | 827 (49.9%) |
Education in Rio Communities
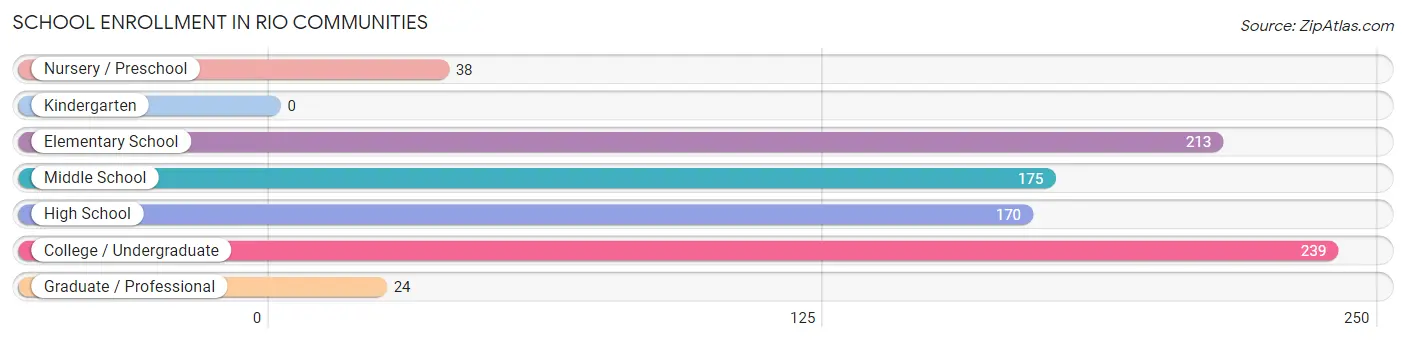
School Enrollment in Rio Communities
The most common levels of schooling among the 859 students in Rio Communities are college / undergraduate (239 | 27.8%), elementary school (213 | 24.8%), and middle school (175 | 20.4%).
| School Level | # Students | % Students |
| Nursery / Preschool | 38 | 4.4% |
| Kindergarten | 0 | 0.0% |
| Elementary School | 213 | 24.8% |
| Middle School | 175 | 20.4% |
| High School | 170 | 19.8% |
| College / Undergraduate | 239 | 27.8% |
| Graduate / Professional | 24 | 2.8% |
| Total | 859 | 100.0% |
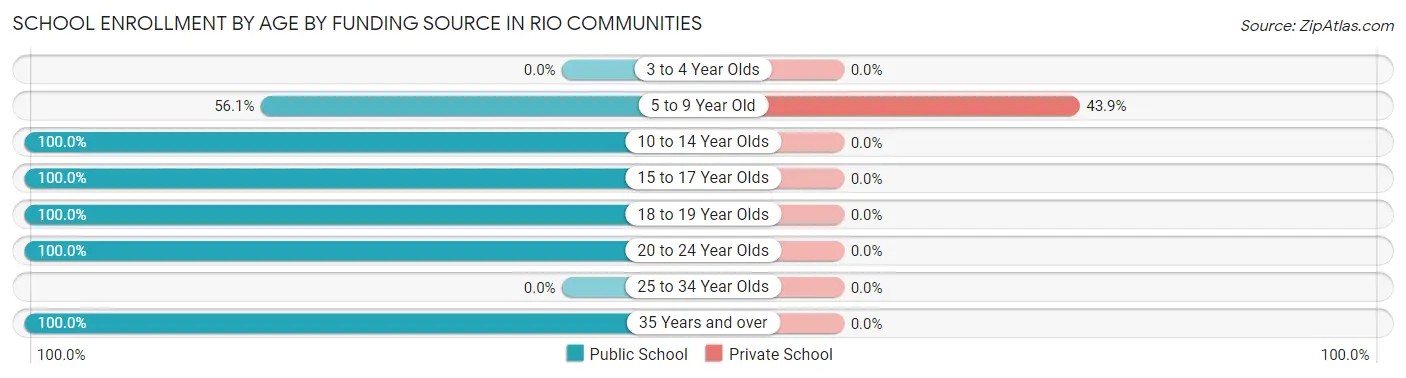
School Enrollment by Age by Funding Source in Rio Communities
Out of a total of 859 students who are enrolled in schools in Rio Communities, 97 (11.3%) attend a private institution, while the remaining 762 (88.7%) are enrolled in public schools. The age group of 5 to 9 year old has the highest likelihood of being enrolled in private schools, with 97 (43.9% in the age bracket) enrolled. Conversely, the age group of 10 to 14 year olds has the lowest likelihood of being enrolled in a private school, with 224 (100.0% in the age bracket) attending a public institution.
| Age Bracket | Public School | Private School |
| 3 to 4 Year Olds | 0 (0.0%) | 0 (0.0%) |
| 5 to 9 Year Old | 124 (56.1%) | 97 (43.9%) |
| 10 to 14 Year Olds | 224 (100.0%) | 0 (0.0%) |
| 15 to 17 Year Olds | 50 (100.0%) | 0 (0.0%) |
| 18 to 19 Year Olds | 113 (100.0%) | 0 (0.0%) |
| 20 to 24 Year Olds | 204 (100.0%) | 0 (0.0%) |
| 25 to 34 Year Olds | 0 (0.0%) | 0 (0.0%) |
| 35 Years and over | 47 (100.0%) | 0 (0.0%) |
| Total | 762 (88.7%) | 97 (11.3%) |
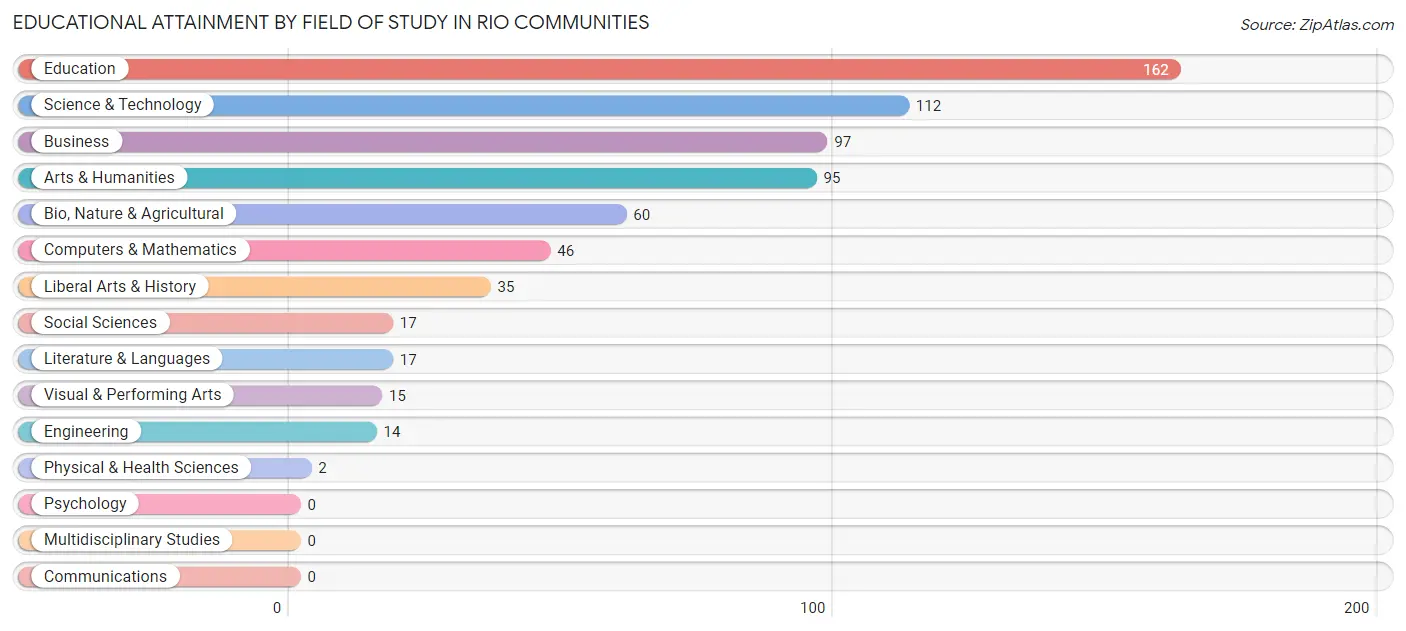
Educational Attainment by Field of Study in Rio Communities
Education (162 | 24.1%), science & technology (112 | 16.7%), business (97 | 14.4%), arts & humanities (95 | 14.1%), and bio, nature & agricultural (60 | 8.9%) are the most common fields of study among 672 individuals in Rio Communities who have obtained a bachelor's degree or higher.
| Field of Study | # Graduates | % Graduates |
| Computers & Mathematics | 46 | 6.9% |
| Bio, Nature & Agricultural | 60 | 8.9% |
| Physical & Health Sciences | 2 | 0.3% |
| Psychology | 0 | 0.0% |
| Social Sciences | 17 | 2.5% |
| Engineering | 14 | 2.1% |
| Multidisciplinary Studies | 0 | 0.0% |
| Science & Technology | 112 | 16.7% |
| Business | 97 | 14.4% |
| Education | 162 | 24.1% |
| Literature & Languages | 17 | 2.5% |
| Liberal Arts & History | 35 | 5.2% |
| Visual & Performing Arts | 15 | 2.2% |
| Communications | 0 | 0.0% |
| Arts & Humanities | 95 | 14.1% |
| Total | 672 | 100.0% |
Transportation & Commute in Rio Communities
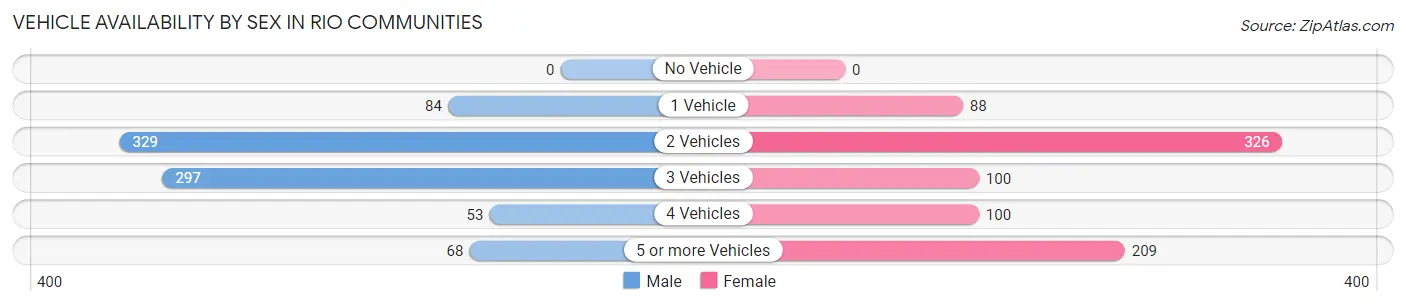
Vehicle Availability by Sex in Rio Communities
The most prevalent vehicle ownership categories in Rio Communities are males with 2 vehicles (329, accounting for 39.6%) and females with 2 vehicles (326, making up 40.0%).
| Vehicles Available | Male | Female |
| No Vehicle | 0 (0.0%) | 0 (0.0%) |
| 1 Vehicle | 84 (10.1%) | 88 (10.7%) |
| 2 Vehicles | 329 (39.6%) | 326 (39.6%) |
| 3 Vehicles | 297 (35.7%) | 100 (12.1%) |
| 4 Vehicles | 53 (6.4%) | 100 (12.1%) |
| 5 or more Vehicles | 68 (8.2%) | 209 (25.4%) |
| Total | 831 (100.0%) | 823 (100.0%) |
Commute Time in Rio Communities
The most frequently occuring commute durations in Rio Communities are 45 to 59 minutes (392 commuters, 24.8%), 5 to 9 minutes (326 commuters, 20.6%), and 15 to 19 minutes (268 commuters, 16.9%).
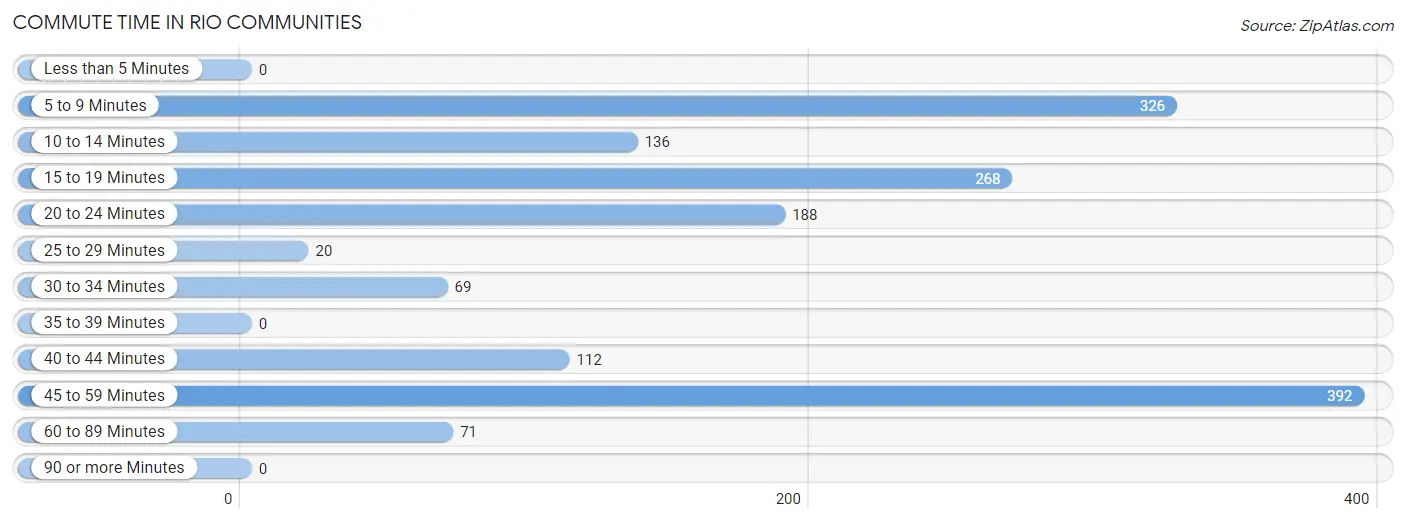
| Commute Time | # Commuters | % Commuters |
| Less than 5 Minutes | 0 | 0.0% |
| 5 to 9 Minutes | 326 | 20.6% |
| 10 to 14 Minutes | 136 | 8.6% |
| 15 to 19 Minutes | 268 | 16.9% |
| 20 to 24 Minutes | 188 | 11.9% |
| 25 to 29 Minutes | 20 | 1.3% |
| 30 to 34 Minutes | 69 | 4.4% |
| 35 to 39 Minutes | 0 | 0.0% |
| 40 to 44 Minutes | 112 | 7.1% |
| 45 to 59 Minutes | 392 | 24.8% |
| 60 to 89 Minutes | 71 | 4.5% |
| 90 or more Minutes | 0 | 0.0% |
Commute Time by Sex in Rio Communities
The most common commute times in Rio Communities are 45 to 59 minutes (255 commuters, 30.7%) for males and 5 to 9 minutes (176 commuters, 23.4%) for females.
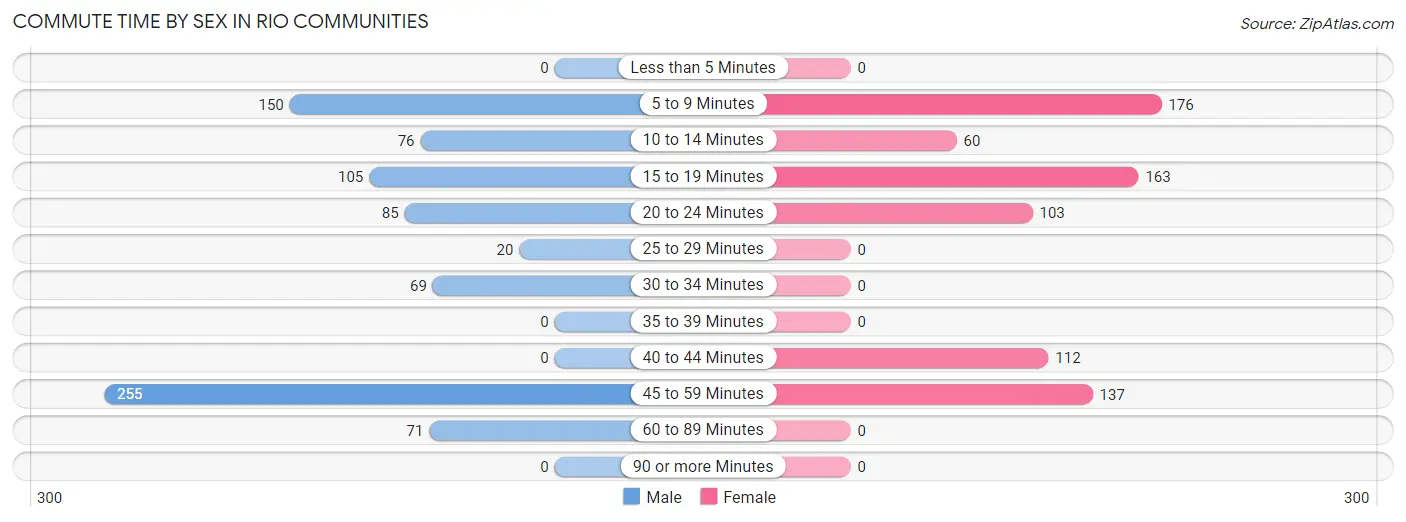
| Commute Time | Male | Female |
| Less than 5 Minutes | 0 (0.0%) | 0 (0.0%) |
| 5 to 9 Minutes | 150 (18.0%) | 176 (23.4%) |
| 10 to 14 Minutes | 76 (9.1%) | 60 (8.0%) |
| 15 to 19 Minutes | 105 (12.6%) | 163 (21.7%) |
| 20 to 24 Minutes | 85 (10.2%) | 103 (13.7%) |
| 25 to 29 Minutes | 20 (2.4%) | 0 (0.0%) |
| 30 to 34 Minutes | 69 (8.3%) | 0 (0.0%) |
| 35 to 39 Minutes | 0 (0.0%) | 0 (0.0%) |
| 40 to 44 Minutes | 0 (0.0%) | 112 (14.9%) |
| 45 to 59 Minutes | 255 (30.7%) | 137 (18.2%) |
| 60 to 89 Minutes | 71 (8.5%) | 0 (0.0%) |
| 90 or more Minutes | 0 (0.0%) | 0 (0.0%) |
Time of Departure to Work by Sex in Rio Communities
The most frequent times of departure to work in Rio Communities are 12:00 PM to 3:59 PM (227, 27.3%) for males and 7:30 AM to 7:59 AM (305, 40.6%) for females.
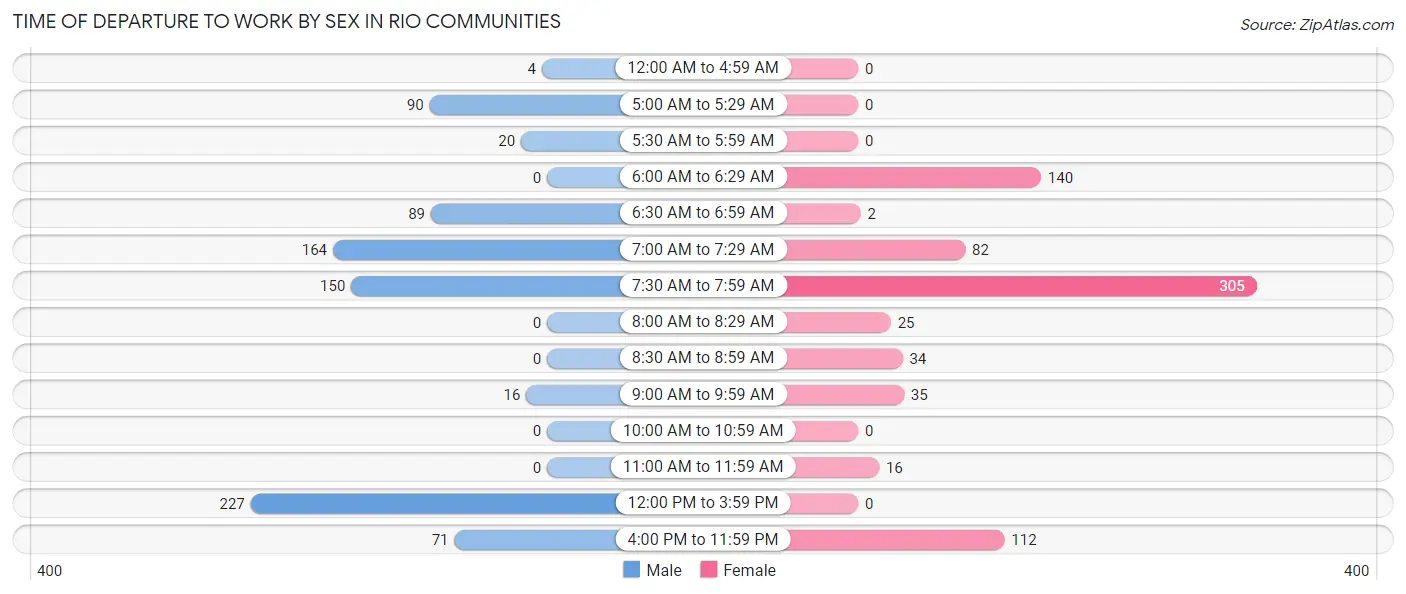
| Time of Departure | Male | Female |
| 12:00 AM to 4:59 AM | 4 (0.5%) | 0 (0.0%) |
| 5:00 AM to 5:29 AM | 90 (10.8%) | 0 (0.0%) |
| 5:30 AM to 5:59 AM | 20 (2.4%) | 0 (0.0%) |
| 6:00 AM to 6:29 AM | 0 (0.0%) | 140 (18.6%) |
| 6:30 AM to 6:59 AM | 89 (10.7%) | 2 (0.3%) |
| 7:00 AM to 7:29 AM | 164 (19.7%) | 82 (10.9%) |
| 7:30 AM to 7:59 AM | 150 (18.0%) | 305 (40.6%) |
| 8:00 AM to 8:29 AM | 0 (0.0%) | 25 (3.3%) |
| 8:30 AM to 8:59 AM | 0 (0.0%) | 34 (4.5%) |
| 9:00 AM to 9:59 AM | 16 (1.9%) | 35 (4.7%) |
| 10:00 AM to 10:59 AM | 0 (0.0%) | 0 (0.0%) |
| 11:00 AM to 11:59 AM | 0 (0.0%) | 16 (2.1%) |
| 12:00 PM to 3:59 PM | 227 (27.3%) | 0 (0.0%) |
| 4:00 PM to 11:59 PM | 71 (8.5%) | 112 (14.9%) |
| Total | 831 (100.0%) | 751 (100.0%) |
Housing Occupancy in Rio Communities
Occupancy by Ownership in Rio Communities
Of the total 1,897 dwellings in Rio Communities, owner-occupied units account for 1,436 (75.7%), while renter-occupied units make up 461 (24.3%).
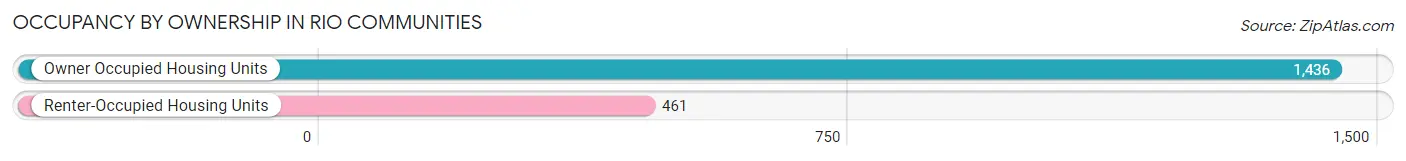
| Occupancy | # Housing Units | % Housing Units |
| Owner Occupied Housing Units | 1,436 | 75.7% |
| Renter-Occupied Housing Units | 461 | 24.3% |
| Total Occupied Housing Units | 1,897 | 100.0% |
Occupancy by Household Size in Rio Communities
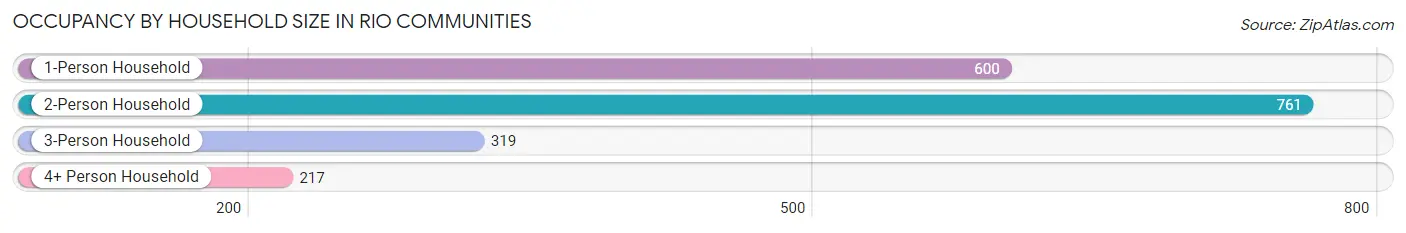
| Household Size | # Housing Units | % Housing Units |
| 1-Person Household | 600 | 31.6% |
| 2-Person Household | 761 | 40.1% |
| 3-Person Household | 319 | 16.8% |
| 4+ Person Household | 217 | 11.4% |
| Total Housing Units | 1,897 | 100.0% |
Occupancy by Ownership by Household Size in Rio Communities
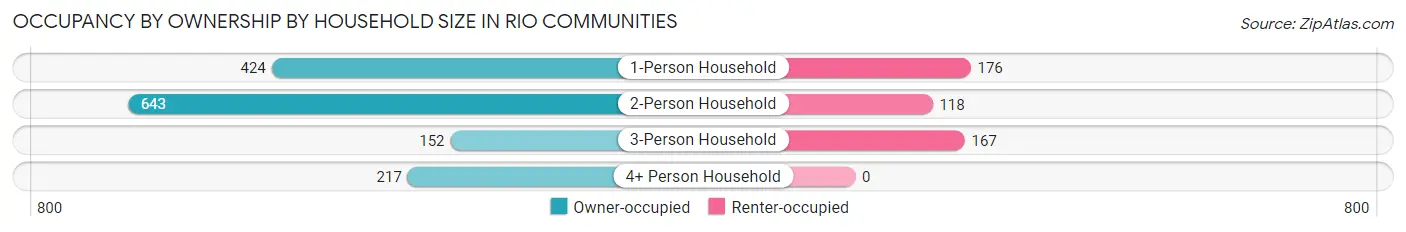
| Household Size | Owner-occupied | Renter-occupied |
| 1-Person Household | 424 (70.7%) | 176 (29.3%) |
| 2-Person Household | 643 (84.5%) | 118 (15.5%) |
| 3-Person Household | 152 (47.6%) | 167 (52.3%) |
| 4+ Person Household | 217 (100.0%) | 0 (0.0%) |
| Total Housing Units | 1,436 (75.7%) | 461 (24.3%) |
Occupancy by Educational Attainment in Rio Communities
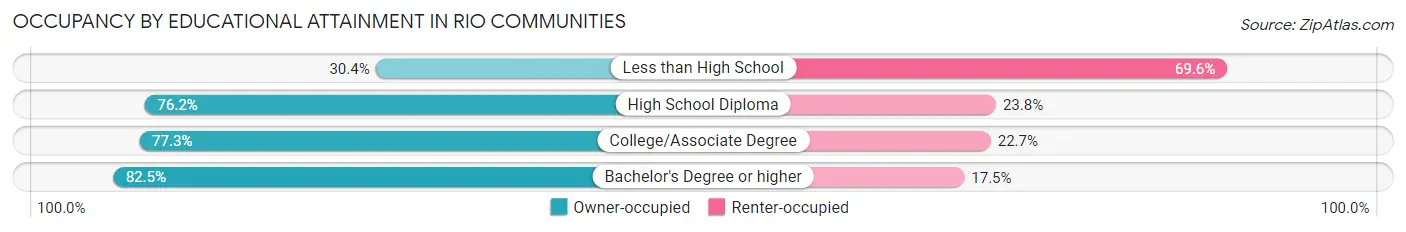
| Household Size | Owner-occupied | Renter-occupied |
| Less than High School | 28 (30.4%) | 64 (69.6%) |
| High School Diploma | 536 (76.2%) | 167 (23.8%) |
| College/Associate Degree | 551 (77.3%) | 162 (22.7%) |
| Bachelor's Degree or higher | 321 (82.5%) | 68 (17.5%) |
Occupancy by Age of Householder in Rio Communities
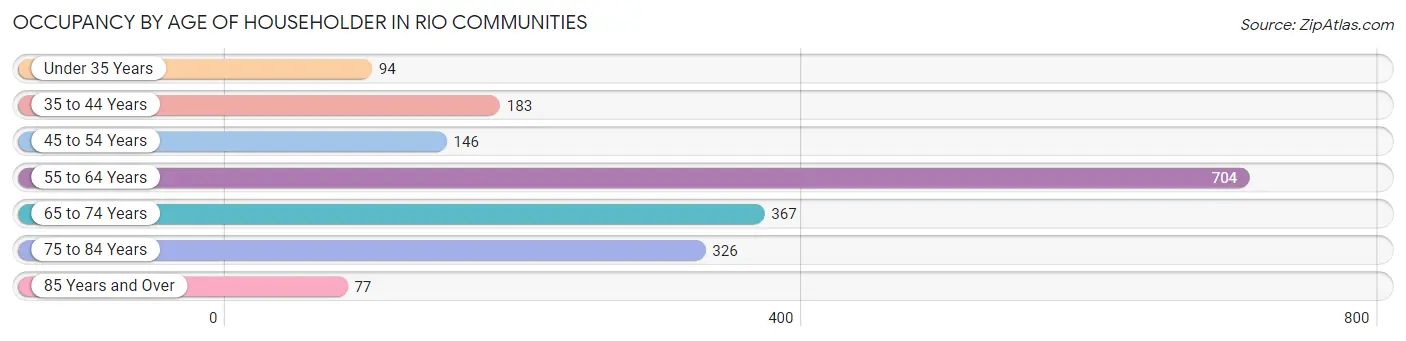
| Age Bracket | # Households | % Households |
| Under 35 Years | 94 | 5.0% |
| 35 to 44 Years | 183 | 9.7% |
| 45 to 54 Years | 146 | 7.7% |
| 55 to 64 Years | 704 | 37.1% |
| 65 to 74 Years | 367 | 19.4% |
| 75 to 84 Years | 326 | 17.2% |
| 85 Years and Over | 77 | 4.1% |
| Total | 1,897 | 100.0% |
Housing Finances in Rio Communities
Median Income by Occupancy in Rio Communities
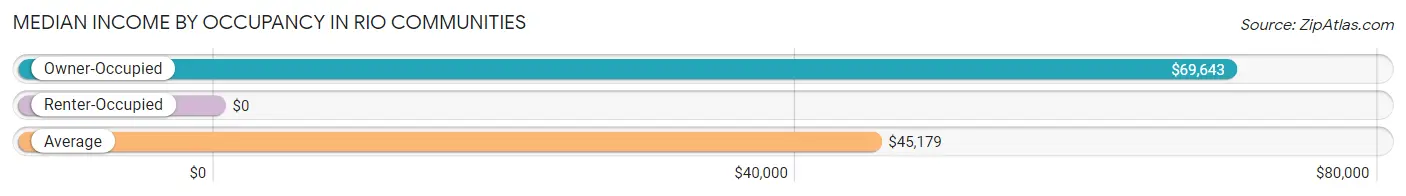
| Occupancy Type | # Households | Median Income |
| Owner-Occupied | 1,436 (75.7%) | $69,643 |
| Renter-Occupied | 461 (24.3%) | $0 |
| Average | 1,897 (100.0%) | $45,179 |
Occupancy by Householder Income Bracket in Rio Communities
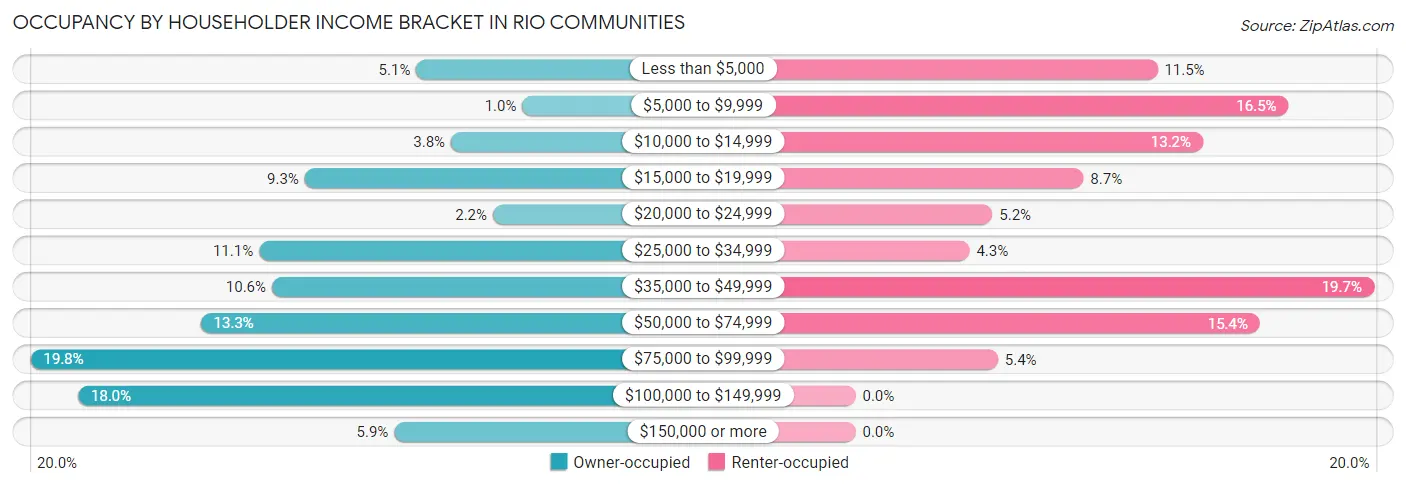
| Income Bracket | Owner-occupied | Renter-occupied |
| Less than $5,000 | 73 (5.1%) | 53 (11.5%) |
| $5,000 to $9,999 | 15 (1.0%) | 76 (16.5%) |
| $10,000 to $14,999 | 54 (3.8%) | 61 (13.2%) |
| $15,000 to $19,999 | 134 (9.3%) | 40 (8.7%) |
| $20,000 to $24,999 | 31 (2.2%) | 24 (5.2%) |
| $25,000 to $34,999 | 159 (11.1%) | 20 (4.3%) |
| $35,000 to $49,999 | 152 (10.6%) | 91 (19.7%) |
| $50,000 to $74,999 | 191 (13.3%) | 71 (15.4%) |
| $75,000 to $99,999 | 284 (19.8%) | 25 (5.4%) |
| $100,000 to $149,999 | 258 (18.0%) | 0 (0.0%) |
| $150,000 or more | 85 (5.9%) | 0 (0.0%) |
| Total | 1,436 (100.0%) | 461 (100.0%) |
Monthly Housing Cost Tiers in Rio Communities
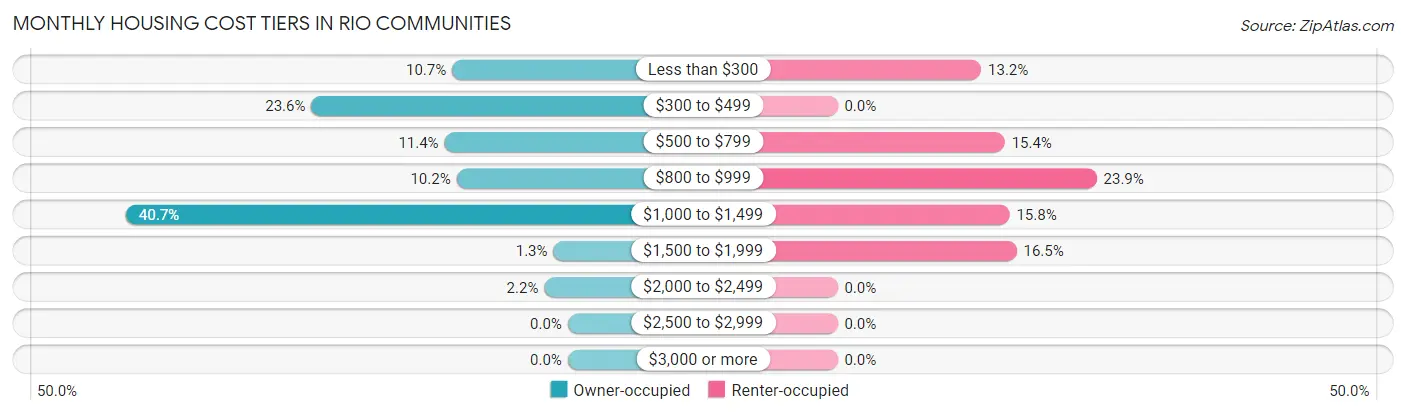
| Monthly Cost | Owner-occupied | Renter-occupied |
| Less than $300 | 153 (10.6%) | 61 (13.2%) |
| $300 to $499 | 339 (23.6%) | 0 (0.0%) |
| $500 to $799 | 163 (11.4%) | 71 (15.4%) |
| $800 to $999 | 147 (10.2%) | 110 (23.9%) |
| $1,000 to $1,499 | 584 (40.7%) | 73 (15.8%) |
| $1,500 to $1,999 | 19 (1.3%) | 76 (16.5%) |
| $2,000 to $2,499 | 31 (2.2%) | 0 (0.0%) |
| $2,500 to $2,999 | 0 (0.0%) | 0 (0.0%) |
| $3,000 or more | 0 (0.0%) | 0 (0.0%) |
| Total | 1,436 (100.0%) | 461 (100.0%) |
Physical Housing Characteristics in Rio Communities
Housing Structures in Rio Communities
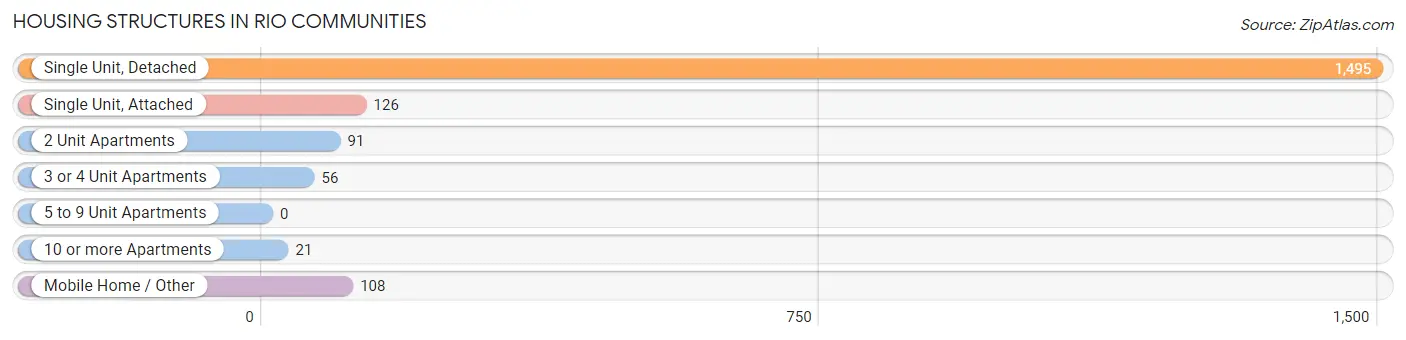
| Structure Type | # Housing Units | % Housing Units |
| Single Unit, Detached | 1,495 | 78.8% |
| Single Unit, Attached | 126 | 6.6% |
| 2 Unit Apartments | 91 | 4.8% |
| 3 or 4 Unit Apartments | 56 | 2.9% |
| 5 to 9 Unit Apartments | 0 | 0.0% |
| 10 or more Apartments | 21 | 1.1% |
| Mobile Home / Other | 108 | 5.7% |
| Total | 1,897 | 100.0% |
Housing Structures by Occupancy in Rio Communities
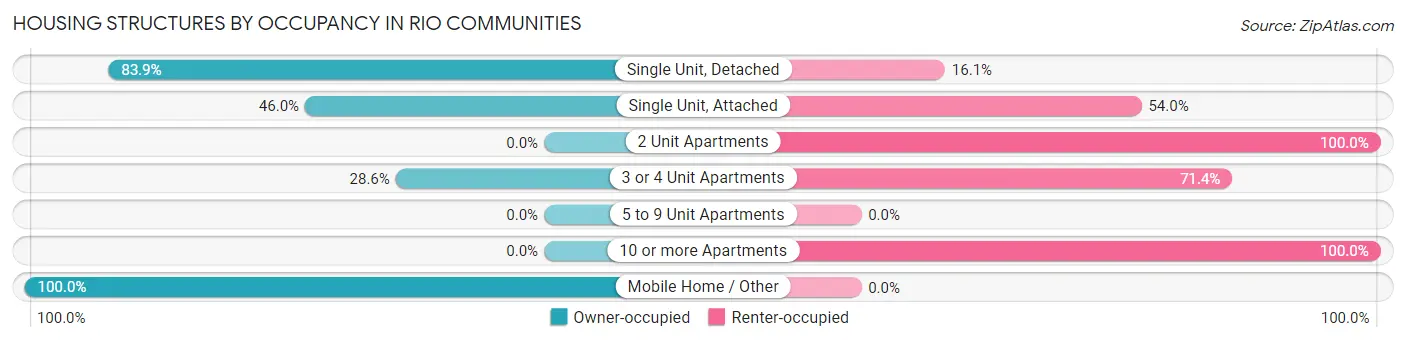
| Structure Type | Owner-occupied | Renter-occupied |
| Single Unit, Detached | 1,254 (83.9%) | 241 (16.1%) |
| Single Unit, Attached | 58 (46.0%) | 68 (54.0%) |
| 2 Unit Apartments | 0 (0.0%) | 91 (100.0%) |
| 3 or 4 Unit Apartments | 16 (28.6%) | 40 (71.4%) |
| 5 to 9 Unit Apartments | 0 (0.0%) | 0 (0.0%) |
| 10 or more Apartments | 0 (0.0%) | 21 (100.0%) |
| Mobile Home / Other | 108 (100.0%) | 0 (0.0%) |
| Total | 1,436 (75.7%) | 461 (24.3%) |
Housing Structures by Number of Rooms in Rio Communities
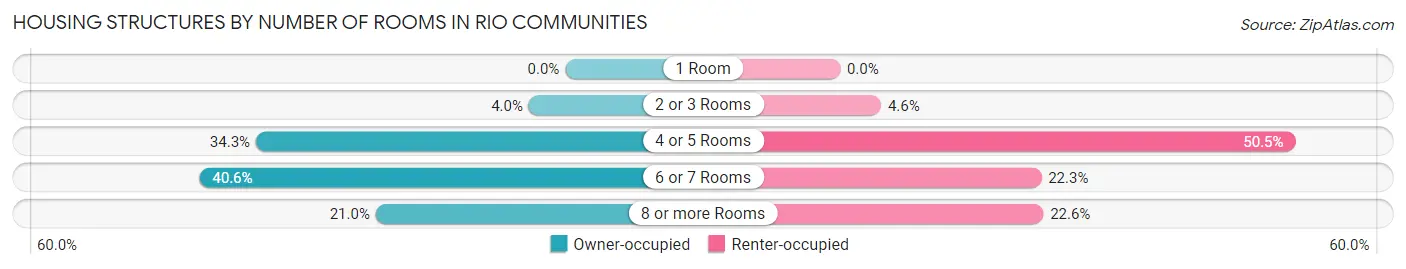
| Number of Rooms | Owner-occupied | Renter-occupied |
| 1 Room | 0 (0.0%) | 0 (0.0%) |
| 2 or 3 Rooms | 58 (4.0%) | 21 (4.6%) |
| 4 or 5 Rooms | 493 (34.3%) | 233 (50.5%) |
| 6 or 7 Rooms | 583 (40.6%) | 103 (22.3%) |
| 8 or more Rooms | 302 (21.0%) | 104 (22.6%) |
| Total | 1,436 (100.0%) | 461 (100.0%) |
Housing Structure by Heating Type in Rio Communities
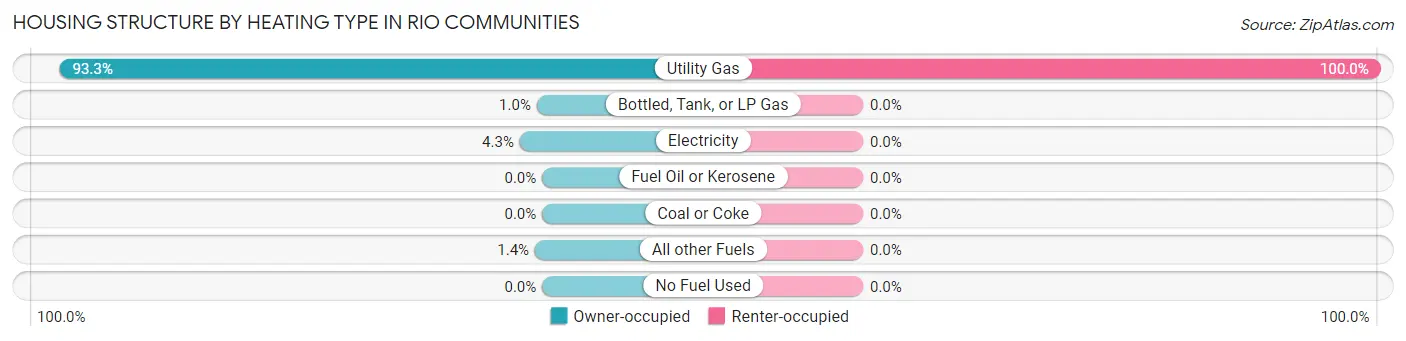
| Heating Type | Owner-occupied | Renter-occupied |
| Utility Gas | 1,339 (93.2%) | 461 (100.0%) |
| Bottled, Tank, or LP Gas | 15 (1.0%) | 0 (0.0%) |
| Electricity | 62 (4.3%) | 0 (0.0%) |
| Fuel Oil or Kerosene | 0 (0.0%) | 0 (0.0%) |
| Coal or Coke | 0 (0.0%) | 0 (0.0%) |
| All other Fuels | 20 (1.4%) | 0 (0.0%) |
| No Fuel Used | 0 (0.0%) | 0 (0.0%) |
| Total | 1,436 (100.0%) | 461 (100.0%) |
Household Vehicle Usage in Rio Communities
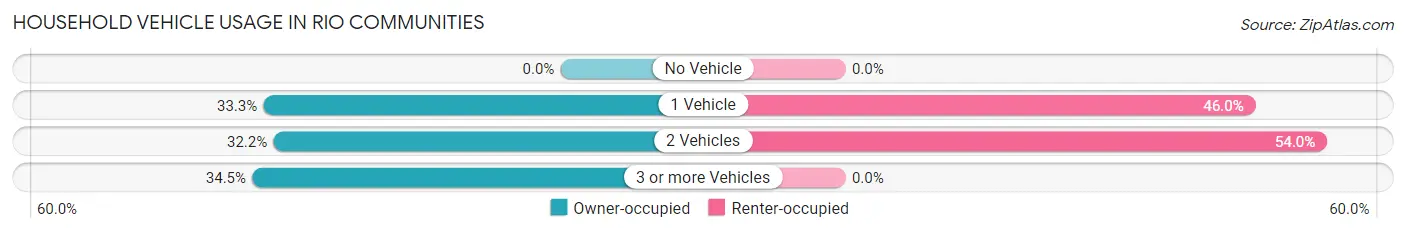
| Vehicles per Household | Owner-occupied | Renter-occupied |
| No Vehicle | 0 (0.0%) | 0 (0.0%) |
| 1 Vehicle | 478 (33.3%) | 212 (46.0%) |
| 2 Vehicles | 462 (32.2%) | 249 (54.0%) |
| 3 or more Vehicles | 496 (34.5%) | 0 (0.0%) |
| Total | 1,436 (100.0%) | 461 (100.0%) |
Real Estate & Mortgages in Rio Communities
Real Estate and Mortgage Overview in Rio Communities
| Characteristic | Without Mortgage | With Mortgage |
| Housing Units | 540 | 896 |
| Median Property Value | $168,300 | $162,000 |
| Median Household Income | - | - |
| Monthly Housing Costs | $376 | $0 |
| Real Estate Taxes | $1,053 | $35 |
Property Value by Mortgage Status in Rio Communities
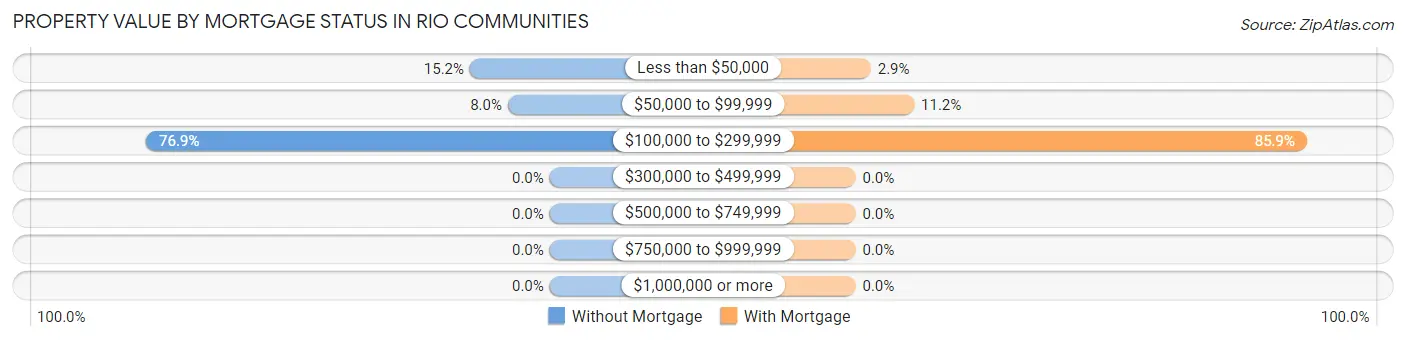
| Property Value | Without Mortgage | With Mortgage |
| Less than $50,000 | 82 (15.2%) | 26 (2.9%) |
| $50,000 to $99,999 | 43 (8.0%) | 100 (11.2%) |
| $100,000 to $299,999 | 415 (76.8%) | 770 (85.9%) |
| $300,000 to $499,999 | 0 (0.0%) | 0 (0.0%) |
| $500,000 to $749,999 | 0 (0.0%) | 0 (0.0%) |
| $750,000 to $999,999 | 0 (0.0%) | 0 (0.0%) |
| $1,000,000 or more | 0 (0.0%) | 0 (0.0%) |
| Total | 540 (100.0%) | 896 (100.0%) |
Household Income by Mortgage Status in Rio Communities
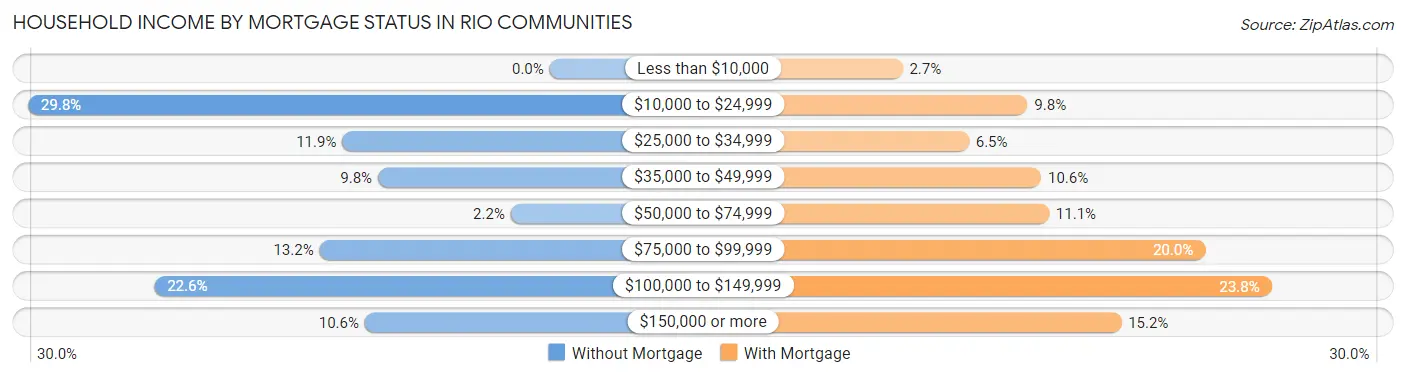
| Household Income | Without Mortgage | With Mortgage |
| Less than $10,000 | 0 (0.0%) | 24 (2.7%) |
| $10,000 to $24,999 | 161 (29.8%) | 88 (9.8%) |
| $25,000 to $34,999 | 64 (11.8%) | 58 (6.5%) |
| $35,000 to $49,999 | 53 (9.8%) | 95 (10.6%) |
| $50,000 to $74,999 | 12 (2.2%) | 99 (11.1%) |
| $75,000 to $99,999 | 71 (13.2%) | 179 (20.0%) |
| $100,000 to $149,999 | 122 (22.6%) | 213 (23.8%) |
| $150,000 or more | 57 (10.6%) | 136 (15.2%) |
| Total | 540 (100.0%) | 896 (100.0%) |
Property Value to Household Income Ratio in Rio Communities
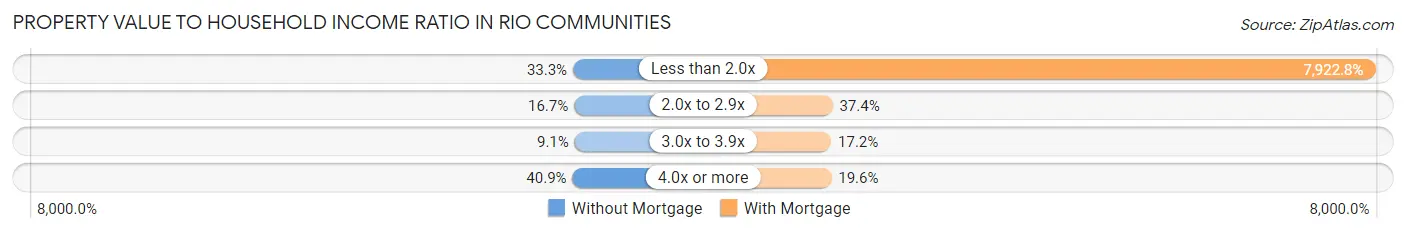
| Value-to-Income Ratio | Without Mortgage | With Mortgage |
| Less than 2.0x | 180 (33.3%) | 70,988 (7,922.8%) |
| 2.0x to 2.9x | 90 (16.7%) | 335 (37.4%) |
| 3.0x to 3.9x | 49 (9.1%) | 154 (17.2%) |
| 4.0x or more | 221 (40.9%) | 176 (19.6%) |
| Total | 540 (100.0%) | 896 (100.0%) |
Real Estate Taxes by Mortgage Status in Rio Communities
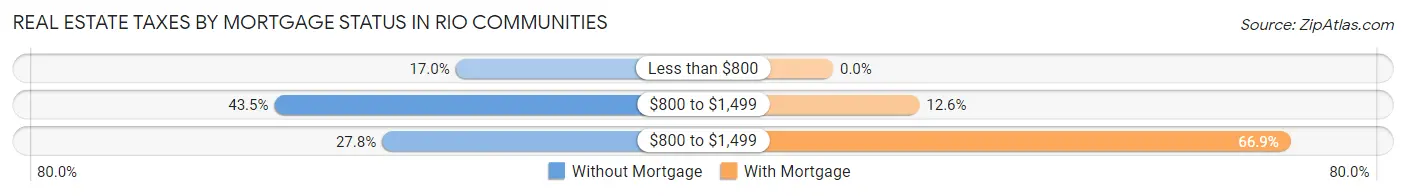
| Property Taxes | Without Mortgage | With Mortgage |
| Less than $800 | 92 (17.0%) | 0 (0.0%) |
| $800 to $1,499 | 235 (43.5%) | 113 (12.6%) |
| $800 to $1,499 | 150 (27.8%) | 599 (66.8%) |
| Total | 540 (100.0%) | 896 (100.0%) |
Health & Disability in Rio Communities
Health Insurance Coverage by Age in Rio Communities
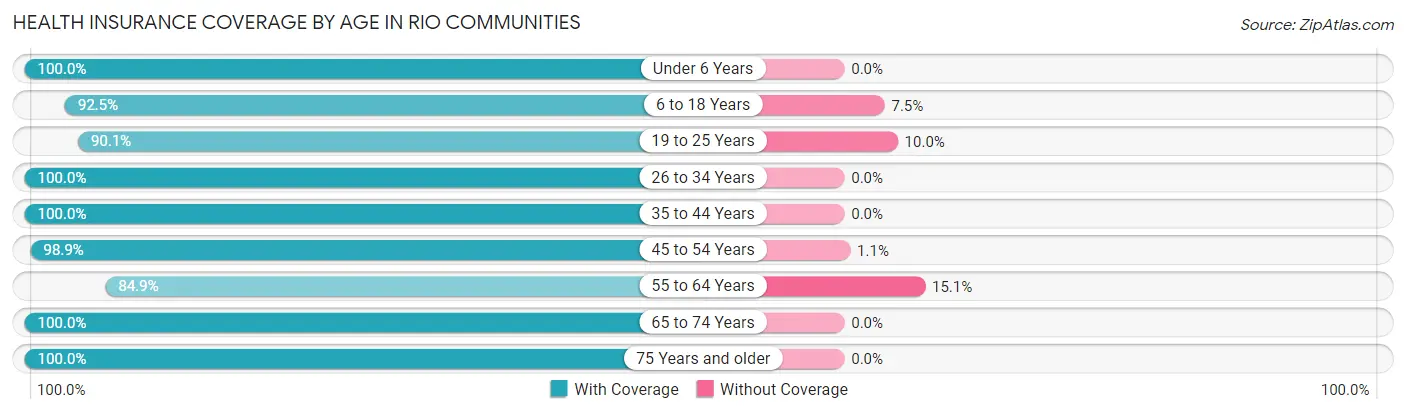
| Age Bracket | With Coverage | Without Coverage |
| Under 6 Years | 172 (100.0%) | 0 (0.0%) |
| 6 to 18 Years | 506 (92.5%) | 41 (7.5%) |
| 19 to 25 Years | 706 (90.0%) | 78 (10.0%) |
| 26 to 34 Years | 195 (100.0%) | 0 (0.0%) |
| 35 to 44 Years | 470 (100.0%) | 0 (0.0%) |
| 45 to 54 Years | 362 (98.9%) | 4 (1.1%) |
| 55 to 64 Years | 891 (84.9%) | 158 (15.1%) |
| 65 to 74 Years | 603 (100.0%) | 0 (0.0%) |
| 75 Years and older | 727 (100.0%) | 0 (0.0%) |
| Total | 4,632 (94.3%) | 281 (5.7%) |
Health Insurance Coverage by Citizenship Status in Rio Communities
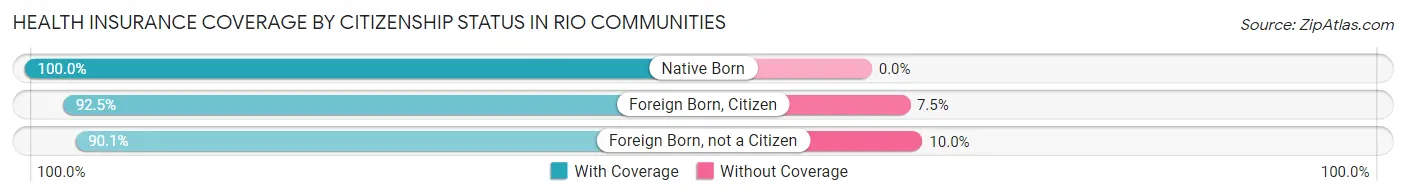
| Citizenship Status | With Coverage | Without Coverage |
| Native Born | 172 (100.0%) | 0 (0.0%) |
| Foreign Born, Citizen | 506 (92.5%) | 41 (7.5%) |
| Foreign Born, not a Citizen | 706 (90.0%) | 78 (10.0%) |
Health Insurance Coverage by Household Income in Rio Communities
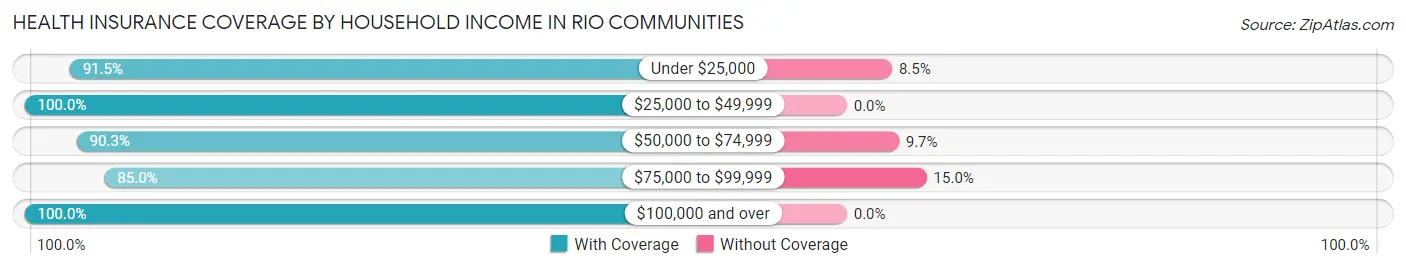
| Household Income | With Coverage | Without Coverage |
| Under $25,000 | 952 (91.5%) | 88 (8.5%) |
| $25,000 to $49,999 | 1,018 (100.0%) | 0 (0.0%) |
| $50,000 to $74,999 | 658 (90.3%) | 71 (9.7%) |
| $75,000 to $99,999 | 671 (85.0%) | 118 (15.0%) |
| $100,000 and over | 1,333 (100.0%) | 0 (0.0%) |
Public vs Private Health Insurance Coverage by Age in Rio Communities
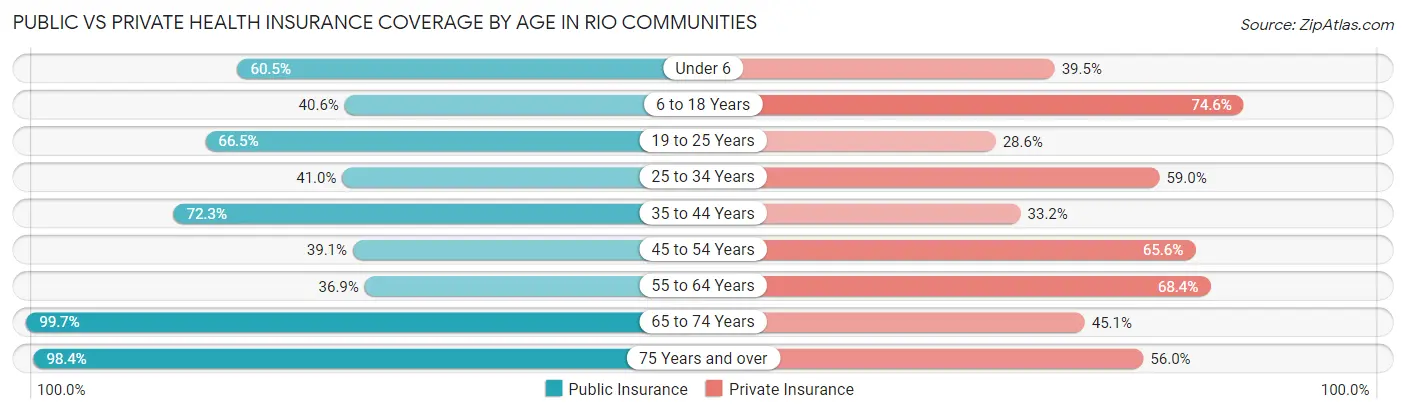
| Age Bracket | Public Insurance | Private Insurance |
| Under 6 | 104 (60.5%) | 68 (39.5%) |
| 6 to 18 Years | 222 (40.6%) | 408 (74.6%) |
| 19 to 25 Years | 521 (66.4%) | 224 (28.6%) |
| 25 to 34 Years | 80 (41.0%) | 115 (59.0%) |
| 35 to 44 Years | 340 (72.3%) | 156 (33.2%) |
| 45 to 54 Years | 143 (39.1%) | 240 (65.6%) |
| 55 to 64 Years | 387 (36.9%) | 717 (68.3%) |
| 65 to 74 Years | 601 (99.7%) | 272 (45.1%) |
| 75 Years and over | 715 (98.4%) | 407 (56.0%) |
| Total | 3,113 (63.4%) | 2,607 (53.1%) |
Disability Status by Sex by Age in Rio Communities
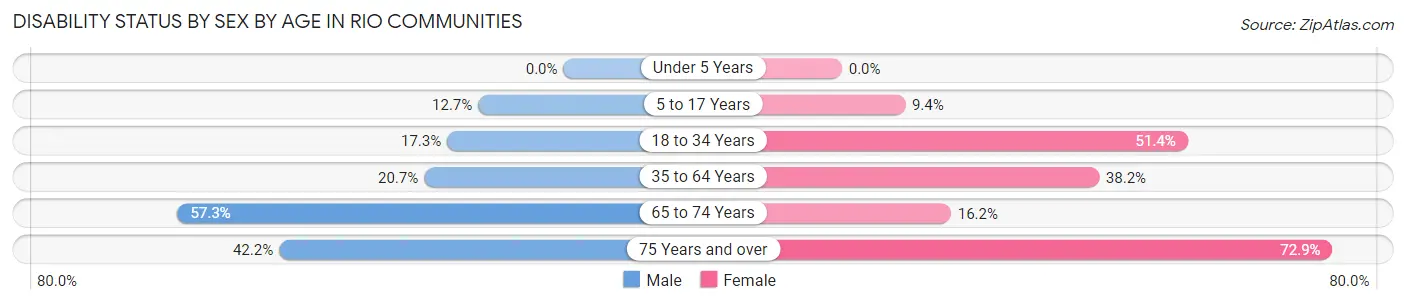
| Age Bracket | Male | Female |
| Under 5 Years | 0 (0.0%) | 0 (0.0%) |
| 5 to 17 Years | 30 (12.7%) | 27 (9.4%) |
| 18 to 34 Years | 76 (17.3%) | 323 (51.3%) |
| 35 to 64 Years | 151 (20.7%) | 441 (38.2%) |
| 65 to 74 Years | 204 (57.3%) | 40 (16.2%) |
| 75 Years and over | 125 (42.2%) | 314 (72.9%) |
Disability Class by Sex by Age in Rio Communities
Disability Class: Hearing Difficulty
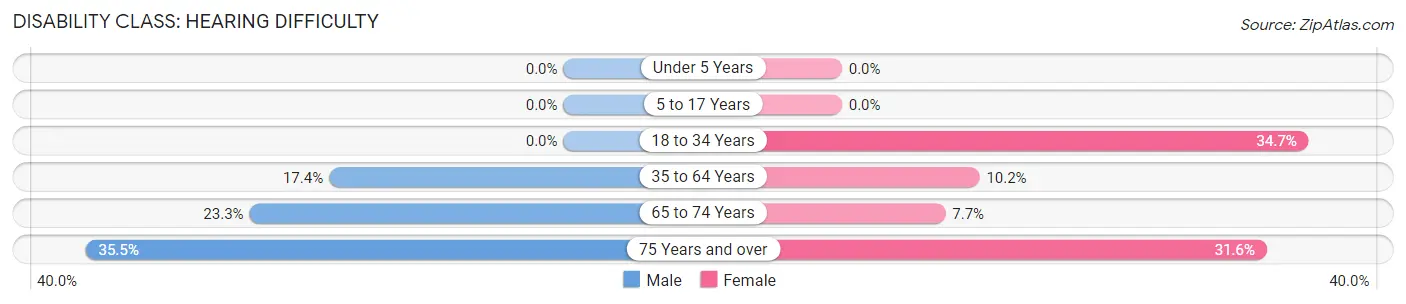
| Age Bracket | Male | Female |
| Under 5 Years | 0 (0.0%) | 0 (0.0%) |
| 5 to 17 Years | 0 (0.0%) | 0 (0.0%) |
| 18 to 34 Years | 0 (0.0%) | 218 (34.7%) |
| 35 to 64 Years | 127 (17.4%) | 118 (10.2%) |
| 65 to 74 Years | 83 (23.3%) | 19 (7.7%) |
| 75 Years and over | 105 (35.5%) | 136 (31.6%) |
Disability Class: Vision Difficulty
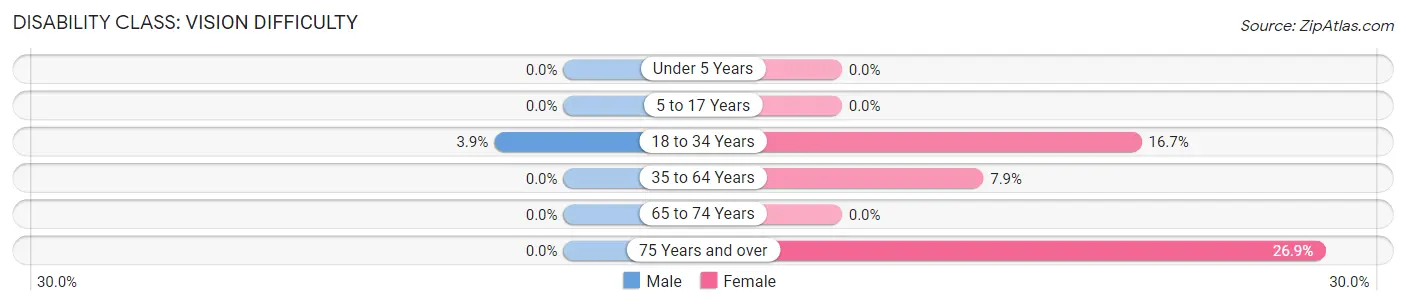
| Age Bracket | Male | Female |
| Under 5 Years | 0 (0.0%) | 0 (0.0%) |
| 5 to 17 Years | 0 (0.0%) | 0 (0.0%) |
| 18 to 34 Years | 17 (3.9%) | 105 (16.7%) |
| 35 to 64 Years | 0 (0.0%) | 91 (7.9%) |
| 65 to 74 Years | 0 (0.0%) | 0 (0.0%) |
| 75 Years and over | 0 (0.0%) | 116 (26.9%) |
Disability Class: Cognitive Difficulty
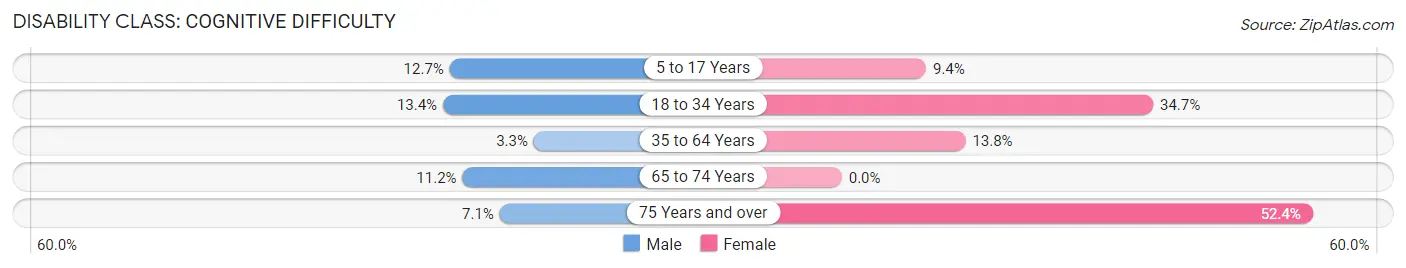
| Age Bracket | Male | Female |
| 5 to 17 Years | 30 (12.7%) | 27 (9.4%) |
| 18 to 34 Years | 59 (13.4%) | 218 (34.7%) |
| 35 to 64 Years | 24 (3.3%) | 159 (13.8%) |
| 65 to 74 Years | 40 (11.2%) | 0 (0.0%) |
| 75 Years and over | 21 (7.1%) | 226 (52.4%) |
Disability Class: Ambulatory Difficulty
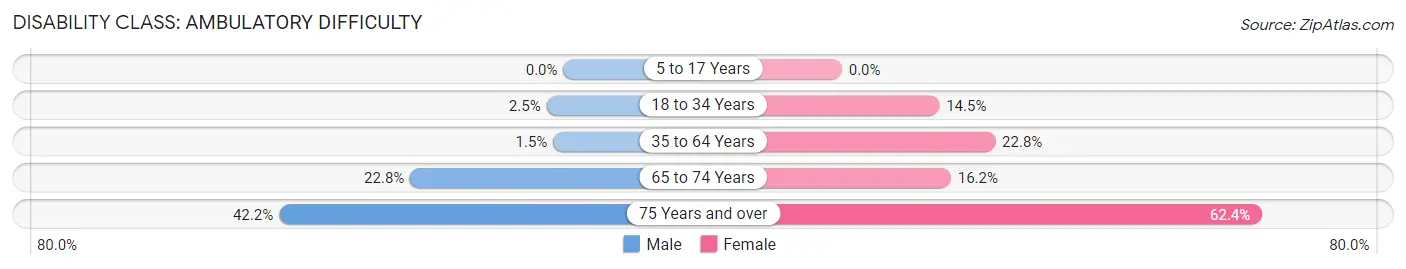
| Age Bracket | Male | Female |
| 5 to 17 Years | 0 (0.0%) | 0 (0.0%) |
| 18 to 34 Years | 11 (2.5%) | 91 (14.5%) |
| 35 to 64 Years | 11 (1.5%) | 263 (22.8%) |
| 65 to 74 Years | 81 (22.8%) | 40 (16.2%) |
| 75 Years and over | 125 (42.2%) | 269 (62.4%) |
Disability Class: Self-Care Difficulty
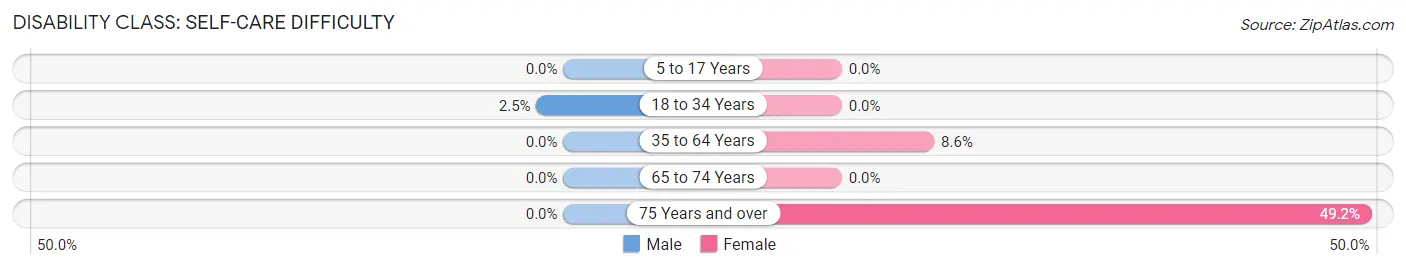
| Age Bracket | Male | Female |
| 5 to 17 Years | 0 (0.0%) | 0 (0.0%) |
| 18 to 34 Years | 11 (2.5%) | 0 (0.0%) |
| 35 to 64 Years | 0 (0.0%) | 99 (8.6%) |
| 65 to 74 Years | 0 (0.0%) | 0 (0.0%) |
| 75 Years and over | 0 (0.0%) | 212 (49.2%) |
Technology Access in Rio Communities
Computing Device Access in Rio Communities
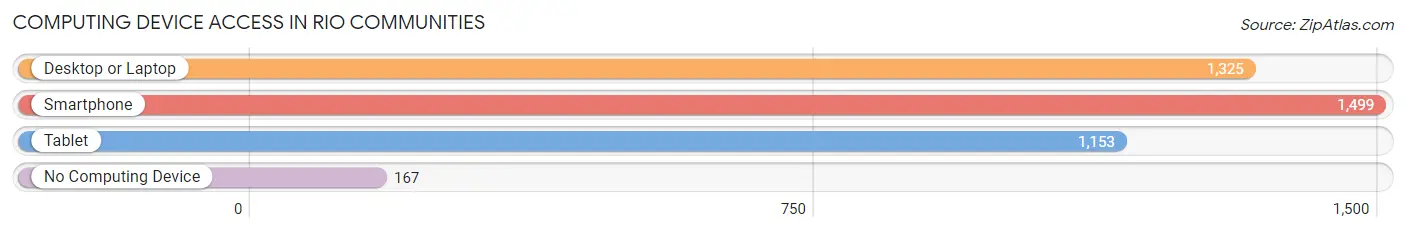
| Device Type | # Households | % Households |
| Desktop or Laptop | 1,325 | 69.9% |
| Smartphone | 1,499 | 79.0% |
| Tablet | 1,153 | 60.8% |
| No Computing Device | 167 | 8.8% |
| Total | 1,897 | 100.0% |
Internet Access in Rio Communities
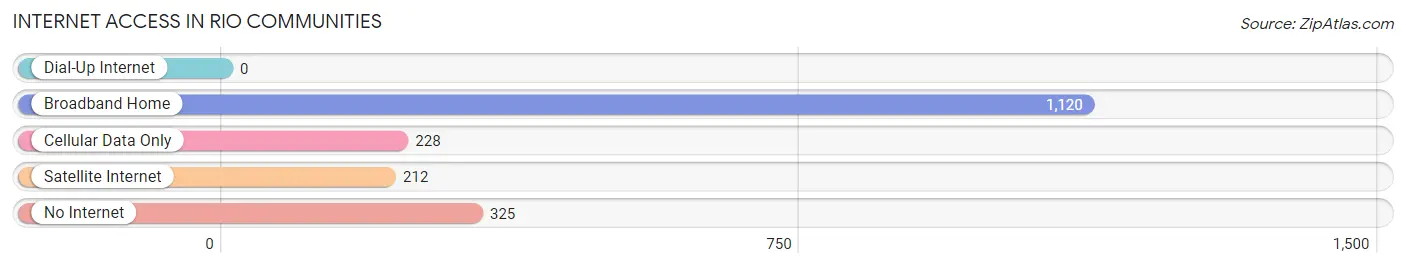
| Internet Type | # Households | % Households |
| Dial-Up Internet | 0 | 0.0% |
| Broadband Home | 1,120 | 59.0% |
| Cellular Data Only | 228 | 12.0% |
| Satellite Internet | 212 | 11.2% |
| No Internet | 325 | 17.1% |
| Total | 1,897 | 100.0% |
Rio Communities Summary
Rio Communities is a census-designated place (CDP) located in Valencia County, New Mexico. It is situated in the Rio Grande Valley, approximately 20 miles south of Albuquerque. The population of Rio Communities was 8,845 at the 2010 census.
Geography
Rio Communities is located at 34°51'25"N 106°45'45"W (34.856944, -106.762500). According to the United States Census Bureau, the CDP has a total area of 8.3 square miles (21.5 km2), all of it land.
History
Rio Communities was originally inhabited by the Pueblo Indians. The area was later settled by Spanish colonists in the late 1700s. The area was part of the original Spanish land grant of the Rio Grande Valley. The area was later annexed by the United States in 1848 as part of the Treaty of Guadalupe Hidalgo.
The area was originally known as "Rio Abajo" or "Lower Rio" due to its location along the Rio Grande. The name was later changed to "Rio Communities" in the early 1900s.
Economy
Rio Communities is primarily a rural community. The primary industries are agriculture and tourism. The area is known for its pecan orchards and vineyards. The area is also home to several small businesses, including restaurants, retail stores, and service providers.
Demographics
As of the 2010 census, there were 8,845 people, 2,945 households, and 2,521 families residing in the CDP. The population density was 1,068.2 people per square mile (412.3/km2). There were 3,093 housing units at an average density of 373.3 per square mile (144.2/km2). The racial makeup of the CDP was 68.2% White, 0.7% African American, 1.2% Native American, 0.3% Asian, 0.1% Pacific Islander, 27.2% from other races, and 2.4% from two or more races. Hispanic or Latino of any race were 79.2% of the population.
There were 2,945 households, out of which 41.2% had children under the age of 18 living with them, 57.2% were married couples living together, 15.2% had a female householder with no husband present, and 21.2% were non-families. 17.2% of all households were made up of individuals, and 6.7% had someone living alone who was 65 years of age or older. The average household size was 3.00 and the average family size was 3.41.
In the CDP, the population was spread out, with 30.7% under the age of 18, 9.7% from 18 to 24, 28.2% from 25 to 44, 22.2% from 45 to 64, and 9.2% who were 65 years of age or older. The median age was 32 years. For every 100 females, there were 97.2 males. For every 100 females age 18 and over, there were 94.2 males.
The median income for a household in the CDP was $30,938, and the median income for a family was $33,906. Males had a median income of $27,917 versus $20,972 for females. The per capita income for the CDP was $12,845. About 17.2% of families and 19.7% of the population were below the poverty line, including 25.2% of those under age 18 and 15.2% of those age 65 or over.
Common Questions
What is Per Capita Income in Rio Communities?
Per Capita income in Rio Communities is $25,143.
What is the Median Family Income in Rio Communities?
Median Family Income in Rio Communities is $69,643.
What is the Median Household income in Rio Communities?
Median Household Income in Rio Communities is $45,179.
What is Inequality or Gini Index in Rio Communities?
Inequality or Gini Index in Rio Communities is 0.43.
What is the Total Population of Rio Communities?
Total Population of Rio Communities is 4,913.
What is the Total Male Population of Rio Communities?
Total Male Population of Rio Communities is 2,117.
What is the Total Female Population of Rio Communities?
Total Female Population of Rio Communities is 2,796.
What is the Ratio of Males per 100 Females in Rio Communities?
There are 75.72 Males per 100 Females in Rio Communities.
What is the Ratio of Females per 100 Males in Rio Communities?
There are 132.07 Females per 100 Males in Rio Communities.
What is the Median Population Age in Rio Communities?
Median Population Age in Rio Communities is 51.9 Years.
What is the Average Family Size in Rio Communities
Average Family Size in Rio Communities is 3.3 People.
What is the Average Household Size in Rio Communities
Average Household Size in Rio Communities is 2.6 People.
How Large is the Labor Force in Rio Communities?
There are 1,942 People in the Labor Forcein in Rio Communities.
What is the Percentage of People in the Labor Force in Rio Communities?
44.8% of People are in the Labor Force in Rio Communities.
What is the Unemployment Rate in Rio Communities?
Unemployment Rate in Rio Communities is 14.5%.