Alamo, NM Map & Demographics
Alamo Map
Alamo Overview
$9,043
PER CAPITA INCOME
$22,303
AVG FAMILY INCOME
$24,118
AVG HOUSEHOLD INCOME
11.2%
WAGE / INCOME GAP [ % ]
88.8¢/ $1
WAGE / INCOME GAP [ $ ]
0.39
INEQUALITY / GINI INDEX
1,081
TOTAL POPULATION
465
MALE POPULATION
616
FEMALE POPULATION
75.49
MALES / 100 FEMALES
132.47
FEMALES / 100 MALES
42.5
MEDIAN AGE
4.7
AVG FAMILY SIZE
4.6
AVG HOUSEHOLD SIZE
377
LABOR FORCE [ PEOPLE ]
47.8%
PERCENT IN LABOR FORCE
22.5%
UNEMPLOYMENT RATE
Alamo Area Codes
Income in Alamo
Income Overview in Alamo
Per Capita Income in Alamo is $9,043, while median incomes of families and households are $22,303 and $24,118 respectively.
| Characteristic | Number | Measure |
| Per Capita Income | 1,081 | $9,043 |
| Median Family Income | 200 | $22,303 |
| Mean Family Income | 200 | $29,896 |
| Median Household Income | 236 | $24,118 |
| Mean Household Income | 236 | $30,594 |
| Income Deficit | 200 | $0 |
| Wage / Income Gap (%) | 1,081 | 11.20% |
| Wage / Income Gap ($) | 1,081 | 88.80¢ per $1 |
| Gini / Inequality Index | 1,081 | 0.39 |
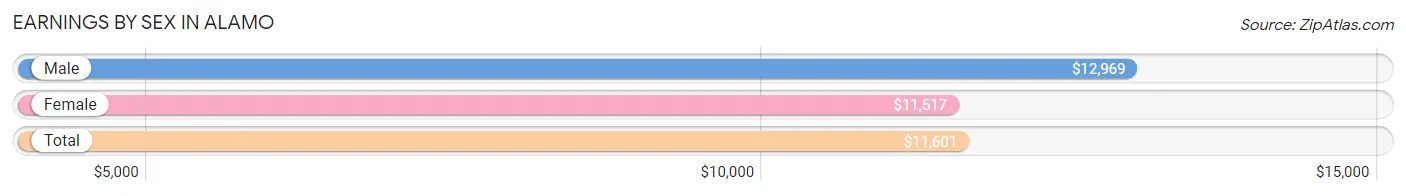
Earnings by Sex in Alamo
Average Earnings in Alamo are $11,601, $12,969 for men and $11,517 for women, a difference of 11.2%.
| Sex | Number | Average Earnings |
| Male | 92 (25.6%) | $12,969 |
| Female | 268 (74.4%) | $11,517 |
| Total | 360 (100.0%) | $11,601 |
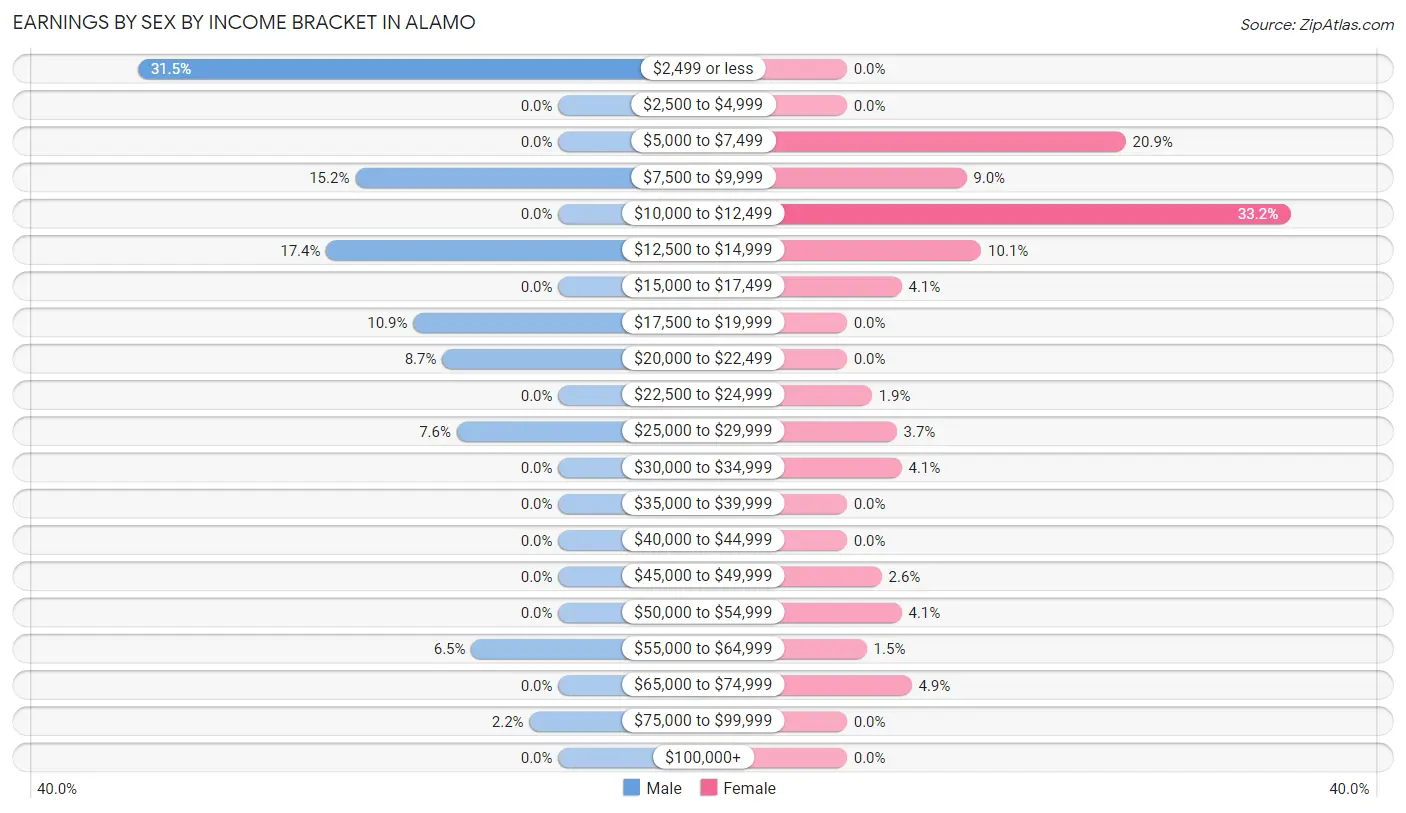
Earnings by Sex by Income Bracket in Alamo
The most common earnings brackets in Alamo are $2,499 or less for men (29 | 31.5%) and $10,000 to $12,499 for women (89 | 33.2%).
| Income | Male | Female |
| $2,499 or less | 29 (31.5%) | 0 (0.0%) |
| $2,500 to $4,999 | 0 (0.0%) | 0 (0.0%) |
| $5,000 to $7,499 | 0 (0.0%) | 56 (20.9%) |
| $7,500 to $9,999 | 14 (15.2%) | 24 (9.0%) |
| $10,000 to $12,499 | 0 (0.0%) | 89 (33.2%) |
| $12,500 to $14,999 | 16 (17.4%) | 27 (10.1%) |
| $15,000 to $17,499 | 0 (0.0%) | 11 (4.1%) |
| $17,500 to $19,999 | 10 (10.9%) | 0 (0.0%) |
| $20,000 to $22,499 | 8 (8.7%) | 0 (0.0%) |
| $22,500 to $24,999 | 0 (0.0%) | 5 (1.9%) |
| $25,000 to $29,999 | 7 (7.6%) | 10 (3.7%) |
| $30,000 to $34,999 | 0 (0.0%) | 11 (4.1%) |
| $35,000 to $39,999 | 0 (0.0%) | 0 (0.0%) |
| $40,000 to $44,999 | 0 (0.0%) | 0 (0.0%) |
| $45,000 to $49,999 | 0 (0.0%) | 7 (2.6%) |
| $50,000 to $54,999 | 0 (0.0%) | 11 (4.1%) |
| $55,000 to $64,999 | 6 (6.5%) | 4 (1.5%) |
| $65,000 to $74,999 | 0 (0.0%) | 13 (4.9%) |
| $75,000 to $99,999 | 2 (2.2%) | 0 (0.0%) |
| $100,000+ | 0 (0.0%) | 0 (0.0%) |
| Total | 92 (100.0%) | 268 (100.0%) |
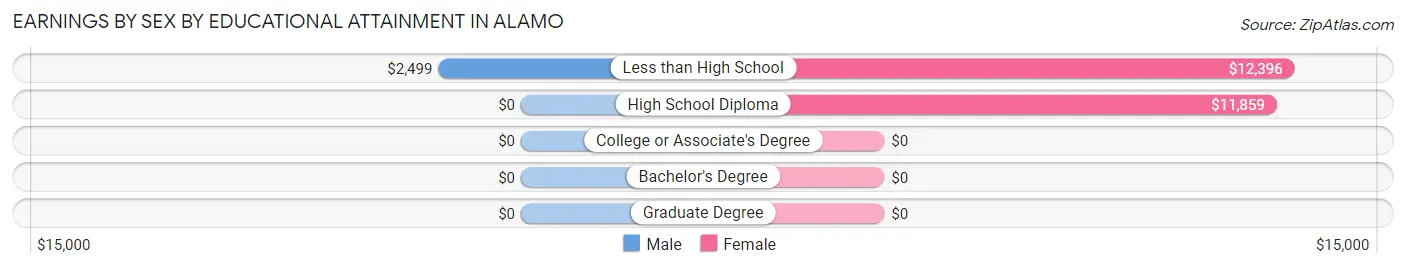
Earnings by Sex by Educational Attainment in Alamo
Average earnings in Alamo are $12,969 for men and $12,135 for women, a difference of 6.4%. Men with an educational attainment of less than high school enjoy the highest average annual earnings of $2,499, while those with less than high school education earn the least with $2,499. Women with an educational attainment of less than high school earn the most with the average annual earnings of $12,396, while those with high school diploma education have the smallest earnings of $11,859.
| Educational Attainment | Male Income | Female Income |
| Less than High School | $2,499 | $12,396 |
| High School Diploma | - | - |
| College or Associate's Degree | - | - |
| Bachelor's Degree | - | - |
| Graduate Degree | - | - |
| Total | $12,969 | $12,135 |
Family Income in Alamo
Family Income Brackets in Alamo
According to the Alamo family income data, there are 76 families falling into the $15,000 to $24,999 income range, which is the most common income bracket and makes up 38.0% of all families.
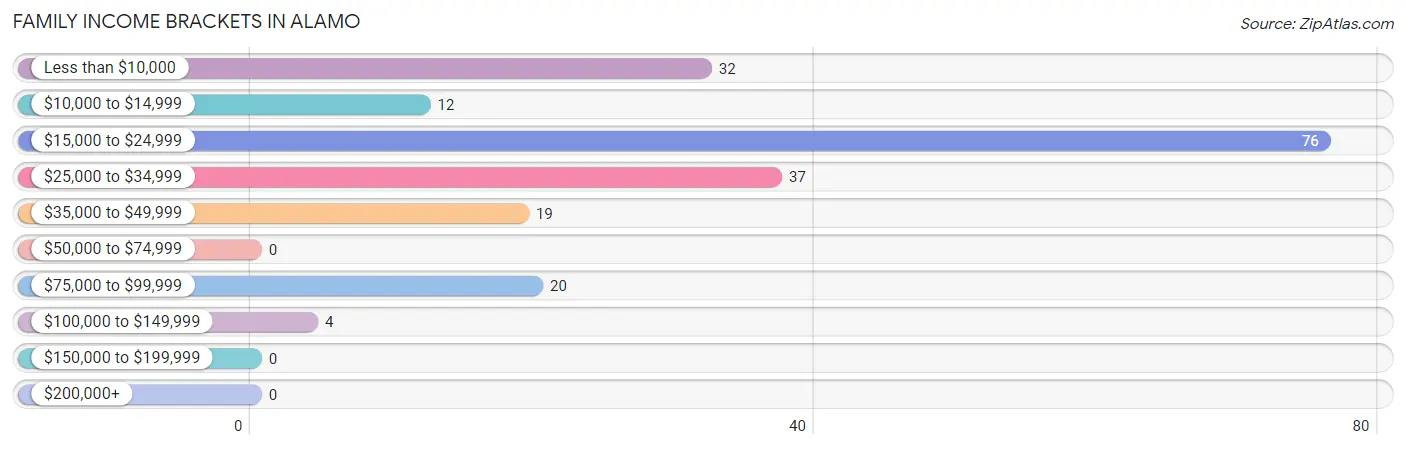
| Income Bracket | # Families | % Families |
| Less than $10,000 | 32 | 16.0% |
| $10,000 to $14,999 | 12 | 6.0% |
| $15,000 to $24,999 | 76 | 38.0% |
| $25,000 to $34,999 | 37 | 18.5% |
| $35,000 to $49,999 | 19 | 9.5% |
| $50,000 to $74,999 | 0 | 0.0% |
| $75,000 to $99,999 | 20 | 10.0% |
| $100,000 to $149,999 | 4 | 2.0% |
| $150,000 to $199,999 | 0 | 0.0% |
| $200,000+ | 0 | 0.0% |
Family Income by Famaliy Size in Alamo
2-person families (134 | 67.0%) account for the highest median family income in Alamo with $25,878 per family, while 2-person families (134 | 67.0%) have the highest median income of $12,939 per family member.
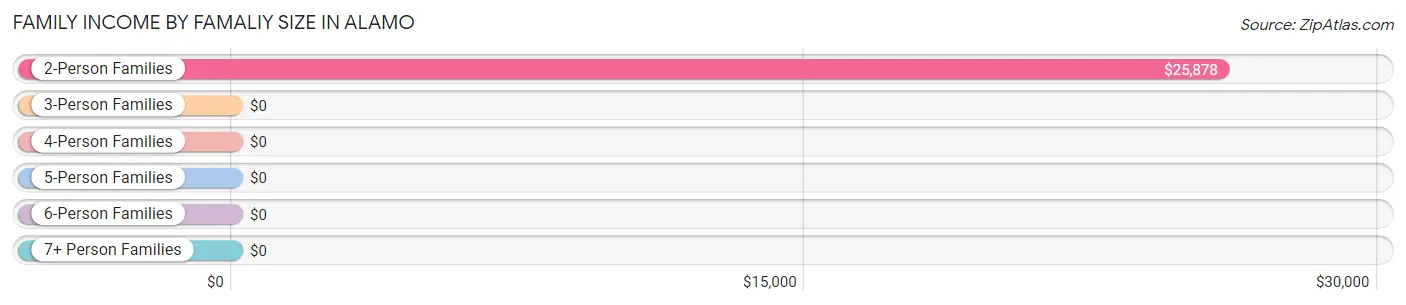
| Income Bracket | # Families | Median Income |
| 2-Person Families | 134 (67.0%) | $25,878 |
| 3-Person Families | 24 (12.0%) | $0 |
| 4-Person Families | 5 (2.5%) | $0 |
| 5-Person Families | 25 (12.5%) | $0 |
| 6-Person Families | 0 (0.0%) | $0 |
| 7+ Person Families | 12 (6.0%) | $0 |
| Total | 200 (100.0%) | $22,303 |
Family Income by Number of Earners in Alamo
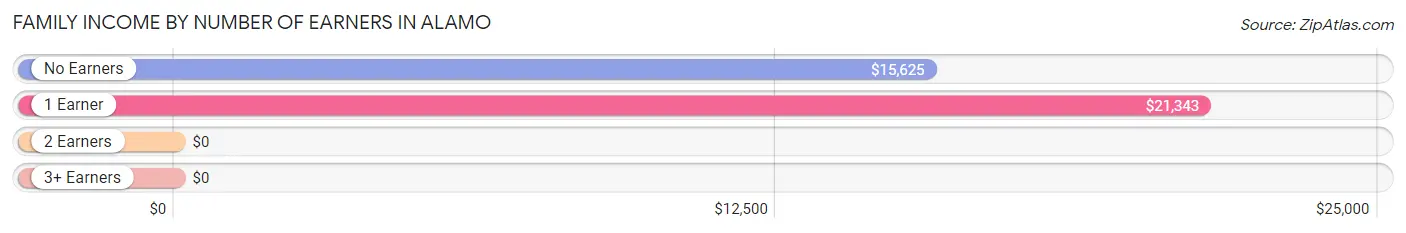
| Number of Earners | # Families | Median Income |
| No Earners | 36 (18.0%) | $15,625 |
| 1 Earner | 111 (55.5%) | $21,343 |
| 2 Earners | 53 (26.5%) | $0 |
| 3+ Earners | 0 (0.0%) | $0 |
| Total | 200 (100.0%) | $22,303 |
Household Income in Alamo
Household Income Brackets in Alamo
With 65 households falling in the category, the $15,000 to $24,999 income range is the most frequent in Alamo, accounting for 27.5% of all households.
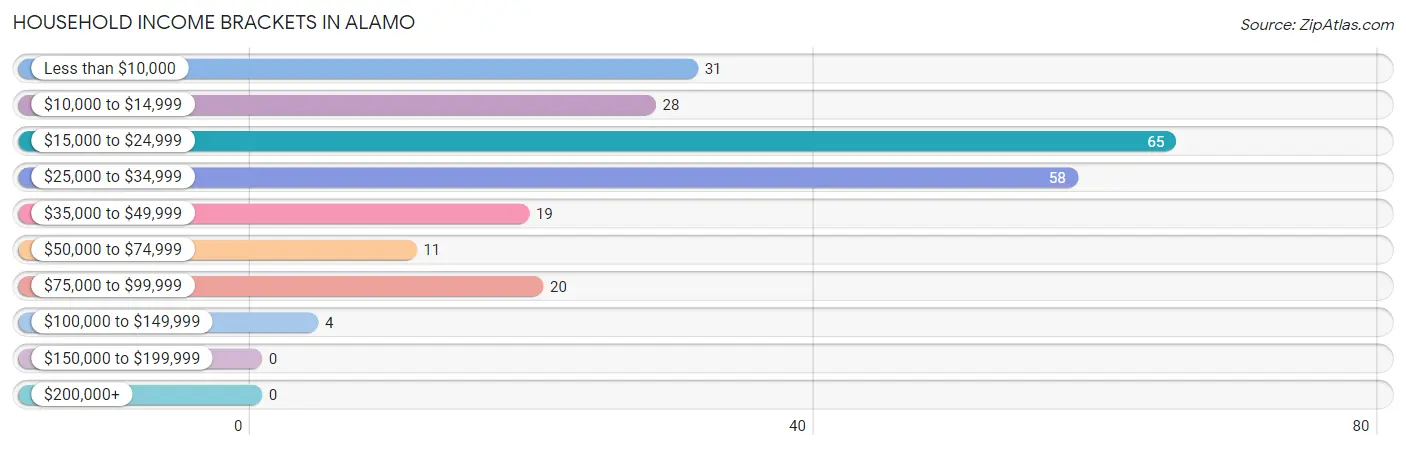
| Income Bracket | # Households | % Households |
| Less than $10,000 | 31 | 13.1% |
| $10,000 to $14,999 | 28 | 11.9% |
| $15,000 to $24,999 | 65 | 27.5% |
| $25,000 to $34,999 | 58 | 24.6% |
| $35,000 to $49,999 | 19 | 8.1% |
| $50,000 to $74,999 | 11 | 4.7% |
| $75,000 to $99,999 | 20 | 8.5% |
| $100,000 to $149,999 | 4 | 1.7% |
| $150,000 to $199,999 | 0 | 0.0% |
| $200,000+ | 0 | 0.0% |
Household Income by Householder Age in Alamo
The median household income in Alamo is $24,118, with the highest median household income of $25,304 found in the 45 to 64 years age bracket for the primary householder. A total of 179 households (75.8%) fall into this category.
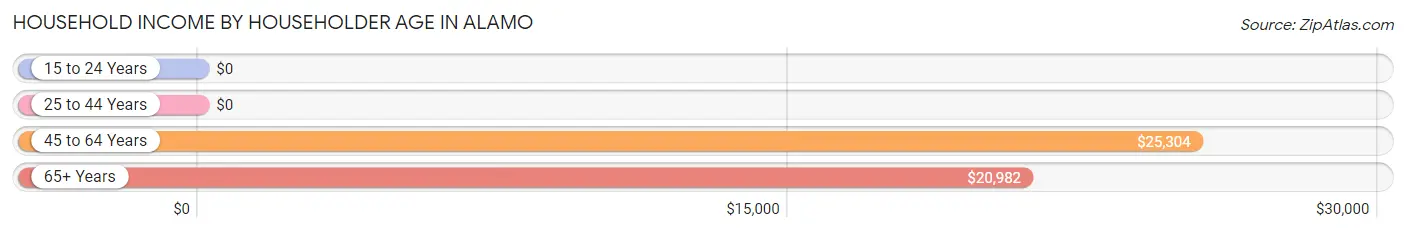
| Income Bracket | # Households | Median Income |
| 15 to 24 Years | 0 (0.0%) | $0 |
| 25 to 44 Years | 20 (8.5%) | $0 |
| 45 to 64 Years | 179 (75.8%) | $25,304 |
| 65+ Years | 37 (15.7%) | $20,982 |
| Total | 236 (100.0%) | $24,118 |
Poverty in Alamo
Income Below Poverty by Sex and Age in Alamo
With 66.0% poverty level for males and 72.7% for females among the residents of Alamo, under 5 year old males and under 5 year old females are the most vulnerable to poverty, with 25 males (100.0%) and 50 females (100.0%) in their respective age groups living below the poverty level.
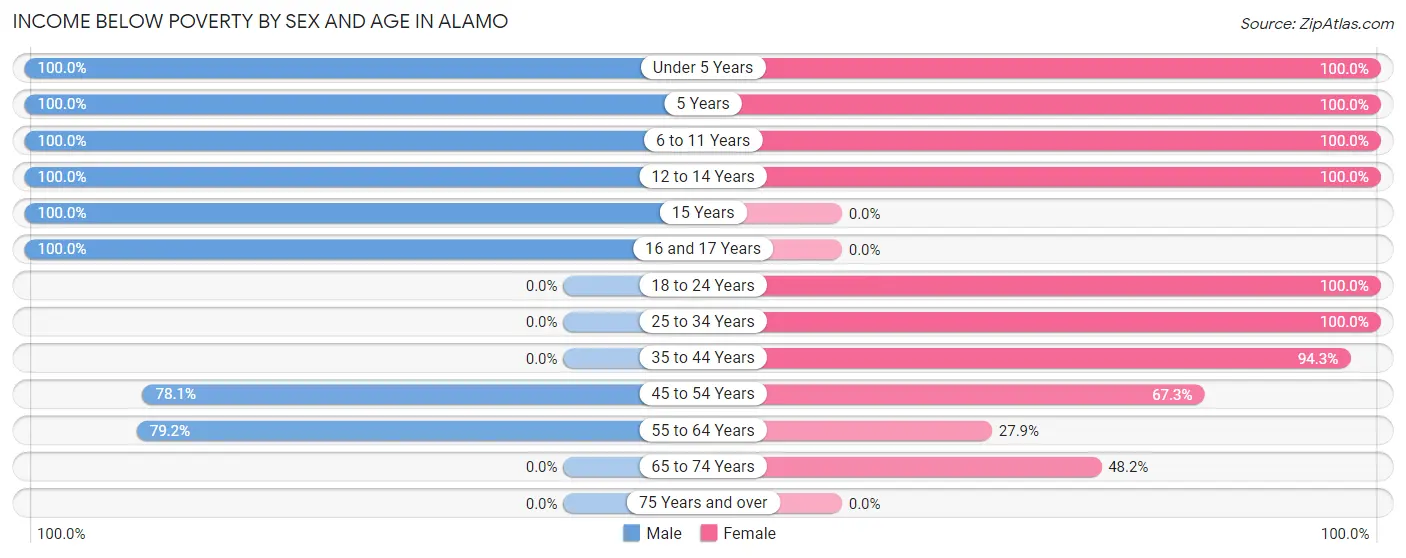
| Age Bracket | Male | Female |
| Under 5 Years | 25 (100.0%) | 50 (100.0%) |
| 5 Years | 24 (100.0%) | 16 (100.0%) |
| 6 to 11 Years | 58 (100.0%) | 44 (100.0%) |
| 12 to 14 Years | 53 (100.0%) | 12 (100.0%) |
| 15 Years | 10 (100.0%) | 0 (0.0%) |
| 16 and 17 Years | 23 (100.0%) | 0 (0.0%) |
| 18 to 24 Years | 0 (0.0%) | 82 (100.0%) |
| 25 to 34 Years | 0 (0.0%) | 52 (100.0%) |
| 35 to 44 Years | 0 (0.0%) | 83 (94.3%) |
| 45 to 54 Years | 57 (78.1%) | 74 (67.3%) |
| 55 to 64 Years | 57 (79.2%) | 22 (27.9%) |
| 65 to 74 Years | 0 (0.0%) | 13 (48.1%) |
| 75 Years and over | 0 (0.0%) | 0 (0.0%) |
| Total | 307 (66.0%) | 448 (72.7%) |
Income Above Poverty by Sex and Age in Alamo
According to the poverty statistics in Alamo, males aged 18 to 24 years and females aged 75 years and over are the age groups that are most secure financially, with 100.0% of males and 100.0% of females in these age groups living above the poverty line.
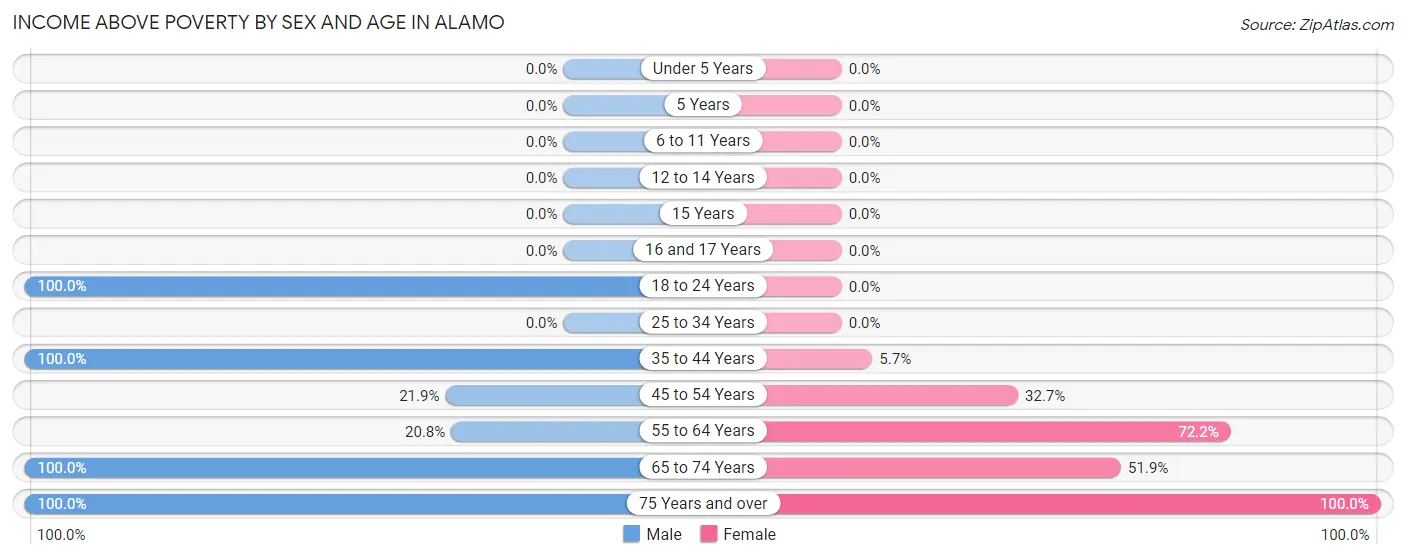
| Age Bracket | Male | Female |
| Under 5 Years | 0 (0.0%) | 0 (0.0%) |
| 5 Years | 0 (0.0%) | 0 (0.0%) |
| 6 to 11 Years | 0 (0.0%) | 0 (0.0%) |
| 12 to 14 Years | 0 (0.0%) | 0 (0.0%) |
| 15 Years | 0 (0.0%) | 0 (0.0%) |
| 16 and 17 Years | 0 (0.0%) | 0 (0.0%) |
| 18 to 24 Years | 41 (100.0%) | 0 (0.0%) |
| 25 to 34 Years | 0 (0.0%) | 0 (0.0%) |
| 35 to 44 Years | 8 (100.0%) | 5 (5.7%) |
| 45 to 54 Years | 16 (21.9%) | 36 (32.7%) |
| 55 to 64 Years | 15 (20.8%) | 57 (72.2%) |
| 65 to 74 Years | 65 (100.0%) | 14 (51.8%) |
| 75 Years and over | 13 (100.0%) | 56 (100.0%) |
| Total | 158 (34.0%) | 168 (27.3%) |
Income Below Poverty Among Married-Couple Families in Alamo
The poverty statistics for married-couple families in Alamo show that 27.3% or 21 of the total 77 families live below the poverty line. Families with 5 or more children have the highest poverty rate of 100.0%, comprising of 12 families. On the other hand, families with no children have the lowest poverty rate of 13.9%, which includes 9 families.
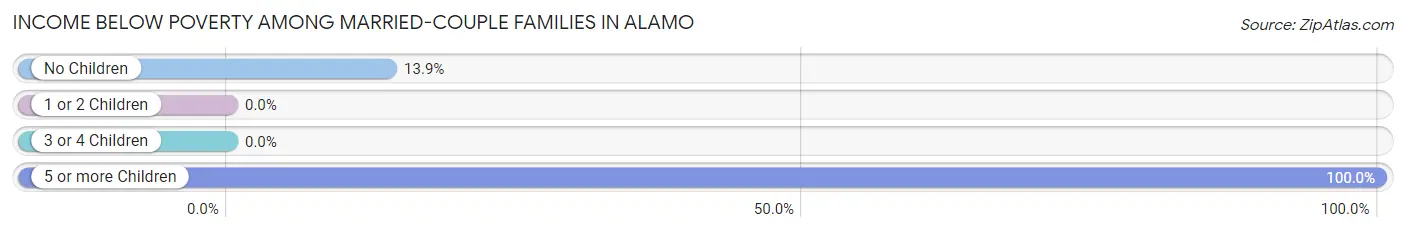
| Children | Above Poverty | Below Poverty |
| No Children | 56 (86.2%) | 9 (13.9%) |
| 1 or 2 Children | 0 (0.0%) | 0 (0.0%) |
| 3 or 4 Children | 0 (0.0%) | 0 (0.0%) |
| 5 or more Children | 0 (0.0%) | 12 (100.0%) |
| Total | 56 (72.7%) | 21 (27.3%) |
Income Below Poverty Among Single-Parent Households in Alamo
According to the poverty data in Alamo, 100.0% or 29 single-father households and 59.6% or 56 single-mother households are living below the poverty line. Among single-father households, those with 1 or 2 children have the highest poverty rate, with 29 households (100.0%) experiencing poverty. Likewise, among single-mother households, those with 1 or 2 children have the highest poverty rate, with 36 households (100.0%) falling below the poverty line.
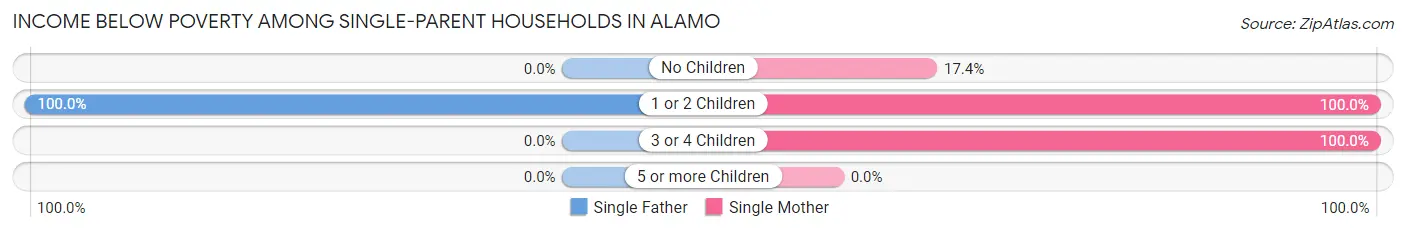
| Children | Single Father | Single Mother |
| No Children | 0 (0.0%) | 8 (17.4%) |
| 1 or 2 Children | 29 (100.0%) | 36 (100.0%) |
| 3 or 4 Children | 0 (0.0%) | 12 (100.0%) |
| 5 or more Children | 0 (0.0%) | 0 (0.0%) |
| Total | 29 (100.0%) | 56 (59.6%) |
Income Below Poverty Among Married-Couple vs Single-Parent Households in Alamo
The poverty data for Alamo shows that 21 of the married-couple family households (27.3%) and 85 of the single-parent households (69.1%) are living below the poverty level. Within the married-couple family households, those with 5 or more children have the highest poverty rate, with 12 households (100.0%) falling below the poverty line. Among the single-parent households, those with 1 or 2 children have the highest poverty rate, with 65 household (100.0%) living below poverty.
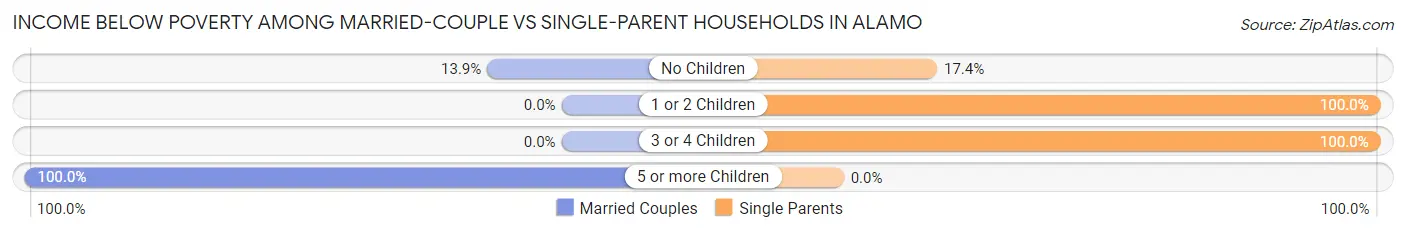
| Children | Married-Couple Families | Single-Parent Households |
| No Children | 9 (13.9%) | 8 (17.4%) |
| 1 or 2 Children | 0 (0.0%) | 65 (100.0%) |
| 3 or 4 Children | 0 (0.0%) | 12 (100.0%) |
| 5 or more Children | 12 (100.0%) | 0 (0.0%) |
| Total | 21 (27.3%) | 85 (69.1%) |
Race in Alamo
The most populous races in Alamo are Native / Alaskan (1,064 | 98.4%), and White / Caucasian (17 | 1.6%).
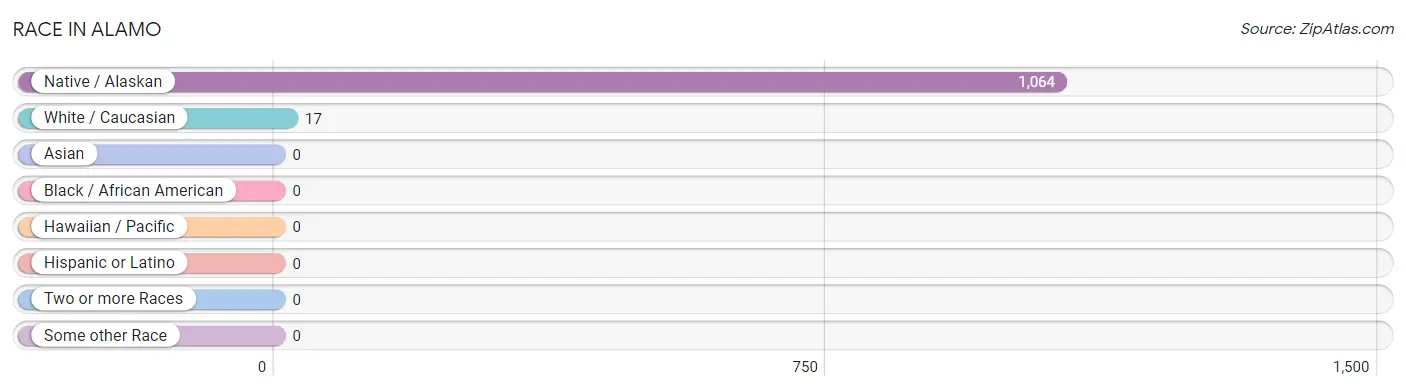
| Race | # Population | % Population |
| Asian | 0 | 0.0% |
| Black / African American | 0 | 0.0% |
| Hawaiian / Pacific | 0 | 0.0% |
| Hispanic or Latino | 0 | 0.0% |
| Native / Alaskan | 1,064 | 98.4% |
| White / Caucasian | 17 | 1.6% |
| Two or more Races | 0 | 0.0% |
| Some other Race | 0 | 0.0% |
| Total | 1,081 | 100.0% |
Ancestry in Alamo
The most populous ancestries reported in Alamo are Navajo (1,056 | 97.7%), and German (2 | 0.2%), together accounting for 97.9% of all Alamo residents.
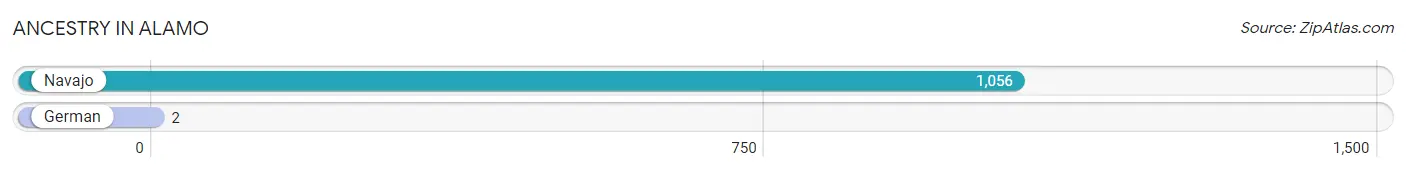
| Ancestry | # Population | % Population |
| German | 2 | 0.2% |
| Navajo | 1,056 | 97.7% | View All 2 Rows |
Immigrants in Alamo

| Immigration Origin | # Population | % Population | View All 0 Rows |
Sex and Age in Alamo
Sex and Age in Alamo
The most populous age groups in Alamo are 10 to 14 Years (77 | 16.6%) for men and 20 to 24 Years (82 | 13.3%) for women.
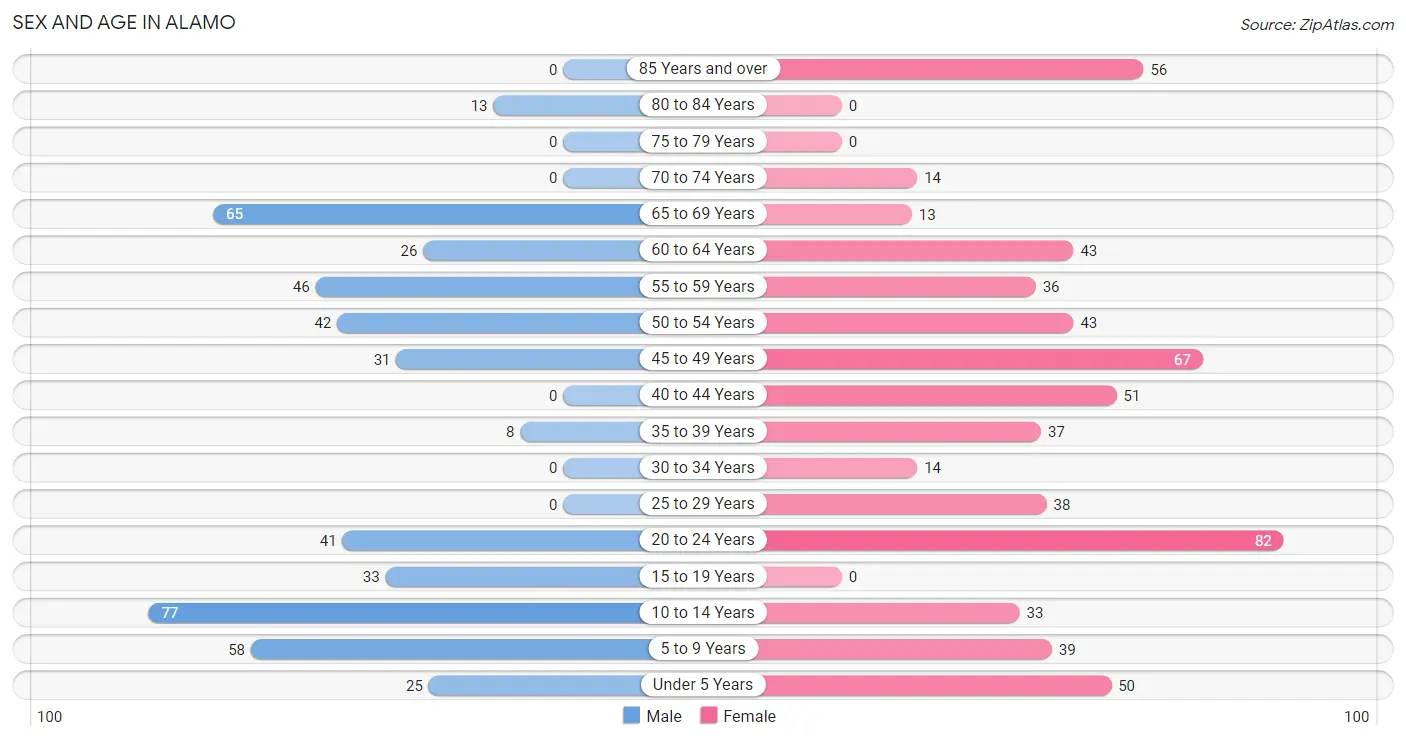
| Age Bracket | Male | Female |
| Under 5 Years | 25 (5.4%) | 50 (8.1%) |
| 5 to 9 Years | 58 (12.5%) | 39 (6.3%) |
| 10 to 14 Years | 77 (16.6%) | 33 (5.4%) |
| 15 to 19 Years | 33 (7.1%) | 0 (0.0%) |
| 20 to 24 Years | 41 (8.8%) | 82 (13.3%) |
| 25 to 29 Years | 0 (0.0%) | 38 (6.2%) |
| 30 to 34 Years | 0 (0.0%) | 14 (2.3%) |
| 35 to 39 Years | 8 (1.7%) | 37 (6.0%) |
| 40 to 44 Years | 0 (0.0%) | 51 (8.3%) |
| 45 to 49 Years | 31 (6.7%) | 67 (10.9%) |
| 50 to 54 Years | 42 (9.0%) | 43 (7.0%) |
| 55 to 59 Years | 46 (9.9%) | 36 (5.8%) |
| 60 to 64 Years | 26 (5.6%) | 43 (7.0%) |
| 65 to 69 Years | 65 (14.0%) | 13 (2.1%) |
| 70 to 74 Years | 0 (0.0%) | 14 (2.3%) |
| 75 to 79 Years | 0 (0.0%) | 0 (0.0%) |
| 80 to 84 Years | 13 (2.8%) | 0 (0.0%) |
| 85 Years and over | 0 (0.0%) | 56 (9.1%) |
| Total | 465 (100.0%) | 616 (100.0%) |
Families and Households in Alamo
Median Family Size in Alamo
The median family size in Alamo is 4.69 persons per family, with single male/father families (29 | 14.5%) accounting for the largest median family size of 5.34 persons per family. On the other hand, married-couple families (77 | 38.5%) represent the smallest median family size with 3.86 persons per family.
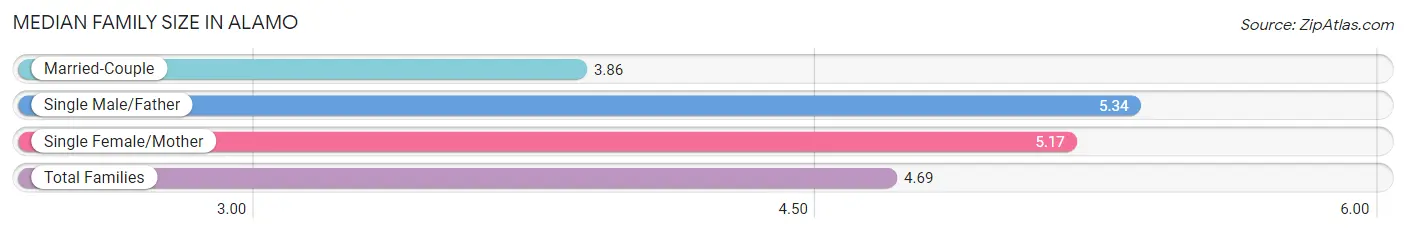
| Family Type | # Families | Family Size |
| Married-Couple | 77 (38.5%) | 3.86 |
| Single Male/Father | 29 (14.5%) | 5.34 |
| Single Female/Mother | 94 (47.0%) | 5.17 |
| Total Families | 200 (100.0%) | 4.69 |
Median Household Size in Alamo
The median household size in Alamo is 4.57 persons per household, with single male/father households (29 | 12.3%) accounting for the largest median household size of 5.76 persons per household. non-family households (36 | 15.2%) represent the smallest median household size with 3.19 persons per household.
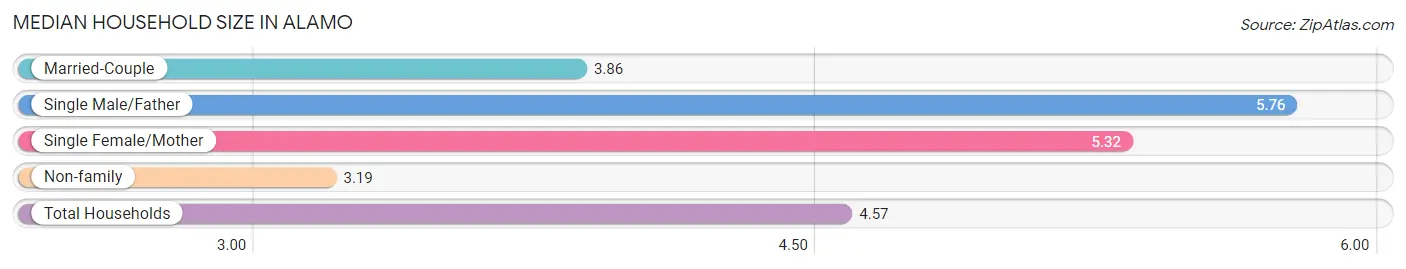
| Household Type | # Households | Household Size |
| Married-Couple | 77 (32.6%) | 3.86 |
| Single Male/Father | 29 (12.3%) | 5.76 |
| Single Female/Mother | 94 (39.8%) | 5.32 |
| Non-family | 36 (15.2%) | 3.19 |
| Total Households | 236 (100.0%) | 4.57 |
Household Size by Marriage Status in Alamo
Out of a total of 236 households in Alamo, 200 (84.8%) are family households, while 36 (15.2%) are nonfamily households. The most numerous type of family households are 2-person households, comprising 118, and the most common type of nonfamily households are 2-person households, comprising 25.
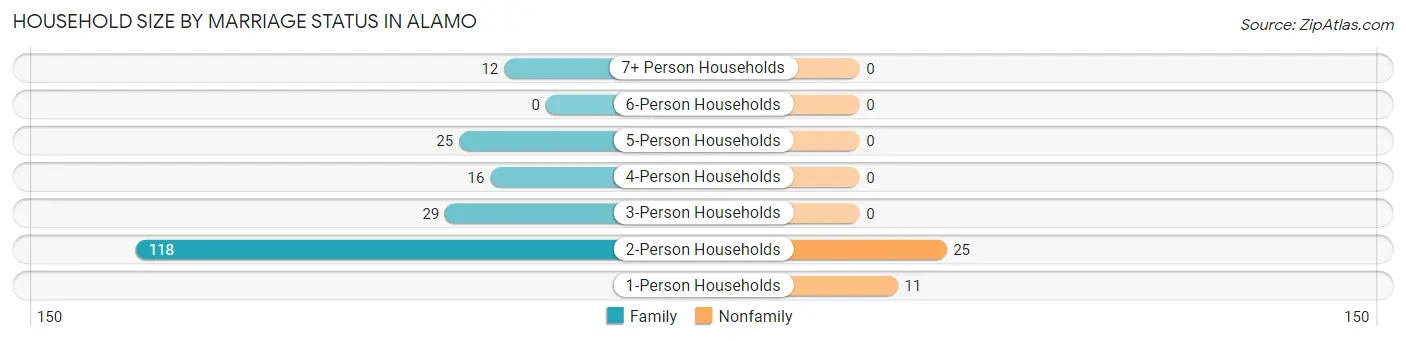
| Household Size | Family Households | Nonfamily Households |
| 1-Person Households | - | 11 (4.7%) |
| 2-Person Households | 118 (50.0%) | 25 (10.6%) |
| 3-Person Households | 29 (12.3%) | 0 (0.0%) |
| 4-Person Households | 16 (6.8%) | 0 (0.0%) |
| 5-Person Households | 25 (10.6%) | 0 (0.0%) |
| 6-Person Households | 0 (0.0%) | 0 (0.0%) |
| 7+ Person Households | 12 (5.1%) | 0 (0.0%) |
| Total | 200 (84.8%) | 36 (15.2%) |
Female Fertility in Alamo
Fertility by Age in Alamo
| Age Bracket | Women with Births | Births / 1,000 Women |
| 15 to 19 years | 0 (0.0%) | 0.0 |
| 20 to 34 years | 0 (0.0%) | 0.0 |
| 35 to 50 years | 0 (0.0%) | 0.0 |
| Total | 0 (0.0%) | 0.0 |
Fertility by Age by Marriage Status in Alamo
| Age Bracket | Married | Unmarried |
| 15 to 19 years | 0 (0.0%) | 0 (0.0%) |
| 20 to 34 years | 0 (0.0%) | 0 (0.0%) |
| 35 to 50 years | 0 (0.0%) | 0 (0.0%) |
| Total | 0 (0.0%) | 0 (0.0%) |
Fertility by Education in Alamo
| Educational Attainment | Women with Births | Births / 1,000 Women |
| Less than High School | 0 (0.0%) | 0.0 |
| High School Diploma | 0 (0.0%) | 0.0 |
| College or Associate's Degree | 0 (0.0%) | 0.0 |
| Bachelor's Degree | 0 (0.0%) | 0.0 |
| Graduate Degree | 0 (0.0%) | 0.0 |
| Total | 0 (0.0%) | 0.0 |
Fertility by Education by Marriage Status in Alamo
| Educational Attainment | Married | Unmarried |
| Less than High School | 0 (0.0%) | 0 (0.0%) |
| High School Diploma | 0 (0.0%) | 0 (0.0%) |
| College or Associate's Degree | 0 (0.0%) | 0 (0.0%) |
| Bachelor's Degree | 0 (0.0%) | 0 (0.0%) |
| Graduate Degree | 0 (0.0%) | 0 (0.0%) |
| Total | 0 (0.0%) | 0 (0.0%) |
Employment Characteristics in Alamo
Employment by Class of Employer in Alamo
Among the 292 employed individuals in Alamo, private company employees (148 | 50.7%), federal government employees (55 | 18.8%), and local government employees (34 | 11.6%) make up the most common classes of employment.
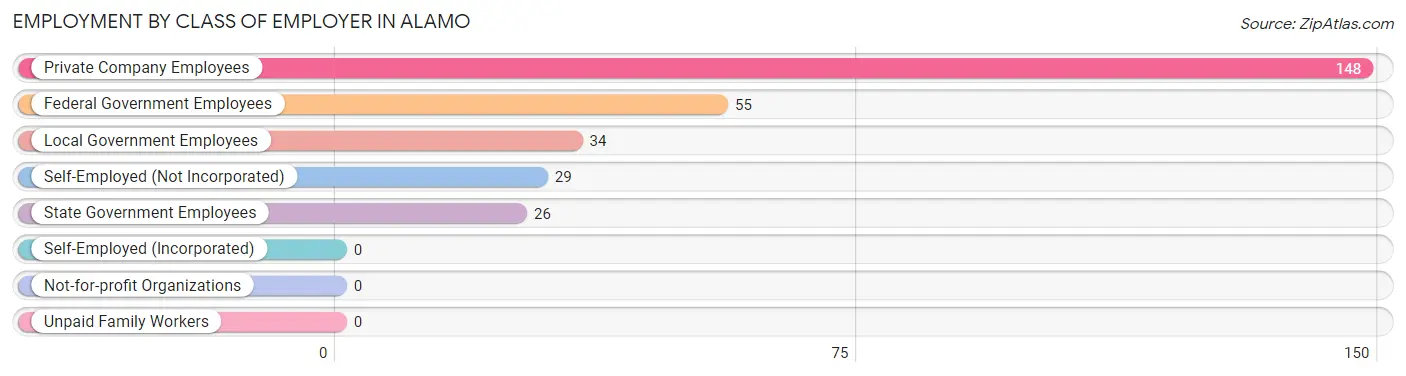
| Employer Class | # Employees | % Employees |
| Private Company Employees | 148 | 50.7% |
| Self-Employed (Incorporated) | 0 | 0.0% |
| Self-Employed (Not Incorporated) | 29 | 9.9% |
| Not-for-profit Organizations | 0 | 0.0% |
| Local Government Employees | 34 | 11.6% |
| State Government Employees | 26 | 8.9% |
| Federal Government Employees | 55 | 18.8% |
| Unpaid Family Workers | 0 | 0.0% |
| Total | 292 | 100.0% |
Employment Status by Age in Alamo
According to the labor force statistics for Alamo, out of the total population over 16 years of age (789), 47.8% or 377 individuals are in the labor force, with 22.5% or 85 of them unemployed. The age group with the highest labor force participation rate is 25 to 29 years, with 100.0% or 38 individuals in the labor force. Within the labor force, the 20 to 24 years age range has the highest percentage of unemployed individuals, with 100.0% or 38 of them being unemployed.
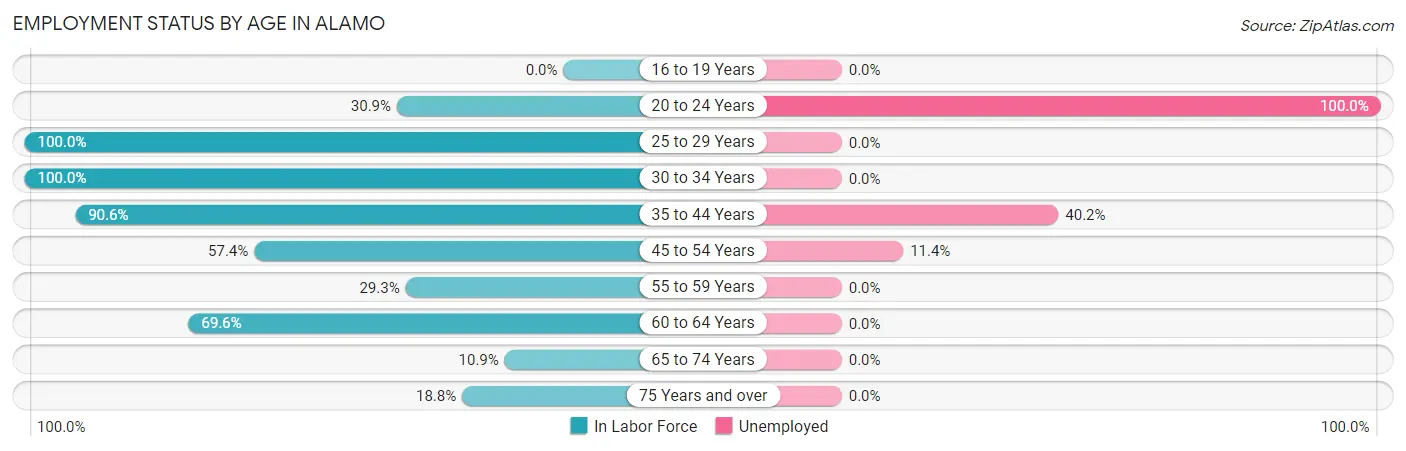
| Age Bracket | In Labor Force | Unemployed |
| 16 to 19 Years | 0 (0.0%) | 0 (0.0%) |
| 20 to 24 Years | 38 (30.9%) | 38 (100.0%) |
| 25 to 29 Years | 38 (100.0%) | 0 (0.0%) |
| 30 to 34 Years | 14 (100.0%) | 0 (0.0%) |
| 35 to 44 Years | 87 (90.6%) | 35 (40.2%) |
| 45 to 54 Years | 105 (57.4%) | 12 (11.4%) |
| 55 to 59 Years | 24 (29.3%) | 0 (0.0%) |
| 60 to 64 Years | 48 (69.6%) | 0 (0.0%) |
| 65 to 74 Years | 10 (10.9%) | 0 (0.0%) |
| 75 Years and over | 13 (18.8%) | 0 (0.0%) |
| Total | 377 (47.8%) | 85 (22.5%) |
Employment Status by Educational Attainment in Alamo
According to labor force statistics for Alamo, 65.6% of individuals (316) out of the total population between 25 and 64 years of age (482) are in the labor force, with 14.9% or 47 of them being unemployed. The group with the highest labor force participation rate are those with the educational attainment of bachelor's degree or higher, with 100.0% or 28 individuals in the labor force. Within the labor force, individuals with less than high school education have the highest percentage of unemployment, with 23.1% or 24 of them being unemployed.
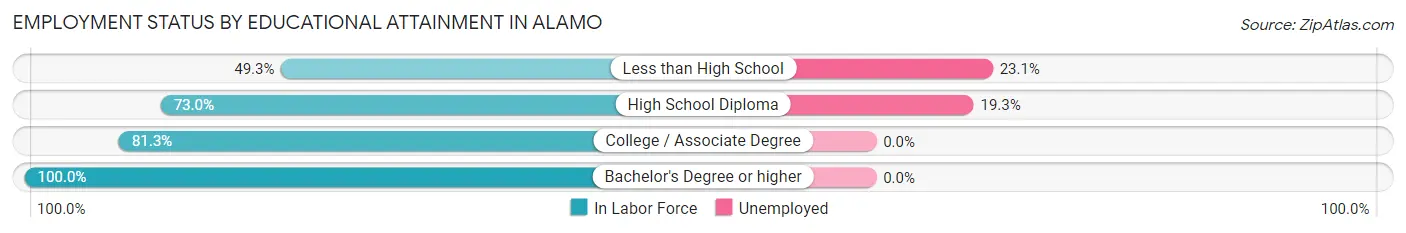
| Educational Attainment | In Labor Force | Unemployed |
| Less than High School | 104 (49.3%) | 49 (23.1%) |
| High School Diploma | 119 (73.0%) | 31 (19.3%) |
| College / Associate Degree | 65 (81.3%) | 0 (0.0%) |
| Bachelor's Degree or higher | 28 (100.0%) | 0 (0.0%) |
| Total | 316 (65.6%) | 72 (14.9%) |
Employment Occupations by Sex in Alamo
Management, Business, Science and Arts Occupations
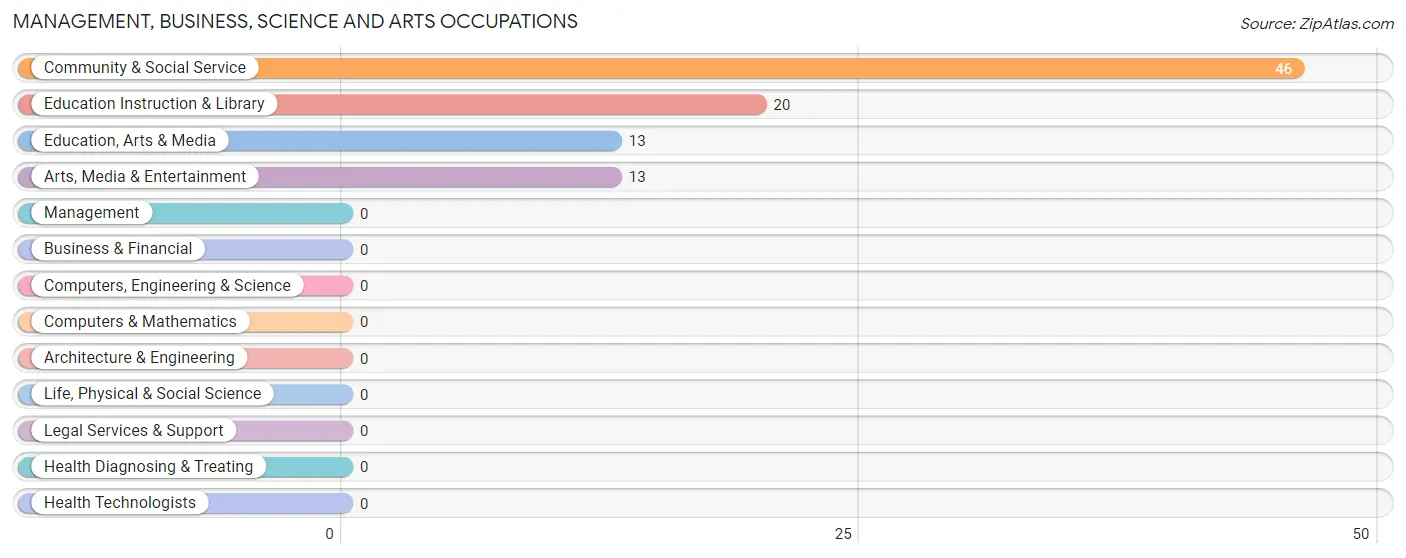
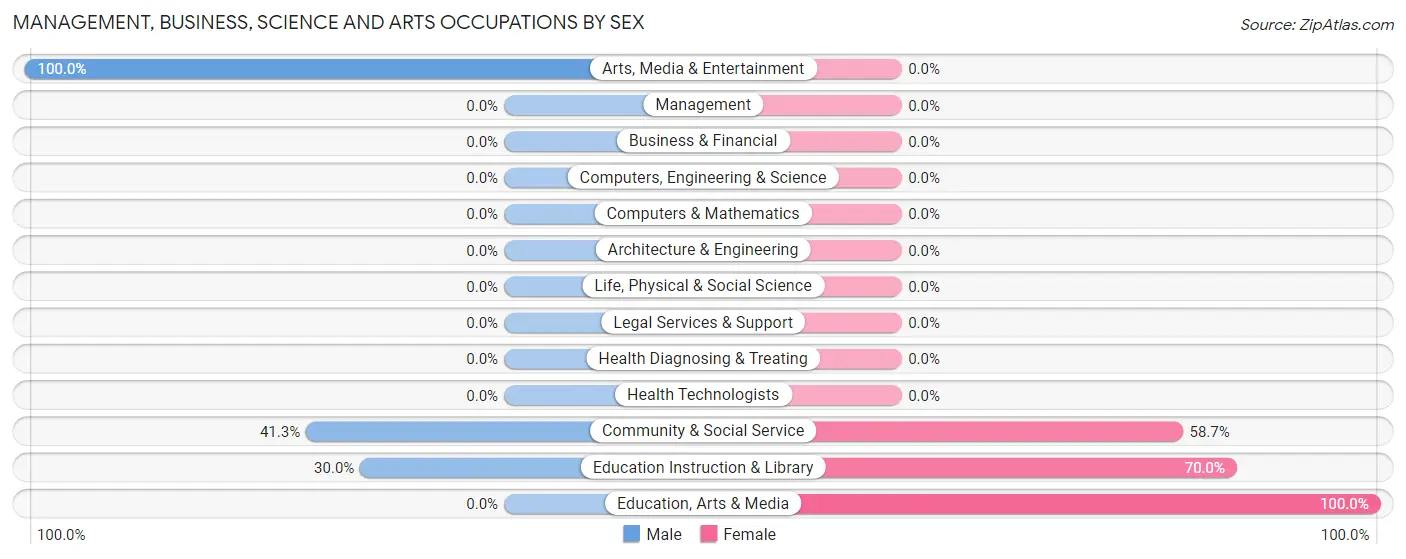
The most common Management, Business, Science and Arts occupations in Alamo are Community & Social Service (46 | 15.8%), Education Instruction & Library (20 | 6.9%), Education, Arts & Media (13 | 4.4%), and Arts, Media & Entertainment (13 | 4.4%).
Management, Business, Science and Arts Occupations by Sex
Within the Management, Business, Science and Arts occupations in Alamo, the most male-oriented occupations are Arts, Media & Entertainment (100.0%), Community & Social Service (41.3%), and Education Instruction & Library (30.0%), while the most female-oriented occupations are Education, Arts & Media (100.0%), Education Instruction & Library (70.0%), and Community & Social Service (58.7%).
| Occupation | Male | Female |
| Management | 0 (0.0%) | 0 (0.0%) |
| Business & Financial | 0 (0.0%) | 0 (0.0%) |
| Computers, Engineering & Science | 0 (0.0%) | 0 (0.0%) |
| Computers & Mathematics | 0 (0.0%) | 0 (0.0%) |
| Architecture & Engineering | 0 (0.0%) | 0 (0.0%) |
| Life, Physical & Social Science | 0 (0.0%) | 0 (0.0%) |
| Community & Social Service | 19 (41.3%) | 27 (58.7%) |
| Education, Arts & Media | 0 (0.0%) | 13 (100.0%) |
| Legal Services & Support | 0 (0.0%) | 0 (0.0%) |
| Education Instruction & Library | 6 (30.0%) | 14 (70.0%) |
| Arts, Media & Entertainment | 13 (100.0%) | 0 (0.0%) |
| Health Diagnosing & Treating | 0 (0.0%) | 0 (0.0%) |
| Health Technologists | 0 (0.0%) | 0 (0.0%) |
| Total (Category) | 19 (41.3%) | 27 (58.7%) |
| Total (Overall) | 92 (31.5%) | 200 (68.5%) |
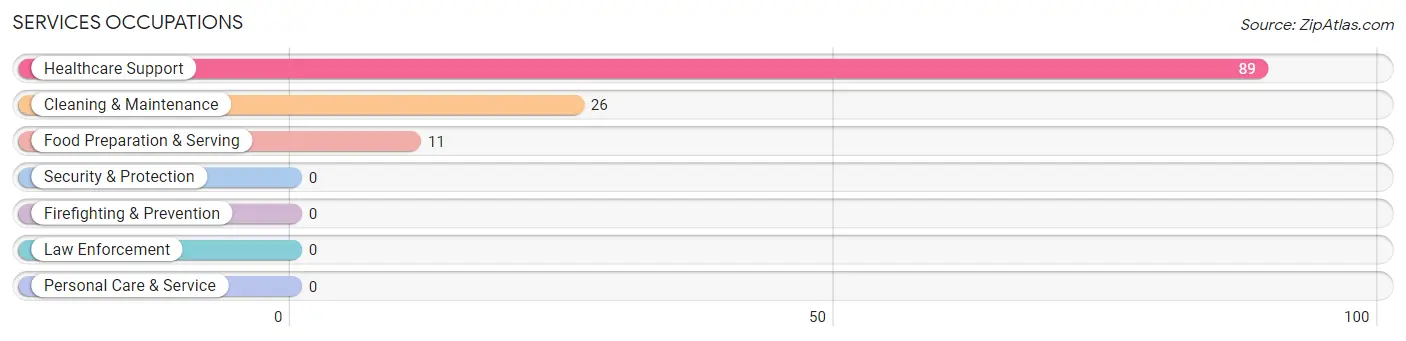
Services Occupations
The most common Services occupations in Alamo are Healthcare Support (89 | 30.5%), Cleaning & Maintenance (26 | 8.9%), and Food Preparation & Serving (11 | 3.8%).
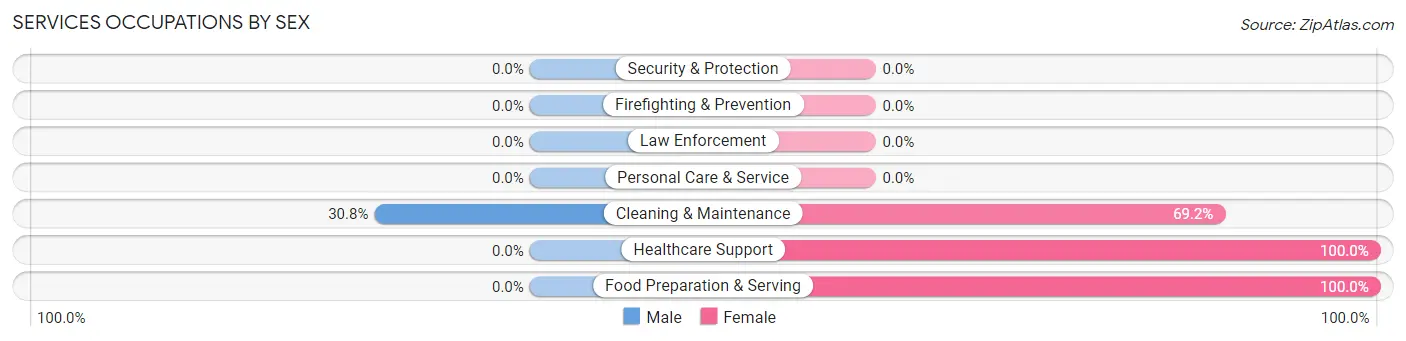
Services Occupations by Sex
| Occupation | Male | Female |
| Healthcare Support | 0 (0.0%) | 89 (100.0%) |
| Security & Protection | 0 (0.0%) | 0 (0.0%) |
| Firefighting & Prevention | 0 (0.0%) | 0 (0.0%) |
| Law Enforcement | 0 (0.0%) | 0 (0.0%) |
| Food Preparation & Serving | 0 (0.0%) | 11 (100.0%) |
| Cleaning & Maintenance | 8 (30.8%) | 18 (69.2%) |
| Personal Care & Service | 0 (0.0%) | 0 (0.0%) |
| Total (Category) | 8 (6.4%) | 118 (93.6%) |
| Total (Overall) | 92 (31.5%) | 200 (68.5%) |
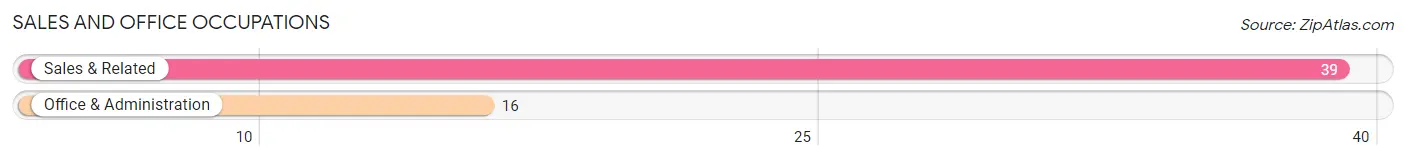
Sales and Office Occupations
The most common Sales and Office occupations in Alamo are Sales & Related (39 | 13.4%), and Office & Administration (16 | 5.5%).
Sales and Office Occupations by Sex
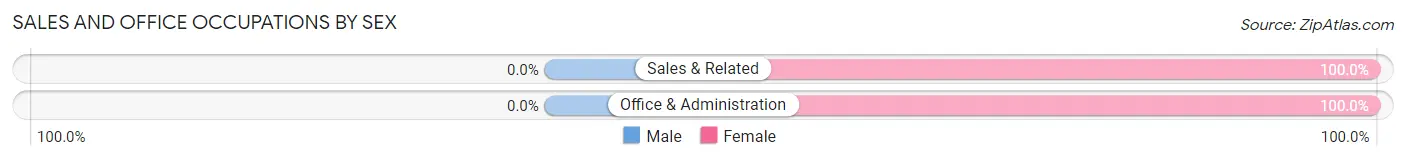
| Occupation | Male | Female |
| Sales & Related | 0 (0.0%) | 39 (100.0%) |
| Office & Administration | 0 (0.0%) | 16 (100.0%) |
| Total (Category) | 0 (0.0%) | 55 (100.0%) |
| Total (Overall) | 92 (31.5%) | 200 (68.5%) |
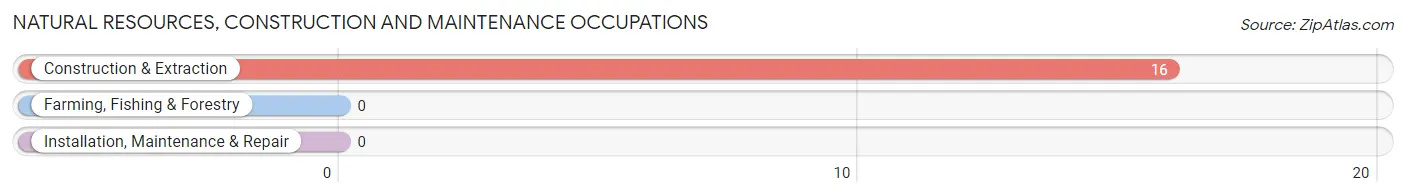
Natural Resources, Construction and Maintenance Occupations
The most common Natural Resources, Construction and Maintenance occupations in Alamo are , and Construction & Extraction (16 | 5.5%).
Natural Resources, Construction and Maintenance Occupations by Sex
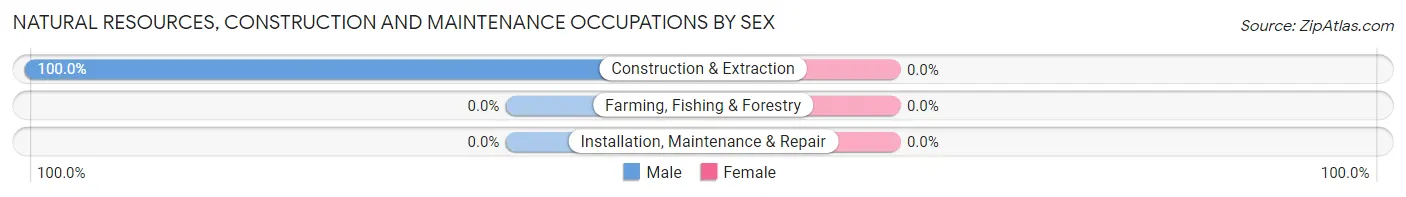
| Occupation | Male | Female |
| Farming, Fishing & Forestry | 0 (0.0%) | 0 (0.0%) |
| Construction & Extraction | 16 (100.0%) | 0 (0.0%) |
| Installation, Maintenance & Repair | 0 (0.0%) | 0 (0.0%) |
| Total (Category) | 16 (100.0%) | 0 (0.0%) |
| Total (Overall) | 92 (31.5%) | 200 (68.5%) |
Production, Transportation and Moving Occupations
The most common Production, Transportation and Moving occupations in Alamo are Material Moving (30 | 10.3%), Transportation (10 | 3.4%), and Production (9 | 3.1%).
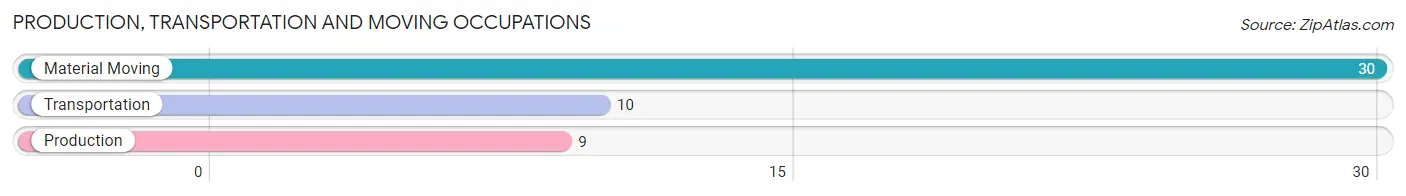
Production, Transportation and Moving Occupations by Sex
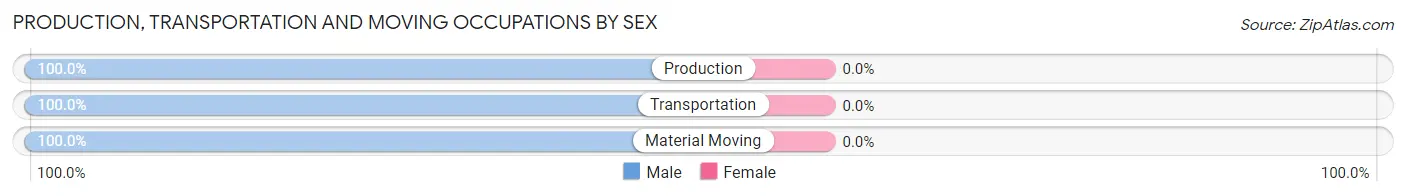
| Occupation | Male | Female |
| Production | 9 (100.0%) | 0 (0.0%) |
| Transportation | 10 (100.0%) | 0 (0.0%) |
| Material Moving | 30 (100.0%) | 0 (0.0%) |
| Total (Category) | 49 (100.0%) | 0 (0.0%) |
| Total (Overall) | 92 (31.5%) | 200 (68.5%) |
Employment Industries by Sex in Alamo
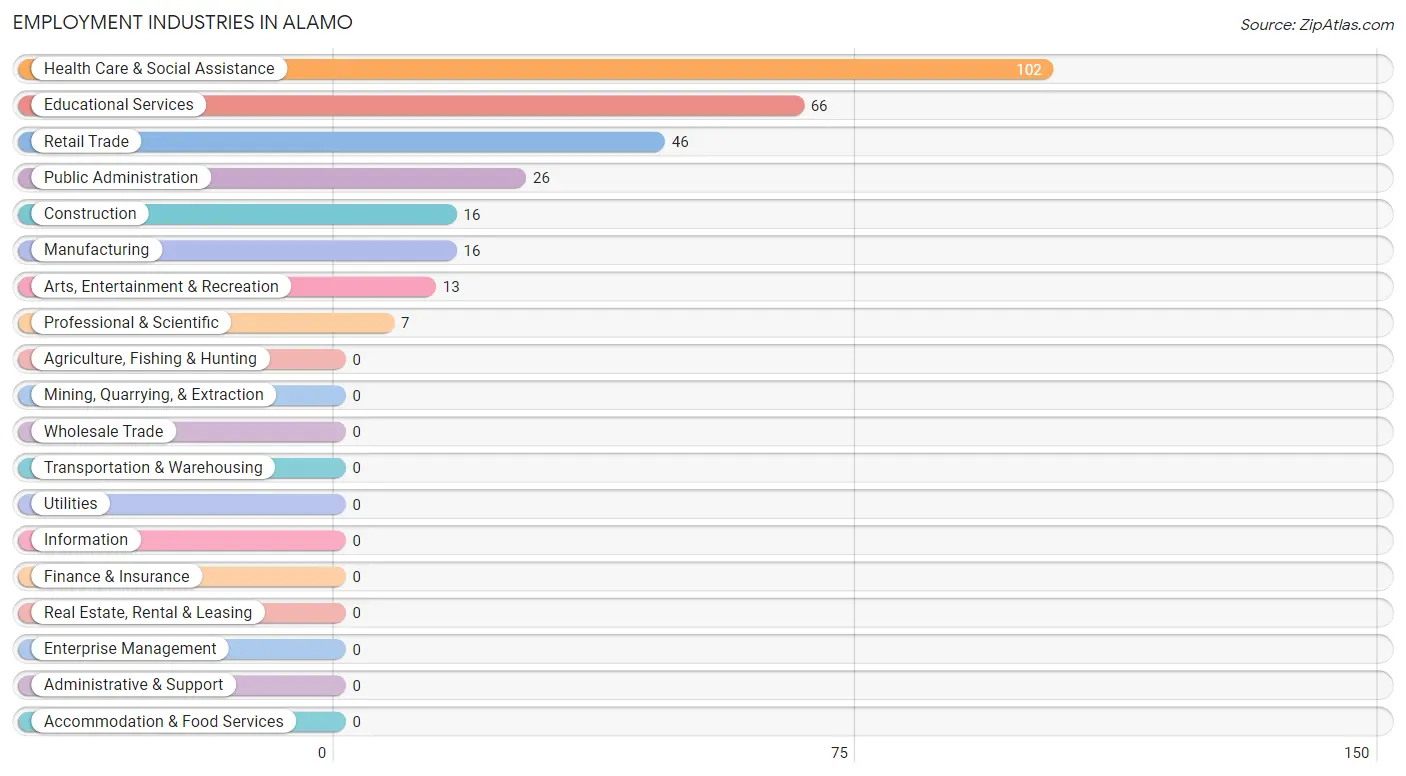
Employment Industries in Alamo
The major employment industries in Alamo include Health Care & Social Assistance (102 | 34.9%), Educational Services (66 | 22.6%), Retail Trade (46 | 15.8%), Public Administration (26 | 8.9%), and Construction (16 | 5.5%).
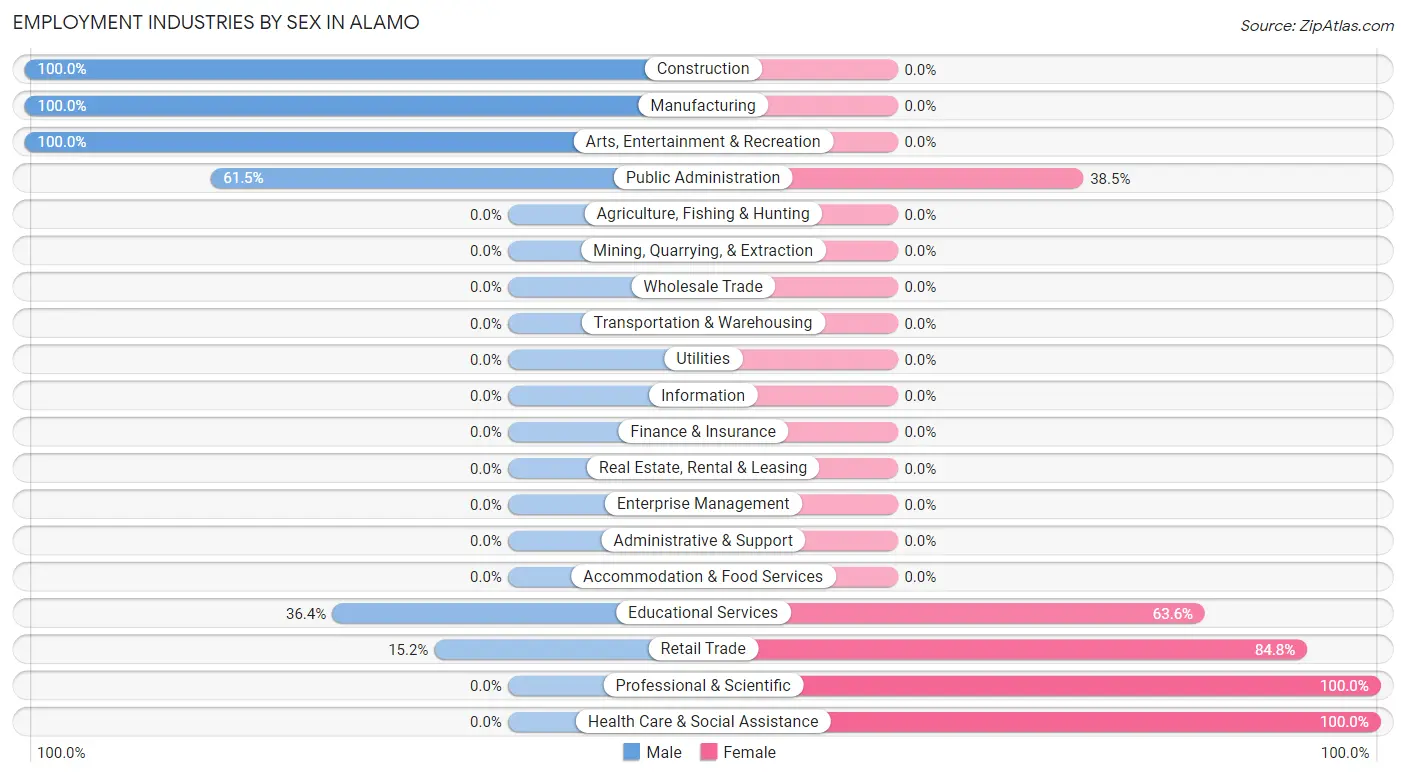
Employment Industries by Sex in Alamo
The Alamo industries that see more men than women are Construction (100.0%), Manufacturing (100.0%), and Arts, Entertainment & Recreation (100.0%), whereas the industries that tend to have a higher number of women are Professional & Scientific (100.0%), Health Care & Social Assistance (100.0%), and Retail Trade (84.8%).
| Industry | Male | Female |
| Agriculture, Fishing & Hunting | 0 (0.0%) | 0 (0.0%) |
| Mining, Quarrying, & Extraction | 0 (0.0%) | 0 (0.0%) |
| Construction | 16 (100.0%) | 0 (0.0%) |
| Manufacturing | 16 (100.0%) | 0 (0.0%) |
| Wholesale Trade | 0 (0.0%) | 0 (0.0%) |
| Retail Trade | 7 (15.2%) | 39 (84.8%) |
| Transportation & Warehousing | 0 (0.0%) | 0 (0.0%) |
| Utilities | 0 (0.0%) | 0 (0.0%) |
| Information | 0 (0.0%) | 0 (0.0%) |
| Finance & Insurance | 0 (0.0%) | 0 (0.0%) |
| Real Estate, Rental & Leasing | 0 (0.0%) | 0 (0.0%) |
| Professional & Scientific | 0 (0.0%) | 7 (100.0%) |
| Enterprise Management | 0 (0.0%) | 0 (0.0%) |
| Administrative & Support | 0 (0.0%) | 0 (0.0%) |
| Educational Services | 24 (36.4%) | 42 (63.6%) |
| Health Care & Social Assistance | 0 (0.0%) | 102 (100.0%) |
| Arts, Entertainment & Recreation | 13 (100.0%) | 0 (0.0%) |
| Accommodation & Food Services | 0 (0.0%) | 0 (0.0%) |
| Public Administration | 16 (61.5%) | 10 (38.5%) |
| Total | 92 (31.5%) | 200 (68.5%) |
Education in Alamo
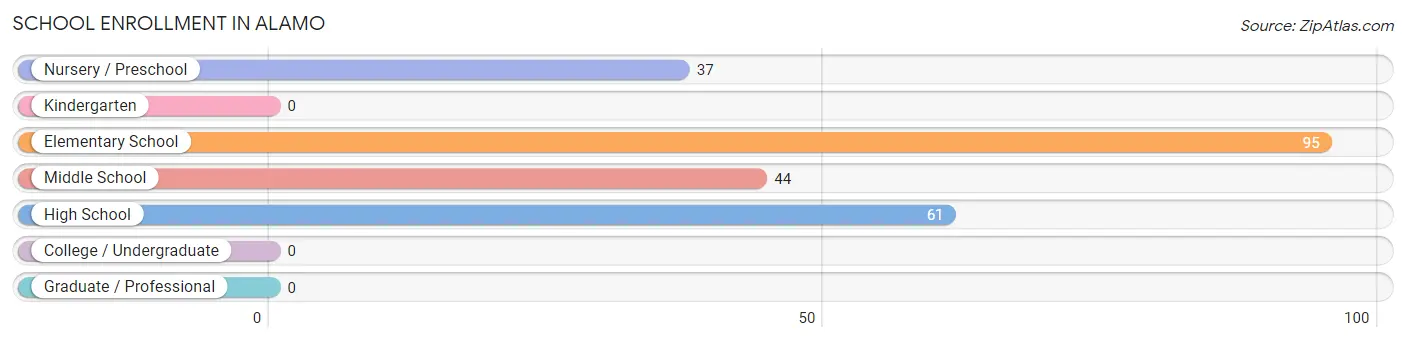
School Enrollment in Alamo
The most common levels of schooling among the 237 students in Alamo are elementary school (95 | 40.1%), high school (61 | 25.7%), and middle school (44 | 18.6%).
| School Level | # Students | % Students |
| Nursery / Preschool | 37 | 15.6% |
| Kindergarten | 0 | 0.0% |
| Elementary School | 95 | 40.1% |
| Middle School | 44 | 18.6% |
| High School | 61 | 25.7% |
| College / Undergraduate | 0 | 0.0% |
| Graduate / Professional | 0 | 0.0% |
| Total | 237 | 100.0% |
School Enrollment by Age by Funding Source in Alamo
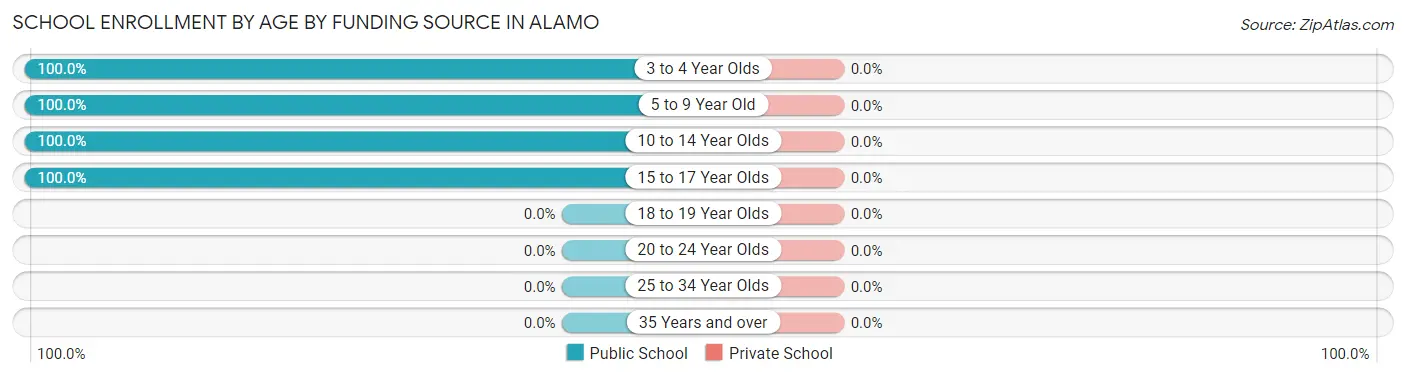
| Age Bracket | Public School | Private School |
| 3 to 4 Year Olds | 25 (100.0%) | 0 (0.0%) |
| 5 to 9 Year Old | 69 (100.0%) | 0 (0.0%) |
| 10 to 14 Year Olds | 110 (100.0%) | 0 (0.0%) |
| 15 to 17 Year Olds | 33 (100.0%) | 0 (0.0%) |
| 18 to 19 Year Olds | 0 (0.0%) | 0 (0.0%) |
| 20 to 24 Year Olds | 0 (0.0%) | 0 (0.0%) |
| 25 to 34 Year Olds | 0 (0.0%) | 0 (0.0%) |
| 35 Years and over | 0 (0.0%) | 0 (0.0%) |
| Total | 237 (100.0%) | 0 (0.0%) |
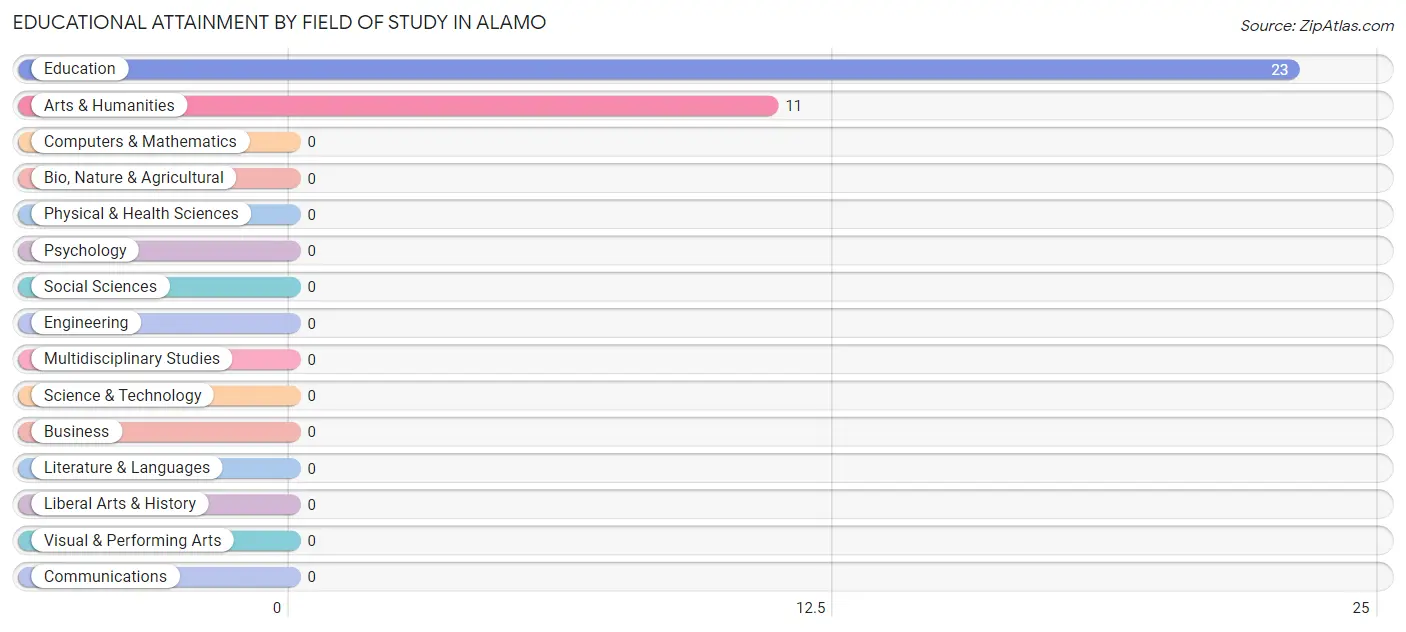
Educational Attainment by Field of Study in Alamo
Education (23 | 67.6%), and arts & humanities (11 | 32.4%) are the most common fields of study among 34 individuals in Alamo who have obtained a bachelor's degree or higher.
| Field of Study | # Graduates | % Graduates |
| Computers & Mathematics | 0 | 0.0% |
| Bio, Nature & Agricultural | 0 | 0.0% |
| Physical & Health Sciences | 0 | 0.0% |
| Psychology | 0 | 0.0% |
| Social Sciences | 0 | 0.0% |
| Engineering | 0 | 0.0% |
| Multidisciplinary Studies | 0 | 0.0% |
| Science & Technology | 0 | 0.0% |
| Business | 0 | 0.0% |
| Education | 23 | 67.6% |
| Literature & Languages | 0 | 0.0% |
| Liberal Arts & History | 0 | 0.0% |
| Visual & Performing Arts | 0 | 0.0% |
| Communications | 0 | 0.0% |
| Arts & Humanities | 11 | 32.4% |
| Total | 34 | 100.0% |
Transportation & Commute in Alamo
Vehicle Availability by Sex in Alamo
The most prevalent vehicle ownership categories in Alamo are males with 2 vehicles (47, accounting for 52.2%) and females with 2 vehicles (50, making up 23.5%).
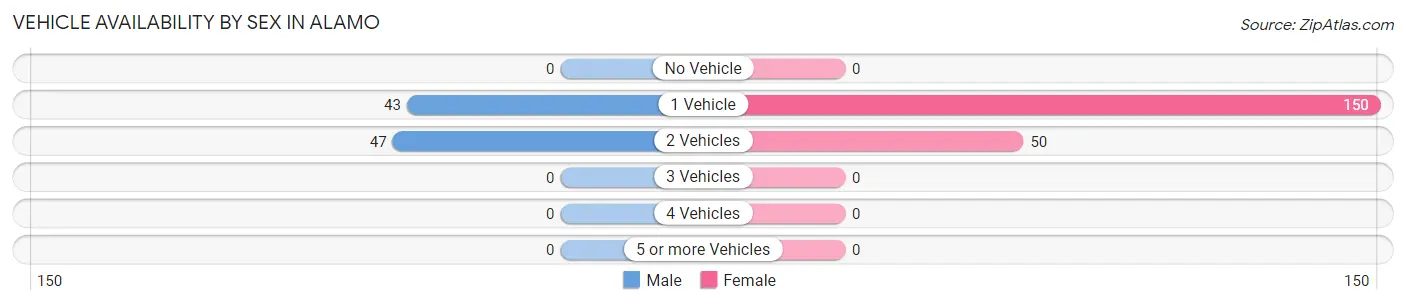
| Vehicles Available | Male | Female |
| No Vehicle | 0 (0.0%) | 0 (0.0%) |
| 1 Vehicle | 43 (47.8%) | 150 (75.0%) |
| 2 Vehicles | 47 (52.2%) | 50 (25.0%) |
| 3 Vehicles | 0 (0.0%) | 0 (0.0%) |
| 4 Vehicles | 0 (0.0%) | 0 (0.0%) |
| 5 or more Vehicles | 0 (0.0%) | 0 (0.0%) |
| Total | 90 (100.0%) | 200 (100.0%) |
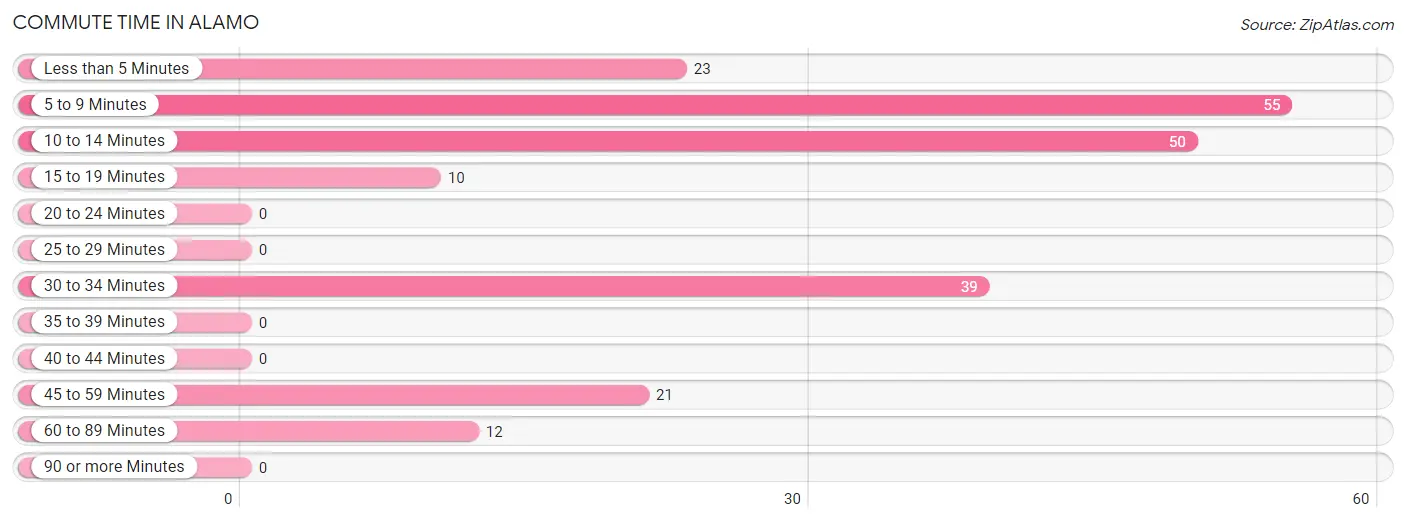
Commute Time in Alamo
The most frequently occuring commute durations in Alamo are 5 to 9 minutes (55 commuters, 26.2%), 10 to 14 minutes (50 commuters, 23.8%), and 30 to 34 minutes (39 commuters, 18.6%).
| Commute Time | # Commuters | % Commuters |
| Less than 5 Minutes | 23 | 11.0% |
| 5 to 9 Minutes | 55 | 26.2% |
| 10 to 14 Minutes | 50 | 23.8% |
| 15 to 19 Minutes | 10 | 4.8% |
| 20 to 24 Minutes | 0 | 0.0% |
| 25 to 29 Minutes | 0 | 0.0% |
| 30 to 34 Minutes | 39 | 18.6% |
| 35 to 39 Minutes | 0 | 0.0% |
| 40 to 44 Minutes | 0 | 0.0% |
| 45 to 59 Minutes | 21 | 10.0% |
| 60 to 89 Minutes | 12 | 5.7% |
| 90 or more Minutes | 0 | 0.0% |
Commute Time by Sex in Alamo
The most common commute times in Alamo are 5 to 9 minutes (35 commuters, 55.6%) for males and 30 to 34 minutes (39 commuters, 26.5%) for females.
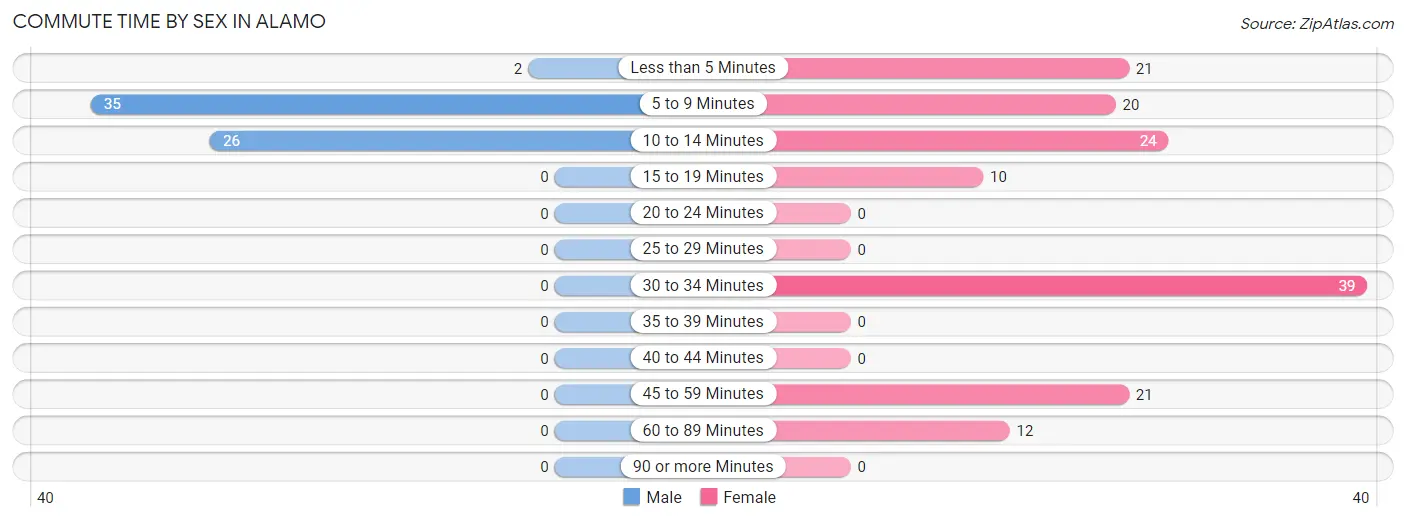
| Commute Time | Male | Female |
| Less than 5 Minutes | 2 (3.2%) | 21 (14.3%) |
| 5 to 9 Minutes | 35 (55.6%) | 20 (13.6%) |
| 10 to 14 Minutes | 26 (41.3%) | 24 (16.3%) |
| 15 to 19 Minutes | 0 (0.0%) | 10 (6.8%) |
| 20 to 24 Minutes | 0 (0.0%) | 0 (0.0%) |
| 25 to 29 Minutes | 0 (0.0%) | 0 (0.0%) |
| 30 to 34 Minutes | 0 (0.0%) | 39 (26.5%) |
| 35 to 39 Minutes | 0 (0.0%) | 0 (0.0%) |
| 40 to 44 Minutes | 0 (0.0%) | 0 (0.0%) |
| 45 to 59 Minutes | 0 (0.0%) | 21 (14.3%) |
| 60 to 89 Minutes | 0 (0.0%) | 12 (8.2%) |
| 90 or more Minutes | 0 (0.0%) | 0 (0.0%) |
Time of Departure to Work by Sex in Alamo
The most frequent times of departure to work in Alamo are 5:30 AM to 5:59 AM (28, 44.4%) for males and 7:00 AM to 7:29 AM (81, 55.1%) for females.
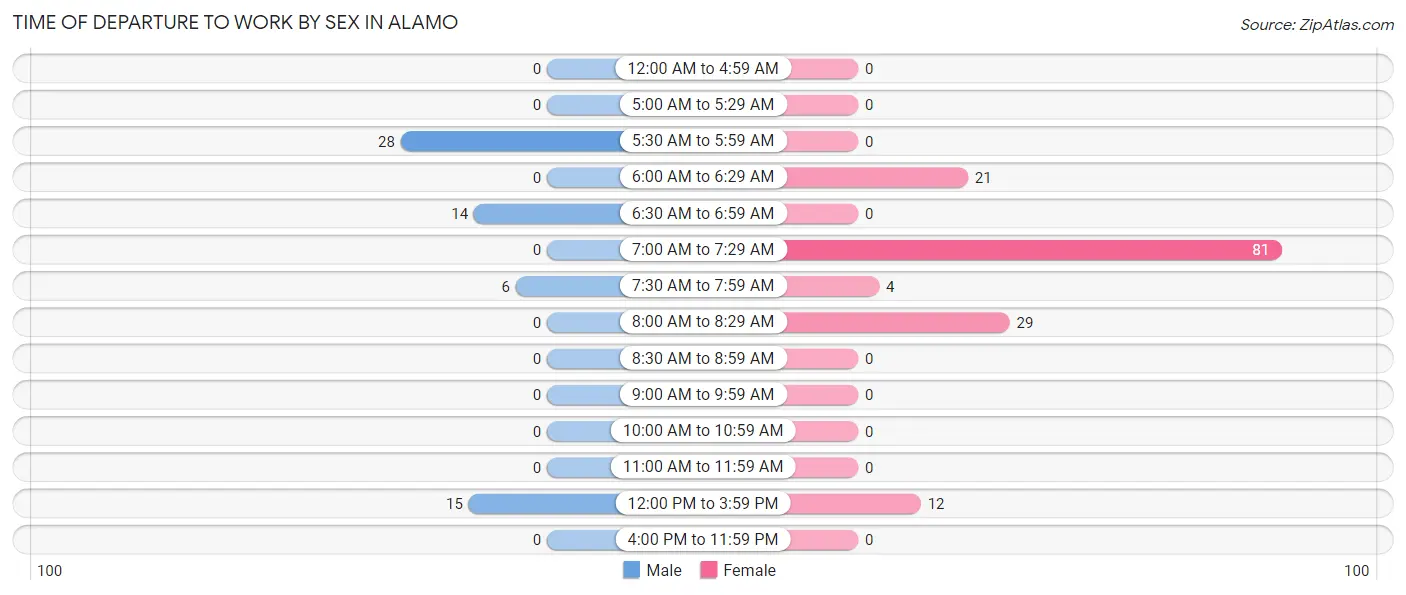
| Time of Departure | Male | Female |
| 12:00 AM to 4:59 AM | 0 (0.0%) | 0 (0.0%) |
| 5:00 AM to 5:29 AM | 0 (0.0%) | 0 (0.0%) |
| 5:30 AM to 5:59 AM | 28 (44.4%) | 0 (0.0%) |
| 6:00 AM to 6:29 AM | 0 (0.0%) | 21 (14.3%) |
| 6:30 AM to 6:59 AM | 14 (22.2%) | 0 (0.0%) |
| 7:00 AM to 7:29 AM | 0 (0.0%) | 81 (55.1%) |
| 7:30 AM to 7:59 AM | 6 (9.5%) | 4 (2.7%) |
| 8:00 AM to 8:29 AM | 0 (0.0%) | 29 (19.7%) |
| 8:30 AM to 8:59 AM | 0 (0.0%) | 0 (0.0%) |
| 9:00 AM to 9:59 AM | 0 (0.0%) | 0 (0.0%) |
| 10:00 AM to 10:59 AM | 0 (0.0%) | 0 (0.0%) |
| 11:00 AM to 11:59 AM | 0 (0.0%) | 0 (0.0%) |
| 12:00 PM to 3:59 PM | 15 (23.8%) | 12 (8.2%) |
| 4:00 PM to 11:59 PM | 0 (0.0%) | 0 (0.0%) |
| Total | 63 (100.0%) | 147 (100.0%) |
Housing Occupancy in Alamo
Occupancy by Ownership in Alamo
Of the total 236 dwellings in Alamo, owner-occupied units account for 151 (64.0%), while renter-occupied units make up 85 (36.0%).
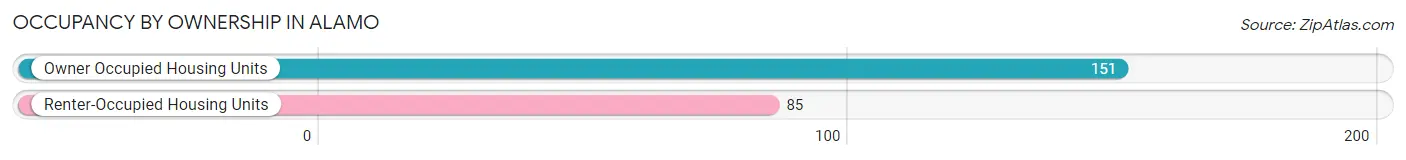
| Occupancy | # Housing Units | % Housing Units |
| Owner Occupied Housing Units | 151 | 64.0% |
| Renter-Occupied Housing Units | 85 | 36.0% |
| Total Occupied Housing Units | 236 | 100.0% |
Occupancy by Household Size in Alamo
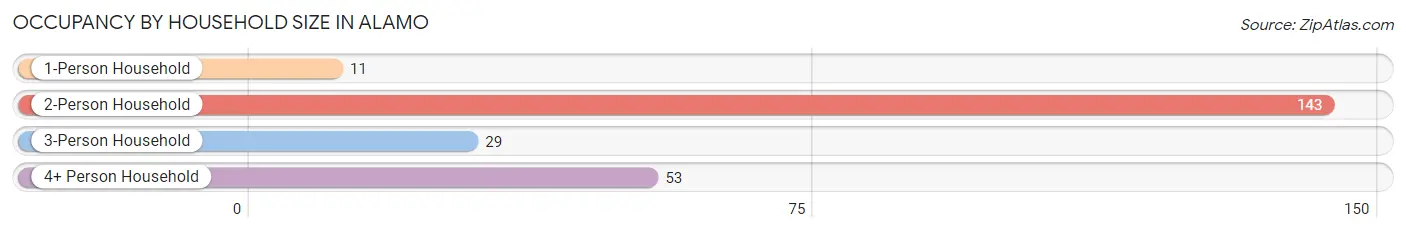
| Household Size | # Housing Units | % Housing Units |
| 1-Person Household | 11 | 4.7% |
| 2-Person Household | 143 | 60.6% |
| 3-Person Household | 29 | 12.3% |
| 4+ Person Household | 53 | 22.5% |
| Total Housing Units | 236 | 100.0% |
Occupancy by Ownership by Household Size in Alamo

| Household Size | Owner-occupied | Renter-occupied |
| 1-Person Household | 11 (100.0%) | 0 (0.0%) |
| 2-Person Household | 97 (67.8%) | 46 (32.2%) |
| 3-Person Household | 13 (44.8%) | 16 (55.2%) |
| 4+ Person Household | 30 (56.6%) | 23 (43.4%) |
| Total Housing Units | 151 (64.0%) | 85 (36.0%) |
Occupancy by Educational Attainment in Alamo
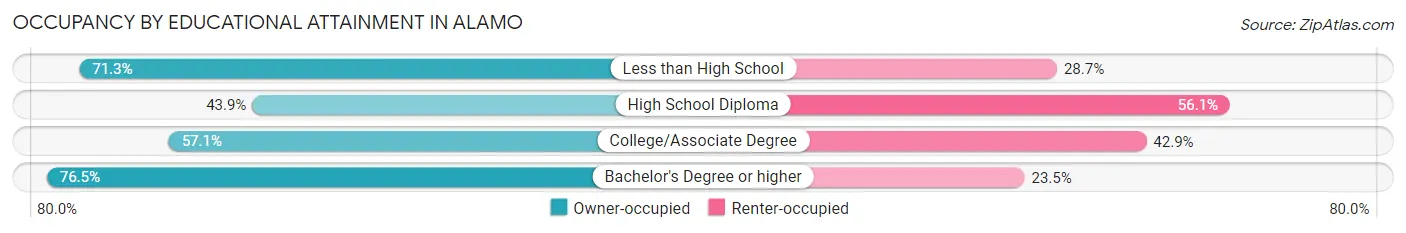
| Household Size | Owner-occupied | Renter-occupied |
| Less than High School | 92 (71.3%) | 37 (28.7%) |
| High School Diploma | 18 (43.9%) | 23 (56.1%) |
| College/Associate Degree | 28 (57.1%) | 21 (42.9%) |
| Bachelor's Degree or higher | 13 (76.5%) | 4 (23.5%) |
Occupancy by Age of Householder in Alamo
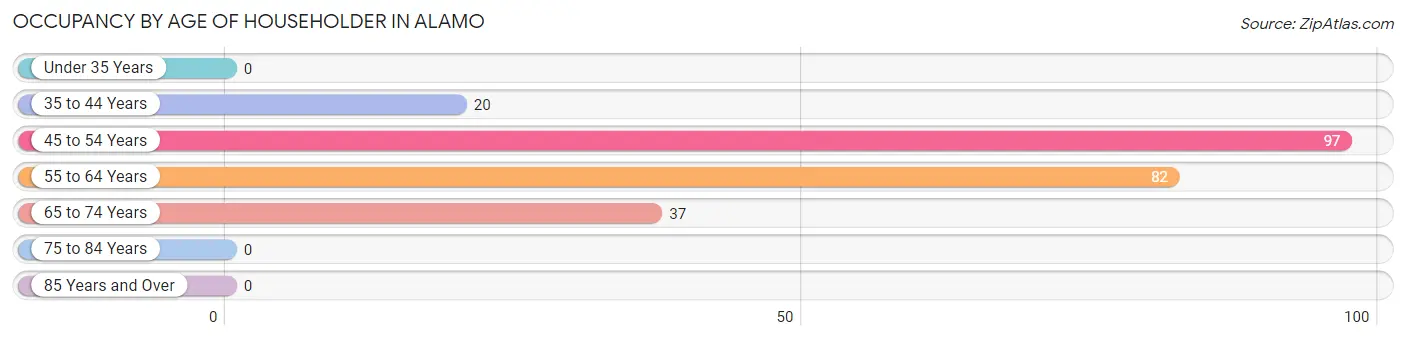
| Age Bracket | # Households | % Households |
| Under 35 Years | 0 | 0.0% |
| 35 to 44 Years | 20 | 8.5% |
| 45 to 54 Years | 97 | 41.1% |
| 55 to 64 Years | 82 | 34.7% |
| 65 to 74 Years | 37 | 15.7% |
| 75 to 84 Years | 0 | 0.0% |
| 85 Years and Over | 0 | 0.0% |
| Total | 236 | 100.0% |
Housing Finances in Alamo
Median Income by Occupancy in Alamo
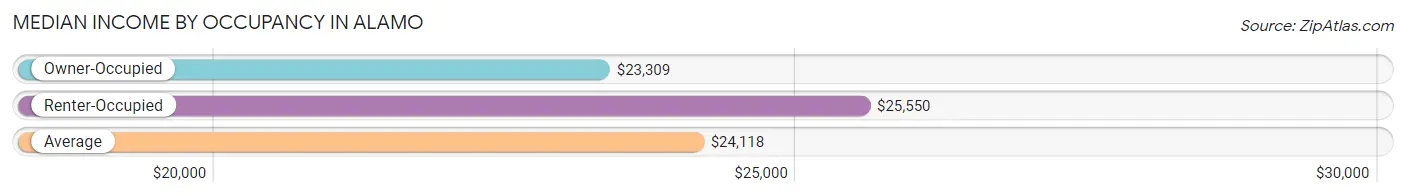
| Occupancy Type | # Households | Median Income |
| Owner-Occupied | 151 (64.0%) | $23,309 |
| Renter-Occupied | 85 (36.0%) | $25,550 |
| Average | 236 (100.0%) | $24,118 |
Occupancy by Householder Income Bracket in Alamo
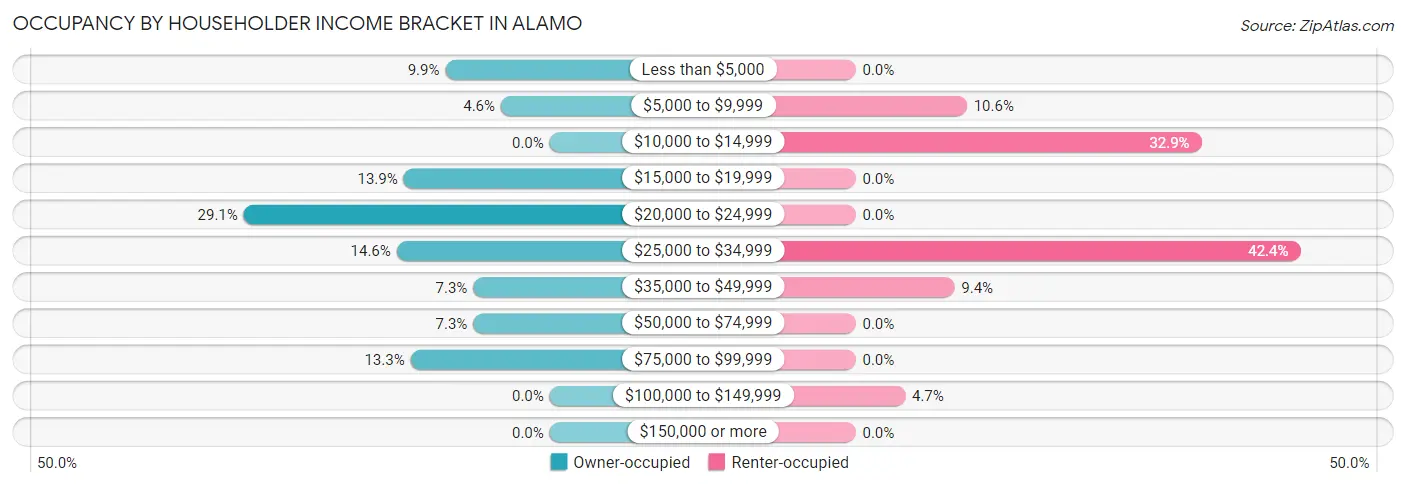
| Income Bracket | Owner-occupied | Renter-occupied |
| Less than $5,000 | 15 (9.9%) | 0 (0.0%) |
| $5,000 to $9,999 | 7 (4.6%) | 9 (10.6%) |
| $10,000 to $14,999 | 0 (0.0%) | 28 (32.9%) |
| $15,000 to $19,999 | 21 (13.9%) | 0 (0.0%) |
| $20,000 to $24,999 | 44 (29.1%) | 0 (0.0%) |
| $25,000 to $34,999 | 22 (14.6%) | 36 (42.3%) |
| $35,000 to $49,999 | 11 (7.3%) | 8 (9.4%) |
| $50,000 to $74,999 | 11 (7.3%) | 0 (0.0%) |
| $75,000 to $99,999 | 20 (13.3%) | 0 (0.0%) |
| $100,000 to $149,999 | 0 (0.0%) | 4 (4.7%) |
| $150,000 or more | 0 (0.0%) | 0 (0.0%) |
| Total | 151 (100.0%) | 85 (100.0%) |
Monthly Housing Cost Tiers in Alamo
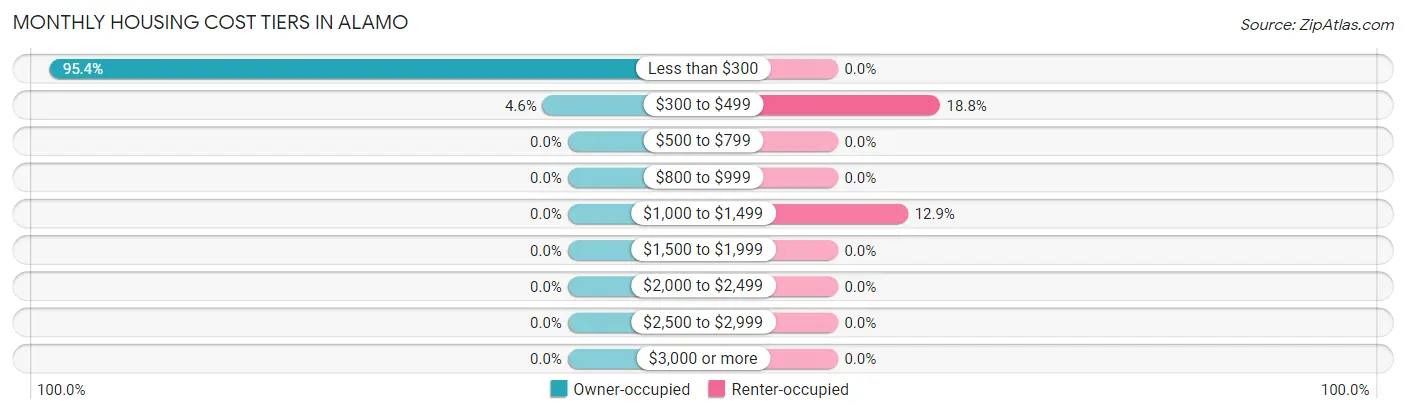
| Monthly Cost | Owner-occupied | Renter-occupied |
| Less than $300 | 144 (95.4%) | 0 (0.0%) |
| $300 to $499 | 7 (4.6%) | 16 (18.8%) |
| $500 to $799 | 0 (0.0%) | 0 (0.0%) |
| $800 to $999 | 0 (0.0%) | 0 (0.0%) |
| $1,000 to $1,499 | 0 (0.0%) | 11 (12.9%) |
| $1,500 to $1,999 | 0 (0.0%) | 0 (0.0%) |
| $2,000 to $2,499 | 0 (0.0%) | 0 (0.0%) |
| $2,500 to $2,999 | 0 (0.0%) | 0 (0.0%) |
| $3,000 or more | 0 (0.0%) | 0 (0.0%) |
| Total | 151 (100.0%) | 85 (100.0%) |
Physical Housing Characteristics in Alamo
Housing Structures in Alamo
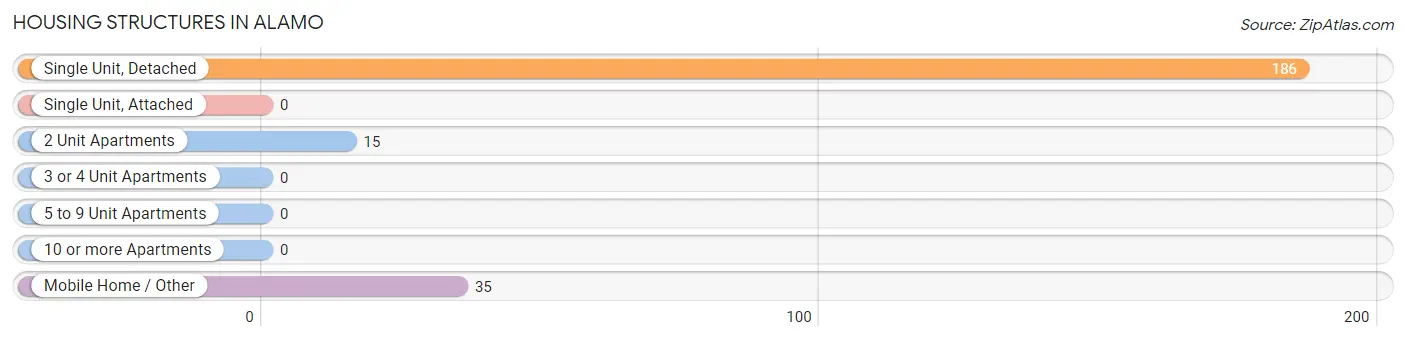
| Structure Type | # Housing Units | % Housing Units |
| Single Unit, Detached | 186 | 78.8% |
| Single Unit, Attached | 0 | 0.0% |
| 2 Unit Apartments | 15 | 6.4% |
| 3 or 4 Unit Apartments | 0 | 0.0% |
| 5 to 9 Unit Apartments | 0 | 0.0% |
| 10 or more Apartments | 0 | 0.0% |
| Mobile Home / Other | 35 | 14.8% |
| Total | 236 | 100.0% |
Housing Structures by Occupancy in Alamo
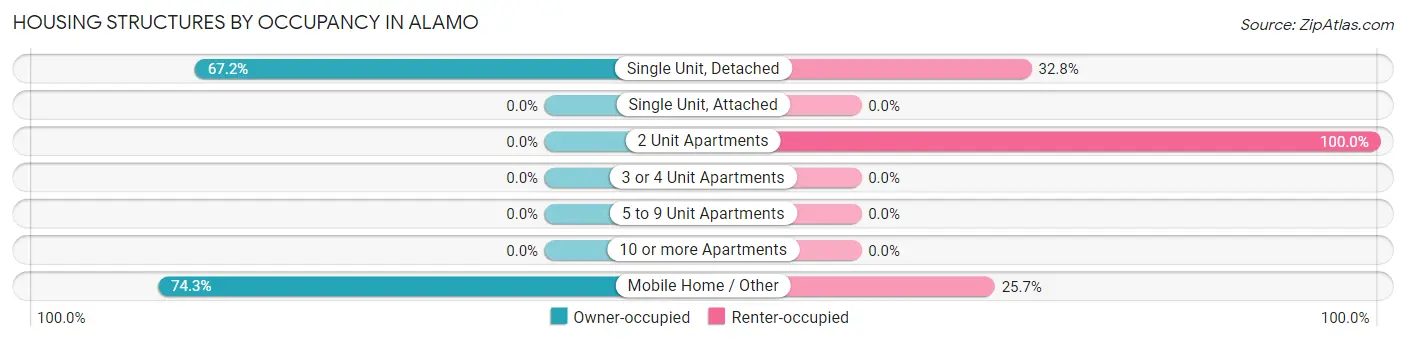
| Structure Type | Owner-occupied | Renter-occupied |
| Single Unit, Detached | 125 (67.2%) | 61 (32.8%) |
| Single Unit, Attached | 0 (0.0%) | 0 (0.0%) |
| 2 Unit Apartments | 0 (0.0%) | 15 (100.0%) |
| 3 or 4 Unit Apartments | 0 (0.0%) | 0 (0.0%) |
| 5 to 9 Unit Apartments | 0 (0.0%) | 0 (0.0%) |
| 10 or more Apartments | 0 (0.0%) | 0 (0.0%) |
| Mobile Home / Other | 26 (74.3%) | 9 (25.7%) |
| Total | 151 (64.0%) | 85 (36.0%) |
Housing Structures by Number of Rooms in Alamo
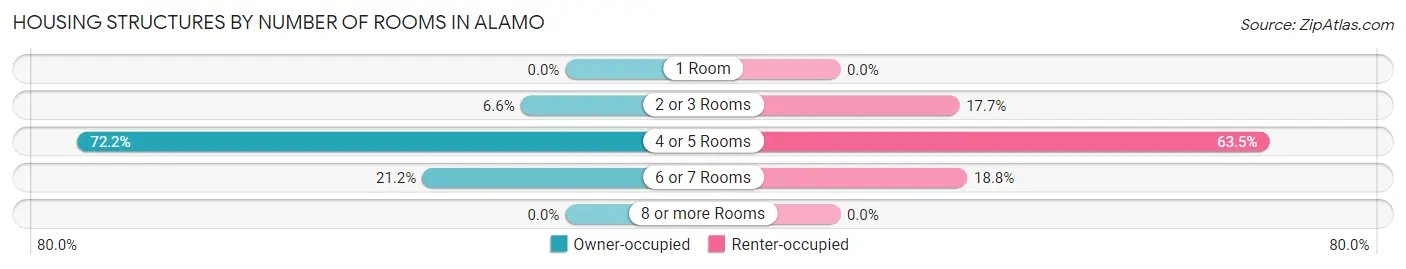
| Number of Rooms | Owner-occupied | Renter-occupied |
| 1 Room | 0 (0.0%) | 0 (0.0%) |
| 2 or 3 Rooms | 10 (6.6%) | 15 (17.6%) |
| 4 or 5 Rooms | 109 (72.2%) | 54 (63.5%) |
| 6 or 7 Rooms | 32 (21.2%) | 16 (18.8%) |
| 8 or more Rooms | 0 (0.0%) | 0 (0.0%) |
| Total | 151 (100.0%) | 85 (100.0%) |
Housing Structure by Heating Type in Alamo
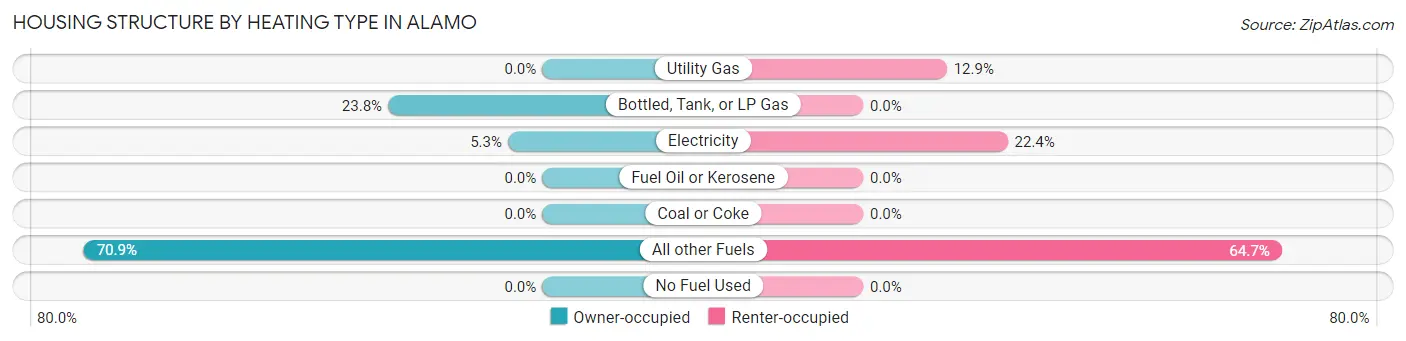
| Heating Type | Owner-occupied | Renter-occupied |
| Utility Gas | 0 (0.0%) | 11 (12.9%) |
| Bottled, Tank, or LP Gas | 36 (23.8%) | 0 (0.0%) |
| Electricity | 8 (5.3%) | 19 (22.4%) |
| Fuel Oil or Kerosene | 0 (0.0%) | 0 (0.0%) |
| Coal or Coke | 0 (0.0%) | 0 (0.0%) |
| All other Fuels | 107 (70.9%) | 55 (64.7%) |
| No Fuel Used | 0 (0.0%) | 0 (0.0%) |
| Total | 151 (100.0%) | 85 (100.0%) |
Household Vehicle Usage in Alamo
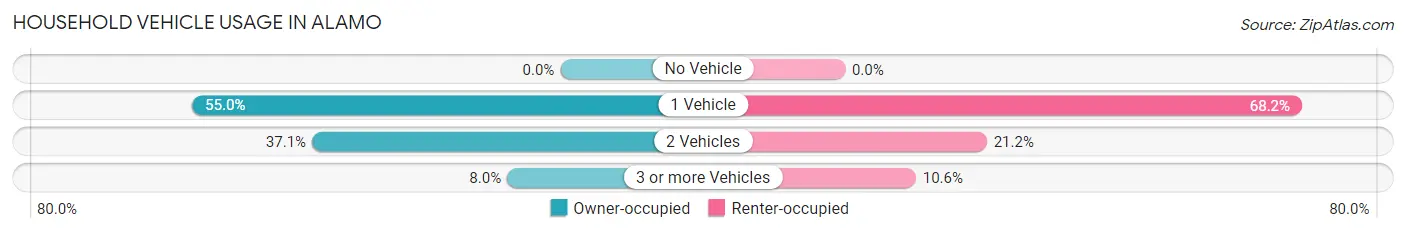
| Vehicles per Household | Owner-occupied | Renter-occupied |
| No Vehicle | 0 (0.0%) | 0 (0.0%) |
| 1 Vehicle | 83 (55.0%) | 58 (68.2%) |
| 2 Vehicles | 56 (37.1%) | 18 (21.2%) |
| 3 or more Vehicles | 12 (8.0%) | 9 (10.6%) |
| Total | 151 (100.0%) | 85 (100.0%) |
Real Estate & Mortgages in Alamo
Real Estate and Mortgage Overview in Alamo
| Characteristic | Without Mortgage | With Mortgage |
| Housing Units | 151 | 0 |
| Median Property Value | $9,999 | $0 |
| Median Household Income | $23,309 | $0 |
| Monthly Housing Costs | $204 | $0 |
| Real Estate Taxes | $199 | $0 |
Property Value by Mortgage Status in Alamo
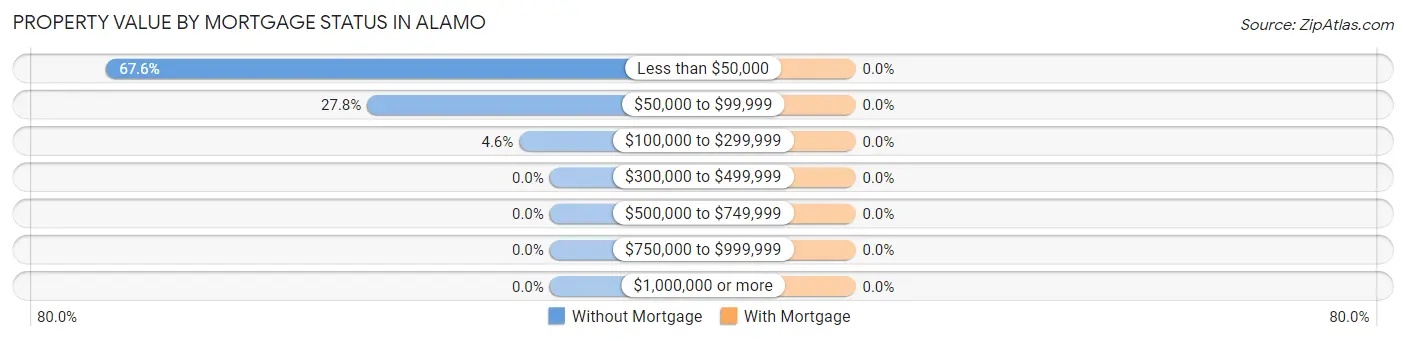
| Property Value | Without Mortgage | With Mortgage |
| Less than $50,000 | 102 (67.5%) | 0 (0.0%) |
| $50,000 to $99,999 | 42 (27.8%) | 0 (0.0%) |
| $100,000 to $299,999 | 7 (4.6%) | 0 (0.0%) |
| $300,000 to $499,999 | 0 (0.0%) | 0 (0.0%) |
| $500,000 to $749,999 | 0 (0.0%) | 0 (0.0%) |
| $750,000 to $999,999 | 0 (0.0%) | 0 (0.0%) |
| $1,000,000 or more | 0 (0.0%) | 0 (0.0%) |
| Total | 151 (100.0%) | 0 (0.0%) |
Household Income by Mortgage Status in Alamo
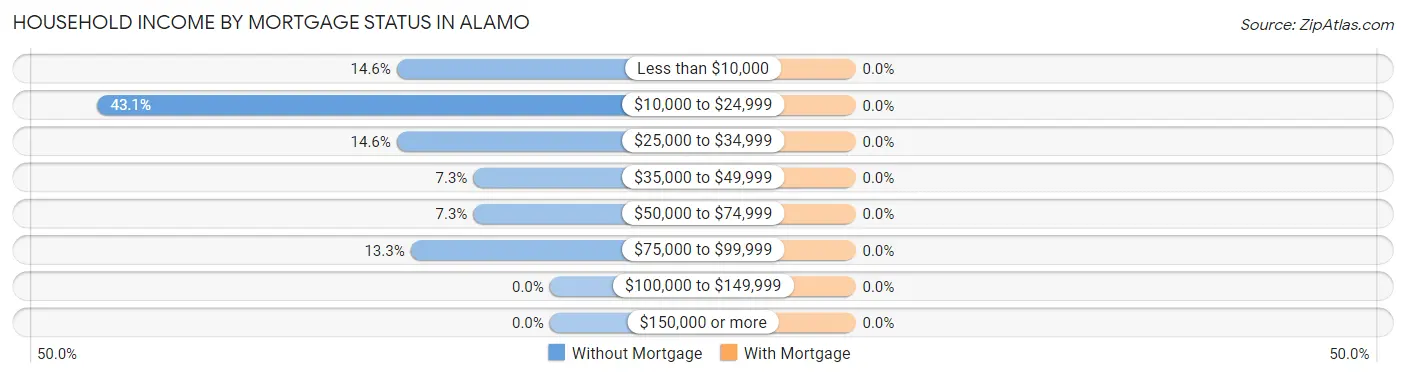
| Household Income | Without Mortgage | With Mortgage |
| Less than $10,000 | 22 (14.6%) | 0 (0.0%) |
| $10,000 to $24,999 | 65 (43.0%) | 0 (0.0%) |
| $25,000 to $34,999 | 22 (14.6%) | 0 (0.0%) |
| $35,000 to $49,999 | 11 (7.3%) | 0 (0.0%) |
| $50,000 to $74,999 | 11 (7.3%) | 0 (0.0%) |
| $75,000 to $99,999 | 20 (13.3%) | 0 (0.0%) |
| $100,000 to $149,999 | 0 (0.0%) | 0 (0.0%) |
| $150,000 or more | 0 (0.0%) | 0 (0.0%) |
| Total | 151 (100.0%) | 0 (0.0%) |
Property Value to Household Income Ratio in Alamo
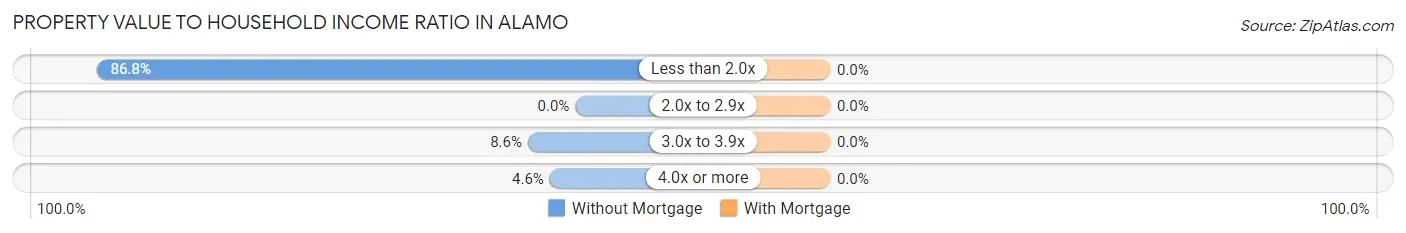
| Value-to-Income Ratio | Without Mortgage | With Mortgage |
| Less than 2.0x | 131 (86.8%) | 0 (0.0%) |
| 2.0x to 2.9x | 0 (0.0%) | 0 (0.0%) |
| 3.0x to 3.9x | 13 (8.6%) | 0 (0.0%) |
| 4.0x or more | 7 (4.6%) | 0 (0.0%) |
| Total | 151 (100.0%) | 0 (0.0%) |
Real Estate Taxes by Mortgage Status in Alamo
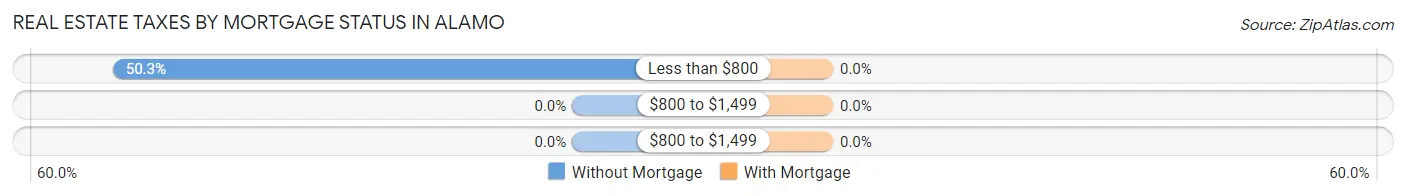
| Property Taxes | Without Mortgage | With Mortgage |
| Less than $800 | 76 (50.3%) | 0 (0.0%) |
| $800 to $1,499 | 0 (0.0%) | 0 (0.0%) |
| $800 to $1,499 | 0 (0.0%) | 0 (0.0%) |
| Total | 151 (100.0%) | 0 (0.0%) |
Health & Disability in Alamo
Health Insurance Coverage by Age in Alamo
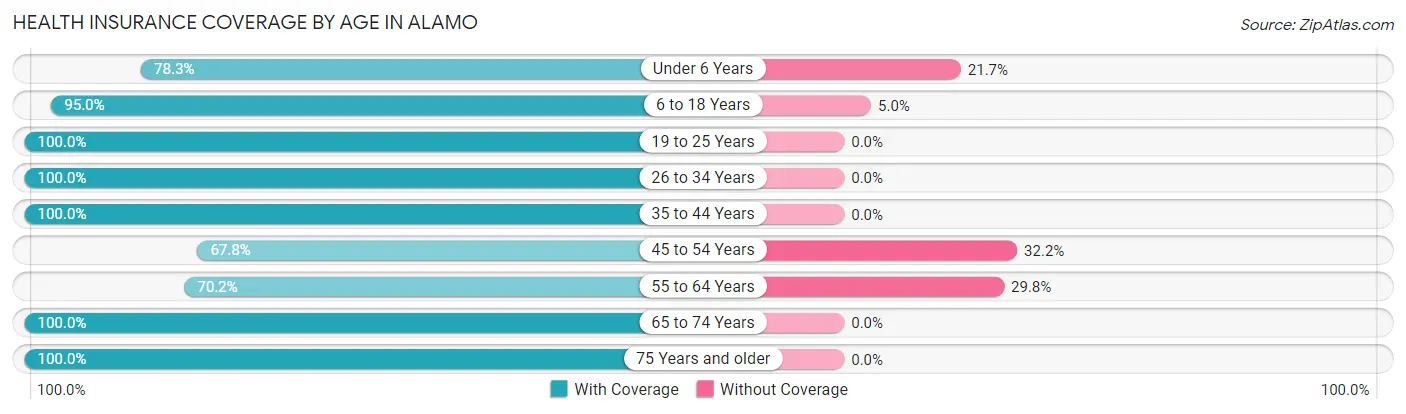
| Age Bracket | With Coverage | Without Coverage |
| Under 6 Years | 90 (78.3%) | 25 (21.7%) |
| 6 to 18 Years | 190 (95.0%) | 10 (5.0%) |
| 19 to 25 Years | 123 (100.0%) | 0 (0.0%) |
| 26 to 34 Years | 52 (100.0%) | 0 (0.0%) |
| 35 to 44 Years | 96 (100.0%) | 0 (0.0%) |
| 45 to 54 Years | 124 (67.8%) | 59 (32.2%) |
| 55 to 64 Years | 106 (70.2%) | 45 (29.8%) |
| 65 to 74 Years | 92 (100.0%) | 0 (0.0%) |
| 75 Years and older | 69 (100.0%) | 0 (0.0%) |
| Total | 942 (87.1%) | 139 (12.9%) |
Health Insurance Coverage by Citizenship Status in Alamo
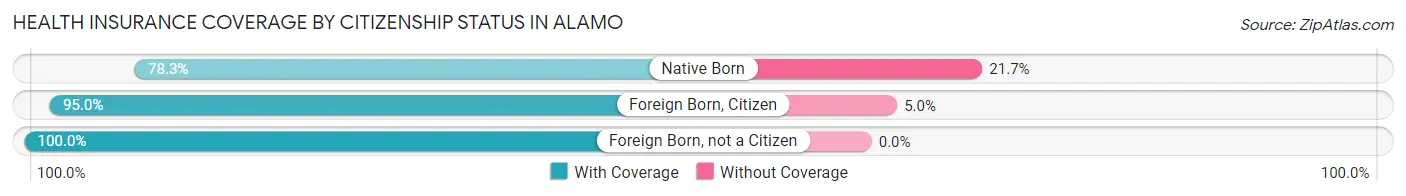
| Citizenship Status | With Coverage | Without Coverage |
| Native Born | 90 (78.3%) | 25 (21.7%) |
| Foreign Born, Citizen | 190 (95.0%) | 10 (5.0%) |
| Foreign Born, not a Citizen | 123 (100.0%) | 0 (0.0%) |
Health Insurance Coverage by Household Income in Alamo
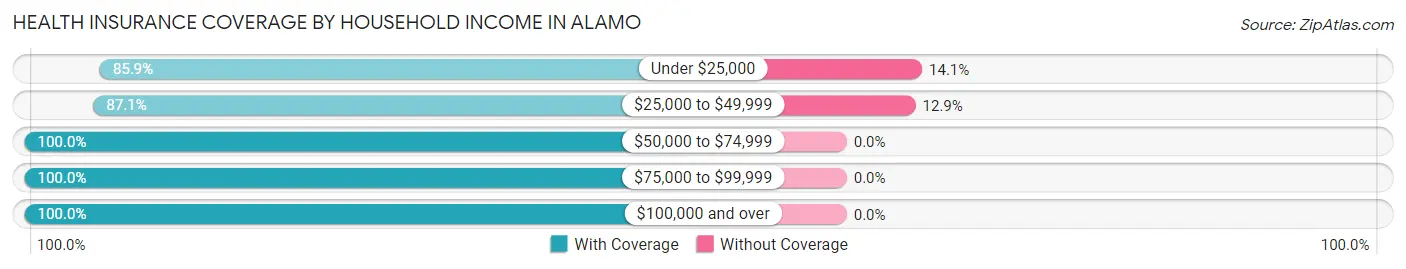
| Household Income | With Coverage | Without Coverage |
| Under $25,000 | 572 (85.9%) | 94 (14.1%) |
| $25,000 to $49,999 | 304 (87.1%) | 45 (12.9%) |
| $50,000 to $74,999 | 11 (100.0%) | 0 (0.0%) |
| $75,000 to $99,999 | 43 (100.0%) | 0 (0.0%) |
| $100,000 and over | 10 (100.0%) | 0 (0.0%) |
Public vs Private Health Insurance Coverage by Age in Alamo
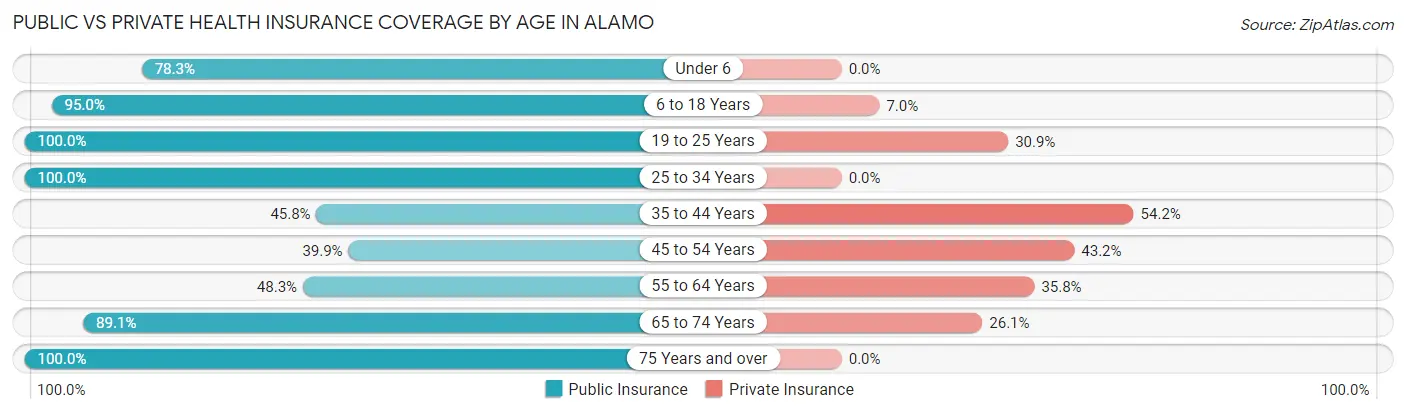
| Age Bracket | Public Insurance | Private Insurance |
| Under 6 | 90 (78.3%) | 0 (0.0%) |
| 6 to 18 Years | 190 (95.0%) | 14 (7.0%) |
| 19 to 25 Years | 123 (100.0%) | 38 (30.9%) |
| 25 to 34 Years | 52 (100.0%) | 0 (0.0%) |
| 35 to 44 Years | 44 (45.8%) | 52 (54.2%) |
| 45 to 54 Years | 73 (39.9%) | 79 (43.2%) |
| 55 to 64 Years | 73 (48.3%) | 54 (35.8%) |
| 65 to 74 Years | 82 (89.1%) | 24 (26.1%) |
| 75 Years and over | 69 (100.0%) | 0 (0.0%) |
| Total | 796 (73.6%) | 261 (24.1%) |
Disability Status by Sex by Age in Alamo
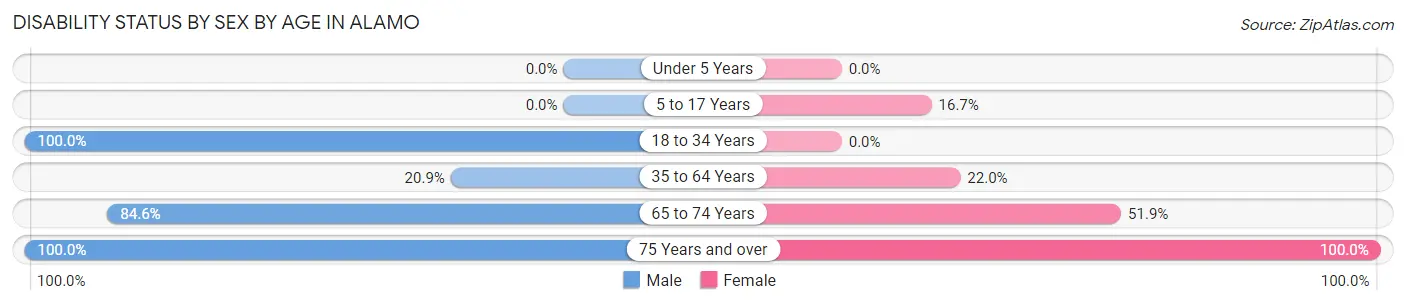
| Age Bracket | Male | Female |
| Under 5 Years | 0 (0.0%) | 0 (0.0%) |
| 5 to 17 Years | 0 (0.0%) | 12 (16.7%) |
| 18 to 34 Years | 41 (100.0%) | 0 (0.0%) |
| 35 to 64 Years | 32 (20.9%) | 61 (22.0%) |
| 65 to 74 Years | 55 (84.6%) | 14 (51.8%) |
| 75 Years and over | 13 (100.0%) | 56 (100.0%) |
Disability Class by Sex by Age in Alamo
Disability Class: Hearing Difficulty
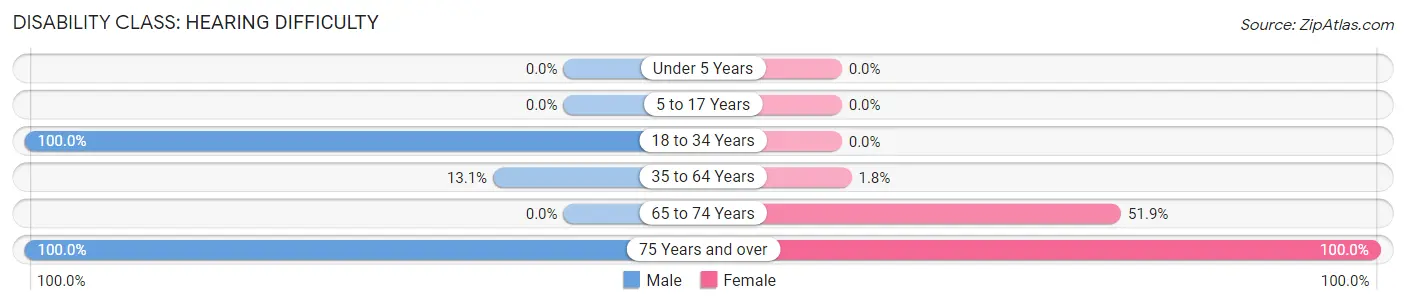
| Age Bracket | Male | Female |
| Under 5 Years | 0 (0.0%) | 0 (0.0%) |
| 5 to 17 Years | 0 (0.0%) | 0 (0.0%) |
| 18 to 34 Years | 41 (100.0%) | 0 (0.0%) |
| 35 to 64 Years | 20 (13.1%) | 5 (1.8%) |
| 65 to 74 Years | 0 (0.0%) | 14 (51.8%) |
| 75 Years and over | 13 (100.0%) | 56 (100.0%) |
Disability Class: Vision Difficulty

| Age Bracket | Male | Female |
| Under 5 Years | 0 (0.0%) | 0 (0.0%) |
| 5 to 17 Years | 0 (0.0%) | 0 (0.0%) |
| 18 to 34 Years | 41 (100.0%) | 0 (0.0%) |
| 35 to 64 Years | 20 (13.1%) | 20 (7.2%) |
| 65 to 74 Years | 0 (0.0%) | 14 (51.8%) |
| 75 Years and over | 13 (100.0%) | 56 (100.0%) |
Disability Class: Cognitive Difficulty
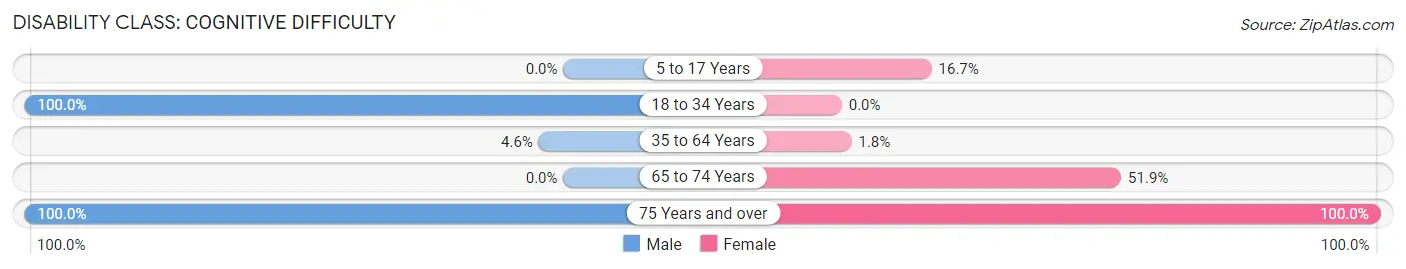
| Age Bracket | Male | Female |
| 5 to 17 Years | 0 (0.0%) | 12 (16.7%) |
| 18 to 34 Years | 41 (100.0%) | 0 (0.0%) |
| 35 to 64 Years | 7 (4.6%) | 5 (1.8%) |
| 65 to 74 Years | 0 (0.0%) | 14 (51.8%) |
| 75 Years and over | 13 (100.0%) | 56 (100.0%) |
Disability Class: Ambulatory Difficulty
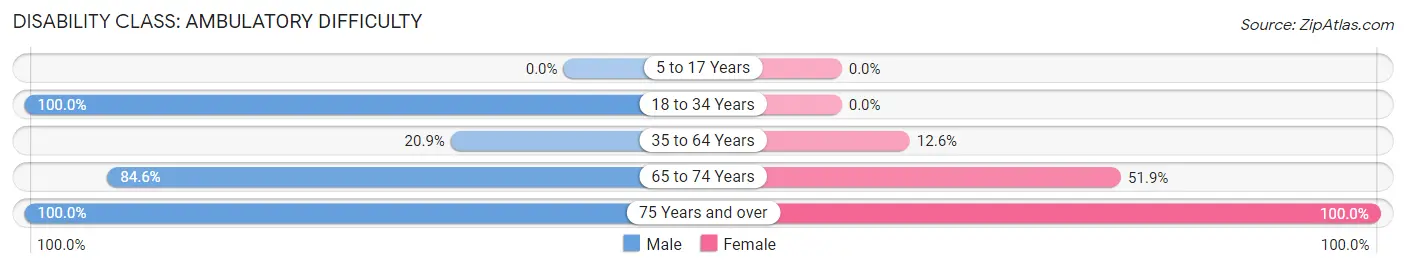
| Age Bracket | Male | Female |
| 5 to 17 Years | 0 (0.0%) | 0 (0.0%) |
| 18 to 34 Years | 41 (100.0%) | 0 (0.0%) |
| 35 to 64 Years | 32 (20.9%) | 35 (12.6%) |
| 65 to 74 Years | 55 (84.6%) | 14 (51.8%) |
| 75 Years and over | 13 (100.0%) | 56 (100.0%) |
Disability Class: Self-Care Difficulty
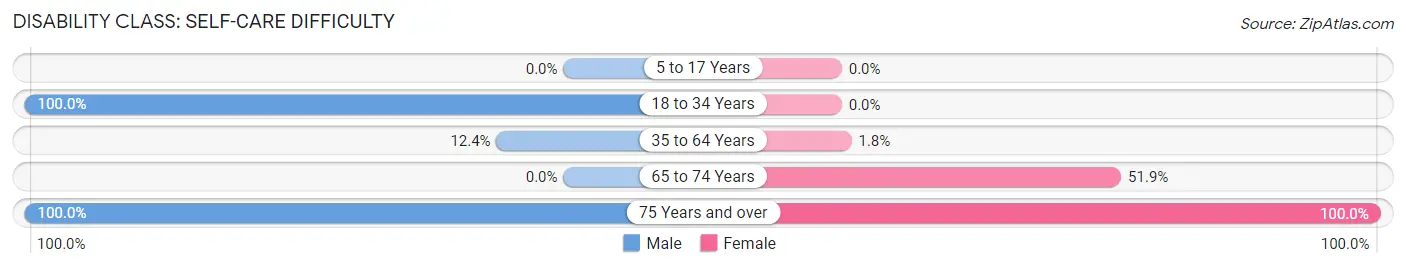
| Age Bracket | Male | Female |
| 5 to 17 Years | 0 (0.0%) | 0 (0.0%) |
| 18 to 34 Years | 41 (100.0%) | 0 (0.0%) |
| 35 to 64 Years | 19 (12.4%) | 5 (1.8%) |
| 65 to 74 Years | 0 (0.0%) | 14 (51.8%) |
| 75 Years and over | 13 (100.0%) | 56 (100.0%) |
Technology Access in Alamo
Computing Device Access in Alamo
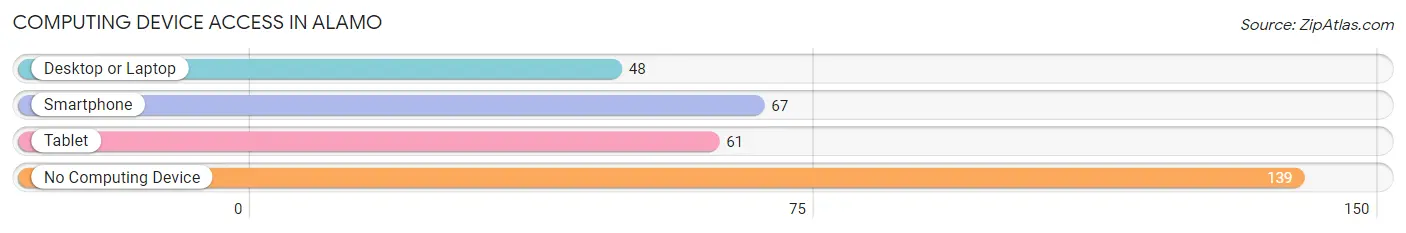
| Device Type | # Households | % Households |
| Desktop or Laptop | 48 | 20.3% |
| Smartphone | 67 | 28.4% |
| Tablet | 61 | 25.9% |
| No Computing Device | 139 | 58.9% |
| Total | 236 | 100.0% |
Internet Access in Alamo
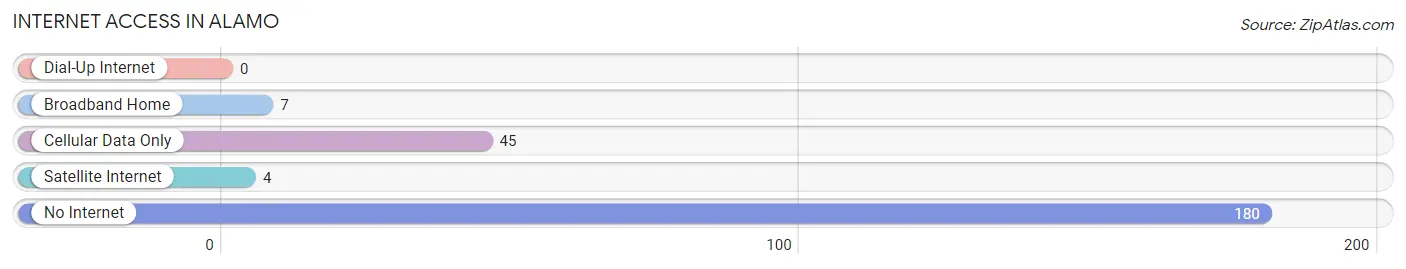
| Internet Type | # Households | % Households |
| Dial-Up Internet | 0 | 0.0% |
| Broadband Home | 7 | 3.0% |
| Cellular Data Only | 45 | 19.1% |
| Satellite Internet | 4 | 1.7% |
| No Internet | 180 | 76.3% |
| Total | 236 | 100.0% |
Alamo Summary
Alamo, New Mexico is a small unincorporated community located in the northeastern corner of the state. It is situated in the foothills of the Sangre de Cristo Mountains, approximately 25 miles south of Taos and 40 miles north of Santa Fe. The area is known for its scenic beauty, with rolling hills, lush vegetation, and stunning views of the surrounding mountains.
History
The area now known as Alamo was first settled by the Spanish in the late 1700s. The settlement was originally called San Antonio de Padua, and was part of the Spanish land grant system. The area was used for grazing and farming, and the settlers built adobe homes and churches.
In 1821, Mexico gained independence from Spain, and the area became part of the Mexican state of Nuevo Mexico. In 1848, the United States acquired the area as part of the Treaty of Guadalupe Hidalgo, and the area became part of the Territory of New Mexico.
In 1876, the area was renamed Alamo, after the famous battle in Texas. The name was chosen by the local postmaster, who was a veteran of the battle.
Geography
Alamo is located in the northeastern corner of New Mexico, in the foothills of the Sangre de Cristo Mountains. The area is known for its scenic beauty, with rolling hills, lush vegetation, and stunning views of the surrounding mountains.
The climate in Alamo is semi-arid, with hot summers and cold winters. The average annual temperature is around 50 degrees Fahrenheit, and the average annual precipitation is around 12 inches.
Economy
The economy of Alamo is largely based on agriculture and tourism. The area is known for its scenic beauty, and attracts many visitors each year.
Agriculture is the main economic activity in Alamo. The area is known for its production of apples, peaches, and other fruits and vegetables. Livestock production is also important, with cattle, sheep, and goats being raised in the area.
Demographics
As of the 2010 census, the population of Alamo was 1,845. The population is largely Hispanic, with over 90% of the population identifying as Hispanic or Latino. The median household income is around $30,000, and the median age is around 40 years old.
Conclusion
Alamo, New Mexico is a small unincorporated community located in the northeastern corner of the state. It is known for its scenic beauty, with rolling hills, lush vegetation, and stunning views of the surrounding mountains. The economy of Alamo is largely based on agriculture and tourism, and the population is largely Hispanic. Alamo is a beautiful and unique area, and is a great place to visit or live.
Common Questions
What is Per Capita Income in Alamo?
Per Capita income in Alamo is $9,043.
What is the Median Family Income in Alamo?
Median Family Income in Alamo is $22,303.
What is the Median Household income in Alamo?
Median Household Income in Alamo is $24,118.
What is Income or Wage Gap in Alamo?
Income or Wage Gap in Alamo is 11.2%.
Women in Alamo earn 88.8 cents for every dollar earned by a man.
What is Inequality or Gini Index in Alamo?
Inequality or Gini Index in Alamo is 0.39.
What is the Total Population of Alamo?
Total Population of Alamo is 1,081.
What is the Total Male Population of Alamo?
Total Male Population of Alamo is 465.
What is the Total Female Population of Alamo?
Total Female Population of Alamo is 616.
What is the Ratio of Males per 100 Females in Alamo?
There are 75.49 Males per 100 Females in Alamo.
What is the Ratio of Females per 100 Males in Alamo?
There are 132.47 Females per 100 Males in Alamo.
What is the Median Population Age in Alamo?
Median Population Age in Alamo is 42.5 Years.
What is the Average Family Size in Alamo
Average Family Size in Alamo is 4.7 People.
What is the Average Household Size in Alamo
Average Household Size in Alamo is 4.6 People.
How Large is the Labor Force in Alamo?
There are 377 People in the Labor Forcein in Alamo.
What is the Percentage of People in the Labor Force in Alamo?
47.8% of People are in the Labor Force in Alamo.
What is the Unemployment Rate in Alamo?
Unemployment Rate in Alamo is 22.5%.