Happy Valley, NM Map & Demographics
Happy Valley Map
Happy Valley Overview
$23,167
PER CAPITA INCOME
$80,577
AVG FAMILY INCOME
$61,083
AVG HOUSEHOLD INCOME
0.49
INEQUALITY / GINI INDEX
629
TOTAL POPULATION
357
MALE POPULATION
272
FEMALE POPULATION
131.25
MALES / 100 FEMALES
76.19
FEMALES / 100 MALES
45.3
MEDIAN AGE
2.5
AVG FAMILY SIZE
2.2
AVG HOUSEHOLD SIZE
252
LABOR FORCE [ PEOPLE ]
43.4%
PERCENT IN LABOR FORCE
23.0%
UNEMPLOYMENT RATE
Income in Happy Valley
Income Overview in Happy Valley
Per Capita Income in Happy Valley is $23,167, while median incomes of families and households are $80,577 and $61,083 respectively.
| Characteristic | Number | Measure |
| Per Capita Income | 629 | $23,167 |
| Median Family Income | 202 | $80,577 |
| Mean Family Income | 202 | $70,780 |
| Median Household Income | 287 | $61,083 |
| Mean Household Income | 287 | $58,981 |
| Income Deficit | 202 | $0 |
| Wage / Income Gap (%) | 629 | 0.00% |
| Wage / Income Gap ($) | 629 | 100.00¢ per $1 |
| Gini / Inequality Index | 629 | 0.49 |
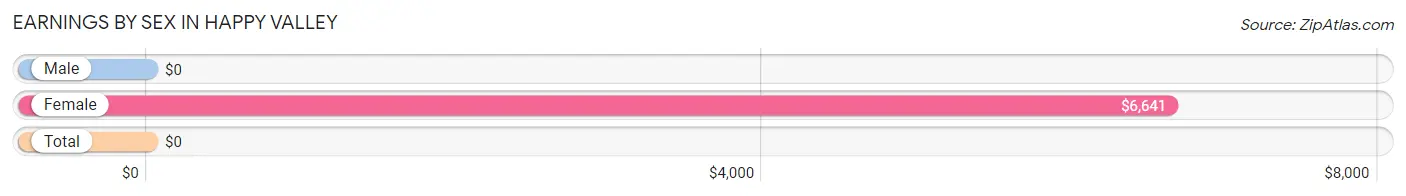
Earnings by Sex in Happy Valley
| Sex | Number | Average Earnings |
| Male | 231 (73.1%) | $0 |
| Female | 85 (26.9%) | $6,641 |
| Total | 316 (100.0%) | $0 |
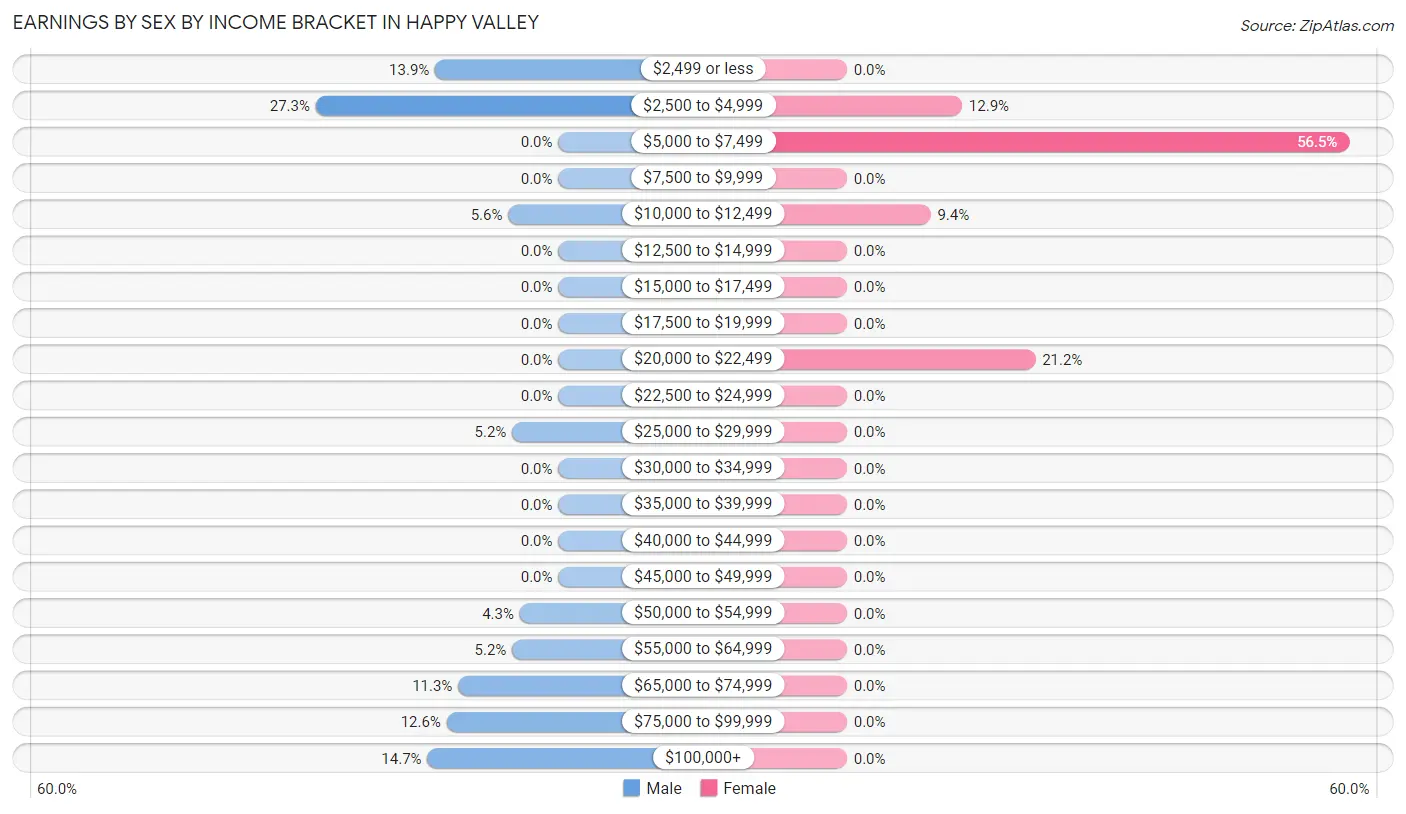
Earnings by Sex by Income Bracket in Happy Valley
The most common earnings brackets in Happy Valley are $2,500 to $4,999 for men (63 | 27.3%) and $5,000 to $7,499 for women (48 | 56.5%).
| Income | Male | Female |
| $2,499 or less | 32 (13.9%) | 0 (0.0%) |
| $2,500 to $4,999 | 63 (27.3%) | 11 (12.9%) |
| $5,000 to $7,499 | 0 (0.0%) | 48 (56.5%) |
| $7,500 to $9,999 | 0 (0.0%) | 0 (0.0%) |
| $10,000 to $12,499 | 13 (5.6%) | 8 (9.4%) |
| $12,500 to $14,999 | 0 (0.0%) | 0 (0.0%) |
| $15,000 to $17,499 | 0 (0.0%) | 0 (0.0%) |
| $17,500 to $19,999 | 0 (0.0%) | 0 (0.0%) |
| $20,000 to $22,499 | 0 (0.0%) | 18 (21.2%) |
| $22,500 to $24,999 | 0 (0.0%) | 0 (0.0%) |
| $25,000 to $29,999 | 12 (5.2%) | 0 (0.0%) |
| $30,000 to $34,999 | 0 (0.0%) | 0 (0.0%) |
| $35,000 to $39,999 | 0 (0.0%) | 0 (0.0%) |
| $40,000 to $44,999 | 0 (0.0%) | 0 (0.0%) |
| $45,000 to $49,999 | 0 (0.0%) | 0 (0.0%) |
| $50,000 to $54,999 | 10 (4.3%) | 0 (0.0%) |
| $55,000 to $64,999 | 12 (5.2%) | 0 (0.0%) |
| $65,000 to $74,999 | 26 (11.3%) | 0 (0.0%) |
| $75,000 to $99,999 | 29 (12.6%) | 0 (0.0%) |
| $100,000+ | 34 (14.7%) | 0 (0.0%) |
| Total | 231 (100.0%) | 85 (100.0%) |
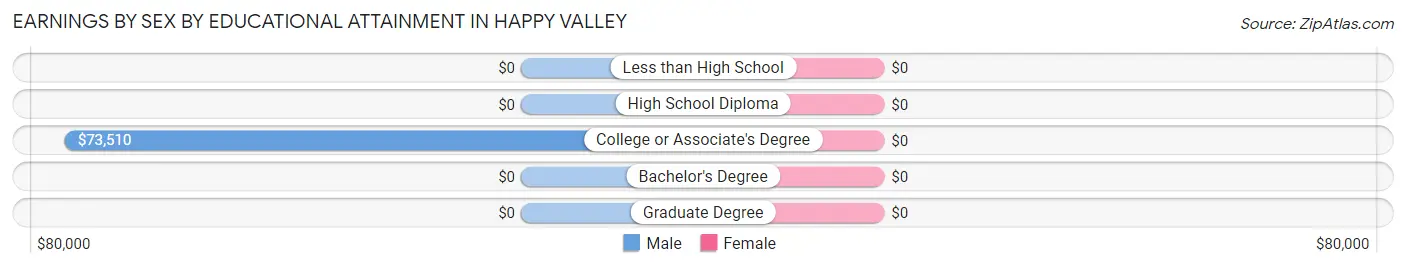
Earnings by Sex by Educational Attainment in Happy Valley
| Educational Attainment | Male Income | Female Income |
| Less than High School | - | - |
| High School Diploma | - | - |
| College or Associate's Degree | $73,510 | $0 |
| Bachelor's Degree | - | - |
| Graduate Degree | - | - |
| Total | $74,519 | $0 |
Family Income in Happy Valley
Family Income Brackets in Happy Valley
According to the Happy Valley family income data, there are 77 families falling into the $75,000 to $99,999 income range, which is the most common income bracket and makes up 38.1% of all families.
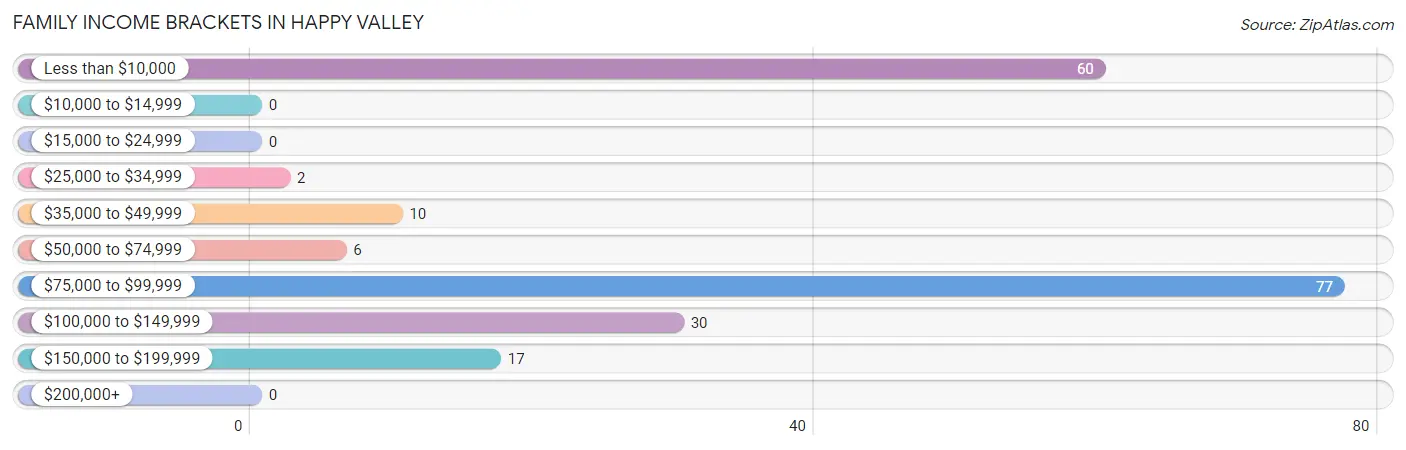
| Income Bracket | # Families | % Families |
| Less than $10,000 | 60 | 29.7% |
| $10,000 to $14,999 | 0 | 0.0% |
| $15,000 to $24,999 | 0 | 0.0% |
| $25,000 to $34,999 | 2 | 1.0% |
| $35,000 to $49,999 | 10 | 5.0% |
| $50,000 to $74,999 | 6 | 3.0% |
| $75,000 to $99,999 | 77 | 38.1% |
| $100,000 to $149,999 | 30 | 14.9% |
| $150,000 to $199,999 | 17 | 8.4% |
| $200,000+ | 0 | 0.0% |
Family Income by Famaliy Size in Happy Valley
4-person families (63 | 31.2%) account for the highest median family income in Happy Valley with $81,010 per family, while 4-person families (63 | 31.2%) have the highest median income of $20,252 per family member.
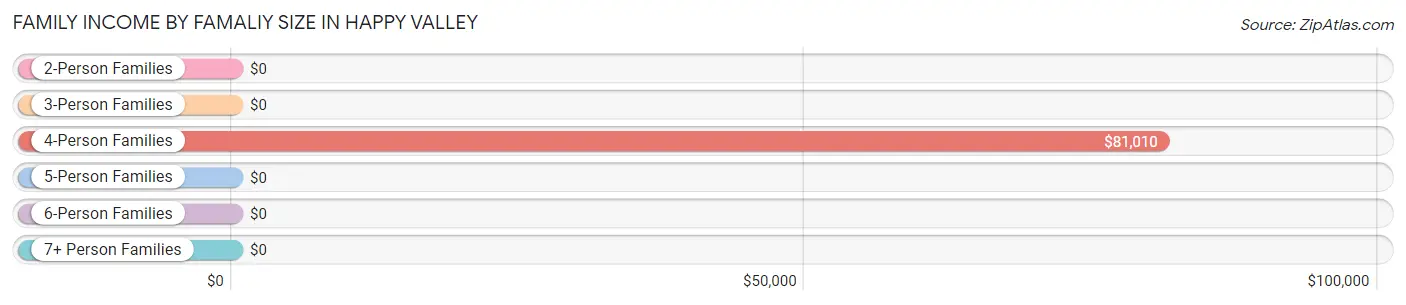
| Income Bracket | # Families | Median Income |
| 2-Person Families | 139 (68.8%) | $0 |
| 3-Person Families | 0 (0.0%) | $0 |
| 4-Person Families | 63 (31.2%) | $81,010 |
| 5-Person Families | 0 (0.0%) | $0 |
| 6-Person Families | 0 (0.0%) | $0 |
| 7+ Person Families | 0 (0.0%) | $0 |
| Total | 202 (100.0%) | $80,577 |
Family Income by Number of Earners in Happy Valley
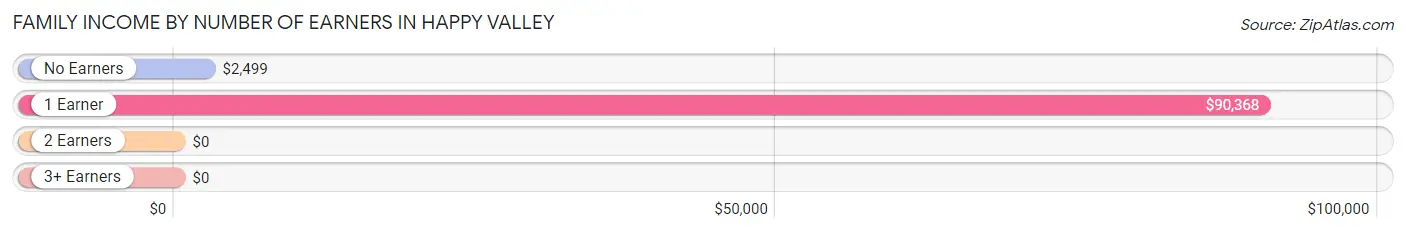
| Number of Earners | # Families | Median Income |
| No Earners | 57 (28.2%) | $2,499 |
| 1 Earner | 86 (42.6%) | $90,368 |
| 2 Earners | 17 (8.4%) | $0 |
| 3+ Earners | 42 (20.8%) | $0 |
| Total | 202 (100.0%) | $80,577 |
Household Income in Happy Valley
Household Income Brackets in Happy Valley
With 88 households falling in the category, the $75,000 to $99,999 income range is the most frequent in Happy Valley, accounting for 30.7% of all households.
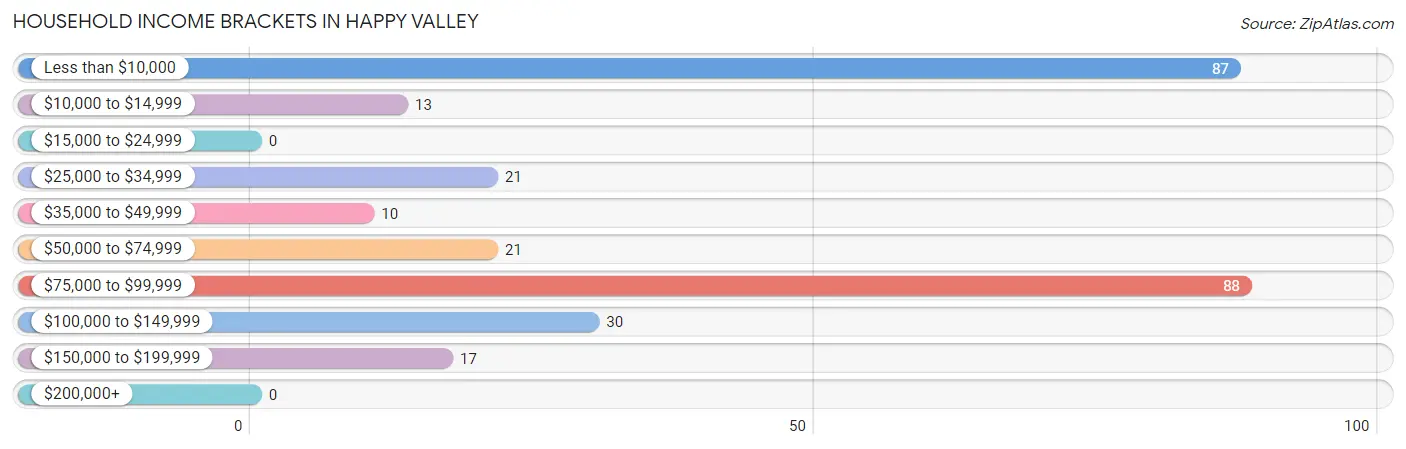
| Income Bracket | # Households | % Households |
| Less than $10,000 | 87 | 30.3% |
| $10,000 to $14,999 | 13 | 4.5% |
| $15,000 to $24,999 | 0 | 0.0% |
| $25,000 to $34,999 | 21 | 7.3% |
| $35,000 to $49,999 | 10 | 3.5% |
| $50,000 to $74,999 | 21 | 7.3% |
| $75,000 to $99,999 | 88 | 30.7% |
| $100,000 to $149,999 | 30 | 10.5% |
| $150,000 to $199,999 | 17 | 5.9% |
| $200,000+ | 0 | 0.0% |
Household Income by Householder Age in Happy Valley
The median household income in Happy Valley is $61,083, with the highest median household income of $91,581 found in the 25 to 44 years age bracket for the primary householder. A total of 91 households (31.7%) fall into this category.
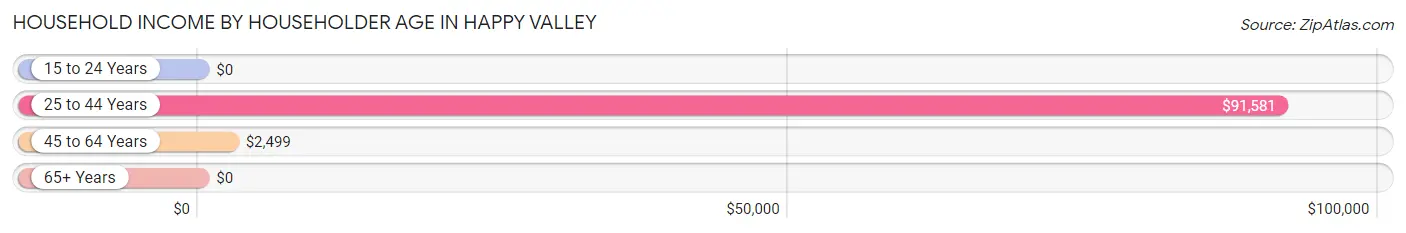
| Income Bracket | # Households | Median Income |
| 15 to 24 Years | 0 (0.0%) | $0 |
| 25 to 44 Years | 91 (31.7%) | $91,581 |
| 45 to 64 Years | 135 (47.0%) | $2,499 |
| 65+ Years | 61 (21.2%) | $0 |
| Total | 287 (100.0%) | $61,083 |
Poverty in Happy Valley
Income Below Poverty by Sex and Age in Happy Valley
With 24.6% poverty level for males and 43.4% for females among the residents of Happy Valley, 6 to 11 year old males and 18 to 24 year old females are the most vulnerable to poverty, with 10 males (100.0%) and 13 females (100.0%) in their respective age groups living below the poverty level.
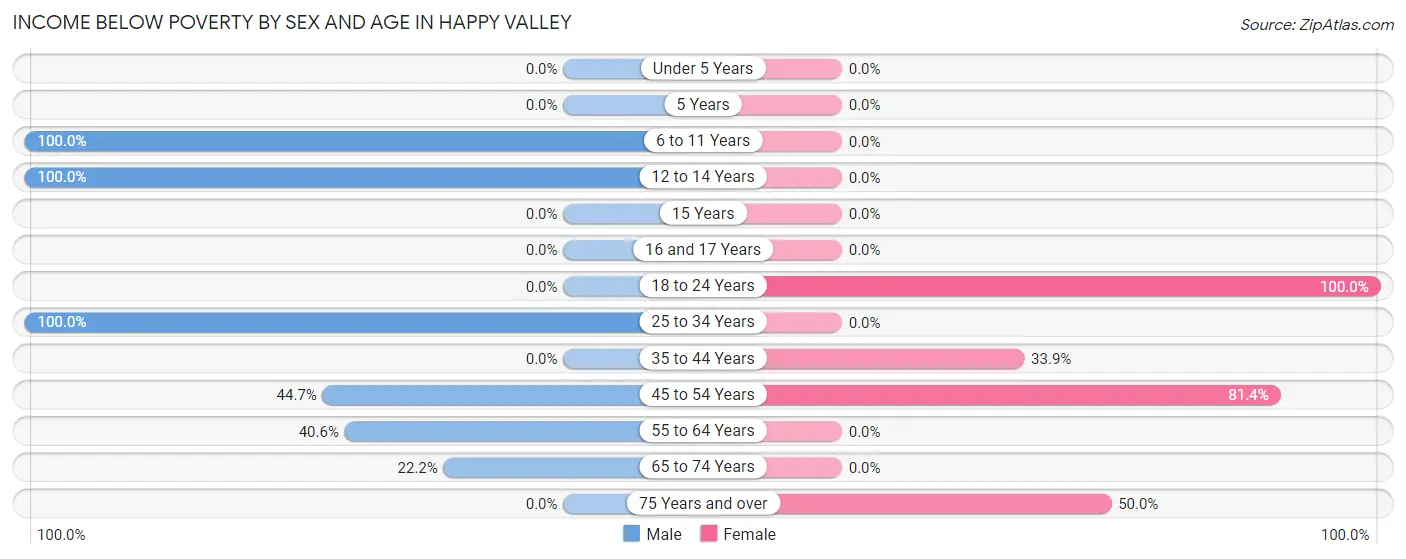
| Age Bracket | Male | Female |
| Under 5 Years | 0 (0.0%) | 0 (0.0%) |
| 5 Years | 0 (0.0%) | 0 (0.0%) |
| 6 to 11 Years | 10 (100.0%) | 0 (0.0%) |
| 12 to 14 Years | 10 (100.0%) | 0 (0.0%) |
| 15 Years | 0 (0.0%) | 0 (0.0%) |
| 16 and 17 Years | 0 (0.0%) | 0 (0.0%) |
| 18 to 24 Years | 0 (0.0%) | 13 (100.0%) |
| 25 to 34 Years | 13 (100.0%) | 0 (0.0%) |
| 35 to 44 Years | 0 (0.0%) | 22 (33.9%) |
| 45 to 54 Years | 21 (44.7%) | 79 (81.4%) |
| 55 to 64 Years | 28 (40.6%) | 0 (0.0%) |
| 65 to 74 Years | 6 (22.2%) | 0 (0.0%) |
| 75 Years and over | 0 (0.0%) | 4 (50.0%) |
| Total | 88 (24.6%) | 118 (43.4%) |
Income Above Poverty by Sex and Age in Happy Valley
According to the poverty statistics in Happy Valley, males aged under 5 years and females aged 6 to 11 years are the age groups that are most secure financially, with 100.0% of males and 100.0% of females in these age groups living above the poverty line.
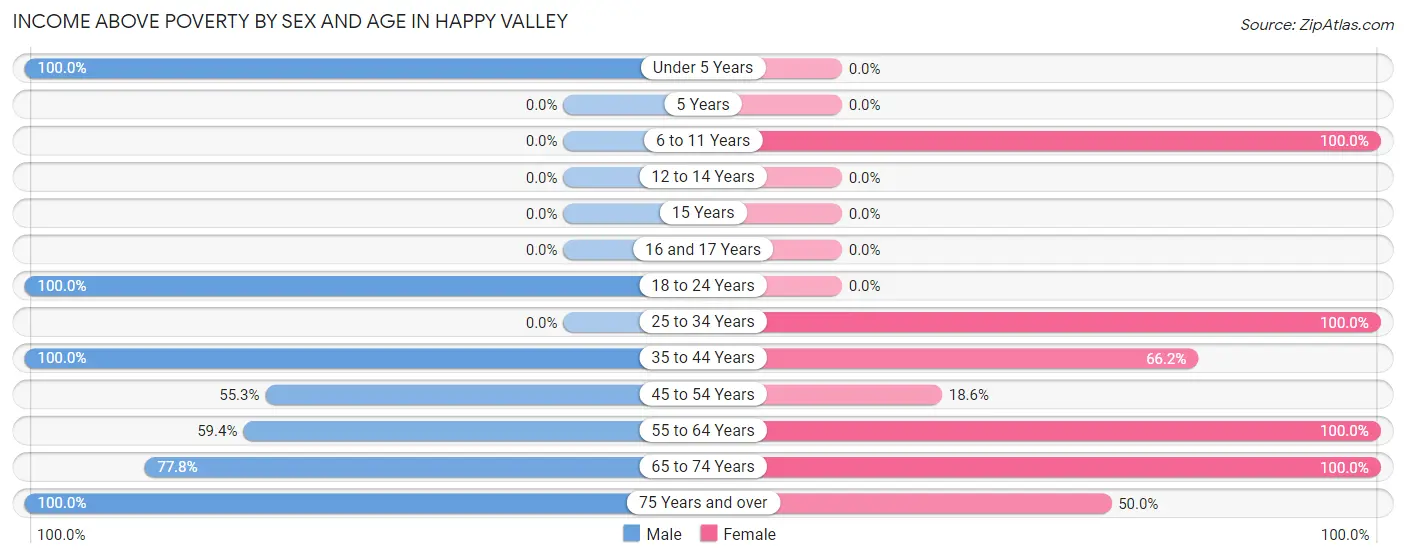
| Age Bracket | Male | Female |
| Under 5 Years | 19 (100.0%) | 0 (0.0%) |
| 5 Years | 0 (0.0%) | 0 (0.0%) |
| 6 to 11 Years | 0 (0.0%) | 10 (100.0%) |
| 12 to 14 Years | 0 (0.0%) | 0 (0.0%) |
| 15 Years | 0 (0.0%) | 0 (0.0%) |
| 16 and 17 Years | 0 (0.0%) | 0 (0.0%) |
| 18 to 24 Years | 95 (100.0%) | 0 (0.0%) |
| 25 to 34 Years | 0 (0.0%) | 16 (100.0%) |
| 35 to 44 Years | 59 (100.0%) | 43 (66.1%) |
| 45 to 54 Years | 26 (55.3%) | 18 (18.6%) |
| 55 to 64 Years | 41 (59.4%) | 25 (100.0%) |
| 65 to 74 Years | 21 (77.8%) | 38 (100.0%) |
| 75 Years and over | 8 (100.0%) | 4 (50.0%) |
| Total | 269 (75.3%) | 154 (56.6%) |
Income Below Poverty Among Married-Couple Families in Happy Valley
The poverty statistics for married-couple families in Happy Valley show that 37.1% or 49 of the total 132 families live below the poverty line. Families with no children have the highest poverty rate of 37.1%, comprising of 49 families. On the other hand, families with no children have the lowest poverty rate of 37.1%, which includes 49 families.
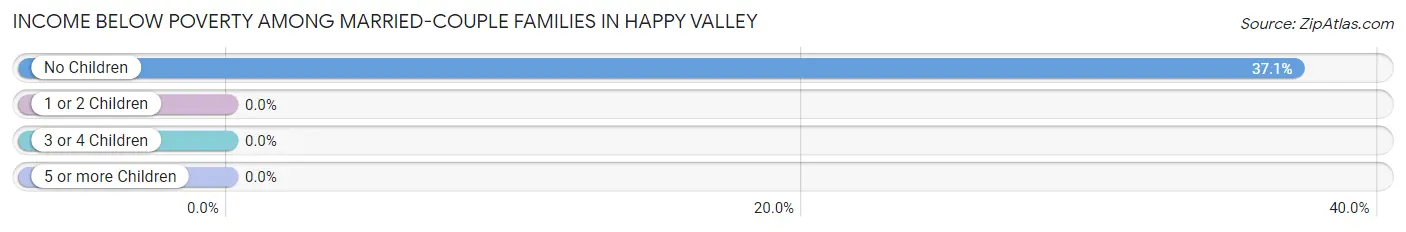
| Children | Above Poverty | Below Poverty |
| No Children | 83 (62.9%) | 49 (37.1%) |
| 1 or 2 Children | 0 (0.0%) | 0 (0.0%) |
| 3 or 4 Children | 0 (0.0%) | 0 (0.0%) |
| 5 or more Children | 0 (0.0%) | 0 (0.0%) |
| Total | 83 (62.9%) | 49 (37.1%) |
Income Below Poverty Among Single-Parent Households in Happy Valley
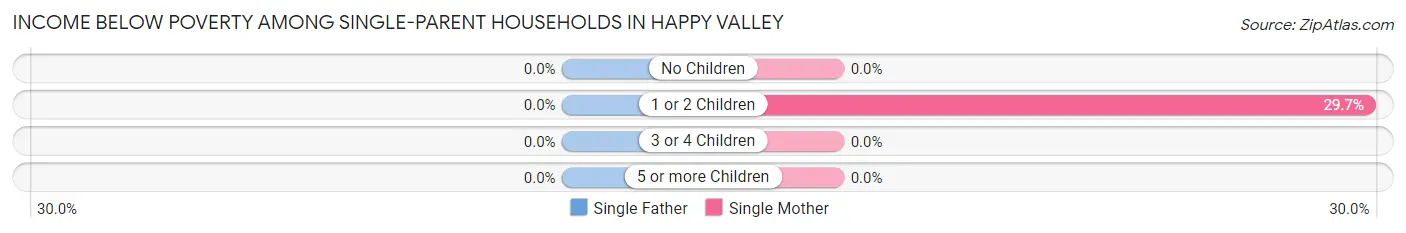
| Children | Single Father | Single Mother |
| No Children | 0 (0.0%) | 0 (0.0%) |
| 1 or 2 Children | 0 (0.0%) | 11 (29.7%) |
| 3 or 4 Children | 0 (0.0%) | 0 (0.0%) |
| 5 or more Children | 0 (0.0%) | 0 (0.0%) |
| Total | 0 (0.0%) | 11 (29.7%) |
Income Below Poverty Among Married-Couple vs Single-Parent Households in Happy Valley
The poverty data for Happy Valley shows that 49 of the married-couple family households (37.1%) and 11 of the single-parent households (15.7%) are living below the poverty level. Within the married-couple family households, those with no children have the highest poverty rate, with 49 households (37.1%) falling below the poverty line. Among the single-parent households, those with 1 or 2 children have the highest poverty rate, with 11 household (29.7%) living below poverty.
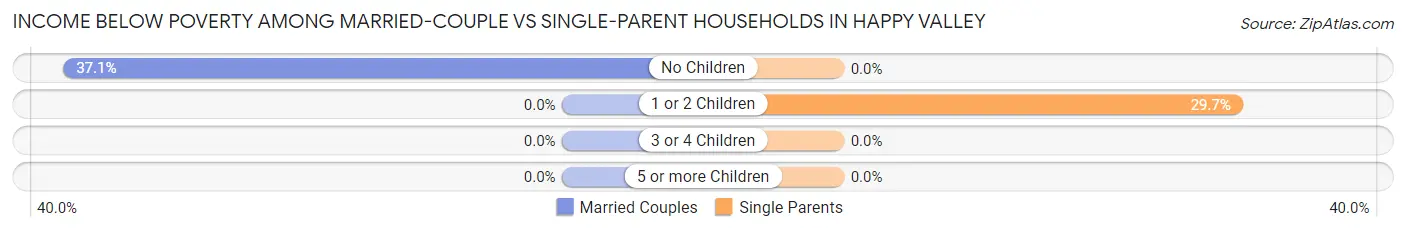
| Children | Married-Couple Families | Single-Parent Households |
| No Children | 49 (37.1%) | 0 (0.0%) |
| 1 or 2 Children | 0 (0.0%) | 11 (29.7%) |
| 3 or 4 Children | 0 (0.0%) | 0 (0.0%) |
| 5 or more Children | 0 (0.0%) | 0 (0.0%) |
| Total | 49 (37.1%) | 11 (15.7%) |
Race in Happy Valley
The most populous races in Happy Valley are White / Caucasian (539 | 85.7%), Hispanic or Latino (227 | 36.1%), and Some other Race (53 | 8.4%).
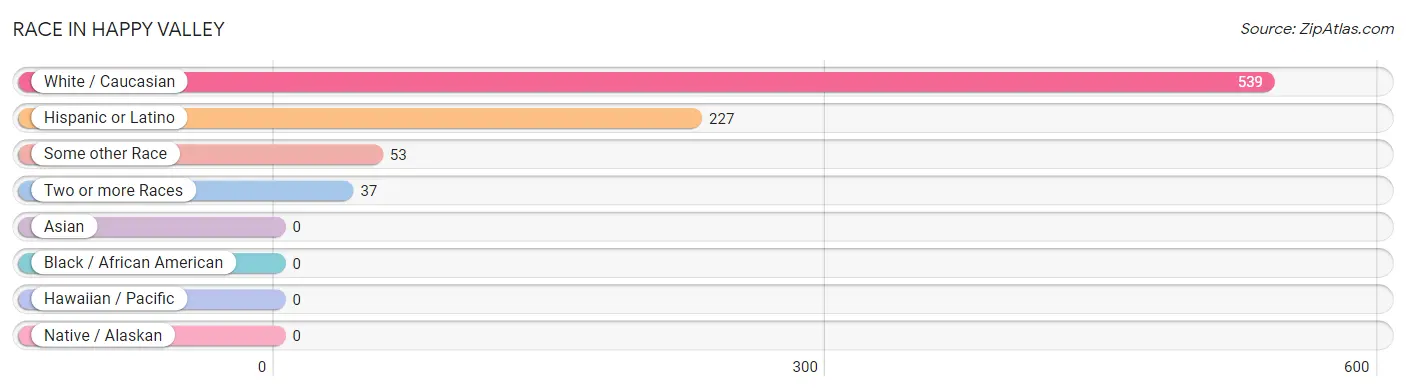
| Race | # Population | % Population |
| Asian | 0 | 0.0% |
| Black / African American | 0 | 0.0% |
| Hawaiian / Pacific | 0 | 0.0% |
| Hispanic or Latino | 227 | 36.1% |
| Native / Alaskan | 0 | 0.0% |
| White / Caucasian | 539 | 85.7% |
| Two or more Races | 37 | 5.9% |
| Some other Race | 53 | 8.4% |
| Total | 629 | 100.0% |
Ancestry in Happy Valley
The most populous ancestries reported in Happy Valley are Mexican (227 | 36.1%), American (84 | 13.4%), Irish (67 | 10.6%), German (45 | 7.1%), and English (34 | 5.4%), together accounting for 72.7% of all Happy Valley residents.
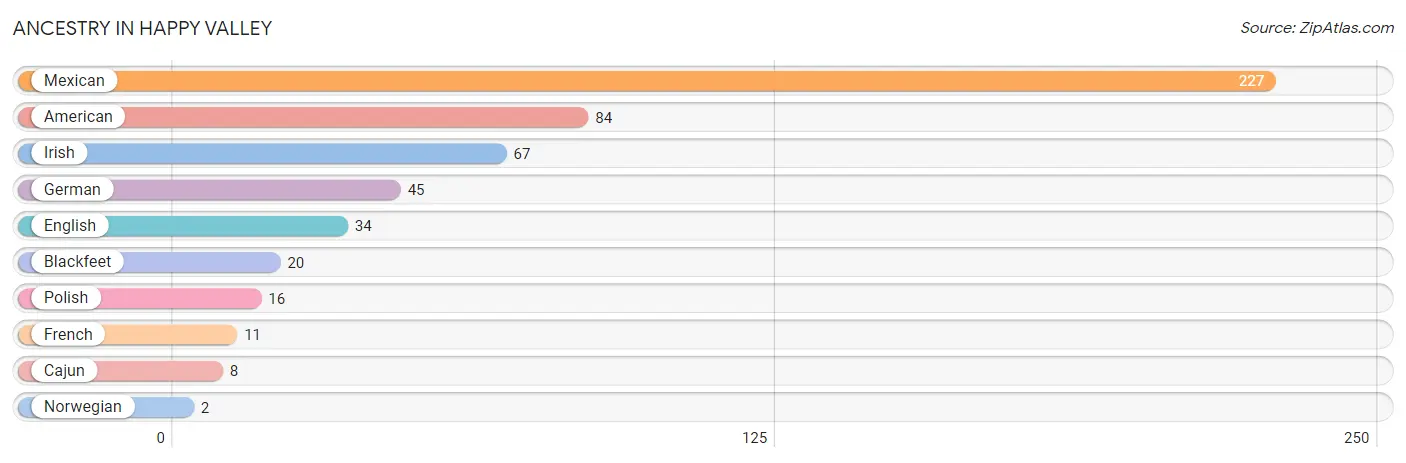
| Ancestry | # Population | % Population |
| American | 84 | 13.4% |
| Blackfeet | 20 | 3.2% |
| Cajun | 8 | 1.3% |
| English | 34 | 5.4% |
| French | 11 | 1.8% |
| German | 45 | 7.1% |
| Irish | 67 | 10.6% |
| Mexican | 227 | 36.1% |
| Norwegian | 2 | 0.3% |
| Polish | 16 | 2.5% | View All 10 Rows |
Immigrants in Happy Valley
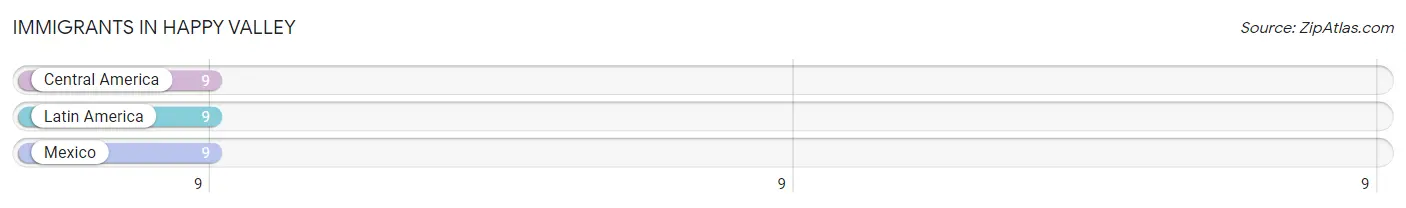
The most numerous immigrant groups reported in Happy Valley came from Central America (9 | 1.4%), Latin America (9 | 1.4%), and Mexico (9 | 1.4%), together accounting for 4.3% of all Happy Valley residents.
| Immigration Origin | # Population | % Population |
| Central America | 9 | 1.4% |
| Latin America | 9 | 1.4% |
| Mexico | 9 | 1.4% | View All 3 Rows |
Sex and Age in Happy Valley
Sex and Age in Happy Valley
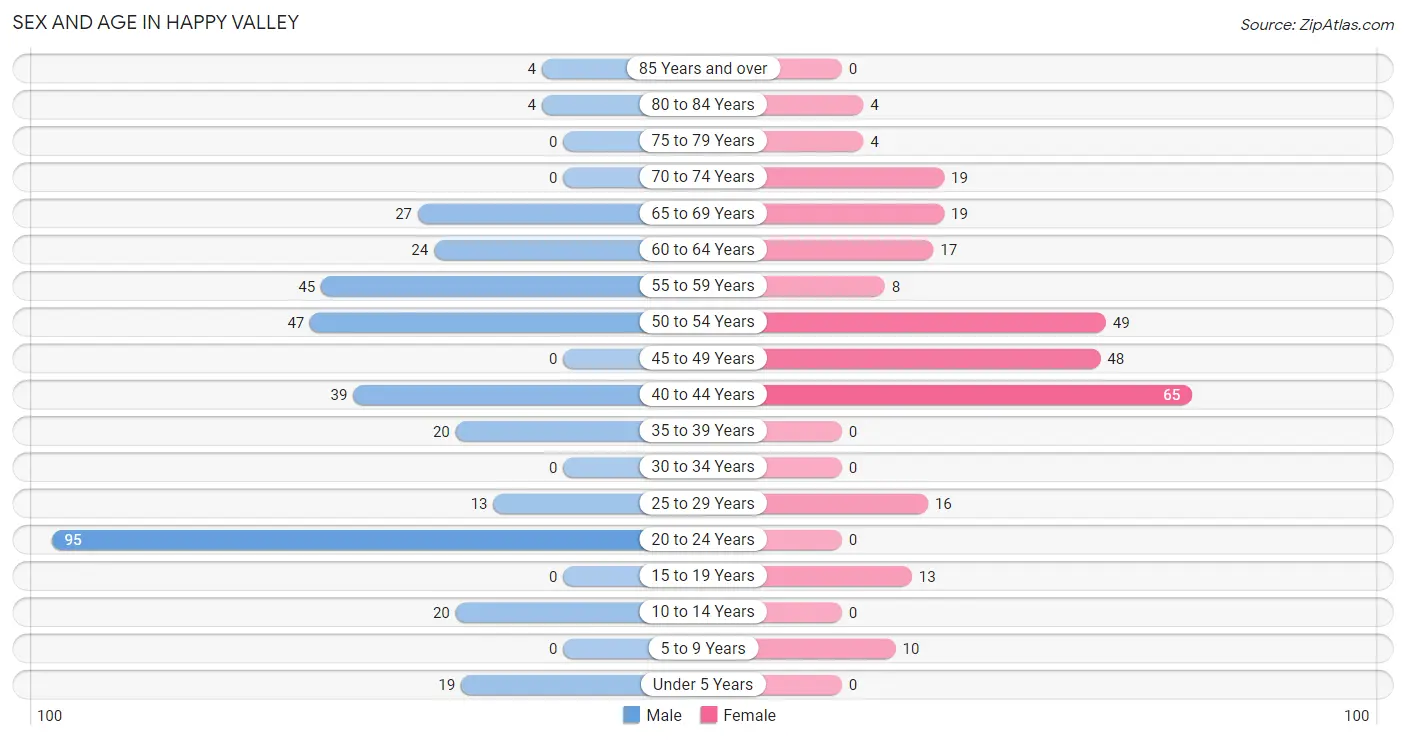
The most populous age groups in Happy Valley are 20 to 24 Years (95 | 26.6%) for men and 40 to 44 Years (65 | 23.9%) for women.
| Age Bracket | Male | Female |
| Under 5 Years | 19 (5.3%) | 0 (0.0%) |
| 5 to 9 Years | 0 (0.0%) | 10 (3.7%) |
| 10 to 14 Years | 20 (5.6%) | 0 (0.0%) |
| 15 to 19 Years | 0 (0.0%) | 13 (4.8%) |
| 20 to 24 Years | 95 (26.6%) | 0 (0.0%) |
| 25 to 29 Years | 13 (3.6%) | 16 (5.9%) |
| 30 to 34 Years | 0 (0.0%) | 0 (0.0%) |
| 35 to 39 Years | 20 (5.6%) | 0 (0.0%) |
| 40 to 44 Years | 39 (10.9%) | 65 (23.9%) |
| 45 to 49 Years | 0 (0.0%) | 48 (17.6%) |
| 50 to 54 Years | 47 (13.2%) | 49 (18.0%) |
| 55 to 59 Years | 45 (12.6%) | 8 (2.9%) |
| 60 to 64 Years | 24 (6.7%) | 17 (6.2%) |
| 65 to 69 Years | 27 (7.6%) | 19 (7.0%) |
| 70 to 74 Years | 0 (0.0%) | 19 (7.0%) |
| 75 to 79 Years | 0 (0.0%) | 4 (1.5%) |
| 80 to 84 Years | 4 (1.1%) | 4 (1.5%) |
| 85 Years and over | 4 (1.1%) | 0 (0.0%) |
| Total | 357 (100.0%) | 272 (100.0%) |
Families and Households in Happy Valley
Median Family Size in Happy Valley
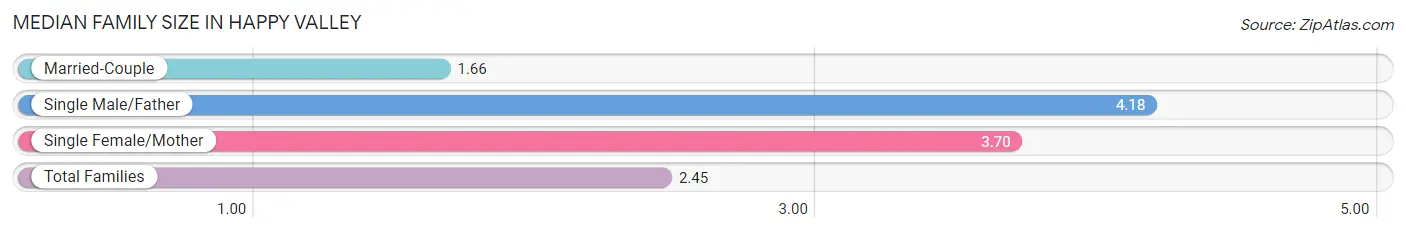
The median family size in Happy Valley is 2.45 persons per family, with single male/father families (33 | 16.3%) accounting for the largest median family size of 4.18 persons per family. On the other hand, married-couple families (132 | 65.3%) represent the smallest median family size with 1.66 persons per family.
| Family Type | # Families | Family Size |
| Married-Couple | 132 (65.3%) | 1.66 |
| Single Male/Father | 33 (16.3%) | 4.18 |
| Single Female/Mother | 37 (18.3%) | 3.70 |
| Total Families | 202 (100.0%) | 2.45 |
Median Household Size in Happy Valley
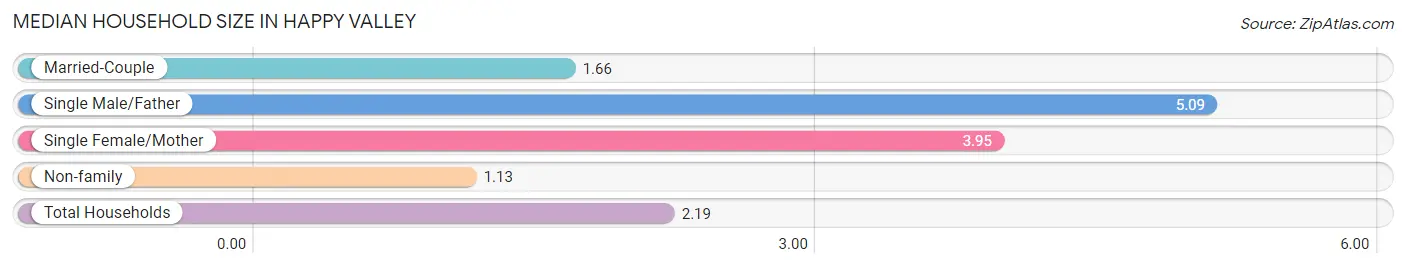
The median household size in Happy Valley is 2.19 persons per household, with single male/father households (33 | 11.5%) accounting for the largest median household size of 5.09 persons per household. non-family households (85 | 29.6%) represent the smallest median household size with 1.13 persons per household.
| Household Type | # Households | Household Size |
| Married-Couple | 132 (46.0%) | 1.66 |
| Single Male/Father | 33 (11.5%) | 5.09 |
| Single Female/Mother | 37 (12.9%) | 3.95 |
| Non-family | 85 (29.6%) | 1.13 |
| Total Households | 287 (100.0%) | 2.19 |
Household Size by Marriage Status in Happy Valley
Out of a total of 287 households in Happy Valley, 202 (70.4%) are family households, while 85 (29.6%) are nonfamily households. The most numerous type of family households are 2-person households, comprising 139, and the most common type of nonfamily households are 1-person households, comprising 66.
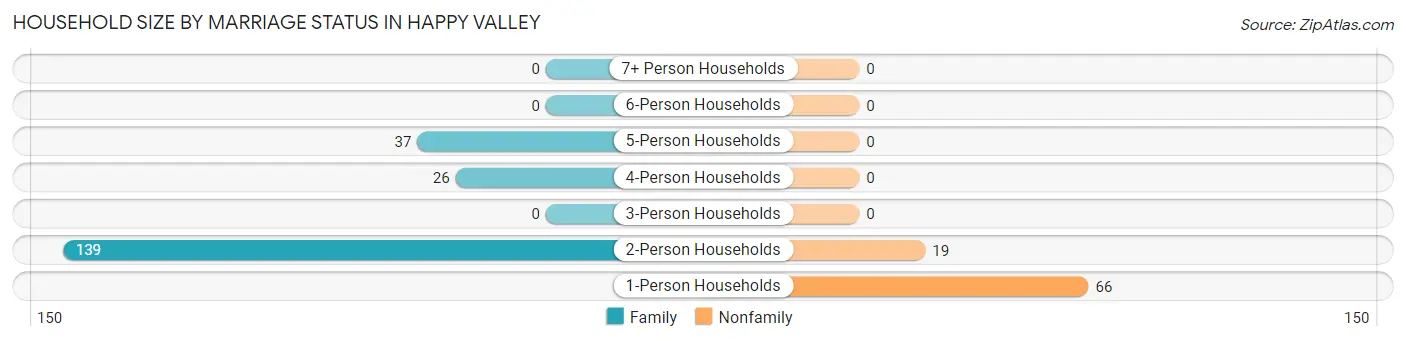
| Household Size | Family Households | Nonfamily Households |
| 1-Person Households | - | 66 (23.0%) |
| 2-Person Households | 139 (48.4%) | 19 (6.6%) |
| 3-Person Households | 0 (0.0%) | 0 (0.0%) |
| 4-Person Households | 26 (9.1%) | 0 (0.0%) |
| 5-Person Households | 37 (12.9%) | 0 (0.0%) |
| 6-Person Households | 0 (0.0%) | 0 (0.0%) |
| 7+ Person Households | 0 (0.0%) | 0 (0.0%) |
| Total | 202 (70.4%) | 85 (29.6%) |
Female Fertility in Happy Valley
Fertility by Age in Happy Valley
| Age Bracket | Women with Births | Births / 1,000 Women |
| 15 to 19 years | 0 (0.0%) | 0.0 |
| 20 to 34 years | 0 (0.0%) | 0.0 |
| 35 to 50 years | 0 (0.0%) | 0.0 |
| Total | 0 (0.0%) | 0.0 |
Fertility by Age by Marriage Status in Happy Valley
| Age Bracket | Married | Unmarried |
| 15 to 19 years | 0 (0.0%) | 0 (0.0%) |
| 20 to 34 years | 0 (0.0%) | 0 (0.0%) |
| 35 to 50 years | 0 (0.0%) | 0 (0.0%) |
| Total | 0 (0.0%) | 0 (0.0%) |
Fertility by Education in Happy Valley
| Educational Attainment | Women with Births | Births / 1,000 Women |
| Less than High School | 0 (0.0%) | 0.0 |
| High School Diploma | 0 (0.0%) | 0.0 |
| College or Associate's Degree | 0 (0.0%) | 0.0 |
| Bachelor's Degree | 0 (0.0%) | 0.0 |
| Graduate Degree | 0 (0.0%) | 0.0 |
| Total | 0 (0.0%) | 0.0 |
Fertility by Education by Marriage Status in Happy Valley
| Educational Attainment | Married | Unmarried |
| Less than High School | 0 (0.0%) | 0 (0.0%) |
| High School Diploma | 0 (0.0%) | 0 (0.0%) |
| College or Associate's Degree | 0 (0.0%) | 0 (0.0%) |
| Bachelor's Degree | 0 (0.0%) | 0 (0.0%) |
| Graduate Degree | 0 (0.0%) | 0 (0.0%) |
| Total | 0 (0.0%) | 0 (0.0%) |
Employment Characteristics in Happy Valley
Employment by Class of Employer in Happy Valley
Among the 194 employed individuals in Happy Valley, private company employees (158 | 81.4%), self-employed (not incorporated) (19 | 9.8%), and federal government employees (17 | 8.8%) make up the most common classes of employment.
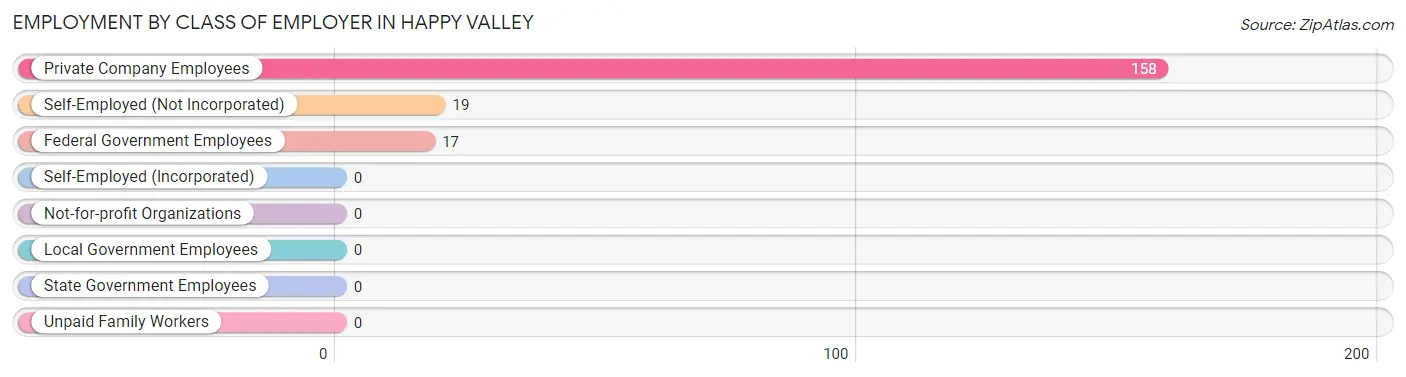
| Employer Class | # Employees | % Employees |
| Private Company Employees | 158 | 81.4% |
| Self-Employed (Incorporated) | 0 | 0.0% |
| Self-Employed (Not Incorporated) | 19 | 9.8% |
| Not-for-profit Organizations | 0 | 0.0% |
| Local Government Employees | 0 | 0.0% |
| State Government Employees | 0 | 0.0% |
| Federal Government Employees | 17 | 8.8% |
| Unpaid Family Workers | 0 | 0.0% |
| Total | 194 | 100.0% |
Employment Status by Age in Happy Valley
According to the labor force statistics for Happy Valley, out of the total population over 16 years of age (580), 43.4% or 252 individuals are in the labor force, with 23.0% or 58 of them unemployed. The age group with the highest labor force participation rate is 16 to 19 years, with 100.0% or 13 individuals in the labor force. Within the labor force, the 20 to 24 years age range has the highest percentage of unemployed individuals, with 100.0% or 31 of them being unemployed.
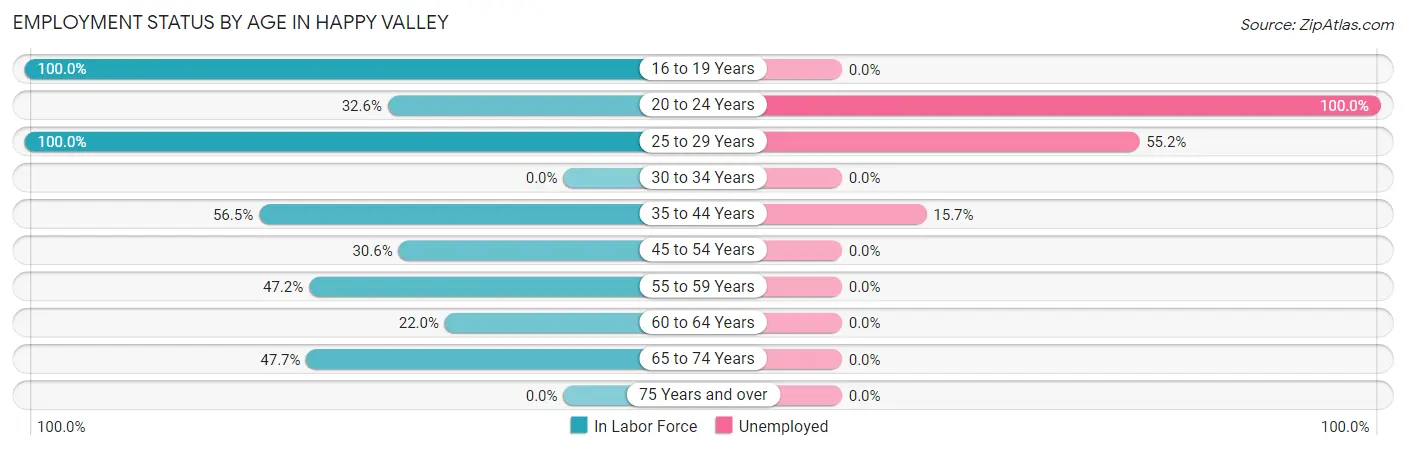
| Age Bracket | In Labor Force | Unemployed |
| 16 to 19 Years | 13 (100.0%) | 0 (0.0%) |
| 20 to 24 Years | 31 (32.6%) | 31 (100.0%) |
| 25 to 29 Years | 29 (100.0%) | 16 (55.2%) |
| 30 to 34 Years | 0 (0.0%) | 0 (0.0%) |
| 35 to 44 Years | 70 (56.5%) | 11 (15.7%) |
| 45 to 54 Years | 44 (30.6%) | 0 (0.0%) |
| 55 to 59 Years | 25 (47.2%) | 0 (0.0%) |
| 60 to 64 Years | 9 (22.0%) | 0 (0.0%) |
| 65 to 74 Years | 31 (47.7%) | 0 (0.0%) |
| 75 Years and over | 0 (0.0%) | 0 (0.0%) |
| Total | 252 (43.4%) | 58 (23.0%) |
Employment Status by Educational Attainment in Happy Valley
According to labor force statistics for Happy Valley, 45.3% of individuals (177) out of the total population between 25 and 64 years of age (391) are in the labor force, with 15.3% or 27 of them being unemployed. The group with the highest labor force participation rate are those with the educational attainment of bachelor's degree or higher, with 100.0% or 17 individuals in the labor force. Within the labor force, individuals with high school diploma education have the highest percentage of unemployment, with 34.0% or 16 of them being unemployed.
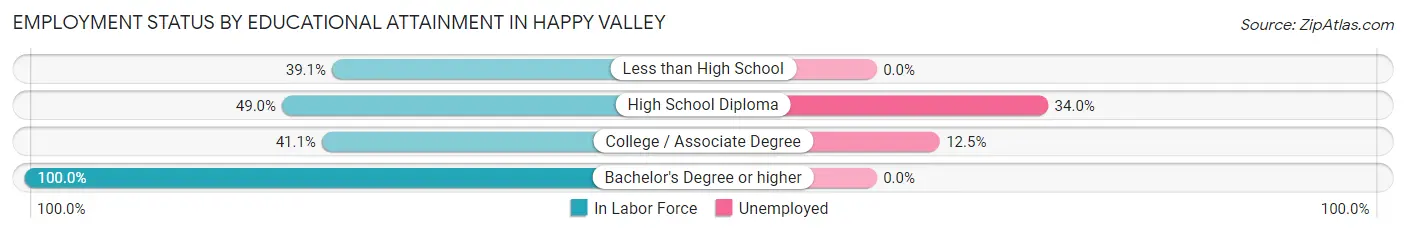
| Educational Attainment | In Labor Force | Unemployed |
| Less than High School | 25 (39.1%) | 0 (0.0%) |
| High School Diploma | 47 (49.0%) | 33 (34.0%) |
| College / Associate Degree | 88 (41.1%) | 27 (12.5%) |
| Bachelor's Degree or higher | 17 (100.0%) | 0 (0.0%) |
| Total | 177 (45.3%) | 60 (15.3%) |
Employment Occupations by Sex in Happy Valley
Management, Business, Science and Arts Occupations
The most common Management, Business, Science and Arts occupations in Happy Valley are Management (35 | 18.0%), Community & Social Service (19 | 9.8%), and Arts, Media & Entertainment (19 | 9.8%).
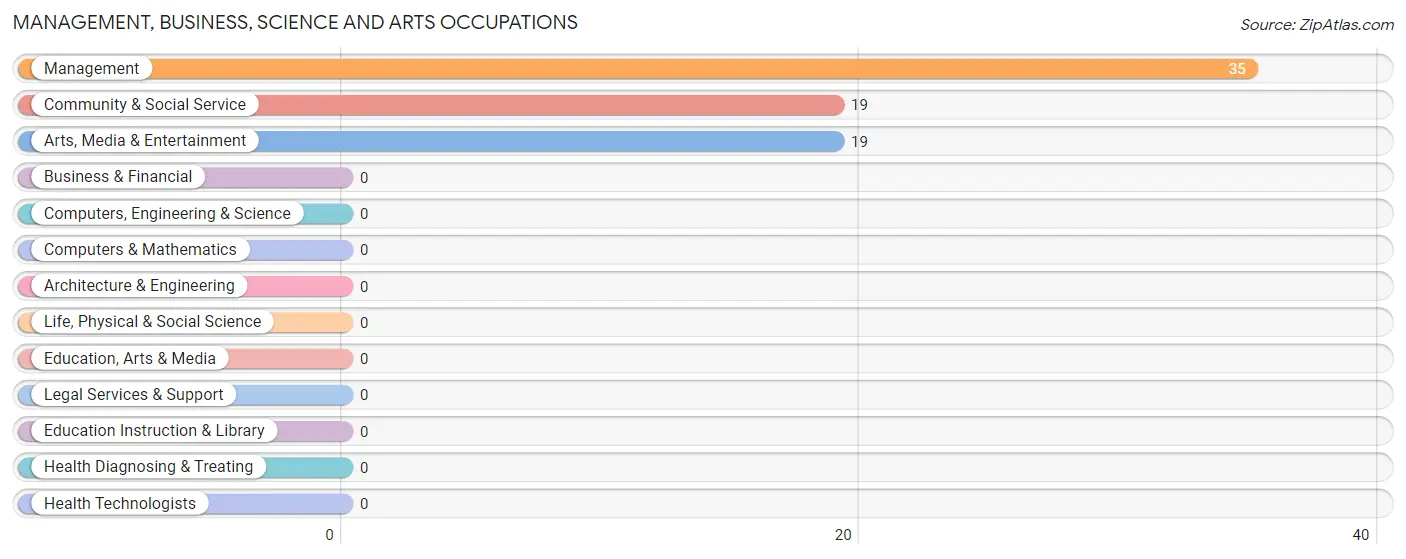
Management, Business, Science and Arts Occupations by Sex
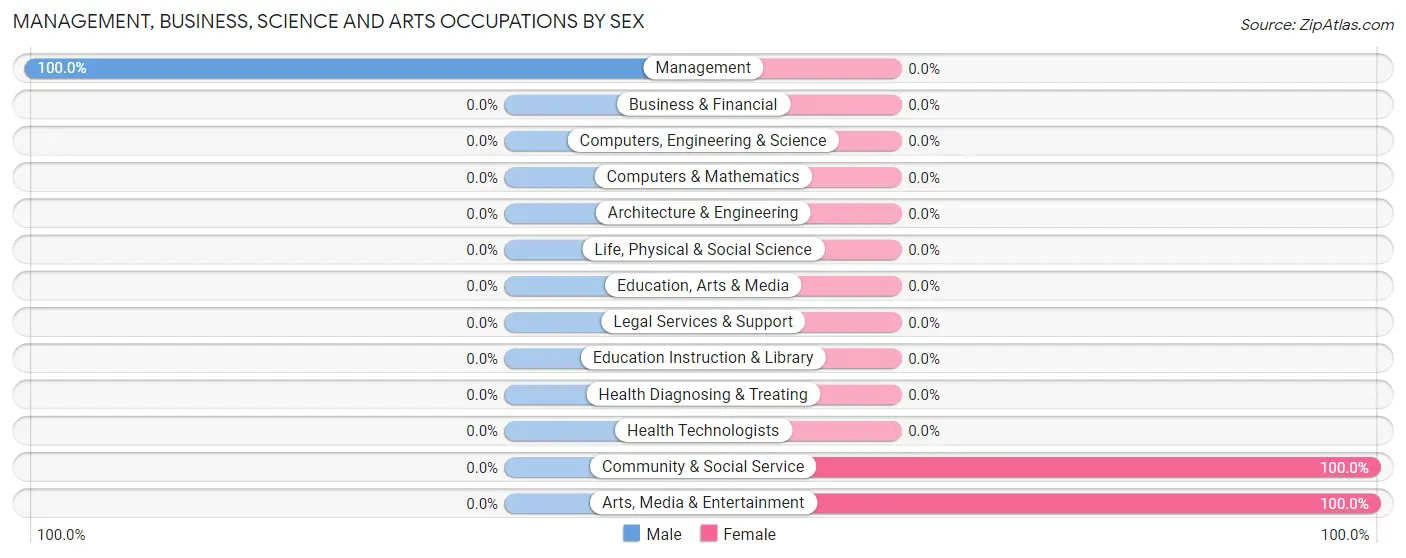
| Occupation | Male | Female |
| Management | 35 (100.0%) | 0 (0.0%) |
| Business & Financial | 0 (0.0%) | 0 (0.0%) |
| Computers, Engineering & Science | 0 (0.0%) | 0 (0.0%) |
| Computers & Mathematics | 0 (0.0%) | 0 (0.0%) |
| Architecture & Engineering | 0 (0.0%) | 0 (0.0%) |
| Life, Physical & Social Science | 0 (0.0%) | 0 (0.0%) |
| Community & Social Service | 0 (0.0%) | 19 (100.0%) |
| Education, Arts & Media | 0 (0.0%) | 0 (0.0%) |
| Legal Services & Support | 0 (0.0%) | 0 (0.0%) |
| Education Instruction & Library | 0 (0.0%) | 0 (0.0%) |
| Arts, Media & Entertainment | 0 (0.0%) | 19 (100.0%) |
| Health Diagnosing & Treating | 0 (0.0%) | 0 (0.0%) |
| Health Technologists | 0 (0.0%) | 0 (0.0%) |
| Total (Category) | 35 (64.8%) | 19 (35.2%) |
| Total (Overall) | 136 (70.1%) | 58 (29.9%) |
Services Occupations
The most common Services occupations in Happy Valley are , and Food Preparation & Serving (21 | 10.8%).
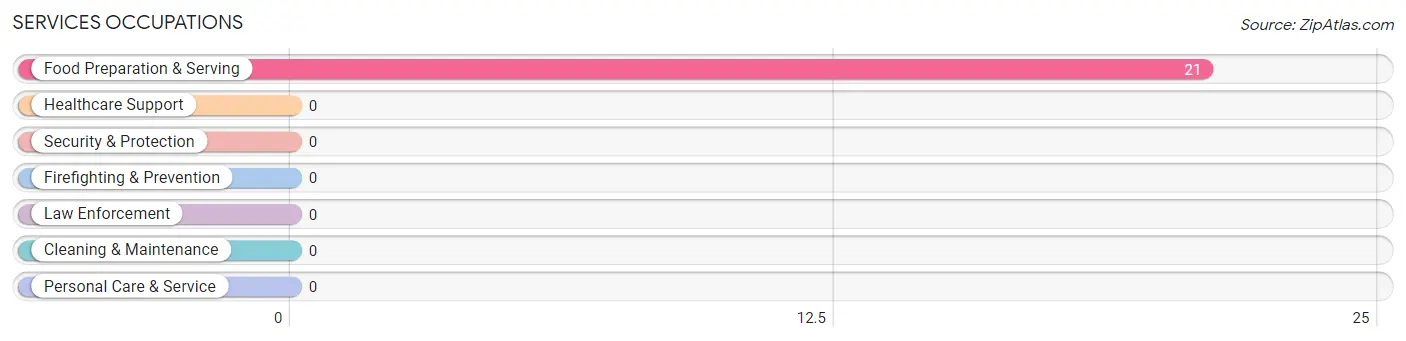
Services Occupations by Sex
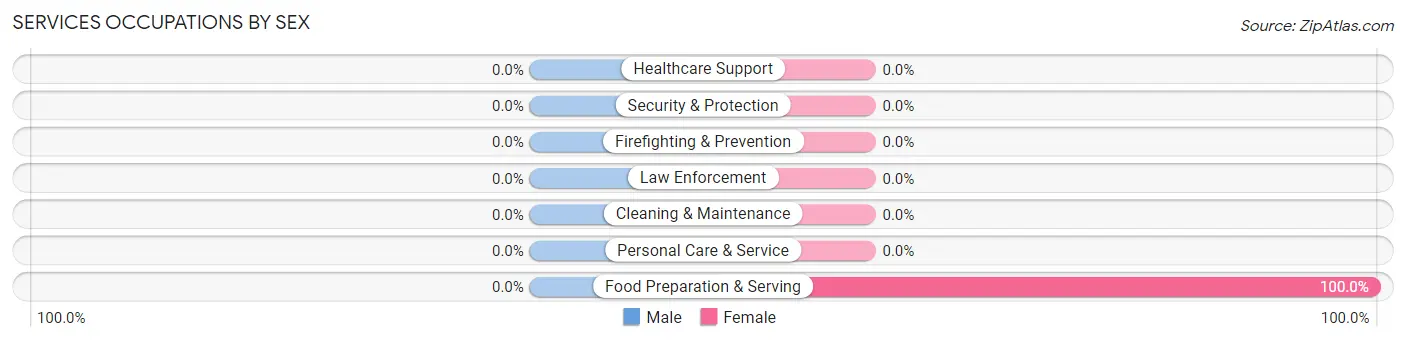
| Occupation | Male | Female |
| Healthcare Support | 0 (0.0%) | 0 (0.0%) |
| Security & Protection | 0 (0.0%) | 0 (0.0%) |
| Firefighting & Prevention | 0 (0.0%) | 0 (0.0%) |
| Law Enforcement | 0 (0.0%) | 0 (0.0%) |
| Food Preparation & Serving | 0 (0.0%) | 21 (100.0%) |
| Cleaning & Maintenance | 0 (0.0%) | 0 (0.0%) |
| Personal Care & Service | 0 (0.0%) | 0 (0.0%) |
| Total (Category) | 0 (0.0%) | 21 (100.0%) |
| Total (Overall) | 136 (70.1%) | 58 (29.9%) |
Sales and Office Occupations
The most common Sales and Office occupations in Happy Valley are , and Office & Administration (18 | 9.3%).
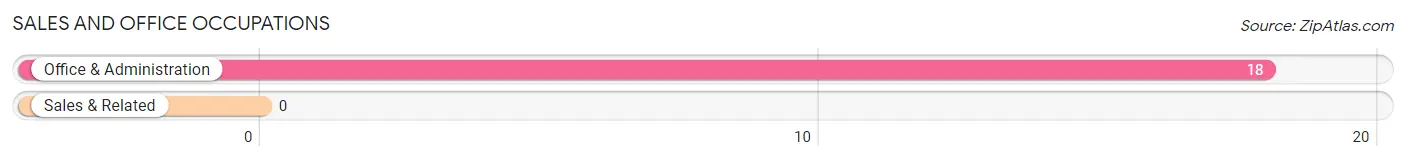
Sales and Office Occupations by Sex
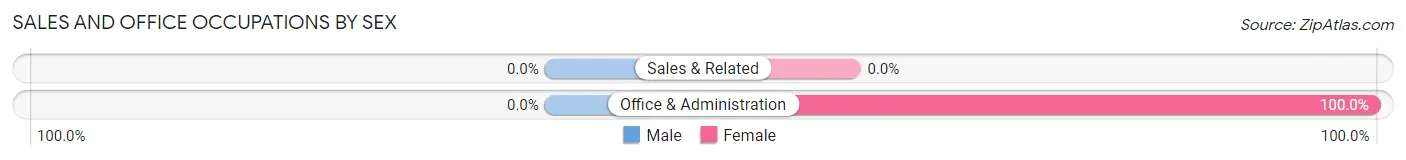
| Occupation | Male | Female |
| Sales & Related | 0 (0.0%) | 0 (0.0%) |
| Office & Administration | 0 (0.0%) | 18 (100.0%) |
| Total (Category) | 0 (0.0%) | 18 (100.0%) |
| Total (Overall) | 136 (70.1%) | 58 (29.9%) |
Natural Resources, Construction and Maintenance Occupations
The most common Natural Resources, Construction and Maintenance occupations in Happy Valley are Construction & Extraction (29 | 14.9%), and Installation, Maintenance & Repair (26 | 13.4%).
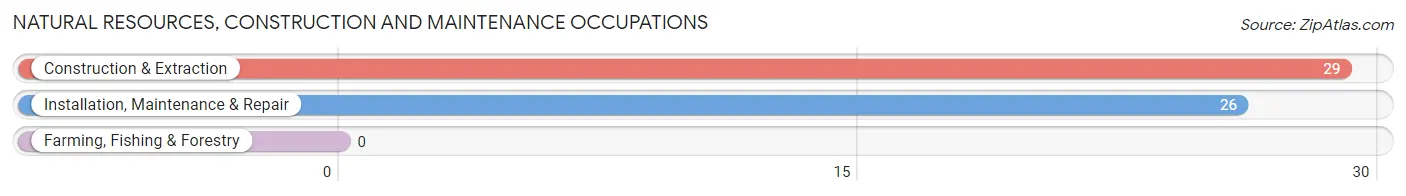
Natural Resources, Construction and Maintenance Occupations by Sex
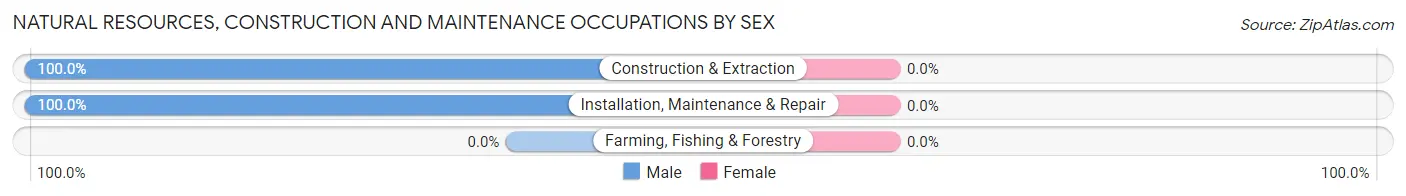
| Occupation | Male | Female |
| Farming, Fishing & Forestry | 0 (0.0%) | 0 (0.0%) |
| Construction & Extraction | 29 (100.0%) | 0 (0.0%) |
| Installation, Maintenance & Repair | 26 (100.0%) | 0 (0.0%) |
| Total (Category) | 55 (100.0%) | 0 (0.0%) |
| Total (Overall) | 136 (70.1%) | 58 (29.9%) |
Production, Transportation and Moving Occupations
The most common Production, Transportation and Moving occupations in Happy Valley are Production (25 | 12.9%), Transportation (12 | 6.2%), and Material Moving (9 | 4.6%).
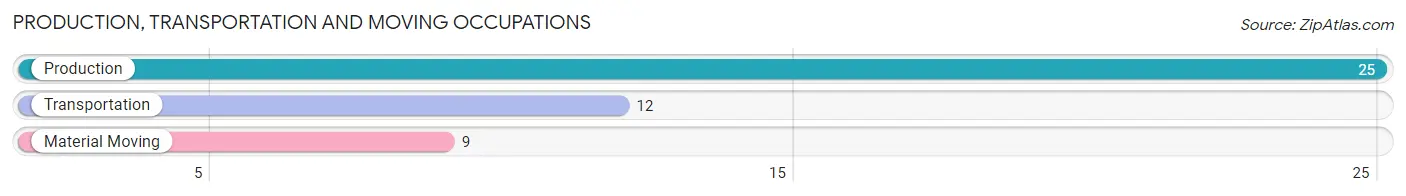
Production, Transportation and Moving Occupations by Sex
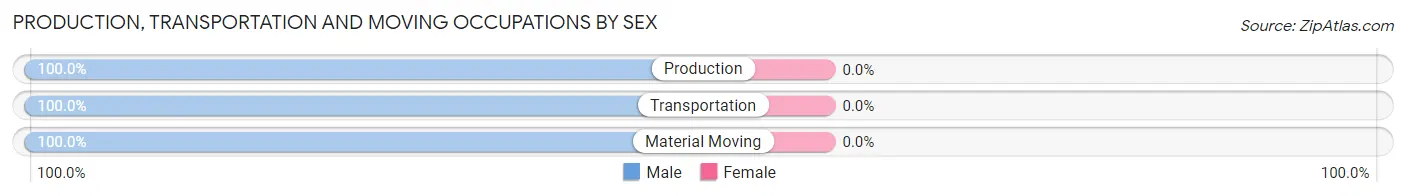
| Occupation | Male | Female |
| Production | 25 (100.0%) | 0 (0.0%) |
| Transportation | 12 (100.0%) | 0 (0.0%) |
| Material Moving | 9 (100.0%) | 0 (0.0%) |
| Total (Category) | 46 (100.0%) | 0 (0.0%) |
| Total (Overall) | 136 (70.1%) | 58 (29.9%) |
Employment Industries by Sex in Happy Valley
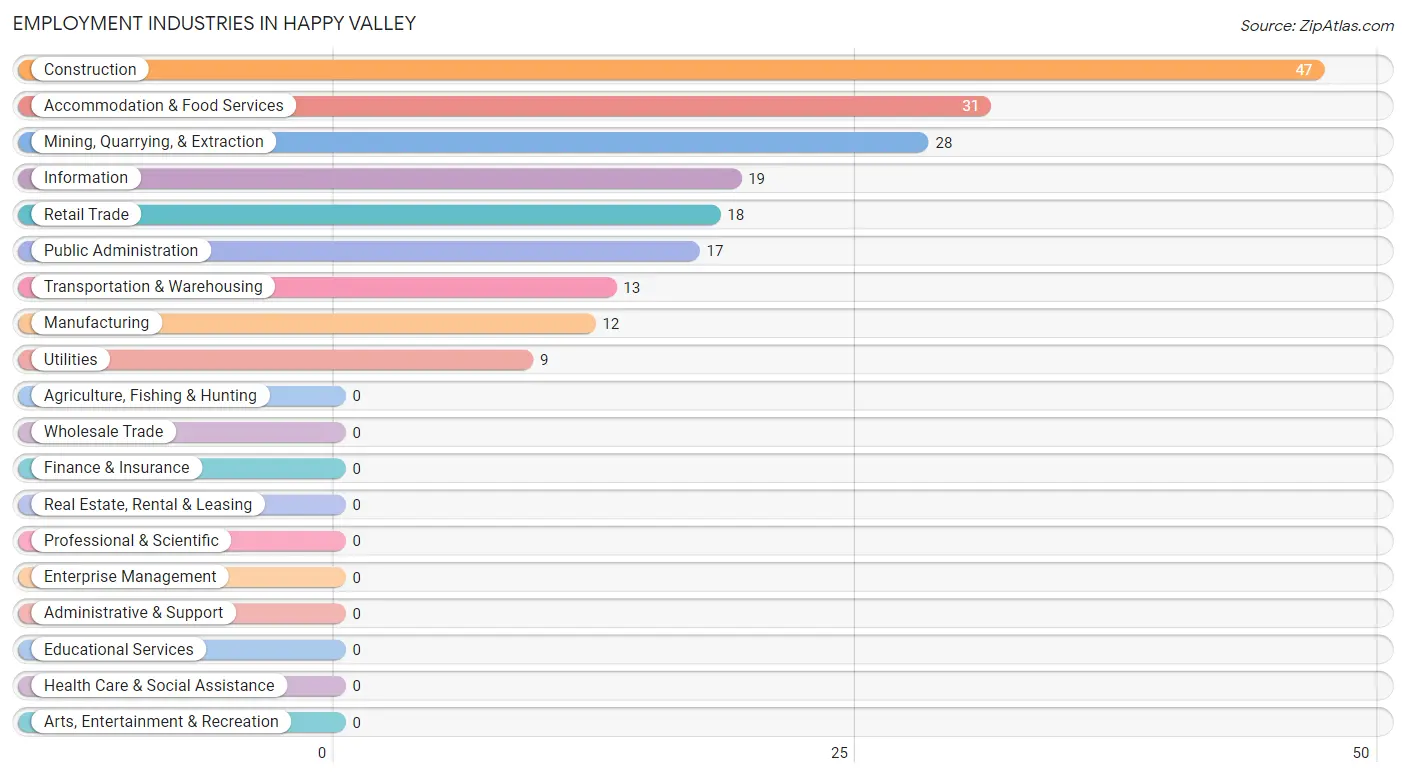
Employment Industries in Happy Valley
The major employment industries in Happy Valley include Construction (47 | 24.2%), Accommodation & Food Services (31 | 16.0%), Mining, Quarrying, & Extraction (28 | 14.4%), Information (19 | 9.8%), and Retail Trade (18 | 9.3%).
Employment Industries by Sex in Happy Valley
The Happy Valley industries that see more men than women are Mining, Quarrying, & Extraction (100.0%), Construction (100.0%), and Manufacturing (100.0%), whereas the industries that tend to have a higher number of women are Retail Trade (100.0%), Information (100.0%), and Accommodation & Food Services (67.7%).
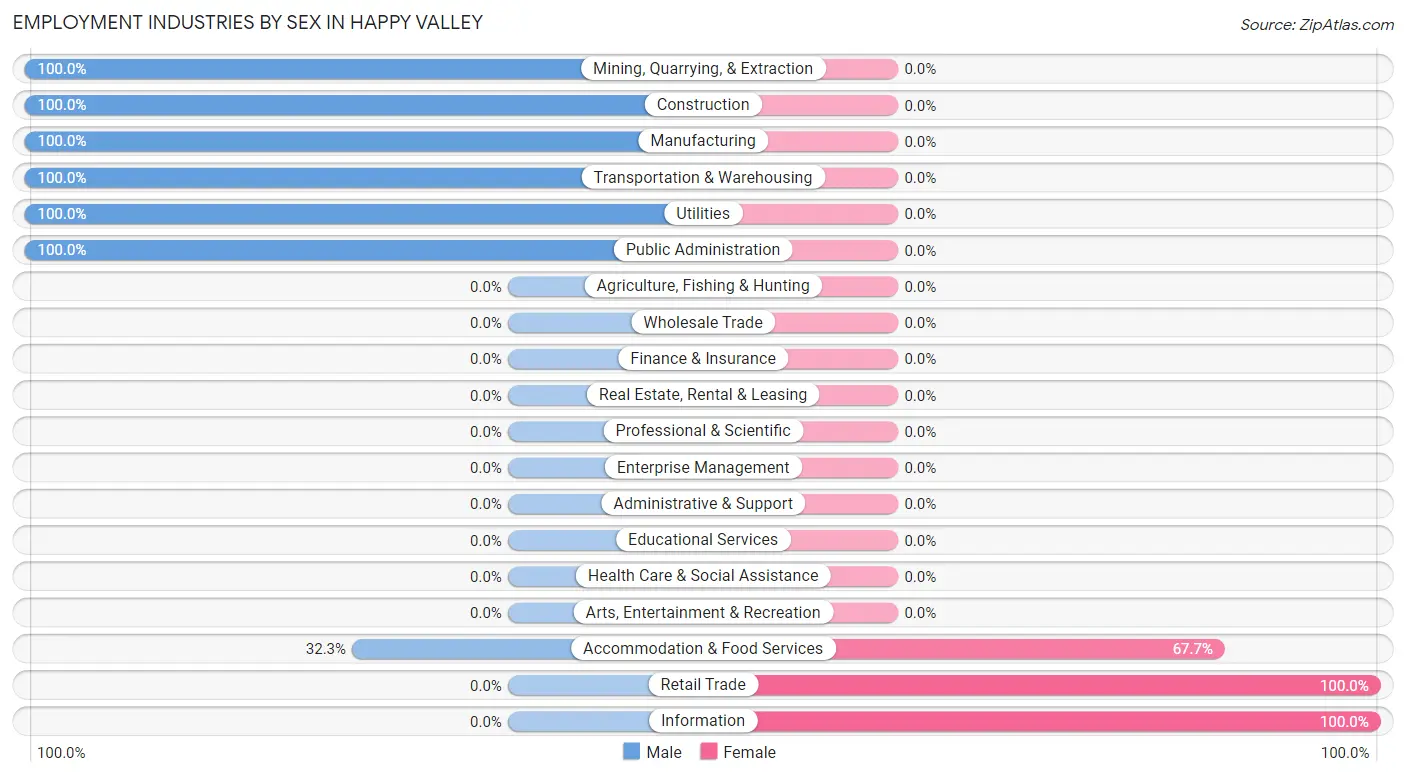
| Industry | Male | Female |
| Agriculture, Fishing & Hunting | 0 (0.0%) | 0 (0.0%) |
| Mining, Quarrying, & Extraction | 28 (100.0%) | 0 (0.0%) |
| Construction | 47 (100.0%) | 0 (0.0%) |
| Manufacturing | 12 (100.0%) | 0 (0.0%) |
| Wholesale Trade | 0 (0.0%) | 0 (0.0%) |
| Retail Trade | 0 (0.0%) | 18 (100.0%) |
| Transportation & Warehousing | 13 (100.0%) | 0 (0.0%) |
| Utilities | 9 (100.0%) | 0 (0.0%) |
| Information | 0 (0.0%) | 19 (100.0%) |
| Finance & Insurance | 0 (0.0%) | 0 (0.0%) |
| Real Estate, Rental & Leasing | 0 (0.0%) | 0 (0.0%) |
| Professional & Scientific | 0 (0.0%) | 0 (0.0%) |
| Enterprise Management | 0 (0.0%) | 0 (0.0%) |
| Administrative & Support | 0 (0.0%) | 0 (0.0%) |
| Educational Services | 0 (0.0%) | 0 (0.0%) |
| Health Care & Social Assistance | 0 (0.0%) | 0 (0.0%) |
| Arts, Entertainment & Recreation | 0 (0.0%) | 0 (0.0%) |
| Accommodation & Food Services | 10 (32.3%) | 21 (67.7%) |
| Public Administration | 17 (100.0%) | 0 (0.0%) |
| Total | 136 (70.1%) | 58 (29.9%) |
Education in Happy Valley
School Enrollment in Happy Valley
The most common levels of schooling among the 30 students in Happy Valley are middle school (20 | 66.7%), and elementary school (10 | 33.3%).
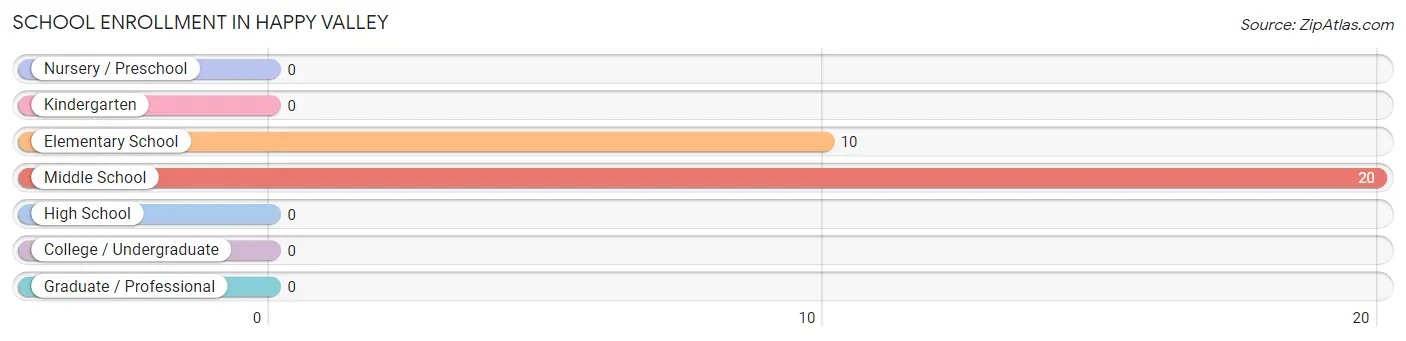
| School Level | # Students | % Students |
| Nursery / Preschool | 0 | 0.0% |
| Kindergarten | 0 | 0.0% |
| Elementary School | 10 | 33.3% |
| Middle School | 20 | 66.7% |
| High School | 0 | 0.0% |
| College / Undergraduate | 0 | 0.0% |
| Graduate / Professional | 0 | 0.0% |
| Total | 30 | 100.0% |
School Enrollment by Age by Funding Source in Happy Valley
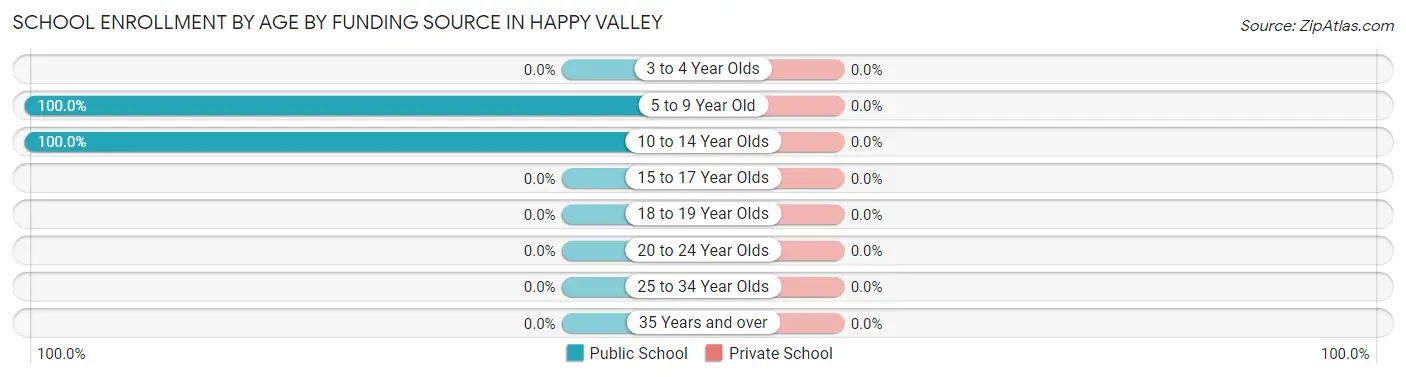
| Age Bracket | Public School | Private School |
| 3 to 4 Year Olds | 0 (0.0%) | 0 (0.0%) |
| 5 to 9 Year Old | 10 (100.0%) | 0 (0.0%) |
| 10 to 14 Year Olds | 20 (100.0%) | 0 (0.0%) |
| 15 to 17 Year Olds | 0 (0.0%) | 0 (0.0%) |
| 18 to 19 Year Olds | 0 (0.0%) | 0 (0.0%) |
| 20 to 24 Year Olds | 0 (0.0%) | 0 (0.0%) |
| 25 to 34 Year Olds | 0 (0.0%) | 0 (0.0%) |
| 35 Years and over | 0 (0.0%) | 0 (0.0%) |
| Total | 30 (100.0%) | 0 (0.0%) |
Educational Attainment by Field of Study in Happy Valley
Literature & languages (19 | 34.5%), liberal arts & history (19 | 34.5%), and business (17 | 30.9%) are the most common fields of study among 55 individuals in Happy Valley who have obtained a bachelor's degree or higher.
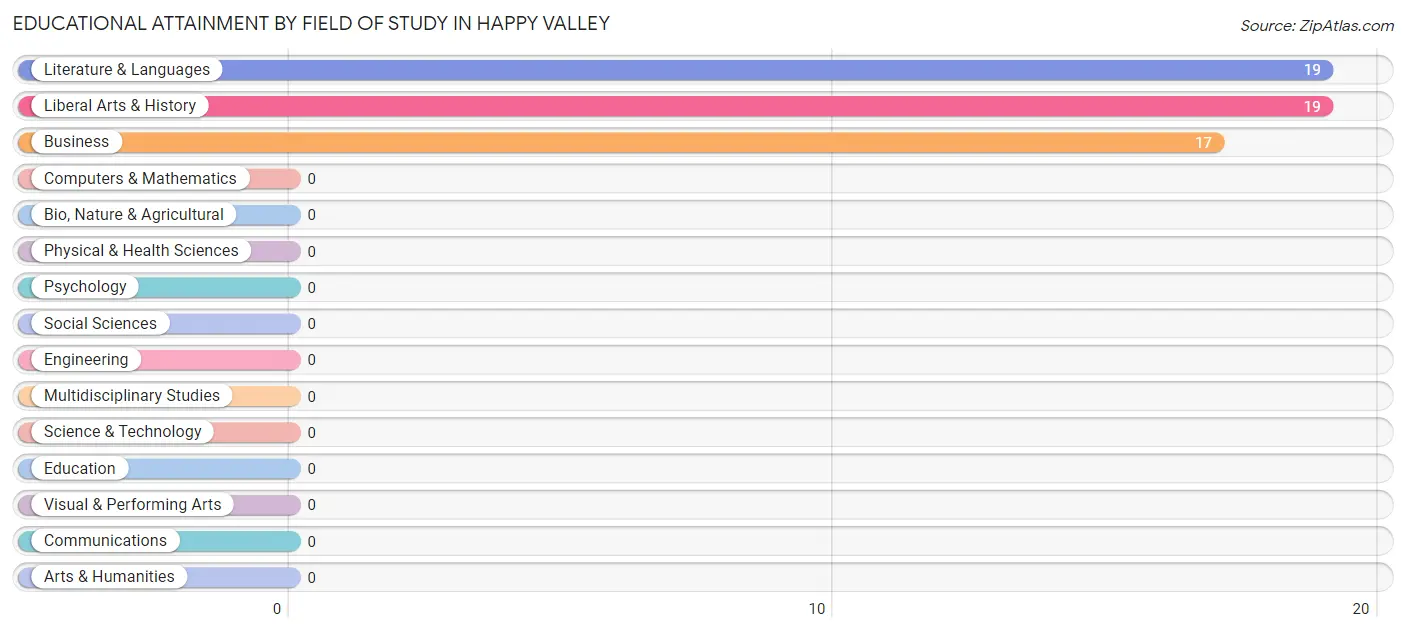
| Field of Study | # Graduates | % Graduates |
| Computers & Mathematics | 0 | 0.0% |
| Bio, Nature & Agricultural | 0 | 0.0% |
| Physical & Health Sciences | 0 | 0.0% |
| Psychology | 0 | 0.0% |
| Social Sciences | 0 | 0.0% |
| Engineering | 0 | 0.0% |
| Multidisciplinary Studies | 0 | 0.0% |
| Science & Technology | 0 | 0.0% |
| Business | 17 | 30.9% |
| Education | 0 | 0.0% |
| Literature & Languages | 19 | 34.5% |
| Liberal Arts & History | 19 | 34.5% |
| Visual & Performing Arts | 0 | 0.0% |
| Communications | 0 | 0.0% |
| Arts & Humanities | 0 | 0.0% |
| Total | 55 | 100.0% |
Transportation & Commute in Happy Valley
Vehicle Availability by Sex in Happy Valley
The most prevalent vehicle ownership categories in Happy Valley are males with 2 vehicles (62, accounting for 45.6%) and females with 2 vehicles (37, making up 106.9%).
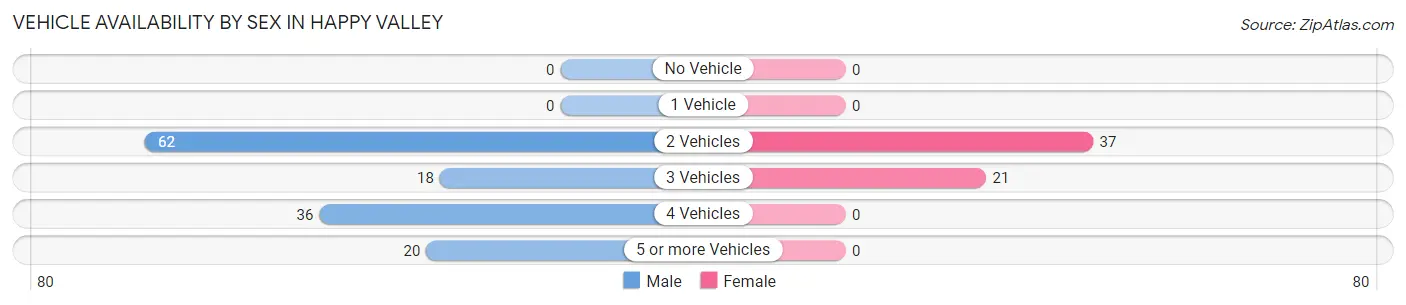
| Vehicles Available | Male | Female |
| No Vehicle | 0 (0.0%) | 0 (0.0%) |
| 1 Vehicle | 0 (0.0%) | 0 (0.0%) |
| 2 Vehicles | 62 (45.6%) | 37 (63.8%) |
| 3 Vehicles | 18 (13.2%) | 21 (36.2%) |
| 4 Vehicles | 36 (26.5%) | 0 (0.0%) |
| 5 or more Vehicles | 20 (14.7%) | 0 (0.0%) |
| Total | 136 (100.0%) | 58 (100.0%) |
Commute Time in Happy Valley
The most frequently occuring commute durations in Happy Valley are 10 to 14 minutes (83 commuters, 42.8%), 30 to 34 minutes (29 commuters, 14.9%), and 20 to 24 minutes (28 commuters, 14.4%).
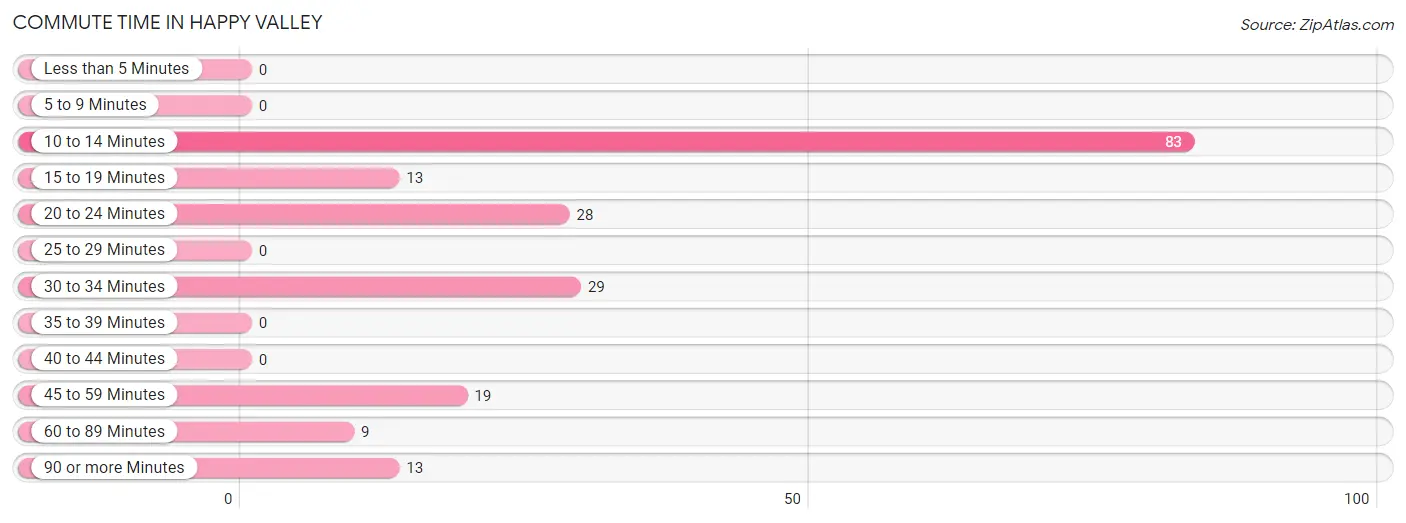
| Commute Time | # Commuters | % Commuters |
| Less than 5 Minutes | 0 | 0.0% |
| 5 to 9 Minutes | 0 | 0.0% |
| 10 to 14 Minutes | 83 | 42.8% |
| 15 to 19 Minutes | 13 | 6.7% |
| 20 to 24 Minutes | 28 | 14.4% |
| 25 to 29 Minutes | 0 | 0.0% |
| 30 to 34 Minutes | 29 | 14.9% |
| 35 to 39 Minutes | 0 | 0.0% |
| 40 to 44 Minutes | 0 | 0.0% |
| 45 to 59 Minutes | 19 | 9.8% |
| 60 to 89 Minutes | 9 | 4.6% |
| 90 or more Minutes | 13 | 6.7% |
Commute Time by Sex in Happy Valley
The most common commute times in Happy Valley are 10 to 14 minutes (65 commuters, 47.8%) for males and 45 to 59 minutes (19 commuters, 32.8%) for females.
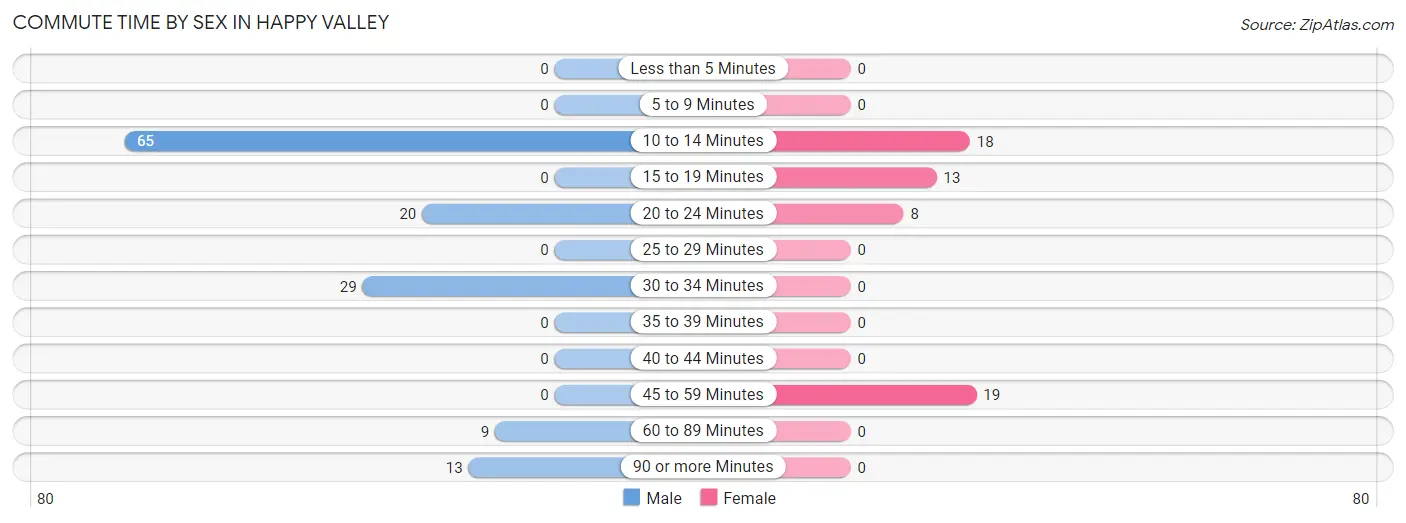
| Commute Time | Male | Female |
| Less than 5 Minutes | 0 (0.0%) | 0 (0.0%) |
| 5 to 9 Minutes | 0 (0.0%) | 0 (0.0%) |
| 10 to 14 Minutes | 65 (47.8%) | 18 (31.0%) |
| 15 to 19 Minutes | 0 (0.0%) | 13 (22.4%) |
| 20 to 24 Minutes | 20 (14.7%) | 8 (13.8%) |
| 25 to 29 Minutes | 0 (0.0%) | 0 (0.0%) |
| 30 to 34 Minutes | 29 (21.3%) | 0 (0.0%) |
| 35 to 39 Minutes | 0 (0.0%) | 0 (0.0%) |
| 40 to 44 Minutes | 0 (0.0%) | 0 (0.0%) |
| 45 to 59 Minutes | 0 (0.0%) | 19 (32.8%) |
| 60 to 89 Minutes | 9 (6.6%) | 0 (0.0%) |
| 90 or more Minutes | 13 (9.6%) | 0 (0.0%) |
Time of Departure to Work by Sex in Happy Valley
The most frequent times of departure to work in Happy Valley are 6:00 AM to 6:29 AM (38, 27.9%) for males and 7:00 AM to 7:29 AM (37, 63.8%) for females.
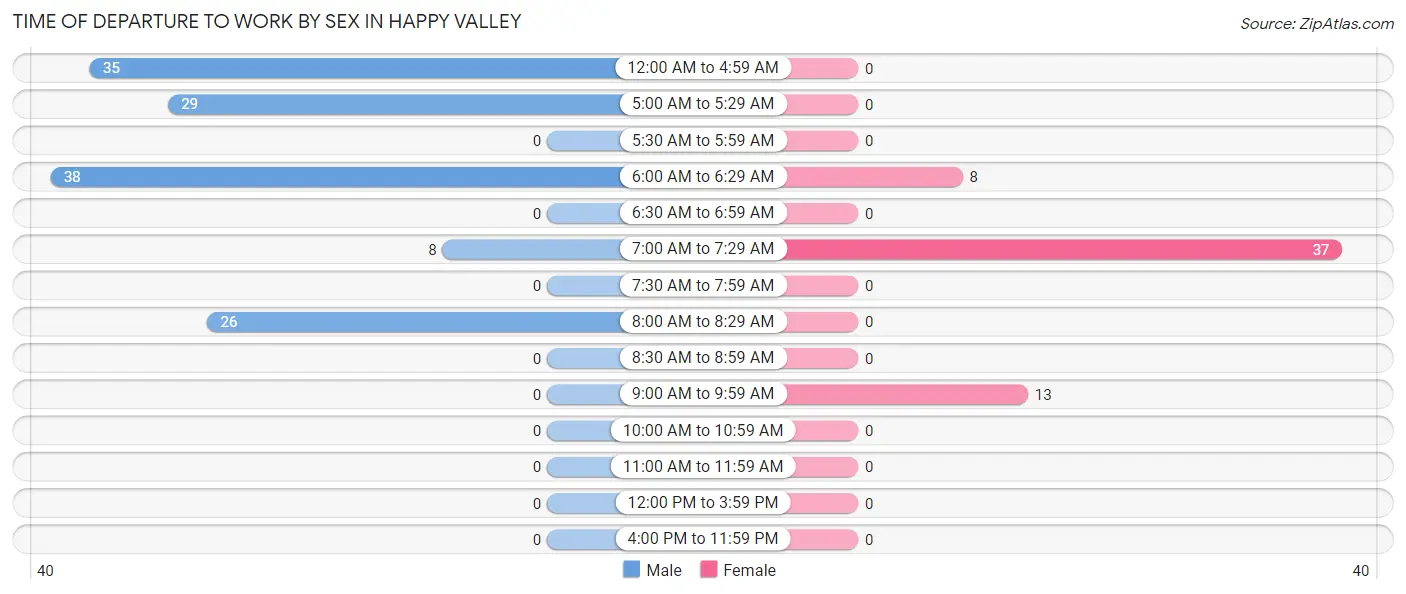
| Time of Departure | Male | Female |
| 12:00 AM to 4:59 AM | 35 (25.7%) | 0 (0.0%) |
| 5:00 AM to 5:29 AM | 29 (21.3%) | 0 (0.0%) |
| 5:30 AM to 5:59 AM | 0 (0.0%) | 0 (0.0%) |
| 6:00 AM to 6:29 AM | 38 (27.9%) | 8 (13.8%) |
| 6:30 AM to 6:59 AM | 0 (0.0%) | 0 (0.0%) |
| 7:00 AM to 7:29 AM | 8 (5.9%) | 37 (63.8%) |
| 7:30 AM to 7:59 AM | 0 (0.0%) | 0 (0.0%) |
| 8:00 AM to 8:29 AM | 26 (19.1%) | 0 (0.0%) |
| 8:30 AM to 8:59 AM | 0 (0.0%) | 0 (0.0%) |
| 9:00 AM to 9:59 AM | 0 (0.0%) | 13 (22.4%) |
| 10:00 AM to 10:59 AM | 0 (0.0%) | 0 (0.0%) |
| 11:00 AM to 11:59 AM | 0 (0.0%) | 0 (0.0%) |
| 12:00 PM to 3:59 PM | 0 (0.0%) | 0 (0.0%) |
| 4:00 PM to 11:59 PM | 0 (0.0%) | 0 (0.0%) |
| Total | 136 (100.0%) | 58 (100.0%) |
Housing Occupancy in Happy Valley
Occupancy by Ownership in Happy Valley
Of the total 287 dwellings in Happy Valley, owner-occupied units account for 225 (78.4%), while renter-occupied units make up 62 (21.6%).
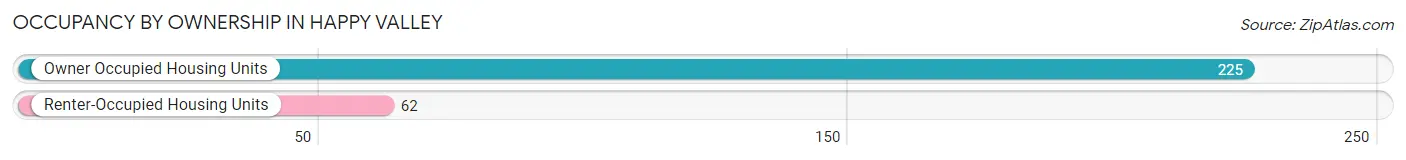
| Occupancy | # Housing Units | % Housing Units |
| Owner Occupied Housing Units | 225 | 78.4% |
| Renter-Occupied Housing Units | 62 | 21.6% |
| Total Occupied Housing Units | 287 | 100.0% |
Occupancy by Household Size in Happy Valley
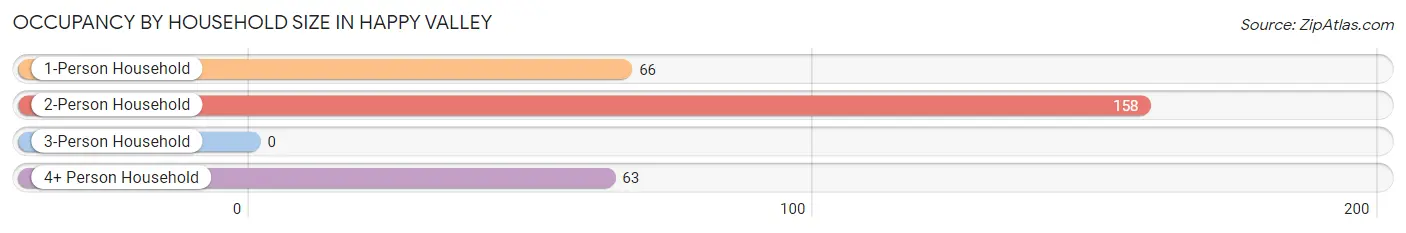
| Household Size | # Housing Units | % Housing Units |
| 1-Person Household | 66 | 23.0% |
| 2-Person Household | 158 | 55.0% |
| 3-Person Household | 0 | 0.0% |
| 4+ Person Household | 63 | 22.0% |
| Total Housing Units | 287 | 100.0% |
Occupancy by Ownership by Household Size in Happy Valley
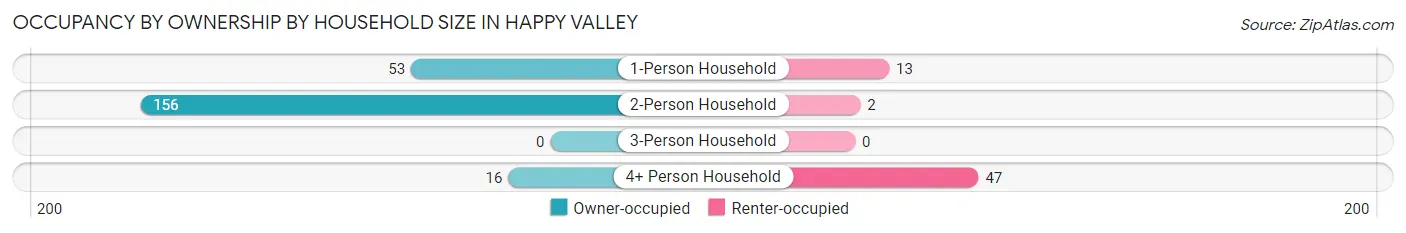
| Household Size | Owner-occupied | Renter-occupied |
| 1-Person Household | 53 (80.3%) | 13 (19.7%) |
| 2-Person Household | 156 (98.7%) | 2 (1.3%) |
| 3-Person Household | 0 (0.0%) | 0 (0.0%) |
| 4+ Person Household | 16 (25.4%) | 47 (74.6%) |
| Total Housing Units | 225 (78.4%) | 62 (21.6%) |
Occupancy by Educational Attainment in Happy Valley
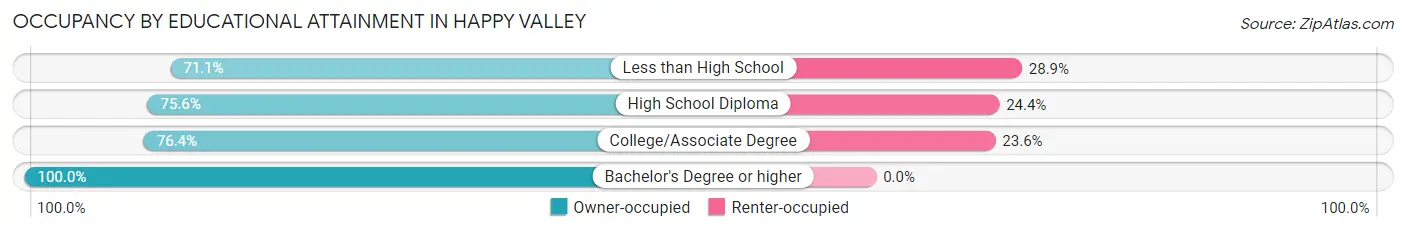
| Household Size | Owner-occupied | Renter-occupied |
| Less than High School | 32 (71.1%) | 13 (28.9%) |
| High School Diploma | 31 (75.6%) | 10 (24.4%) |
| College/Associate Degree | 126 (76.4%) | 39 (23.6%) |
| Bachelor's Degree or higher | 36 (100.0%) | 0 (0.0%) |
Occupancy by Age of Householder in Happy Valley
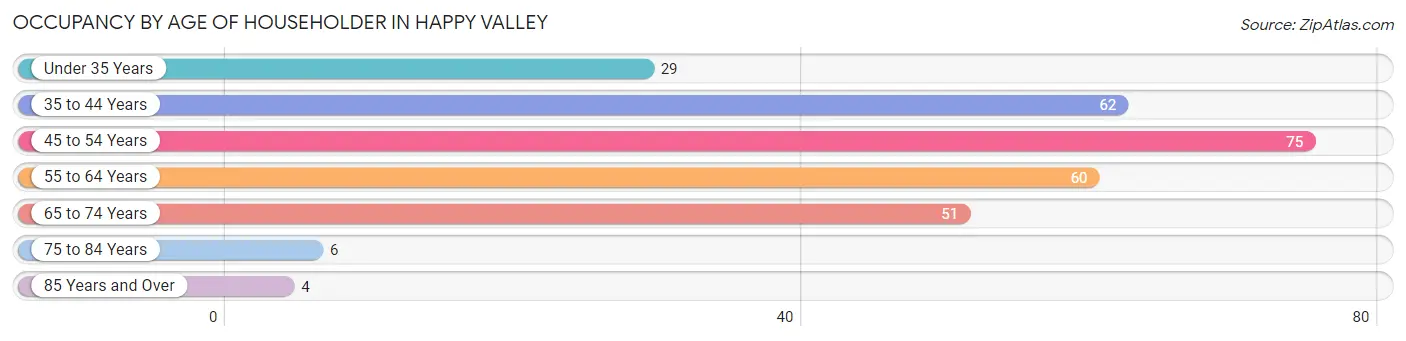
| Age Bracket | # Households | % Households |
| Under 35 Years | 29 | 10.1% |
| 35 to 44 Years | 62 | 21.6% |
| 45 to 54 Years | 75 | 26.1% |
| 55 to 64 Years | 60 | 20.9% |
| 65 to 74 Years | 51 | 17.8% |
| 75 to 84 Years | 6 | 2.1% |
| 85 Years and Over | 4 | 1.4% |
| Total | 287 | 100.0% |
Housing Finances in Happy Valley
Median Income by Occupancy in Happy Valley
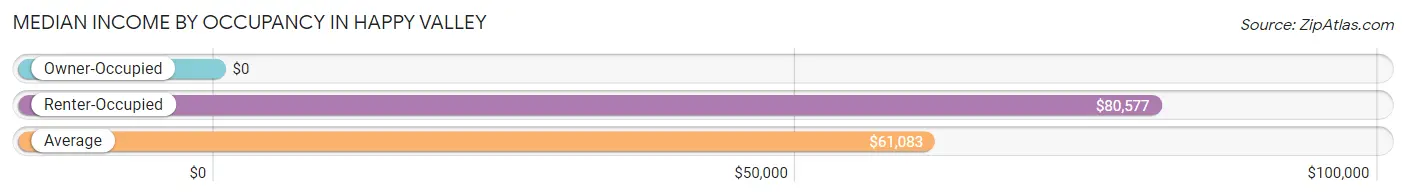
| Occupancy Type | # Households | Median Income |
| Owner-Occupied | 225 (78.4%) | $0 |
| Renter-Occupied | 62 (21.6%) | $80,577 |
| Average | 287 (100.0%) | $61,083 |
Occupancy by Householder Income Bracket in Happy Valley
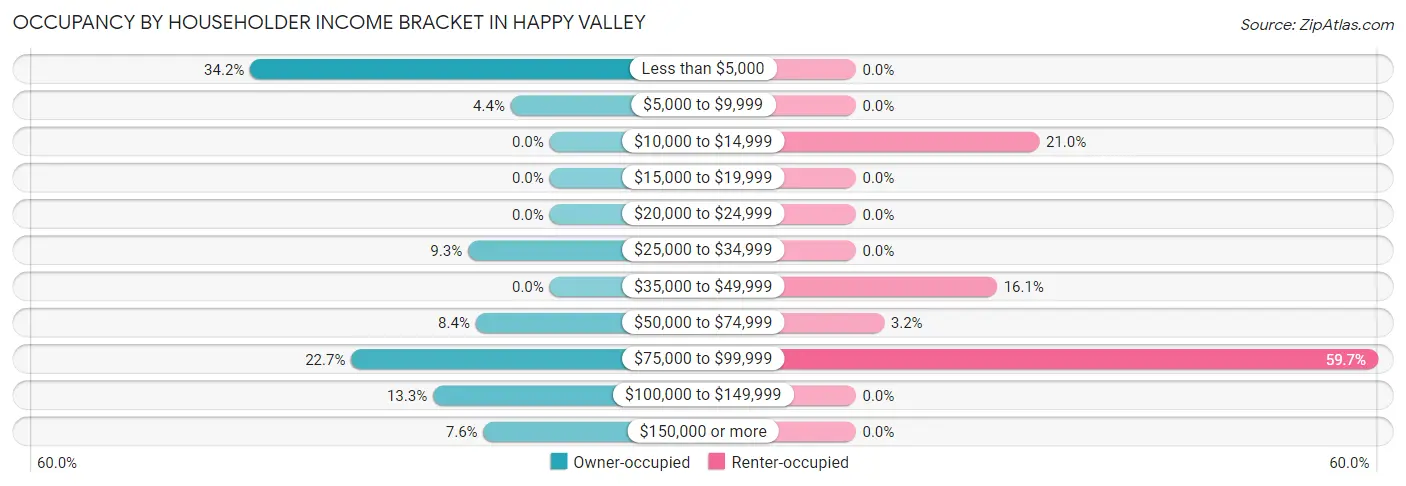
| Income Bracket | Owner-occupied | Renter-occupied |
| Less than $5,000 | 77 (34.2%) | 0 (0.0%) |
| $5,000 to $9,999 | 10 (4.4%) | 0 (0.0%) |
| $10,000 to $14,999 | 0 (0.0%) | 13 (21.0%) |
| $15,000 to $19,999 | 0 (0.0%) | 0 (0.0%) |
| $20,000 to $24,999 | 0 (0.0%) | 0 (0.0%) |
| $25,000 to $34,999 | 21 (9.3%) | 0 (0.0%) |
| $35,000 to $49,999 | 0 (0.0%) | 10 (16.1%) |
| $50,000 to $74,999 | 19 (8.4%) | 2 (3.2%) |
| $75,000 to $99,999 | 51 (22.7%) | 37 (59.7%) |
| $100,000 to $149,999 | 30 (13.3%) | 0 (0.0%) |
| $150,000 or more | 17 (7.6%) | 0 (0.0%) |
| Total | 225 (100.0%) | 62 (100.0%) |
Monthly Housing Cost Tiers in Happy Valley
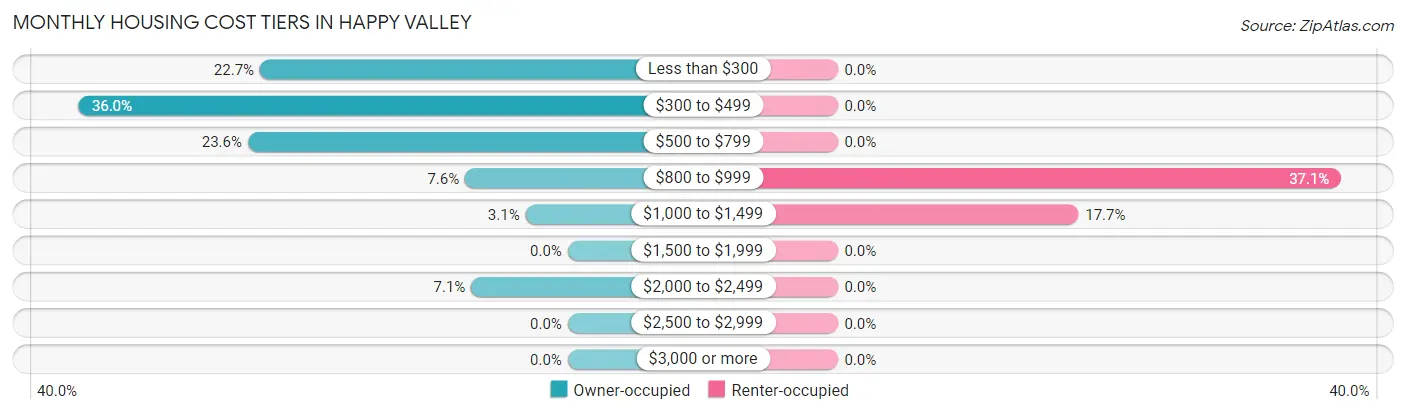
| Monthly Cost | Owner-occupied | Renter-occupied |
| Less than $300 | 51 (22.7%) | 0 (0.0%) |
| $300 to $499 | 81 (36.0%) | 0 (0.0%) |
| $500 to $799 | 53 (23.6%) | 0 (0.0%) |
| $800 to $999 | 17 (7.6%) | 23 (37.1%) |
| $1,000 to $1,499 | 7 (3.1%) | 11 (17.7%) |
| $1,500 to $1,999 | 0 (0.0%) | 0 (0.0%) |
| $2,000 to $2,499 | 16 (7.1%) | 0 (0.0%) |
| $2,500 to $2,999 | 0 (0.0%) | 0 (0.0%) |
| $3,000 or more | 0 (0.0%) | 0 (0.0%) |
| Total | 225 (100.0%) | 62 (100.0%) |
Physical Housing Characteristics in Happy Valley
Housing Structures in Happy Valley
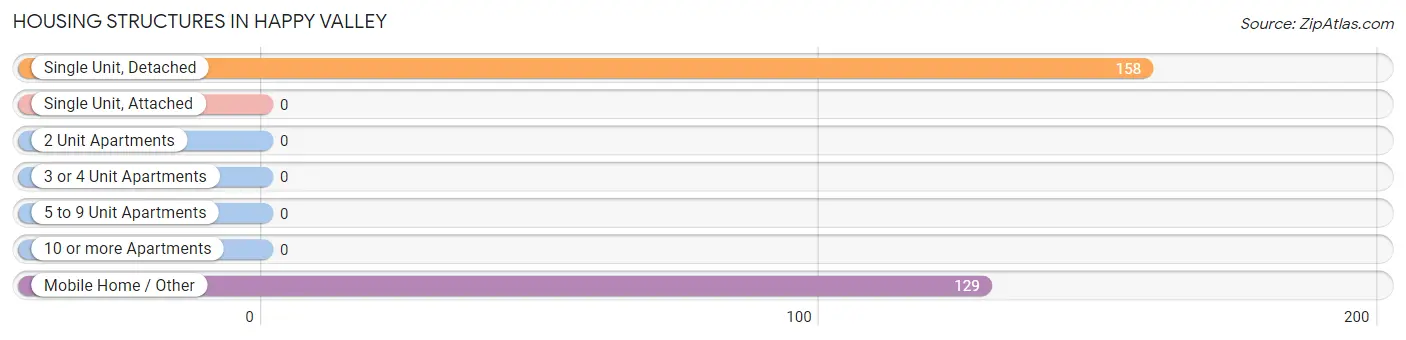
| Structure Type | # Housing Units | % Housing Units |
| Single Unit, Detached | 158 | 55.0% |
| Single Unit, Attached | 0 | 0.0% |
| 2 Unit Apartments | 0 | 0.0% |
| 3 or 4 Unit Apartments | 0 | 0.0% |
| 5 to 9 Unit Apartments | 0 | 0.0% |
| 10 or more Apartments | 0 | 0.0% |
| Mobile Home / Other | 129 | 45.0% |
| Total | 287 | 100.0% |
Housing Structures by Occupancy in Happy Valley
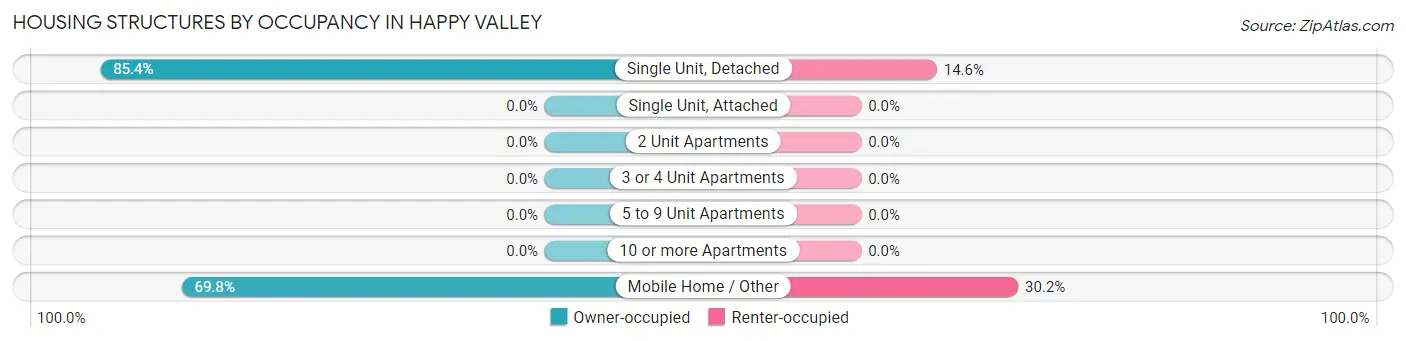
| Structure Type | Owner-occupied | Renter-occupied |
| Single Unit, Detached | 135 (85.4%) | 23 (14.6%) |
| Single Unit, Attached | 0 (0.0%) | 0 (0.0%) |
| 2 Unit Apartments | 0 (0.0%) | 0 (0.0%) |
| 3 or 4 Unit Apartments | 0 (0.0%) | 0 (0.0%) |
| 5 to 9 Unit Apartments | 0 (0.0%) | 0 (0.0%) |
| 10 or more Apartments | 0 (0.0%) | 0 (0.0%) |
| Mobile Home / Other | 90 (69.8%) | 39 (30.2%) |
| Total | 225 (78.4%) | 62 (21.6%) |
Housing Structures by Number of Rooms in Happy Valley
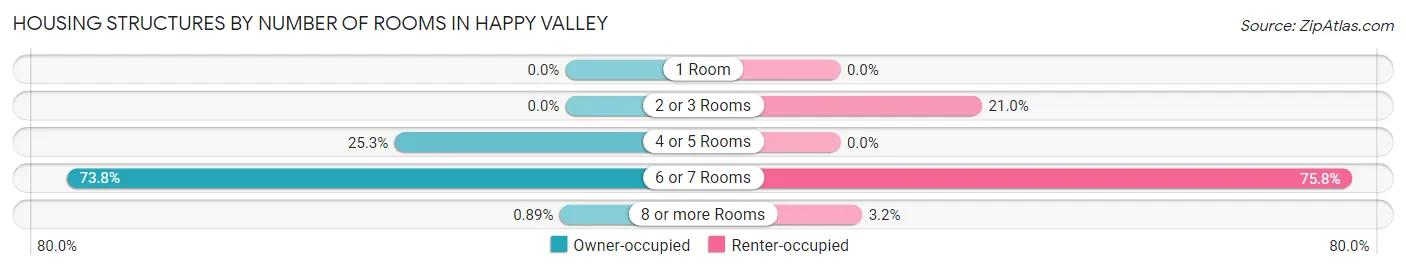
| Number of Rooms | Owner-occupied | Renter-occupied |
| 1 Room | 0 (0.0%) | 0 (0.0%) |
| 2 or 3 Rooms | 0 (0.0%) | 13 (21.0%) |
| 4 or 5 Rooms | 57 (25.3%) | 0 (0.0%) |
| 6 or 7 Rooms | 166 (73.8%) | 47 (75.8%) |
| 8 or more Rooms | 2 (0.9%) | 2 (3.2%) |
| Total | 225 (100.0%) | 62 (100.0%) |
Housing Structure by Heating Type in Happy Valley
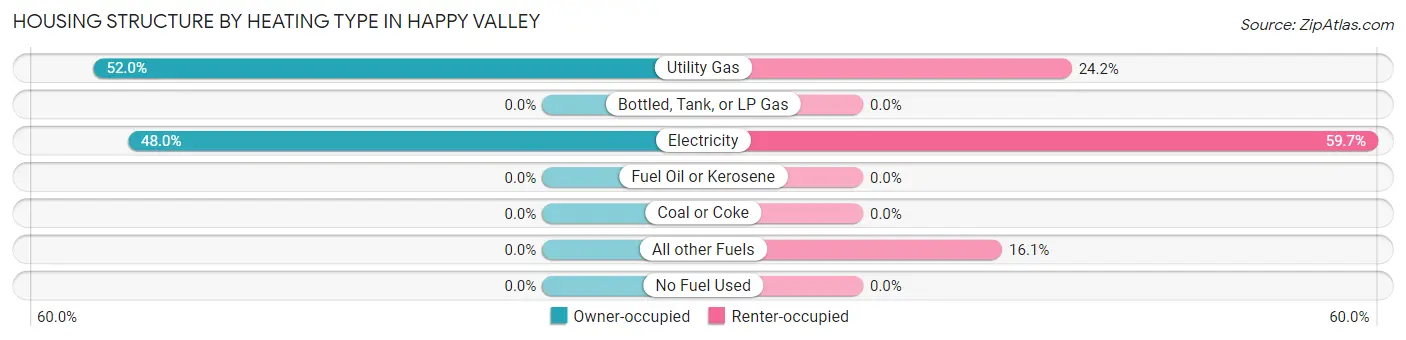
| Heating Type | Owner-occupied | Renter-occupied |
| Utility Gas | 117 (52.0%) | 15 (24.2%) |
| Bottled, Tank, or LP Gas | 0 (0.0%) | 0 (0.0%) |
| Electricity | 108 (48.0%) | 37 (59.7%) |
| Fuel Oil or Kerosene | 0 (0.0%) | 0 (0.0%) |
| Coal or Coke | 0 (0.0%) | 0 (0.0%) |
| All other Fuels | 0 (0.0%) | 10 (16.1%) |
| No Fuel Used | 0 (0.0%) | 0 (0.0%) |
| Total | 225 (100.0%) | 62 (100.0%) |
Household Vehicle Usage in Happy Valley
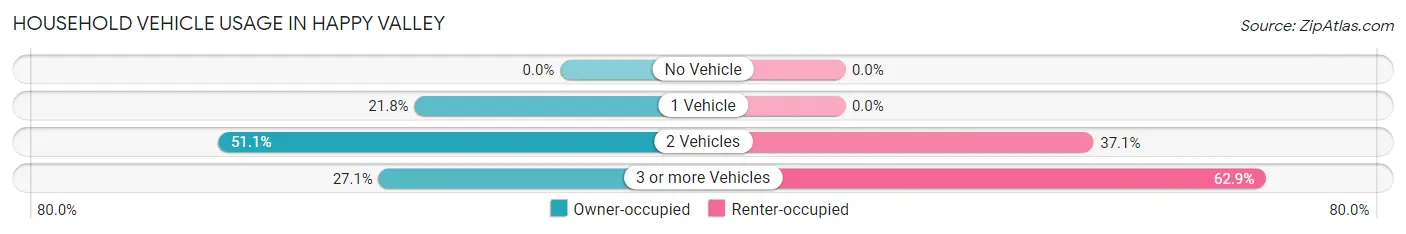
| Vehicles per Household | Owner-occupied | Renter-occupied |
| No Vehicle | 0 (0.0%) | 0 (0.0%) |
| 1 Vehicle | 49 (21.8%) | 0 (0.0%) |
| 2 Vehicles | 115 (51.1%) | 23 (37.1%) |
| 3 or more Vehicles | 61 (27.1%) | 39 (62.9%) |
| Total | 225 (100.0%) | 62 (100.0%) |
Real Estate & Mortgages in Happy Valley
Real Estate and Mortgage Overview in Happy Valley
| Characteristic | Without Mortgage | With Mortgage |
| Housing Units | 185 | 40 |
| Median Property Value | $145,700 | $179,700 |
| Median Household Income | - | - |
| Monthly Housing Costs | $370 | $0 |
| Real Estate Taxes | $317 | $0 |
Property Value by Mortgage Status in Happy Valley
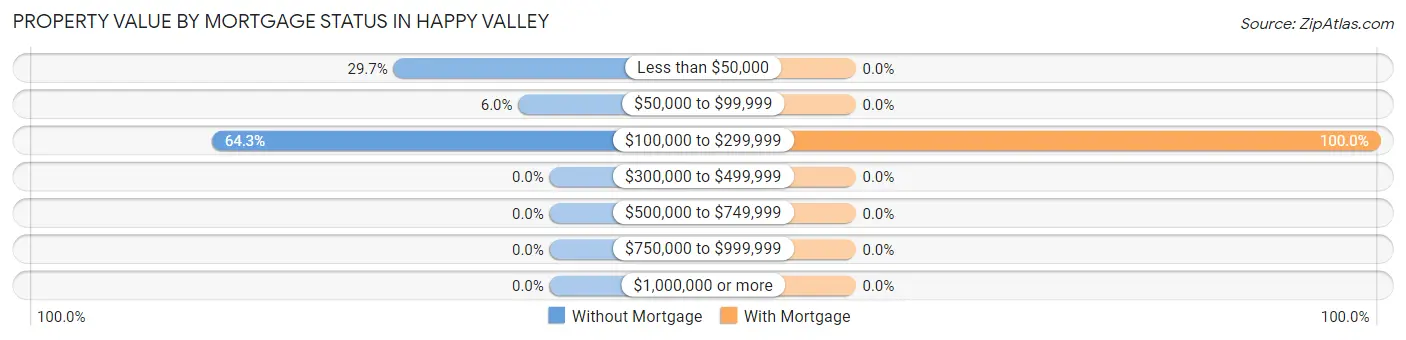
| Property Value | Without Mortgage | With Mortgage |
| Less than $50,000 | 55 (29.7%) | 0 (0.0%) |
| $50,000 to $99,999 | 11 (5.9%) | 0 (0.0%) |
| $100,000 to $299,999 | 119 (64.3%) | 40 (100.0%) |
| $300,000 to $499,999 | 0 (0.0%) | 0 (0.0%) |
| $500,000 to $749,999 | 0 (0.0%) | 0 (0.0%) |
| $750,000 to $999,999 | 0 (0.0%) | 0 (0.0%) |
| $1,000,000 or more | 0 (0.0%) | 0 (0.0%) |
| Total | 185 (100.0%) | 40 (100.0%) |
Household Income by Mortgage Status in Happy Valley
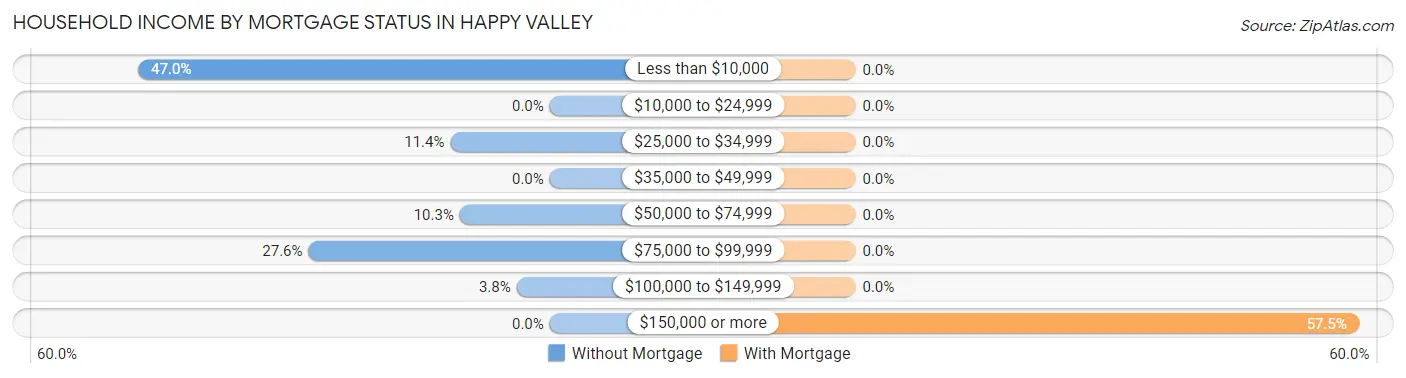
| Household Income | Without Mortgage | With Mortgage |
| Less than $10,000 | 87 (47.0%) | 0 (0.0%) |
| $10,000 to $24,999 | 0 (0.0%) | 0 (0.0%) |
| $25,000 to $34,999 | 21 (11.4%) | 0 (0.0%) |
| $35,000 to $49,999 | 0 (0.0%) | 0 (0.0%) |
| $50,000 to $74,999 | 19 (10.3%) | 0 (0.0%) |
| $75,000 to $99,999 | 51 (27.6%) | 0 (0.0%) |
| $100,000 to $149,999 | 7 (3.8%) | 0 (0.0%) |
| $150,000 or more | 0 (0.0%) | 23 (57.5%) |
| Total | 185 (100.0%) | 40 (100.0%) |
Property Value to Household Income Ratio in Happy Valley
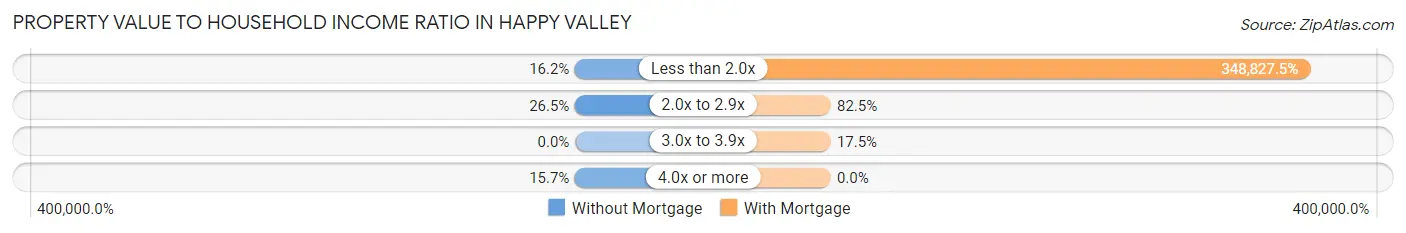
| Value-to-Income Ratio | Without Mortgage | With Mortgage |
| Less than 2.0x | 30 (16.2%) | 139,531 (348,827.5%) |
| 2.0x to 2.9x | 49 (26.5%) | 33 (82.5%) |
| 3.0x to 3.9x | 0 (0.0%) | 7 (17.5%) |
| 4.0x or more | 29 (15.7%) | 0 (0.0%) |
| Total | 185 (100.0%) | 40 (100.0%) |
Real Estate Taxes by Mortgage Status in Happy Valley
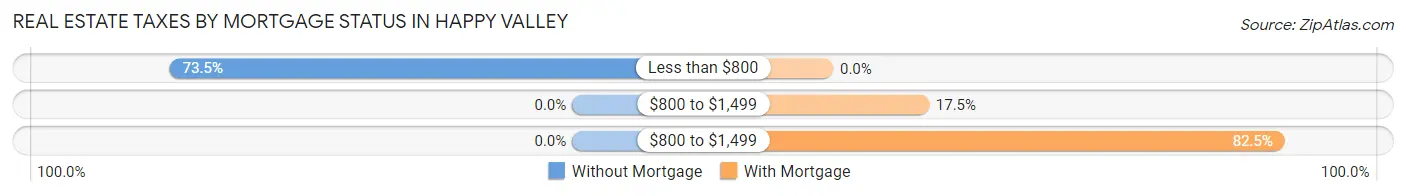
| Property Taxes | Without Mortgage | With Mortgage |
| Less than $800 | 136 (73.5%) | 0 (0.0%) |
| $800 to $1,499 | 0 (0.0%) | 7 (17.5%) |
| $800 to $1,499 | 0 (0.0%) | 33 (82.5%) |
| Total | 185 (100.0%) | 40 (100.0%) |
Health & Disability in Happy Valley
Health Insurance Coverage by Age in Happy Valley
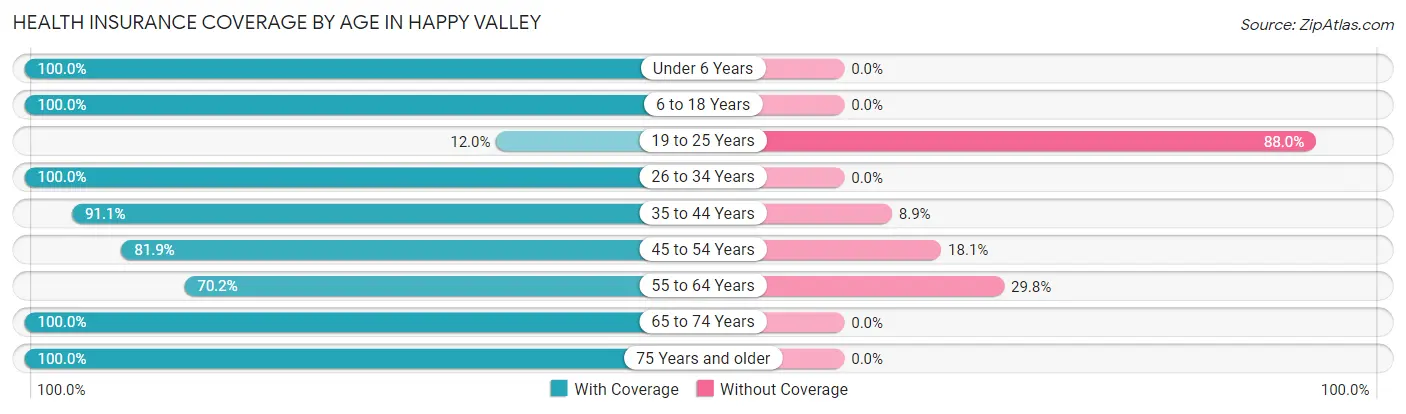
| Age Bracket | With Coverage | Without Coverage |
| Under 6 Years | 19 (100.0%) | 0 (0.0%) |
| 6 to 18 Years | 43 (100.0%) | 0 (0.0%) |
| 19 to 25 Years | 13 (12.0%) | 95 (88.0%) |
| 26 to 34 Years | 16 (100.0%) | 0 (0.0%) |
| 35 to 44 Years | 113 (91.1%) | 11 (8.9%) |
| 45 to 54 Years | 118 (81.9%) | 26 (18.1%) |
| 55 to 64 Years | 66 (70.2%) | 28 (29.8%) |
| 65 to 74 Years | 65 (100.0%) | 0 (0.0%) |
| 75 Years and older | 16 (100.0%) | 0 (0.0%) |
| Total | 469 (74.6%) | 160 (25.4%) |
Health Insurance Coverage by Citizenship Status in Happy Valley
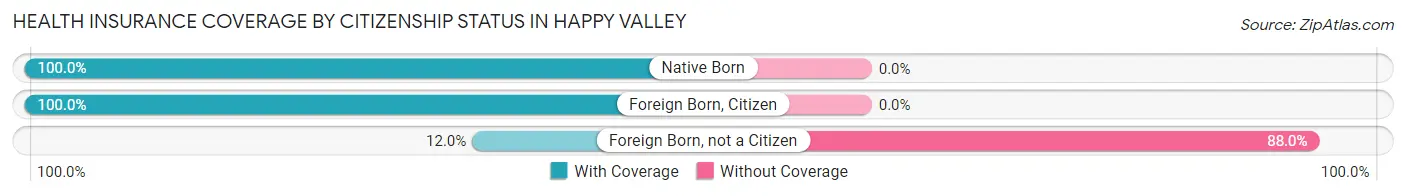
| Citizenship Status | With Coverage | Without Coverage |
| Native Born | 19 (100.0%) | 0 (0.0%) |
| Foreign Born, Citizen | 43 (100.0%) | 0 (0.0%) |
| Foreign Born, not a Citizen | 13 (12.0%) | 95 (88.0%) |
Health Insurance Coverage by Household Income in Happy Valley
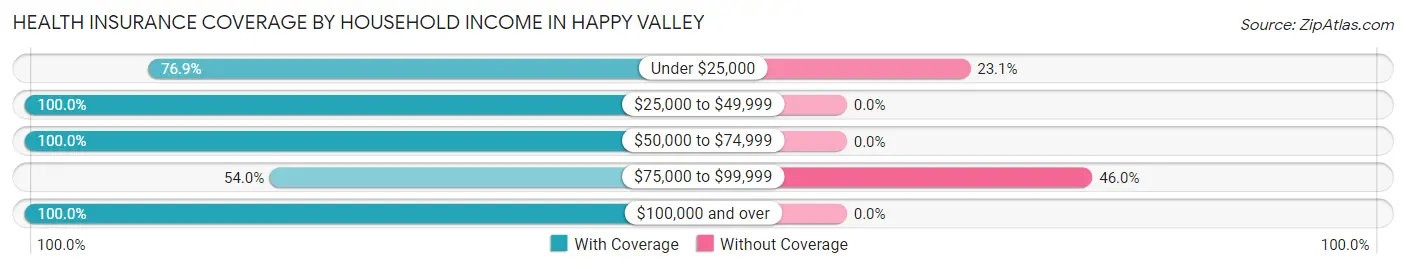
| Household Income | With Coverage | Without Coverage |
| Under $25,000 | 93 (76.9%) | 28 (23.1%) |
| $25,000 to $49,999 | 86 (100.0%) | 0 (0.0%) |
| $50,000 to $74,999 | 25 (100.0%) | 0 (0.0%) |
| $75,000 to $99,999 | 155 (54.0%) | 132 (46.0%) |
| $100,000 and over | 110 (100.0%) | 0 (0.0%) |
Public vs Private Health Insurance Coverage by Age in Happy Valley
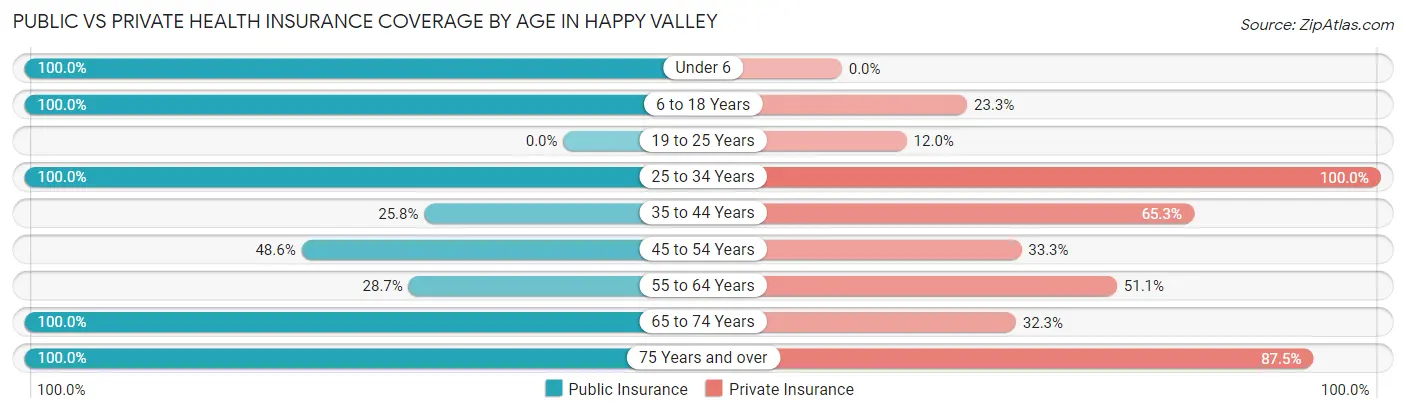
| Age Bracket | Public Insurance | Private Insurance |
| Under 6 | 19 (100.0%) | 0 (0.0%) |
| 6 to 18 Years | 43 (100.0%) | 10 (23.3%) |
| 19 to 25 Years | 0 (0.0%) | 13 (12.0%) |
| 25 to 34 Years | 16 (100.0%) | 16 (100.0%) |
| 35 to 44 Years | 32 (25.8%) | 81 (65.3%) |
| 45 to 54 Years | 70 (48.6%) | 48 (33.3%) |
| 55 to 64 Years | 27 (28.7%) | 48 (51.1%) |
| 65 to 74 Years | 65 (100.0%) | 21 (32.3%) |
| 75 Years and over | 16 (100.0%) | 14 (87.5%) |
| Total | 288 (45.8%) | 251 (39.9%) |
Disability Status by Sex by Age in Happy Valley
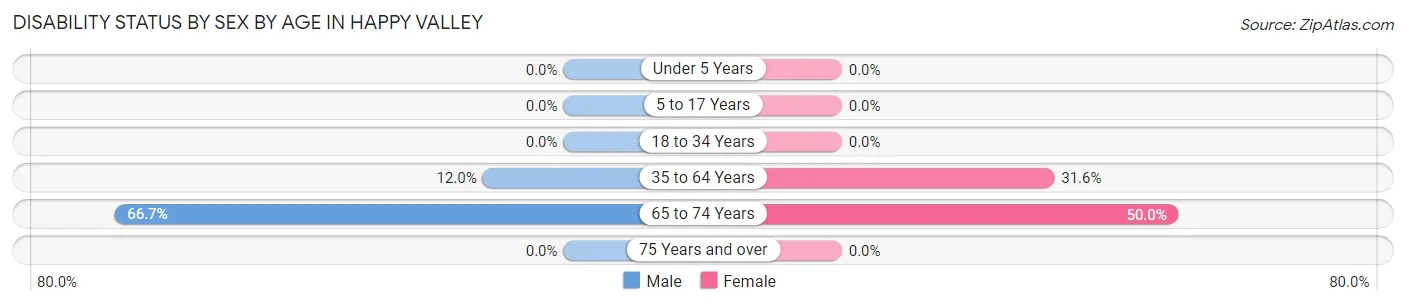
| Age Bracket | Male | Female |
| Under 5 Years | 0 (0.0%) | 0 (0.0%) |
| 5 to 17 Years | 0 (0.0%) | 0 (0.0%) |
| 18 to 34 Years | 0 (0.0%) | 0 (0.0%) |
| 35 to 64 Years | 21 (12.0%) | 59 (31.6%) |
| 65 to 74 Years | 18 (66.7%) | 19 (50.0%) |
| 75 Years and over | 0 (0.0%) | 0 (0.0%) |
Disability Class by Sex by Age in Happy Valley
Disability Class: Hearing Difficulty
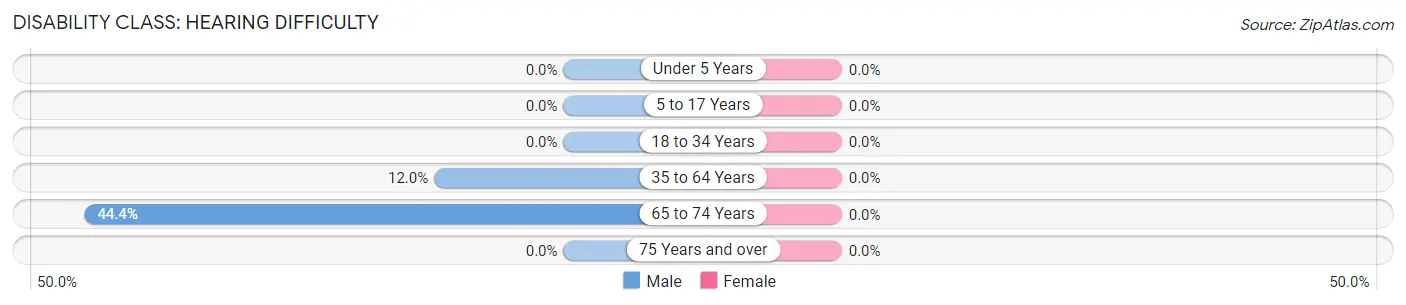
| Age Bracket | Male | Female |
| Under 5 Years | 0 (0.0%) | 0 (0.0%) |
| 5 to 17 Years | 0 (0.0%) | 0 (0.0%) |
| 18 to 34 Years | 0 (0.0%) | 0 (0.0%) |
| 35 to 64 Years | 21 (12.0%) | 0 (0.0%) |
| 65 to 74 Years | 12 (44.4%) | 0 (0.0%) |
| 75 Years and over | 0 (0.0%) | 0 (0.0%) |
Disability Class: Vision Difficulty
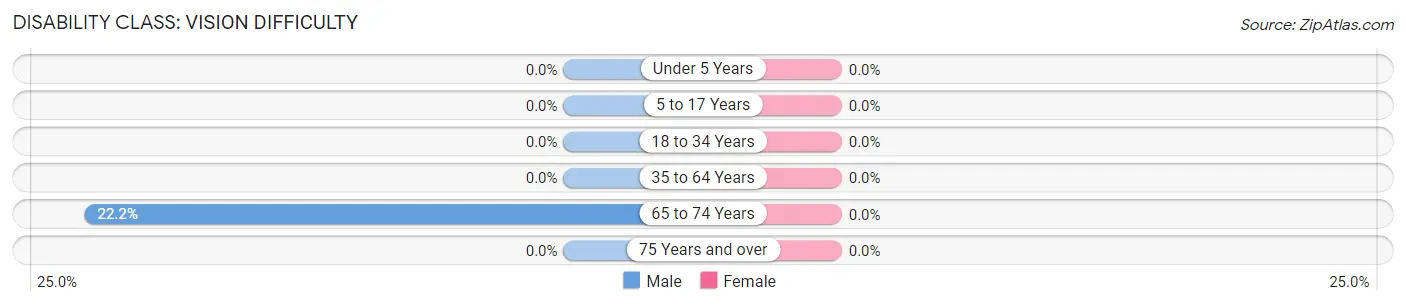
| Age Bracket | Male | Female |
| Under 5 Years | 0 (0.0%) | 0 (0.0%) |
| 5 to 17 Years | 0 (0.0%) | 0 (0.0%) |
| 18 to 34 Years | 0 (0.0%) | 0 (0.0%) |
| 35 to 64 Years | 0 (0.0%) | 0 (0.0%) |
| 65 to 74 Years | 6 (22.2%) | 0 (0.0%) |
| 75 Years and over | 0 (0.0%) | 0 (0.0%) |
Disability Class: Cognitive Difficulty
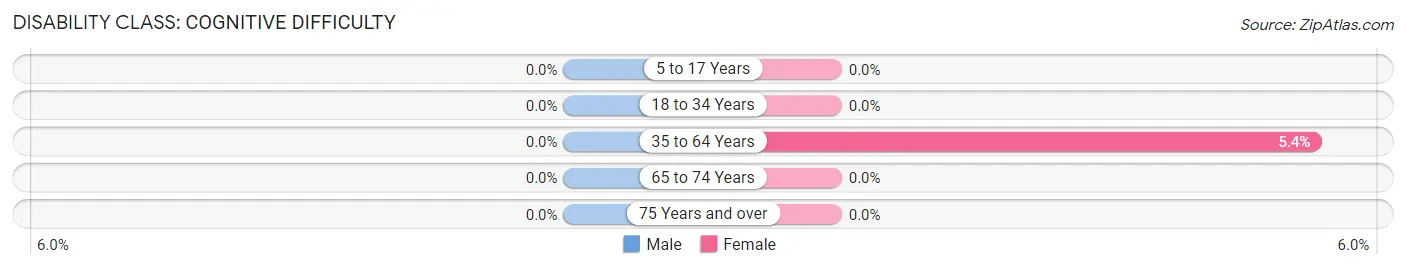
| Age Bracket | Male | Female |
| 5 to 17 Years | 0 (0.0%) | 0 (0.0%) |
| 18 to 34 Years | 0 (0.0%) | 0 (0.0%) |
| 35 to 64 Years | 0 (0.0%) | 10 (5.3%) |
| 65 to 74 Years | 0 (0.0%) | 0 (0.0%) |
| 75 Years and over | 0 (0.0%) | 0 (0.0%) |
Disability Class: Ambulatory Difficulty
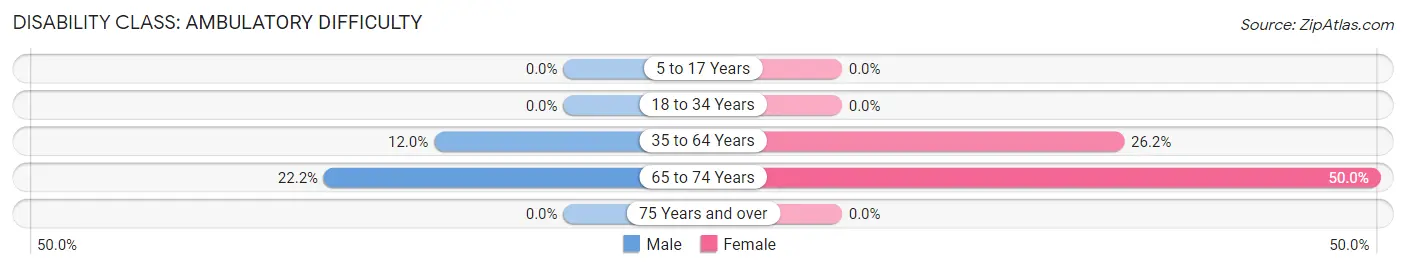
| Age Bracket | Male | Female |
| 5 to 17 Years | 0 (0.0%) | 0 (0.0%) |
| 18 to 34 Years | 0 (0.0%) | 0 (0.0%) |
| 35 to 64 Years | 21 (12.0%) | 49 (26.2%) |
| 65 to 74 Years | 6 (22.2%) | 19 (50.0%) |
| 75 Years and over | 0 (0.0%) | 0 (0.0%) |
Disability Class: Self-Care Difficulty
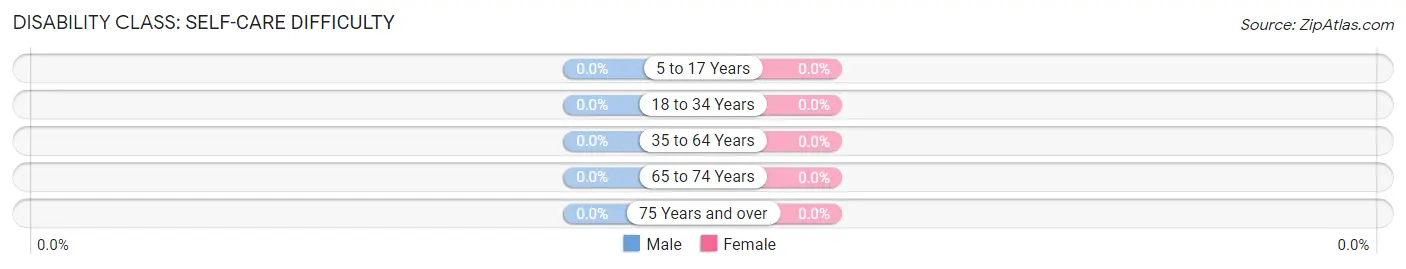
| Age Bracket | Male | Female |
| 5 to 17 Years | 0 (0.0%) | 0 (0.0%) |
| 18 to 34 Years | 0 (0.0%) | 0 (0.0%) |
| 35 to 64 Years | 0 (0.0%) | 0 (0.0%) |
| 65 to 74 Years | 0 (0.0%) | 0 (0.0%) |
| 75 Years and over | 0 (0.0%) | 0 (0.0%) |
Technology Access in Happy Valley
Computing Device Access in Happy Valley
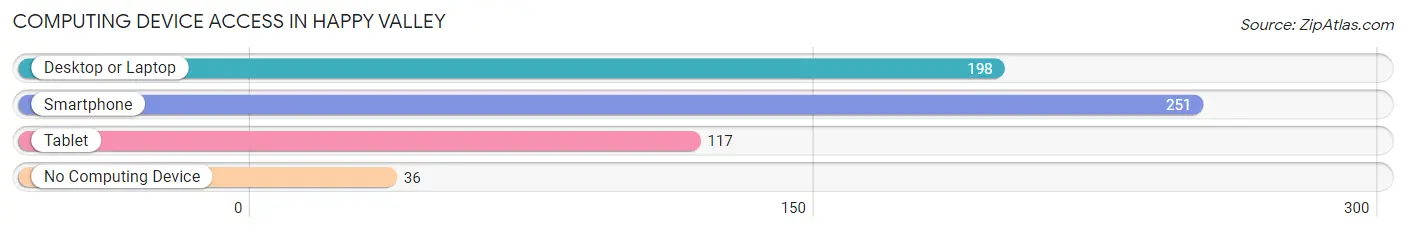
| Device Type | # Households | % Households |
| Desktop or Laptop | 198 | 69.0% |
| Smartphone | 251 | 87.5% |
| Tablet | 117 | 40.8% |
| No Computing Device | 36 | 12.5% |
| Total | 287 | 100.0% |
Internet Access in Happy Valley
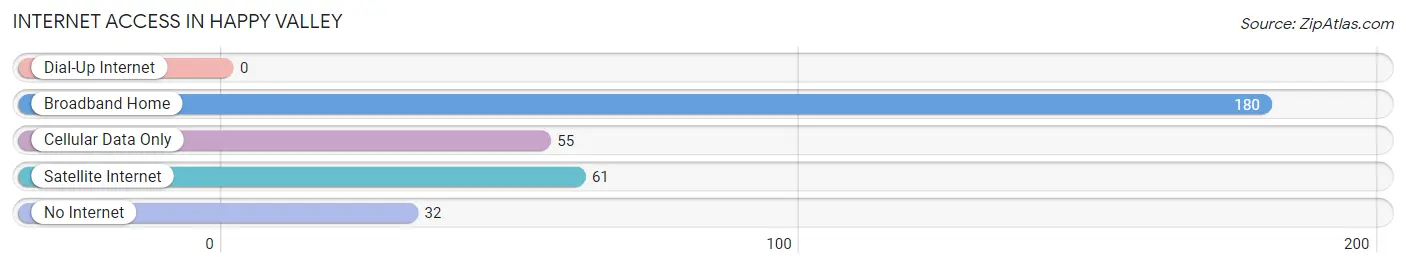
| Internet Type | # Households | % Households |
| Dial-Up Internet | 0 | 0.0% |
| Broadband Home | 180 | 62.7% |
| Cellular Data Only | 55 | 19.2% |
| Satellite Internet | 61 | 21.2% |
| No Internet | 32 | 11.2% |
| Total | 287 | 100.0% |
Happy Valley Summary
History
Happy Valley is a small unincorporated community located in the San Juan County of New Mexico. It is situated in the northwest corner of the state, near the Arizona border. The area was first settled in the late 1800s by Mormon settlers who were looking for a place to practice their faith. The town was originally called “Mormon Valley” but was later changed to “Happy Valley” due to the joyous atmosphere of the community.
The town was officially established in 1891 and was home to a variety of businesses, including a general store, a post office, a blacksmith shop, and a school. The town was also home to a number of churches, including the Church of Jesus Christ of Latter-day Saints, the Methodist Episcopal Church, and the Presbyterian Church.
In the early 1900s, the town experienced a period of growth and prosperity. The population increased from around 200 in 1900 to over 500 in 1910. During this time, the town was home to a variety of businesses, including a hotel, a bank, a newspaper, and a movie theater.
The town experienced a period of decline in the mid-1900s, as many of the businesses closed and the population decreased. By the 1970s, the population had dropped to around 200.
Geography
Happy Valley is located in the northwest corner of New Mexico, near the Arizona border. The town is situated in the San Juan Basin, which is a large area of desert and semi-arid land. The area is characterized by flat terrain and sparse vegetation.
The town is located at an elevation of 4,800 feet and has a mild climate, with temperatures ranging from the mid-50s in the winter to the mid-90s in the summer. The area receives an average of 8 inches of precipitation per year.
Economy
The economy of Happy Valley is largely based on agriculture and tourism. The town is home to a number of farms, which produce a variety of crops, including alfalfa, corn, and wheat. The town is also home to a number of tourist attractions, including the nearby Navajo Nation and the Four Corners Monument.
The town is also home to a number of small businesses, including restaurants, gas stations, and convenience stores. The town is also home to a number of art galleries, which feature the work of local artists.
Demographics
As of the 2010 census, the population of Happy Valley was 545. The town is predominantly white, with a small Hispanic population. The median household income is $35,000, and the median home value is $90,000. The town has a poverty rate of 16.7%.
Conclusion
Happy Valley is a small unincorporated community located in the San Juan County of New Mexico. It is situated in the northwest corner of the state, near the Arizona border. The town was first settled in the late 1800s by Mormon settlers and was officially established in 1891. The town experienced a period of growth and prosperity in the early 1900s, but has since experienced a period of decline. The economy of Happy Valley is largely based on agriculture and tourism, and the town is home to a number of small businesses. As of the 2010 census, the population of Happy Valley was 545.
Common Questions
What is Per Capita Income in Happy Valley?
Per Capita income in Happy Valley is $23,167.
What is the Median Family Income in Happy Valley?
Median Family Income in Happy Valley is $80,577.
What is the Median Household income in Happy Valley?
Median Household Income in Happy Valley is $61,083.
What is Inequality or Gini Index in Happy Valley?
Inequality or Gini Index in Happy Valley is 0.49.
What is the Total Population of Happy Valley?
Total Population of Happy Valley is 629.
What is the Total Male Population of Happy Valley?
Total Male Population of Happy Valley is 357.
What is the Total Female Population of Happy Valley?
Total Female Population of Happy Valley is 272.
What is the Ratio of Males per 100 Females in Happy Valley?
There are 131.25 Males per 100 Females in Happy Valley.
What is the Ratio of Females per 100 Males in Happy Valley?
There are 76.19 Females per 100 Males in Happy Valley.
What is the Median Population Age in Happy Valley?
Median Population Age in Happy Valley is 45.3 Years.
What is the Average Family Size in Happy Valley
Average Family Size in Happy Valley is 2.5 People.
What is the Average Household Size in Happy Valley
Average Household Size in Happy Valley is 2.2 People.
How Large is the Labor Force in Happy Valley?
There are 252 People in the Labor Forcein in Happy Valley.
What is the Percentage of People in the Labor Force in Happy Valley?
43.4% of People are in the Labor Force in Happy Valley.
What is the Unemployment Rate in Happy Valley?
Unemployment Rate in Happy Valley is 23.0%.