Beclabito, NM Map & Demographics
Beclabito Map
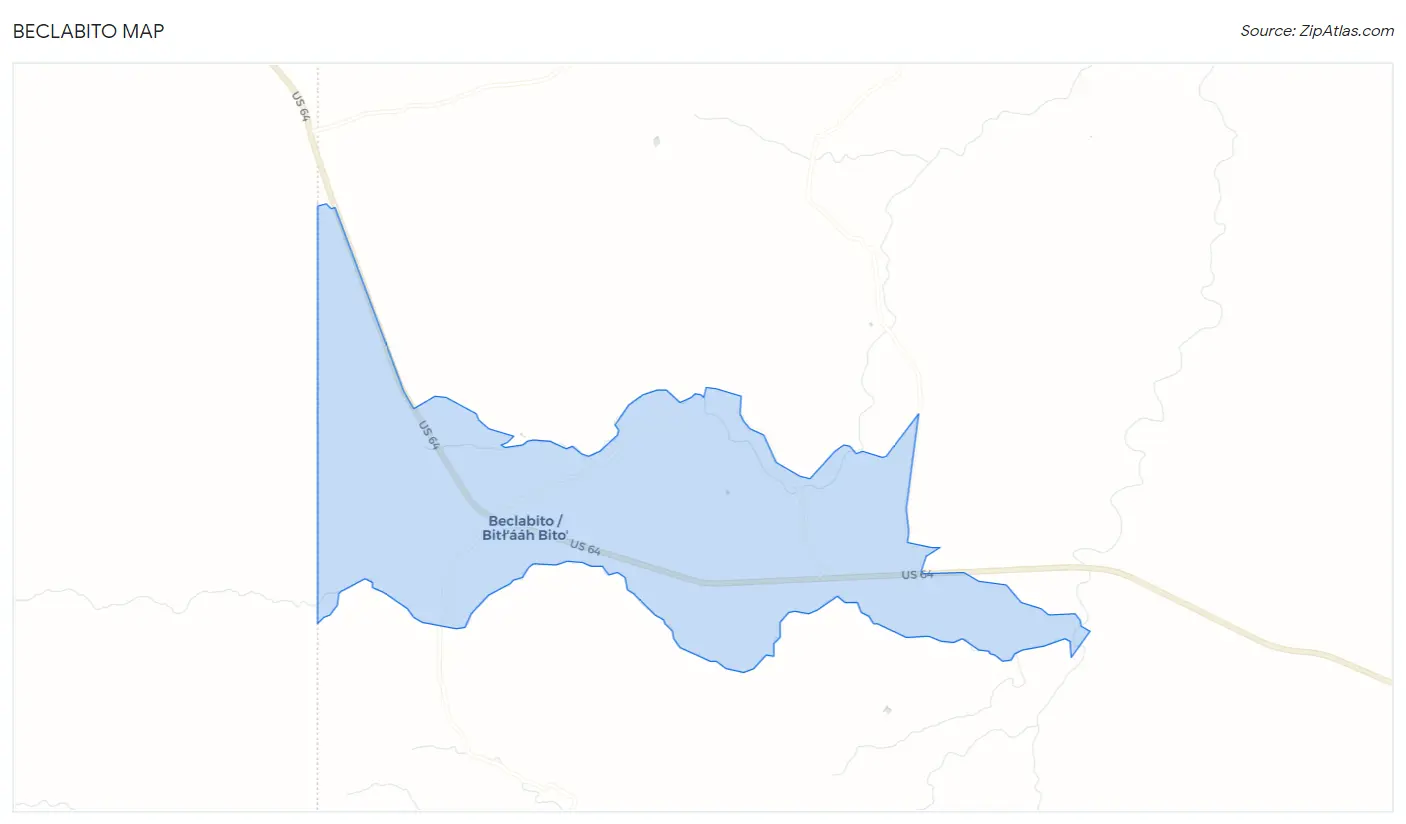
Beclabito Overview
$21,965
PER CAPITA INCOME
$61,750
AVG FAMILY INCOME
$60,500
AVG HOUSEHOLD INCOME
10.4%
WAGE / INCOME GAP [ % ]
89.6¢/ $1
WAGE / INCOME GAP [ $ ]
0.31
INEQUALITY / GINI INDEX
238
TOTAL POPULATION
125
MALE POPULATION
113
FEMALE POPULATION
110.62
MALES / 100 FEMALES
90.40
FEMALES / 100 MALES
44.0
MEDIAN AGE
3.7
AVG FAMILY SIZE
3.2
AVG HOUSEHOLD SIZE
110
LABOR FORCE [ PEOPLE ]
55.3%
PERCENT IN LABOR FORCE
16.4%
UNEMPLOYMENT RATE
Income in Beclabito
Income Overview in Beclabito
Per Capita Income in Beclabito is $21,965, while median incomes of families and households are $61,750 and $60,500 respectively.
| Characteristic | Number | Measure |
| Per Capita Income | 238 | $21,965 |
| Median Family Income | 57 | $61,750 |
| Mean Family Income | 57 | $68,044 |
| Median Household Income | 74 | $60,500 |
| Mean Household Income | 74 | $61,874 |
| Income Deficit | 57 | $0 |
| Wage / Income Gap (%) | 238 | 10.42% |
| Wage / Income Gap ($) | 238 | 89.58¢ per $1 |
| Gini / Inequality Index | 238 | 0.31 |
Earnings by Sex in Beclabito
Average Earnings in Beclabito are $37,500, $35,833 for men and $40,000 for women, a difference of 10.4%.
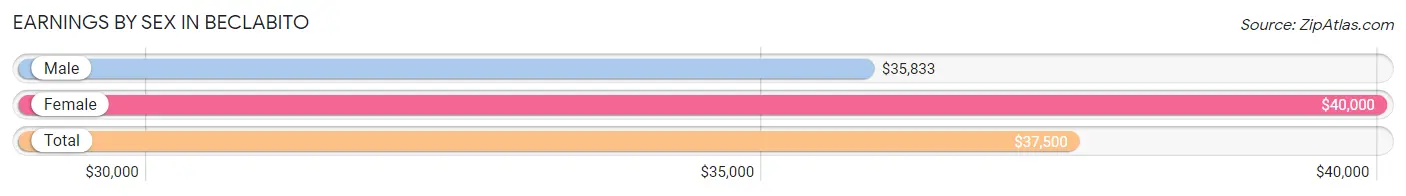
| Sex | Number | Average Earnings |
| Male | 66 (62.3%) | $35,833 |
| Female | 40 (37.7%) | $40,000 |
| Total | 106 (100.0%) | $37,500 |
Earnings by Sex by Income Bracket in Beclabito
The most common earnings brackets in Beclabito are $55,000 to $64,999 for men (13 | 19.7%) and $40,000 to $44,999 for women (8 | 20.0%).
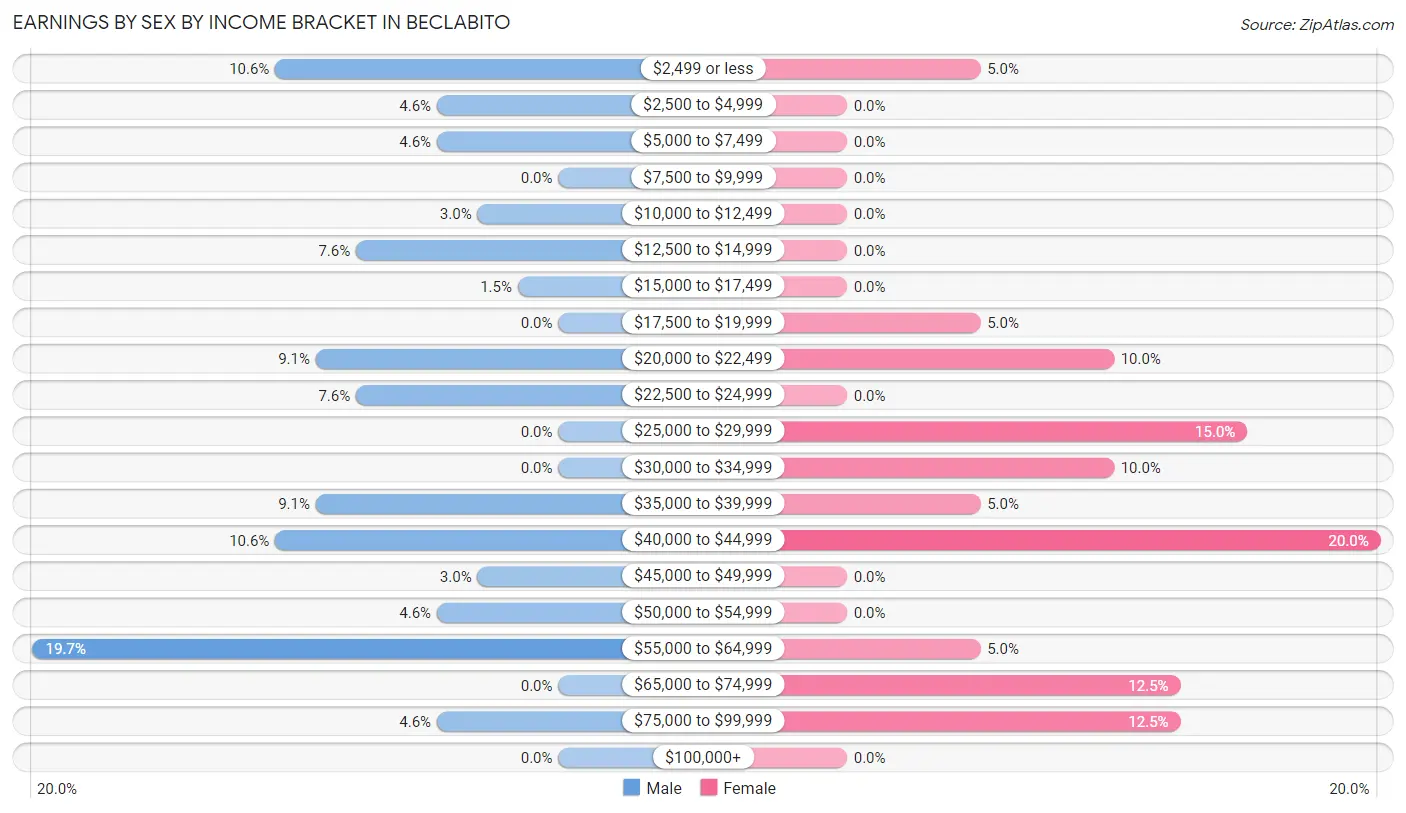
| Income | Male | Female |
| $2,499 or less | 7 (10.6%) | 2 (5.0%) |
| $2,500 to $4,999 | 3 (4.5%) | 0 (0.0%) |
| $5,000 to $7,499 | 3 (4.5%) | 0 (0.0%) |
| $7,500 to $9,999 | 0 (0.0%) | 0 (0.0%) |
| $10,000 to $12,499 | 2 (3.0%) | 0 (0.0%) |
| $12,500 to $14,999 | 5 (7.6%) | 0 (0.0%) |
| $15,000 to $17,499 | 1 (1.5%) | 0 (0.0%) |
| $17,500 to $19,999 | 0 (0.0%) | 2 (5.0%) |
| $20,000 to $22,499 | 6 (9.1%) | 4 (10.0%) |
| $22,500 to $24,999 | 5 (7.6%) | 0 (0.0%) |
| $25,000 to $29,999 | 0 (0.0%) | 6 (15.0%) |
| $30,000 to $34,999 | 0 (0.0%) | 4 (10.0%) |
| $35,000 to $39,999 | 6 (9.1%) | 2 (5.0%) |
| $40,000 to $44,999 | 7 (10.6%) | 8 (20.0%) |
| $45,000 to $49,999 | 2 (3.0%) | 0 (0.0%) |
| $50,000 to $54,999 | 3 (4.5%) | 0 (0.0%) |
| $55,000 to $64,999 | 13 (19.7%) | 2 (5.0%) |
| $65,000 to $74,999 | 0 (0.0%) | 5 (12.5%) |
| $75,000 to $99,999 | 3 (4.5%) | 5 (12.5%) |
| $100,000+ | 0 (0.0%) | 0 (0.0%) |
| Total | 66 (100.0%) | 40 (100.0%) |
Earnings by Sex by Educational Attainment in Beclabito
Average earnings in Beclabito are $37,083 for men and $40,000 for women, a difference of 7.3%. Men with an educational attainment of college or associate's degree enjoy the highest average annual earnings of $37,500, while those with high school diploma education earn the least with $23,333. Women with an educational attainment of college or associate's degree earn the most with the average annual earnings of $40,750, while those with high school diploma education have the smallest earnings of $21,250.
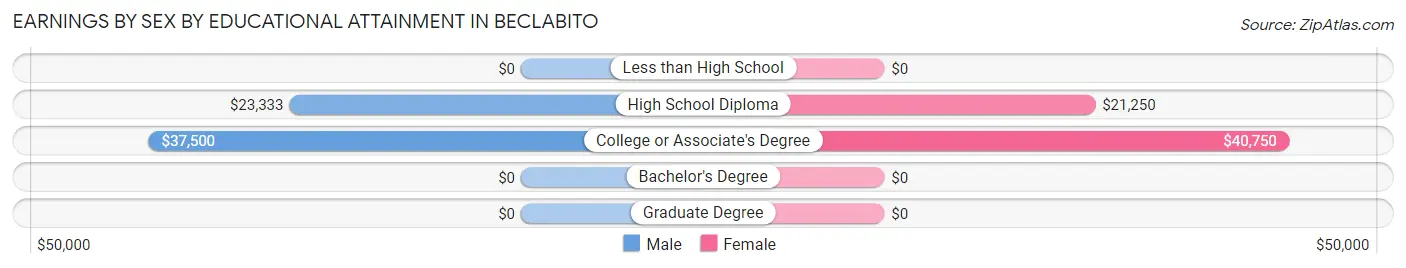
| Educational Attainment | Male Income | Female Income |
| Less than High School | - | - |
| High School Diploma | $23,333 | $21,250 |
| College or Associate's Degree | $37,500 | $40,750 |
| Bachelor's Degree | - | - |
| Graduate Degree | - | - |
| Total | $37,083 | $40,000 |
Family Income in Beclabito
Family Income Brackets in Beclabito
According to the Beclabito family income data, there are 20 families falling into the $50,000 to $74,999 income range, which is the most common income bracket and makes up 35.1% of all families.
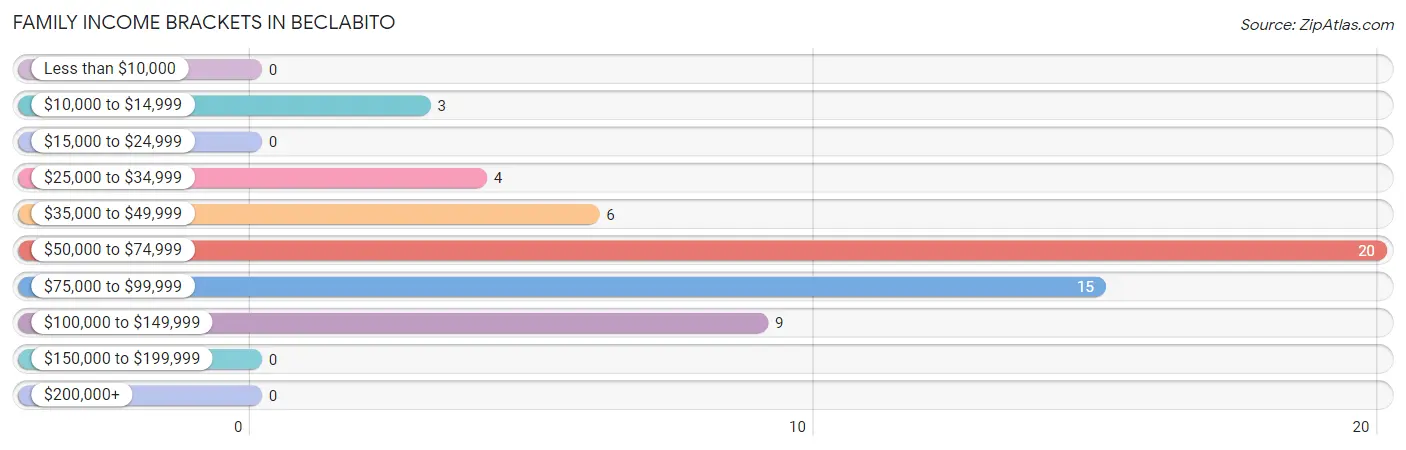
| Income Bracket | # Families | % Families |
| Less than $10,000 | 0 | 0.0% |
| $10,000 to $14,999 | 3 | 5.3% |
| $15,000 to $24,999 | 0 | 0.0% |
| $25,000 to $34,999 | 4 | 7.0% |
| $35,000 to $49,999 | 6 | 10.5% |
| $50,000 to $74,999 | 20 | 35.1% |
| $75,000 to $99,999 | 15 | 26.3% |
| $100,000 to $149,999 | 9 | 15.8% |
| $150,000 to $199,999 | 0 | 0.0% |
| $200,000+ | 0 | 0.0% |
Family Income by Famaliy Size in Beclabito
5-person families (8 | 14.0%) account for the highest median family income in Beclabito with $93,750 per family, while 2-person families (24 | 42.1%) have the highest median income of $25,625 per family member.
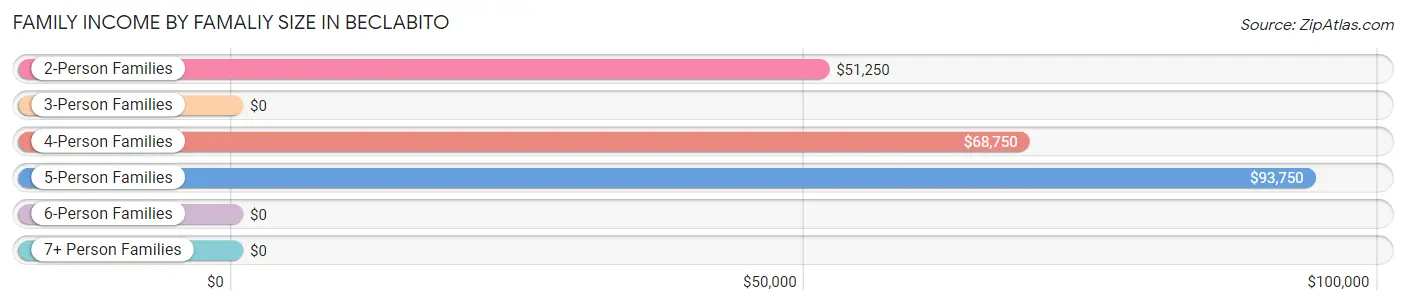
| Income Bracket | # Families | Median Income |
| 2-Person Families | 24 (42.1%) | $51,250 |
| 3-Person Families | 5 (8.8%) | $0 |
| 4-Person Families | 13 (22.8%) | $68,750 |
| 5-Person Families | 8 (14.0%) | $93,750 |
| 6-Person Families | 7 (12.3%) | $0 |
| 7+ Person Families | 0 (0.0%) | $0 |
| Total | 57 (100.0%) | $61,750 |
Family Income by Number of Earners in Beclabito
The median family income in Beclabito is $61,750, with families comprising 3+ earners (8) having the highest median family income of $93,750, while families with no earners (7) have the lowest median family income of $25,625, accounting for 14.0% and 12.3% of families, respectively.
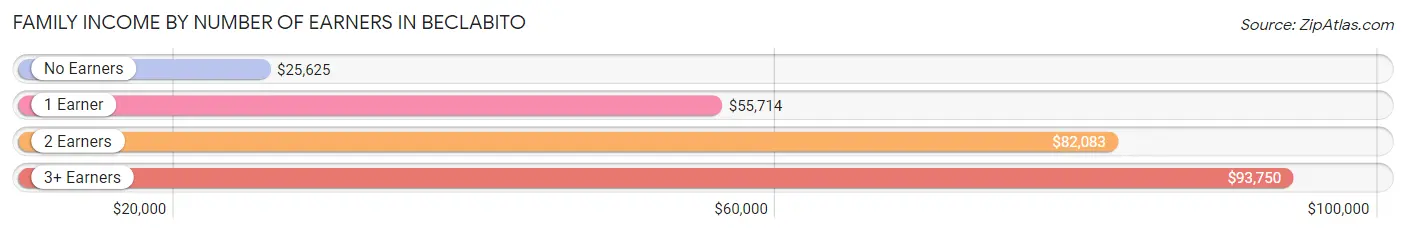
| Number of Earners | # Families | Median Income |
| No Earners | 7 (12.3%) | $25,625 |
| 1 Earner | 26 (45.6%) | $55,714 |
| 2 Earners | 16 (28.1%) | $82,083 |
| 3+ Earners | 8 (14.0%) | $93,750 |
| Total | 57 (100.0%) | $61,750 |
Household Income in Beclabito
Household Income Brackets in Beclabito
With 21 households falling in the category, the $75,000 to $99,999 income range is the most frequent in Beclabito, accounting for 28.4% of all households.
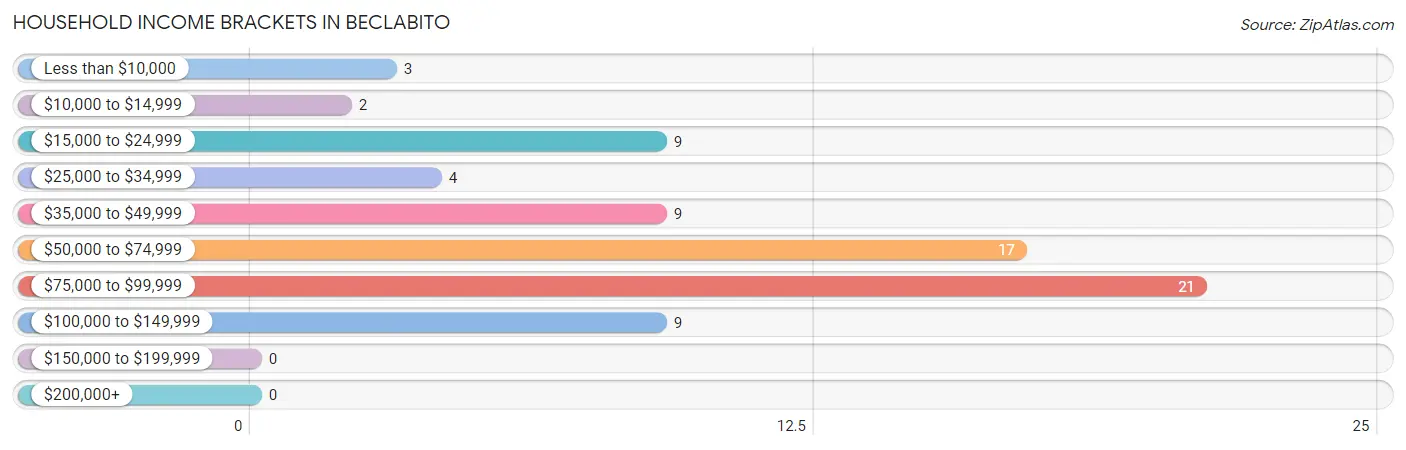
| Income Bracket | # Households | % Households |
| Less than $10,000 | 3 | 4.1% |
| $10,000 to $14,999 | 2 | 2.7% |
| $15,000 to $24,999 | 9 | 12.2% |
| $25,000 to $34,999 | 4 | 5.4% |
| $35,000 to $49,999 | 9 | 12.2% |
| $50,000 to $74,999 | 17 | 23.0% |
| $75,000 to $99,999 | 21 | 28.4% |
| $100,000 to $149,999 | 9 | 12.2% |
| $150,000 to $199,999 | 0 | 0.0% |
| $200,000+ | 0 | 0.0% |
Household Income by Householder Age in Beclabito
The median household income in Beclabito is $60,500, with the highest median household income of $69,583 found in the 45 to 64 years age bracket for the primary householder. A total of 31 households (41.9%) fall into this category.
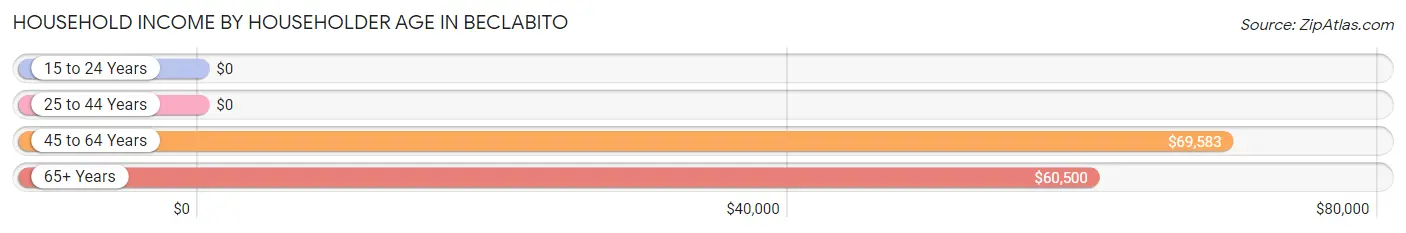
| Income Bracket | # Households | Median Income |
| 15 to 24 Years | 0 (0.0%) | $0 |
| 25 to 44 Years | 9 (12.2%) | $0 |
| 45 to 64 Years | 31 (41.9%) | $69,583 |
| 65+ Years | 34 (46.0%) | $60,500 |
| Total | 74 (100.0%) | $60,500 |
Poverty in Beclabito
Income Below Poverty by Sex and Age in Beclabito
With 5.6% poverty level for males and 5.3% for females among the residents of Beclabito, 55 to 64 year old males and 65 to 74 year old females are the most vulnerable to poverty, with 3 males (16.7%) and 3 females (42.9%) in their respective age groups living below the poverty level.
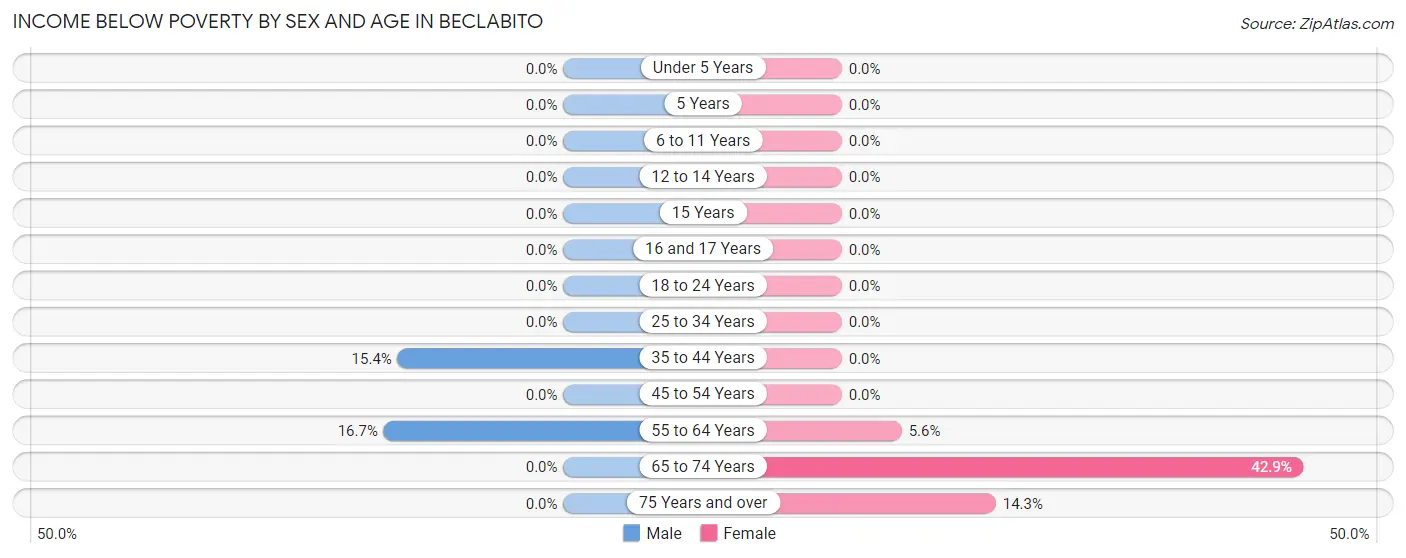
| Age Bracket | Male | Female |
| Under 5 Years | 0 (0.0%) | 0 (0.0%) |
| 5 Years | 0 (0.0%) | 0 (0.0%) |
| 6 to 11 Years | 0 (0.0%) | 0 (0.0%) |
| 12 to 14 Years | 0 (0.0%) | 0 (0.0%) |
| 15 Years | 0 (0.0%) | 0 (0.0%) |
| 16 and 17 Years | 0 (0.0%) | 0 (0.0%) |
| 18 to 24 Years | 0 (0.0%) | 0 (0.0%) |
| 25 to 34 Years | 0 (0.0%) | 0 (0.0%) |
| 35 to 44 Years | 4 (15.4%) | 0 (0.0%) |
| 45 to 54 Years | 0 (0.0%) | 0 (0.0%) |
| 55 to 64 Years | 3 (16.7%) | 1 (5.6%) |
| 65 to 74 Years | 0 (0.0%) | 3 (42.9%) |
| 75 Years and over | 0 (0.0%) | 2 (14.3%) |
| Total | 7 (5.6%) | 6 (5.3%) |
Income Above Poverty by Sex and Age in Beclabito
According to the poverty statistics in Beclabito, males aged under 5 years and females aged under 5 years are the age groups that are most secure financially, with 100.0% of males and 100.0% of females in these age groups living above the poverty line.
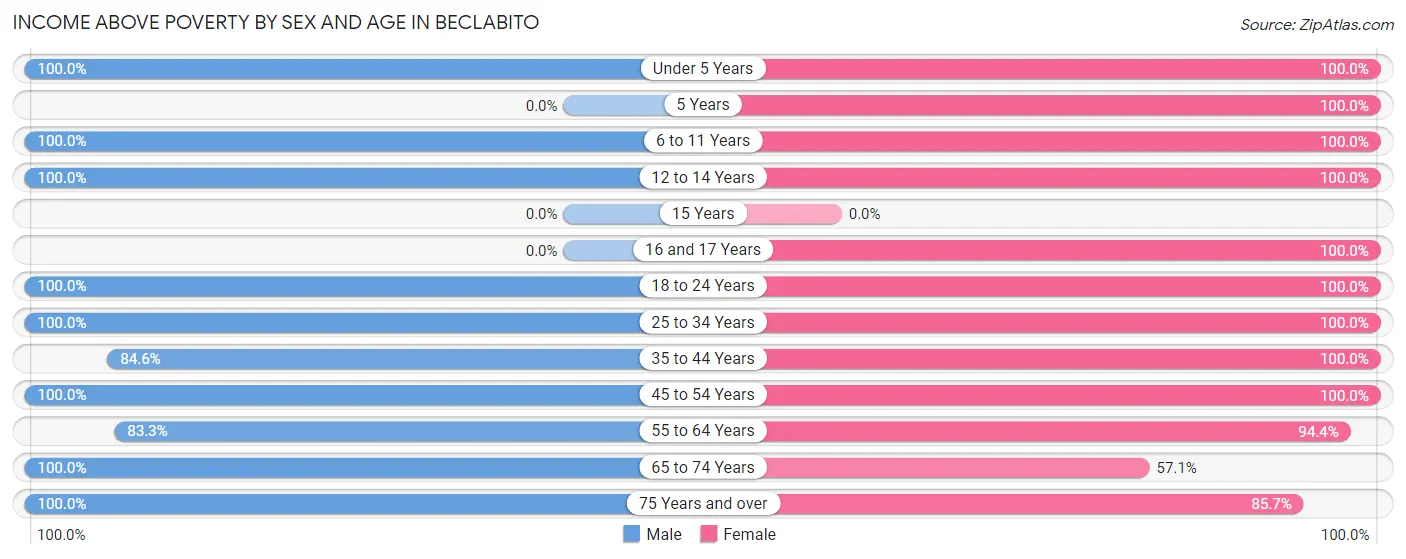
| Age Bracket | Male | Female |
| Under 5 Years | 2 (100.0%) | 4 (100.0%) |
| 5 Years | 0 (0.0%) | 1 (100.0%) |
| 6 to 11 Years | 6 (100.0%) | 13 (100.0%) |
| 12 to 14 Years | 10 (100.0%) | 3 (100.0%) |
| 15 Years | 0 (0.0%) | 0 (0.0%) |
| 16 and 17 Years | 0 (0.0%) | 4 (100.0%) |
| 18 to 24 Years | 6 (100.0%) | 4 (100.0%) |
| 25 to 34 Years | 16 (100.0%) | 20 (100.0%) |
| 35 to 44 Years | 22 (84.6%) | 13 (100.0%) |
| 45 to 54 Years | 18 (100.0%) | 12 (100.0%) |
| 55 to 64 Years | 15 (83.3%) | 17 (94.4%) |
| 65 to 74 Years | 21 (100.0%) | 4 (57.1%) |
| 75 Years and over | 2 (100.0%) | 12 (85.7%) |
| Total | 118 (94.4%) | 107 (94.7%) |
Income Below Poverty Among Married-Couple Families in Beclabito
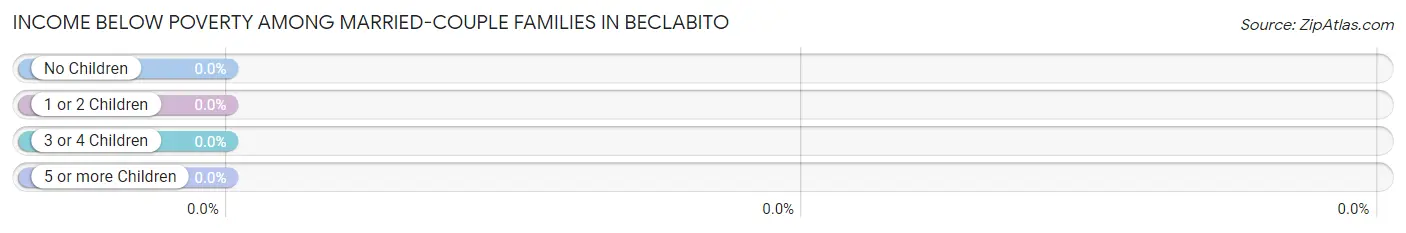
| Children | Above Poverty | Below Poverty |
| No Children | 15 (100.0%) | 0 (0.0%) |
| 1 or 2 Children | 16 (100.0%) | 0 (0.0%) |
| 3 or 4 Children | 7 (100.0%) | 0 (0.0%) |
| 5 or more Children | 0 (0.0%) | 0 (0.0%) |
| Total | 38 (100.0%) | 0 (0.0%) |
Income Below Poverty Among Single-Parent Households in Beclabito
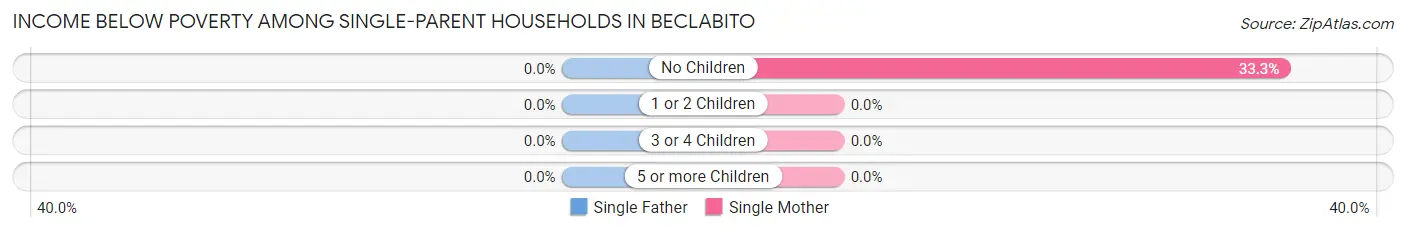
| Children | Single Father | Single Mother |
| No Children | 0 (0.0%) | 3 (33.3%) |
| 1 or 2 Children | 0 (0.0%) | 0 (0.0%) |
| 3 or 4 Children | 0 (0.0%) | 0 (0.0%) |
| 5 or more Children | 0 (0.0%) | 0 (0.0%) |
| Total | 0 (0.0%) | 3 (27.3%) |
Income Below Poverty Among Married-Couple vs Single-Parent Households in Beclabito
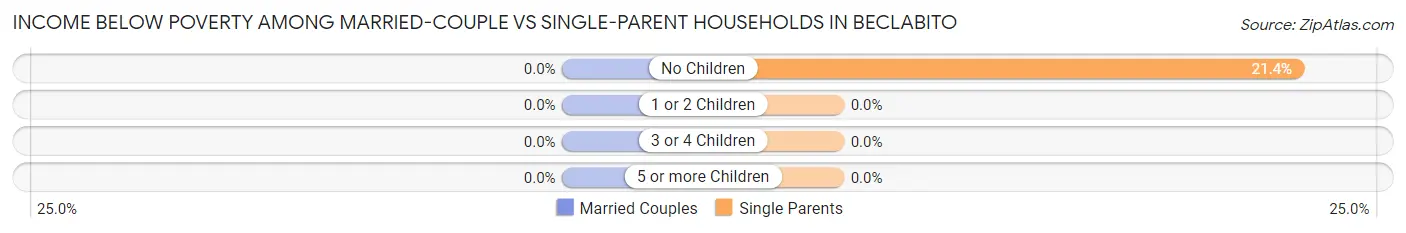
| Children | Married-Couple Families | Single-Parent Households |
| No Children | 0 (0.0%) | 3 (21.4%) |
| 1 or 2 Children | 0 (0.0%) | 0 (0.0%) |
| 3 or 4 Children | 0 (0.0%) | 0 (0.0%) |
| 5 or more Children | 0 (0.0%) | 0 (0.0%) |
| Total | 0 (0.0%) | 3 (15.8%) |
Race in Beclabito
The most populous races in Beclabito are Native / Alaskan (224 | 94.1%), Hispanic or Latino (14 | 5.9%), and Two or more Races (7 | 2.9%).
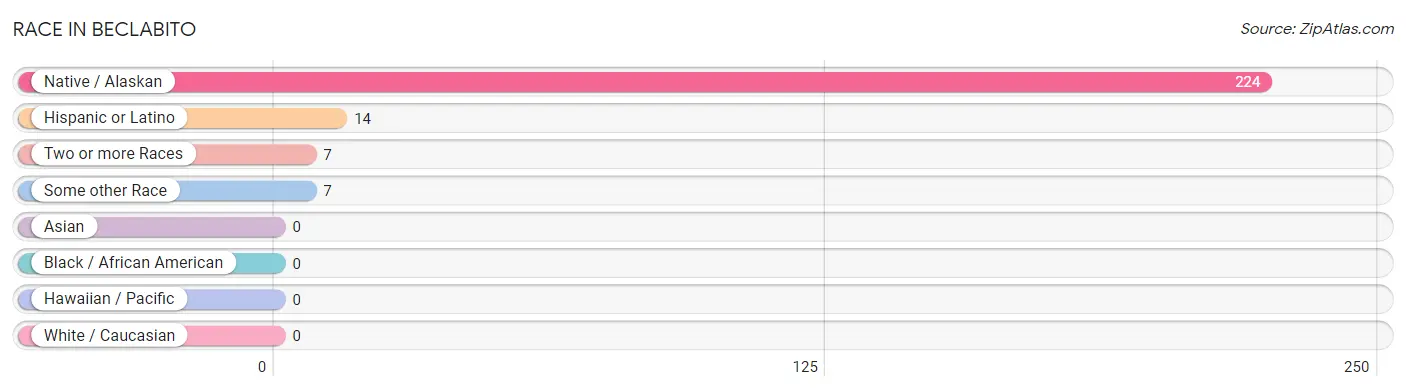
| Race | # Population | % Population |
| Asian | 0 | 0.0% |
| Black / African American | 0 | 0.0% |
| Hawaiian / Pacific | 0 | 0.0% |
| Hispanic or Latino | 14 | 5.9% |
| Native / Alaskan | 224 | 94.1% |
| White / Caucasian | 0 | 0.0% |
| Two or more Races | 7 | 2.9% |
| Some other Race | 7 | 2.9% |
| Total | 238 | 100.0% |
Ancestry in Beclabito
The most populous ancestries reported in Beclabito are Navajo (204 | 85.7%), Pueblo (27 | 11.3%), Apache (10 | 4.2%), Mexican (9 | 3.8%), and Spaniard (5 | 2.1%), together accounting for 107.1% of all Beclabito residents.
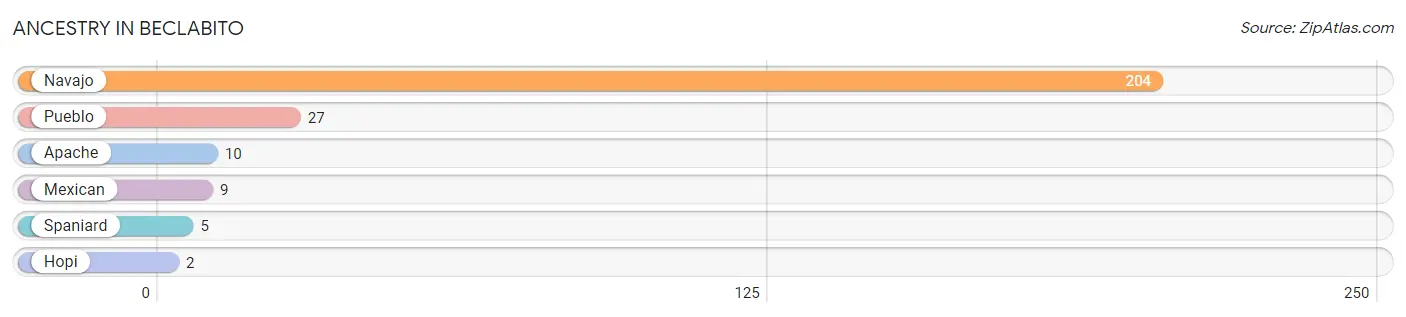
| Ancestry | # Population | % Population |
| Apache | 10 | 4.2% |
| Hopi | 2 | 0.8% |
| Mexican | 9 | 3.8% |
| Navajo | 204 | 85.7% |
| Pueblo | 27 | 11.3% |
| Spaniard | 5 | 2.1% | View All 6 Rows |
Immigrants in Beclabito

| Immigration Origin | # Population | % Population | View All 0 Rows |
Sex and Age in Beclabito
Sex and Age in Beclabito
The most populous age groups in Beclabito are 40 to 44 Years (21 | 16.8%) for men and 25 to 29 Years (13 | 11.5%) for women.
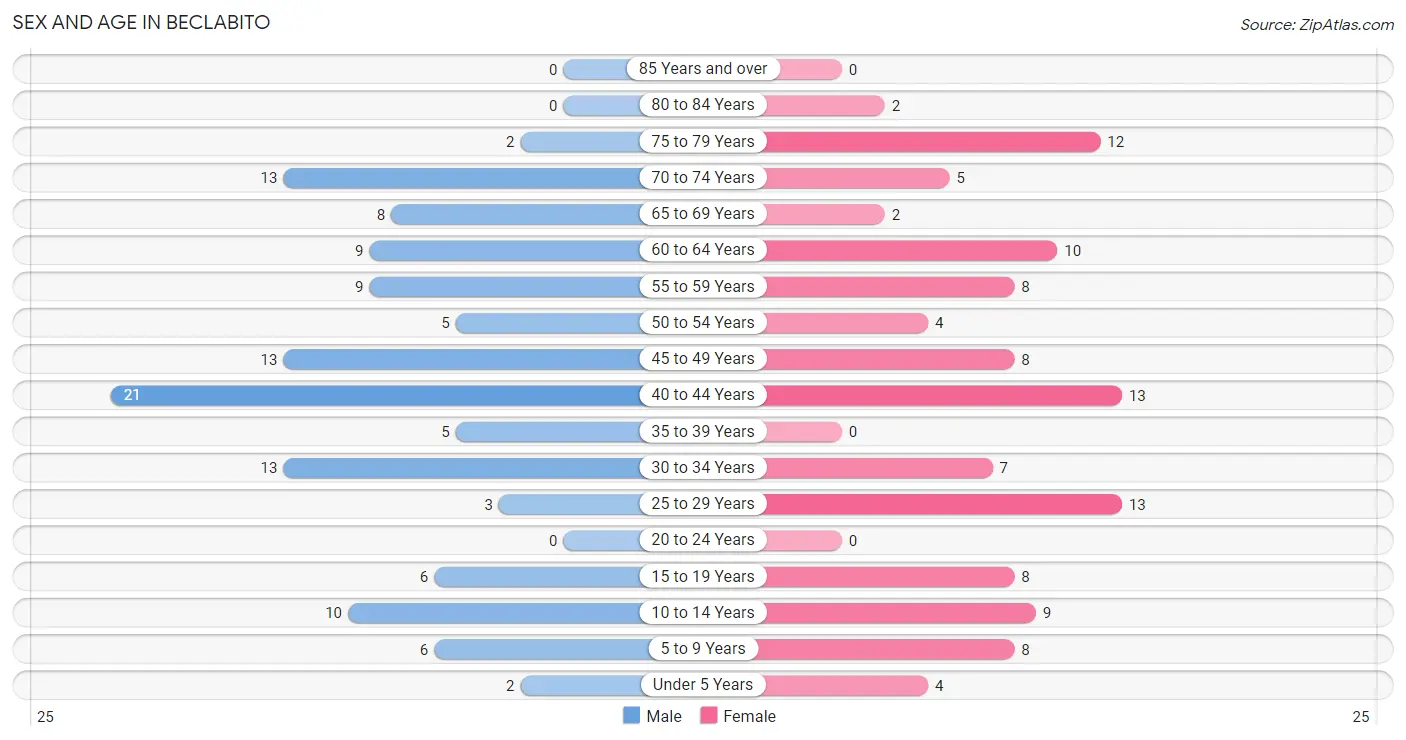
| Age Bracket | Male | Female |
| Under 5 Years | 2 (1.6%) | 4 (3.5%) |
| 5 to 9 Years | 6 (4.8%) | 8 (7.1%) |
| 10 to 14 Years | 10 (8.0%) | 9 (8.0%) |
| 15 to 19 Years | 6 (4.8%) | 8 (7.1%) |
| 20 to 24 Years | 0 (0.0%) | 0 (0.0%) |
| 25 to 29 Years | 3 (2.4%) | 13 (11.5%) |
| 30 to 34 Years | 13 (10.4%) | 7 (6.2%) |
| 35 to 39 Years | 5 (4.0%) | 0 (0.0%) |
| 40 to 44 Years | 21 (16.8%) | 13 (11.5%) |
| 45 to 49 Years | 13 (10.4%) | 8 (7.1%) |
| 50 to 54 Years | 5 (4.0%) | 4 (3.5%) |
| 55 to 59 Years | 9 (7.2%) | 8 (7.1%) |
| 60 to 64 Years | 9 (7.2%) | 10 (8.8%) |
| 65 to 69 Years | 8 (6.4%) | 2 (1.8%) |
| 70 to 74 Years | 13 (10.4%) | 5 (4.4%) |
| 75 to 79 Years | 2 (1.6%) | 12 (10.6%) |
| 80 to 84 Years | 0 (0.0%) | 2 (1.8%) |
| 85 Years and over | 0 (0.0%) | 0 (0.0%) |
| Total | 125 (100.0%) | 113 (100.0%) |
Families and Households in Beclabito
Median Family Size in Beclabito
The median family size in Beclabito is 3.72 persons per family, with married-couple families (38 | 66.7%) accounting for the largest median family size of 3.97 persons per family. On the other hand, single male/father families (8 | 14.0%) represent the smallest median family size with 3.00 persons per family.
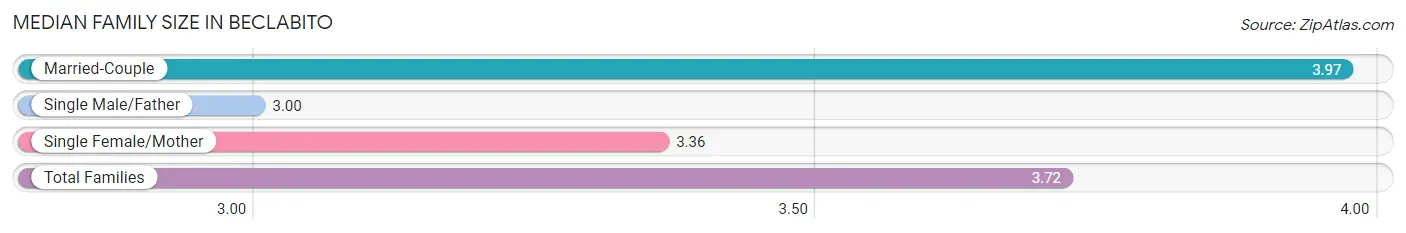
| Family Type | # Families | Family Size |
| Married-Couple | 38 (66.7%) | 3.97 |
| Single Male/Father | 8 (14.0%) | 3.00 |
| Single Female/Mother | 11 (19.3%) | 3.36 |
| Total Families | 57 (100.0%) | 3.72 |
Median Household Size in Beclabito
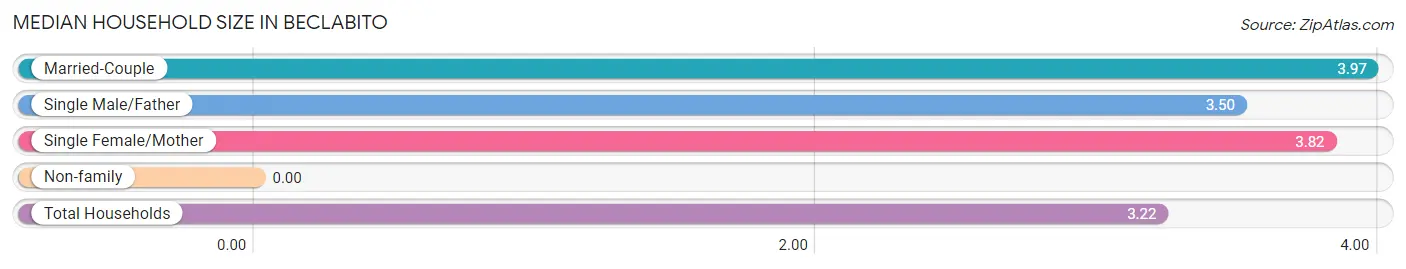
| Household Type | # Households | Household Size |
| Married-Couple | 38 (51.3%) | 3.97 |
| Single Male/Father | 8 (10.8%) | 3.50 |
| Single Female/Mother | 11 (14.9%) | 3.82 |
| Non-family | 17 (23.0%) | - |
| Total Households | 74 (100.0%) | 3.22 |
Household Size by Marriage Status in Beclabito
Out of a total of 74 households in Beclabito, 57 (77.0%) are family households, while 17 (23.0%) are nonfamily households. The most numerous type of family households are 2-person households, comprising 18, and the most common type of nonfamily households are 1-person households, comprising 17.
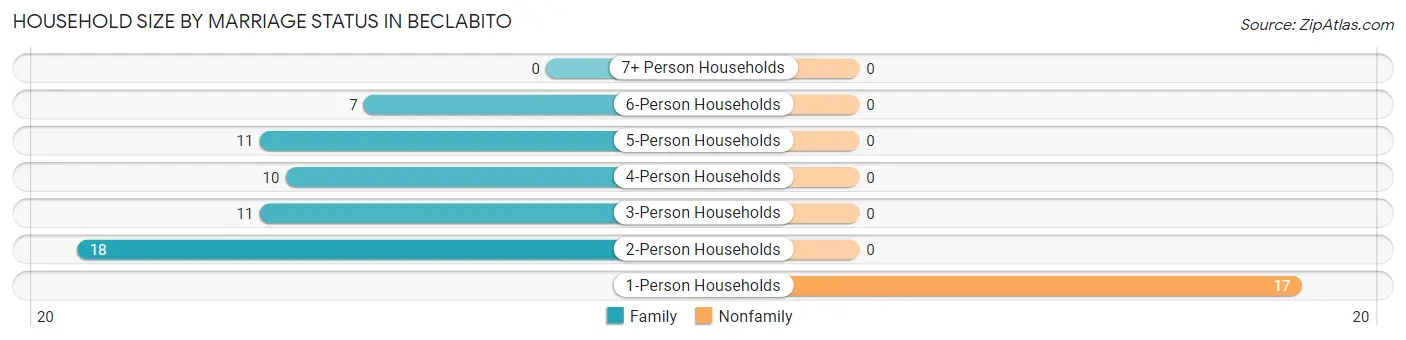
| Household Size | Family Households | Nonfamily Households |
| 1-Person Households | - | 17 (23.0%) |
| 2-Person Households | 18 (24.3%) | 0 (0.0%) |
| 3-Person Households | 11 (14.9%) | 0 (0.0%) |
| 4-Person Households | 10 (13.5%) | 0 (0.0%) |
| 5-Person Households | 11 (14.9%) | 0 (0.0%) |
| 6-Person Households | 7 (9.5%) | 0 (0.0%) |
| 7+ Person Households | 0 (0.0%) | 0 (0.0%) |
| Total | 57 (77.0%) | 17 (23.0%) |
Female Fertility in Beclabito
Fertility by Age in Beclabito
| Age Bracket | Women with Births | Births / 1,000 Women |
| 15 to 19 years | 0 (0.0%) | 0.0 |
| 20 to 34 years | 0 (0.0%) | 0.0 |
| 35 to 50 years | 0 (0.0%) | 0.0 |
| Total | 0 (0.0%) | 0.0 |
Fertility by Age by Marriage Status in Beclabito
| Age Bracket | Married | Unmarried |
| 15 to 19 years | 0 (0.0%) | 0 (0.0%) |
| 20 to 34 years | 0 (0.0%) | 0 (0.0%) |
| 35 to 50 years | 0 (0.0%) | 0 (0.0%) |
| Total | 0 (0.0%) | 0 (0.0%) |
Fertility by Education in Beclabito
| Educational Attainment | Women with Births | Births / 1,000 Women |
| Less than High School | 0 (0.0%) | 0.0 |
| High School Diploma | 0 (0.0%) | 0.0 |
| College or Associate's Degree | 0 (0.0%) | 0.0 |
| Bachelor's Degree | 0 (0.0%) | 0.0 |
| Graduate Degree | 0 (0.0%) | 0.0 |
| Total | 0 (0.0%) | 0.0 |
Fertility by Education by Marriage Status in Beclabito
| Educational Attainment | Married | Unmarried |
| Less than High School | 0 (0.0%) | 0 (0.0%) |
| High School Diploma | 0 (0.0%) | 0 (0.0%) |
| College or Associate's Degree | 0 (0.0%) | 0 (0.0%) |
| Bachelor's Degree | 0 (0.0%) | 0 (0.0%) |
| Graduate Degree | 0 (0.0%) | 0 (0.0%) |
| Total | 0 (0.0%) | 0 (0.0%) |
Employment Characteristics in Beclabito
Employment by Class of Employer in Beclabito
Among the 88 employed individuals in Beclabito, private company employees (40 | 45.5%), local government employees (28 | 31.8%), and federal government employees (14 | 15.9%) make up the most common classes of employment.
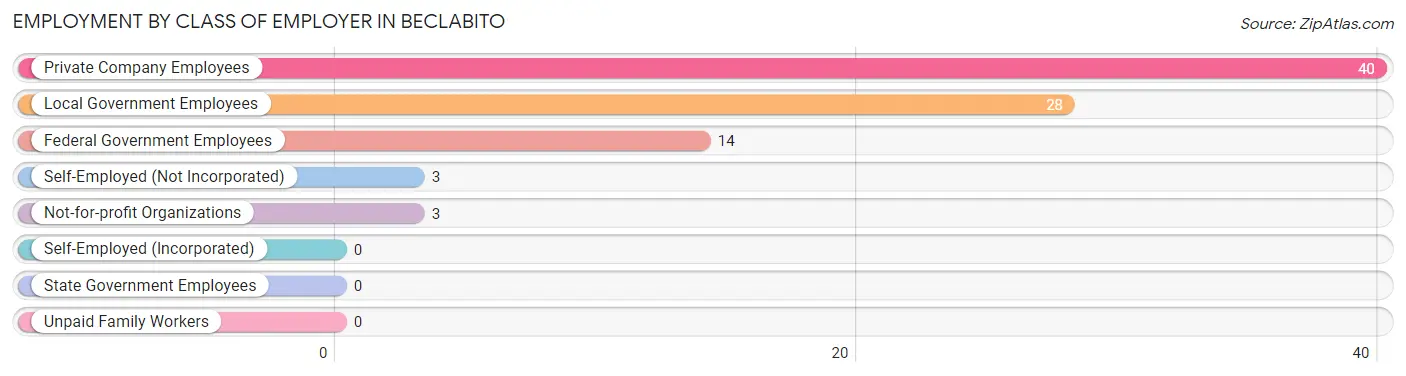
| Employer Class | # Employees | % Employees |
| Private Company Employees | 40 | 45.5% |
| Self-Employed (Incorporated) | 0 | 0.0% |
| Self-Employed (Not Incorporated) | 3 | 3.4% |
| Not-for-profit Organizations | 3 | 3.4% |
| Local Government Employees | 28 | 31.8% |
| State Government Employees | 0 | 0.0% |
| Federal Government Employees | 14 | 15.9% |
| Unpaid Family Workers | 0 | 0.0% |
| Total | 88 | 100.0% |
Employment Status by Age in Beclabito
According to the labor force statistics for Beclabito, out of the total population over 16 years of age (199), 55.3% or 110 individuals are in the labor force, with 16.4% or 18 of them unemployed. The age group with the highest labor force participation rate is 25 to 29 years, with 100.0% or 16 individuals in the labor force. Within the labor force, the 16 to 19 years age range has the highest percentage of unemployed individuals, with 57.1% or 4 of them being unemployed.
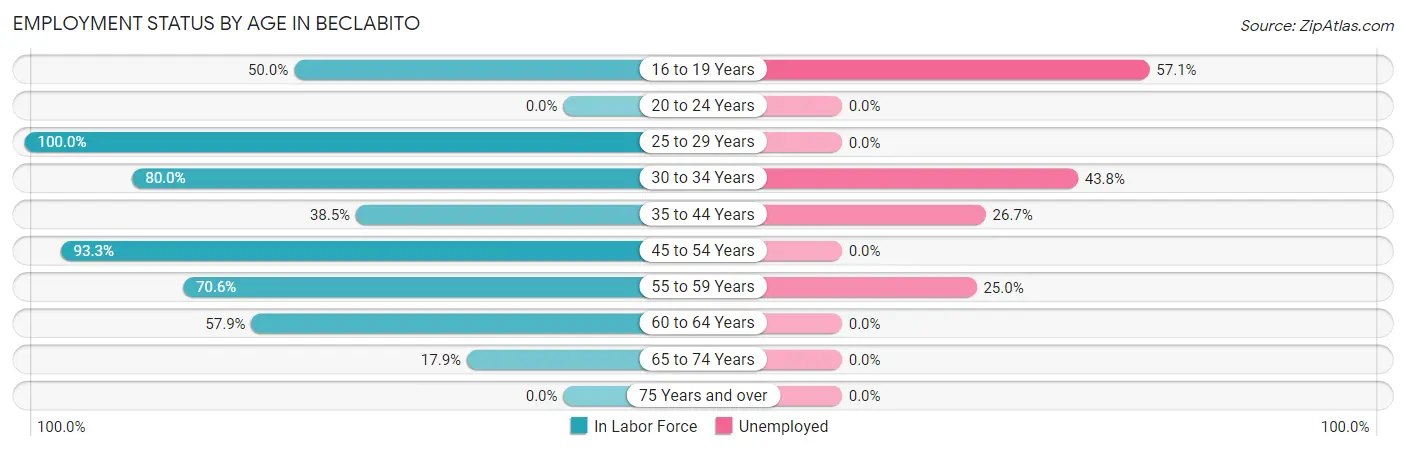
| Age Bracket | In Labor Force | Unemployed |
| 16 to 19 Years | 7 (50.0%) | 4 (57.1%) |
| 20 to 24 Years | 0 (0.0%) | 0 (0.0%) |
| 25 to 29 Years | 16 (100.0%) | 0 (0.0%) |
| 30 to 34 Years | 16 (80.0%) | 7 (43.8%) |
| 35 to 44 Years | 15 (38.5%) | 4 (26.7%) |
| 45 to 54 Years | 28 (93.3%) | 0 (0.0%) |
| 55 to 59 Years | 12 (70.6%) | 3 (25.0%) |
| 60 to 64 Years | 11 (57.9%) | 0 (0.0%) |
| 65 to 74 Years | 5 (17.9%) | 0 (0.0%) |
| 75 Years and over | 0 (0.0%) | 0 (0.0%) |
| Total | 110 (55.3%) | 18 (16.4%) |
Employment Status by Educational Attainment in Beclabito
According to labor force statistics for Beclabito, 69.5% of individuals (98) out of the total population between 25 and 64 years of age (141) are in the labor force, with 14.3% or 14 of them being unemployed. The group with the highest labor force participation rate are those with the educational attainment of college / associate degree, with 74.7% or 56 individuals in the labor force. Within the labor force, individuals with high school diploma education have the highest percentage of unemployment, with 21.2% or 7 of them being unemployed.
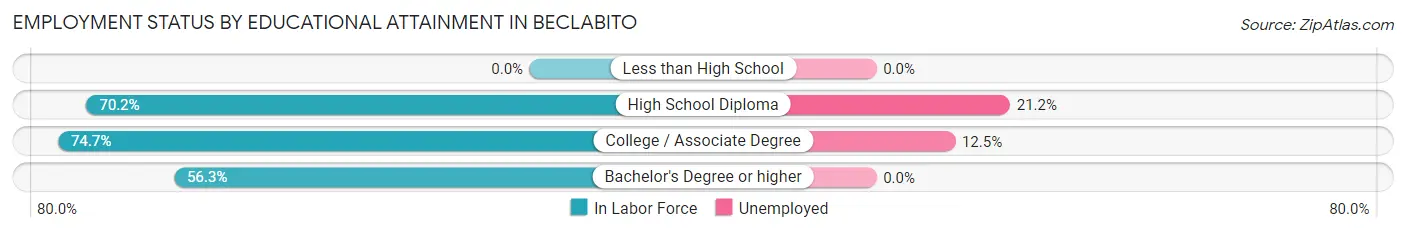
| Educational Attainment | In Labor Force | Unemployed |
| Less than High School | 0 (0.0%) | 0 (0.0%) |
| High School Diploma | 33 (70.2%) | 10 (21.2%) |
| College / Associate Degree | 56 (74.7%) | 9 (12.5%) |
| Bachelor's Degree or higher | 9 (56.3%) | 0 (0.0%) |
| Total | 98 (69.5%) | 20 (14.3%) |
Employment Occupations by Sex in Beclabito
Management, Business, Science and Arts Occupations
The most common Management, Business, Science and Arts occupations in Beclabito are Community & Social Service (6 | 6.5%), Education Instruction & Library (6 | 6.5%), Business & Financial (3 | 3.3%), Computers, Engineering & Science (3 | 3.3%), and Life, Physical & Social Science (3 | 3.3%).
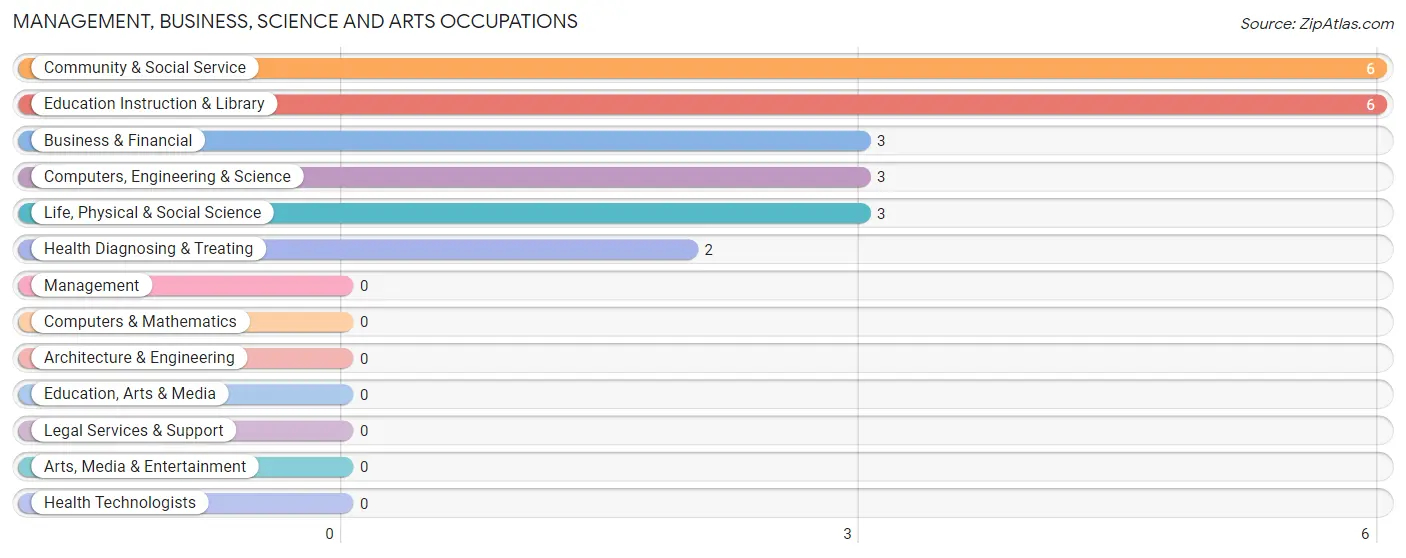
Management, Business, Science and Arts Occupations by Sex
Within the Management, Business, Science and Arts occupations in Beclabito, the most male-oriented occupations are Computers, Engineering & Science (100.0%), and Life, Physical & Social Science (100.0%), while the most female-oriented occupations are Business & Financial (100.0%), Community & Social Service (100.0%), and Education Instruction & Library (100.0%).
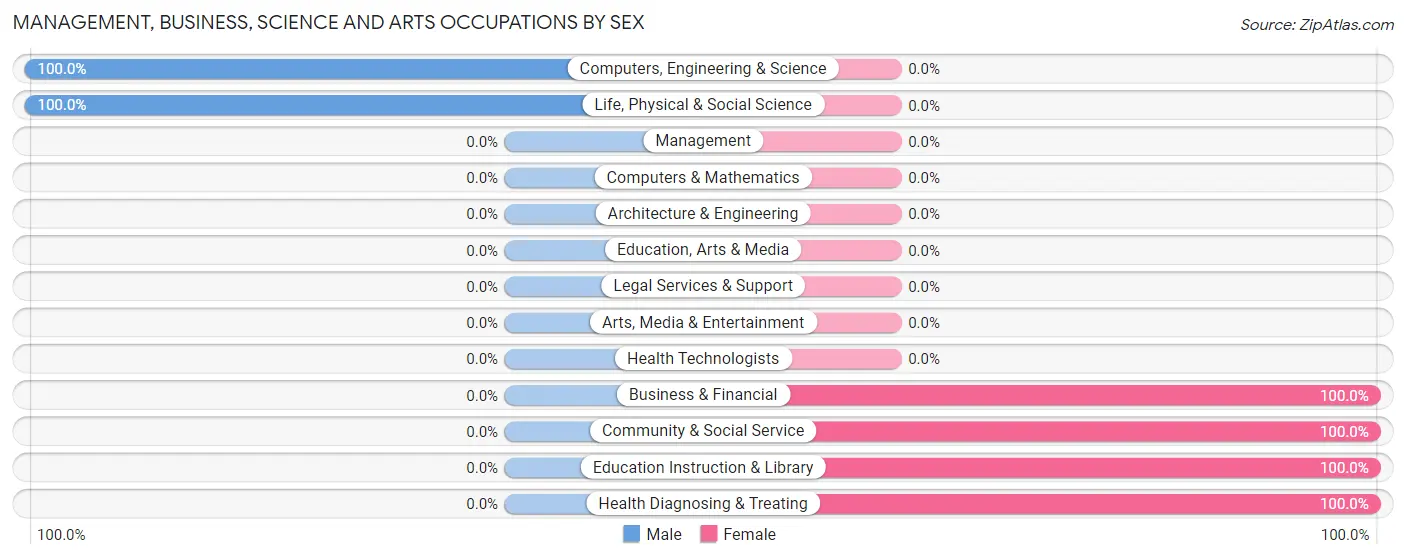
| Occupation | Male | Female |
| Management | 0 (0.0%) | 0 (0.0%) |
| Business & Financial | 0 (0.0%) | 3 (100.0%) |
| Computers, Engineering & Science | 3 (100.0%) | 0 (0.0%) |
| Computers & Mathematics | 0 (0.0%) | 0 (0.0%) |
| Architecture & Engineering | 0 (0.0%) | 0 (0.0%) |
| Life, Physical & Social Science | 3 (100.0%) | 0 (0.0%) |
| Community & Social Service | 0 (0.0%) | 6 (100.0%) |
| Education, Arts & Media | 0 (0.0%) | 0 (0.0%) |
| Legal Services & Support | 0 (0.0%) | 0 (0.0%) |
| Education Instruction & Library | 0 (0.0%) | 6 (100.0%) |
| Arts, Media & Entertainment | 0 (0.0%) | 0 (0.0%) |
| Health Diagnosing & Treating | 0 (0.0%) | 2 (100.0%) |
| Health Technologists | 0 (0.0%) | 0 (0.0%) |
| Total (Category) | 3 (21.4%) | 11 (78.6%) |
| Total (Overall) | 52 (56.5%) | 40 (43.5%) |
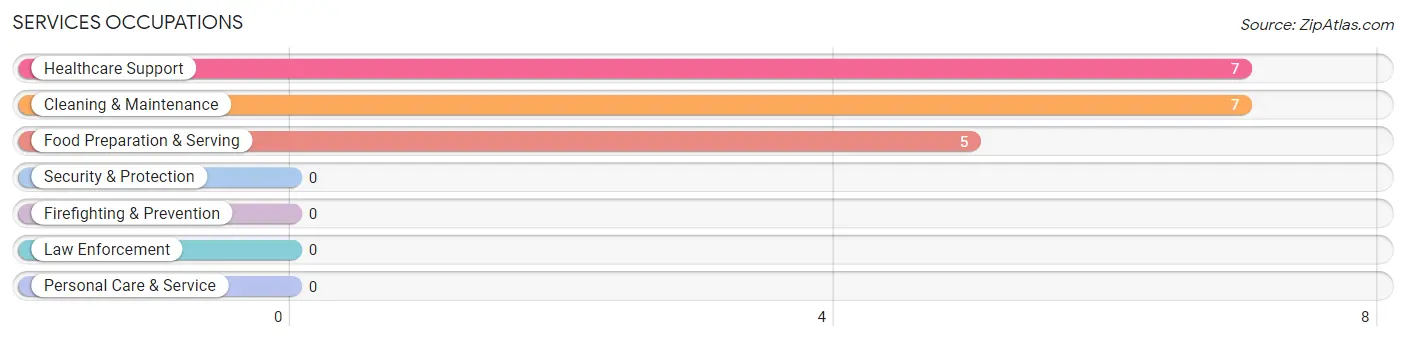
Services Occupations
The most common Services occupations in Beclabito are Healthcare Support (7 | 7.6%), Cleaning & Maintenance (7 | 7.6%), and Food Preparation & Serving (5 | 5.4%).
Services Occupations by Sex
Within the Services occupations in Beclabito, the most male-oriented occupations are Cleaning & Maintenance (71.4%), and Food Preparation & Serving (60.0%), while the most female-oriented occupations are Healthcare Support (100.0%), Food Preparation & Serving (40.0%), and Cleaning & Maintenance (28.6%).
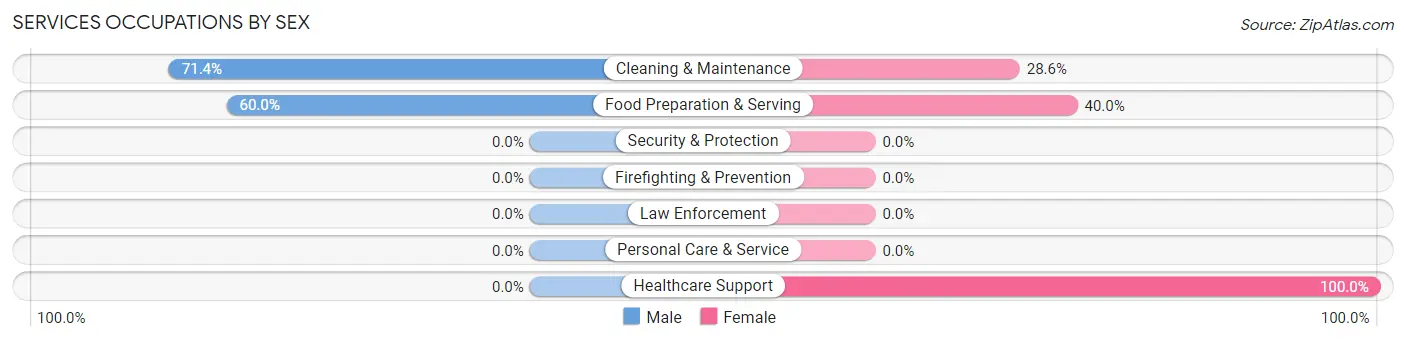
| Occupation | Male | Female |
| Healthcare Support | 0 (0.0%) | 7 (100.0%) |
| Security & Protection | 0 (0.0%) | 0 (0.0%) |
| Firefighting & Prevention | 0 (0.0%) | 0 (0.0%) |
| Law Enforcement | 0 (0.0%) | 0 (0.0%) |
| Food Preparation & Serving | 3 (60.0%) | 2 (40.0%) |
| Cleaning & Maintenance | 5 (71.4%) | 2 (28.6%) |
| Personal Care & Service | 0 (0.0%) | 0 (0.0%) |
| Total (Category) | 8 (42.1%) | 11 (57.9%) |
| Total (Overall) | 52 (56.5%) | 40 (43.5%) |
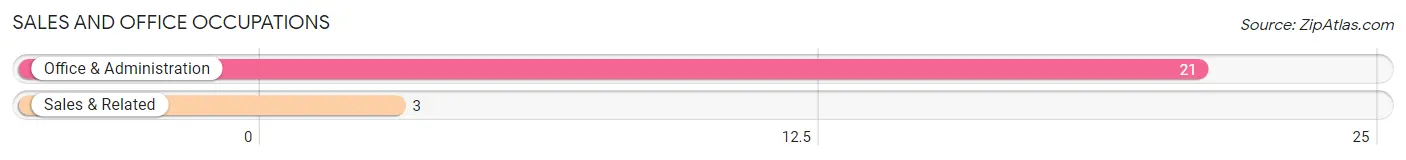
Sales and Office Occupations
The most common Sales and Office occupations in Beclabito are Office & Administration (21 | 22.8%), and Sales & Related (3 | 3.3%).
Sales and Office Occupations by Sex
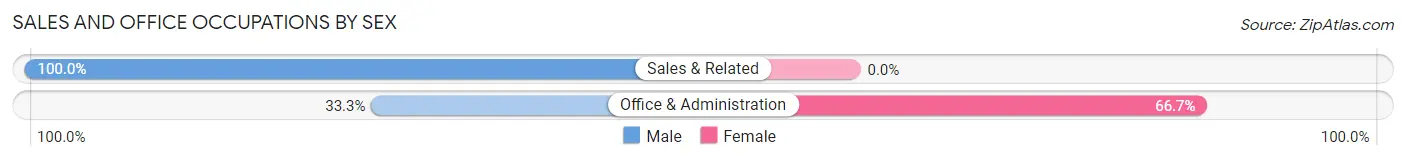
| Occupation | Male | Female |
| Sales & Related | 3 (100.0%) | 0 (0.0%) |
| Office & Administration | 7 (33.3%) | 14 (66.7%) |
| Total (Category) | 10 (41.7%) | 14 (58.3%) |
| Total (Overall) | 52 (56.5%) | 40 (43.5%) |
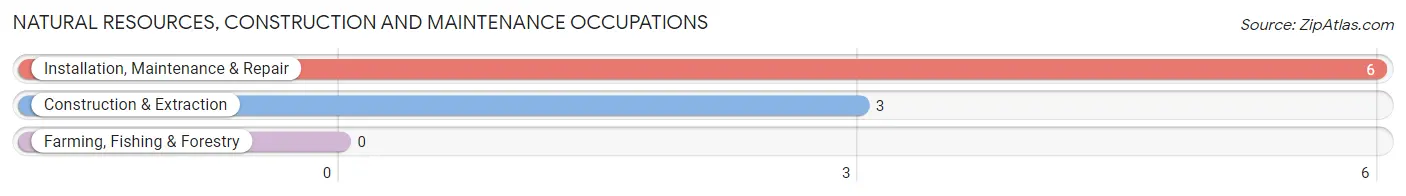
Natural Resources, Construction and Maintenance Occupations
The most common Natural Resources, Construction and Maintenance occupations in Beclabito are Installation, Maintenance & Repair (6 | 6.5%), and Construction & Extraction (3 | 3.3%).
Natural Resources, Construction and Maintenance Occupations by Sex
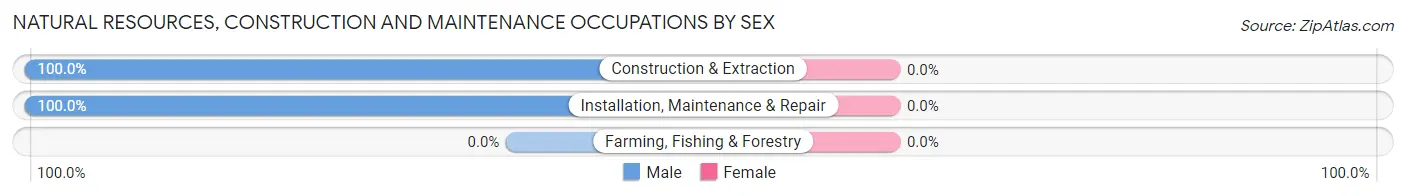
| Occupation | Male | Female |
| Farming, Fishing & Forestry | 0 (0.0%) | 0 (0.0%) |
| Construction & Extraction | 3 (100.0%) | 0 (0.0%) |
| Installation, Maintenance & Repair | 6 (100.0%) | 0 (0.0%) |
| Total (Category) | 9 (100.0%) | 0 (0.0%) |
| Total (Overall) | 52 (56.5%) | 40 (43.5%) |
Production, Transportation and Moving Occupations
The most common Production, Transportation and Moving occupations in Beclabito are Material Moving (21 | 22.8%), and Production (5 | 5.4%).
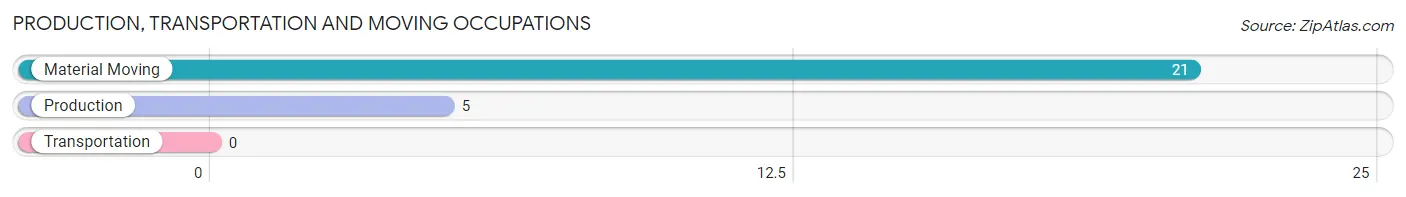
Production, Transportation and Moving Occupations by Sex
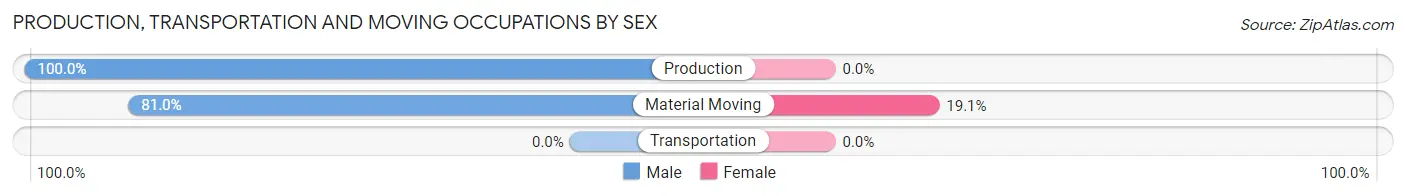
| Occupation | Male | Female |
| Production | 5 (100.0%) | 0 (0.0%) |
| Transportation | 0 (0.0%) | 0 (0.0%) |
| Material Moving | 17 (80.9%) | 4 (19.1%) |
| Total (Category) | 22 (84.6%) | 4 (15.4%) |
| Total (Overall) | 52 (56.5%) | 40 (43.5%) |
Employment Industries by Sex in Beclabito
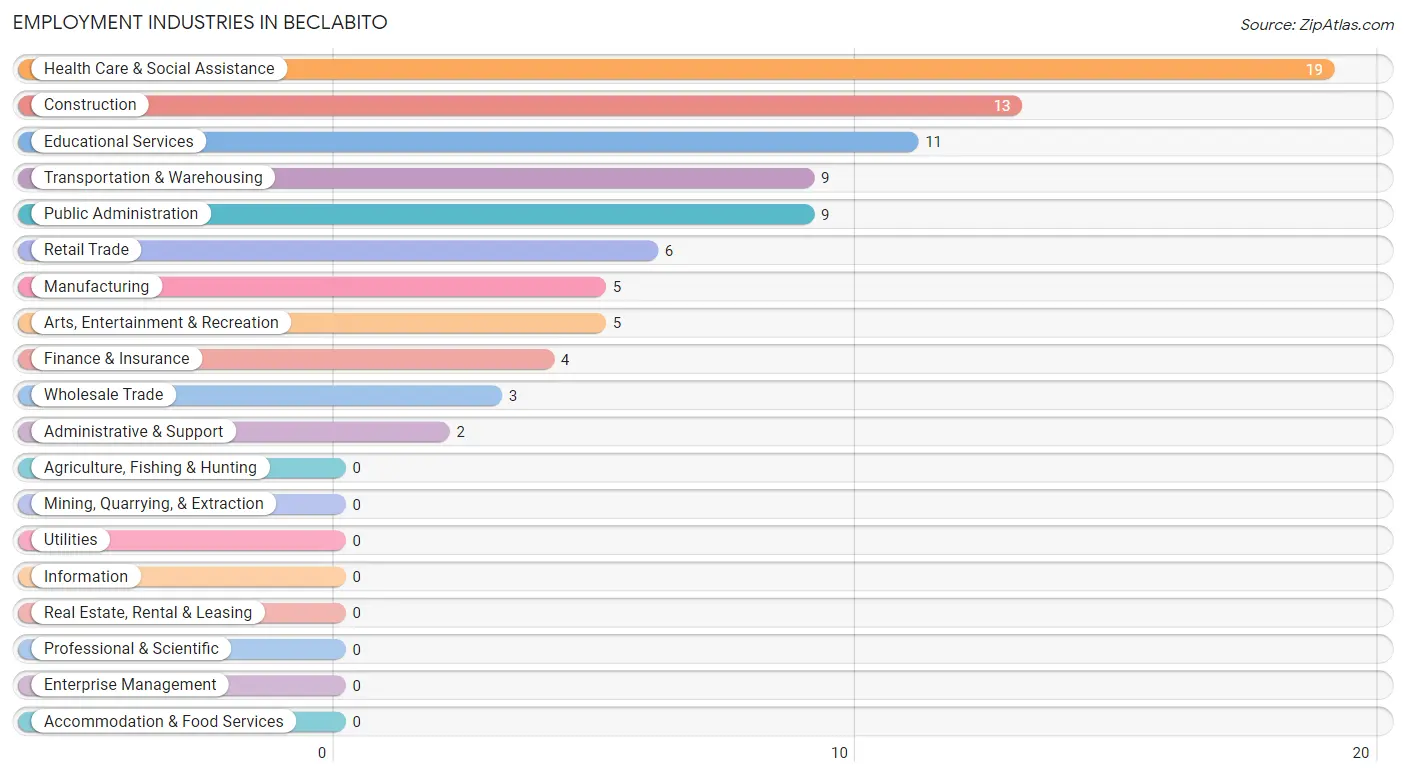
Employment Industries in Beclabito
The major employment industries in Beclabito include Health Care & Social Assistance (19 | 20.6%), Construction (13 | 14.1%), Educational Services (11 | 12.0%), Transportation & Warehousing (9 | 9.8%), and Public Administration (9 | 9.8%).
Employment Industries by Sex in Beclabito
The Beclabito industries that see more men than women are Construction (100.0%), Manufacturing (100.0%), and Wholesale Trade (100.0%), whereas the industries that tend to have a higher number of women are Finance & Insurance (100.0%), Arts, Entertainment & Recreation (100.0%), and Educational Services (72.7%).
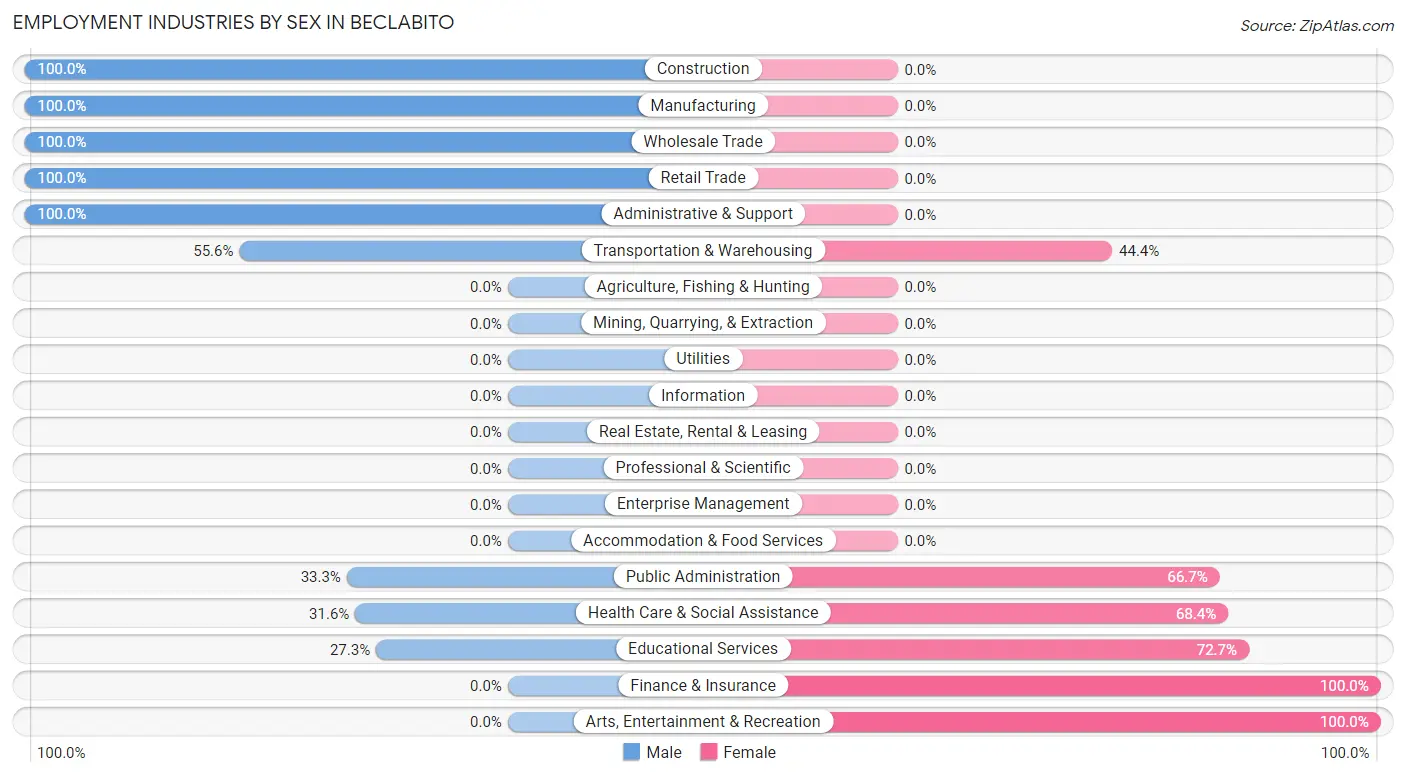
| Industry | Male | Female |
| Agriculture, Fishing & Hunting | 0 (0.0%) | 0 (0.0%) |
| Mining, Quarrying, & Extraction | 0 (0.0%) | 0 (0.0%) |
| Construction | 13 (100.0%) | 0 (0.0%) |
| Manufacturing | 5 (100.0%) | 0 (0.0%) |
| Wholesale Trade | 3 (100.0%) | 0 (0.0%) |
| Retail Trade | 6 (100.0%) | 0 (0.0%) |
| Transportation & Warehousing | 5 (55.6%) | 4 (44.4%) |
| Utilities | 0 (0.0%) | 0 (0.0%) |
| Information | 0 (0.0%) | 0 (0.0%) |
| Finance & Insurance | 0 (0.0%) | 4 (100.0%) |
| Real Estate, Rental & Leasing | 0 (0.0%) | 0 (0.0%) |
| Professional & Scientific | 0 (0.0%) | 0 (0.0%) |
| Enterprise Management | 0 (0.0%) | 0 (0.0%) |
| Administrative & Support | 2 (100.0%) | 0 (0.0%) |
| Educational Services | 3 (27.3%) | 8 (72.7%) |
| Health Care & Social Assistance | 6 (31.6%) | 13 (68.4%) |
| Arts, Entertainment & Recreation | 0 (0.0%) | 5 (100.0%) |
| Accommodation & Food Services | 0 (0.0%) | 0 (0.0%) |
| Public Administration | 3 (33.3%) | 6 (66.7%) |
| Total | 52 (56.5%) | 40 (43.5%) |
Education in Beclabito
School Enrollment in Beclabito
The most common levels of schooling among the 53 students in Beclabito are high school (15 | 28.3%), elementary school (13 | 24.5%), and middle school (11 | 20.7%).
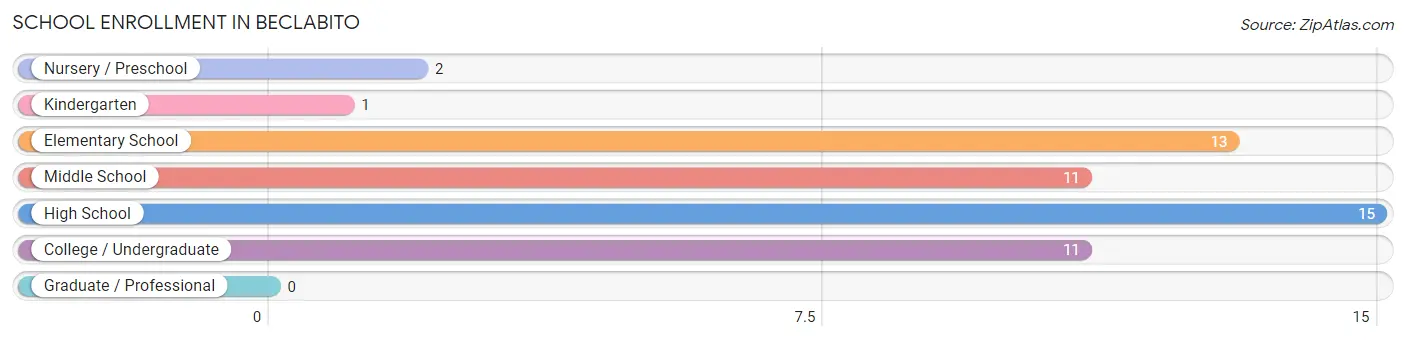
| School Level | # Students | % Students |
| Nursery / Preschool | 2 | 3.8% |
| Kindergarten | 1 | 1.9% |
| Elementary School | 13 | 24.5% |
| Middle School | 11 | 20.7% |
| High School | 15 | 28.3% |
| College / Undergraduate | 11 | 20.7% |
| Graduate / Professional | 0 | 0.0% |
| Total | 53 | 100.0% |
School Enrollment by Age by Funding Source in Beclabito
Out of a total of 53 students who are enrolled in schools in Beclabito, 3 (5.7%) attend a private institution, while the remaining 50 (94.3%) are enrolled in public schools. The age group of 35 years and over has the highest likelihood of being enrolled in private schools, with 3 (100.0% in the age bracket) enrolled. Conversely, the age group of 3 to 4 year olds has the lowest likelihood of being enrolled in a private school, with 2 (100.0% in the age bracket) attending a public institution.
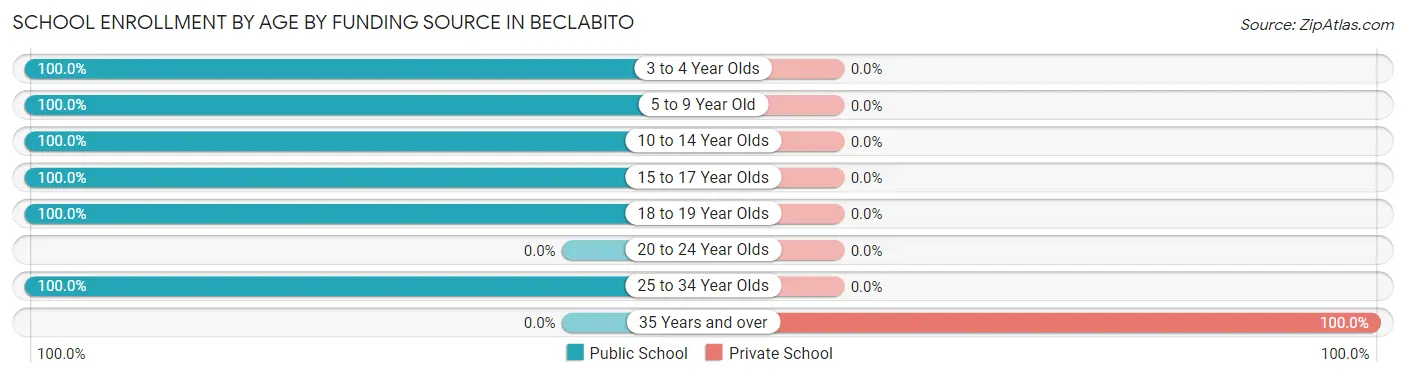
| Age Bracket | Public School | Private School |
| 3 to 4 Year Olds | 2 (100.0%) | 0 (0.0%) |
| 5 to 9 Year Old | 14 (100.0%) | 0 (0.0%) |
| 10 to 14 Year Olds | 19 (100.0%) | 0 (0.0%) |
| 15 to 17 Year Olds | 4 (100.0%) | 0 (0.0%) |
| 18 to 19 Year Olds | 6 (100.0%) | 0 (0.0%) |
| 20 to 24 Year Olds | 0 (0.0%) | 0 (0.0%) |
| 25 to 34 Year Olds | 5 (100.0%) | 0 (0.0%) |
| 35 Years and over | 0 (0.0%) | 3 (100.0%) |
| Total | 50 (94.3%) | 3 (5.7%) |
Educational Attainment by Field of Study in Beclabito
Bio, nature & agricultural (8 | 38.1%), education (8 | 38.1%), liberal arts & history (3 | 14.3%), and arts & humanities (2 | 9.5%) are the most common fields of study among 21 individuals in Beclabito who have obtained a bachelor's degree or higher.
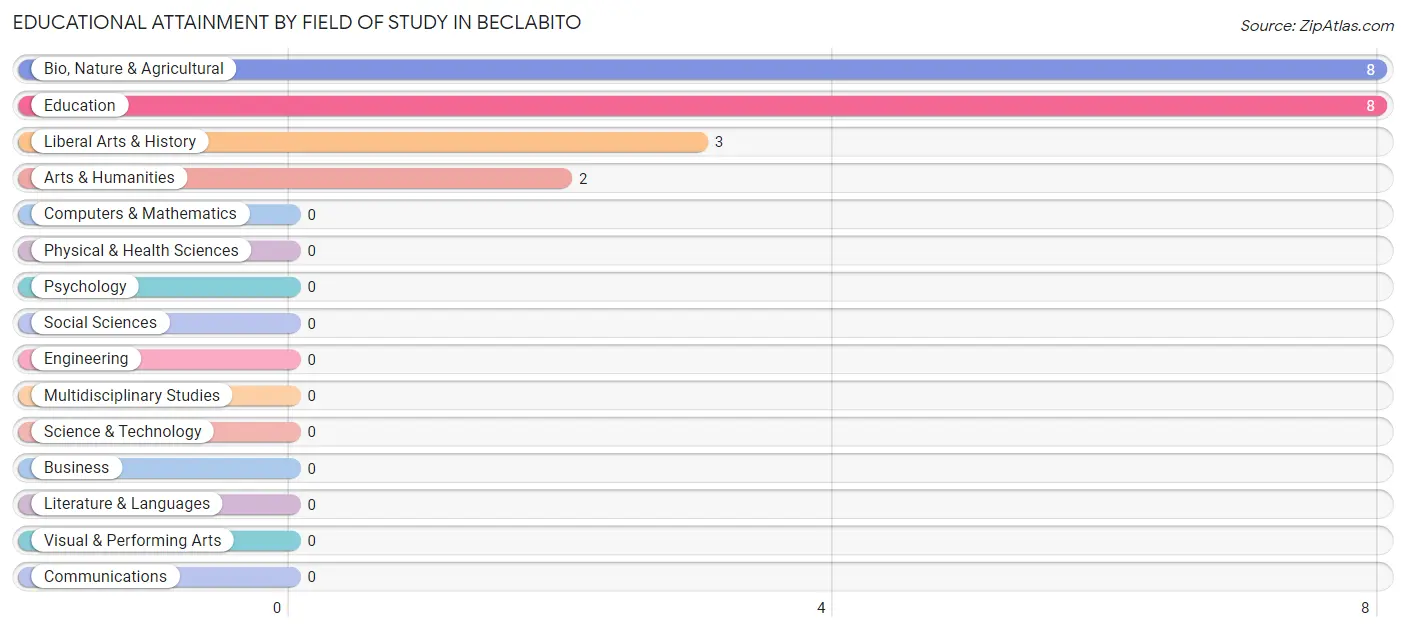
| Field of Study | # Graduates | % Graduates |
| Computers & Mathematics | 0 | 0.0% |
| Bio, Nature & Agricultural | 8 | 38.1% |
| Physical & Health Sciences | 0 | 0.0% |
| Psychology | 0 | 0.0% |
| Social Sciences | 0 | 0.0% |
| Engineering | 0 | 0.0% |
| Multidisciplinary Studies | 0 | 0.0% |
| Science & Technology | 0 | 0.0% |
| Business | 0 | 0.0% |
| Education | 8 | 38.1% |
| Literature & Languages | 0 | 0.0% |
| Liberal Arts & History | 3 | 14.3% |
| Visual & Performing Arts | 0 | 0.0% |
| Communications | 0 | 0.0% |
| Arts & Humanities | 2 | 9.5% |
| Total | 21 | 100.0% |
Transportation & Commute in Beclabito
Vehicle Availability by Sex in Beclabito
The most prevalent vehicle ownership categories in Beclabito are males with 2 vehicles (17, accounting for 32.7%) and females with 2 vehicles (4, making up 47.2%).
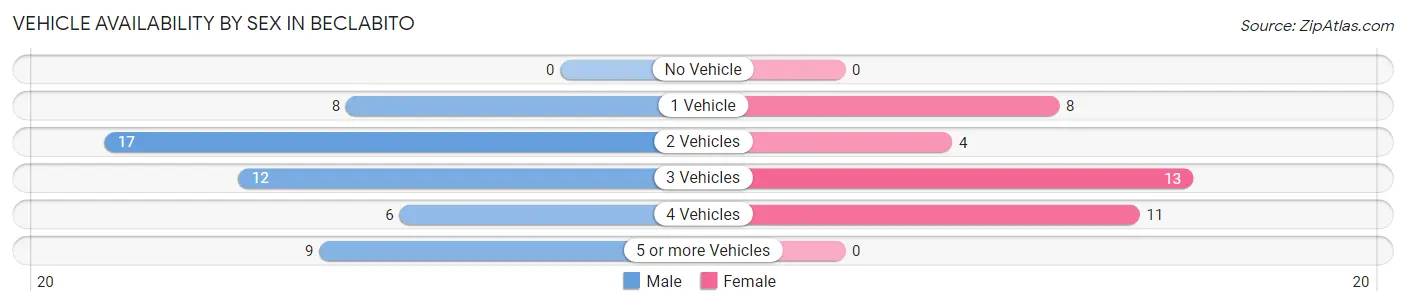
| Vehicles Available | Male | Female |
| No Vehicle | 0 (0.0%) | 0 (0.0%) |
| 1 Vehicle | 8 (15.4%) | 8 (22.2%) |
| 2 Vehicles | 17 (32.7%) | 4 (11.1%) |
| 3 Vehicles | 12 (23.1%) | 13 (36.1%) |
| 4 Vehicles | 6 (11.5%) | 11 (30.6%) |
| 5 or more Vehicles | 9 (17.3%) | 0 (0.0%) |
| Total | 52 (100.0%) | 36 (100.0%) |
Commute Time in Beclabito
The most frequently occuring commute durations in Beclabito are 30 to 34 minutes (19 commuters, 24.4%), 60 to 89 minutes (14 commuters, 17.9%), and 90 or more minutes (13 commuters, 16.7%).
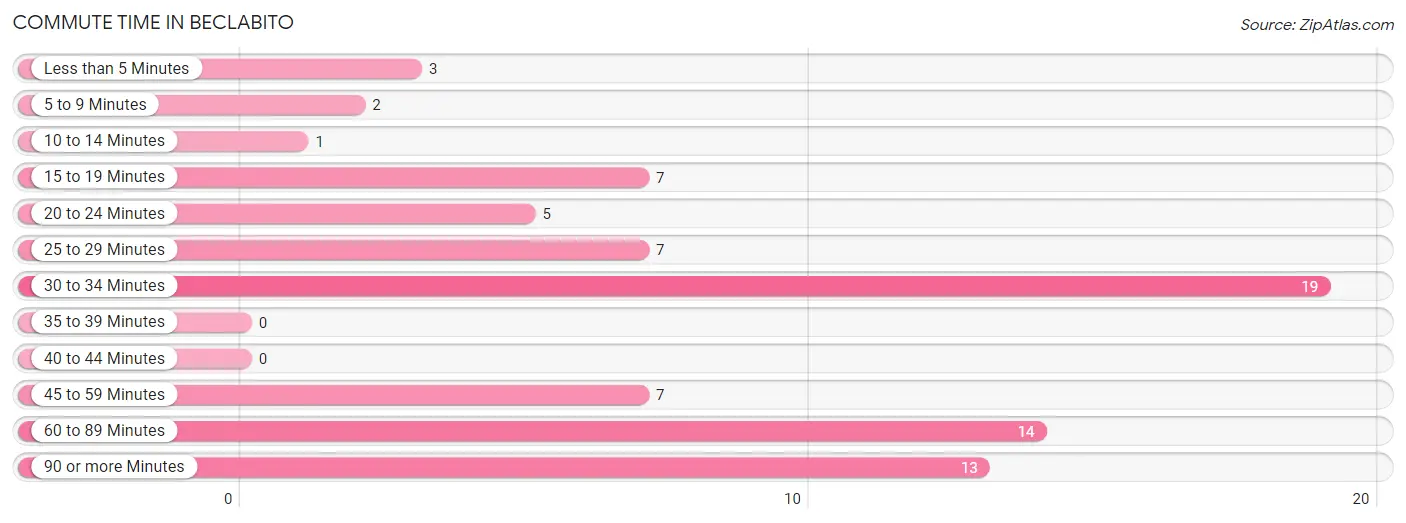
| Commute Time | # Commuters | % Commuters |
| Less than 5 Minutes | 3 | 3.8% |
| 5 to 9 Minutes | 2 | 2.6% |
| 10 to 14 Minutes | 1 | 1.3% |
| 15 to 19 Minutes | 7 | 9.0% |
| 20 to 24 Minutes | 5 | 6.4% |
| 25 to 29 Minutes | 7 | 9.0% |
| 30 to 34 Minutes | 19 | 24.4% |
| 35 to 39 Minutes | 0 | 0.0% |
| 40 to 44 Minutes | 0 | 0.0% |
| 45 to 59 Minutes | 7 | 9.0% |
| 60 to 89 Minutes | 14 | 17.9% |
| 90 or more Minutes | 13 | 16.7% |
Commute Time by Sex in Beclabito
The most common commute times in Beclabito are 60 to 89 minutes (14 commuters, 33.3%) for males and 30 to 34 minutes (14 commuters, 38.9%) for females.
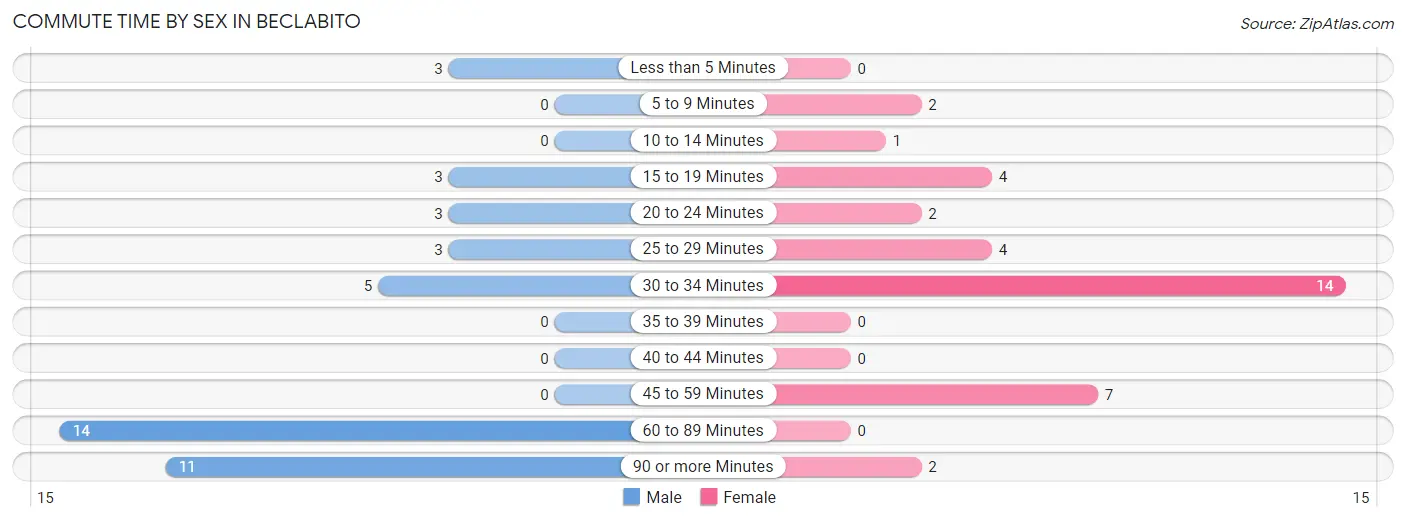
| Commute Time | Male | Female |
| Less than 5 Minutes | 3 (7.1%) | 0 (0.0%) |
| 5 to 9 Minutes | 0 (0.0%) | 2 (5.6%) |
| 10 to 14 Minutes | 0 (0.0%) | 1 (2.8%) |
| 15 to 19 Minutes | 3 (7.1%) | 4 (11.1%) |
| 20 to 24 Minutes | 3 (7.1%) | 2 (5.6%) |
| 25 to 29 Minutes | 3 (7.1%) | 4 (11.1%) |
| 30 to 34 Minutes | 5 (11.9%) | 14 (38.9%) |
| 35 to 39 Minutes | 0 (0.0%) | 0 (0.0%) |
| 40 to 44 Minutes | 0 (0.0%) | 0 (0.0%) |
| 45 to 59 Minutes | 0 (0.0%) | 7 (19.4%) |
| 60 to 89 Minutes | 14 (33.3%) | 0 (0.0%) |
| 90 or more Minutes | 11 (26.2%) | 2 (5.6%) |
Time of Departure to Work by Sex in Beclabito
The most frequent times of departure to work in Beclabito are 5:00 AM to 5:29 AM (6, 14.3%) for males and 7:00 AM to 7:29 AM (16, 44.4%) for females.
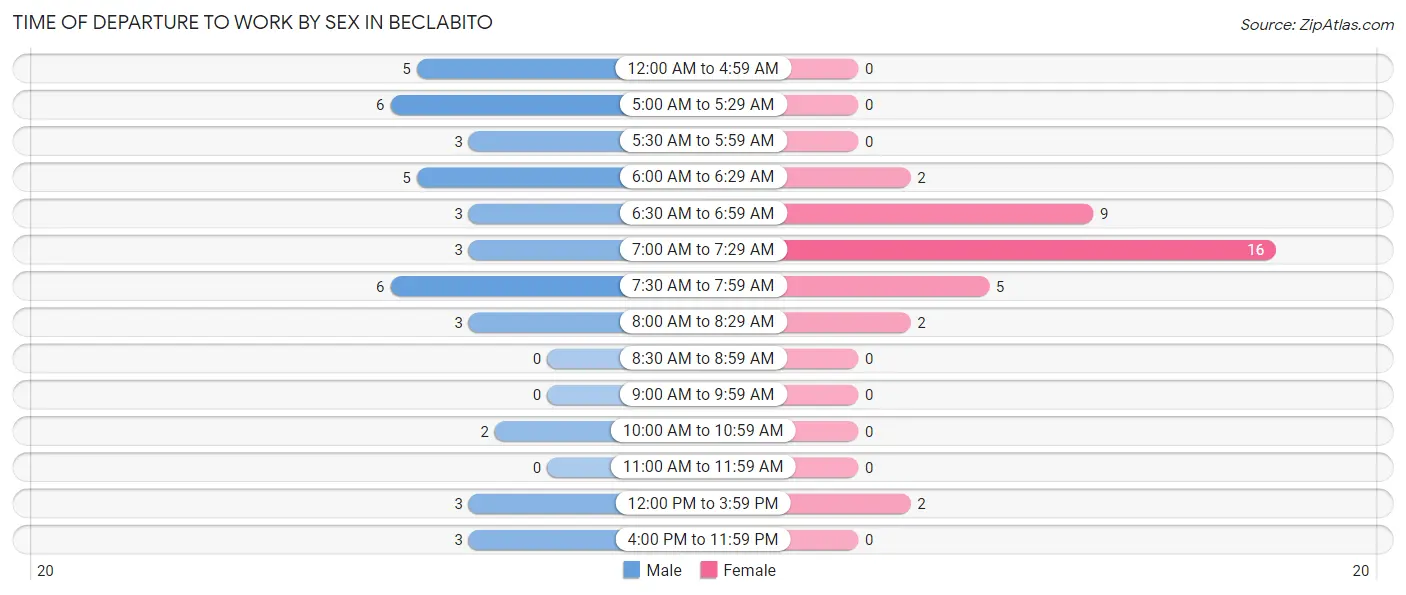
| Time of Departure | Male | Female |
| 12:00 AM to 4:59 AM | 5 (11.9%) | 0 (0.0%) |
| 5:00 AM to 5:29 AM | 6 (14.3%) | 0 (0.0%) |
| 5:30 AM to 5:59 AM | 3 (7.1%) | 0 (0.0%) |
| 6:00 AM to 6:29 AM | 5 (11.9%) | 2 (5.6%) |
| 6:30 AM to 6:59 AM | 3 (7.1%) | 9 (25.0%) |
| 7:00 AM to 7:29 AM | 3 (7.1%) | 16 (44.4%) |
| 7:30 AM to 7:59 AM | 6 (14.3%) | 5 (13.9%) |
| 8:00 AM to 8:29 AM | 3 (7.1%) | 2 (5.6%) |
| 8:30 AM to 8:59 AM | 0 (0.0%) | 0 (0.0%) |
| 9:00 AM to 9:59 AM | 0 (0.0%) | 0 (0.0%) |
| 10:00 AM to 10:59 AM | 2 (4.8%) | 0 (0.0%) |
| 11:00 AM to 11:59 AM | 0 (0.0%) | 0 (0.0%) |
| 12:00 PM to 3:59 PM | 3 (7.1%) | 2 (5.6%) |
| 4:00 PM to 11:59 PM | 3 (7.1%) | 0 (0.0%) |
| Total | 42 (100.0%) | 36 (100.0%) |
Housing Occupancy in Beclabito
Occupancy by Ownership in Beclabito
Of the total 74 dwellings in Beclabito, owner-occupied units account for 74 (100.0%), while renter-occupied units make up 0 (0.0%).
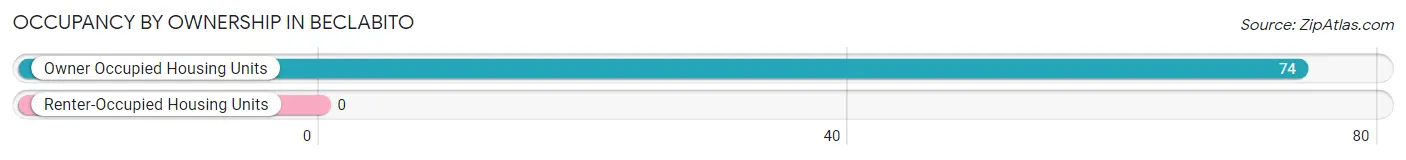
| Occupancy | # Housing Units | % Housing Units |
| Owner Occupied Housing Units | 74 | 100.0% |
| Renter-Occupied Housing Units | 0 | 0.0% |
| Total Occupied Housing Units | 74 | 100.0% |
Occupancy by Household Size in Beclabito
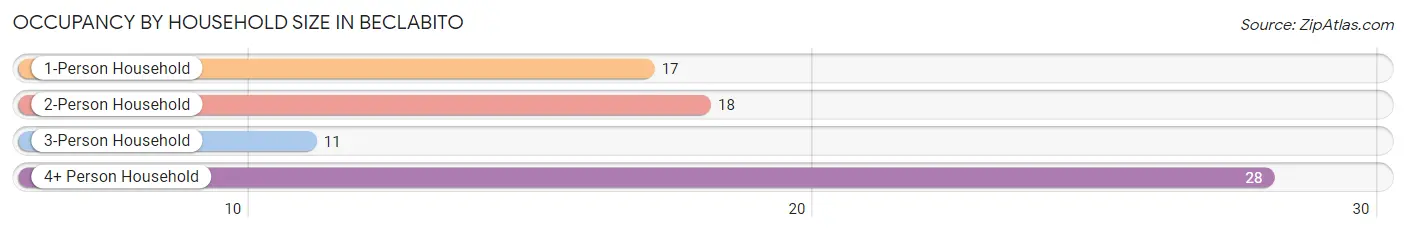
| Household Size | # Housing Units | % Housing Units |
| 1-Person Household | 17 | 23.0% |
| 2-Person Household | 18 | 24.3% |
| 3-Person Household | 11 | 14.9% |
| 4+ Person Household | 28 | 37.8% |
| Total Housing Units | 74 | 100.0% |
Occupancy by Ownership by Household Size in Beclabito
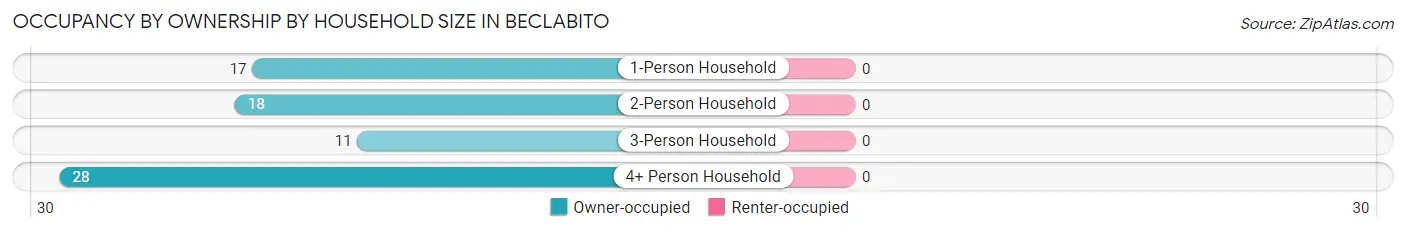
| Household Size | Owner-occupied | Renter-occupied |
| 1-Person Household | 17 (100.0%) | 0 (0.0%) |
| 2-Person Household | 18 (100.0%) | 0 (0.0%) |
| 3-Person Household | 11 (100.0%) | 0 (0.0%) |
| 4+ Person Household | 28 (100.0%) | 0 (0.0%) |
| Total Housing Units | 74 (100.0%) | 0 (0.0%) |
Occupancy by Educational Attainment in Beclabito
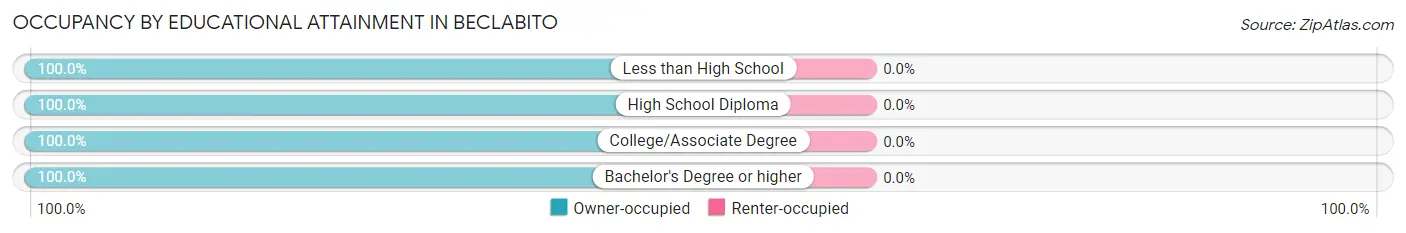
| Household Size | Owner-occupied | Renter-occupied |
| Less than High School | 2 (100.0%) | 0 (0.0%) |
| High School Diploma | 20 (100.0%) | 0 (0.0%) |
| College/Associate Degree | 39 (100.0%) | 0 (0.0%) |
| Bachelor's Degree or higher | 13 (100.0%) | 0 (0.0%) |
Occupancy by Age of Householder in Beclabito
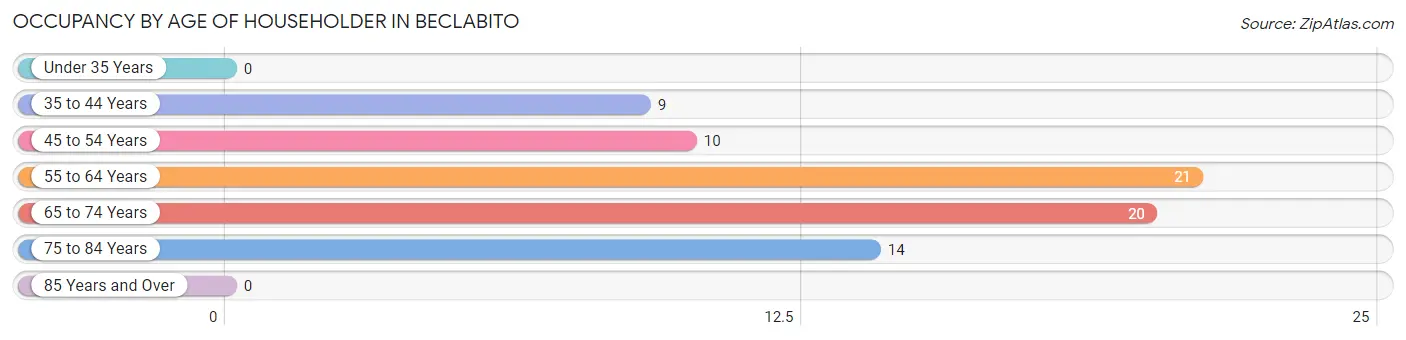
| Age Bracket | # Households | % Households |
| Under 35 Years | 0 | 0.0% |
| 35 to 44 Years | 9 | 12.2% |
| 45 to 54 Years | 10 | 13.5% |
| 55 to 64 Years | 21 | 28.4% |
| 65 to 74 Years | 20 | 27.0% |
| 75 to 84 Years | 14 | 18.9% |
| 85 Years and Over | 0 | 0.0% |
| Total | 74 | 100.0% |
Housing Finances in Beclabito
Median Income by Occupancy in Beclabito
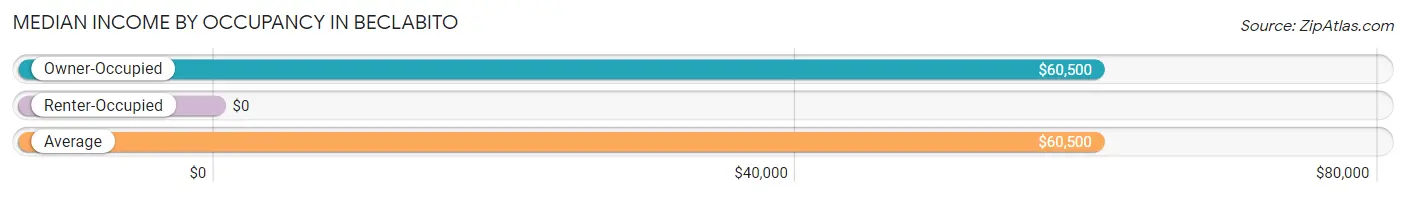
| Occupancy Type | # Households | Median Income |
| Owner-Occupied | 74 (100.0%) | $60,500 |
| Renter-Occupied | 0 (0.0%) | $0 |
| Average | 74 (100.0%) | $60,500 |
Occupancy by Householder Income Bracket in Beclabito
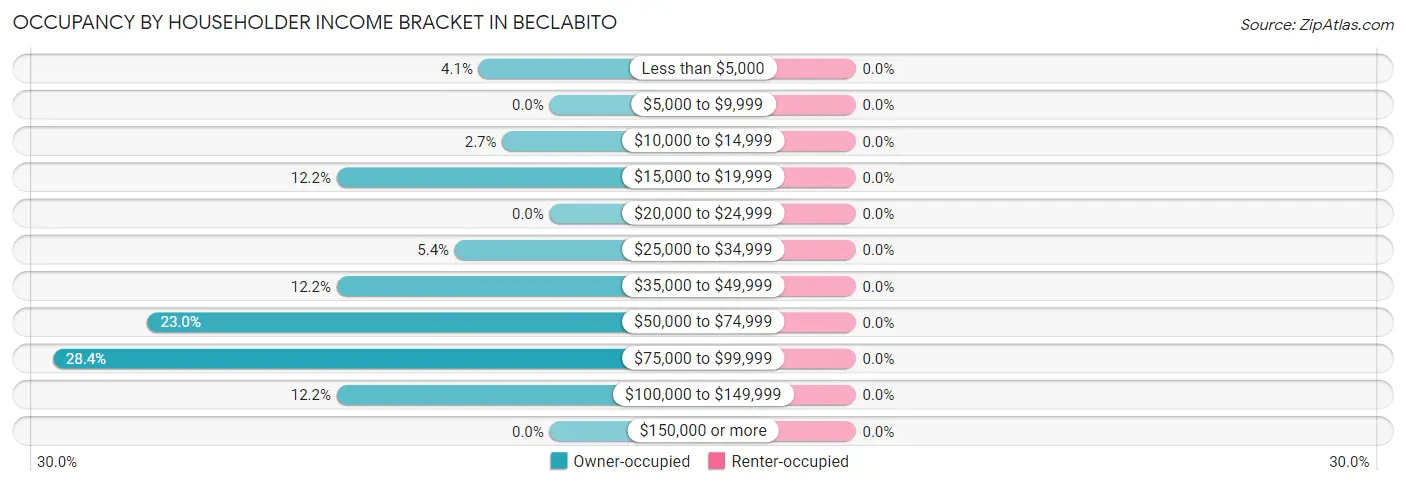
| Income Bracket | Owner-occupied | Renter-occupied |
| Less than $5,000 | 3 (4.1%) | 0 (0.0%) |
| $5,000 to $9,999 | 0 (0.0%) | 0 (0.0%) |
| $10,000 to $14,999 | 2 (2.7%) | 0 (0.0%) |
| $15,000 to $19,999 | 9 (12.2%) | 0 (0.0%) |
| $20,000 to $24,999 | 0 (0.0%) | 0 (0.0%) |
| $25,000 to $34,999 | 4 (5.4%) | 0 (0.0%) |
| $35,000 to $49,999 | 9 (12.2%) | 0 (0.0%) |
| $50,000 to $74,999 | 17 (23.0%) | 0 (0.0%) |
| $75,000 to $99,999 | 21 (28.4%) | 0 (0.0%) |
| $100,000 to $149,999 | 9 (12.2%) | 0 (0.0%) |
| $150,000 or more | 0 (0.0%) | 0 (0.0%) |
| Total | 74 (100.0%) | 0 (0.0%) |
Monthly Housing Cost Tiers in Beclabito
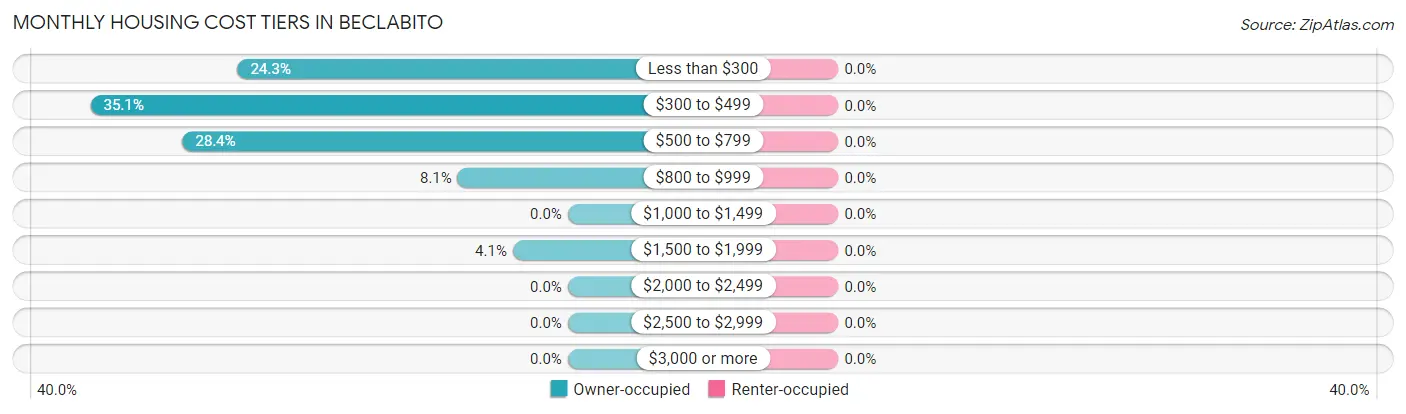
| Monthly Cost | Owner-occupied | Renter-occupied |
| Less than $300 | 18 (24.3%) | 0 (0.0%) |
| $300 to $499 | 26 (35.1%) | 0 (0.0%) |
| $500 to $799 | 21 (28.4%) | 0 (0.0%) |
| $800 to $999 | 6 (8.1%) | 0 (0.0%) |
| $1,000 to $1,499 | 0 (0.0%) | 0 (0.0%) |
| $1,500 to $1,999 | 3 (4.1%) | 0 (0.0%) |
| $2,000 to $2,499 | 0 (0.0%) | 0 (0.0%) |
| $2,500 to $2,999 | 0 (0.0%) | 0 (0.0%) |
| $3,000 or more | 0 (0.0%) | 0 (0.0%) |
| Total | 74 (100.0%) | 0 (0.0%) |
Physical Housing Characteristics in Beclabito
Housing Structures in Beclabito
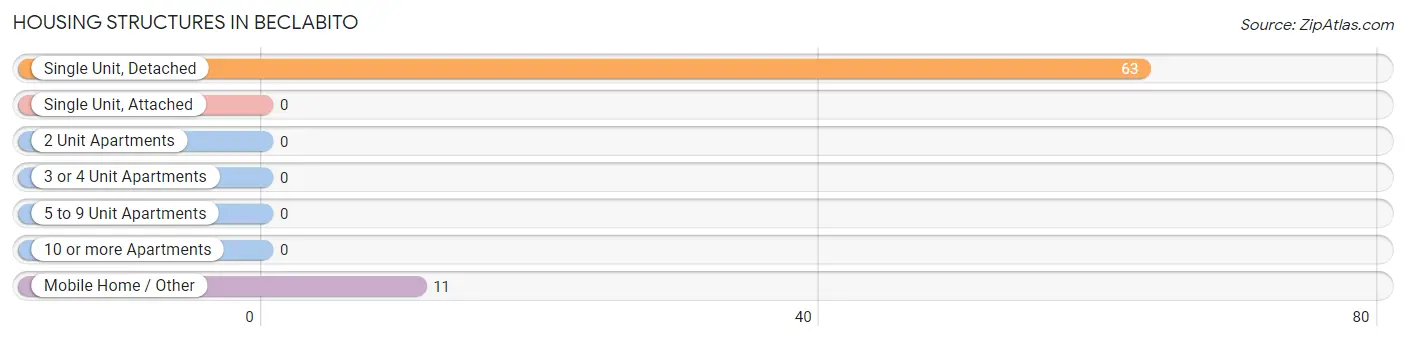
| Structure Type | # Housing Units | % Housing Units |
| Single Unit, Detached | 63 | 85.1% |
| Single Unit, Attached | 0 | 0.0% |
| 2 Unit Apartments | 0 | 0.0% |
| 3 or 4 Unit Apartments | 0 | 0.0% |
| 5 to 9 Unit Apartments | 0 | 0.0% |
| 10 or more Apartments | 0 | 0.0% |
| Mobile Home / Other | 11 | 14.9% |
| Total | 74 | 100.0% |
Housing Structures by Occupancy in Beclabito
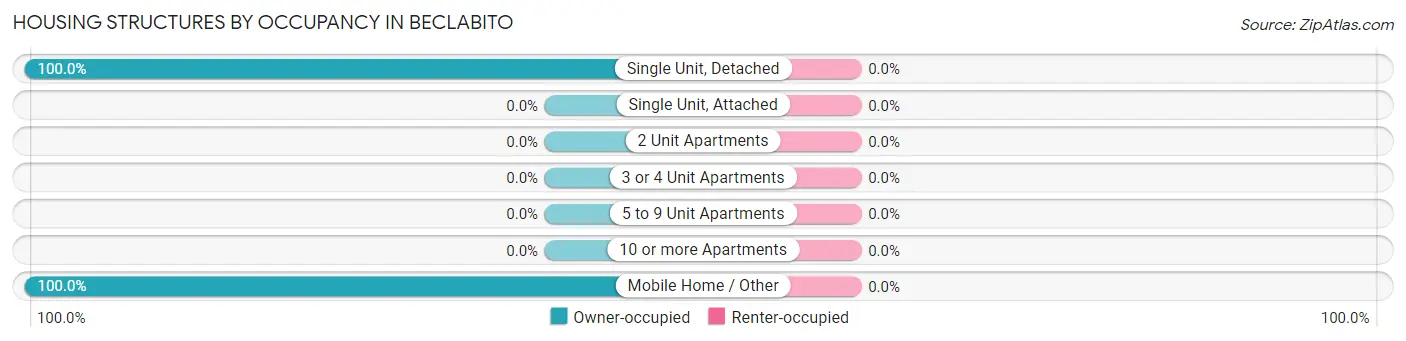
| Structure Type | Owner-occupied | Renter-occupied |
| Single Unit, Detached | 63 (100.0%) | 0 (0.0%) |
| Single Unit, Attached | 0 (0.0%) | 0 (0.0%) |
| 2 Unit Apartments | 0 (0.0%) | 0 (0.0%) |
| 3 or 4 Unit Apartments | 0 (0.0%) | 0 (0.0%) |
| 5 to 9 Unit Apartments | 0 (0.0%) | 0 (0.0%) |
| 10 or more Apartments | 0 (0.0%) | 0 (0.0%) |
| Mobile Home / Other | 11 (100.0%) | 0 (0.0%) |
| Total | 74 (100.0%) | 0 (0.0%) |
Housing Structures by Number of Rooms in Beclabito
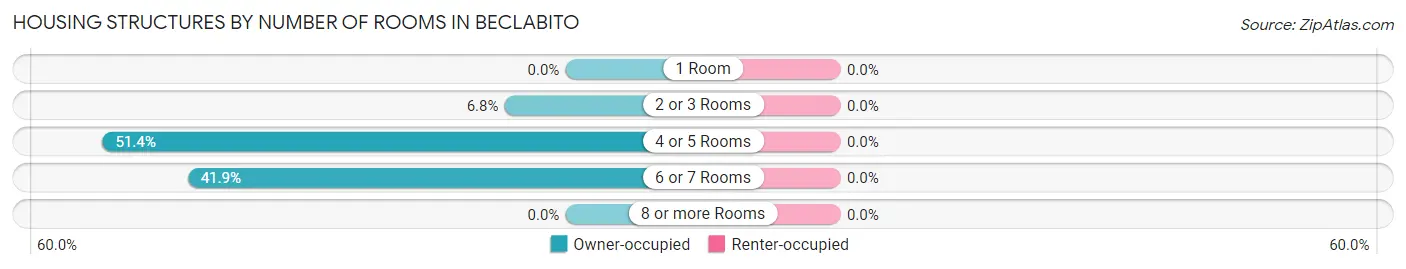
| Number of Rooms | Owner-occupied | Renter-occupied |
| 1 Room | 0 (0.0%) | 0 (0.0%) |
| 2 or 3 Rooms | 5 (6.8%) | 0 (0.0%) |
| 4 or 5 Rooms | 38 (51.3%) | 0 (0.0%) |
| 6 or 7 Rooms | 31 (41.9%) | 0 (0.0%) |
| 8 or more Rooms | 0 (0.0%) | 0 (0.0%) |
| Total | 74 (100.0%) | 0 (0.0%) |
Housing Structure by Heating Type in Beclabito
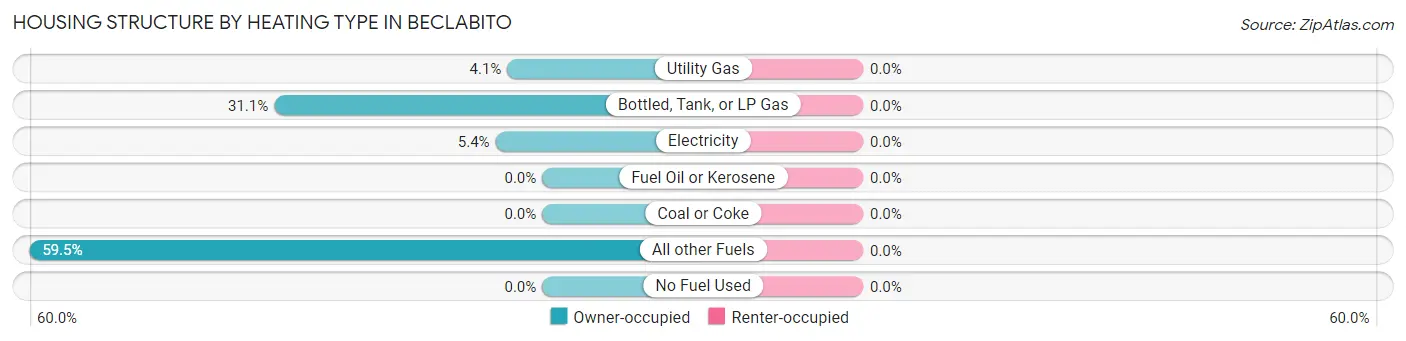
| Heating Type | Owner-occupied | Renter-occupied |
| Utility Gas | 3 (4.1%) | 0 (0.0%) |
| Bottled, Tank, or LP Gas | 23 (31.1%) | 0 (0.0%) |
| Electricity | 4 (5.4%) | 0 (0.0%) |
| Fuel Oil or Kerosene | 0 (0.0%) | 0 (0.0%) |
| Coal or Coke | 0 (0.0%) | 0 (0.0%) |
| All other Fuels | 44 (59.5%) | 0 (0.0%) |
| No Fuel Used | 0 (0.0%) | 0 (0.0%) |
| Total | 74 (100.0%) | 0 (0.0%) |
Household Vehicle Usage in Beclabito
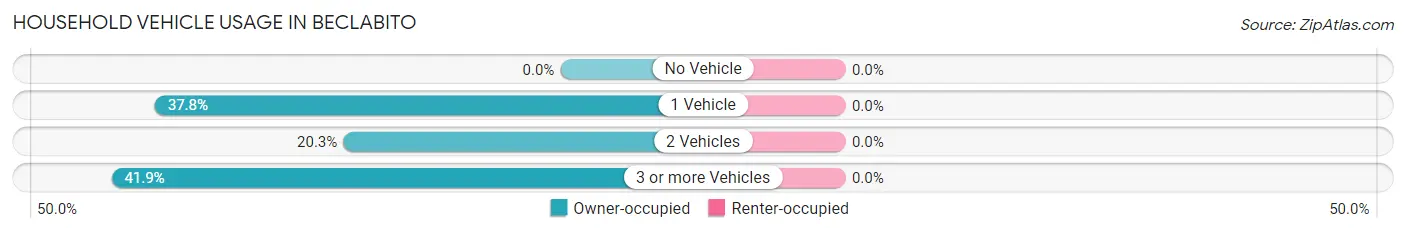
| Vehicles per Household | Owner-occupied | Renter-occupied |
| No Vehicle | 0 (0.0%) | 0 (0.0%) |
| 1 Vehicle | 28 (37.8%) | 0 (0.0%) |
| 2 Vehicles | 15 (20.3%) | 0 (0.0%) |
| 3 or more Vehicles | 31 (41.9%) | 0 (0.0%) |
| Total | 74 (100.0%) | 0 (0.0%) |
Real Estate & Mortgages in Beclabito
Real Estate and Mortgage Overview in Beclabito
| Characteristic | Without Mortgage | With Mortgage |
| Housing Units | 71 | 3 |
| Median Property Value | $76,500 | $0 |
| Median Household Income | $57,321 | $0 |
| Monthly Housing Costs | $396 | $0 |
| Real Estate Taxes | - | - |
Property Value by Mortgage Status in Beclabito
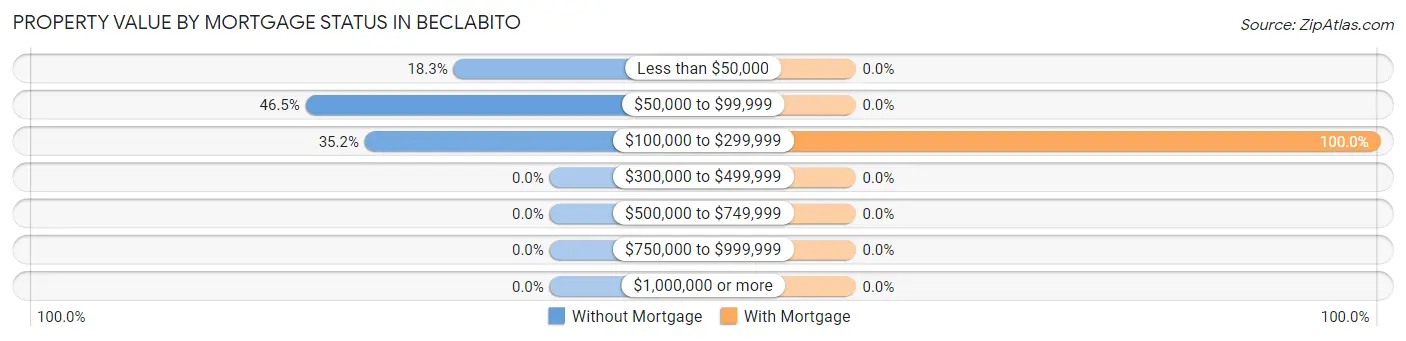
| Property Value | Without Mortgage | With Mortgage |
| Less than $50,000 | 13 (18.3%) | 0 (0.0%) |
| $50,000 to $99,999 | 33 (46.5%) | 0 (0.0%) |
| $100,000 to $299,999 | 25 (35.2%) | 3 (100.0%) |
| $300,000 to $499,999 | 0 (0.0%) | 0 (0.0%) |
| $500,000 to $749,999 | 0 (0.0%) | 0 (0.0%) |
| $750,000 to $999,999 | 0 (0.0%) | 0 (0.0%) |
| $1,000,000 or more | 0 (0.0%) | 0 (0.0%) |
| Total | 71 (100.0%) | 3 (100.0%) |
Household Income by Mortgage Status in Beclabito
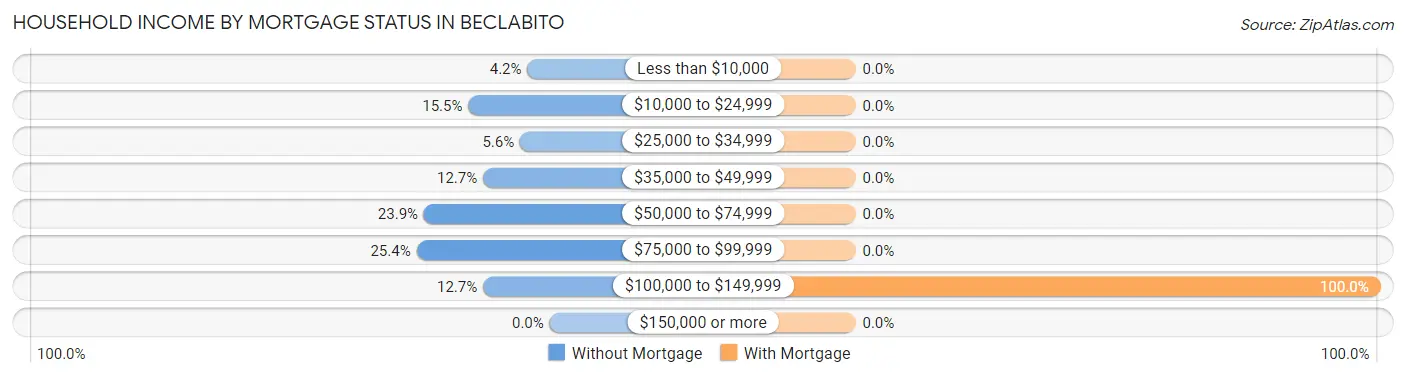
| Household Income | Without Mortgage | With Mortgage |
| Less than $10,000 | 3 (4.2%) | 0 (0.0%) |
| $10,000 to $24,999 | 11 (15.5%) | 0 (0.0%) |
| $25,000 to $34,999 | 4 (5.6%) | 0 (0.0%) |
| $35,000 to $49,999 | 9 (12.7%) | 0 (0.0%) |
| $50,000 to $74,999 | 17 (23.9%) | 0 (0.0%) |
| $75,000 to $99,999 | 18 (25.4%) | 0 (0.0%) |
| $100,000 to $149,999 | 9 (12.7%) | 3 (100.0%) |
| $150,000 or more | 0 (0.0%) | 0 (0.0%) |
| Total | 71 (100.0%) | 3 (100.0%) |
Property Value to Household Income Ratio in Beclabito
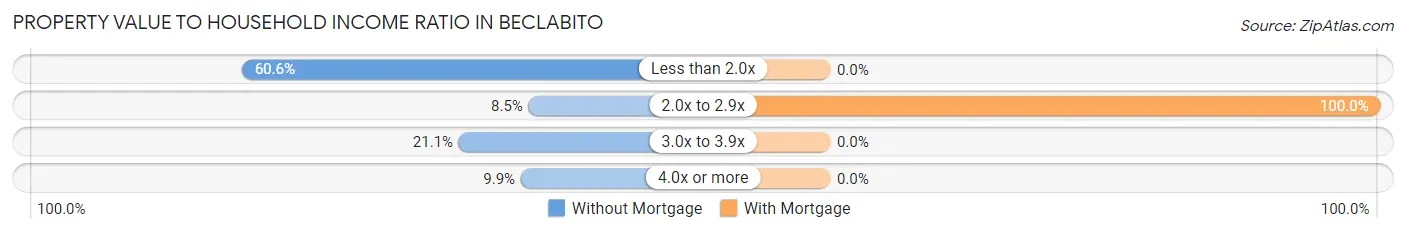
| Value-to-Income Ratio | Without Mortgage | With Mortgage |
| Less than 2.0x | 43 (60.6%) | 0 (0.0%) |
| 2.0x to 2.9x | 6 (8.5%) | 3 (100.0%) |
| 3.0x to 3.9x | 15 (21.1%) | 0 (0.0%) |
| 4.0x or more | 7 (9.9%) | 0 (0.0%) |
| Total | 71 (100.0%) | 3 (100.0%) |
Real Estate Taxes by Mortgage Status in Beclabito
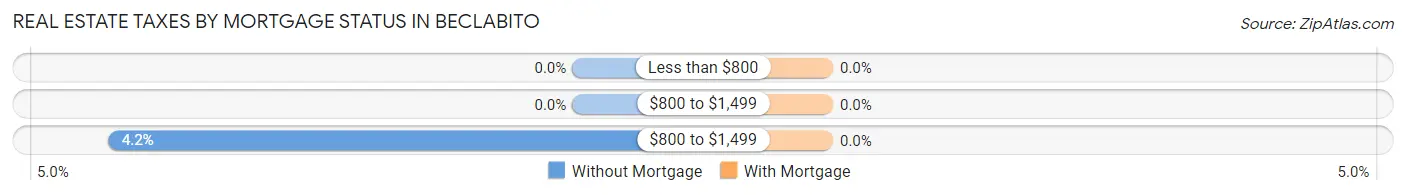
| Property Taxes | Without Mortgage | With Mortgage |
| Less than $800 | 0 (0.0%) | 0 (0.0%) |
| $800 to $1,499 | 0 (0.0%) | 0 (0.0%) |
| $800 to $1,499 | 3 (4.2%) | 0 (0.0%) |
| Total | 71 (100.0%) | 3 (100.0%) |
Health & Disability in Beclabito
Health Insurance Coverage by Age in Beclabito
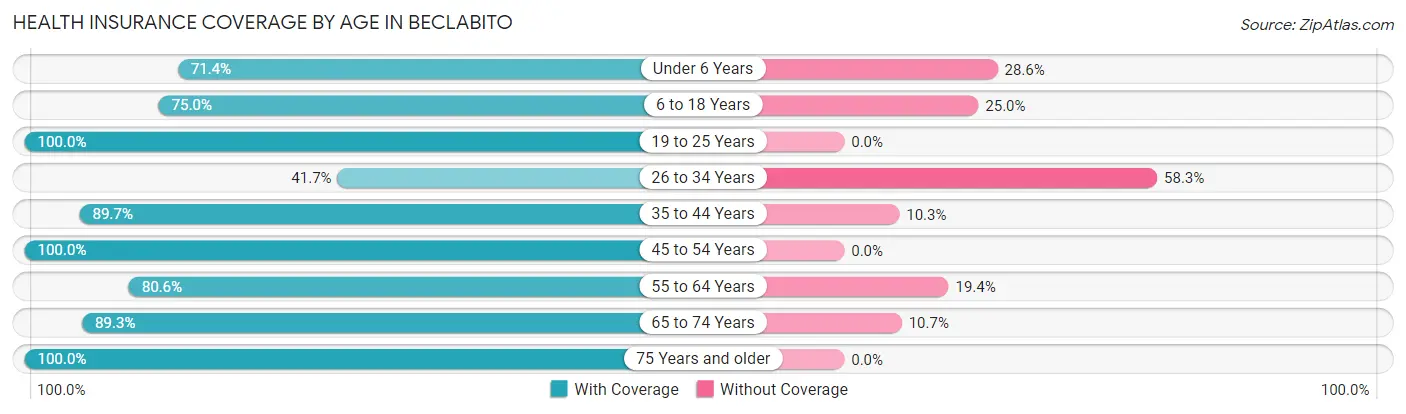
| Age Bracket | With Coverage | Without Coverage |
| Under 6 Years | 5 (71.4%) | 2 (28.6%) |
| 6 to 18 Years | 27 (75.0%) | 9 (25.0%) |
| 19 to 25 Years | 10 (100.0%) | 0 (0.0%) |
| 26 to 34 Years | 15 (41.7%) | 21 (58.3%) |
| 35 to 44 Years | 35 (89.7%) | 4 (10.3%) |
| 45 to 54 Years | 30 (100.0%) | 0 (0.0%) |
| 55 to 64 Years | 29 (80.6%) | 7 (19.4%) |
| 65 to 74 Years | 25 (89.3%) | 3 (10.7%) |
| 75 Years and older | 16 (100.0%) | 0 (0.0%) |
| Total | 192 (80.7%) | 46 (19.3%) |
Health Insurance Coverage by Citizenship Status in Beclabito
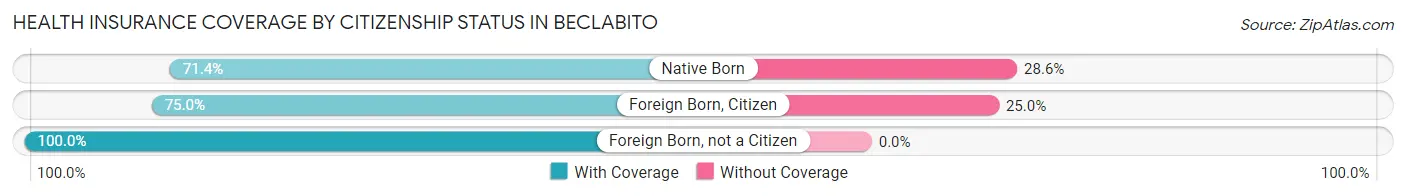
| Citizenship Status | With Coverage | Without Coverage |
| Native Born | 5 (71.4%) | 2 (28.6%) |
| Foreign Born, Citizen | 27 (75.0%) | 9 (25.0%) |
| Foreign Born, not a Citizen | 10 (100.0%) | 0 (0.0%) |
Health Insurance Coverage by Household Income in Beclabito
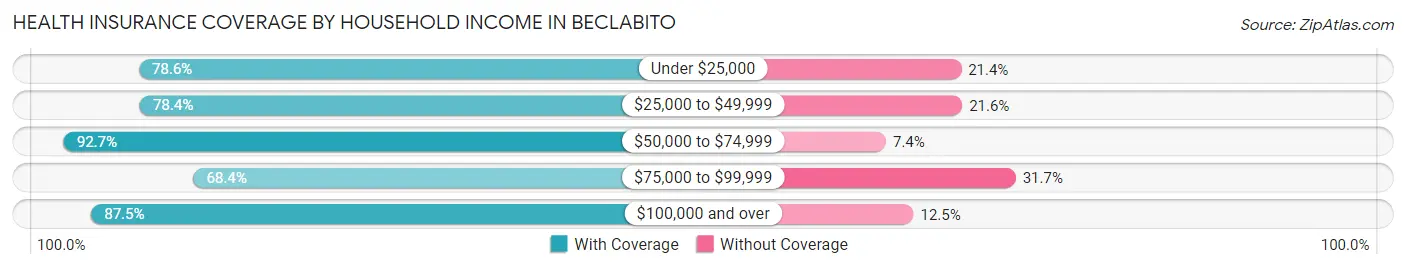
| Household Income | With Coverage | Without Coverage |
| Under $25,000 | 11 (78.6%) | 3 (21.4%) |
| $25,000 to $49,999 | 29 (78.4%) | 8 (21.6%) |
| $50,000 to $74,999 | 63 (92.6%) | 5 (7.3%) |
| $75,000 to $99,999 | 54 (68.3%) | 25 (31.7%) |
| $100,000 and over | 35 (87.5%) | 5 (12.5%) |
Public vs Private Health Insurance Coverage by Age in Beclabito
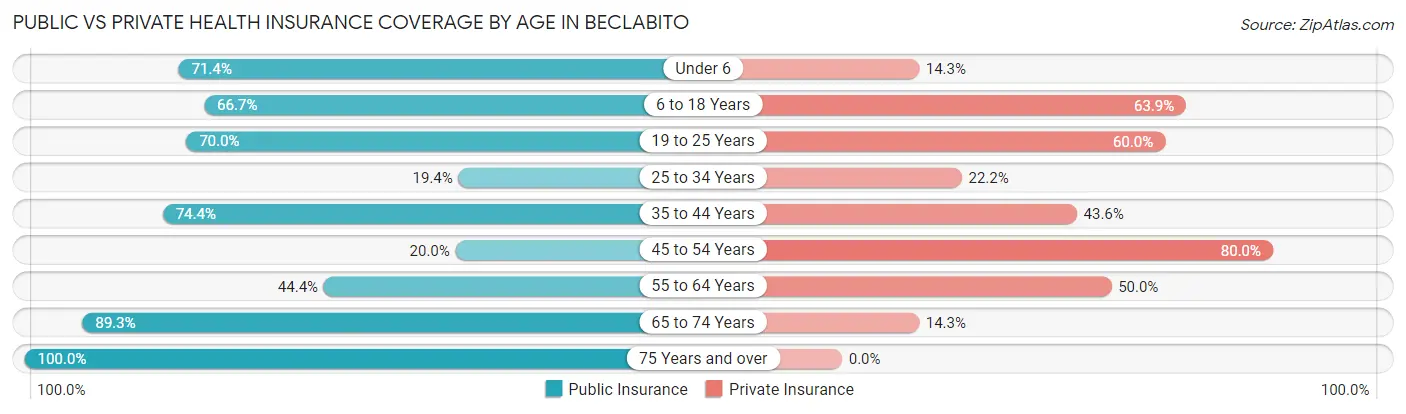
| Age Bracket | Public Insurance | Private Insurance |
| Under 6 | 5 (71.4%) | 1 (14.3%) |
| 6 to 18 Years | 24 (66.7%) | 23 (63.9%) |
| 19 to 25 Years | 7 (70.0%) | 6 (60.0%) |
| 25 to 34 Years | 7 (19.4%) | 8 (22.2%) |
| 35 to 44 Years | 29 (74.4%) | 17 (43.6%) |
| 45 to 54 Years | 6 (20.0%) | 24 (80.0%) |
| 55 to 64 Years | 16 (44.4%) | 18 (50.0%) |
| 65 to 74 Years | 25 (89.3%) | 4 (14.3%) |
| 75 Years and over | 16 (100.0%) | 0 (0.0%) |
| Total | 135 (56.7%) | 101 (42.4%) |
Disability Status by Sex by Age in Beclabito
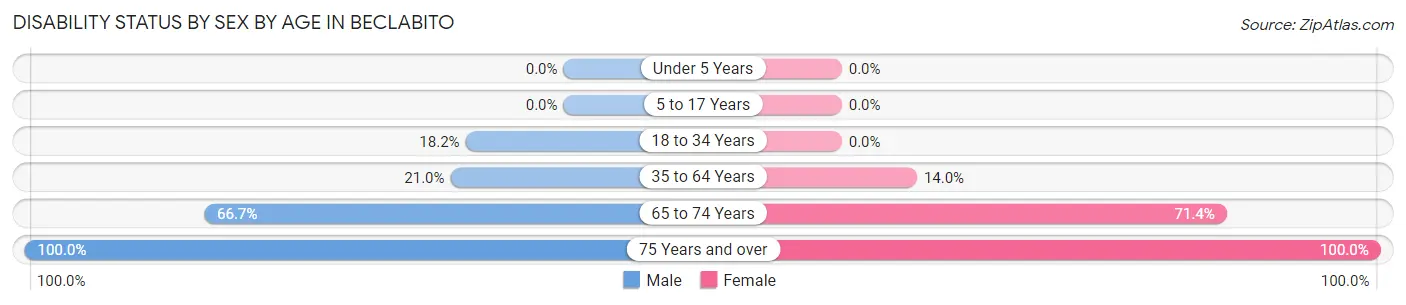
| Age Bracket | Male | Female |
| Under 5 Years | 0 (0.0%) | 0 (0.0%) |
| 5 to 17 Years | 0 (0.0%) | 0 (0.0%) |
| 18 to 34 Years | 4 (18.2%) | 0 (0.0%) |
| 35 to 64 Years | 13 (21.0%) | 6 (14.0%) |
| 65 to 74 Years | 14 (66.7%) | 5 (71.4%) |
| 75 Years and over | 2 (100.0%) | 14 (100.0%) |
Disability Class by Sex by Age in Beclabito
Disability Class: Hearing Difficulty
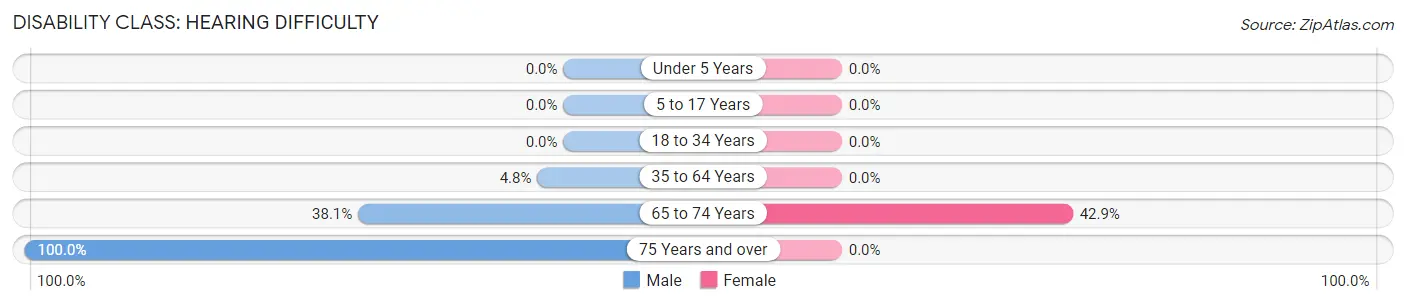
| Age Bracket | Male | Female |
| Under 5 Years | 0 (0.0%) | 0 (0.0%) |
| 5 to 17 Years | 0 (0.0%) | 0 (0.0%) |
| 18 to 34 Years | 0 (0.0%) | 0 (0.0%) |
| 35 to 64 Years | 3 (4.8%) | 0 (0.0%) |
| 65 to 74 Years | 8 (38.1%) | 3 (42.9%) |
| 75 Years and over | 2 (100.0%) | 0 (0.0%) |
Disability Class: Vision Difficulty
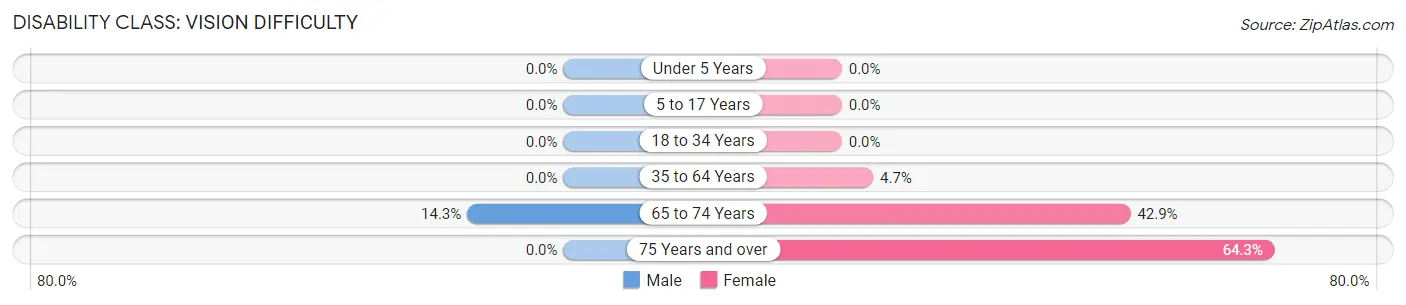
| Age Bracket | Male | Female |
| Under 5 Years | 0 (0.0%) | 0 (0.0%) |
| 5 to 17 Years | 0 (0.0%) | 0 (0.0%) |
| 18 to 34 Years | 0 (0.0%) | 0 (0.0%) |
| 35 to 64 Years | 0 (0.0%) | 2 (4.6%) |
| 65 to 74 Years | 3 (14.3%) | 3 (42.9%) |
| 75 Years and over | 0 (0.0%) | 9 (64.3%) |
Disability Class: Cognitive Difficulty
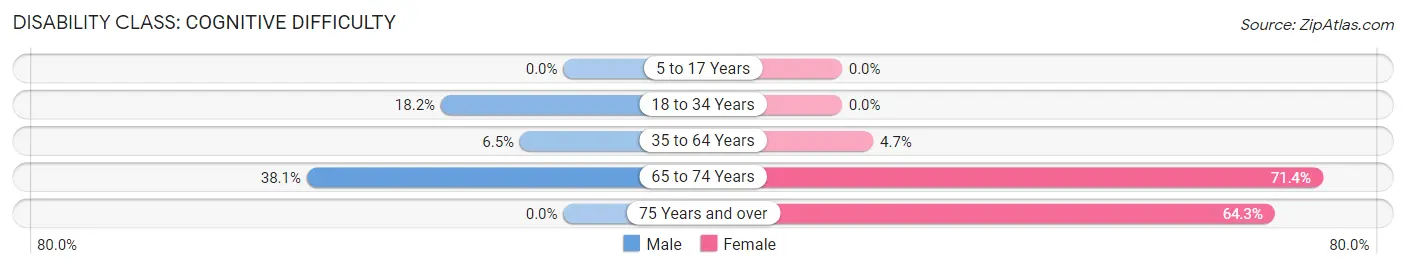
| Age Bracket | Male | Female |
| 5 to 17 Years | 0 (0.0%) | 0 (0.0%) |
| 18 to 34 Years | 4 (18.2%) | 0 (0.0%) |
| 35 to 64 Years | 4 (6.5%) | 2 (4.6%) |
| 65 to 74 Years | 8 (38.1%) | 5 (71.4%) |
| 75 Years and over | 0 (0.0%) | 9 (64.3%) |
Disability Class: Ambulatory Difficulty
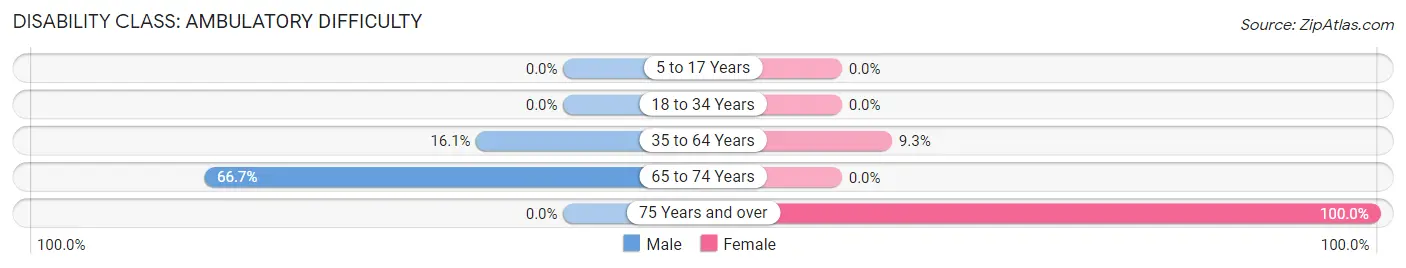
| Age Bracket | Male | Female |
| 5 to 17 Years | 0 (0.0%) | 0 (0.0%) |
| 18 to 34 Years | 0 (0.0%) | 0 (0.0%) |
| 35 to 64 Years | 10 (16.1%) | 4 (9.3%) |
| 65 to 74 Years | 14 (66.7%) | 0 (0.0%) |
| 75 Years and over | 0 (0.0%) | 14 (100.0%) |
Disability Class: Self-Care Difficulty
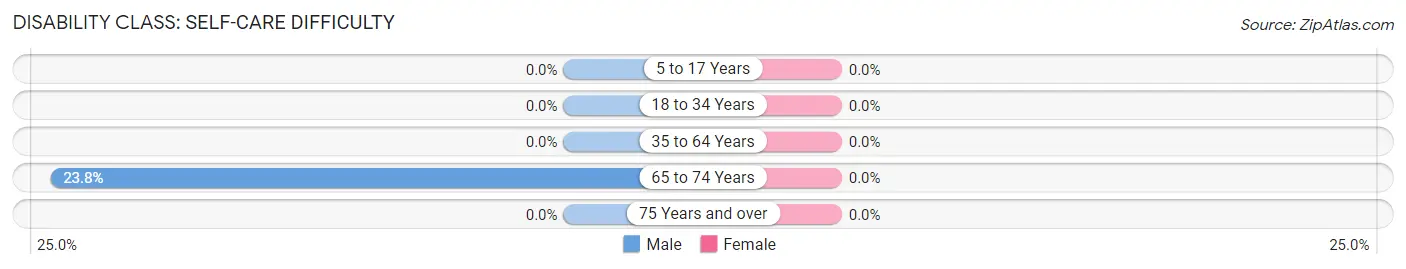
| Age Bracket | Male | Female |
| 5 to 17 Years | 0 (0.0%) | 0 (0.0%) |
| 18 to 34 Years | 0 (0.0%) | 0 (0.0%) |
| 35 to 64 Years | 0 (0.0%) | 0 (0.0%) |
| 65 to 74 Years | 5 (23.8%) | 0 (0.0%) |
| 75 Years and over | 0 (0.0%) | 0 (0.0%) |
Technology Access in Beclabito
Computing Device Access in Beclabito
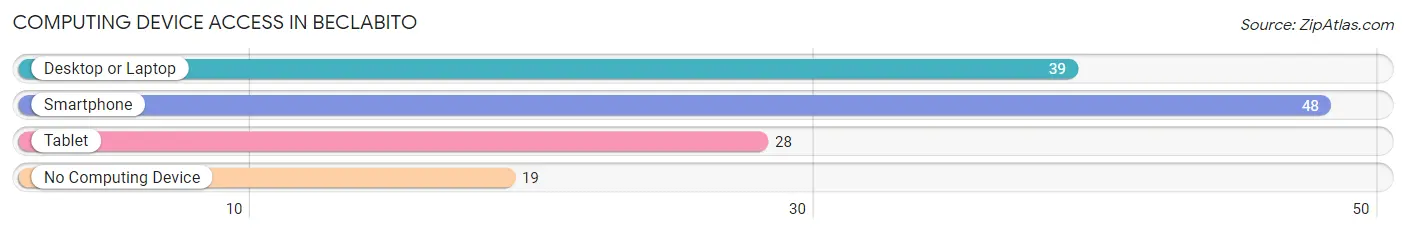
| Device Type | # Households | % Households |
| Desktop or Laptop | 39 | 52.7% |
| Smartphone | 48 | 64.9% |
| Tablet | 28 | 37.8% |
| No Computing Device | 19 | 25.7% |
| Total | 74 | 100.0% |
Internet Access in Beclabito
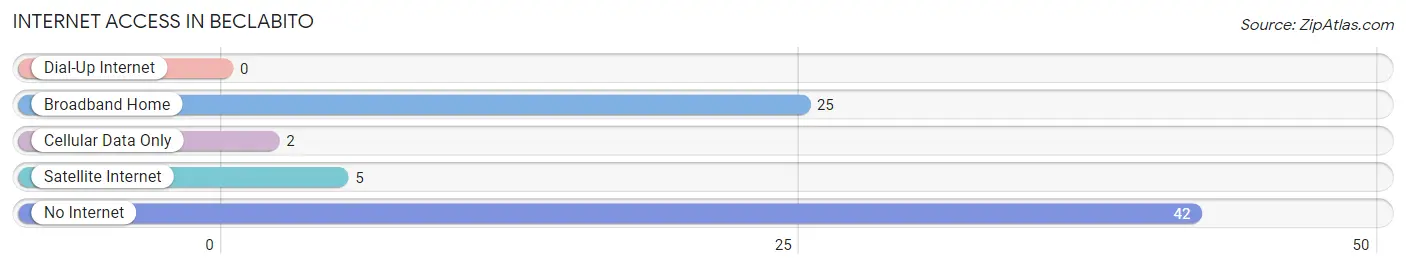
| Internet Type | # Households | % Households |
| Dial-Up Internet | 0 | 0.0% |
| Broadband Home | 25 | 33.8% |
| Cellular Data Only | 2 | 2.7% |
| Satellite Internet | 5 | 6.8% |
| No Internet | 42 | 56.8% |
| Total | 74 | 100.0% |
Beclabito Summary
Beclabito is a small unincorporated community located in San Juan County, New Mexico. It is situated on the Navajo Nation Reservation, approximately 20 miles west of Shiprock. The population of Beclabito was estimated to be around 200 people in 2000.
Geography
Beclabito is located in the Four Corners region of the United States, at the intersection of Arizona, New Mexico, Utah, and Colorado. The community is situated in the Chuska Mountains, at an elevation of 5,890 feet. The area is characterized by high desert terrain, with sparse vegetation and rolling hills. The climate is arid, with hot summers and cold winters.
The nearest major city is Farmington, New Mexico, which is located approximately 50 miles to the east. The closest airport is in Gallup, New Mexico, which is approximately 70 miles away.
History
Beclabito was established in the late 19th century by Navajo families who were seeking a place to settle and raise their families. The community was named after a nearby spring, which was known as Beclabito Spring. The spring was a source of water for the community, and it was also used for ceremonial purposes.
The community was largely self-sufficient, with residents relying on subsistence farming and livestock raising for their livelihoods. The area was also known for its rich deposits of coal, which were mined by the Navajo people.
Economy
The economy of Beclabito is largely based on agriculture and livestock. The area is known for its production of sheep, goats, and cattle. The community also produces a variety of crops, including corn, beans, squash, and melons.
In addition to agriculture, the community is also home to a number of small businesses, including convenience stores, gas stations, and restaurants. The area is also home to a number of art galleries, which feature the work of local Navajo artists.
Demographics
As of the 2000 census, the population of Beclabito was estimated to be around 200 people. The majority of the population is Native American, with the majority of the population being Navajo. The median household income in Beclabito is $20,000, and the median age is 28.
Conclusion
Beclabito is a small unincorporated community located in San Juan County, New Mexico. It is situated on the Navajo Nation Reservation, and is home to around 200 people. The economy of Beclabito is largely based on agriculture and livestock, and the majority of the population is Native American. Beclabito is a unique community that offers a glimpse into the traditional lifestyle of the Navajo people.
Common Questions
What is Per Capita Income in Beclabito?
Per Capita income in Beclabito is $21,965.
What is the Median Family Income in Beclabito?
Median Family Income in Beclabito is $61,750.
What is the Median Household income in Beclabito?
Median Household Income in Beclabito is $60,500.
What is Income or Wage Gap in Beclabito?
Income or Wage Gap in Beclabito is 10.4%.
Women in Beclabito earn 89.6 cents for every dollar earned by a man.
What is Inequality or Gini Index in Beclabito?
Inequality or Gini Index in Beclabito is 0.31.
What is the Total Population of Beclabito?
Total Population of Beclabito is 238.
What is the Total Male Population of Beclabito?
Total Male Population of Beclabito is 125.
What is the Total Female Population of Beclabito?
Total Female Population of Beclabito is 113.
What is the Ratio of Males per 100 Females in Beclabito?
There are 110.62 Males per 100 Females in Beclabito.
What is the Ratio of Females per 100 Males in Beclabito?
There are 90.40 Females per 100 Males in Beclabito.
What is the Median Population Age in Beclabito?
Median Population Age in Beclabito is 44.0 Years.
What is the Average Family Size in Beclabito
Average Family Size in Beclabito is 3.7 People.
What is the Average Household Size in Beclabito
Average Household Size in Beclabito is 3.2 People.
How Large is the Labor Force in Beclabito?
There are 110 People in the Labor Forcein in Beclabito.
What is the Percentage of People in the Labor Force in Beclabito?
55.3% of People are in the Labor Force in Beclabito.
What is the Unemployment Rate in Beclabito?
Unemployment Rate in Beclabito is 16.4%.