Hatch, NM Map & Demographics
Hatch Map
Hatch Overview
$20,060
PER CAPITA INCOME
$56,806
AVG FAMILY INCOME
$42,917
AVG HOUSEHOLD INCOME
0.48
INEQUALITY / GINI INDEX
1,673
TOTAL POPULATION
838
MALE POPULATION
835
FEMALE POPULATION
100.36
MALES / 100 FEMALES
99.64
FEMALES / 100 MALES
26.9
MEDIAN AGE
4.3
AVG FAMILY SIZE
3.7
AVG HOUSEHOLD SIZE
844
LABOR FORCE [ PEOPLE ]
71.5%
PERCENT IN LABOR FORCE
20.1%
UNEMPLOYMENT RATE
Hatch Zip Codes
Hatch Area Codes
Income in Hatch
Income Overview in Hatch
Per Capita Income in Hatch is $20,060, while median incomes of families and households are $56,806 and $42,917 respectively.
| Characteristic | Number | Measure |
| Per Capita Income | 1,673 | $20,060 |
| Median Family Income | 349 | $56,806 |
| Mean Family Income | 349 | $78,528 |
| Median Household Income | 447 | $42,917 |
| Mean Household Income | 447 | $66,991 |
| Income Deficit | 349 | $0 |
| Wage / Income Gap (%) | 1,673 | 0.00% |
| Wage / Income Gap ($) | 1,673 | 100.00¢ per $1 |
| Gini / Inequality Index | 1,673 | 0.48 |
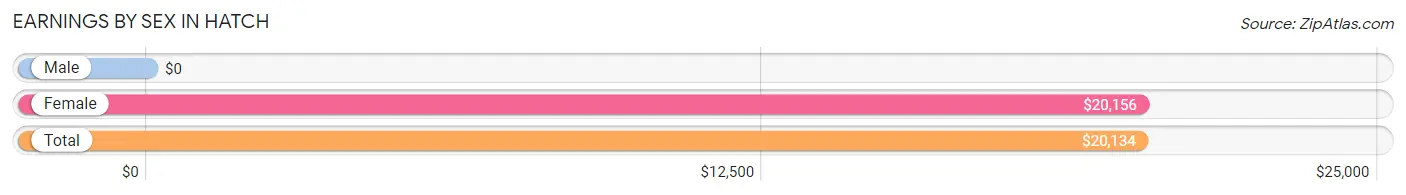
Earnings by Sex in Hatch
| Sex | Number | Average Earnings |
| Male | 381 (47.4%) | $0 |
| Female | 422 (52.5%) | $20,156 |
| Total | 803 (100.0%) | $20,134 |
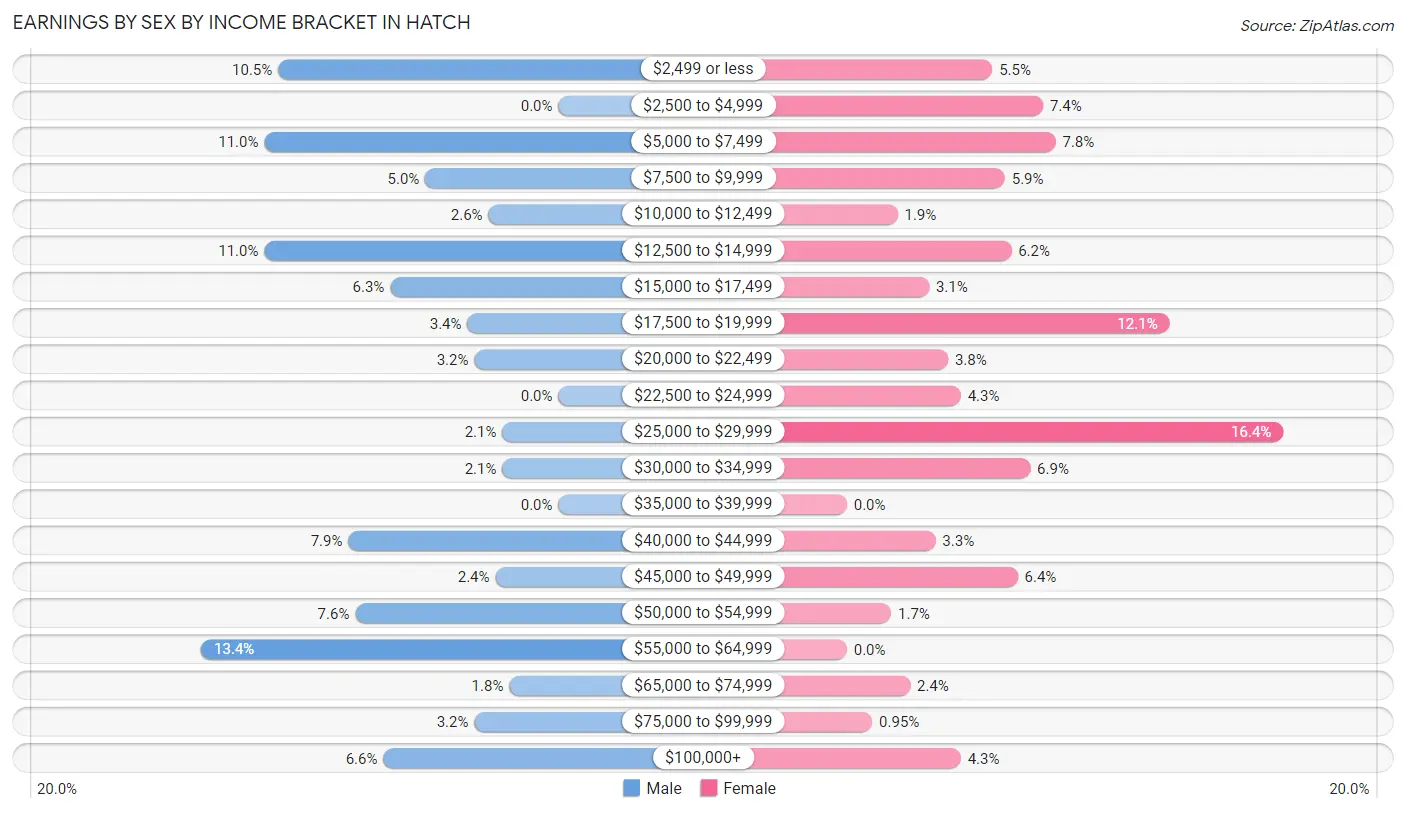
Earnings by Sex by Income Bracket in Hatch
The most common earnings brackets in Hatch are $55,000 to $64,999 for men (51 | 13.4%) and $25,000 to $29,999 for women (69 | 16.4%).
| Income | Male | Female |
| $2,499 or less | 40 (10.5%) | 23 (5.4%) |
| $2,500 to $4,999 | 0 (0.0%) | 31 (7.3%) |
| $5,000 to $7,499 | 42 (11.0%) | 33 (7.8%) |
| $7,500 to $9,999 | 19 (5.0%) | 25 (5.9%) |
| $10,000 to $12,499 | 10 (2.6%) | 8 (1.9%) |
| $12,500 to $14,999 | 42 (11.0%) | 26 (6.2%) |
| $15,000 to $17,499 | 24 (6.3%) | 13 (3.1%) |
| $17,500 to $19,999 | 13 (3.4%) | 51 (12.1%) |
| $20,000 to $22,499 | 12 (3.2%) | 16 (3.8%) |
| $22,500 to $24,999 | 0 (0.0%) | 18 (4.3%) |
| $25,000 to $29,999 | 8 (2.1%) | 69 (16.4%) |
| $30,000 to $34,999 | 8 (2.1%) | 29 (6.9%) |
| $35,000 to $39,999 | 0 (0.0%) | 0 (0.0%) |
| $40,000 to $44,999 | 30 (7.9%) | 14 (3.3%) |
| $45,000 to $49,999 | 9 (2.4%) | 27 (6.4%) |
| $50,000 to $54,999 | 29 (7.6%) | 7 (1.7%) |
| $55,000 to $64,999 | 51 (13.4%) | 0 (0.0%) |
| $65,000 to $74,999 | 7 (1.8%) | 10 (2.4%) |
| $75,000 to $99,999 | 12 (3.2%) | 4 (0.9%) |
| $100,000+ | 25 (6.6%) | 18 (4.3%) |
| Total | 381 (100.0%) | 422 (100.0%) |
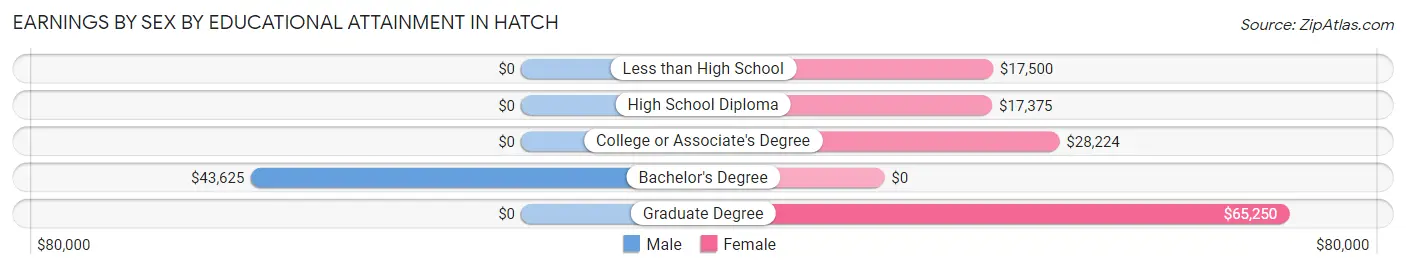
Earnings by Sex by Educational Attainment in Hatch
Average earnings in Hatch are $40,250 for men and $23,958 for women, a difference of 40.5%. Men with an educational attainment of bachelor's degree enjoy the highest average annual earnings of $43,625, while those with bachelor's degree education earn the least with $43,625. Women with an educational attainment of graduate degree earn the most with the average annual earnings of $65,250, while those with high school diploma education have the smallest earnings of $17,375.
| Educational Attainment | Male Income | Female Income |
| Less than High School | - | - |
| High School Diploma | - | - |
| College or Associate's Degree | - | - |
| Bachelor's Degree | $43,625 | $0 |
| Graduate Degree | - | - |
| Total | $40,250 | $23,958 |
Family Income in Hatch
Family Income Brackets in Hatch
According to the Hatch family income data, there are 57 families falling into the $35,000 to $49,999 income range, which is the most common income bracket and makes up 16.3% of all families.
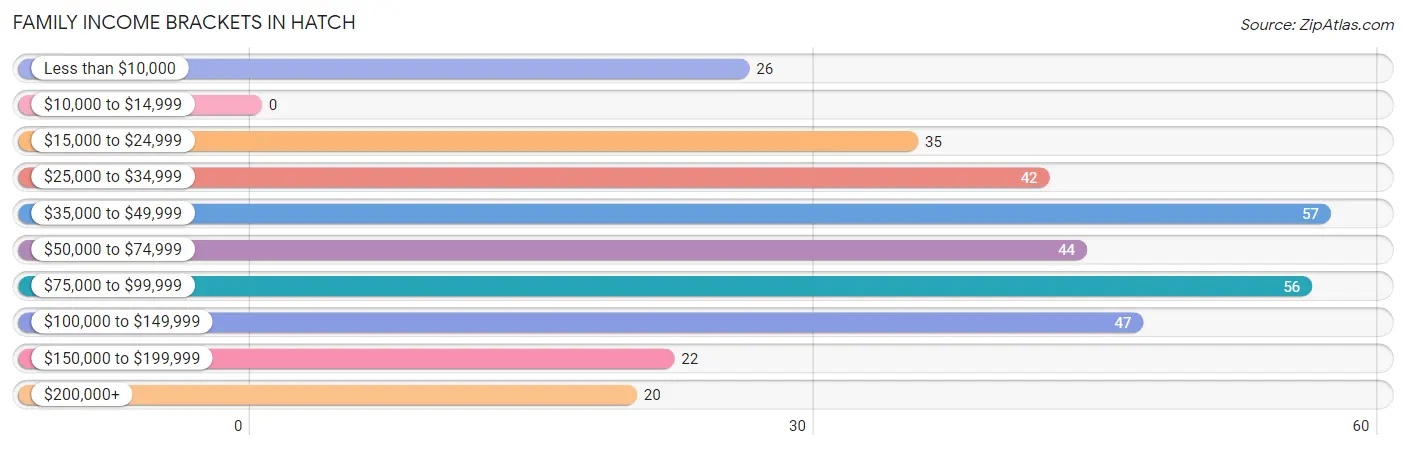
| Income Bracket | # Families | % Families |
| Less than $10,000 | 26 | 7.4% |
| $10,000 to $14,999 | 0 | 0.0% |
| $15,000 to $24,999 | 35 | 10.0% |
| $25,000 to $34,999 | 42 | 12.0% |
| $35,000 to $49,999 | 57 | 16.3% |
| $50,000 to $74,999 | 44 | 12.6% |
| $75,000 to $99,999 | 56 | 16.0% |
| $100,000 to $149,999 | 47 | 13.5% |
| $150,000 to $199,999 | 22 | 6.3% |
| $200,000+ | 20 | 5.7% |
Family Income by Famaliy Size in Hatch
6-person families (25 | 7.2%) account for the highest median family income in Hatch with $85,156 per family, while 4-person families (77 | 22.1%) have the highest median income of $19,601 per family member.
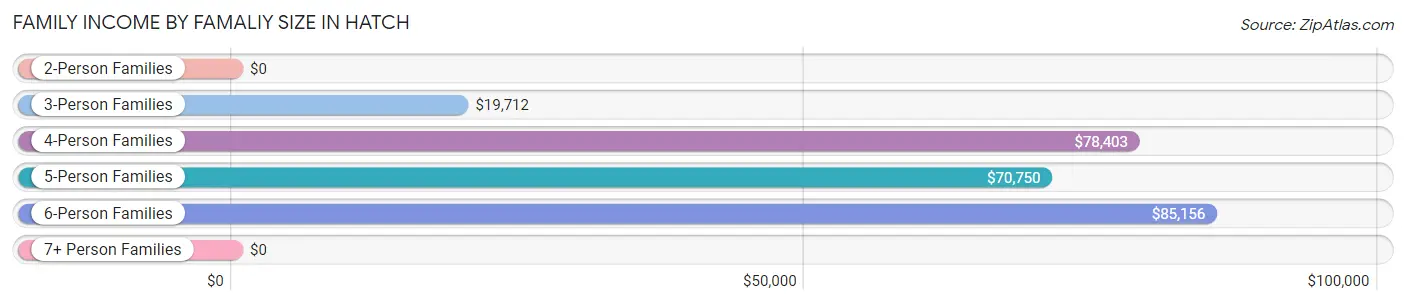
| Income Bracket | # Families | Median Income |
| 2-Person Families | 91 (26.1%) | $0 |
| 3-Person Families | 78 (22.4%) | $19,712 |
| 4-Person Families | 77 (22.1%) | $78,403 |
| 5-Person Families | 52 (14.9%) | $70,750 |
| 6-Person Families | 25 (7.2%) | $85,156 |
| 7+ Person Families | 26 (7.4%) | $0 |
| Total | 349 (100.0%) | $56,806 |
Family Income by Number of Earners in Hatch
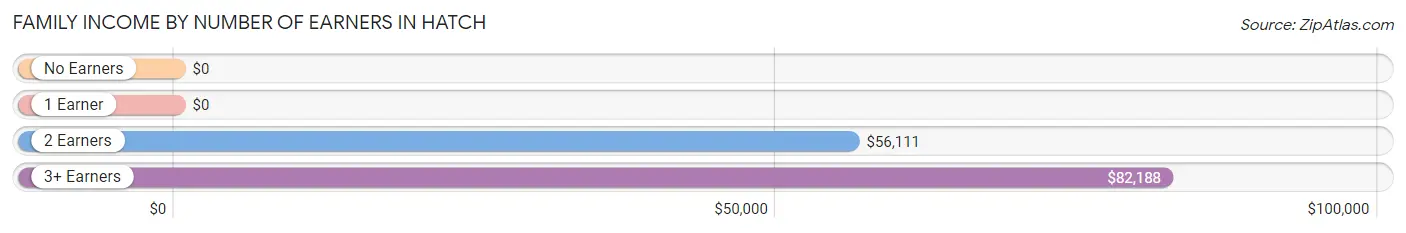
| Number of Earners | # Families | Median Income |
| No Earners | 23 (6.6%) | $0 |
| 1 Earner | 109 (31.2%) | $0 |
| 2 Earners | 178 (51.0%) | $56,111 |
| 3+ Earners | 39 (11.2%) | $82,188 |
| Total | 349 (100.0%) | $56,806 |
Household Income in Hatch
Household Income Brackets in Hatch
With 90 households falling in the category, the $35,000 to $49,999 income range is the most frequent in Hatch, accounting for 20.1% of all households.
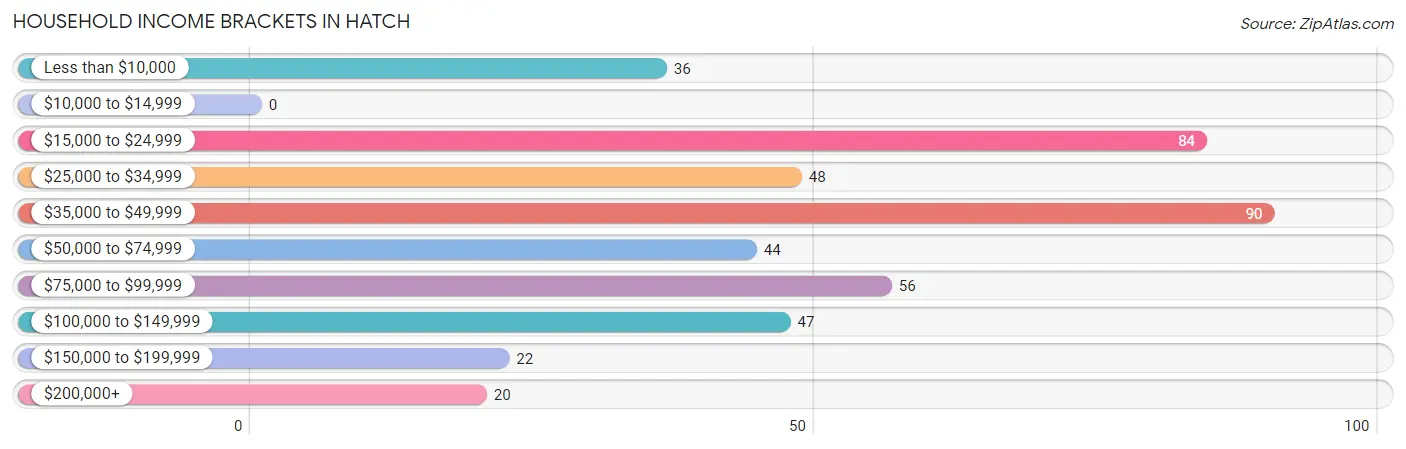
| Income Bracket | # Households | % Households |
| Less than $10,000 | 36 | 8.1% |
| $10,000 to $14,999 | 0 | 0.0% |
| $15,000 to $24,999 | 84 | 18.8% |
| $25,000 to $34,999 | 48 | 10.7% |
| $35,000 to $49,999 | 90 | 20.1% |
| $50,000 to $74,999 | 44 | 9.8% |
| $75,000 to $99,999 | 56 | 12.5% |
| $100,000 to $149,999 | 47 | 10.5% |
| $150,000 to $199,999 | 22 | 4.9% |
| $200,000+ | 20 | 4.5% |
Household Income by Householder Age in Hatch
The median household income in Hatch is $42,917, with the highest median household income of $55,278 found in the 25 to 44 years age bracket for the primary householder. A total of 224 households (50.1%) fall into this category. Meanwhile, the 15 to 24 years age bracket for the primary householder has the lowest median household income of $0, with 28 households (6.3%) in this group.
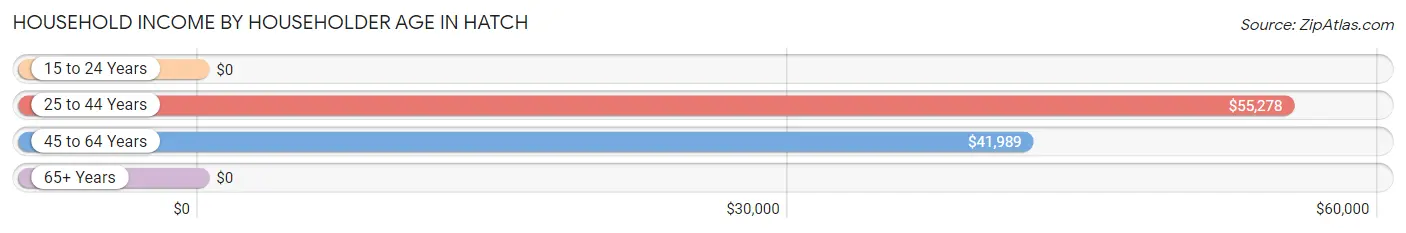
| Income Bracket | # Households | Median Income |
| 15 to 24 Years | 28 (6.3%) | $0 |
| 25 to 44 Years | 224 (50.1%) | $55,278 |
| 45 to 64 Years | 145 (32.4%) | $41,989 |
| 65+ Years | 50 (11.2%) | $0 |
| Total | 447 (100.0%) | $42,917 |
Poverty in Hatch
Income Below Poverty by Sex and Age in Hatch
With 26.0% poverty level for males and 29.6% for females among the residents of Hatch, under 5 year old males and 12 to 14 year old females are the most vulnerable to poverty, with 27 males (69.2%) and 26 females (66.7%) in their respective age groups living below the poverty level.
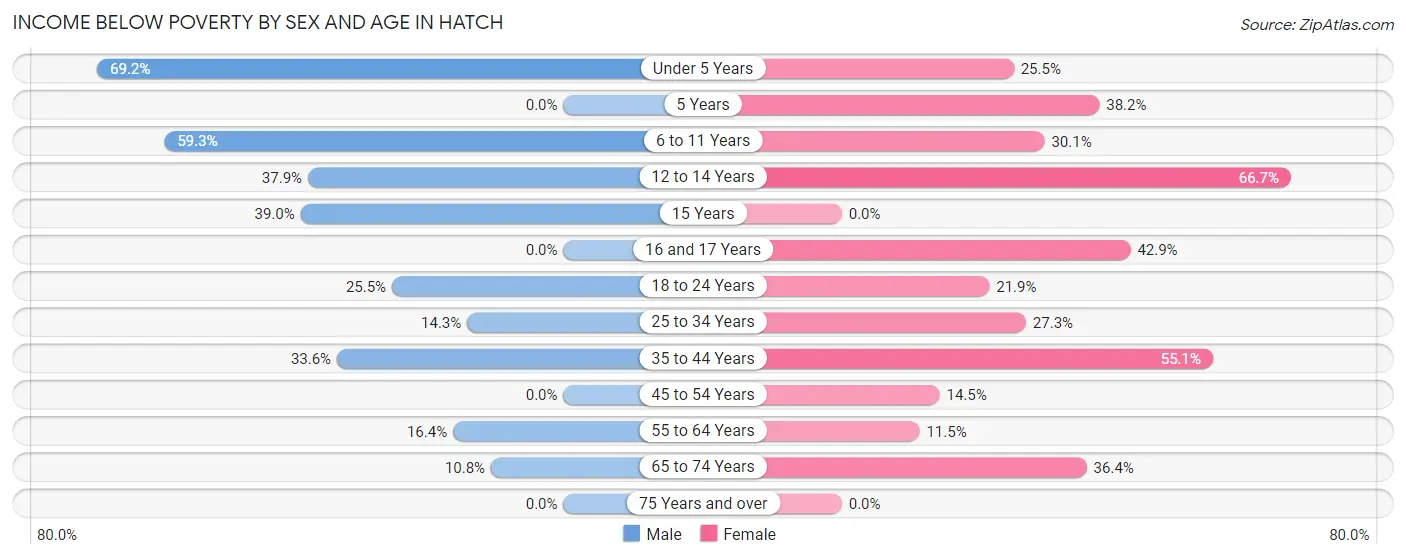
| Age Bracket | Male | Female |
| Under 5 Years | 27 (69.2%) | 12 (25.5%) |
| 5 Years | 0 (0.0%) | 13 (38.2%) |
| 6 to 11 Years | 64 (59.3%) | 31 (30.1%) |
| 12 to 14 Years | 22 (37.9%) | 26 (66.7%) |
| 15 Years | 16 (39.0%) | 0 (0.0%) |
| 16 and 17 Years | 0 (0.0%) | 6 (42.9%) |
| 18 to 24 Years | 14 (25.5%) | 30 (21.9%) |
| 25 to 34 Years | 16 (14.3%) | 38 (27.3%) |
| 35 to 44 Years | 39 (33.6%) | 65 (55.1%) |
| 45 to 54 Years | 0 (0.0%) | 9 (14.5%) |
| 55 to 64 Years | 10 (16.4%) | 9 (11.5%) |
| 65 to 74 Years | 10 (10.7%) | 8 (36.4%) |
| 75 Years and over | 0 (0.0%) | 0 (0.0%) |
| Total | 218 (26.0%) | 247 (29.6%) |
Income Above Poverty by Sex and Age in Hatch
According to the poverty statistics in Hatch, males aged 5 years and females aged 15 years are the age groups that are most secure financially, with 100.0% of males and 100.0% of females in these age groups living above the poverty line.
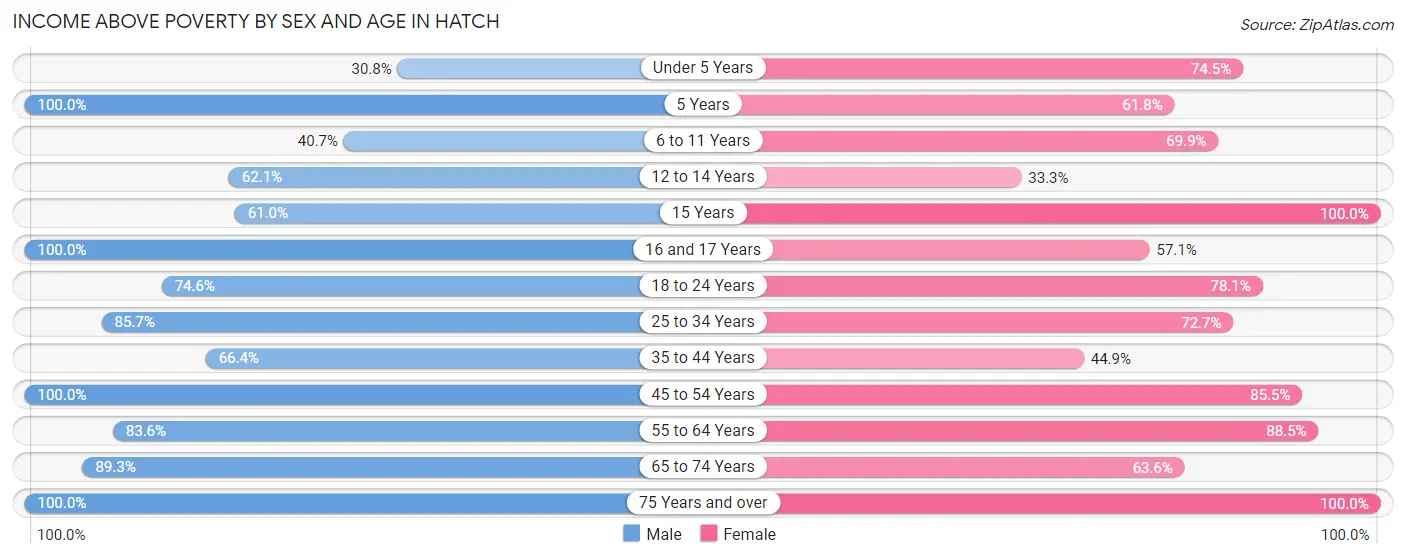
| Age Bracket | Male | Female |
| Under 5 Years | 12 (30.8%) | 35 (74.5%) |
| 5 Years | 11 (100.0%) | 21 (61.8%) |
| 6 to 11 Years | 44 (40.7%) | 72 (69.9%) |
| 12 to 14 Years | 36 (62.1%) | 13 (33.3%) |
| 15 Years | 25 (61.0%) | 12 (100.0%) |
| 16 and 17 Years | 67 (100.0%) | 8 (57.1%) |
| 18 to 24 Years | 41 (74.6%) | 107 (78.1%) |
| 25 to 34 Years | 96 (85.7%) | 101 (72.7%) |
| 35 to 44 Years | 77 (66.4%) | 53 (44.9%) |
| 45 to 54 Years | 38 (100.0%) | 53 (85.5%) |
| 55 to 64 Years | 51 (83.6%) | 69 (88.5%) |
| 65 to 74 Years | 83 (89.2%) | 14 (63.6%) |
| 75 Years and over | 39 (100.0%) | 30 (100.0%) |
| Total | 620 (74.0%) | 588 (70.4%) |
Income Below Poverty Among Married-Couple Families in Hatch
The poverty statistics for married-couple families in Hatch show that 16.4% or 43 of the total 263 families live below the poverty line. Families with 5 or more children have the highest poverty rate of 100.0%, comprising of 12 families. On the other hand, families with no children have the lowest poverty rate of 10.3%, which includes 10 families.
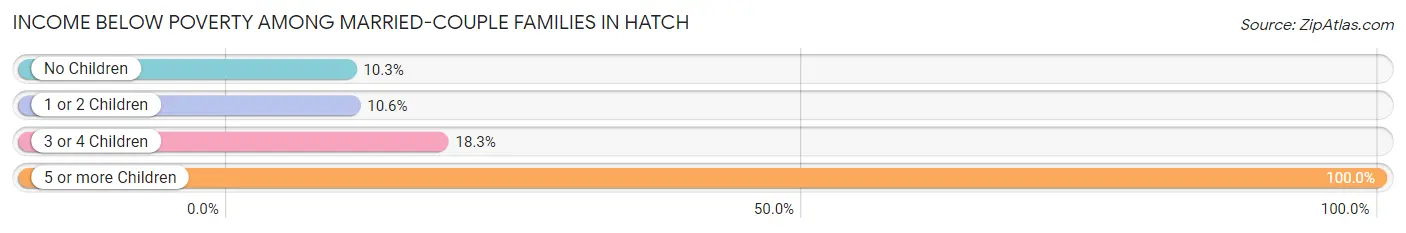
| Children | Above Poverty | Below Poverty |
| No Children | 87 (89.7%) | 10 (10.3%) |
| 1 or 2 Children | 84 (89.4%) | 10 (10.6%) |
| 3 or 4 Children | 49 (81.7%) | 11 (18.3%) |
| 5 or more Children | 0 (0.0%) | 12 (100.0%) |
| Total | 220 (83.7%) | 43 (16.4%) |
Income Below Poverty Among Single-Parent Households in Hatch
According to the poverty data in Hatch, 61.2% or 30 single-father households and 67.6% or 25 single-mother households are living below the poverty line. Among single-father households, those with 3 or 4 children have the highest poverty rate, with 14 households (100.0%) experiencing poverty. Likewise, among single-mother households, those with 1 or 2 children have the highest poverty rate, with 25 households (86.2%) falling below the poverty line.
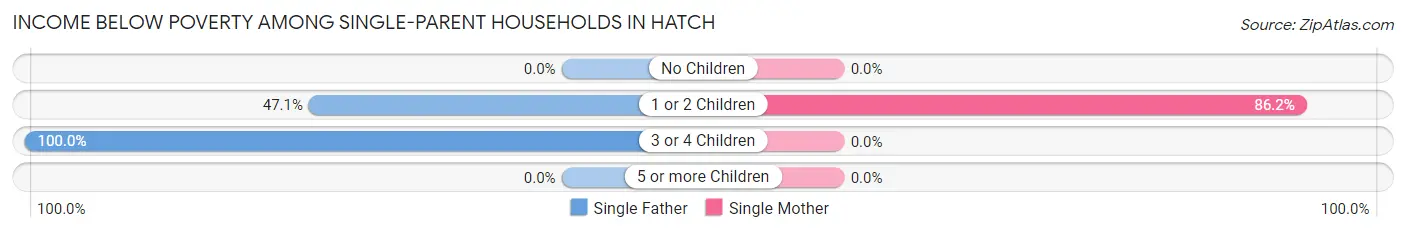
| Children | Single Father | Single Mother |
| No Children | 0 (0.0%) | 0 (0.0%) |
| 1 or 2 Children | 16 (47.1%) | 25 (86.2%) |
| 3 or 4 Children | 14 (100.0%) | 0 (0.0%) |
| 5 or more Children | 0 (0.0%) | 0 (0.0%) |
| Total | 30 (61.2%) | 25 (67.6%) |
Income Below Poverty Among Married-Couple vs Single-Parent Households in Hatch
The poverty data for Hatch shows that 43 of the married-couple family households (16.4%) and 55 of the single-parent households (63.9%) are living below the poverty level. Within the married-couple family households, those with 5 or more children have the highest poverty rate, with 12 households (100.0%) falling below the poverty line. Among the single-parent households, those with 3 or 4 children have the highest poverty rate, with 14 household (100.0%) living below poverty.
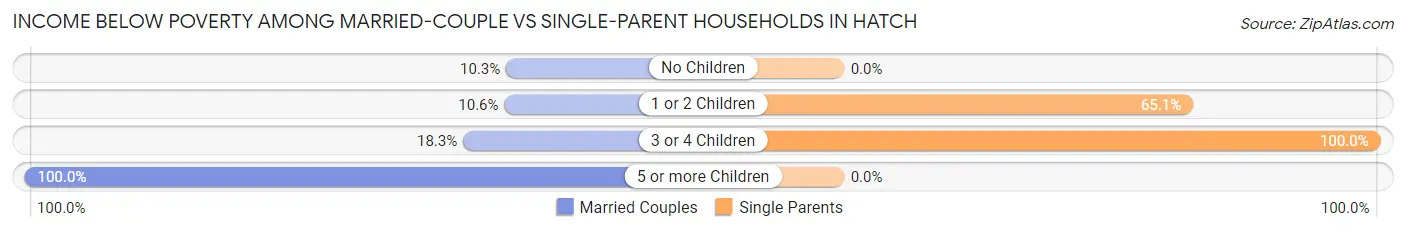
| Children | Married-Couple Families | Single-Parent Households |
| No Children | 10 (10.3%) | 0 (0.0%) |
| 1 or 2 Children | 10 (10.6%) | 41 (65.1%) |
| 3 or 4 Children | 11 (18.3%) | 14 (100.0%) |
| 5 or more Children | 12 (100.0%) | 0 (0.0%) |
| Total | 43 (16.4%) | 55 (63.9%) |
Race in Hatch
The most populous races in Hatch are Hispanic or Latino (1,412 | 84.4%), White / Caucasian (967 | 57.8%), and Some other Race (516 | 30.8%).
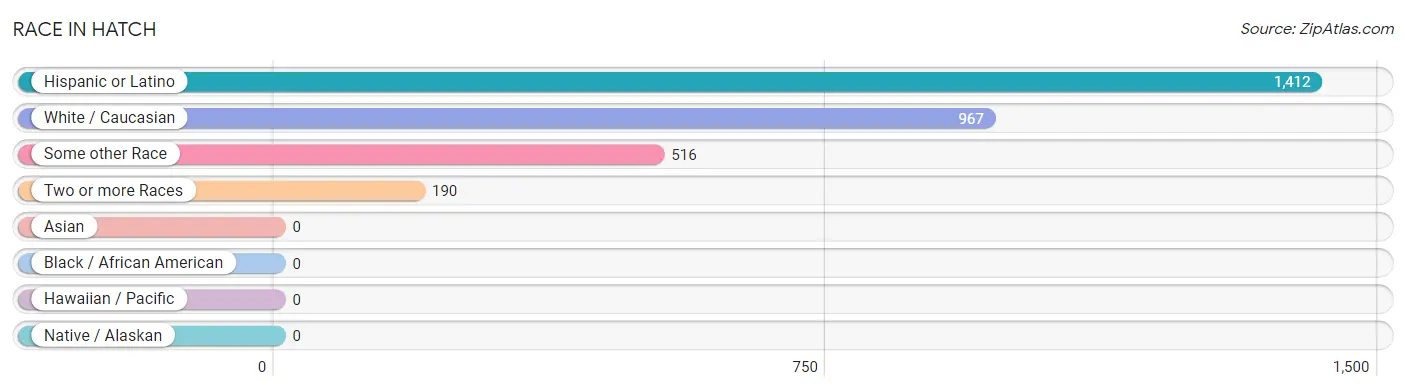
| Race | # Population | % Population |
| Asian | 0 | 0.0% |
| Black / African American | 0 | 0.0% |
| Hawaiian / Pacific | 0 | 0.0% |
| Hispanic or Latino | 1,412 | 84.4% |
| Native / Alaskan | 0 | 0.0% |
| White / Caucasian | 967 | 57.8% |
| Two or more Races | 190 | 11.4% |
| Some other Race | 516 | 30.8% |
| Total | 1,673 | 100.0% |
Ancestry in Hatch
The most populous ancestries reported in Hatch are Mexican (1,359 | 81.2%), Irish (44 | 2.6%), English (35 | 2.1%), German (29 | 1.7%), and Austrian (26 | 1.5%), together accounting for 89.2% of all Hatch residents.
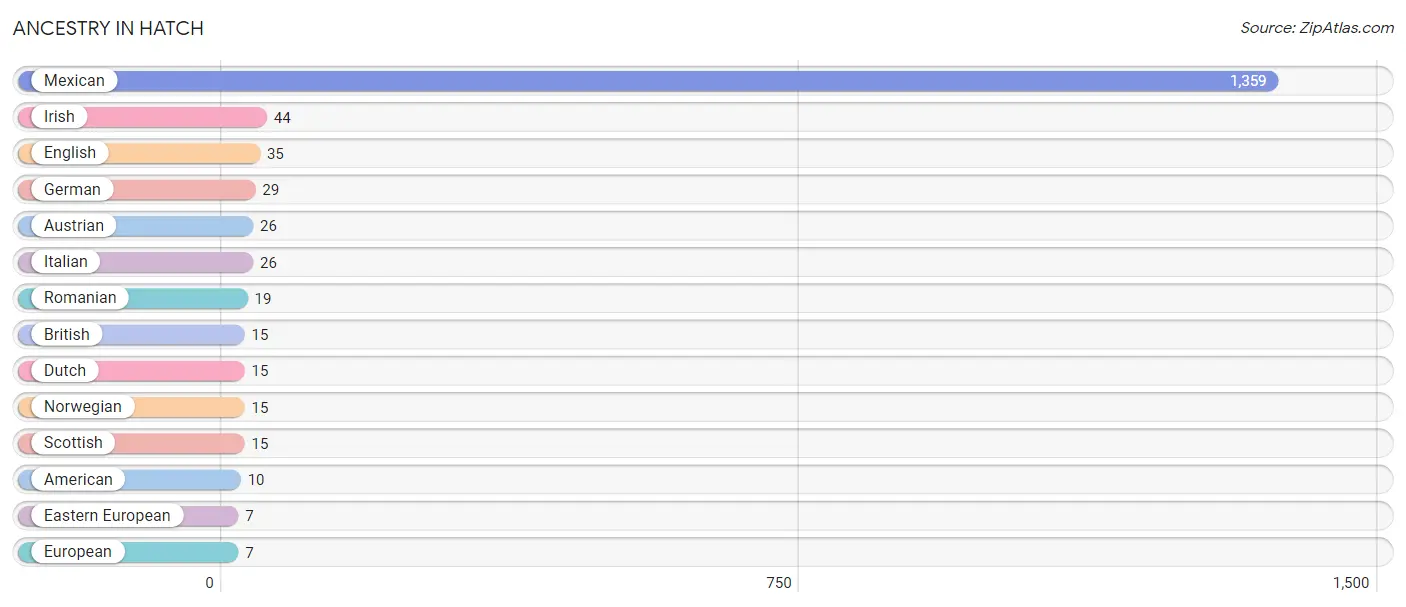
| Ancestry | # Population | % Population |
| American | 10 | 0.6% |
| Austrian | 26 | 1.5% |
| British | 15 | 0.9% |
| Dutch | 15 | 0.9% |
| Eastern European | 7 | 0.4% |
| English | 35 | 2.1% |
| European | 7 | 0.4% |
| German | 29 | 1.7% |
| Irish | 44 | 2.6% |
| Italian | 26 | 1.5% |
| Mexican | 1,359 | 81.2% |
| Norwegian | 15 | 0.9% |
| Romanian | 19 | 1.1% |
| Scottish | 15 | 0.9% | View All 14 Rows |
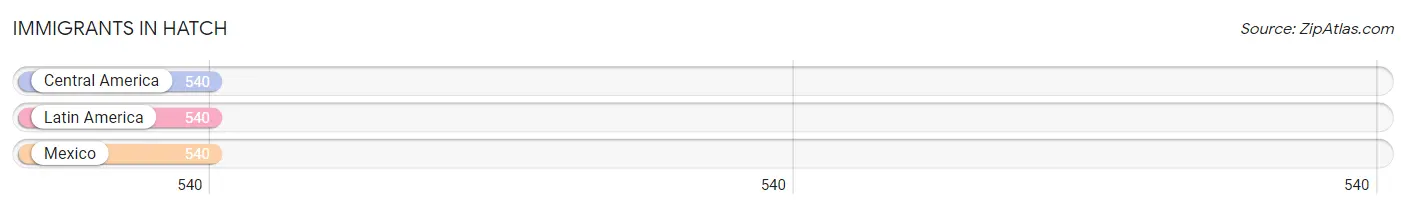
Immigrants in Hatch
The most numerous immigrant groups reported in Hatch came from Central America (540 | 32.3%), Latin America (540 | 32.3%), and Mexico (540 | 32.3%), together accounting for 96.8% of all Hatch residents.
| Immigration Origin | # Population | % Population |
| Central America | 540 | 32.3% |
| Latin America | 540 | 32.3% |
| Mexico | 540 | 32.3% | View All 3 Rows |
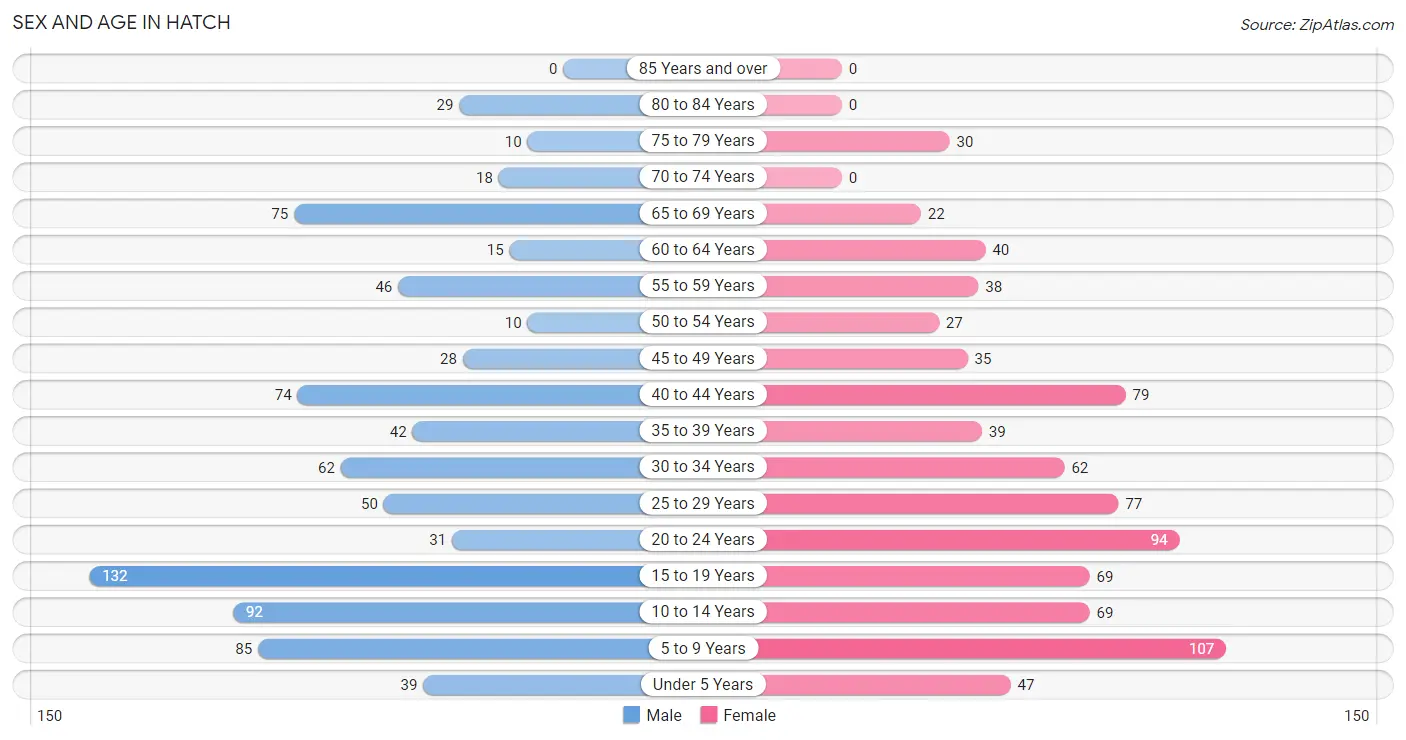
Sex and Age in Hatch
Sex and Age in Hatch
The most populous age groups in Hatch are 15 to 19 Years (132 | 15.8%) for men and 5 to 9 Years (107 | 12.8%) for women.
| Age Bracket | Male | Female |
| Under 5 Years | 39 (4.6%) | 47 (5.6%) |
| 5 to 9 Years | 85 (10.1%) | 107 (12.8%) |
| 10 to 14 Years | 92 (11.0%) | 69 (8.3%) |
| 15 to 19 Years | 132 (15.8%) | 69 (8.3%) |
| 20 to 24 Years | 31 (3.7%) | 94 (11.3%) |
| 25 to 29 Years | 50 (6.0%) | 77 (9.2%) |
| 30 to 34 Years | 62 (7.4%) | 62 (7.4%) |
| 35 to 39 Years | 42 (5.0%) | 39 (4.7%) |
| 40 to 44 Years | 74 (8.8%) | 79 (9.5%) |
| 45 to 49 Years | 28 (3.3%) | 35 (4.2%) |
| 50 to 54 Years | 10 (1.2%) | 27 (3.2%) |
| 55 to 59 Years | 46 (5.5%) | 38 (4.5%) |
| 60 to 64 Years | 15 (1.8%) | 40 (4.8%) |
| 65 to 69 Years | 75 (8.9%) | 22 (2.6%) |
| 70 to 74 Years | 18 (2.1%) | 0 (0.0%) |
| 75 to 79 Years | 10 (1.2%) | 30 (3.6%) |
| 80 to 84 Years | 29 (3.5%) | 0 (0.0%) |
| 85 Years and over | 0 (0.0%) | 0 (0.0%) |
| Total | 838 (100.0%) | 835 (100.0%) |
Families and Households in Hatch
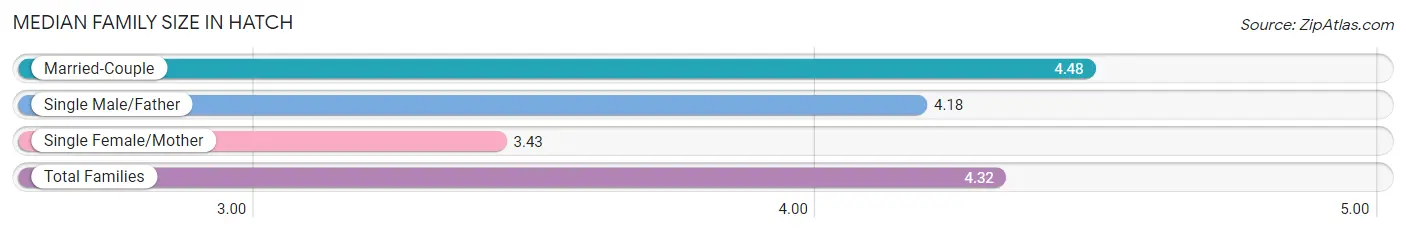
Median Family Size in Hatch
The median family size in Hatch is 4.32 persons per family, with married-couple families (263 | 75.4%) accounting for the largest median family size of 4.48 persons per family. On the other hand, single female/mother families (37 | 10.6%) represent the smallest median family size with 3.43 persons per family.
| Family Type | # Families | Family Size |
| Married-Couple | 263 (75.4%) | 4.48 |
| Single Male/Father | 49 (14.0%) | 4.18 |
| Single Female/Mother | 37 (10.6%) | 3.43 |
| Total Families | 349 (100.0%) | 4.32 |
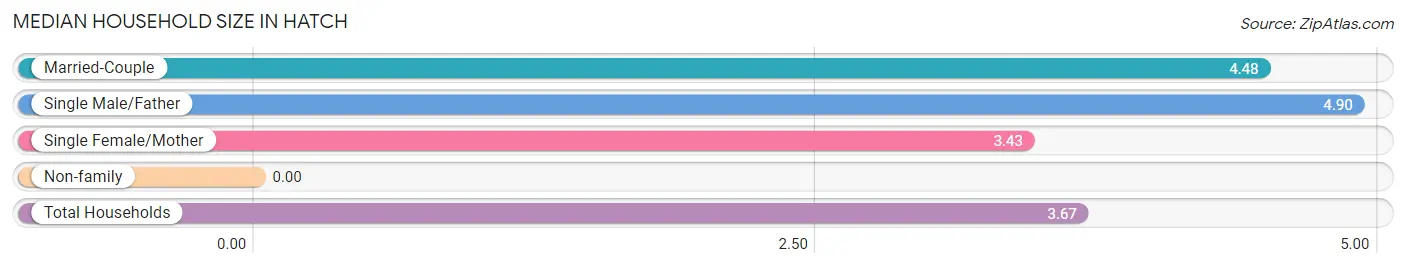
Median Household Size in Hatch
| Household Type | # Households | Household Size |
| Married-Couple | 263 (58.8%) | 4.48 |
| Single Male/Father | 49 (11.0%) | 4.90 |
| Single Female/Mother | 37 (8.3%) | 3.43 |
| Non-family | 98 (21.9%) | - |
| Total Households | 447 (100.0%) | 3.67 |
Household Size by Marriage Status in Hatch
Out of a total of 447 households in Hatch, 349 (78.1%) are family households, while 98 (21.9%) are nonfamily households. The most numerous type of family households are 2-person households, comprising 91, and the most common type of nonfamily households are 1-person households, comprising 98.
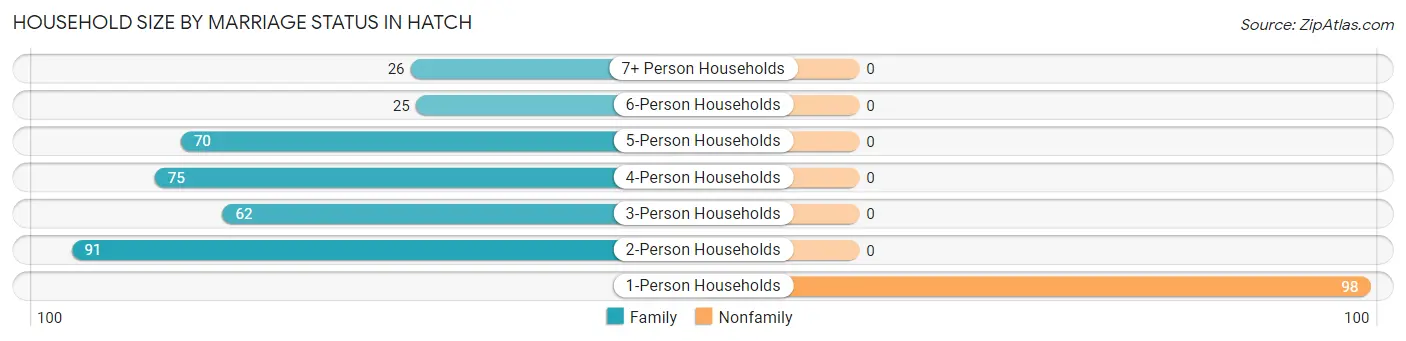
| Household Size | Family Households | Nonfamily Households |
| 1-Person Households | - | 98 (21.9%) |
| 2-Person Households | 91 (20.4%) | 0 (0.0%) |
| 3-Person Households | 62 (13.9%) | 0 (0.0%) |
| 4-Person Households | 75 (16.8%) | 0 (0.0%) |
| 5-Person Households | 70 (15.7%) | 0 (0.0%) |
| 6-Person Households | 25 (5.6%) | 0 (0.0%) |
| 7+ Person Households | 26 (5.8%) | 0 (0.0%) |
| Total | 349 (78.1%) | 98 (21.9%) |
Female Fertility in Hatch
Fertility by Age in Hatch
Average fertility rate in Hatch is 42.0 births per 1,000 women. Women in the age bracket of 20 to 34 years have the highest fertility rate with 82.0 births per 1,000 women. Women in the age bracket of 20 to 34 years acount for 100.0% of all women with births.
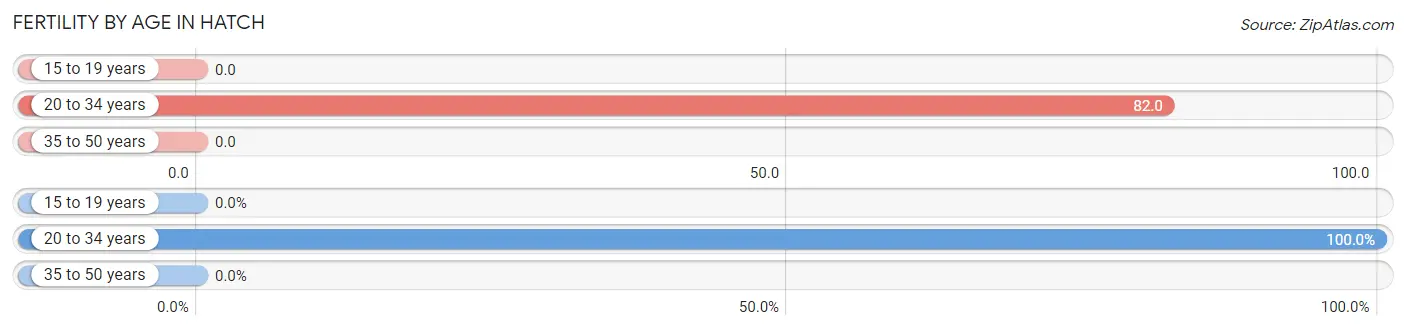
| Age Bracket | Women with Births | Births / 1,000 Women |
| 15 to 19 years | 0 (0.0%) | 0.0 |
| 20 to 34 years | 19 (100.0%) | 82.0 |
| 35 to 50 years | 0 (0.0%) | 0.0 |
| Total | 19 (100.0%) | 42.0 |
Fertility by Age by Marriage Status in Hatch
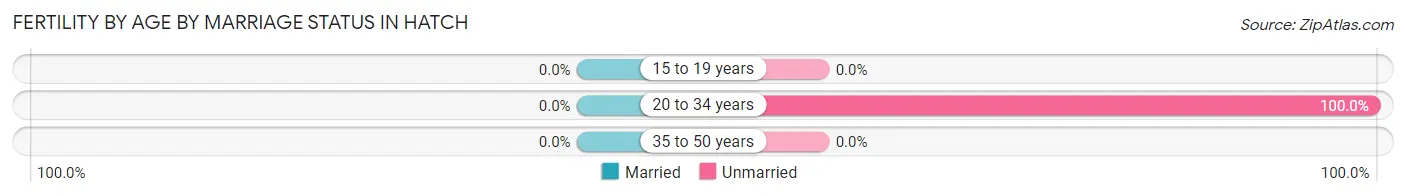
| Age Bracket | Married | Unmarried |
| 15 to 19 years | 0 (0.0%) | 0 (0.0%) |
| 20 to 34 years | 0 (0.0%) | 19 (100.0%) |
| 35 to 50 years | 0 (0.0%) | 0 (0.0%) |
| Total | 0 (0.0%) | 19 (100.0%) |
Fertility by Education in Hatch
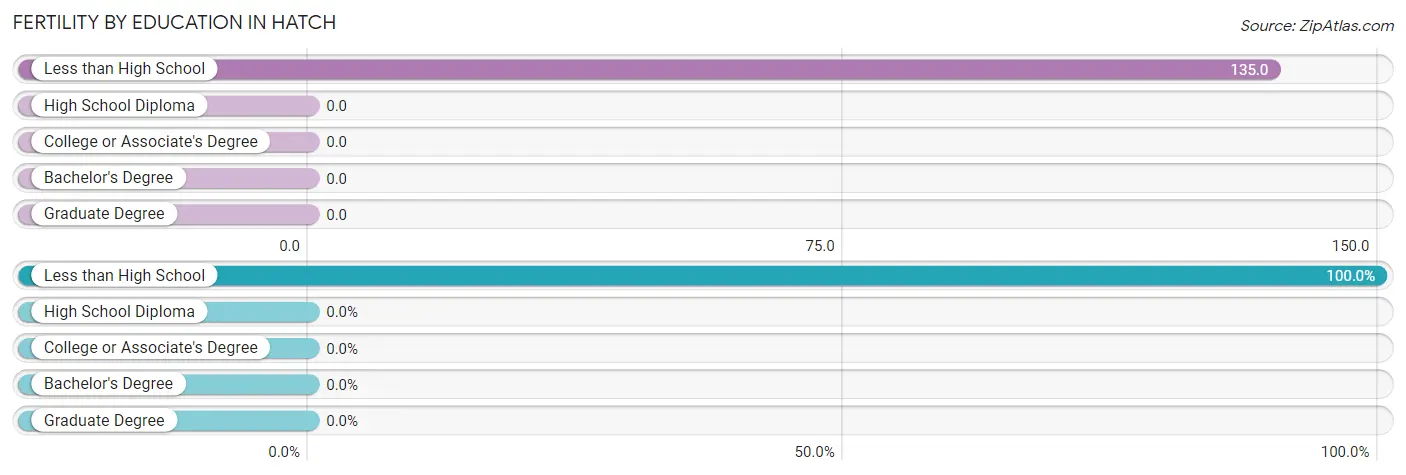
| Educational Attainment | Women with Births | Births / 1,000 Women |
| Less than High School | 19 (100.0%) | 135.0 |
| High School Diploma | 0 (0.0%) | 0.0 |
| College or Associate's Degree | 0 (0.0%) | 0.0 |
| Bachelor's Degree | 0 (0.0%) | 0.0 |
| Graduate Degree | 0 (0.0%) | 0.0 |
| Total | 19 (100.0%) | 42.0 |
Fertility by Education by Marriage Status in Hatch
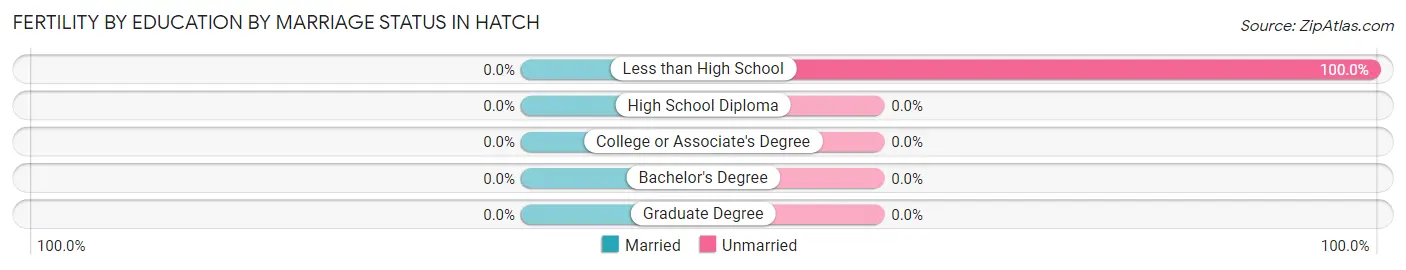
| Educational Attainment | Married | Unmarried |
| Less than High School | 0 (0.0%) | 19 (100.0%) |
| High School Diploma | 0 (0.0%) | 0 (0.0%) |
| College or Associate's Degree | 0 (0.0%) | 0 (0.0%) |
| Bachelor's Degree | 0 (0.0%) | 0 (0.0%) |
| Graduate Degree | 0 (0.0%) | 0 (0.0%) |
| Total | 0 (0.0%) | 19 (100.0%) |
Employment Characteristics in Hatch
Employment by Class of Employer in Hatch
Among the 660 employed individuals in Hatch, private company employees (432 | 65.4%), state government employees (91 | 13.8%), and not-for-profit organizations (53 | 8.0%) make up the most common classes of employment.
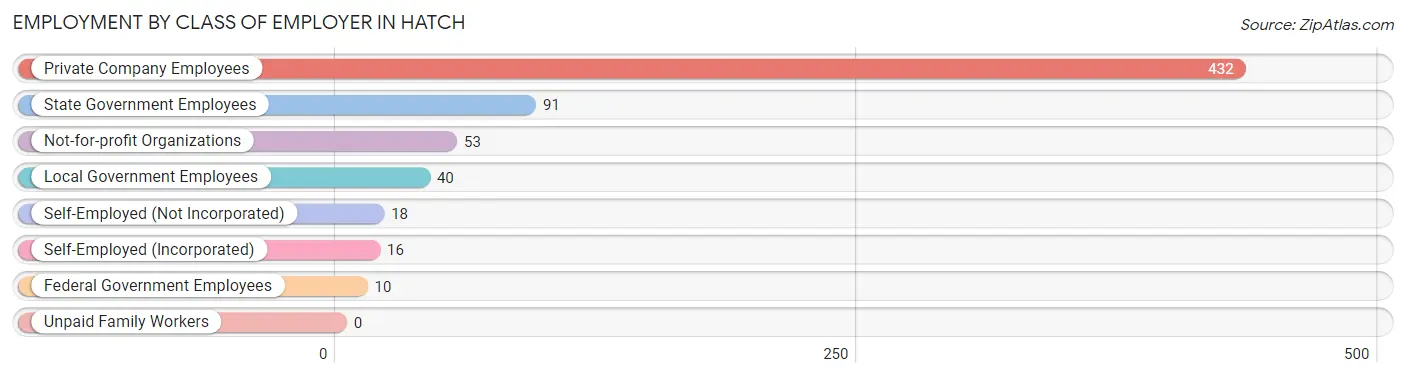
| Employer Class | # Employees | % Employees |
| Private Company Employees | 432 | 65.4% |
| Self-Employed (Incorporated) | 16 | 2.4% |
| Self-Employed (Not Incorporated) | 18 | 2.7% |
| Not-for-profit Organizations | 53 | 8.0% |
| Local Government Employees | 40 | 6.1% |
| State Government Employees | 91 | 13.8% |
| Federal Government Employees | 10 | 1.5% |
| Unpaid Family Workers | 0 | 0.0% |
| Total | 660 | 100.0% |
Employment Status by Age in Hatch
According to the labor force statistics for Hatch, out of the total population over 16 years of age (1,181), 71.5% or 844 individuals are in the labor force, with 20.1% or 170 of them unemployed. The age group with the highest labor force participation rate is 25 to 29 years, with 100.0% or 127 individuals in the labor force. Within the labor force, the 20 to 24 years age range has the highest percentage of unemployed individuals, with 52.4% or 54 of them being unemployed.
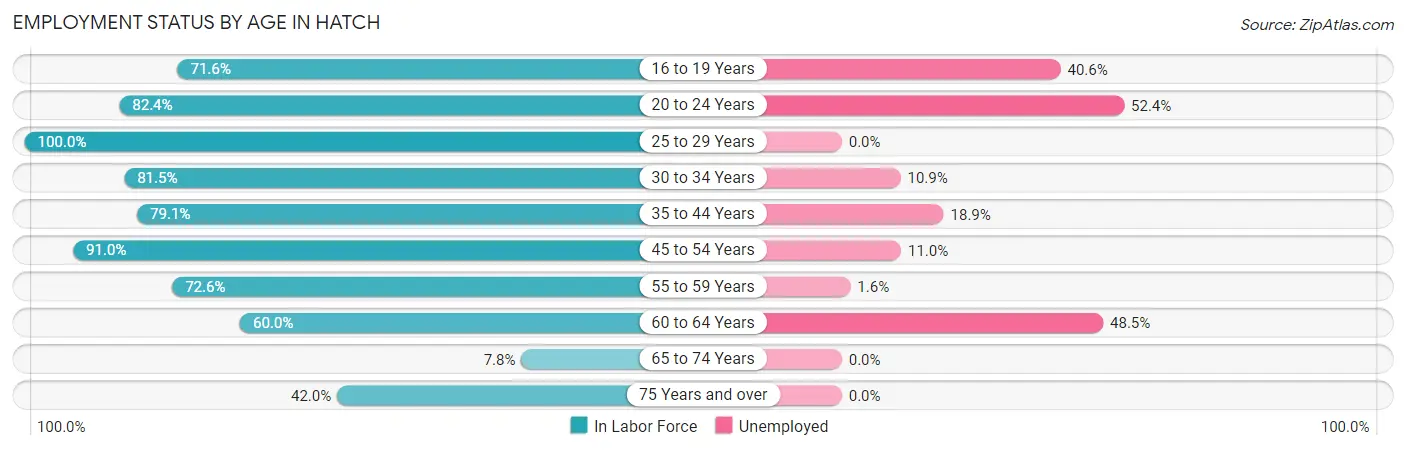
| Age Bracket | In Labor Force | Unemployed |
| 16 to 19 Years | 106 (71.6%) | 43 (40.6%) |
| 20 to 24 Years | 103 (82.4%) | 54 (52.4%) |
| 25 to 29 Years | 127 (100.0%) | 0 (0.0%) |
| 30 to 34 Years | 101 (81.5%) | 11 (10.9%) |
| 35 to 44 Years | 185 (79.1%) | 35 (18.9%) |
| 45 to 54 Years | 91 (91.0%) | 10 (11.0%) |
| 55 to 59 Years | 61 (72.6%) | 1 (1.6%) |
| 60 to 64 Years | 33 (60.0%) | 16 (48.5%) |
| 65 to 74 Years | 9 (7.8%) | 0 (0.0%) |
| 75 Years and over | 29 (42.0%) | 0 (0.0%) |
| Total | 844 (71.5%) | 170 (20.1%) |
Employment Status by Educational Attainment in Hatch
According to labor force statistics for Hatch, 82.6% of individuals (598) out of the total population between 25 and 64 years of age (724) are in the labor force, with 12.2% or 73 of them being unemployed. The group with the highest labor force participation rate are those with the educational attainment of college / associate degree, with 98.6% or 138 individuals in the labor force. Within the labor force, individuals with high school diploma education have the highest percentage of unemployment, with 16.9% or 35 of them being unemployed.
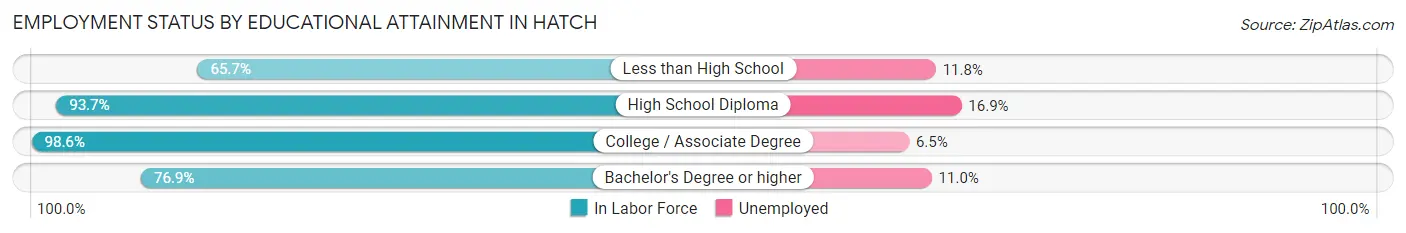
| Educational Attainment | In Labor Force | Unemployed |
| Less than High School | 153 (65.7%) | 27 (11.8%) |
| High School Diploma | 207 (93.7%) | 37 (16.9%) |
| College / Associate Degree | 138 (98.6%) | 9 (6.5%) |
| Bachelor's Degree or higher | 100 (76.9%) | 14 (11.0%) |
| Total | 598 (82.6%) | 88 (12.2%) |
Employment Occupations by Sex in Hatch
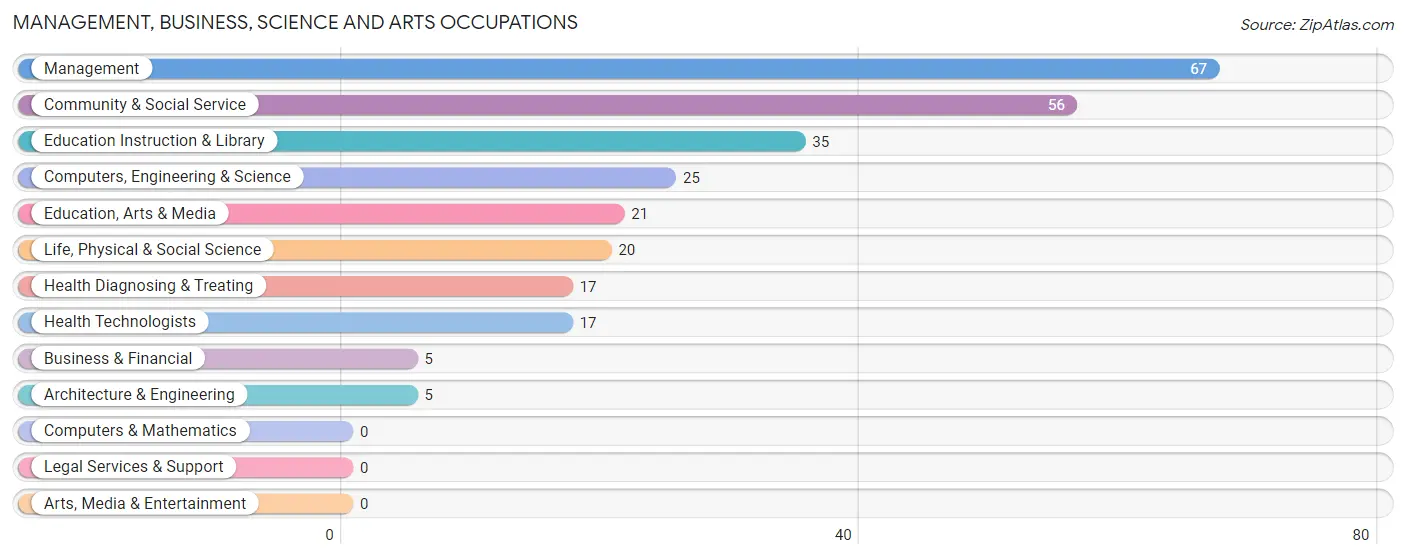
Management, Business, Science and Arts Occupations
The most common Management, Business, Science and Arts occupations in Hatch are Management (67 | 9.9%), Community & Social Service (56 | 8.3%), Education Instruction & Library (35 | 5.2%), Computers, Engineering & Science (25 | 3.7%), and Education, Arts & Media (21 | 3.1%).
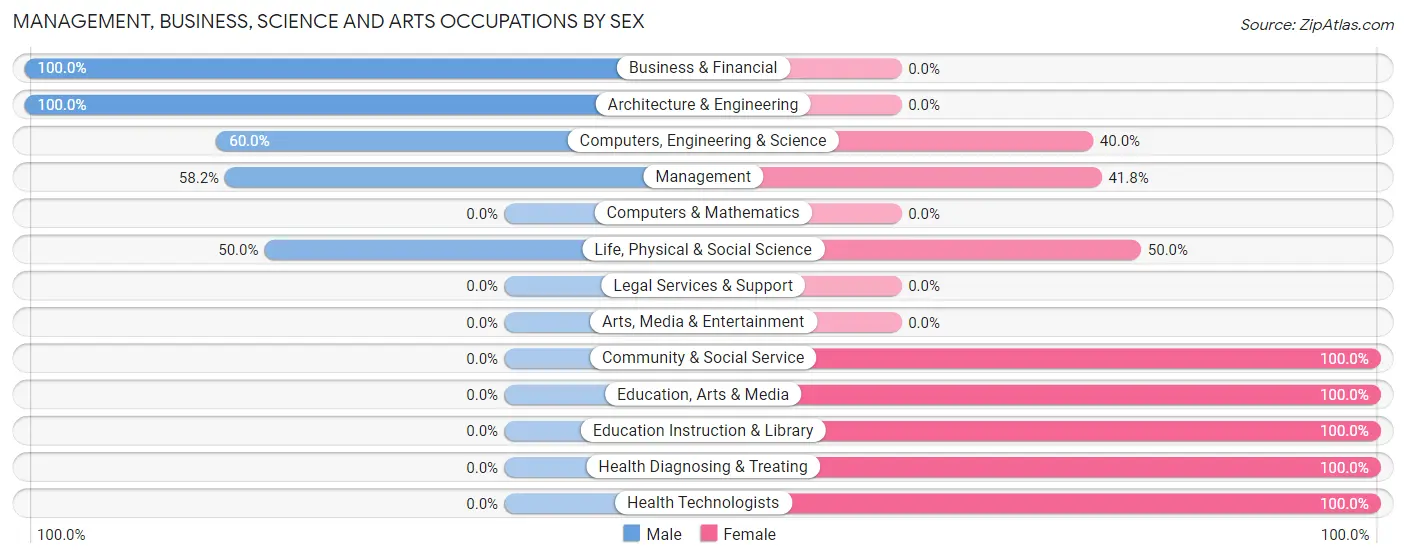
Management, Business, Science and Arts Occupations by Sex
Within the Management, Business, Science and Arts occupations in Hatch, the most male-oriented occupations are Business & Financial (100.0%), Architecture & Engineering (100.0%), and Computers, Engineering & Science (60.0%), while the most female-oriented occupations are Community & Social Service (100.0%), Education, Arts & Media (100.0%), and Education Instruction & Library (100.0%).
| Occupation | Male | Female |
| Management | 39 (58.2%) | 28 (41.8%) |
| Business & Financial | 5 (100.0%) | 0 (0.0%) |
| Computers, Engineering & Science | 15 (60.0%) | 10 (40.0%) |
| Computers & Mathematics | 0 (0.0%) | 0 (0.0%) |
| Architecture & Engineering | 5 (100.0%) | 0 (0.0%) |
| Life, Physical & Social Science | 10 (50.0%) | 10 (50.0%) |
| Community & Social Service | 0 (0.0%) | 56 (100.0%) |
| Education, Arts & Media | 0 (0.0%) | 21 (100.0%) |
| Legal Services & Support | 0 (0.0%) | 0 (0.0%) |
| Education Instruction & Library | 0 (0.0%) | 35 (100.0%) |
| Arts, Media & Entertainment | 0 (0.0%) | 0 (0.0%) |
| Health Diagnosing & Treating | 0 (0.0%) | 17 (100.0%) |
| Health Technologists | 0 (0.0%) | 17 (100.0%) |
| Total (Category) | 59 (34.7%) | 111 (65.3%) |
| Total (Overall) | 325 (48.1%) | 350 (51.8%) |
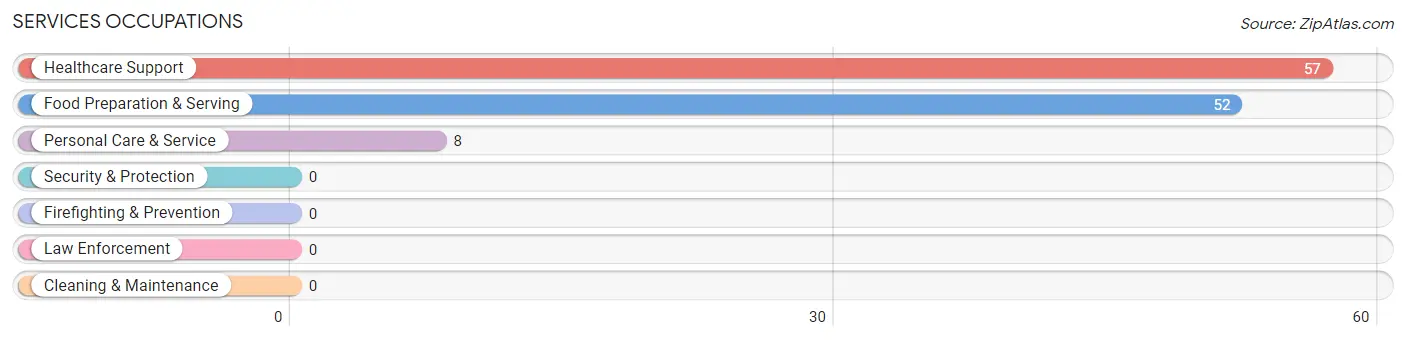
Services Occupations
The most common Services occupations in Hatch are Healthcare Support (57 | 8.4%), Food Preparation & Serving (52 | 7.7%), and Personal Care & Service (8 | 1.2%).
Services Occupations by Sex
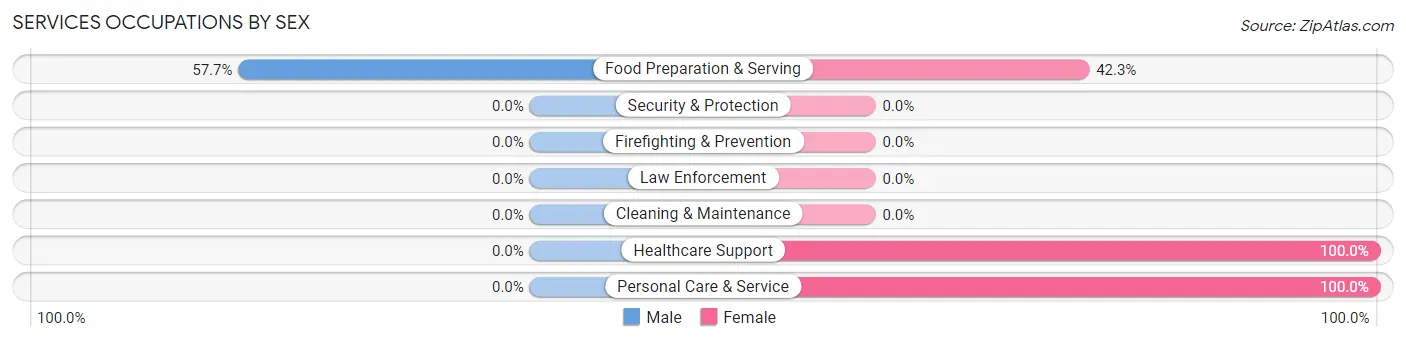
| Occupation | Male | Female |
| Healthcare Support | 0 (0.0%) | 57 (100.0%) |
| Security & Protection | 0 (0.0%) | 0 (0.0%) |
| Firefighting & Prevention | 0 (0.0%) | 0 (0.0%) |
| Law Enforcement | 0 (0.0%) | 0 (0.0%) |
| Food Preparation & Serving | 30 (57.7%) | 22 (42.3%) |
| Cleaning & Maintenance | 0 (0.0%) | 0 (0.0%) |
| Personal Care & Service | 0 (0.0%) | 8 (100.0%) |
| Total (Category) | 30 (25.6%) | 87 (74.4%) |
| Total (Overall) | 325 (48.1%) | 350 (51.8%) |
Sales and Office Occupations
The most common Sales and Office occupations in Hatch are Sales & Related (47 | 7.0%), and Office & Administration (31 | 4.6%).
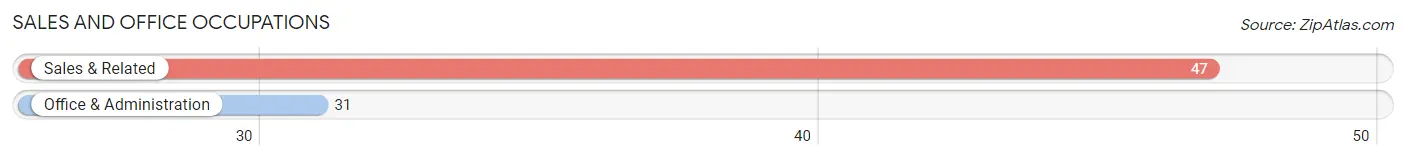
Sales and Office Occupations by Sex
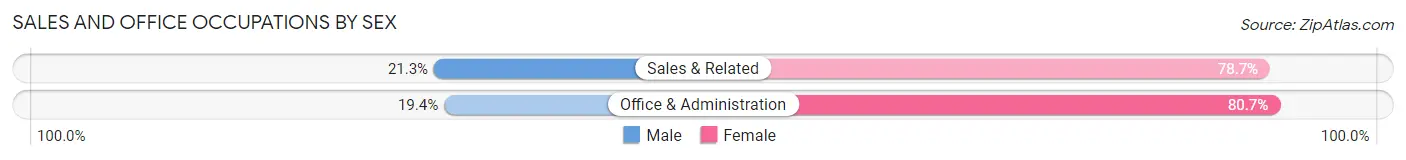
| Occupation | Male | Female |
| Sales & Related | 10 (21.3%) | 37 (78.7%) |
| Office & Administration | 6 (19.4%) | 25 (80.6%) |
| Total (Category) | 16 (20.5%) | 62 (79.5%) |
| Total (Overall) | 325 (48.1%) | 350 (51.8%) |
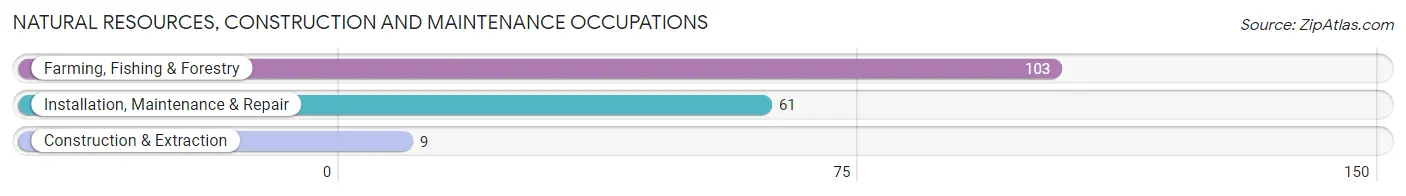
Natural Resources, Construction and Maintenance Occupations
The most common Natural Resources, Construction and Maintenance occupations in Hatch are Farming, Fishing & Forestry (103 | 15.3%), Installation, Maintenance & Repair (61 | 9.0%), and Construction & Extraction (9 | 1.3%).
Natural Resources, Construction and Maintenance Occupations by Sex
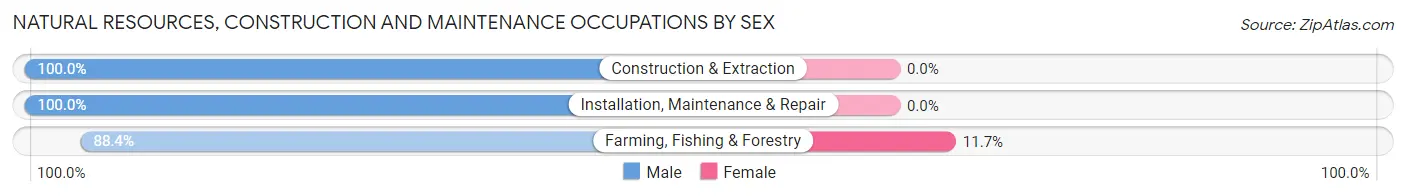
| Occupation | Male | Female |
| Farming, Fishing & Forestry | 91 (88.3%) | 12 (11.7%) |
| Construction & Extraction | 9 (100.0%) | 0 (0.0%) |
| Installation, Maintenance & Repair | 61 (100.0%) | 0 (0.0%) |
| Total (Category) | 161 (93.1%) | 12 (6.9%) |
| Total (Overall) | 325 (48.1%) | 350 (51.8%) |
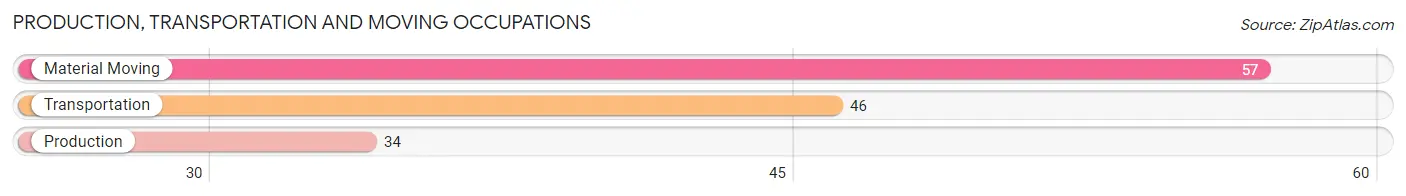
Production, Transportation and Moving Occupations
The most common Production, Transportation and Moving occupations in Hatch are Material Moving (57 | 8.4%), Transportation (46 | 6.8%), and Production (34 | 5.0%).
Production, Transportation and Moving Occupations by Sex
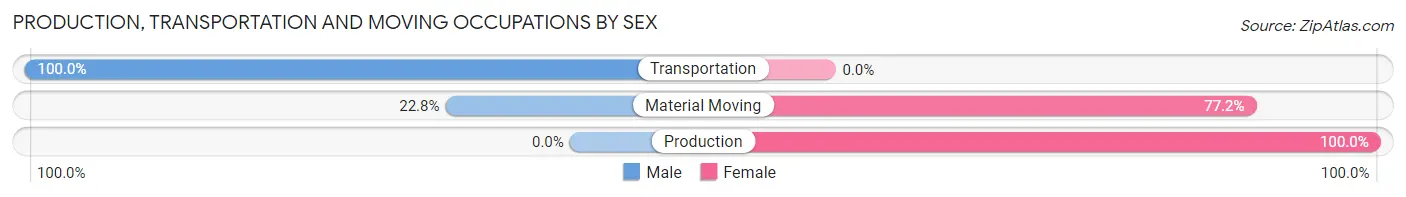
| Occupation | Male | Female |
| Production | 0 (0.0%) | 34 (100.0%) |
| Transportation | 46 (100.0%) | 0 (0.0%) |
| Material Moving | 13 (22.8%) | 44 (77.2%) |
| Total (Category) | 59 (43.1%) | 78 (56.9%) |
| Total (Overall) | 325 (48.1%) | 350 (51.8%) |
Employment Industries by Sex in Hatch
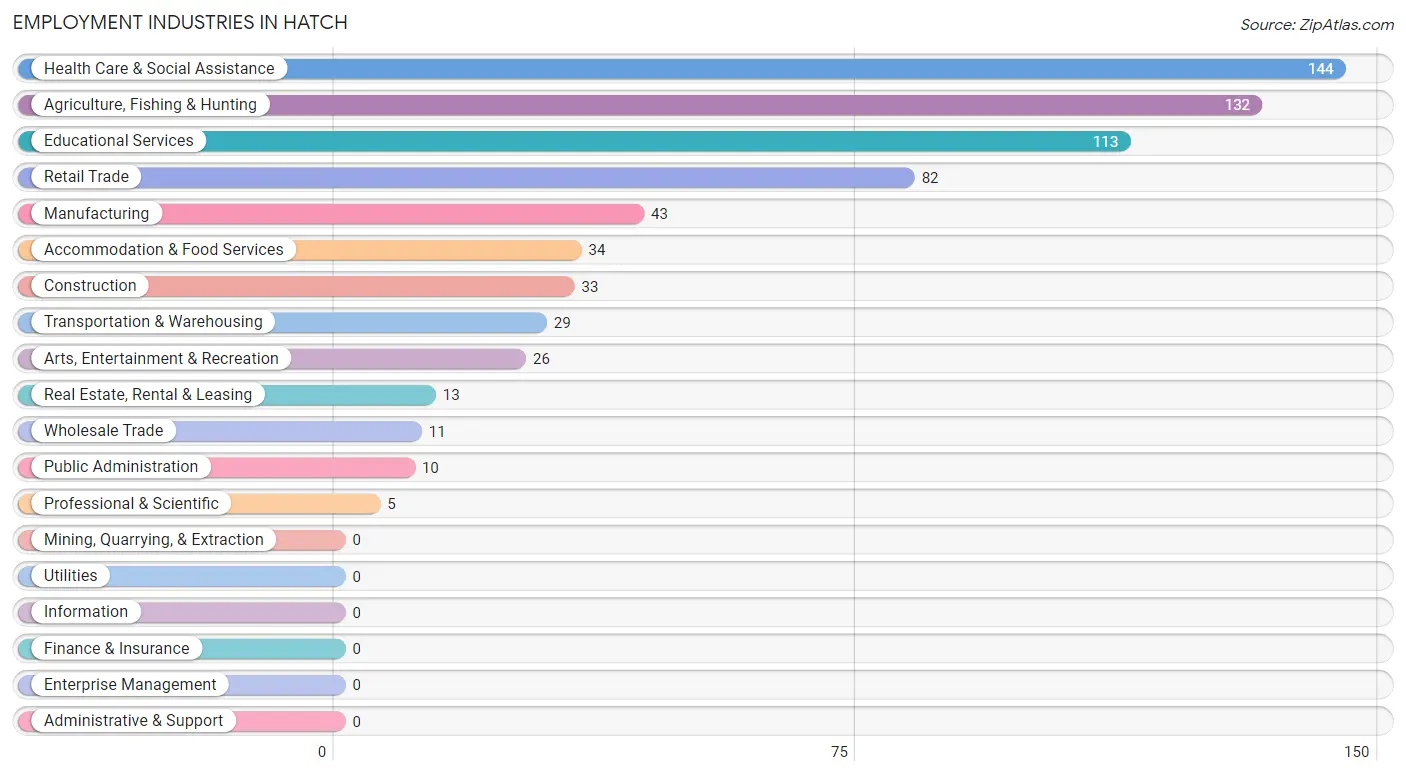
Employment Industries in Hatch
The major employment industries in Hatch include Health Care & Social Assistance (144 | 21.3%), Agriculture, Fishing & Hunting (132 | 19.6%), Educational Services (113 | 16.7%), Retail Trade (82 | 12.1%), and Manufacturing (43 | 6.4%).
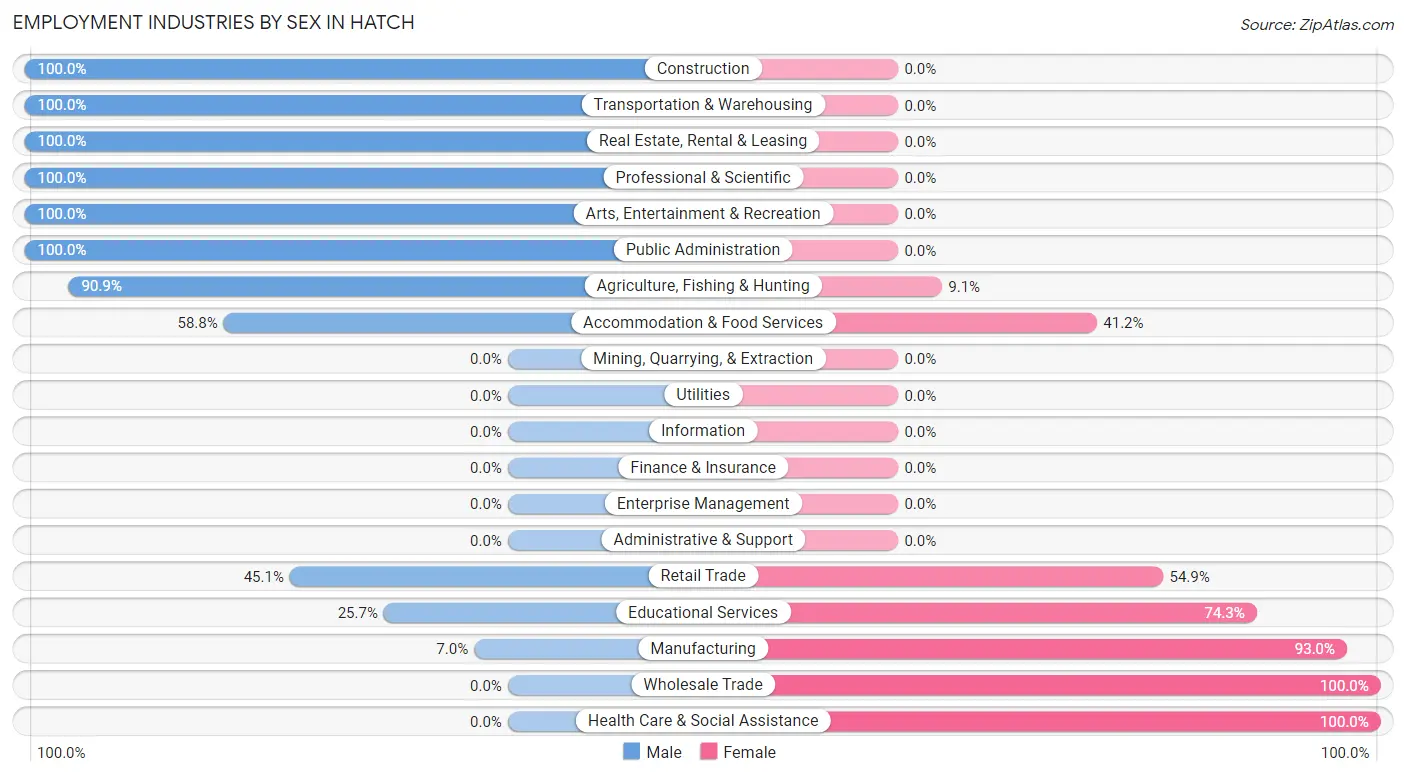
Employment Industries by Sex in Hatch
The Hatch industries that see more men than women are Construction (100.0%), Transportation & Warehousing (100.0%), and Real Estate, Rental & Leasing (100.0%), whereas the industries that tend to have a higher number of women are Wholesale Trade (100.0%), Health Care & Social Assistance (100.0%), and Manufacturing (93.0%).
| Industry | Male | Female |
| Agriculture, Fishing & Hunting | 120 (90.9%) | 12 (9.1%) |
| Mining, Quarrying, & Extraction | 0 (0.0%) | 0 (0.0%) |
| Construction | 33 (100.0%) | 0 (0.0%) |
| Manufacturing | 3 (7.0%) | 40 (93.0%) |
| Wholesale Trade | 0 (0.0%) | 11 (100.0%) |
| Retail Trade | 37 (45.1%) | 45 (54.9%) |
| Transportation & Warehousing | 29 (100.0%) | 0 (0.0%) |
| Utilities | 0 (0.0%) | 0 (0.0%) |
| Information | 0 (0.0%) | 0 (0.0%) |
| Finance & Insurance | 0 (0.0%) | 0 (0.0%) |
| Real Estate, Rental & Leasing | 13 (100.0%) | 0 (0.0%) |
| Professional & Scientific | 5 (100.0%) | 0 (0.0%) |
| Enterprise Management | 0 (0.0%) | 0 (0.0%) |
| Administrative & Support | 0 (0.0%) | 0 (0.0%) |
| Educational Services | 29 (25.7%) | 84 (74.3%) |
| Health Care & Social Assistance | 0 (0.0%) | 144 (100.0%) |
| Arts, Entertainment & Recreation | 26 (100.0%) | 0 (0.0%) |
| Accommodation & Food Services | 20 (58.8%) | 14 (41.2%) |
| Public Administration | 10 (100.0%) | 0 (0.0%) |
| Total | 325 (48.1%) | 350 (51.8%) |
Education in Hatch
School Enrollment in Hatch
The most common levels of schooling among the 596 students in Hatch are high school (174 | 29.2%), elementary school (153 | 25.7%), and middle school (121 | 20.3%).
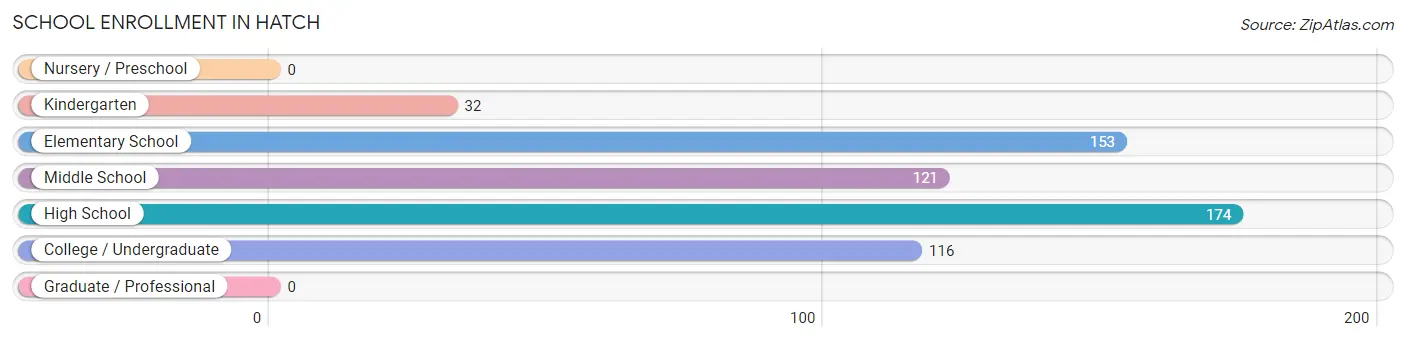
| School Level | # Students | % Students |
| Nursery / Preschool | 0 | 0.0% |
| Kindergarten | 32 | 5.4% |
| Elementary School | 153 | 25.7% |
| Middle School | 121 | 20.3% |
| High School | 174 | 29.2% |
| College / Undergraduate | 116 | 19.5% |
| Graduate / Professional | 0 | 0.0% |
| Total | 596 | 100.0% |
School Enrollment by Age by Funding Source in Hatch
Out of a total of 596 students who are enrolled in schools in Hatch, 76 (12.8%) attend a private institution, while the remaining 520 (87.2%) are enrolled in public schools. The age group of 25 to 34 year olds has the highest likelihood of being enrolled in private schools, with 12 (100.0% in the age bracket) enrolled. Conversely, the age group of 10 to 14 year olds has the lowest likelihood of being enrolled in a private school, with 135 (100.0% in the age bracket) attending a public institution.
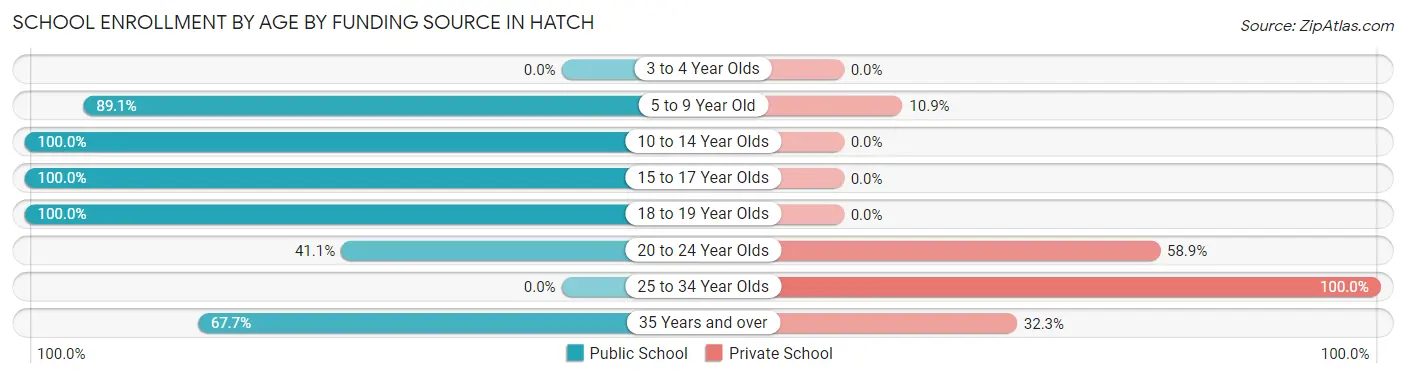
| Age Bracket | Public School | Private School |
| 3 to 4 Year Olds | 0 (0.0%) | 0 (0.0%) |
| 5 to 9 Year Old | 171 (89.1%) | 21 (10.9%) |
| 10 to 14 Year Olds | 135 (100.0%) | 0 (0.0%) |
| 15 to 17 Year Olds | 128 (100.0%) | 0 (0.0%) |
| 18 to 19 Year Olds | 42 (100.0%) | 0 (0.0%) |
| 20 to 24 Year Olds | 23 (41.1%) | 33 (58.9%) |
| 25 to 34 Year Olds | 0 (0.0%) | 12 (100.0%) |
| 35 Years and over | 21 (67.7%) | 10 (32.3%) |
| Total | 520 (87.2%) | 76 (12.8%) |
Educational Attainment by Field of Study in Hatch
Education (50 | 33.1%), arts & humanities (34 | 22.5%), engineering (20 | 13.3%), bio, nature & agricultural (16 | 10.6%), and visual & performing arts (11 | 7.3%) are the most common fields of study among 151 individuals in Hatch who have obtained a bachelor's degree or higher.
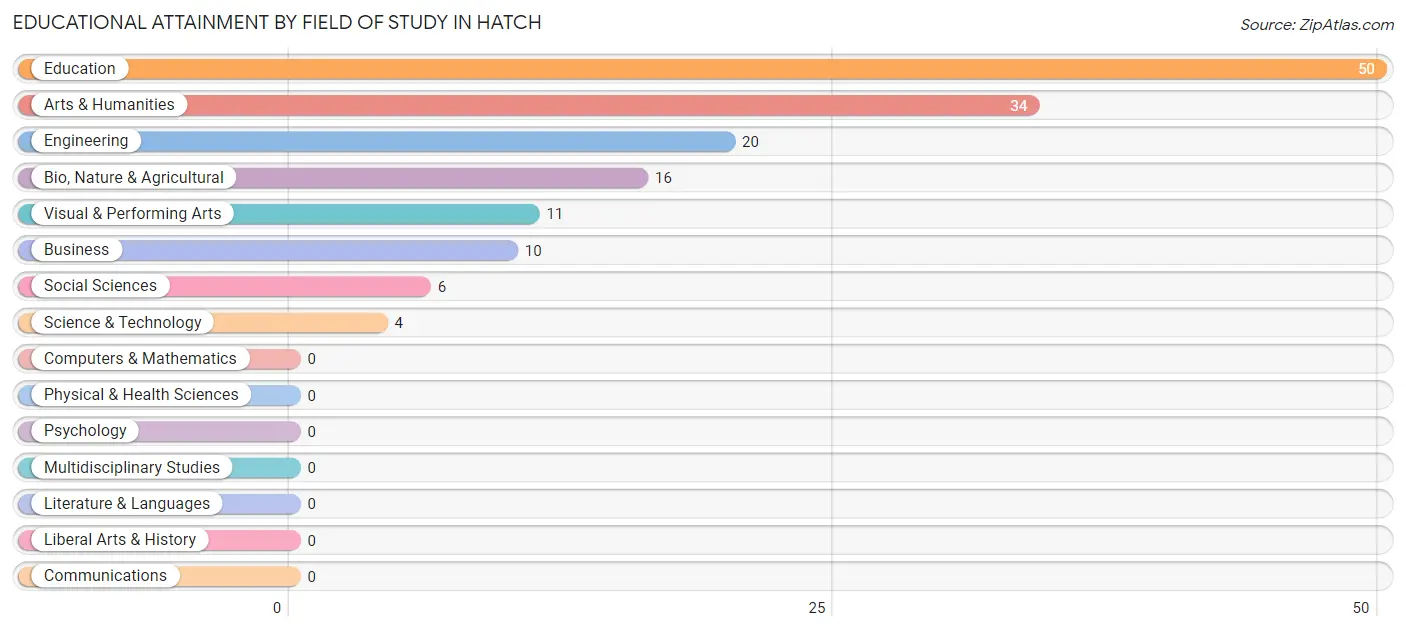
| Field of Study | # Graduates | % Graduates |
| Computers & Mathematics | 0 | 0.0% |
| Bio, Nature & Agricultural | 16 | 10.6% |
| Physical & Health Sciences | 0 | 0.0% |
| Psychology | 0 | 0.0% |
| Social Sciences | 6 | 4.0% |
| Engineering | 20 | 13.3% |
| Multidisciplinary Studies | 0 | 0.0% |
| Science & Technology | 4 | 2.6% |
| Business | 10 | 6.6% |
| Education | 50 | 33.1% |
| Literature & Languages | 0 | 0.0% |
| Liberal Arts & History | 0 | 0.0% |
| Visual & Performing Arts | 11 | 7.3% |
| Communications | 0 | 0.0% |
| Arts & Humanities | 34 | 22.5% |
| Total | 151 | 100.0% |
Transportation & Commute in Hatch
Vehicle Availability by Sex in Hatch
The most prevalent vehicle ownership categories in Hatch are males with 3 vehicles (122, accounting for 38.6%) and females with 3 vehicles (83, making up 39.0%).
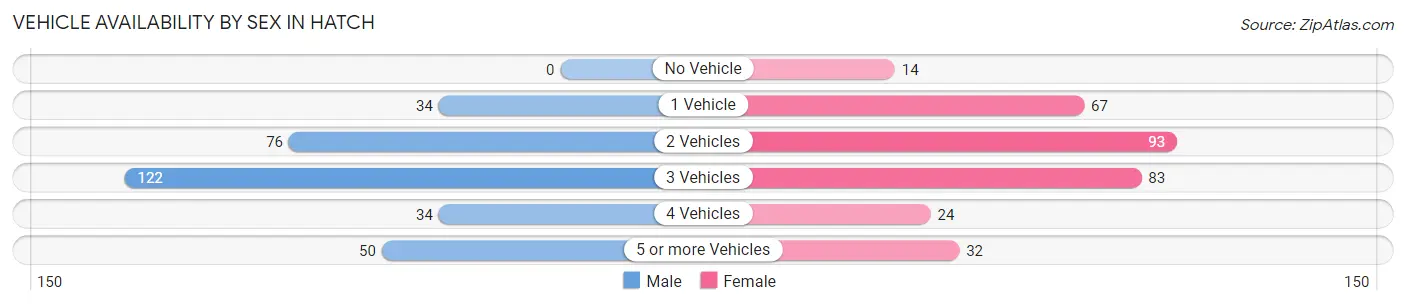
| Vehicles Available | Male | Female |
| No Vehicle | 0 (0.0%) | 14 (4.5%) |
| 1 Vehicle | 34 (10.8%) | 67 (21.4%) |
| 2 Vehicles | 76 (24.0%) | 93 (29.7%) |
| 3 Vehicles | 122 (38.6%) | 83 (26.5%) |
| 4 Vehicles | 34 (10.8%) | 24 (7.7%) |
| 5 or more Vehicles | 50 (15.8%) | 32 (10.2%) |
| Total | 316 (100.0%) | 313 (100.0%) |
Commute Time in Hatch
The most frequently occuring commute durations in Hatch are 5 to 9 minutes (149 commuters, 22.6%), less than 5 minutes (133 commuters, 20.2%), and 30 to 34 minutes (108 commuters, 16.4%).
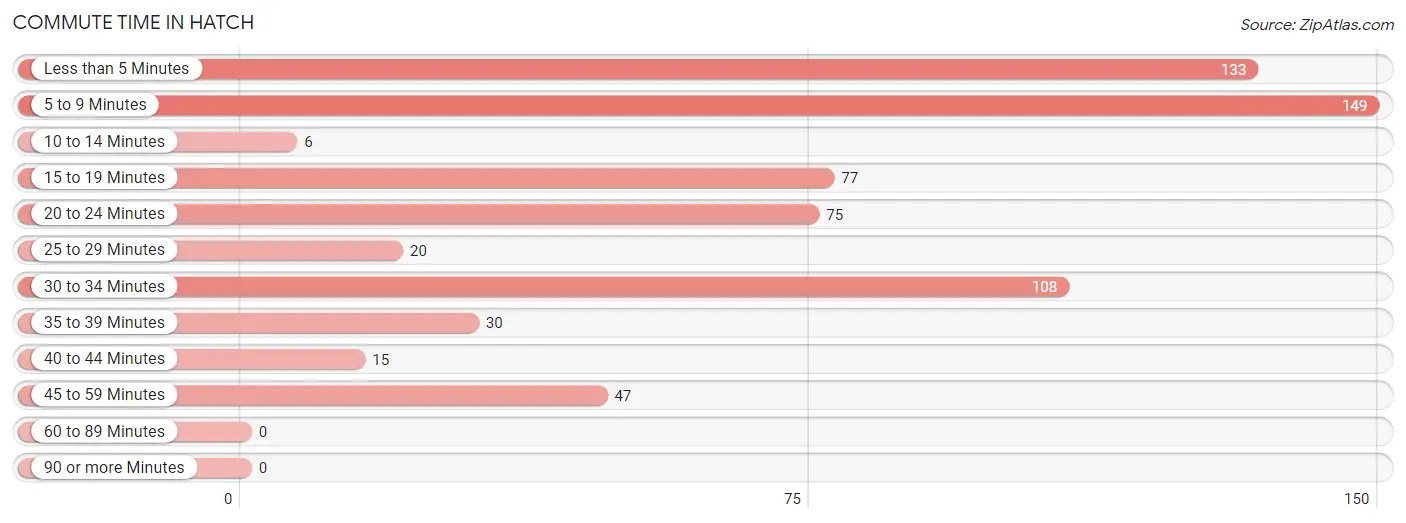
| Commute Time | # Commuters | % Commuters |
| Less than 5 Minutes | 133 | 20.2% |
| 5 to 9 Minutes | 149 | 22.6% |
| 10 to 14 Minutes | 6 | 0.9% |
| 15 to 19 Minutes | 77 | 11.7% |
| 20 to 24 Minutes | 75 | 11.4% |
| 25 to 29 Minutes | 20 | 3.0% |
| 30 to 34 Minutes | 108 | 16.4% |
| 35 to 39 Minutes | 30 | 4.5% |
| 40 to 44 Minutes | 15 | 2.3% |
| 45 to 59 Minutes | 47 | 7.1% |
| 60 to 89 Minutes | 0 | 0.0% |
| 90 or more Minutes | 0 | 0.0% |
Commute Time by Sex in Hatch
The most common commute times in Hatch are less than 5 minutes (70 commuters, 21.7%) for males and 5 to 9 minutes (87 commuters, 25.7%) for females.
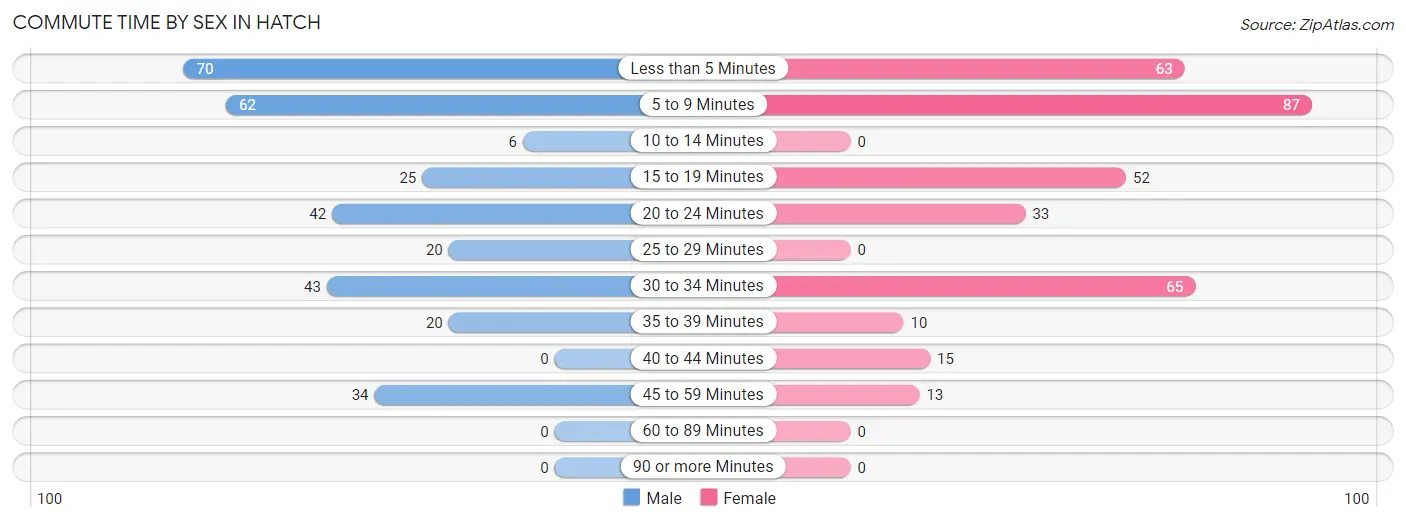
| Commute Time | Male | Female |
| Less than 5 Minutes | 70 (21.7%) | 63 (18.6%) |
| 5 to 9 Minutes | 62 (19.3%) | 87 (25.7%) |
| 10 to 14 Minutes | 6 (1.9%) | 0 (0.0%) |
| 15 to 19 Minutes | 25 (7.8%) | 52 (15.4%) |
| 20 to 24 Minutes | 42 (13.0%) | 33 (9.8%) |
| 25 to 29 Minutes | 20 (6.2%) | 0 (0.0%) |
| 30 to 34 Minutes | 43 (13.4%) | 65 (19.2%) |
| 35 to 39 Minutes | 20 (6.2%) | 10 (3.0%) |
| 40 to 44 Minutes | 0 (0.0%) | 15 (4.4%) |
| 45 to 59 Minutes | 34 (10.6%) | 13 (3.8%) |
| 60 to 89 Minutes | 0 (0.0%) | 0 (0.0%) |
| 90 or more Minutes | 0 (0.0%) | 0 (0.0%) |
Time of Departure to Work by Sex in Hatch
The most frequent times of departure to work in Hatch are 7:00 AM to 7:29 AM (75, 23.3%) for males and 7:00 AM to 7:29 AM (92, 27.2%) for females.
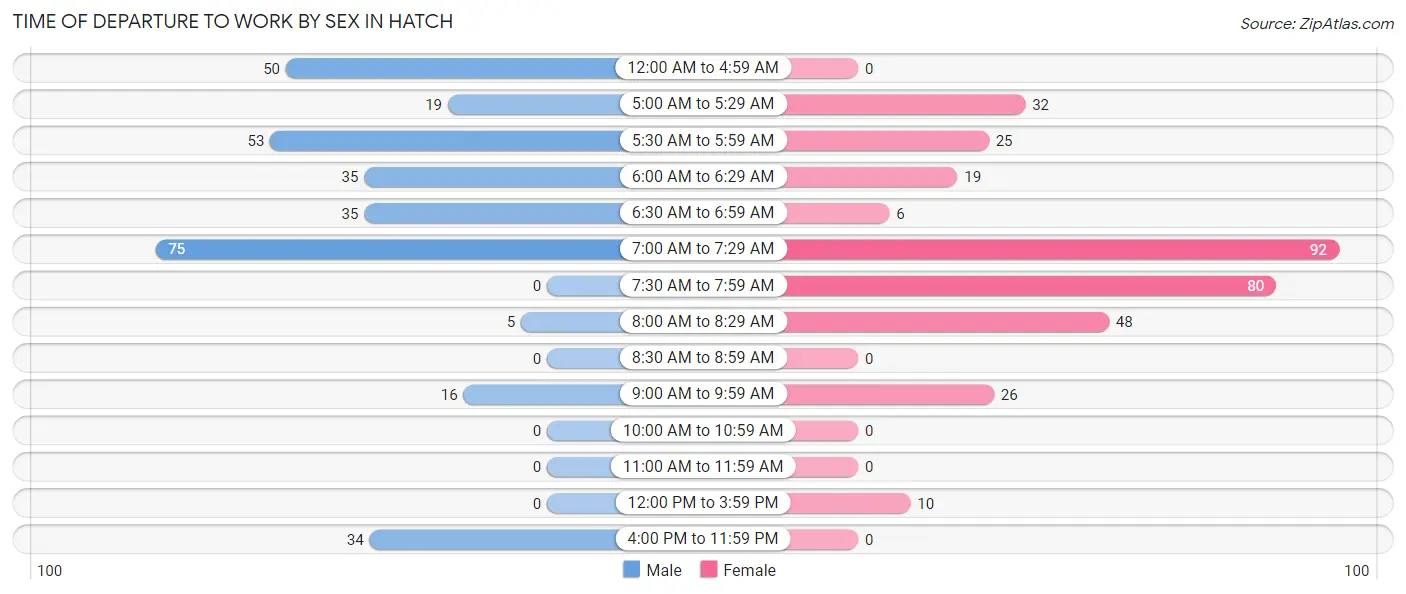
| Time of Departure | Male | Female |
| 12:00 AM to 4:59 AM | 50 (15.5%) | 0 (0.0%) |
| 5:00 AM to 5:29 AM | 19 (5.9%) | 32 (9.5%) |
| 5:30 AM to 5:59 AM | 53 (16.5%) | 25 (7.4%) |
| 6:00 AM to 6:29 AM | 35 (10.9%) | 19 (5.6%) |
| 6:30 AM to 6:59 AM | 35 (10.9%) | 6 (1.8%) |
| 7:00 AM to 7:29 AM | 75 (23.3%) | 92 (27.2%) |
| 7:30 AM to 7:59 AM | 0 (0.0%) | 80 (23.7%) |
| 8:00 AM to 8:29 AM | 5 (1.5%) | 48 (14.2%) |
| 8:30 AM to 8:59 AM | 0 (0.0%) | 0 (0.0%) |
| 9:00 AM to 9:59 AM | 16 (5.0%) | 26 (7.7%) |
| 10:00 AM to 10:59 AM | 0 (0.0%) | 0 (0.0%) |
| 11:00 AM to 11:59 AM | 0 (0.0%) | 0 (0.0%) |
| 12:00 PM to 3:59 PM | 0 (0.0%) | 10 (3.0%) |
| 4:00 PM to 11:59 PM | 34 (10.6%) | 0 (0.0%) |
| Total | 322 (100.0%) | 338 (100.0%) |
Housing Occupancy in Hatch
Occupancy by Ownership in Hatch
Of the total 447 dwellings in Hatch, owner-occupied units account for 392 (87.7%), while renter-occupied units make up 55 (12.3%).
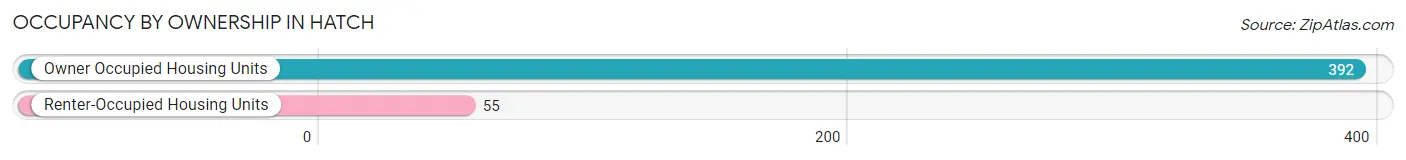
| Occupancy | # Housing Units | % Housing Units |
| Owner Occupied Housing Units | 392 | 87.7% |
| Renter-Occupied Housing Units | 55 | 12.3% |
| Total Occupied Housing Units | 447 | 100.0% |
Occupancy by Household Size in Hatch
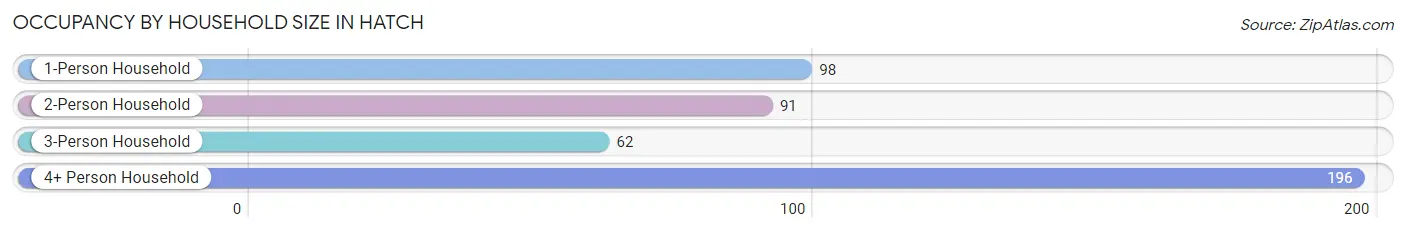
| Household Size | # Housing Units | % Housing Units |
| 1-Person Household | 98 | 21.9% |
| 2-Person Household | 91 | 20.4% |
| 3-Person Household | 62 | 13.9% |
| 4+ Person Household | 196 | 43.9% |
| Total Housing Units | 447 | 100.0% |
Occupancy by Ownership by Household Size in Hatch
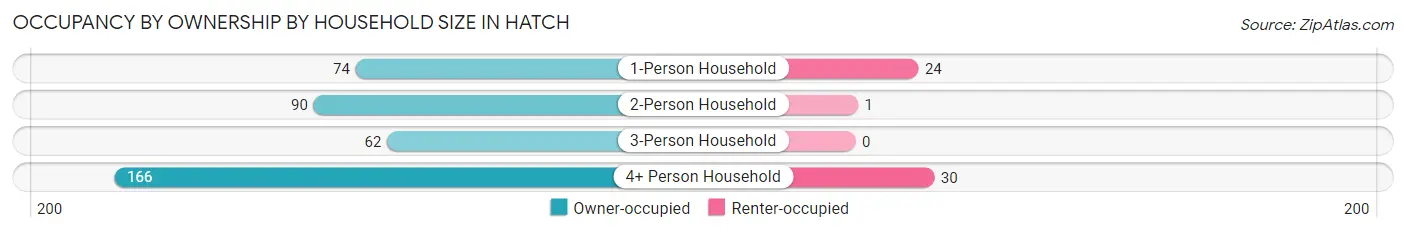
| Household Size | Owner-occupied | Renter-occupied |
| 1-Person Household | 74 (75.5%) | 24 (24.5%) |
| 2-Person Household | 90 (98.9%) | 1 (1.1%) |
| 3-Person Household | 62 (100.0%) | 0 (0.0%) |
| 4+ Person Household | 166 (84.7%) | 30 (15.3%) |
| Total Housing Units | 392 (87.7%) | 55 (12.3%) |
Occupancy by Educational Attainment in Hatch
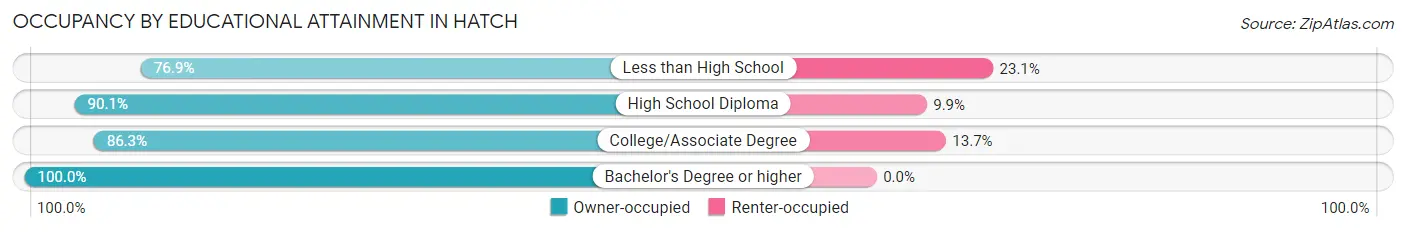
| Household Size | Owner-occupied | Renter-occupied |
| Less than High School | 90 (76.9%) | 27 (23.1%) |
| High School Diploma | 127 (90.1%) | 14 (9.9%) |
| College/Associate Degree | 88 (86.3%) | 14 (13.7%) |
| Bachelor's Degree or higher | 87 (100.0%) | 0 (0.0%) |
Occupancy by Age of Householder in Hatch
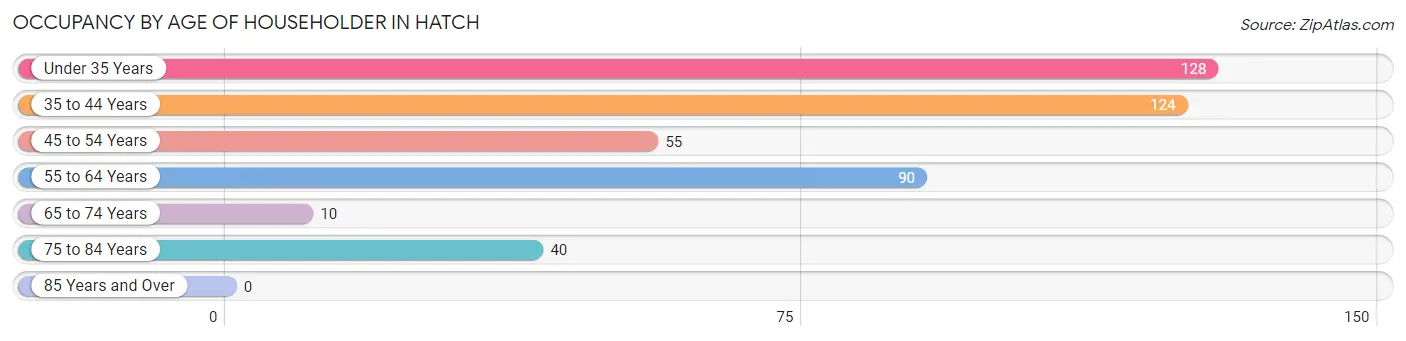
| Age Bracket | # Households | % Households |
| Under 35 Years | 128 | 28.6% |
| 35 to 44 Years | 124 | 27.7% |
| 45 to 54 Years | 55 | 12.3% |
| 55 to 64 Years | 90 | 20.1% |
| 65 to 74 Years | 10 | 2.2% |
| 75 to 84 Years | 40 | 8.9% |
| 85 Years and Over | 0 | 0.0% |
| Total | 447 | 100.0% |
Housing Finances in Hatch
Median Income by Occupancy in Hatch
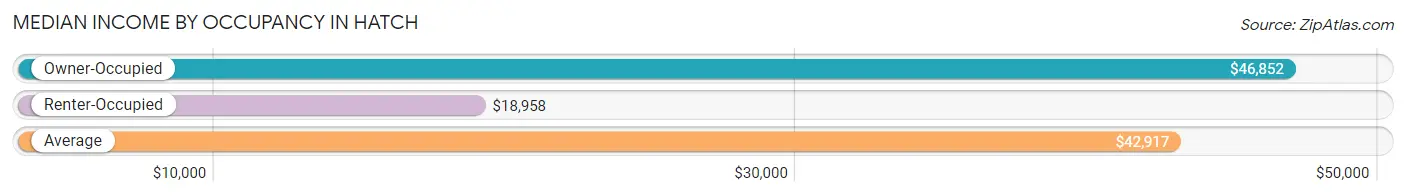
| Occupancy Type | # Households | Median Income |
| Owner-Occupied | 392 (87.7%) | $46,852 |
| Renter-Occupied | 55 (12.3%) | $18,958 |
| Average | 447 (100.0%) | $42,917 |
Occupancy by Householder Income Bracket in Hatch
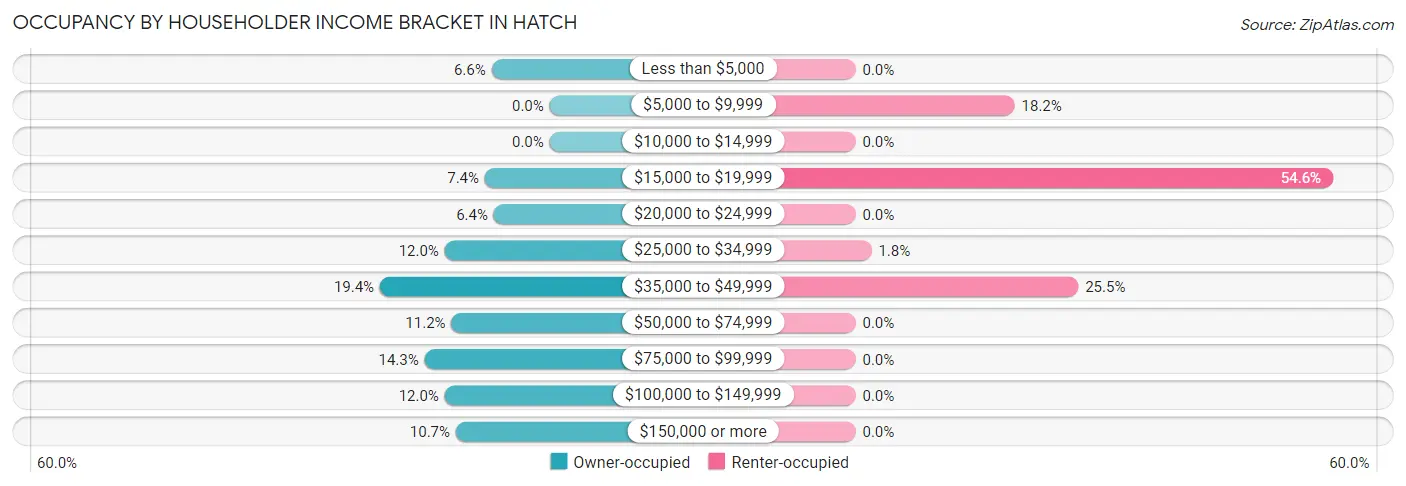
| Income Bracket | Owner-occupied | Renter-occupied |
| Less than $5,000 | 26 (6.6%) | 0 (0.0%) |
| $5,000 to $9,999 | 0 (0.0%) | 10 (18.2%) |
| $10,000 to $14,999 | 0 (0.0%) | 0 (0.0%) |
| $15,000 to $19,999 | 29 (7.4%) | 30 (54.5%) |
| $20,000 to $24,999 | 25 (6.4%) | 0 (0.0%) |
| $25,000 to $34,999 | 47 (12.0%) | 1 (1.8%) |
| $35,000 to $49,999 | 76 (19.4%) | 14 (25.5%) |
| $50,000 to $74,999 | 44 (11.2%) | 0 (0.0%) |
| $75,000 to $99,999 | 56 (14.3%) | 0 (0.0%) |
| $100,000 to $149,999 | 47 (12.0%) | 0 (0.0%) |
| $150,000 or more | 42 (10.7%) | 0 (0.0%) |
| Total | 392 (100.0%) | 55 (100.0%) |
Monthly Housing Cost Tiers in Hatch
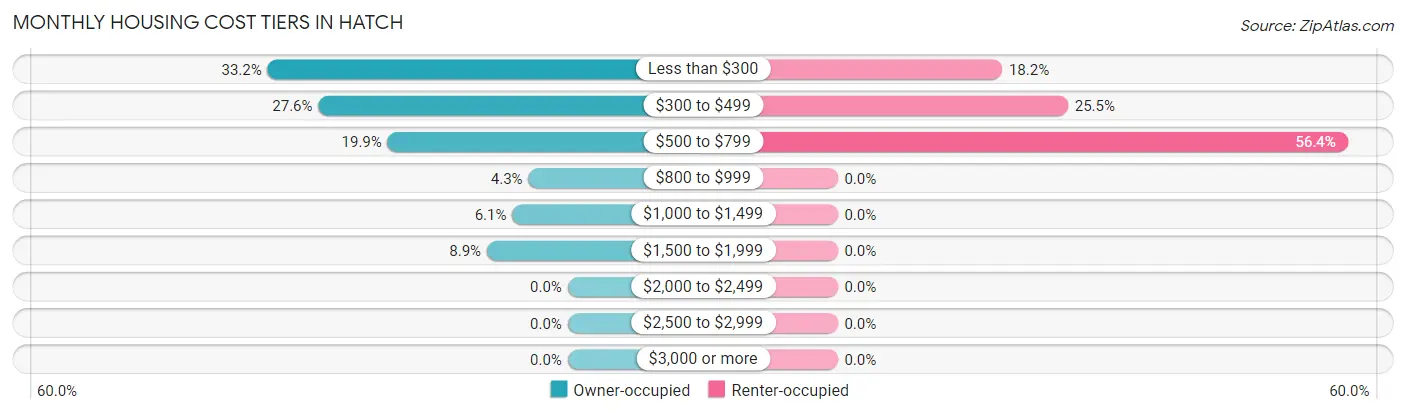
| Monthly Cost | Owner-occupied | Renter-occupied |
| Less than $300 | 130 (33.2%) | 10 (18.2%) |
| $300 to $499 | 108 (27.6%) | 14 (25.5%) |
| $500 to $799 | 78 (19.9%) | 31 (56.4%) |
| $800 to $999 | 17 (4.3%) | 0 (0.0%) |
| $1,000 to $1,499 | 24 (6.1%) | 0 (0.0%) |
| $1,500 to $1,999 | 35 (8.9%) | 0 (0.0%) |
| $2,000 to $2,499 | 0 (0.0%) | 0 (0.0%) |
| $2,500 to $2,999 | 0 (0.0%) | 0 (0.0%) |
| $3,000 or more | 0 (0.0%) | 0 (0.0%) |
| Total | 392 (100.0%) | 55 (100.0%) |
Physical Housing Characteristics in Hatch
Housing Structures in Hatch
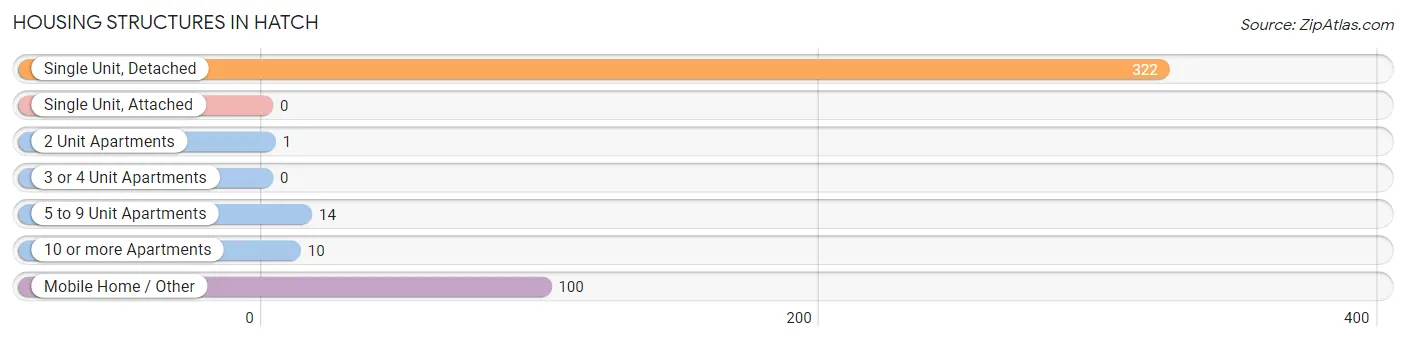
| Structure Type | # Housing Units | % Housing Units |
| Single Unit, Detached | 322 | 72.0% |
| Single Unit, Attached | 0 | 0.0% |
| 2 Unit Apartments | 1 | 0.2% |
| 3 or 4 Unit Apartments | 0 | 0.0% |
| 5 to 9 Unit Apartments | 14 | 3.1% |
| 10 or more Apartments | 10 | 2.2% |
| Mobile Home / Other | 100 | 22.4% |
| Total | 447 | 100.0% |
Housing Structures by Occupancy in Hatch
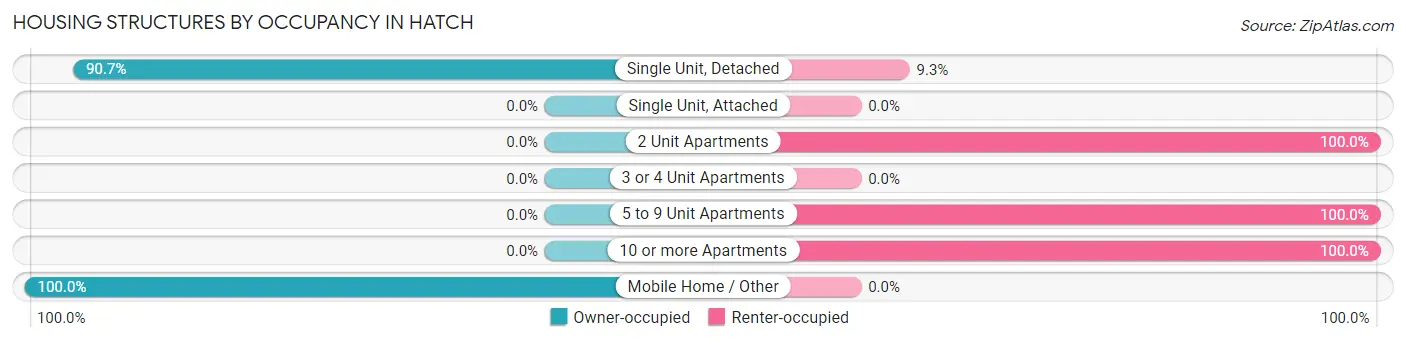
| Structure Type | Owner-occupied | Renter-occupied |
| Single Unit, Detached | 292 (90.7%) | 30 (9.3%) |
| Single Unit, Attached | 0 (0.0%) | 0 (0.0%) |
| 2 Unit Apartments | 0 (0.0%) | 1 (100.0%) |
| 3 or 4 Unit Apartments | 0 (0.0%) | 0 (0.0%) |
| 5 to 9 Unit Apartments | 0 (0.0%) | 14 (100.0%) |
| 10 or more Apartments | 0 (0.0%) | 10 (100.0%) |
| Mobile Home / Other | 100 (100.0%) | 0 (0.0%) |
| Total | 392 (87.7%) | 55 (12.3%) |
Housing Structures by Number of Rooms in Hatch
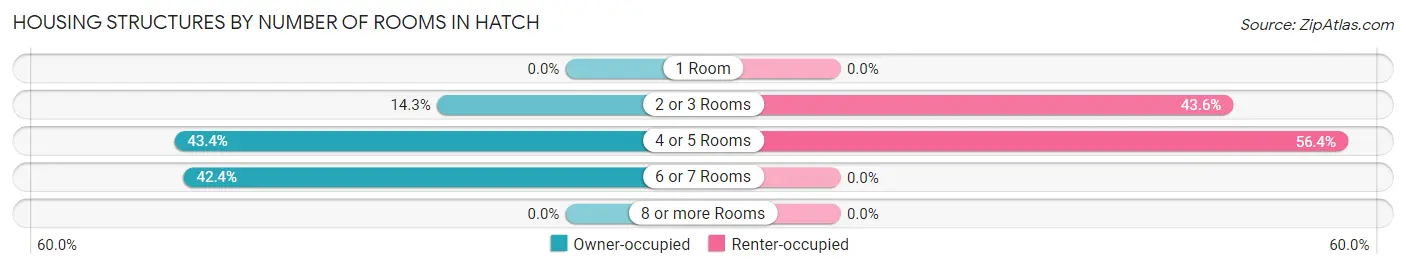
| Number of Rooms | Owner-occupied | Renter-occupied |
| 1 Room | 0 (0.0%) | 0 (0.0%) |
| 2 or 3 Rooms | 56 (14.3%) | 24 (43.6%) |
| 4 or 5 Rooms | 170 (43.4%) | 31 (56.4%) |
| 6 or 7 Rooms | 166 (42.3%) | 0 (0.0%) |
| 8 or more Rooms | 0 (0.0%) | 0 (0.0%) |
| Total | 392 (100.0%) | 55 (100.0%) |
Housing Structure by Heating Type in Hatch
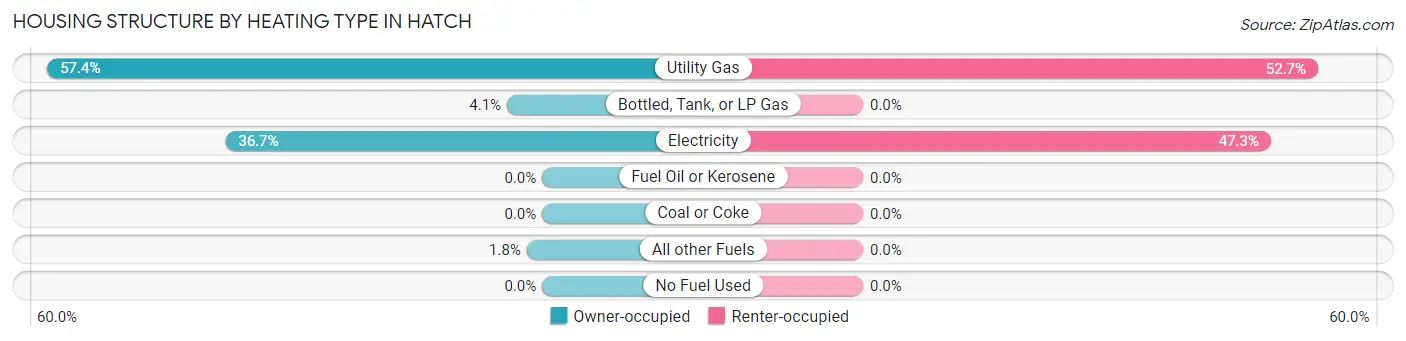
| Heating Type | Owner-occupied | Renter-occupied |
| Utility Gas | 225 (57.4%) | 29 (52.7%) |
| Bottled, Tank, or LP Gas | 16 (4.1%) | 0 (0.0%) |
| Electricity | 144 (36.7%) | 26 (47.3%) |
| Fuel Oil or Kerosene | 0 (0.0%) | 0 (0.0%) |
| Coal or Coke | 0 (0.0%) | 0 (0.0%) |
| All other Fuels | 7 (1.8%) | 0 (0.0%) |
| No Fuel Used | 0 (0.0%) | 0 (0.0%) |
| Total | 392 (100.0%) | 55 (100.0%) |
Household Vehicle Usage in Hatch
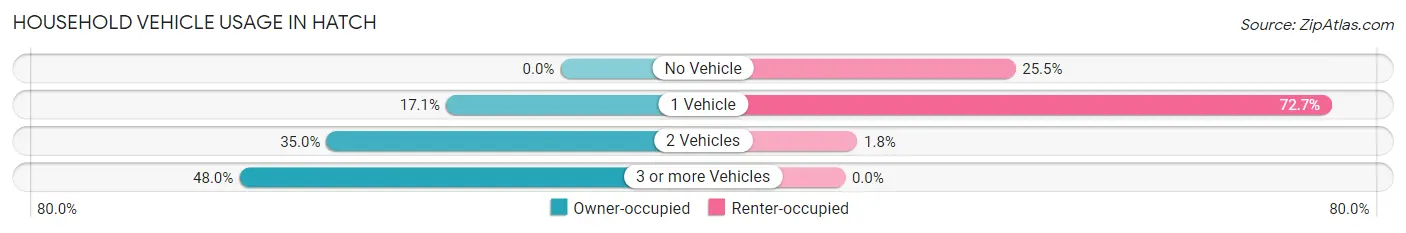
| Vehicles per Household | Owner-occupied | Renter-occupied |
| No Vehicle | 0 (0.0%) | 14 (25.5%) |
| 1 Vehicle | 67 (17.1%) | 40 (72.7%) |
| 2 Vehicles | 137 (34.9%) | 1 (1.8%) |
| 3 or more Vehicles | 188 (48.0%) | 0 (0.0%) |
| Total | 392 (100.0%) | 55 (100.0%) |
Real Estate & Mortgages in Hatch
Real Estate and Mortgage Overview in Hatch
| Characteristic | Without Mortgage | With Mortgage |
| Housing Units | 293 | 99 |
| Median Property Value | $108,600 | $115,100 |
| Median Household Income | $45,417 | $0 |
| Monthly Housing Costs | $318 | $0 |
| Real Estate Taxes | $479 | $7 |
Property Value by Mortgage Status in Hatch
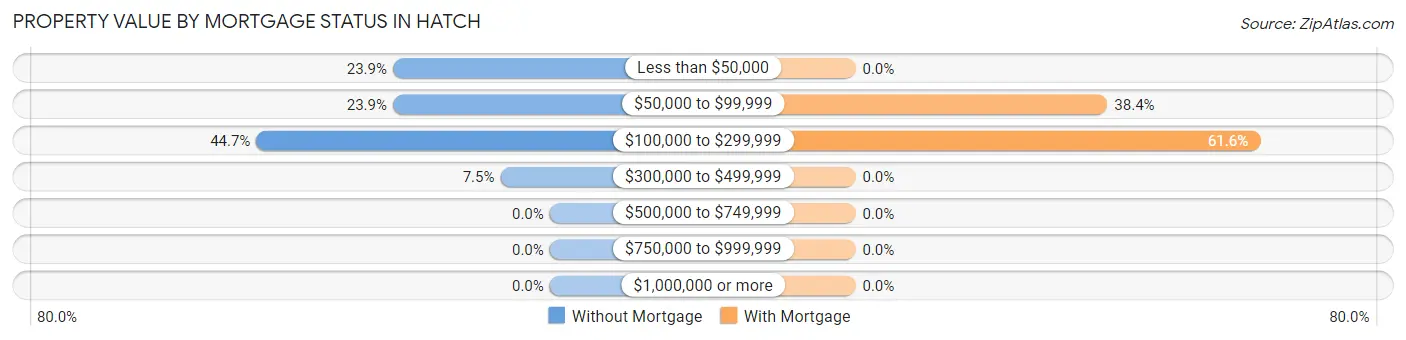
| Property Value | Without Mortgage | With Mortgage |
| Less than $50,000 | 70 (23.9%) | 0 (0.0%) |
| $50,000 to $99,999 | 70 (23.9%) | 38 (38.4%) |
| $100,000 to $299,999 | 131 (44.7%) | 61 (61.6%) |
| $300,000 to $499,999 | 22 (7.5%) | 0 (0.0%) |
| $500,000 to $749,999 | 0 (0.0%) | 0 (0.0%) |
| $750,000 to $999,999 | 0 (0.0%) | 0 (0.0%) |
| $1,000,000 or more | 0 (0.0%) | 0 (0.0%) |
| Total | 293 (100.0%) | 99 (100.0%) |
Household Income by Mortgage Status in Hatch
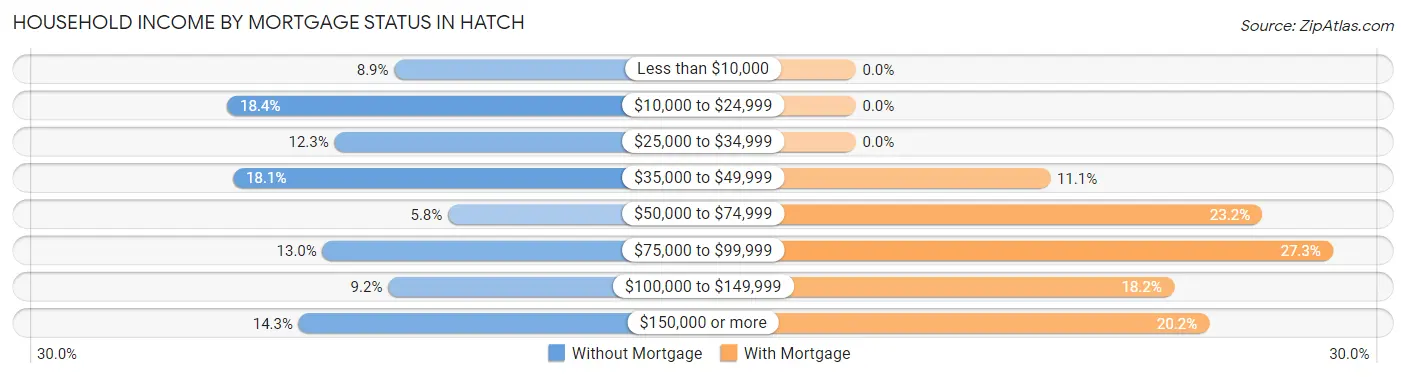
| Household Income | Without Mortgage | With Mortgage |
| Less than $10,000 | 26 (8.9%) | 0 (0.0%) |
| $10,000 to $24,999 | 54 (18.4%) | 0 (0.0%) |
| $25,000 to $34,999 | 36 (12.3%) | 0 (0.0%) |
| $35,000 to $49,999 | 53 (18.1%) | 11 (11.1%) |
| $50,000 to $74,999 | 17 (5.8%) | 23 (23.2%) |
| $75,000 to $99,999 | 38 (13.0%) | 27 (27.3%) |
| $100,000 to $149,999 | 27 (9.2%) | 18 (18.2%) |
| $150,000 or more | 42 (14.3%) | 20 (20.2%) |
| Total | 293 (100.0%) | 99 (100.0%) |
Property Value to Household Income Ratio in Hatch
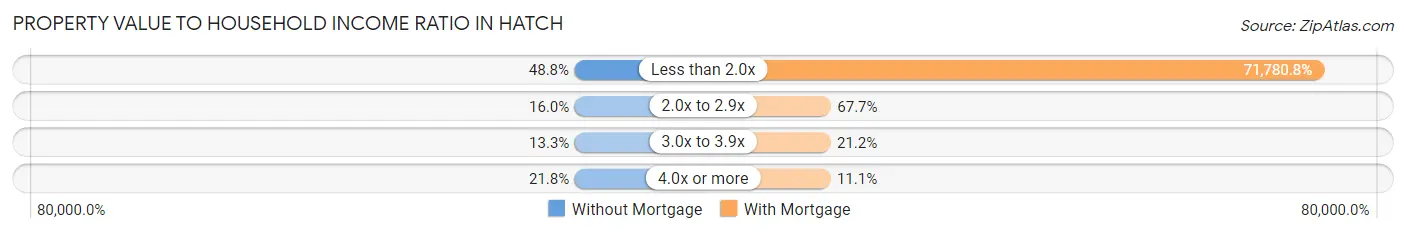
| Value-to-Income Ratio | Without Mortgage | With Mortgage |
| Less than 2.0x | 143 (48.8%) | 71,063 (71,780.8%) |
| 2.0x to 2.9x | 47 (16.0%) | 67 (67.7%) |
| 3.0x to 3.9x | 39 (13.3%) | 21 (21.2%) |
| 4.0x or more | 64 (21.8%) | 11 (11.1%) |
| Total | 293 (100.0%) | 99 (100.0%) |
Real Estate Taxes by Mortgage Status in Hatch
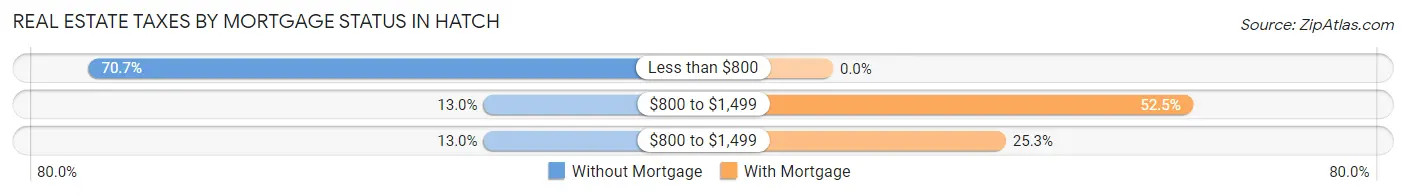
| Property Taxes | Without Mortgage | With Mortgage |
| Less than $800 | 207 (70.7%) | 0 (0.0%) |
| $800 to $1,499 | 38 (13.0%) | 52 (52.5%) |
| $800 to $1,499 | 38 (13.0%) | 25 (25.3%) |
| Total | 293 (100.0%) | 99 (100.0%) |
Health & Disability in Hatch
Health Insurance Coverage by Age in Hatch
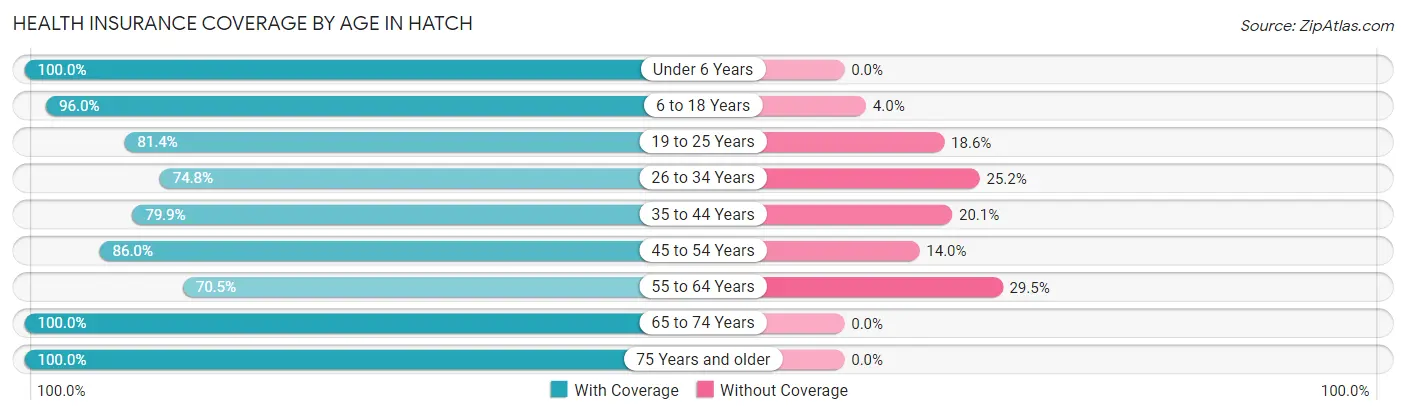
| Age Bracket | With Coverage | Without Coverage |
| Under 6 Years | 131 (100.0%) | 0 (0.0%) |
| 6 to 18 Years | 452 (96.0%) | 19 (4.0%) |
| 19 to 25 Years | 153 (81.4%) | 35 (18.6%) |
| 26 to 34 Years | 169 (74.8%) | 57 (25.2%) |
| 35 to 44 Years | 187 (79.9%) | 47 (20.1%) |
| 45 to 54 Years | 86 (86.0%) | 14 (14.0%) |
| 55 to 64 Years | 98 (70.5%) | 41 (29.5%) |
| 65 to 74 Years | 115 (100.0%) | 0 (0.0%) |
| 75 Years and older | 69 (100.0%) | 0 (0.0%) |
| Total | 1,460 (87.3%) | 213 (12.7%) |
Health Insurance Coverage by Citizenship Status in Hatch
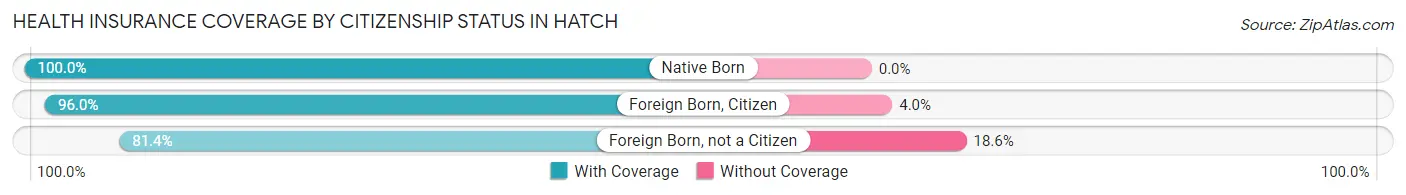
| Citizenship Status | With Coverage | Without Coverage |
| Native Born | 131 (100.0%) | 0 (0.0%) |
| Foreign Born, Citizen | 452 (96.0%) | 19 (4.0%) |
| Foreign Born, not a Citizen | 153 (81.4%) | 35 (18.6%) |
Health Insurance Coverage by Household Income in Hatch
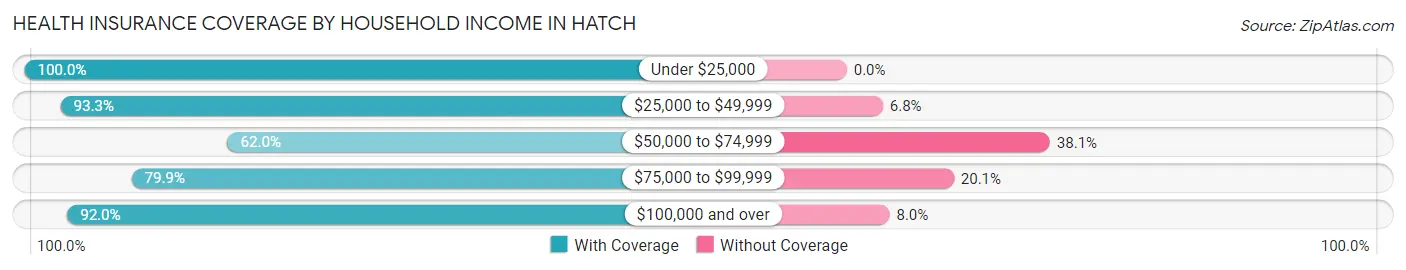
| Household Income | With Coverage | Without Coverage |
| Under $25,000 | 253 (100.0%) | 0 (0.0%) |
| $25,000 to $49,999 | 497 (93.2%) | 36 (6.8%) |
| $50,000 to $74,999 | 127 (62.0%) | 78 (38.1%) |
| $75,000 to $99,999 | 271 (79.9%) | 68 (20.1%) |
| $100,000 and over | 287 (92.0%) | 25 (8.0%) |
Public vs Private Health Insurance Coverage by Age in Hatch
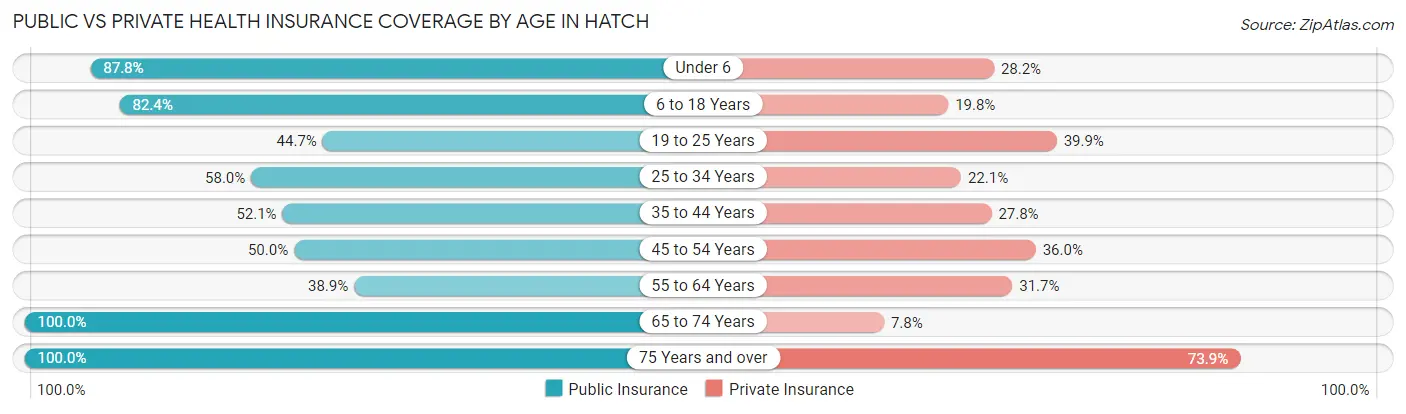
| Age Bracket | Public Insurance | Private Insurance |
| Under 6 | 115 (87.8%) | 37 (28.2%) |
| 6 to 18 Years | 388 (82.4%) | 93 (19.8%) |
| 19 to 25 Years | 84 (44.7%) | 75 (39.9%) |
| 25 to 34 Years | 131 (58.0%) | 50 (22.1%) |
| 35 to 44 Years | 122 (52.1%) | 65 (27.8%) |
| 45 to 54 Years | 50 (50.0%) | 36 (36.0%) |
| 55 to 64 Years | 54 (38.9%) | 44 (31.7%) |
| 65 to 74 Years | 115 (100.0%) | 9 (7.8%) |
| 75 Years and over | 69 (100.0%) | 51 (73.9%) |
| Total | 1,128 (67.4%) | 460 (27.5%) |
Disability Status by Sex by Age in Hatch
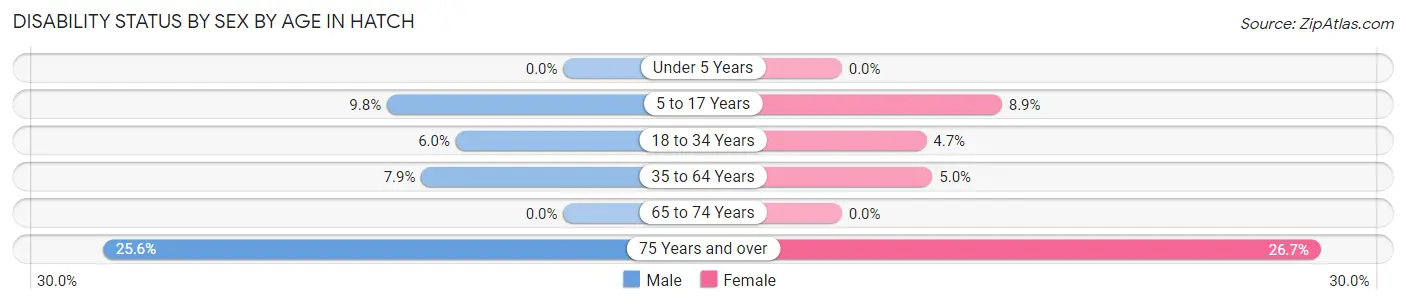
| Age Bracket | Male | Female |
| Under 5 Years | 0 (0.0%) | 0 (0.0%) |
| 5 to 17 Years | 28 (9.8%) | 18 (8.9%) |
| 18 to 34 Years | 10 (6.0%) | 13 (4.7%) |
| 35 to 64 Years | 17 (7.9%) | 13 (5.0%) |
| 65 to 74 Years | 0 (0.0%) | 0 (0.0%) |
| 75 Years and over | 10 (25.6%) | 8 (26.7%) |
Disability Class by Sex by Age in Hatch
Disability Class: Hearing Difficulty
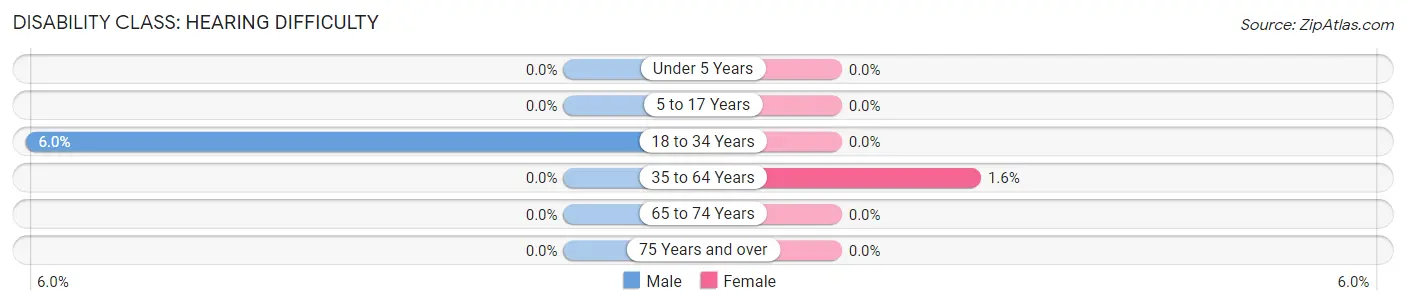
| Age Bracket | Male | Female |
| Under 5 Years | 0 (0.0%) | 0 (0.0%) |
| 5 to 17 Years | 0 (0.0%) | 0 (0.0%) |
| 18 to 34 Years | 10 (6.0%) | 0 (0.0%) |
| 35 to 64 Years | 0 (0.0%) | 4 (1.5%) |
| 65 to 74 Years | 0 (0.0%) | 0 (0.0%) |
| 75 Years and over | 0 (0.0%) | 0 (0.0%) |
Disability Class: Vision Difficulty
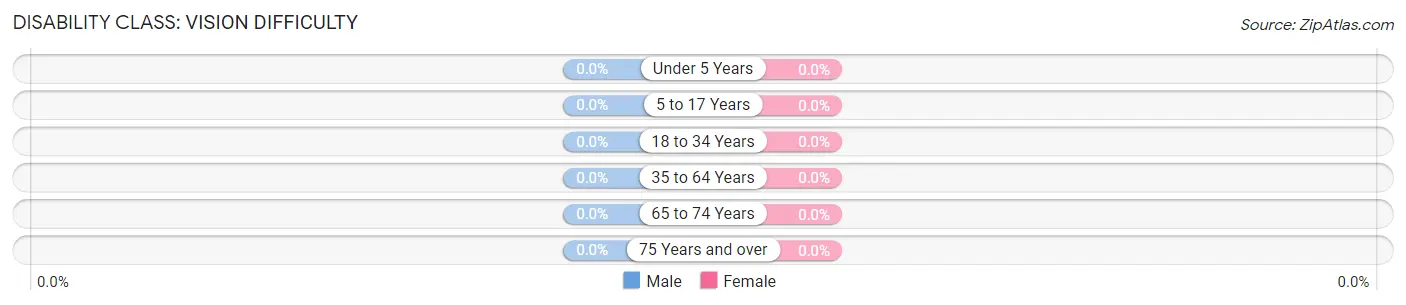
| Age Bracket | Male | Female |
| Under 5 Years | 0 (0.0%) | 0 (0.0%) |
| 5 to 17 Years | 0 (0.0%) | 0 (0.0%) |
| 18 to 34 Years | 0 (0.0%) | 0 (0.0%) |
| 35 to 64 Years | 0 (0.0%) | 0 (0.0%) |
| 65 to 74 Years | 0 (0.0%) | 0 (0.0%) |
| 75 Years and over | 0 (0.0%) | 0 (0.0%) |
Disability Class: Cognitive Difficulty
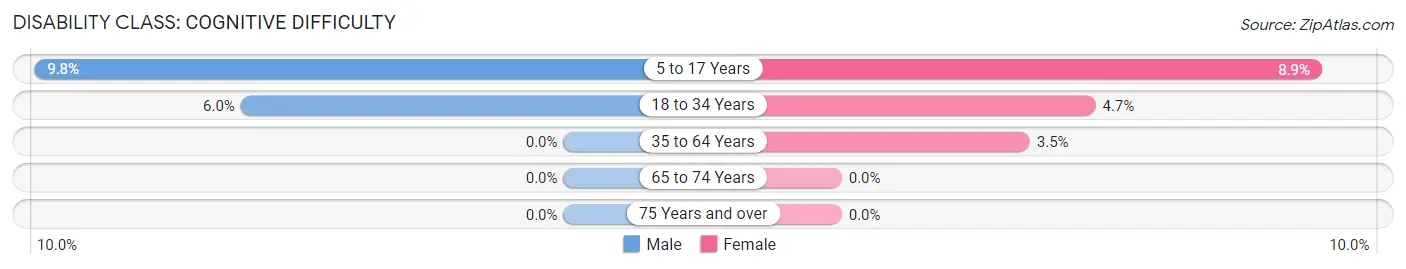
| Age Bracket | Male | Female |
| 5 to 17 Years | 28 (9.8%) | 18 (8.9%) |
| 18 to 34 Years | 10 (6.0%) | 13 (4.7%) |
| 35 to 64 Years | 0 (0.0%) | 9 (3.5%) |
| 65 to 74 Years | 0 (0.0%) | 0 (0.0%) |
| 75 Years and over | 0 (0.0%) | 0 (0.0%) |
Disability Class: Ambulatory Difficulty
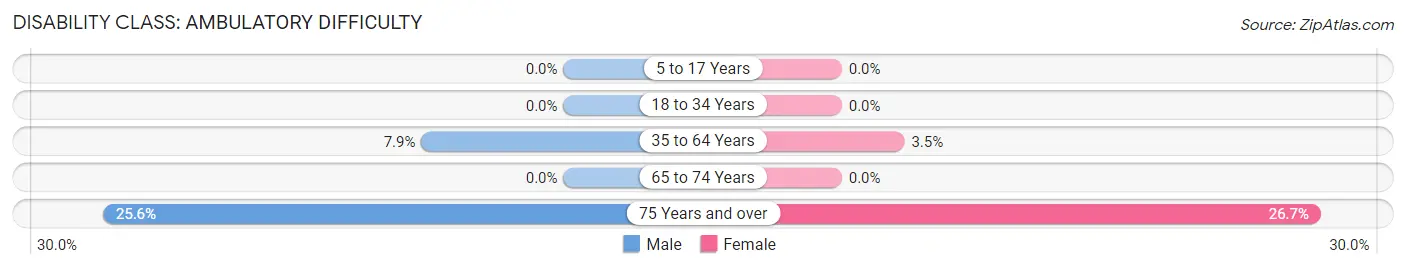
| Age Bracket | Male | Female |
| 5 to 17 Years | 0 (0.0%) | 0 (0.0%) |
| 18 to 34 Years | 0 (0.0%) | 0 (0.0%) |
| 35 to 64 Years | 17 (7.9%) | 9 (3.5%) |
| 65 to 74 Years | 0 (0.0%) | 0 (0.0%) |
| 75 Years and over | 10 (25.6%) | 8 (26.7%) |
Disability Class: Self-Care Difficulty
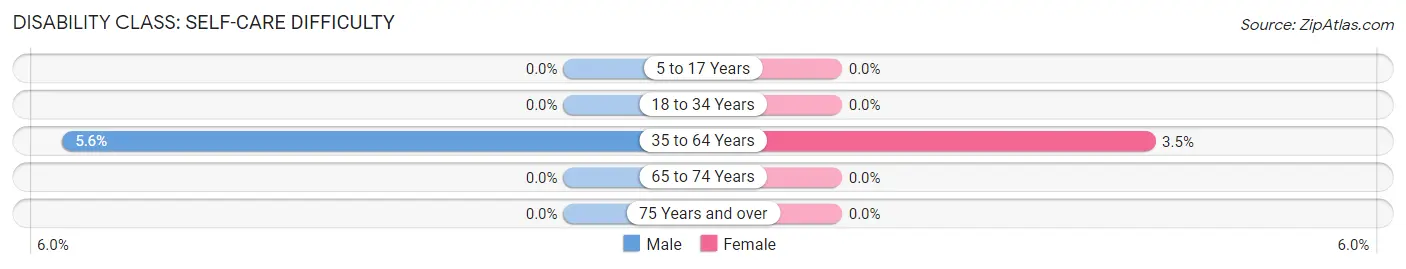
| Age Bracket | Male | Female |
| 5 to 17 Years | 0 (0.0%) | 0 (0.0%) |
| 18 to 34 Years | 0 (0.0%) | 0 (0.0%) |
| 35 to 64 Years | 12 (5.6%) | 9 (3.5%) |
| 65 to 74 Years | 0 (0.0%) | 0 (0.0%) |
| 75 Years and over | 0 (0.0%) | 0 (0.0%) |
Technology Access in Hatch
Computing Device Access in Hatch
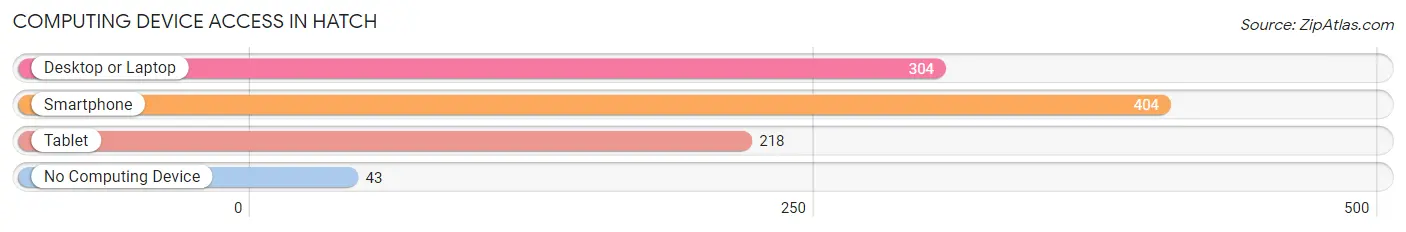
| Device Type | # Households | % Households |
| Desktop or Laptop | 304 | 68.0% |
| Smartphone | 404 | 90.4% |
| Tablet | 218 | 48.8% |
| No Computing Device | 43 | 9.6% |
| Total | 447 | 100.0% |
Internet Access in Hatch
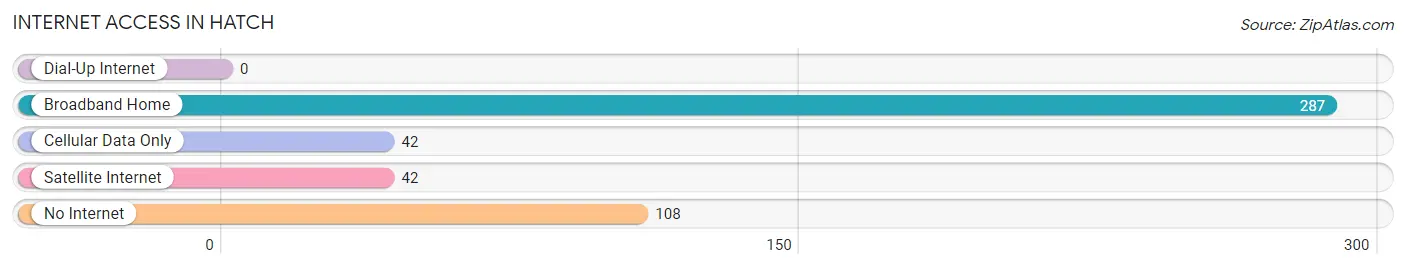
| Internet Type | # Households | % Households |
| Dial-Up Internet | 0 | 0.0% |
| Broadband Home | 287 | 64.2% |
| Cellular Data Only | 42 | 9.4% |
| Satellite Internet | 42 | 9.4% |
| No Internet | 108 | 24.2% |
| Total | 447 | 100.0% |
Hatch Summary
Hatch is a small town located in Dona Ana County, New Mexico. It is situated in the Mesilla Valley, approximately 40 miles northwest of Las Cruces and 30 miles south of Truth or Consequences. The town was founded in 1851 and is known for its chile peppers, which are grown in the area and used in many local dishes.
Geography
Hatch is located in the Mesilla Valley, which is a large valley in the Chihuahuan Desert. The valley is surrounded by the Organ Mountains to the east, the San Andres Mountains to the west, and the Franklin Mountains to the south. The valley is known for its fertile soil and mild climate, which makes it ideal for growing chile peppers. The town is situated at an elevation of 4,000 feet and has a total area of 1.2 square miles.
Economy
Hatch is known for its chile peppers, which are grown in the area and used in many local dishes. The town is home to several chile pepper farms, which produce a variety of peppers, including jalapenos, serranos, and poblanos. The peppers are sold to local restaurants, grocery stores, and markets. In addition to chile peppers, Hatch is also home to several other agricultural businesses, including dairy farms, cattle ranches, and fruit orchards.
The town is also home to several small businesses, including restaurants, shops, and services. The town is served by several major highways, including Interstate 25 and US Highway 70, which provide access to nearby cities and towns.
Demographics
As of the 2010 census, Hatch had a population of 1,648. The population is predominantly Hispanic, with over 90% of the population identifying as Hispanic or Latino. The median household income is $30,000, and the median age is 33. The town is served by the Hatch Valley Public Schools, which includes two elementary schools, one middle school, and one high school.
Conclusion
Hatch is a small town located in Dona Ana County, New Mexico. It is situated in the Mesilla Valley and is known for its chile peppers, which are grown in the area and used in many local dishes. The town is home to several small businesses, including restaurants, shops, and services. The population is predominantly Hispanic, with over 90% of the population identifying as Hispanic or Latino. The town is served by the Hatch Valley Public Schools, which includes two elementary schools, one middle school, and one high school.
Common Questions
What is Per Capita Income in Hatch?
Per Capita income in Hatch is $20,060.
What is the Median Family Income in Hatch?
Median Family Income in Hatch is $56,806.
What is the Median Household income in Hatch?
Median Household Income in Hatch is $42,917.
What is Inequality or Gini Index in Hatch?
Inequality or Gini Index in Hatch is 0.48.
What is the Total Population of Hatch?
Total Population of Hatch is 1,673.
What is the Total Male Population of Hatch?
Total Male Population of Hatch is 838.
What is the Total Female Population of Hatch?
Total Female Population of Hatch is 835.
What is the Ratio of Males per 100 Females in Hatch?
There are 100.36 Males per 100 Females in Hatch.
What is the Ratio of Females per 100 Males in Hatch?
There are 99.64 Females per 100 Males in Hatch.
What is the Median Population Age in Hatch?
Median Population Age in Hatch is 26.9 Years.
What is the Average Family Size in Hatch
Average Family Size in Hatch is 4.3 People.
What is the Average Household Size in Hatch
Average Household Size in Hatch is 3.7 People.
How Large is the Labor Force in Hatch?
There are 844 People in the Labor Forcein in Hatch.
What is the Percentage of People in the Labor Force in Hatch?
71.5% of People are in the Labor Force in Hatch.
What is the Unemployment Rate in Hatch?
Unemployment Rate in Hatch is 20.1%.