Milan, NM Map & Demographics
Milan Map
Milan Overview
$20,829
PER CAPITA INCOME
$62,697
AVG FAMILY INCOME
$36,433
AVG HOUSEHOLD INCOME
24.0%
WAGE / INCOME GAP [ % ]
76.0¢/ $1
WAGE / INCOME GAP [ $ ]
0.43
INEQUALITY / GINI INDEX
2,375
TOTAL POPULATION
1,377
MALE POPULATION
998
FEMALE POPULATION
137.98
MALES / 100 FEMALES
72.48
FEMALES / 100 MALES
44.2
MEDIAN AGE
5.2
AVG FAMILY SIZE
2.7
AVG HOUSEHOLD SIZE
875
LABOR FORCE [ PEOPLE ]
44.2%
PERCENT IN LABOR FORCE
17.4%
UNEMPLOYMENT RATE
Milan Zip Codes
Milan Area Codes
Income in Milan
Income Overview in Milan
Per Capita Income in Milan is $20,829, while median incomes of families and households are $62,697 and $36,433 respectively.
| Characteristic | Number | Measure |
| Per Capita Income | 2,375 | $20,829 |
| Median Family Income | 291 | $62,697 |
| Mean Family Income | 291 | $76,577 |
| Median Household Income | 848 | $36,433 |
| Mean Household Income | 848 | $52,602 |
| Income Deficit | 291 | $0 |
| Wage / Income Gap (%) | 2,375 | 23.98% |
| Wage / Income Gap ($) | 2,375 | 76.02¢ per $1 |
| Gini / Inequality Index | 2,375 | 0.43 |
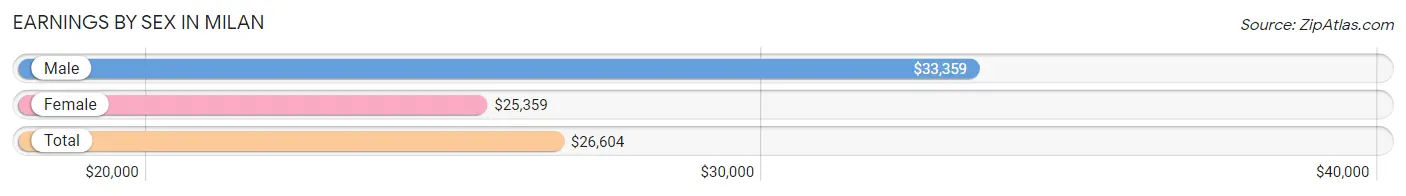
Earnings by Sex in Milan
Average Earnings in Milan are $26,604, $33,359 for men and $25,359 for women, a difference of 24.0%.
| Sex | Number | Average Earnings |
| Male | 531 (53.4%) | $33,359 |
| Female | 463 (46.6%) | $25,359 |
| Total | 994 (100.0%) | $26,604 |
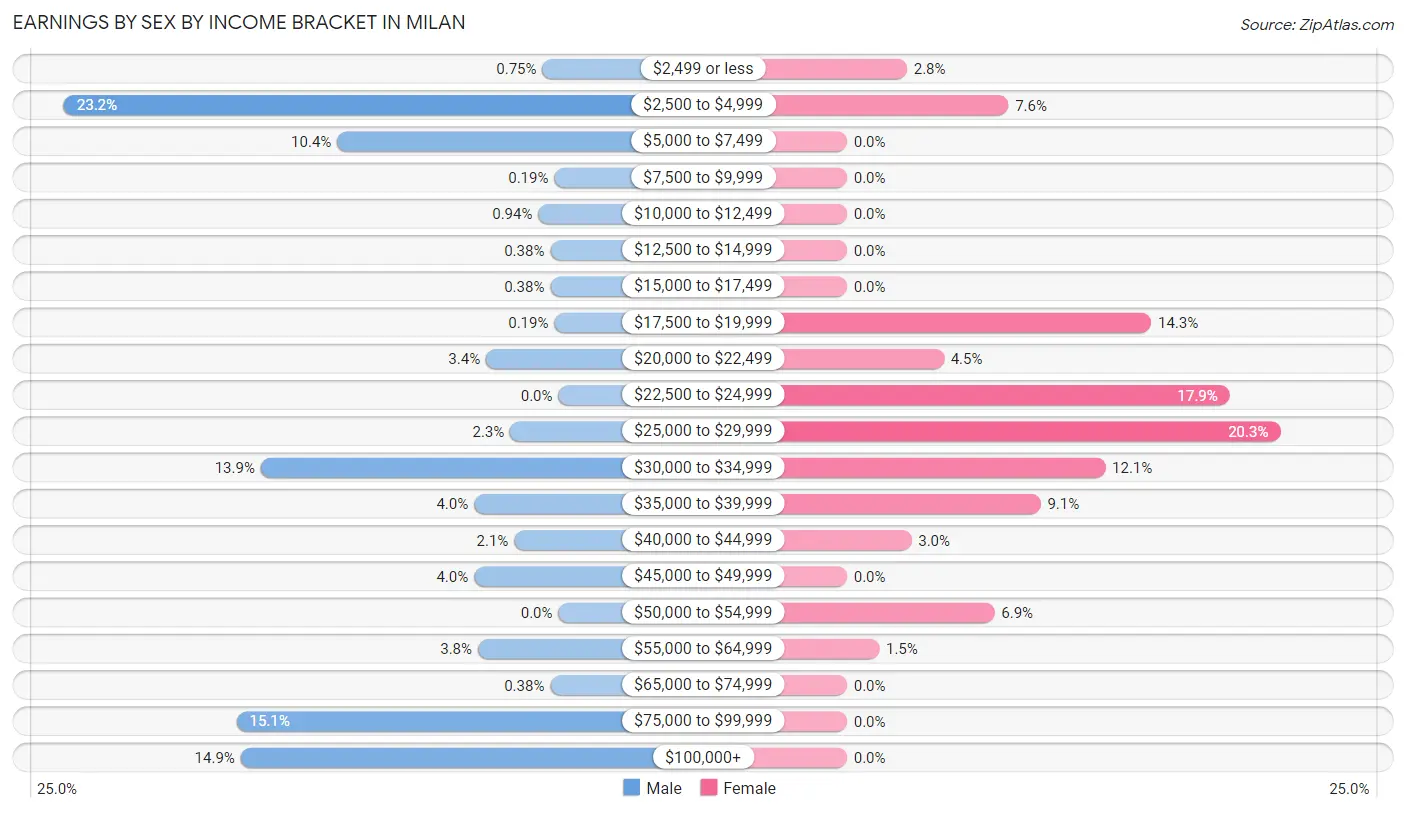
Earnings by Sex by Income Bracket in Milan
The most common earnings brackets in Milan are $2,500 to $4,999 for men (123 | 23.2%) and $25,000 to $29,999 for women (94 | 20.3%).
| Income | Male | Female |
| $2,499 or less | 4 (0.7%) | 13 (2.8%) |
| $2,500 to $4,999 | 123 (23.2%) | 35 (7.6%) |
| $5,000 to $7,499 | 55 (10.4%) | 0 (0.0%) |
| $7,500 to $9,999 | 1 (0.2%) | 0 (0.0%) |
| $10,000 to $12,499 | 5 (0.9%) | 0 (0.0%) |
| $12,500 to $14,999 | 2 (0.4%) | 0 (0.0%) |
| $15,000 to $17,499 | 2 (0.4%) | 0 (0.0%) |
| $17,500 to $19,999 | 1 (0.2%) | 66 (14.2%) |
| $20,000 to $22,499 | 18 (3.4%) | 21 (4.5%) |
| $22,500 to $24,999 | 0 (0.0%) | 83 (17.9%) |
| $25,000 to $29,999 | 12 (2.3%) | 94 (20.3%) |
| $30,000 to $34,999 | 74 (13.9%) | 56 (12.1%) |
| $35,000 to $39,999 | 21 (4.0%) | 42 (9.1%) |
| $40,000 to $44,999 | 11 (2.1%) | 14 (3.0%) |
| $45,000 to $49,999 | 21 (4.0%) | 0 (0.0%) |
| $50,000 to $54,999 | 0 (0.0%) | 32 (6.9%) |
| $55,000 to $64,999 | 20 (3.8%) | 7 (1.5%) |
| $65,000 to $74,999 | 2 (0.4%) | 0 (0.0%) |
| $75,000 to $99,999 | 80 (15.1%) | 0 (0.0%) |
| $100,000+ | 79 (14.9%) | 0 (0.0%) |
| Total | 531 (100.0%) | 463 (100.0%) |
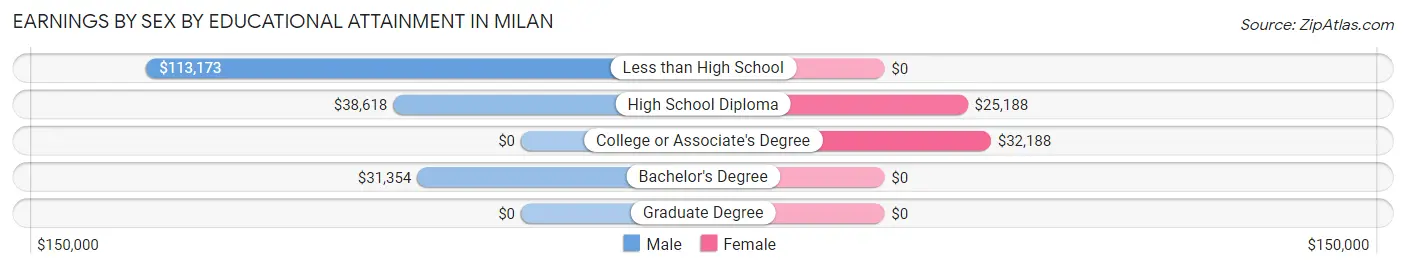
Earnings by Sex by Educational Attainment in Milan
| Educational Attainment | Male Income | Female Income |
| Less than High School | $113,173 | $0 |
| High School Diploma | $38,618 | $25,188 |
| College or Associate's Degree | - | - |
| Bachelor's Degree | $31,354 | $0 |
| Graduate Degree | - | - |
| Total | - | - |
Family Income in Milan
Family Income Brackets in Milan
According to the Milan family income data, there are 91 families falling into the $35,000 to $49,999 income range, which is the most common income bracket and makes up 31.3% of all families.
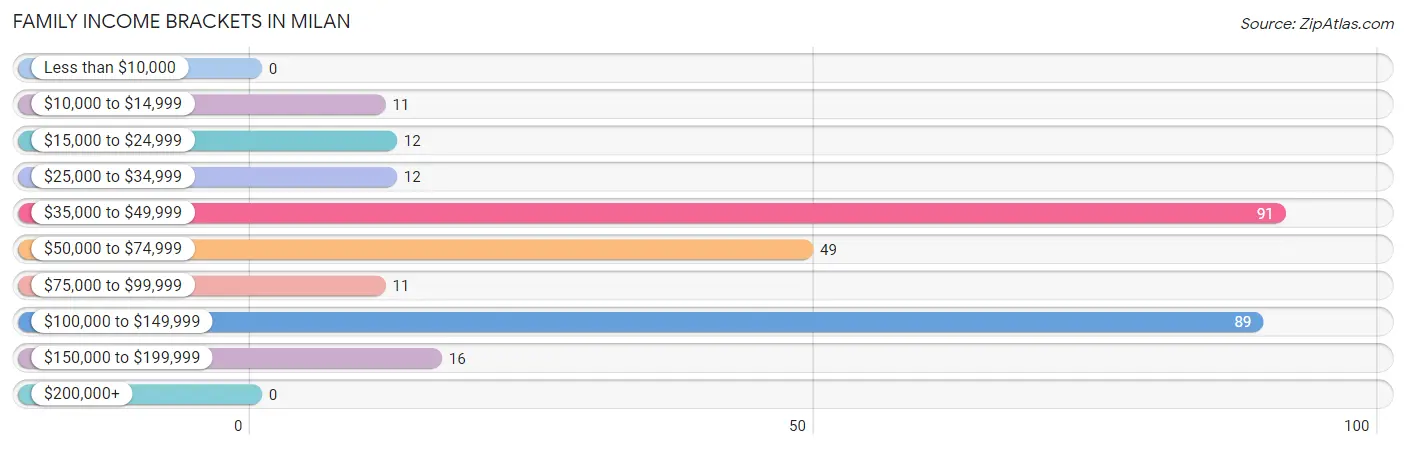
| Income Bracket | # Families | % Families |
| Less than $10,000 | 0 | 0.0% |
| $10,000 to $14,999 | 11 | 3.8% |
| $15,000 to $24,999 | 12 | 4.1% |
| $25,000 to $34,999 | 12 | 4.1% |
| $35,000 to $49,999 | 91 | 31.3% |
| $50,000 to $74,999 | 49 | 16.8% |
| $75,000 to $99,999 | 11 | 3.8% |
| $100,000 to $149,999 | 89 | 30.6% |
| $150,000 to $199,999 | 16 | 5.5% |
| $200,000+ | 0 | 0.0% |
Family Income by Famaliy Size in Milan
3-person families (70 | 24.0%) account for the highest median family income in Milan with $47,778 per family, while 3-person families (70 | 24.0%) have the highest median income of $15,926 per family member.
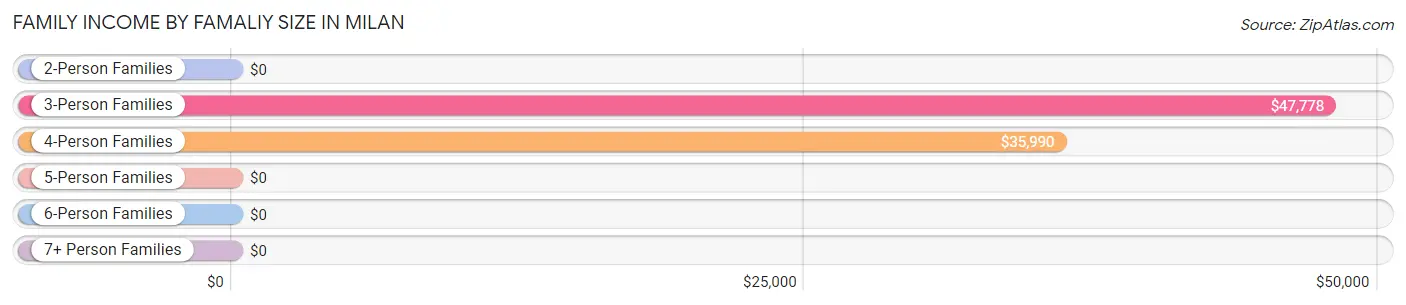
| Income Bracket | # Families | Median Income |
| 2-Person Families | 94 (32.3%) | $0 |
| 3-Person Families | 70 (24.0%) | $47,778 |
| 4-Person Families | 43 (14.8%) | $35,990 |
| 5-Person Families | 65 (22.3%) | $0 |
| 6-Person Families | 19 (6.5%) | $0 |
| 7+ Person Families | 0 (0.0%) | $0 |
| Total | 291 (100.0%) | $62,697 |
Family Income by Number of Earners in Milan
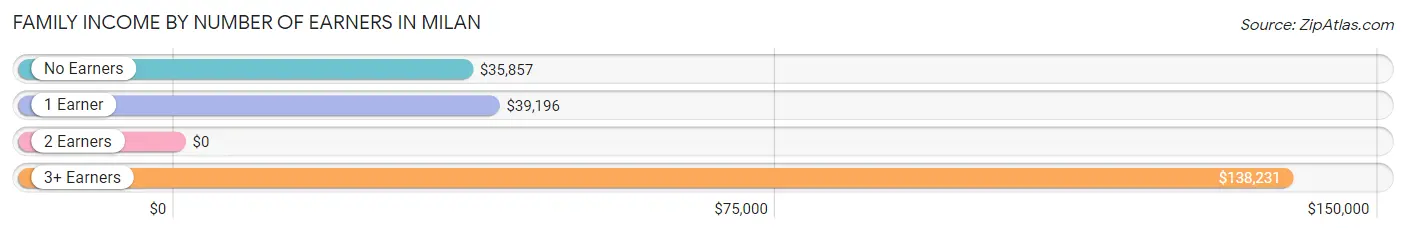
| Number of Earners | # Families | Median Income |
| No Earners | 70 (24.0%) | $35,857 |
| 1 Earner | 91 (31.3%) | $39,196 |
| 2 Earners | 38 (13.1%) | $0 |
| 3+ Earners | 92 (31.6%) | $138,231 |
| Total | 291 (100.0%) | $62,697 |
Household Income in Milan
Household Income Brackets in Milan
With 202 households falling in the category, the $35,000 to $49,999 income range is the most frequent in Milan, accounting for 23.8% of all households.
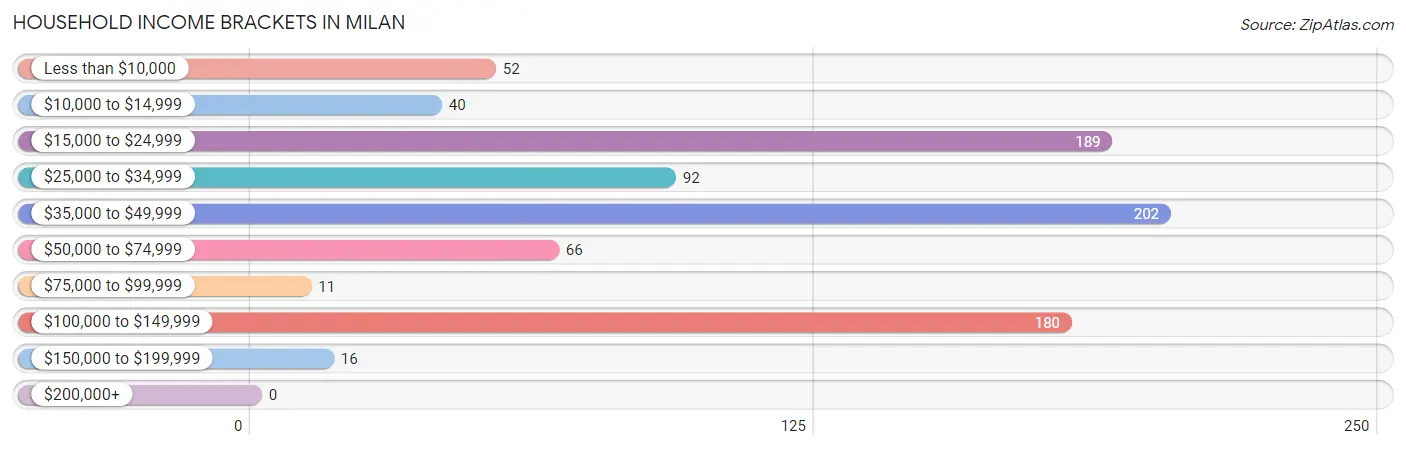
| Income Bracket | # Households | % Households |
| Less than $10,000 | 52 | 6.1% |
| $10,000 to $14,999 | 40 | 4.7% |
| $15,000 to $24,999 | 189 | 22.3% |
| $25,000 to $34,999 | 92 | 10.8% |
| $35,000 to $49,999 | 202 | 23.8% |
| $50,000 to $74,999 | 66 | 7.8% |
| $75,000 to $99,999 | 11 | 1.3% |
| $100,000 to $149,999 | 180 | 21.2% |
| $150,000 to $199,999 | 16 | 1.9% |
| $200,000+ | 0 | 0.0% |
Household Income by Householder Age in Milan
The median household income in Milan is $36,433, with the highest median household income of $42,813 found in the 45 to 64 years age bracket for the primary householder. A total of 348 households (41.0%) fall into this category. Meanwhile, the 15 to 24 years age bracket for the primary householder has the lowest median household income of $0, with 45 households (5.3%) in this group.
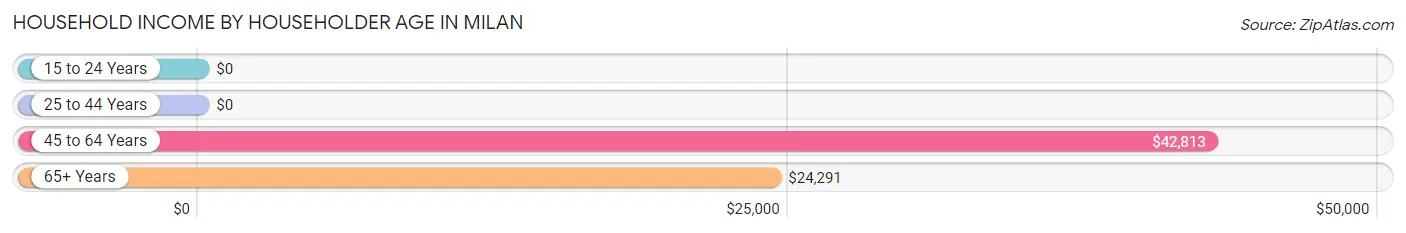
| Income Bracket | # Households | Median Income |
| 15 to 24 Years | 45 (5.3%) | $0 |
| 25 to 44 Years | 135 (15.9%) | $0 |
| 45 to 64 Years | 348 (41.0%) | $42,813 |
| 65+ Years | 320 (37.7%) | $24,291 |
| Total | 848 (100.0%) | $36,433 |
Poverty in Milan
Income Below Poverty by Sex and Age in Milan
With 18.2% poverty level for males and 24.0% for females among the residents of Milan, 45 to 54 year old males and 18 to 24 year old females are the most vulnerable to poverty, with 168 males (54.9%) and 16 females (100.0%) in their respective age groups living below the poverty level.
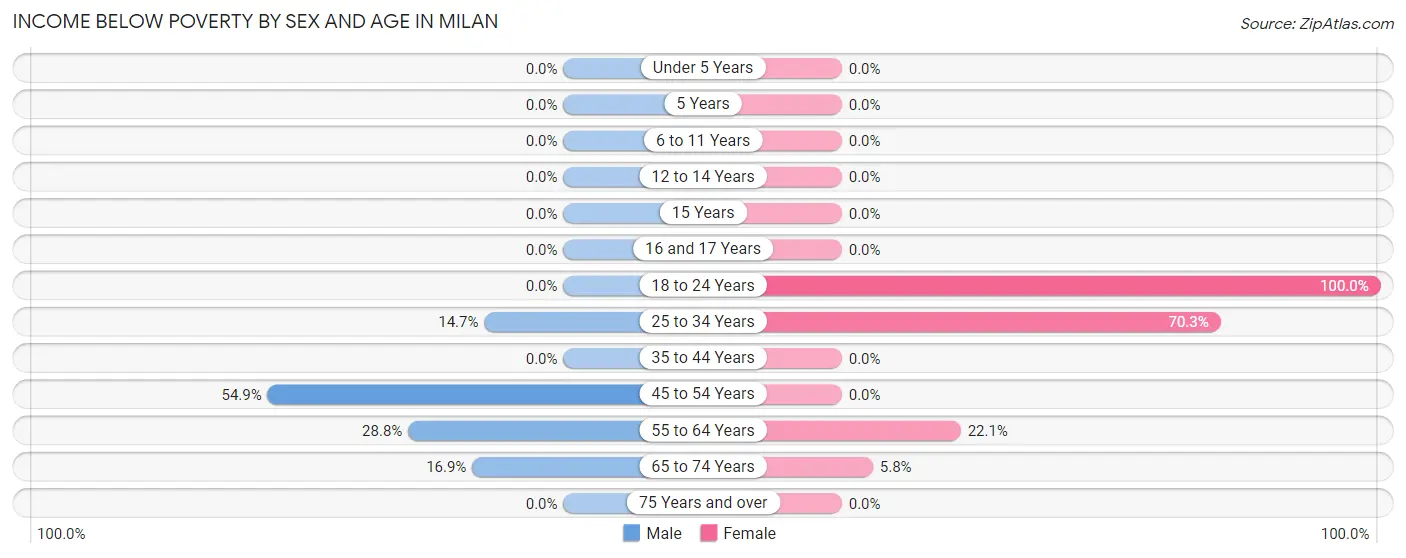
| Age Bracket | Male | Female |
| Under 5 Years | 0 (0.0%) | 0 (0.0%) |
| 5 Years | 0 (0.0%) | 0 (0.0%) |
| 6 to 11 Years | 0 (0.0%) | 0 (0.0%) |
| 12 to 14 Years | 0 (0.0%) | 0 (0.0%) |
| 15 Years | 0 (0.0%) | 0 (0.0%) |
| 16 and 17 Years | 0 (0.0%) | 0 (0.0%) |
| 18 to 24 Years | 0 (0.0%) | 16 (100.0%) |
| 25 to 34 Years | 22 (14.7%) | 180 (70.3%) |
| 35 to 44 Years | 0 (0.0%) | 0 (0.0%) |
| 45 to 54 Years | 168 (54.9%) | 0 (0.0%) |
| 55 to 64 Years | 34 (28.8%) | 32 (22.1%) |
| 65 to 74 Years | 11 (16.9%) | 11 (5.8%) |
| 75 Years and over | 0 (0.0%) | 0 (0.0%) |
| Total | 235 (18.2%) | 239 (24.0%) |
Income Above Poverty by Sex and Age in Milan
According to the poverty statistics in Milan, males aged under 5 years and females aged 5 years are the age groups that are most secure financially, with 100.0% of males and 100.0% of females in these age groups living above the poverty line.
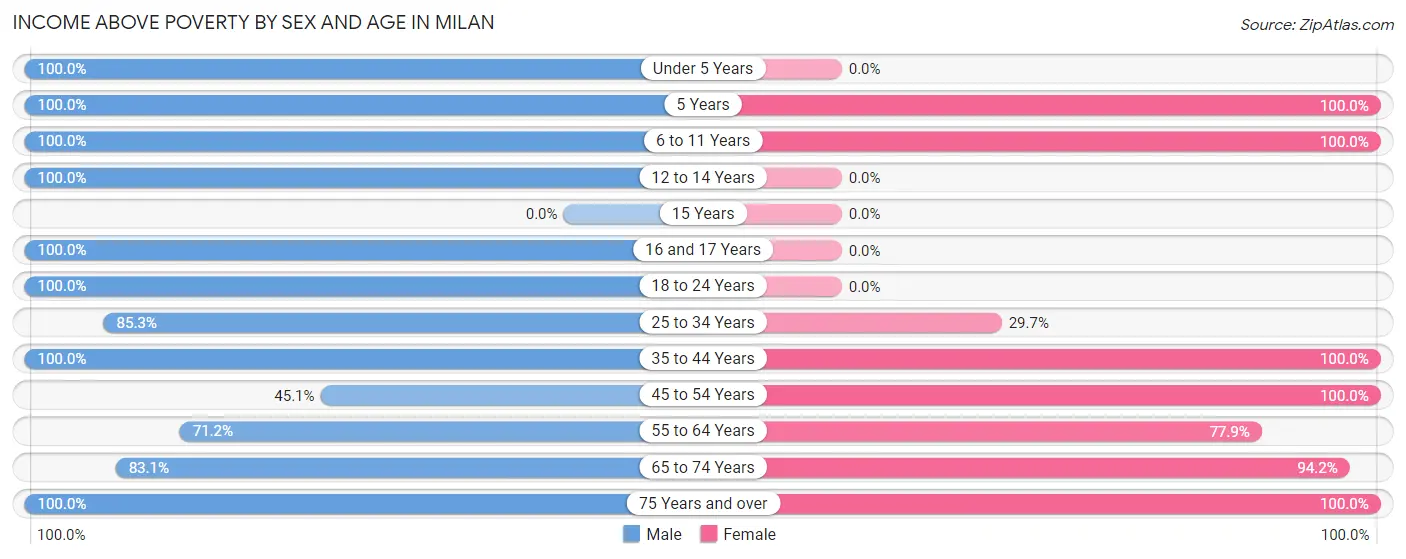
| Age Bracket | Male | Female |
| Under 5 Years | 49 (100.0%) | 0 (0.0%) |
| 5 Years | 30 (100.0%) | 13 (100.0%) |
| 6 to 11 Years | 242 (100.0%) | 9 (100.0%) |
| 12 to 14 Years | 52 (100.0%) | 0 (0.0%) |
| 15 Years | 0 (0.0%) | 0 (0.0%) |
| 16 and 17 Years | 62 (100.0%) | 0 (0.0%) |
| 18 to 24 Years | 115 (100.0%) | 0 (0.0%) |
| 25 to 34 Years | 128 (85.3%) | 76 (29.7%) |
| 35 to 44 Years | 89 (100.0%) | 100 (100.0%) |
| 45 to 54 Years | 138 (45.1%) | 177 (100.0%) |
| 55 to 64 Years | 84 (71.2%) | 113 (77.9%) |
| 65 to 74 Years | 54 (83.1%) | 180 (94.2%) |
| 75 Years and over | 12 (100.0%) | 90 (100.0%) |
| Total | 1,055 (81.8%) | 758 (76.0%) |
Income Below Poverty Among Married-Couple Families in Milan
The poverty statistics for married-couple families in Milan show that 5.8% or 12 of the total 207 families live below the poverty line. Families with no children have the highest poverty rate of 12.2%, comprising of 12 families. On the other hand, families with 1 or 2 children have the lowest poverty rate of 0.0%, which includes 0 families.
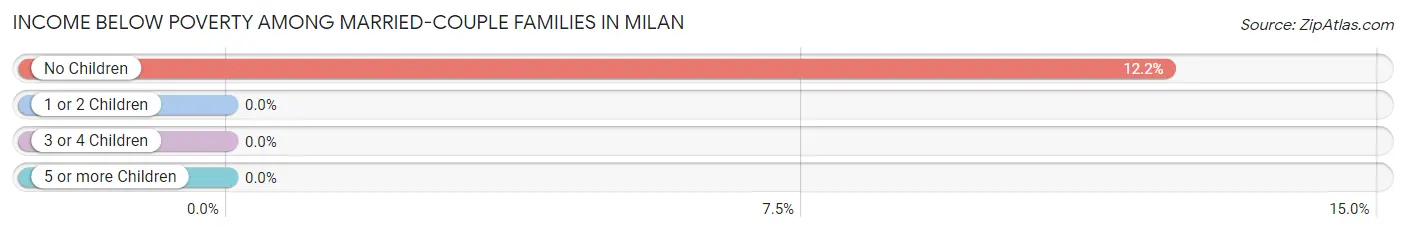
| Children | Above Poverty | Below Poverty |
| No Children | 86 (87.8%) | 12 (12.2%) |
| 1 or 2 Children | 90 (100.0%) | 0 (0.0%) |
| 3 or 4 Children | 19 (100.0%) | 0 (0.0%) |
| 5 or more Children | 0 (0.0%) | 0 (0.0%) |
| Total | 195 (94.2%) | 12 (5.8%) |
Income Below Poverty Among Single-Parent Households in Milan
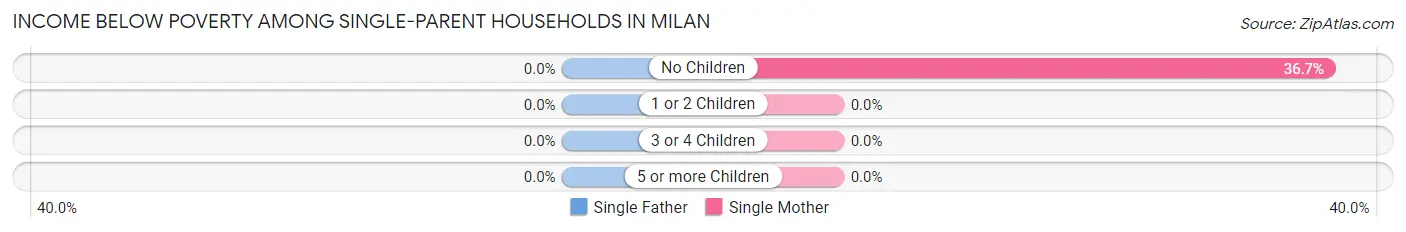
| Children | Single Father | Single Mother |
| No Children | 0 (0.0%) | 11 (36.7%) |
| 1 or 2 Children | 0 (0.0%) | 0 (0.0%) |
| 3 or 4 Children | 0 (0.0%) | 0 (0.0%) |
| 5 or more Children | 0 (0.0%) | 0 (0.0%) |
| Total | 0 (0.0%) | 11 (29.7%) |
Income Below Poverty Among Married-Couple vs Single-Parent Households in Milan
The poverty data for Milan shows that 12 of the married-couple family households (5.8%) and 11 of the single-parent households (13.1%) are living below the poverty level. Within the married-couple family households, those with no children have the highest poverty rate, with 12 households (12.2%) falling below the poverty line. Among the single-parent households, those with no children have the highest poverty rate, with 11 household (26.8%) living below poverty.
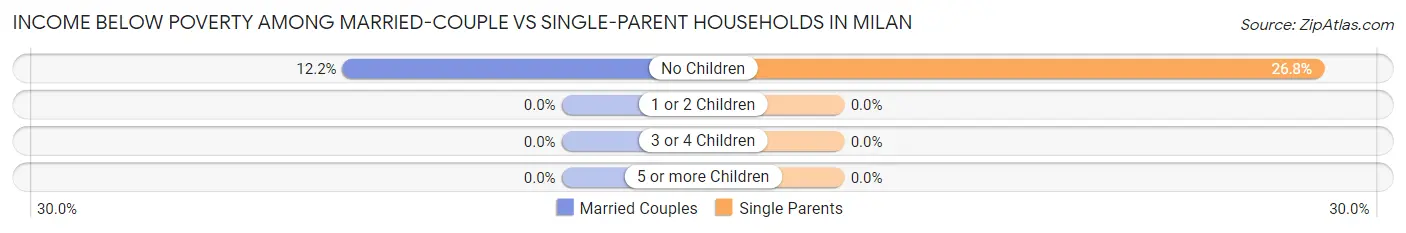
| Children | Married-Couple Families | Single-Parent Households |
| No Children | 12 (12.2%) | 11 (26.8%) |
| 1 or 2 Children | 0 (0.0%) | 0 (0.0%) |
| 3 or 4 Children | 0 (0.0%) | 0 (0.0%) |
| 5 or more Children | 0 (0.0%) | 0 (0.0%) |
| Total | 12 (5.8%) | 11 (13.1%) |
Race in Milan
The most populous races in Milan are Hispanic or Latino (1,443 | 60.8%), White / Caucasian (1,225 | 51.6%), and Two or more Races (648 | 27.3%).
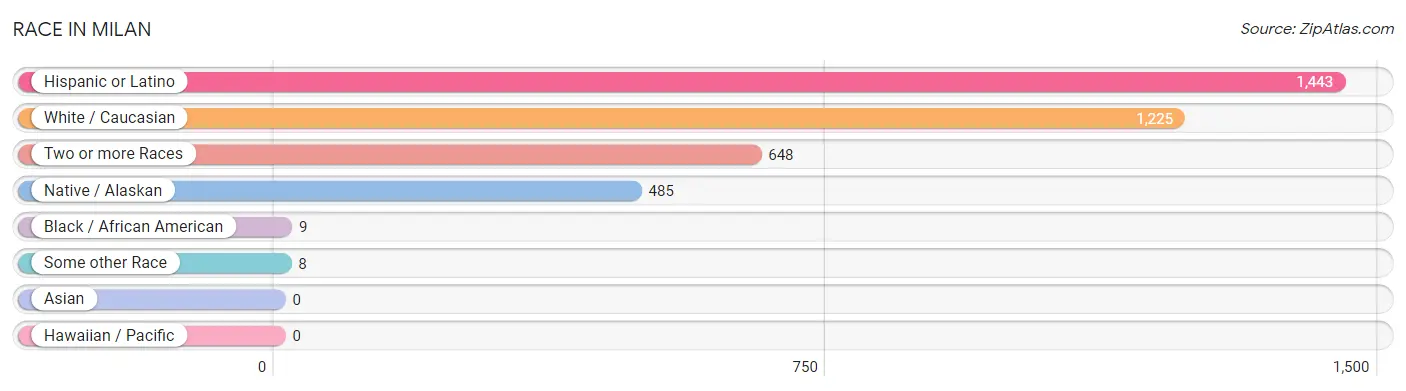
| Race | # Population | % Population |
| Asian | 0 | 0.0% |
| Black / African American | 9 | 0.4% |
| Hawaiian / Pacific | 0 | 0.0% |
| Hispanic or Latino | 1,443 | 60.8% |
| Native / Alaskan | 485 | 20.4% |
| White / Caucasian | 1,225 | 51.6% |
| Two or more Races | 648 | 27.3% |
| Some other Race | 8 | 0.3% |
| Total | 2,375 | 100.0% |
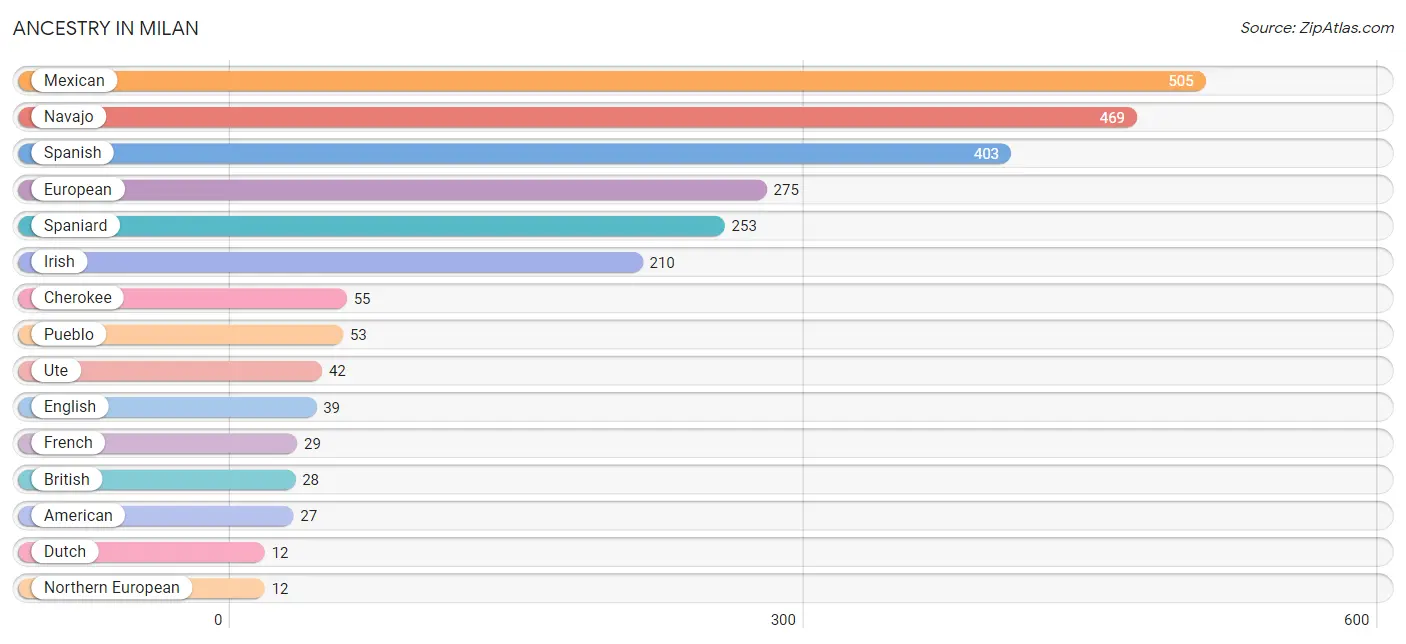
Ancestry in Milan
The most populous ancestries reported in Milan are Mexican (505 | 21.3%), Navajo (469 | 19.8%), Spanish (403 | 17.0%), European (275 | 11.6%), and Spaniard (253 | 10.6%), together accounting for 80.2% of all Milan residents.
| Ancestry | # Population | % Population |
| American | 27 | 1.1% |
| Apache | 1 | 0.0% |
| Arab | 2 | 0.1% |
| British | 28 | 1.2% |
| Cherokee | 55 | 2.3% |
| Dutch | 12 | 0.5% |
| English | 39 | 1.6% |
| European | 275 | 11.6% |
| French | 29 | 1.2% |
| German | 3 | 0.1% |
| Irish | 210 | 8.8% |
| Korean | 2 | 0.1% |
| Mexican | 505 | 21.3% |
| Navajo | 469 | 19.8% |
| Northern European | 12 | 0.5% |
| Polish | 1 | 0.0% |
| Pueblo | 53 | 2.2% |
| Scottish | 7 | 0.3% |
| Sioux | 1 | 0.0% |
| Spaniard | 253 | 10.6% |
| Spanish | 403 | 17.0% |
| Swiss | 1 | 0.0% |
| Ute | 42 | 1.8% | View All 23 Rows |
Immigrants in Milan
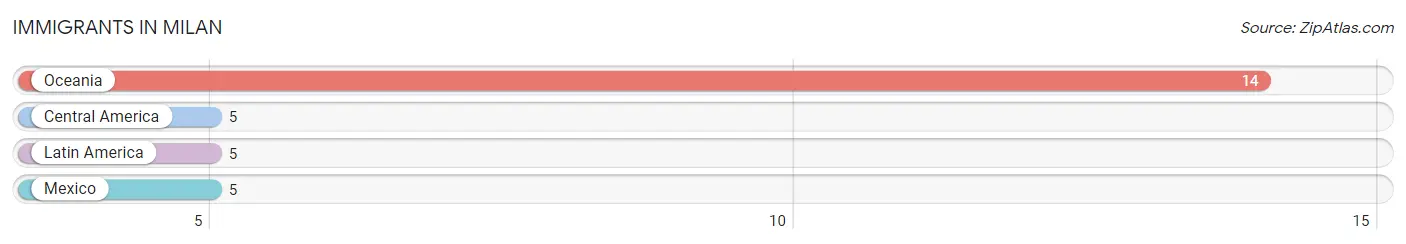
The most numerous immigrant groups reported in Milan came from Oceania (14 | 0.6%), Central America (5 | 0.2%), Latin America (5 | 0.2%), and Mexico (5 | 0.2%), together accounting for 1.2% of all Milan residents.
| Immigration Origin | # Population | % Population |
| Central America | 5 | 0.2% |
| Latin America | 5 | 0.2% |
| Mexico | 5 | 0.2% |
| Oceania | 14 | 0.6% | View All 4 Rows |
Sex and Age in Milan
Sex and Age in Milan
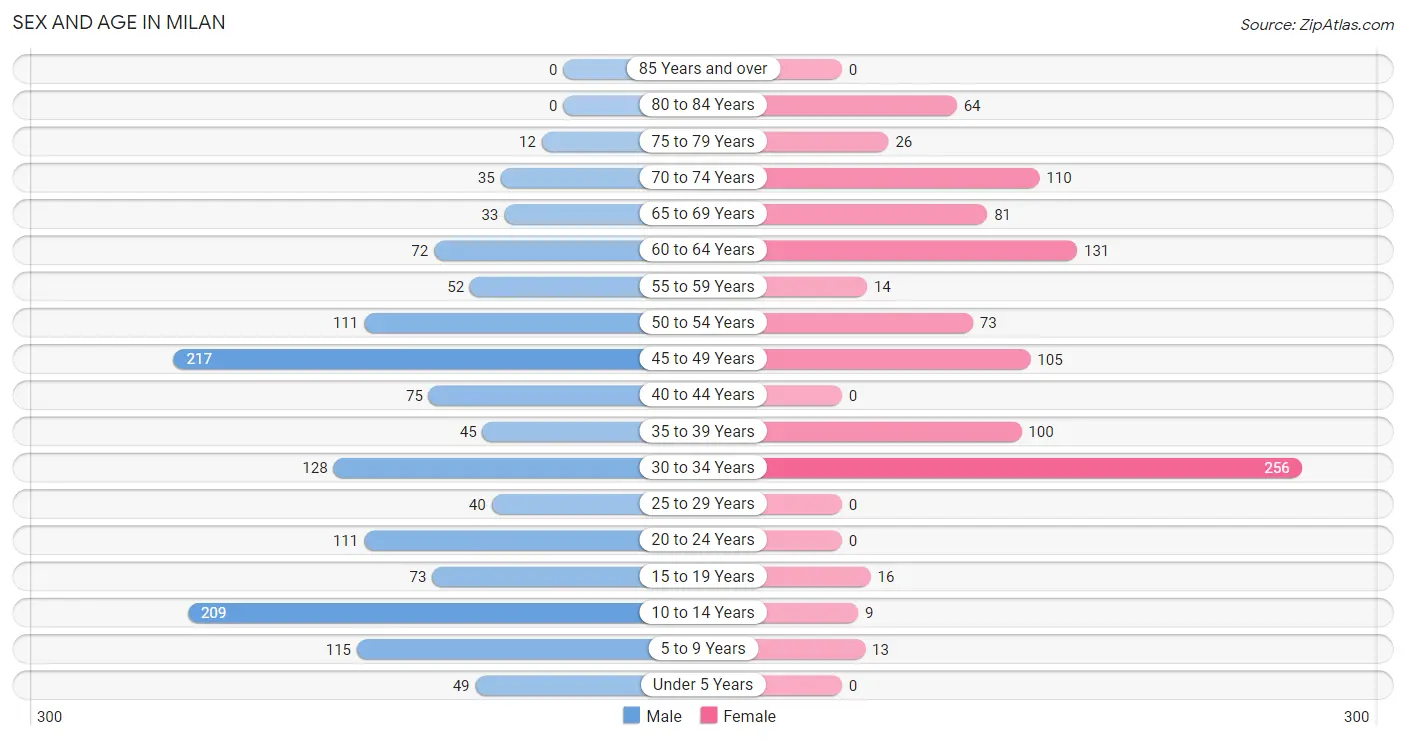
The most populous age groups in Milan are 45 to 49 Years (217 | 15.8%) for men and 30 to 34 Years (256 | 25.7%) for women.
| Age Bracket | Male | Female |
| Under 5 Years | 49 (3.6%) | 0 (0.0%) |
| 5 to 9 Years | 115 (8.4%) | 13 (1.3%) |
| 10 to 14 Years | 209 (15.2%) | 9 (0.9%) |
| 15 to 19 Years | 73 (5.3%) | 16 (1.6%) |
| 20 to 24 Years | 111 (8.1%) | 0 (0.0%) |
| 25 to 29 Years | 40 (2.9%) | 0 (0.0%) |
| 30 to 34 Years | 128 (9.3%) | 256 (25.7%) |
| 35 to 39 Years | 45 (3.3%) | 100 (10.0%) |
| 40 to 44 Years | 75 (5.4%) | 0 (0.0%) |
| 45 to 49 Years | 217 (15.8%) | 105 (10.5%) |
| 50 to 54 Years | 111 (8.1%) | 73 (7.3%) |
| 55 to 59 Years | 52 (3.8%) | 14 (1.4%) |
| 60 to 64 Years | 72 (5.2%) | 131 (13.1%) |
| 65 to 69 Years | 33 (2.4%) | 81 (8.1%) |
| 70 to 74 Years | 35 (2.5%) | 110 (11.0%) |
| 75 to 79 Years | 12 (0.9%) | 26 (2.6%) |
| 80 to 84 Years | 0 (0.0%) | 64 (6.4%) |
| 85 Years and over | 0 (0.0%) | 0 (0.0%) |
| Total | 1,377 (100.0%) | 998 (100.0%) |
Families and Households in Milan
Median Family Size in Milan
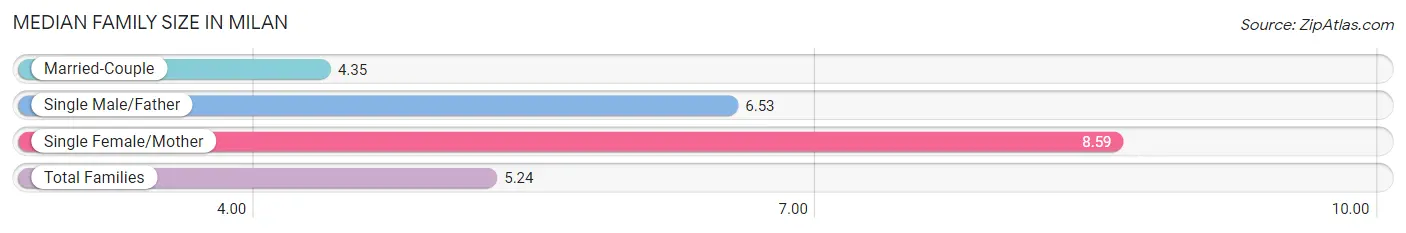
The median family size in Milan is 5.24 persons per family, with single female/mother families (37 | 12.7%) accounting for the largest median family size of 8.59 persons per family. On the other hand, married-couple families (207 | 71.1%) represent the smallest median family size with 4.35 persons per family.
| Family Type | # Families | Family Size |
| Married-Couple | 207 (71.1%) | 4.35 |
| Single Male/Father | 47 (16.2%) | 6.53 |
| Single Female/Mother | 37 (12.7%) | 8.59 |
| Total Families | 291 (100.0%) | 5.24 |
Median Household Size in Milan
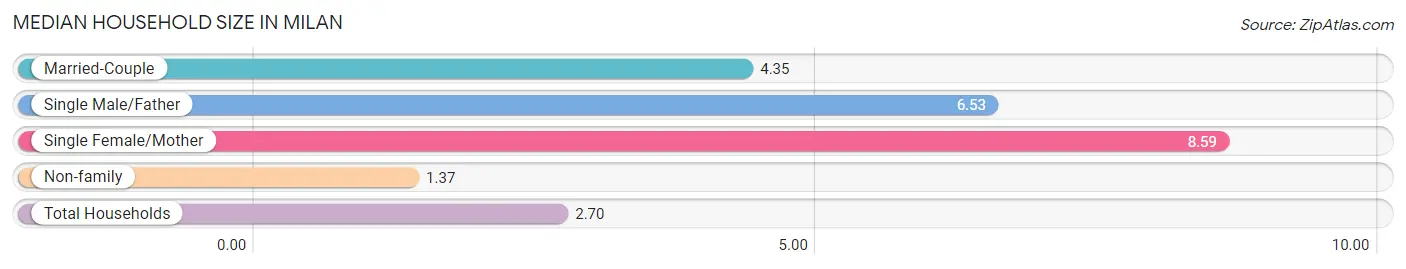
The median household size in Milan is 2.70 persons per household, with single female/mother households (37 | 4.4%) accounting for the largest median household size of 8.59 persons per household. non-family households (557 | 65.7%) represent the smallest median household size with 1.37 persons per household.
| Household Type | # Households | Household Size |
| Married-Couple | 207 (24.4%) | 4.35 |
| Single Male/Father | 47 (5.5%) | 6.53 |
| Single Female/Mother | 37 (4.4%) | 8.59 |
| Non-family | 557 (65.7%) | 1.37 |
| Total Households | 848 (100.0%) | 2.70 |
Household Size by Marriage Status in Milan
Out of a total of 848 households in Milan, 291 (34.3%) are family households, while 557 (65.7%) are nonfamily households. The most numerous type of family households are 2-person households, comprising 94, and the most common type of nonfamily households are 1-person households, comprising 407.
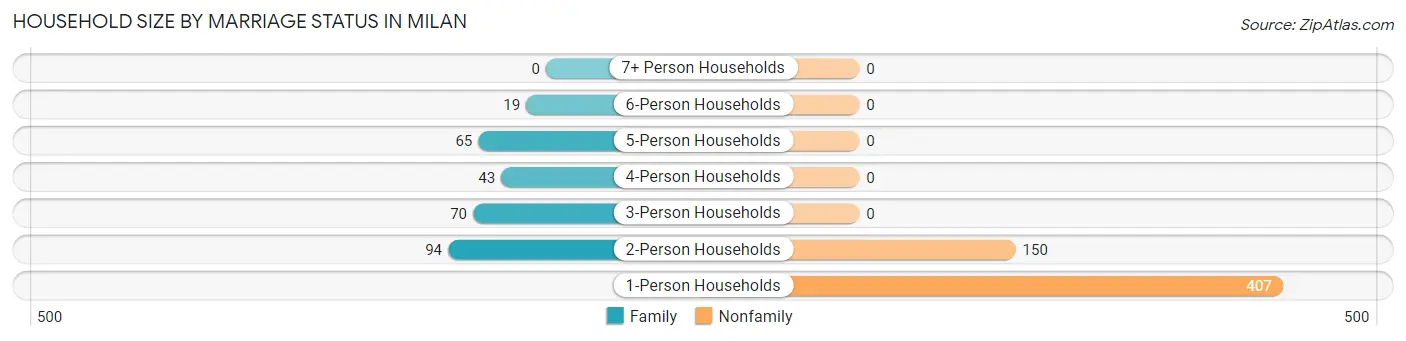
| Household Size | Family Households | Nonfamily Households |
| 1-Person Households | - | 407 (48.0%) |
| 2-Person Households | 94 (11.1%) | 150 (17.7%) |
| 3-Person Households | 70 (8.3%) | 0 (0.0%) |
| 4-Person Households | 43 (5.1%) | 0 (0.0%) |
| 5-Person Households | 65 (7.7%) | 0 (0.0%) |
| 6-Person Households | 19 (2.2%) | 0 (0.0%) |
| 7+ Person Households | 0 (0.0%) | 0 (0.0%) |
| Total | 291 (34.3%) | 557 (65.7%) |
Female Fertility in Milan
Fertility by Age in Milan
| Age Bracket | Women with Births | Births / 1,000 Women |
| 15 to 19 years | 0 (0.0%) | 0.0 |
| 20 to 34 years | 0 (0.0%) | 0.0 |
| 35 to 50 years | 0 (0.0%) | 0.0 |
| Total | 0 (0.0%) | 0.0 |
Fertility by Age by Marriage Status in Milan
| Age Bracket | Married | Unmarried |
| 15 to 19 years | 0 (0.0%) | 0 (0.0%) |
| 20 to 34 years | 0 (0.0%) | 0 (0.0%) |
| 35 to 50 years | 0 (0.0%) | 0 (0.0%) |
| Total | 0 (0.0%) | 0 (0.0%) |
Fertility by Education in Milan
| Educational Attainment | Women with Births | Births / 1,000 Women |
| Less than High School | 0 (0.0%) | 0.0 |
| High School Diploma | 0 (0.0%) | 0.0 |
| College or Associate's Degree | 0 (0.0%) | 0.0 |
| Bachelor's Degree | 0 (0.0%) | 0.0 |
| Graduate Degree | 0 (0.0%) | 0.0 |
| Total | 0 (0.0%) | 0.0 |
Fertility by Education by Marriage Status in Milan
| Educational Attainment | Married | Unmarried |
| Less than High School | 0 (0.0%) | 0 (0.0%) |
| High School Diploma | 0 (0.0%) | 0 (0.0%) |
| College or Associate's Degree | 0 (0.0%) | 0 (0.0%) |
| Bachelor's Degree | 0 (0.0%) | 0 (0.0%) |
| Graduate Degree | 0 (0.0%) | 0 (0.0%) |
| Total | 0 (0.0%) | 0 (0.0%) |
Employment Characteristics in Milan
Employment by Class of Employer in Milan
Among the 724 employed individuals in Milan, private company employees (340 | 47.0%), local government employees (129 | 17.8%), and self-employed (not incorporated) (120 | 16.6%) make up the most common classes of employment.
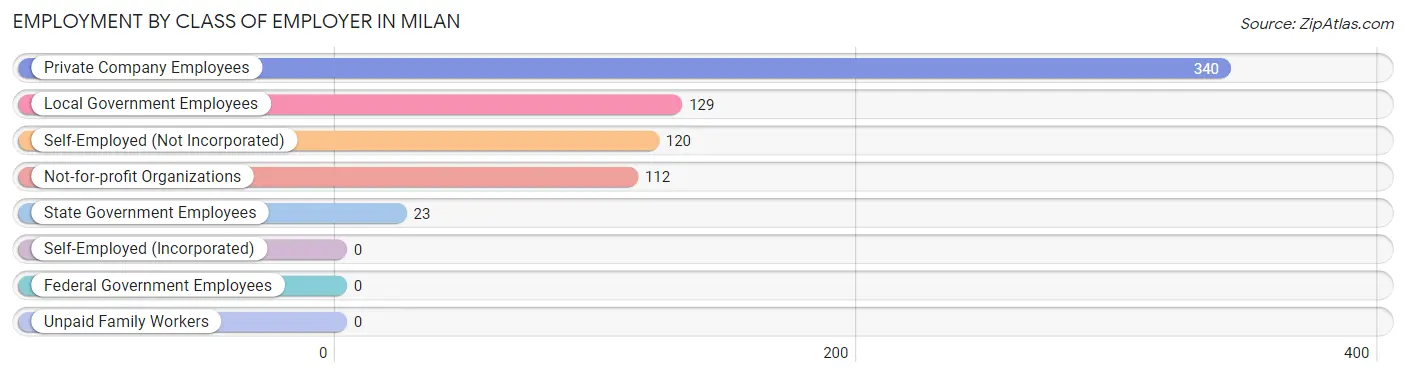
| Employer Class | # Employees | % Employees |
| Private Company Employees | 340 | 47.0% |
| Self-Employed (Incorporated) | 0 | 0.0% |
| Self-Employed (Not Incorporated) | 120 | 16.6% |
| Not-for-profit Organizations | 112 | 15.5% |
| Local Government Employees | 129 | 17.8% |
| State Government Employees | 23 | 3.2% |
| Federal Government Employees | 0 | 0.0% |
| Unpaid Family Workers | 0 | 0.0% |
| Total | 724 | 100.0% |
Employment Status by Age in Milan
According to the labor force statistics for Milan, out of the total population over 16 years of age (1,980), 44.2% or 875 individuals are in the labor force, with 17.4% or 152 of them unemployed. The age group with the highest labor force participation rate is 16 to 19 years, with 77.5% or 69 individuals in the labor force. Within the labor force, the 16 to 19 years age range has the highest percentage of unemployed individuals, with 100.0% or 69 of them being unemployed.
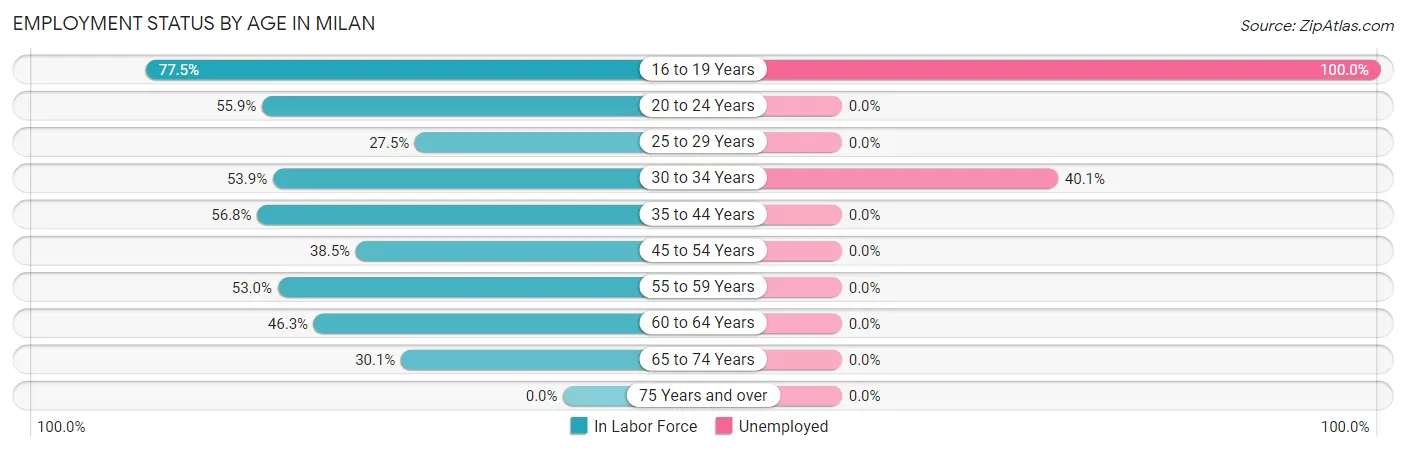
| Age Bracket | In Labor Force | Unemployed |
| 16 to 19 Years | 69 (77.5%) | 69 (100.0%) |
| 20 to 24 Years | 62 (55.9%) | 0 (0.0%) |
| 25 to 29 Years | 11 (27.5%) | 0 (0.0%) |
| 30 to 34 Years | 207 (53.9%) | 83 (40.1%) |
| 35 to 44 Years | 125 (56.8%) | 0 (0.0%) |
| 45 to 54 Years | 195 (38.5%) | 0 (0.0%) |
| 55 to 59 Years | 35 (53.0%) | 0 (0.0%) |
| 60 to 64 Years | 94 (46.3%) | 0 (0.0%) |
| 65 to 74 Years | 78 (30.1%) | 0 (0.0%) |
| 75 Years and over | 0 (0.0%) | 0 (0.0%) |
| Total | 875 (44.2%) | 152 (17.4%) |
Employment Status by Educational Attainment in Milan
According to labor force statistics for Milan, 47.0% of individuals (667) out of the total population between 25 and 64 years of age (1,419) are in the labor force, with 12.4% or 83 of them being unemployed. The group with the highest labor force participation rate are those with the educational attainment of college / associate degree, with 64.4% or 235 individuals in the labor force. Within the labor force, individuals with less than high school education have the highest percentage of unemployment, with 20.6% or 35 of them being unemployed.
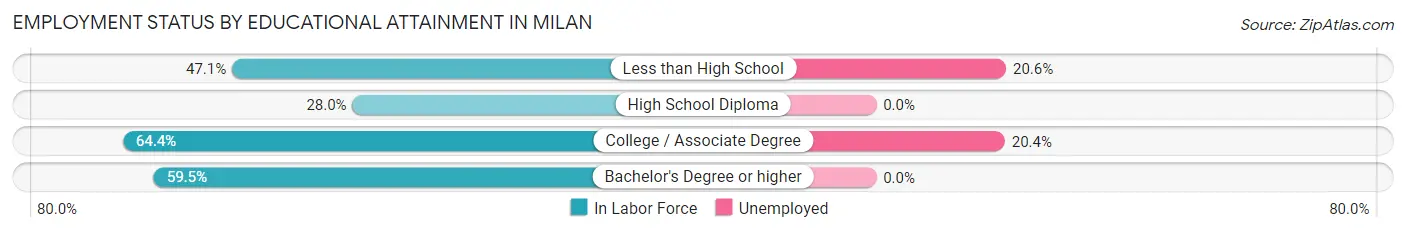
| Educational Attainment | In Labor Force | Unemployed |
| Less than High School | 170 (47.1%) | 74 (20.6%) |
| High School Diploma | 134 (28.0%) | 0 (0.0%) |
| College / Associate Degree | 235 (64.4%) | 74 (20.4%) |
| Bachelor's Degree or higher | 128 (59.5%) | 0 (0.0%) |
| Total | 667 (47.0%) | 176 (12.4%) |
Employment Occupations by Sex in Milan
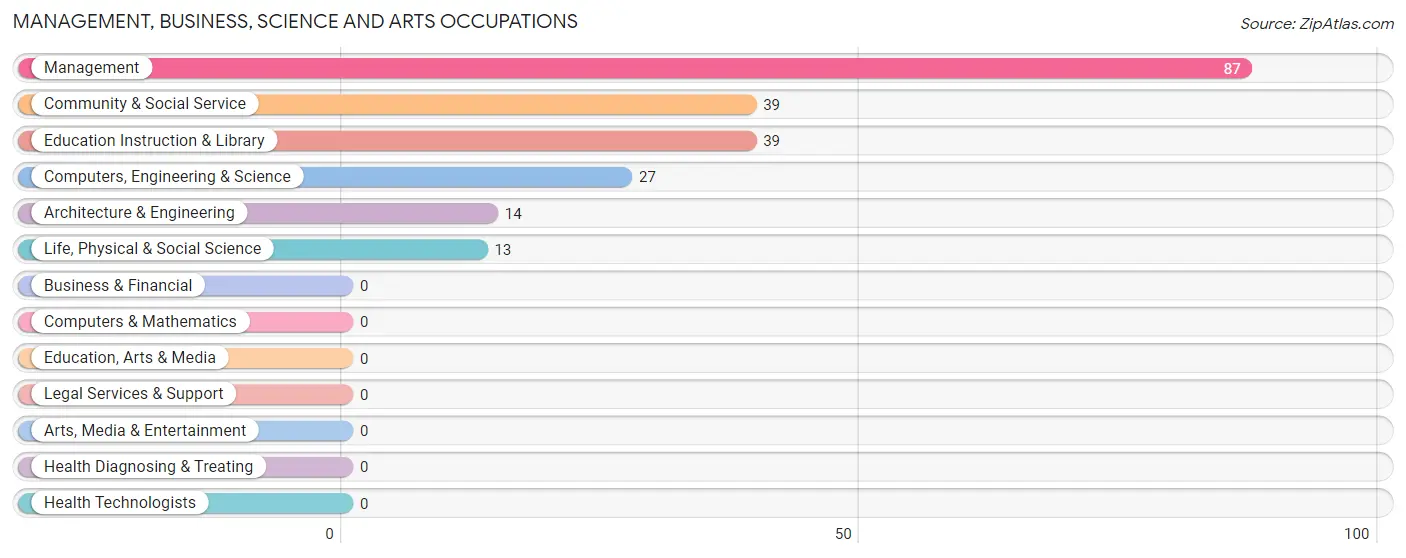
Management, Business, Science and Arts Occupations
The most common Management, Business, Science and Arts occupations in Milan are Management (87 | 12.0%), Community & Social Service (39 | 5.4%), Education Instruction & Library (39 | 5.4%), Computers, Engineering & Science (27 | 3.7%), and Architecture & Engineering (14 | 1.9%).
Management, Business, Science and Arts Occupations by Sex
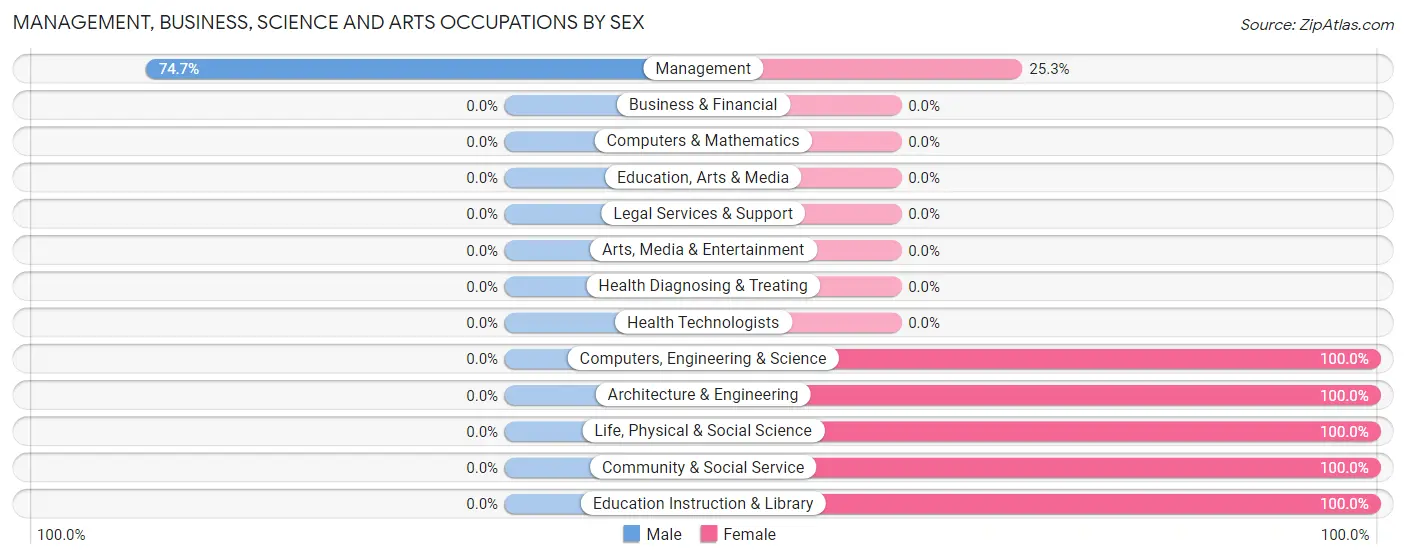
| Occupation | Male | Female |
| Management | 65 (74.7%) | 22 (25.3%) |
| Business & Financial | 0 (0.0%) | 0 (0.0%) |
| Computers, Engineering & Science | 0 (0.0%) | 27 (100.0%) |
| Computers & Mathematics | 0 (0.0%) | 0 (0.0%) |
| Architecture & Engineering | 0 (0.0%) | 14 (100.0%) |
| Life, Physical & Social Science | 0 (0.0%) | 13 (100.0%) |
| Community & Social Service | 0 (0.0%) | 39 (100.0%) |
| Education, Arts & Media | 0 (0.0%) | 0 (0.0%) |
| Legal Services & Support | 0 (0.0%) | 0 (0.0%) |
| Education Instruction & Library | 0 (0.0%) | 39 (100.0%) |
| Arts, Media & Entertainment | 0 (0.0%) | 0 (0.0%) |
| Health Diagnosing & Treating | 0 (0.0%) | 0 (0.0%) |
| Health Technologists | 0 (0.0%) | 0 (0.0%) |
| Total (Category) | 65 (42.5%) | 88 (57.5%) |
| Total (Overall) | 427 (59.0%) | 297 (41.0%) |
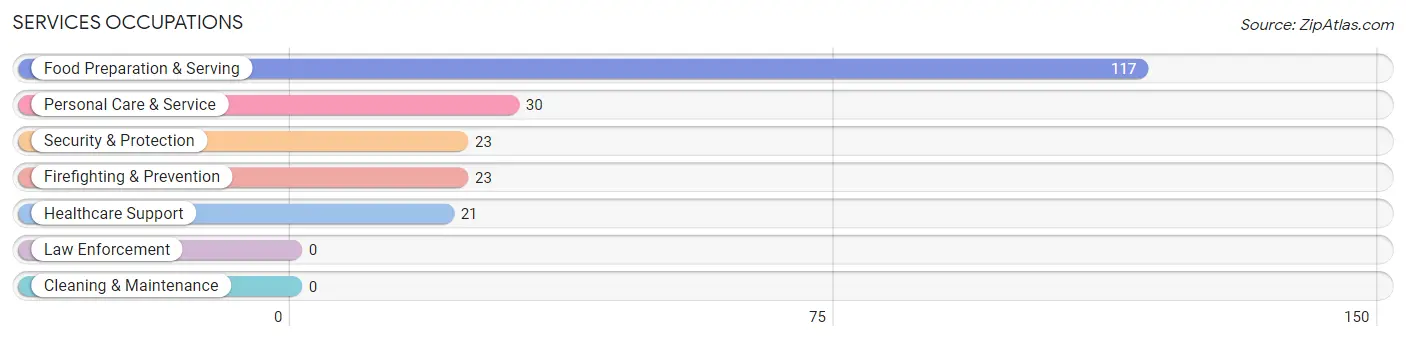
Services Occupations
The most common Services occupations in Milan are Food Preparation & Serving (117 | 16.2%), Personal Care & Service (30 | 4.1%), Security & Protection (23 | 3.2%), Firefighting & Prevention (23 | 3.2%), and Healthcare Support (21 | 2.9%).
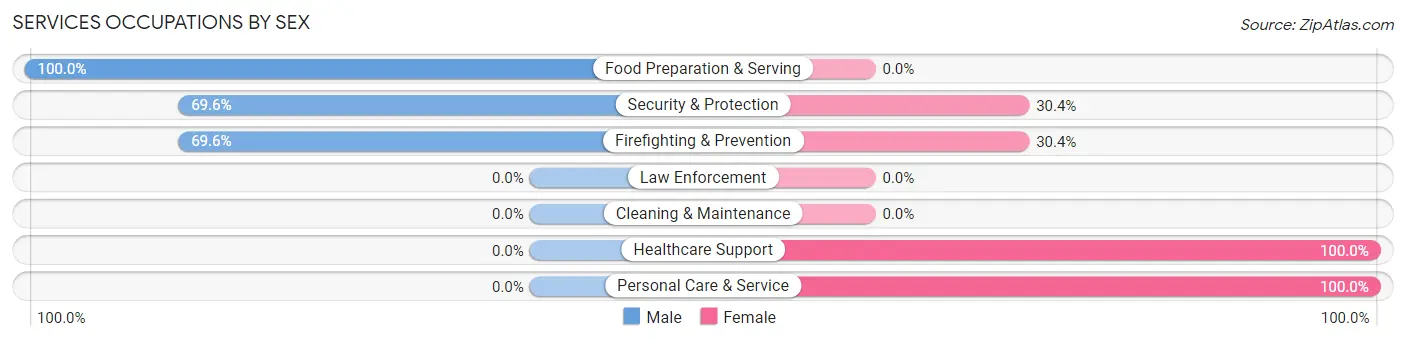
Services Occupations by Sex
Within the Services occupations in Milan, the most male-oriented occupations are Food Preparation & Serving (100.0%), Security & Protection (69.6%), and Firefighting & Prevention (69.6%), while the most female-oriented occupations are Healthcare Support (100.0%), Personal Care & Service (100.0%), and Security & Protection (30.4%).
| Occupation | Male | Female |
| Healthcare Support | 0 (0.0%) | 21 (100.0%) |
| Security & Protection | 16 (69.6%) | 7 (30.4%) |
| Firefighting & Prevention | 16 (69.6%) | 7 (30.4%) |
| Law Enforcement | 0 (0.0%) | 0 (0.0%) |
| Food Preparation & Serving | 117 (100.0%) | 0 (0.0%) |
| Cleaning & Maintenance | 0 (0.0%) | 0 (0.0%) |
| Personal Care & Service | 0 (0.0%) | 30 (100.0%) |
| Total (Category) | 133 (69.6%) | 58 (30.4%) |
| Total (Overall) | 427 (59.0%) | 297 (41.0%) |
Sales and Office Occupations
The most common Sales and Office occupations in Milan are Office & Administration (172 | 23.8%), and Sales & Related (101 | 14.0%).
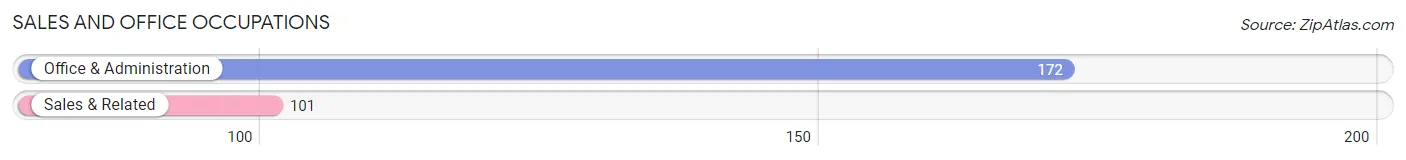
Sales and Office Occupations by Sex
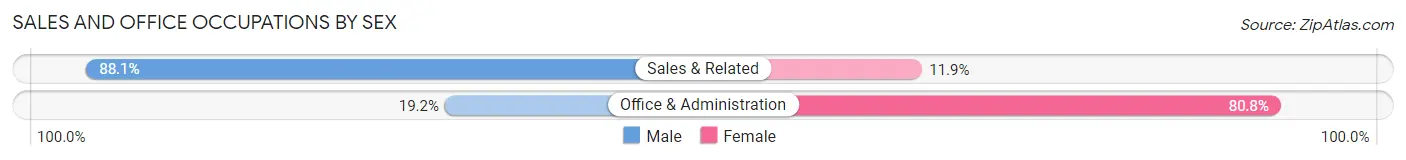
| Occupation | Male | Female |
| Sales & Related | 89 (88.1%) | 12 (11.9%) |
| Office & Administration | 33 (19.2%) | 139 (80.8%) |
| Total (Category) | 122 (44.7%) | 151 (55.3%) |
| Total (Overall) | 427 (59.0%) | 297 (41.0%) |
Natural Resources, Construction and Maintenance Occupations
The most common Natural Resources, Construction and Maintenance occupations in Milan are , and Installation, Maintenance & Repair (50 | 6.9%).
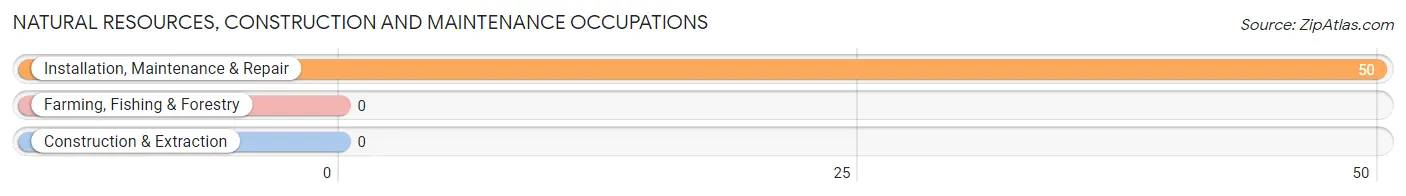
Natural Resources, Construction and Maintenance Occupations by Sex

| Occupation | Male | Female |
| Farming, Fishing & Forestry | 0 (0.0%) | 0 (0.0%) |
| Construction & Extraction | 0 (0.0%) | 0 (0.0%) |
| Installation, Maintenance & Repair | 50 (100.0%) | 0 (0.0%) |
| Total (Category) | 50 (100.0%) | 0 (0.0%) |
| Total (Overall) | 427 (59.0%) | 297 (41.0%) |
Production, Transportation and Moving Occupations
The most common Production, Transportation and Moving occupations in Milan are Production (33 | 4.6%), and Material Moving (24 | 3.3%).
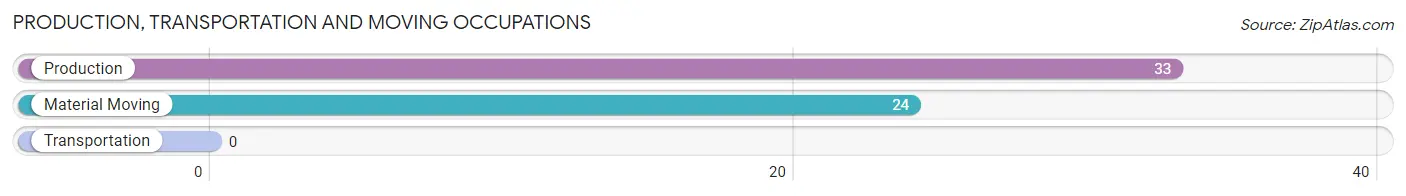
Production, Transportation and Moving Occupations by Sex
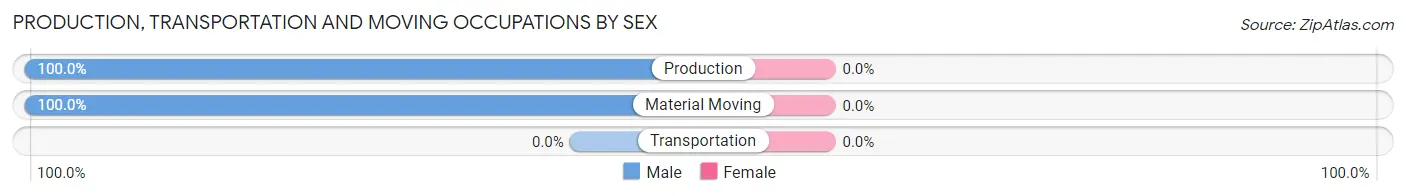
| Occupation | Male | Female |
| Production | 33 (100.0%) | 0 (0.0%) |
| Transportation | 0 (0.0%) | 0 (0.0%) |
| Material Moving | 24 (100.0%) | 0 (0.0%) |
| Total (Category) | 57 (100.0%) | 0 (0.0%) |
| Total (Overall) | 427 (59.0%) | 297 (41.0%) |
Employment Industries by Sex in Milan
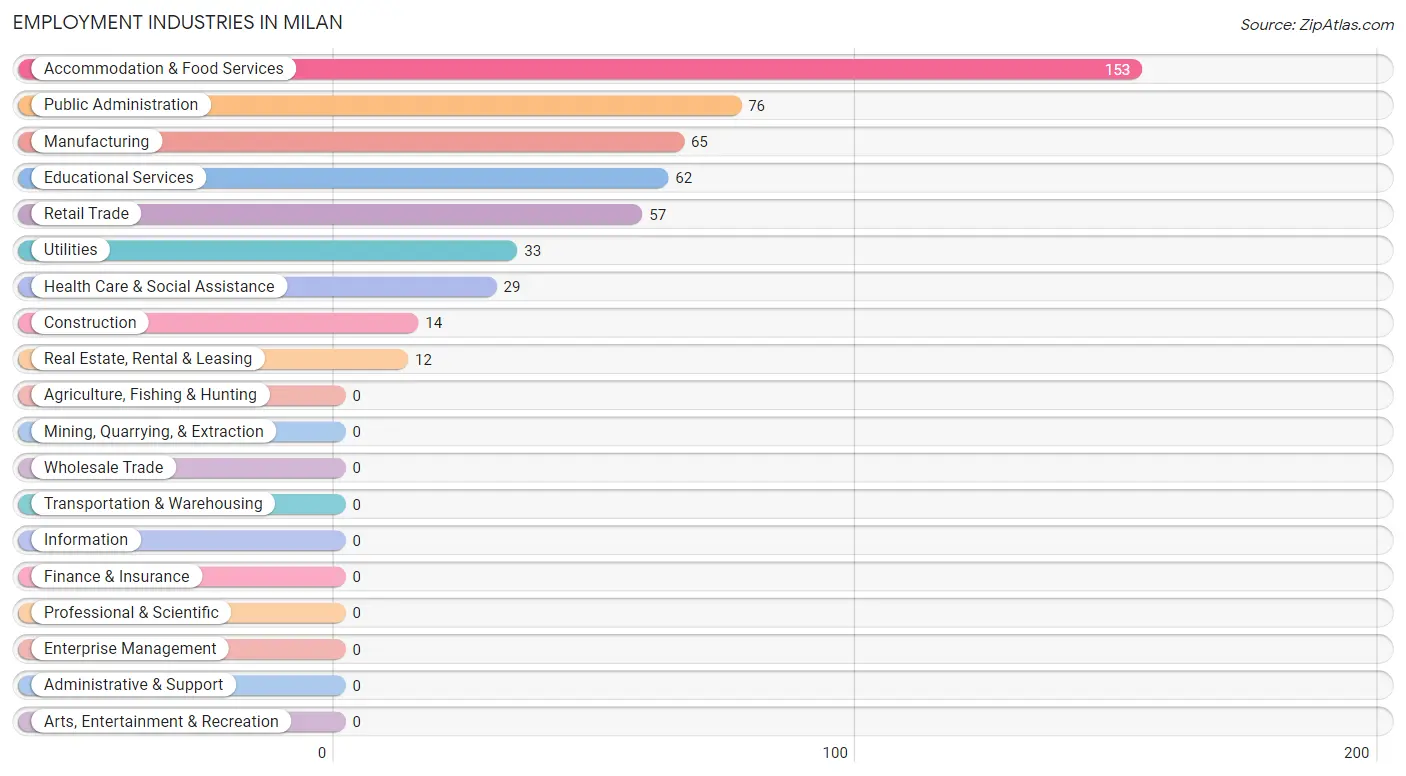
Employment Industries in Milan
The major employment industries in Milan include Accommodation & Food Services (153 | 21.1%), Public Administration (76 | 10.5%), Manufacturing (65 | 9.0%), Educational Services (62 | 8.6%), and Retail Trade (57 | 7.9%).
Employment Industries by Sex in Milan
The Milan industries that see more men than women are Construction (100.0%), Manufacturing (100.0%), and Retail Trade (87.7%), whereas the industries that tend to have a higher number of women are Real Estate, Rental & Leasing (100.0%), Educational Services (100.0%), and Health Care & Social Assistance (100.0%).
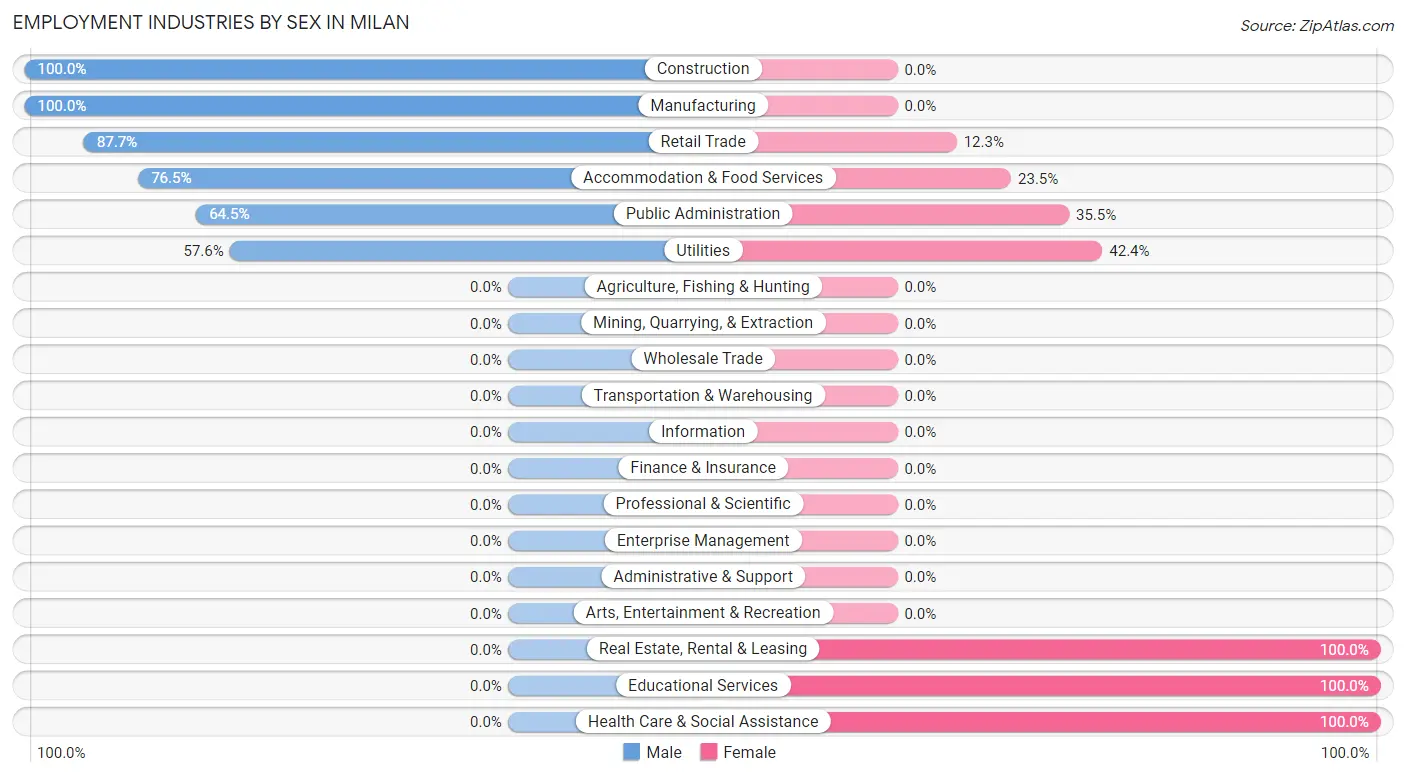
| Industry | Male | Female |
| Agriculture, Fishing & Hunting | 0 (0.0%) | 0 (0.0%) |
| Mining, Quarrying, & Extraction | 0 (0.0%) | 0 (0.0%) |
| Construction | 14 (100.0%) | 0 (0.0%) |
| Manufacturing | 65 (100.0%) | 0 (0.0%) |
| Wholesale Trade | 0 (0.0%) | 0 (0.0%) |
| Retail Trade | 50 (87.7%) | 7 (12.3%) |
| Transportation & Warehousing | 0 (0.0%) | 0 (0.0%) |
| Utilities | 19 (57.6%) | 14 (42.4%) |
| Information | 0 (0.0%) | 0 (0.0%) |
| Finance & Insurance | 0 (0.0%) | 0 (0.0%) |
| Real Estate, Rental & Leasing | 0 (0.0%) | 12 (100.0%) |
| Professional & Scientific | 0 (0.0%) | 0 (0.0%) |
| Enterprise Management | 0 (0.0%) | 0 (0.0%) |
| Administrative & Support | 0 (0.0%) | 0 (0.0%) |
| Educational Services | 0 (0.0%) | 62 (100.0%) |
| Health Care & Social Assistance | 0 (0.0%) | 29 (100.0%) |
| Arts, Entertainment & Recreation | 0 (0.0%) | 0 (0.0%) |
| Accommodation & Food Services | 117 (76.5%) | 36 (23.5%) |
| Public Administration | 49 (64.5%) | 27 (35.5%) |
| Total | 427 (59.0%) | 297 (41.0%) |
Education in Milan
School Enrollment in Milan
The most common levels of schooling among the 420 students in Milan are middle school (166 | 39.5%), elementary school (125 | 29.8%), and high school (73 | 17.4%).
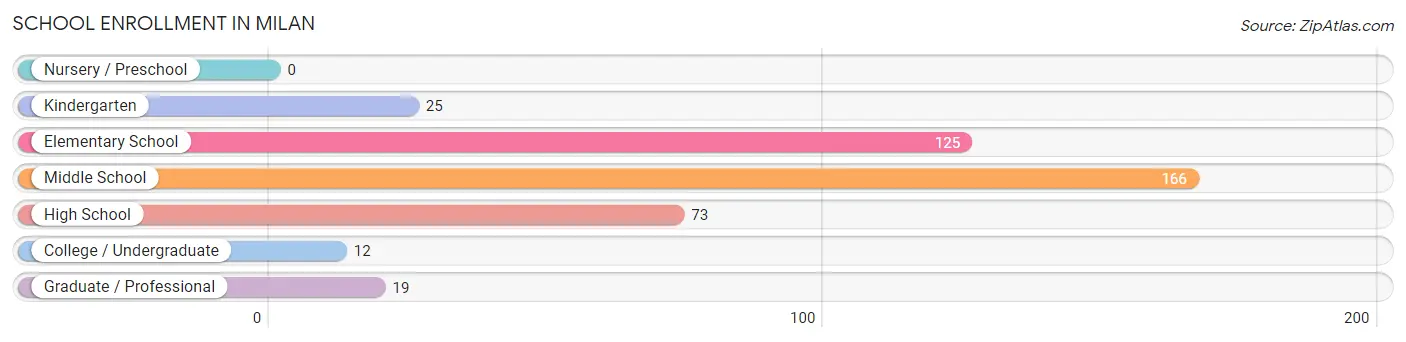
| School Level | # Students | % Students |
| Nursery / Preschool | 0 | 0.0% |
| Kindergarten | 25 | 5.9% |
| Elementary School | 125 | 29.8% |
| Middle School | 166 | 39.5% |
| High School | 73 | 17.4% |
| College / Undergraduate | 12 | 2.9% |
| Graduate / Professional | 19 | 4.5% |
| Total | 420 | 100.0% |
School Enrollment by Age by Funding Source in Milan
Out of a total of 420 students who are enrolled in schools in Milan, 12 (2.9%) attend a private institution, while the remaining 408 (97.1%) are enrolled in public schools. The age group of 35 years and over has the highest likelihood of being enrolled in private schools, with 12 (38.7% in the age bracket) enrolled. Conversely, the age group of 5 to 9 year old has the lowest likelihood of being enrolled in a private school, with 98 (100.0% in the age bracket) attending a public institution.
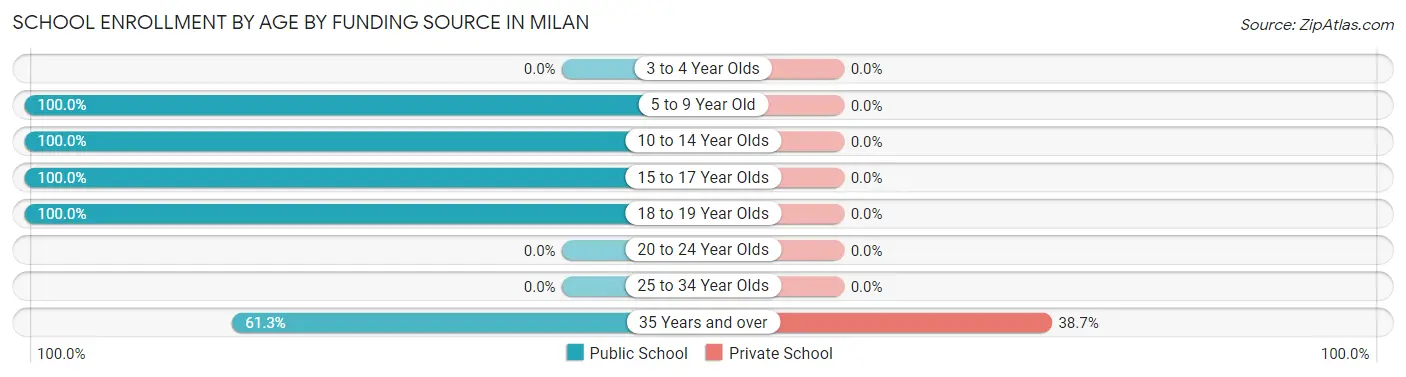
| Age Bracket | Public School | Private School |
| 3 to 4 Year Olds | 0 (0.0%) | 0 (0.0%) |
| 5 to 9 Year Old | 98 (100.0%) | 0 (0.0%) |
| 10 to 14 Year Olds | 218 (100.0%) | 0 (0.0%) |
| 15 to 17 Year Olds | 62 (100.0%) | 0 (0.0%) |
| 18 to 19 Year Olds | 11 (100.0%) | 0 (0.0%) |
| 20 to 24 Year Olds | 0 (0.0%) | 0 (0.0%) |
| 25 to 34 Year Olds | 0 (0.0%) | 0 (0.0%) |
| 35 Years and over | 19 (61.3%) | 12 (38.7%) |
| Total | 408 (97.1%) | 12 (2.9%) |
Educational Attainment by Field of Study in Milan
Arts & humanities (90 | 27.5%), business (86 | 26.3%), science & technology (66 | 20.2%), education (39 | 11.9%), and social sciences (16 | 4.9%) are the most common fields of study among 327 individuals in Milan who have obtained a bachelor's degree or higher.
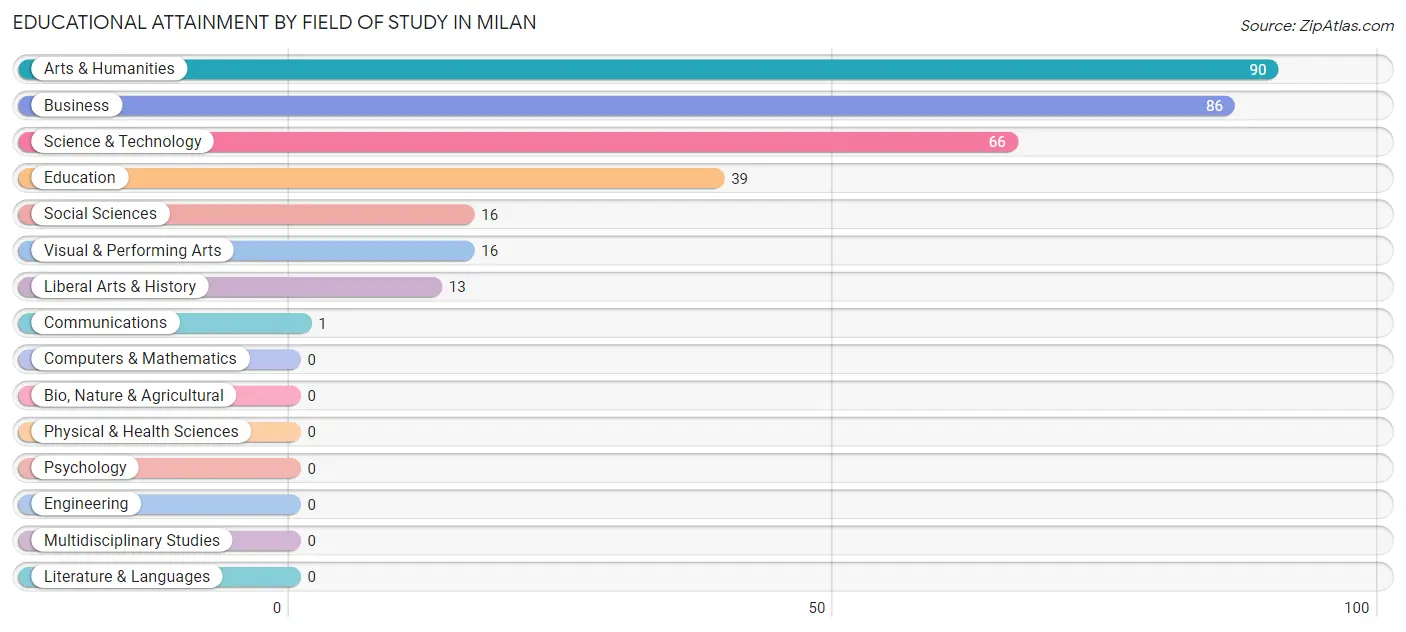
| Field of Study | # Graduates | % Graduates |
| Computers & Mathematics | 0 | 0.0% |
| Bio, Nature & Agricultural | 0 | 0.0% |
| Physical & Health Sciences | 0 | 0.0% |
| Psychology | 0 | 0.0% |
| Social Sciences | 16 | 4.9% |
| Engineering | 0 | 0.0% |
| Multidisciplinary Studies | 0 | 0.0% |
| Science & Technology | 66 | 20.2% |
| Business | 86 | 26.3% |
| Education | 39 | 11.9% |
| Literature & Languages | 0 | 0.0% |
| Liberal Arts & History | 13 | 4.0% |
| Visual & Performing Arts | 16 | 4.9% |
| Communications | 1 | 0.3% |
| Arts & Humanities | 90 | 27.5% |
| Total | 327 | 100.0% |
Transportation & Commute in Milan
Vehicle Availability by Sex in Milan
The most prevalent vehicle ownership categories in Milan are males with 3 vehicles (269, accounting for 63.0%) and females with 3 vehicles (79, making up 90.6%).
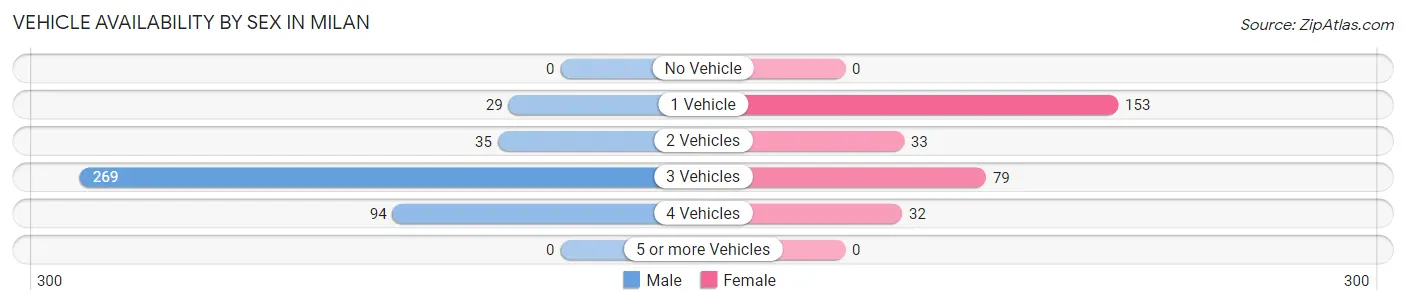
| Vehicles Available | Male | Female |
| No Vehicle | 0 (0.0%) | 0 (0.0%) |
| 1 Vehicle | 29 (6.8%) | 153 (51.5%) |
| 2 Vehicles | 35 (8.2%) | 33 (11.1%) |
| 3 Vehicles | 269 (63.0%) | 79 (26.6%) |
| 4 Vehicles | 94 (22.0%) | 32 (10.8%) |
| 5 or more Vehicles | 0 (0.0%) | 0 (0.0%) |
| Total | 427 (100.0%) | 297 (100.0%) |
Commute Time in Milan
The most frequently occuring commute durations in Milan are 5 to 9 minutes (161 commuters, 22.5%), less than 5 minutes (150 commuters, 20.9%), and 15 to 19 minutes (149 commuters, 20.8%).
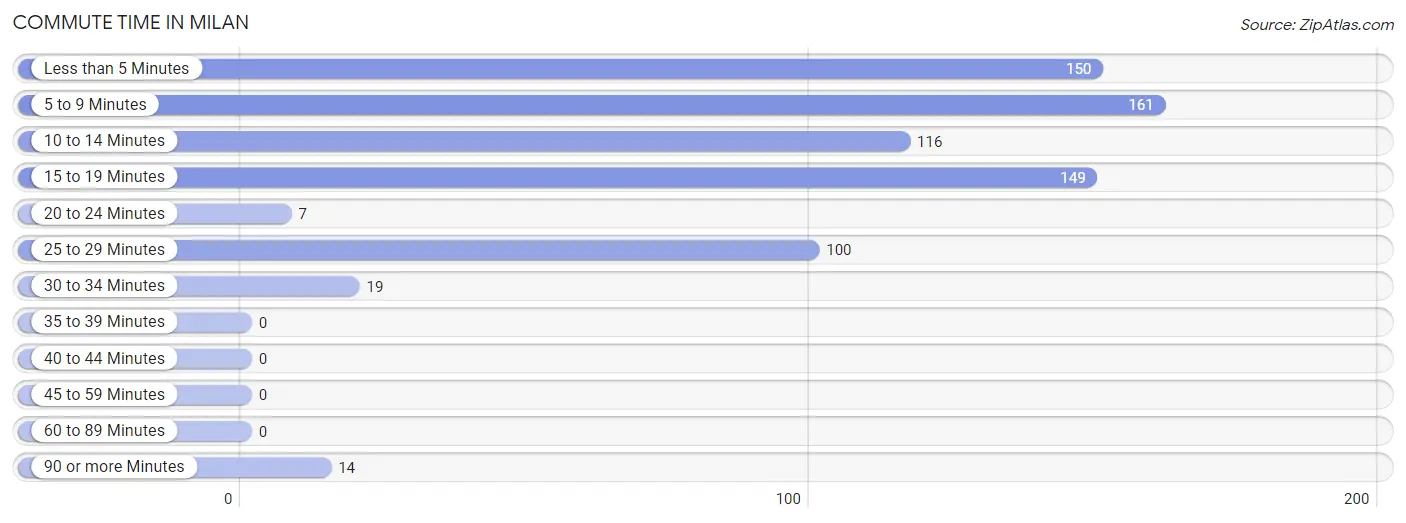
| Commute Time | # Commuters | % Commuters |
| Less than 5 Minutes | 150 | 20.9% |
| 5 to 9 Minutes | 161 | 22.5% |
| 10 to 14 Minutes | 116 | 16.2% |
| 15 to 19 Minutes | 149 | 20.8% |
| 20 to 24 Minutes | 7 | 1.0% |
| 25 to 29 Minutes | 100 | 14.0% |
| 30 to 34 Minutes | 19 | 2.6% |
| 35 to 39 Minutes | 0 | 0.0% |
| 40 to 44 Minutes | 0 | 0.0% |
| 45 to 59 Minutes | 0 | 0.0% |
| 60 to 89 Minutes | 0 | 0.0% |
| 90 or more Minutes | 14 | 2.0% |
Commute Time by Sex in Milan
The most common commute times in Milan are 5 to 9 minutes (147 commuters, 34.4%) for males and 15 to 19 minutes (116 commuters, 40.1%) for females.
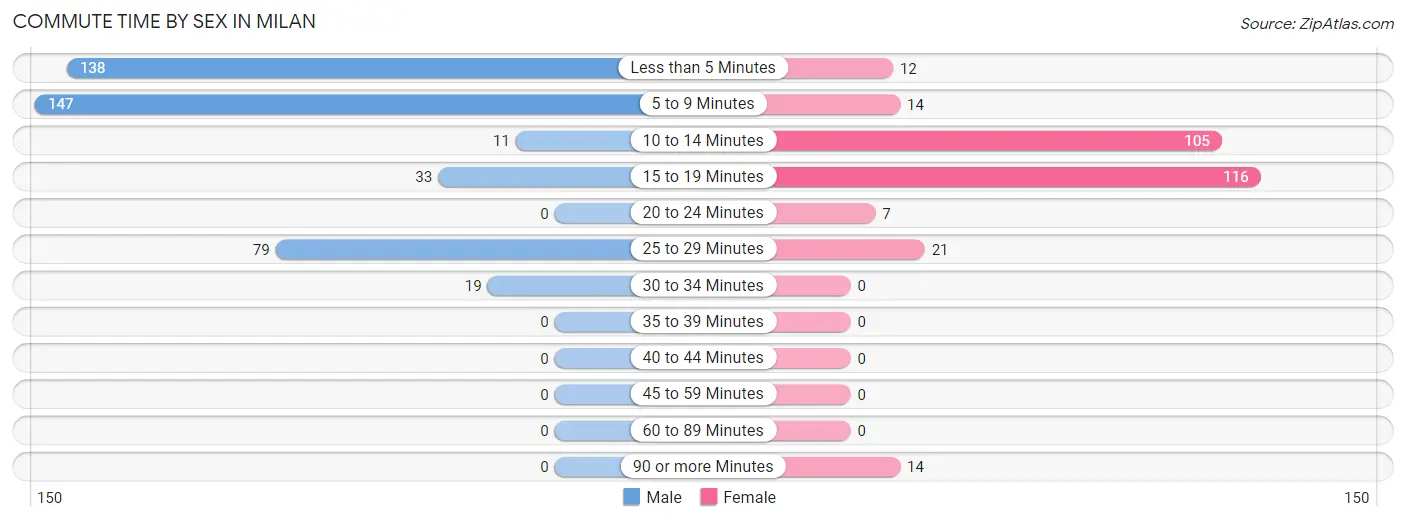
| Commute Time | Male | Female |
| Less than 5 Minutes | 138 (32.3%) | 12 (4.2%) |
| 5 to 9 Minutes | 147 (34.4%) | 14 (4.8%) |
| 10 to 14 Minutes | 11 (2.6%) | 105 (36.3%) |
| 15 to 19 Minutes | 33 (7.7%) | 116 (40.1%) |
| 20 to 24 Minutes | 0 (0.0%) | 7 (2.4%) |
| 25 to 29 Minutes | 79 (18.5%) | 21 (7.3%) |
| 30 to 34 Minutes | 19 (4.4%) | 0 (0.0%) |
| 35 to 39 Minutes | 0 (0.0%) | 0 (0.0%) |
| 40 to 44 Minutes | 0 (0.0%) | 0 (0.0%) |
| 45 to 59 Minutes | 0 (0.0%) | 0 (0.0%) |
| 60 to 89 Minutes | 0 (0.0%) | 0 (0.0%) |
| 90 or more Minutes | 0 (0.0%) | 14 (4.8%) |
Time of Departure to Work by Sex in Milan
The most frequent times of departure to work in Milan are 12:00 PM to 3:59 PM (128, 30.0%) for males and 7:00 AM to 7:29 AM (95, 32.9%) for females.
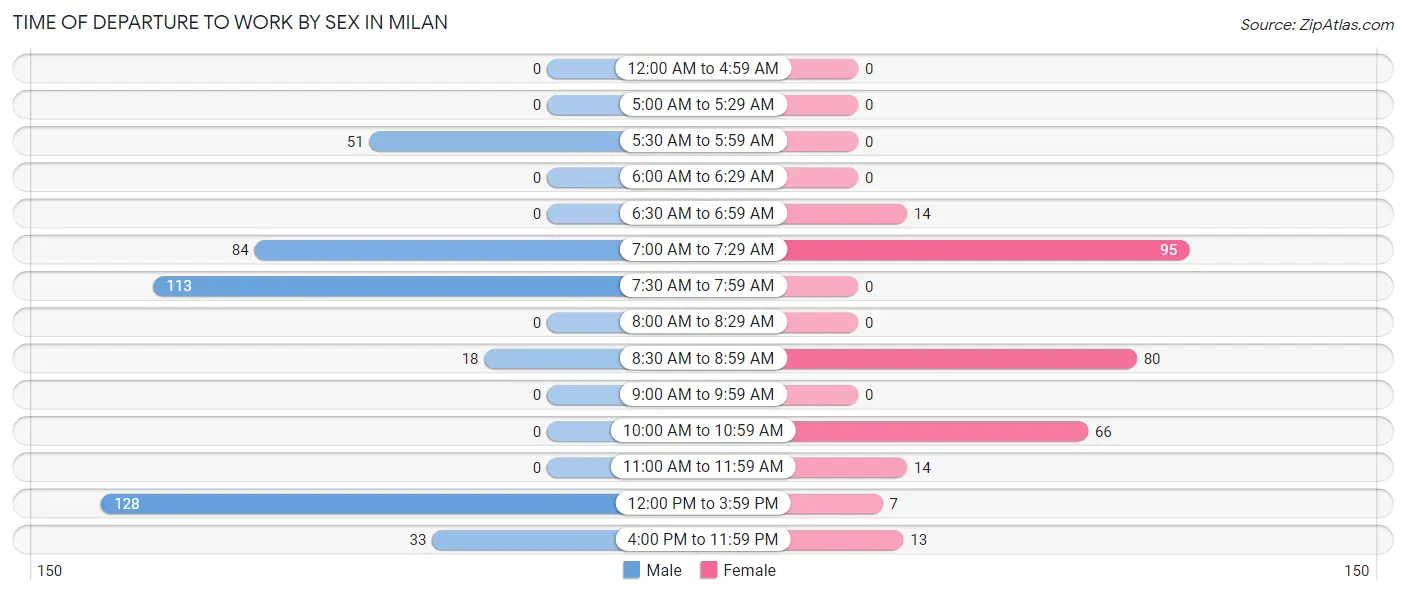
| Time of Departure | Male | Female |
| 12:00 AM to 4:59 AM | 0 (0.0%) | 0 (0.0%) |
| 5:00 AM to 5:29 AM | 0 (0.0%) | 0 (0.0%) |
| 5:30 AM to 5:59 AM | 51 (11.9%) | 0 (0.0%) |
| 6:00 AM to 6:29 AM | 0 (0.0%) | 0 (0.0%) |
| 6:30 AM to 6:59 AM | 0 (0.0%) | 14 (4.8%) |
| 7:00 AM to 7:29 AM | 84 (19.7%) | 95 (32.9%) |
| 7:30 AM to 7:59 AM | 113 (26.5%) | 0 (0.0%) |
| 8:00 AM to 8:29 AM | 0 (0.0%) | 0 (0.0%) |
| 8:30 AM to 8:59 AM | 18 (4.2%) | 80 (27.7%) |
| 9:00 AM to 9:59 AM | 0 (0.0%) | 0 (0.0%) |
| 10:00 AM to 10:59 AM | 0 (0.0%) | 66 (22.8%) |
| 11:00 AM to 11:59 AM | 0 (0.0%) | 14 (4.8%) |
| 12:00 PM to 3:59 PM | 128 (30.0%) | 7 (2.4%) |
| 4:00 PM to 11:59 PM | 33 (7.7%) | 13 (4.5%) |
| Total | 427 (100.0%) | 289 (100.0%) |
Housing Occupancy in Milan
Occupancy by Ownership in Milan
Of the total 848 dwellings in Milan, owner-occupied units account for 489 (57.7%), while renter-occupied units make up 359 (42.3%).
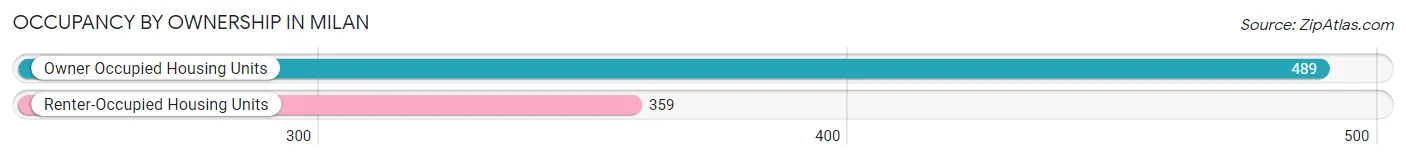
| Occupancy | # Housing Units | % Housing Units |
| Owner Occupied Housing Units | 489 | 57.7% |
| Renter-Occupied Housing Units | 359 | 42.3% |
| Total Occupied Housing Units | 848 | 100.0% |
Occupancy by Household Size in Milan
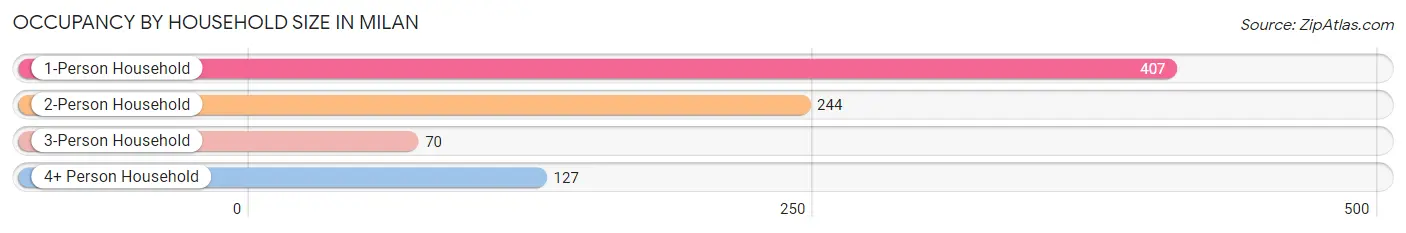
| Household Size | # Housing Units | % Housing Units |
| 1-Person Household | 407 | 48.0% |
| 2-Person Household | 244 | 28.8% |
| 3-Person Household | 70 | 8.3% |
| 4+ Person Household | 127 | 15.0% |
| Total Housing Units | 848 | 100.0% |
Occupancy by Ownership by Household Size in Milan
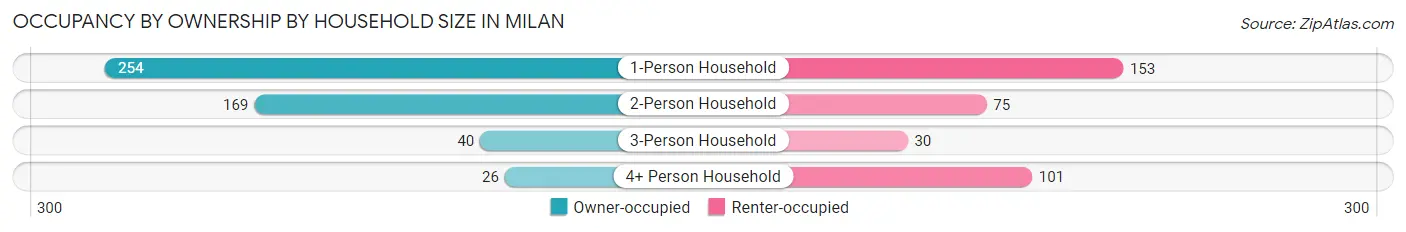
| Household Size | Owner-occupied | Renter-occupied |
| 1-Person Household | 254 (62.4%) | 153 (37.6%) |
| 2-Person Household | 169 (69.3%) | 75 (30.7%) |
| 3-Person Household | 40 (57.1%) | 30 (42.9%) |
| 4+ Person Household | 26 (20.5%) | 101 (79.5%) |
| Total Housing Units | 489 (57.7%) | 359 (42.3%) |
Occupancy by Educational Attainment in Milan
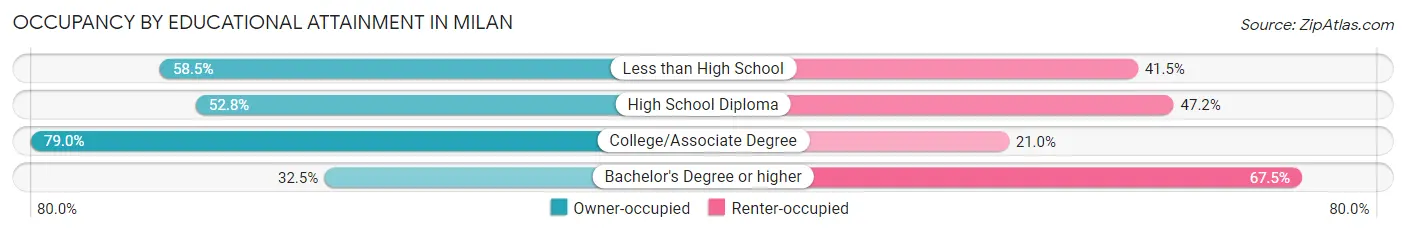
| Household Size | Owner-occupied | Renter-occupied |
| Less than High School | 79 (58.5%) | 56 (41.5%) |
| High School Diploma | 159 (52.8%) | 142 (47.2%) |
| College/Associate Degree | 199 (79.0%) | 53 (21.0%) |
| Bachelor's Degree or higher | 52 (32.5%) | 108 (67.5%) |
Occupancy by Age of Householder in Milan
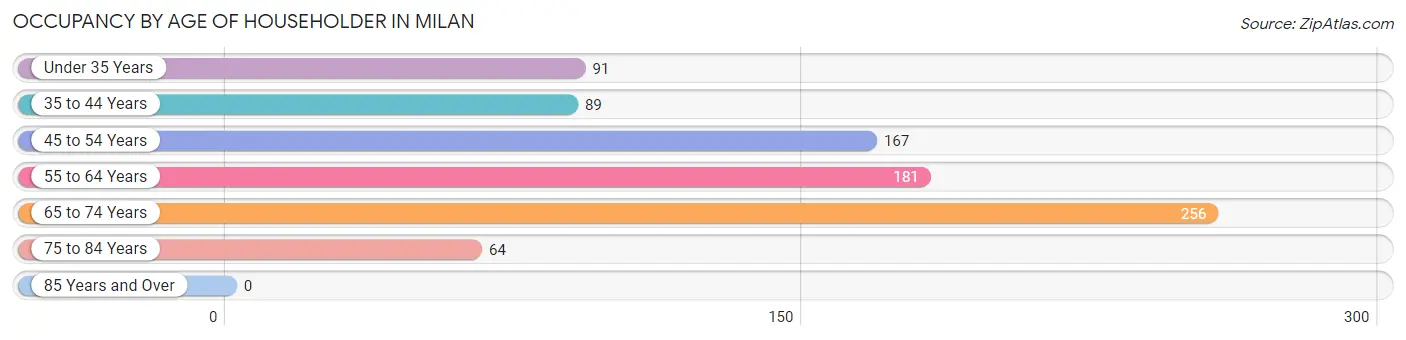
| Age Bracket | # Households | % Households |
| Under 35 Years | 91 | 10.7% |
| 35 to 44 Years | 89 | 10.5% |
| 45 to 54 Years | 167 | 19.7% |
| 55 to 64 Years | 181 | 21.3% |
| 65 to 74 Years | 256 | 30.2% |
| 75 to 84 Years | 64 | 7.5% |
| 85 Years and Over | 0 | 0.0% |
| Total | 848 | 100.0% |
Housing Finances in Milan
Median Income by Occupancy in Milan
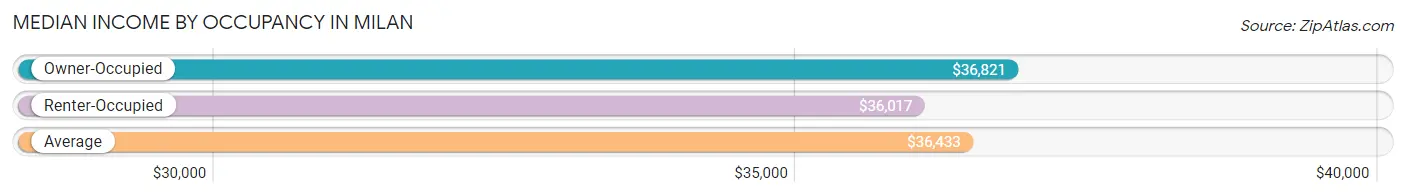
| Occupancy Type | # Households | Median Income |
| Owner-Occupied | 489 (57.7%) | $36,821 |
| Renter-Occupied | 359 (42.3%) | $36,017 |
| Average | 848 (100.0%) | $36,433 |
Occupancy by Householder Income Bracket in Milan
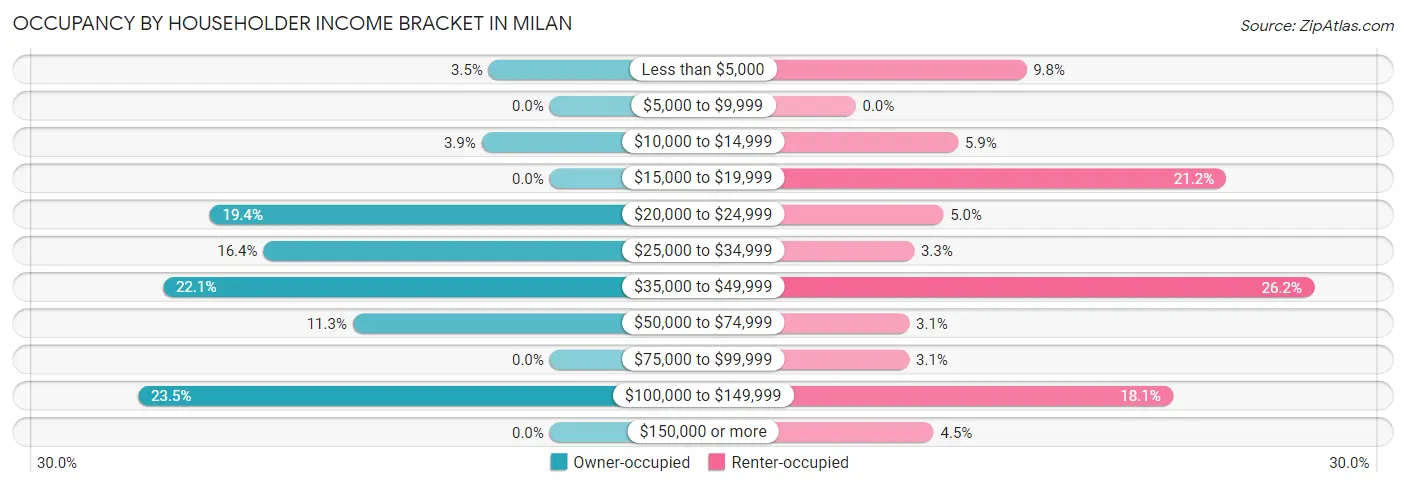
| Income Bracket | Owner-occupied | Renter-occupied |
| Less than $5,000 | 17 (3.5%) | 35 (9.8%) |
| $5,000 to $9,999 | 0 (0.0%) | 0 (0.0%) |
| $10,000 to $14,999 | 19 (3.9%) | 21 (5.9%) |
| $15,000 to $19,999 | 0 (0.0%) | 76 (21.2%) |
| $20,000 to $24,999 | 95 (19.4%) | 18 (5.0%) |
| $25,000 to $34,999 | 80 (16.4%) | 12 (3.3%) |
| $35,000 to $49,999 | 108 (22.1%) | 94 (26.2%) |
| $50,000 to $74,999 | 55 (11.3%) | 11 (3.1%) |
| $75,000 to $99,999 | 0 (0.0%) | 11 (3.1%) |
| $100,000 to $149,999 | 115 (23.5%) | 65 (18.1%) |
| $150,000 or more | 0 (0.0%) | 16 (4.5%) |
| Total | 489 (100.0%) | 359 (100.0%) |
Monthly Housing Cost Tiers in Milan
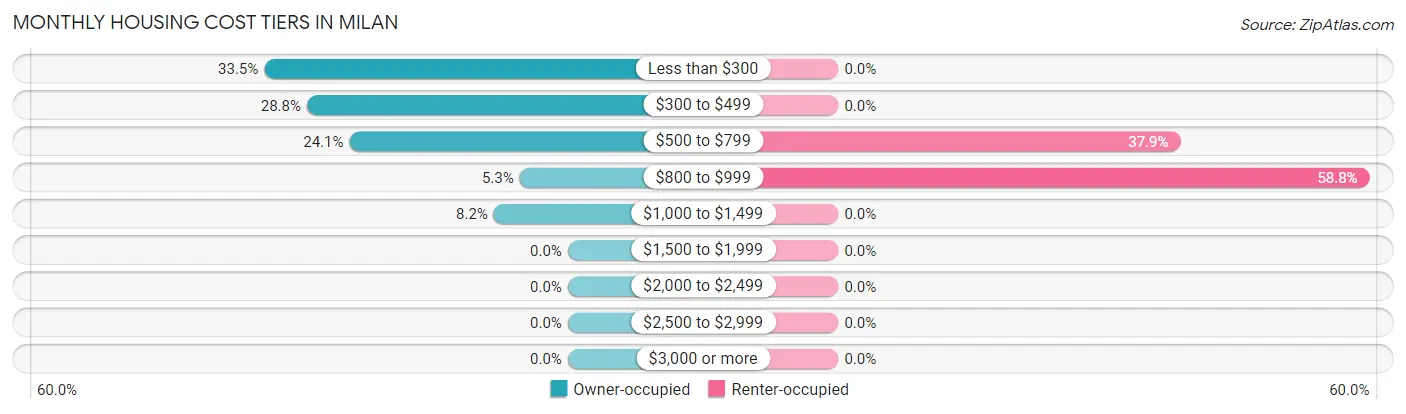
| Monthly Cost | Owner-occupied | Renter-occupied |
| Less than $300 | 164 (33.5%) | 0 (0.0%) |
| $300 to $499 | 141 (28.8%) | 0 (0.0%) |
| $500 to $799 | 118 (24.1%) | 136 (37.9%) |
| $800 to $999 | 26 (5.3%) | 211 (58.8%) |
| $1,000 to $1,499 | 40 (8.2%) | 0 (0.0%) |
| $1,500 to $1,999 | 0 (0.0%) | 0 (0.0%) |
| $2,000 to $2,499 | 0 (0.0%) | 0 (0.0%) |
| $2,500 to $2,999 | 0 (0.0%) | 0 (0.0%) |
| $3,000 or more | 0 (0.0%) | 0 (0.0%) |
| Total | 489 (100.0%) | 359 (100.0%) |
Physical Housing Characteristics in Milan
Housing Structures in Milan
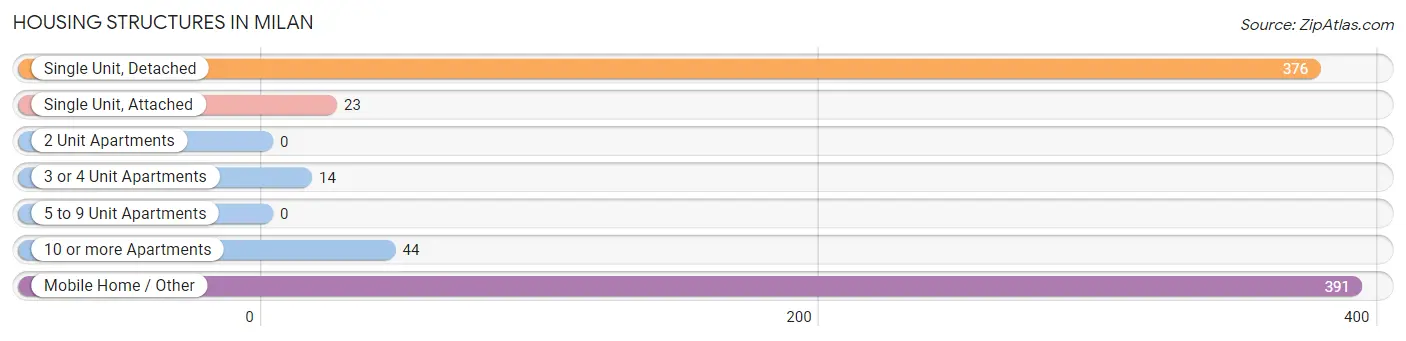
| Structure Type | # Housing Units | % Housing Units |
| Single Unit, Detached | 376 | 44.3% |
| Single Unit, Attached | 23 | 2.7% |
| 2 Unit Apartments | 0 | 0.0% |
| 3 or 4 Unit Apartments | 14 | 1.7% |
| 5 to 9 Unit Apartments | 0 | 0.0% |
| 10 or more Apartments | 44 | 5.2% |
| Mobile Home / Other | 391 | 46.1% |
| Total | 848 | 100.0% |
Housing Structures by Occupancy in Milan
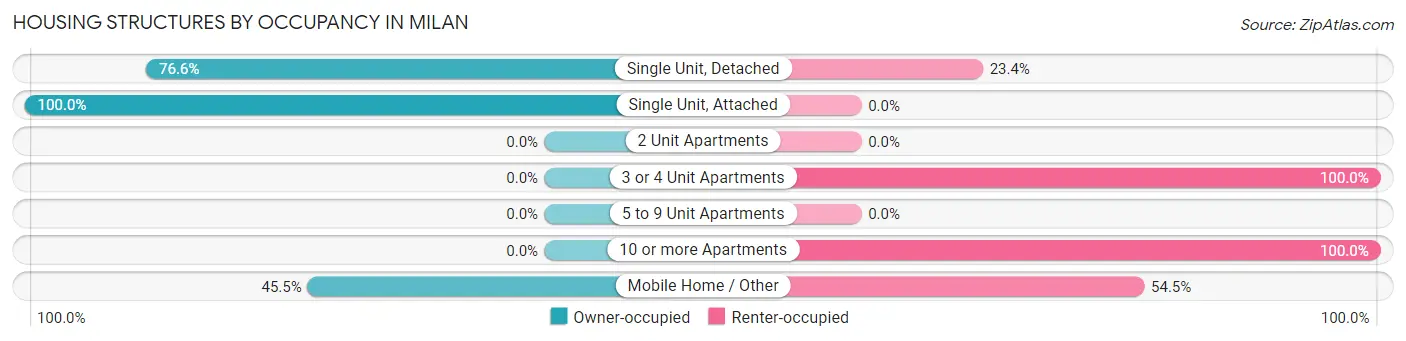
| Structure Type | Owner-occupied | Renter-occupied |
| Single Unit, Detached | 288 (76.6%) | 88 (23.4%) |
| Single Unit, Attached | 23 (100.0%) | 0 (0.0%) |
| 2 Unit Apartments | 0 (0.0%) | 0 (0.0%) |
| 3 or 4 Unit Apartments | 0 (0.0%) | 14 (100.0%) |
| 5 to 9 Unit Apartments | 0 (0.0%) | 0 (0.0%) |
| 10 or more Apartments | 0 (0.0%) | 44 (100.0%) |
| Mobile Home / Other | 178 (45.5%) | 213 (54.5%) |
| Total | 489 (57.7%) | 359 (42.3%) |
Housing Structures by Number of Rooms in Milan
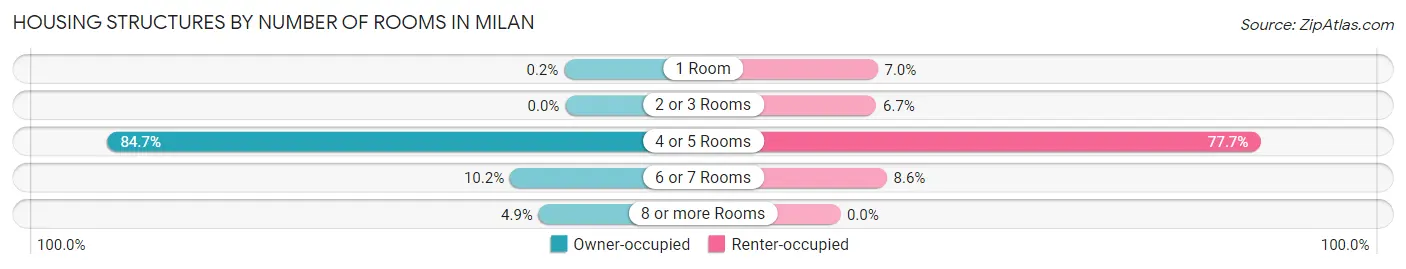
| Number of Rooms | Owner-occupied | Renter-occupied |
| 1 Room | 1 (0.2%) | 25 (7.0%) |
| 2 or 3 Rooms | 0 (0.0%) | 24 (6.7%) |
| 4 or 5 Rooms | 414 (84.7%) | 279 (77.7%) |
| 6 or 7 Rooms | 50 (10.2%) | 31 (8.6%) |
| 8 or more Rooms | 24 (4.9%) | 0 (0.0%) |
| Total | 489 (100.0%) | 359 (100.0%) |
Housing Structure by Heating Type in Milan
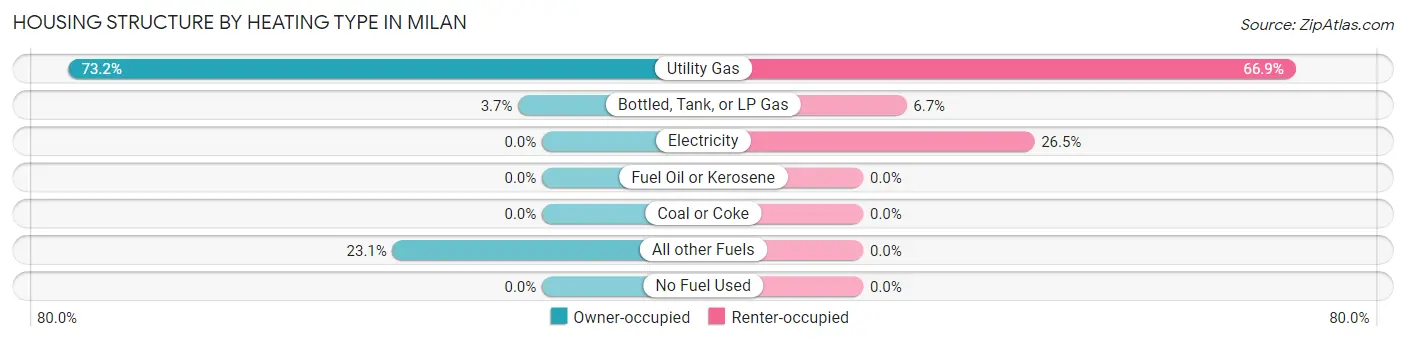
| Heating Type | Owner-occupied | Renter-occupied |
| Utility Gas | 358 (73.2%) | 240 (66.8%) |
| Bottled, Tank, or LP Gas | 18 (3.7%) | 24 (6.7%) |
| Electricity | 0 (0.0%) | 95 (26.5%) |
| Fuel Oil or Kerosene | 0 (0.0%) | 0 (0.0%) |
| Coal or Coke | 0 (0.0%) | 0 (0.0%) |
| All other Fuels | 113 (23.1%) | 0 (0.0%) |
| No Fuel Used | 0 (0.0%) | 0 (0.0%) |
| Total | 489 (100.0%) | 359 (100.0%) |
Household Vehicle Usage in Milan
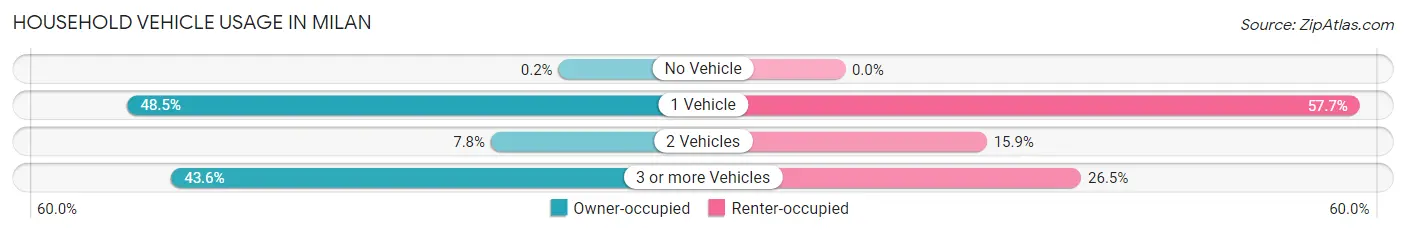
| Vehicles per Household | Owner-occupied | Renter-occupied |
| No Vehicle | 1 (0.2%) | 0 (0.0%) |
| 1 Vehicle | 237 (48.5%) | 207 (57.7%) |
| 2 Vehicles | 38 (7.8%) | 57 (15.9%) |
| 3 or more Vehicles | 213 (43.6%) | 95 (26.5%) |
| Total | 489 (100.0%) | 359 (100.0%) |
Real Estate & Mortgages in Milan
Real Estate and Mortgage Overview in Milan
| Characteristic | Without Mortgage | With Mortgage |
| Housing Units | 322 | 167 |
| Median Property Value | - | - |
| Median Household Income | $26,500 | $0 |
| Monthly Housing Costs | $293 | $0 |
| Real Estate Taxes | $631 | $0 |
Property Value by Mortgage Status in Milan
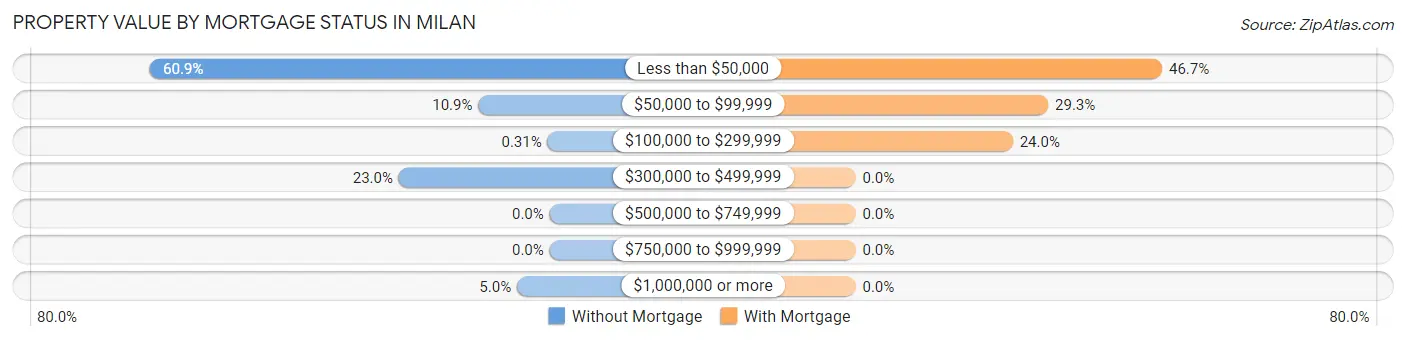
| Property Value | Without Mortgage | With Mortgage |
| Less than $50,000 | 196 (60.9%) | 78 (46.7%) |
| $50,000 to $99,999 | 35 (10.9%) | 49 (29.3%) |
| $100,000 to $299,999 | 1 (0.3%) | 40 (23.9%) |
| $300,000 to $499,999 | 74 (23.0%) | 0 (0.0%) |
| $500,000 to $749,999 | 0 (0.0%) | 0 (0.0%) |
| $750,000 to $999,999 | 0 (0.0%) | 0 (0.0%) |
| $1,000,000 or more | 16 (5.0%) | 0 (0.0%) |
| Total | 322 (100.0%) | 167 (100.0%) |
Household Income by Mortgage Status in Milan
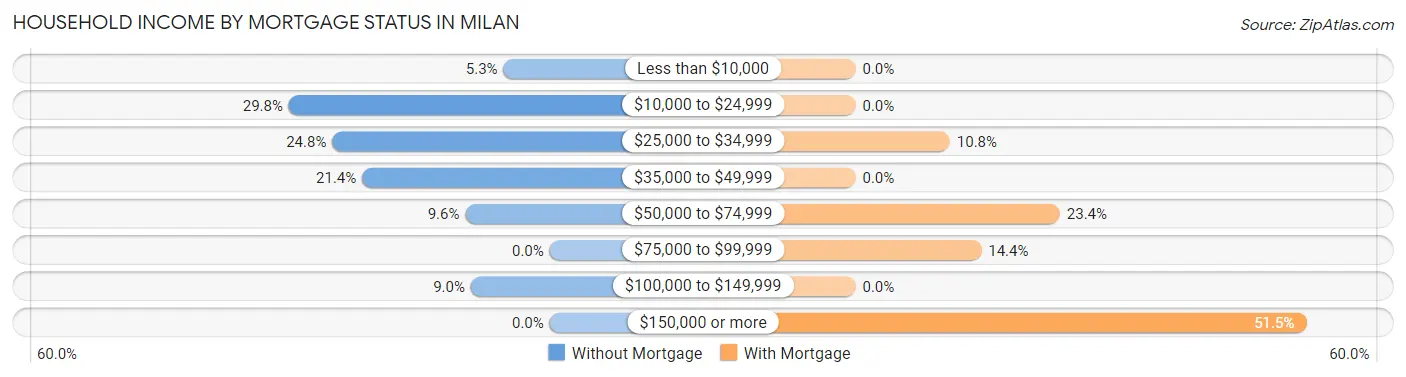
| Household Income | Without Mortgage | With Mortgage |
| Less than $10,000 | 17 (5.3%) | 0 (0.0%) |
| $10,000 to $24,999 | 96 (29.8%) | 0 (0.0%) |
| $25,000 to $34,999 | 80 (24.8%) | 18 (10.8%) |
| $35,000 to $49,999 | 69 (21.4%) | 0 (0.0%) |
| $50,000 to $74,999 | 31 (9.6%) | 39 (23.4%) |
| $75,000 to $99,999 | 0 (0.0%) | 24 (14.4%) |
| $100,000 to $149,999 | 29 (9.0%) | 0 (0.0%) |
| $150,000 or more | 0 (0.0%) | 86 (51.5%) |
| Total | 322 (100.0%) | 167 (100.0%) |
Property Value to Household Income Ratio in Milan
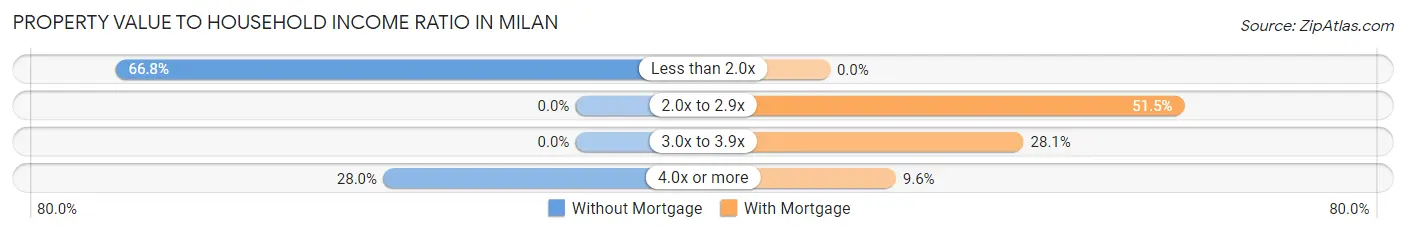
| Value-to-Income Ratio | Without Mortgage | With Mortgage |
| Less than 2.0x | 215 (66.8%) | 0 (0.0%) |
| 2.0x to 2.9x | 0 (0.0%) | 86 (51.5%) |
| 3.0x to 3.9x | 0 (0.0%) | 47 (28.1%) |
| 4.0x or more | 90 (28.0%) | 16 (9.6%) |
| Total | 322 (100.0%) | 167 (100.0%) |
Real Estate Taxes by Mortgage Status in Milan
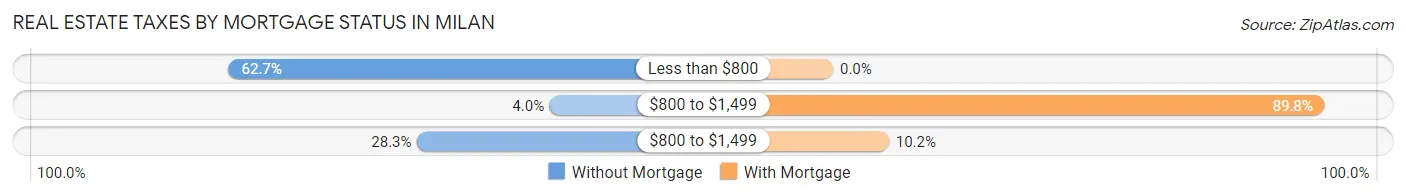
| Property Taxes | Without Mortgage | With Mortgage |
| Less than $800 | 202 (62.7%) | 0 (0.0%) |
| $800 to $1,499 | 13 (4.0%) | 150 (89.8%) |
| $800 to $1,499 | 91 (28.3%) | 17 (10.2%) |
| Total | 322 (100.0%) | 167 (100.0%) |
Health & Disability in Milan
Health Insurance Coverage by Age in Milan
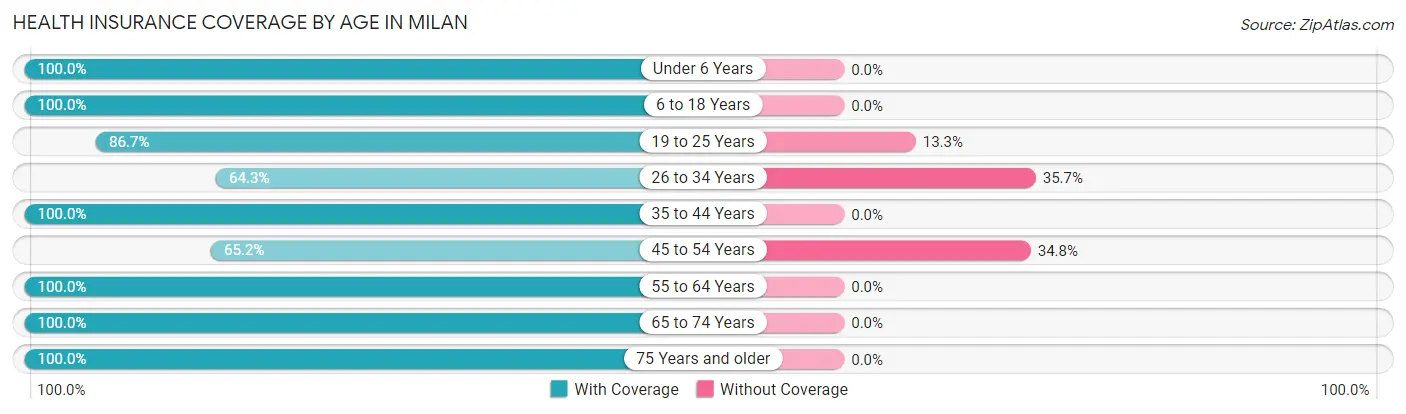
| Age Bracket | With Coverage | Without Coverage |
| Under 6 Years | 92 (100.0%) | 0 (0.0%) |
| 6 to 18 Years | 376 (100.0%) | 0 (0.0%) |
| 19 to 25 Years | 104 (86.7%) | 16 (13.3%) |
| 26 to 34 Years | 261 (64.3%) | 145 (35.7%) |
| 35 to 44 Years | 189 (100.0%) | 0 (0.0%) |
| 45 to 54 Years | 315 (65.2%) | 168 (34.8%) |
| 55 to 64 Years | 263 (100.0%) | 0 (0.0%) |
| 65 to 74 Years | 256 (100.0%) | 0 (0.0%) |
| 75 Years and older | 102 (100.0%) | 0 (0.0%) |
| Total | 1,958 (85.6%) | 329 (14.4%) |
Health Insurance Coverage by Citizenship Status in Milan
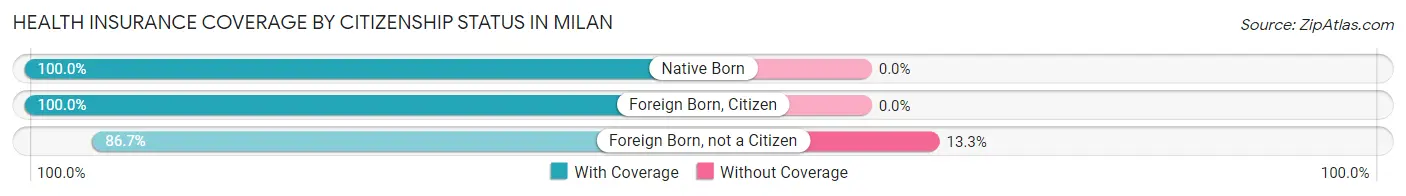
| Citizenship Status | With Coverage | Without Coverage |
| Native Born | 92 (100.0%) | 0 (0.0%) |
| Foreign Born, Citizen | 376 (100.0%) | 0 (0.0%) |
| Foreign Born, not a Citizen | 104 (86.7%) | 16 (13.3%) |
Health Insurance Coverage by Household Income in Milan
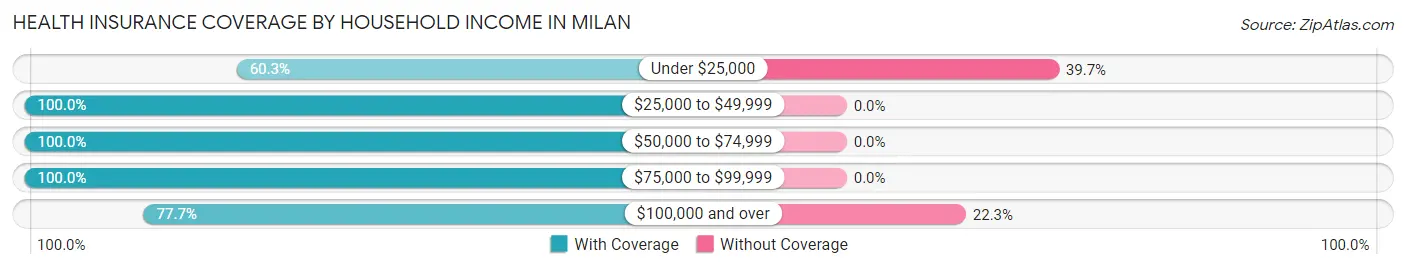
| Household Income | With Coverage | Without Coverage |
| Under $25,000 | 279 (60.3%) | 184 (39.7%) |
| $25,000 to $49,999 | 699 (100.0%) | 0 (0.0%) |
| $50,000 to $74,999 | 440 (100.0%) | 0 (0.0%) |
| $75,000 to $99,999 | 35 (100.0%) | 0 (0.0%) |
| $100,000 and over | 505 (77.7%) | 145 (22.3%) |
Public vs Private Health Insurance Coverage by Age in Milan
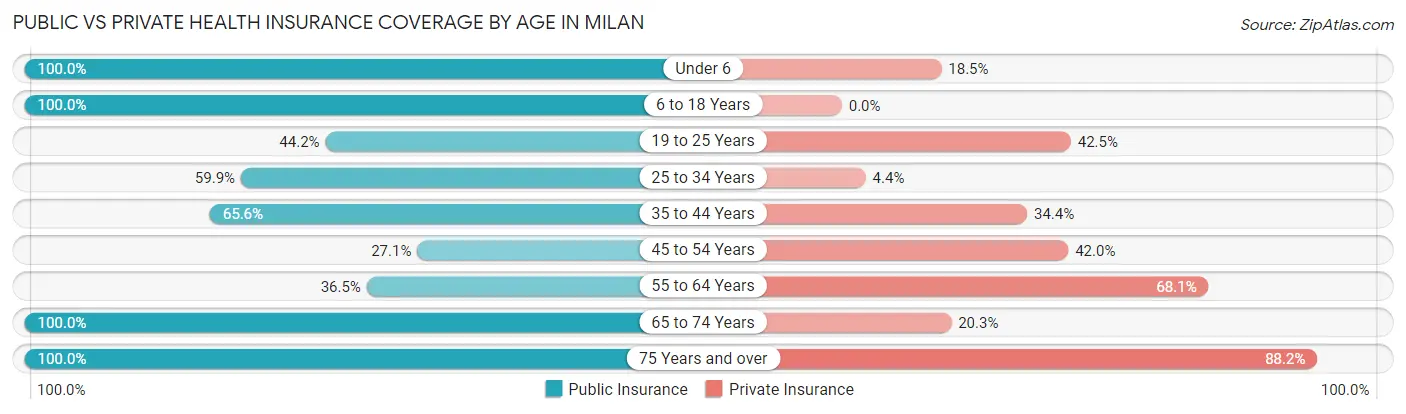
| Age Bracket | Public Insurance | Private Insurance |
| Under 6 | 92 (100.0%) | 17 (18.5%) |
| 6 to 18 Years | 376 (100.0%) | 0 (0.0%) |
| 19 to 25 Years | 53 (44.2%) | 51 (42.5%) |
| 25 to 34 Years | 243 (59.9%) | 18 (4.4%) |
| 35 to 44 Years | 124 (65.6%) | 65 (34.4%) |
| 45 to 54 Years | 131 (27.1%) | 203 (42.0%) |
| 55 to 64 Years | 96 (36.5%) | 179 (68.1%) |
| 65 to 74 Years | 256 (100.0%) | 52 (20.3%) |
| 75 Years and over | 102 (100.0%) | 90 (88.2%) |
| Total | 1,473 (64.4%) | 675 (29.5%) |
Disability Status by Sex by Age in Milan
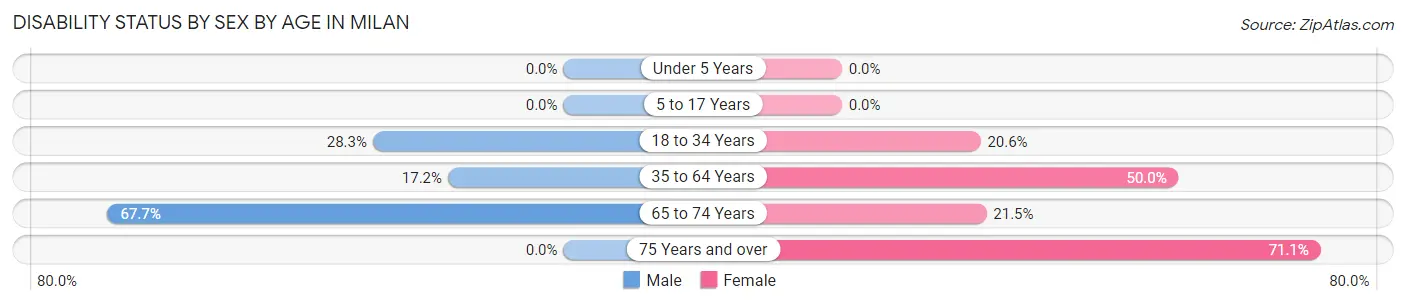
| Age Bracket | Male | Female |
| Under 5 Years | 0 (0.0%) | 0 (0.0%) |
| 5 to 17 Years | 0 (0.0%) | 0 (0.0%) |
| 18 to 34 Years | 75 (28.3%) | 56 (20.6%) |
| 35 to 64 Years | 88 (17.2%) | 211 (50.0%) |
| 65 to 74 Years | 44 (67.7%) | 41 (21.5%) |
| 75 Years and over | 0 (0.0%) | 64 (71.1%) |
Disability Class by Sex by Age in Milan
Disability Class: Hearing Difficulty
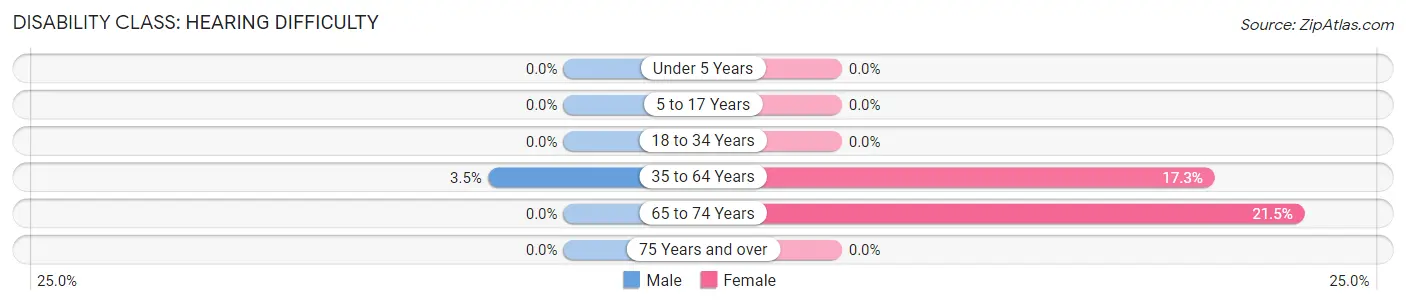
| Age Bracket | Male | Female |
| Under 5 Years | 0 (0.0%) | 0 (0.0%) |
| 5 to 17 Years | 0 (0.0%) | 0 (0.0%) |
| 18 to 34 Years | 0 (0.0%) | 0 (0.0%) |
| 35 to 64 Years | 18 (3.5%) | 73 (17.3%) |
| 65 to 74 Years | 0 (0.0%) | 41 (21.5%) |
| 75 Years and over | 0 (0.0%) | 0 (0.0%) |
Disability Class: Vision Difficulty
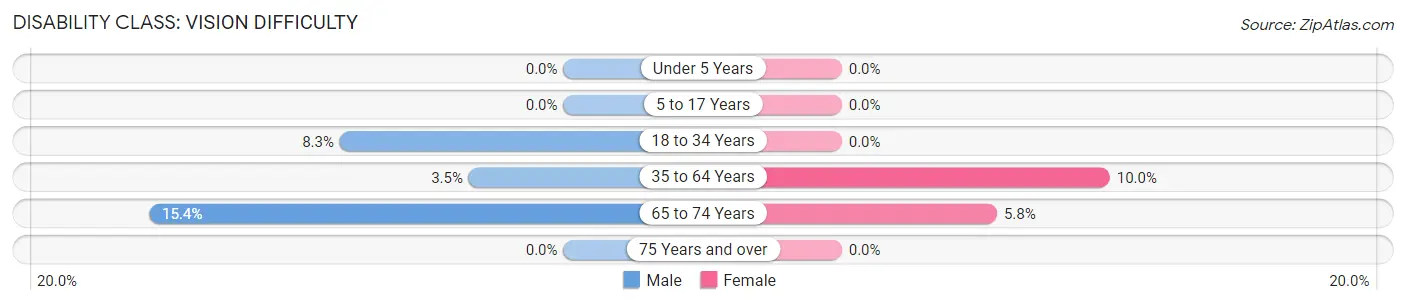
| Age Bracket | Male | Female |
| Under 5 Years | 0 (0.0%) | 0 (0.0%) |
| 5 to 17 Years | 0 (0.0%) | 0 (0.0%) |
| 18 to 34 Years | 22 (8.3%) | 0 (0.0%) |
| 35 to 64 Years | 18 (3.5%) | 42 (10.0%) |
| 65 to 74 Years | 10 (15.4%) | 11 (5.8%) |
| 75 Years and over | 0 (0.0%) | 0 (0.0%) |
Disability Class: Cognitive Difficulty
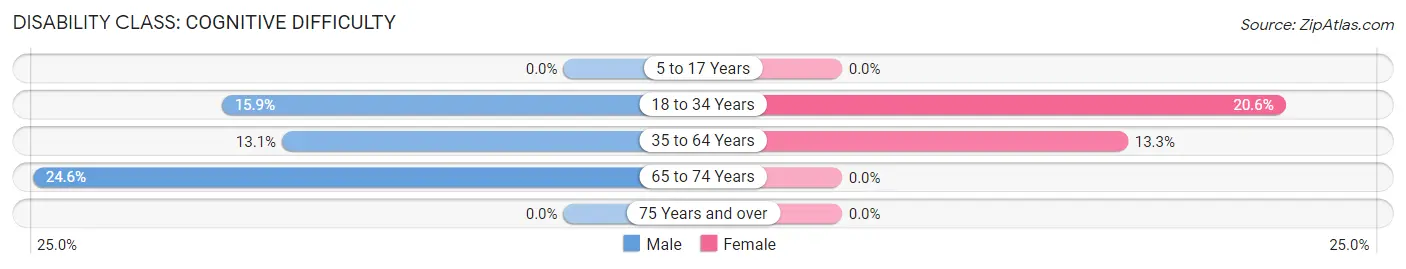
| Age Bracket | Male | Female |
| 5 to 17 Years | 0 (0.0%) | 0 (0.0%) |
| 18 to 34 Years | 42 (15.9%) | 56 (20.6%) |
| 35 to 64 Years | 67 (13.1%) | 56 (13.3%) |
| 65 to 74 Years | 16 (24.6%) | 0 (0.0%) |
| 75 Years and over | 0 (0.0%) | 0 (0.0%) |
Disability Class: Ambulatory Difficulty
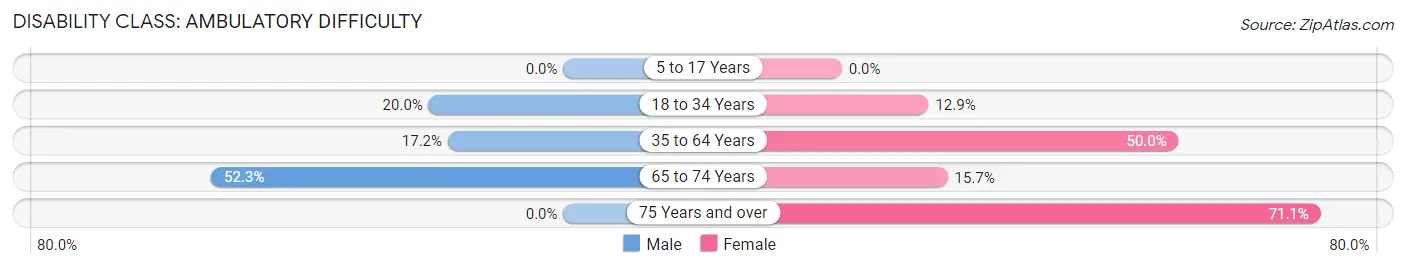
| Age Bracket | Male | Female |
| 5 to 17 Years | 0 (0.0%) | 0 (0.0%) |
| 18 to 34 Years | 53 (20.0%) | 35 (12.9%) |
| 35 to 64 Years | 88 (17.2%) | 211 (50.0%) |
| 65 to 74 Years | 34 (52.3%) | 30 (15.7%) |
| 75 Years and over | 0 (0.0%) | 64 (71.1%) |
Disability Class: Self-Care Difficulty
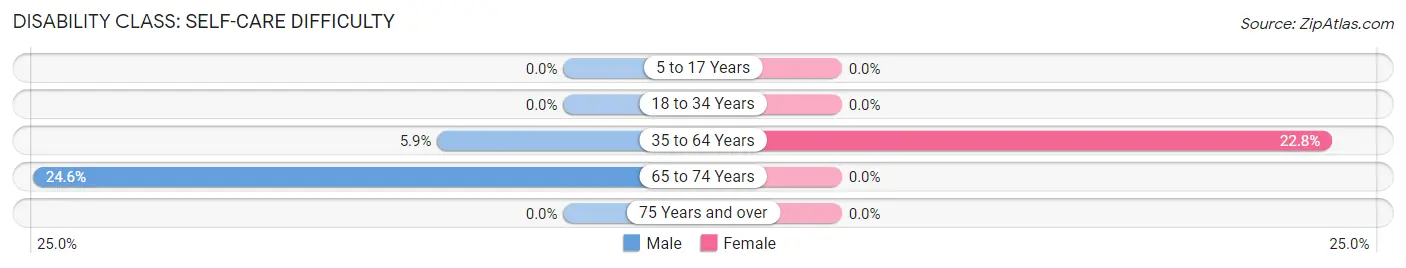
| Age Bracket | Male | Female |
| 5 to 17 Years | 0 (0.0%) | 0 (0.0%) |
| 18 to 34 Years | 0 (0.0%) | 0 (0.0%) |
| 35 to 64 Years | 30 (5.9%) | 96 (22.8%) |
| 65 to 74 Years | 16 (24.6%) | 0 (0.0%) |
| 75 Years and over | 0 (0.0%) | 0 (0.0%) |
Technology Access in Milan
Computing Device Access in Milan
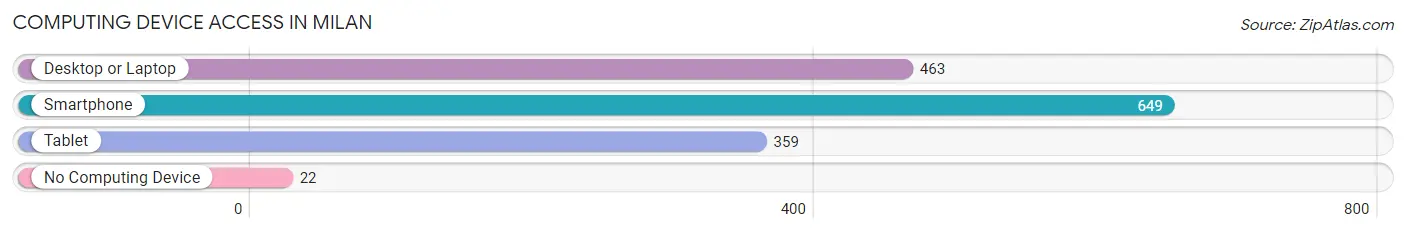
| Device Type | # Households | % Households |
| Desktop or Laptop | 463 | 54.6% |
| Smartphone | 649 | 76.5% |
| Tablet | 359 | 42.3% |
| No Computing Device | 22 | 2.6% |
| Total | 848 | 100.0% |
Internet Access in Milan
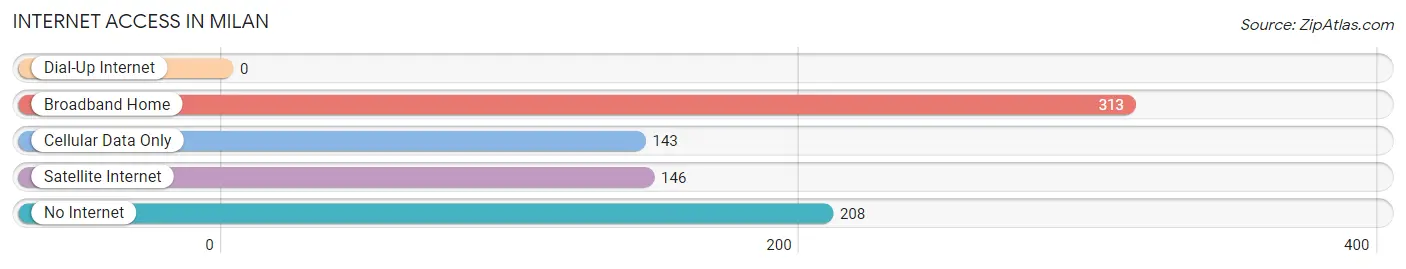
| Internet Type | # Households | % Households |
| Dial-Up Internet | 0 | 0.0% |
| Broadband Home | 313 | 36.9% |
| Cellular Data Only | 143 | 16.9% |
| Satellite Internet | 146 | 17.2% |
| No Internet | 208 | 24.5% |
| Total | 848 | 100.0% |
Milan Summary
Milan, New Mexico is a small town located in the northwest corner of the state, near the Arizona border. It is part of Cibola County and is situated in the heart of the Navajo Nation. The town was founded in 1881 and has a population of approximately 1,500 people.
History
The area around Milan was first inhabited by the Anasazi people, who lived in the area for centuries before the arrival of the Spanish. The Spanish arrived in the area in the late 1500s and established a mission in the area in 1629. The mission was abandoned in 1680, but the Spanish continued to use the area for grazing and farming.
In 1881, the town of Milan was founded by a group of settlers from the nearby town of Grants. The town was named after the Italian city of Milan, and the settlers hoped to create a prosperous agricultural community. The town quickly grew and by the early 1900s, it had become a bustling center of commerce and industry.
The town was also home to a large number of Navajo people, who had been living in the area for centuries. The Navajo people were an integral part of the town’s economy and culture, and they continue to be an important part of the community today.
Geography
Milan is located in the northwest corner of New Mexico, near the Arizona border. The town is situated in the heart of the Navajo Nation and is surrounded by the beautiful Chuska Mountains. The town is located at an elevation of 5,400 feet and has a semi-arid climate with hot summers and cold winters.
The town is located on the banks of the San Juan River, which is a major source of water for the area. The river is also a popular destination for fishing, boating, and other recreational activities.
Economy
The economy of Milan is largely based on agriculture and tourism. The town is home to a number of farms and ranches, which produce a variety of crops and livestock. The town is also home to a number of tourist attractions, including the nearby Chuska Mountains and the San Juan River.
The town is also home to a number of businesses, including restaurants, hotels, and retail stores. The town is also home to a number of manufacturing companies, which produce a variety of products, including furniture, clothing, and electronics.
Demographics
As of the 2010 census, the population of Milan was 1,500. The town is predominantly Hispanic, with a large percentage of Native Americans. The median household income in the town is $30,000, and the median age is 33.
The town is served by the Milan Independent School District, which includes two elementary schools, one middle school, and one high school. The town is also home to a number of churches, including the Church of Jesus Christ of Latter-day Saints, the Catholic Church, and the United Methodist Church.
Conclusion
Milan, New Mexico is a small town located in the northwest corner of the state, near the Arizona border. It is part of Cibola County and is situated in the heart of the Navajo Nation. The town was founded in 1881 and has a population of approximately 1,500 people. The economy of Milan is largely based on agriculture and tourism, and the town is predominantly Hispanic, with a large percentage of Native Americans. The town is served by the Milan Independent School District and is home to a number of churches. Milan is a vibrant and diverse community that is proud of its history and culture.
Common Questions
What is Per Capita Income in Milan?
Per Capita income in Milan is $20,829.
What is the Median Family Income in Milan?
Median Family Income in Milan is $62,697.
What is the Median Household income in Milan?
Median Household Income in Milan is $36,433.
What is Income or Wage Gap in Milan?
Income or Wage Gap in Milan is 24.0%.
Women in Milan earn 76.0 cents for every dollar earned by a man.
What is Inequality or Gini Index in Milan?
Inequality or Gini Index in Milan is 0.43.
What is the Total Population of Milan?
Total Population of Milan is 2,375.
What is the Total Male Population of Milan?
Total Male Population of Milan is 1,377.
What is the Total Female Population of Milan?
Total Female Population of Milan is 998.
What is the Ratio of Males per 100 Females in Milan?
There are 137.98 Males per 100 Females in Milan.
What is the Ratio of Females per 100 Males in Milan?
There are 72.48 Females per 100 Males in Milan.
What is the Median Population Age in Milan?
Median Population Age in Milan is 44.2 Years.
What is the Average Family Size in Milan
Average Family Size in Milan is 5.2 People.
What is the Average Household Size in Milan
Average Household Size in Milan is 2.7 People.
How Large is the Labor Force in Milan?
There are 875 People in the Labor Forcein in Milan.
What is the Percentage of People in the Labor Force in Milan?
44.2% of People are in the Labor Force in Milan.
What is the Unemployment Rate in Milan?
Unemployment Rate in Milan is 17.4%.