Yah ta hey, NM Map & Demographics
Yah ta hey Map
Yah ta hey Overview
$13,573
PER CAPITA INCOME
$36,769
AVG FAMILY INCOME
$68,143
AVG HOUSEHOLD INCOME
49.1%
WAGE / INCOME GAP [ % ]
50.9¢/ $1
WAGE / INCOME GAP [ $ ]
0.32
INEQUALITY / GINI INDEX
709
TOTAL POPULATION
372
MALE POPULATION
337
FEMALE POPULATION
110.39
MALES / 100 FEMALES
90.59
FEMALES / 100 MALES
33.7
MEDIAN AGE
4.1
AVG FAMILY SIZE
3.9
AVG HOUSEHOLD SIZE
210
LABOR FORCE [ PEOPLE ]
32.7%
PERCENT IN LABOR FORCE
7.1%
UNEMPLOYMENT RATE
Income in Yah ta hey
Income Overview in Yah ta hey
Per Capita Income in Yah ta hey is $13,573, while median incomes of families and households are $36,769 and $68,143 respectively.
| Characteristic | Number | Measure |
| Per Capita Income | 709 | $13,573 |
| Median Family Income | 149 | $36,769 |
| Mean Family Income | 149 | $45,228 |
| Median Household Income | 180 | $68,143 |
| Mean Household Income | 180 | $49,160 |
| Income Deficit | 149 | $0 |
| Wage / Income Gap (%) | 709 | 49.10% |
| Wage / Income Gap ($) | 709 | 50.90¢ per $1 |
| Gini / Inequality Index | 709 | 0.32 |
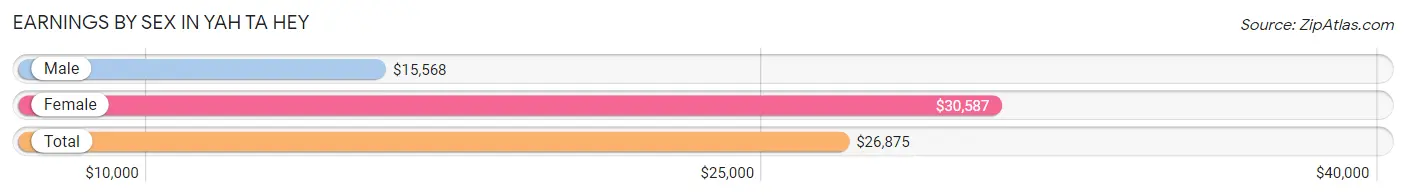
Earnings by Sex in Yah ta hey
Average Earnings in Yah ta hey are $26,875, $15,568 for men and $30,587 for women, a difference of 49.1%.
| Sex | Number | Average Earnings |
| Male | 163 (64.7%) | $15,568 |
| Female | 89 (35.3%) | $30,587 |
| Total | 252 (100.0%) | $26,875 |
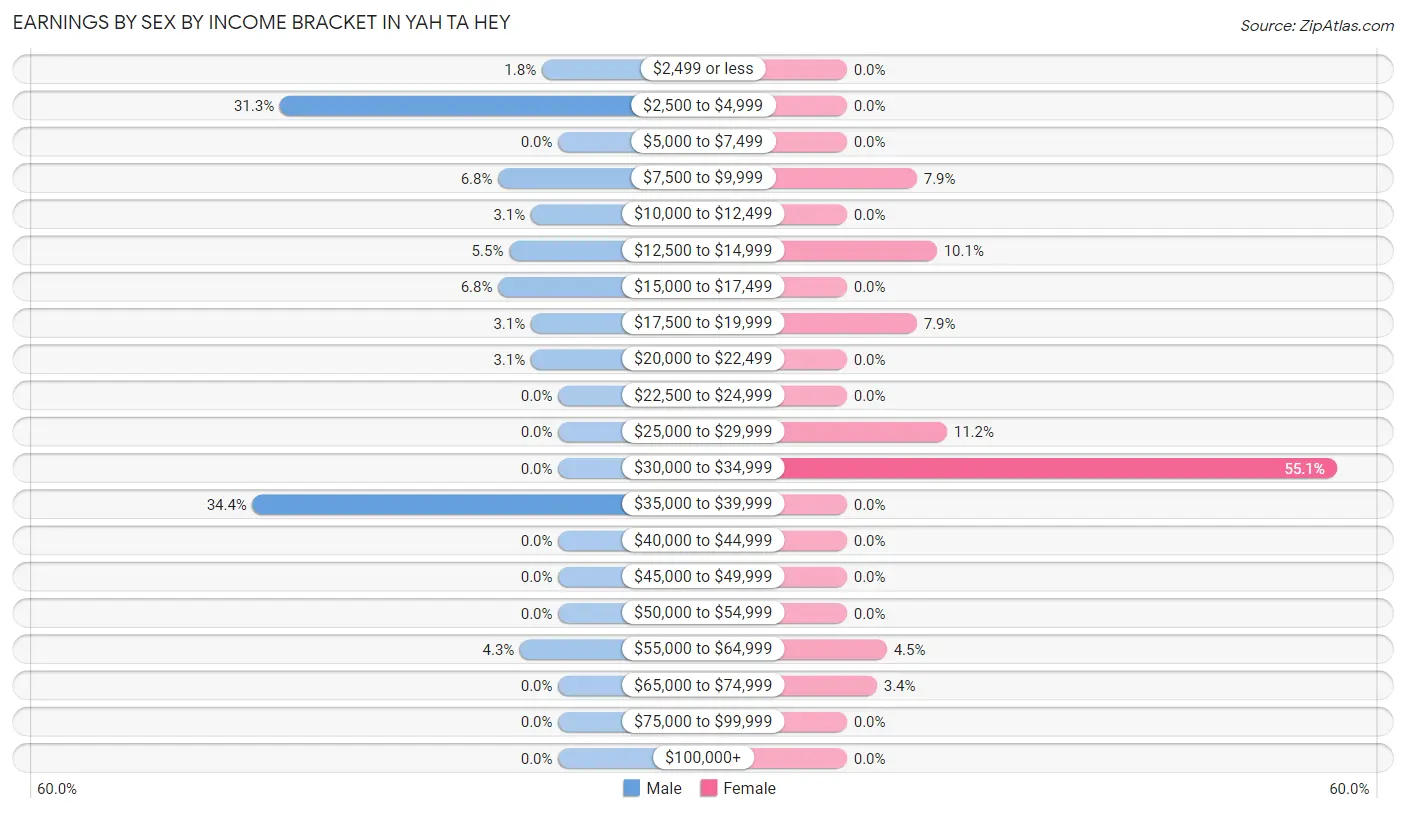
Earnings by Sex by Income Bracket in Yah ta hey
The most common earnings brackets in Yah ta hey are $35,000 to $39,999 for men (56 | 34.4%) and $30,000 to $34,999 for women (49 | 55.1%).
| Income | Male | Female |
| $2,499 or less | 3 (1.8%) | 0 (0.0%) |
| $2,500 to $4,999 | 51 (31.3%) | 0 (0.0%) |
| $5,000 to $7,499 | 0 (0.0%) | 0 (0.0%) |
| $7,500 to $9,999 | 11 (6.8%) | 7 (7.9%) |
| $10,000 to $12,499 | 5 (3.1%) | 0 (0.0%) |
| $12,500 to $14,999 | 9 (5.5%) | 9 (10.1%) |
| $15,000 to $17,499 | 11 (6.8%) | 0 (0.0%) |
| $17,500 to $19,999 | 5 (3.1%) | 7 (7.9%) |
| $20,000 to $22,499 | 5 (3.1%) | 0 (0.0%) |
| $22,500 to $24,999 | 0 (0.0%) | 0 (0.0%) |
| $25,000 to $29,999 | 0 (0.0%) | 10 (11.2%) |
| $30,000 to $34,999 | 0 (0.0%) | 49 (55.1%) |
| $35,000 to $39,999 | 56 (34.4%) | 0 (0.0%) |
| $40,000 to $44,999 | 0 (0.0%) | 0 (0.0%) |
| $45,000 to $49,999 | 0 (0.0%) | 0 (0.0%) |
| $50,000 to $54,999 | 0 (0.0%) | 0 (0.0%) |
| $55,000 to $64,999 | 7 (4.3%) | 4 (4.5%) |
| $65,000 to $74,999 | 0 (0.0%) | 3 (3.4%) |
| $75,000 to $99,999 | 0 (0.0%) | 0 (0.0%) |
| $100,000+ | 0 (0.0%) | 0 (0.0%) |
| Total | 163 (100.0%) | 89 (100.0%) |
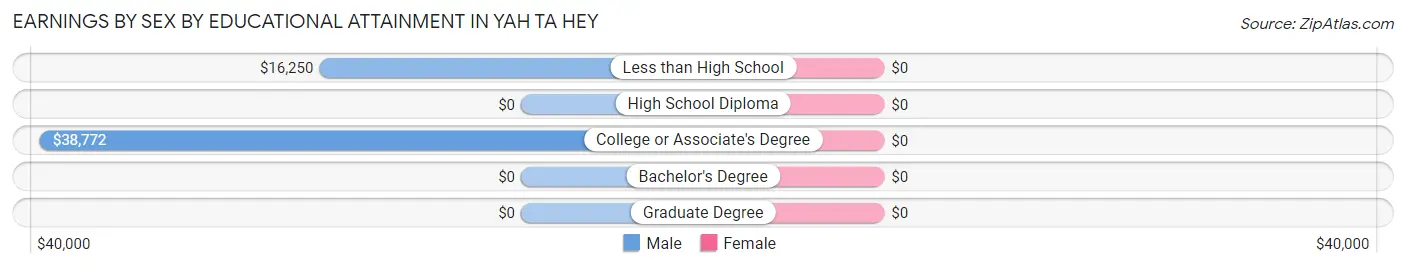
Earnings by Sex by Educational Attainment in Yah ta hey
| Educational Attainment | Male Income | Female Income |
| Less than High School | $16,250 | $0 |
| High School Diploma | - | - |
| College or Associate's Degree | $38,772 | $0 |
| Bachelor's Degree | - | - |
| Graduate Degree | - | - |
| Total | $38,192 | $30,663 |
Family Income in Yah ta hey
Family Income Brackets in Yah ta hey
According to the Yah ta hey family income data, there are 53 families falling into the $35,000 to $49,999 income range, which is the most common income bracket and makes up 35.6% of all families.
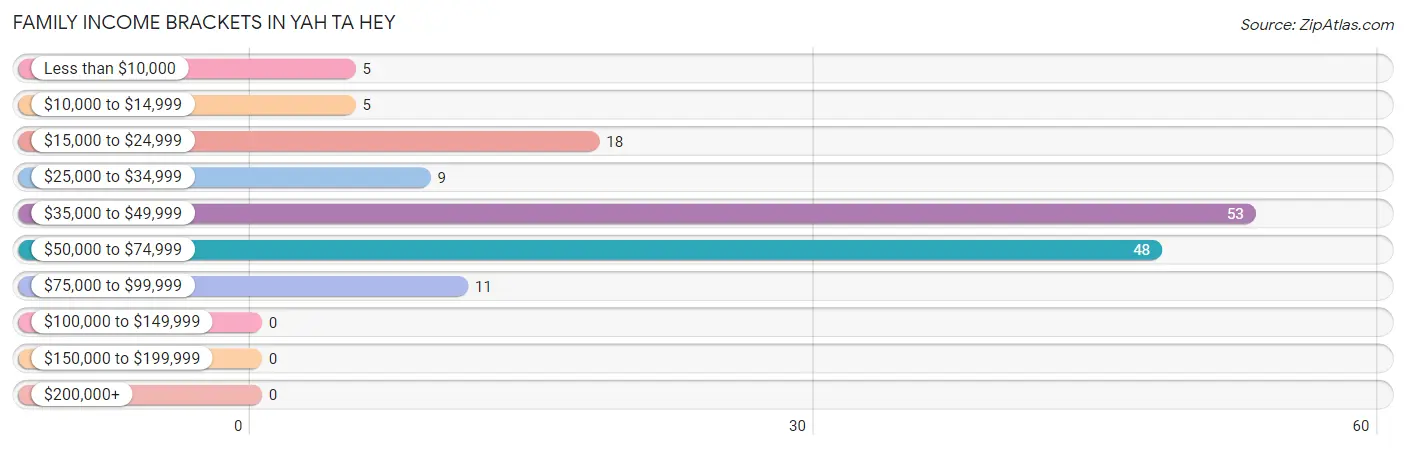
| Income Bracket | # Families | % Families |
| Less than $10,000 | 5 | 3.4% |
| $10,000 to $14,999 | 5 | 3.4% |
| $15,000 to $24,999 | 18 | 12.1% |
| $25,000 to $34,999 | 9 | 6.0% |
| $35,000 to $49,999 | 53 | 35.6% |
| $50,000 to $74,999 | 48 | 32.2% |
| $75,000 to $99,999 | 11 | 7.4% |
| $100,000 to $149,999 | 0 | 0.0% |
| $150,000 to $199,999 | 0 | 0.0% |
| $200,000+ | 0 | 0.0% |
Family Income by Famaliy Size in Yah ta hey
7+ person families (11 | 7.4%) account for the highest median family income in Yah ta hey with $76,563 per family, while 2-person families (63 | 42.3%) have the highest median income of $33,875 per family member.
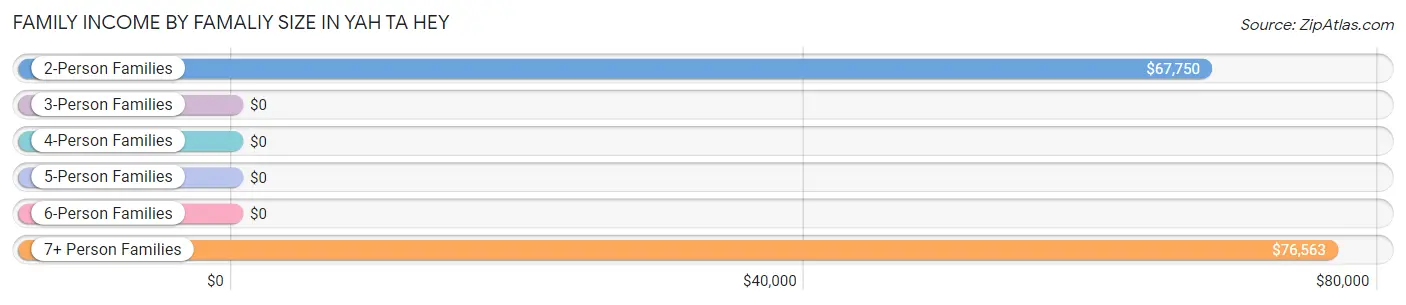
| Income Bracket | # Families | Median Income |
| 2-Person Families | 63 (42.3%) | $67,750 |
| 3-Person Families | 8 (5.4%) | $0 |
| 4-Person Families | 53 (35.6%) | $0 |
| 5-Person Families | 9 (6.0%) | $0 |
| 6-Person Families | 5 (3.4%) | $0 |
| 7+ Person Families | 11 (7.4%) | $76,563 |
| Total | 149 (100.0%) | $36,769 |
Family Income by Number of Earners in Yah ta hey
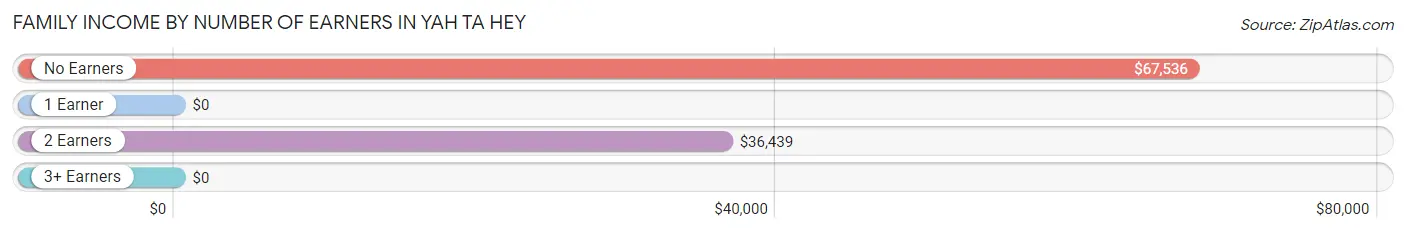
| Number of Earners | # Families | Median Income |
| No Earners | 69 (46.3%) | $67,536 |
| 1 Earner | 12 (8.1%) | $0 |
| 2 Earners | 61 (40.9%) | $36,439 |
| 3+ Earners | 7 (4.7%) | $0 |
| Total | 149 (100.0%) | $36,769 |
Household Income in Yah ta hey
Household Income Brackets in Yah ta hey
With 97 households falling in the category, the $50,000 to $74,999 income range is the most frequent in Yah ta hey, accounting for 53.9% of all households.
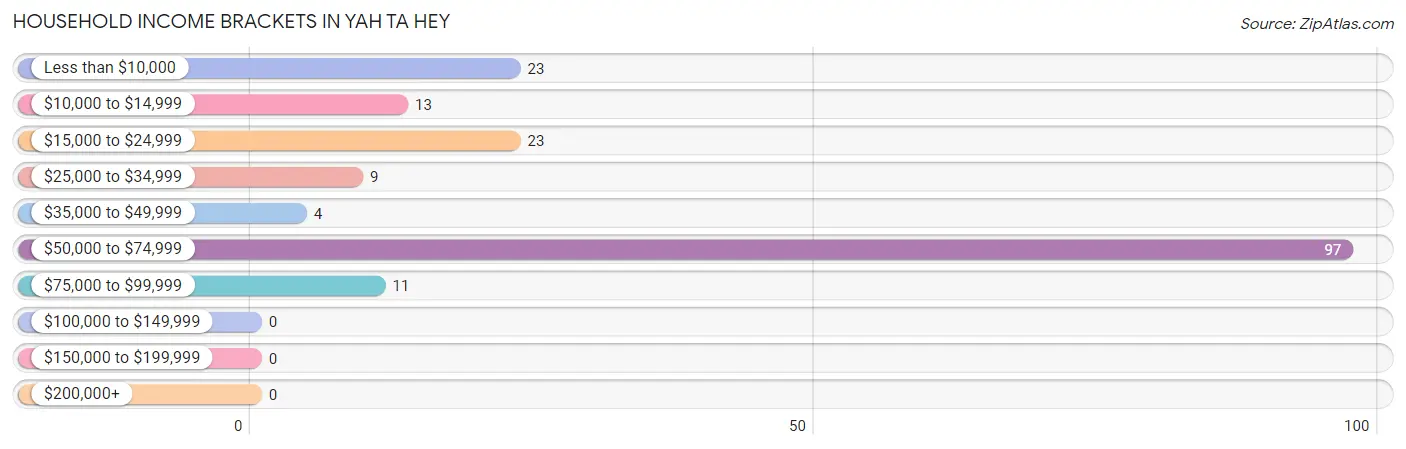
| Income Bracket | # Households | % Households |
| Less than $10,000 | 23 | 12.8% |
| $10,000 to $14,999 | 13 | 7.2% |
| $15,000 to $24,999 | 23 | 12.8% |
| $25,000 to $34,999 | 9 | 5.0% |
| $35,000 to $49,999 | 4 | 2.2% |
| $50,000 to $74,999 | 97 | 53.9% |
| $75,000 to $99,999 | 11 | 6.1% |
| $100,000 to $149,999 | 0 | 0.0% |
| $150,000 to $199,999 | 0 | 0.0% |
| $200,000+ | 0 | 0.0% |
Household Income by Householder Age in Yah ta hey
The median household income in Yah ta hey is $68,143, with the highest median household income of $73,520 found in the 25 to 44 years age bracket for the primary householder. A total of 64 households (35.6%) fall into this category. Meanwhile, the 15 to 24 years age bracket for the primary householder has the lowest median household income of $0, with 5 households (2.8%) in this group.
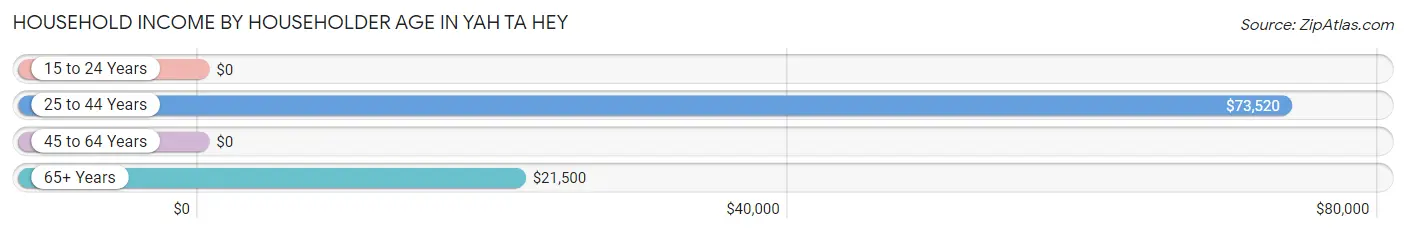
| Income Bracket | # Households | Median Income |
| 15 to 24 Years | 5 (2.8%) | $0 |
| 25 to 44 Years | 64 (35.6%) | $73,520 |
| 45 to 64 Years | 85 (47.2%) | $0 |
| 65+ Years | 26 (14.4%) | $21,500 |
| Total | 180 (100.0%) | $68,143 |
Poverty in Yah ta hey
Income Below Poverty by Sex and Age in Yah ta hey
With 19.6% poverty level for males and 21.4% for females among the residents of Yah ta hey, 45 to 54 year old males and under 5 year old females are the most vulnerable to poverty, with 23 males (100.0%) and 5 females (83.3%) in their respective age groups living below the poverty level.
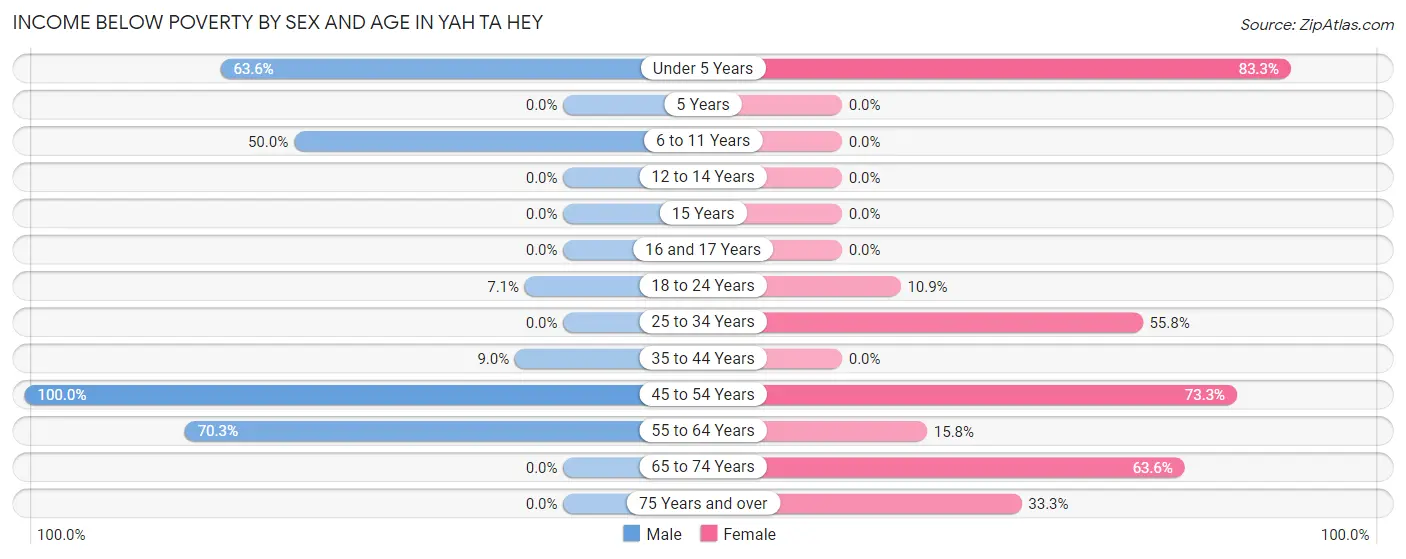
| Age Bracket | Male | Female |
| Under 5 Years | 7 (63.6%) | 5 (83.3%) |
| 5 Years | 0 (0.0%) | 0 (0.0%) |
| 6 to 11 Years | 5 (50.0%) | 0 (0.0%) |
| 12 to 14 Years | 0 (0.0%) | 0 (0.0%) |
| 15 Years | 0 (0.0%) | 0 (0.0%) |
| 16 and 17 Years | 0 (0.0%) | 0 (0.0%) |
| 18 to 24 Years | 5 (7.1%) | 11 (10.9%) |
| 25 to 34 Years | 0 (0.0%) | 24 (55.8%) |
| 35 to 44 Years | 7 (9.0%) | 0 (0.0%) |
| 45 to 54 Years | 23 (100.0%) | 11 (73.3%) |
| 55 to 64 Years | 26 (70.3%) | 9 (15.8%) |
| 65 to 74 Years | 0 (0.0%) | 7 (63.6%) |
| 75 Years and over | 0 (0.0%) | 5 (33.3%) |
| Total | 73 (19.6%) | 72 (21.4%) |
Income Above Poverty by Sex and Age in Yah ta hey
According to the poverty statistics in Yah ta hey, males aged 12 to 14 years and females aged 6 to 11 years are the age groups that are most secure financially, with 100.0% of males and 100.0% of females in these age groups living above the poverty line.
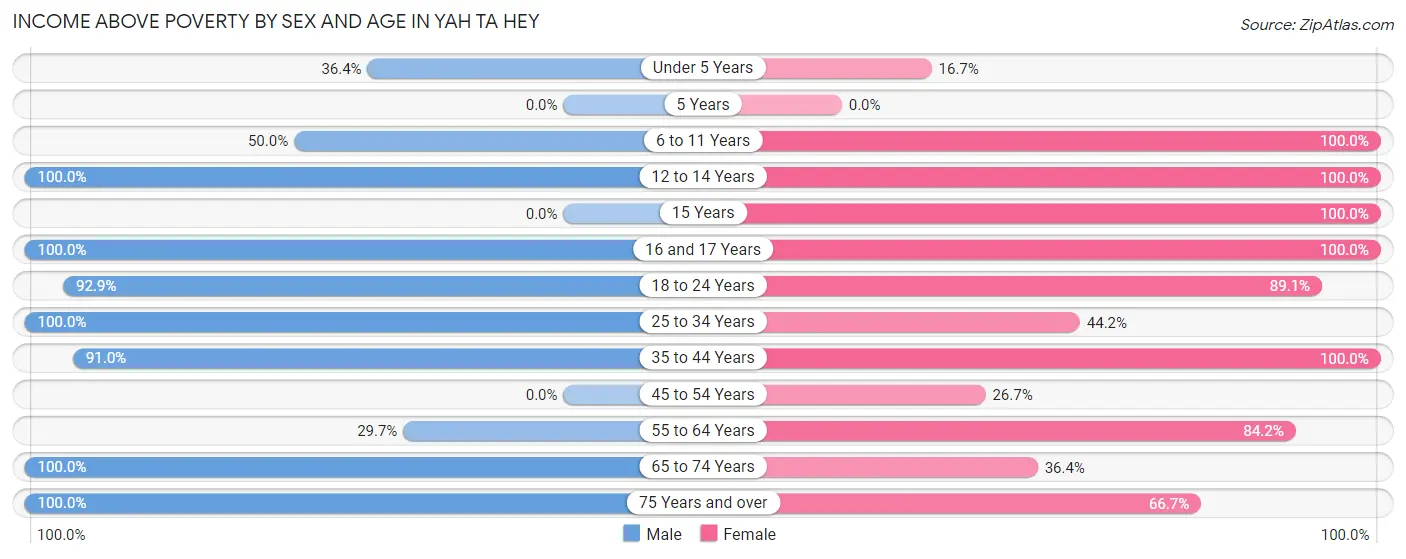
| Age Bracket | Male | Female |
| Under 5 Years | 4 (36.4%) | 1 (16.7%) |
| 5 Years | 0 (0.0%) | 0 (0.0%) |
| 6 to 11 Years | 5 (50.0%) | 9 (100.0%) |
| 12 to 14 Years | 15 (100.0%) | 10 (100.0%) |
| 15 Years | 0 (0.0%) | 6 (100.0%) |
| 16 and 17 Years | 58 (100.0%) | 5 (100.0%) |
| 18 to 24 Years | 65 (92.9%) | 90 (89.1%) |
| 25 to 34 Years | 26 (100.0%) | 19 (44.2%) |
| 35 to 44 Years | 71 (91.0%) | 59 (100.0%) |
| 45 to 54 Years | 0 (0.0%) | 4 (26.7%) |
| 55 to 64 Years | 11 (29.7%) | 48 (84.2%) |
| 65 to 74 Years | 39 (100.0%) | 4 (36.4%) |
| 75 Years and over | 5 (100.0%) | 10 (66.7%) |
| Total | 299 (80.4%) | 265 (78.6%) |
Income Below Poverty Among Married-Couple Families in Yah ta hey
The poverty statistics for married-couple families in Yah ta hey show that 13.6% or 9 of the total 66 families live below the poverty line. Families with no children have the highest poverty rate of 15.2%, comprising of 9 families. On the other hand, families with 1 or 2 children have the lowest poverty rate of 0.0%, which includes 0 families.
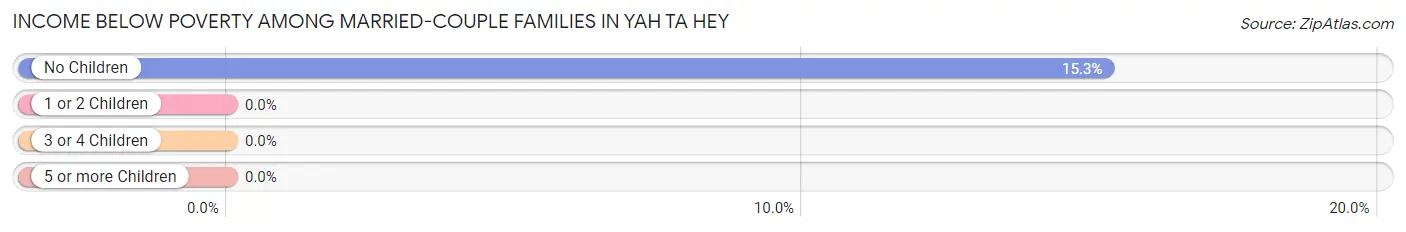
| Children | Above Poverty | Below Poverty |
| No Children | 50 (84.8%) | 9 (15.2%) |
| 1 or 2 Children | 7 (100.0%) | 0 (0.0%) |
| 3 or 4 Children | 0 (0.0%) | 0 (0.0%) |
| 5 or more Children | 0 (0.0%) | 0 (0.0%) |
| Total | 57 (86.4%) | 9 (13.6%) |
Income Below Poverty Among Single-Parent Households in Yah ta hey
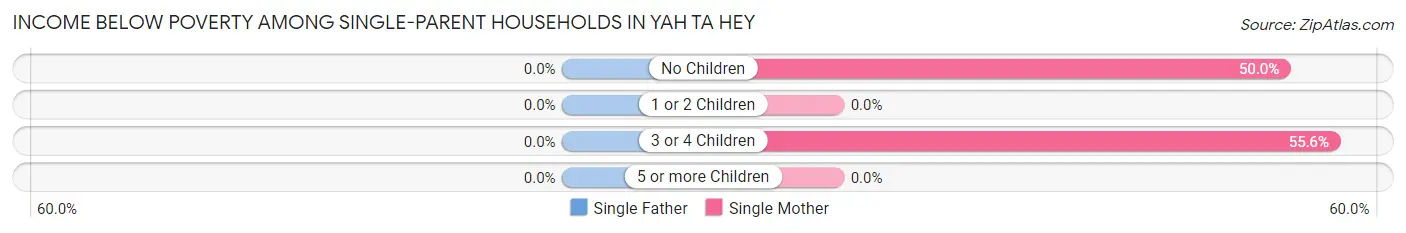
| Children | Single Father | Single Mother |
| No Children | 0 (0.0%) | 9 (50.0%) |
| 1 or 2 Children | 0 (0.0%) | 0 (0.0%) |
| 3 or 4 Children | 0 (0.0%) | 5 (55.6%) |
| 5 or more Children | 0 (0.0%) | 0 (0.0%) |
| Total | 0 (0.0%) | 14 (16.9%) |
Income Below Poverty Among Married-Couple vs Single-Parent Households in Yah ta hey
The poverty data for Yah ta hey shows that 9 of the married-couple family households (13.6%) and 14 of the single-parent households (16.9%) are living below the poverty level. Within the married-couple family households, those with no children have the highest poverty rate, with 9 households (15.2%) falling below the poverty line. Among the single-parent households, those with 3 or 4 children have the highest poverty rate, with 5 household (55.6%) living below poverty.
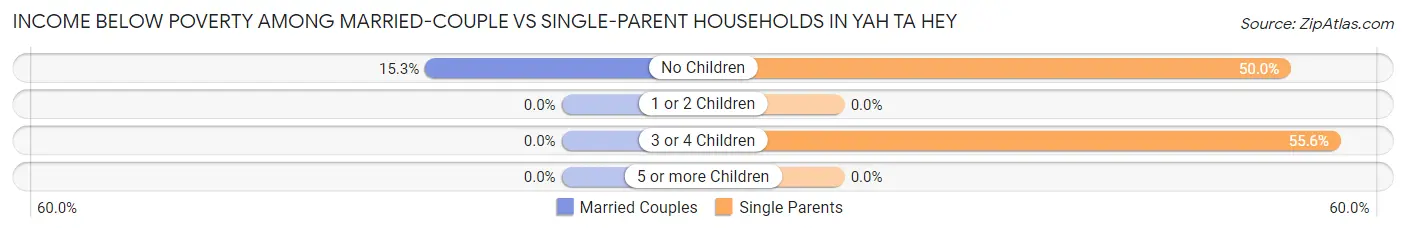
| Children | Married-Couple Families | Single-Parent Households |
| No Children | 9 (15.2%) | 9 (50.0%) |
| 1 or 2 Children | 0 (0.0%) | 0 (0.0%) |
| 3 or 4 Children | 0 (0.0%) | 5 (55.6%) |
| 5 or more Children | 0 (0.0%) | 0 (0.0%) |
| Total | 9 (13.6%) | 14 (16.9%) |
Race in Yah ta hey
The most populous races in Yah ta hey are Native / Alaskan (612 | 86.3%), Hispanic or Latino (97 | 13.7%), and Some other Race (69 | 9.7%).
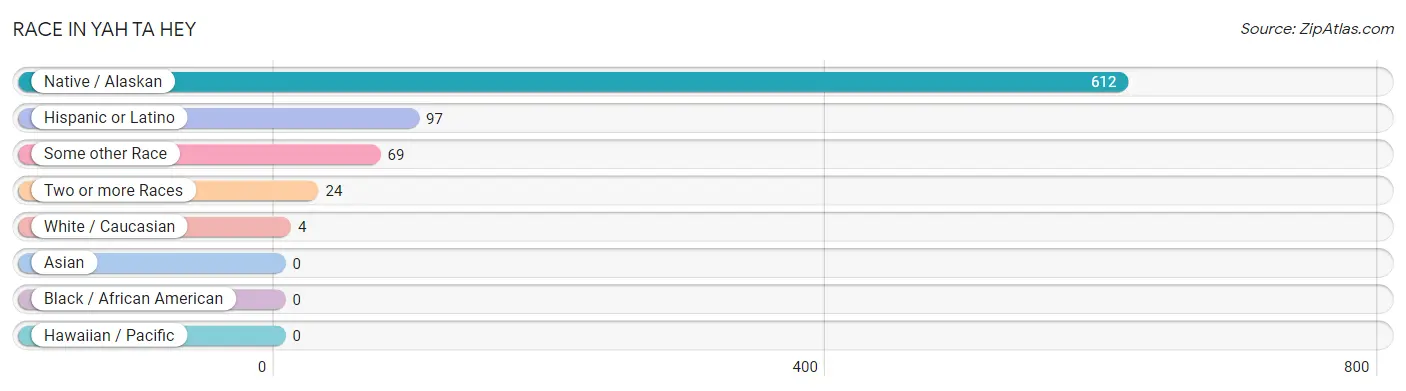
| Race | # Population | % Population |
| Asian | 0 | 0.0% |
| Black / African American | 0 | 0.0% |
| Hawaiian / Pacific | 0 | 0.0% |
| Hispanic or Latino | 97 | 13.7% |
| Native / Alaskan | 612 | 86.3% |
| White / Caucasian | 4 | 0.6% |
| Two or more Races | 24 | 3.4% |
| Some other Race | 69 | 9.7% |
| Total | 709 | 100.0% |
Ancestry in Yah ta hey
The most populous ancestries reported in Yah ta hey are Navajo (629 | 88.7%), Mexican (76 | 10.7%), English (21 | 3.0%), and Spanish (21 | 3.0%), together accounting for 105.4% of all Yah ta hey residents.
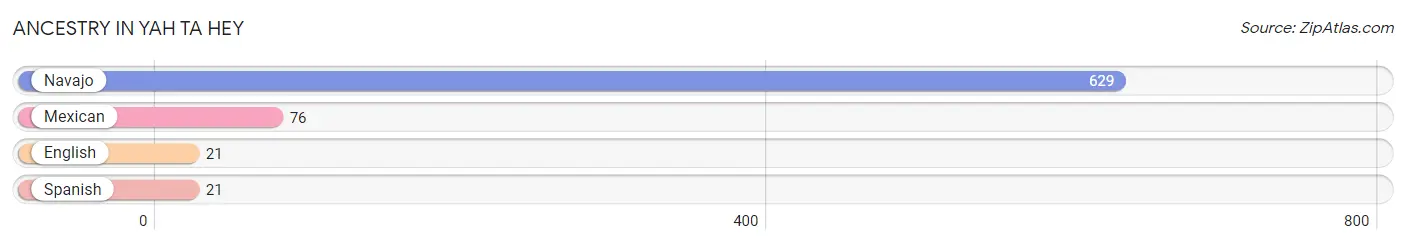
| Ancestry | # Population | % Population |
| English | 21 | 3.0% |
| Mexican | 76 | 10.7% |
| Navajo | 629 | 88.7% |
| Spanish | 21 | 3.0% | View All 4 Rows |
Immigrants in Yah ta hey

| Immigration Origin | # Population | % Population | View All 0 Rows |
Sex and Age in Yah ta hey
Sex and Age in Yah ta hey
The most populous age groups in Yah ta hey are 15 to 19 Years (114 | 30.6%) for men and 20 to 24 Years (88 | 26.1%) for women.
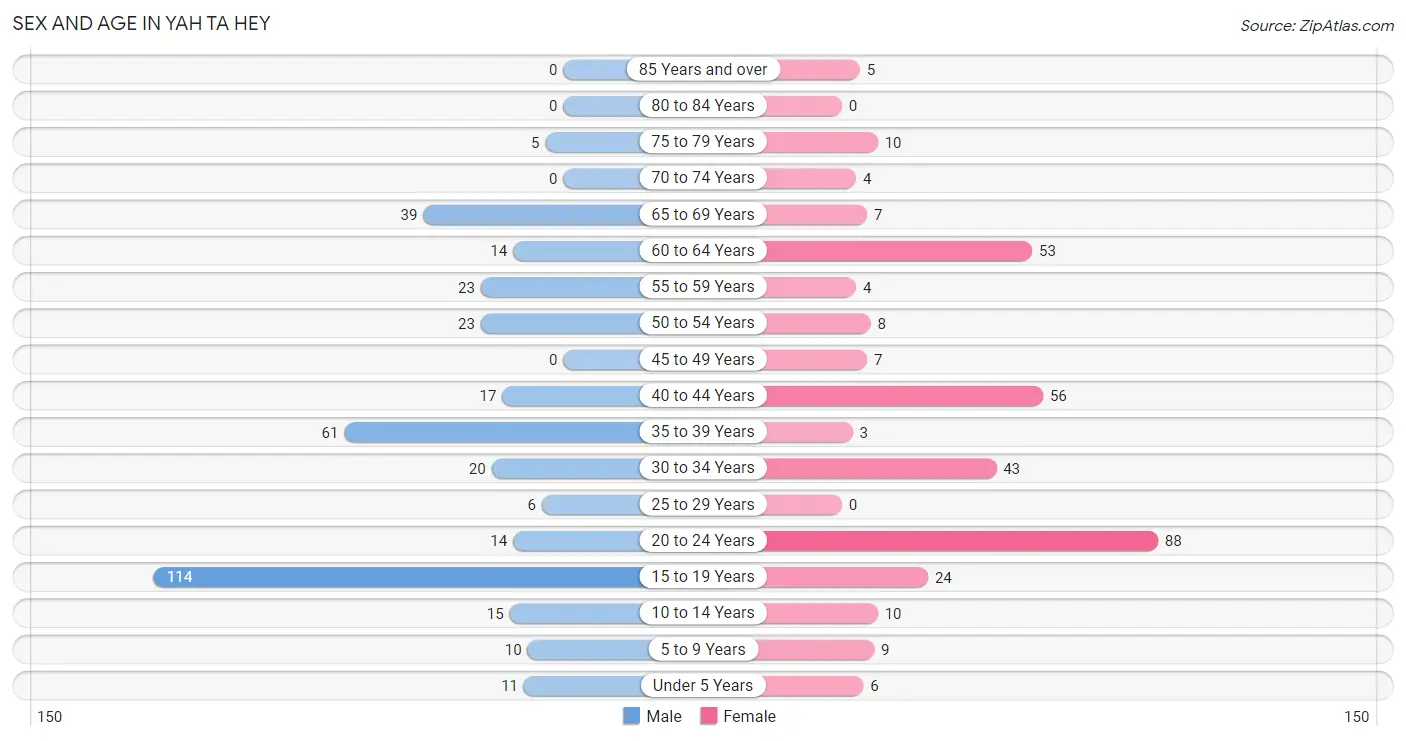
| Age Bracket | Male | Female |
| Under 5 Years | 11 (3.0%) | 6 (1.8%) |
| 5 to 9 Years | 10 (2.7%) | 9 (2.7%) |
| 10 to 14 Years | 15 (4.0%) | 10 (3.0%) |
| 15 to 19 Years | 114 (30.6%) | 24 (7.1%) |
| 20 to 24 Years | 14 (3.8%) | 88 (26.1%) |
| 25 to 29 Years | 6 (1.6%) | 0 (0.0%) |
| 30 to 34 Years | 20 (5.4%) | 43 (12.8%) |
| 35 to 39 Years | 61 (16.4%) | 3 (0.9%) |
| 40 to 44 Years | 17 (4.6%) | 56 (16.6%) |
| 45 to 49 Years | 0 (0.0%) | 7 (2.1%) |
| 50 to 54 Years | 23 (6.2%) | 8 (2.4%) |
| 55 to 59 Years | 23 (6.2%) | 4 (1.2%) |
| 60 to 64 Years | 14 (3.8%) | 53 (15.7%) |
| 65 to 69 Years | 39 (10.5%) | 7 (2.1%) |
| 70 to 74 Years | 0 (0.0%) | 4 (1.2%) |
| 75 to 79 Years | 5 (1.3%) | 10 (3.0%) |
| 80 to 84 Years | 0 (0.0%) | 0 (0.0%) |
| 85 Years and over | 0 (0.0%) | 5 (1.5%) |
| Total | 372 (100.0%) | 337 (100.0%) |
Families and Households in Yah ta hey
Median Family Size in Yah ta hey
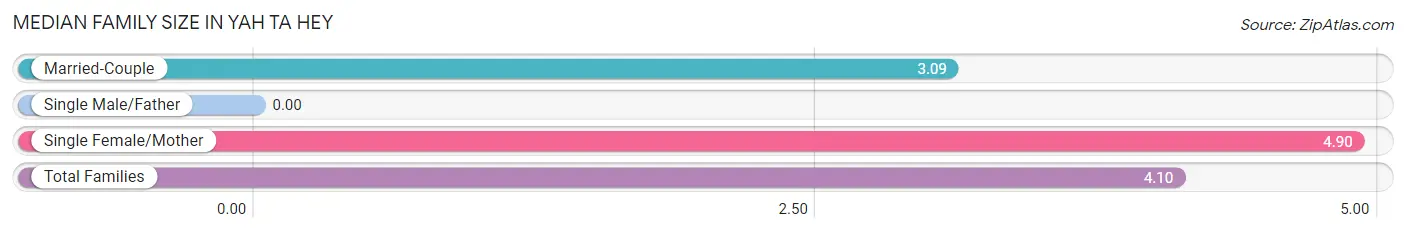
| Family Type | # Families | Family Size |
| Married-Couple | 66 (44.3%) | 3.09 |
| Single Male/Father | 0 (0.0%) | - |
| Single Female/Mother | 83 (55.7%) | 4.90 |
| Total Families | 149 (100.0%) | 4.10 |
Median Household Size in Yah ta hey
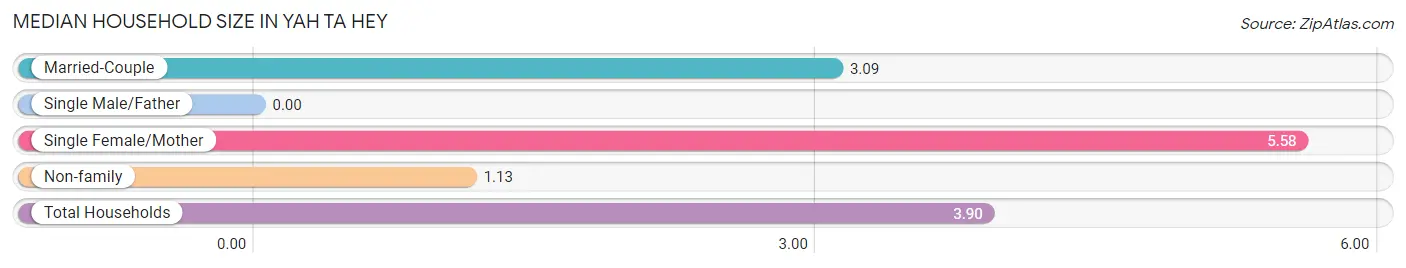
| Household Type | # Households | Household Size |
| Married-Couple | 66 (36.7%) | 3.09 |
| Single Male/Father | 0 (0.0%) | - |
| Single Female/Mother | 83 (46.1%) | 5.58 |
| Non-family | 31 (17.2%) | 1.13 |
| Total Households | 180 (100.0%) | 3.90 |
Household Size by Marriage Status in Yah ta hey
Out of a total of 180 households in Yah ta hey, 149 (82.8%) are family households, while 31 (17.2%) are nonfamily households. The most numerous type of family households are 2-person households, comprising 63, and the most common type of nonfamily households are 1-person households, comprising 26.
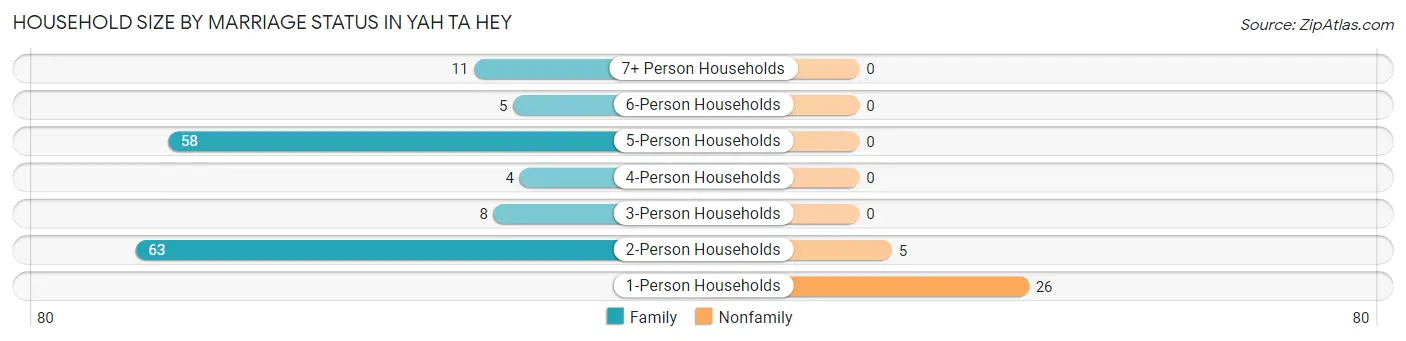
| Household Size | Family Households | Nonfamily Households |
| 1-Person Households | - | 26 (14.4%) |
| 2-Person Households | 63 (35.0%) | 5 (2.8%) |
| 3-Person Households | 8 (4.4%) | 0 (0.0%) |
| 4-Person Households | 4 (2.2%) | 0 (0.0%) |
| 5-Person Households | 58 (32.2%) | 0 (0.0%) |
| 6-Person Households | 5 (2.8%) | 0 (0.0%) |
| 7+ Person Households | 11 (6.1%) | 0 (0.0%) |
| Total | 149 (82.8%) | 31 (17.2%) |
Female Fertility in Yah ta hey
Fertility by Age in Yah ta hey
Average fertility rate in Yah ta hey is 18.0 births per 1,000 women. Women in the age bracket of 15 to 19 years have the highest fertility rate with 167.0 births per 1,000 women. Women in the age bracket of 15 to 19 years acount for 100.0% of all women with births.
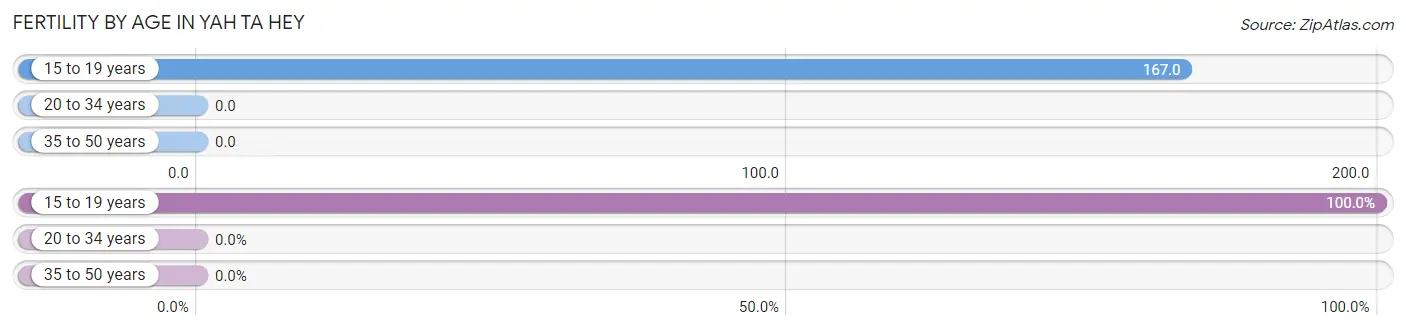
| Age Bracket | Women with Births | Births / 1,000 Women |
| 15 to 19 years | 4 (100.0%) | 167.0 |
| 20 to 34 years | 0 (0.0%) | 0.0 |
| 35 to 50 years | 0 (0.0%) | 0.0 |
| Total | 4 (100.0%) | 18.0 |
Fertility by Age by Marriage Status in Yah ta hey
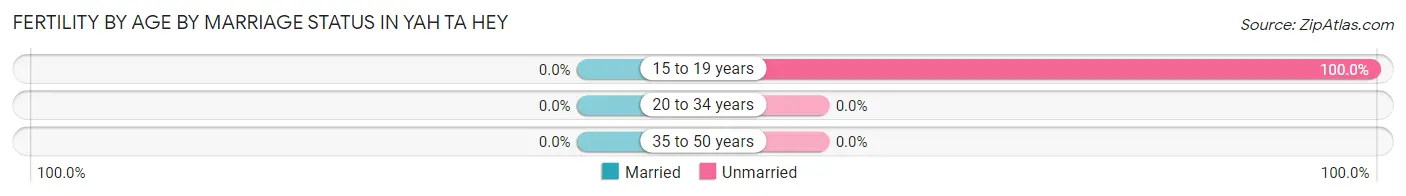
| Age Bracket | Married | Unmarried |
| 15 to 19 years | 0 (0.0%) | 4 (100.0%) |
| 20 to 34 years | 0 (0.0%) | 0 (0.0%) |
| 35 to 50 years | 0 (0.0%) | 0 (0.0%) |
| Total | 0 (0.0%) | 4 (100.0%) |
Fertility by Education in Yah ta hey
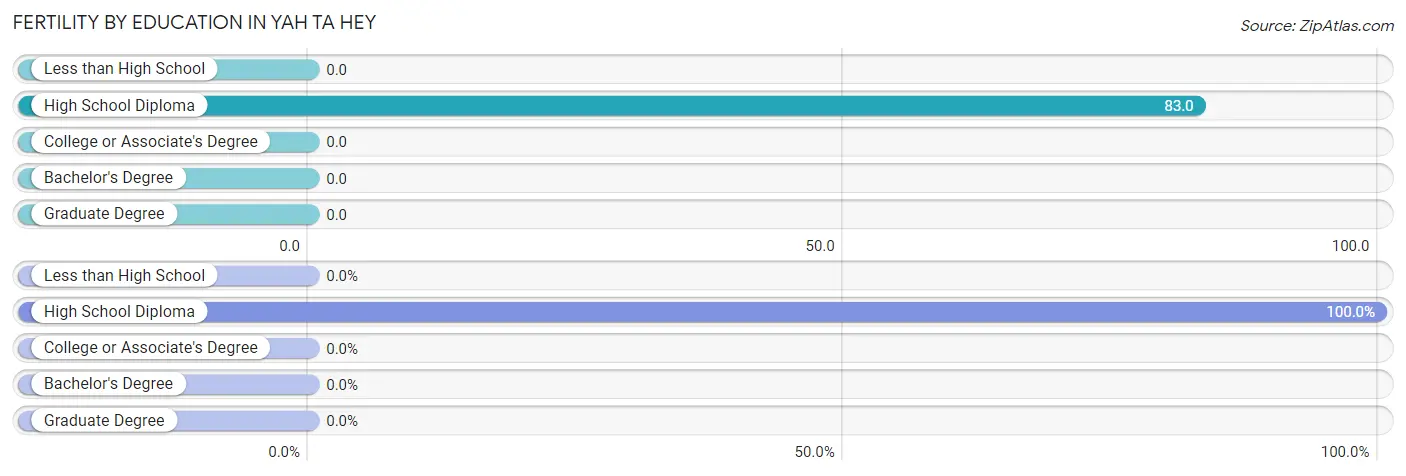
| Educational Attainment | Women with Births | Births / 1,000 Women |
| Less than High School | 0 (0.0%) | 0.0 |
| High School Diploma | 4 (100.0%) | 83.0 |
| College or Associate's Degree | 0 (0.0%) | 0.0 |
| Bachelor's Degree | 0 (0.0%) | 0.0 |
| Graduate Degree | 0 (0.0%) | 0.0 |
| Total | 4 (100.0%) | 18.0 |
Fertility by Education by Marriage Status in Yah ta hey
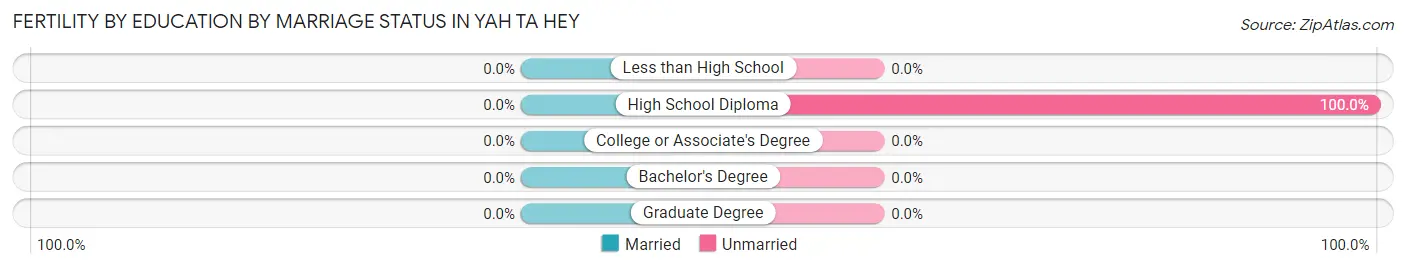
| Educational Attainment | Married | Unmarried |
| Less than High School | 0 (0.0%) | 0 (0.0%) |
| High School Diploma | 0 (0.0%) | 4 (100.0%) |
| College or Associate's Degree | 0 (0.0%) | 0 (0.0%) |
| Bachelor's Degree | 0 (0.0%) | 0 (0.0%) |
| Graduate Degree | 0 (0.0%) | 0 (0.0%) |
| Total | 0 (0.0%) | 4 (100.0%) |
Employment Characteristics in Yah ta hey
Employment by Class of Employer in Yah ta hey
Among the 195 employed individuals in Yah ta hey, private company employees (167 | 85.6%), not-for-profit organizations (9 | 4.6%), and local government employees (7 | 3.6%) make up the most common classes of employment.
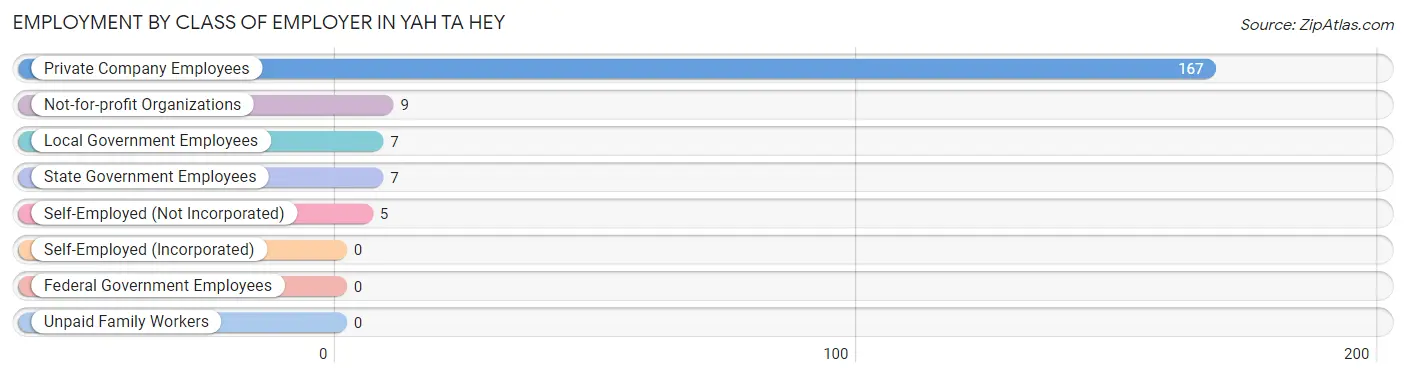
| Employer Class | # Employees | % Employees |
| Private Company Employees | 167 | 85.6% |
| Self-Employed (Incorporated) | 0 | 0.0% |
| Self-Employed (Not Incorporated) | 5 | 2.6% |
| Not-for-profit Organizations | 9 | 4.6% |
| Local Government Employees | 7 | 3.6% |
| State Government Employees | 7 | 3.6% |
| Federal Government Employees | 0 | 0.0% |
| Unpaid Family Workers | 0 | 0.0% |
| Total | 195 | 100.0% |
Employment Status by Age in Yah ta hey
According to the labor force statistics for Yah ta hey, out of the total population over 16 years of age (642), 32.7% or 210 individuals are in the labor force, with 7.1% or 15 of them unemployed. The age group with the highest labor force participation rate is 35 to 44 years, with 92.7% or 127 individuals in the labor force. Within the labor force, the 60 to 64 years age range has the highest percentage of unemployed individuals, with 100.0% or 5 of them being unemployed.
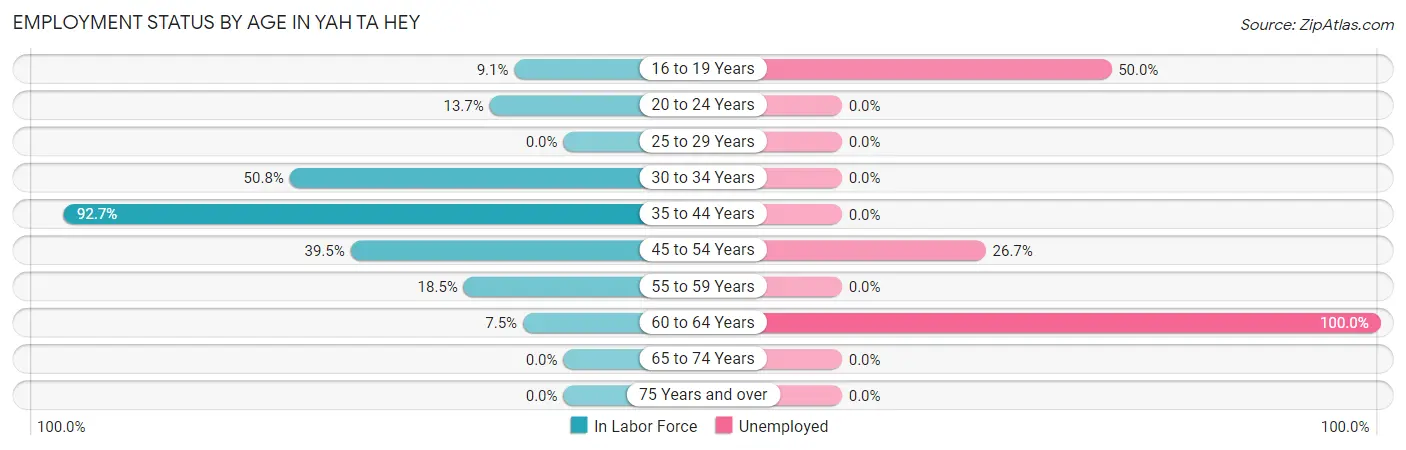
| Age Bracket | In Labor Force | Unemployed |
| 16 to 19 Years | 12 (9.1%) | 6 (50.0%) |
| 20 to 24 Years | 14 (13.7%) | 0 (0.0%) |
| 25 to 29 Years | 0 (0.0%) | 0 (0.0%) |
| 30 to 34 Years | 32 (50.8%) | 0 (0.0%) |
| 35 to 44 Years | 127 (92.7%) | 0 (0.0%) |
| 45 to 54 Years | 15 (39.5%) | 4 (26.7%) |
| 55 to 59 Years | 5 (18.5%) | 0 (0.0%) |
| 60 to 64 Years | 5 (7.5%) | 5 (100.0%) |
| 65 to 74 Years | 0 (0.0%) | 0 (0.0%) |
| 75 Years and over | 0 (0.0%) | 0 (0.0%) |
| Total | 210 (32.7%) | 15 (7.1%) |
Employment Status by Educational Attainment in Yah ta hey
According to labor force statistics for Yah ta hey, 54.4% of individuals (184) out of the total population between 25 and 64 years of age (338) are in the labor force, with 4.9% or 9 of them being unemployed. The group with the highest labor force participation rate are those with the educational attainment of college / associate degree, with 81.3% or 126 individuals in the labor force. Within the labor force, individuals with less than high school education have the highest percentage of unemployment, with 17.9% or 5 of them being unemployed.
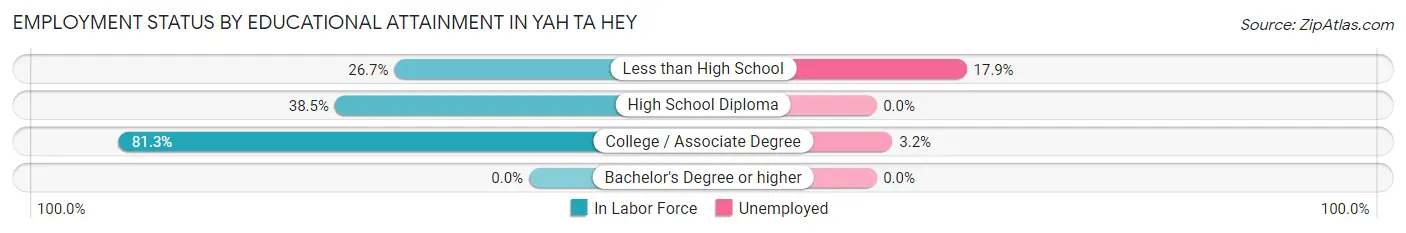
| Educational Attainment | In Labor Force | Unemployed |
| Less than High School | 28 (26.7%) | 19 (17.9%) |
| High School Diploma | 30 (38.5%) | 0 (0.0%) |
| College / Associate Degree | 126 (81.3%) | 5 (3.2%) |
| Bachelor's Degree or higher | 0 (0.0%) | 0 (0.0%) |
| Total | 184 (54.4%) | 17 (4.9%) |
Employment Occupations by Sex in Yah ta hey
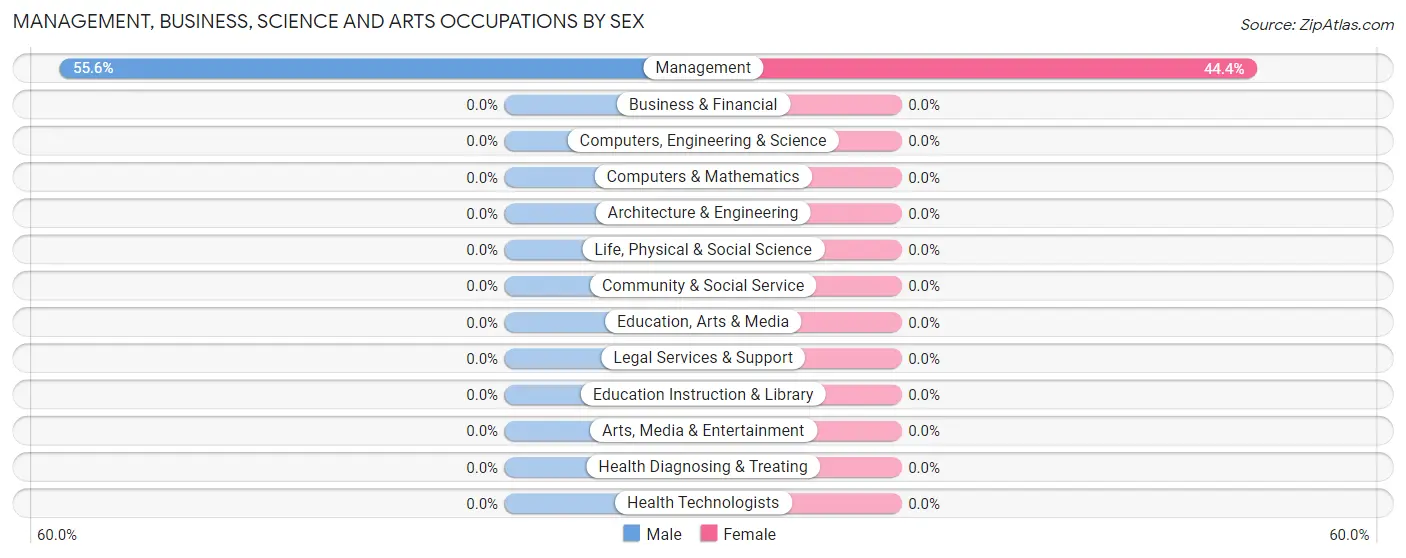
Management, Business, Science and Arts Occupations
The most common Management, Business, Science and Arts occupations in Yah ta hey are , and Management (9 | 4.6%).
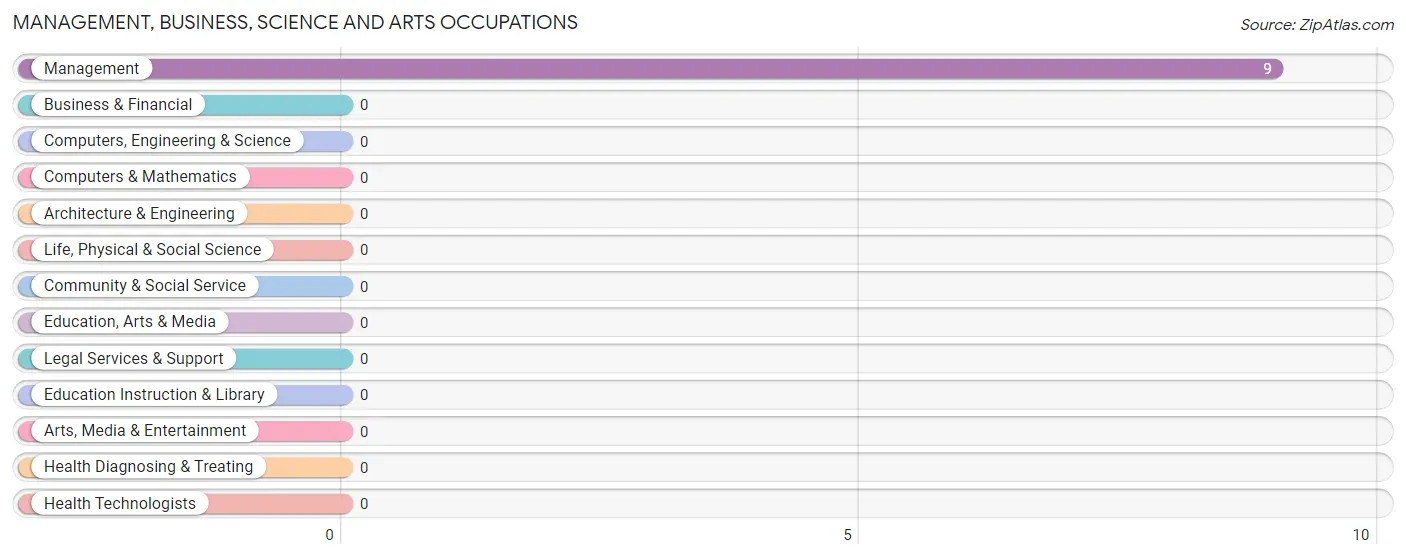
Management, Business, Science and Arts Occupations by Sex
| Occupation | Male | Female |
| Management | 5 (55.6%) | 4 (44.4%) |
| Business & Financial | 0 (0.0%) | 0 (0.0%) |
| Computers, Engineering & Science | 0 (0.0%) | 0 (0.0%) |
| Computers & Mathematics | 0 (0.0%) | 0 (0.0%) |
| Architecture & Engineering | 0 (0.0%) | 0 (0.0%) |
| Life, Physical & Social Science | 0 (0.0%) | 0 (0.0%) |
| Community & Social Service | 0 (0.0%) | 0 (0.0%) |
| Education, Arts & Media | 0 (0.0%) | 0 (0.0%) |
| Legal Services & Support | 0 (0.0%) | 0 (0.0%) |
| Education Instruction & Library | 0 (0.0%) | 0 (0.0%) |
| Arts, Media & Entertainment | 0 (0.0%) | 0 (0.0%) |
| Health Diagnosing & Treating | 0 (0.0%) | 0 (0.0%) |
| Health Technologists | 0 (0.0%) | 0 (0.0%) |
| Total (Category) | 5 (55.6%) | 4 (44.4%) |
| Total (Overall) | 106 (54.4%) | 89 (45.6%) |
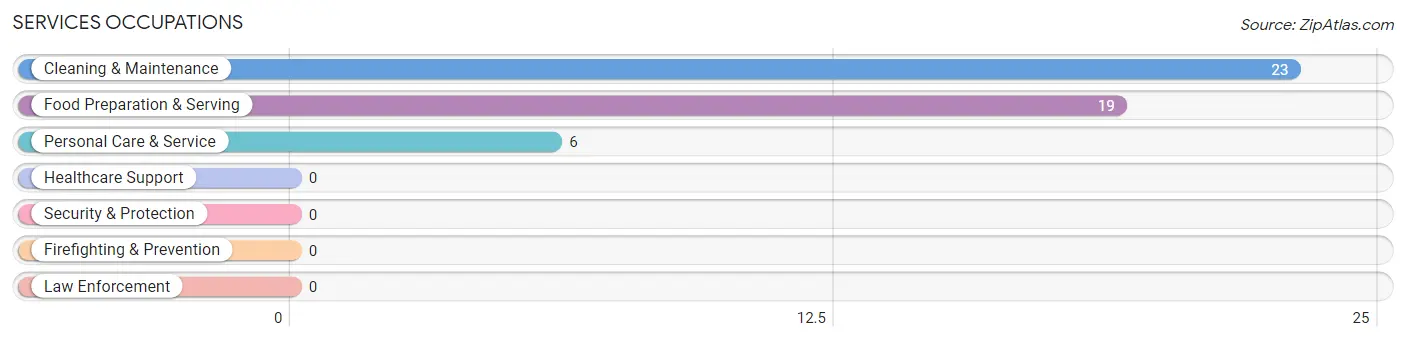
Services Occupations
The most common Services occupations in Yah ta hey are Cleaning & Maintenance (23 | 11.8%), Food Preparation & Serving (19 | 9.7%), and Personal Care & Service (6 | 3.1%).
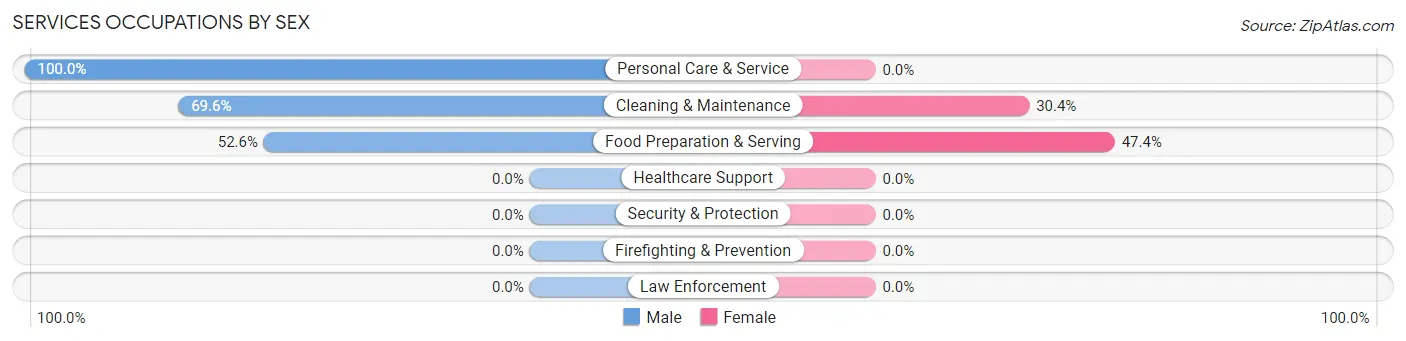
Services Occupations by Sex
Within the Services occupations in Yah ta hey, the most male-oriented occupations are Personal Care & Service (100.0%), Cleaning & Maintenance (69.6%), and Food Preparation & Serving (52.6%), while the most female-oriented occupations are Food Preparation & Serving (47.4%), and Cleaning & Maintenance (30.4%).
| Occupation | Male | Female |
| Healthcare Support | 0 (0.0%) | 0 (0.0%) |
| Security & Protection | 0 (0.0%) | 0 (0.0%) |
| Firefighting & Prevention | 0 (0.0%) | 0 (0.0%) |
| Law Enforcement | 0 (0.0%) | 0 (0.0%) |
| Food Preparation & Serving | 10 (52.6%) | 9 (47.4%) |
| Cleaning & Maintenance | 16 (69.6%) | 7 (30.4%) |
| Personal Care & Service | 6 (100.0%) | 0 (0.0%) |
| Total (Category) | 32 (66.7%) | 16 (33.3%) |
| Total (Overall) | 106 (54.4%) | 89 (45.6%) |
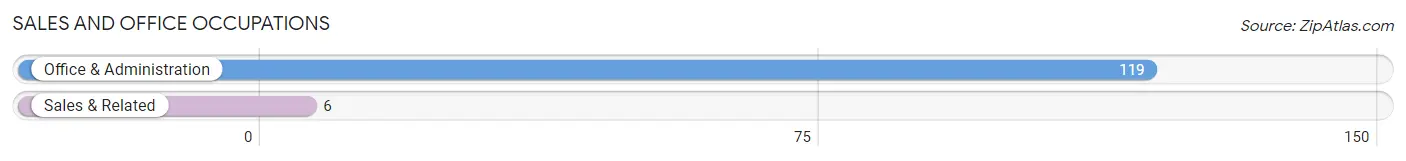
Sales and Office Occupations
The most common Sales and Office occupations in Yah ta hey are Office & Administration (119 | 61.0%), and Sales & Related (6 | 3.1%).
Sales and Office Occupations by Sex

| Occupation | Male | Female |
| Sales & Related | 0 (0.0%) | 6 (100.0%) |
| Office & Administration | 56 (47.1%) | 63 (52.9%) |
| Total (Category) | 56 (44.8%) | 69 (55.2%) |
| Total (Overall) | 106 (54.4%) | 89 (45.6%) |
Natural Resources, Construction and Maintenance Occupations
Natural Resources, Construction and Maintenance Occupations by Sex
| Occupation | Male | Female |
| Farming, Fishing & Forestry | 0 (0.0%) | 0 (0.0%) |
| Construction & Extraction | 0 (0.0%) | 0 (0.0%) |
| Installation, Maintenance & Repair | 0 (0.0%) | 0 (0.0%) |
| Total (Category) | 0 (0.0%) | 0 (0.0%) |
| Total (Overall) | 106 (54.4%) | 89 (45.6%) |
Production, Transportation and Moving Occupations
The most common Production, Transportation and Moving occupations in Yah ta hey are Production (5 | 2.6%), Transportation (5 | 2.6%), and Material Moving (3 | 1.5%).
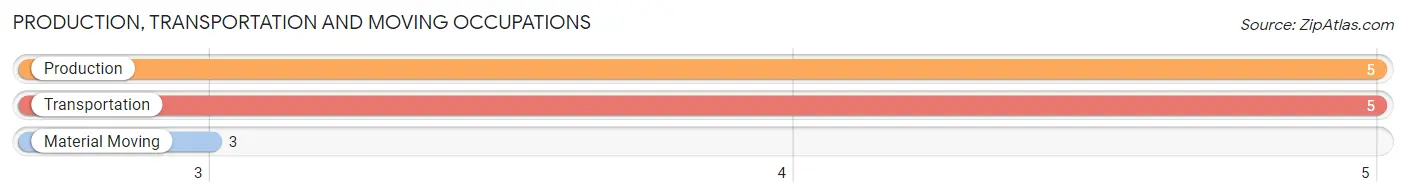
Production, Transportation and Moving Occupations by Sex
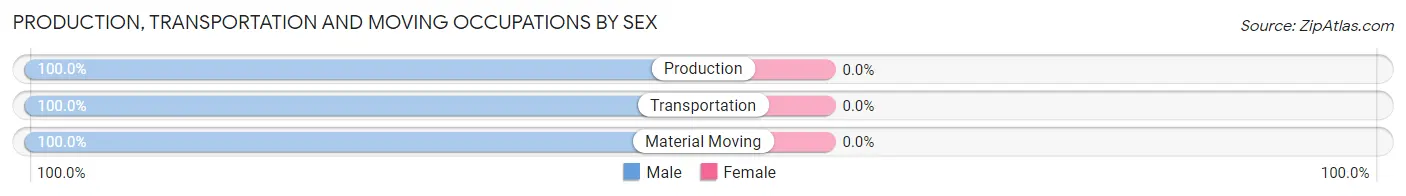
| Occupation | Male | Female |
| Production | 5 (100.0%) | 0 (0.0%) |
| Transportation | 5 (100.0%) | 0 (0.0%) |
| Material Moving | 3 (100.0%) | 0 (0.0%) |
| Total (Category) | 13 (100.0%) | 0 (0.0%) |
| Total (Overall) | 106 (54.4%) | 89 (45.6%) |
Employment Industries by Sex in Yah ta hey
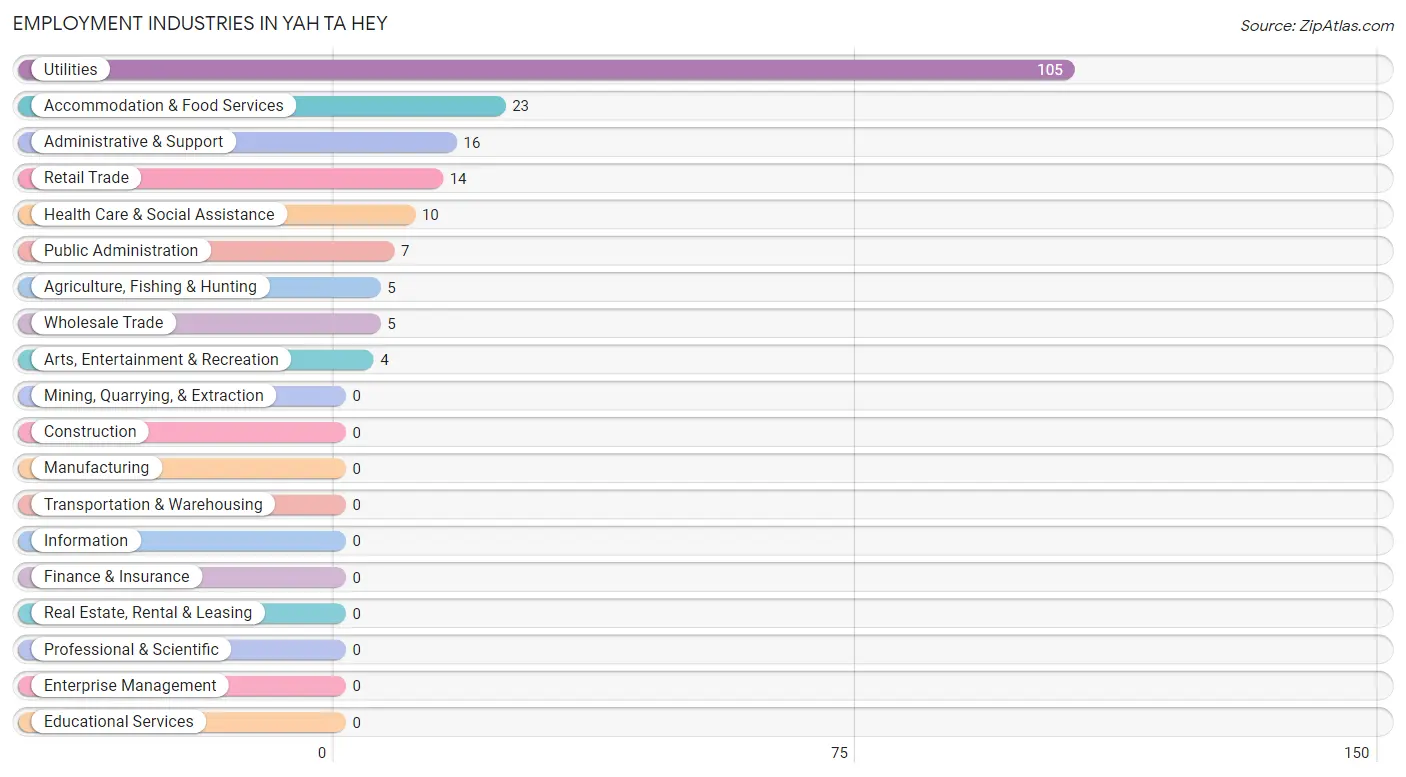
Employment Industries in Yah ta hey
The major employment industries in Yah ta hey include Utilities (105 | 53.8%), Accommodation & Food Services (23 | 11.8%), Administrative & Support (16 | 8.2%), Retail Trade (14 | 7.2%), and Health Care & Social Assistance (10 | 5.1%).
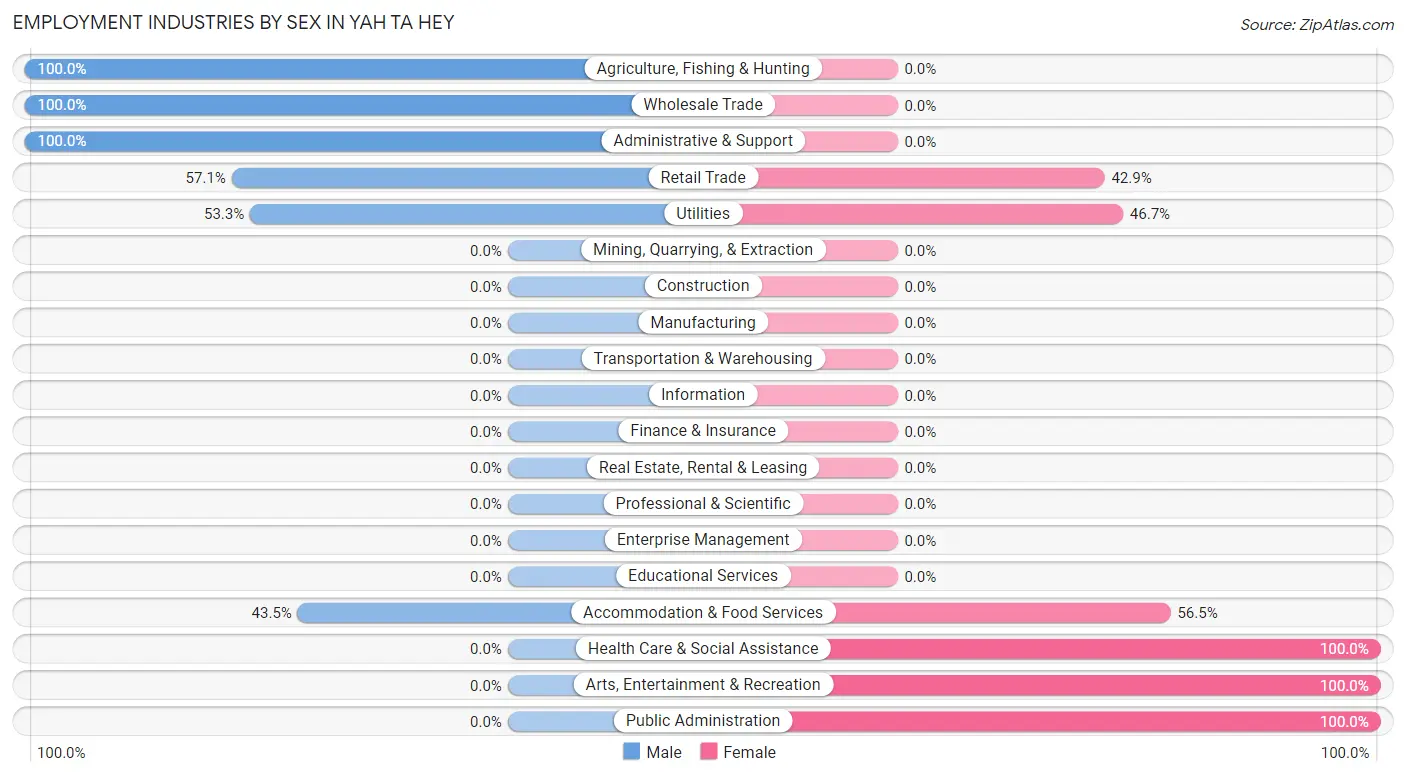
Employment Industries by Sex in Yah ta hey
The Yah ta hey industries that see more men than women are Agriculture, Fishing & Hunting (100.0%), Wholesale Trade (100.0%), and Administrative & Support (100.0%), whereas the industries that tend to have a higher number of women are Health Care & Social Assistance (100.0%), Arts, Entertainment & Recreation (100.0%), and Public Administration (100.0%).
| Industry | Male | Female |
| Agriculture, Fishing & Hunting | 5 (100.0%) | 0 (0.0%) |
| Mining, Quarrying, & Extraction | 0 (0.0%) | 0 (0.0%) |
| Construction | 0 (0.0%) | 0 (0.0%) |
| Manufacturing | 0 (0.0%) | 0 (0.0%) |
| Wholesale Trade | 5 (100.0%) | 0 (0.0%) |
| Retail Trade | 8 (57.1%) | 6 (42.9%) |
| Transportation & Warehousing | 0 (0.0%) | 0 (0.0%) |
| Utilities | 56 (53.3%) | 49 (46.7%) |
| Information | 0 (0.0%) | 0 (0.0%) |
| Finance & Insurance | 0 (0.0%) | 0 (0.0%) |
| Real Estate, Rental & Leasing | 0 (0.0%) | 0 (0.0%) |
| Professional & Scientific | 0 (0.0%) | 0 (0.0%) |
| Enterprise Management | 0 (0.0%) | 0 (0.0%) |
| Administrative & Support | 16 (100.0%) | 0 (0.0%) |
| Educational Services | 0 (0.0%) | 0 (0.0%) |
| Health Care & Social Assistance | 0 (0.0%) | 10 (100.0%) |
| Arts, Entertainment & Recreation | 0 (0.0%) | 4 (100.0%) |
| Accommodation & Food Services | 10 (43.5%) | 13 (56.5%) |
| Public Administration | 0 (0.0%) | 7 (100.0%) |
| Total | 106 (54.4%) | 89 (45.6%) |
Education in Yah ta hey
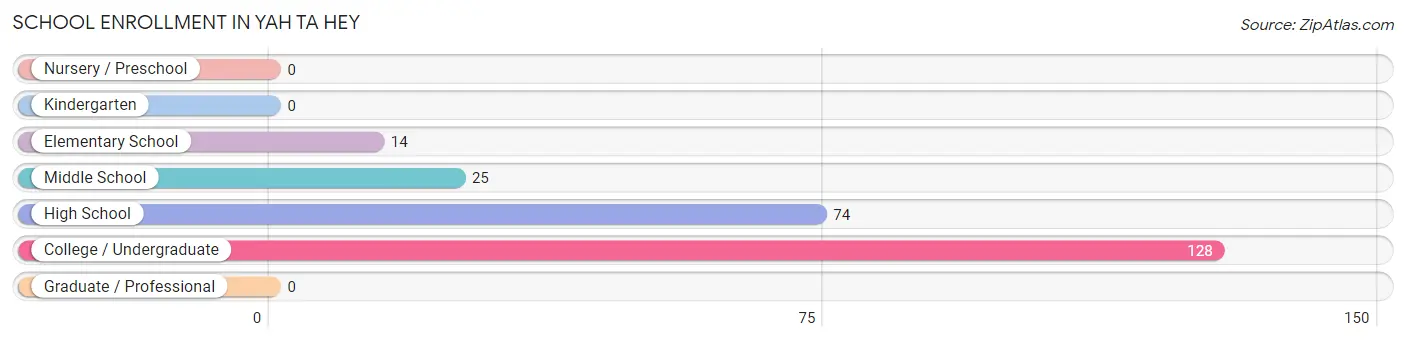
School Enrollment in Yah ta hey
The most common levels of schooling among the 241 students in Yah ta hey are college / undergraduate (128 | 53.1%), high school (74 | 30.7%), and middle school (25 | 10.4%).
| School Level | # Students | % Students |
| Nursery / Preschool | 0 | 0.0% |
| Kindergarten | 0 | 0.0% |
| Elementary School | 14 | 5.8% |
| Middle School | 25 | 10.4% |
| High School | 74 | 30.7% |
| College / Undergraduate | 128 | 53.1% |
| Graduate / Professional | 0 | 0.0% |
| Total | 241 | 100.0% |
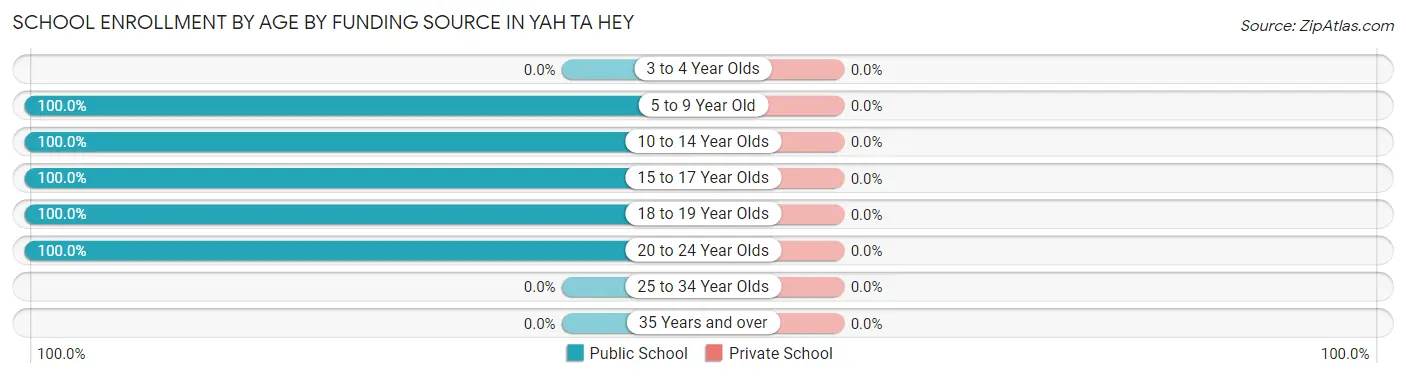
School Enrollment by Age by Funding Source in Yah ta hey
| Age Bracket | Public School | Private School |
| 3 to 4 Year Olds | 0 (0.0%) | 0 (0.0%) |
| 5 to 9 Year Old | 14 (100.0%) | 0 (0.0%) |
| 10 to 14 Year Olds | 25 (100.0%) | 0 (0.0%) |
| 15 to 17 Year Olds | 65 (100.0%) | 0 (0.0%) |
| 18 to 19 Year Olds | 60 (100.0%) | 0 (0.0%) |
| 20 to 24 Year Olds | 77 (100.0%) | 0 (0.0%) |
| 25 to 34 Year Olds | 0 (0.0%) | 0 (0.0%) |
| 35 Years and over | 0 (0.0%) | 0 (0.0%) |
| Total | 241 (100.0%) | 0 (0.0%) |
Educational Attainment by Field of Study in Yah ta hey
| Field of Study | # Graduates | % Graduates |
| Computers & Mathematics | 0 | 0.0% |
| Bio, Nature & Agricultural | 0 | 0.0% |
| Physical & Health Sciences | 0 | 0.0% |
| Psychology | 0 | 0.0% |
| Social Sciences | 0 | 0.0% |
| Engineering | 0 | 0.0% |
| Multidisciplinary Studies | 0 | 0.0% |
| Science & Technology | 0 | 0.0% |
| Business | 0 | 0.0% |
| Education | 0 | 0.0% |
| Literature & Languages | 0 | 0.0% |
| Liberal Arts & History | 0 | 0.0% |
| Visual & Performing Arts | 0 | 0.0% |
| Communications | 0 | 0.0% |
| Arts & Humanities | 0 | 0.0% |
| Total | 0 | 0.0% |
Transportation & Commute in Yah ta hey
Vehicle Availability by Sex in Yah ta hey
The most prevalent vehicle ownership categories in Yah ta hey are males with 4 vehicles (56, accounting for 52.8%) and females with 4 vehicles (49, making up 68.3%).
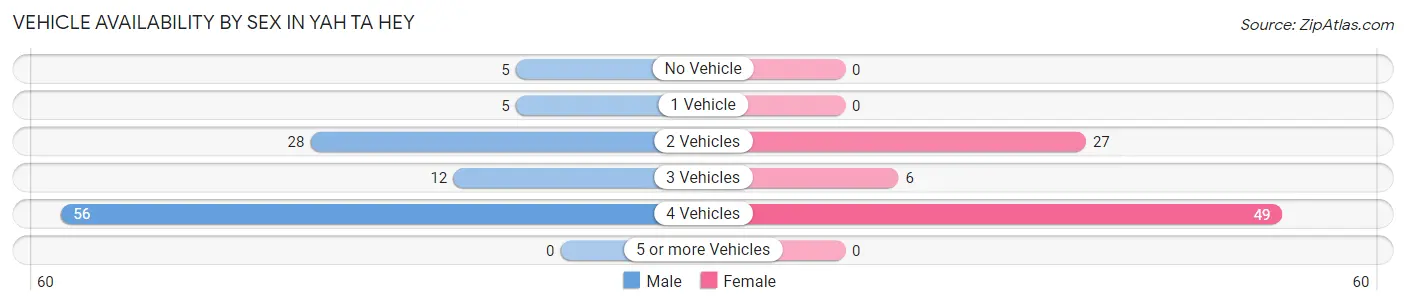
| Vehicles Available | Male | Female |
| No Vehicle | 5 (4.7%) | 0 (0.0%) |
| 1 Vehicle | 5 (4.7%) | 0 (0.0%) |
| 2 Vehicles | 28 (26.4%) | 27 (32.9%) |
| 3 Vehicles | 12 (11.3%) | 6 (7.3%) |
| 4 Vehicles | 56 (52.8%) | 49 (59.8%) |
| 5 or more Vehicles | 0 (0.0%) | 0 (0.0%) |
| Total | 106 (100.0%) | 82 (100.0%) |
Commute Time in Yah ta hey
The most frequently occuring commute durations in Yah ta hey are 45 to 59 minutes (105 commuters, 53.8%), 20 to 24 minutes (45 commuters, 23.1%), and 30 to 34 minutes (14 commuters, 7.2%).
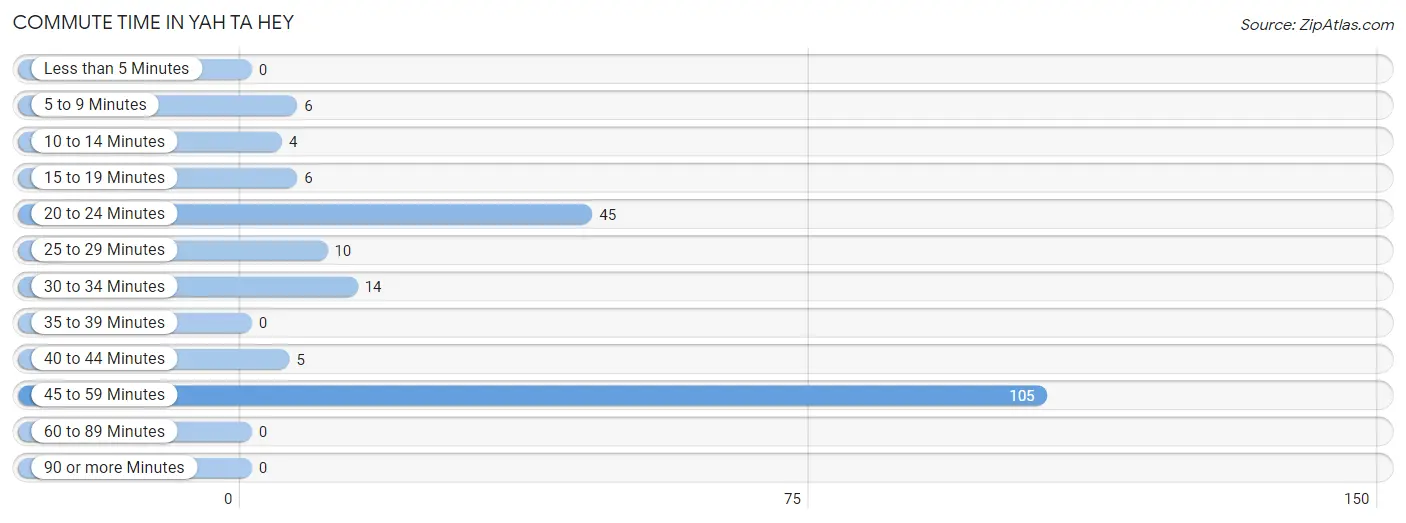
| Commute Time | # Commuters | % Commuters |
| Less than 5 Minutes | 0 | 0.0% |
| 5 to 9 Minutes | 6 | 3.1% |
| 10 to 14 Minutes | 4 | 2.1% |
| 15 to 19 Minutes | 6 | 3.1% |
| 20 to 24 Minutes | 45 | 23.1% |
| 25 to 29 Minutes | 10 | 5.1% |
| 30 to 34 Minutes | 14 | 7.2% |
| 35 to 39 Minutes | 0 | 0.0% |
| 40 to 44 Minutes | 5 | 2.6% |
| 45 to 59 Minutes | 105 | 53.8% |
| 60 to 89 Minutes | 0 | 0.0% |
| 90 or more Minutes | 0 | 0.0% |
Commute Time by Sex in Yah ta hey
The most common commute times in Yah ta hey are 45 to 59 minutes (56 commuters, 52.8%) for males and 45 to 59 minutes (49 commuters, 55.1%) for females.
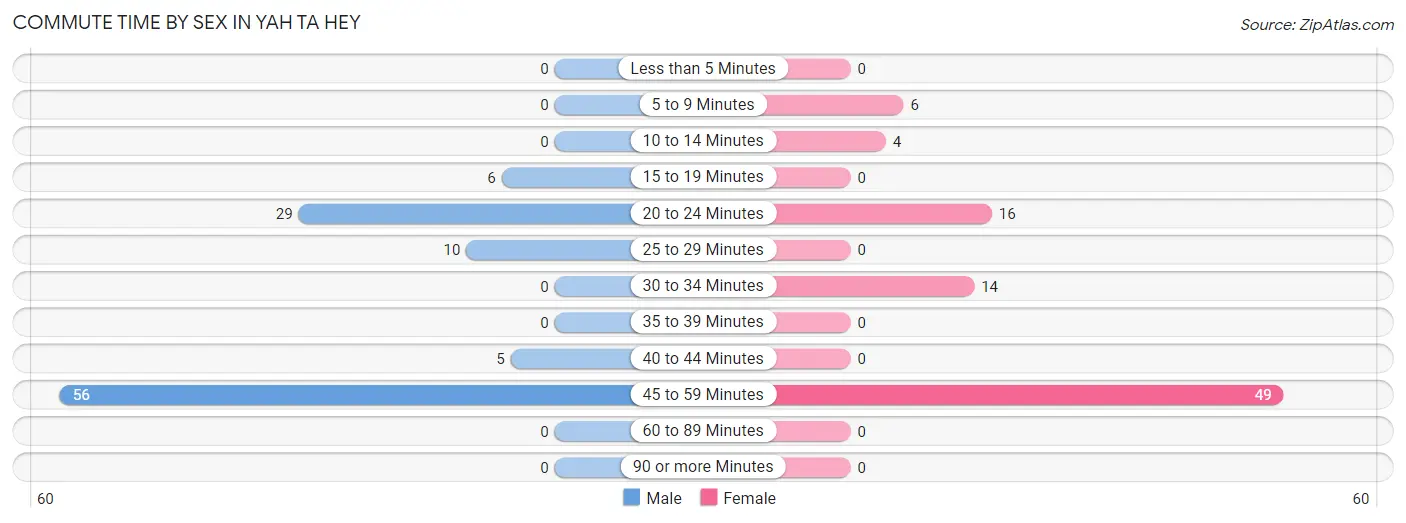
| Commute Time | Male | Female |
| Less than 5 Minutes | 0 (0.0%) | 0 (0.0%) |
| 5 to 9 Minutes | 0 (0.0%) | 6 (6.7%) |
| 10 to 14 Minutes | 0 (0.0%) | 4 (4.5%) |
| 15 to 19 Minutes | 6 (5.7%) | 0 (0.0%) |
| 20 to 24 Minutes | 29 (27.4%) | 16 (18.0%) |
| 25 to 29 Minutes | 10 (9.4%) | 0 (0.0%) |
| 30 to 34 Minutes | 0 (0.0%) | 14 (15.7%) |
| 35 to 39 Minutes | 0 (0.0%) | 0 (0.0%) |
| 40 to 44 Minutes | 5 (4.7%) | 0 (0.0%) |
| 45 to 59 Minutes | 56 (52.8%) | 49 (55.1%) |
| 60 to 89 Minutes | 0 (0.0%) | 0 (0.0%) |
| 90 or more Minutes | 0 (0.0%) | 0 (0.0%) |
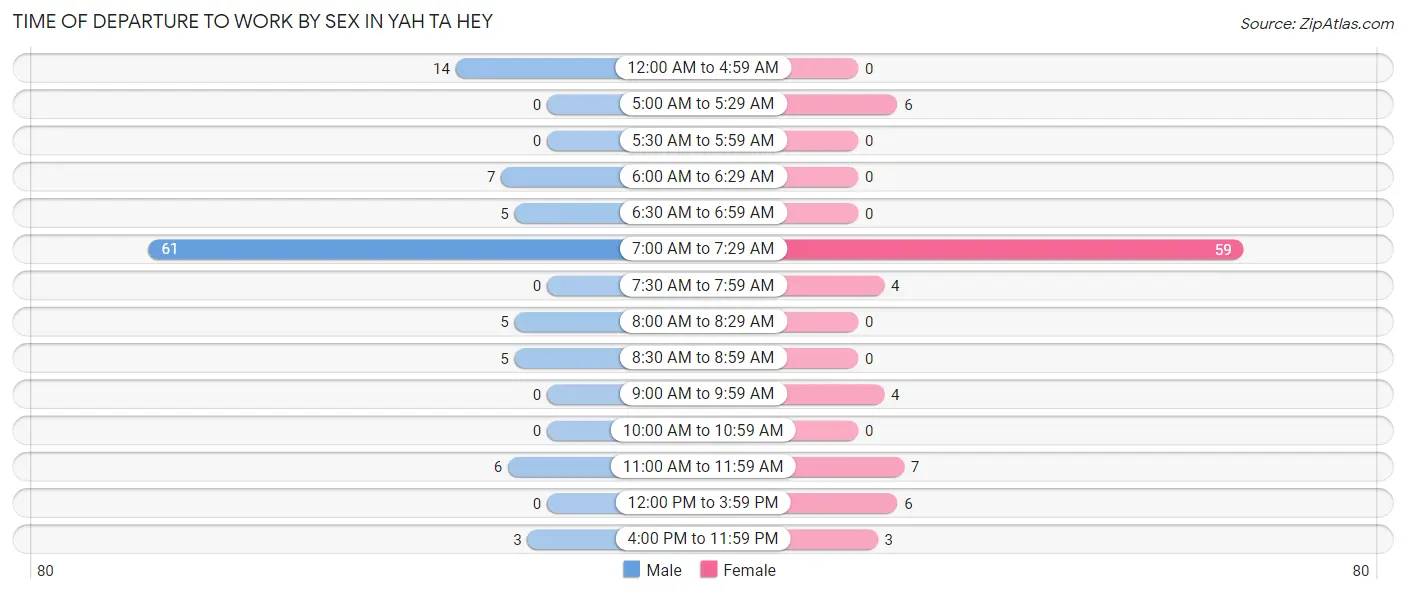
Time of Departure to Work by Sex in Yah ta hey
The most frequent times of departure to work in Yah ta hey are 7:00 AM to 7:29 AM (61, 57.6%) for males and 7:00 AM to 7:29 AM (59, 66.3%) for females.
| Time of Departure | Male | Female |
| 12:00 AM to 4:59 AM | 14 (13.2%) | 0 (0.0%) |
| 5:00 AM to 5:29 AM | 0 (0.0%) | 6 (6.7%) |
| 5:30 AM to 5:59 AM | 0 (0.0%) | 0 (0.0%) |
| 6:00 AM to 6:29 AM | 7 (6.6%) | 0 (0.0%) |
| 6:30 AM to 6:59 AM | 5 (4.7%) | 0 (0.0%) |
| 7:00 AM to 7:29 AM | 61 (57.6%) | 59 (66.3%) |
| 7:30 AM to 7:59 AM | 0 (0.0%) | 4 (4.5%) |
| 8:00 AM to 8:29 AM | 5 (4.7%) | 0 (0.0%) |
| 8:30 AM to 8:59 AM | 5 (4.7%) | 0 (0.0%) |
| 9:00 AM to 9:59 AM | 0 (0.0%) | 4 (4.5%) |
| 10:00 AM to 10:59 AM | 0 (0.0%) | 0 (0.0%) |
| 11:00 AM to 11:59 AM | 6 (5.7%) | 7 (7.9%) |
| 12:00 PM to 3:59 PM | 0 (0.0%) | 6 (6.7%) |
| 4:00 PM to 11:59 PM | 3 (2.8%) | 3 (3.4%) |
| Total | 106 (100.0%) | 89 (100.0%) |
Housing Occupancy in Yah ta hey
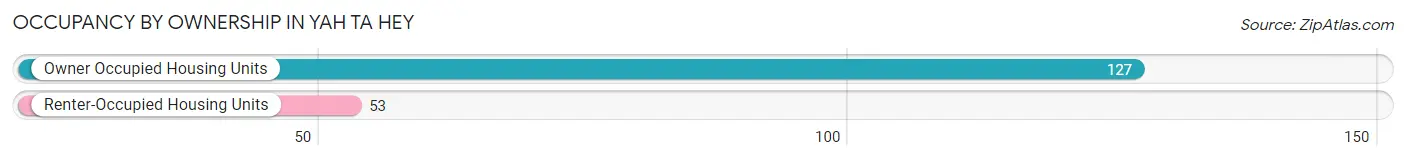
Occupancy by Ownership in Yah ta hey
Of the total 180 dwellings in Yah ta hey, owner-occupied units account for 127 (70.6%), while renter-occupied units make up 53 (29.4%).
| Occupancy | # Housing Units | % Housing Units |
| Owner Occupied Housing Units | 127 | 70.6% |
| Renter-Occupied Housing Units | 53 | 29.4% |
| Total Occupied Housing Units | 180 | 100.0% |
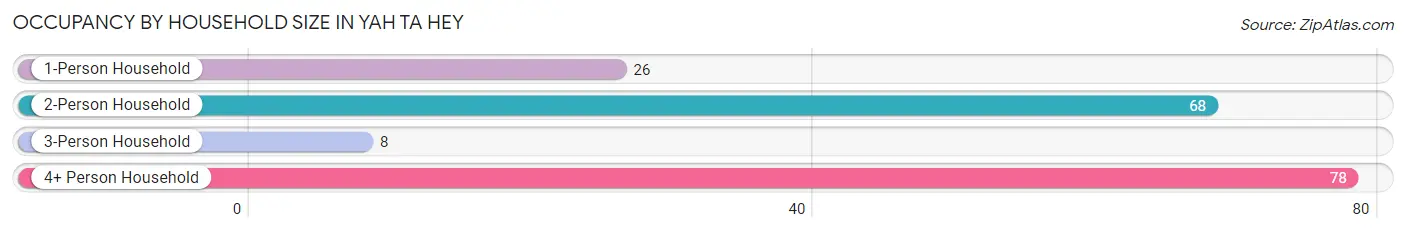
Occupancy by Household Size in Yah ta hey
| Household Size | # Housing Units | % Housing Units |
| 1-Person Household | 26 | 14.4% |
| 2-Person Household | 68 | 37.8% |
| 3-Person Household | 8 | 4.4% |
| 4+ Person Household | 78 | 43.3% |
| Total Housing Units | 180 | 100.0% |
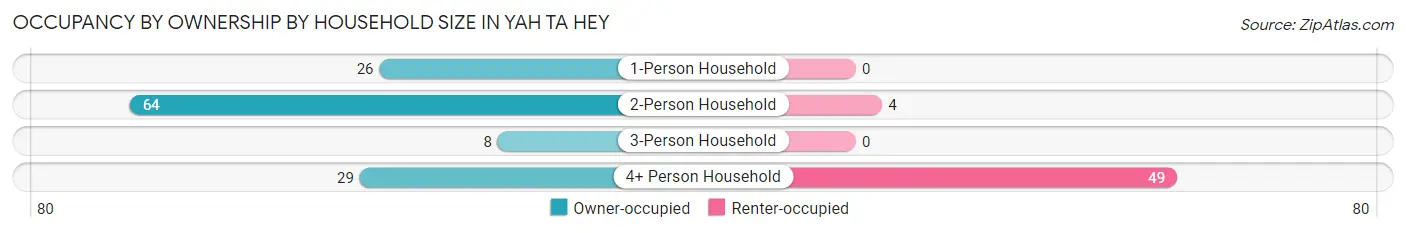
Occupancy by Ownership by Household Size in Yah ta hey
| Household Size | Owner-occupied | Renter-occupied |
| 1-Person Household | 26 (100.0%) | 0 (0.0%) |
| 2-Person Household | 64 (94.1%) | 4 (5.9%) |
| 3-Person Household | 8 (100.0%) | 0 (0.0%) |
| 4+ Person Household | 29 (37.2%) | 49 (62.8%) |
| Total Housing Units | 127 (70.6%) | 53 (29.4%) |
Occupancy by Educational Attainment in Yah ta hey
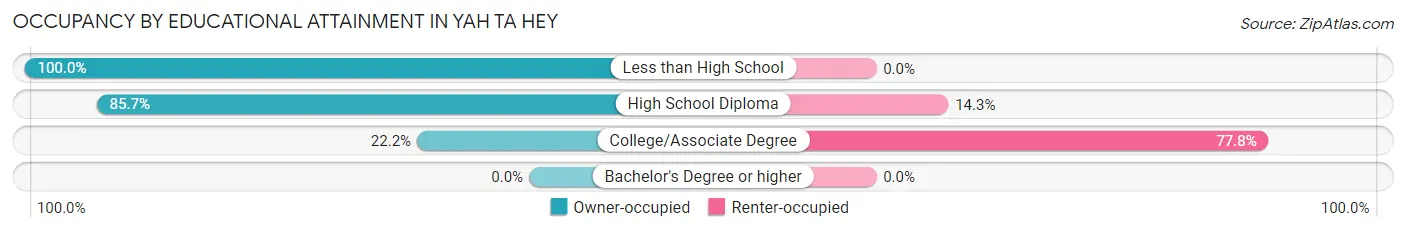
| Household Size | Owner-occupied | Renter-occupied |
| Less than High School | 89 (100.0%) | 0 (0.0%) |
| High School Diploma | 24 (85.7%) | 4 (14.3%) |
| College/Associate Degree | 14 (22.2%) | 49 (77.8%) |
| Bachelor's Degree or higher | 0 (0.0%) | 0 (0.0%) |
Occupancy by Age of Householder in Yah ta hey
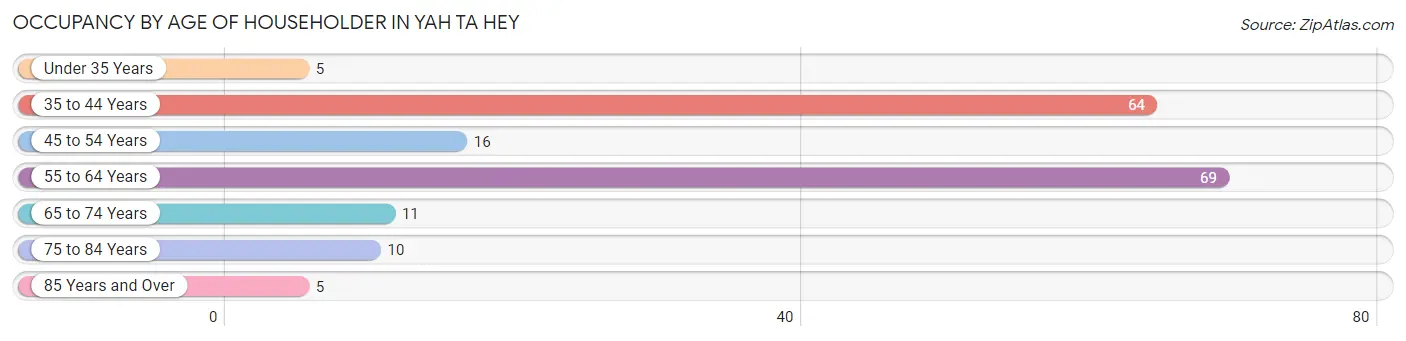
| Age Bracket | # Households | % Households |
| Under 35 Years | 5 | 2.8% |
| 35 to 44 Years | 64 | 35.6% |
| 45 to 54 Years | 16 | 8.9% |
| 55 to 64 Years | 69 | 38.3% |
| 65 to 74 Years | 11 | 6.1% |
| 75 to 84 Years | 10 | 5.6% |
| 85 Years and Over | 5 | 2.8% |
| Total | 180 | 100.0% |
Housing Finances in Yah ta hey
Median Income by Occupancy in Yah ta hey
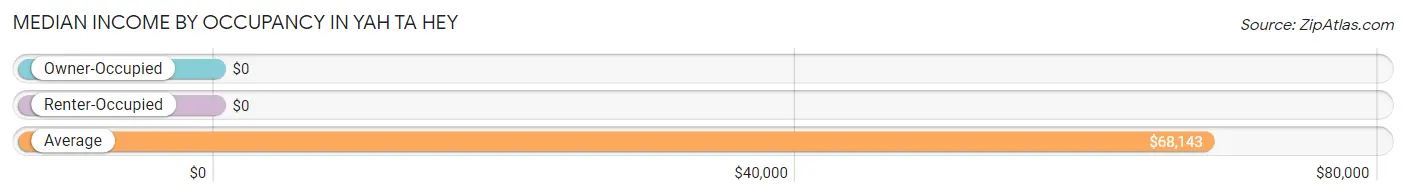
| Occupancy Type | # Households | Median Income |
| Owner-Occupied | 127 (70.6%) | $0 |
| Renter-Occupied | 53 (29.4%) | $0 |
| Average | 180 (100.0%) | $68,143 |
Occupancy by Householder Income Bracket in Yah ta hey
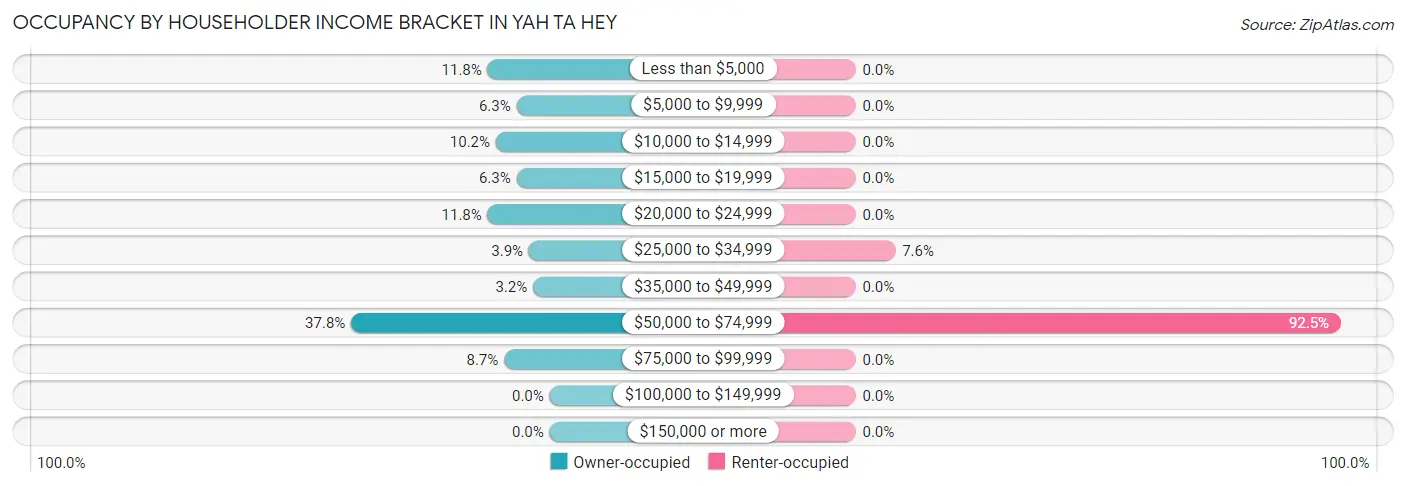
| Income Bracket | Owner-occupied | Renter-occupied |
| Less than $5,000 | 15 (11.8%) | 0 (0.0%) |
| $5,000 to $9,999 | 8 (6.3%) | 0 (0.0%) |
| $10,000 to $14,999 | 13 (10.2%) | 0 (0.0%) |
| $15,000 to $19,999 | 8 (6.3%) | 0 (0.0%) |
| $20,000 to $24,999 | 15 (11.8%) | 0 (0.0%) |
| $25,000 to $34,999 | 5 (3.9%) | 4 (7.5%) |
| $35,000 to $49,999 | 4 (3.2%) | 0 (0.0%) |
| $50,000 to $74,999 | 48 (37.8%) | 49 (92.4%) |
| $75,000 to $99,999 | 11 (8.7%) | 0 (0.0%) |
| $100,000 to $149,999 | 0 (0.0%) | 0 (0.0%) |
| $150,000 or more | 0 (0.0%) | 0 (0.0%) |
| Total | 127 (100.0%) | 53 (100.0%) |
Monthly Housing Cost Tiers in Yah ta hey
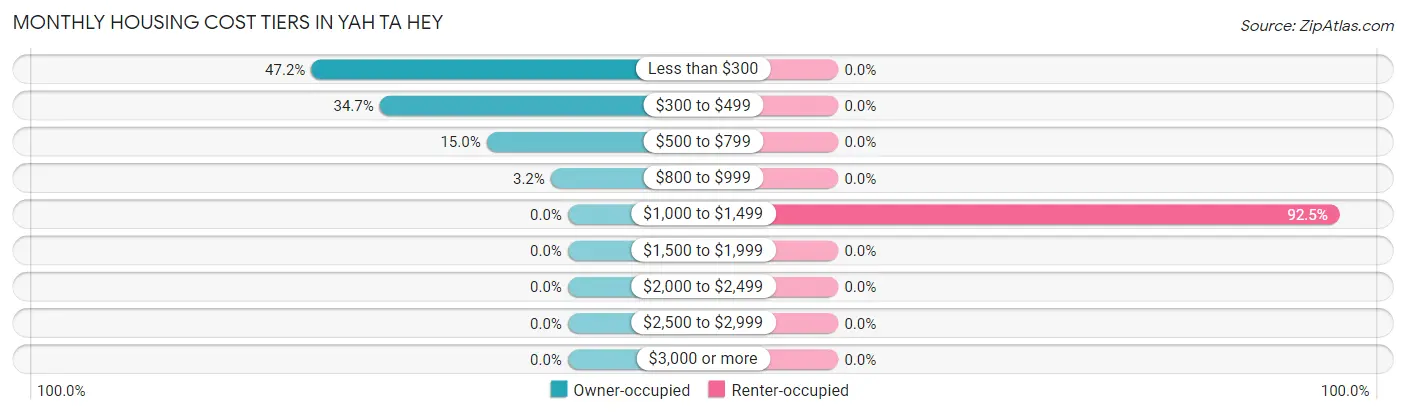
| Monthly Cost | Owner-occupied | Renter-occupied |
| Less than $300 | 60 (47.2%) | 0 (0.0%) |
| $300 to $499 | 44 (34.6%) | 0 (0.0%) |
| $500 to $799 | 19 (15.0%) | 0 (0.0%) |
| $800 to $999 | 4 (3.2%) | 0 (0.0%) |
| $1,000 to $1,499 | 0 (0.0%) | 49 (92.4%) |
| $1,500 to $1,999 | 0 (0.0%) | 0 (0.0%) |
| $2,000 to $2,499 | 0 (0.0%) | 0 (0.0%) |
| $2,500 to $2,999 | 0 (0.0%) | 0 (0.0%) |
| $3,000 or more | 0 (0.0%) | 0 (0.0%) |
| Total | 127 (100.0%) | 53 (100.0%) |
Physical Housing Characteristics in Yah ta hey
Housing Structures in Yah ta hey
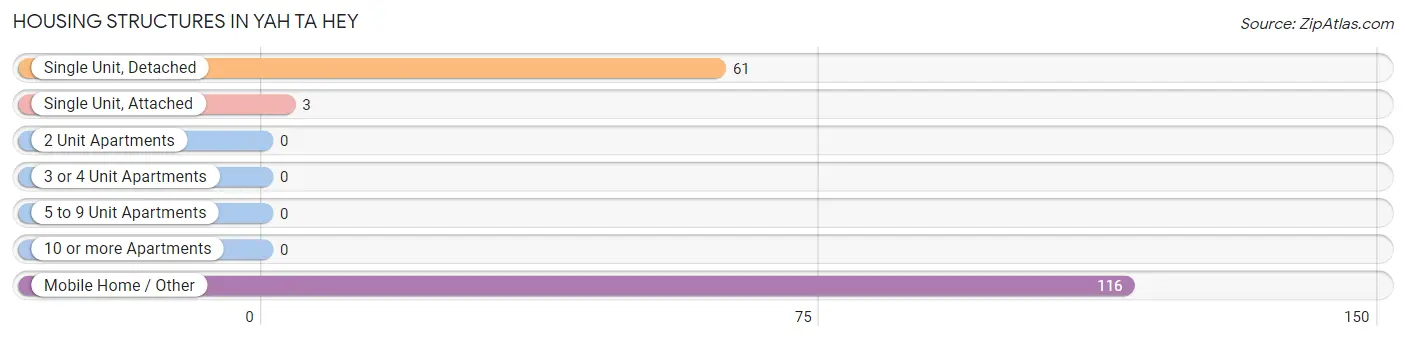
| Structure Type | # Housing Units | % Housing Units |
| Single Unit, Detached | 61 | 33.9% |
| Single Unit, Attached | 3 | 1.7% |
| 2 Unit Apartments | 0 | 0.0% |
| 3 or 4 Unit Apartments | 0 | 0.0% |
| 5 to 9 Unit Apartments | 0 | 0.0% |
| 10 or more Apartments | 0 | 0.0% |
| Mobile Home / Other | 116 | 64.4% |
| Total | 180 | 100.0% |
Housing Structures by Occupancy in Yah ta hey
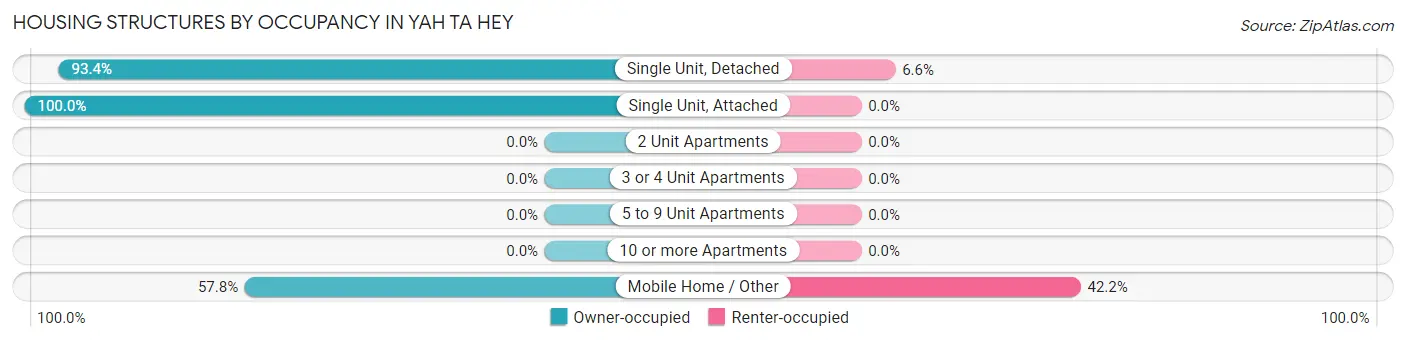
| Structure Type | Owner-occupied | Renter-occupied |
| Single Unit, Detached | 57 (93.4%) | 4 (6.6%) |
| Single Unit, Attached | 3 (100.0%) | 0 (0.0%) |
| 2 Unit Apartments | 0 (0.0%) | 0 (0.0%) |
| 3 or 4 Unit Apartments | 0 (0.0%) | 0 (0.0%) |
| 5 to 9 Unit Apartments | 0 (0.0%) | 0 (0.0%) |
| 10 or more Apartments | 0 (0.0%) | 0 (0.0%) |
| Mobile Home / Other | 67 (57.8%) | 49 (42.2%) |
| Total | 127 (70.6%) | 53 (29.4%) |
Housing Structures by Number of Rooms in Yah ta hey
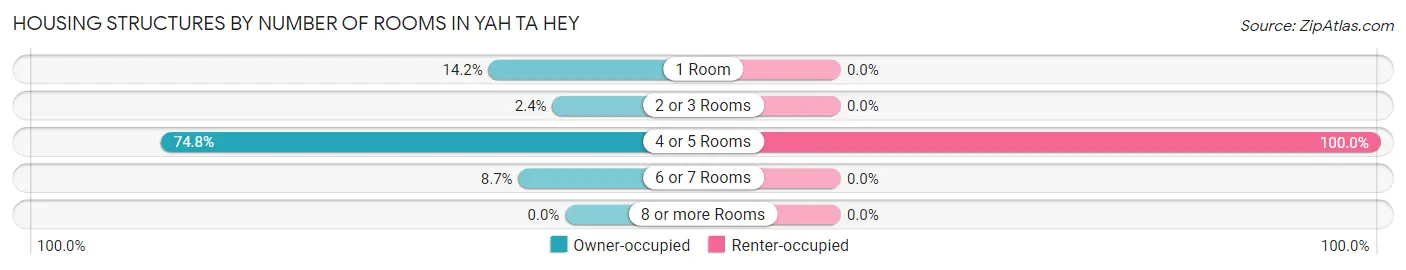
| Number of Rooms | Owner-occupied | Renter-occupied |
| 1 Room | 18 (14.2%) | 0 (0.0%) |
| 2 or 3 Rooms | 3 (2.4%) | 0 (0.0%) |
| 4 or 5 Rooms | 95 (74.8%) | 53 (100.0%) |
| 6 or 7 Rooms | 11 (8.7%) | 0 (0.0%) |
| 8 or more Rooms | 0 (0.0%) | 0 (0.0%) |
| Total | 127 (100.0%) | 53 (100.0%) |
Housing Structure by Heating Type in Yah ta hey
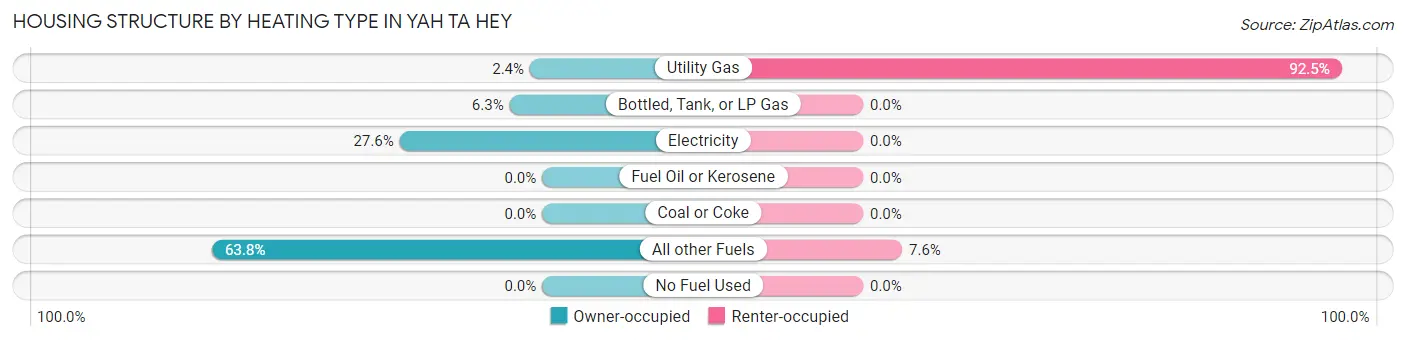
| Heating Type | Owner-occupied | Renter-occupied |
| Utility Gas | 3 (2.4%) | 49 (92.4%) |
| Bottled, Tank, or LP Gas | 8 (6.3%) | 0 (0.0%) |
| Electricity | 35 (27.6%) | 0 (0.0%) |
| Fuel Oil or Kerosene | 0 (0.0%) | 0 (0.0%) |
| Coal or Coke | 0 (0.0%) | 0 (0.0%) |
| All other Fuels | 81 (63.8%) | 4 (7.5%) |
| No Fuel Used | 0 (0.0%) | 0 (0.0%) |
| Total | 127 (100.0%) | 53 (100.0%) |
Household Vehicle Usage in Yah ta hey
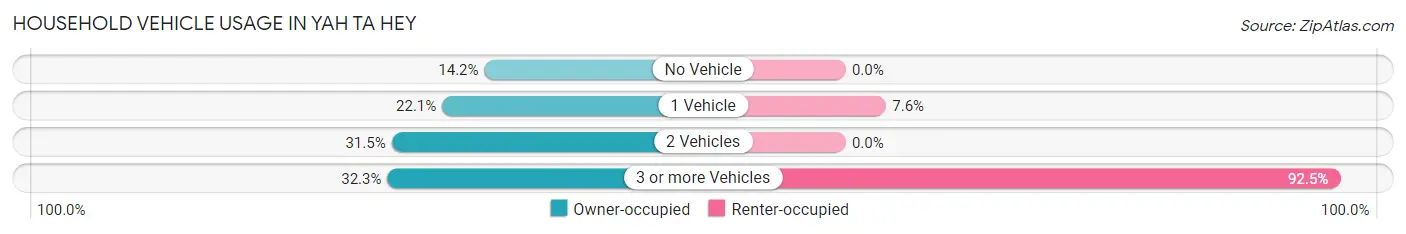
| Vehicles per Household | Owner-occupied | Renter-occupied |
| No Vehicle | 18 (14.2%) | 0 (0.0%) |
| 1 Vehicle | 28 (22.1%) | 4 (7.5%) |
| 2 Vehicles | 40 (31.5%) | 0 (0.0%) |
| 3 or more Vehicles | 41 (32.3%) | 49 (92.4%) |
| Total | 127 (100.0%) | 53 (100.0%) |
Real Estate & Mortgages in Yah ta hey
Real Estate and Mortgage Overview in Yah ta hey
| Characteristic | Without Mortgage | With Mortgage |
| Housing Units | 119 | 8 |
| Median Property Value | - | - |
| Median Household Income | - | - |
| Monthly Housing Costs | $306 | $0 |
| Real Estate Taxes | - | - |
Property Value by Mortgage Status in Yah ta hey
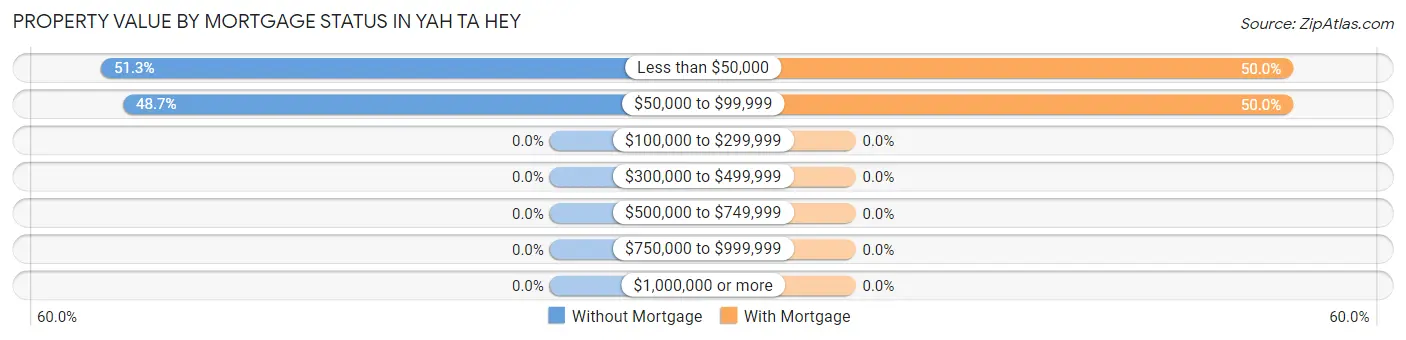
| Property Value | Without Mortgage | With Mortgage |
| Less than $50,000 | 61 (51.3%) | 4 (50.0%) |
| $50,000 to $99,999 | 58 (48.7%) | 4 (50.0%) |
| $100,000 to $299,999 | 0 (0.0%) | 0 (0.0%) |
| $300,000 to $499,999 | 0 (0.0%) | 0 (0.0%) |
| $500,000 to $749,999 | 0 (0.0%) | 0 (0.0%) |
| $750,000 to $999,999 | 0 (0.0%) | 0 (0.0%) |
| $1,000,000 or more | 0 (0.0%) | 0 (0.0%) |
| Total | 119 (100.0%) | 8 (100.0%) |
Household Income by Mortgage Status in Yah ta hey
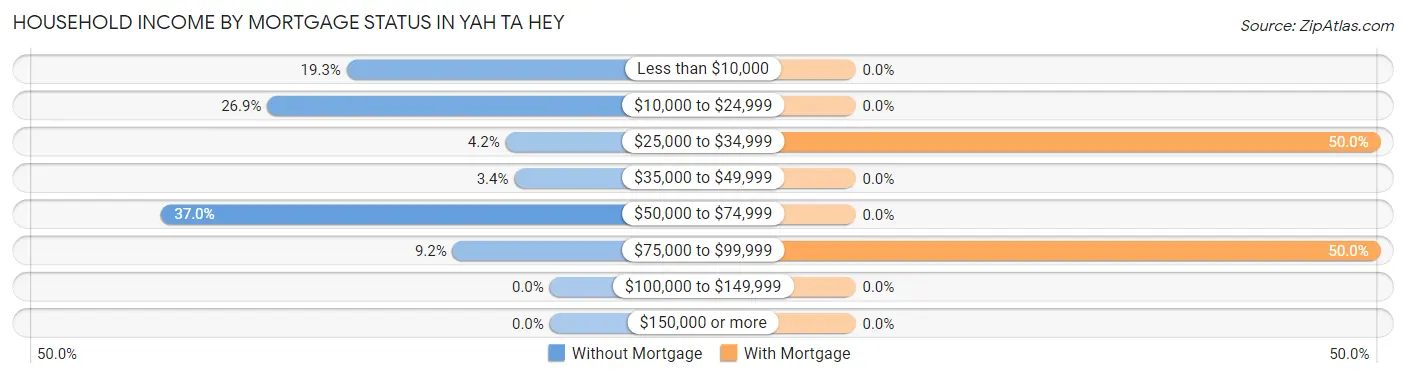
| Household Income | Without Mortgage | With Mortgage |
| Less than $10,000 | 23 (19.3%) | 0 (0.0%) |
| $10,000 to $24,999 | 32 (26.9%) | 0 (0.0%) |
| $25,000 to $34,999 | 5 (4.2%) | 4 (50.0%) |
| $35,000 to $49,999 | 4 (3.4%) | 0 (0.0%) |
| $50,000 to $74,999 | 44 (37.0%) | 0 (0.0%) |
| $75,000 to $99,999 | 11 (9.2%) | 4 (50.0%) |
| $100,000 to $149,999 | 0 (0.0%) | 0 (0.0%) |
| $150,000 or more | 0 (0.0%) | 0 (0.0%) |
| Total | 119 (100.0%) | 8 (100.0%) |
Property Value to Household Income Ratio in Yah ta hey
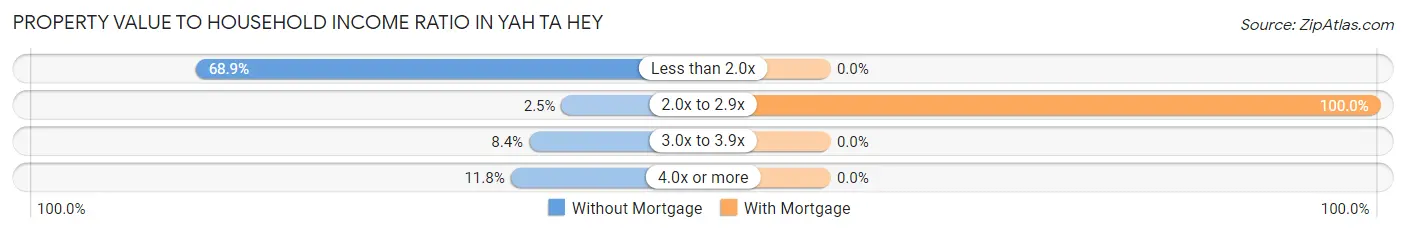
| Value-to-Income Ratio | Without Mortgage | With Mortgage |
| Less than 2.0x | 82 (68.9%) | 0 (0.0%) |
| 2.0x to 2.9x | 3 (2.5%) | 8 (100.0%) |
| 3.0x to 3.9x | 10 (8.4%) | 0 (0.0%) |
| 4.0x or more | 14 (11.8%) | 0 (0.0%) |
| Total | 119 (100.0%) | 8 (100.0%) |
Real Estate Taxes by Mortgage Status in Yah ta hey
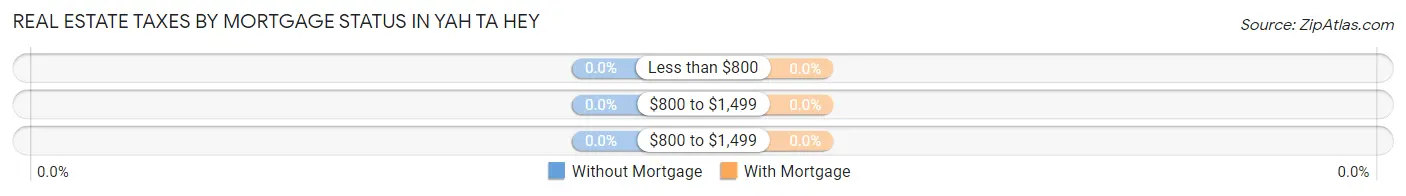
| Property Taxes | Without Mortgage | With Mortgage |
| Less than $800 | 0 (0.0%) | 0 (0.0%) |
| $800 to $1,499 | 0 (0.0%) | 0 (0.0%) |
| $800 to $1,499 | 0 (0.0%) | 0 (0.0%) |
| Total | 119 (100.0%) | 8 (100.0%) |
Health & Disability in Yah ta hey
Health Insurance Coverage by Age in Yah ta hey
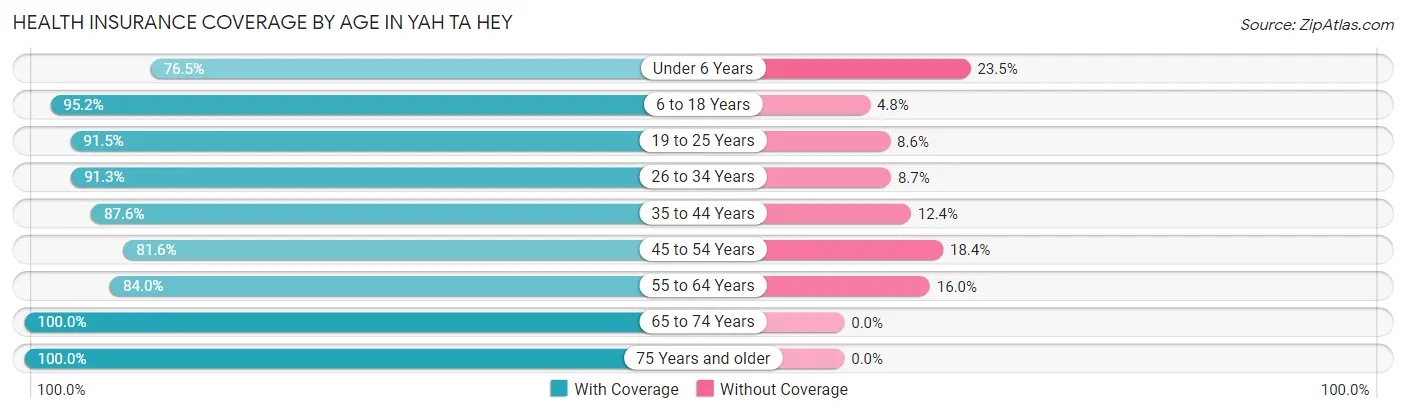
| Age Bracket | With Coverage | Without Coverage |
| Under 6 Years | 13 (76.5%) | 4 (23.5%) |
| 6 to 18 Years | 159 (95.2%) | 8 (4.8%) |
| 19 to 25 Years | 107 (91.4%) | 10 (8.6%) |
| 26 to 34 Years | 63 (91.3%) | 6 (8.7%) |
| 35 to 44 Years | 120 (87.6%) | 17 (12.4%) |
| 45 to 54 Years | 31 (81.6%) | 7 (18.4%) |
| 55 to 64 Years | 79 (84.0%) | 15 (16.0%) |
| 65 to 74 Years | 50 (100.0%) | 0 (0.0%) |
| 75 Years and older | 20 (100.0%) | 0 (0.0%) |
| Total | 642 (90.5%) | 67 (9.5%) |
Health Insurance Coverage by Citizenship Status in Yah ta hey
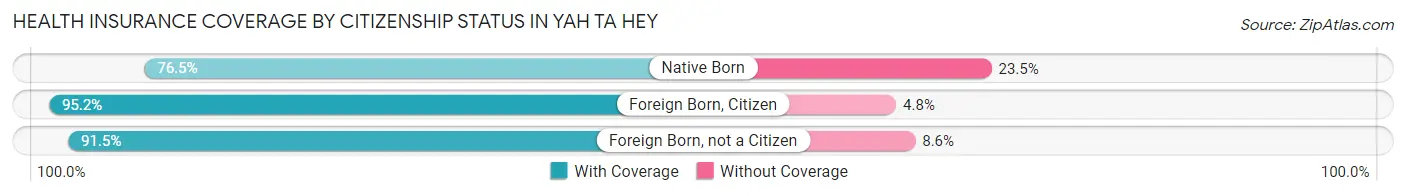
| Citizenship Status | With Coverage | Without Coverage |
| Native Born | 13 (76.5%) | 4 (23.5%) |
| Foreign Born, Citizen | 159 (95.2%) | 8 (4.8%) |
| Foreign Born, not a Citizen | 107 (91.4%) | 10 (8.6%) |
Health Insurance Coverage by Household Income in Yah ta hey
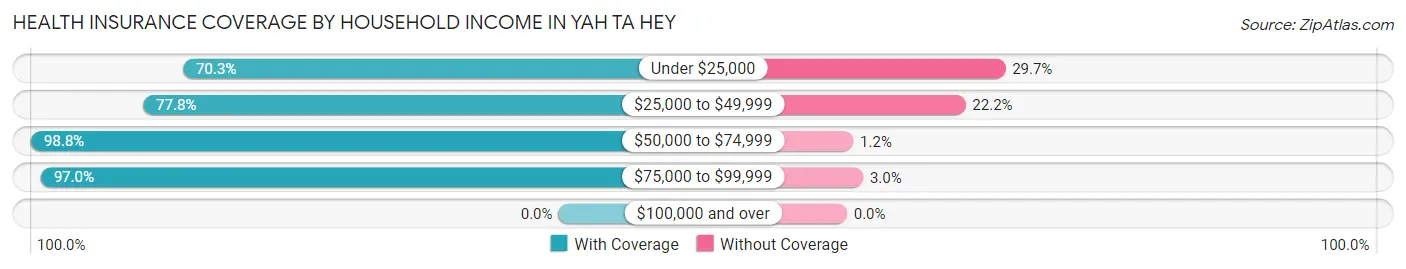
| Household Income | With Coverage | Without Coverage |
| Under $25,000 | 109 (70.3%) | 46 (29.7%) |
| $25,000 to $49,999 | 21 (77.8%) | 6 (22.2%) |
| $50,000 to $74,999 | 416 (98.8%) | 5 (1.2%) |
| $75,000 to $99,999 | 96 (97.0%) | 3 (3.0%) |
| $100,000 and over | 0 (0.0%) | 0 (0.0%) |
Public vs Private Health Insurance Coverage by Age in Yah ta hey
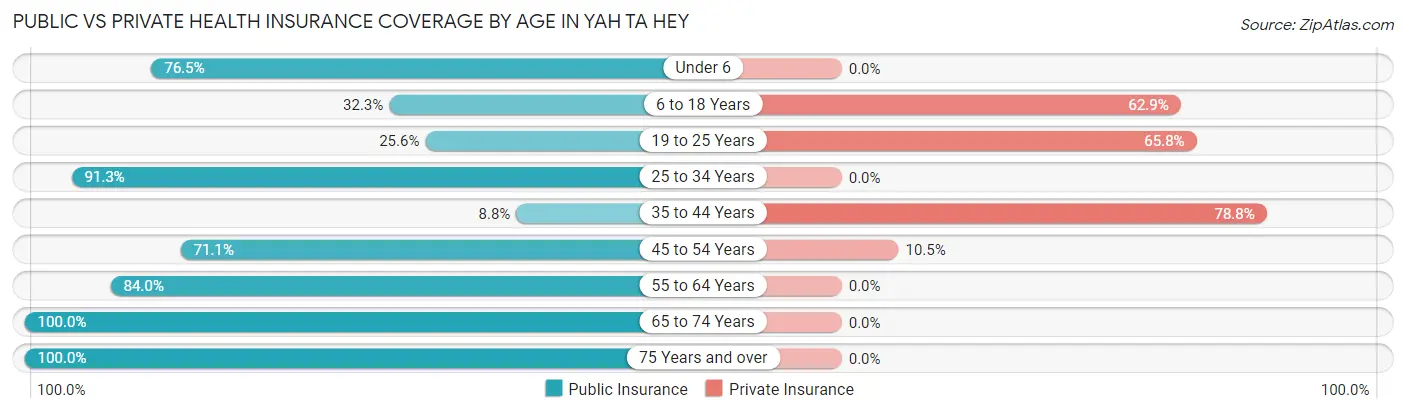
| Age Bracket | Public Insurance | Private Insurance |
| Under 6 | 13 (76.5%) | 0 (0.0%) |
| 6 to 18 Years | 54 (32.3%) | 105 (62.9%) |
| 19 to 25 Years | 30 (25.6%) | 77 (65.8%) |
| 25 to 34 Years | 63 (91.3%) | 0 (0.0%) |
| 35 to 44 Years | 12 (8.8%) | 108 (78.8%) |
| 45 to 54 Years | 27 (71.1%) | 4 (10.5%) |
| 55 to 64 Years | 79 (84.0%) | 0 (0.0%) |
| 65 to 74 Years | 50 (100.0%) | 0 (0.0%) |
| 75 Years and over | 20 (100.0%) | 0 (0.0%) |
| Total | 348 (49.1%) | 294 (41.5%) |
Disability Status by Sex by Age in Yah ta hey
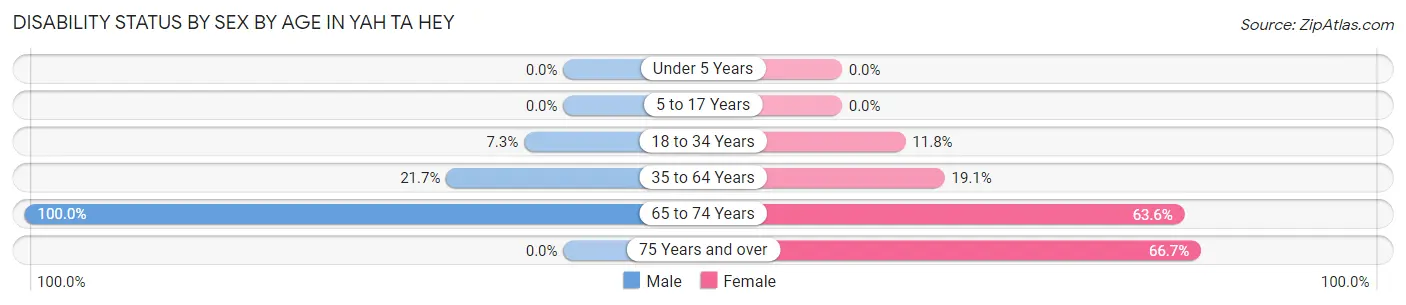
| Age Bracket | Male | Female |
| Under 5 Years | 0 (0.0%) | 0 (0.0%) |
| 5 to 17 Years | 0 (0.0%) | 0 (0.0%) |
| 18 to 34 Years | 7 (7.3%) | 17 (11.8%) |
| 35 to 64 Years | 30 (21.7%) | 25 (19.1%) |
| 65 to 74 Years | 39 (100.0%) | 7 (63.6%) |
| 75 Years and over | 0 (0.0%) | 10 (66.7%) |
Disability Class by Sex by Age in Yah ta hey
Disability Class: Hearing Difficulty
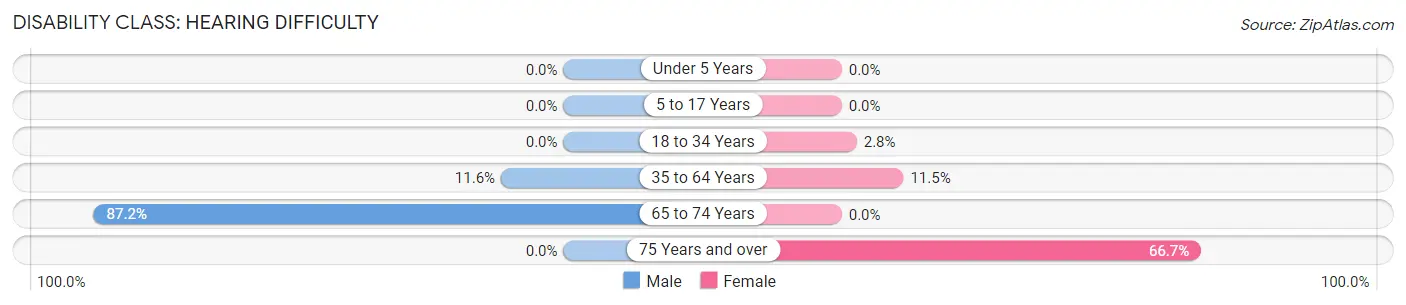
| Age Bracket | Male | Female |
| Under 5 Years | 0 (0.0%) | 0 (0.0%) |
| 5 to 17 Years | 0 (0.0%) | 0 (0.0%) |
| 18 to 34 Years | 0 (0.0%) | 4 (2.8%) |
| 35 to 64 Years | 16 (11.6%) | 15 (11.5%) |
| 65 to 74 Years | 34 (87.2%) | 0 (0.0%) |
| 75 Years and over | 0 (0.0%) | 10 (66.7%) |
Disability Class: Vision Difficulty
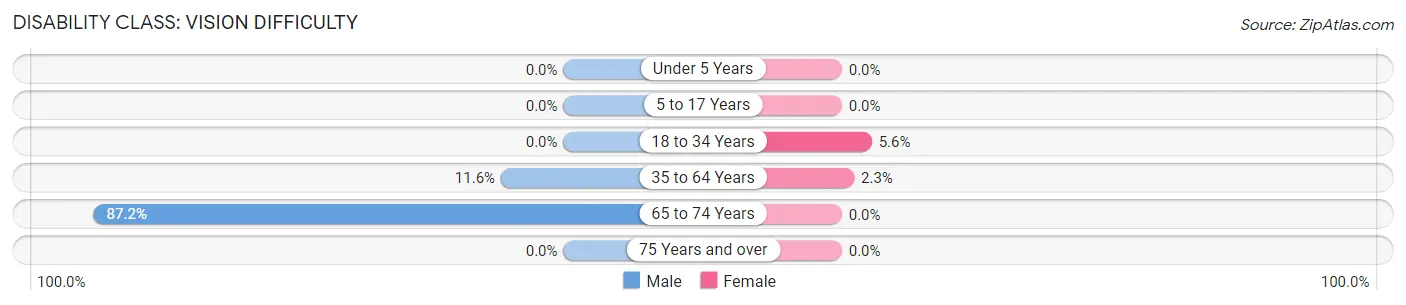
| Age Bracket | Male | Female |
| Under 5 Years | 0 (0.0%) | 0 (0.0%) |
| 5 to 17 Years | 0 (0.0%) | 0 (0.0%) |
| 18 to 34 Years | 0 (0.0%) | 8 (5.6%) |
| 35 to 64 Years | 16 (11.6%) | 3 (2.3%) |
| 65 to 74 Years | 34 (87.2%) | 0 (0.0%) |
| 75 Years and over | 0 (0.0%) | 0 (0.0%) |
Disability Class: Cognitive Difficulty
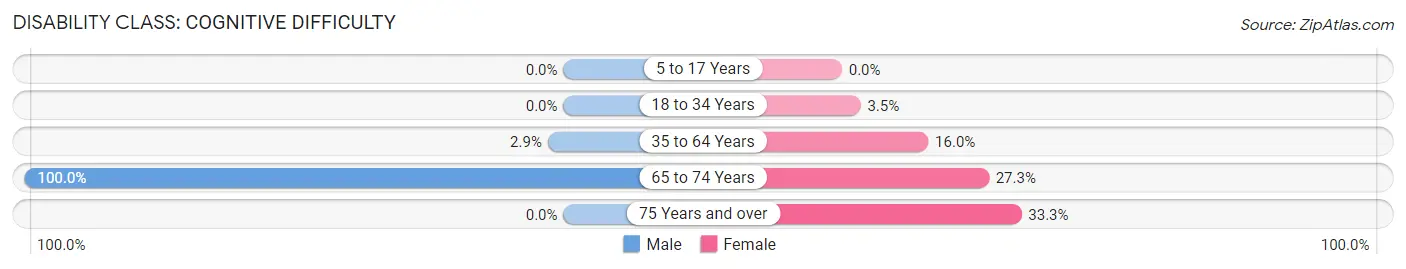
| Age Bracket | Male | Female |
| 5 to 17 Years | 0 (0.0%) | 0 (0.0%) |
| 18 to 34 Years | 0 (0.0%) | 5 (3.5%) |
| 35 to 64 Years | 4 (2.9%) | 21 (16.0%) |
| 65 to 74 Years | 39 (100.0%) | 3 (27.3%) |
| 75 Years and over | 0 (0.0%) | 5 (33.3%) |
Disability Class: Ambulatory Difficulty
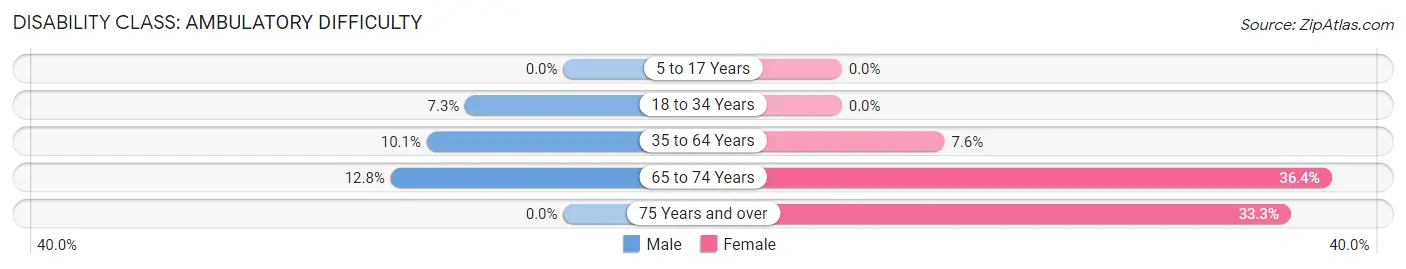
| Age Bracket | Male | Female |
| 5 to 17 Years | 0 (0.0%) | 0 (0.0%) |
| 18 to 34 Years | 7 (7.3%) | 0 (0.0%) |
| 35 to 64 Years | 14 (10.1%) | 10 (7.6%) |
| 65 to 74 Years | 5 (12.8%) | 4 (36.4%) |
| 75 Years and over | 0 (0.0%) | 5 (33.3%) |
Disability Class: Self-Care Difficulty
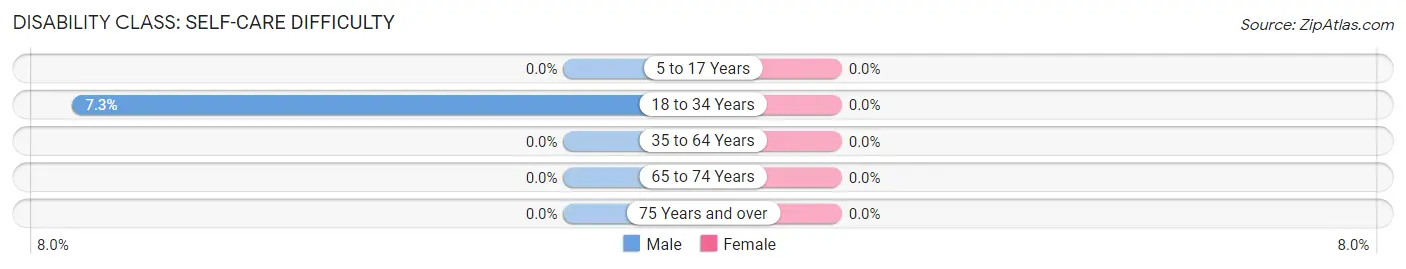
| Age Bracket | Male | Female |
| 5 to 17 Years | 0 (0.0%) | 0 (0.0%) |
| 18 to 34 Years | 7 (7.3%) | 0 (0.0%) |
| 35 to 64 Years | 0 (0.0%) | 0 (0.0%) |
| 65 to 74 Years | 0 (0.0%) | 0 (0.0%) |
| 75 Years and over | 0 (0.0%) | 0 (0.0%) |
Technology Access in Yah ta hey
Computing Device Access in Yah ta hey
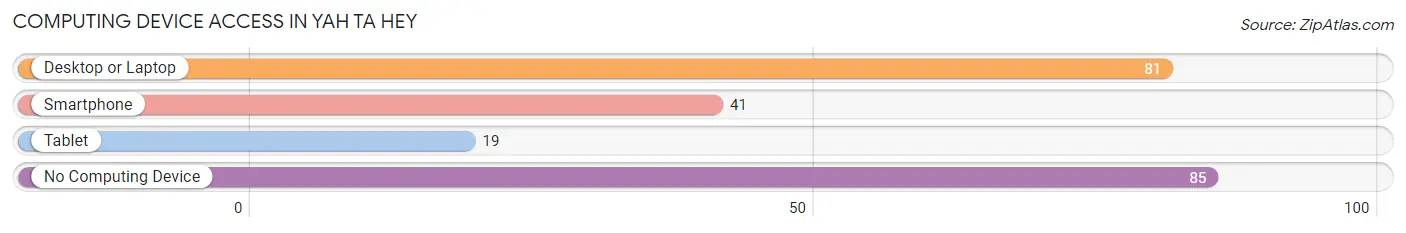
| Device Type | # Households | % Households |
| Desktop or Laptop | 81 | 45.0% |
| Smartphone | 41 | 22.8% |
| Tablet | 19 | 10.6% |
| No Computing Device | 85 | 47.2% |
| Total | 180 | 100.0% |
Internet Access in Yah ta hey
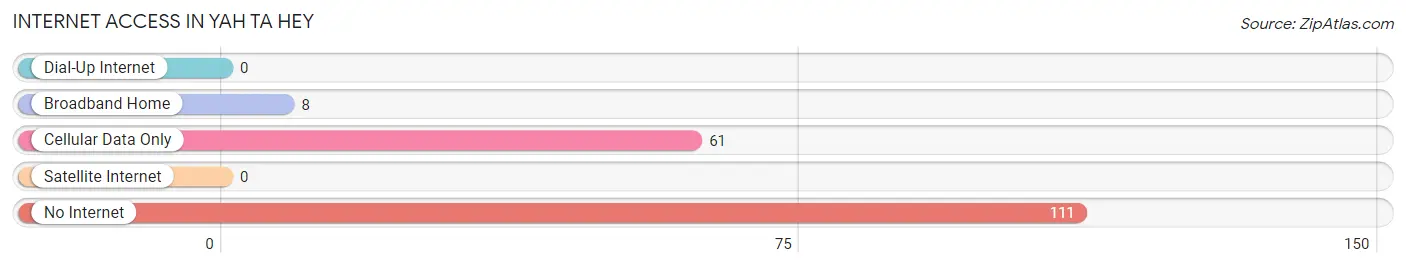
| Internet Type | # Households | % Households |
| Dial-Up Internet | 0 | 0.0% |
| Broadband Home | 8 | 4.4% |
| Cellular Data Only | 61 | 33.9% |
| Satellite Internet | 0 | 0.0% |
| No Internet | 111 | 61.7% |
| Total | 180 | 100.0% |
Yah ta hey Summary
Yah Ta Hey, New Mexico is a small unincorporated community located in McKinley County, New Mexico. It is situated on the Navajo Nation Reservation, approximately 20 miles west of Gallup, New Mexico. The population of Yah Ta Hey was estimated to be around 1,000 in 2000.
History
Yah Ta Hey was originally established in the late 1800s as a trading post for the Navajo people. The name Yah Ta Hey is derived from the Navajo phrase meaning “where the water flows”. The trading post was located near a spring that provided water for the local Navajo people.
In the early 1900s, the trading post was replaced by a school and a post office. The school was established to provide education to the local Navajo children. The post office was established to provide mail service to the local residents.
In the 1950s, the community began to grow as more people moved to the area. The population of Yah Ta Hey increased to around 1,000 by the year 2000.
Geography
Yah Ta Hey is located in the northwestern corner of McKinley County, New Mexico. It is situated on the Navajo Nation Reservation, approximately 20 miles west of Gallup, New Mexico. The community is located at an elevation of 6,000 feet above sea level.
The climate in Yah Ta Hey is semi-arid, with hot summers and cold winters. The average annual temperature is around 50 degrees Fahrenheit. The average annual precipitation is around 10 inches.
Economy
The economy of Yah Ta Hey is largely based on agriculture and tourism. The local Navajo people grow crops such as corn, beans, squash, and melons. The community also has a few small businesses, such as convenience stores and gas stations.
Tourism is an important part of the local economy. The nearby Navajo Nation Reservation is a popular destination for tourists, who come to experience the culture and history of the Navajo people.
Demographics
The population of Yah Ta Hey was estimated to be around 1,000 in 2000. The majority of the population is Native American, with the majority being Navajo. The median household income in Yah Ta Hey is around $25,000. The median age is around 30 years old.
Common Questions
What is Per Capita Income in Yah ta hey?
Per Capita income in Yah ta hey is $13,573.
What is the Median Family Income in Yah ta hey?
Median Family Income in Yah ta hey is $36,769.
What is the Median Household income in Yah ta hey?
Median Household Income in Yah ta hey is $68,143.
What is Income or Wage Gap in Yah ta hey?
Income or Wage Gap in Yah ta hey is 49.1%.
Women in Yah ta hey earn 50.9 cents for every dollar earned by a man.
What is Inequality or Gini Index in Yah ta hey?
Inequality or Gini Index in Yah ta hey is 0.32.
What is the Total Population of Yah ta hey?
Total Population of Yah ta hey is 709.
What is the Total Male Population of Yah ta hey?
Total Male Population of Yah ta hey is 372.
What is the Total Female Population of Yah ta hey?
Total Female Population of Yah ta hey is 337.
What is the Ratio of Males per 100 Females in Yah ta hey?
There are 110.39 Males per 100 Females in Yah ta hey.
What is the Ratio of Females per 100 Males in Yah ta hey?
There are 90.59 Females per 100 Males in Yah ta hey.
What is the Median Population Age in Yah ta hey?
Median Population Age in Yah ta hey is 33.7 Years.
What is the Average Family Size in Yah ta hey
Average Family Size in Yah ta hey is 4.1 People.
What is the Average Household Size in Yah ta hey
Average Household Size in Yah ta hey is 3.9 People.
How Large is the Labor Force in Yah ta hey?
There are 210 People in the Labor Forcein in Yah ta hey.
What is the Percentage of People in the Labor Force in Yah ta hey?
32.7% of People are in the Labor Force in Yah ta hey.
What is the Unemployment Rate in Yah ta hey?
Unemployment Rate in Yah ta hey is 7.1%.