Cimarron, NM Map & Demographics
Cimarron Map
Cimarron Overview
$25,218
PER CAPITA INCOME
$55,865
AVG FAMILY INCOME
$35,917
AVG HOUSEHOLD INCOME
43.7%
WAGE / INCOME GAP [ % ]
56.3¢/ $1
WAGE / INCOME GAP [ $ ]
0.35
INEQUALITY / GINI INDEX
816
TOTAL POPULATION
354
MALE POPULATION
462
FEMALE POPULATION
76.62
MALES / 100 FEMALES
130.51
FEMALES / 100 MALES
36.6
MEDIAN AGE
2.9
AVG FAMILY SIZE
1.9
AVG HOUSEHOLD SIZE
343
LABOR FORCE [ PEOPLE ]
53.8%
PERCENT IN LABOR FORCE
8.5%
UNEMPLOYMENT RATE
Cimarron Zip Codes
Cimarron Area Codes
Income in Cimarron
Income Overview in Cimarron
Per Capita Income in Cimarron is $25,218, while median incomes of families and households are $55,865 and $35,917 respectively.
| Characteristic | Number | Measure |
| Per Capita Income | 816 | $25,218 |
| Median Family Income | 197 | $55,865 |
| Mean Family Income | 197 | $63,010 |
| Median Household Income | 419 | $35,917 |
| Mean Household Income | 419 | $49,853 |
| Income Deficit | 197 | $0 |
| Wage / Income Gap (%) | 816 | 43.65% |
| Wage / Income Gap ($) | 816 | 56.35¢ per $1 |
| Gini / Inequality Index | 816 | 0.35 |
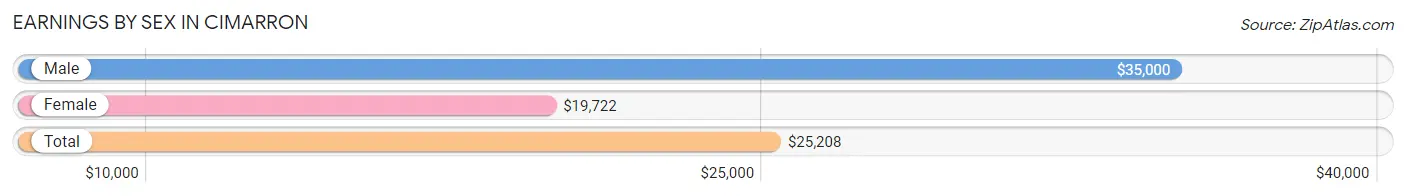
Earnings by Sex in Cimarron
Average Earnings in Cimarron are $25,208, $35,000 for men and $19,722 for women, a difference of 43.6%.
| Sex | Number | Average Earnings |
| Male | 112 (32.4%) | $35,000 |
| Female | 234 (67.6%) | $19,722 |
| Total | 346 (100.0%) | $25,208 |
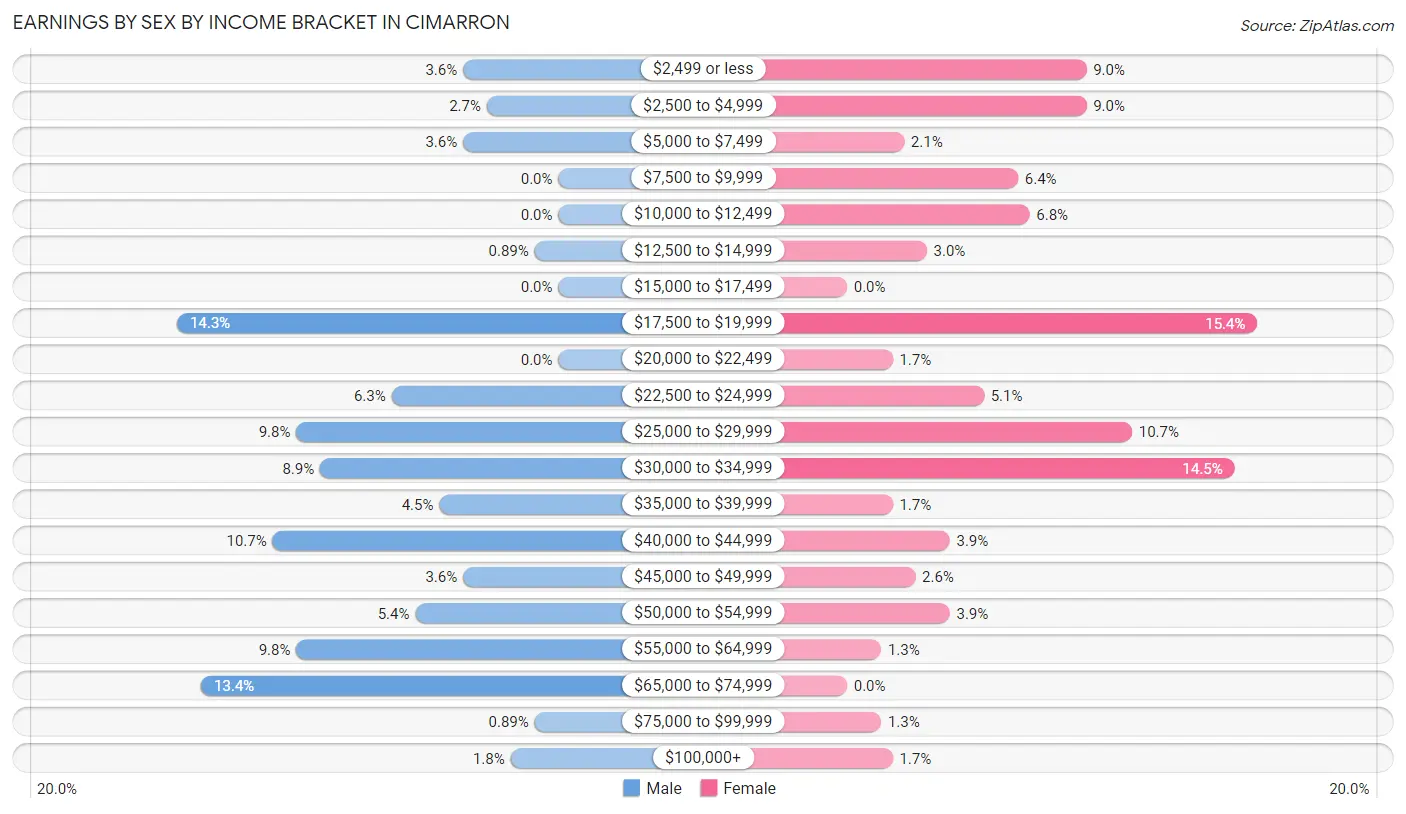
Earnings by Sex by Income Bracket in Cimarron
The most common earnings brackets in Cimarron are $17,500 to $19,999 for men (16 | 14.3%) and $17,500 to $19,999 for women (36 | 15.4%).
| Income | Male | Female |
| $2,499 or less | 4 (3.6%) | 21 (9.0%) |
| $2,500 to $4,999 | 3 (2.7%) | 21 (9.0%) |
| $5,000 to $7,499 | 4 (3.6%) | 5 (2.1%) |
| $7,500 to $9,999 | 0 (0.0%) | 15 (6.4%) |
| $10,000 to $12,499 | 0 (0.0%) | 16 (6.8%) |
| $12,500 to $14,999 | 1 (0.9%) | 7 (3.0%) |
| $15,000 to $17,499 | 0 (0.0%) | 0 (0.0%) |
| $17,500 to $19,999 | 16 (14.3%) | 36 (15.4%) |
| $20,000 to $22,499 | 0 (0.0%) | 4 (1.7%) |
| $22,500 to $24,999 | 7 (6.2%) | 12 (5.1%) |
| $25,000 to $29,999 | 11 (9.8%) | 25 (10.7%) |
| $30,000 to $34,999 | 10 (8.9%) | 34 (14.5%) |
| $35,000 to $39,999 | 5 (4.5%) | 4 (1.7%) |
| $40,000 to $44,999 | 12 (10.7%) | 9 (3.8%) |
| $45,000 to $49,999 | 4 (3.6%) | 6 (2.6%) |
| $50,000 to $54,999 | 6 (5.4%) | 9 (3.8%) |
| $55,000 to $64,999 | 11 (9.8%) | 3 (1.3%) |
| $65,000 to $74,999 | 15 (13.4%) | 0 (0.0%) |
| $75,000 to $99,999 | 1 (0.9%) | 3 (1.3%) |
| $100,000+ | 2 (1.8%) | 4 (1.7%) |
| Total | 112 (100.0%) | 234 (100.0%) |
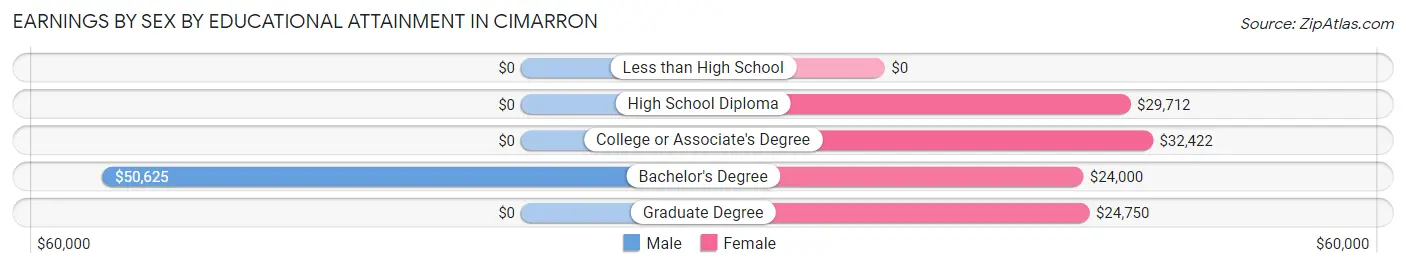
Earnings by Sex by Educational Attainment in Cimarron
Average earnings in Cimarron are $35,000 for men and $30,000 for women, a difference of 14.3%. Men with an educational attainment of bachelor's degree enjoy the highest average annual earnings of $50,625, while those with bachelor's degree education earn the least with $50,625. Women with an educational attainment of college or associate's degree earn the most with the average annual earnings of $32,422, while those with bachelor's degree education have the smallest earnings of $24,000.
| Educational Attainment | Male Income | Female Income |
| Less than High School | - | - |
| High School Diploma | - | - |
| College or Associate's Degree | - | - |
| Bachelor's Degree | $50,625 | $24,000 |
| Graduate Degree | - | - |
| Total | $35,000 | $30,000 |
Family Income in Cimarron
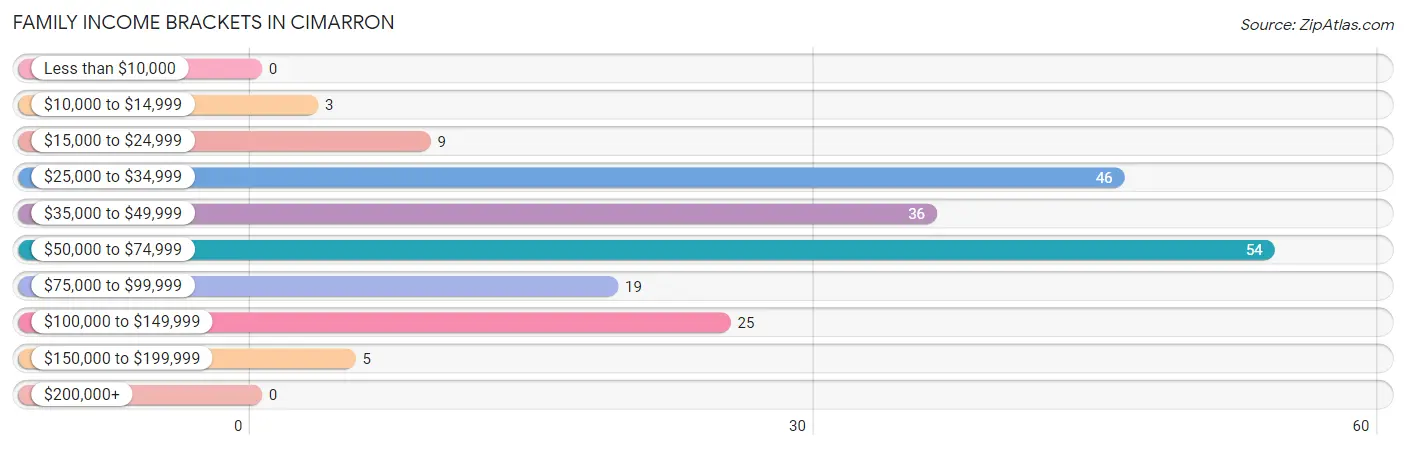
Family Income Brackets in Cimarron
According to the Cimarron family income data, there are 54 families falling into the $50,000 to $74,999 income range, which is the most common income bracket and makes up 27.4% of all families.
| Income Bracket | # Families | % Families |
| Less than $10,000 | 0 | 0.0% |
| $10,000 to $14,999 | 3 | 1.5% |
| $15,000 to $24,999 | 9 | 4.6% |
| $25,000 to $34,999 | 46 | 23.4% |
| $35,000 to $49,999 | 36 | 18.3% |
| $50,000 to $74,999 | 54 | 27.4% |
| $75,000 to $99,999 | 19 | 9.6% |
| $100,000 to $149,999 | 25 | 12.7% |
| $150,000 to $199,999 | 5 | 2.5% |
| $200,000+ | 0 | 0.0% |
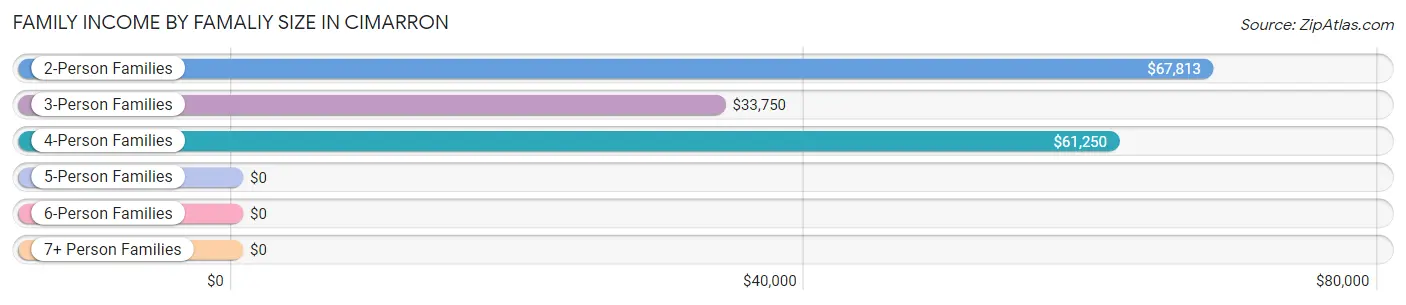
Family Income by Famaliy Size in Cimarron
2-person families (120 | 60.9%) account for the highest median family income in Cimarron with $67,813 per family, while 2-person families (120 | 60.9%) have the highest median income of $33,906 per family member.
| Income Bracket | # Families | Median Income |
| 2-Person Families | 120 (60.9%) | $67,813 |
| 3-Person Families | 22 (11.2%) | $33,750 |
| 4-Person Families | 52 (26.4%) | $61,250 |
| 5-Person Families | 0 (0.0%) | $0 |
| 6-Person Families | 3 (1.5%) | $0 |
| 7+ Person Families | 0 (0.0%) | $0 |
| Total | 197 (100.0%) | $55,865 |
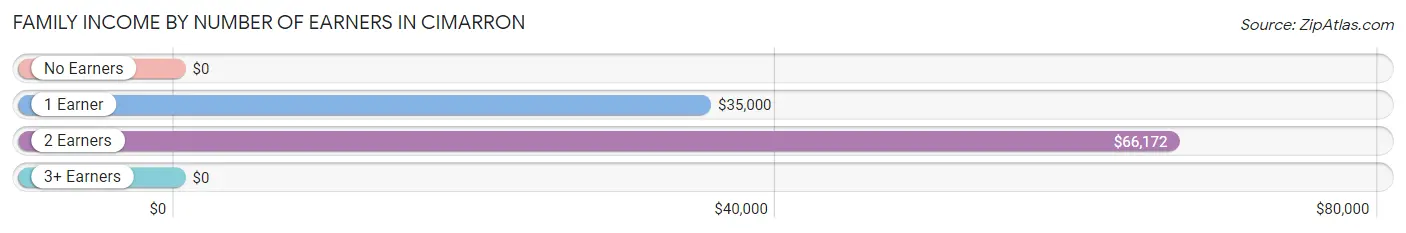
Family Income by Number of Earners in Cimarron
| Number of Earners | # Families | Median Income |
| No Earners | 62 (31.5%) | $0 |
| 1 Earner | 50 (25.4%) | $35,000 |
| 2 Earners | 85 (43.1%) | $66,172 |
| 3+ Earners | 0 (0.0%) | $0 |
| Total | 197 (100.0%) | $55,865 |
Household Income in Cimarron
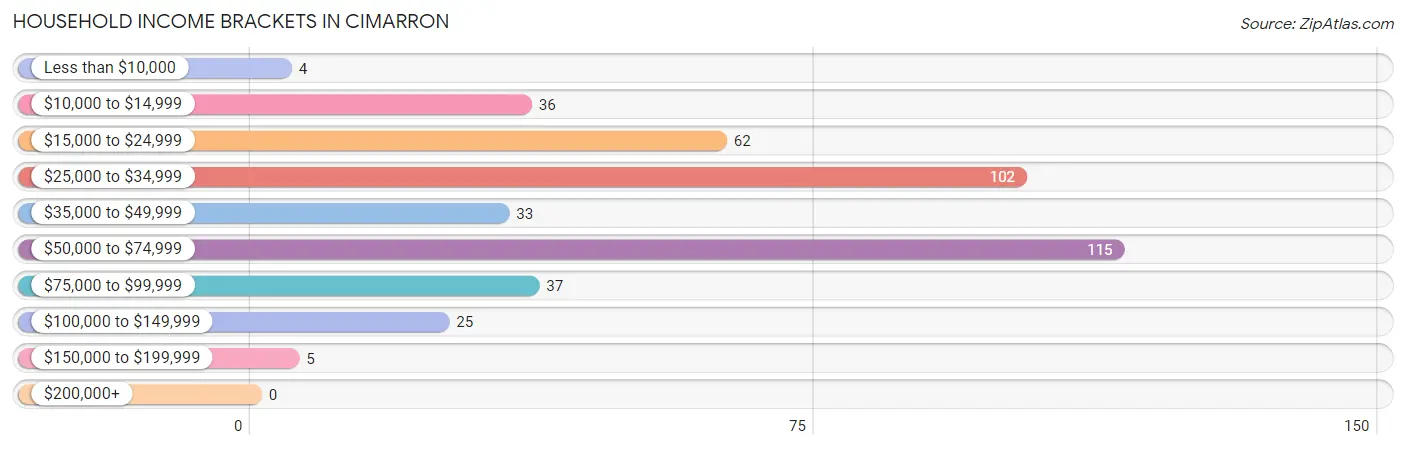
Household Income Brackets in Cimarron
With 115 households falling in the category, the $50,000 to $74,999 income range is the most frequent in Cimarron, accounting for 27.5% of all households.
| Income Bracket | # Households | % Households |
| Less than $10,000 | 4 | 1.0% |
| $10,000 to $14,999 | 36 | 8.6% |
| $15,000 to $24,999 | 62 | 14.8% |
| $25,000 to $34,999 | 102 | 24.3% |
| $35,000 to $49,999 | 33 | 7.9% |
| $50,000 to $74,999 | 115 | 27.4% |
| $75,000 to $99,999 | 37 | 8.8% |
| $100,000 to $149,999 | 25 | 6.0% |
| $150,000 to $199,999 | 5 | 1.2% |
| $200,000+ | 0 | 0.0% |
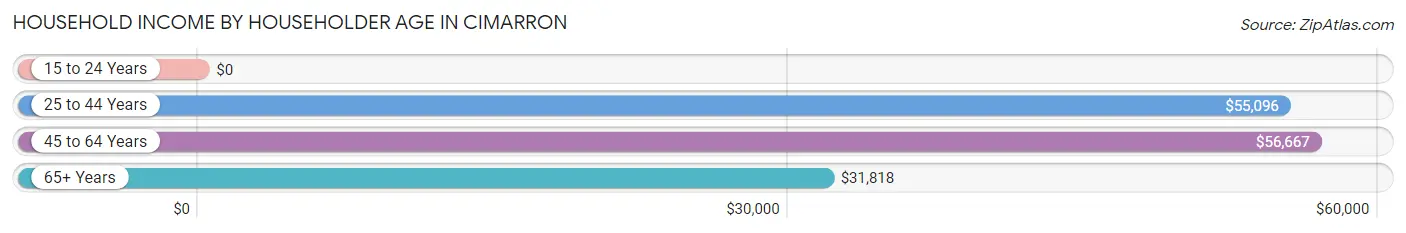
Household Income by Householder Age in Cimarron
The median household income in Cimarron is $35,917, with the highest median household income of $56,667 found in the 45 to 64 years age bracket for the primary householder. A total of 120 households (28.6%) fall into this category. Meanwhile, the 15 to 24 years age bracket for the primary householder has the lowest median household income of $0, with 36 households (8.6%) in this group.
| Income Bracket | # Households | Median Income |
| 15 to 24 Years | 36 (8.6%) | $0 |
| 25 to 44 Years | 105 (25.1%) | $55,096 |
| 45 to 64 Years | 120 (28.6%) | $56,667 |
| 65+ Years | 158 (37.7%) | $31,818 |
| Total | 419 (100.0%) | $35,917 |
Poverty in Cimarron
Income Below Poverty by Sex and Age in Cimarron
With 7.6% poverty level for males and 15.6% for females among the residents of Cimarron, under 5 year old males and 75 year old and over females are the most vulnerable to poverty, with 8 males (100.0%) and 23 females (41.1%) in their respective age groups living below the poverty level.
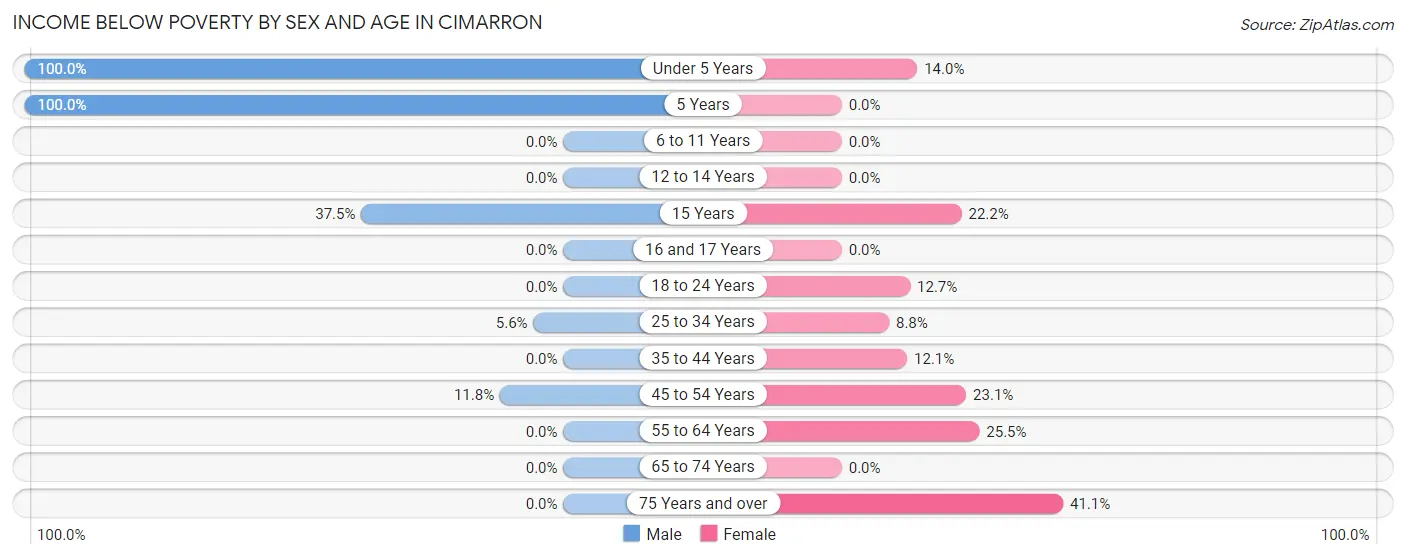
| Age Bracket | Male | Female |
| Under 5 Years | 8 (100.0%) | 7 (14.0%) |
| 5 Years | 10 (100.0%) | 0 (0.0%) |
| 6 to 11 Years | 0 (0.0%) | 0 (0.0%) |
| 12 to 14 Years | 0 (0.0%) | 0 (0.0%) |
| 15 Years | 3 (37.5%) | 6 (22.2%) |
| 16 and 17 Years | 0 (0.0%) | 0 (0.0%) |
| 18 to 24 Years | 0 (0.0%) | 9 (12.7%) |
| 25 to 34 Years | 4 (5.6%) | 5 (8.8%) |
| 35 to 44 Years | 0 (0.0%) | 4 (12.1%) |
| 45 to 54 Years | 2 (11.8%) | 6 (23.1%) |
| 55 to 64 Years | 0 (0.0%) | 12 (25.5%) |
| 65 to 74 Years | 0 (0.0%) | 0 (0.0%) |
| 75 Years and over | 0 (0.0%) | 23 (41.1%) |
| Total | 27 (7.6%) | 72 (15.6%) |
Income Above Poverty by Sex and Age in Cimarron
According to the poverty statistics in Cimarron, males aged 6 to 11 years and females aged 6 to 11 years are the age groups that are most secure financially, with 100.0% of males and 100.0% of females in these age groups living above the poverty line.
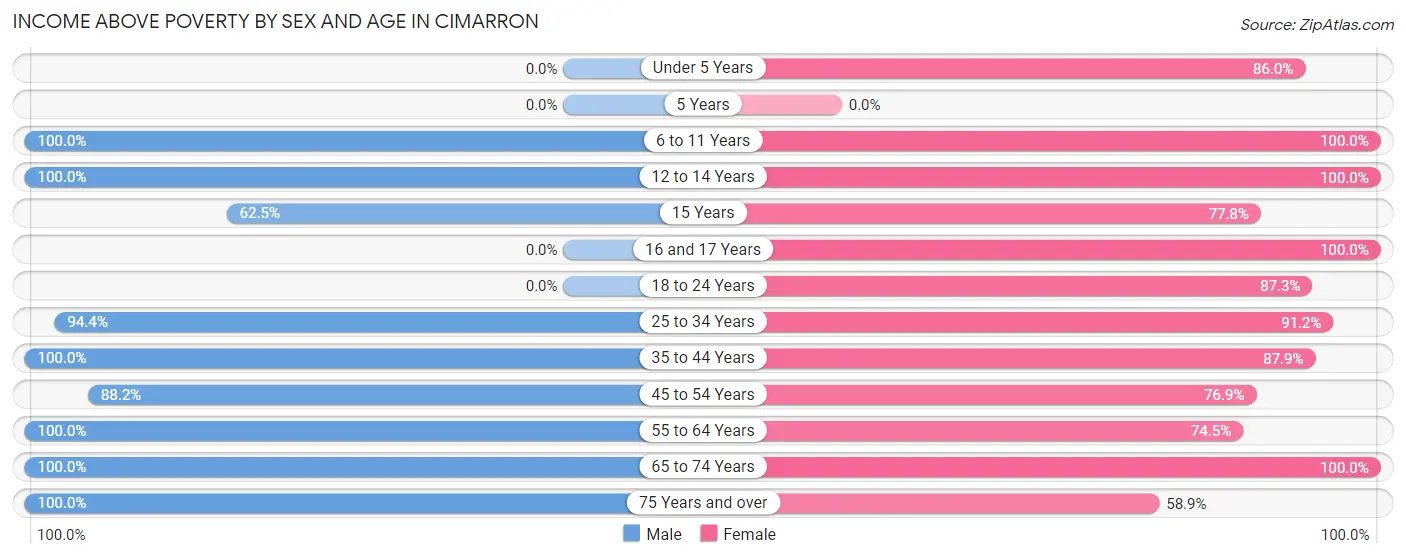
| Age Bracket | Male | Female |
| Under 5 Years | 0 (0.0%) | 43 (86.0%) |
| 5 Years | 0 (0.0%) | 0 (0.0%) |
| 6 to 11 Years | 30 (100.0%) | 1 (100.0%) |
| 12 to 14 Years | 31 (100.0%) | 13 (100.0%) |
| 15 Years | 5 (62.5%) | 21 (77.8%) |
| 16 and 17 Years | 0 (0.0%) | 21 (100.0%) |
| 18 to 24 Years | 0 (0.0%) | 62 (87.3%) |
| 25 to 34 Years | 68 (94.4%) | 52 (91.2%) |
| 35 to 44 Years | 19 (100.0%) | 29 (87.9%) |
| 45 to 54 Years | 15 (88.2%) | 20 (76.9%) |
| 55 to 64 Years | 71 (100.0%) | 35 (74.5%) |
| 65 to 74 Years | 55 (100.0%) | 60 (100.0%) |
| 75 Years and over | 33 (100.0%) | 33 (58.9%) |
| Total | 327 (92.4%) | 390 (84.4%) |
Income Below Poverty Among Married-Couple Families in Cimarron
The poverty statistics for married-couple families in Cimarron show that 2.3% or 3 of the total 133 families live below the poverty line. Families with 1 or 2 children have the highest poverty rate of 6.8%, comprising of 3 families. On the other hand, families with no children have the lowest poverty rate of 0.0%, which includes 0 families.
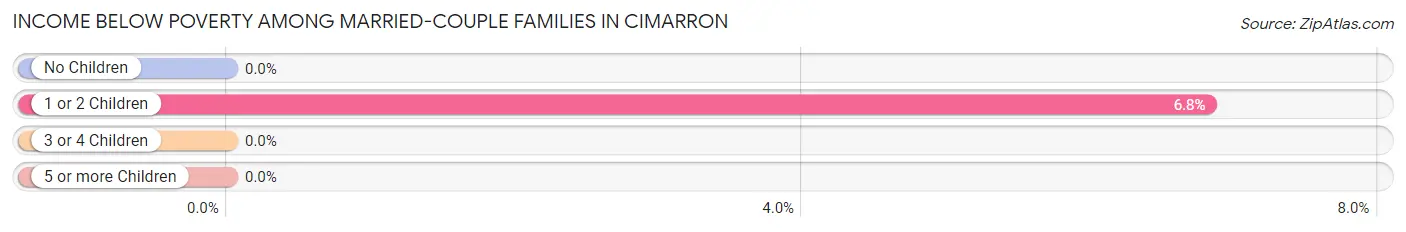
| Children | Above Poverty | Below Poverty |
| No Children | 89 (100.0%) | 0 (0.0%) |
| 1 or 2 Children | 41 (93.2%) | 3 (6.8%) |
| 3 or 4 Children | 0 (0.0%) | 0 (0.0%) |
| 5 or more Children | 0 (0.0%) | 0 (0.0%) |
| Total | 130 (97.7%) | 3 (2.3%) |
Income Below Poverty Among Single-Parent Households in Cimarron
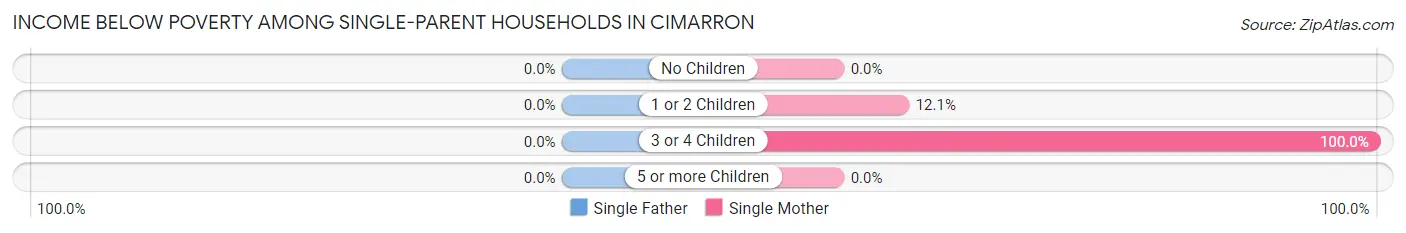
| Children | Single Father | Single Mother |
| No Children | 0 (0.0%) | 0 (0.0%) |
| 1 or 2 Children | 0 (0.0%) | 4 (12.1%) |
| 3 or 4 Children | 0 (0.0%) | 5 (100.0%) |
| 5 or more Children | 0 (0.0%) | 0 (0.0%) |
| Total | 0 (0.0%) | 9 (18.8%) |
Income Below Poverty Among Married-Couple vs Single-Parent Households in Cimarron
The poverty data for Cimarron shows that 3 of the married-couple family households (2.3%) and 9 of the single-parent households (14.1%) are living below the poverty level. Within the married-couple family households, those with 1 or 2 children have the highest poverty rate, with 3 households (6.8%) falling below the poverty line. Among the single-parent households, those with 3 or 4 children have the highest poverty rate, with 5 household (100.0%) living below poverty.
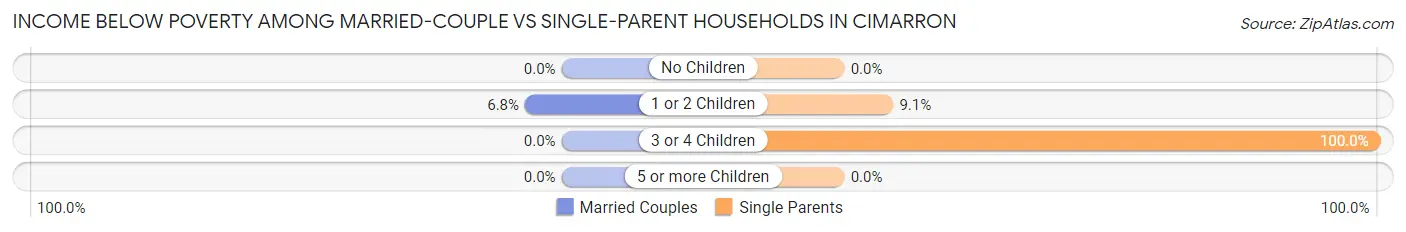
| Children | Married-Couple Families | Single-Parent Households |
| No Children | 0 (0.0%) | 0 (0.0%) |
| 1 or 2 Children | 3 (6.8%) | 4 (9.1%) |
| 3 or 4 Children | 0 (0.0%) | 5 (100.0%) |
| 5 or more Children | 0 (0.0%) | 0 (0.0%) |
| Total | 3 (2.3%) | 9 (14.1%) |
Race in Cimarron
The most populous races in Cimarron are White / Caucasian (570 | 69.9%), Hispanic or Latino (549 | 67.3%), and Two or more Races (99 | 12.1%).
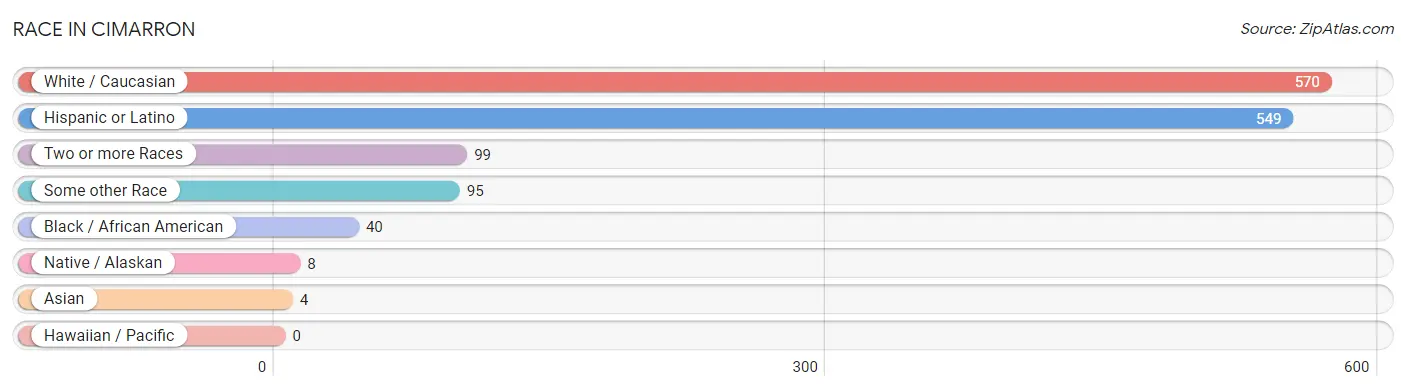
| Race | # Population | % Population |
| Asian | 4 | 0.5% |
| Black / African American | 40 | 4.9% |
| Hawaiian / Pacific | 0 | 0.0% |
| Hispanic or Latino | 549 | 67.3% |
| Native / Alaskan | 8 | 1.0% |
| White / Caucasian | 570 | 69.9% |
| Two or more Races | 99 | 12.1% |
| Some other Race | 95 | 11.6% |
| Total | 816 | 100.0% |
Ancestry in Cimarron
The most populous ancestries reported in Cimarron are Mexican (200 | 24.5%), Spanish (135 | 16.5%), German (90 | 11.0%), Irish (62 | 7.6%), and Spaniard (62 | 7.6%), together accounting for 67.3% of all Cimarron residents.
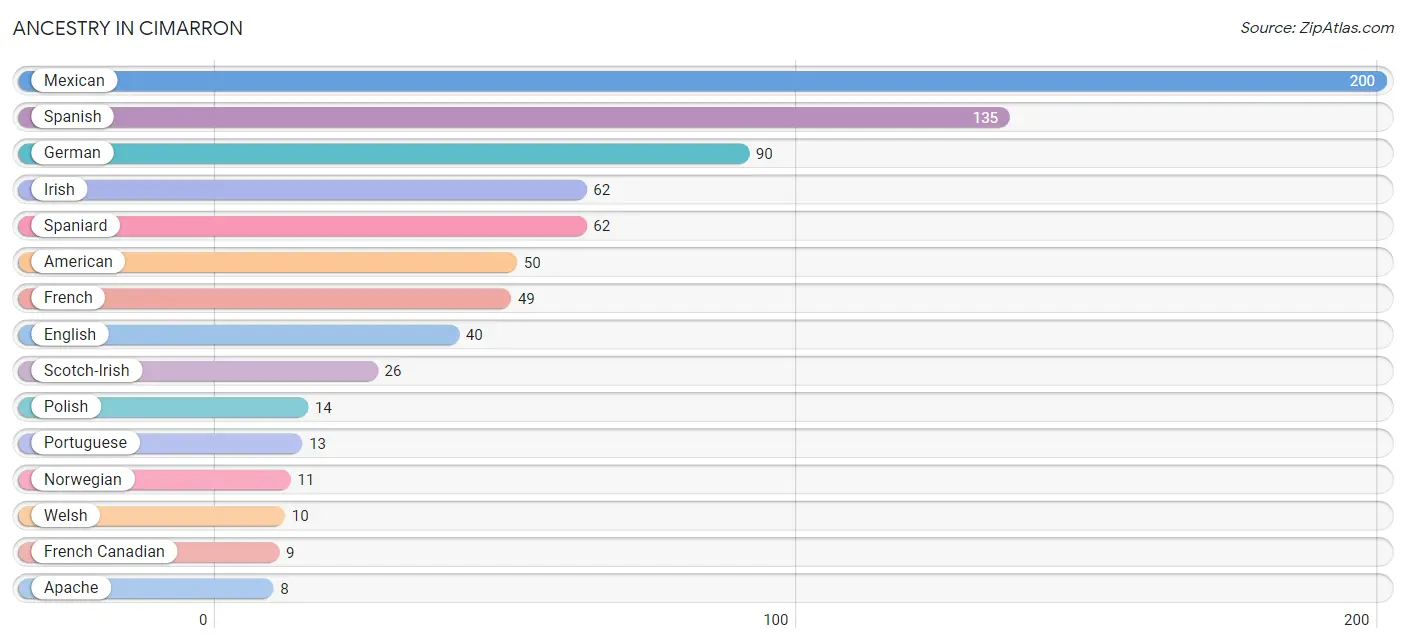
| Ancestry | # Population | % Population |
| American | 50 | 6.1% |
| Apache | 8 | 1.0% |
| Austrian | 7 | 0.9% |
| Central American | 2 | 0.3% |
| Cherokee | 2 | 0.3% |
| Czech | 7 | 0.9% |
| Dutch | 8 | 1.0% |
| English | 40 | 4.9% |
| French | 49 | 6.0% |
| French Canadian | 9 | 1.1% |
| German | 90 | 11.0% |
| Irish | 62 | 7.6% |
| Italian | 4 | 0.5% |
| Mexican | 200 | 24.5% |
| Mexican American Indian | 7 | 0.9% |
| Norwegian | 11 | 1.3% |
| Polish | 14 | 1.7% |
| Portuguese | 13 | 1.6% |
| Salvadoran | 2 | 0.3% |
| Scandinavian | 1 | 0.1% |
| Scotch-Irish | 26 | 3.2% |
| Spaniard | 62 | 7.6% |
| Spanish | 135 | 16.5% |
| Subsaharan African | 3 | 0.4% |
| Swedish | 2 | 0.3% |
| Thai | 4 | 0.5% |
| Welsh | 10 | 1.2% | View All 27 Rows |
Immigrants in Cimarron
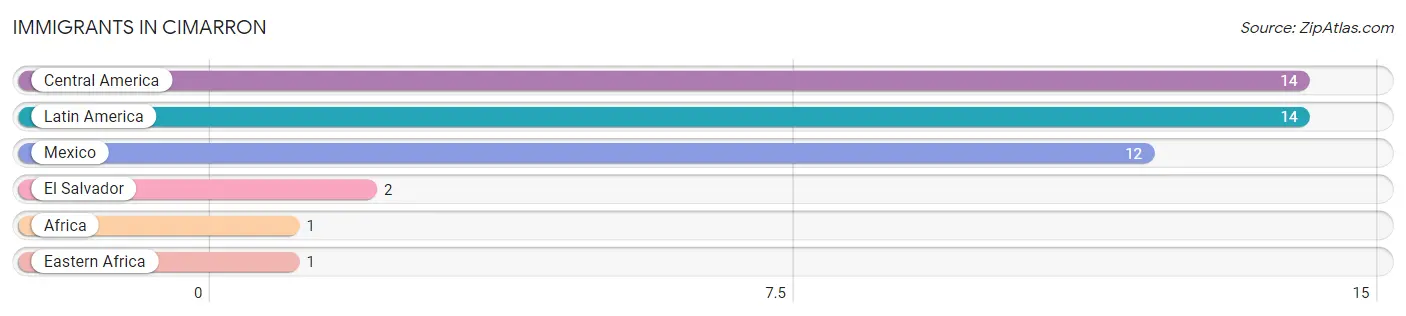
The most numerous immigrant groups reported in Cimarron came from Central America (14 | 1.7%), Latin America (14 | 1.7%), Mexico (12 | 1.5%), El Salvador (2 | 0.3%), and Africa (1 | 0.1%), together accounting for 5.3% of all Cimarron residents.
| Immigration Origin | # Population | % Population |
| Africa | 1 | 0.1% |
| Central America | 14 | 1.7% |
| Eastern Africa | 1 | 0.1% |
| El Salvador | 2 | 0.3% |
| Latin America | 14 | 1.7% |
| Mexico | 12 | 1.5% | View All 6 Rows |
Sex and Age in Cimarron
Sex and Age in Cimarron
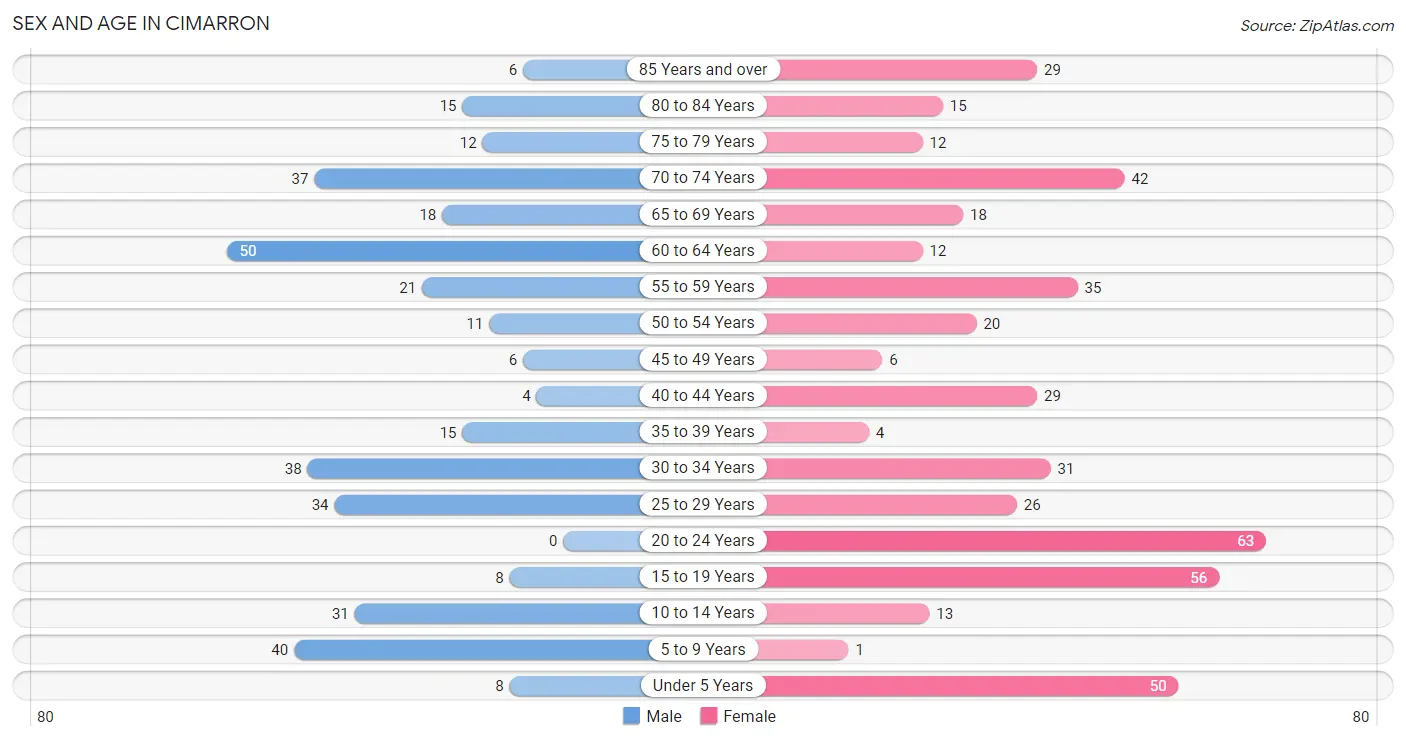
The most populous age groups in Cimarron are 60 to 64 Years (50 | 14.1%) for men and 20 to 24 Years (63 | 13.6%) for women.
| Age Bracket | Male | Female |
| Under 5 Years | 8 (2.3%) | 50 (10.8%) |
| 5 to 9 Years | 40 (11.3%) | 1 (0.2%) |
| 10 to 14 Years | 31 (8.8%) | 13 (2.8%) |
| 15 to 19 Years | 8 (2.3%) | 56 (12.1%) |
| 20 to 24 Years | 0 (0.0%) | 63 (13.6%) |
| 25 to 29 Years | 34 (9.6%) | 26 (5.6%) |
| 30 to 34 Years | 38 (10.7%) | 31 (6.7%) |
| 35 to 39 Years | 15 (4.2%) | 4 (0.9%) |
| 40 to 44 Years | 4 (1.1%) | 29 (6.3%) |
| 45 to 49 Years | 6 (1.7%) | 6 (1.3%) |
| 50 to 54 Years | 11 (3.1%) | 20 (4.3%) |
| 55 to 59 Years | 21 (5.9%) | 35 (7.6%) |
| 60 to 64 Years | 50 (14.1%) | 12 (2.6%) |
| 65 to 69 Years | 18 (5.1%) | 18 (3.9%) |
| 70 to 74 Years | 37 (10.4%) | 42 (9.1%) |
| 75 to 79 Years | 12 (3.4%) | 12 (2.6%) |
| 80 to 84 Years | 15 (4.2%) | 15 (3.3%) |
| 85 Years and over | 6 (1.7%) | 29 (6.3%) |
| Total | 354 (100.0%) | 462 (100.0%) |
Families and Households in Cimarron
Median Family Size in Cimarron
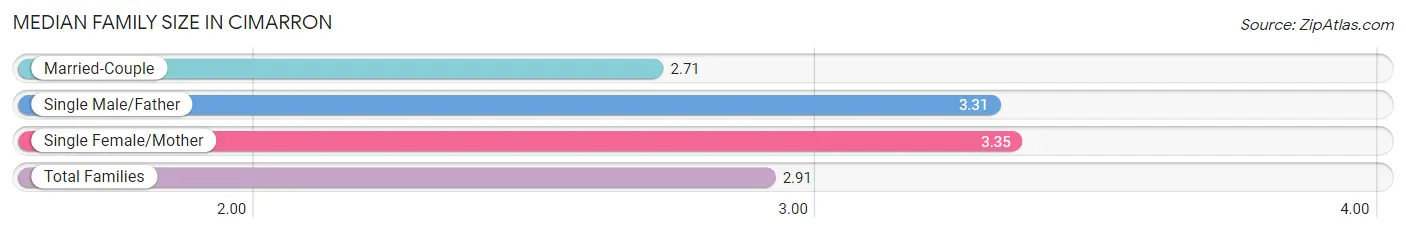
The median family size in Cimarron is 2.91 persons per family, with single female/mother families (48 | 24.4%) accounting for the largest median family size of 3.35 persons per family. On the other hand, married-couple families (133 | 67.5%) represent the smallest median family size with 2.71 persons per family.
| Family Type | # Families | Family Size |
| Married-Couple | 133 (67.5%) | 2.71 |
| Single Male/Father | 16 (8.1%) | 3.31 |
| Single Female/Mother | 48 (24.4%) | 3.35 |
| Total Families | 197 (100.0%) | 2.91 |
Median Household Size in Cimarron
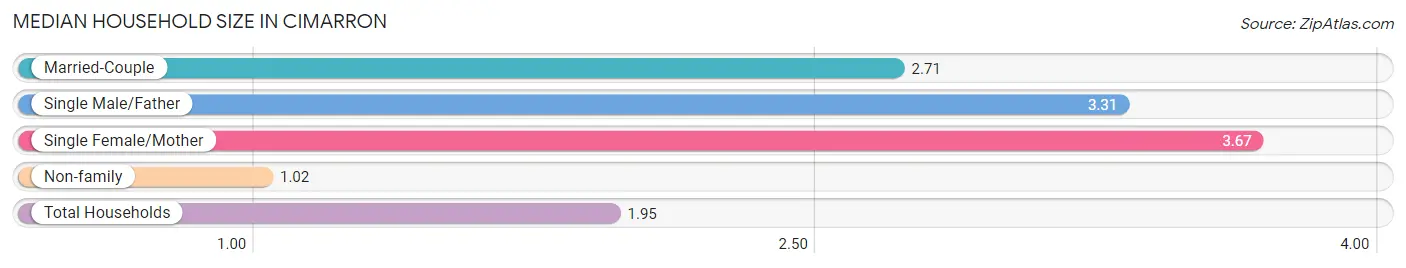
The median household size in Cimarron is 1.95 persons per household, with single female/mother households (48 | 11.5%) accounting for the largest median household size of 3.67 persons per household. non-family households (222 | 53.0%) represent the smallest median household size with 1.02 persons per household.
| Household Type | # Households | Household Size |
| Married-Couple | 133 (31.7%) | 2.71 |
| Single Male/Father | 16 (3.8%) | 3.31 |
| Single Female/Mother | 48 (11.5%) | 3.67 |
| Non-family | 222 (53.0%) | 1.02 |
| Total Households | 419 (100.0%) | 1.95 |
Household Size by Marriage Status in Cimarron
Out of a total of 419 households in Cimarron, 197 (47.0%) are family households, while 222 (53.0%) are nonfamily households. The most numerous type of family households are 2-person households, comprising 114, and the most common type of nonfamily households are 1-person households, comprising 212.
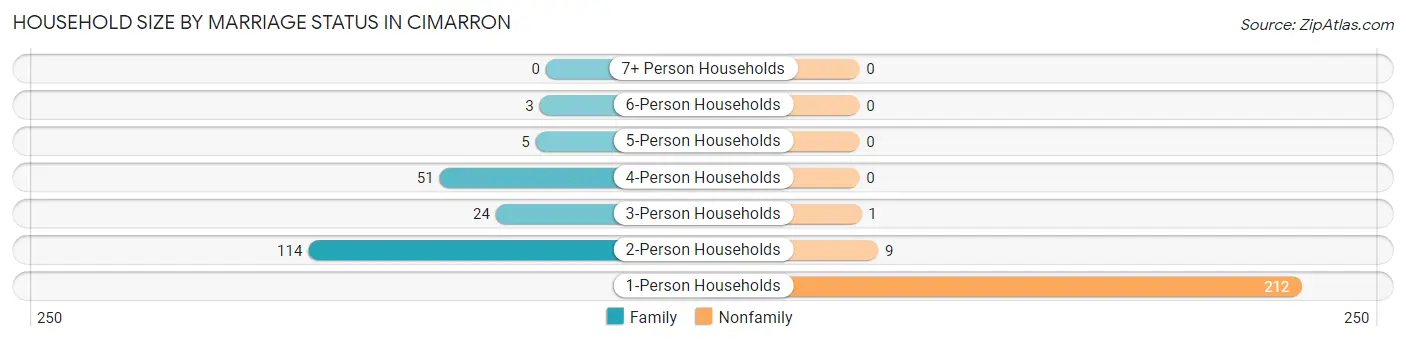
| Household Size | Family Households | Nonfamily Households |
| 1-Person Households | - | 212 (50.6%) |
| 2-Person Households | 114 (27.2%) | 9 (2.1%) |
| 3-Person Households | 24 (5.7%) | 1 (0.2%) |
| 4-Person Households | 51 (12.2%) | 0 (0.0%) |
| 5-Person Households | 5 (1.2%) | 0 (0.0%) |
| 6-Person Households | 3 (0.7%) | 0 (0.0%) |
| 7+ Person Households | 0 (0.0%) | 0 (0.0%) |
| Total | 197 (47.0%) | 222 (53.0%) |
Female Fertility in Cimarron
Fertility by Age in Cimarron
Average fertility rate in Cimarron is 23.0 births per 1,000 women. Women in the age bracket of 20 to 34 years have the highest fertility rate with 42.0 births per 1,000 women. Women in the age bracket of 20 to 34 years acount for 100.0% of all women with births.
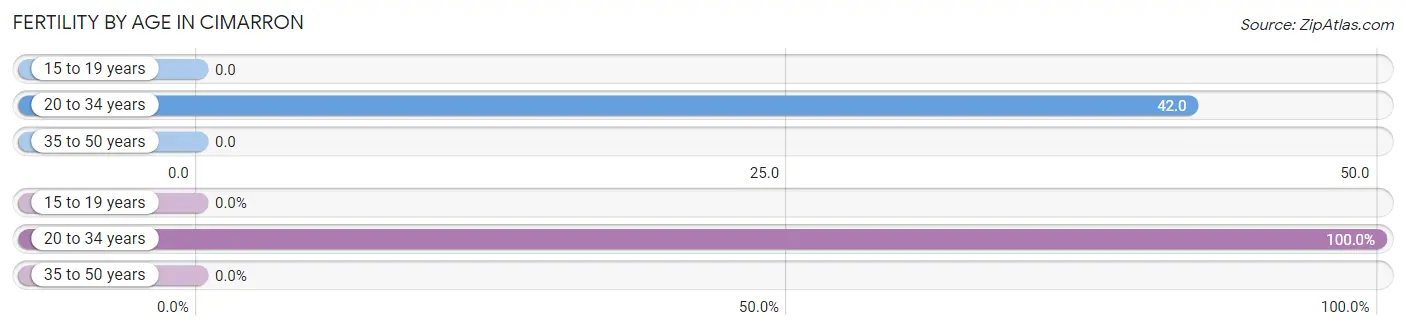
| Age Bracket | Women with Births | Births / 1,000 Women |
| 15 to 19 years | 0 (0.0%) | 0.0 |
| 20 to 34 years | 5 (100.0%) | 42.0 |
| 35 to 50 years | 0 (0.0%) | 0.0 |
| Total | 5 (100.0%) | 23.0 |
Fertility by Age by Marriage Status in Cimarron
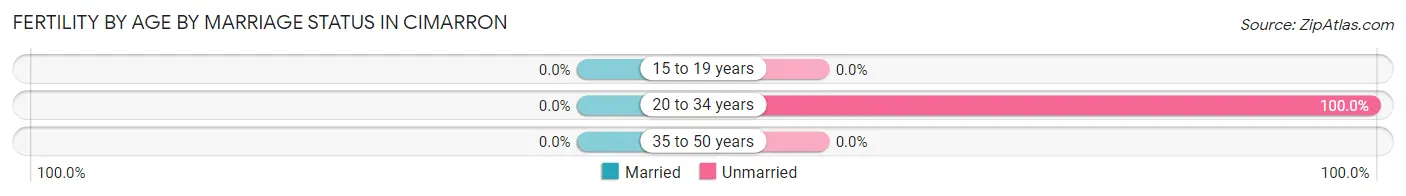
| Age Bracket | Married | Unmarried |
| 15 to 19 years | 0 (0.0%) | 0 (0.0%) |
| 20 to 34 years | 0 (0.0%) | 5 (100.0%) |
| 35 to 50 years | 0 (0.0%) | 0 (0.0%) |
| Total | 0 (0.0%) | 5 (100.0%) |
Fertility by Education in Cimarron
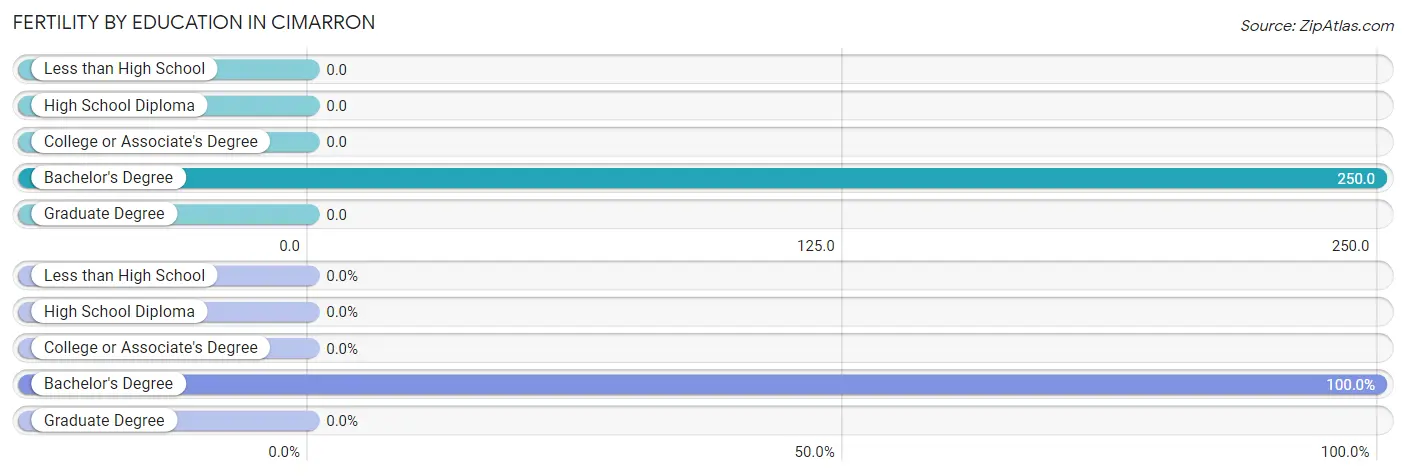
| Educational Attainment | Women with Births | Births / 1,000 Women |
| Less than High School | 0 (0.0%) | 0.0 |
| High School Diploma | 0 (0.0%) | 0.0 |
| College or Associate's Degree | 0 (0.0%) | 0.0 |
| Bachelor's Degree | 5 (100.0%) | 250.0 |
| Graduate Degree | 0 (0.0%) | 0.0 |
| Total | 5 (100.0%) | 23.0 |
Fertility by Education by Marriage Status in Cimarron
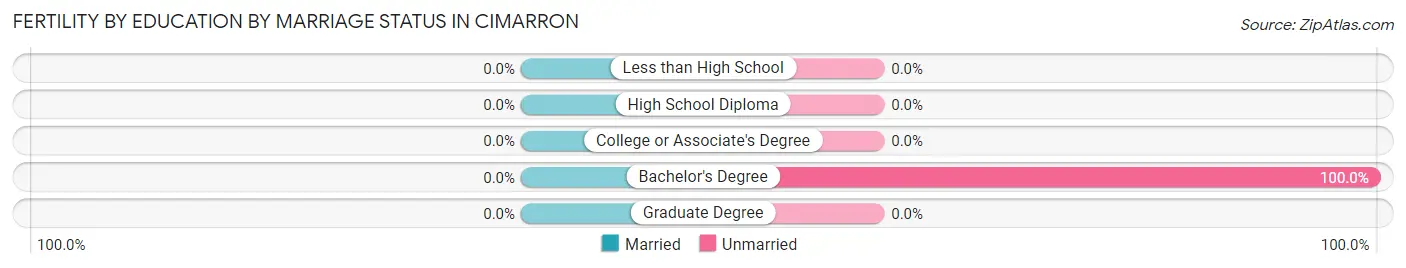
| Educational Attainment | Married | Unmarried |
| Less than High School | 0 (0.0%) | 0 (0.0%) |
| High School Diploma | 0 (0.0%) | 0 (0.0%) |
| College or Associate's Degree | 0 (0.0%) | 0 (0.0%) |
| Bachelor's Degree | 0 (0.0%) | 5 (100.0%) |
| Graduate Degree | 0 (0.0%) | 0 (0.0%) |
| Total | 0 (0.0%) | 5 (100.0%) |
Employment Characteristics in Cimarron
Employment by Class of Employer in Cimarron
Among the 307 employed individuals in Cimarron, not-for-profit organizations (104 | 33.9%), private company employees (95 | 30.9%), and local government employees (30 | 9.8%) make up the most common classes of employment.
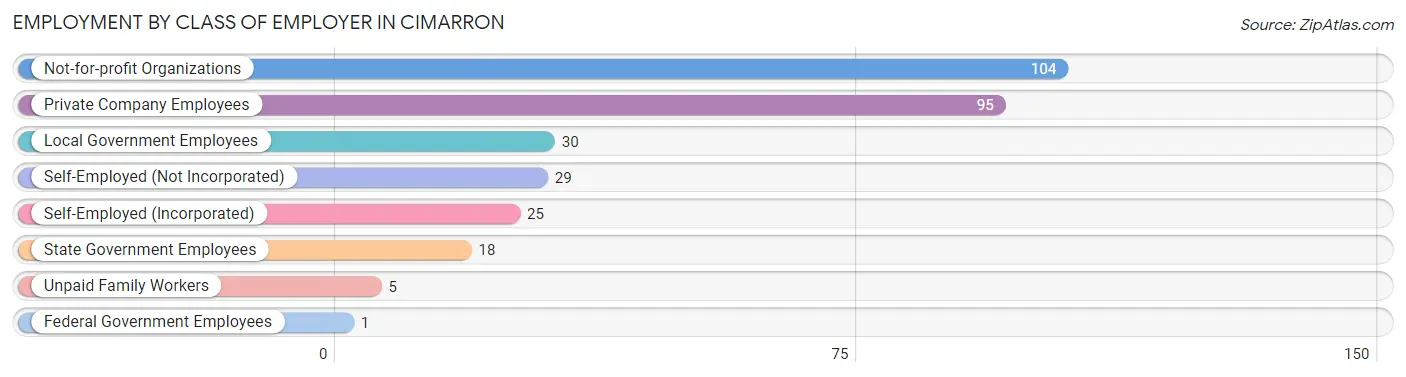
| Employer Class | # Employees | % Employees |
| Private Company Employees | 95 | 30.9% |
| Self-Employed (Incorporated) | 25 | 8.1% |
| Self-Employed (Not Incorporated) | 29 | 9.5% |
| Not-for-profit Organizations | 104 | 33.9% |
| Local Government Employees | 30 | 9.8% |
| State Government Employees | 18 | 5.9% |
| Federal Government Employees | 1 | 0.3% |
| Unpaid Family Workers | 5 | 1.6% |
| Total | 307 | 100.0% |
Employment Status by Age in Cimarron
According to the labor force statistics for Cimarron, out of the total population over 16 years of age (638), 53.8% or 343 individuals are in the labor force, with 8.5% or 29 of them unemployed. The age group with the highest labor force participation rate is 20 to 24 years, with 98.4% or 62 individuals in the labor force. Within the labor force, the 20 to 24 years age range has the highest percentage of unemployed individuals, with 29.0% or 18 of them being unemployed.
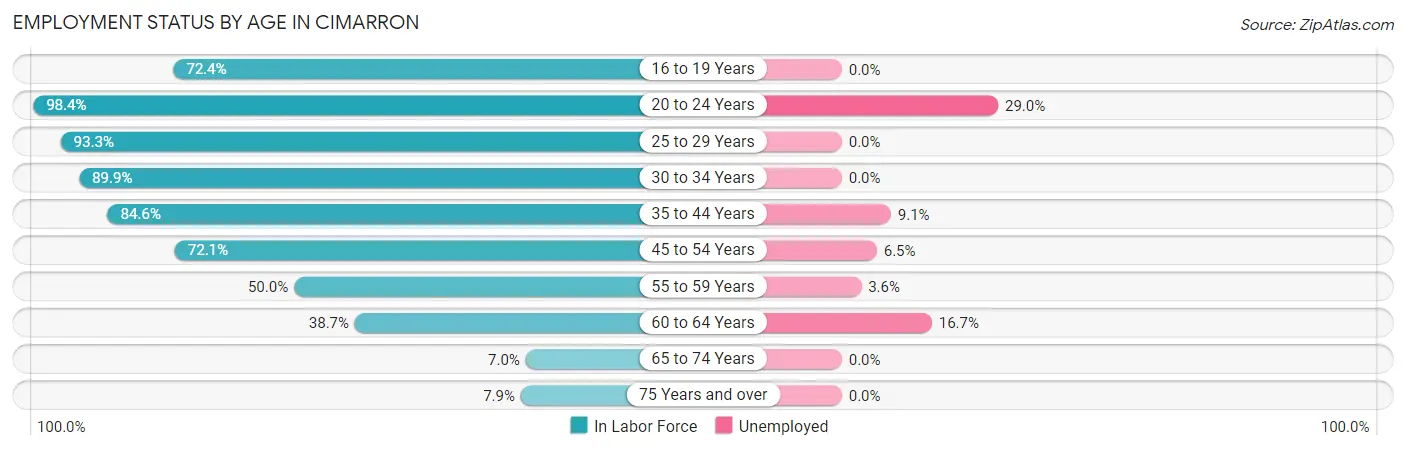
| Age Bracket | In Labor Force | Unemployed |
| 16 to 19 Years | 21 (72.4%) | 0 (0.0%) |
| 20 to 24 Years | 62 (98.4%) | 18 (29.0%) |
| 25 to 29 Years | 56 (93.3%) | 0 (0.0%) |
| 30 to 34 Years | 62 (89.9%) | 0 (0.0%) |
| 35 to 44 Years | 44 (84.6%) | 4 (9.1%) |
| 45 to 54 Years | 31 (72.1%) | 2 (6.5%) |
| 55 to 59 Years | 28 (50.0%) | 1 (3.6%) |
| 60 to 64 Years | 24 (38.7%) | 4 (16.7%) |
| 65 to 74 Years | 8 (7.0%) | 0 (0.0%) |
| 75 Years and over | 7 (7.9%) | 0 (0.0%) |
| Total | 343 (53.8%) | 29 (8.5%) |
Employment Status by Educational Attainment in Cimarron
According to labor force statistics for Cimarron, 71.6% of individuals (245) out of the total population between 25 and 64 years of age (342) are in the labor force, with 4.5% or 11 of them being unemployed. The group with the highest labor force participation rate are those with the educational attainment of bachelor's degree or higher, with 75.5% or 71 individuals in the labor force. Within the labor force, individuals with less than high school education have the highest percentage of unemployment, with 11.8% or 2 of them being unemployed.
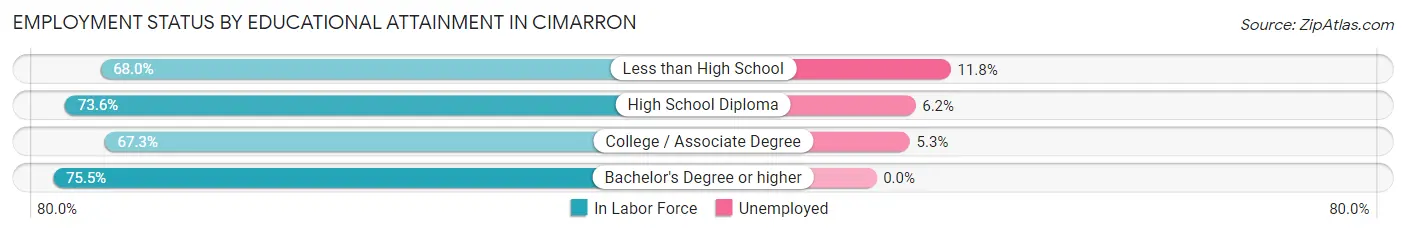
| Educational Attainment | In Labor Force | Unemployed |
| Less than High School | 17 (68.0%) | 3 (11.8%) |
| High School Diploma | 81 (73.6%) | 7 (6.2%) |
| College / Associate Degree | 76 (67.3%) | 6 (5.3%) |
| Bachelor's Degree or higher | 71 (75.5%) | 0 (0.0%) |
| Total | 245 (71.6%) | 15 (4.5%) |
Employment Occupations by Sex in Cimarron
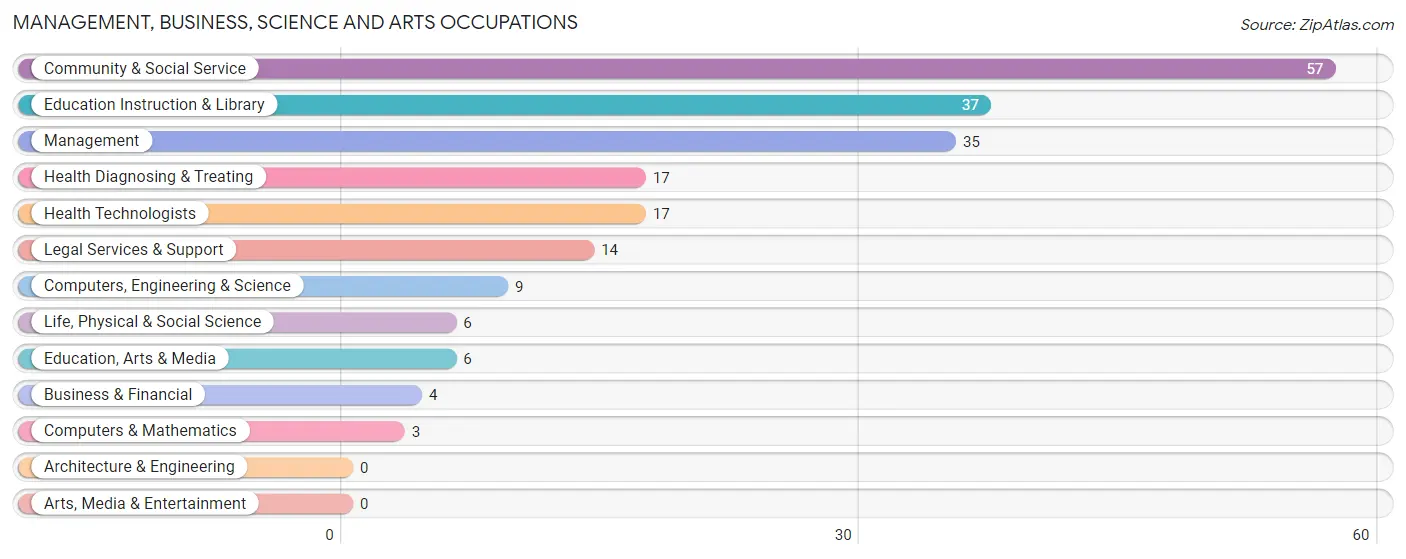
Management, Business, Science and Arts Occupations
The most common Management, Business, Science and Arts occupations in Cimarron are Community & Social Service (57 | 18.1%), Education Instruction & Library (37 | 11.8%), Management (35 | 11.2%), Health Diagnosing & Treating (17 | 5.4%), and Health Technologists (17 | 5.4%).
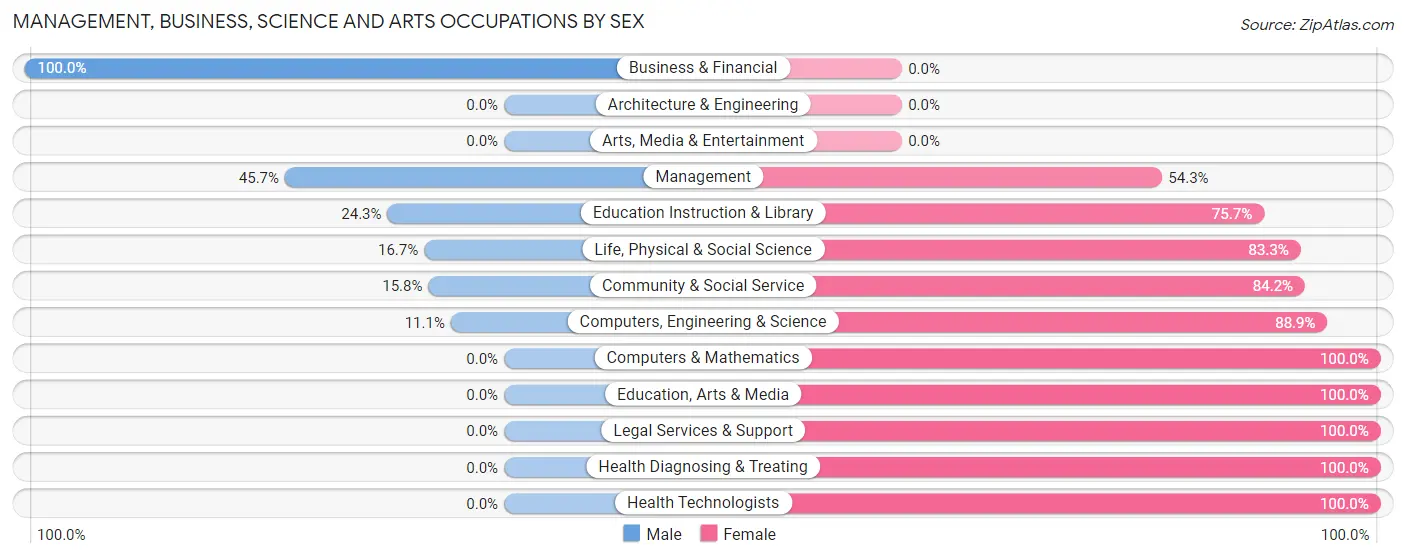
Management, Business, Science and Arts Occupations by Sex
Within the Management, Business, Science and Arts occupations in Cimarron, the most male-oriented occupations are Business & Financial (100.0%), Management (45.7%), and Education Instruction & Library (24.3%), while the most female-oriented occupations are Computers & Mathematics (100.0%), Education, Arts & Media (100.0%), and Legal Services & Support (100.0%).
| Occupation | Male | Female |
| Management | 16 (45.7%) | 19 (54.3%) |
| Business & Financial | 4 (100.0%) | 0 (0.0%) |
| Computers, Engineering & Science | 1 (11.1%) | 8 (88.9%) |
| Computers & Mathematics | 0 (0.0%) | 3 (100.0%) |
| Architecture & Engineering | 0 (0.0%) | 0 (0.0%) |
| Life, Physical & Social Science | 1 (16.7%) | 5 (83.3%) |
| Community & Social Service | 9 (15.8%) | 48 (84.2%) |
| Education, Arts & Media | 0 (0.0%) | 6 (100.0%) |
| Legal Services & Support | 0 (0.0%) | 14 (100.0%) |
| Education Instruction & Library | 9 (24.3%) | 28 (75.7%) |
| Arts, Media & Entertainment | 0 (0.0%) | 0 (0.0%) |
| Health Diagnosing & Treating | 0 (0.0%) | 17 (100.0%) |
| Health Technologists | 0 (0.0%) | 17 (100.0%) |
| Total (Category) | 30 (24.6%) | 92 (75.4%) |
| Total (Overall) | 109 (34.7%) | 205 (65.3%) |
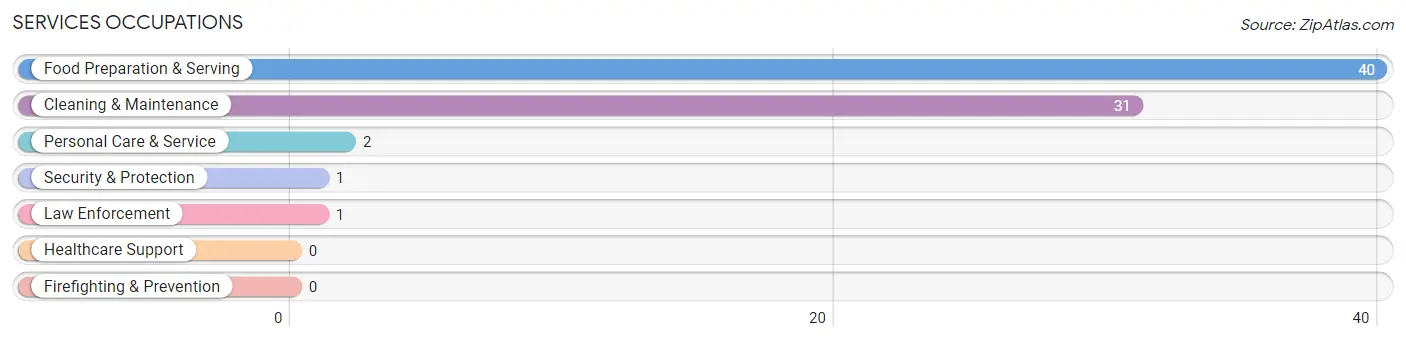
Services Occupations
The most common Services occupations in Cimarron are Food Preparation & Serving (40 | 12.7%), Cleaning & Maintenance (31 | 9.9%), Personal Care & Service (2 | 0.6%), Security & Protection (1 | 0.3%), and Law Enforcement (1 | 0.3%).
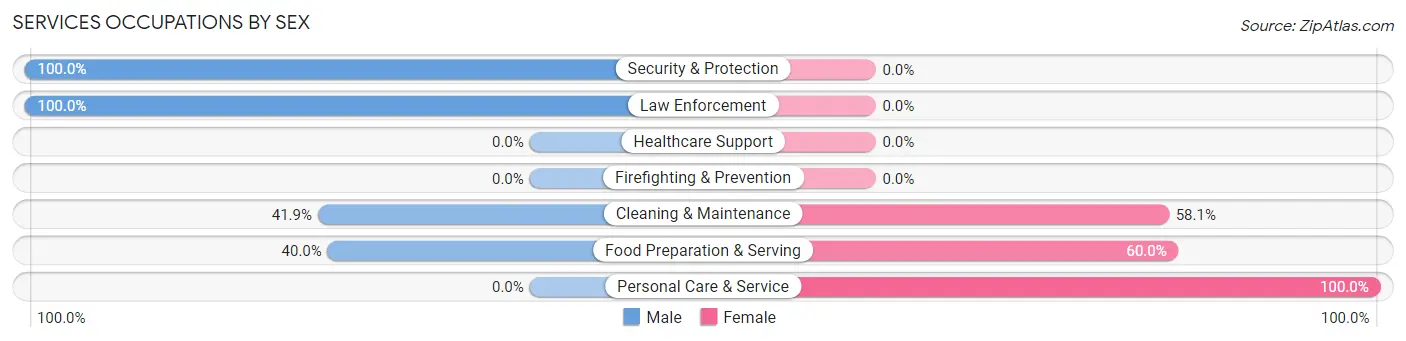
Services Occupations by Sex
Within the Services occupations in Cimarron, the most male-oriented occupations are Security & Protection (100.0%), Law Enforcement (100.0%), and Cleaning & Maintenance (41.9%), while the most female-oriented occupations are Personal Care & Service (100.0%), Food Preparation & Serving (60.0%), and Cleaning & Maintenance (58.1%).
| Occupation | Male | Female |
| Healthcare Support | 0 (0.0%) | 0 (0.0%) |
| Security & Protection | 1 (100.0%) | 0 (0.0%) |
| Firefighting & Prevention | 0 (0.0%) | 0 (0.0%) |
| Law Enforcement | 1 (100.0%) | 0 (0.0%) |
| Food Preparation & Serving | 16 (40.0%) | 24 (60.0%) |
| Cleaning & Maintenance | 13 (41.9%) | 18 (58.1%) |
| Personal Care & Service | 0 (0.0%) | 2 (100.0%) |
| Total (Category) | 30 (40.5%) | 44 (59.5%) |
| Total (Overall) | 109 (34.7%) | 205 (65.3%) |
Sales and Office Occupations
The most common Sales and Office occupations in Cimarron are Sales & Related (71 | 22.6%), and Office & Administration (16 | 5.1%).
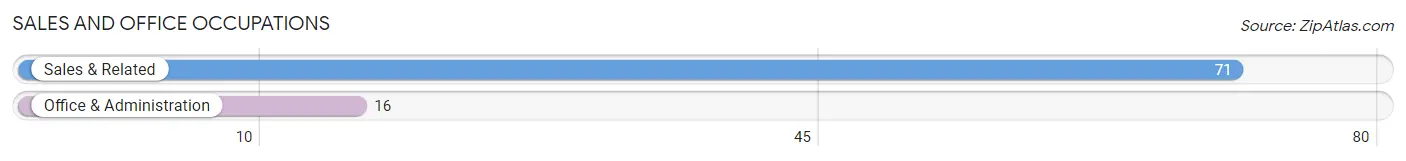
Sales and Office Occupations by Sex
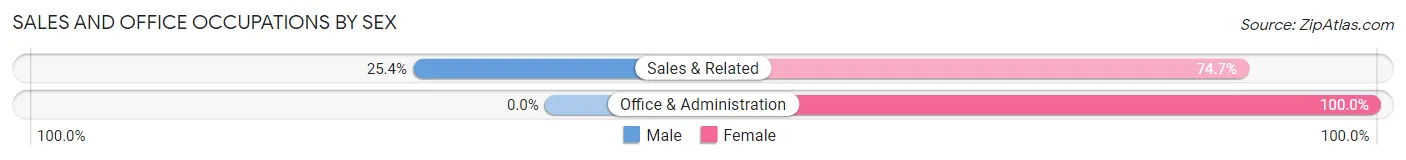
| Occupation | Male | Female |
| Sales & Related | 18 (25.4%) | 53 (74.7%) |
| Office & Administration | 0 (0.0%) | 16 (100.0%) |
| Total (Category) | 18 (20.7%) | 69 (79.3%) |
| Total (Overall) | 109 (34.7%) | 205 (65.3%) |
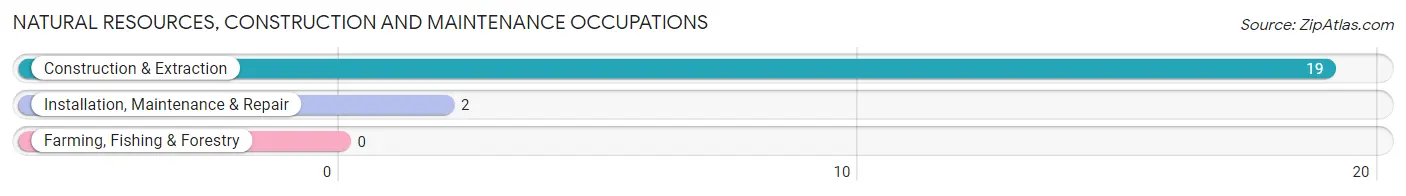
Natural Resources, Construction and Maintenance Occupations
The most common Natural Resources, Construction and Maintenance occupations in Cimarron are Construction & Extraction (19 | 6.0%), and Installation, Maintenance & Repair (2 | 0.6%).
Natural Resources, Construction and Maintenance Occupations by Sex
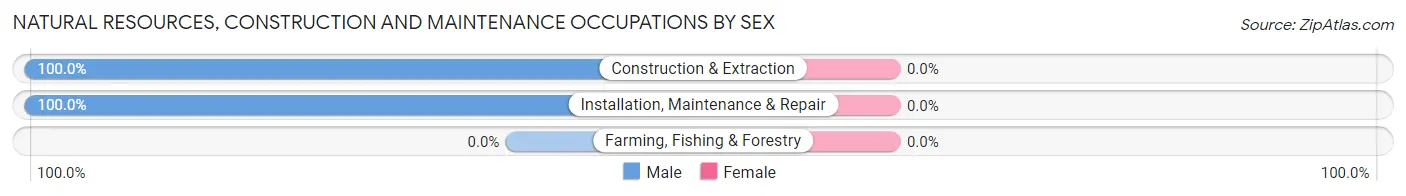
| Occupation | Male | Female |
| Farming, Fishing & Forestry | 0 (0.0%) | 0 (0.0%) |
| Construction & Extraction | 19 (100.0%) | 0 (0.0%) |
| Installation, Maintenance & Repair | 2 (100.0%) | 0 (0.0%) |
| Total (Category) | 21 (100.0%) | 0 (0.0%) |
| Total (Overall) | 109 (34.7%) | 205 (65.3%) |
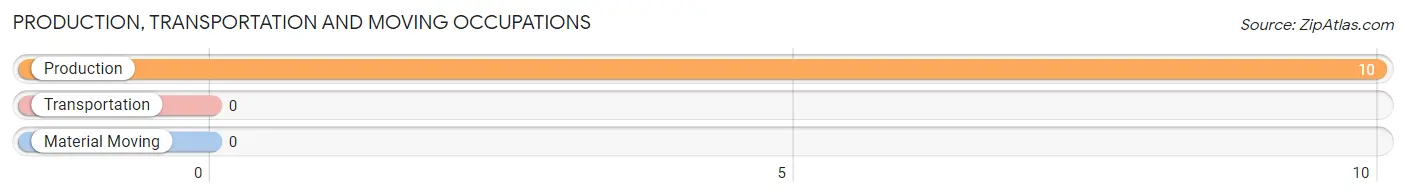
Production, Transportation and Moving Occupations
The most common Production, Transportation and Moving occupations in Cimarron are , and Production (10 | 3.2%).
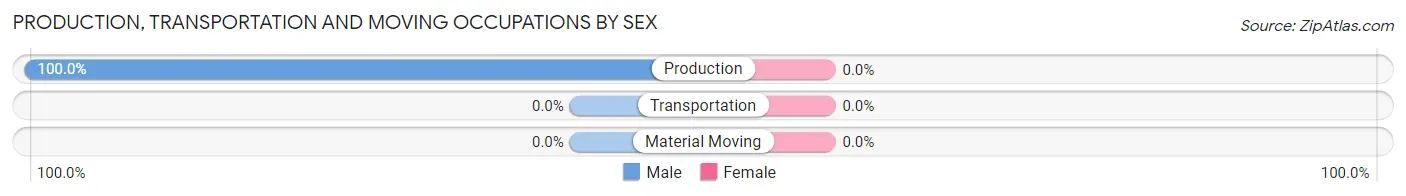
Production, Transportation and Moving Occupations by Sex
| Occupation | Male | Female |
| Production | 10 (100.0%) | 0 (0.0%) |
| Transportation | 0 (0.0%) | 0 (0.0%) |
| Material Moving | 0 (0.0%) | 0 (0.0%) |
| Total (Category) | 10 (100.0%) | 0 (0.0%) |
| Total (Overall) | 109 (34.7%) | 205 (65.3%) |
Employment Industries by Sex in Cimarron
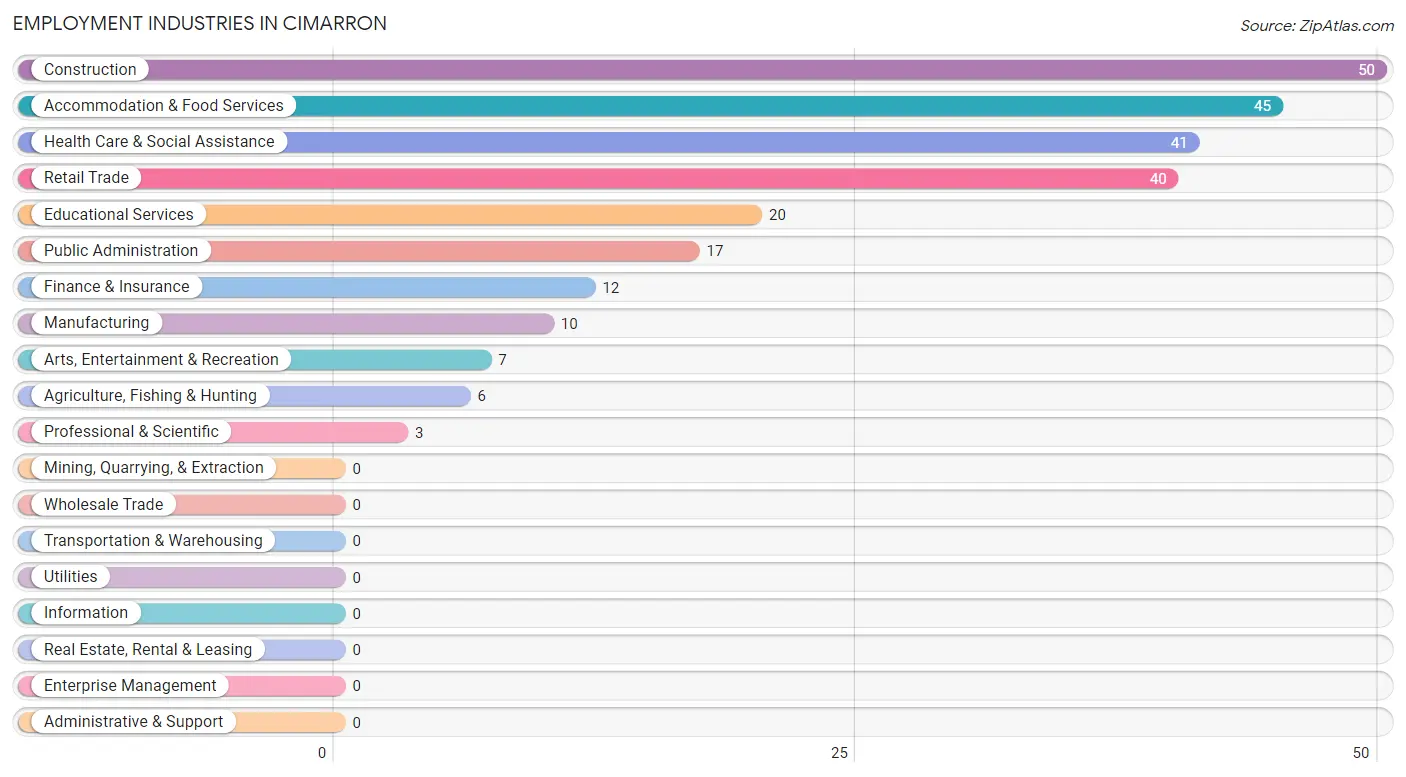
Employment Industries in Cimarron
The major employment industries in Cimarron include Construction (50 | 15.9%), Accommodation & Food Services (45 | 14.3%), Health Care & Social Assistance (41 | 13.1%), Retail Trade (40 | 12.7%), and Educational Services (20 | 6.4%).
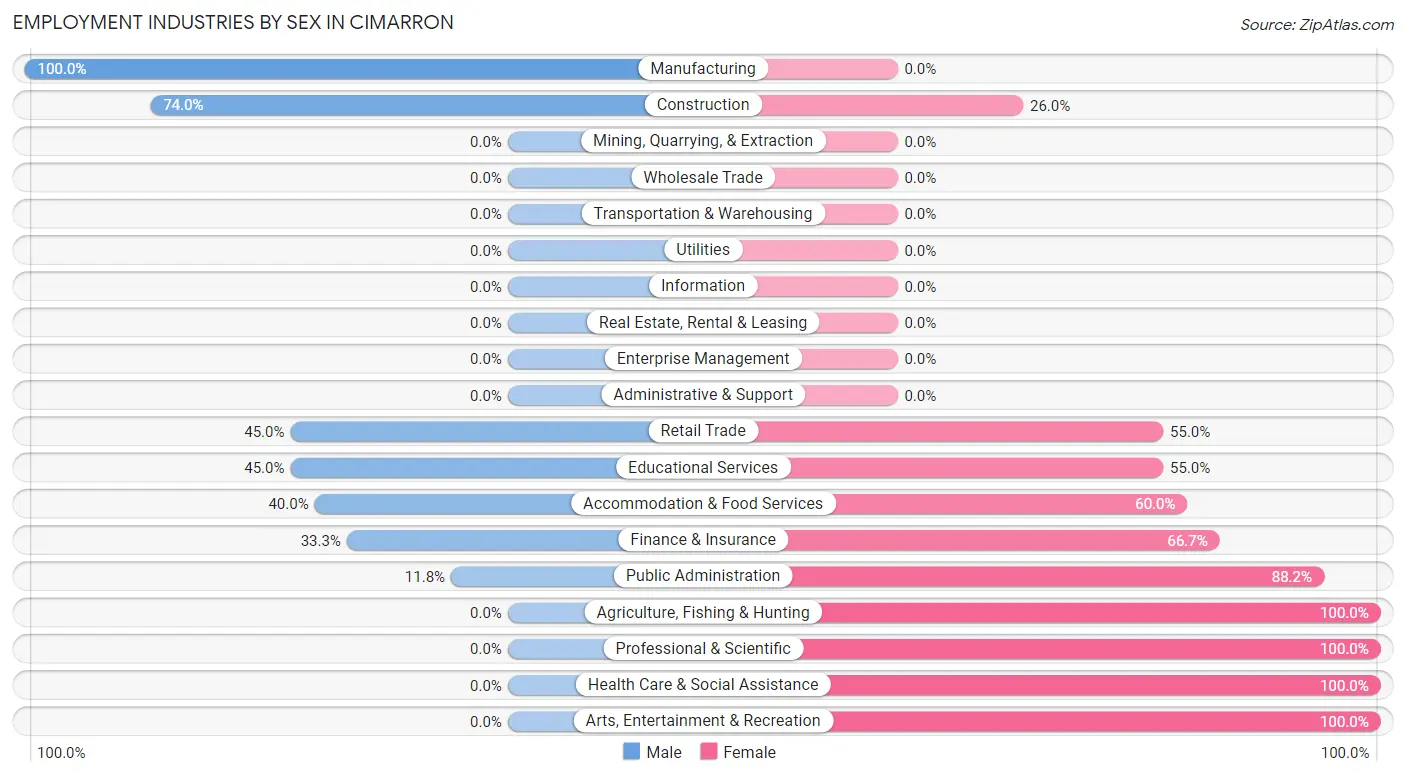
Employment Industries by Sex in Cimarron
The Cimarron industries that see more men than women are Manufacturing (100.0%), Construction (74.0%), and Retail Trade (45.0%), whereas the industries that tend to have a higher number of women are Agriculture, Fishing & Hunting (100.0%), Professional & Scientific (100.0%), and Health Care & Social Assistance (100.0%).
| Industry | Male | Female |
| Agriculture, Fishing & Hunting | 0 (0.0%) | 6 (100.0%) |
| Mining, Quarrying, & Extraction | 0 (0.0%) | 0 (0.0%) |
| Construction | 37 (74.0%) | 13 (26.0%) |
| Manufacturing | 10 (100.0%) | 0 (0.0%) |
| Wholesale Trade | 0 (0.0%) | 0 (0.0%) |
| Retail Trade | 18 (45.0%) | 22 (55.0%) |
| Transportation & Warehousing | 0 (0.0%) | 0 (0.0%) |
| Utilities | 0 (0.0%) | 0 (0.0%) |
| Information | 0 (0.0%) | 0 (0.0%) |
| Finance & Insurance | 4 (33.3%) | 8 (66.7%) |
| Real Estate, Rental & Leasing | 0 (0.0%) | 0 (0.0%) |
| Professional & Scientific | 0 (0.0%) | 3 (100.0%) |
| Enterprise Management | 0 (0.0%) | 0 (0.0%) |
| Administrative & Support | 0 (0.0%) | 0 (0.0%) |
| Educational Services | 9 (45.0%) | 11 (55.0%) |
| Health Care & Social Assistance | 0 (0.0%) | 41 (100.0%) |
| Arts, Entertainment & Recreation | 0 (0.0%) | 7 (100.0%) |
| Accommodation & Food Services | 18 (40.0%) | 27 (60.0%) |
| Public Administration | 2 (11.8%) | 15 (88.2%) |
| Total | 109 (34.7%) | 205 (65.3%) |
Education in Cimarron
School Enrollment in Cimarron
The most common levels of schooling among the 148 students in Cimarron are high school (56 | 37.8%), middle school (44 | 29.7%), and elementary school (31 | 20.9%).
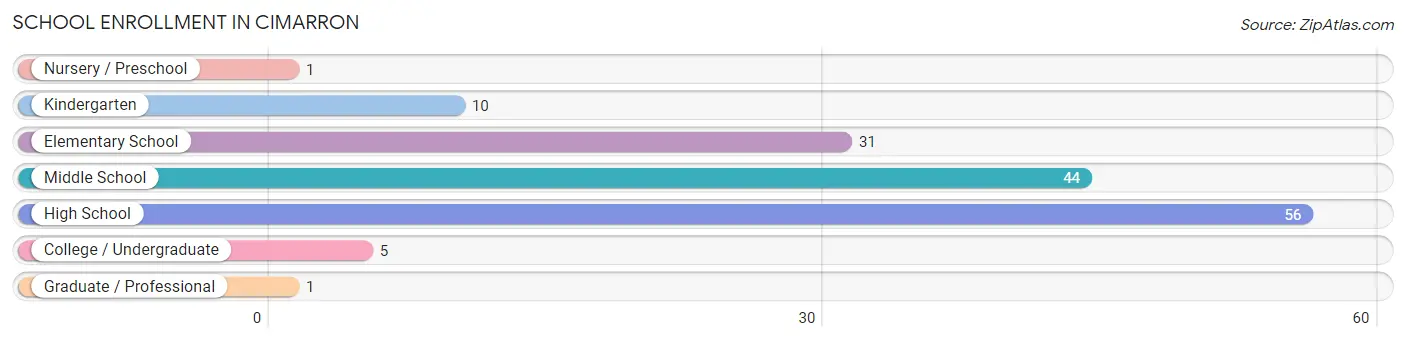
| School Level | # Students | % Students |
| Nursery / Preschool | 1 | 0.7% |
| Kindergarten | 10 | 6.8% |
| Elementary School | 31 | 20.9% |
| Middle School | 44 | 29.7% |
| High School | 56 | 37.8% |
| College / Undergraduate | 5 | 3.4% |
| Graduate / Professional | 1 | 0.7% |
| Total | 148 | 100.0% |
School Enrollment by Age by Funding Source in Cimarron
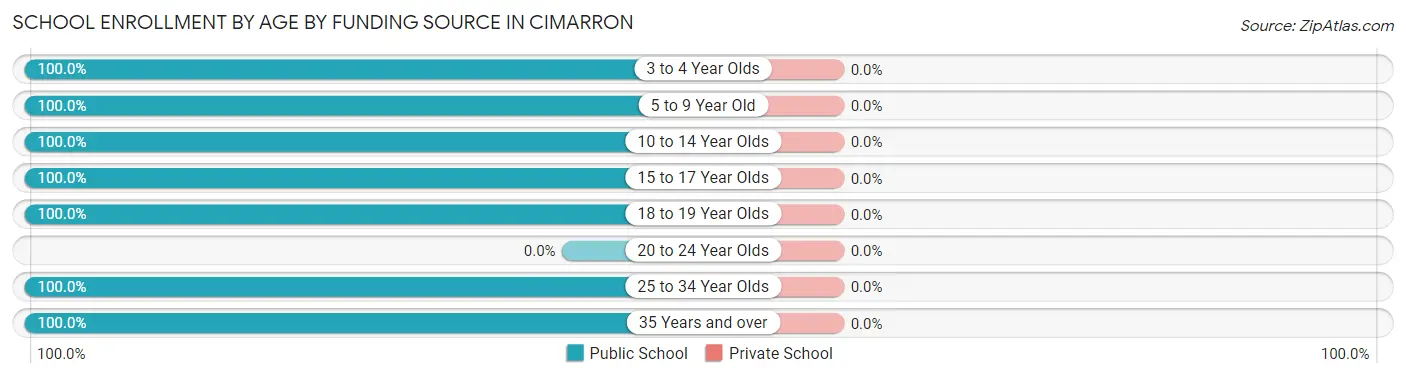
| Age Bracket | Public School | Private School |
| 3 to 4 Year Olds | 1 (100.0%) | 0 (0.0%) |
| 5 to 9 Year Old | 41 (100.0%) | 0 (0.0%) |
| 10 to 14 Year Olds | 44 (100.0%) | 0 (0.0%) |
| 15 to 17 Year Olds | 56 (100.0%) | 0 (0.0%) |
| 18 to 19 Year Olds | 2 (100.0%) | 0 (0.0%) |
| 20 to 24 Year Olds | 0 (0.0%) | 0 (0.0%) |
| 25 to 34 Year Olds | 3 (100.0%) | 0 (0.0%) |
| 35 Years and over | 1 (100.0%) | 0 (0.0%) |
| Total | 148 (100.0%) | 0 (0.0%) |
Educational Attainment by Field of Study in Cimarron
Literature & languages (30 | 18.0%), science & technology (27 | 16.2%), education (25 | 15.0%), arts & humanities (22 | 13.2%), and bio, nature & agricultural (16 | 9.6%) are the most common fields of study among 167 individuals in Cimarron who have obtained a bachelor's degree or higher.
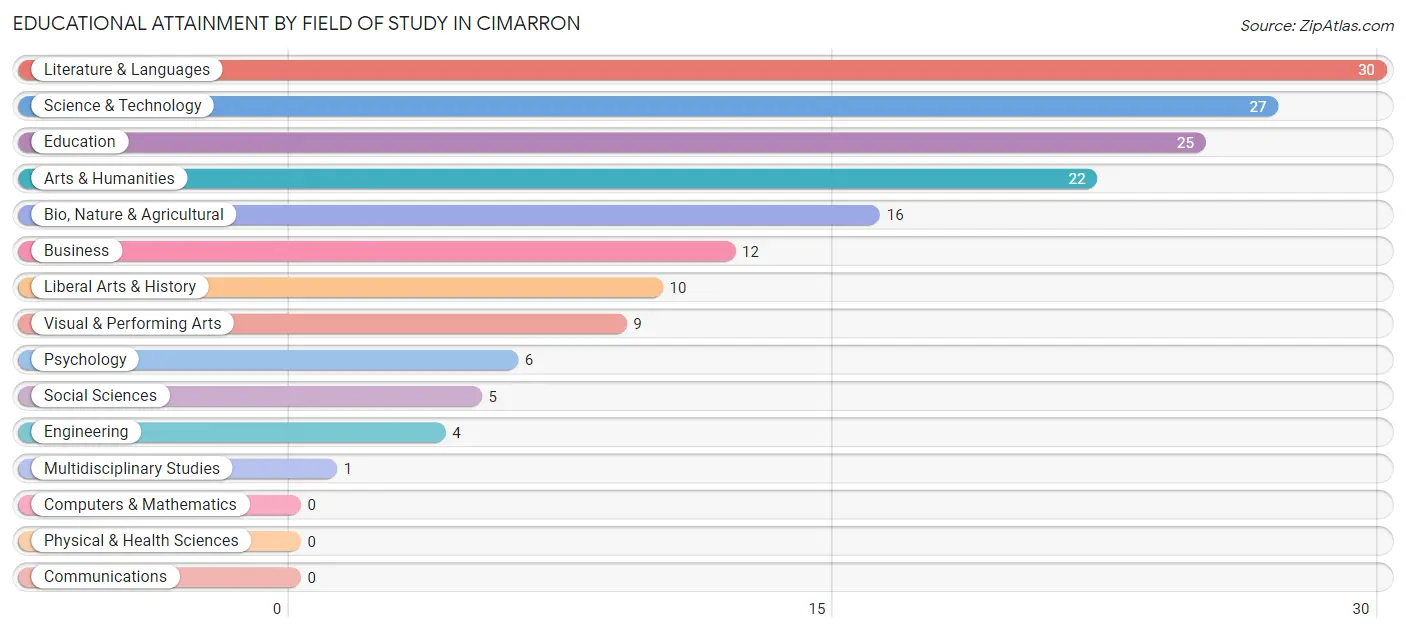
| Field of Study | # Graduates | % Graduates |
| Computers & Mathematics | 0 | 0.0% |
| Bio, Nature & Agricultural | 16 | 9.6% |
| Physical & Health Sciences | 0 | 0.0% |
| Psychology | 6 | 3.6% |
| Social Sciences | 5 | 3.0% |
| Engineering | 4 | 2.4% |
| Multidisciplinary Studies | 1 | 0.6% |
| Science & Technology | 27 | 16.2% |
| Business | 12 | 7.2% |
| Education | 25 | 15.0% |
| Literature & Languages | 30 | 18.0% |
| Liberal Arts & History | 10 | 6.0% |
| Visual & Performing Arts | 9 | 5.4% |
| Communications | 0 | 0.0% |
| Arts & Humanities | 22 | 13.2% |
| Total | 167 | 100.0% |
Transportation & Commute in Cimarron
Vehicle Availability by Sex in Cimarron
The most prevalent vehicle ownership categories in Cimarron are males with 2 vehicles (74, accounting for 69.2%) and females with 2 vehicles (44, making up 37.0%).
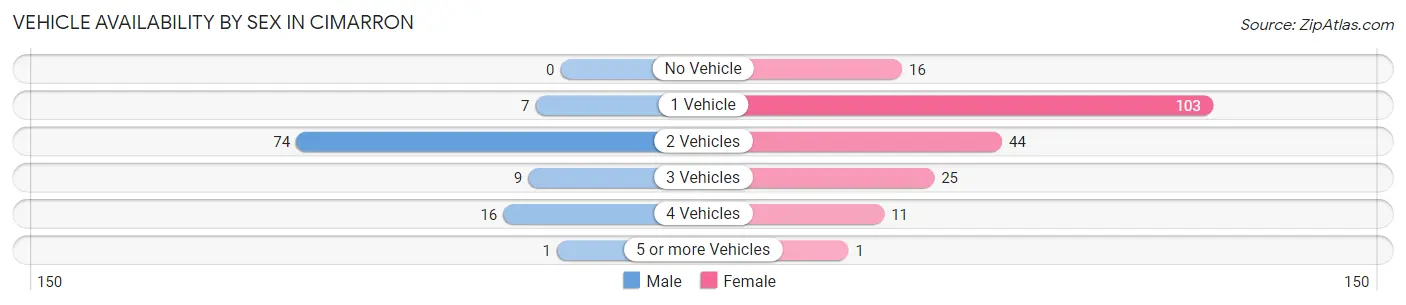
| Vehicles Available | Male | Female |
| No Vehicle | 0 (0.0%) | 16 (8.0%) |
| 1 Vehicle | 7 (6.5%) | 103 (51.5%) |
| 2 Vehicles | 74 (69.2%) | 44 (22.0%) |
| 3 Vehicles | 9 (8.4%) | 25 (12.5%) |
| 4 Vehicles | 16 (14.9%) | 11 (5.5%) |
| 5 or more Vehicles | 1 (0.9%) | 1 (0.5%) |
| Total | 107 (100.0%) | 200 (100.0%) |
Commute Time in Cimarron
The most frequently occuring commute durations in Cimarron are 5 to 9 minutes (102 commuters, 35.9%), 10 to 14 minutes (58 commuters, 20.4%), and 30 to 34 minutes (30 commuters, 10.6%).
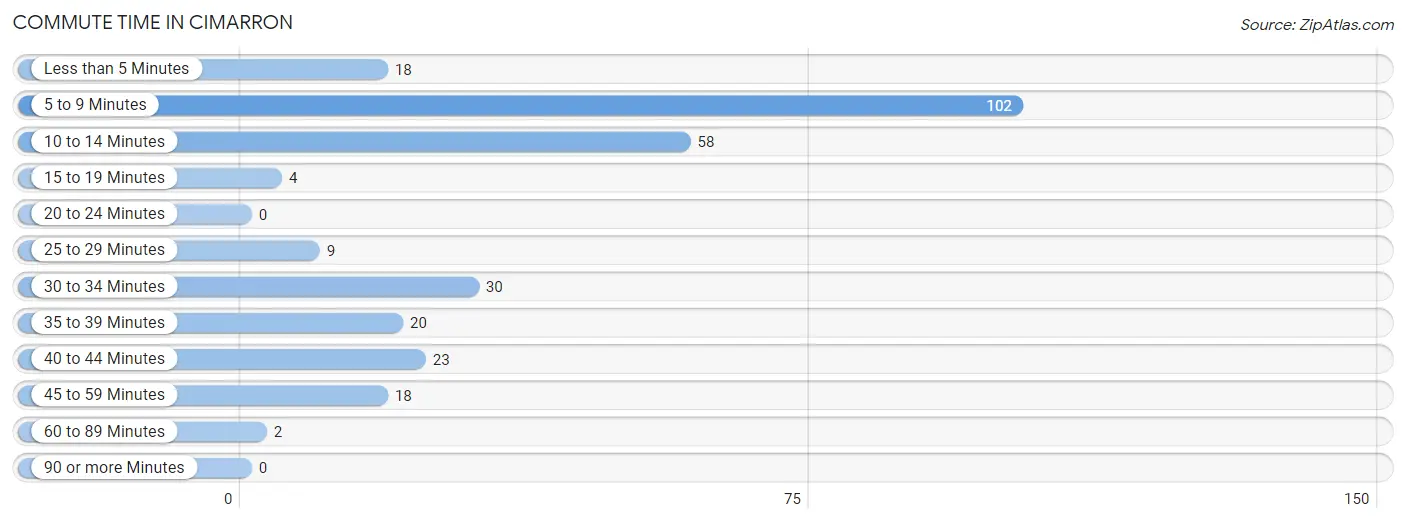
| Commute Time | # Commuters | % Commuters |
| Less than 5 Minutes | 18 | 6.3% |
| 5 to 9 Minutes | 102 | 35.9% |
| 10 to 14 Minutes | 58 | 20.4% |
| 15 to 19 Minutes | 4 | 1.4% |
| 20 to 24 Minutes | 0 | 0.0% |
| 25 to 29 Minutes | 9 | 3.2% |
| 30 to 34 Minutes | 30 | 10.6% |
| 35 to 39 Minutes | 20 | 7.0% |
| 40 to 44 Minutes | 23 | 8.1% |
| 45 to 59 Minutes | 18 | 6.3% |
| 60 to 89 Minutes | 2 | 0.7% |
| 90 or more Minutes | 0 | 0.0% |
Commute Time by Sex in Cimarron
The most common commute times in Cimarron are 5 to 9 minutes (38 commuters, 39.6%) for males and 5 to 9 minutes (64 commuters, 34.0%) for females.
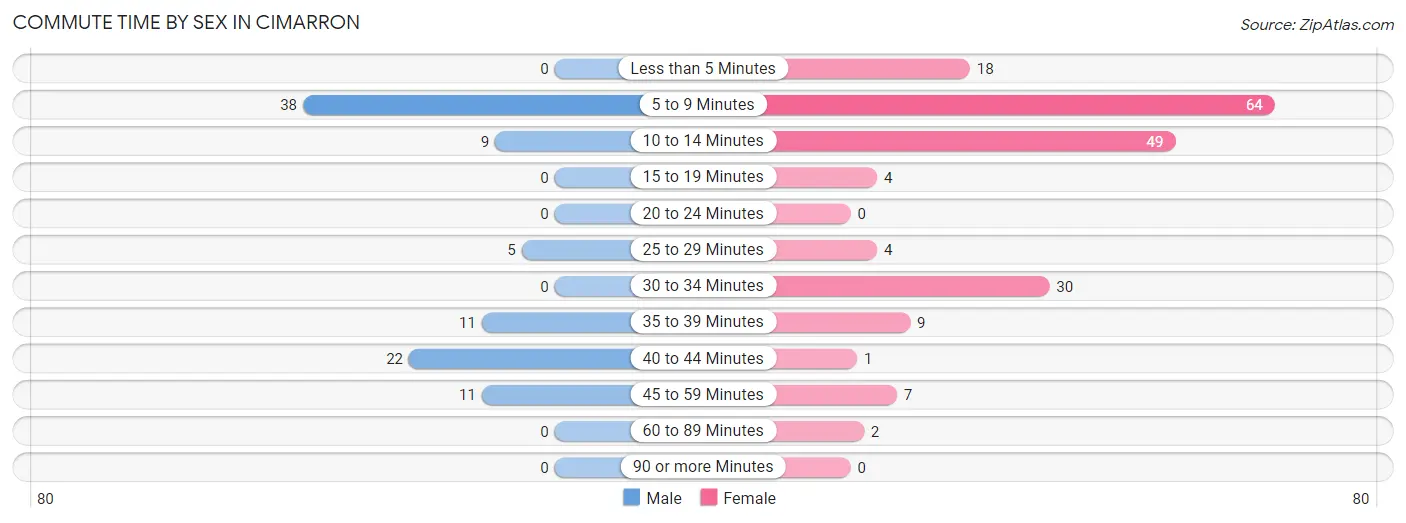
| Commute Time | Male | Female |
| Less than 5 Minutes | 0 (0.0%) | 18 (9.6%) |
| 5 to 9 Minutes | 38 (39.6%) | 64 (34.0%) |
| 10 to 14 Minutes | 9 (9.4%) | 49 (26.1%) |
| 15 to 19 Minutes | 0 (0.0%) | 4 (2.1%) |
| 20 to 24 Minutes | 0 (0.0%) | 0 (0.0%) |
| 25 to 29 Minutes | 5 (5.2%) | 4 (2.1%) |
| 30 to 34 Minutes | 0 (0.0%) | 30 (16.0%) |
| 35 to 39 Minutes | 11 (11.5%) | 9 (4.8%) |
| 40 to 44 Minutes | 22 (22.9%) | 1 (0.5%) |
| 45 to 59 Minutes | 11 (11.5%) | 7 (3.7%) |
| 60 to 89 Minutes | 0 (0.0%) | 2 (1.1%) |
| 90 or more Minutes | 0 (0.0%) | 0 (0.0%) |
Time of Departure to Work by Sex in Cimarron
The most frequent times of departure to work in Cimarron are 7:30 AM to 7:59 AM (34, 35.4%) for males and 7:30 AM to 7:59 AM (82, 43.6%) for females.
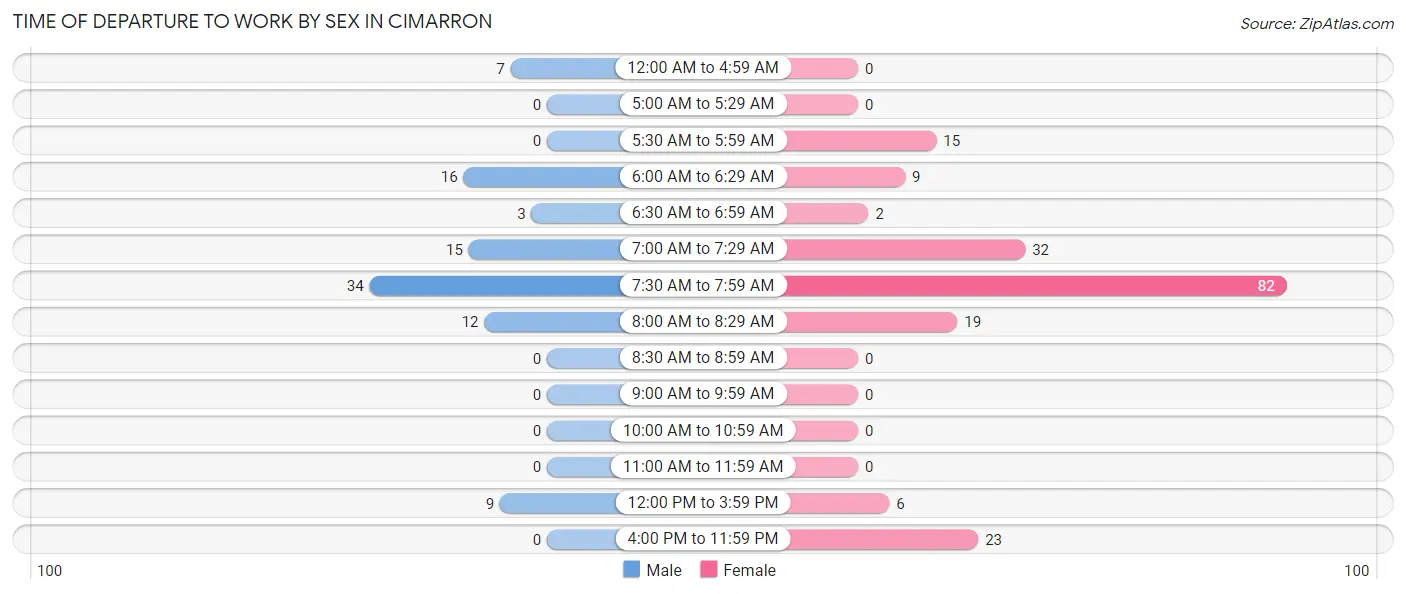
| Time of Departure | Male | Female |
| 12:00 AM to 4:59 AM | 7 (7.3%) | 0 (0.0%) |
| 5:00 AM to 5:29 AM | 0 (0.0%) | 0 (0.0%) |
| 5:30 AM to 5:59 AM | 0 (0.0%) | 15 (8.0%) |
| 6:00 AM to 6:29 AM | 16 (16.7%) | 9 (4.8%) |
| 6:30 AM to 6:59 AM | 3 (3.1%) | 2 (1.1%) |
| 7:00 AM to 7:29 AM | 15 (15.6%) | 32 (17.0%) |
| 7:30 AM to 7:59 AM | 34 (35.4%) | 82 (43.6%) |
| 8:00 AM to 8:29 AM | 12 (12.5%) | 19 (10.1%) |
| 8:30 AM to 8:59 AM | 0 (0.0%) | 0 (0.0%) |
| 9:00 AM to 9:59 AM | 0 (0.0%) | 0 (0.0%) |
| 10:00 AM to 10:59 AM | 0 (0.0%) | 0 (0.0%) |
| 11:00 AM to 11:59 AM | 0 (0.0%) | 0 (0.0%) |
| 12:00 PM to 3:59 PM | 9 (9.4%) | 6 (3.2%) |
| 4:00 PM to 11:59 PM | 0 (0.0%) | 23 (12.2%) |
| Total | 96 (100.0%) | 188 (100.0%) |
Housing Occupancy in Cimarron
Occupancy by Ownership in Cimarron
Of the total 419 dwellings in Cimarron, owner-occupied units account for 266 (63.5%), while renter-occupied units make up 153 (36.5%).
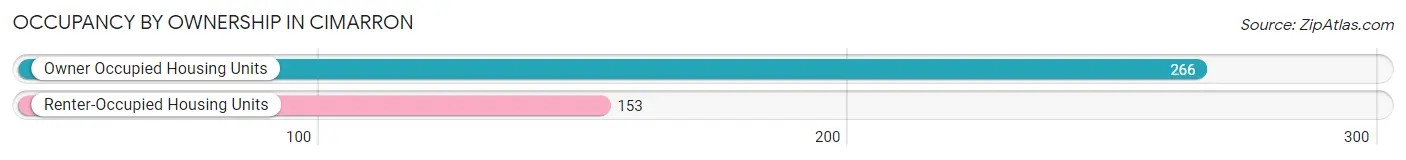
| Occupancy | # Housing Units | % Housing Units |
| Owner Occupied Housing Units | 266 | 63.5% |
| Renter-Occupied Housing Units | 153 | 36.5% |
| Total Occupied Housing Units | 419 | 100.0% |
Occupancy by Household Size in Cimarron
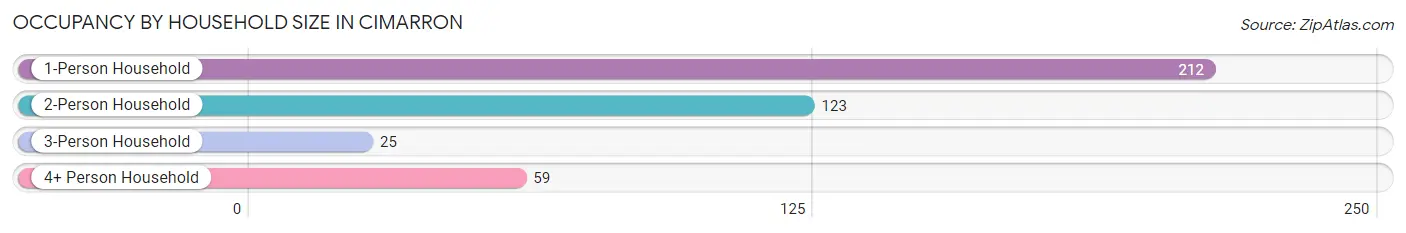
| Household Size | # Housing Units | % Housing Units |
| 1-Person Household | 212 | 50.6% |
| 2-Person Household | 123 | 29.4% |
| 3-Person Household | 25 | 6.0% |
| 4+ Person Household | 59 | 14.1% |
| Total Housing Units | 419 | 100.0% |
Occupancy by Ownership by Household Size in Cimarron
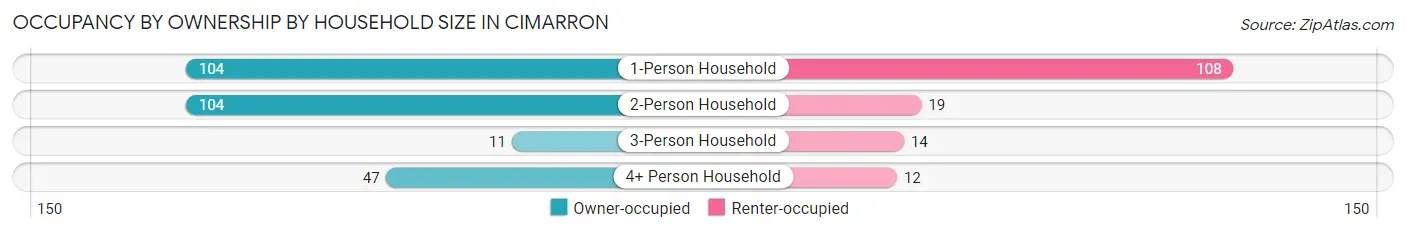
| Household Size | Owner-occupied | Renter-occupied |
| 1-Person Household | 104 (49.1%) | 108 (50.9%) |
| 2-Person Household | 104 (84.6%) | 19 (15.4%) |
| 3-Person Household | 11 (44.0%) | 14 (56.0%) |
| 4+ Person Household | 47 (79.7%) | 12 (20.3%) |
| Total Housing Units | 266 (63.5%) | 153 (36.5%) |
Occupancy by Educational Attainment in Cimarron
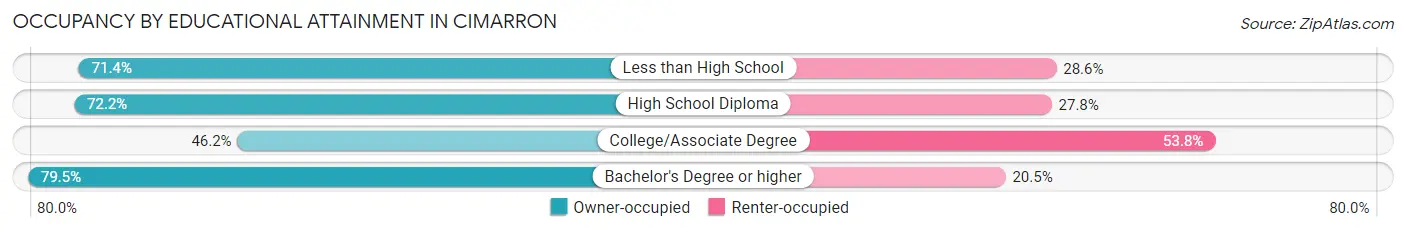
| Household Size | Owner-occupied | Renter-occupied |
| Less than High School | 10 (71.4%) | 4 (28.6%) |
| High School Diploma | 83 (72.2%) | 32 (27.8%) |
| College/Associate Degree | 80 (46.2%) | 93 (53.8%) |
| Bachelor's Degree or higher | 93 (79.5%) | 24 (20.5%) |
Occupancy by Age of Householder in Cimarron
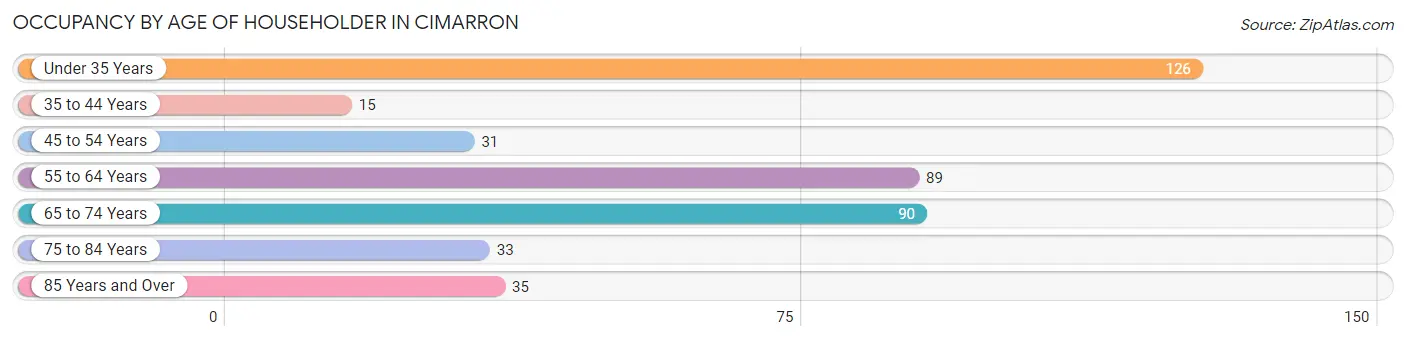
| Age Bracket | # Households | % Households |
| Under 35 Years | 126 | 30.1% |
| 35 to 44 Years | 15 | 3.6% |
| 45 to 54 Years | 31 | 7.4% |
| 55 to 64 Years | 89 | 21.2% |
| 65 to 74 Years | 90 | 21.5% |
| 75 to 84 Years | 33 | 7.9% |
| 85 Years and Over | 35 | 8.4% |
| Total | 419 | 100.0% |
Housing Finances in Cimarron
Median Income by Occupancy in Cimarron
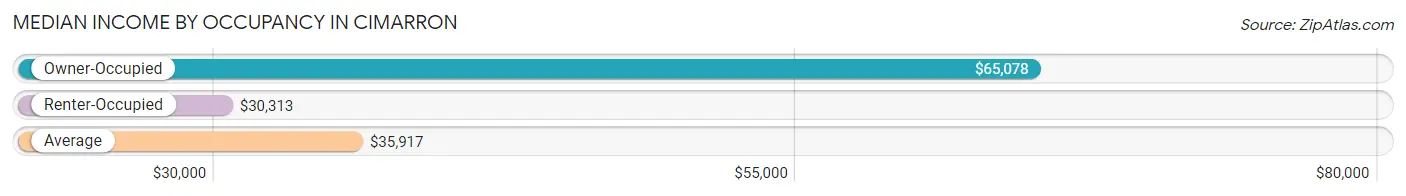
| Occupancy Type | # Households | Median Income |
| Owner-Occupied | 266 (63.5%) | $65,078 |
| Renter-Occupied | 153 (36.5%) | $30,313 |
| Average | 419 (100.0%) | $35,917 |
Occupancy by Householder Income Bracket in Cimarron
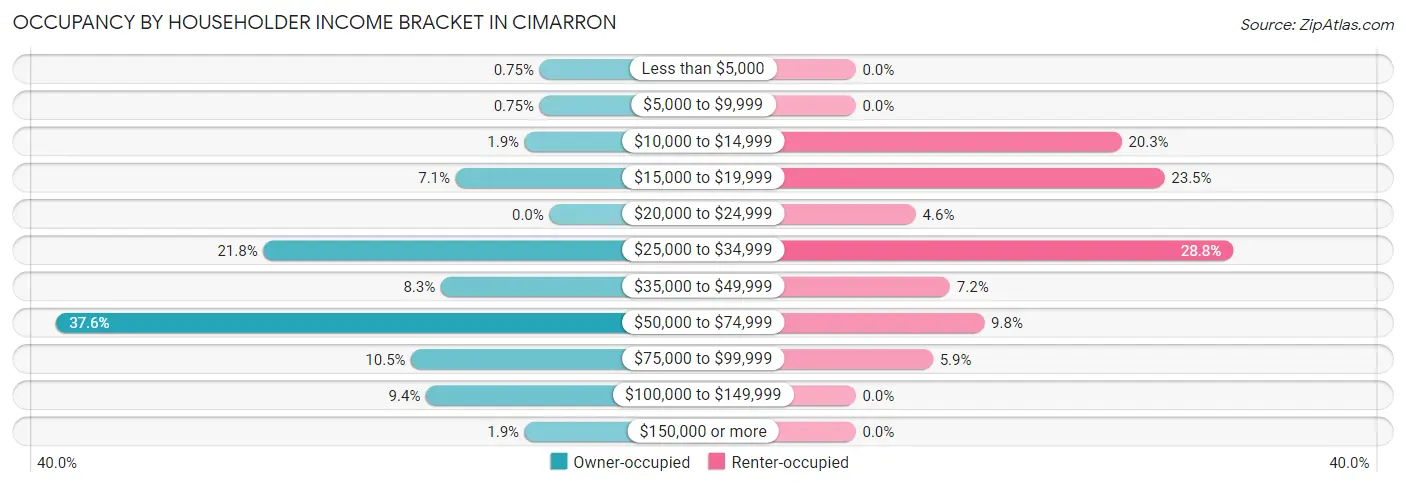
| Income Bracket | Owner-occupied | Renter-occupied |
| Less than $5,000 | 2 (0.7%) | 0 (0.0%) |
| $5,000 to $9,999 | 2 (0.7%) | 0 (0.0%) |
| $10,000 to $14,999 | 5 (1.9%) | 31 (20.3%) |
| $15,000 to $19,999 | 19 (7.1%) | 36 (23.5%) |
| $20,000 to $24,999 | 0 (0.0%) | 7 (4.6%) |
| $25,000 to $34,999 | 58 (21.8%) | 44 (28.8%) |
| $35,000 to $49,999 | 22 (8.3%) | 11 (7.2%) |
| $50,000 to $74,999 | 100 (37.6%) | 15 (9.8%) |
| $75,000 to $99,999 | 28 (10.5%) | 9 (5.9%) |
| $100,000 to $149,999 | 25 (9.4%) | 0 (0.0%) |
| $150,000 or more | 5 (1.9%) | 0 (0.0%) |
| Total | 266 (100.0%) | 153 (100.0%) |
Monthly Housing Cost Tiers in Cimarron
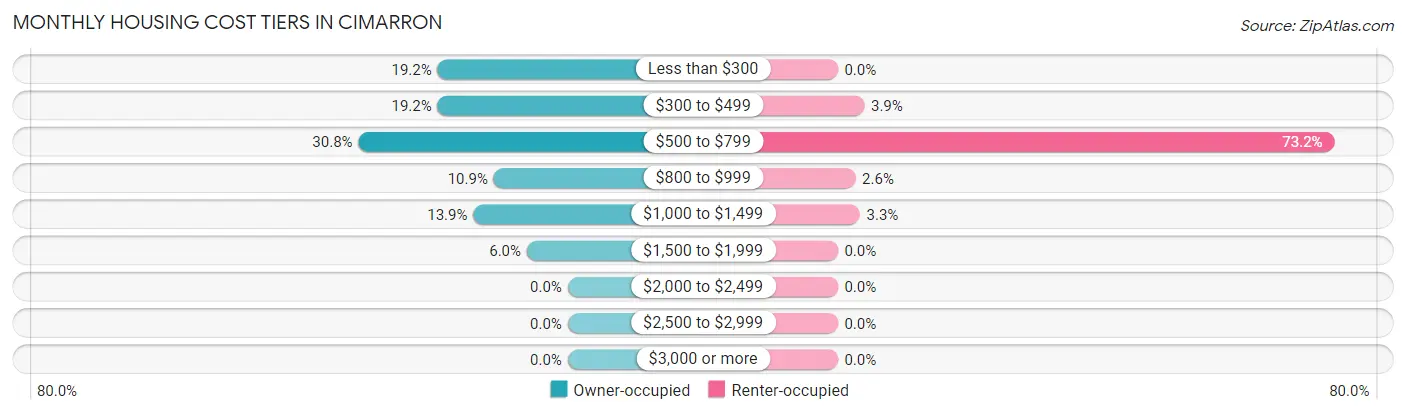
| Monthly Cost | Owner-occupied | Renter-occupied |
| Less than $300 | 51 (19.2%) | 0 (0.0%) |
| $300 to $499 | 51 (19.2%) | 6 (3.9%) |
| $500 to $799 | 82 (30.8%) | 112 (73.2%) |
| $800 to $999 | 29 (10.9%) | 4 (2.6%) |
| $1,000 to $1,499 | 37 (13.9%) | 5 (3.3%) |
| $1,500 to $1,999 | 16 (6.0%) | 0 (0.0%) |
| $2,000 to $2,499 | 0 (0.0%) | 0 (0.0%) |
| $2,500 to $2,999 | 0 (0.0%) | 0 (0.0%) |
| $3,000 or more | 0 (0.0%) | 0 (0.0%) |
| Total | 266 (100.0%) | 153 (100.0%) |
Physical Housing Characteristics in Cimarron
Housing Structures in Cimarron
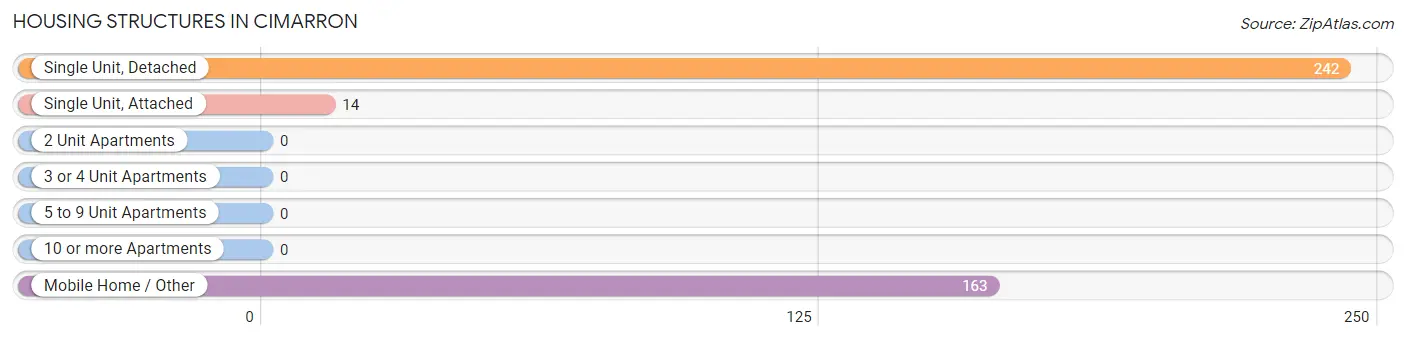
| Structure Type | # Housing Units | % Housing Units |
| Single Unit, Detached | 242 | 57.8% |
| Single Unit, Attached | 14 | 3.3% |
| 2 Unit Apartments | 0 | 0.0% |
| 3 or 4 Unit Apartments | 0 | 0.0% |
| 5 to 9 Unit Apartments | 0 | 0.0% |
| 10 or more Apartments | 0 | 0.0% |
| Mobile Home / Other | 163 | 38.9% |
| Total | 419 | 100.0% |
Housing Structures by Occupancy in Cimarron
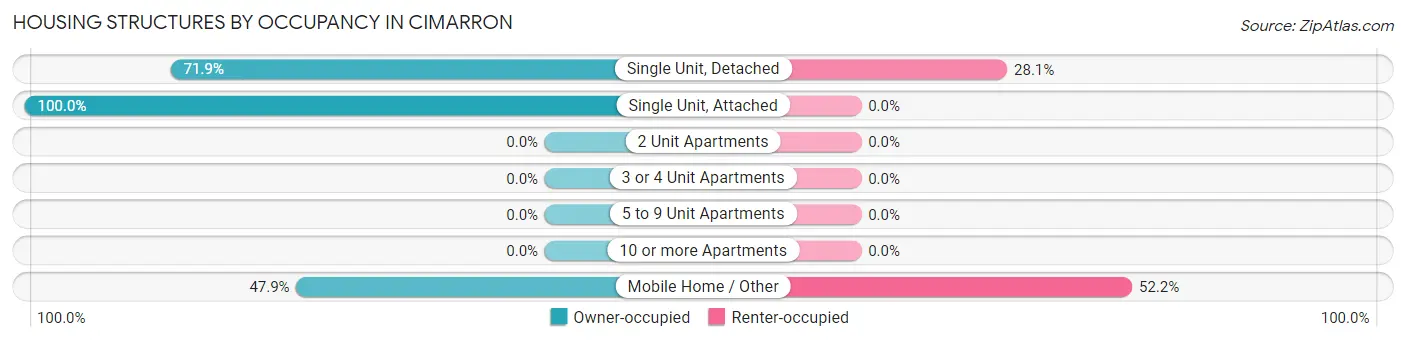
| Structure Type | Owner-occupied | Renter-occupied |
| Single Unit, Detached | 174 (71.9%) | 68 (28.1%) |
| Single Unit, Attached | 14 (100.0%) | 0 (0.0%) |
| 2 Unit Apartments | 0 (0.0%) | 0 (0.0%) |
| 3 or 4 Unit Apartments | 0 (0.0%) | 0 (0.0%) |
| 5 to 9 Unit Apartments | 0 (0.0%) | 0 (0.0%) |
| 10 or more Apartments | 0 (0.0%) | 0 (0.0%) |
| Mobile Home / Other | 78 (47.8%) | 85 (52.1%) |
| Total | 266 (63.5%) | 153 (36.5%) |
Housing Structures by Number of Rooms in Cimarron
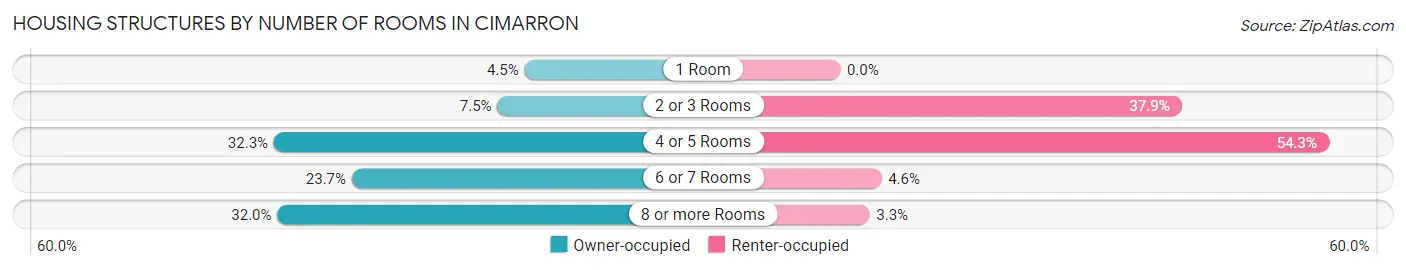
| Number of Rooms | Owner-occupied | Renter-occupied |
| 1 Room | 12 (4.5%) | 0 (0.0%) |
| 2 or 3 Rooms | 20 (7.5%) | 58 (37.9%) |
| 4 or 5 Rooms | 86 (32.3%) | 83 (54.2%) |
| 6 or 7 Rooms | 63 (23.7%) | 7 (4.6%) |
| 8 or more Rooms | 85 (32.0%) | 5 (3.3%) |
| Total | 266 (100.0%) | 153 (100.0%) |
Housing Structure by Heating Type in Cimarron
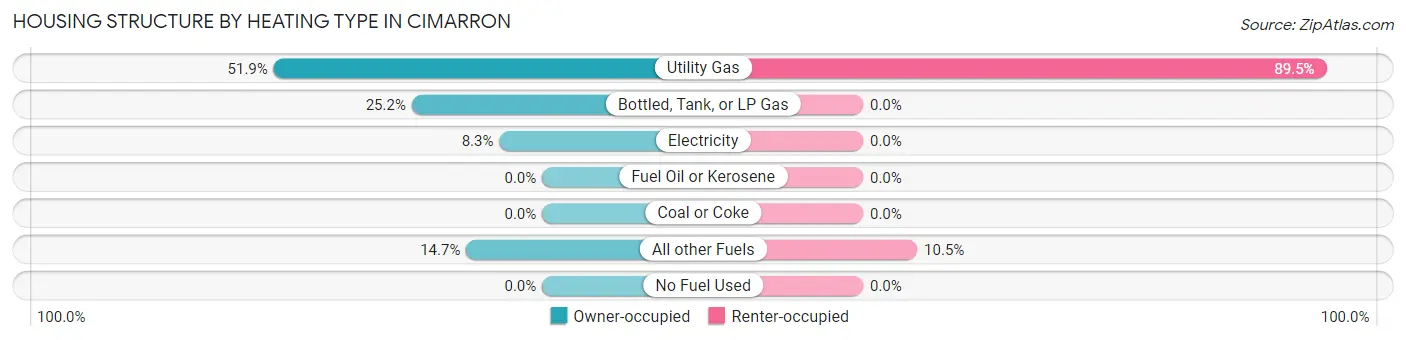
| Heating Type | Owner-occupied | Renter-occupied |
| Utility Gas | 138 (51.9%) | 137 (89.5%) |
| Bottled, Tank, or LP Gas | 67 (25.2%) | 0 (0.0%) |
| Electricity | 22 (8.3%) | 0 (0.0%) |
| Fuel Oil or Kerosene | 0 (0.0%) | 0 (0.0%) |
| Coal or Coke | 0 (0.0%) | 0 (0.0%) |
| All other Fuels | 39 (14.7%) | 16 (10.5%) |
| No Fuel Used | 0 (0.0%) | 0 (0.0%) |
| Total | 266 (100.0%) | 153 (100.0%) |
Household Vehicle Usage in Cimarron
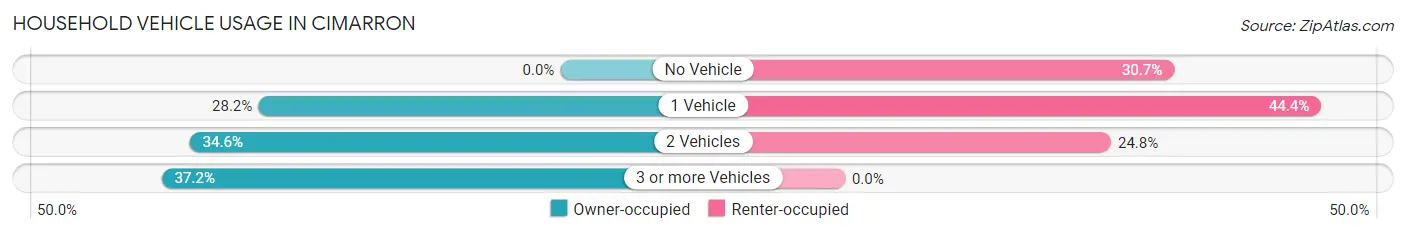
| Vehicles per Household | Owner-occupied | Renter-occupied |
| No Vehicle | 0 (0.0%) | 47 (30.7%) |
| 1 Vehicle | 75 (28.2%) | 68 (44.4%) |
| 2 Vehicles | 92 (34.6%) | 38 (24.8%) |
| 3 or more Vehicles | 99 (37.2%) | 0 (0.0%) |
| Total | 266 (100.0%) | 153 (100.0%) |
Real Estate & Mortgages in Cimarron
Real Estate and Mortgage Overview in Cimarron
| Characteristic | Without Mortgage | With Mortgage |
| Housing Units | 171 | 95 |
| Median Property Value | $165,600 | $129,200 |
| Median Household Income | $35,938 | $0 |
| Monthly Housing Costs | $391 | $0 |
| Real Estate Taxes | $717 | $18 |
Property Value by Mortgage Status in Cimarron
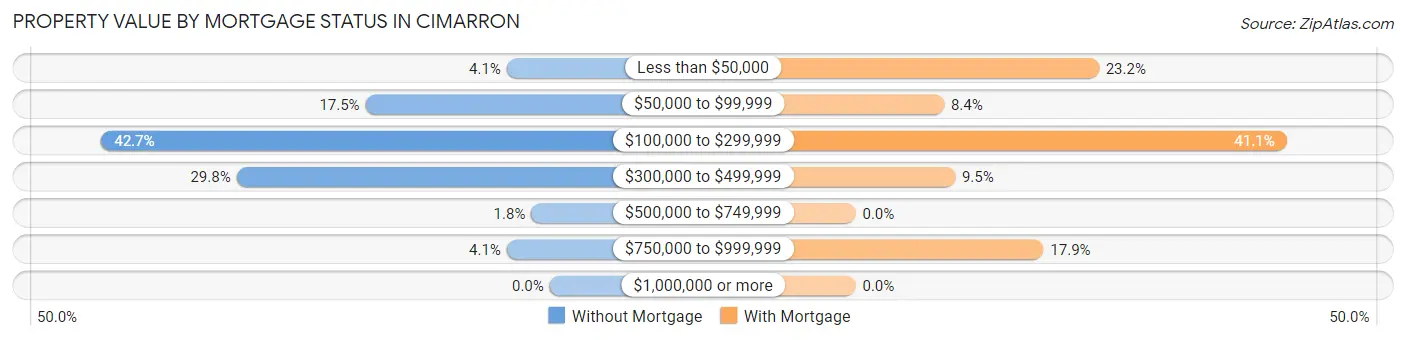
| Property Value | Without Mortgage | With Mortgage |
| Less than $50,000 | 7 (4.1%) | 22 (23.2%) |
| $50,000 to $99,999 | 30 (17.5%) | 8 (8.4%) |
| $100,000 to $299,999 | 73 (42.7%) | 39 (41.0%) |
| $300,000 to $499,999 | 51 (29.8%) | 9 (9.5%) |
| $500,000 to $749,999 | 3 (1.8%) | 0 (0.0%) |
| $750,000 to $999,999 | 7 (4.1%) | 17 (17.9%) |
| $1,000,000 or more | 0 (0.0%) | 0 (0.0%) |
| Total | 171 (100.0%) | 95 (100.0%) |
Household Income by Mortgage Status in Cimarron
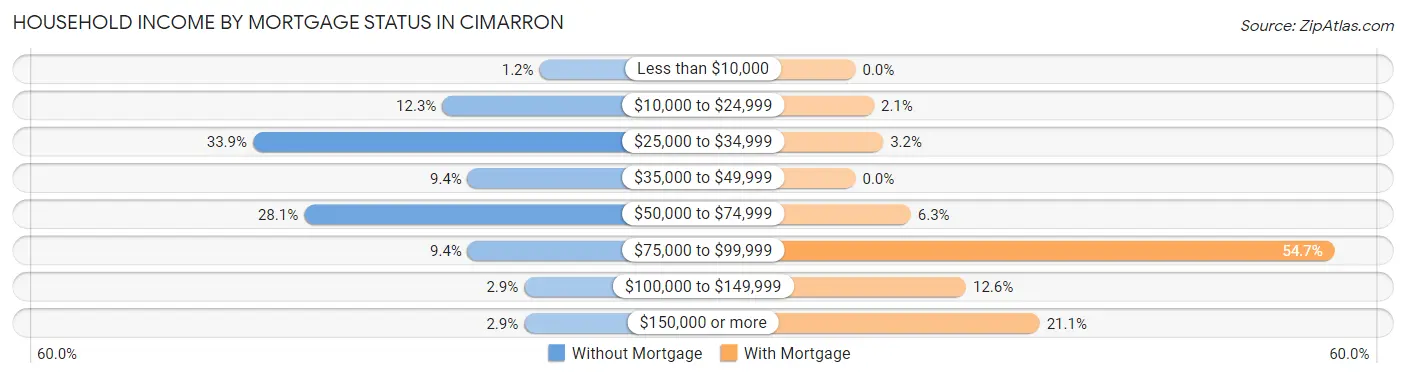
| Household Income | Without Mortgage | With Mortgage |
| Less than $10,000 | 2 (1.2%) | 0 (0.0%) |
| $10,000 to $24,999 | 21 (12.3%) | 2 (2.1%) |
| $25,000 to $34,999 | 58 (33.9%) | 3 (3.2%) |
| $35,000 to $49,999 | 16 (9.4%) | 0 (0.0%) |
| $50,000 to $74,999 | 48 (28.1%) | 6 (6.3%) |
| $75,000 to $99,999 | 16 (9.4%) | 52 (54.7%) |
| $100,000 to $149,999 | 5 (2.9%) | 12 (12.6%) |
| $150,000 or more | 5 (2.9%) | 20 (21.0%) |
| Total | 171 (100.0%) | 95 (100.0%) |
Property Value to Household Income Ratio in Cimarron
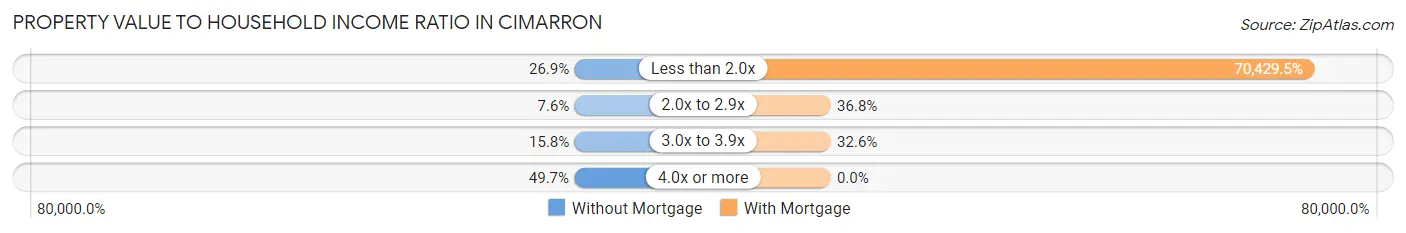
| Value-to-Income Ratio | Without Mortgage | With Mortgage |
| Less than 2.0x | 46 (26.9%) | 66,908 (70,429.5%) |
| 2.0x to 2.9x | 13 (7.6%) | 35 (36.8%) |
| 3.0x to 3.9x | 27 (15.8%) | 31 (32.6%) |
| 4.0x or more | 85 (49.7%) | 0 (0.0%) |
| Total | 171 (100.0%) | 95 (100.0%) |
Real Estate Taxes by Mortgage Status in Cimarron
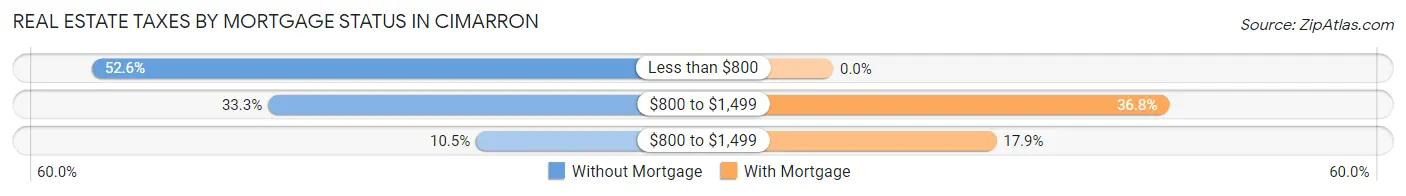
| Property Taxes | Without Mortgage | With Mortgage |
| Less than $800 | 90 (52.6%) | 0 (0.0%) |
| $800 to $1,499 | 57 (33.3%) | 35 (36.8%) |
| $800 to $1,499 | 18 (10.5%) | 17 (17.9%) |
| Total | 171 (100.0%) | 95 (100.0%) |
Health & Disability in Cimarron
Health Insurance Coverage by Age in Cimarron
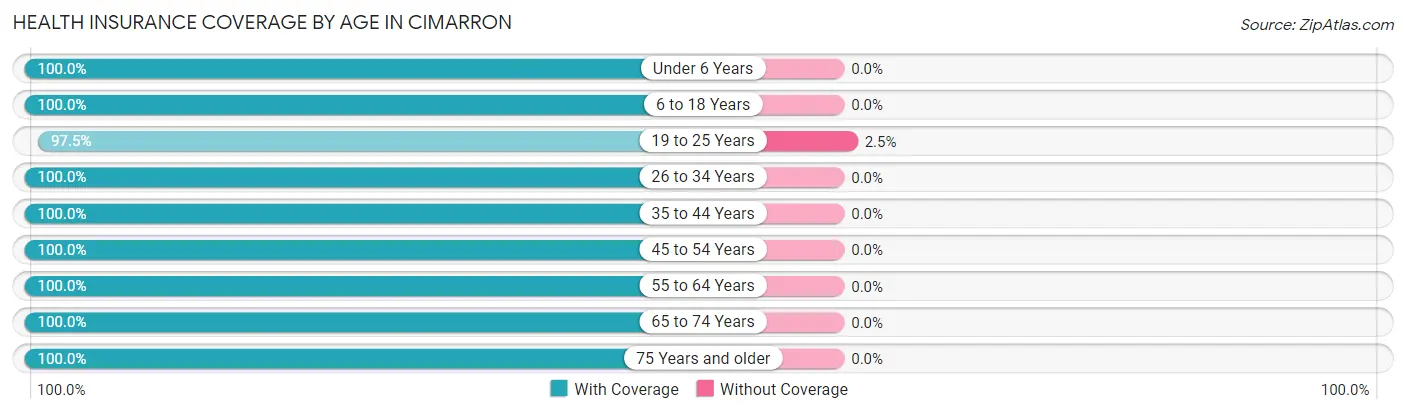
| Age Bracket | With Coverage | Without Coverage |
| Under 6 Years | 68 (100.0%) | 0 (0.0%) |
| 6 to 18 Years | 131 (100.0%) | 0 (0.0%) |
| 19 to 25 Years | 78 (97.5%) | 2 (2.5%) |
| 26 to 34 Years | 120 (100.0%) | 0 (0.0%) |
| 35 to 44 Years | 52 (100.0%) | 0 (0.0%) |
| 45 to 54 Years | 43 (100.0%) | 0 (0.0%) |
| 55 to 64 Years | 118 (100.0%) | 0 (0.0%) |
| 65 to 74 Years | 115 (100.0%) | 0 (0.0%) |
| 75 Years and older | 89 (100.0%) | 0 (0.0%) |
| Total | 814 (99.8%) | 2 (0.3%) |
Health Insurance Coverage by Citizenship Status in Cimarron
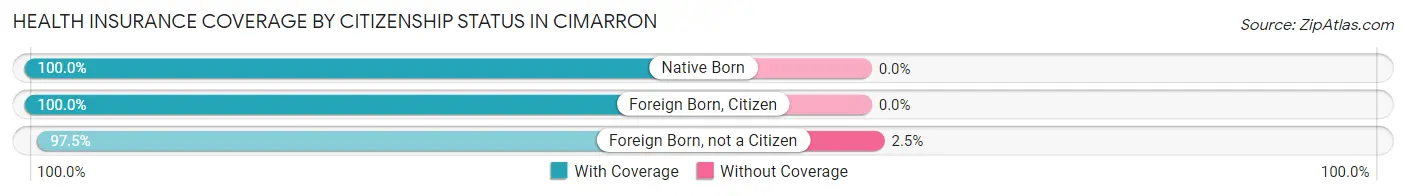
| Citizenship Status | With Coverage | Without Coverage |
| Native Born | 68 (100.0%) | 0 (0.0%) |
| Foreign Born, Citizen | 131 (100.0%) | 0 (0.0%) |
| Foreign Born, not a Citizen | 78 (97.5%) | 2 (2.5%) |
Health Insurance Coverage by Household Income in Cimarron
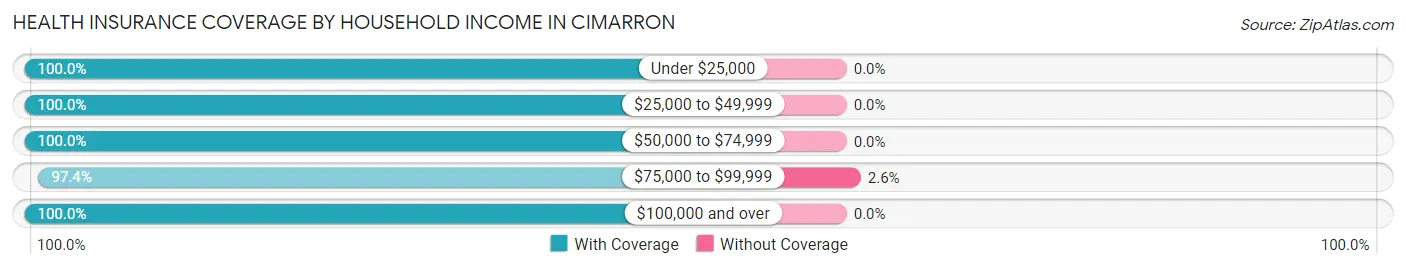
| Household Income | With Coverage | Without Coverage |
| Under $25,000 | 115 (100.0%) | 0 (0.0%) |
| $25,000 to $49,999 | 259 (100.0%) | 0 (0.0%) |
| $50,000 to $74,999 | 312 (100.0%) | 0 (0.0%) |
| $75,000 to $99,999 | 74 (97.4%) | 2 (2.6%) |
| $100,000 and over | 54 (100.0%) | 0 (0.0%) |
Public vs Private Health Insurance Coverage by Age in Cimarron
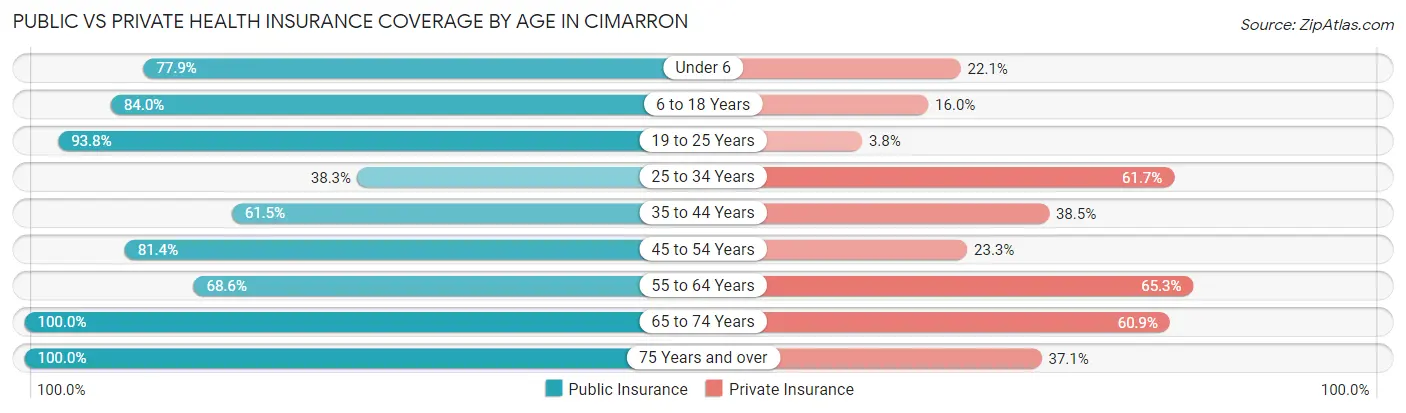
| Age Bracket | Public Insurance | Private Insurance |
| Under 6 | 53 (77.9%) | 15 (22.1%) |
| 6 to 18 Years | 110 (84.0%) | 21 (16.0%) |
| 19 to 25 Years | 75 (93.8%) | 3 (3.7%) |
| 25 to 34 Years | 46 (38.3%) | 74 (61.7%) |
| 35 to 44 Years | 32 (61.5%) | 20 (38.5%) |
| 45 to 54 Years | 35 (81.4%) | 10 (23.3%) |
| 55 to 64 Years | 81 (68.6%) | 77 (65.2%) |
| 65 to 74 Years | 115 (100.0%) | 70 (60.9%) |
| 75 Years and over | 89 (100.0%) | 33 (37.1%) |
| Total | 636 (77.9%) | 323 (39.6%) |
Disability Status by Sex by Age in Cimarron
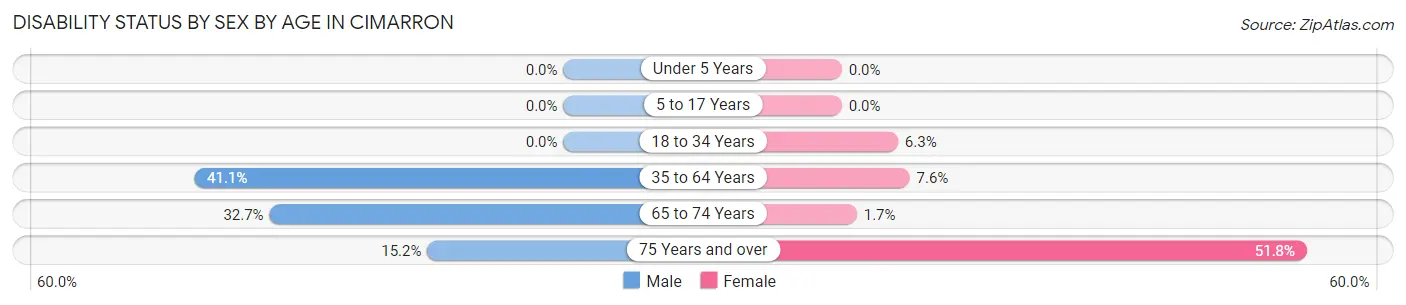
| Age Bracket | Male | Female |
| Under 5 Years | 0 (0.0%) | 0 (0.0%) |
| 5 to 17 Years | 0 (0.0%) | 0 (0.0%) |
| 18 to 34 Years | 0 (0.0%) | 8 (6.2%) |
| 35 to 64 Years | 44 (41.1%) | 8 (7.5%) |
| 65 to 74 Years | 18 (32.7%) | 1 (1.7%) |
| 75 Years and over | 5 (15.1%) | 29 (51.8%) |
Disability Class by Sex by Age in Cimarron
Disability Class: Hearing Difficulty
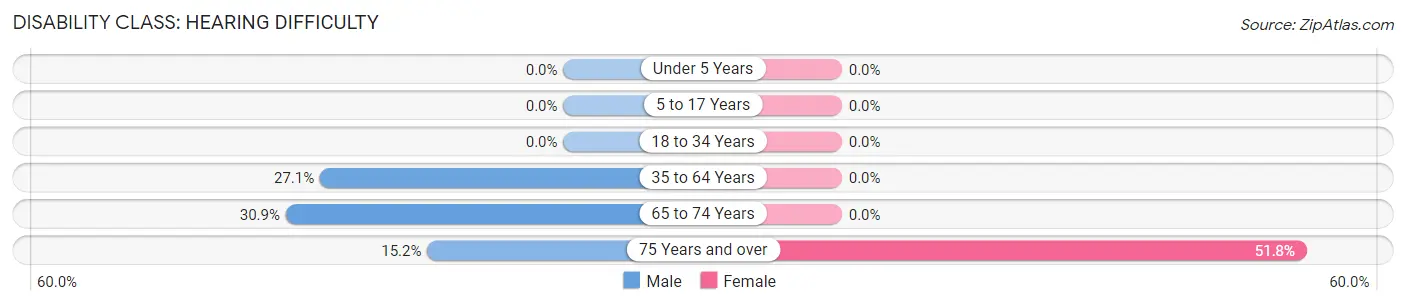
| Age Bracket | Male | Female |
| Under 5 Years | 0 (0.0%) | 0 (0.0%) |
| 5 to 17 Years | 0 (0.0%) | 0 (0.0%) |
| 18 to 34 Years | 0 (0.0%) | 0 (0.0%) |
| 35 to 64 Years | 29 (27.1%) | 0 (0.0%) |
| 65 to 74 Years | 17 (30.9%) | 0 (0.0%) |
| 75 Years and over | 5 (15.1%) | 29 (51.8%) |
Disability Class: Vision Difficulty
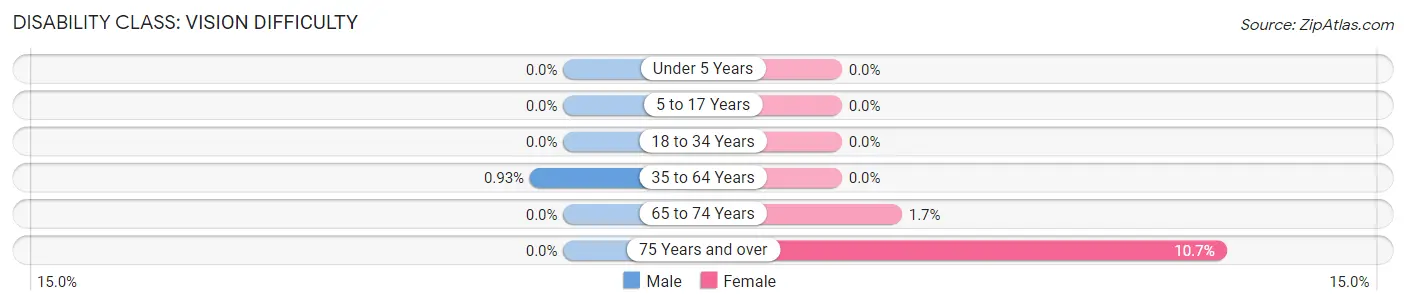
| Age Bracket | Male | Female |
| Under 5 Years | 0 (0.0%) | 0 (0.0%) |
| 5 to 17 Years | 0 (0.0%) | 0 (0.0%) |
| 18 to 34 Years | 0 (0.0%) | 0 (0.0%) |
| 35 to 64 Years | 1 (0.9%) | 0 (0.0%) |
| 65 to 74 Years | 0 (0.0%) | 1 (1.7%) |
| 75 Years and over | 0 (0.0%) | 6 (10.7%) |
Disability Class: Cognitive Difficulty
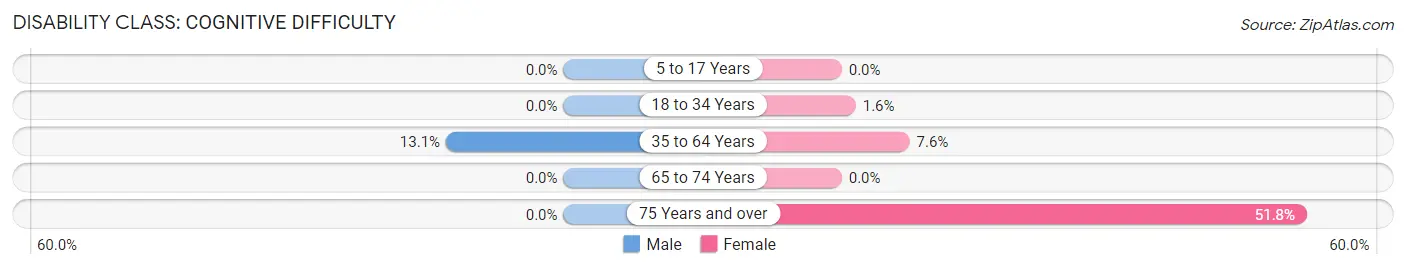
| Age Bracket | Male | Female |
| 5 to 17 Years | 0 (0.0%) | 0 (0.0%) |
| 18 to 34 Years | 0 (0.0%) | 2 (1.6%) |
| 35 to 64 Years | 14 (13.1%) | 8 (7.5%) |
| 65 to 74 Years | 0 (0.0%) | 0 (0.0%) |
| 75 Years and over | 0 (0.0%) | 29 (51.8%) |
Disability Class: Ambulatory Difficulty
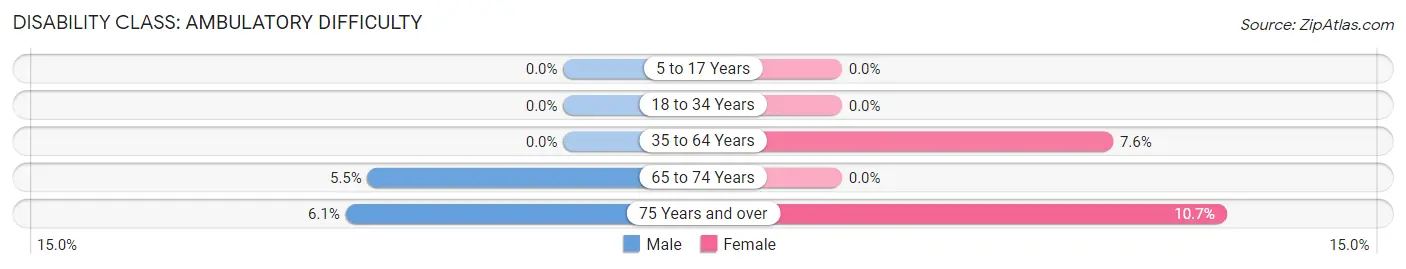
| Age Bracket | Male | Female |
| 5 to 17 Years | 0 (0.0%) | 0 (0.0%) |
| 18 to 34 Years | 0 (0.0%) | 0 (0.0%) |
| 35 to 64 Years | 0 (0.0%) | 8 (7.5%) |
| 65 to 74 Years | 3 (5.4%) | 0 (0.0%) |
| 75 Years and over | 2 (6.1%) | 6 (10.7%) |
Disability Class: Self-Care Difficulty
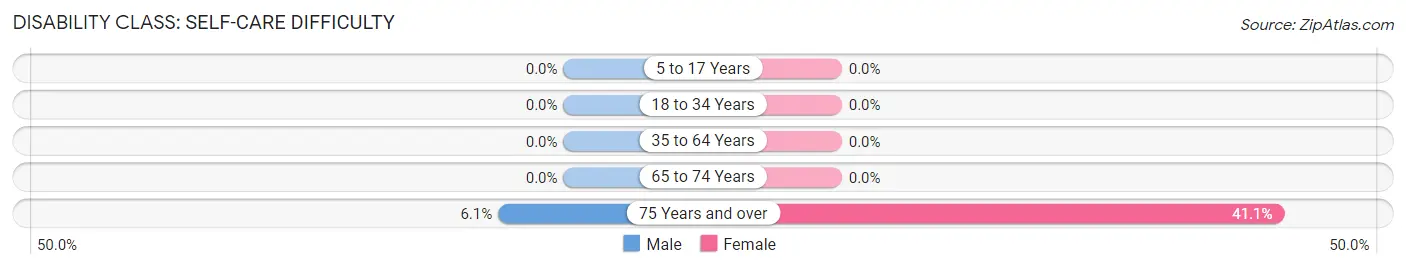
| Age Bracket | Male | Female |
| 5 to 17 Years | 0 (0.0%) | 0 (0.0%) |
| 18 to 34 Years | 0 (0.0%) | 0 (0.0%) |
| 35 to 64 Years | 0 (0.0%) | 0 (0.0%) |
| 65 to 74 Years | 0 (0.0%) | 0 (0.0%) |
| 75 Years and over | 2 (6.1%) | 23 (41.1%) |
Technology Access in Cimarron
Computing Device Access in Cimarron
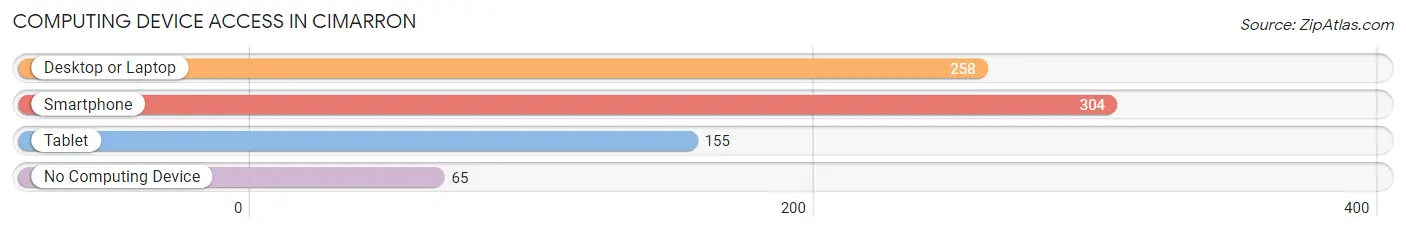
| Device Type | # Households | % Households |
| Desktop or Laptop | 258 | 61.6% |
| Smartphone | 304 | 72.6% |
| Tablet | 155 | 37.0% |
| No Computing Device | 65 | 15.5% |
| Total | 419 | 100.0% |
Internet Access in Cimarron
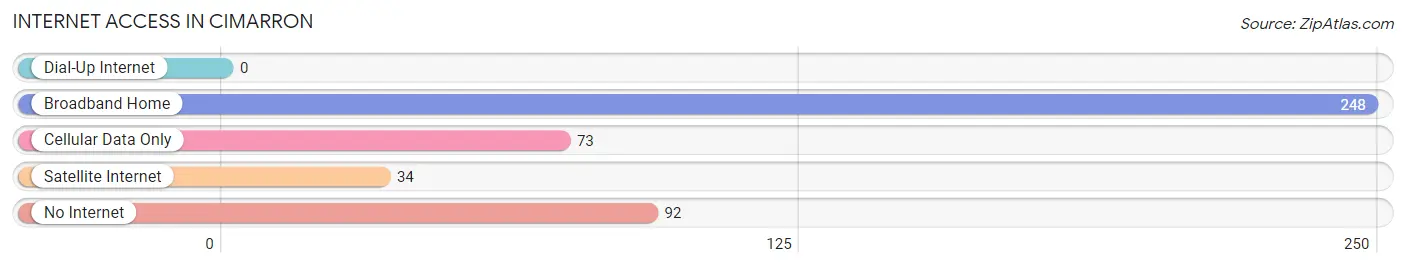
| Internet Type | # Households | % Households |
| Dial-Up Internet | 0 | 0.0% |
| Broadband Home | 248 | 59.2% |
| Cellular Data Only | 73 | 17.4% |
| Satellite Internet | 34 | 8.1% |
| No Internet | 92 | 22.0% |
| Total | 419 | 100.0% |
Cimarron Summary
Cimarron, New Mexico is a small town located in Colfax County in the northeastern corner of the state. It is situated at the confluence of the Cimarron and Vermejo Rivers, and is surrounded by the Sangre de Cristo Mountains. The town has a population of approximately 1,000 people and is the county seat of Colfax County.
Geography
Cimarron is located in the northeastern corner of New Mexico, at the confluence of the Cimarron and Vermejo Rivers. The town is situated at an elevation of 6,890 feet, and is surrounded by the Sangre de Cristo Mountains. The town is located in a semi-arid climate, with hot summers and cold winters. The average annual precipitation is approximately 12 inches, with most of the precipitation occurring in the summer months.
The town is located on the Santa Fe Trail, which was a major route for settlers and traders traveling between Missouri and New Mexico in the 19th century. The town is also located near the Philmont Scout Ranch, which is a popular destination for Boy Scouts and other outdoor enthusiasts.
Economy
The economy of Cimarron is largely based on tourism and ranching. The town is a popular destination for tourists, who come to enjoy the scenery and outdoor activities such as fishing, hunting, and camping. The town is also home to several ranches, which raise cattle and horses.
The town is also home to several small businesses, including restaurants, shops, and a hotel. The town is also home to a small airport, which serves as a hub for private aircraft.
Demographics
As of the 2010 census, the population of Cimarron was 1,039. The racial makeup of the town was 94.3% White, 0.3% African American, 0.7% Native American, 0.2% Asian, 0.1% Pacific Islander, 2.2% from other races, and 2.4% from two or more races. Hispanic or Latino of any race were 8.2% of the population.
The median income for a household in the town was $31,250, and the median income for a family was $37,500. The per capita income for the town was $17,845. About 11.2% of families and 14.2% of the population were below the poverty line, including 18.2% of those under age 18 and 8.3% of those age 65 or over.
Conclusion
Cimarron, New Mexico is a small town located in Colfax County in the northeastern corner of the state. It is situated at the confluence of the Cimarron and Vermejo Rivers, and is surrounded by the Sangre de Cristo Mountains. The town has a population of approximately 1,000 people and is the county seat of Colfax County. The economy of Cimarron is largely based on tourism and ranching, and the town is a popular destination for tourists who come to enjoy the scenery and outdoor activities. The racial makeup of the town is predominantly White, with a small percentage of African American, Native American, Asian, and Pacific Islander residents. The median income for a household in the town is $31,250, and the per capita income for the town is $17,845.
Common Questions
What is Per Capita Income in Cimarron?
Per Capita income in Cimarron is $25,218.
What is the Median Family Income in Cimarron?
Median Family Income in Cimarron is $55,865.
What is the Median Household income in Cimarron?
Median Household Income in Cimarron is $35,917.
What is Income or Wage Gap in Cimarron?
Income or Wage Gap in Cimarron is 43.7%.
Women in Cimarron earn 56.3 cents for every dollar earned by a man.
What is Inequality or Gini Index in Cimarron?
Inequality or Gini Index in Cimarron is 0.35.
What is the Total Population of Cimarron?
Total Population of Cimarron is 816.
What is the Total Male Population of Cimarron?
Total Male Population of Cimarron is 354.
What is the Total Female Population of Cimarron?
Total Female Population of Cimarron is 462.
What is the Ratio of Males per 100 Females in Cimarron?
There are 76.62 Males per 100 Females in Cimarron.
What is the Ratio of Females per 100 Males in Cimarron?
There are 130.51 Females per 100 Males in Cimarron.
What is the Median Population Age in Cimarron?
Median Population Age in Cimarron is 36.6 Years.
What is the Average Family Size in Cimarron
Average Family Size in Cimarron is 2.9 People.
What is the Average Household Size in Cimarron
Average Household Size in Cimarron is 1.9 People.
How Large is the Labor Force in Cimarron?
There are 343 People in the Labor Forcein in Cimarron.
What is the Percentage of People in the Labor Force in Cimarron?
53.8% of People are in the Labor Force in Cimarron.
What is the Unemployment Rate in Cimarron?
Unemployment Rate in Cimarron is 8.5%.