Jarales, NM Map & Demographics
Jarales Map
Jarales Overview
$30,104
PER CAPITA INCOME
$51,240
AVG FAMILY INCOME
$50,673
AVG HOUSEHOLD INCOME
45.0%
WAGE / INCOME GAP [ % ]
55.0¢/ $1
WAGE / INCOME GAP [ $ ]
0.40
INEQUALITY / GINI INDEX
1,690
TOTAL POPULATION
894
MALE POPULATION
796
FEMALE POPULATION
112.31
MALES / 100 FEMALES
89.04
FEMALES / 100 MALES
59.5
MEDIAN AGE
2.4
AVG FAMILY SIZE
2.0
AVG HOUSEHOLD SIZE
558
LABOR FORCE [ PEOPLE ]
37.6%
PERCENT IN LABOR FORCE
11.4%
UNEMPLOYMENT RATE
Jarales Zip Codes
Jarales Area Codes
Income in Jarales
Income Overview in Jarales
Per Capita Income in Jarales is $30,104, while median incomes of families and households are $51,240 and $50,673 respectively.
| Characteristic | Number | Measure |
| Per Capita Income | 1,690 | $30,104 |
| Median Family Income | 584 | $51,240 |
| Mean Family Income | 584 | $72,133 |
| Median Household Income | 835 | $50,673 |
| Mean Household Income | 835 | $62,820 |
| Income Deficit | 584 | $0 |
| Wage / Income Gap (%) | 1,690 | 45.03% |
| Wage / Income Gap ($) | 1,690 | 54.97¢ per $1 |
| Gini / Inequality Index | 1,690 | 0.40 |
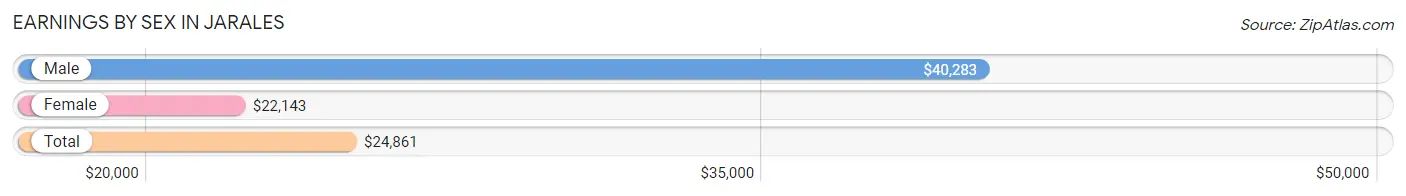
Earnings by Sex in Jarales
Average Earnings in Jarales are $24,861, $40,283 for men and $22,143 for women, a difference of 45.0%.
| Sex | Number | Average Earnings |
| Male | 278 (44.7%) | $40,283 |
| Female | 344 (55.3%) | $22,143 |
| Total | 622 (100.0%) | $24,861 |
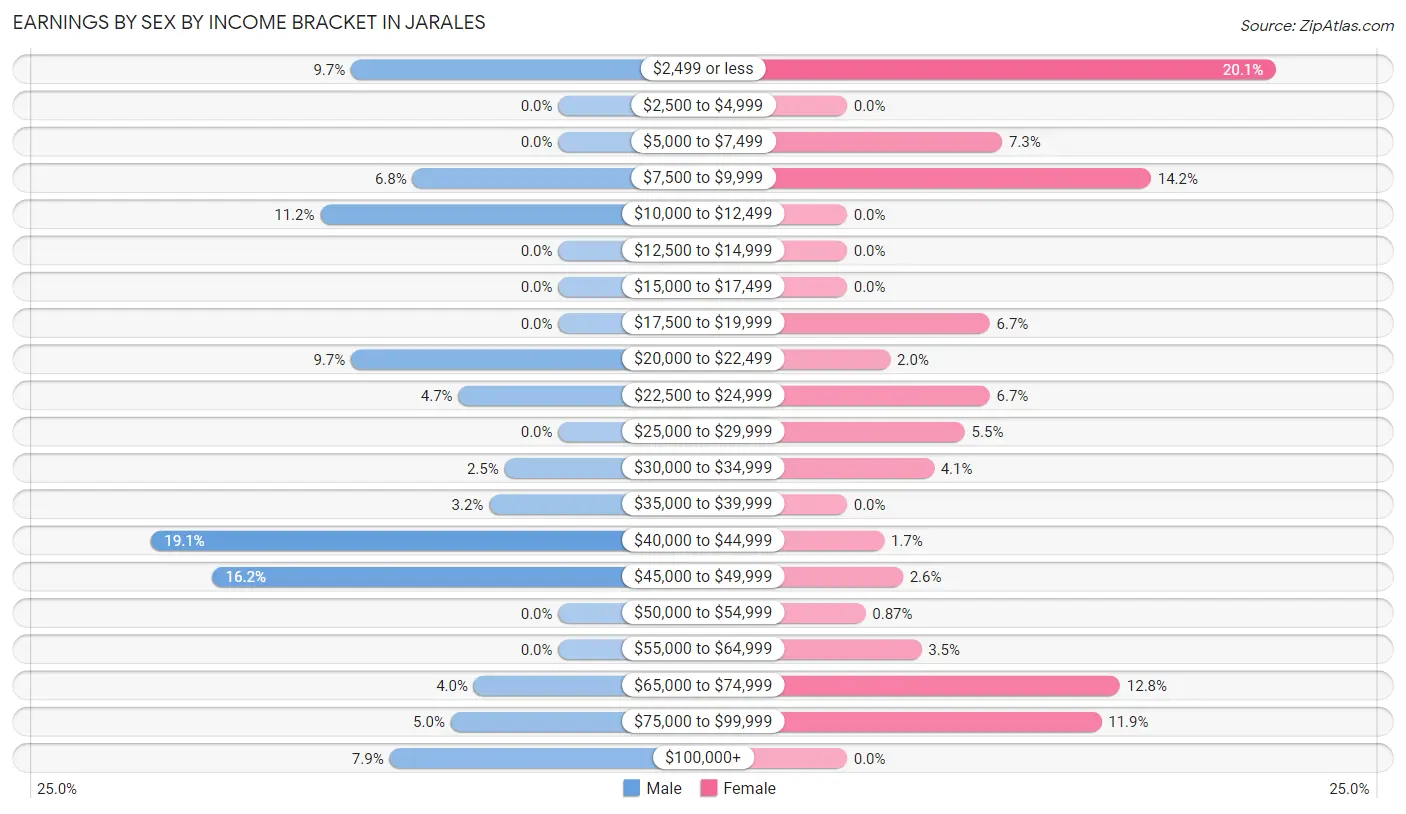
Earnings by Sex by Income Bracket in Jarales
The most common earnings brackets in Jarales are $40,000 to $44,999 for men (53 | 19.1%) and $2,499 or less for women (69 | 20.1%).
| Income | Male | Female |
| $2,499 or less | 27 (9.7%) | 69 (20.1%) |
| $2,500 to $4,999 | 0 (0.0%) | 0 (0.0%) |
| $5,000 to $7,499 | 0 (0.0%) | 25 (7.3%) |
| $7,500 to $9,999 | 19 (6.8%) | 49 (14.2%) |
| $10,000 to $12,499 | 31 (11.2%) | 0 (0.0%) |
| $12,500 to $14,999 | 0 (0.0%) | 0 (0.0%) |
| $15,000 to $17,499 | 0 (0.0%) | 0 (0.0%) |
| $17,500 to $19,999 | 0 (0.0%) | 23 (6.7%) |
| $20,000 to $22,499 | 27 (9.7%) | 7 (2.0%) |
| $22,500 to $24,999 | 13 (4.7%) | 23 (6.7%) |
| $25,000 to $29,999 | 0 (0.0%) | 19 (5.5%) |
| $30,000 to $34,999 | 7 (2.5%) | 14 (4.1%) |
| $35,000 to $39,999 | 9 (3.2%) | 0 (0.0%) |
| $40,000 to $44,999 | 53 (19.1%) | 6 (1.7%) |
| $45,000 to $49,999 | 45 (16.2%) | 9 (2.6%) |
| $50,000 to $54,999 | 0 (0.0%) | 3 (0.9%) |
| $55,000 to $64,999 | 0 (0.0%) | 12 (3.5%) |
| $65,000 to $74,999 | 11 (4.0%) | 44 (12.8%) |
| $75,000 to $99,999 | 14 (5.0%) | 41 (11.9%) |
| $100,000+ | 22 (7.9%) | 0 (0.0%) |
| Total | 278 (100.0%) | 344 (100.0%) |
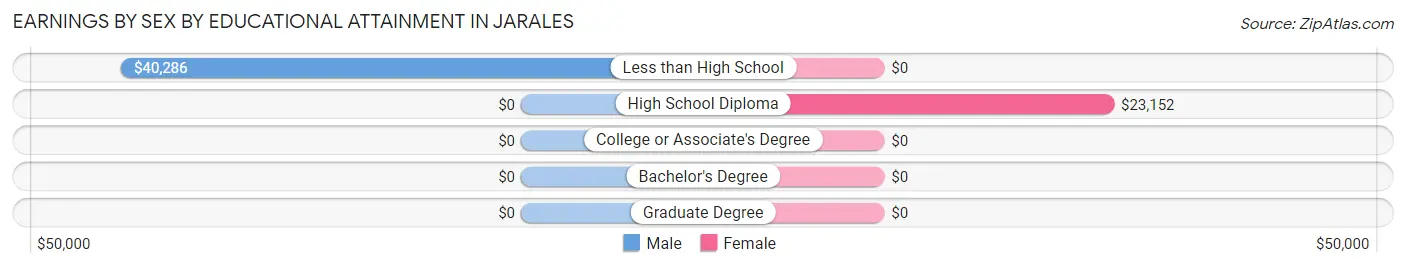
Earnings by Sex by Educational Attainment in Jarales
Average earnings in Jarales are $41,226 for men and $28,026 for women, a difference of 32.0%. Men with an educational attainment of less than high school enjoy the highest average annual earnings of $40,286, while those with less than high school education earn the least with $40,286. Women with an educational attainment of high school diploma earn the most with the average annual earnings of $23,152, while those with high school diploma education have the smallest earnings of $23,152.
| Educational Attainment | Male Income | Female Income |
| Less than High School | $40,286 | $0 |
| High School Diploma | - | - |
| College or Associate's Degree | - | - |
| Bachelor's Degree | - | - |
| Graduate Degree | - | - |
| Total | $41,226 | $28,026 |
Family Income in Jarales
Family Income Brackets in Jarales
According to the Jarales family income data, there are 302 families falling into the $50,000 to $74,999 income range, which is the most common income bracket and makes up 51.7% of all families.
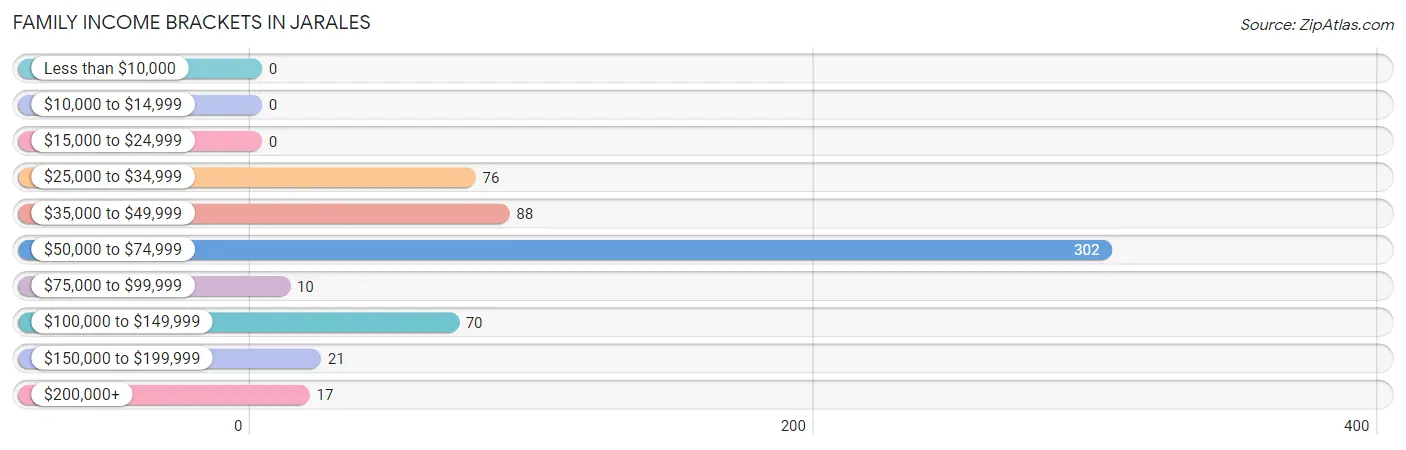
| Income Bracket | # Families | % Families |
| Less than $10,000 | 0 | 0.0% |
| $10,000 to $14,999 | 0 | 0.0% |
| $15,000 to $24,999 | 0 | 0.0% |
| $25,000 to $34,999 | 76 | 13.0% |
| $35,000 to $49,999 | 88 | 15.1% |
| $50,000 to $74,999 | 302 | 51.7% |
| $75,000 to $99,999 | 10 | 1.7% |
| $100,000 to $149,999 | 70 | 12.0% |
| $150,000 to $199,999 | 21 | 3.6% |
| $200,000+ | 17 | 2.9% |
Family Income by Famaliy Size in Jarales
3-person families (107 | 18.3%) account for the highest median family income in Jarales with $70,260 per family, while 2-person families (154 | 26.4%) have the highest median income of $24,018 per family member.
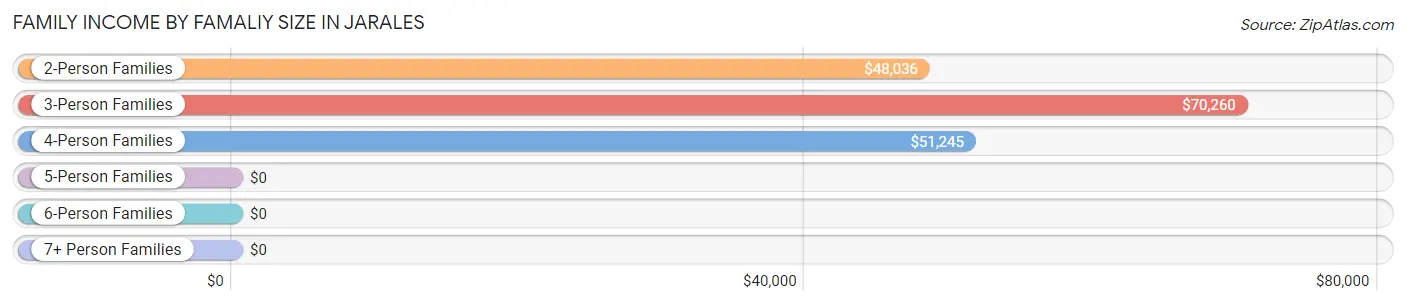
| Income Bracket | # Families | Median Income |
| 2-Person Families | 154 (26.4%) | $48,036 |
| 3-Person Families | 107 (18.3%) | $70,260 |
| 4-Person Families | 271 (46.4%) | $51,245 |
| 5-Person Families | 52 (8.9%) | $0 |
| 6-Person Families | 0 (0.0%) | $0 |
| 7+ Person Families | 0 (0.0%) | $0 |
| Total | 584 (100.0%) | $51,240 |
Family Income by Number of Earners in Jarales
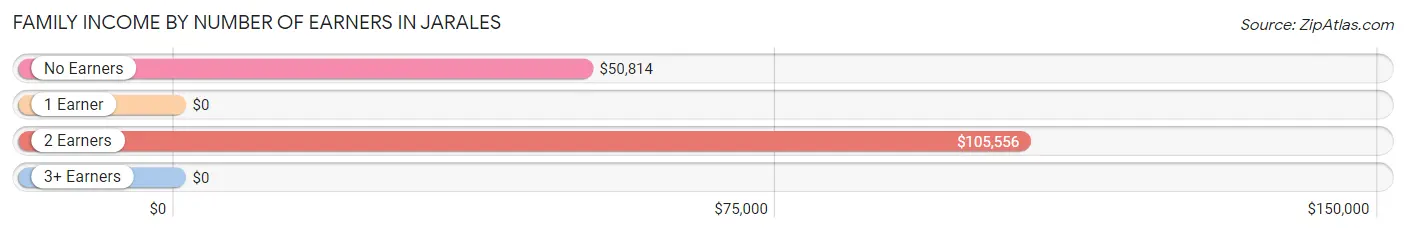
| Number of Earners | # Families | Median Income |
| No Earners | 348 (59.6%) | $50,814 |
| 1 Earner | 77 (13.2%) | $0 |
| 2 Earners | 136 (23.3%) | $105,556 |
| 3+ Earners | 23 (3.9%) | $0 |
| Total | 584 (100.0%) | $51,240 |
Household Income in Jarales
Household Income Brackets in Jarales
With 337 households falling in the category, the $50,000 to $74,999 income range is the most frequent in Jarales, accounting for 40.4% of all households. In contrast, only 17 households (2.0%) fall into the less than $10,000 income bracket, making it the least populous group.
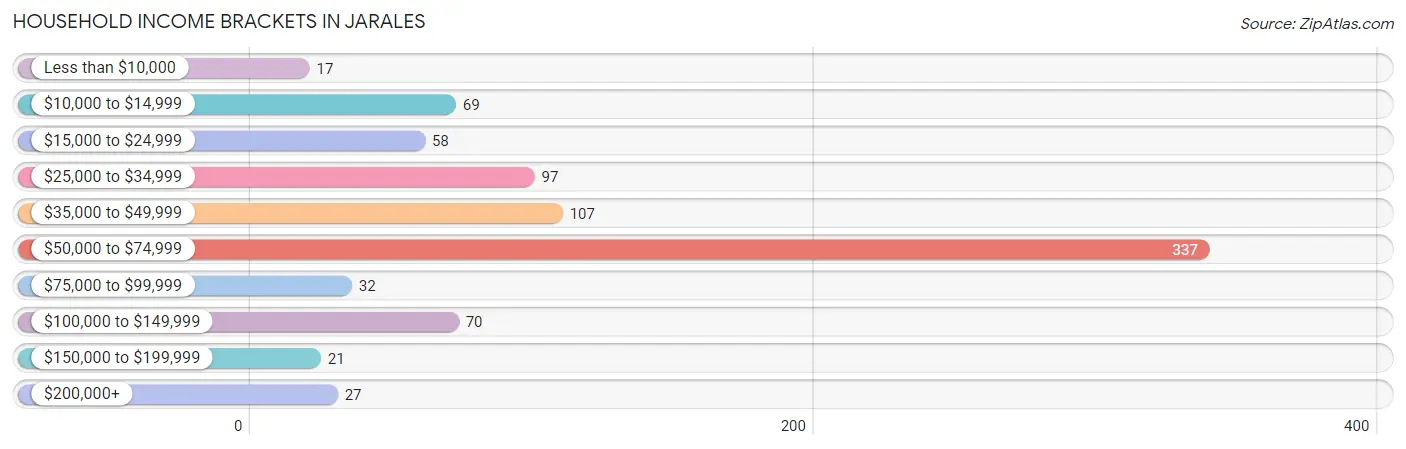
| Income Bracket | # Households | % Households |
| Less than $10,000 | 17 | 2.0% |
| $10,000 to $14,999 | 69 | 8.3% |
| $15,000 to $24,999 | 58 | 6.9% |
| $25,000 to $34,999 | 97 | 11.6% |
| $35,000 to $49,999 | 107 | 12.8% |
| $50,000 to $74,999 | 337 | 40.4% |
| $75,000 to $99,999 | 32 | 3.8% |
| $100,000 to $149,999 | 70 | 8.4% |
| $150,000 to $199,999 | 21 | 2.5% |
| $200,000+ | 27 | 3.2% |
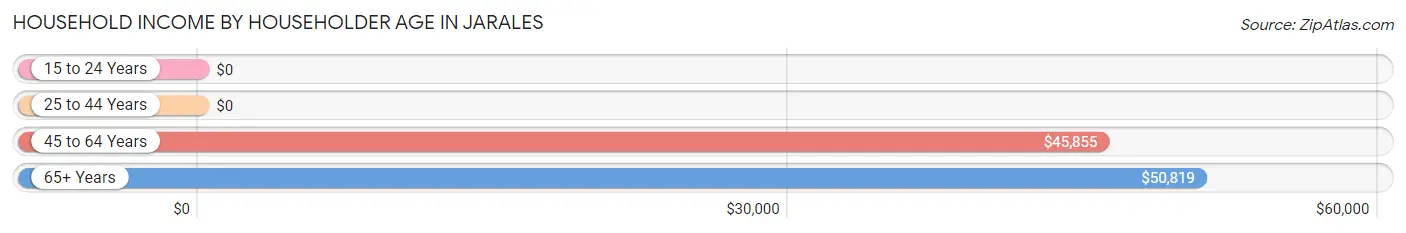
Household Income by Householder Age in Jarales
The median household income in Jarales is $50,673, with the highest median household income of $50,819 found in the 65+ years age bracket for the primary householder. A total of 443 households (53.0%) fall into this category.
| Income Bracket | # Households | Median Income |
| 15 to 24 Years | 0 (0.0%) | $0 |
| 25 to 44 Years | 45 (5.4%) | $0 |
| 45 to 64 Years | 347 (41.6%) | $45,855 |
| 65+ Years | 443 (53.0%) | $50,819 |
| Total | 835 (100.0%) | $50,673 |
Poverty in Jarales
Income Below Poverty by Sex and Age in Jarales
With 4.4% poverty level for males and 3.9% for females among the residents of Jarales, 45 to 54 year old males and 75 year old and over females are the most vulnerable to poverty, with 22 males (18.5%) and 12 females (19.1%) in their respective age groups living below the poverty level.
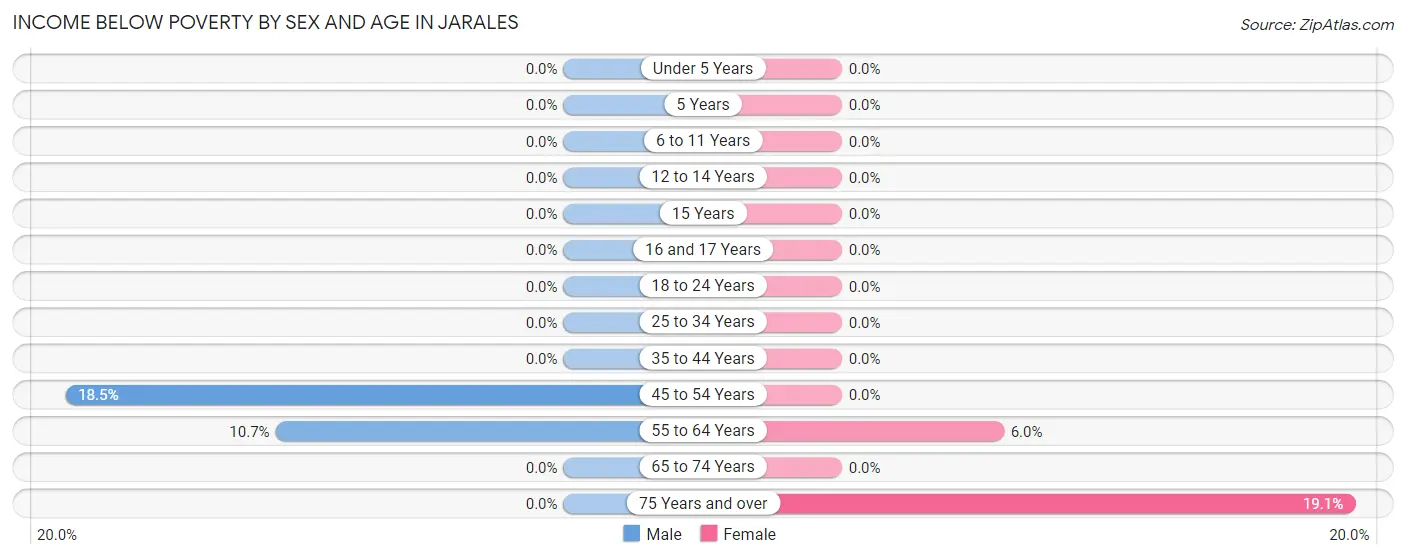
| Age Bracket | Male | Female |
| Under 5 Years | 0 (0.0%) | 0 (0.0%) |
| 5 Years | 0 (0.0%) | 0 (0.0%) |
| 6 to 11 Years | 0 (0.0%) | 0 (0.0%) |
| 12 to 14 Years | 0 (0.0%) | 0 (0.0%) |
| 15 Years | 0 (0.0%) | 0 (0.0%) |
| 16 and 17 Years | 0 (0.0%) | 0 (0.0%) |
| 18 to 24 Years | 0 (0.0%) | 0 (0.0%) |
| 25 to 34 Years | 0 (0.0%) | 0 (0.0%) |
| 35 to 44 Years | 0 (0.0%) | 0 (0.0%) |
| 45 to 54 Years | 22 (18.5%) | 0 (0.0%) |
| 55 to 64 Years | 17 (10.7%) | 19 (6.0%) |
| 65 to 74 Years | 0 (0.0%) | 0 (0.0%) |
| 75 Years and over | 0 (0.0%) | 12 (19.1%) |
| Total | 39 (4.4%) | 31 (3.9%) |
Income Above Poverty by Sex and Age in Jarales
According to the poverty statistics in Jarales, males aged 5 years and females aged under 5 years are the age groups that are most secure financially, with 100.0% of males and 100.0% of females in these age groups living above the poverty line.
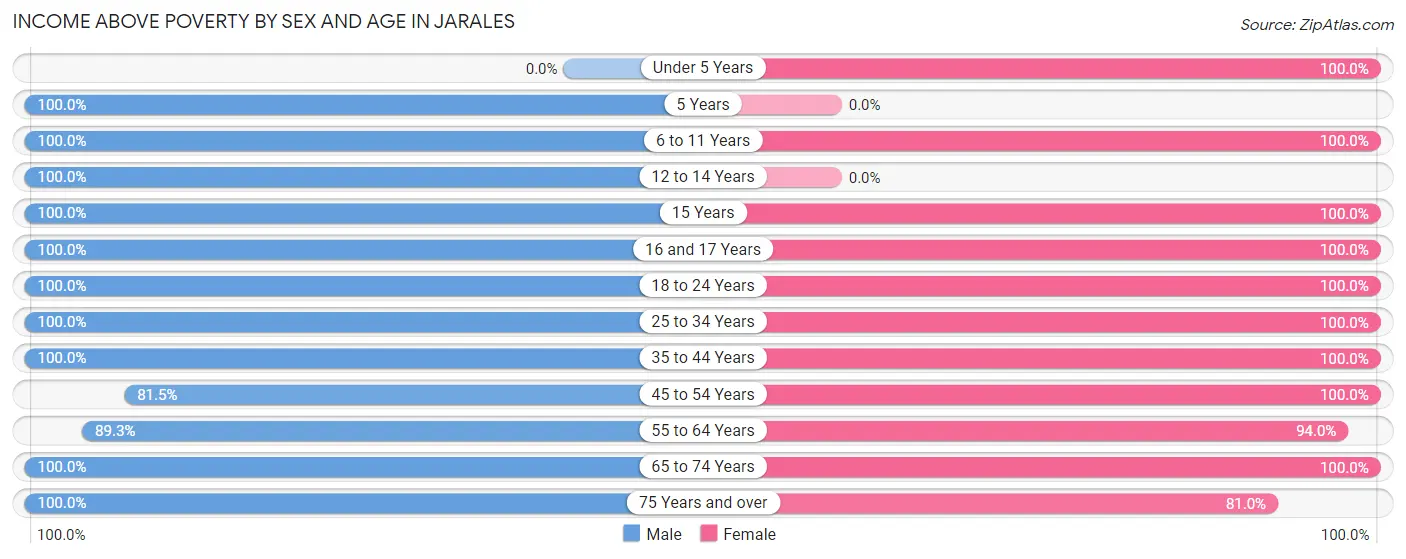
| Age Bracket | Male | Female |
| Under 5 Years | 0 (0.0%) | 54 (100.0%) |
| 5 Years | 2 (100.0%) | 0 (0.0%) |
| 6 to 11 Years | 38 (100.0%) | 19 (100.0%) |
| 12 to 14 Years | 22 (100.0%) | 0 (0.0%) |
| 15 Years | 12 (100.0%) | 58 (100.0%) |
| 16 and 17 Years | 12 (100.0%) | 38 (100.0%) |
| 18 to 24 Years | 40 (100.0%) | 24 (100.0%) |
| 25 to 34 Years | 35 (100.0%) | 47 (100.0%) |
| 35 to 44 Years | 27 (100.0%) | 25 (100.0%) |
| 45 to 54 Years | 97 (81.5%) | 63 (100.0%) |
| 55 to 64 Years | 142 (89.3%) | 297 (94.0%) |
| 65 to 74 Years | 367 (100.0%) | 89 (100.0%) |
| 75 Years and over | 61 (100.0%) | 51 (80.9%) |
| Total | 855 (95.6%) | 765 (96.1%) |
Income Below Poverty Among Married-Couple Families in Jarales
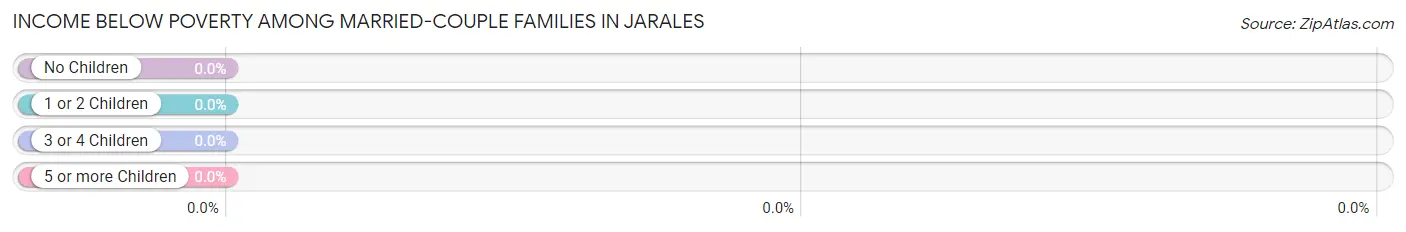
| Children | Above Poverty | Below Poverty |
| No Children | 208 (100.0%) | 0 (0.0%) |
| 1 or 2 Children | 339 (100.0%) | 0 (0.0%) |
| 3 or 4 Children | 18 (100.0%) | 0 (0.0%) |
| 5 or more Children | 0 (0.0%) | 0 (0.0%) |
| Total | 565 (100.0%) | 0 (0.0%) |
Income Below Poverty Among Single-Parent Households in Jarales
| Children | Single Father | Single Mother |
| No Children | 0 (0.0%) | 0 (0.0%) |
| 1 or 2 Children | 0 (0.0%) | 0 (0.0%) |
| 3 or 4 Children | 0 (0.0%) | 0 (0.0%) |
| 5 or more Children | 0 (0.0%) | 0 (0.0%) |
| Total | 0 (0.0%) | 0 (0.0%) |
Income Below Poverty Among Married-Couple vs Single-Parent Households in Jarales
| Children | Married-Couple Families | Single-Parent Households |
| No Children | 0 (0.0%) | 0 (0.0%) |
| 1 or 2 Children | 0 (0.0%) | 0 (0.0%) |
| 3 or 4 Children | 0 (0.0%) | 0 (0.0%) |
| 5 or more Children | 0 (0.0%) | 0 (0.0%) |
| Total | 0 (0.0%) | 0 (0.0%) |
Race in Jarales
The most populous races in Jarales are White / Caucasian (1,196 | 70.8%), Hispanic or Latino (1,175 | 69.5%), and Some other Race (323 | 19.1%).
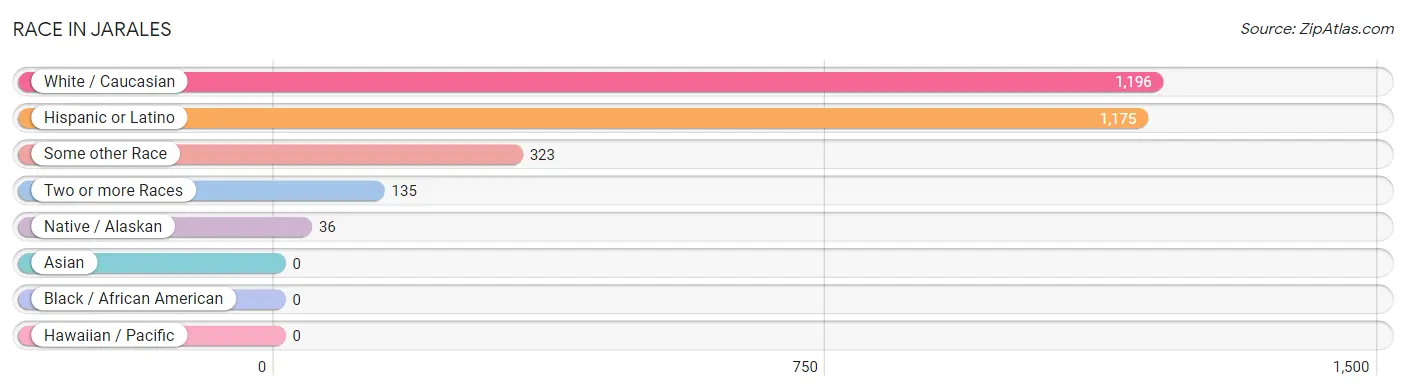
| Race | # Population | % Population |
| Asian | 0 | 0.0% |
| Black / African American | 0 | 0.0% |
| Hawaiian / Pacific | 0 | 0.0% |
| Hispanic or Latino | 1,175 | 69.5% |
| Native / Alaskan | 36 | 2.1% |
| White / Caucasian | 1,196 | 70.8% |
| Two or more Races | 135 | 8.0% |
| Some other Race | 323 | 19.1% |
| Total | 1,690 | 100.0% |
Ancestry in Jarales
The most populous ancestries reported in Jarales are Mexican (661 | 39.1%), American (273 | 16.2%), Spanish (126 | 7.5%), German (108 | 6.4%), and Spaniard (68 | 4.0%), together accounting for 73.1% of all Jarales residents.
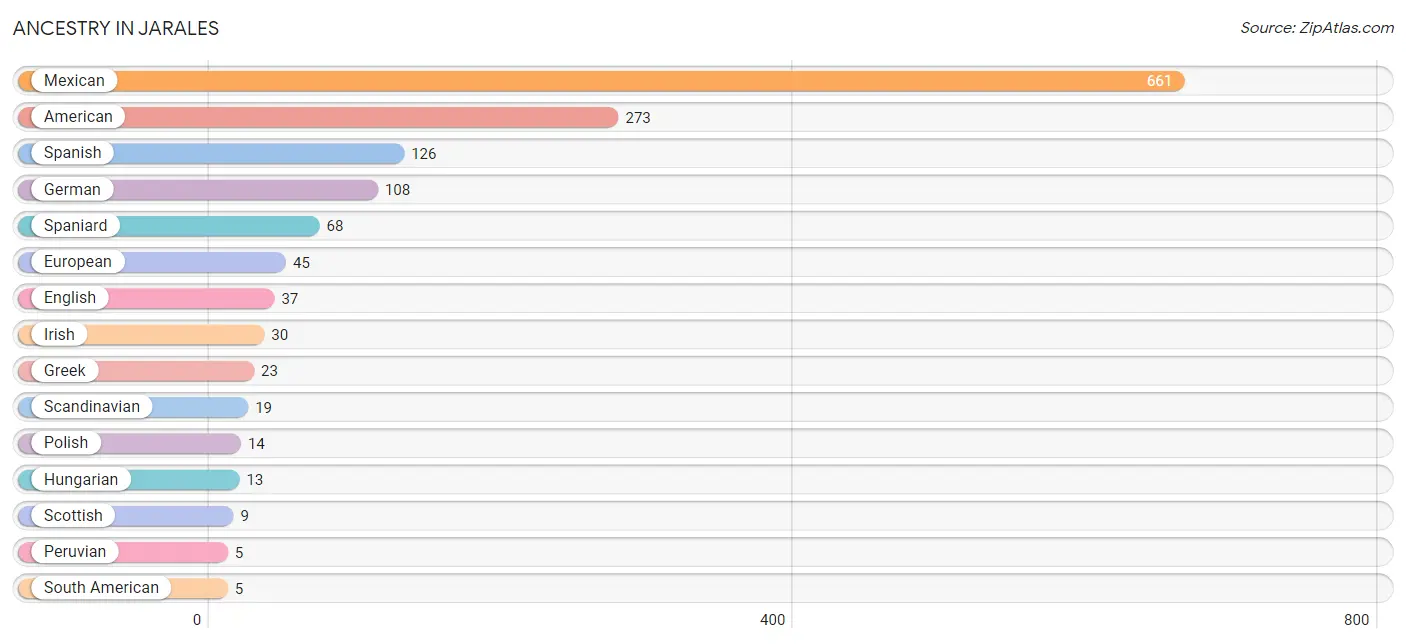
| Ancestry | # Population | % Population |
| American | 273 | 16.2% |
| English | 37 | 2.2% |
| European | 45 | 2.7% |
| German | 108 | 6.4% |
| Greek | 23 | 1.4% |
| Hungarian | 13 | 0.8% |
| Irish | 30 | 1.8% |
| Mexican | 661 | 39.1% |
| Peruvian | 5 | 0.3% |
| Polish | 14 | 0.8% |
| Scandinavian | 19 | 1.1% |
| Scottish | 9 | 0.5% |
| South American | 5 | 0.3% |
| Spaniard | 68 | 4.0% |
| Spanish | 126 | 7.5% |
| Spanish American | 3 | 0.2% | View All 16 Rows |
Immigrants in Jarales
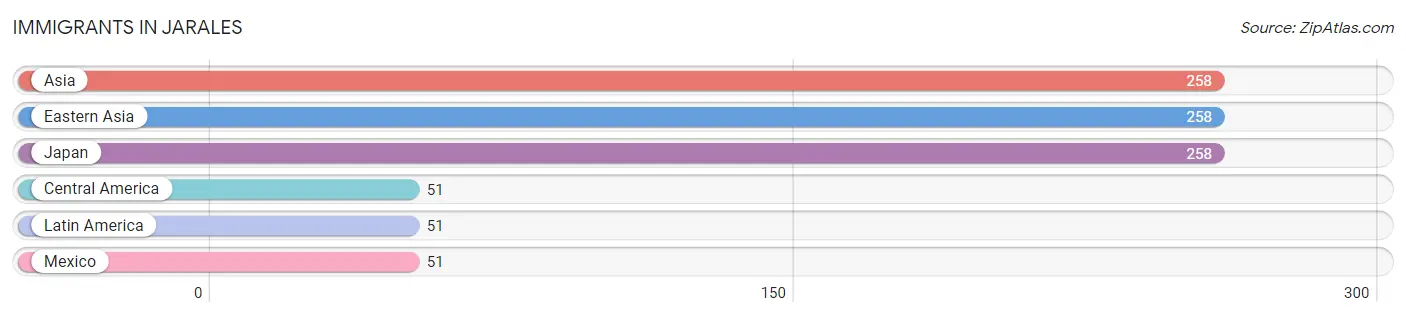
The most numerous immigrant groups reported in Jarales came from Asia (258 | 15.3%), Eastern Asia (258 | 15.3%), Japan (258 | 15.3%), Central America (51 | 3.0%), and Latin America (51 | 3.0%), together accounting for 51.8% of all Jarales residents.
| Immigration Origin | # Population | % Population |
| Asia | 258 | 15.3% |
| Central America | 51 | 3.0% |
| Eastern Asia | 258 | 15.3% |
| Japan | 258 | 15.3% |
| Latin America | 51 | 3.0% |
| Mexico | 51 | 3.0% | View All 6 Rows |
Sex and Age in Jarales
Sex and Age in Jarales
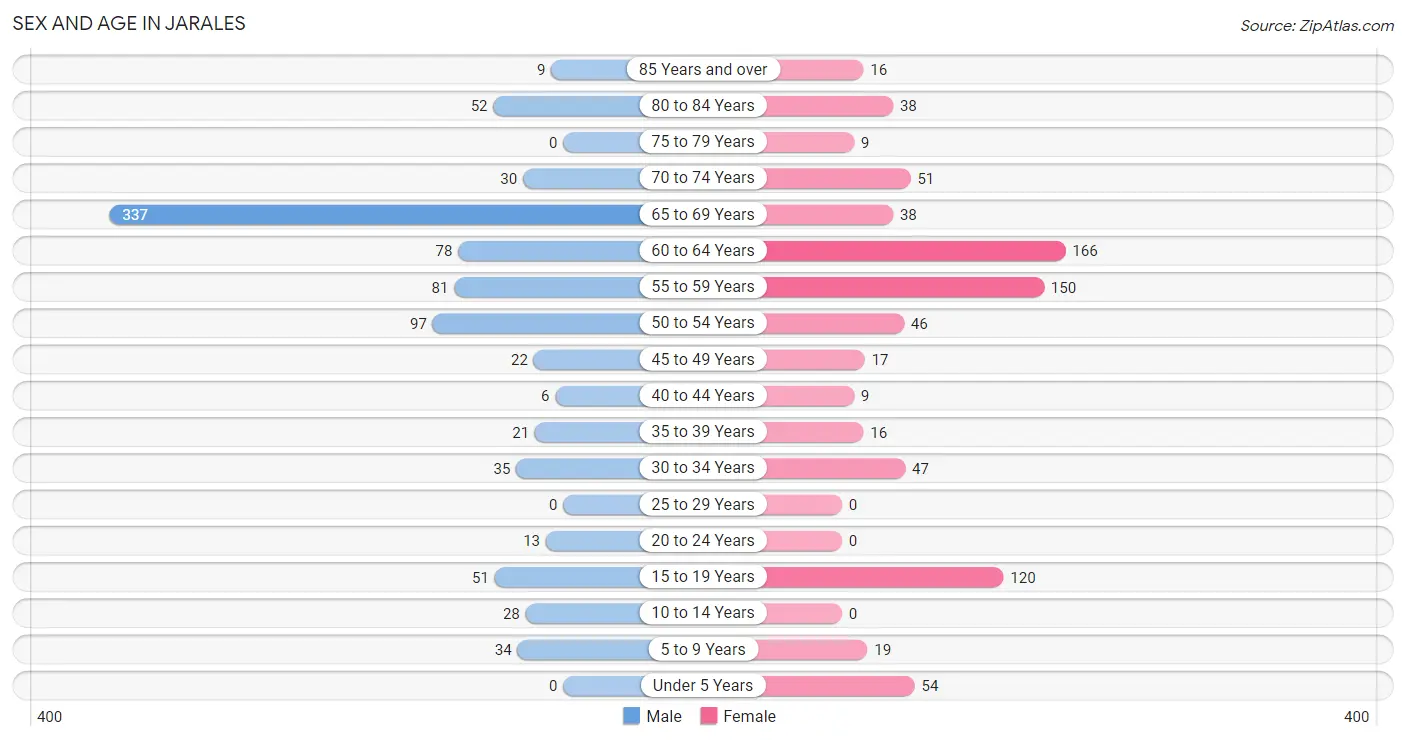
The most populous age groups in Jarales are 65 to 69 Years (337 | 37.7%) for men and 60 to 64 Years (166 | 20.8%) for women.
| Age Bracket | Male | Female |
| Under 5 Years | 0 (0.0%) | 54 (6.8%) |
| 5 to 9 Years | 34 (3.8%) | 19 (2.4%) |
| 10 to 14 Years | 28 (3.1%) | 0 (0.0%) |
| 15 to 19 Years | 51 (5.7%) | 120 (15.1%) |
| 20 to 24 Years | 13 (1.5%) | 0 (0.0%) |
| 25 to 29 Years | 0 (0.0%) | 0 (0.0%) |
| 30 to 34 Years | 35 (3.9%) | 47 (5.9%) |
| 35 to 39 Years | 21 (2.4%) | 16 (2.0%) |
| 40 to 44 Years | 6 (0.7%) | 9 (1.1%) |
| 45 to 49 Years | 22 (2.5%) | 17 (2.1%) |
| 50 to 54 Years | 97 (10.8%) | 46 (5.8%) |
| 55 to 59 Years | 81 (9.1%) | 150 (18.8%) |
| 60 to 64 Years | 78 (8.7%) | 166 (20.8%) |
| 65 to 69 Years | 337 (37.7%) | 38 (4.8%) |
| 70 to 74 Years | 30 (3.4%) | 51 (6.4%) |
| 75 to 79 Years | 0 (0.0%) | 9 (1.1%) |
| 80 to 84 Years | 52 (5.8%) | 38 (4.8%) |
| 85 Years and over | 9 (1.0%) | 16 (2.0%) |
| Total | 894 (100.0%) | 796 (100.0%) |
Families and Households in Jarales
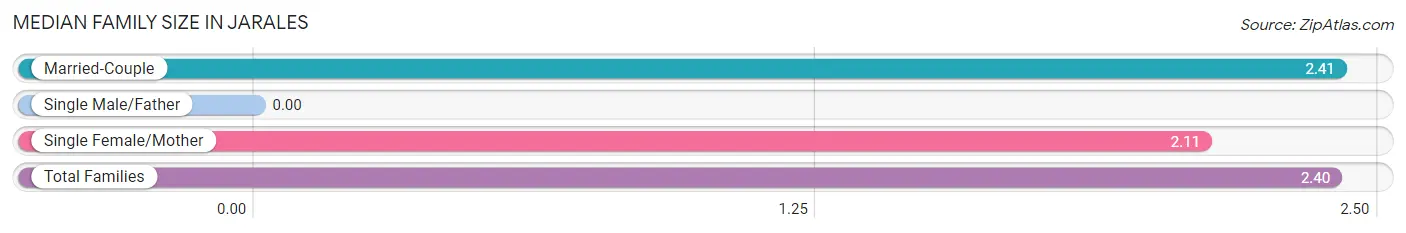
Median Family Size in Jarales
| Family Type | # Families | Family Size |
| Married-Couple | 565 (96.8%) | 2.41 |
| Single Male/Father | 0 (0.0%) | - |
| Single Female/Mother | 19 (3.3%) | 2.11 |
| Total Families | 584 (100.0%) | 2.40 |
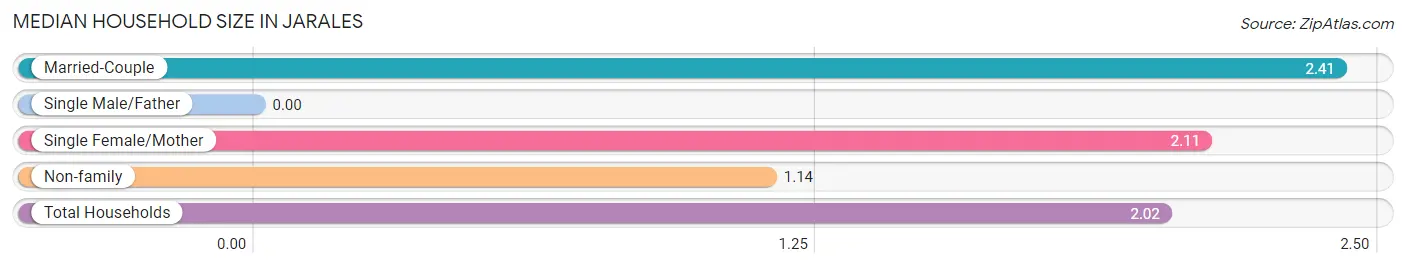
Median Household Size in Jarales
| Household Type | # Households | Household Size |
| Married-Couple | 565 (67.7%) | 2.41 |
| Single Male/Father | 0 (0.0%) | - |
| Single Female/Mother | 19 (2.3%) | 2.11 |
| Non-family | 251 (30.1%) | 1.14 |
| Total Households | 835 (100.0%) | 2.02 |
Household Size by Marriage Status in Jarales
Out of a total of 835 households in Jarales, 584 (69.9%) are family households, while 251 (30.1%) are nonfamily households. The most numerous type of family households are 4-person households, comprising 271, and the most common type of nonfamily households are 1-person households, comprising 213.
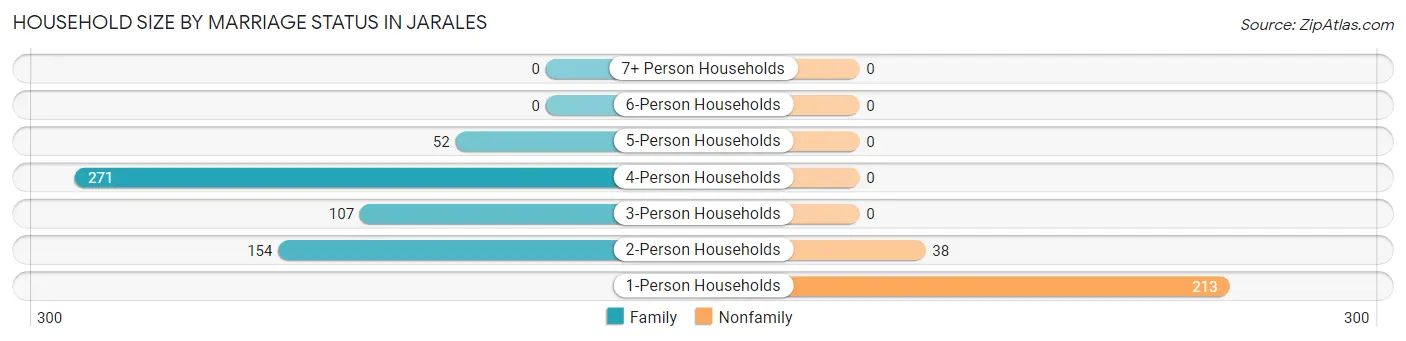
| Household Size | Family Households | Nonfamily Households |
| 1-Person Households | - | 213 (25.5%) |
| 2-Person Households | 154 (18.4%) | 38 (4.5%) |
| 3-Person Households | 107 (12.8%) | 0 (0.0%) |
| 4-Person Households | 271 (32.5%) | 0 (0.0%) |
| 5-Person Households | 52 (6.2%) | 0 (0.0%) |
| 6-Person Households | 0 (0.0%) | 0 (0.0%) |
| 7+ Person Households | 0 (0.0%) | 0 (0.0%) |
| Total | 584 (69.9%) | 251 (30.1%) |
Female Fertility in Jarales
Fertility by Age in Jarales
| Age Bracket | Women with Births | Births / 1,000 Women |
| 15 to 19 years | 0 (0.0%) | 0.0 |
| 20 to 34 years | 0 (0.0%) | 0.0 |
| 35 to 50 years | 0 (0.0%) | 0.0 |
| Total | 0 (0.0%) | 0.0 |
Fertility by Age by Marriage Status in Jarales
| Age Bracket | Married | Unmarried |
| 15 to 19 years | 0 (0.0%) | 0 (0.0%) |
| 20 to 34 years | 0 (0.0%) | 0 (0.0%) |
| 35 to 50 years | 0 (0.0%) | 0 (0.0%) |
| Total | 0 (0.0%) | 0 (0.0%) |
Fertility by Education in Jarales
| Educational Attainment | Women with Births | Births / 1,000 Women |
| Less than High School | 0 (0.0%) | 0.0 |
| High School Diploma | 0 (0.0%) | 0.0 |
| College or Associate's Degree | 0 (0.0%) | 0.0 |
| Bachelor's Degree | 0 (0.0%) | 0.0 |
| Graduate Degree | 0 (0.0%) | 0.0 |
| Total | 0 (0.0%) | 0.0 |
Fertility by Education by Marriage Status in Jarales
| Educational Attainment | Married | Unmarried |
| Less than High School | 0 (0.0%) | 0 (0.0%) |
| High School Diploma | 0 (0.0%) | 0 (0.0%) |
| College or Associate's Degree | 0 (0.0%) | 0 (0.0%) |
| Bachelor's Degree | 0 (0.0%) | 0 (0.0%) |
| Graduate Degree | 0 (0.0%) | 0 (0.0%) |
| Total | 0 (0.0%) | 0 (0.0%) |
Employment Characteristics in Jarales
Employment by Class of Employer in Jarales
Among the 478 employed individuals in Jarales, private company employees (186 | 38.9%), self-employed (not incorporated) (107 | 22.4%), and not-for-profit organizations (87 | 18.2%) make up the most common classes of employment.
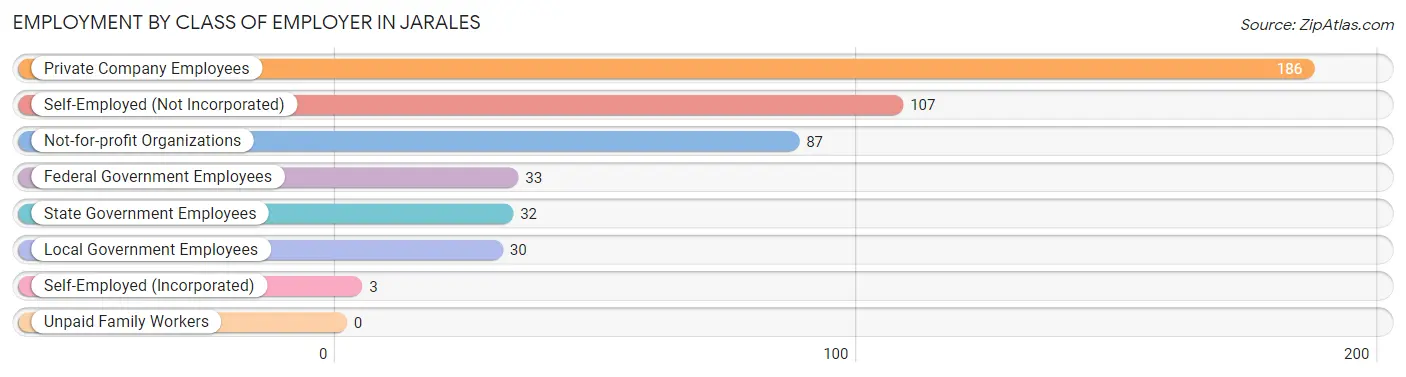
| Employer Class | # Employees | % Employees |
| Private Company Employees | 186 | 38.9% |
| Self-Employed (Incorporated) | 3 | 0.6% |
| Self-Employed (Not Incorporated) | 107 | 22.4% |
| Not-for-profit Organizations | 87 | 18.2% |
| Local Government Employees | 30 | 6.3% |
| State Government Employees | 32 | 6.7% |
| Federal Government Employees | 33 | 6.9% |
| Unpaid Family Workers | 0 | 0.0% |
| Total | 478 | 100.0% |
Employment Status by Age in Jarales
According to the labor force statistics for Jarales, out of the total population over 16 years of age (1,485), 37.6% or 558 individuals are in the labor force, with 11.4% or 64 of them unemployed. The age group with the highest labor force participation rate is 20 to 24 years, with 100.0% or 13 individuals in the labor force. Within the labor force, the 30 to 34 years age range has the highest percentage of unemployed individuals, with 50.0% or 25 of them being unemployed.
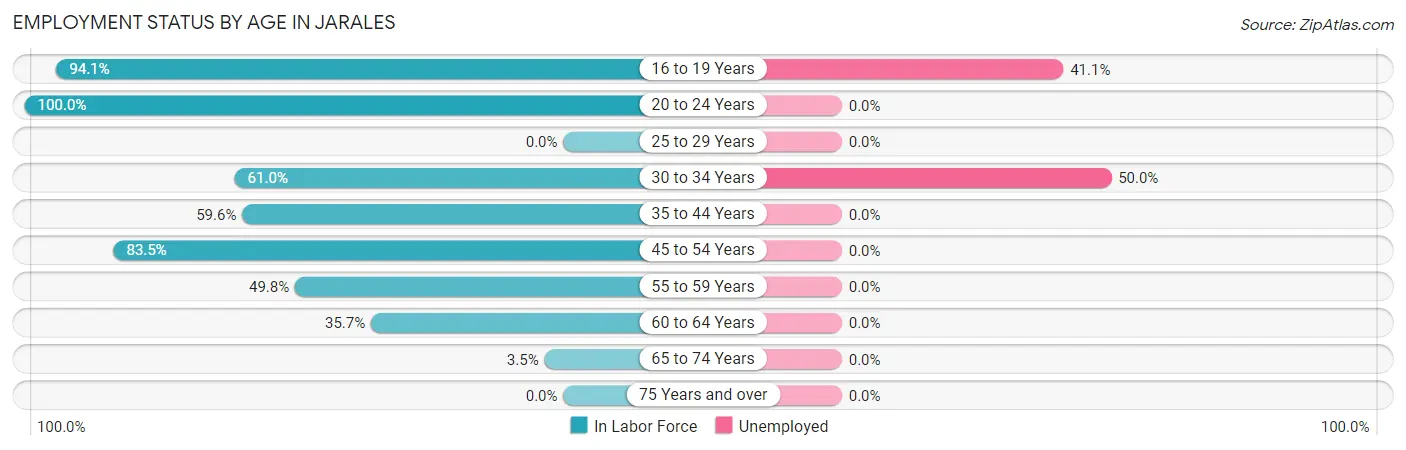
| Age Bracket | In Labor Force | Unemployed |
| 16 to 19 Years | 95 (94.1%) | 39 (41.1%) |
| 20 to 24 Years | 13 (100.0%) | 0 (0.0%) |
| 25 to 29 Years | 0 (0.0%) | 0 (0.0%) |
| 30 to 34 Years | 50 (61.0%) | 25 (50.0%) |
| 35 to 44 Years | 31 (59.6%) | 0 (0.0%) |
| 45 to 54 Years | 152 (83.5%) | 0 (0.0%) |
| 55 to 59 Years | 115 (49.8%) | 0 (0.0%) |
| 60 to 64 Years | 87 (35.7%) | 0 (0.0%) |
| 65 to 74 Years | 16 (3.5%) | 0 (0.0%) |
| 75 Years and over | 0 (0.0%) | 0 (0.0%) |
| Total | 558 (37.6%) | 64 (11.4%) |
Employment Status by Educational Attainment in Jarales
According to labor force statistics for Jarales, 55.0% of individuals (435) out of the total population between 25 and 64 years of age (791) are in the labor force, with 5.7% or 25 of them being unemployed. The group with the highest labor force participation rate are those with the educational attainment of bachelor's degree or higher, with 89.6% or 146 individuals in the labor force. Within the labor force, individuals with bachelor's degree or higher education have the highest percentage of unemployment, with 17.1% or 25 of them being unemployed.
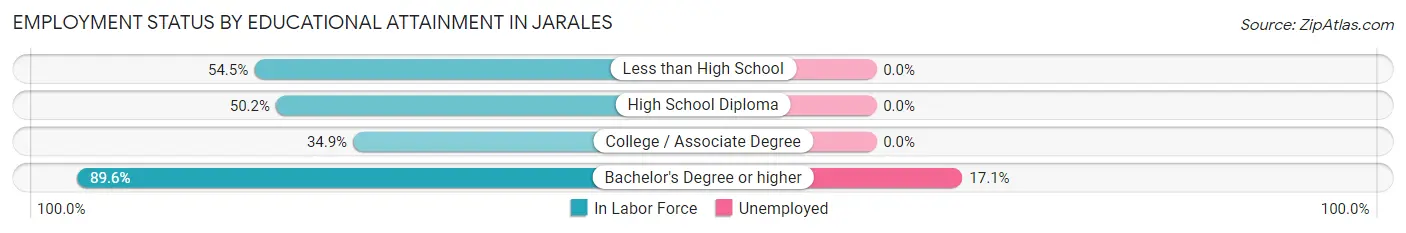
| Educational Attainment | In Labor Force | Unemployed |
| Less than High School | 85 (54.5%) | 0 (0.0%) |
| High School Diploma | 129 (50.2%) | 0 (0.0%) |
| College / Associate Degree | 75 (34.9%) | 0 (0.0%) |
| Bachelor's Degree or higher | 146 (89.6%) | 28 (17.1%) |
| Total | 435 (55.0%) | 45 (5.7%) |
Employment Occupations by Sex in Jarales
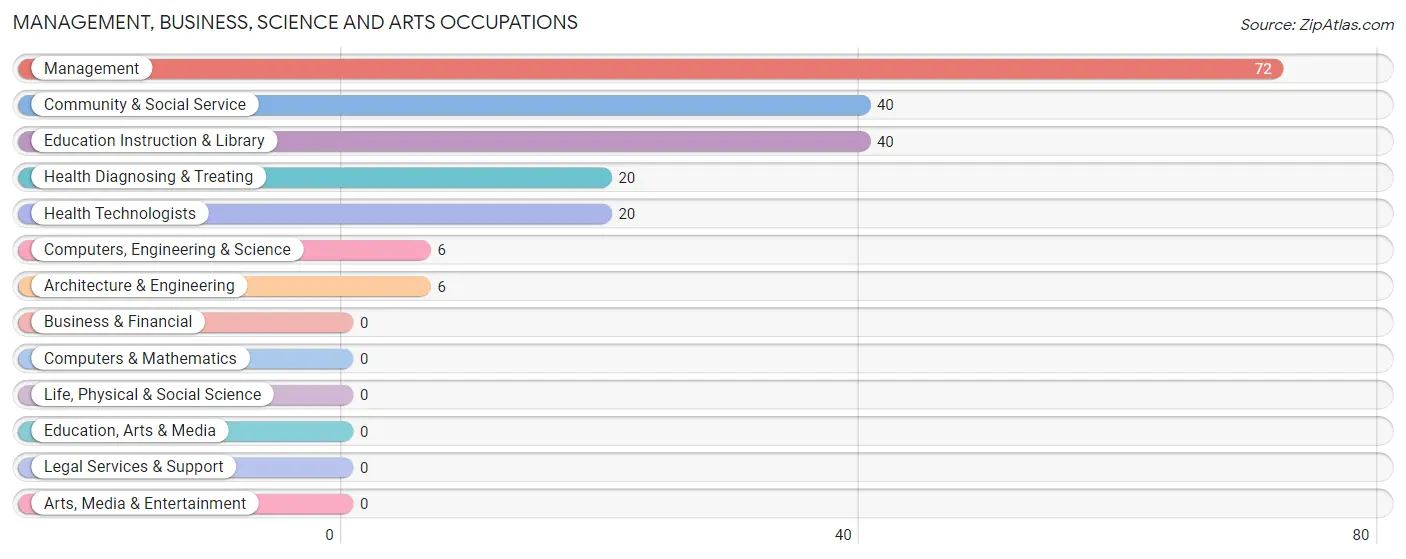
Management, Business, Science and Arts Occupations
The most common Management, Business, Science and Arts occupations in Jarales are Management (72 | 14.5%), Community & Social Service (40 | 8.1%), Education Instruction & Library (40 | 8.1%), Health Diagnosing & Treating (20 | 4.0%), and Health Technologists (20 | 4.0%).
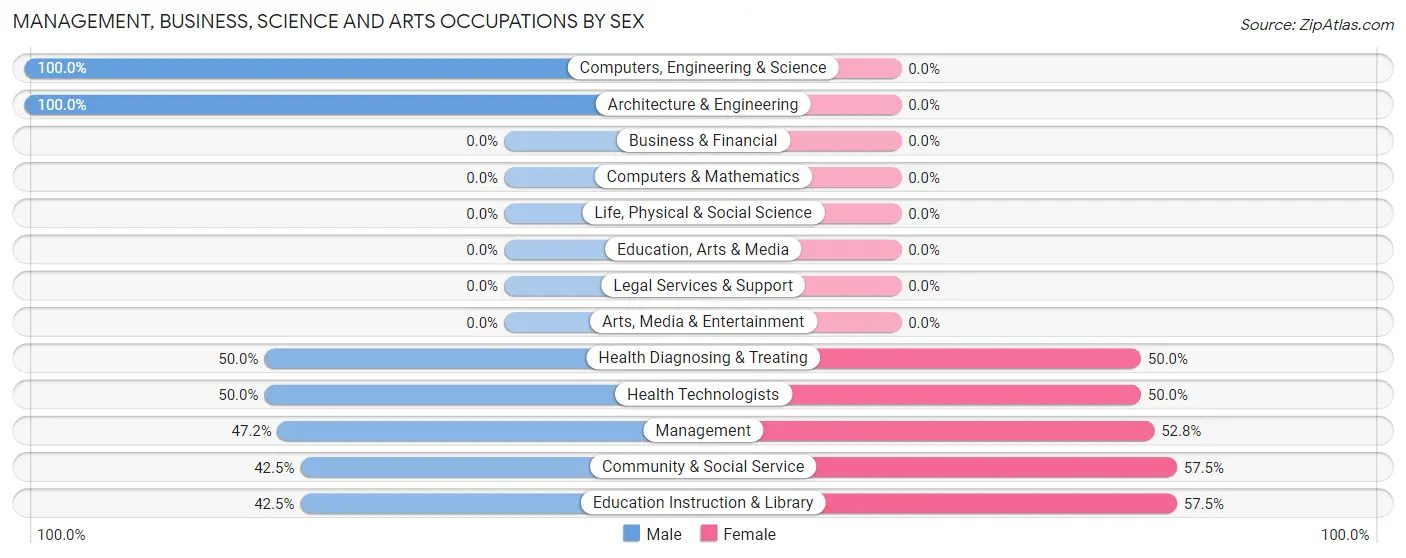
Management, Business, Science and Arts Occupations by Sex
Within the Management, Business, Science and Arts occupations in Jarales, the most male-oriented occupations are Computers, Engineering & Science (100.0%), Architecture & Engineering (100.0%), and Health Diagnosing & Treating (50.0%), while the most female-oriented occupations are Community & Social Service (57.5%), Education Instruction & Library (57.5%), and Management (52.8%).
| Occupation | Male | Female |
| Management | 34 (47.2%) | 38 (52.8%) |
| Business & Financial | 0 (0.0%) | 0 (0.0%) |
| Computers, Engineering & Science | 6 (100.0%) | 0 (0.0%) |
| Computers & Mathematics | 0 (0.0%) | 0 (0.0%) |
| Architecture & Engineering | 6 (100.0%) | 0 (0.0%) |
| Life, Physical & Social Science | 0 (0.0%) | 0 (0.0%) |
| Community & Social Service | 17 (42.5%) | 23 (57.5%) |
| Education, Arts & Media | 0 (0.0%) | 0 (0.0%) |
| Legal Services & Support | 0 (0.0%) | 0 (0.0%) |
| Education Instruction & Library | 17 (42.5%) | 23 (57.5%) |
| Arts, Media & Entertainment | 0 (0.0%) | 0 (0.0%) |
| Health Diagnosing & Treating | 10 (50.0%) | 10 (50.0%) |
| Health Technologists | 10 (50.0%) | 10 (50.0%) |
| Total (Category) | 67 (48.5%) | 71 (51.4%) |
| Total (Overall) | 192 (38.8%) | 303 (61.2%) |
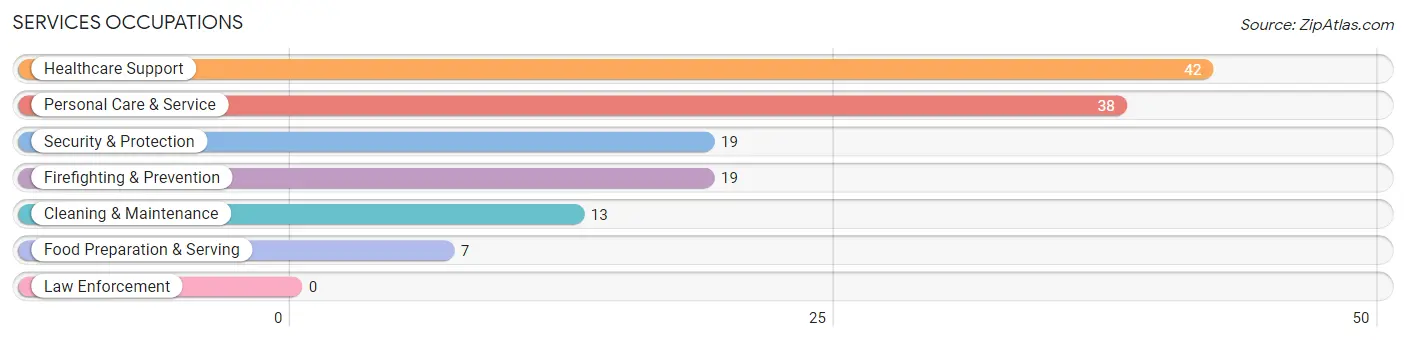
Services Occupations
The most common Services occupations in Jarales are Healthcare Support (42 | 8.5%), Personal Care & Service (38 | 7.7%), Security & Protection (19 | 3.8%), Firefighting & Prevention (19 | 3.8%), and Cleaning & Maintenance (13 | 2.6%).
Services Occupations by Sex
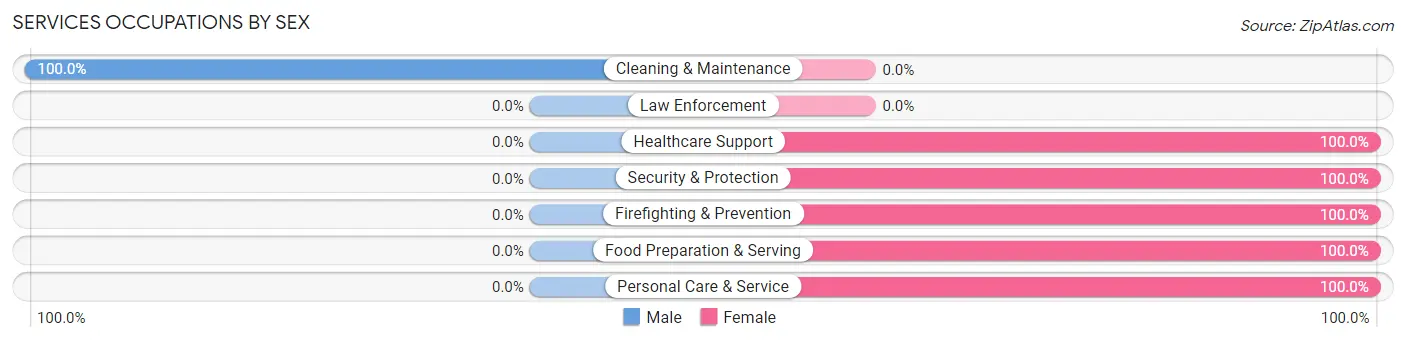
| Occupation | Male | Female |
| Healthcare Support | 0 (0.0%) | 42 (100.0%) |
| Security & Protection | 0 (0.0%) | 19 (100.0%) |
| Firefighting & Prevention | 0 (0.0%) | 19 (100.0%) |
| Law Enforcement | 0 (0.0%) | 0 (0.0%) |
| Food Preparation & Serving | 0 (0.0%) | 7 (100.0%) |
| Cleaning & Maintenance | 13 (100.0%) | 0 (0.0%) |
| Personal Care & Service | 0 (0.0%) | 38 (100.0%) |
| Total (Category) | 13 (10.9%) | 106 (89.1%) |
| Total (Overall) | 192 (38.8%) | 303 (61.2%) |
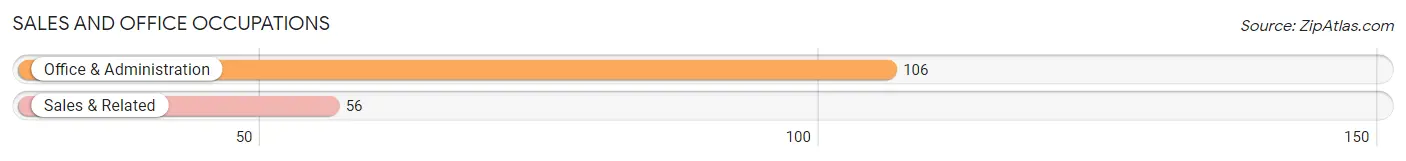
Sales and Office Occupations
The most common Sales and Office occupations in Jarales are Office & Administration (106 | 21.4%), and Sales & Related (56 | 11.3%).
Sales and Office Occupations by Sex
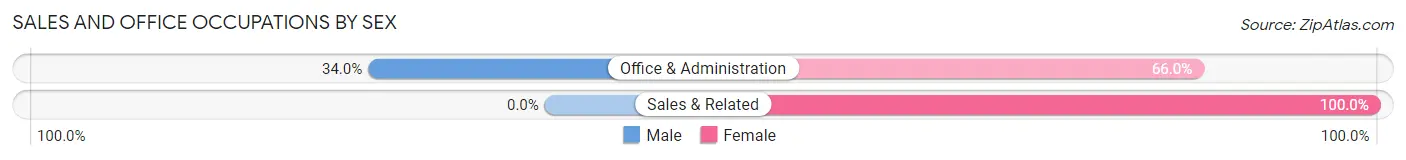
| Occupation | Male | Female |
| Sales & Related | 0 (0.0%) | 56 (100.0%) |
| Office & Administration | 36 (34.0%) | 70 (66.0%) |
| Total (Category) | 36 (22.2%) | 126 (77.8%) |
| Total (Overall) | 192 (38.8%) | 303 (61.2%) |
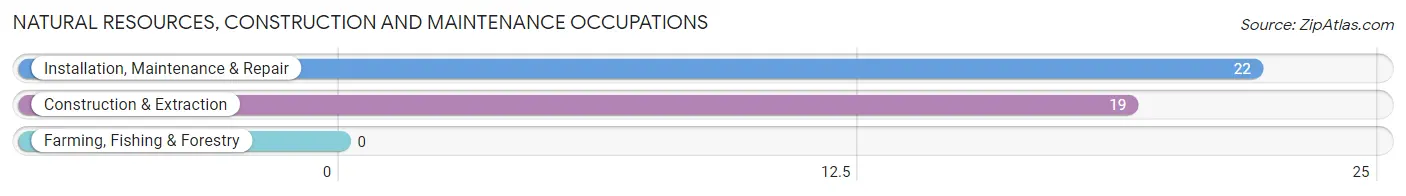
Natural Resources, Construction and Maintenance Occupations
The most common Natural Resources, Construction and Maintenance occupations in Jarales are Installation, Maintenance & Repair (22 | 4.4%), and Construction & Extraction (19 | 3.8%).
Natural Resources, Construction and Maintenance Occupations by Sex
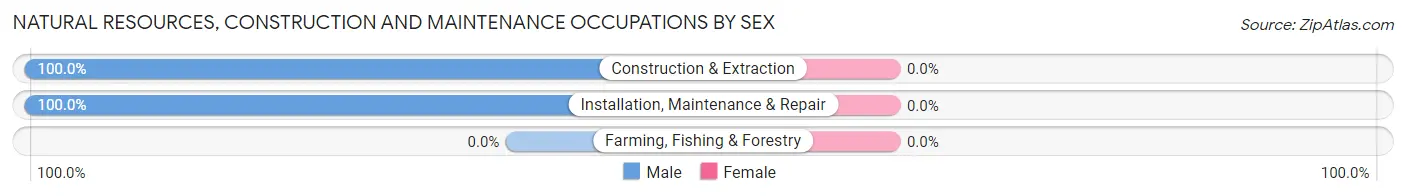
| Occupation | Male | Female |
| Farming, Fishing & Forestry | 0 (0.0%) | 0 (0.0%) |
| Construction & Extraction | 19 (100.0%) | 0 (0.0%) |
| Installation, Maintenance & Repair | 22 (100.0%) | 0 (0.0%) |
| Total (Category) | 41 (100.0%) | 0 (0.0%) |
| Total (Overall) | 192 (38.8%) | 303 (61.2%) |
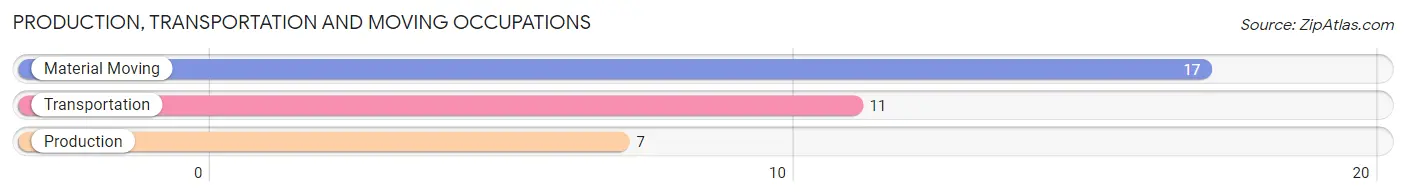
Production, Transportation and Moving Occupations
The most common Production, Transportation and Moving occupations in Jarales are Material Moving (17 | 3.4%), Transportation (11 | 2.2%), and Production (7 | 1.4%).
Production, Transportation and Moving Occupations by Sex
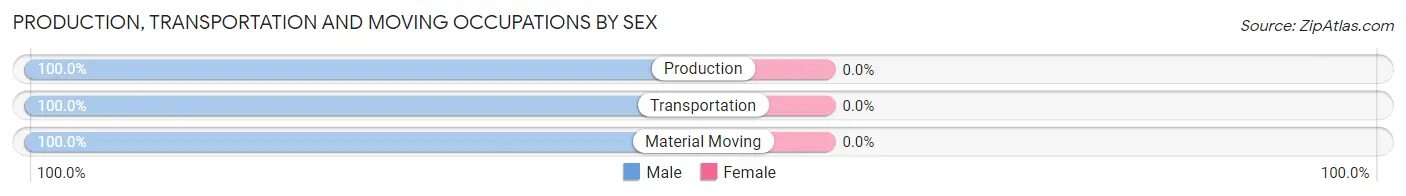
| Occupation | Male | Female |
| Production | 7 (100.0%) | 0 (0.0%) |
| Transportation | 11 (100.0%) | 0 (0.0%) |
| Material Moving | 17 (100.0%) | 0 (0.0%) |
| Total (Category) | 35 (100.0%) | 0 (0.0%) |
| Total (Overall) | 192 (38.8%) | 303 (61.2%) |
Employment Industries by Sex in Jarales
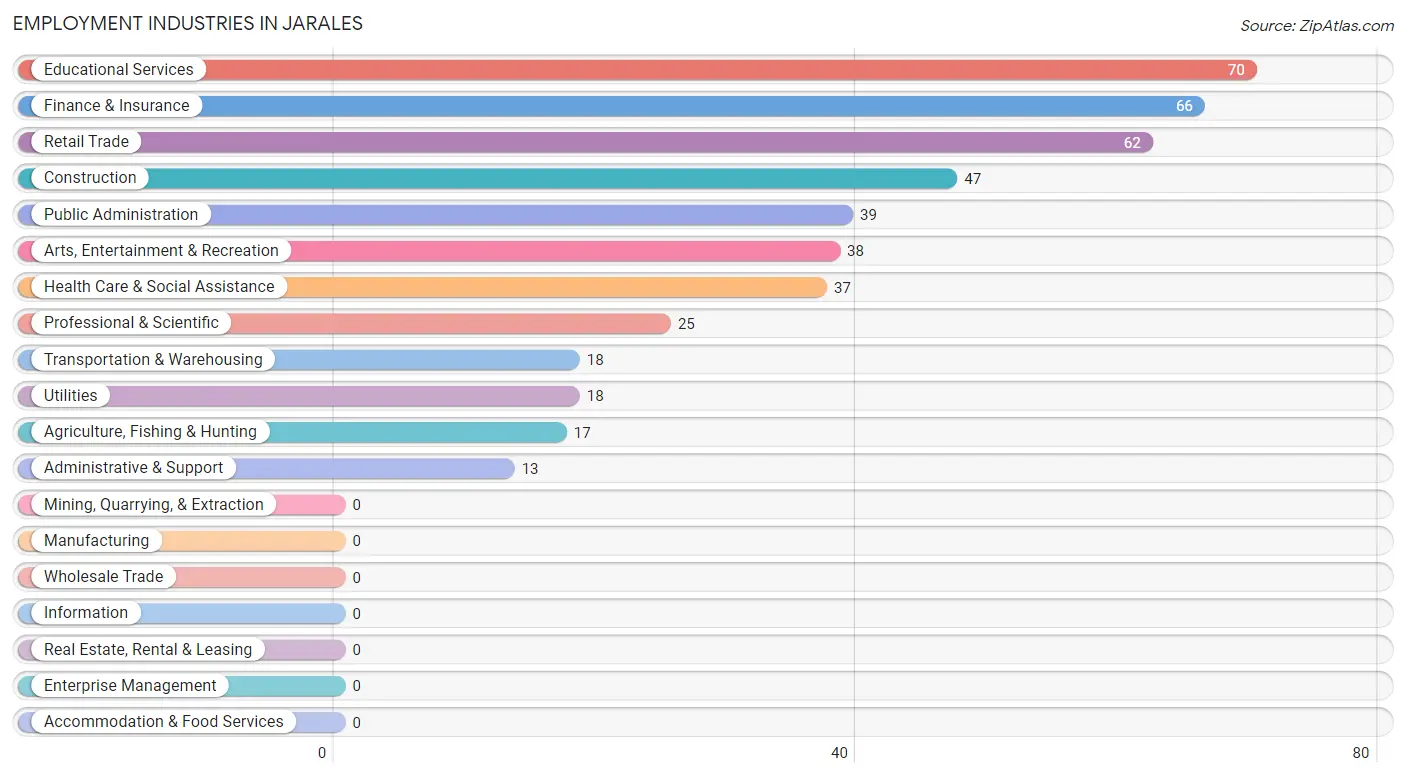
Employment Industries in Jarales
The major employment industries in Jarales include Educational Services (70 | 14.1%), Finance & Insurance (66 | 13.3%), Retail Trade (62 | 12.5%), Construction (47 | 9.5%), and Public Administration (39 | 7.9%).
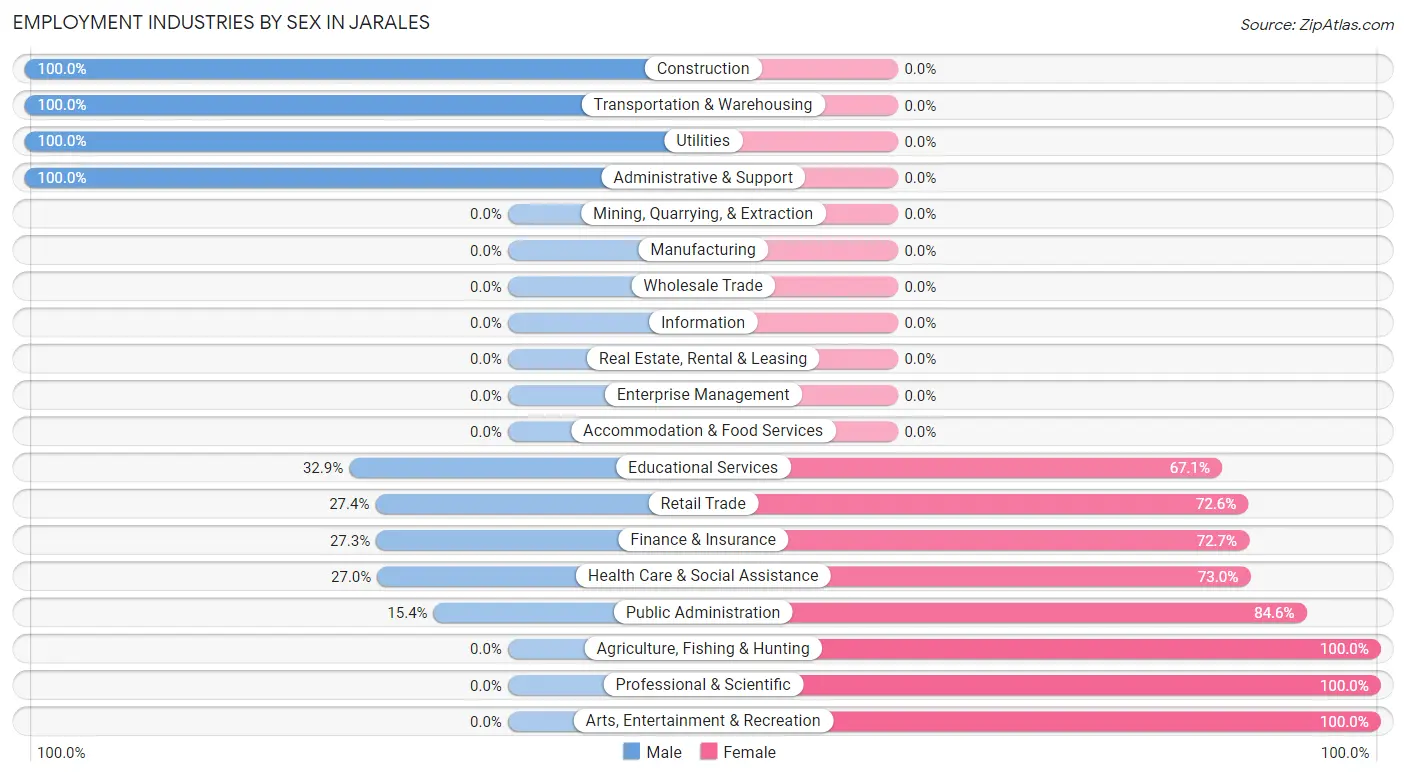
Employment Industries by Sex in Jarales
The Jarales industries that see more men than women are Construction (100.0%), Transportation & Warehousing (100.0%), and Utilities (100.0%), whereas the industries that tend to have a higher number of women are Agriculture, Fishing & Hunting (100.0%), Professional & Scientific (100.0%), and Arts, Entertainment & Recreation (100.0%).
| Industry | Male | Female |
| Agriculture, Fishing & Hunting | 0 (0.0%) | 17 (100.0%) |
| Mining, Quarrying, & Extraction | 0 (0.0%) | 0 (0.0%) |
| Construction | 47 (100.0%) | 0 (0.0%) |
| Manufacturing | 0 (0.0%) | 0 (0.0%) |
| Wholesale Trade | 0 (0.0%) | 0 (0.0%) |
| Retail Trade | 17 (27.4%) | 45 (72.6%) |
| Transportation & Warehousing | 18 (100.0%) | 0 (0.0%) |
| Utilities | 18 (100.0%) | 0 (0.0%) |
| Information | 0 (0.0%) | 0 (0.0%) |
| Finance & Insurance | 18 (27.3%) | 48 (72.7%) |
| Real Estate, Rental & Leasing | 0 (0.0%) | 0 (0.0%) |
| Professional & Scientific | 0 (0.0%) | 25 (100.0%) |
| Enterprise Management | 0 (0.0%) | 0 (0.0%) |
| Administrative & Support | 13 (100.0%) | 0 (0.0%) |
| Educational Services | 23 (32.9%) | 47 (67.1%) |
| Health Care & Social Assistance | 10 (27.0%) | 27 (73.0%) |
| Arts, Entertainment & Recreation | 0 (0.0%) | 38 (100.0%) |
| Accommodation & Food Services | 0 (0.0%) | 0 (0.0%) |
| Public Administration | 6 (15.4%) | 33 (84.6%) |
| Total | 192 (38.8%) | 303 (61.2%) |
Education in Jarales
School Enrollment in Jarales
The most common levels of schooling among the 243 students in Jarales are high school (130 | 53.5%), elementary school (51 | 21.0%), and nursery / preschool (31 | 12.8%).
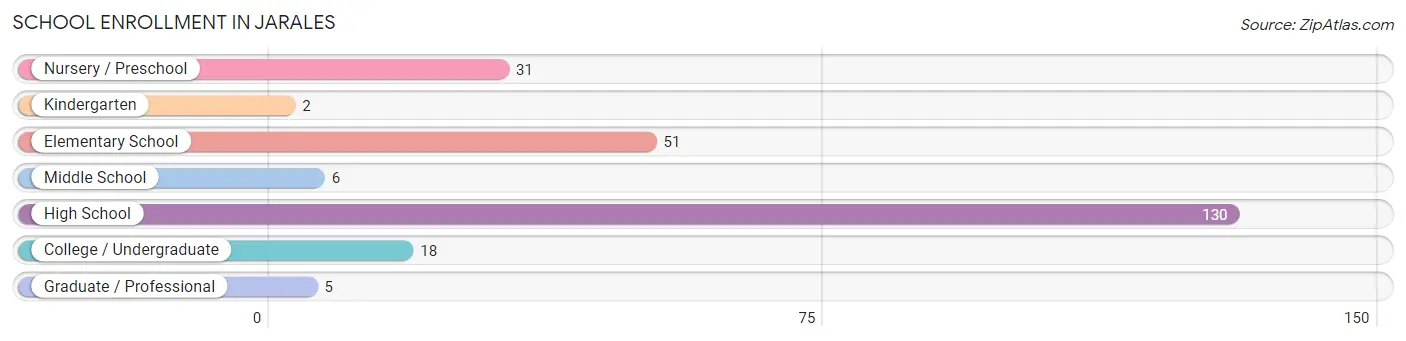
| School Level | # Students | % Students |
| Nursery / Preschool | 31 | 12.8% |
| Kindergarten | 2 | 0.8% |
| Elementary School | 51 | 21.0% |
| Middle School | 6 | 2.5% |
| High School | 130 | 53.5% |
| College / Undergraduate | 18 | 7.4% |
| Graduate / Professional | 5 | 2.1% |
| Total | 243 | 100.0% |
School Enrollment by Age by Funding Source in Jarales
Out of a total of 243 students who are enrolled in schools in Jarales, 86 (35.4%) attend a private institution, while the remaining 157 (64.6%) are enrolled in public schools. The age group of 10 to 14 year olds has the highest likelihood of being enrolled in private schools, with 22 (78.6% in the age bracket) enrolled. Conversely, the age group of 3 to 4 year olds has the lowest likelihood of being enrolled in a private school, with 31 (100.0% in the age bracket) attending a public institution.
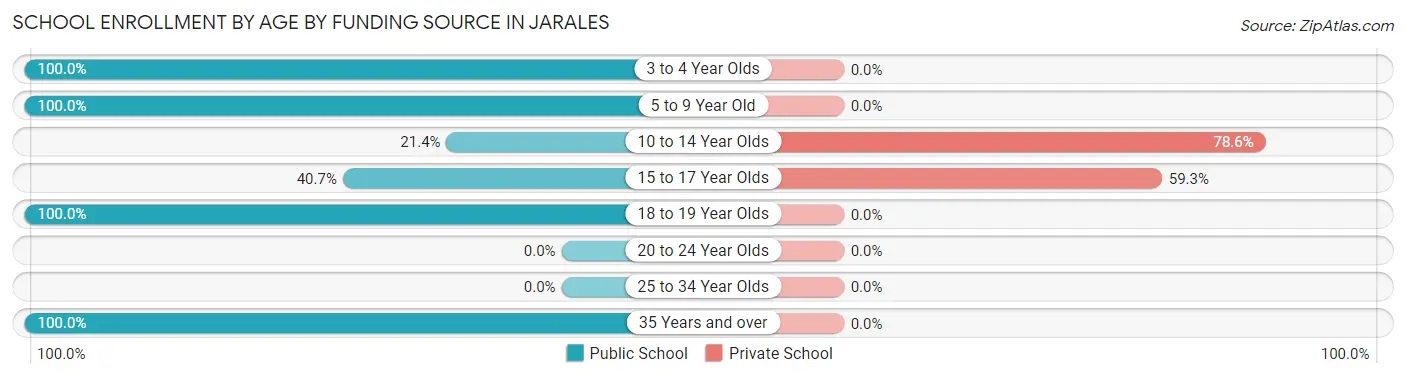
| Age Bracket | Public School | Private School |
| 3 to 4 Year Olds | 31 (100.0%) | 0 (0.0%) |
| 5 to 9 Year Old | 53 (100.0%) | 0 (0.0%) |
| 10 to 14 Year Olds | 6 (21.4%) | 22 (78.6%) |
| 15 to 17 Year Olds | 44 (40.7%) | 64 (59.3%) |
| 18 to 19 Year Olds | 18 (100.0%) | 0 (0.0%) |
| 20 to 24 Year Olds | 0 (0.0%) | 0 (0.0%) |
| 25 to 34 Year Olds | 0 (0.0%) | 0 (0.0%) |
| 35 Years and over | 5 (100.0%) | 0 (0.0%) |
| Total | 157 (64.6%) | 86 (35.4%) |
Educational Attainment by Field of Study in Jarales
Education (72 | 32.0%), business (57 | 25.3%), bio, nature & agricultural (43 | 19.1%), engineering (23 | 10.2%), and science & technology (14 | 6.2%) are the most common fields of study among 225 individuals in Jarales who have obtained a bachelor's degree or higher.
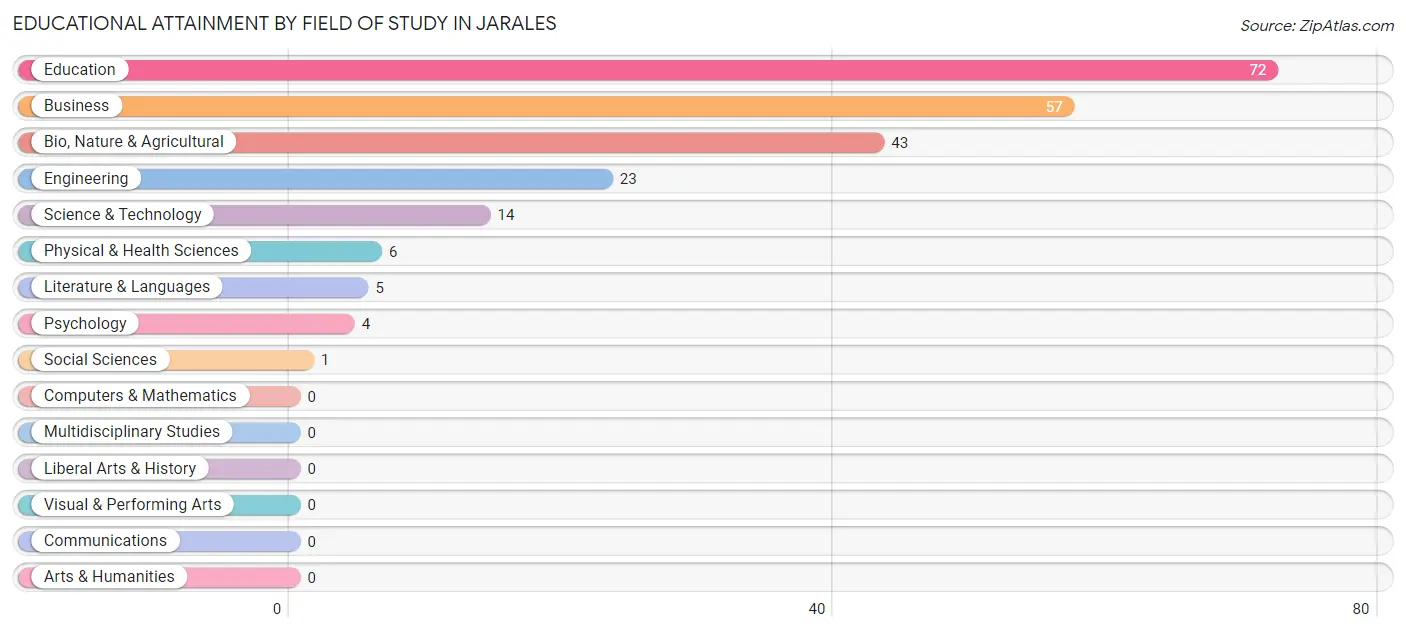
| Field of Study | # Graduates | % Graduates |
| Computers & Mathematics | 0 | 0.0% |
| Bio, Nature & Agricultural | 43 | 19.1% |
| Physical & Health Sciences | 6 | 2.7% |
| Psychology | 4 | 1.8% |
| Social Sciences | 1 | 0.4% |
| Engineering | 23 | 10.2% |
| Multidisciplinary Studies | 0 | 0.0% |
| Science & Technology | 14 | 6.2% |
| Business | 57 | 25.3% |
| Education | 72 | 32.0% |
| Literature & Languages | 5 | 2.2% |
| Liberal Arts & History | 0 | 0.0% |
| Visual & Performing Arts | 0 | 0.0% |
| Communications | 0 | 0.0% |
| Arts & Humanities | 0 | 0.0% |
| Total | 225 | 100.0% |
Transportation & Commute in Jarales
Vehicle Availability by Sex in Jarales
The most prevalent vehicle ownership categories in Jarales are males with 3 vehicles (82, accounting for 46.9%) and females with 3 vehicles (72, making up 27.1%).
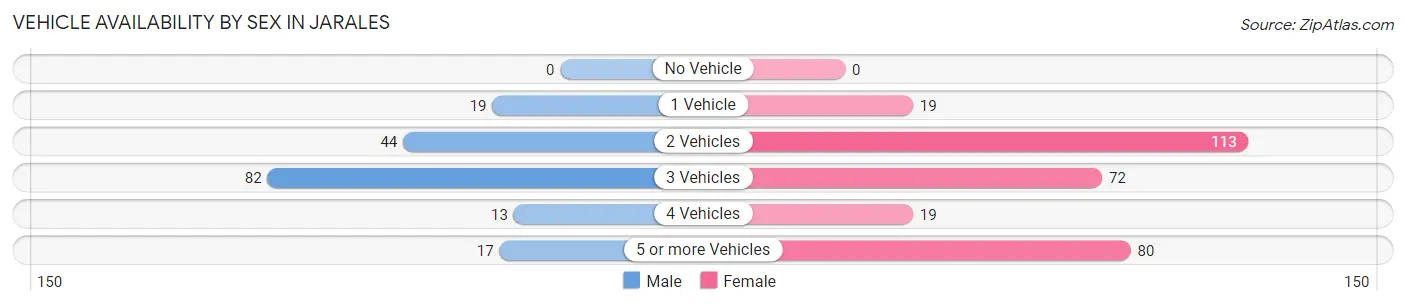
| Vehicles Available | Male | Female |
| No Vehicle | 0 (0.0%) | 0 (0.0%) |
| 1 Vehicle | 19 (10.9%) | 19 (6.3%) |
| 2 Vehicles | 44 (25.1%) | 113 (37.3%) |
| 3 Vehicles | 82 (46.9%) | 72 (23.8%) |
| 4 Vehicles | 13 (7.4%) | 19 (6.3%) |
| 5 or more Vehicles | 17 (9.7%) | 80 (26.4%) |
| Total | 175 (100.0%) | 303 (100.0%) |
Commute Time in Jarales
The most frequently occuring commute durations in Jarales are 15 to 19 minutes (106 commuters, 25.9%), 45 to 59 minutes (94 commuters, 23.0%), and 10 to 14 minutes (59 commuters, 14.4%).
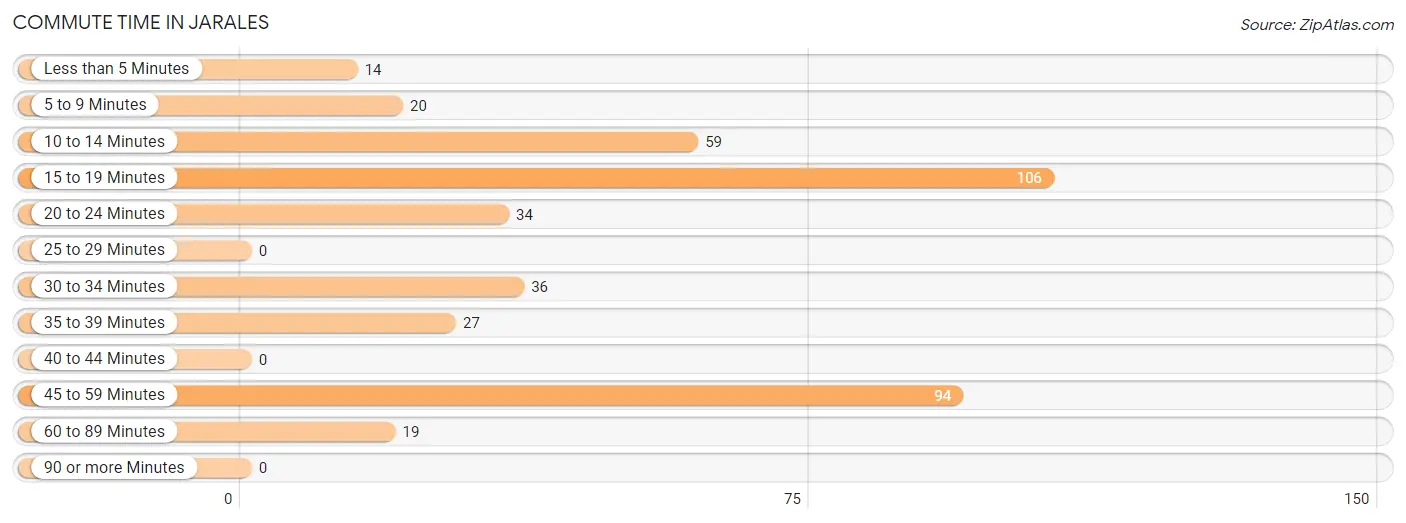
| Commute Time | # Commuters | % Commuters |
| Less than 5 Minutes | 14 | 3.4% |
| 5 to 9 Minutes | 20 | 4.9% |
| 10 to 14 Minutes | 59 | 14.4% |
| 15 to 19 Minutes | 106 | 25.9% |
| 20 to 24 Minutes | 34 | 8.3% |
| 25 to 29 Minutes | 0 | 0.0% |
| 30 to 34 Minutes | 36 | 8.8% |
| 35 to 39 Minutes | 27 | 6.6% |
| 40 to 44 Minutes | 0 | 0.0% |
| 45 to 59 Minutes | 94 | 23.0% |
| 60 to 89 Minutes | 19 | 4.6% |
| 90 or more Minutes | 0 | 0.0% |
Commute Time by Sex in Jarales
The most common commute times in Jarales are 15 to 19 minutes (60 commuters, 40.8%) for males and 45 to 59 minutes (72 commuters, 27.5%) for females.
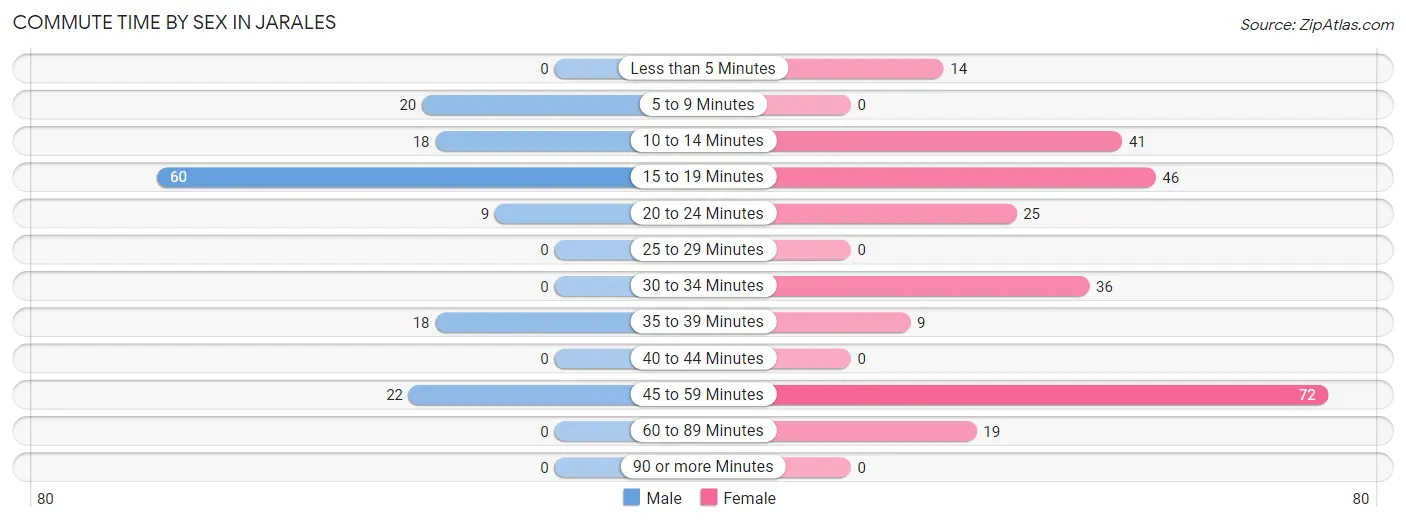
| Commute Time | Male | Female |
| Less than 5 Minutes | 0 (0.0%) | 14 (5.3%) |
| 5 to 9 Minutes | 20 (13.6%) | 0 (0.0%) |
| 10 to 14 Minutes | 18 (12.2%) | 41 (15.7%) |
| 15 to 19 Minutes | 60 (40.8%) | 46 (17.6%) |
| 20 to 24 Minutes | 9 (6.1%) | 25 (9.5%) |
| 25 to 29 Minutes | 0 (0.0%) | 0 (0.0%) |
| 30 to 34 Minutes | 0 (0.0%) | 36 (13.7%) |
| 35 to 39 Minutes | 18 (12.2%) | 9 (3.4%) |
| 40 to 44 Minutes | 0 (0.0%) | 0 (0.0%) |
| 45 to 59 Minutes | 22 (15.0%) | 72 (27.5%) |
| 60 to 89 Minutes | 0 (0.0%) | 19 (7.2%) |
| 90 or more Minutes | 0 (0.0%) | 0 (0.0%) |
Time of Departure to Work by Sex in Jarales
The most frequent times of departure to work in Jarales are 6:00 AM to 6:29 AM (47, 32.0%) for males and 9:00 AM to 9:59 AM (71, 27.1%) for females.
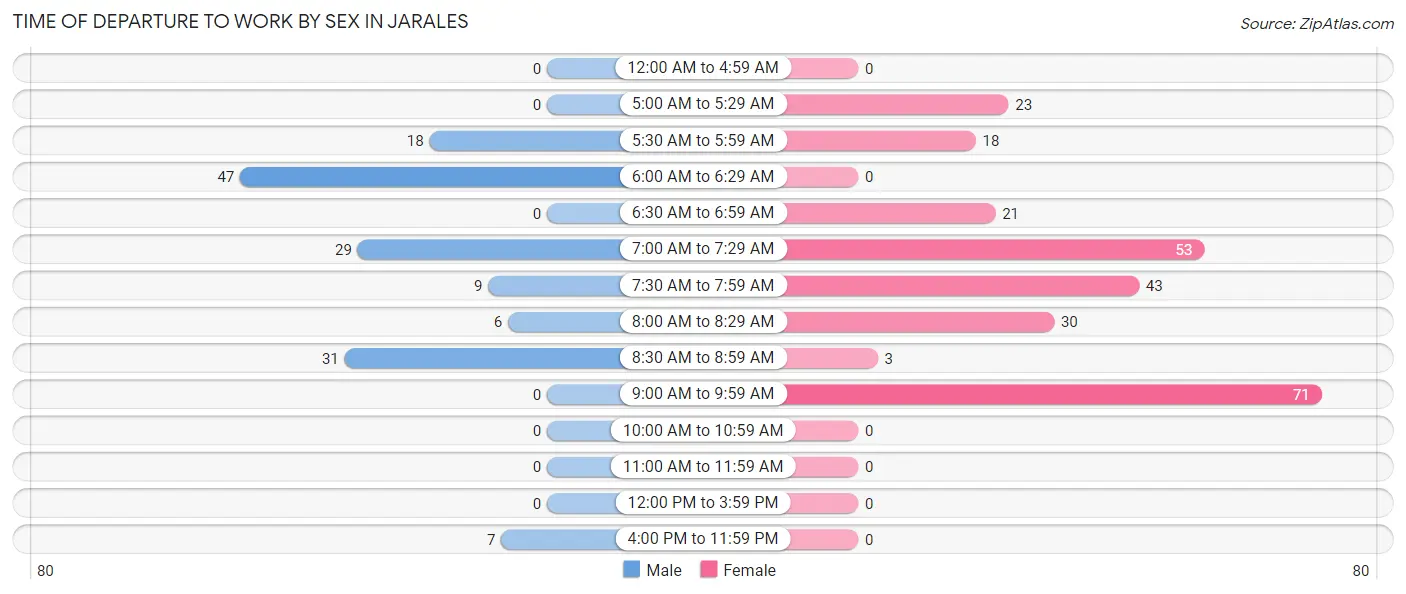
| Time of Departure | Male | Female |
| 12:00 AM to 4:59 AM | 0 (0.0%) | 0 (0.0%) |
| 5:00 AM to 5:29 AM | 0 (0.0%) | 23 (8.8%) |
| 5:30 AM to 5:59 AM | 18 (12.2%) | 18 (6.9%) |
| 6:00 AM to 6:29 AM | 47 (32.0%) | 0 (0.0%) |
| 6:30 AM to 6:59 AM | 0 (0.0%) | 21 (8.0%) |
| 7:00 AM to 7:29 AM | 29 (19.7%) | 53 (20.2%) |
| 7:30 AM to 7:59 AM | 9 (6.1%) | 43 (16.4%) |
| 8:00 AM to 8:29 AM | 6 (4.1%) | 30 (11.5%) |
| 8:30 AM to 8:59 AM | 31 (21.1%) | 3 (1.1%) |
| 9:00 AM to 9:59 AM | 0 (0.0%) | 71 (27.1%) |
| 10:00 AM to 10:59 AM | 0 (0.0%) | 0 (0.0%) |
| 11:00 AM to 11:59 AM | 0 (0.0%) | 0 (0.0%) |
| 12:00 PM to 3:59 PM | 0 (0.0%) | 0 (0.0%) |
| 4:00 PM to 11:59 PM | 7 (4.8%) | 0 (0.0%) |
| Total | 147 (100.0%) | 262 (100.0%) |
Housing Occupancy in Jarales
Occupancy by Ownership in Jarales
Of the total 835 dwellings in Jarales, owner-occupied units account for 723 (86.6%), while renter-occupied units make up 112 (13.4%).
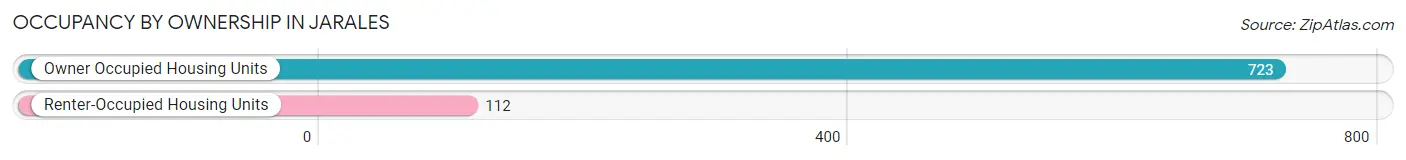
| Occupancy | # Housing Units | % Housing Units |
| Owner Occupied Housing Units | 723 | 86.6% |
| Renter-Occupied Housing Units | 112 | 13.4% |
| Total Occupied Housing Units | 835 | 100.0% |
Occupancy by Household Size in Jarales
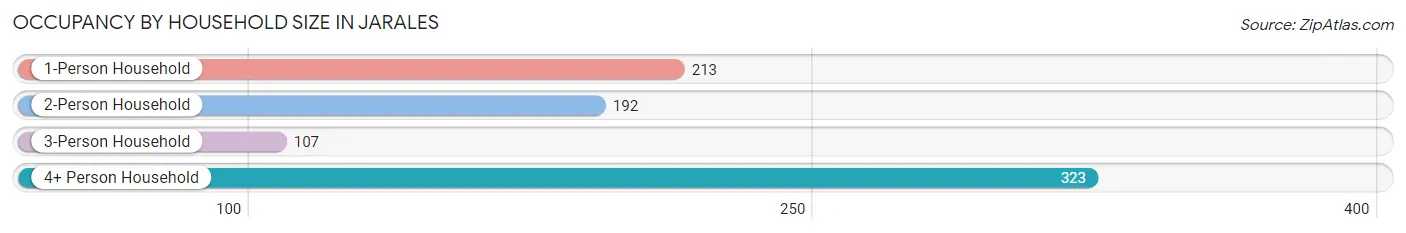
| Household Size | # Housing Units | % Housing Units |
| 1-Person Household | 213 | 25.5% |
| 2-Person Household | 192 | 23.0% |
| 3-Person Household | 107 | 12.8% |
| 4+ Person Household | 323 | 38.7% |
| Total Housing Units | 835 | 100.0% |
Occupancy by Ownership by Household Size in Jarales
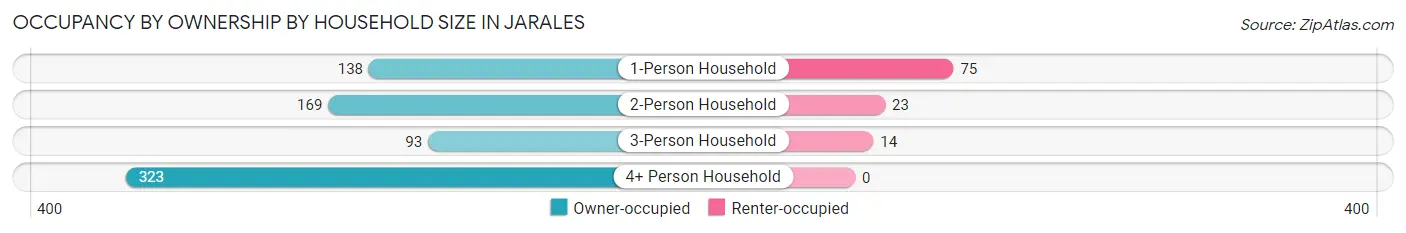
| Household Size | Owner-occupied | Renter-occupied |
| 1-Person Household | 138 (64.8%) | 75 (35.2%) |
| 2-Person Household | 169 (88.0%) | 23 (12.0%) |
| 3-Person Household | 93 (86.9%) | 14 (13.1%) |
| 4+ Person Household | 323 (100.0%) | 0 (0.0%) |
| Total Housing Units | 723 (86.6%) | 112 (13.4%) |
Occupancy by Educational Attainment in Jarales
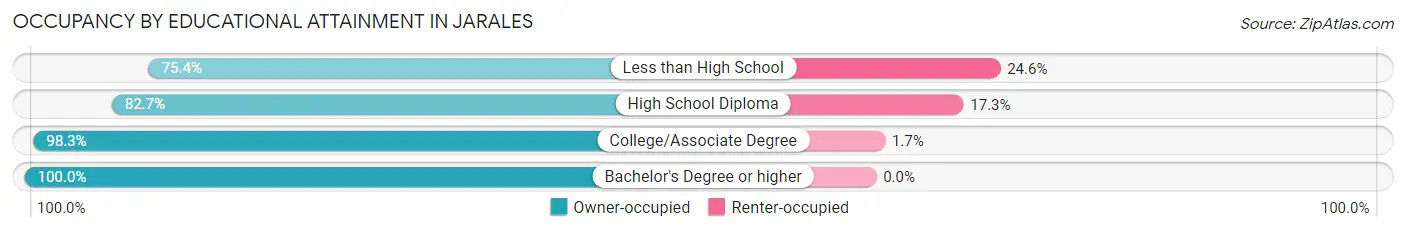
| Household Size | Owner-occupied | Renter-occupied |
| Less than High School | 95 (75.4%) | 31 (24.6%) |
| High School Diploma | 373 (82.7%) | 78 (17.3%) |
| College/Associate Degree | 169 (98.3%) | 3 (1.7%) |
| Bachelor's Degree or higher | 86 (100.0%) | 0 (0.0%) |
Occupancy by Age of Householder in Jarales
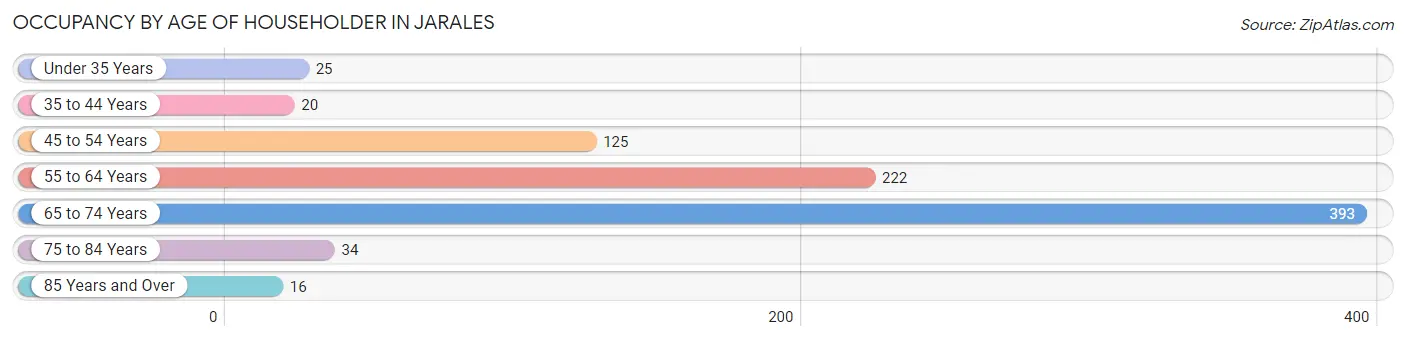
| Age Bracket | # Households | % Households |
| Under 35 Years | 25 | 3.0% |
| 35 to 44 Years | 20 | 2.4% |
| 45 to 54 Years | 125 | 15.0% |
| 55 to 64 Years | 222 | 26.6% |
| 65 to 74 Years | 393 | 47.1% |
| 75 to 84 Years | 34 | 4.1% |
| 85 Years and Over | 16 | 1.9% |
| Total | 835 | 100.0% |
Housing Finances in Jarales
Median Income by Occupancy in Jarales
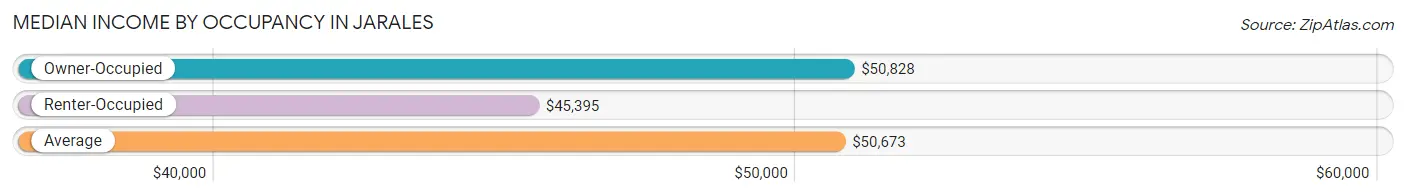
| Occupancy Type | # Households | Median Income |
| Owner-Occupied | 723 (86.6%) | $50,828 |
| Renter-Occupied | 112 (13.4%) | $45,395 |
| Average | 835 (100.0%) | $50,673 |
Occupancy by Householder Income Bracket in Jarales
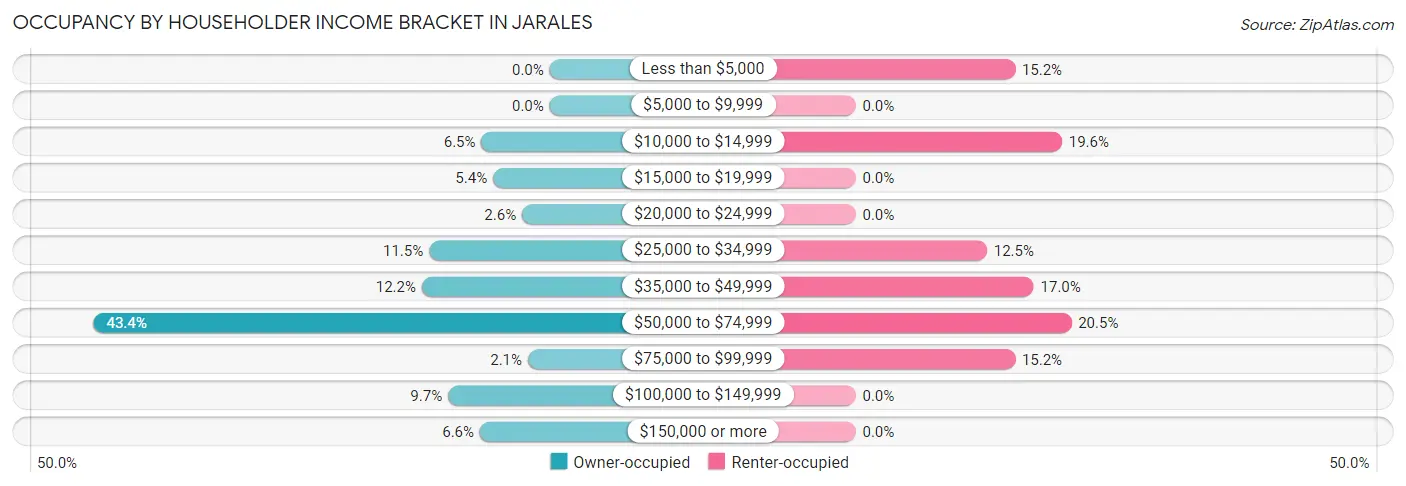
| Income Bracket | Owner-occupied | Renter-occupied |
| Less than $5,000 | 0 (0.0%) | 17 (15.2%) |
| $5,000 to $9,999 | 0 (0.0%) | 0 (0.0%) |
| $10,000 to $14,999 | 47 (6.5%) | 22 (19.6%) |
| $15,000 to $19,999 | 39 (5.4%) | 0 (0.0%) |
| $20,000 to $24,999 | 19 (2.6%) | 0 (0.0%) |
| $25,000 to $34,999 | 83 (11.5%) | 14 (12.5%) |
| $35,000 to $49,999 | 88 (12.2%) | 19 (17.0%) |
| $50,000 to $74,999 | 314 (43.4%) | 23 (20.5%) |
| $75,000 to $99,999 | 15 (2.1%) | 17 (15.2%) |
| $100,000 to $149,999 | 70 (9.7%) | 0 (0.0%) |
| $150,000 or more | 48 (6.6%) | 0 (0.0%) |
| Total | 723 (100.0%) | 112 (100.0%) |
Monthly Housing Cost Tiers in Jarales
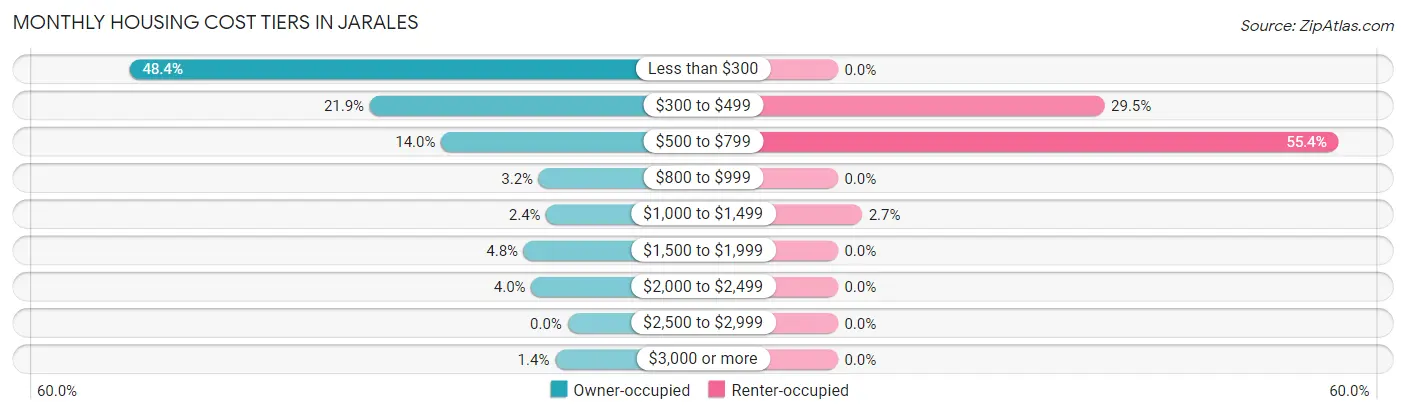
| Monthly Cost | Owner-occupied | Renter-occupied |
| Less than $300 | 350 (48.4%) | 0 (0.0%) |
| $300 to $499 | 158 (21.8%) | 33 (29.5%) |
| $500 to $799 | 101 (14.0%) | 62 (55.4%) |
| $800 to $999 | 23 (3.2%) | 0 (0.0%) |
| $1,000 to $1,499 | 17 (2.4%) | 3 (2.7%) |
| $1,500 to $1,999 | 35 (4.8%) | 0 (0.0%) |
| $2,000 to $2,499 | 29 (4.0%) | 0 (0.0%) |
| $2,500 to $2,999 | 0 (0.0%) | 0 (0.0%) |
| $3,000 or more | 10 (1.4%) | 0 (0.0%) |
| Total | 723 (100.0%) | 112 (100.0%) |
Physical Housing Characteristics in Jarales
Housing Structures in Jarales
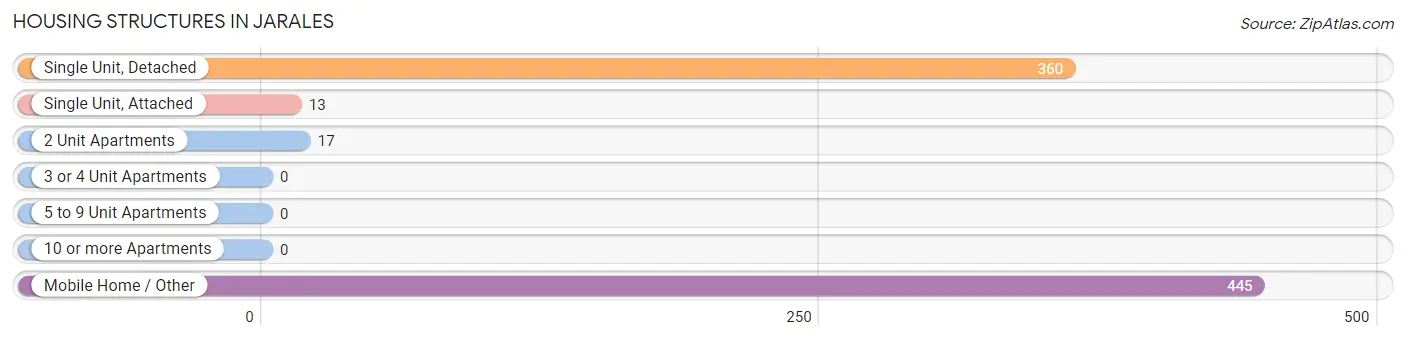
| Structure Type | # Housing Units | % Housing Units |
| Single Unit, Detached | 360 | 43.1% |
| Single Unit, Attached | 13 | 1.6% |
| 2 Unit Apartments | 17 | 2.0% |
| 3 or 4 Unit Apartments | 0 | 0.0% |
| 5 to 9 Unit Apartments | 0 | 0.0% |
| 10 or more Apartments | 0 | 0.0% |
| Mobile Home / Other | 445 | 53.3% |
| Total | 835 | 100.0% |
Housing Structures by Occupancy in Jarales
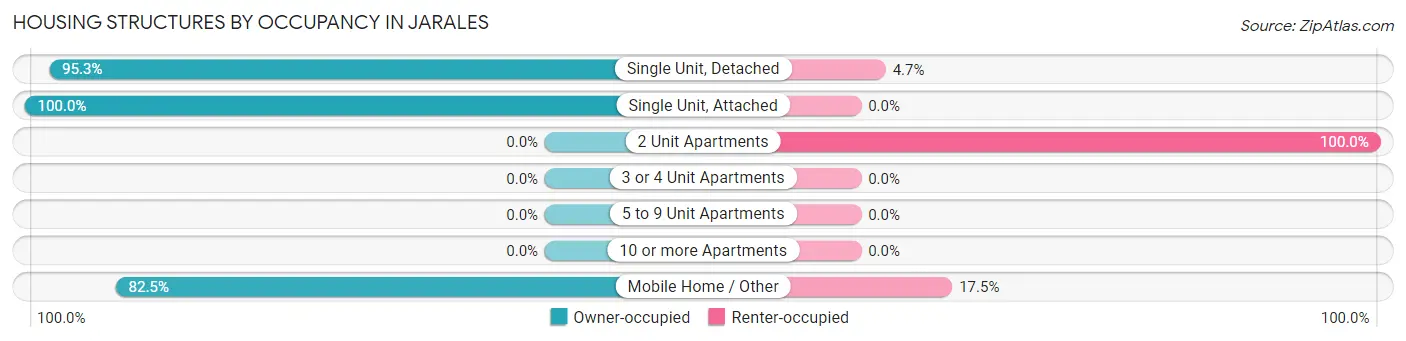
| Structure Type | Owner-occupied | Renter-occupied |
| Single Unit, Detached | 343 (95.3%) | 17 (4.7%) |
| Single Unit, Attached | 13 (100.0%) | 0 (0.0%) |
| 2 Unit Apartments | 0 (0.0%) | 17 (100.0%) |
| 3 or 4 Unit Apartments | 0 (0.0%) | 0 (0.0%) |
| 5 to 9 Unit Apartments | 0 (0.0%) | 0 (0.0%) |
| 10 or more Apartments | 0 (0.0%) | 0 (0.0%) |
| Mobile Home / Other | 367 (82.5%) | 78 (17.5%) |
| Total | 723 (86.6%) | 112 (13.4%) |
Housing Structures by Number of Rooms in Jarales
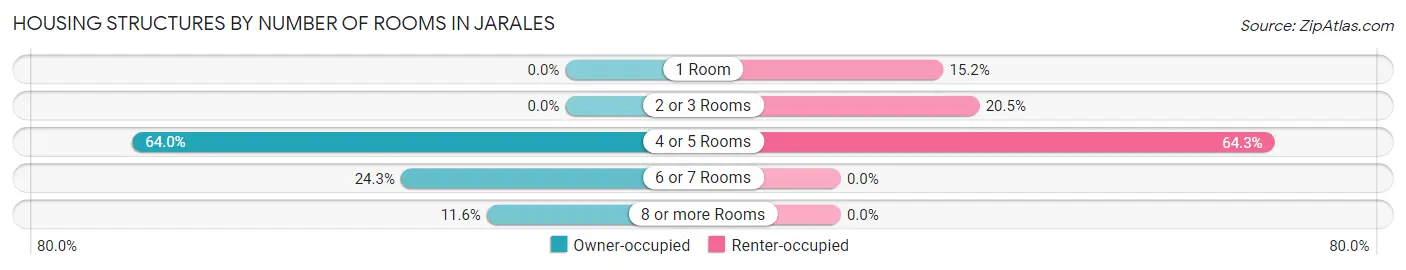
| Number of Rooms | Owner-occupied | Renter-occupied |
| 1 Room | 0 (0.0%) | 17 (15.2%) |
| 2 or 3 Rooms | 0 (0.0%) | 23 (20.5%) |
| 4 or 5 Rooms | 463 (64.0%) | 72 (64.3%) |
| 6 or 7 Rooms | 176 (24.3%) | 0 (0.0%) |
| 8 or more Rooms | 84 (11.6%) | 0 (0.0%) |
| Total | 723 (100.0%) | 112 (100.0%) |
Housing Structure by Heating Type in Jarales
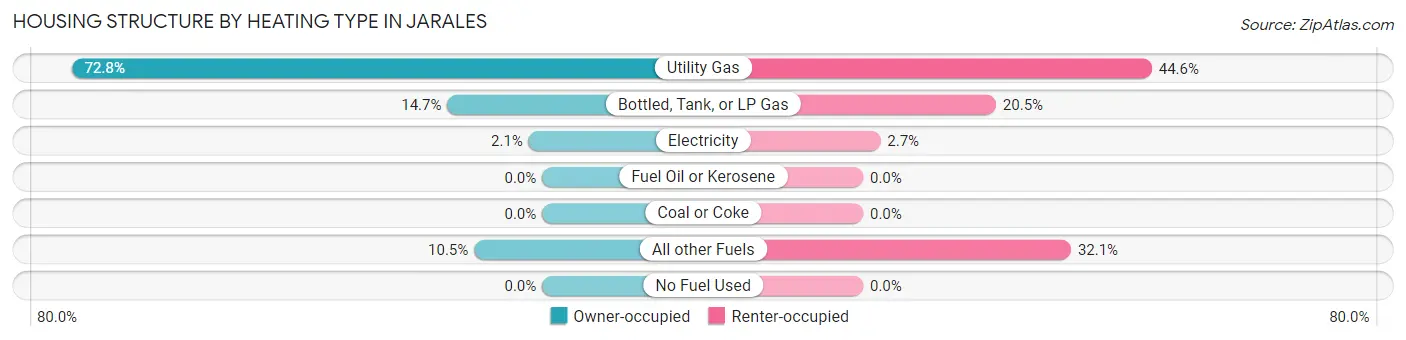
| Heating Type | Owner-occupied | Renter-occupied |
| Utility Gas | 526 (72.8%) | 50 (44.6%) |
| Bottled, Tank, or LP Gas | 106 (14.7%) | 23 (20.5%) |
| Electricity | 15 (2.1%) | 3 (2.7%) |
| Fuel Oil or Kerosene | 0 (0.0%) | 0 (0.0%) |
| Coal or Coke | 0 (0.0%) | 0 (0.0%) |
| All other Fuels | 76 (10.5%) | 36 (32.1%) |
| No Fuel Used | 0 (0.0%) | 0 (0.0%) |
| Total | 723 (100.0%) | 112 (100.0%) |
Household Vehicle Usage in Jarales
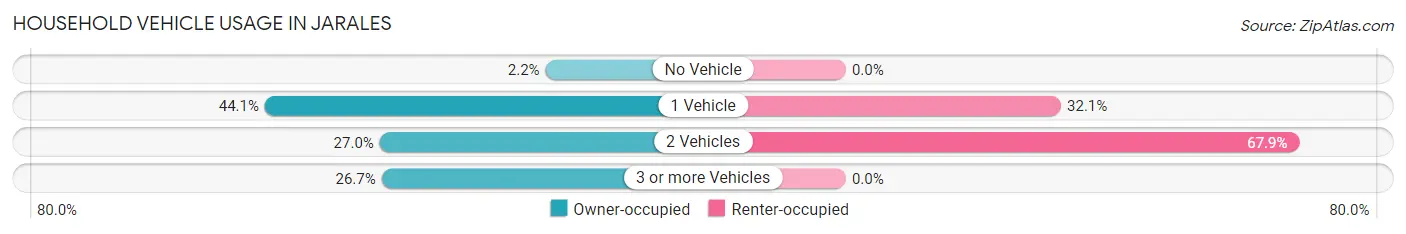
| Vehicles per Household | Owner-occupied | Renter-occupied |
| No Vehicle | 16 (2.2%) | 0 (0.0%) |
| 1 Vehicle | 319 (44.1%) | 36 (32.1%) |
| 2 Vehicles | 195 (27.0%) | 76 (67.9%) |
| 3 or more Vehicles | 193 (26.7%) | 0 (0.0%) |
| Total | 723 (100.0%) | 112 (100.0%) |
Real Estate & Mortgages in Jarales
Real Estate and Mortgage Overview in Jarales
| Characteristic | Without Mortgage | With Mortgage |
| Housing Units | 617 | 106 |
| Median Property Value | - | - |
| Median Household Income | $50,664 | $42 |
| Monthly Housing Costs | $274 | $10 |
| Real Estate Taxes | - | - |
Property Value by Mortgage Status in Jarales
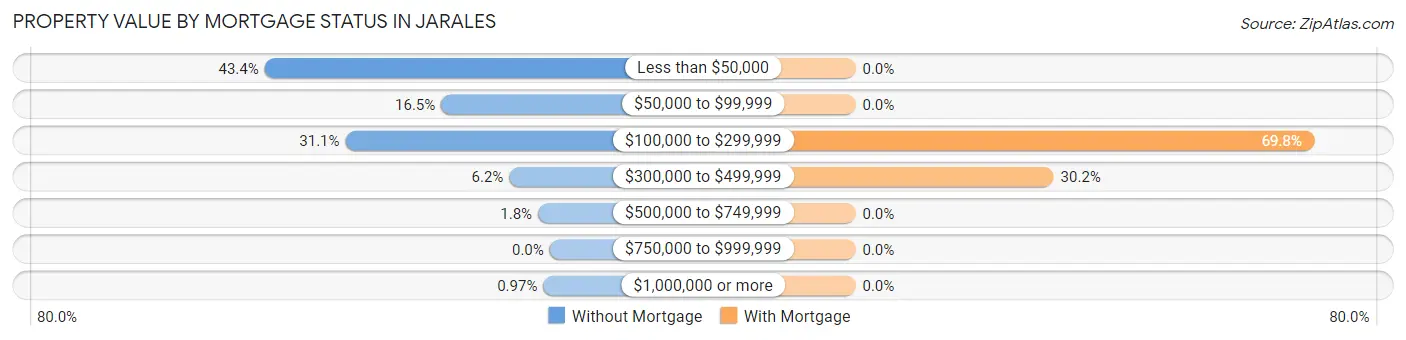
| Property Value | Without Mortgage | With Mortgage |
| Less than $50,000 | 268 (43.4%) | 0 (0.0%) |
| $50,000 to $99,999 | 102 (16.5%) | 0 (0.0%) |
| $100,000 to $299,999 | 192 (31.1%) | 74 (69.8%) |
| $300,000 to $499,999 | 38 (6.2%) | 32 (30.2%) |
| $500,000 to $749,999 | 11 (1.8%) | 0 (0.0%) |
| $750,000 to $999,999 | 0 (0.0%) | 0 (0.0%) |
| $1,000,000 or more | 6 (1.0%) | 0 (0.0%) |
| Total | 617 (100.0%) | 106 (100.0%) |
Household Income by Mortgage Status in Jarales
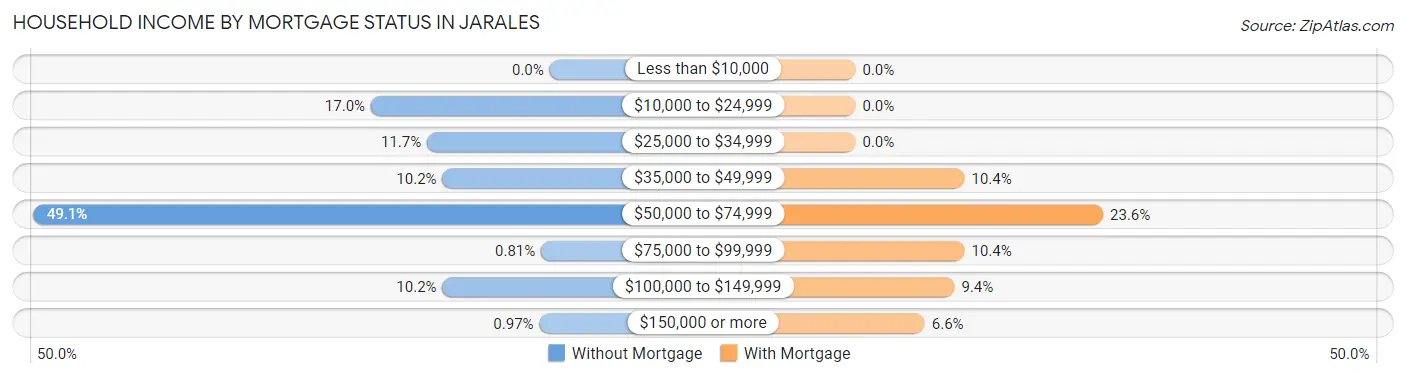
| Household Income | Without Mortgage | With Mortgage |
| Less than $10,000 | 0 (0.0%) | 0 (0.0%) |
| $10,000 to $24,999 | 105 (17.0%) | 0 (0.0%) |
| $25,000 to $34,999 | 72 (11.7%) | 0 (0.0%) |
| $35,000 to $49,999 | 63 (10.2%) | 11 (10.4%) |
| $50,000 to $74,999 | 303 (49.1%) | 25 (23.6%) |
| $75,000 to $99,999 | 5 (0.8%) | 11 (10.4%) |
| $100,000 to $149,999 | 63 (10.2%) | 10 (9.4%) |
| $150,000 or more | 6 (1.0%) | 7 (6.6%) |
| Total | 617 (100.0%) | 106 (100.0%) |
Property Value to Household Income Ratio in Jarales
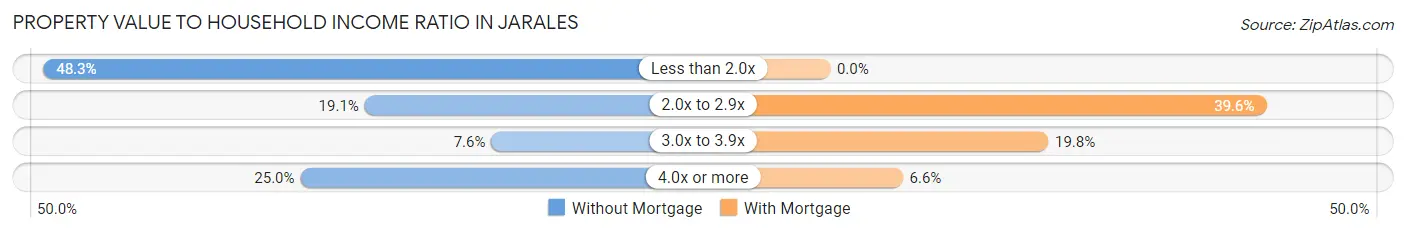
| Value-to-Income Ratio | Without Mortgage | With Mortgage |
| Less than 2.0x | 298 (48.3%) | 0 (0.0%) |
| 2.0x to 2.9x | 118 (19.1%) | 42 (39.6%) |
| 3.0x to 3.9x | 47 (7.6%) | 21 (19.8%) |
| 4.0x or more | 154 (25.0%) | 7 (6.6%) |
| Total | 617 (100.0%) | 106 (100.0%) |
Real Estate Taxes by Mortgage Status in Jarales
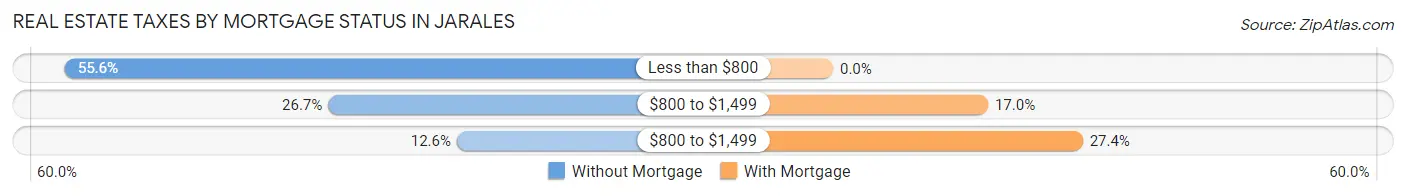
| Property Taxes | Without Mortgage | With Mortgage |
| Less than $800 | 343 (55.6%) | 0 (0.0%) |
| $800 to $1,499 | 165 (26.7%) | 18 (17.0%) |
| $800 to $1,499 | 78 (12.6%) | 29 (27.4%) |
| Total | 617 (100.0%) | 106 (100.0%) |
Health & Disability in Jarales
Health Insurance Coverage by Age in Jarales
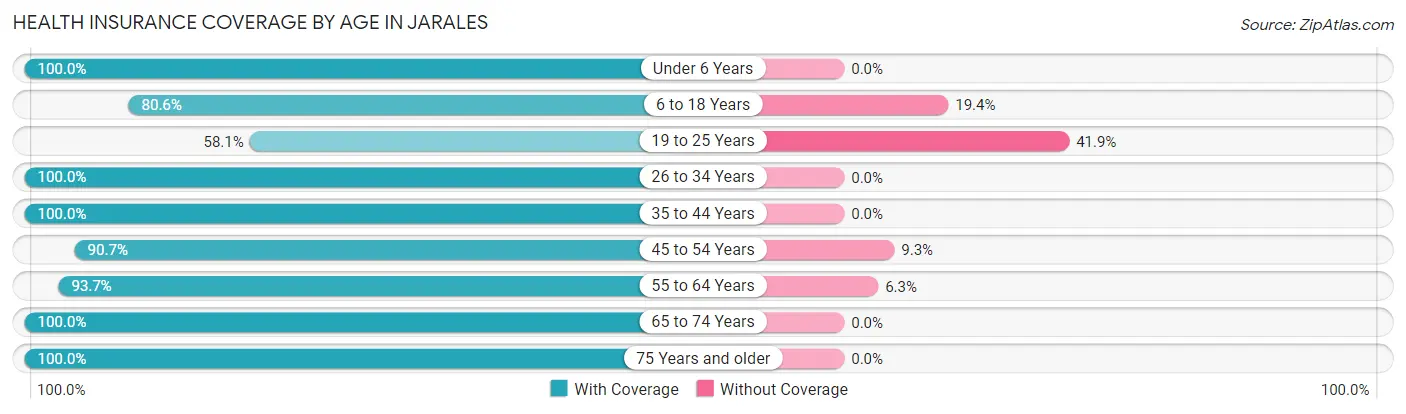
| Age Bracket | With Coverage | Without Coverage |
| Under 6 Years | 56 (100.0%) | 0 (0.0%) |
| 6 to 18 Years | 187 (80.6%) | 45 (19.4%) |
| 19 to 25 Years | 18 (58.1%) | 13 (41.9%) |
| 26 to 34 Years | 82 (100.0%) | 0 (0.0%) |
| 35 to 44 Years | 52 (100.0%) | 0 (0.0%) |
| 45 to 54 Years | 165 (90.7%) | 17 (9.3%) |
| 55 to 64 Years | 445 (93.7%) | 30 (6.3%) |
| 65 to 74 Years | 456 (100.0%) | 0 (0.0%) |
| 75 Years and older | 124 (100.0%) | 0 (0.0%) |
| Total | 1,585 (93.8%) | 105 (6.2%) |
Health Insurance Coverage by Citizenship Status in Jarales
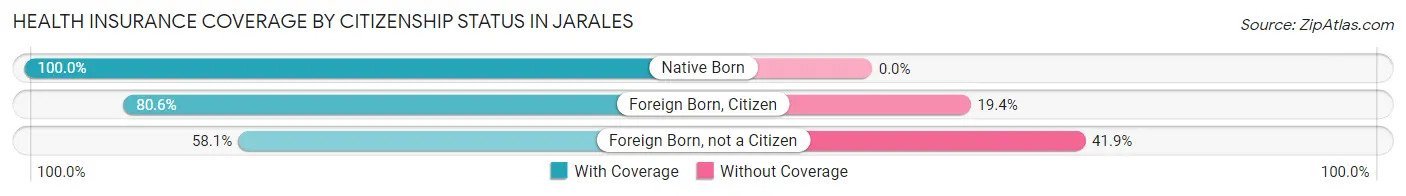
| Citizenship Status | With Coverage | Without Coverage |
| Native Born | 56 (100.0%) | 0 (0.0%) |
| Foreign Born, Citizen | 187 (80.6%) | 45 (19.4%) |
| Foreign Born, not a Citizen | 18 (58.1%) | 13 (41.9%) |
Health Insurance Coverage by Household Income in Jarales

| Household Income | With Coverage | Without Coverage |
| Under $25,000 | 144 (100.0%) | 0 (0.0%) |
| $25,000 to $49,999 | 514 (94.5%) | 30 (5.5%) |
| $50,000 to $74,999 | 479 (92.5%) | 39 (7.5%) |
| $75,000 to $99,999 | 54 (100.0%) | 0 (0.0%) |
| $100,000 and over | 394 (91.6%) | 36 (8.4%) |
Public vs Private Health Insurance Coverage by Age in Jarales
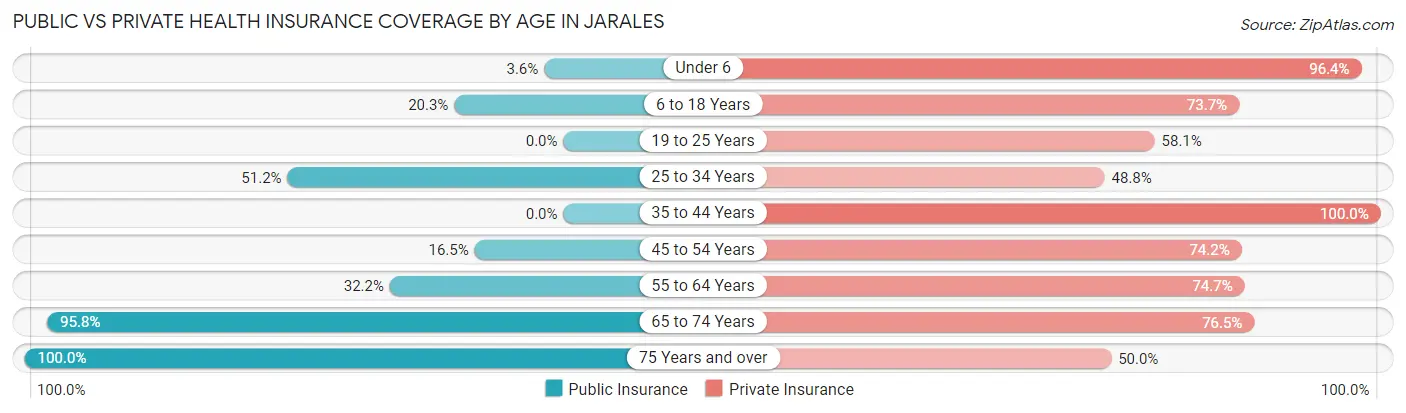
| Age Bracket | Public Insurance | Private Insurance |
| Under 6 | 2 (3.6%) | 54 (96.4%) |
| 6 to 18 Years | 47 (20.3%) | 171 (73.7%) |
| 19 to 25 Years | 0 (0.0%) | 18 (58.1%) |
| 25 to 34 Years | 42 (51.2%) | 40 (48.8%) |
| 35 to 44 Years | 0 (0.0%) | 52 (100.0%) |
| 45 to 54 Years | 30 (16.5%) | 135 (74.2%) |
| 55 to 64 Years | 153 (32.2%) | 355 (74.7%) |
| 65 to 74 Years | 437 (95.8%) | 349 (76.5%) |
| 75 Years and over | 124 (100.0%) | 62 (50.0%) |
| Total | 835 (49.4%) | 1,236 (73.1%) |
Disability Status by Sex by Age in Jarales
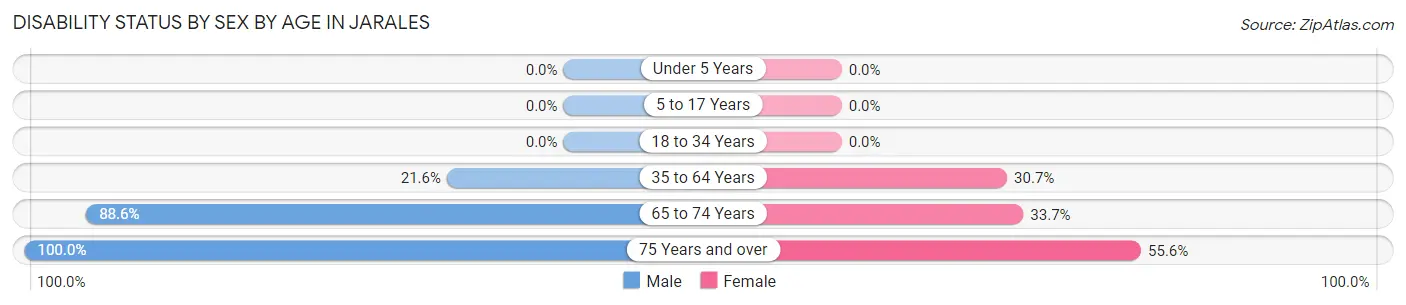
| Age Bracket | Male | Female |
| Under 5 Years | 0 (0.0%) | 0 (0.0%) |
| 5 to 17 Years | 0 (0.0%) | 0 (0.0%) |
| 18 to 34 Years | 0 (0.0%) | 0 (0.0%) |
| 35 to 64 Years | 66 (21.6%) | 124 (30.7%) |
| 65 to 74 Years | 325 (88.6%) | 30 (33.7%) |
| 75 Years and over | 61 (100.0%) | 35 (55.6%) |
Disability Class by Sex by Age in Jarales
Disability Class: Hearing Difficulty
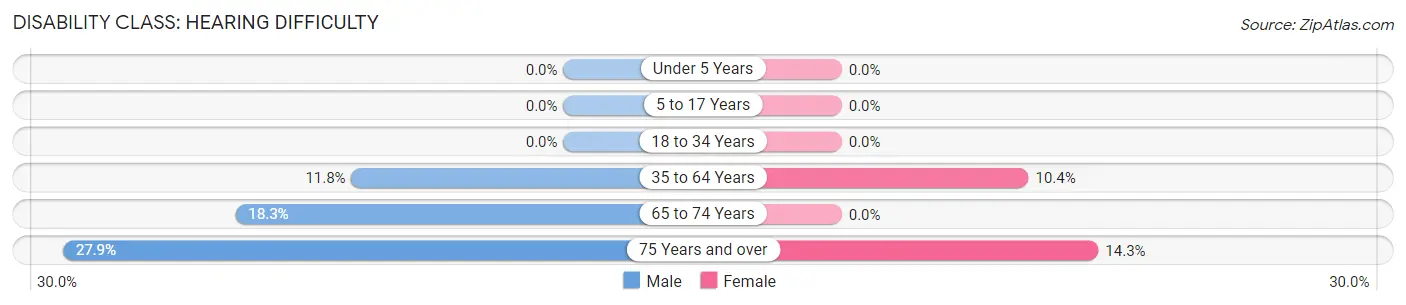
| Age Bracket | Male | Female |
| Under 5 Years | 0 (0.0%) | 0 (0.0%) |
| 5 to 17 Years | 0 (0.0%) | 0 (0.0%) |
| 18 to 34 Years | 0 (0.0%) | 0 (0.0%) |
| 35 to 64 Years | 36 (11.8%) | 42 (10.4%) |
| 65 to 74 Years | 67 (18.3%) | 0 (0.0%) |
| 75 Years and over | 17 (27.9%) | 9 (14.3%) |
Disability Class: Vision Difficulty
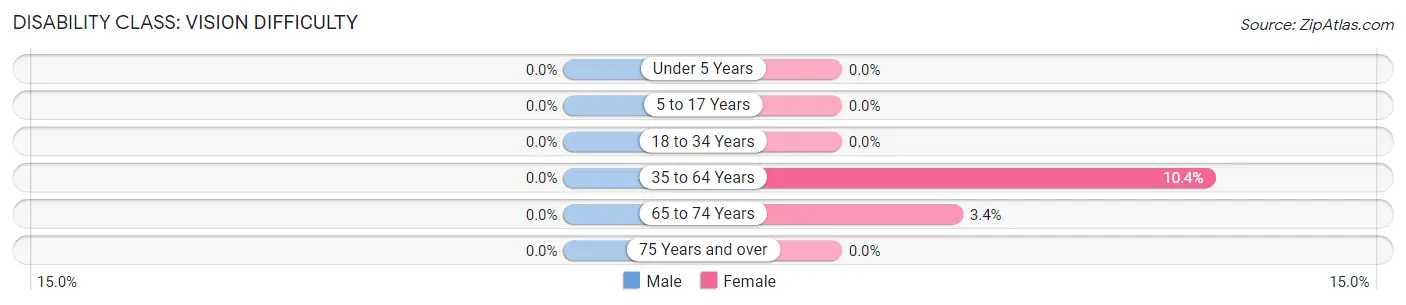
| Age Bracket | Male | Female |
| Under 5 Years | 0 (0.0%) | 0 (0.0%) |
| 5 to 17 Years | 0 (0.0%) | 0 (0.0%) |
| 18 to 34 Years | 0 (0.0%) | 0 (0.0%) |
| 35 to 64 Years | 0 (0.0%) | 42 (10.4%) |
| 65 to 74 Years | 0 (0.0%) | 3 (3.4%) |
| 75 Years and over | 0 (0.0%) | 0 (0.0%) |
Disability Class: Cognitive Difficulty
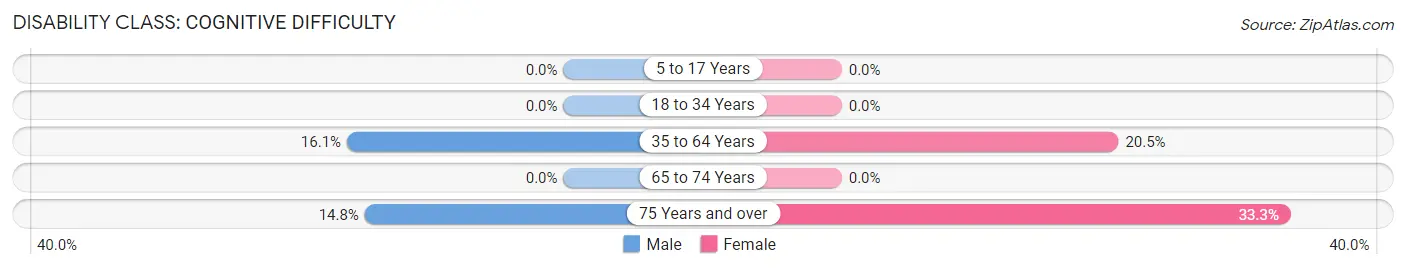
| Age Bracket | Male | Female |
| 5 to 17 Years | 0 (0.0%) | 0 (0.0%) |
| 18 to 34 Years | 0 (0.0%) | 0 (0.0%) |
| 35 to 64 Years | 49 (16.1%) | 83 (20.5%) |
| 65 to 74 Years | 0 (0.0%) | 0 (0.0%) |
| 75 Years and over | 9 (14.7%) | 21 (33.3%) |
Disability Class: Ambulatory Difficulty
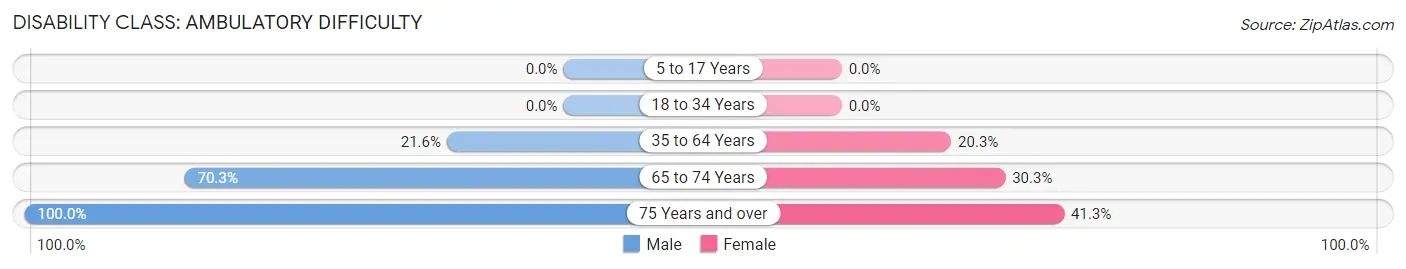
| Age Bracket | Male | Female |
| 5 to 17 Years | 0 (0.0%) | 0 (0.0%) |
| 18 to 34 Years | 0 (0.0%) | 0 (0.0%) |
| 35 to 64 Years | 66 (21.6%) | 82 (20.3%) |
| 65 to 74 Years | 258 (70.3%) | 27 (30.3%) |
| 75 Years and over | 61 (100.0%) | 26 (41.3%) |
Disability Class: Self-Care Difficulty
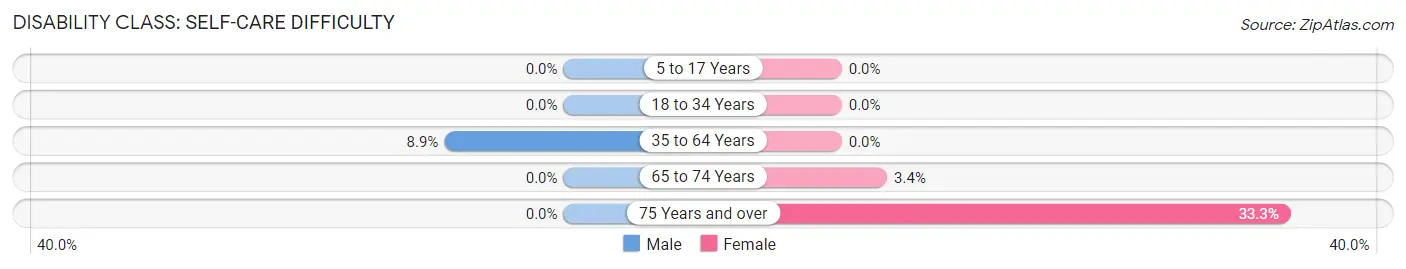
| Age Bracket | Male | Female |
| 5 to 17 Years | 0 (0.0%) | 0 (0.0%) |
| 18 to 34 Years | 0 (0.0%) | 0 (0.0%) |
| 35 to 64 Years | 27 (8.8%) | 0 (0.0%) |
| 65 to 74 Years | 0 (0.0%) | 3 (3.4%) |
| 75 Years and over | 0 (0.0%) | 21 (33.3%) |
Technology Access in Jarales
Computing Device Access in Jarales
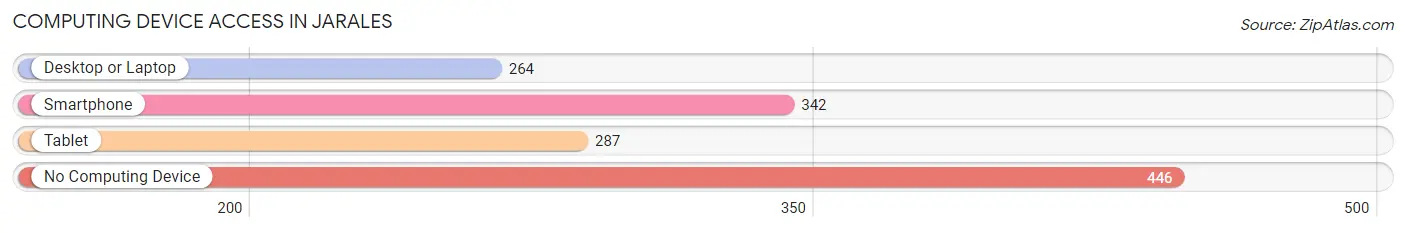
| Device Type | # Households | % Households |
| Desktop or Laptop | 264 | 31.6% |
| Smartphone | 342 | 41.0% |
| Tablet | 287 | 34.4% |
| No Computing Device | 446 | 53.4% |
| Total | 835 | 100.0% |
Internet Access in Jarales
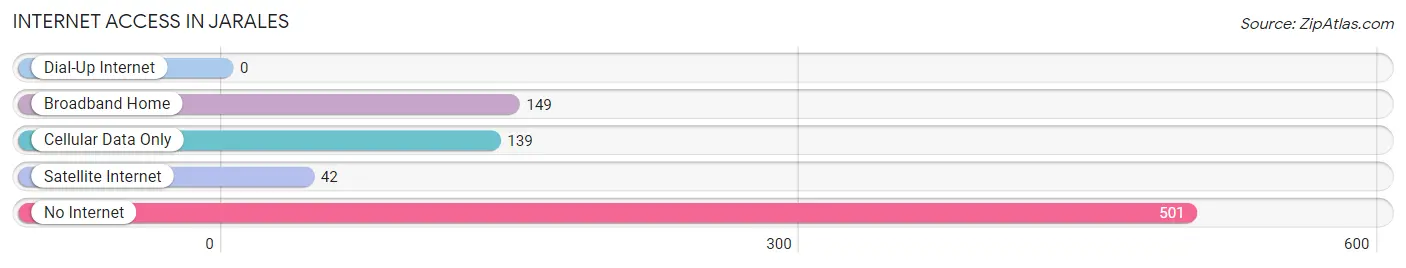
| Internet Type | # Households | % Households |
| Dial-Up Internet | 0 | 0.0% |
| Broadband Home | 149 | 17.8% |
| Cellular Data Only | 139 | 16.7% |
| Satellite Internet | 42 | 5.0% |
| No Internet | 501 | 60.0% |
| Total | 835 | 100.0% |
Jarales Summary
Jarales, New Mexico is a small unincorporated community located in Valencia County, New Mexico. It is situated in the Rio Grande Valley, approximately 25 miles south of Albuquerque. The population of Jarales was estimated to be 1,072 in 2019.
History
Jarales was founded in the late 1800s by a group of settlers from Spain. The settlers were attracted to the area due to its fertile soil and abundant water supply. The town was originally called “Jarales de la Loma”, which translates to “hills of Jarales”. The name was later shortened to simply “Jarales”.
The town was initially a farming community, with the main crops being corn, wheat, and alfalfa. In the early 1900s, the town began to grow and develop. A post office was established in 1910, and a school was built in 1912. The town also had a general store, a blacksmith shop, and a few other businesses.
In the 1950s, the town began to decline as many of the residents moved away in search of better economic opportunities. The population of Jarales decreased from 1,500 in 1950 to just over 1,000 in 2019.
Geography
Jarales is located in the Rio Grande Valley, approximately 25 miles south of Albuquerque. The town is situated at an elevation of 4,400 feet above sea level. The climate in Jarales is semi-arid, with hot summers and mild winters.
The town is surrounded by agricultural land, with the main crops being corn, wheat, and alfalfa. The Rio Grande River is located just to the east of Jarales, providing a source of irrigation for the surrounding farms.
Economy
The economy of Jarales is largely based on agriculture. The main crops grown in the area are corn, wheat, and alfalfa. The town also has a few small businesses, including a general store, a gas station, and a few restaurants.
The town is also home to a few manufacturing companies, including a furniture factory and a plastics factory. These companies provide employment opportunities for the residents of Jarales.
Demographics
The population of Jarales was estimated to be 1,072 in 2019. The town is predominantly Hispanic, with over 90% of the population identifying as Hispanic or Latino. The median household income in Jarales is $30,000, which is lower than the national average.
The town has a high poverty rate, with over 40% of the population living below the poverty line. The unemployment rate in Jarales is also higher than the national average, at 8.2%.
Conclusion
Jarales, New Mexico is a small unincorporated community located in Valencia County, New Mexico. The town was founded in the late 1800s by a group of settlers from Spain and has since grown into a small agricultural community. The town has a predominantly Hispanic population, with over 90% of the population identifying as Hispanic or Latino. The economy of Jarales is largely based on agriculture, with the main crops being corn, wheat, and alfalfa. The town also has a few small businesses, including a general store, a gas station, and a few restaurants. The population of Jarales was estimated to be 1,072 in 2019, with a median household income of $30,000 and a high poverty rate.
Common Questions
What is Per Capita Income in Jarales?
Per Capita income in Jarales is $30,104.
What is the Median Family Income in Jarales?
Median Family Income in Jarales is $51,240.
What is the Median Household income in Jarales?
Median Household Income in Jarales is $50,673.
What is Income or Wage Gap in Jarales?
Income or Wage Gap in Jarales is 45.0%.
Women in Jarales earn 55.0 cents for every dollar earned by a man.
What is Inequality or Gini Index in Jarales?
Inequality or Gini Index in Jarales is 0.40.
What is the Total Population of Jarales?
Total Population of Jarales is 1,690.
What is the Total Male Population of Jarales?
Total Male Population of Jarales is 894.
What is the Total Female Population of Jarales?
Total Female Population of Jarales is 796.
What is the Ratio of Males per 100 Females in Jarales?
There are 112.31 Males per 100 Females in Jarales.
What is the Ratio of Females per 100 Males in Jarales?
There are 89.04 Females per 100 Males in Jarales.
What is the Median Population Age in Jarales?
Median Population Age in Jarales is 59.5 Years.
What is the Average Family Size in Jarales
Average Family Size in Jarales is 2.4 People.
What is the Average Household Size in Jarales
Average Household Size in Jarales is 2.0 People.
How Large is the Labor Force in Jarales?
There are 558 People in the Labor Forcein in Jarales.
What is the Percentage of People in the Labor Force in Jarales?
37.6% of People are in the Labor Force in Jarales.
What is the Unemployment Rate in Jarales?
Unemployment Rate in Jarales is 11.4%.