Mesita, NM Map & Demographics
Mesita Map
Mesita Overview
$23,077
PER CAPITA INCOME
$49,719
AVG HOUSEHOLD INCOME
0.47
INEQUALITY / GINI INDEX
1,270
TOTAL POPULATION
708
MALE POPULATION
562
FEMALE POPULATION
125.98
MALES / 100 FEMALES
79.38
FEMALES / 100 MALES
27.4
MEDIAN AGE
7.1
AVG FAMILY SIZE
6.1
AVG HOUSEHOLD SIZE
499
LABOR FORCE [ PEOPLE ]
57.4%
PERCENT IN LABOR FORCE
5.6%
UNEMPLOYMENT RATE
Mesita Area Codes
Income in Mesita
Income Overview in Mesita
| Characteristic | Number | Measure |
| Per Capita Income | 1,270 | $23,077 |
| Median Family Income | 173 | $0 |
| Mean Family Income | 173 | $107,190 |
| Median Household Income | 205 | $49,719 |
| Mean Household Income | 205 | $92,566 |
| Income Deficit | 173 | $0 |
| Wage / Income Gap (%) | 1,270 | 0.00% |
| Wage / Income Gap ($) | 1,270 | 100.00¢ per $1 |
| Gini / Inequality Index | 1,270 | 0.47 |
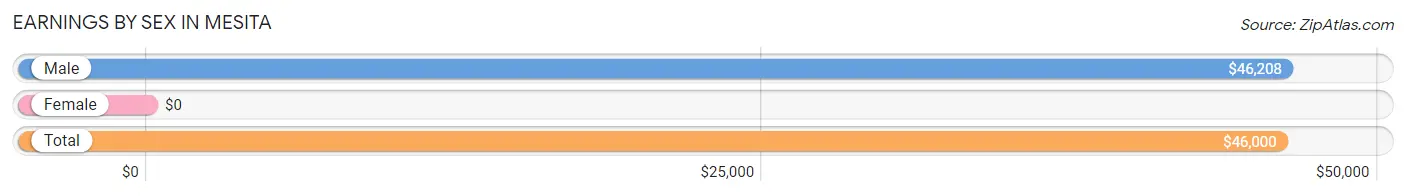
Earnings by Sex in Mesita
| Sex | Number | Average Earnings |
| Male | 268 (52.8%) | $46,208 |
| Female | 240 (47.2%) | $0 |
| Total | 508 (100.0%) | $46,000 |
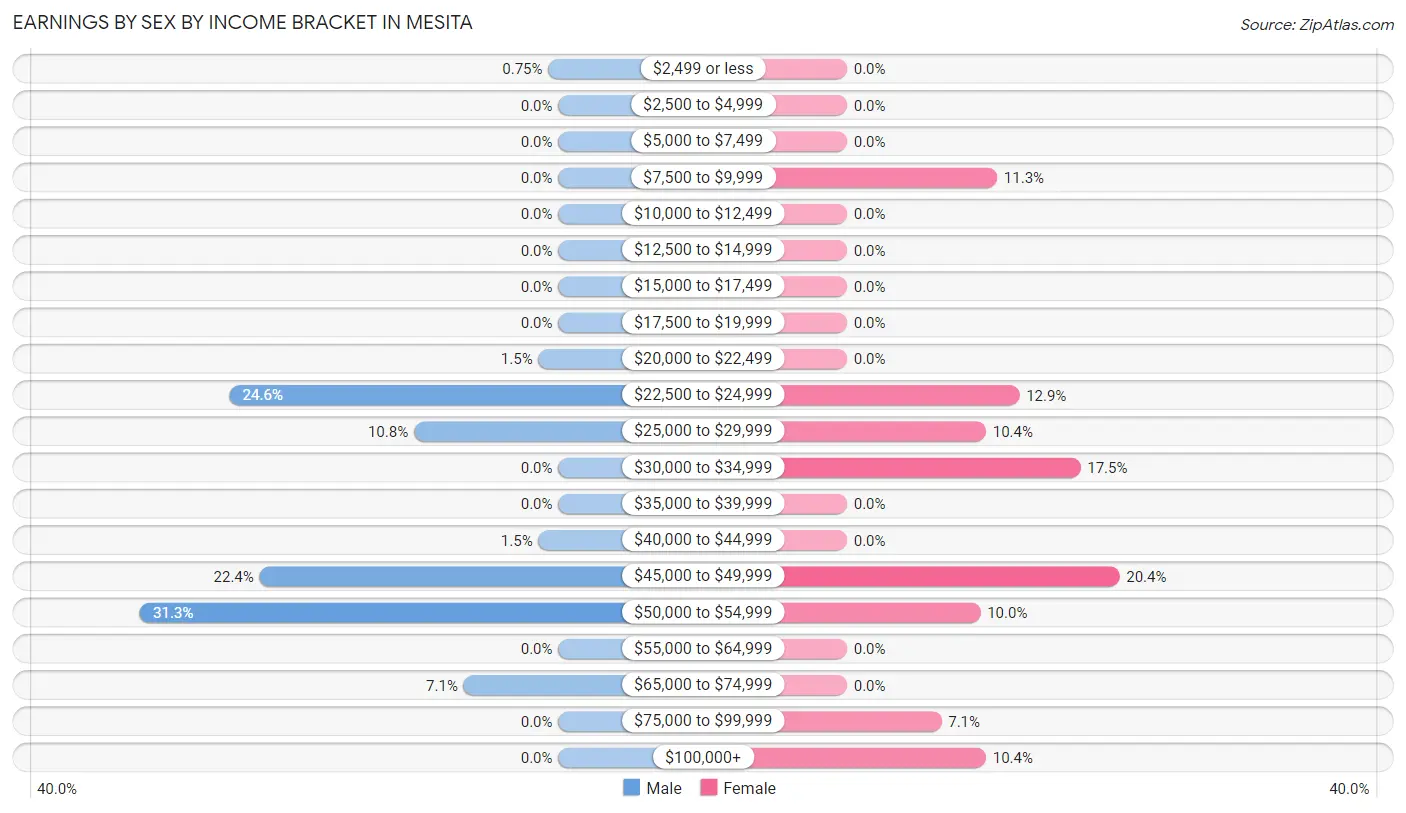
Earnings by Sex by Income Bracket in Mesita
The most common earnings brackets in Mesita are $50,000 to $54,999 for men (84 | 31.3%) and $45,000 to $49,999 for women (49 | 20.4%).
| Income | Male | Female |
| $2,499 or less | 2 (0.7%) | 0 (0.0%) |
| $2,500 to $4,999 | 0 (0.0%) | 0 (0.0%) |
| $5,000 to $7,499 | 0 (0.0%) | 0 (0.0%) |
| $7,500 to $9,999 | 0 (0.0%) | 27 (11.3%) |
| $10,000 to $12,499 | 0 (0.0%) | 0 (0.0%) |
| $12,500 to $14,999 | 0 (0.0%) | 0 (0.0%) |
| $15,000 to $17,499 | 0 (0.0%) | 0 (0.0%) |
| $17,500 to $19,999 | 0 (0.0%) | 0 (0.0%) |
| $20,000 to $22,499 | 4 (1.5%) | 0 (0.0%) |
| $22,500 to $24,999 | 66 (24.6%) | 31 (12.9%) |
| $25,000 to $29,999 | 29 (10.8%) | 25 (10.4%) |
| $30,000 to $34,999 | 0 (0.0%) | 42 (17.5%) |
| $35,000 to $39,999 | 0 (0.0%) | 0 (0.0%) |
| $40,000 to $44,999 | 4 (1.5%) | 0 (0.0%) |
| $45,000 to $49,999 | 60 (22.4%) | 49 (20.4%) |
| $50,000 to $54,999 | 84 (31.3%) | 24 (10.0%) |
| $55,000 to $64,999 | 0 (0.0%) | 0 (0.0%) |
| $65,000 to $74,999 | 19 (7.1%) | 0 (0.0%) |
| $75,000 to $99,999 | 0 (0.0%) | 17 (7.1%) |
| $100,000+ | 0 (0.0%) | 25 (10.4%) |
| Total | 268 (100.0%) | 240 (100.0%) |
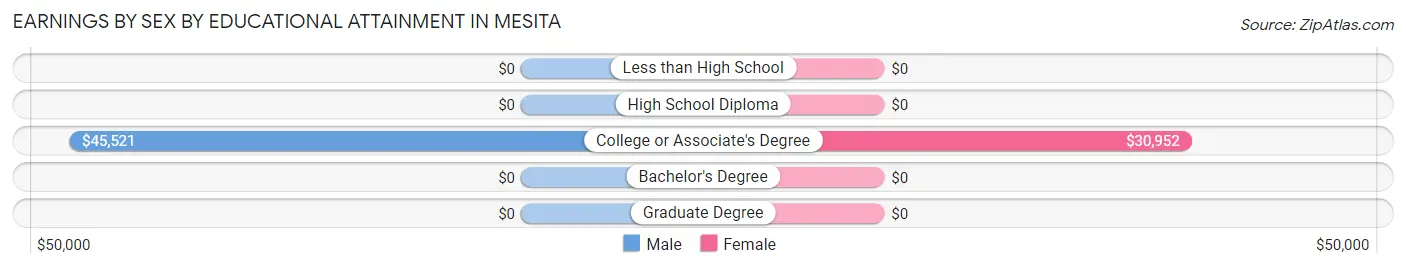
Earnings by Sex by Educational Attainment in Mesita
Average earnings in Mesita are $29,224 for men and $31,667 for women, a difference of 7.7%. Men with an educational attainment of college or associate's degree enjoy the highest average annual earnings of $45,521, while those with college or associate's degree education earn the least with $45,521. Women with an educational attainment of college or associate's degree earn the most with the average annual earnings of $30,952, while those with college or associate's degree education have the smallest earnings of $30,952.
| Educational Attainment | Male Income | Female Income |
| Less than High School | - | - |
| High School Diploma | - | - |
| College or Associate's Degree | $45,521 | $30,952 |
| Bachelor's Degree | - | - |
| Graduate Degree | - | - |
| Total | $29,224 | $31,667 |
Family Income in Mesita
Family Income Brackets in Mesita
According to the Mesita family income data, there are 76 families falling into the $35,000 to $49,999 income range, which is the most common income bracket and makes up 43.9% of all families.
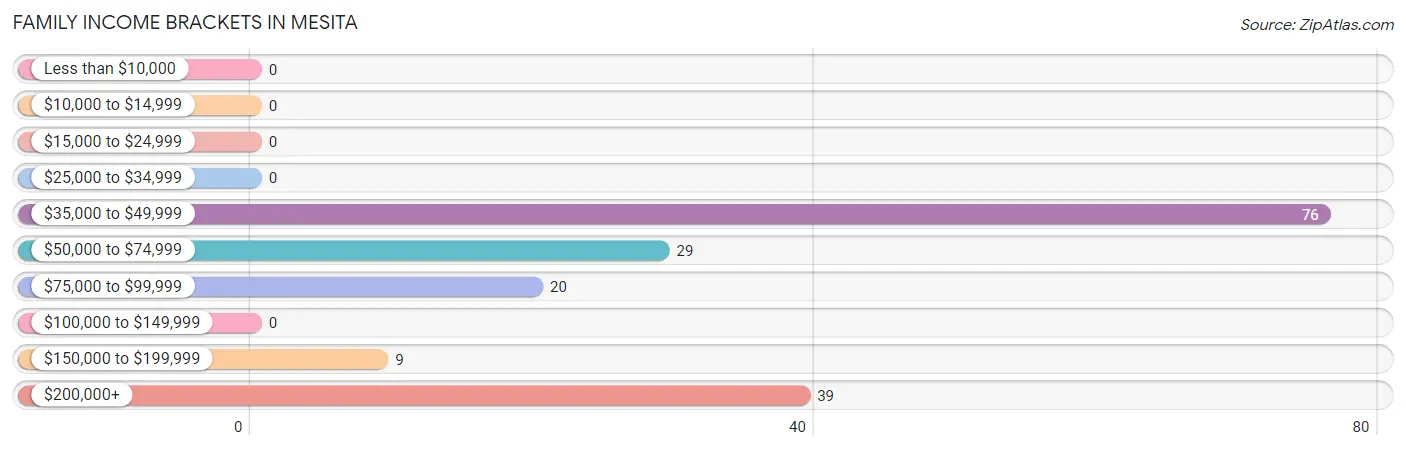
| Income Bracket | # Families | % Families |
| Less than $10,000 | 0 | 0.0% |
| $10,000 to $14,999 | 0 | 0.0% |
| $15,000 to $24,999 | 0 | 0.0% |
| $25,000 to $34,999 | 0 | 0.0% |
| $35,000 to $49,999 | 76 | 43.9% |
| $50,000 to $74,999 | 29 | 16.8% |
| $75,000 to $99,999 | 20 | 11.6% |
| $100,000 to $149,999 | 0 | 0.0% |
| $150,000 to $199,999 | 9 | 5.2% |
| $200,000+ | 39 | 22.5% |
Family Income by Famaliy Size in Mesita
| Income Bracket | # Families | Median Income |
| 2-Person Families | 29 (16.8%) | $0 |
| 3-Person Families | 45 (26.0%) | $0 |
| 4-Person Families | 0 (0.0%) | $0 |
| 5-Person Families | 60 (34.7%) | $0 |
| 6-Person Families | 0 (0.0%) | $0 |
| 7+ Person Families | 39 (22.5%) | $0 |
| Total | 173 (100.0%) | $0 |
Family Income by Number of Earners in Mesita
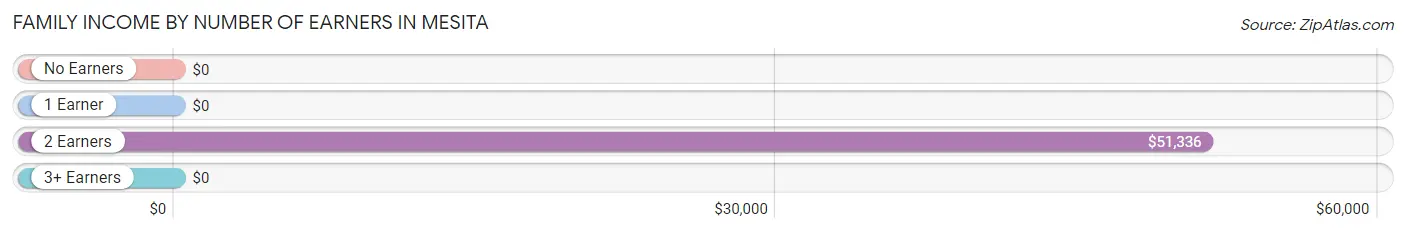
| Number of Earners | # Families | Median Income |
| No Earners | 0 (0.0%) | $0 |
| 1 Earner | 69 (39.9%) | $0 |
| 2 Earners | 85 (49.1%) | $51,336 |
| 3+ Earners | 19 (11.0%) | $0 |
| Total | 173 (100.0%) | $0 |
Household Income in Mesita
Household Income Brackets in Mesita
With 76 households falling in the category, the $35,000 to $49,999 income range is the most frequent in Mesita, accounting for 37.1% of all households.
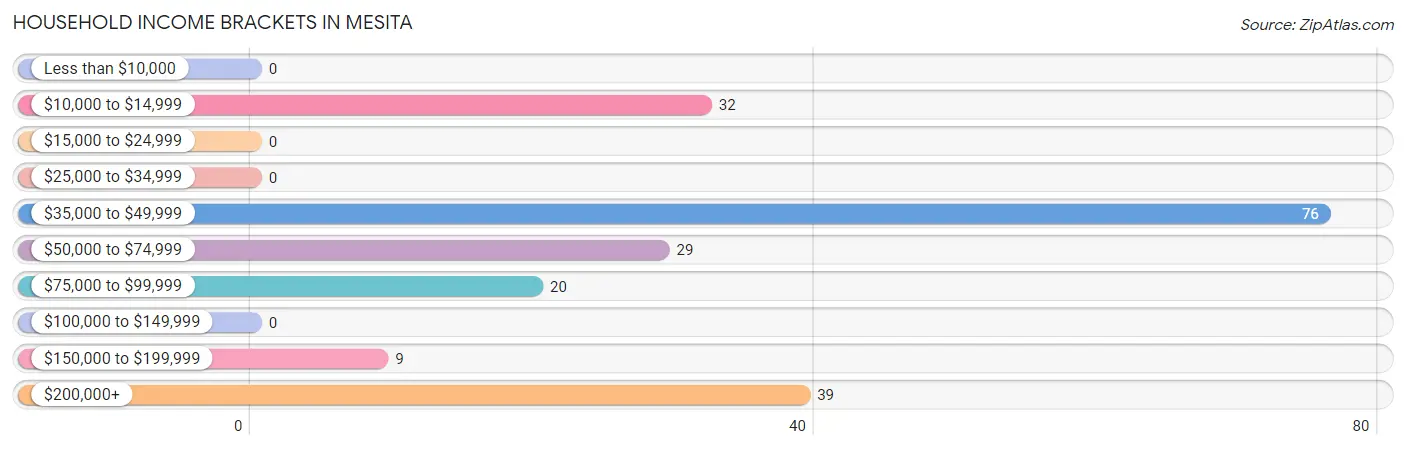
| Income Bracket | # Households | % Households |
| Less than $10,000 | 0 | 0.0% |
| $10,000 to $14,999 | 32 | 15.6% |
| $15,000 to $24,999 | 0 | 0.0% |
| $25,000 to $34,999 | 0 | 0.0% |
| $35,000 to $49,999 | 76 | 37.1% |
| $50,000 to $74,999 | 29 | 14.1% |
| $75,000 to $99,999 | 20 | 9.8% |
| $100,000 to $149,999 | 0 | 0.0% |
| $150,000 to $199,999 | 9 | 4.4% |
| $200,000+ | 39 | 19.0% |
Household Income by Householder Age in Mesita
| Income Bracket | # Households | Median Income |
| 15 to 24 Years | 18 (8.8%) | $0 |
| 25 to 44 Years | 29 (14.1%) | $0 |
| 45 to 64 Years | 86 (41.9%) | $0 |
| 65+ Years | 72 (35.1%) | $0 |
| Total | 205 (100.0%) | $49,719 |
Poverty in Mesita
Income Below Poverty by Sex and Age in Mesita
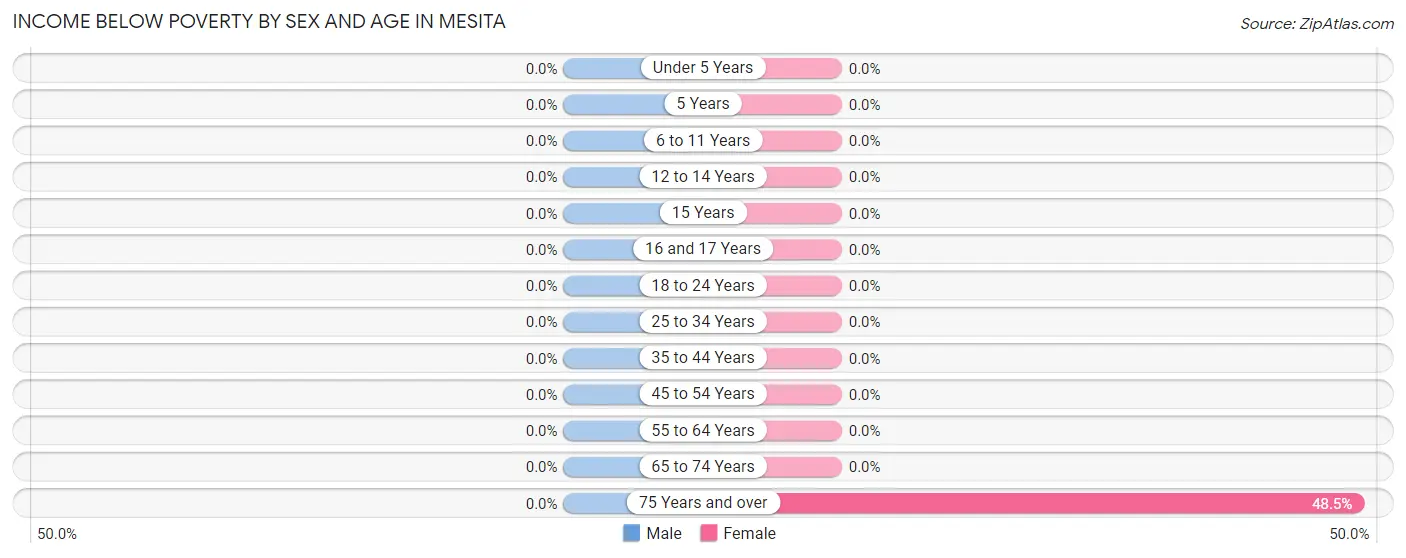
| Age Bracket | Male | Female |
| Under 5 Years | 0 (0.0%) | 0 (0.0%) |
| 5 Years | 0 (0.0%) | 0 (0.0%) |
| 6 to 11 Years | 0 (0.0%) | 0 (0.0%) |
| 12 to 14 Years | 0 (0.0%) | 0 (0.0%) |
| 15 Years | 0 (0.0%) | 0 (0.0%) |
| 16 and 17 Years | 0 (0.0%) | 0 (0.0%) |
| 18 to 24 Years | 0 (0.0%) | 0 (0.0%) |
| 25 to 34 Years | 0 (0.0%) | 0 (0.0%) |
| 35 to 44 Years | 0 (0.0%) | 0 (0.0%) |
| 45 to 54 Years | 0 (0.0%) | 0 (0.0%) |
| 55 to 64 Years | 0 (0.0%) | 0 (0.0%) |
| 65 to 74 Years | 0 (0.0%) | 0 (0.0%) |
| 75 Years and over | 0 (0.0%) | 32 (48.5%) |
| Total | 0 (0.0%) | 32 (5.7%) |
Income Above Poverty by Sex and Age in Mesita
According to the poverty statistics in Mesita, males aged under 5 years and females aged 6 to 11 years are the age groups that are most secure financially, with 100.0% of males and 100.0% of females in these age groups living above the poverty line.
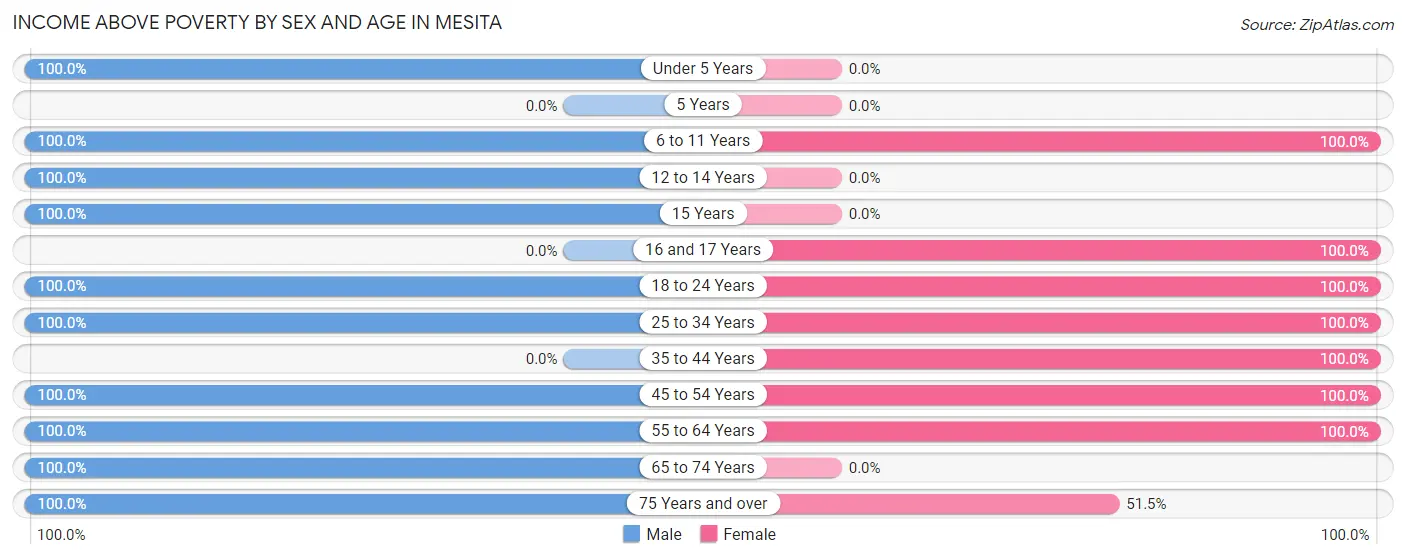
| Age Bracket | Male | Female |
| Under 5 Years | 97 (100.0%) | 0 (0.0%) |
| 5 Years | 0 (0.0%) | 0 (0.0%) |
| 6 to 11 Years | 97 (100.0%) | 107 (100.0%) |
| 12 to 14 Years | 69 (100.0%) | 0 (0.0%) |
| 15 Years | 31 (100.0%) | 0 (0.0%) |
| 16 and 17 Years | 0 (0.0%) | 1 (100.0%) |
| 18 to 24 Years | 112 (100.0%) | 45 (100.0%) |
| 25 to 34 Years | 29 (100.0%) | 134 (100.0%) |
| 35 to 44 Years | 0 (0.0%) | 89 (100.0%) |
| 45 to 54 Years | 157 (100.0%) | 27 (100.0%) |
| 55 to 64 Years | 39 (100.0%) | 93 (100.0%) |
| 65 to 74 Years | 33 (100.0%) | 0 (0.0%) |
| 75 Years and over | 31 (100.0%) | 34 (51.5%) |
| Total | 695 (100.0%) | 530 (94.3%) |
Income Below Poverty Among Married-Couple Families in Mesita
| Children | Above Poverty | Below Poverty |
| No Children | 29 (100.0%) | 0 (0.0%) |
| 1 or 2 Children | 58 (100.0%) | 0 (0.0%) |
| 3 or 4 Children | 20 (100.0%) | 0 (0.0%) |
| 5 or more Children | 19 (100.0%) | 0 (0.0%) |
| Total | 126 (100.0%) | 0 (0.0%) |
Income Below Poverty Among Single-Parent Households in Mesita
| Children | Single Father | Single Mother |
| No Children | 0 (0.0%) | 0 (0.0%) |
| 1 or 2 Children | 0 (0.0%) | 0 (0.0%) |
| 3 or 4 Children | 0 (0.0%) | 0 (0.0%) |
| 5 or more Children | 0 (0.0%) | 0 (0.0%) |
| Total | 0 (0.0%) | 0 (0.0%) |
Income Below Poverty Among Married-Couple vs Single-Parent Households in Mesita
| Children | Married-Couple Families | Single-Parent Households |
| No Children | 0 (0.0%) | 0 (0.0%) |
| 1 or 2 Children | 0 (0.0%) | 0 (0.0%) |
| 3 or 4 Children | 0 (0.0%) | 0 (0.0%) |
| 5 or more Children | 0 (0.0%) | 0 (0.0%) |
| Total | 0 (0.0%) | 0 (0.0%) |
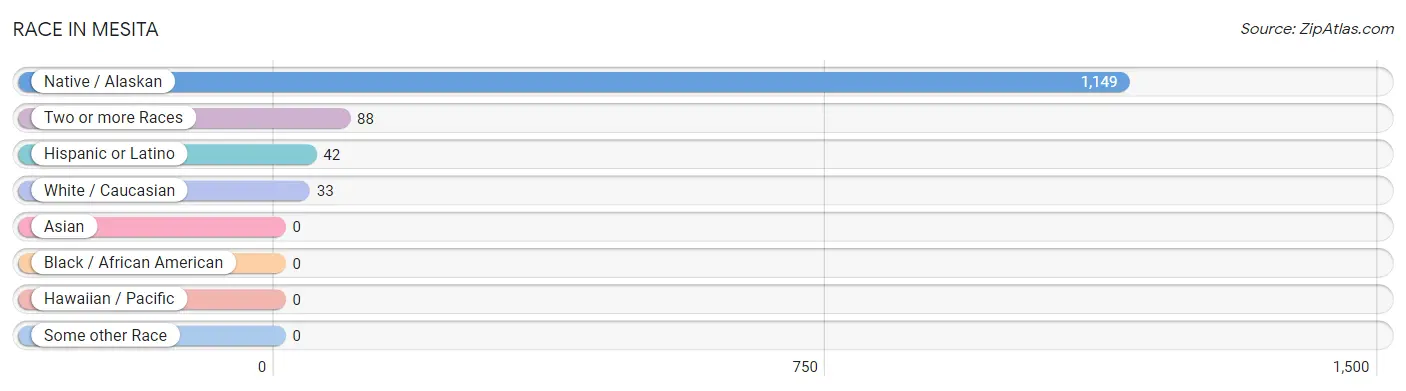
Race in Mesita
The most populous races in Mesita are Native / Alaskan (1,149 | 90.5%), Two or more Races (88 | 6.9%), and Hispanic or Latino (42 | 3.3%).
| Race | # Population | % Population |
| Asian | 0 | 0.0% |
| Black / African American | 0 | 0.0% |
| Hawaiian / Pacific | 0 | 0.0% |
| Hispanic or Latino | 42 | 3.3% |
| Native / Alaskan | 1,149 | 90.5% |
| White / Caucasian | 33 | 2.6% |
| Two or more Races | 88 | 6.9% |
| Some other Race | 0 | 0.0% |
| Total | 1,270 | 100.0% |
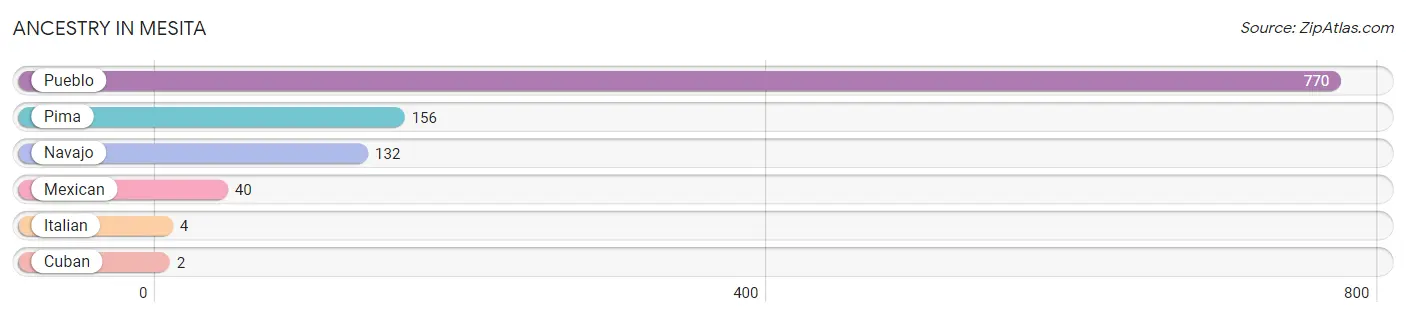
Ancestry in Mesita
The most populous ancestries reported in Mesita are Pueblo (770 | 60.6%), Pima (156 | 12.3%), Navajo (132 | 10.4%), Mexican (40 | 3.2%), and Italian (4 | 0.3%), together accounting for 86.8% of all Mesita residents.
| Ancestry | # Population | % Population |
| Cuban | 2 | 0.2% |
| Italian | 4 | 0.3% |
| Mexican | 40 | 3.2% |
| Navajo | 132 | 10.4% |
| Pima | 156 | 12.3% |
| Pueblo | 770 | 60.6% | View All 6 Rows |
Immigrants in Mesita

| Immigration Origin | # Population | % Population | View All 0 Rows |
Sex and Age in Mesita
Sex and Age in Mesita
The most populous age groups in Mesita are 45 to 49 Years (106 | 15.0%) for men and 25 to 29 Years (92 | 16.4%) for women.
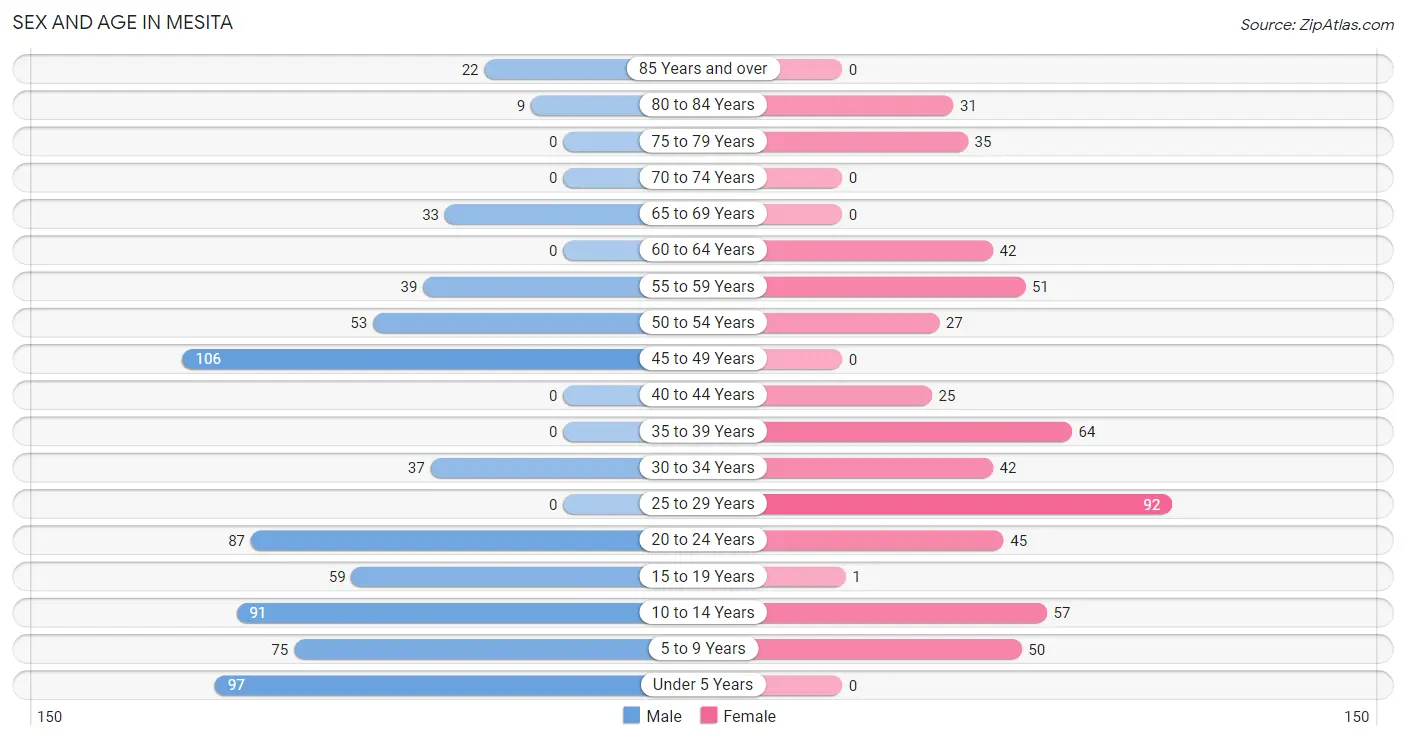
| Age Bracket | Male | Female |
| Under 5 Years | 97 (13.7%) | 0 (0.0%) |
| 5 to 9 Years | 75 (10.6%) | 50 (8.9%) |
| 10 to 14 Years | 91 (12.9%) | 57 (10.1%) |
| 15 to 19 Years | 59 (8.3%) | 1 (0.2%) |
| 20 to 24 Years | 87 (12.3%) | 45 (8.0%) |
| 25 to 29 Years | 0 (0.0%) | 92 (16.4%) |
| 30 to 34 Years | 37 (5.2%) | 42 (7.5%) |
| 35 to 39 Years | 0 (0.0%) | 64 (11.4%) |
| 40 to 44 Years | 0 (0.0%) | 25 (4.4%) |
| 45 to 49 Years | 106 (15.0%) | 0 (0.0%) |
| 50 to 54 Years | 53 (7.5%) | 27 (4.8%) |
| 55 to 59 Years | 39 (5.5%) | 51 (9.1%) |
| 60 to 64 Years | 0 (0.0%) | 42 (7.5%) |
| 65 to 69 Years | 33 (4.7%) | 0 (0.0%) |
| 70 to 74 Years | 0 (0.0%) | 0 (0.0%) |
| 75 to 79 Years | 0 (0.0%) | 35 (6.2%) |
| 80 to 84 Years | 9 (1.3%) | 31 (5.5%) |
| 85 Years and over | 22 (3.1%) | 0 (0.0%) |
| Total | 708 (100.0%) | 562 (100.0%) |
Families and Households in Mesita
Median Family Size in Mesita
The median family size in Mesita is 7.08 persons per family, with married-couple families (126 | 72.8%) accounting for the largest median family size of 8.48 persons per family. On the other hand, single male/father families (29 | 16.8%) represent the smallest median family size with 2.07 persons per family.
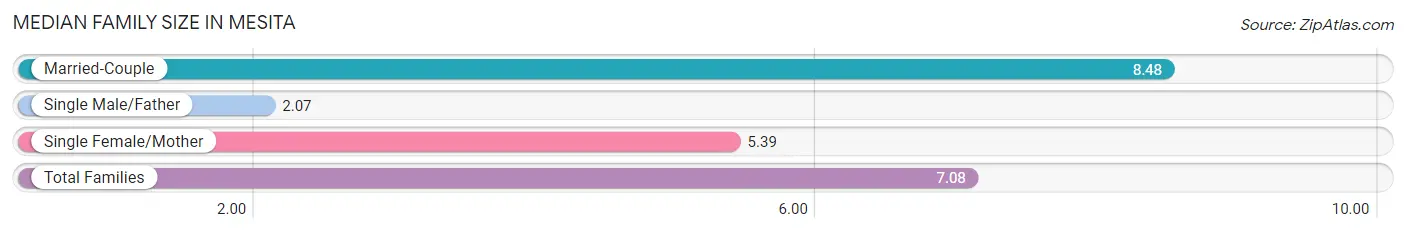
| Family Type | # Families | Family Size |
| Married-Couple | 126 (72.8%) | 8.48 |
| Single Male/Father | 29 (16.8%) | 2.07 |
| Single Female/Mother | 18 (10.4%) | 5.39 |
| Total Families | 173 (100.0%) | 7.08 |
Median Household Size in Mesita
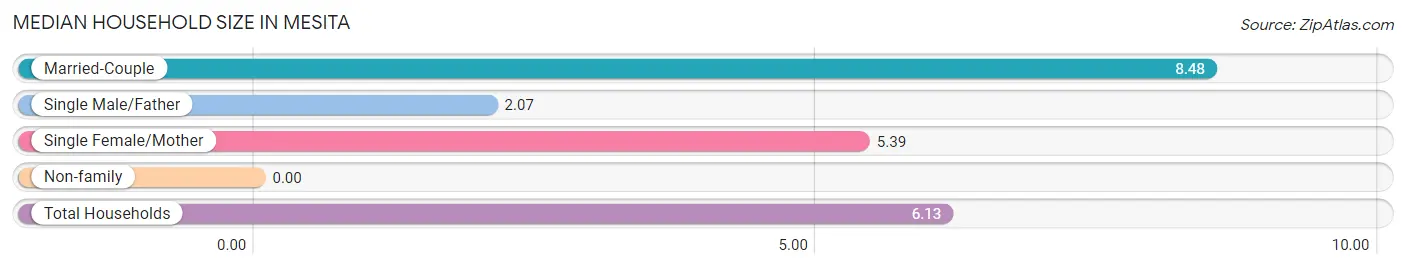
| Household Type | # Households | Household Size |
| Married-Couple | 126 (61.5%) | 8.48 |
| Single Male/Father | 29 (14.1%) | 2.07 |
| Single Female/Mother | 18 (8.8%) | 5.39 |
| Non-family | 32 (15.6%) | - |
| Total Households | 205 (100.0%) | 6.13 |
Household Size by Marriage Status in Mesita
Out of a total of 205 households in Mesita, 173 (84.4%) are family households, while 32 (15.6%) are nonfamily households. The most numerous type of family households are 5-person households, comprising 60, and the most common type of nonfamily households are 1-person households, comprising 32.
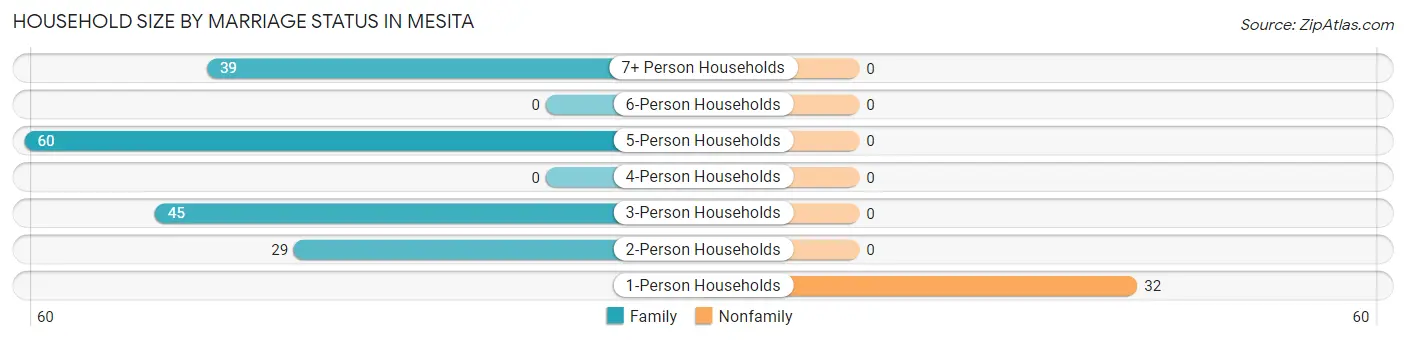
| Household Size | Family Households | Nonfamily Households |
| 1-Person Households | - | 32 (15.6%) |
| 2-Person Households | 29 (14.1%) | 0 (0.0%) |
| 3-Person Households | 45 (22.0%) | 0 (0.0%) |
| 4-Person Households | 0 (0.0%) | 0 (0.0%) |
| 5-Person Households | 60 (29.3%) | 0 (0.0%) |
| 6-Person Households | 0 (0.0%) | 0 (0.0%) |
| 7+ Person Households | 39 (19.0%) | 0 (0.0%) |
| Total | 173 (84.4%) | 32 (15.6%) |
Female Fertility in Mesita
Fertility by Age in Mesita
| Age Bracket | Women with Births | Births / 1,000 Women |
| 15 to 19 years | 0 (0.0%) | 0.0 |
| 20 to 34 years | 0 (0.0%) | 0.0 |
| 35 to 50 years | 0 (0.0%) | 0.0 |
| Total | 0 (0.0%) | 0.0 |
Fertility by Age by Marriage Status in Mesita
| Age Bracket | Married | Unmarried |
| 15 to 19 years | 0 (0.0%) | 0 (0.0%) |
| 20 to 34 years | 0 (0.0%) | 0 (0.0%) |
| 35 to 50 years | 0 (0.0%) | 0 (0.0%) |
| Total | 0 (0.0%) | 0 (0.0%) |
Fertility by Education in Mesita
| Educational Attainment | Women with Births | Births / 1,000 Women |
| Less than High School | 0 (0.0%) | 0.0 |
| High School Diploma | 0 (0.0%) | 0.0 |
| College or Associate's Degree | 0 (0.0%) | 0.0 |
| Bachelor's Degree | 0 (0.0%) | 0.0 |
| Graduate Degree | 0 (0.0%) | 0.0 |
| Total | 0 (0.0%) | 0.0 |
Fertility by Education by Marriage Status in Mesita
| Educational Attainment | Married | Unmarried |
| Less than High School | 0 (0.0%) | 0 (0.0%) |
| High School Diploma | 0 (0.0%) | 0 (0.0%) |
| College or Associate's Degree | 0 (0.0%) | 0 (0.0%) |
| Bachelor's Degree | 0 (0.0%) | 0 (0.0%) |
| Graduate Degree | 0 (0.0%) | 0 (0.0%) |
| Total | 0 (0.0%) | 0 (0.0%) |
Employment Characteristics in Mesita
Employment by Class of Employer in Mesita
Among the 471 employed individuals in Mesita, private company employees (276 | 58.6%), not-for-profit organizations (60 | 12.7%), and federal government employees (59 | 12.5%) make up the most common classes of employment.
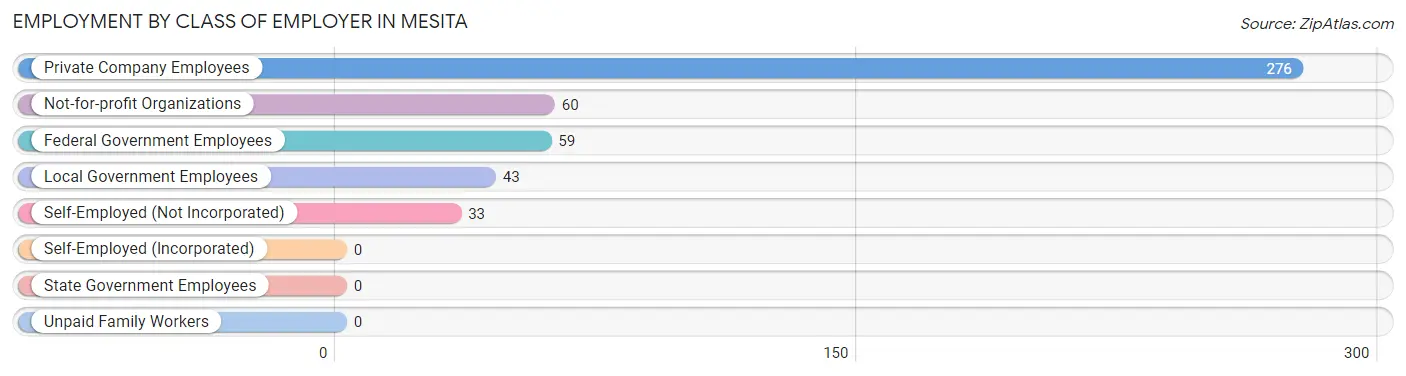
| Employer Class | # Employees | % Employees |
| Private Company Employees | 276 | 58.6% |
| Self-Employed (Incorporated) | 0 | 0.0% |
| Self-Employed (Not Incorporated) | 33 | 7.0% |
| Not-for-profit Organizations | 60 | 12.7% |
| Local Government Employees | 43 | 9.1% |
| State Government Employees | 0 | 0.0% |
| Federal Government Employees | 59 | 12.5% |
| Unpaid Family Workers | 0 | 0.0% |
| Total | 471 | 100.0% |
Employment Status by Age in Mesita
According to the labor force statistics for Mesita, out of the total population over 16 years of age (869), 57.4% or 499 individuals are in the labor force, with 5.6% or 28 of them unemployed. The age group with the highest labor force participation rate is 65 to 74 years, with 100.0% or 33 individuals in the labor force. Within the labor force, the 16 to 19 years age range has the highest percentage of unemployed individuals, with 100.0% or 28 of them being unemployed.
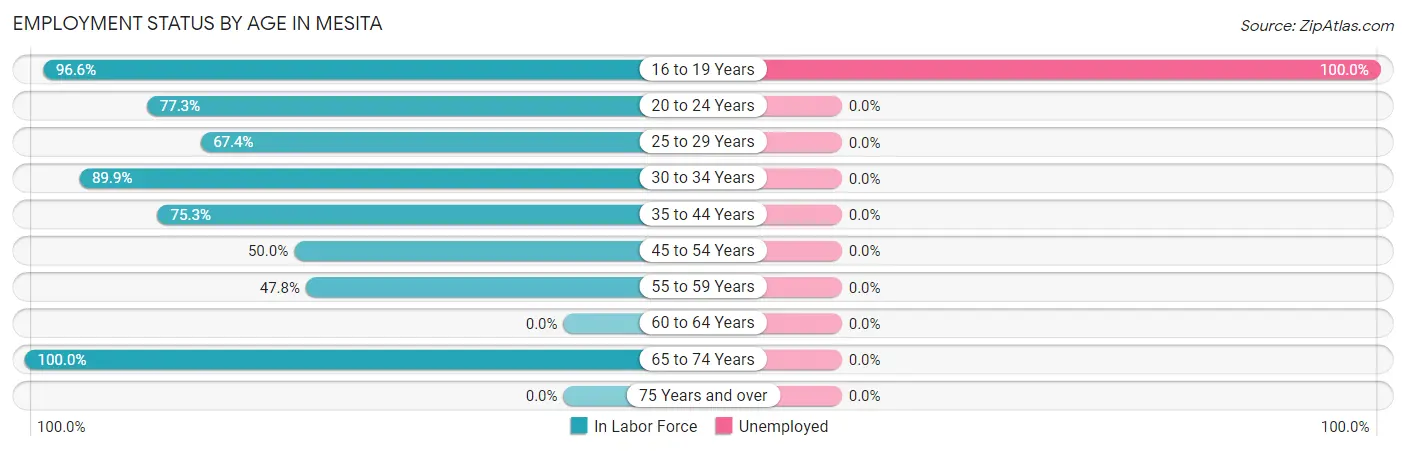
| Age Bracket | In Labor Force | Unemployed |
| 16 to 19 Years | 28 (96.6%) | 28 (100.0%) |
| 20 to 24 Years | 102 (77.3%) | 0 (0.0%) |
| 25 to 29 Years | 62 (67.4%) | 0 (0.0%) |
| 30 to 34 Years | 71 (89.9%) | 0 (0.0%) |
| 35 to 44 Years | 67 (75.3%) | 0 (0.0%) |
| 45 to 54 Years | 93 (50.0%) | 0 (0.0%) |
| 55 to 59 Years | 43 (47.8%) | 0 (0.0%) |
| 60 to 64 Years | 0 (0.0%) | 0 (0.0%) |
| 65 to 74 Years | 33 (100.0%) | 0 (0.0%) |
| 75 Years and over | 0 (0.0%) | 0 (0.0%) |
| Total | 499 (57.4%) | 28 (5.6%) |
Employment Status by Educational Attainment in Mesita
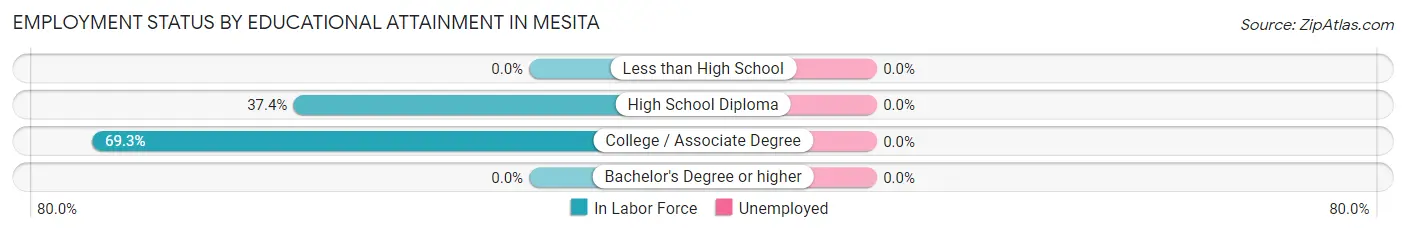
| Educational Attainment | In Labor Force | Unemployed |
| Less than High School | 0 (0.0%) | 0 (0.0%) |
| High School Diploma | 76 (37.4%) | 0 (0.0%) |
| College / Associate Degree | 260 (69.3%) | 0 (0.0%) |
| Bachelor's Degree or higher | 0 (0.0%) | 0 (0.0%) |
| Total | 336 (58.1%) | 0 (0.0%) |
Employment Occupations by Sex in Mesita
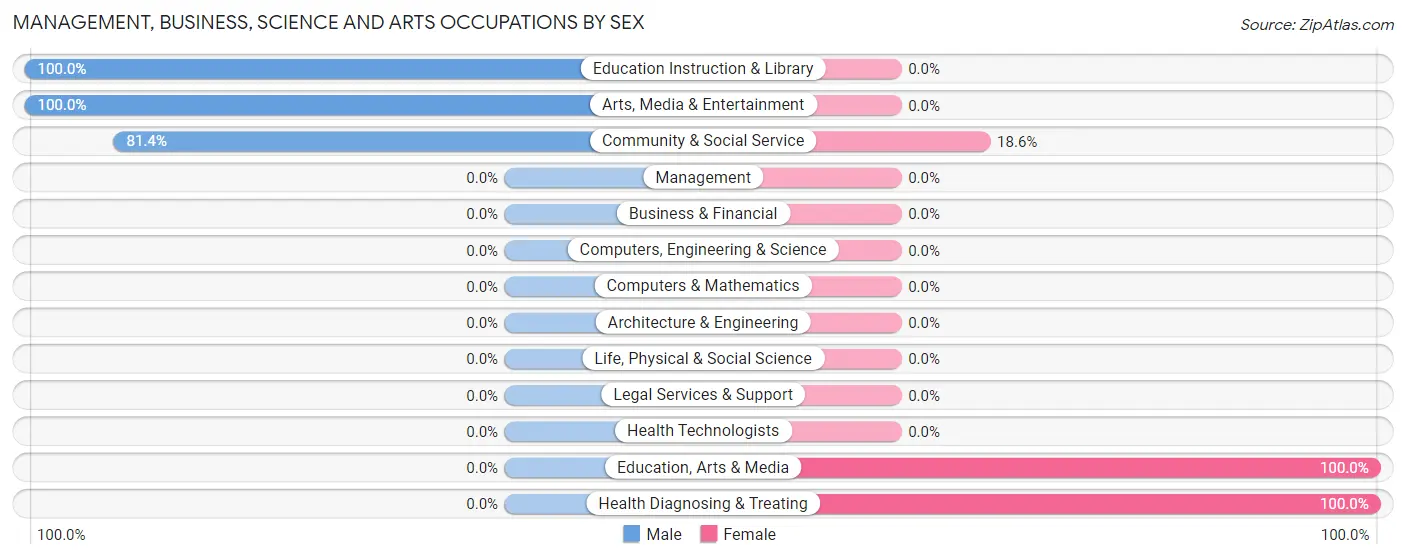
Management, Business, Science and Arts Occupations
The most common Management, Business, Science and Arts occupations in Mesita are Community & Social Service (97 | 20.6%), Education Instruction & Library (60 | 12.7%), Arts, Media & Entertainment (19 | 4.0%), Education, Arts & Media (18 | 3.8%), and Health Diagnosing & Treating (17 | 3.6%).
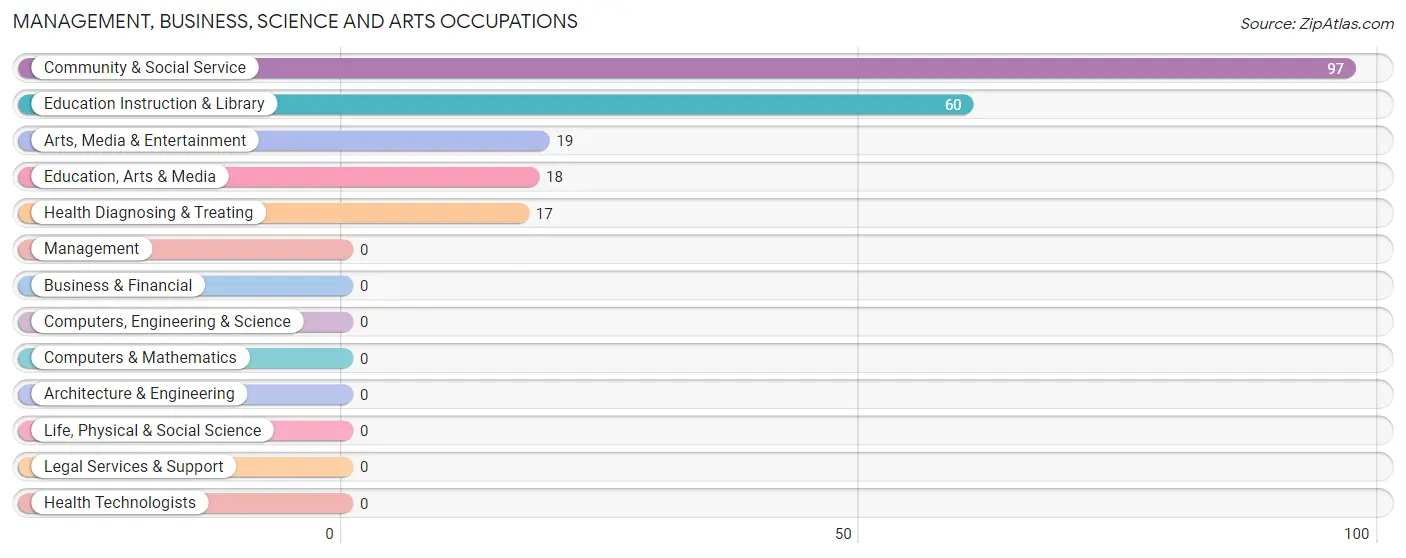
Management, Business, Science and Arts Occupations by Sex
Within the Management, Business, Science and Arts occupations in Mesita, the most male-oriented occupations are Education Instruction & Library (100.0%), Arts, Media & Entertainment (100.0%), and Community & Social Service (81.4%), while the most female-oriented occupations are Education, Arts & Media (100.0%), Health Diagnosing & Treating (100.0%), and Community & Social Service (18.6%).
| Occupation | Male | Female |
| Management | 0 (0.0%) | 0 (0.0%) |
| Business & Financial | 0 (0.0%) | 0 (0.0%) |
| Computers, Engineering & Science | 0 (0.0%) | 0 (0.0%) |
| Computers & Mathematics | 0 (0.0%) | 0 (0.0%) |
| Architecture & Engineering | 0 (0.0%) | 0 (0.0%) |
| Life, Physical & Social Science | 0 (0.0%) | 0 (0.0%) |
| Community & Social Service | 79 (81.4%) | 18 (18.6%) |
| Education, Arts & Media | 0 (0.0%) | 18 (100.0%) |
| Legal Services & Support | 0 (0.0%) | 0 (0.0%) |
| Education Instruction & Library | 60 (100.0%) | 0 (0.0%) |
| Arts, Media & Entertainment | 19 (100.0%) | 0 (0.0%) |
| Health Diagnosing & Treating | 0 (0.0%) | 17 (100.0%) |
| Health Technologists | 0 (0.0%) | 0 (0.0%) |
| Total (Category) | 79 (69.3%) | 35 (30.7%) |
| Total (Overall) | 258 (54.8%) | 213 (45.2%) |
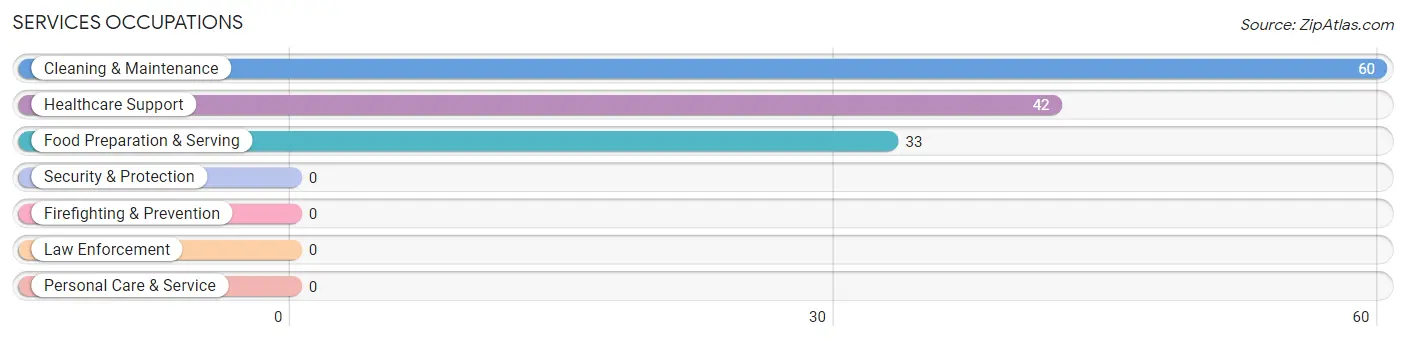
Services Occupations
The most common Services occupations in Mesita are Cleaning & Maintenance (60 | 12.7%), Healthcare Support (42 | 8.9%), and Food Preparation & Serving (33 | 7.0%).
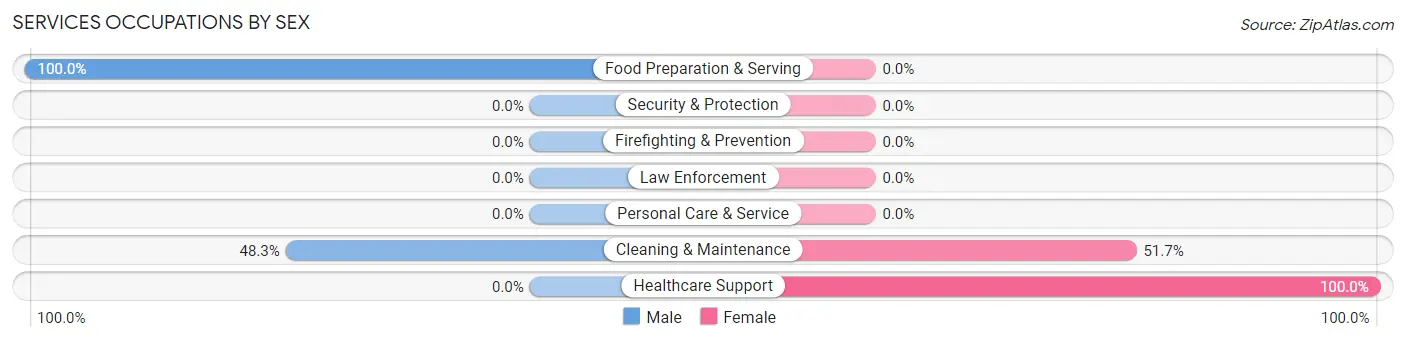
Services Occupations by Sex
Within the Services occupations in Mesita, the most male-oriented occupations are Food Preparation & Serving (100.0%), and Cleaning & Maintenance (48.3%), while the most female-oriented occupations are Healthcare Support (100.0%), and Cleaning & Maintenance (51.7%).
| Occupation | Male | Female |
| Healthcare Support | 0 (0.0%) | 42 (100.0%) |
| Security & Protection | 0 (0.0%) | 0 (0.0%) |
| Firefighting & Prevention | 0 (0.0%) | 0 (0.0%) |
| Law Enforcement | 0 (0.0%) | 0 (0.0%) |
| Food Preparation & Serving | 33 (100.0%) | 0 (0.0%) |
| Cleaning & Maintenance | 29 (48.3%) | 31 (51.7%) |
| Personal Care & Service | 0 (0.0%) | 0 (0.0%) |
| Total (Category) | 62 (45.9%) | 73 (54.1%) |
| Total (Overall) | 258 (54.8%) | 213 (45.2%) |
Sales and Office Occupations
The most common Sales and Office occupations in Mesita are Sales & Related (25 | 5.3%), and Office & Administration (25 | 5.3%).

Sales and Office Occupations by Sex

| Occupation | Male | Female |
| Sales & Related | 0 (0.0%) | 25 (100.0%) |
| Office & Administration | 0 (0.0%) | 25 (100.0%) |
| Total (Category) | 0 (0.0%) | 50 (100.0%) |
| Total (Overall) | 258 (54.8%) | 213 (45.2%) |
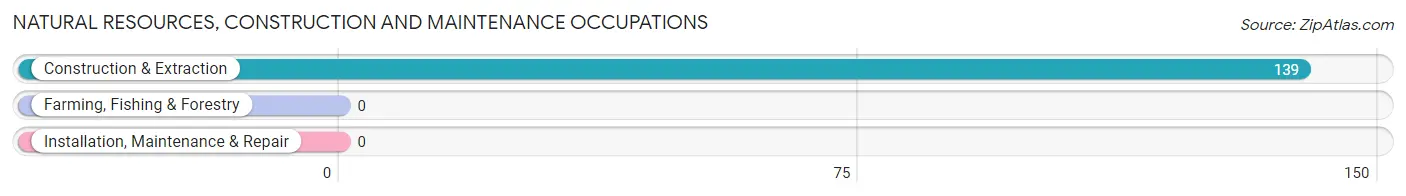
Natural Resources, Construction and Maintenance Occupations
The most common Natural Resources, Construction and Maintenance occupations in Mesita are , and Construction & Extraction (139 | 29.5%).
Natural Resources, Construction and Maintenance Occupations by Sex
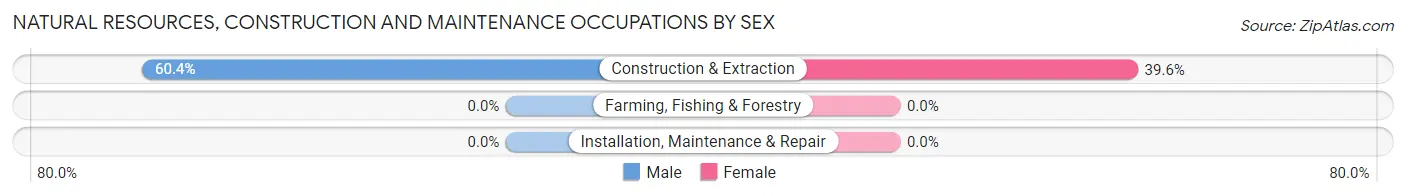
| Occupation | Male | Female |
| Farming, Fishing & Forestry | 0 (0.0%) | 0 (0.0%) |
| Construction & Extraction | 84 (60.4%) | 55 (39.6%) |
| Installation, Maintenance & Repair | 0 (0.0%) | 0 (0.0%) |
| Total (Category) | 84 (60.4%) | 55 (39.6%) |
| Total (Overall) | 258 (54.8%) | 213 (45.2%) |
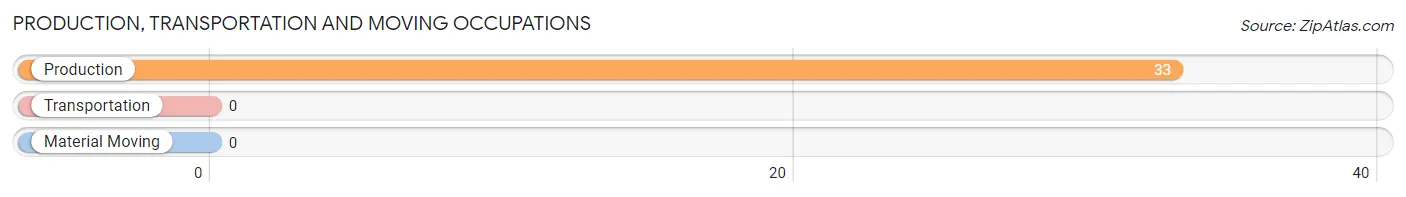
Production, Transportation and Moving Occupations
The most common Production, Transportation and Moving occupations in Mesita are , and Production (33 | 7.0%).
Production, Transportation and Moving Occupations by Sex
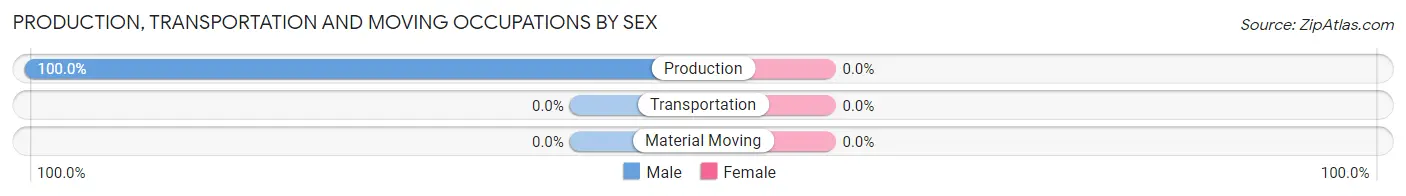
| Occupation | Male | Female |
| Production | 33 (100.0%) | 0 (0.0%) |
| Transportation | 0 (0.0%) | 0 (0.0%) |
| Material Moving | 0 (0.0%) | 0 (0.0%) |
| Total (Category) | 33 (100.0%) | 0 (0.0%) |
| Total (Overall) | 258 (54.8%) | 213 (45.2%) |
Employment Industries by Sex in Mesita
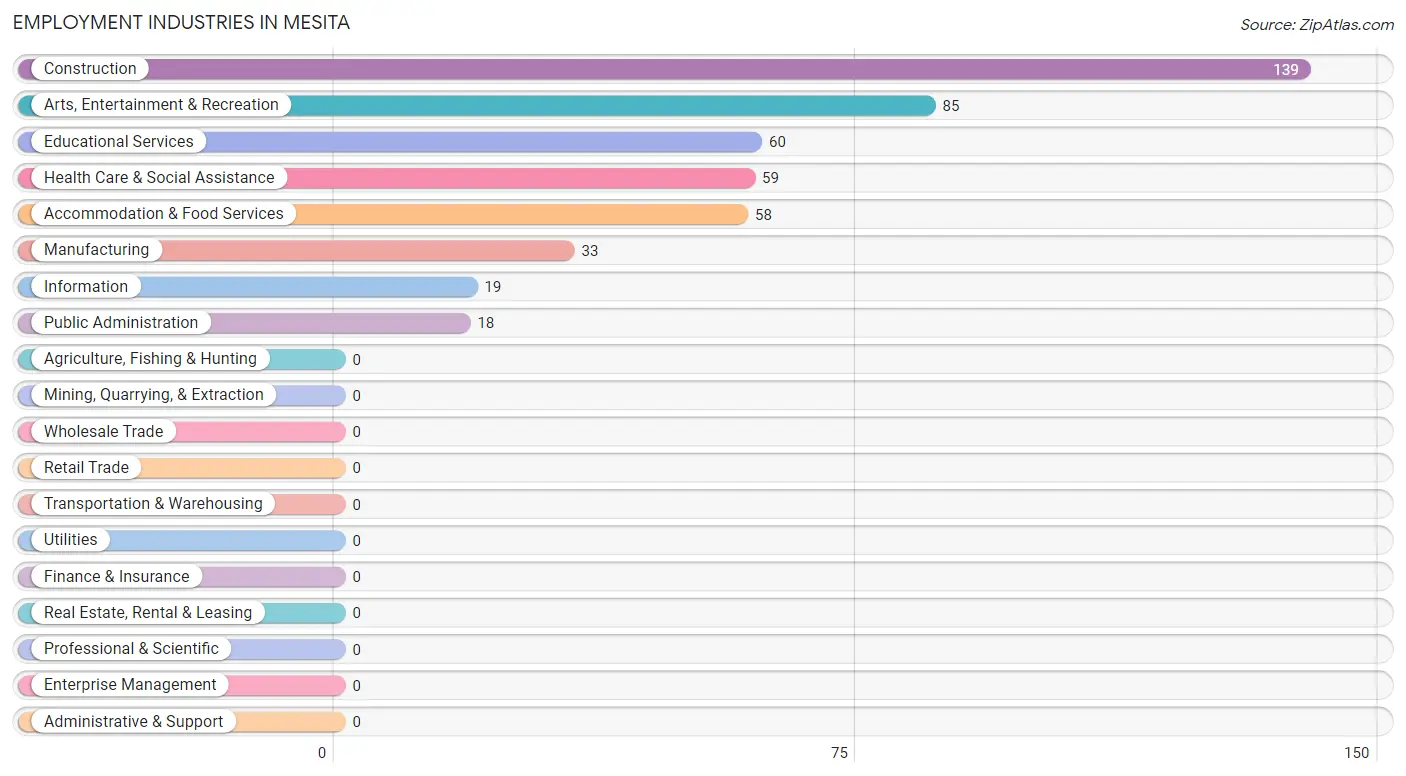
Employment Industries in Mesita
The major employment industries in Mesita include Construction (139 | 29.5%), Arts, Entertainment & Recreation (85 | 18.0%), Educational Services (60 | 12.7%), Health Care & Social Assistance (59 | 12.5%), and Accommodation & Food Services (58 | 12.3%).
Employment Industries by Sex in Mesita
The Mesita industries that see more men than women are Manufacturing (100.0%), Information (100.0%), and Educational Services (100.0%), whereas the industries that tend to have a higher number of women are Health Care & Social Assistance (100.0%), Public Administration (100.0%), and Arts, Entertainment & Recreation (65.9%).
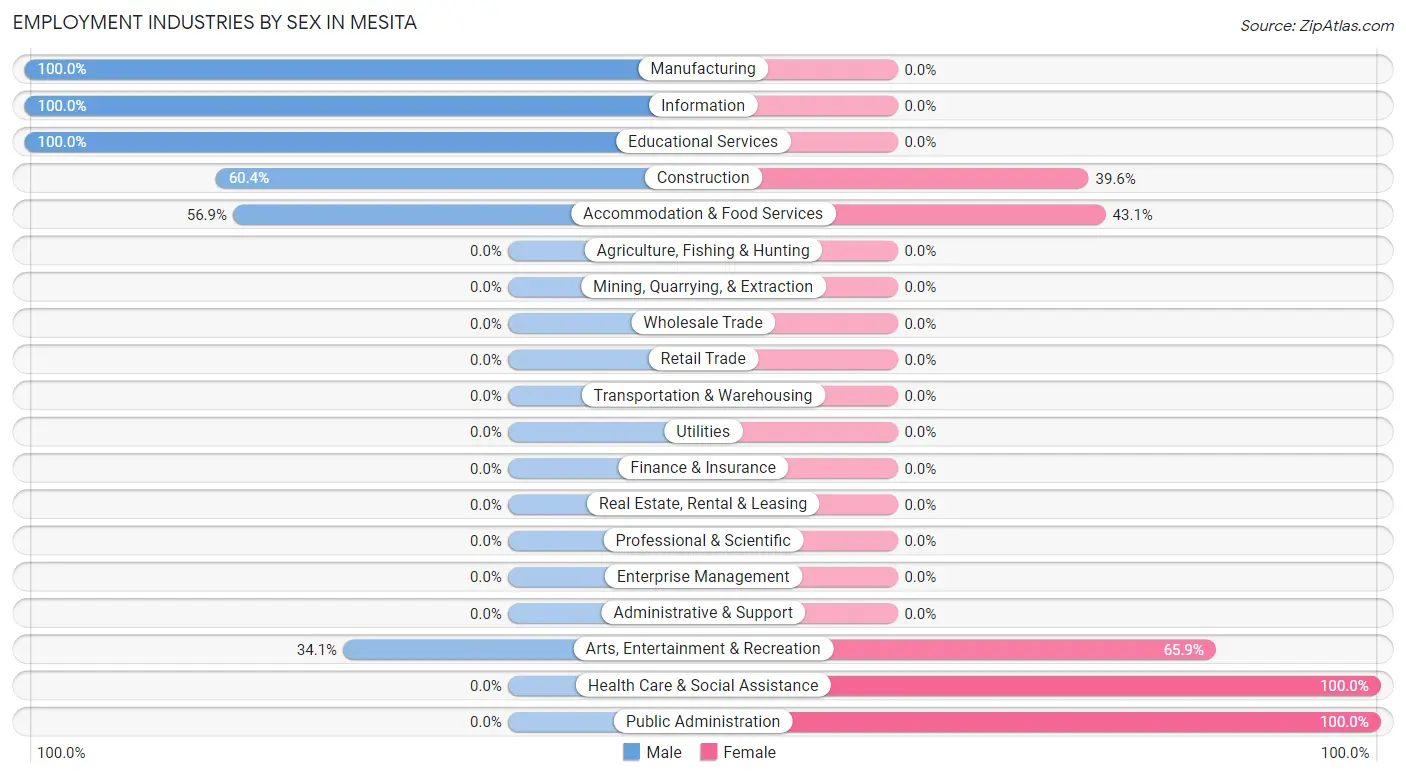
| Industry | Male | Female |
| Agriculture, Fishing & Hunting | 0 (0.0%) | 0 (0.0%) |
| Mining, Quarrying, & Extraction | 0 (0.0%) | 0 (0.0%) |
| Construction | 84 (60.4%) | 55 (39.6%) |
| Manufacturing | 33 (100.0%) | 0 (0.0%) |
| Wholesale Trade | 0 (0.0%) | 0 (0.0%) |
| Retail Trade | 0 (0.0%) | 0 (0.0%) |
| Transportation & Warehousing | 0 (0.0%) | 0 (0.0%) |
| Utilities | 0 (0.0%) | 0 (0.0%) |
| Information | 19 (100.0%) | 0 (0.0%) |
| Finance & Insurance | 0 (0.0%) | 0 (0.0%) |
| Real Estate, Rental & Leasing | 0 (0.0%) | 0 (0.0%) |
| Professional & Scientific | 0 (0.0%) | 0 (0.0%) |
| Enterprise Management | 0 (0.0%) | 0 (0.0%) |
| Administrative & Support | 0 (0.0%) | 0 (0.0%) |
| Educational Services | 60 (100.0%) | 0 (0.0%) |
| Health Care & Social Assistance | 0 (0.0%) | 59 (100.0%) |
| Arts, Entertainment & Recreation | 29 (34.1%) | 56 (65.9%) |
| Accommodation & Food Services | 33 (56.9%) | 25 (43.1%) |
| Public Administration | 0 (0.0%) | 18 (100.0%) |
| Total | 258 (54.8%) | 213 (45.2%) |
Education in Mesita
School Enrollment in Mesita
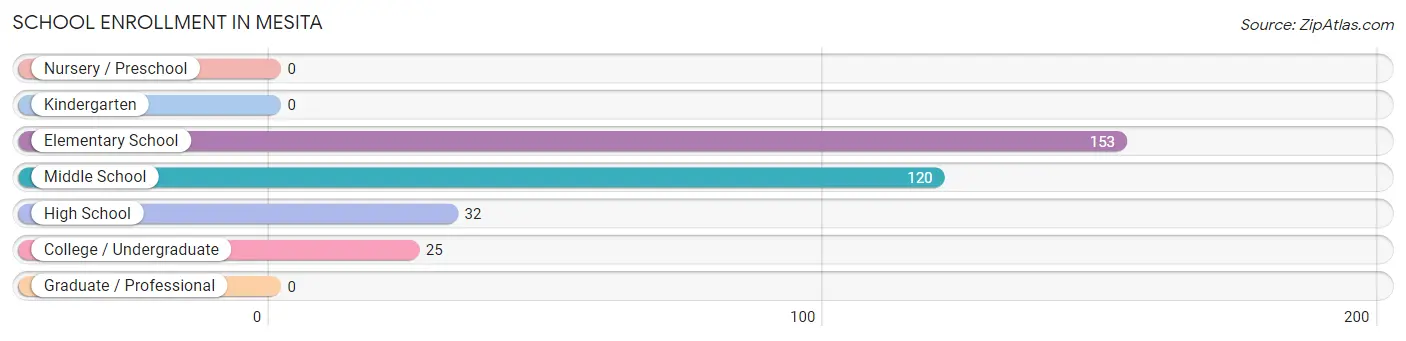
The most common levels of schooling among the 330 students in Mesita are elementary school (153 | 46.4%), middle school (120 | 36.4%), and high school (32 | 9.7%).
| School Level | # Students | % Students |
| Nursery / Preschool | 0 | 0.0% |
| Kindergarten | 0 | 0.0% |
| Elementary School | 153 | 46.4% |
| Middle School | 120 | 36.4% |
| High School | 32 | 9.7% |
| College / Undergraduate | 25 | 7.6% |
| Graduate / Professional | 0 | 0.0% |
| Total | 330 | 100.0% |
School Enrollment by Age by Funding Source in Mesita
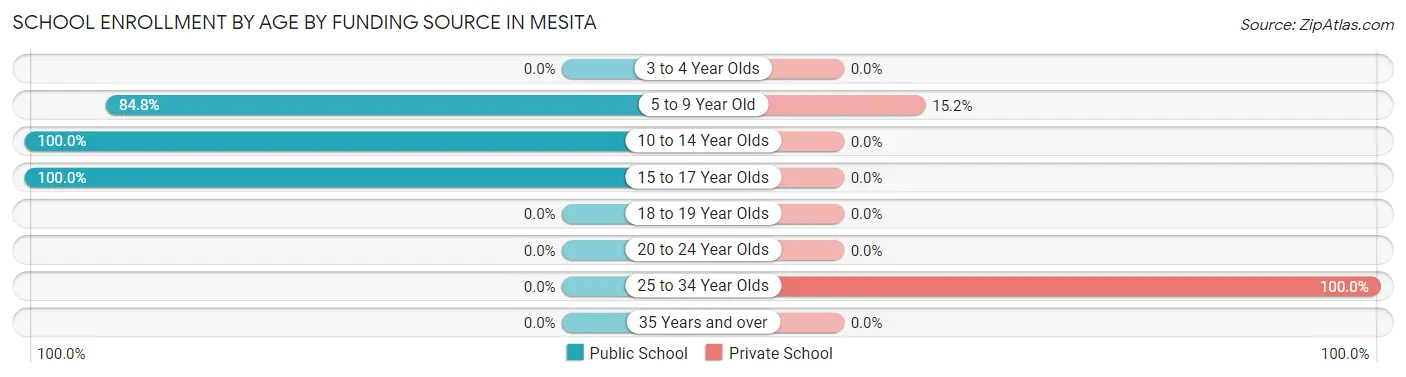
Out of a total of 330 students who are enrolled in schools in Mesita, 44 (13.3%) attend a private institution, while the remaining 286 (86.7%) are enrolled in public schools. The age group of 25 to 34 year olds has the highest likelihood of being enrolled in private schools, with 25 (100.0% in the age bracket) enrolled. Conversely, the age group of 10 to 14 year olds has the lowest likelihood of being enrolled in a private school, with 148 (100.0% in the age bracket) attending a public institution.
| Age Bracket | Public School | Private School |
| 3 to 4 Year Olds | 0 (0.0%) | 0 (0.0%) |
| 5 to 9 Year Old | 106 (84.8%) | 19 (15.2%) |
| 10 to 14 Year Olds | 148 (100.0%) | 0 (0.0%) |
| 15 to 17 Year Olds | 32 (100.0%) | 0 (0.0%) |
| 18 to 19 Year Olds | 0 (0.0%) | 0 (0.0%) |
| 20 to 24 Year Olds | 0 (0.0%) | 0 (0.0%) |
| 25 to 34 Year Olds | 0 (0.0%) | 25 (100.0%) |
| 35 Years and over | 0 (0.0%) | 0 (0.0%) |
| Total | 286 (86.7%) | 44 (13.3%) |
Educational Attainment by Field of Study in Mesita
| Field of Study | # Graduates | % Graduates |
| Computers & Mathematics | 0 | 0.0% |
| Bio, Nature & Agricultural | 0 | 0.0% |
| Physical & Health Sciences | 0 | 0.0% |
| Psychology | 0 | 0.0% |
| Social Sciences | 0 | 0.0% |
| Engineering | 0 | 0.0% |
| Multidisciplinary Studies | 0 | 0.0% |
| Science & Technology | 0 | 0.0% |
| Business | 0 | 0.0% |
| Education | 0 | 0.0% |
| Literature & Languages | 0 | 0.0% |
| Liberal Arts & History | 0 | 0.0% |
| Visual & Performing Arts | 0 | 0.0% |
| Communications | 0 | 0.0% |
| Arts & Humanities | 0 | 0.0% |
| Total | 0 | 0.0% |
Transportation & Commute in Mesita
Vehicle Availability by Sex in Mesita
The most prevalent vehicle ownership categories in Mesita are males with 5 or more vehicles (103, accounting for 39.9%) and females with 5 or more vehicles (59, making up 48.4%).
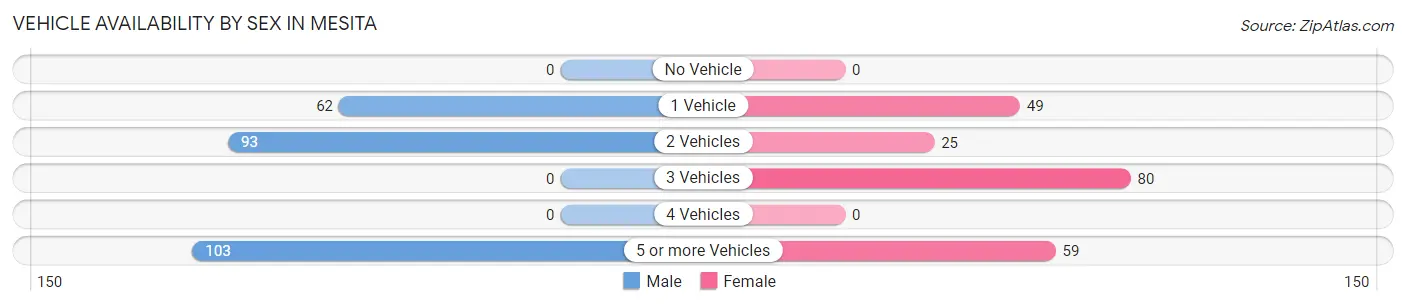
| Vehicles Available | Male | Female |
| No Vehicle | 0 (0.0%) | 0 (0.0%) |
| 1 Vehicle | 62 (24.0%) | 49 (23.0%) |
| 2 Vehicles | 93 (36.0%) | 25 (11.7%) |
| 3 Vehicles | 0 (0.0%) | 80 (37.6%) |
| 4 Vehicles | 0 (0.0%) | 0 (0.0%) |
| 5 or more Vehicles | 103 (39.9%) | 59 (27.7%) |
| Total | 258 (100.0%) | 213 (100.0%) |
Commute Time in Mesita
The most frequently occuring commute durations in Mesita are less than 5 minutes (135 commuters, 28.7%), 20 to 24 minutes (116 commuters, 24.6%), and 15 to 19 minutes (78 commuters, 16.6%).
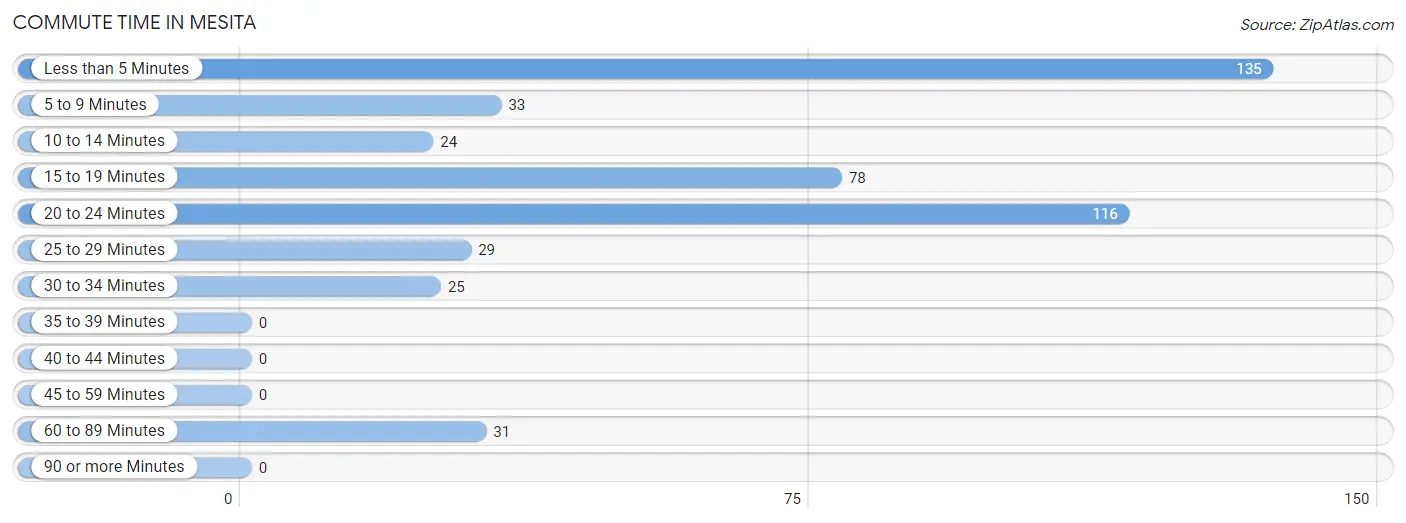
| Commute Time | # Commuters | % Commuters |
| Less than 5 Minutes | 135 | 28.7% |
| 5 to 9 Minutes | 33 | 7.0% |
| 10 to 14 Minutes | 24 | 5.1% |
| 15 to 19 Minutes | 78 | 16.6% |
| 20 to 24 Minutes | 116 | 24.6% |
| 25 to 29 Minutes | 29 | 6.2% |
| 30 to 34 Minutes | 25 | 5.3% |
| 35 to 39 Minutes | 0 | 0.0% |
| 40 to 44 Minutes | 0 | 0.0% |
| 45 to 59 Minutes | 0 | 0.0% |
| 60 to 89 Minutes | 31 | 6.6% |
| 90 or more Minutes | 0 | 0.0% |
Commute Time by Sex in Mesita
The most common commute times in Mesita are less than 5 minutes (117 commuters, 45.4%) for males and 15 to 19 minutes (59 commuters, 27.7%) for females.
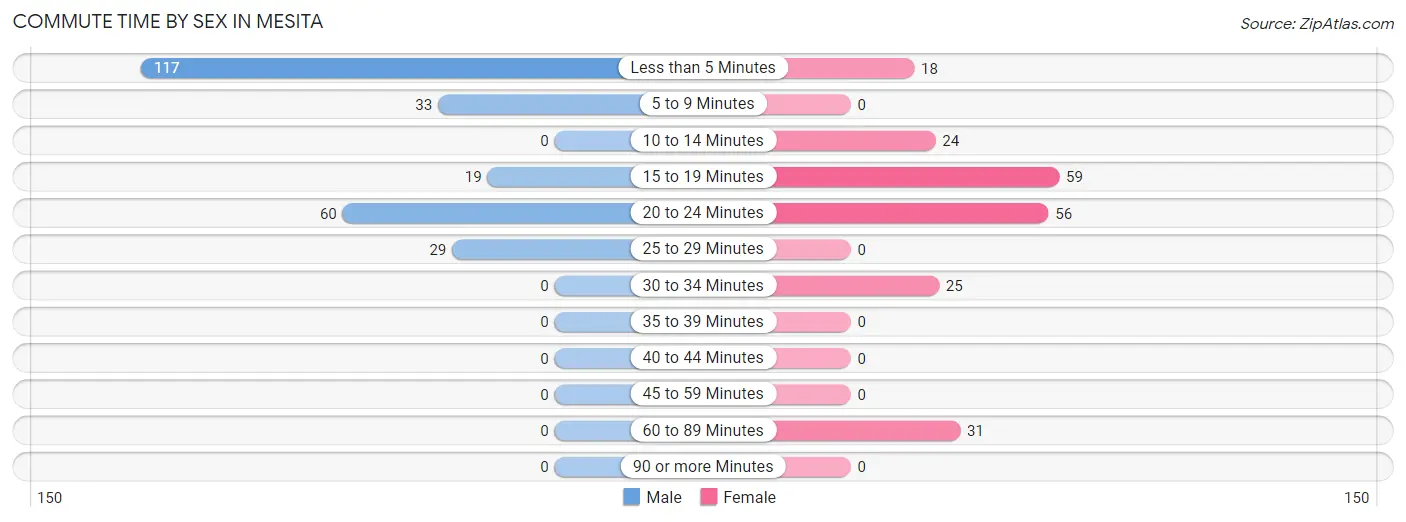
| Commute Time | Male | Female |
| Less than 5 Minutes | 117 (45.4%) | 18 (8.5%) |
| 5 to 9 Minutes | 33 (12.8%) | 0 (0.0%) |
| 10 to 14 Minutes | 0 (0.0%) | 24 (11.3%) |
| 15 to 19 Minutes | 19 (7.4%) | 59 (27.7%) |
| 20 to 24 Minutes | 60 (23.3%) | 56 (26.3%) |
| 25 to 29 Minutes | 29 (11.2%) | 0 (0.0%) |
| 30 to 34 Minutes | 0 (0.0%) | 25 (11.7%) |
| 35 to 39 Minutes | 0 (0.0%) | 0 (0.0%) |
| 40 to 44 Minutes | 0 (0.0%) | 0 (0.0%) |
| 45 to 59 Minutes | 0 (0.0%) | 0 (0.0%) |
| 60 to 89 Minutes | 0 (0.0%) | 31 (14.5%) |
| 90 or more Minutes | 0 (0.0%) | 0 (0.0%) |
Time of Departure to Work by Sex in Mesita
The most frequent times of departure to work in Mesita are 5:30 AM to 5:59 AM (93, 36.0%) for males and 4:00 PM to 11:59 PM (50, 23.5%) for females.
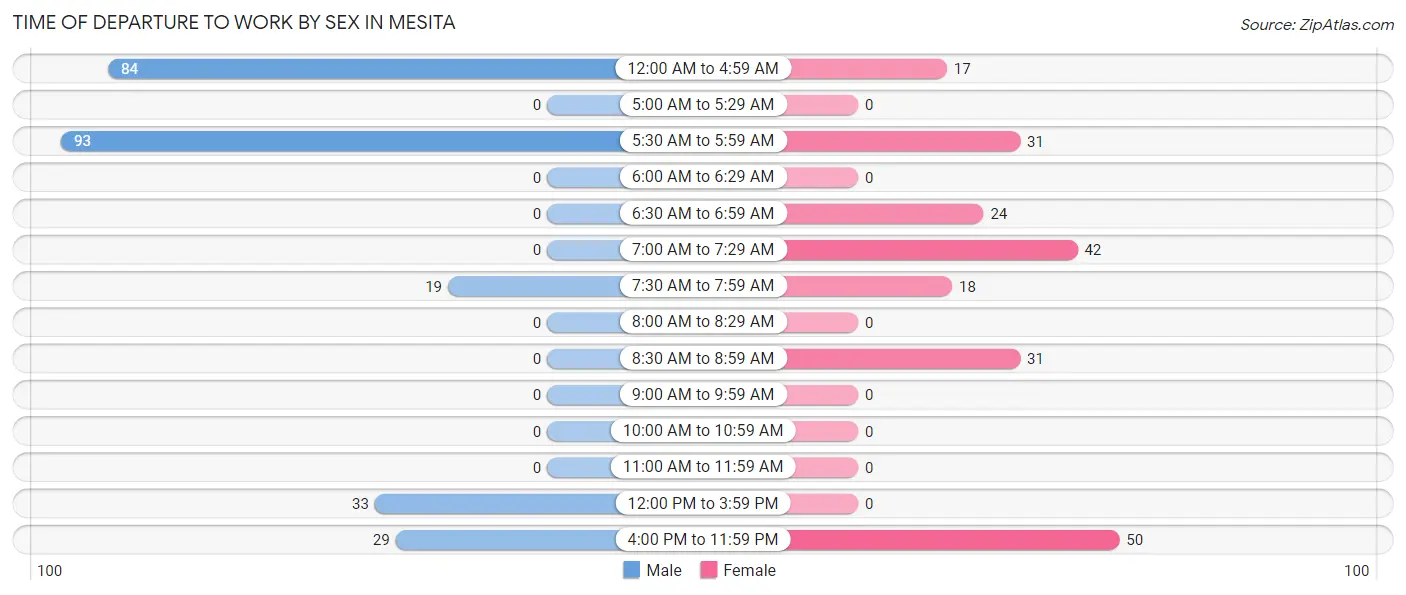
| Time of Departure | Male | Female |
| 12:00 AM to 4:59 AM | 84 (32.6%) | 17 (8.0%) |
| 5:00 AM to 5:29 AM | 0 (0.0%) | 0 (0.0%) |
| 5:30 AM to 5:59 AM | 93 (36.0%) | 31 (14.5%) |
| 6:00 AM to 6:29 AM | 0 (0.0%) | 0 (0.0%) |
| 6:30 AM to 6:59 AM | 0 (0.0%) | 24 (11.3%) |
| 7:00 AM to 7:29 AM | 0 (0.0%) | 42 (19.7%) |
| 7:30 AM to 7:59 AM | 19 (7.4%) | 18 (8.5%) |
| 8:00 AM to 8:29 AM | 0 (0.0%) | 0 (0.0%) |
| 8:30 AM to 8:59 AM | 0 (0.0%) | 31 (14.5%) |
| 9:00 AM to 9:59 AM | 0 (0.0%) | 0 (0.0%) |
| 10:00 AM to 10:59 AM | 0 (0.0%) | 0 (0.0%) |
| 11:00 AM to 11:59 AM | 0 (0.0%) | 0 (0.0%) |
| 12:00 PM to 3:59 PM | 33 (12.8%) | 0 (0.0%) |
| 4:00 PM to 11:59 PM | 29 (11.2%) | 50 (23.5%) |
| Total | 258 (100.0%) | 213 (100.0%) |
Housing Occupancy in Mesita
Occupancy by Ownership in Mesita
Of the total 205 dwellings in Mesita, owner-occupied units account for 167 (81.5%), while renter-occupied units make up 38 (18.5%).
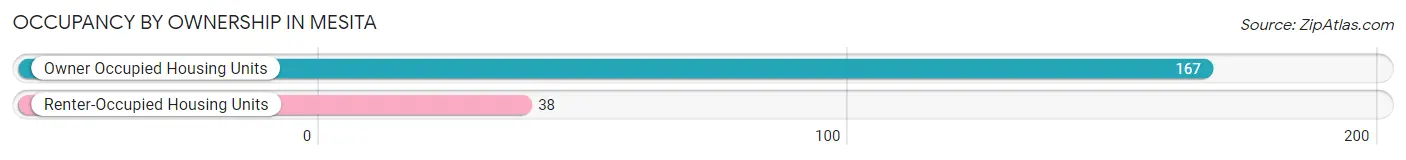
| Occupancy | # Housing Units | % Housing Units |
| Owner Occupied Housing Units | 167 | 81.5% |
| Renter-Occupied Housing Units | 38 | 18.5% |
| Total Occupied Housing Units | 205 | 100.0% |
Occupancy by Household Size in Mesita
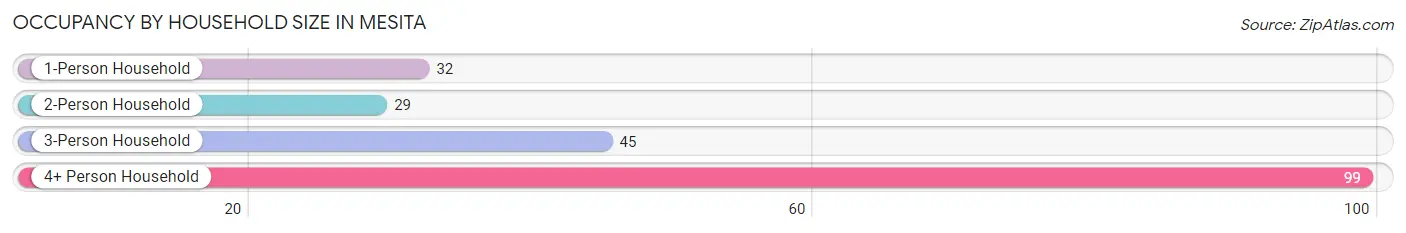
| Household Size | # Housing Units | % Housing Units |
| 1-Person Household | 32 | 15.6% |
| 2-Person Household | 29 | 14.1% |
| 3-Person Household | 45 | 22.0% |
| 4+ Person Household | 99 | 48.3% |
| Total Housing Units | 205 | 100.0% |
Occupancy by Ownership by Household Size in Mesita
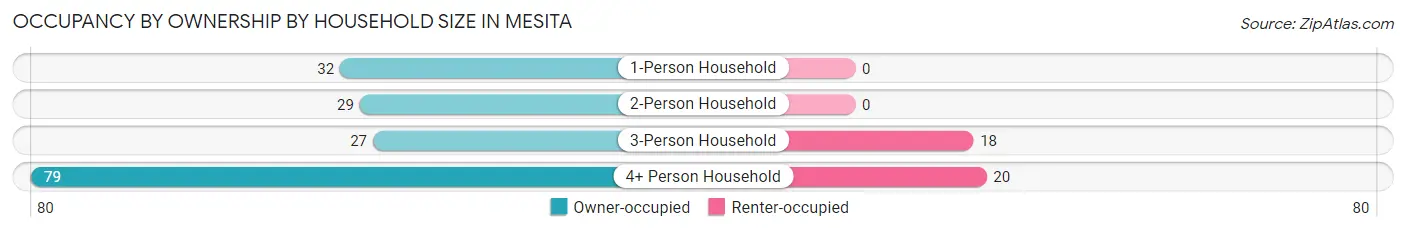
| Household Size | Owner-occupied | Renter-occupied |
| 1-Person Household | 32 (100.0%) | 0 (0.0%) |
| 2-Person Household | 29 (100.0%) | 0 (0.0%) |
| 3-Person Household | 27 (60.0%) | 18 (40.0%) |
| 4+ Person Household | 79 (79.8%) | 20 (20.2%) |
| Total Housing Units | 167 (81.5%) | 38 (18.5%) |
Occupancy by Educational Attainment in Mesita
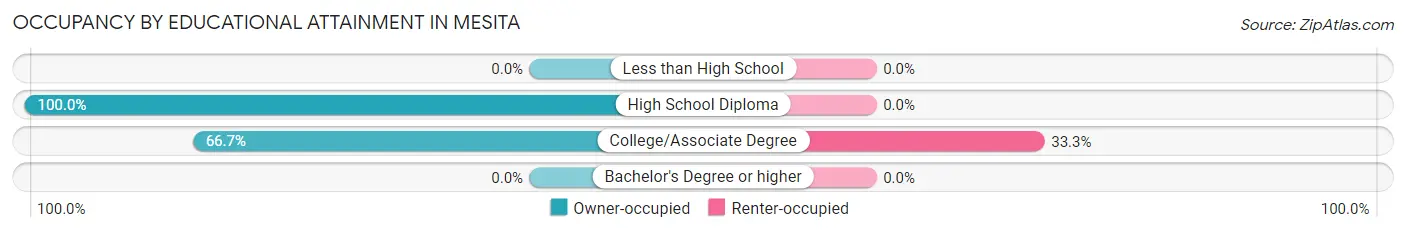
| Household Size | Owner-occupied | Renter-occupied |
| Less than High School | 0 (0.0%) | 0 (0.0%) |
| High School Diploma | 91 (100.0%) | 0 (0.0%) |
| College/Associate Degree | 76 (66.7%) | 38 (33.3%) |
| Bachelor's Degree or higher | 0 (0.0%) | 0 (0.0%) |
Occupancy by Age of Householder in Mesita
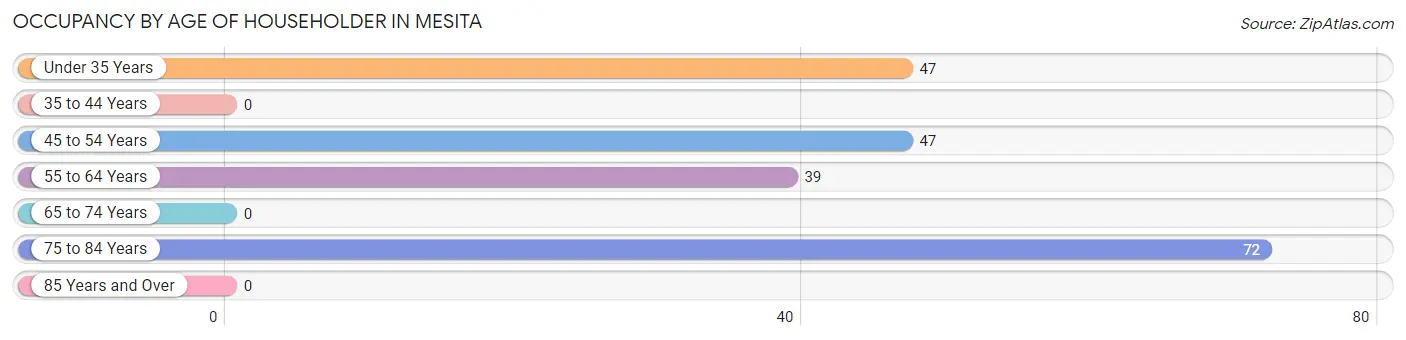
| Age Bracket | # Households | % Households |
| Under 35 Years | 47 | 22.9% |
| 35 to 44 Years | 0 | 0.0% |
| 45 to 54 Years | 47 | 22.9% |
| 55 to 64 Years | 39 | 19.0% |
| 65 to 74 Years | 0 | 0.0% |
| 75 to 84 Years | 72 | 35.1% |
| 85 Years and Over | 0 | 0.0% |
| Total | 205 | 100.0% |
Housing Finances in Mesita
Median Income by Occupancy in Mesita
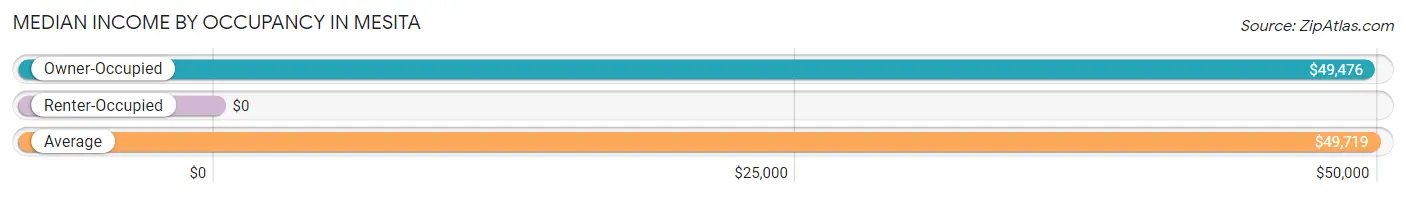
| Occupancy Type | # Households | Median Income |
| Owner-Occupied | 167 (81.5%) | $49,476 |
| Renter-Occupied | 38 (18.5%) | $0 |
| Average | 205 (100.0%) | $49,719 |
Occupancy by Householder Income Bracket in Mesita
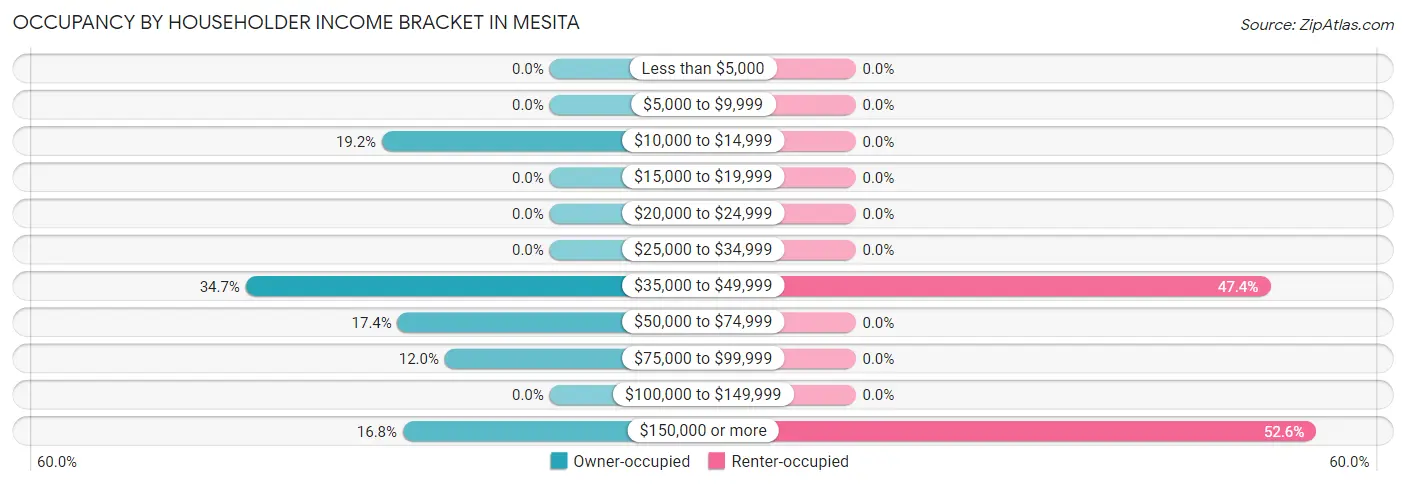
| Income Bracket | Owner-occupied | Renter-occupied |
| Less than $5,000 | 0 (0.0%) | 0 (0.0%) |
| $5,000 to $9,999 | 0 (0.0%) | 0 (0.0%) |
| $10,000 to $14,999 | 32 (19.2%) | 0 (0.0%) |
| $15,000 to $19,999 | 0 (0.0%) | 0 (0.0%) |
| $20,000 to $24,999 | 0 (0.0%) | 0 (0.0%) |
| $25,000 to $34,999 | 0 (0.0%) | 0 (0.0%) |
| $35,000 to $49,999 | 58 (34.7%) | 18 (47.4%) |
| $50,000 to $74,999 | 29 (17.4%) | 0 (0.0%) |
| $75,000 to $99,999 | 20 (12.0%) | 0 (0.0%) |
| $100,000 to $149,999 | 0 (0.0%) | 0 (0.0%) |
| $150,000 or more | 28 (16.8%) | 20 (52.6%) |
| Total | 167 (100.0%) | 38 (100.0%) |
Monthly Housing Cost Tiers in Mesita
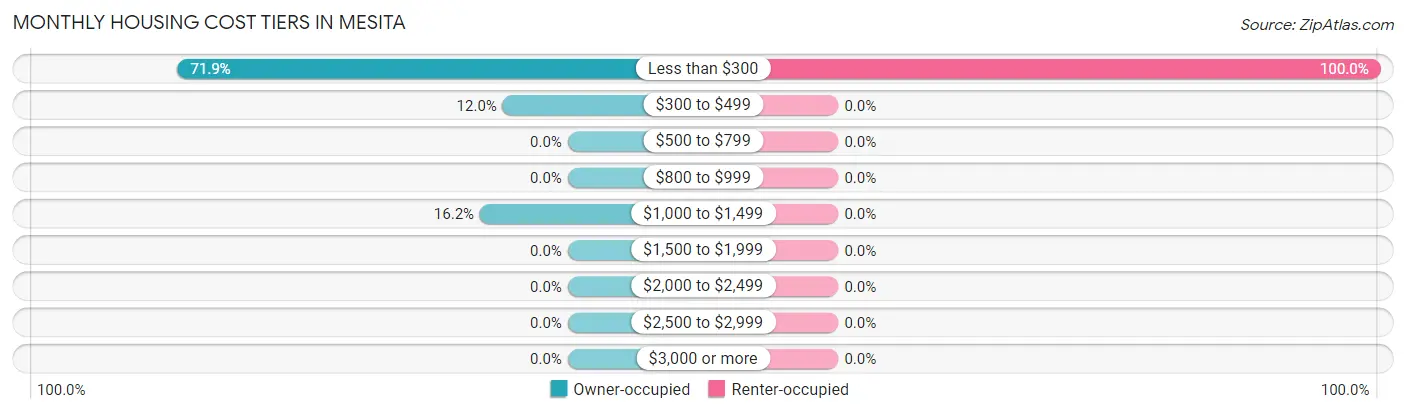
| Monthly Cost | Owner-occupied | Renter-occupied |
| Less than $300 | 120 (71.9%) | 38 (100.0%) |
| $300 to $499 | 20 (12.0%) | 0 (0.0%) |
| $500 to $799 | 0 (0.0%) | 0 (0.0%) |
| $800 to $999 | 0 (0.0%) | 0 (0.0%) |
| $1,000 to $1,499 | 27 (16.2%) | 0 (0.0%) |
| $1,500 to $1,999 | 0 (0.0%) | 0 (0.0%) |
| $2,000 to $2,499 | 0 (0.0%) | 0 (0.0%) |
| $2,500 to $2,999 | 0 (0.0%) | 0 (0.0%) |
| $3,000 or more | 0 (0.0%) | 0 (0.0%) |
| Total | 167 (100.0%) | 38 (100.0%) |
Physical Housing Characteristics in Mesita
Housing Structures in Mesita
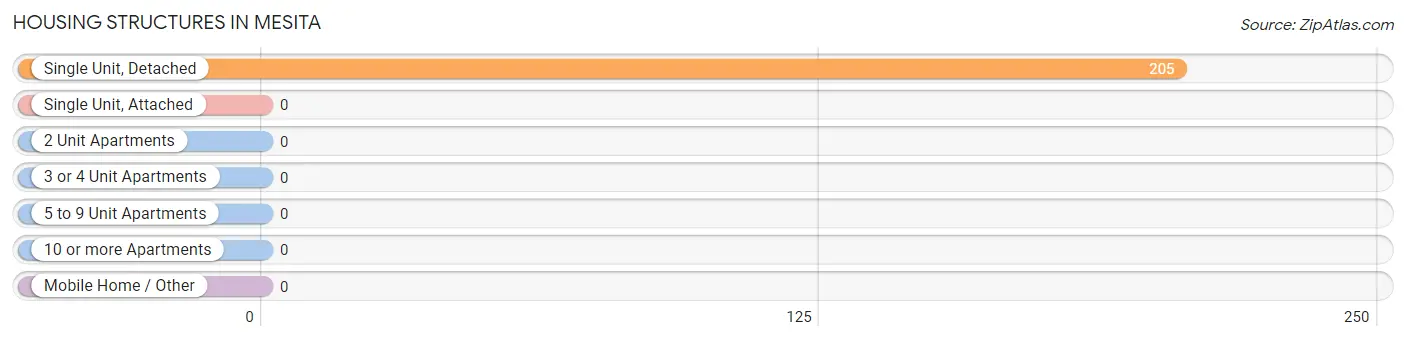
| Structure Type | # Housing Units | % Housing Units |
| Single Unit, Detached | 205 | 100.0% |
| Single Unit, Attached | 0 | 0.0% |
| 2 Unit Apartments | 0 | 0.0% |
| 3 or 4 Unit Apartments | 0 | 0.0% |
| 5 to 9 Unit Apartments | 0 | 0.0% |
| 10 or more Apartments | 0 | 0.0% |
| Mobile Home / Other | 0 | 0.0% |
| Total | 205 | 100.0% |
Housing Structures by Occupancy in Mesita
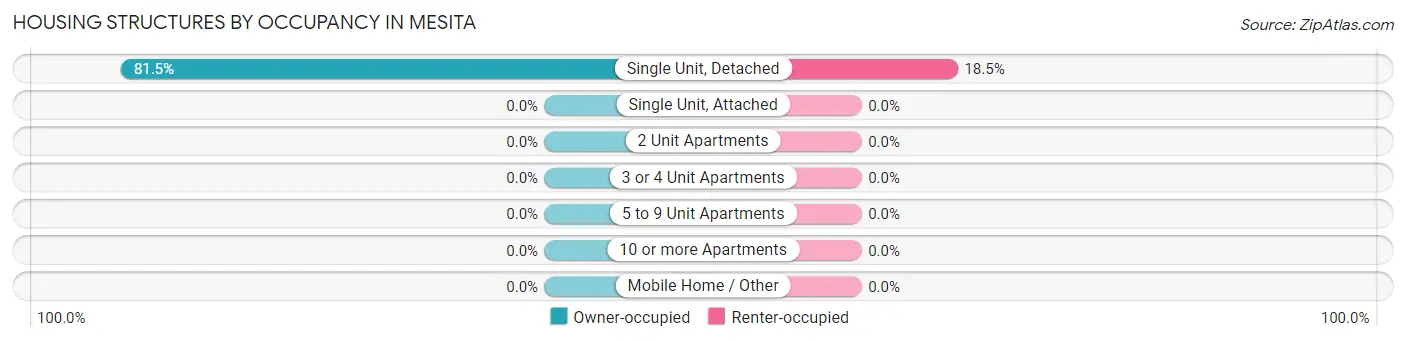
| Structure Type | Owner-occupied | Renter-occupied |
| Single Unit, Detached | 167 (81.5%) | 38 (18.5%) |
| Single Unit, Attached | 0 (0.0%) | 0 (0.0%) |
| 2 Unit Apartments | 0 (0.0%) | 0 (0.0%) |
| 3 or 4 Unit Apartments | 0 (0.0%) | 0 (0.0%) |
| 5 to 9 Unit Apartments | 0 (0.0%) | 0 (0.0%) |
| 10 or more Apartments | 0 (0.0%) | 0 (0.0%) |
| Mobile Home / Other | 0 (0.0%) | 0 (0.0%) |
| Total | 167 (81.5%) | 38 (18.5%) |
Housing Structures by Number of Rooms in Mesita
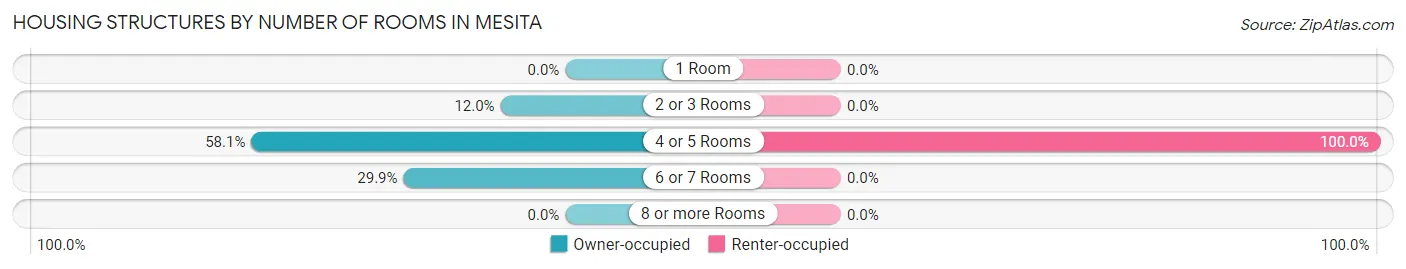
| Number of Rooms | Owner-occupied | Renter-occupied |
| 1 Room | 0 (0.0%) | 0 (0.0%) |
| 2 or 3 Rooms | 20 (12.0%) | 0 (0.0%) |
| 4 or 5 Rooms | 97 (58.1%) | 38 (100.0%) |
| 6 or 7 Rooms | 50 (29.9%) | 0 (0.0%) |
| 8 or more Rooms | 0 (0.0%) | 0 (0.0%) |
| Total | 167 (100.0%) | 38 (100.0%) |
Housing Structure by Heating Type in Mesita
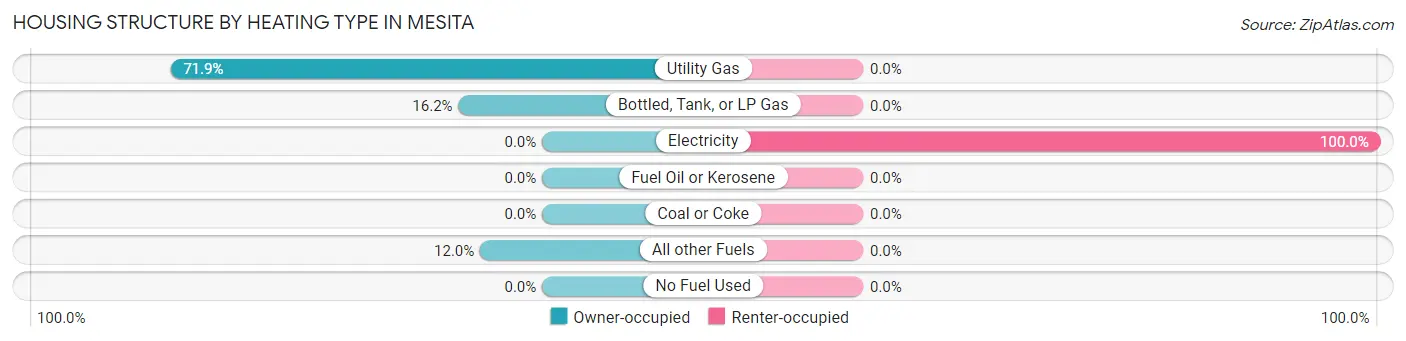
| Heating Type | Owner-occupied | Renter-occupied |
| Utility Gas | 120 (71.9%) | 0 (0.0%) |
| Bottled, Tank, or LP Gas | 27 (16.2%) | 0 (0.0%) |
| Electricity | 0 (0.0%) | 38 (100.0%) |
| Fuel Oil or Kerosene | 0 (0.0%) | 0 (0.0%) |
| Coal or Coke | 0 (0.0%) | 0 (0.0%) |
| All other Fuels | 20 (12.0%) | 0 (0.0%) |
| No Fuel Used | 0 (0.0%) | 0 (0.0%) |
| Total | 167 (100.0%) | 38 (100.0%) |
Household Vehicle Usage in Mesita
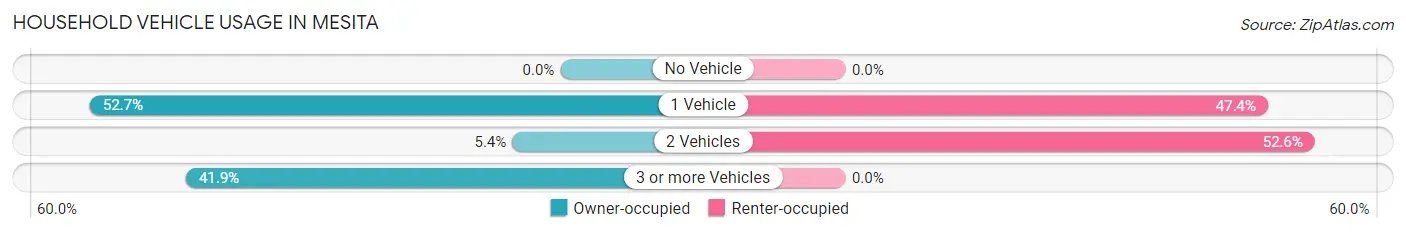
| Vehicles per Household | Owner-occupied | Renter-occupied |
| No Vehicle | 0 (0.0%) | 0 (0.0%) |
| 1 Vehicle | 88 (52.7%) | 18 (47.4%) |
| 2 Vehicles | 9 (5.4%) | 20 (52.6%) |
| 3 or more Vehicles | 70 (41.9%) | 0 (0.0%) |
| Total | 167 (100.0%) | 38 (100.0%) |
Real Estate & Mortgages in Mesita
Real Estate and Mortgage Overview in Mesita
| Characteristic | Without Mortgage | With Mortgage |
| Housing Units | 140 | 27 |
| Median Property Value | $36,900 | $0 |
| Median Household Income | - | - |
| Monthly Housing Costs | $270 | $0 |
| Real Estate Taxes | - | - |
Property Value by Mortgage Status in Mesita
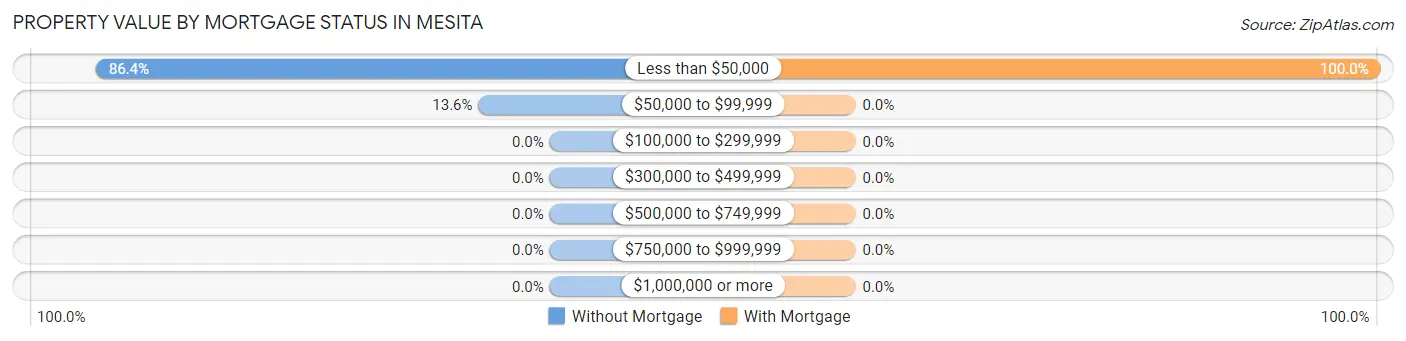
| Property Value | Without Mortgage | With Mortgage |
| Less than $50,000 | 121 (86.4%) | 27 (100.0%) |
| $50,000 to $99,999 | 19 (13.6%) | 0 (0.0%) |
| $100,000 to $299,999 | 0 (0.0%) | 0 (0.0%) |
| $300,000 to $499,999 | 0 (0.0%) | 0 (0.0%) |
| $500,000 to $749,999 | 0 (0.0%) | 0 (0.0%) |
| $750,000 to $999,999 | 0 (0.0%) | 0 (0.0%) |
| $1,000,000 or more | 0 (0.0%) | 0 (0.0%) |
| Total | 140 (100.0%) | 27 (100.0%) |
Household Income by Mortgage Status in Mesita
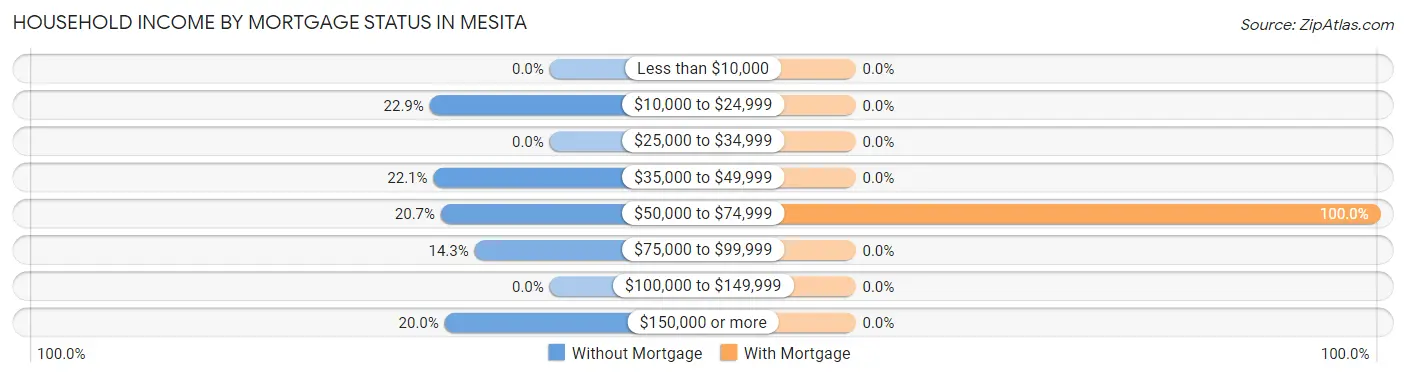
| Household Income | Without Mortgage | With Mortgage |
| Less than $10,000 | 0 (0.0%) | 0 (0.0%) |
| $10,000 to $24,999 | 32 (22.9%) | 0 (0.0%) |
| $25,000 to $34,999 | 0 (0.0%) | 0 (0.0%) |
| $35,000 to $49,999 | 31 (22.1%) | 0 (0.0%) |
| $50,000 to $74,999 | 29 (20.7%) | 27 (100.0%) |
| $75,000 to $99,999 | 20 (14.3%) | 0 (0.0%) |
| $100,000 to $149,999 | 0 (0.0%) | 0 (0.0%) |
| $150,000 or more | 28 (20.0%) | 0 (0.0%) |
| Total | 140 (100.0%) | 27 (100.0%) |
Property Value to Household Income Ratio in Mesita
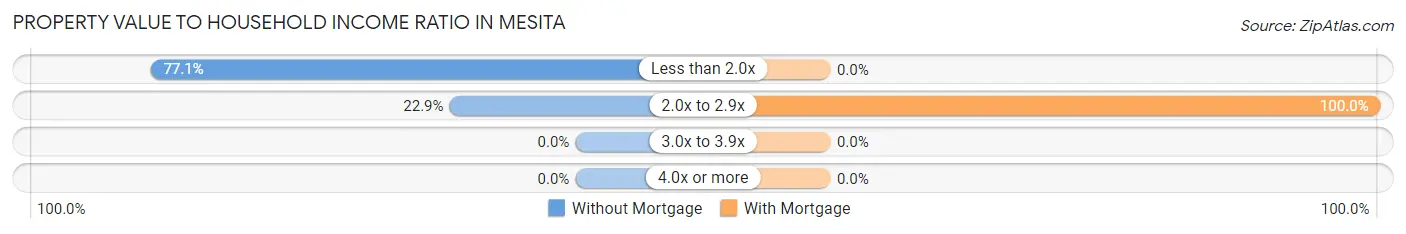
| Value-to-Income Ratio | Without Mortgage | With Mortgage |
| Less than 2.0x | 108 (77.1%) | 0 (0.0%) |
| 2.0x to 2.9x | 32 (22.9%) | 27 (100.0%) |
| 3.0x to 3.9x | 0 (0.0%) | 0 (0.0%) |
| 4.0x or more | 0 (0.0%) | 0 (0.0%) |
| Total | 140 (100.0%) | 27 (100.0%) |
Real Estate Taxes by Mortgage Status in Mesita
| Property Taxes | Without Mortgage | With Mortgage |
| Less than $800 | 0 (0.0%) | 0 (0.0%) |
| $800 to $1,499 | 0 (0.0%) | 0 (0.0%) |
| $800 to $1,499 | 0 (0.0%) | 0 (0.0%) |
| Total | 140 (100.0%) | 27 (100.0%) |
Health & Disability in Mesita
Health Insurance Coverage by Age in Mesita
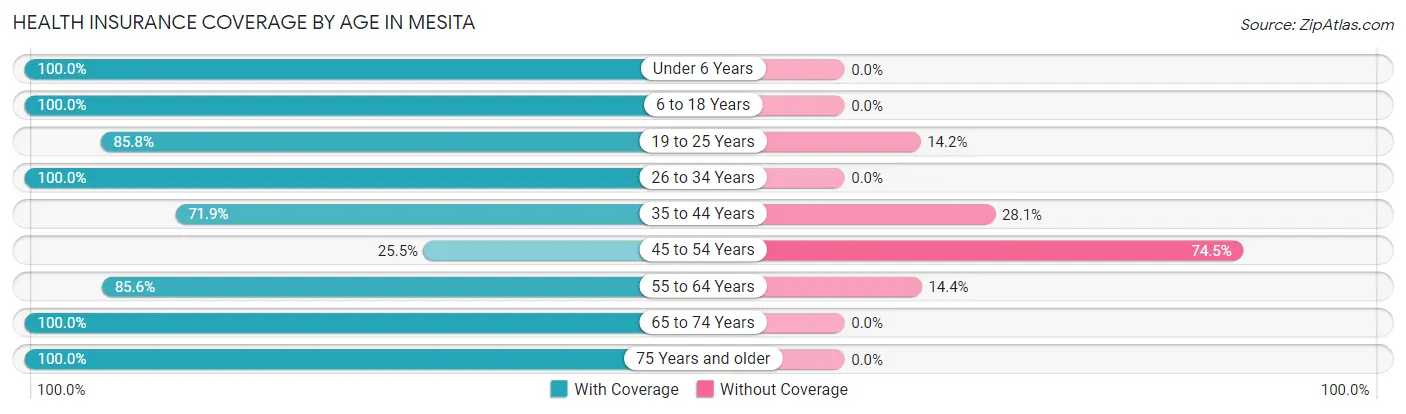
| Age Bracket | With Coverage | Without Coverage |
| Under 6 Years | 97 (100.0%) | 0 (0.0%) |
| 6 to 18 Years | 305 (100.0%) | 0 (0.0%) |
| 19 to 25 Years | 188 (85.8%) | 31 (14.2%) |
| 26 to 34 Years | 101 (100.0%) | 0 (0.0%) |
| 35 to 44 Years | 64 (71.9%) | 25 (28.1%) |
| 45 to 54 Years | 47 (25.5%) | 137 (74.5%) |
| 55 to 64 Years | 113 (85.6%) | 19 (14.4%) |
| 65 to 74 Years | 33 (100.0%) | 0 (0.0%) |
| 75 Years and older | 97 (100.0%) | 0 (0.0%) |
| Total | 1,045 (83.1%) | 212 (16.9%) |
Health Insurance Coverage by Citizenship Status in Mesita
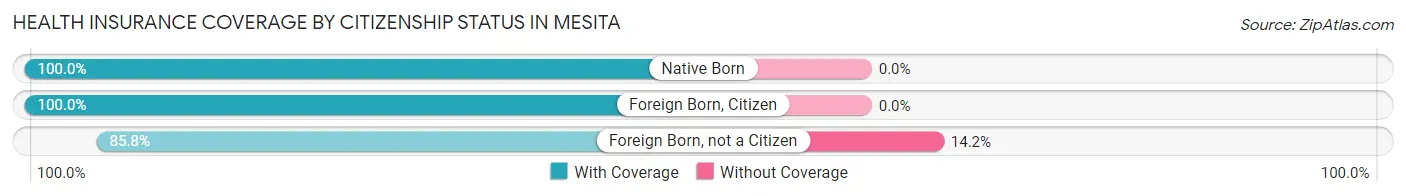
| Citizenship Status | With Coverage | Without Coverage |
| Native Born | 97 (100.0%) | 0 (0.0%) |
| Foreign Born, Citizen | 305 (100.0%) | 0 (0.0%) |
| Foreign Born, not a Citizen | 188 (85.8%) | 31 (14.2%) |
Health Insurance Coverage by Household Income in Mesita
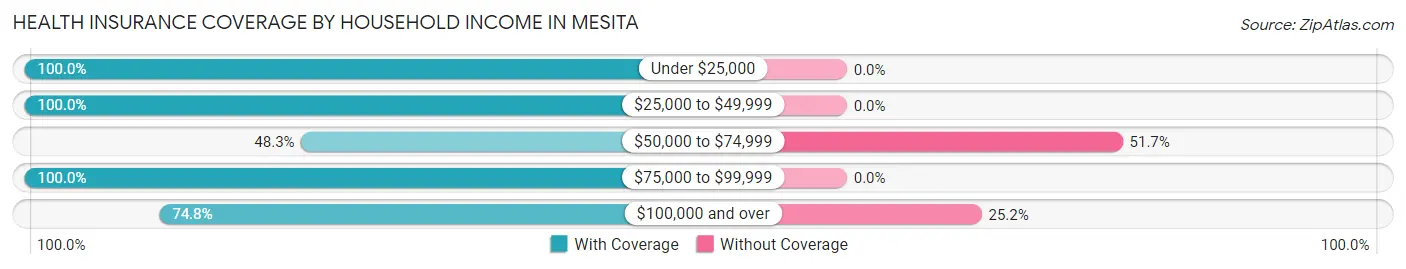
| Household Income | With Coverage | Without Coverage |
| Under $25,000 | 32 (100.0%) | 0 (0.0%) |
| $25,000 to $49,999 | 316 (100.0%) | 0 (0.0%) |
| $50,000 to $74,999 | 29 (48.3%) | 31 (51.7%) |
| $75,000 to $99,999 | 132 (100.0%) | 0 (0.0%) |
| $100,000 and over | 536 (74.8%) | 181 (25.2%) |
Public vs Private Health Insurance Coverage by Age in Mesita
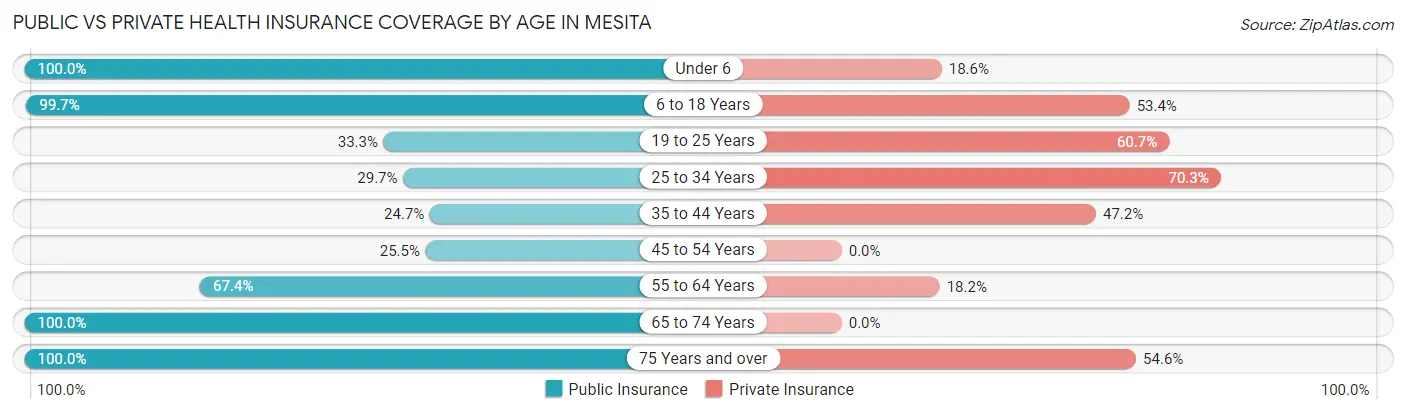
| Age Bracket | Public Insurance | Private Insurance |
| Under 6 | 97 (100.0%) | 18 (18.6%) |
| 6 to 18 Years | 304 (99.7%) | 163 (53.4%) |
| 19 to 25 Years | 73 (33.3%) | 133 (60.7%) |
| 25 to 34 Years | 30 (29.7%) | 71 (70.3%) |
| 35 to 44 Years | 22 (24.7%) | 42 (47.2%) |
| 45 to 54 Years | 47 (25.5%) | 0 (0.0%) |
| 55 to 64 Years | 89 (67.4%) | 24 (18.2%) |
| 65 to 74 Years | 33 (100.0%) | 0 (0.0%) |
| 75 Years and over | 97 (100.0%) | 53 (54.6%) |
| Total | 792 (63.0%) | 504 (40.1%) |
Disability Status by Sex by Age in Mesita
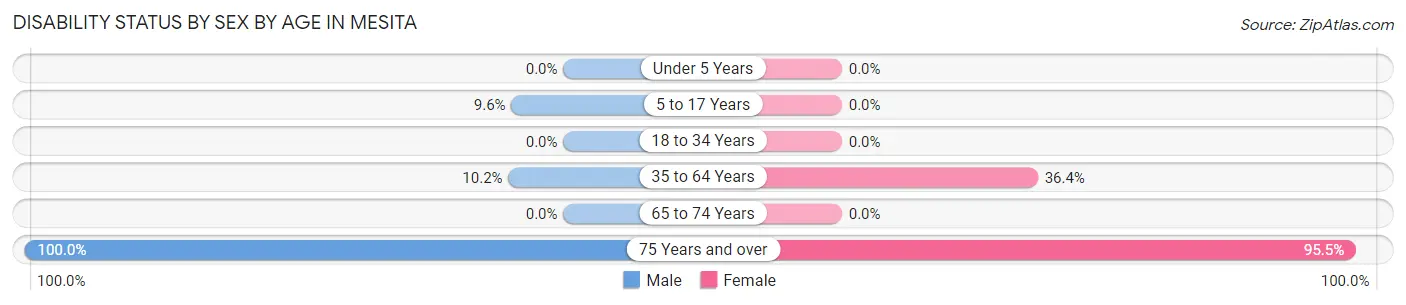
| Age Bracket | Male | Female |
| Under 5 Years | 0 (0.0%) | 0 (0.0%) |
| 5 to 17 Years | 19 (9.6%) | 0 (0.0%) |
| 18 to 34 Years | 0 (0.0%) | 0 (0.0%) |
| 35 to 64 Years | 20 (10.2%) | 76 (36.4%) |
| 65 to 74 Years | 0 (0.0%) | 0 (0.0%) |
| 75 Years and over | 31 (100.0%) | 63 (95.5%) |
Disability Class by Sex by Age in Mesita
Disability Class: Hearing Difficulty
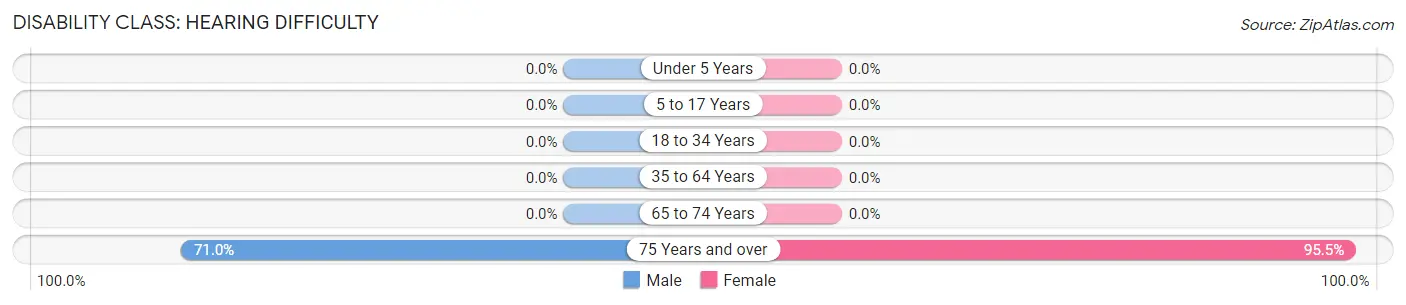
| Age Bracket | Male | Female |
| Under 5 Years | 0 (0.0%) | 0 (0.0%) |
| 5 to 17 Years | 0 (0.0%) | 0 (0.0%) |
| 18 to 34 Years | 0 (0.0%) | 0 (0.0%) |
| 35 to 64 Years | 0 (0.0%) | 0 (0.0%) |
| 65 to 74 Years | 0 (0.0%) | 0 (0.0%) |
| 75 Years and over | 22 (71.0%) | 63 (95.5%) |
Disability Class: Vision Difficulty
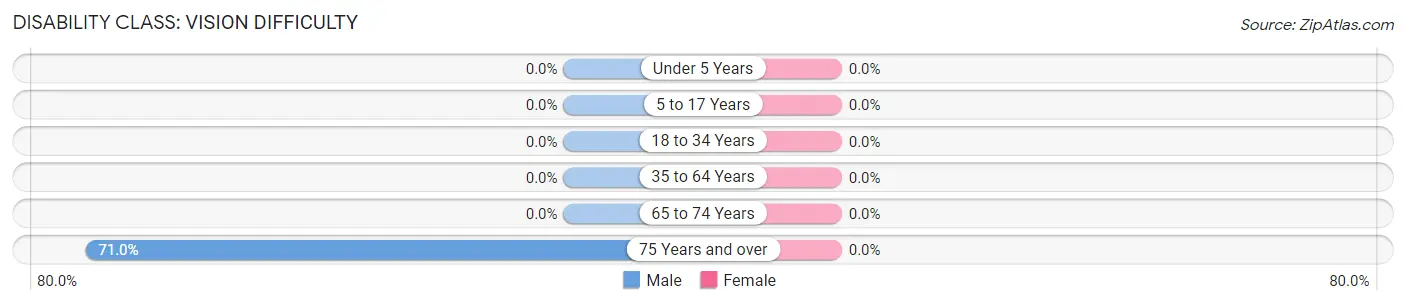
| Age Bracket | Male | Female |
| Under 5 Years | 0 (0.0%) | 0 (0.0%) |
| 5 to 17 Years | 0 (0.0%) | 0 (0.0%) |
| 18 to 34 Years | 0 (0.0%) | 0 (0.0%) |
| 35 to 64 Years | 0 (0.0%) | 0 (0.0%) |
| 65 to 74 Years | 0 (0.0%) | 0 (0.0%) |
| 75 Years and over | 22 (71.0%) | 0 (0.0%) |
Disability Class: Cognitive Difficulty
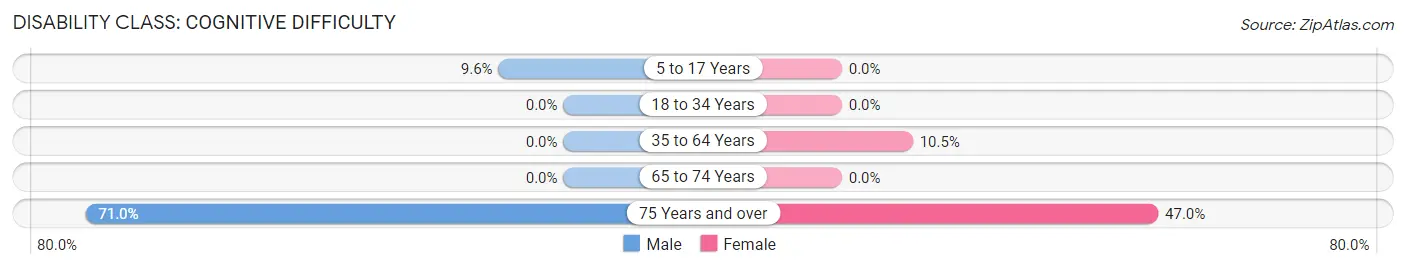
| Age Bracket | Male | Female |
| 5 to 17 Years | 19 (9.6%) | 0 (0.0%) |
| 18 to 34 Years | 0 (0.0%) | 0 (0.0%) |
| 35 to 64 Years | 0 (0.0%) | 22 (10.5%) |
| 65 to 74 Years | 0 (0.0%) | 0 (0.0%) |
| 75 Years and over | 22 (71.0%) | 31 (47.0%) |
Disability Class: Ambulatory Difficulty
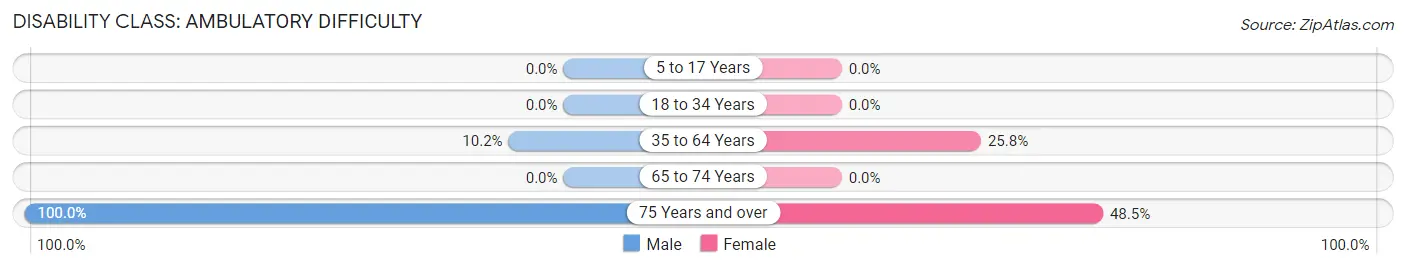
| Age Bracket | Male | Female |
| 5 to 17 Years | 0 (0.0%) | 0 (0.0%) |
| 18 to 34 Years | 0 (0.0%) | 0 (0.0%) |
| 35 to 64 Years | 20 (10.2%) | 54 (25.8%) |
| 65 to 74 Years | 0 (0.0%) | 0 (0.0%) |
| 75 Years and over | 31 (100.0%) | 32 (48.5%) |
Disability Class: Self-Care Difficulty
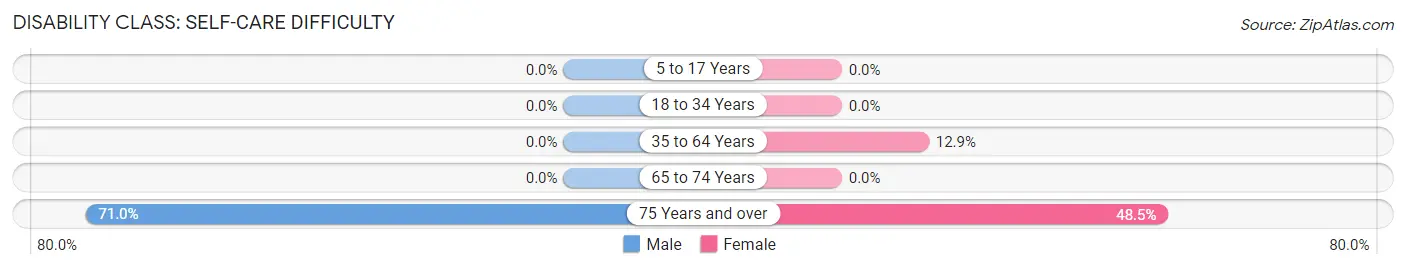
| Age Bracket | Male | Female |
| 5 to 17 Years | 0 (0.0%) | 0 (0.0%) |
| 18 to 34 Years | 0 (0.0%) | 0 (0.0%) |
| 35 to 64 Years | 0 (0.0%) | 27 (12.9%) |
| 65 to 74 Years | 0 (0.0%) | 0 (0.0%) |
| 75 Years and over | 22 (71.0%) | 32 (48.5%) |
Technology Access in Mesita
Computing Device Access in Mesita
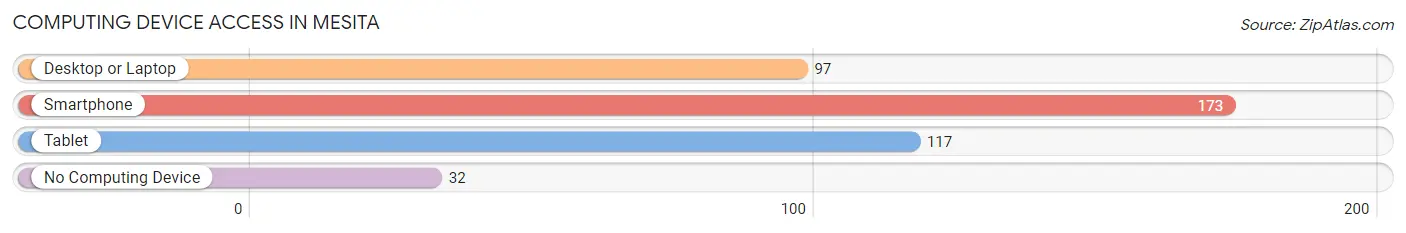
| Device Type | # Households | % Households |
| Desktop or Laptop | 97 | 47.3% |
| Smartphone | 173 | 84.4% |
| Tablet | 117 | 57.1% |
| No Computing Device | 32 | 15.6% |
| Total | 205 | 100.0% |
Internet Access in Mesita
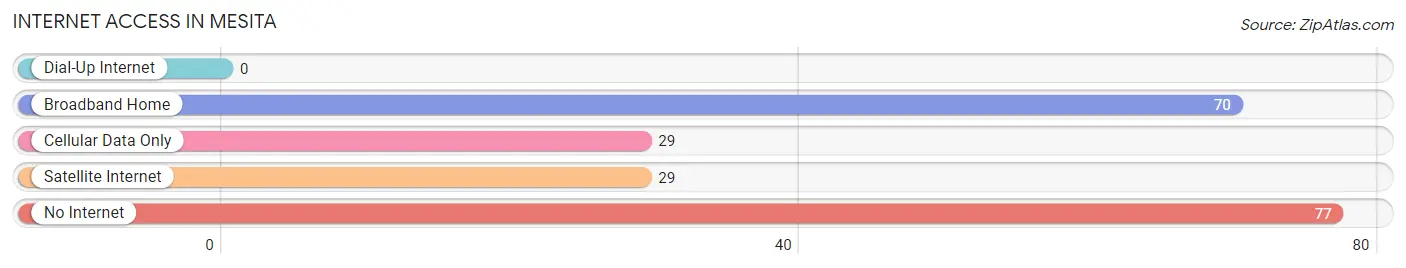
| Internet Type | # Households | % Households |
| Dial-Up Internet | 0 | 0.0% |
| Broadband Home | 70 | 34.2% |
| Cellular Data Only | 29 | 14.1% |
| Satellite Internet | 29 | 14.1% |
| No Internet | 77 | 37.6% |
| Total | 205 | 100.0% |
Mesita Summary
Mesita is a small unincorporated community located in Socorro County, New Mexico. It is situated in the Rio Grande Valley, approximately 25 miles south of Socorro and 40 miles north of Las Cruces. The population of Mesita was estimated to be around 1,000 in 2000.
History
Mesita was founded in the late 1800s by a group of Mexican settlers who were looking for a place to settle and farm. The area was originally known as “La Mesita”, which translates to “the little table” in Spanish. The name was chosen because of the flat terrain of the area, which resembled a table top.
The first settlers in Mesita were mostly farmers and ranchers, and the area quickly became known for its agricultural production. The main crops grown in the area were corn, wheat, and alfalfa. The area also had a thriving dairy industry, with several local dairies producing milk and cheese.
In the early 1900s, Mesita began to grow and develop. The first school was built in 1910, and the first post office was established in 1912. The town also had a general store, a blacksmith shop, and a few other businesses.
Geography
Mesita is located in the Rio Grande Valley, which is a large valley that stretches from El Paso, Texas to Albuquerque, New Mexico. The valley is bordered by the Rio Grande River to the east and the San Mateo Mountains to the west. The area is mostly flat, with some rolling hills and mesas.
The climate in Mesita is semi-arid, with hot summers and mild winters. The average annual temperature is around 70 degrees Fahrenheit. The area receives an average of 12 inches of precipitation per year, mostly in the form of snow during the winter months.
Economy
The economy of Mesita is largely based on agriculture. The main crops grown in the area are corn, wheat, and alfalfa. The area also has a thriving dairy industry, with several local dairies producing milk and cheese.
In addition to agriculture, Mesita also has a few small businesses, including a general store, a blacksmith shop, and a few other businesses. The town also has a few restaurants and bars.
Demographics
As of the 2000 census, the population of Mesita was estimated to be around 1,000. The racial makeup of the town was 94.7% Hispanic, 4.2% White, and 0.1% Native American. The median household income was $20,000, and the median age was 28.
Mesita is a small, rural community with a strong sense of community and a rich cultural heritage. The town is home to a variety of festivals and events throughout the year, including the annual Mesita Fiesta, which celebrates the town’s Mexican heritage. The town also has a few churches, a library, and a community center.
Common Questions
What is Per Capita Income in Mesita?
Per Capita income in Mesita is $23,077.
What is the Median Household income in Mesita?
Median Household Income in Mesita is $49,719.
What is Inequality or Gini Index in Mesita?
Inequality or Gini Index in Mesita is 0.47.
What is the Total Population of Mesita?
Total Population of Mesita is 1,270.
What is the Total Male Population of Mesita?
Total Male Population of Mesita is 708.
What is the Total Female Population of Mesita?
Total Female Population of Mesita is 562.
What is the Ratio of Males per 100 Females in Mesita?
There are 125.98 Males per 100 Females in Mesita.
What is the Ratio of Females per 100 Males in Mesita?
There are 79.38 Females per 100 Males in Mesita.
What is the Median Population Age in Mesita?
Median Population Age in Mesita is 27.4 Years.
What is the Average Family Size in Mesita
Average Family Size in Mesita is 7.1 People.
What is the Average Household Size in Mesita
Average Household Size in Mesita is 6.1 People.
How Large is the Labor Force in Mesita?
There are 499 People in the Labor Forcein in Mesita.
What is the Percentage of People in the Labor Force in Mesita?
57.4% of People are in the Labor Force in Mesita.
What is the Unemployment Rate in Mesita?
Unemployment Rate in Mesita is 5.6%.