Lake Valley, NM Map & Demographics
Lake Valley Map
Lake Valley Overview
$28,315
PER CAPITA INCOME
$78,370
AVG FAMILY INCOME
$77,880
AVG HOUSEHOLD INCOME
0.21
INEQUALITY / GINI INDEX
98
TOTAL POPULATION
28
MALE POPULATION
70
FEMALE POPULATION
40.00
MALES / 100 FEMALES
250.00
FEMALES / 100 MALES
53.9
MEDIAN AGE
2.6
AVG FAMILY SIZE
2.3
AVG HOUSEHOLD SIZE
48
LABOR FORCE [ PEOPLE ]
51.1%
PERCENT IN LABOR FORCE
10.4%
UNEMPLOYMENT RATE
Income in Lake Valley
Income Overview in Lake Valley
Per Capita Income in Lake Valley is $28,315, while median incomes of families and households are $78,370 and $77,880 respectively.
| Characteristic | Number | Measure |
| Per Capita Income | 98 | $28,315 |
| Median Family Income | 34 | $78,370 |
| Mean Family Income | 34 | $69,600 |
| Median Household Income | 43 | $77,880 |
| Mean Household Income | 43 | $61,602 |
| Income Deficit | 34 | $0 |
| Wage / Income Gap (%) | 98 | 0.00% |
| Wage / Income Gap ($) | 98 | 100.00¢ per $1 |
| Gini / Inequality Index | 98 | 0.21 |
Earnings by Sex in Lake Valley
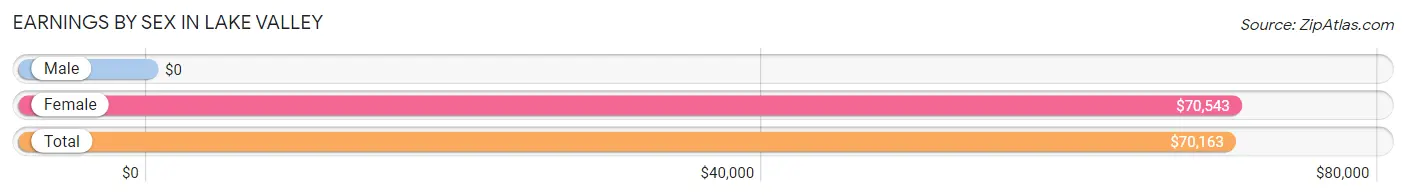
| Sex | Number | Average Earnings |
| Male | 7 (16.3%) | $0 |
| Female | 36 (83.7%) | $70,543 |
| Total | 43 (100.0%) | $70,163 |
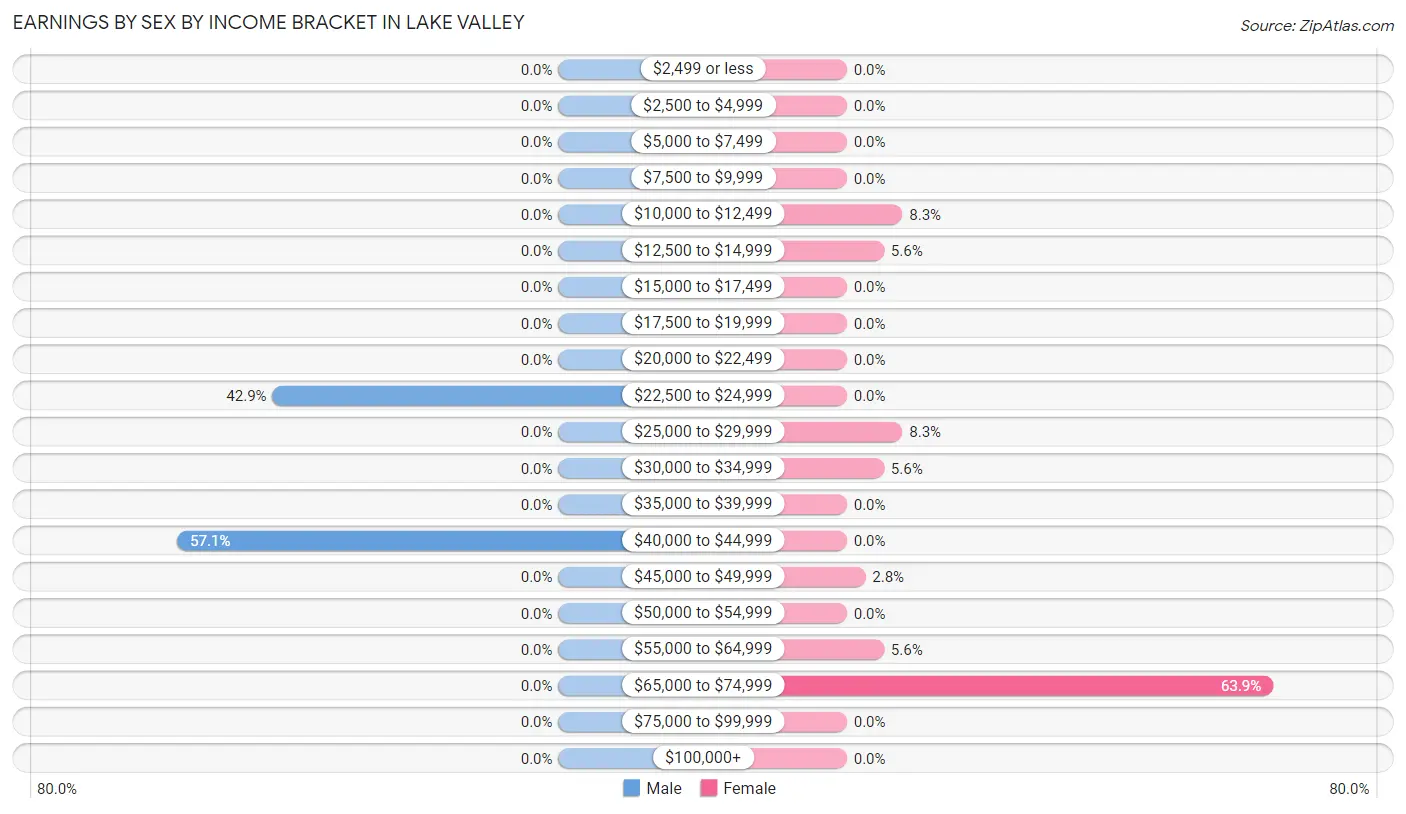
Earnings by Sex by Income Bracket in Lake Valley
The most common earnings brackets in Lake Valley are $40,000 to $44,999 for men (4 | 57.1%) and $65,000 to $74,999 for women (23 | 63.9%).
| Income | Male | Female |
| $2,499 or less | 0 (0.0%) | 0 (0.0%) |
| $2,500 to $4,999 | 0 (0.0%) | 0 (0.0%) |
| $5,000 to $7,499 | 0 (0.0%) | 0 (0.0%) |
| $7,500 to $9,999 | 0 (0.0%) | 0 (0.0%) |
| $10,000 to $12,499 | 0 (0.0%) | 3 (8.3%) |
| $12,500 to $14,999 | 0 (0.0%) | 2 (5.6%) |
| $15,000 to $17,499 | 0 (0.0%) | 0 (0.0%) |
| $17,500 to $19,999 | 0 (0.0%) | 0 (0.0%) |
| $20,000 to $22,499 | 0 (0.0%) | 0 (0.0%) |
| $22,500 to $24,999 | 3 (42.9%) | 0 (0.0%) |
| $25,000 to $29,999 | 0 (0.0%) | 3 (8.3%) |
| $30,000 to $34,999 | 0 (0.0%) | 2 (5.6%) |
| $35,000 to $39,999 | 0 (0.0%) | 0 (0.0%) |
| $40,000 to $44,999 | 4 (57.1%) | 0 (0.0%) |
| $45,000 to $49,999 | 0 (0.0%) | 1 (2.8%) |
| $50,000 to $54,999 | 0 (0.0%) | 0 (0.0%) |
| $55,000 to $64,999 | 0 (0.0%) | 2 (5.6%) |
| $65,000 to $74,999 | 0 (0.0%) | 23 (63.9%) |
| $75,000 to $99,999 | 0 (0.0%) | 0 (0.0%) |
| $100,000+ | 0 (0.0%) | 0 (0.0%) |
| Total | 7 (100.0%) | 36 (100.0%) |
Earnings by Sex by Educational Attainment in Lake Valley
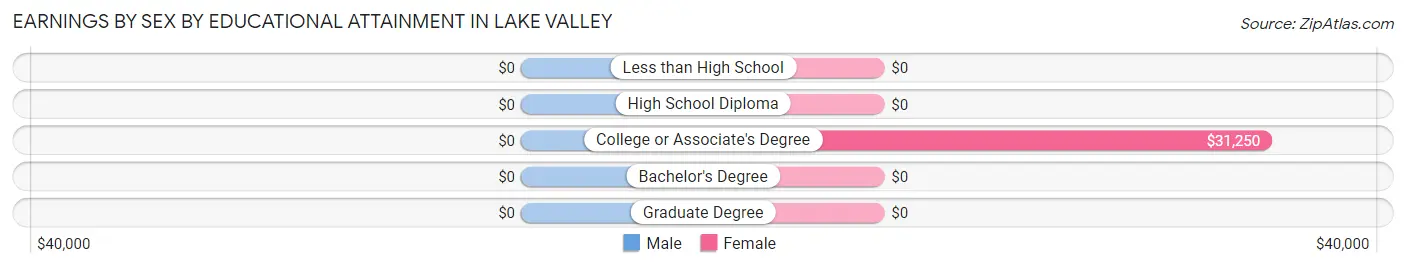
| Educational Attainment | Male Income | Female Income |
| Less than High School | - | - |
| High School Diploma | - | - |
| College or Associate's Degree | - | - |
| Bachelor's Degree | - | - |
| Graduate Degree | - | - |
| Total | - | - |
Family Income in Lake Valley
Family Income Brackets in Lake Valley
According to the Lake Valley family income data, there are 25 families falling into the $75,000 to $99,999 income range, which is the most common income bracket and makes up 73.5% of all families.
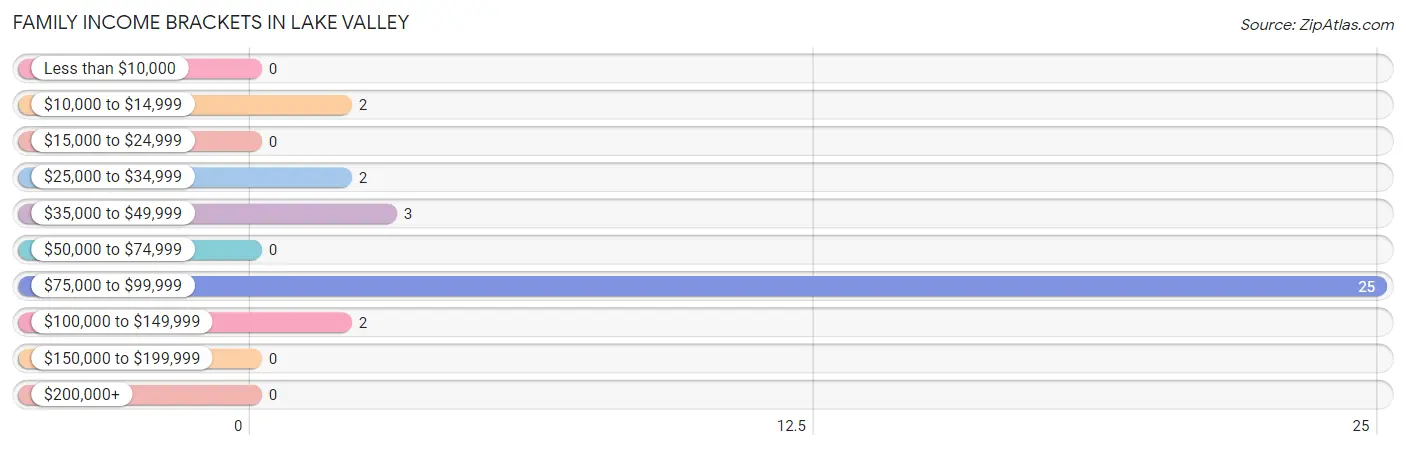
| Income Bracket | # Families | % Families |
| Less than $10,000 | 0 | 0.0% |
| $10,000 to $14,999 | 2 | 5.9% |
| $15,000 to $24,999 | 0 | 0.0% |
| $25,000 to $34,999 | 2 | 5.9% |
| $35,000 to $49,999 | 3 | 8.8% |
| $50,000 to $74,999 | 0 | 0.0% |
| $75,000 to $99,999 | 25 | 73.5% |
| $100,000 to $149,999 | 2 | 5.9% |
| $150,000 to $199,999 | 0 | 0.0% |
| $200,000+ | 0 | 0.0% |
Family Income by Famaliy Size in Lake Valley
2-person families (29 | 85.3%) account for the highest median family income in Lake Valley with $78,424 per family, while 2-person families (29 | 85.3%) have the highest median income of $39,212 per family member.
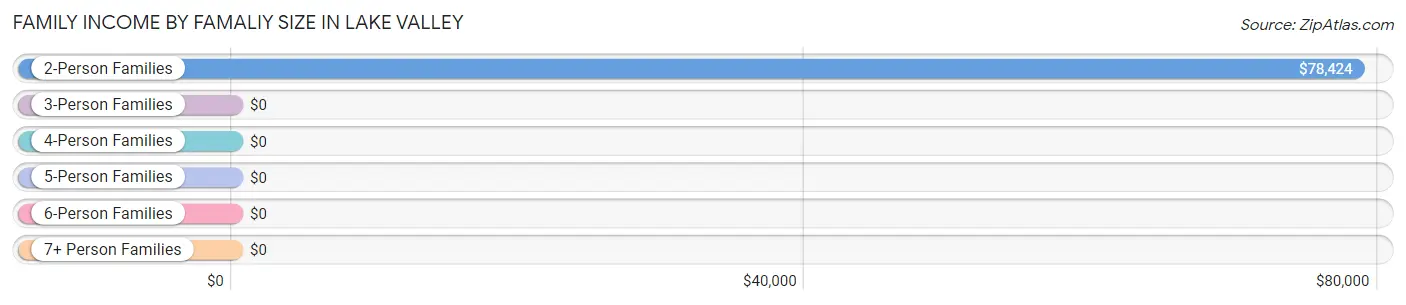
| Income Bracket | # Families | Median Income |
| 2-Person Families | 29 (85.3%) | $78,424 |
| 3-Person Families | 1 (2.9%) | $0 |
| 4-Person Families | 4 (11.8%) | $0 |
| 5-Person Families | 0 (0.0%) | $0 |
| 6-Person Families | 0 (0.0%) | $0 |
| 7+ Person Families | 0 (0.0%) | $0 |
| Total | 34 (100.0%) | $78,370 |
Family Income by Number of Earners in Lake Valley
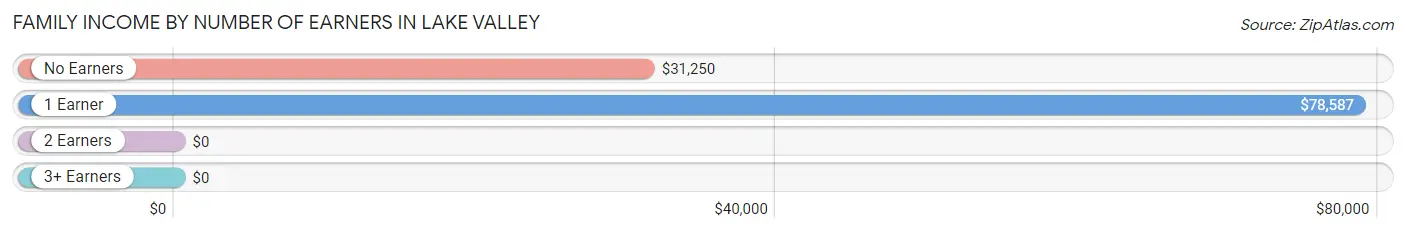
| Number of Earners | # Families | Median Income |
| No Earners | 6 (17.6%) | $31,250 |
| 1 Earner | 26 (76.5%) | $78,587 |
| 2 Earners | 0 (0.0%) | $0 |
| 3+ Earners | 2 (5.9%) | $0 |
| Total | 34 (100.0%) | $78,370 |
Household Income in Lake Valley
Household Income Brackets in Lake Valley
With 25 households falling in the category, the $75,000 to $99,999 income range is the most frequent in Lake Valley, accounting for 58.1% of all households.
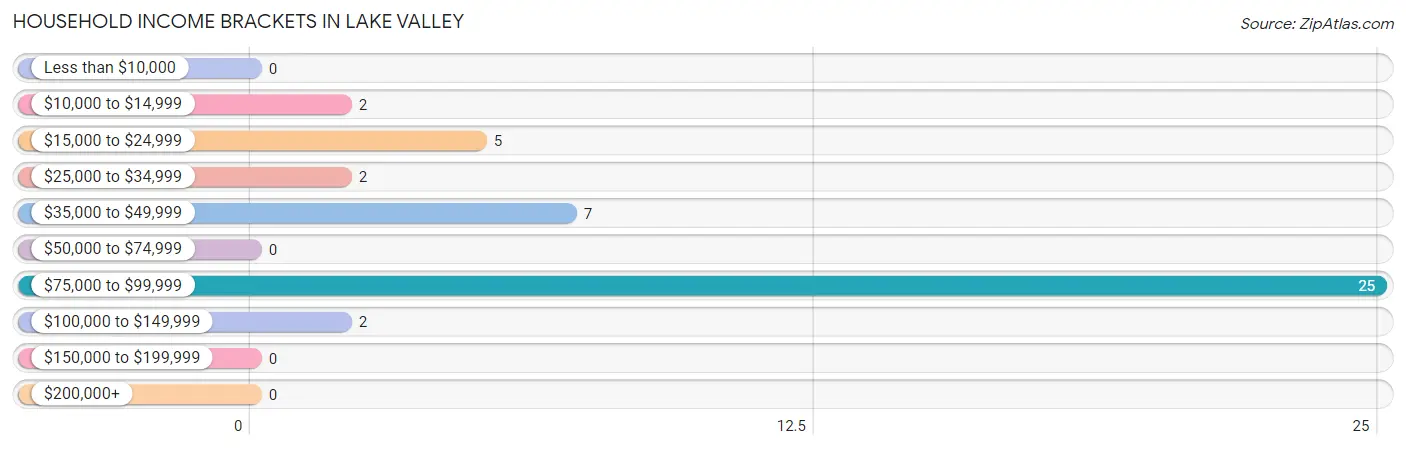
| Income Bracket | # Households | % Households |
| Less than $10,000 | 0 | 0.0% |
| $10,000 to $14,999 | 2 | 4.7% |
| $15,000 to $24,999 | 5 | 11.6% |
| $25,000 to $34,999 | 2 | 4.7% |
| $35,000 to $49,999 | 7 | 16.3% |
| $50,000 to $74,999 | 0 | 0.0% |
| $75,000 to $99,999 | 25 | 58.1% |
| $100,000 to $149,999 | 2 | 4.7% |
| $150,000 to $199,999 | 0 | 0.0% |
| $200,000+ | 0 | 0.0% |
Household Income by Householder Age in Lake Valley
The median household income in Lake Valley is $77,880, with the highest median household income of $78,370 found in the 45 to 64 years age bracket for the primary householder. A total of 34 households (79.1%) fall into this category.
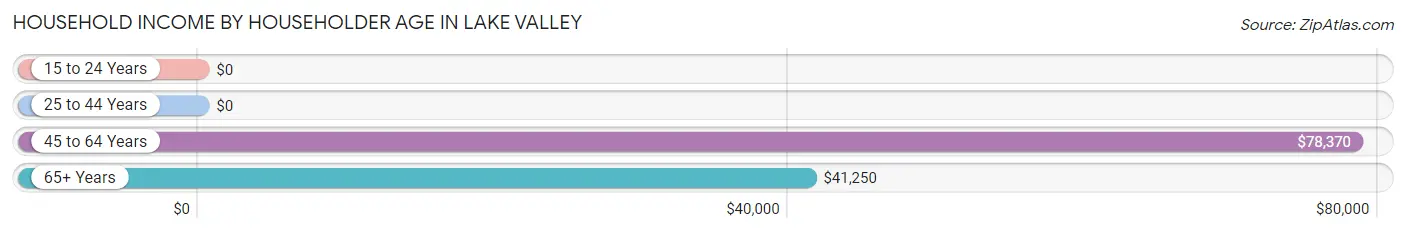
| Income Bracket | # Households | Median Income |
| 15 to 24 Years | 0 (0.0%) | $0 |
| 25 to 44 Years | 3 (7.0%) | $0 |
| 45 to 64 Years | 34 (79.1%) | $78,370 |
| 65+ Years | 6 (14.0%) | $41,250 |
| Total | 43 (100.0%) | $77,880 |
Poverty in Lake Valley
Income Below Poverty by Sex and Age in Lake Valley
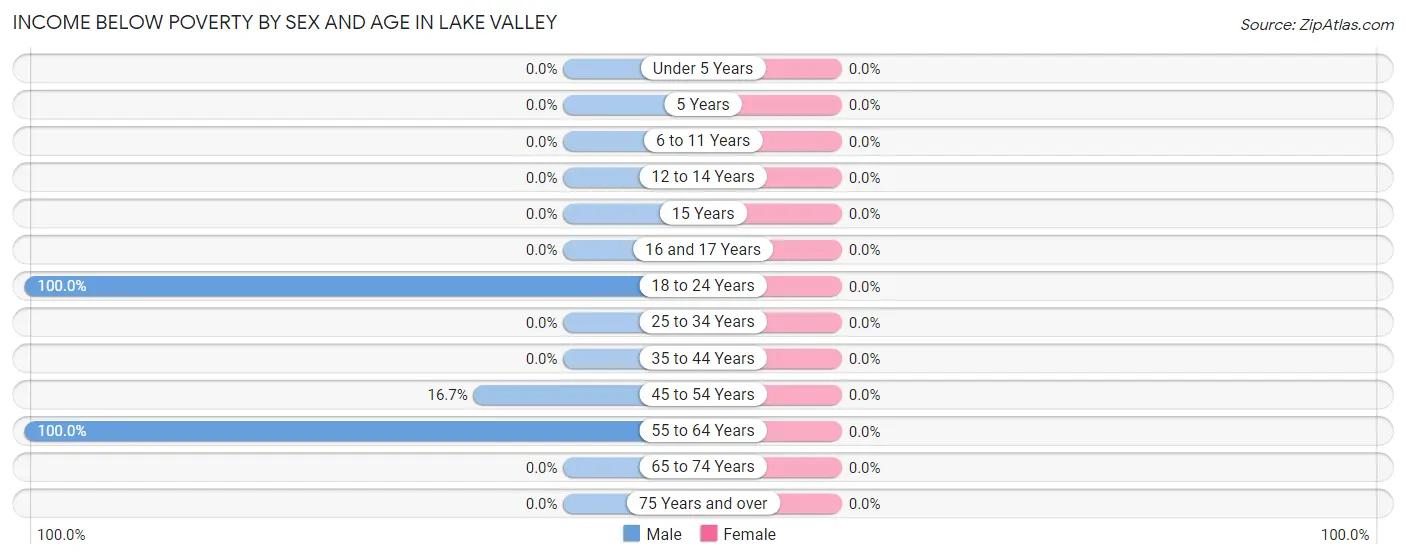
| Age Bracket | Male | Female |
| Under 5 Years | 0 (0.0%) | 0 (0.0%) |
| 5 Years | 0 (0.0%) | 0 (0.0%) |
| 6 to 11 Years | 0 (0.0%) | 0 (0.0%) |
| 12 to 14 Years | 0 (0.0%) | 0 (0.0%) |
| 15 Years | 0 (0.0%) | 0 (0.0%) |
| 16 and 17 Years | 0 (0.0%) | 0 (0.0%) |
| 18 to 24 Years | 3 (100.0%) | 0 (0.0%) |
| 25 to 34 Years | 0 (0.0%) | 0 (0.0%) |
| 35 to 44 Years | 0 (0.0%) | 0 (0.0%) |
| 45 to 54 Years | 2 (16.7%) | 0 (0.0%) |
| 55 to 64 Years | 2 (100.0%) | 0 (0.0%) |
| 65 to 74 Years | 0 (0.0%) | 0 (0.0%) |
| 75 Years and over | 0 (0.0%) | 0 (0.0%) |
| Total | 7 (25.0%) | 0 (0.0%) |
Income Above Poverty by Sex and Age in Lake Valley
According to the poverty statistics in Lake Valley, males aged 6 to 11 years and females aged 25 to 34 years are the age groups that are most secure financially, with 100.0% of males and 100.0% of females in these age groups living above the poverty line.
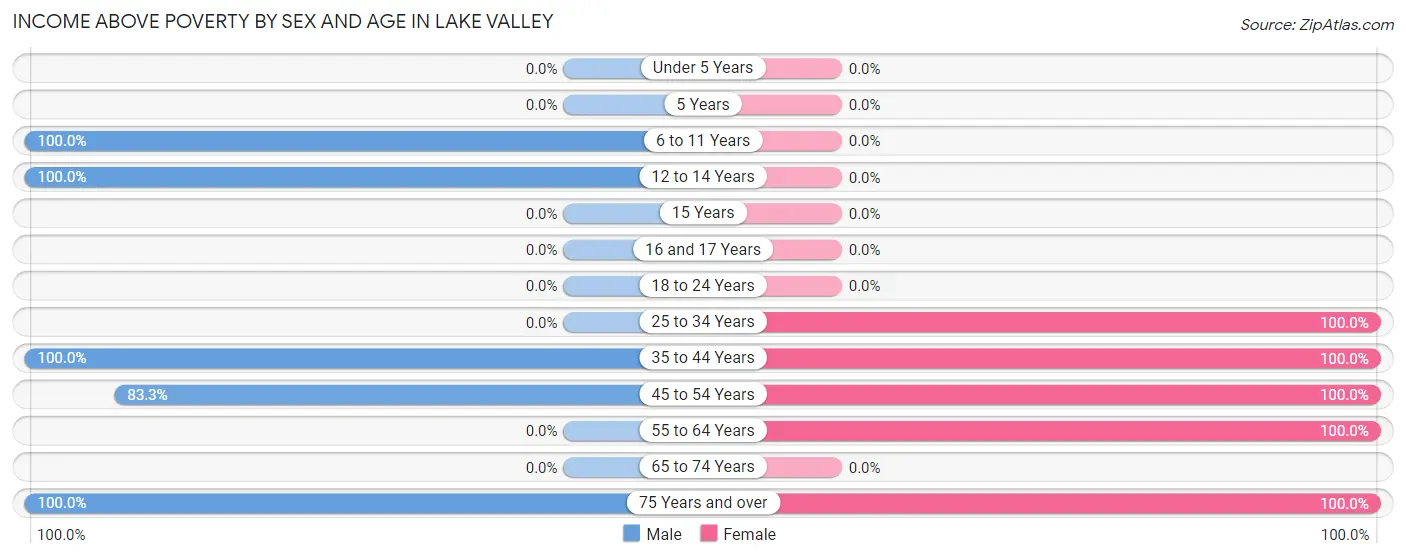
| Age Bracket | Male | Female |
| Under 5 Years | 0 (0.0%) | 0 (0.0%) |
| 5 Years | 0 (0.0%) | 0 (0.0%) |
| 6 to 11 Years | 2 (100.0%) | 0 (0.0%) |
| 12 to 14 Years | 2 (100.0%) | 0 (0.0%) |
| 15 Years | 0 (0.0%) | 0 (0.0%) |
| 16 and 17 Years | 0 (0.0%) | 0 (0.0%) |
| 18 to 24 Years | 0 (0.0%) | 0 (0.0%) |
| 25 to 34 Years | 0 (0.0%) | 5 (100.0%) |
| 35 to 44 Years | 3 (100.0%) | 7 (100.0%) |
| 45 to 54 Years | 10 (83.3%) | 24 (100.0%) |
| 55 to 64 Years | 0 (0.0%) | 4 (100.0%) |
| 65 to 74 Years | 0 (0.0%) | 0 (0.0%) |
| 75 Years and over | 4 (100.0%) | 30 (100.0%) |
| Total | 21 (75.0%) | 70 (100.0%) |
Income Below Poverty Among Married-Couple Families in Lake Valley
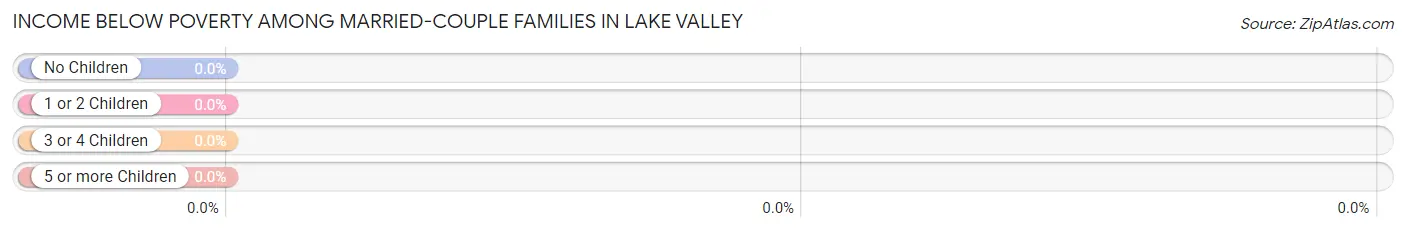
| Children | Above Poverty | Below Poverty |
| No Children | 3 (100.0%) | 0 (0.0%) |
| 1 or 2 Children | 0 (0.0%) | 0 (0.0%) |
| 3 or 4 Children | 0 (0.0%) | 0 (0.0%) |
| 5 or more Children | 0 (0.0%) | 0 (0.0%) |
| Total | 3 (100.0%) | 0 (0.0%) |
Income Below Poverty Among Single-Parent Households in Lake Valley
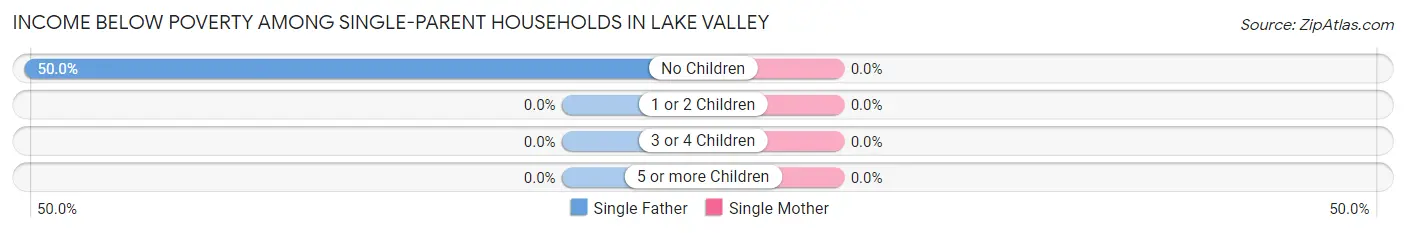
| Children | Single Father | Single Mother |
| No Children | 2 (50.0%) | 0 (0.0%) |
| 1 or 2 Children | 0 (0.0%) | 0 (0.0%) |
| 3 or 4 Children | 0 (0.0%) | 0 (0.0%) |
| 5 or more Children | 0 (0.0%) | 0 (0.0%) |
| Total | 2 (50.0%) | 0 (0.0%) |
Income Below Poverty Among Married-Couple vs Single-Parent Households in Lake Valley
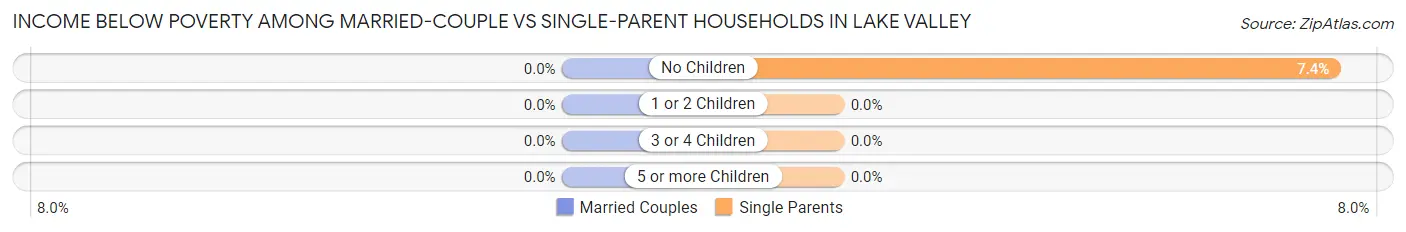
| Children | Married-Couple Families | Single-Parent Households |
| No Children | 0 (0.0%) | 2 (7.4%) |
| 1 or 2 Children | 0 (0.0%) | 0 (0.0%) |
| 3 or 4 Children | 0 (0.0%) | 0 (0.0%) |
| 5 or more Children | 0 (0.0%) | 0 (0.0%) |
| Total | 0 (0.0%) | 2 (6.5%) |
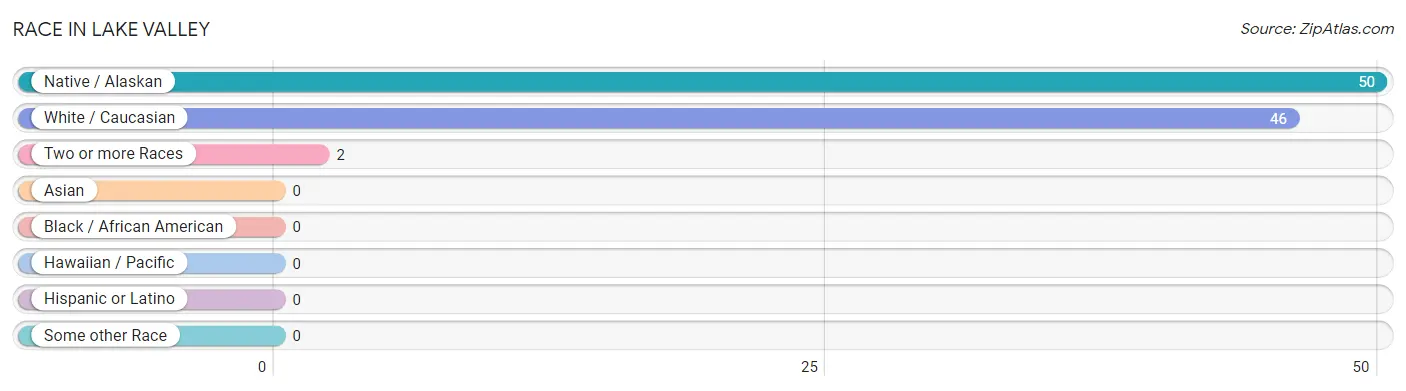
Race in Lake Valley
The most populous races in Lake Valley are Native / Alaskan (50 | 51.0%), White / Caucasian (46 | 46.9%), and Two or more Races (2 | 2.0%).
| Race | # Population | % Population |
| Asian | 0 | 0.0% |
| Black / African American | 0 | 0.0% |
| Hawaiian / Pacific | 0 | 0.0% |
| Hispanic or Latino | 0 | 0.0% |
| Native / Alaskan | 50 | 51.0% |
| White / Caucasian | 46 | 46.9% |
| Two or more Races | 2 | 2.0% |
| Some other Race | 0 | 0.0% |
| Total | 98 | 100.0% |
Ancestry in Lake Valley
The most populous ancestries reported in Lake Valley are Navajo (52 | 53.1%), German (23 | 23.5%), Irish (23 | 23.5%), and Apache (8 | 8.2%), together accounting for 108.2% of all Lake Valley residents.

| Ancestry | # Population | % Population |
| Apache | 8 | 8.2% |
| German | 23 | 23.5% |
| Irish | 23 | 23.5% |
| Navajo | 52 | 53.1% | View All 4 Rows |
Immigrants in Lake Valley

| Immigration Origin | # Population | % Population | View All 0 Rows |
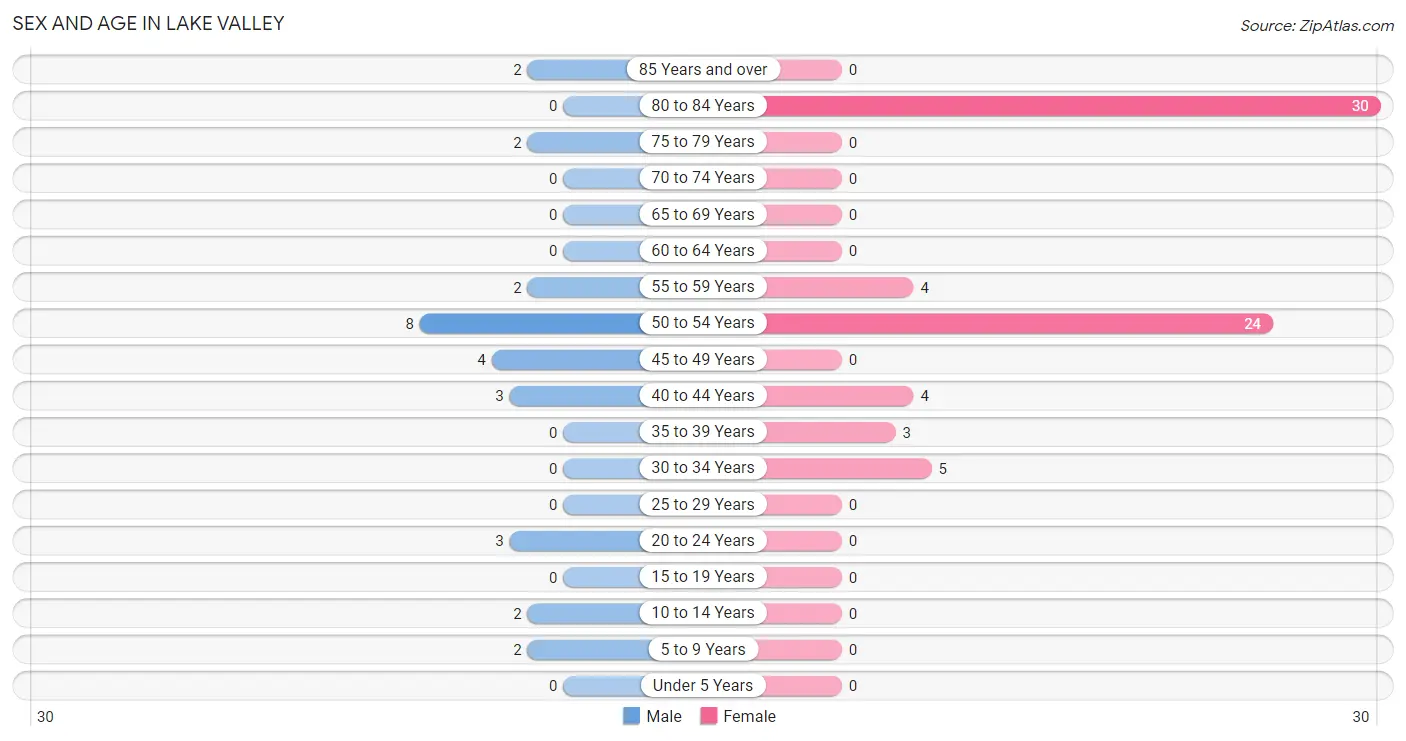
Sex and Age in Lake Valley
Sex and Age in Lake Valley
The most populous age groups in Lake Valley are 50 to 54 Years (8 | 28.6%) for men and 80 to 84 Years (30 | 42.9%) for women.
| Age Bracket | Male | Female |
| Under 5 Years | 0 (0.0%) | 0 (0.0%) |
| 5 to 9 Years | 2 (7.1%) | 0 (0.0%) |
| 10 to 14 Years | 2 (7.1%) | 0 (0.0%) |
| 15 to 19 Years | 0 (0.0%) | 0 (0.0%) |
| 20 to 24 Years | 3 (10.7%) | 0 (0.0%) |
| 25 to 29 Years | 0 (0.0%) | 0 (0.0%) |
| 30 to 34 Years | 0 (0.0%) | 5 (7.1%) |
| 35 to 39 Years | 0 (0.0%) | 3 (4.3%) |
| 40 to 44 Years | 3 (10.7%) | 4 (5.7%) |
| 45 to 49 Years | 4 (14.3%) | 0 (0.0%) |
| 50 to 54 Years | 8 (28.6%) | 24 (34.3%) |
| 55 to 59 Years | 2 (7.1%) | 4 (5.7%) |
| 60 to 64 Years | 0 (0.0%) | 0 (0.0%) |
| 65 to 69 Years | 0 (0.0%) | 0 (0.0%) |
| 70 to 74 Years | 0 (0.0%) | 0 (0.0%) |
| 75 to 79 Years | 2 (7.1%) | 0 (0.0%) |
| 80 to 84 Years | 0 (0.0%) | 30 (42.9%) |
| 85 Years and over | 2 (7.1%) | 0 (0.0%) |
| Total | 28 (100.0%) | 70 (100.0%) |
Families and Households in Lake Valley
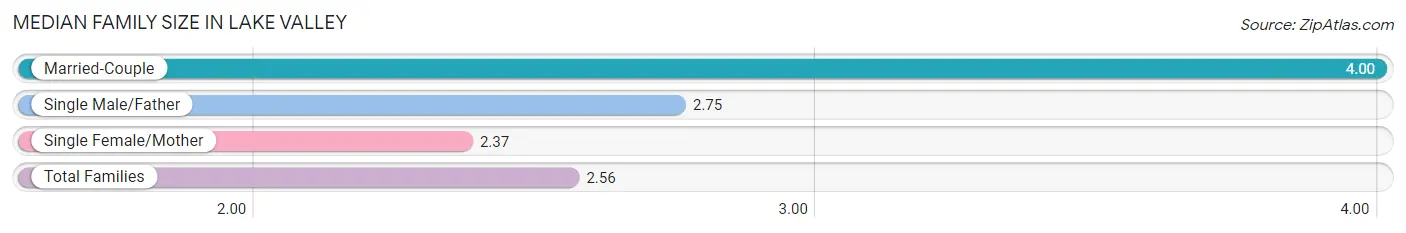
Median Family Size in Lake Valley
The median family size in Lake Valley is 2.56 persons per family, with married-couple families (3 | 8.8%) accounting for the largest median family size of 4 persons per family. On the other hand, single female/mother families (27 | 79.4%) represent the smallest median family size with 2.37 persons per family.
| Family Type | # Families | Family Size |
| Married-Couple | 3 (8.8%) | 4.00 |
| Single Male/Father | 4 (11.8%) | 2.75 |
| Single Female/Mother | 27 (79.4%) | 2.37 |
| Total Families | 34 (100.0%) | 2.56 |
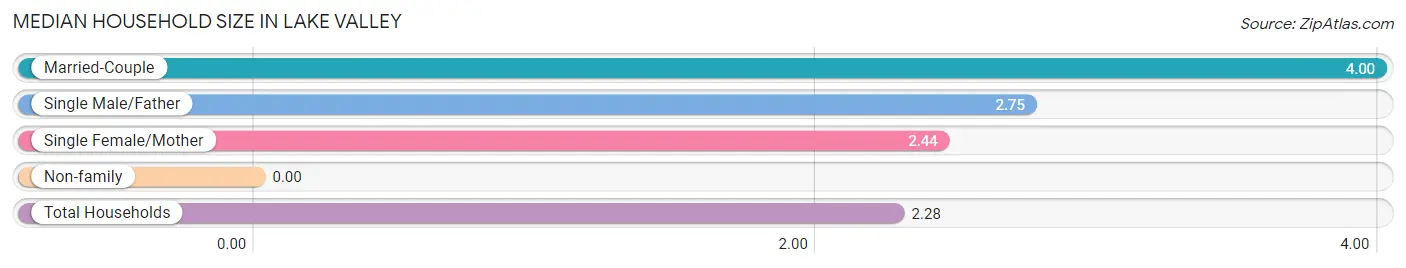
Median Household Size in Lake Valley
| Household Type | # Households | Household Size |
| Married-Couple | 3 (7.0%) | 4.00 |
| Single Male/Father | 4 (9.3%) | 2.75 |
| Single Female/Mother | 27 (62.8%) | 2.44 |
| Non-family | 9 (20.9%) | - |
| Total Households | 43 (100.0%) | 2.28 |
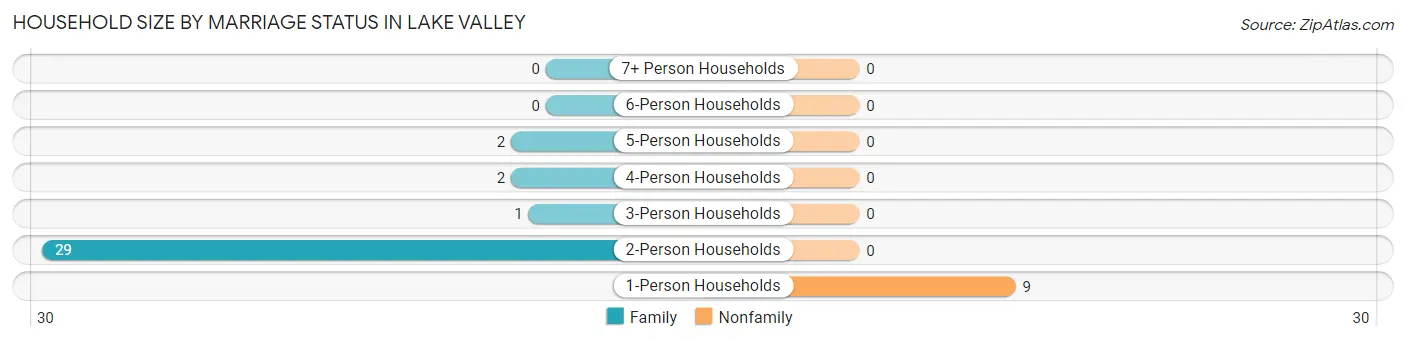
Household Size by Marriage Status in Lake Valley
Out of a total of 43 households in Lake Valley, 34 (79.1%) are family households, while 9 (20.9%) are nonfamily households. The most numerous type of family households are 2-person households, comprising 29, and the most common type of nonfamily households are 1-person households, comprising 9.
| Household Size | Family Households | Nonfamily Households |
| 1-Person Households | - | 9 (20.9%) |
| 2-Person Households | 29 (67.4%) | 0 (0.0%) |
| 3-Person Households | 1 (2.3%) | 0 (0.0%) |
| 4-Person Households | 2 (4.6%) | 0 (0.0%) |
| 5-Person Households | 2 (4.6%) | 0 (0.0%) |
| 6-Person Households | 0 (0.0%) | 0 (0.0%) |
| 7+ Person Households | 0 (0.0%) | 0 (0.0%) |
| Total | 34 (79.1%) | 9 (20.9%) |
Female Fertility in Lake Valley
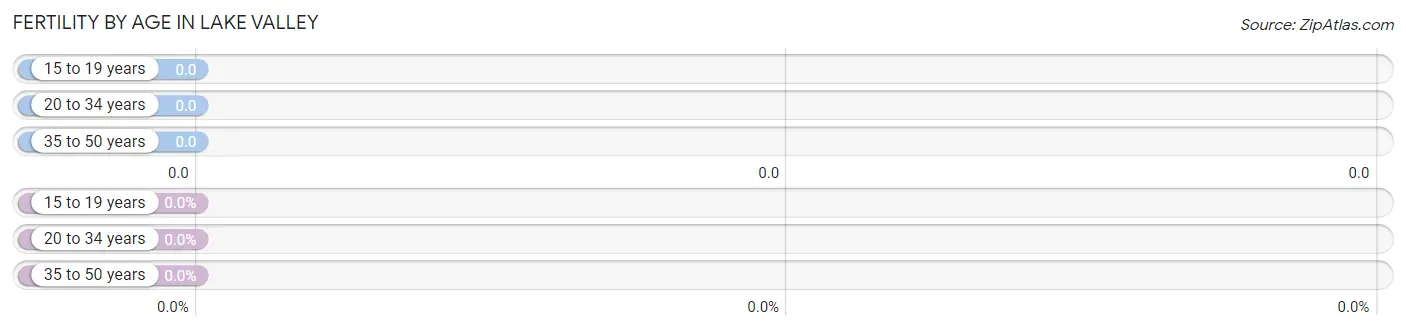
Fertility by Age in Lake Valley
| Age Bracket | Women with Births | Births / 1,000 Women |
| 15 to 19 years | 0 (0.0%) | 0.0 |
| 20 to 34 years | 0 (0.0%) | 0.0 |
| 35 to 50 years | 0 (0.0%) | 0.0 |
| Total | 0 (0.0%) | 0.0 |
Fertility by Age by Marriage Status in Lake Valley
| Age Bracket | Married | Unmarried |
| 15 to 19 years | 0 (0.0%) | 0 (0.0%) |
| 20 to 34 years | 0 (0.0%) | 0 (0.0%) |
| 35 to 50 years | 0 (0.0%) | 0 (0.0%) |
| Total | 0 (0.0%) | 0 (0.0%) |
Fertility by Education in Lake Valley
| Educational Attainment | Women with Births | Births / 1,000 Women |
| Less than High School | 0 (0.0%) | 0.0 |
| High School Diploma | 0 (0.0%) | 0.0 |
| College or Associate's Degree | 0 (0.0%) | 0.0 |
| Bachelor's Degree | 0 (0.0%) | 0.0 |
| Graduate Degree | 0 (0.0%) | 0.0 |
| Total | 0 (0.0%) | 0.0 |
Fertility by Education by Marriage Status in Lake Valley
| Educational Attainment | Married | Unmarried |
| Less than High School | 0 (0.0%) | 0 (0.0%) |
| High School Diploma | 0 (0.0%) | 0 (0.0%) |
| College or Associate's Degree | 0 (0.0%) | 0 (0.0%) |
| Bachelor's Degree | 0 (0.0%) | 0 (0.0%) |
| Graduate Degree | 0 (0.0%) | 0 (0.0%) |
| Total | 0 (0.0%) | 0 (0.0%) |
Employment Characteristics in Lake Valley
Employment by Class of Employer in Lake Valley
Among the 43 employed individuals in Lake Valley, federal government employees (23 | 53.5%), private company employees (9 | 20.9%), and not-for-profit organizations (4 | 9.3%) make up the most common classes of employment.
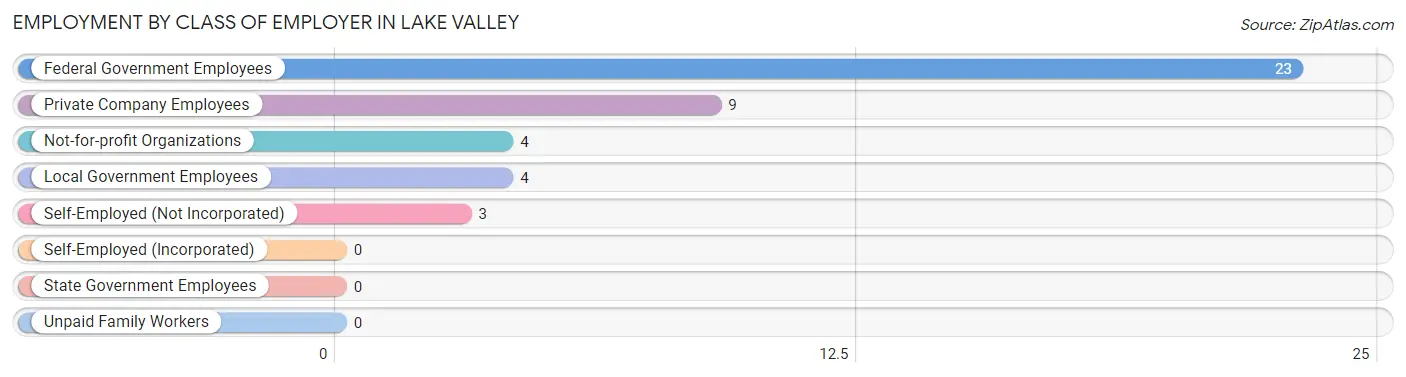
| Employer Class | # Employees | % Employees |
| Private Company Employees | 9 | 20.9% |
| Self-Employed (Incorporated) | 0 | 0.0% |
| Self-Employed (Not Incorporated) | 3 | 7.0% |
| Not-for-profit Organizations | 4 | 9.3% |
| Local Government Employees | 4 | 9.3% |
| State Government Employees | 0 | 0.0% |
| Federal Government Employees | 23 | 53.5% |
| Unpaid Family Workers | 0 | 0.0% |
| Total | 43 | 100.0% |
Employment Status by Age in Lake Valley
According to the labor force statistics for Lake Valley, out of the total population over 16 years of age (94), 51.1% or 48 individuals are in the labor force, with 10.4% or 5 of them unemployed. The age group with the highest labor force participation rate is 20 to 24 years, with 100.0% or 3 individuals in the labor force. Within the labor force, the 20 to 24 years age range has the highest percentage of unemployed individuals, with 100.0% or 3 of them being unemployed.
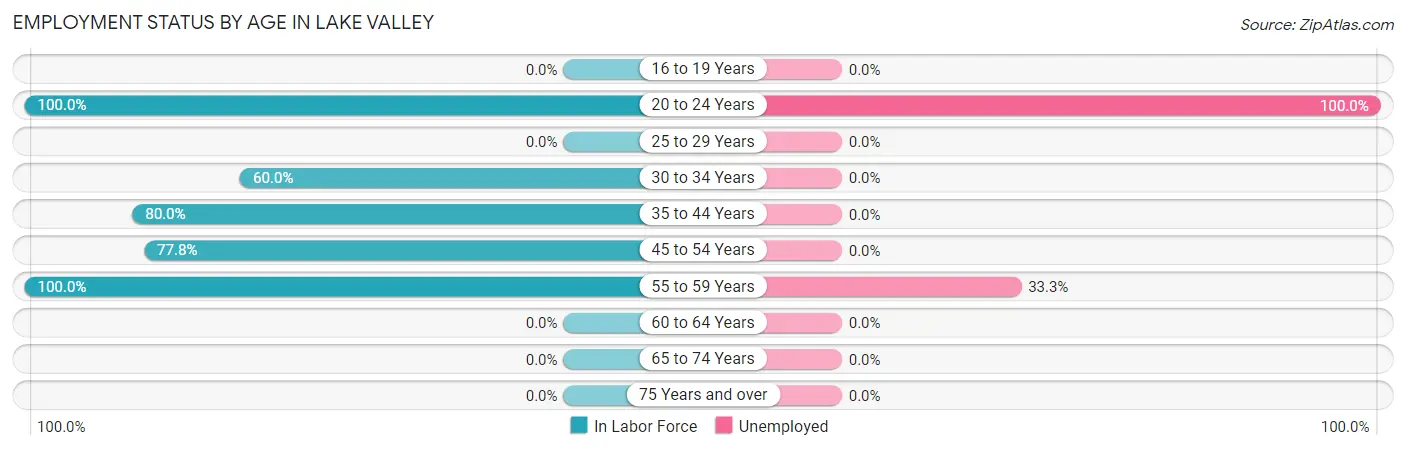
| Age Bracket | In Labor Force | Unemployed |
| 16 to 19 Years | 0 (0.0%) | 0 (0.0%) |
| 20 to 24 Years | 3 (100.0%) | 3 (100.0%) |
| 25 to 29 Years | 0 (0.0%) | 0 (0.0%) |
| 30 to 34 Years | 3 (60.0%) | 0 (0.0%) |
| 35 to 44 Years | 8 (80.0%) | 0 (0.0%) |
| 45 to 54 Years | 28 (77.8%) | 0 (0.0%) |
| 55 to 59 Years | 6 (100.0%) | 2 (33.3%) |
| 60 to 64 Years | 0 (0.0%) | 0 (0.0%) |
| 65 to 74 Years | 0 (0.0%) | 0 (0.0%) |
| 75 Years and over | 0 (0.0%) | 0 (0.0%) |
| Total | 48 (51.1%) | 5 (10.4%) |
Employment Status by Educational Attainment in Lake Valley
According to labor force statistics for Lake Valley, 78.9% of individuals (45) out of the total population between 25 and 64 years of age (57) are in the labor force, with 4.4% or 2 of them being unemployed. The group with the highest labor force participation rate are those with the educational attainment of less than high school, with 100.0% or 5 individuals in the labor force. Within the labor force, individuals with high school diploma education have the highest percentage of unemployment, with 40.0% or 2 of them being unemployed.
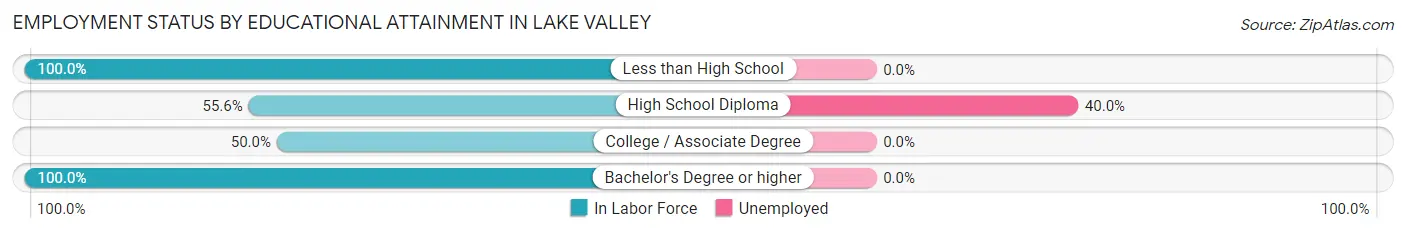
| Educational Attainment | In Labor Force | Unemployed |
| Less than High School | 5 (100.0%) | 0 (0.0%) |
| High School Diploma | 5 (55.6%) | 4 (40.0%) |
| College / Associate Degree | 8 (50.0%) | 0 (0.0%) |
| Bachelor's Degree or higher | 27 (100.0%) | 0 (0.0%) |
| Total | 45 (78.9%) | 3 (4.4%) |
Employment Occupations by Sex in Lake Valley
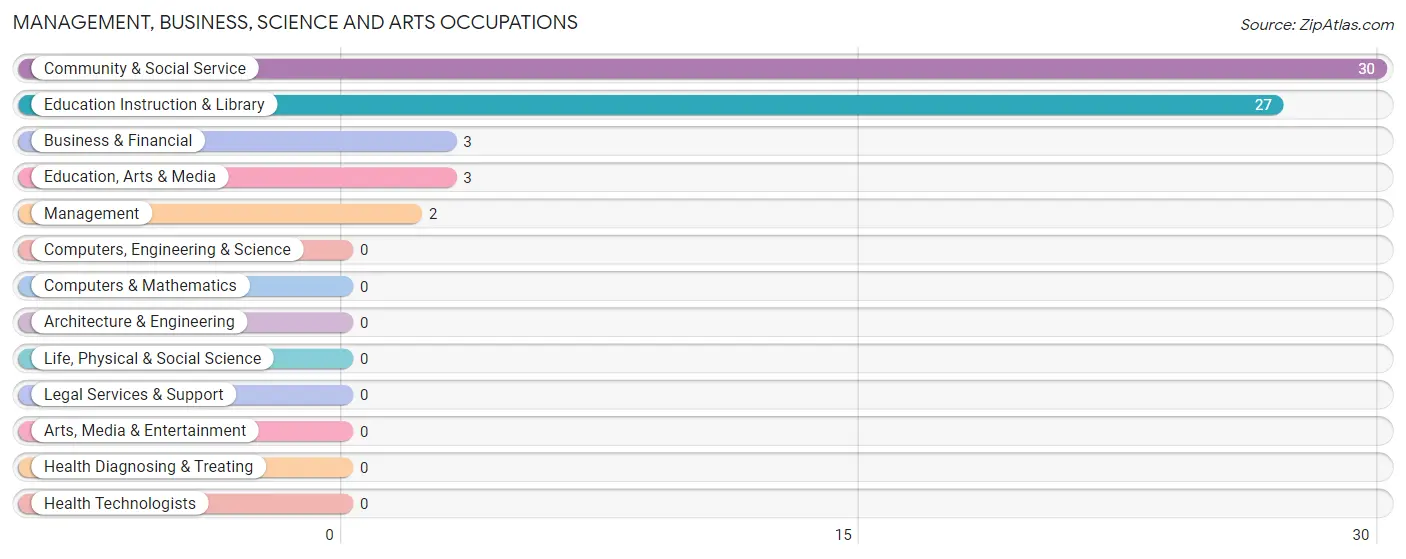
Management, Business, Science and Arts Occupations
The most common Management, Business, Science and Arts occupations in Lake Valley are Community & Social Service (30 | 69.8%), Education Instruction & Library (27 | 62.8%), Business & Financial (3 | 7.0%), Education, Arts & Media (3 | 7.0%), and Management (2 | 4.6%).
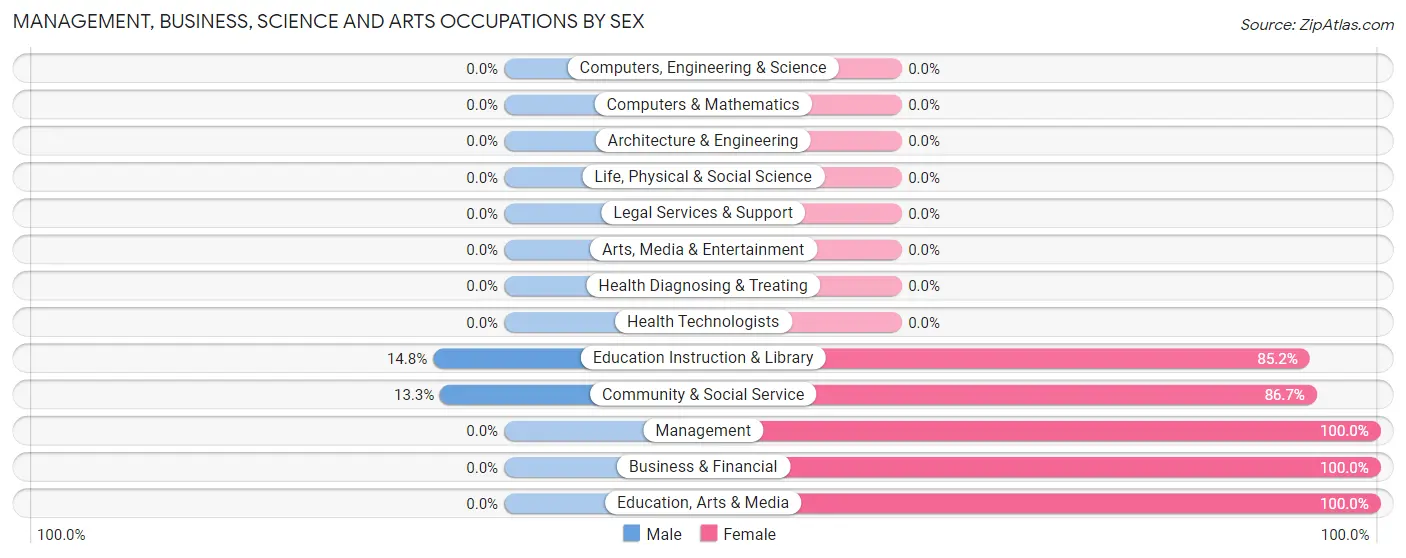
Management, Business, Science and Arts Occupations by Sex
Within the Management, Business, Science and Arts occupations in Lake Valley, the most male-oriented occupations are Education Instruction & Library (14.8%), and Community & Social Service (13.3%), while the most female-oriented occupations are Management (100.0%), Business & Financial (100.0%), and Education, Arts & Media (100.0%).
| Occupation | Male | Female |
| Management | 0 (0.0%) | 2 (100.0%) |
| Business & Financial | 0 (0.0%) | 3 (100.0%) |
| Computers, Engineering & Science | 0 (0.0%) | 0 (0.0%) |
| Computers & Mathematics | 0 (0.0%) | 0 (0.0%) |
| Architecture & Engineering | 0 (0.0%) | 0 (0.0%) |
| Life, Physical & Social Science | 0 (0.0%) | 0 (0.0%) |
| Community & Social Service | 4 (13.3%) | 26 (86.7%) |
| Education, Arts & Media | 0 (0.0%) | 3 (100.0%) |
| Legal Services & Support | 0 (0.0%) | 0 (0.0%) |
| Education Instruction & Library | 4 (14.8%) | 23 (85.2%) |
| Arts, Media & Entertainment | 0 (0.0%) | 0 (0.0%) |
| Health Diagnosing & Treating | 0 (0.0%) | 0 (0.0%) |
| Health Technologists | 0 (0.0%) | 0 (0.0%) |
| Total (Category) | 4 (11.4%) | 31 (88.6%) |
| Total (Overall) | 7 (16.3%) | 36 (83.7%) |
Services Occupations
The most common Services occupations in Lake Valley are , and Cleaning & Maintenance (3 | 7.0%).
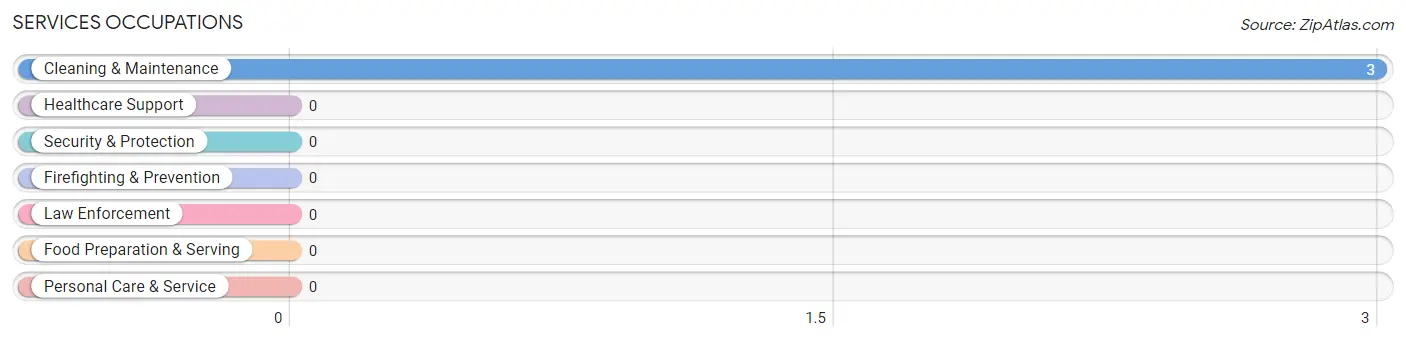
Services Occupations by Sex
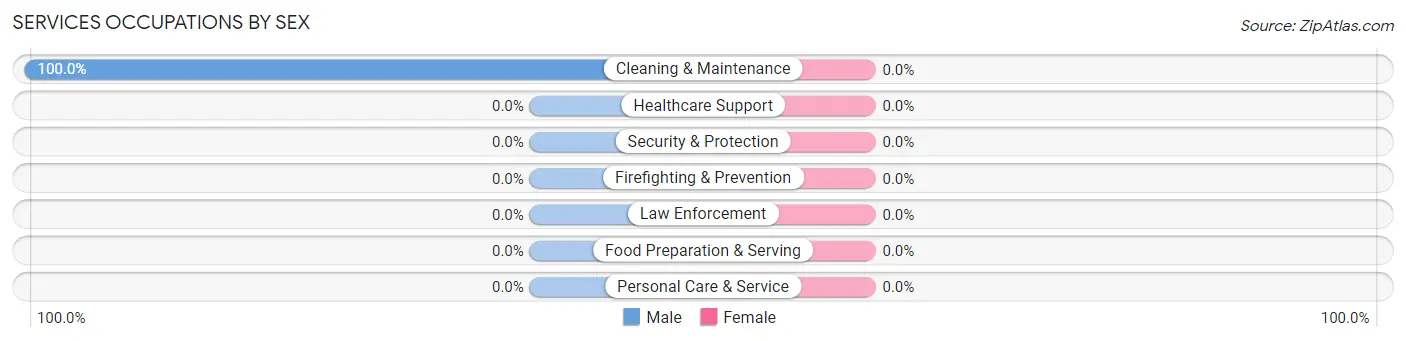
| Occupation | Male | Female |
| Healthcare Support | 0 (0.0%) | 0 (0.0%) |
| Security & Protection | 0 (0.0%) | 0 (0.0%) |
| Firefighting & Prevention | 0 (0.0%) | 0 (0.0%) |
| Law Enforcement | 0 (0.0%) | 0 (0.0%) |
| Food Preparation & Serving | 0 (0.0%) | 0 (0.0%) |
| Cleaning & Maintenance | 3 (100.0%) | 0 (0.0%) |
| Personal Care & Service | 0 (0.0%) | 0 (0.0%) |
| Total (Category) | 3 (100.0%) | 0 (0.0%) |
| Total (Overall) | 7 (16.3%) | 36 (83.7%) |
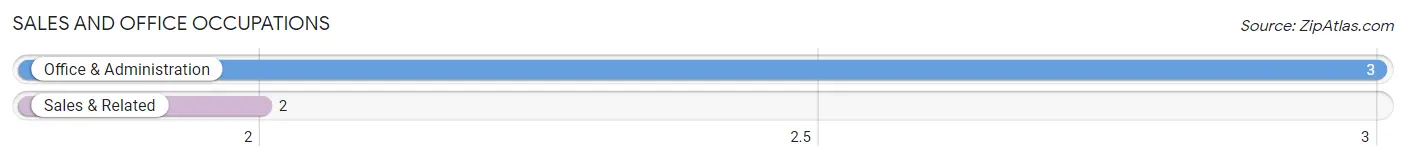
Sales and Office Occupations
The most common Sales and Office occupations in Lake Valley are Office & Administration (3 | 7.0%), and Sales & Related (2 | 4.6%).
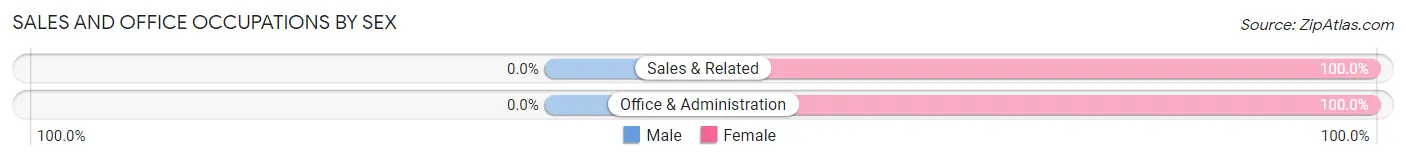
Sales and Office Occupations by Sex
| Occupation | Male | Female |
| Sales & Related | 0 (0.0%) | 2 (100.0%) |
| Office & Administration | 0 (0.0%) | 3 (100.0%) |
| Total (Category) | 0 (0.0%) | 5 (100.0%) |
| Total (Overall) | 7 (16.3%) | 36 (83.7%) |
Natural Resources, Construction and Maintenance Occupations

Natural Resources, Construction and Maintenance Occupations by Sex
| Occupation | Male | Female |
| Farming, Fishing & Forestry | 0 (0.0%) | 0 (0.0%) |
| Construction & Extraction | 0 (0.0%) | 0 (0.0%) |
| Installation, Maintenance & Repair | 0 (0.0%) | 0 (0.0%) |
| Total (Category) | 0 (0.0%) | 0 (0.0%) |
| Total (Overall) | 7 (16.3%) | 36 (83.7%) |
Production, Transportation and Moving Occupations
Production, Transportation and Moving Occupations by Sex
| Occupation | Male | Female |
| Production | 0 (0.0%) | 0 (0.0%) |
| Transportation | 0 (0.0%) | 0 (0.0%) |
| Material Moving | 0 (0.0%) | 0 (0.0%) |
| Total (Category) | 0 (0.0%) | 0 (0.0%) |
| Total (Overall) | 7 (16.3%) | 36 (83.7%) |
Employment Industries by Sex in Lake Valley
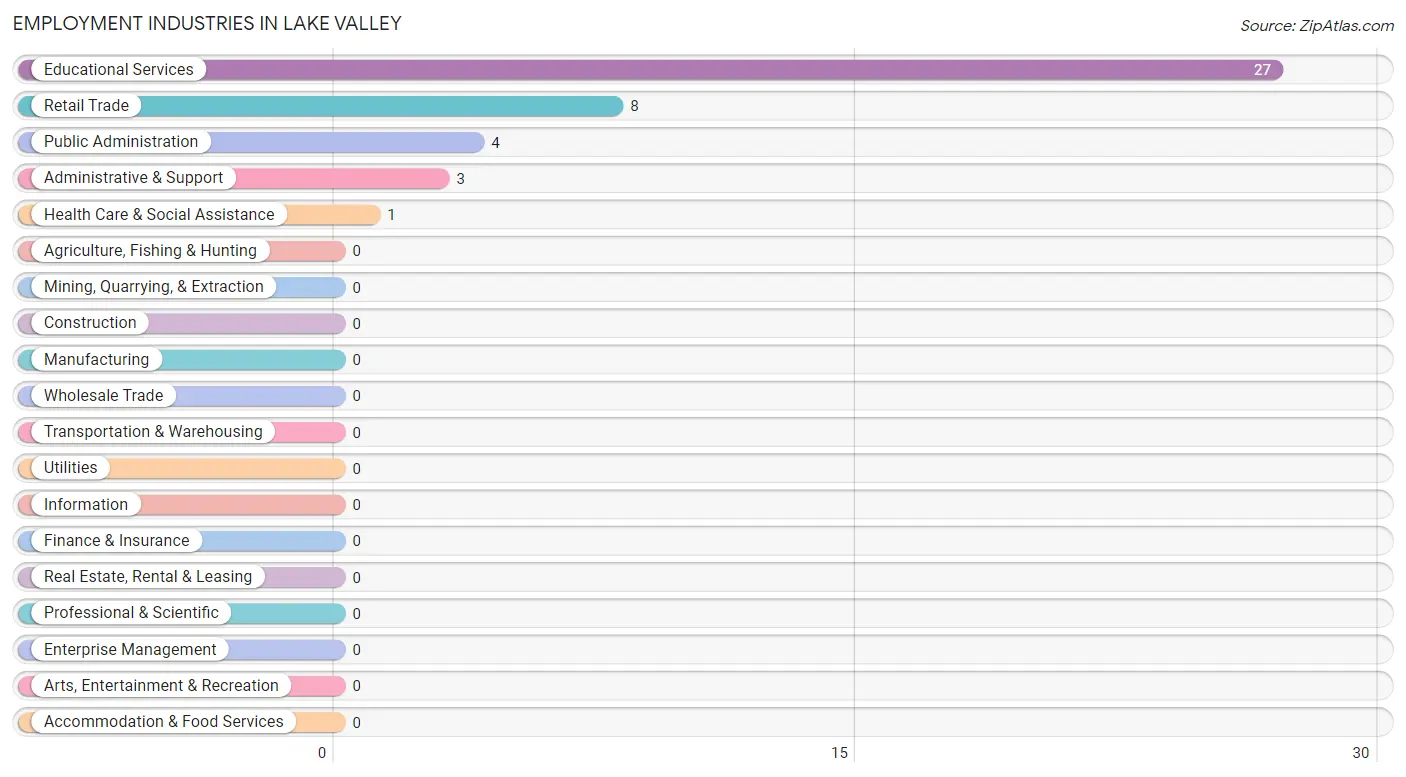
Employment Industries in Lake Valley
The major employment industries in Lake Valley include Educational Services (27 | 62.8%), Retail Trade (8 | 18.6%), Public Administration (4 | 9.3%), Administrative & Support (3 | 7.0%), and Health Care & Social Assistance (1 | 2.3%).
Employment Industries by Sex in Lake Valley
The Lake Valley industries that see more men than women are Administrative & Support (100.0%), and Educational Services (14.8%), whereas the industries that tend to have a higher number of women are Retail Trade (100.0%), Health Care & Social Assistance (100.0%), and Public Administration (100.0%).
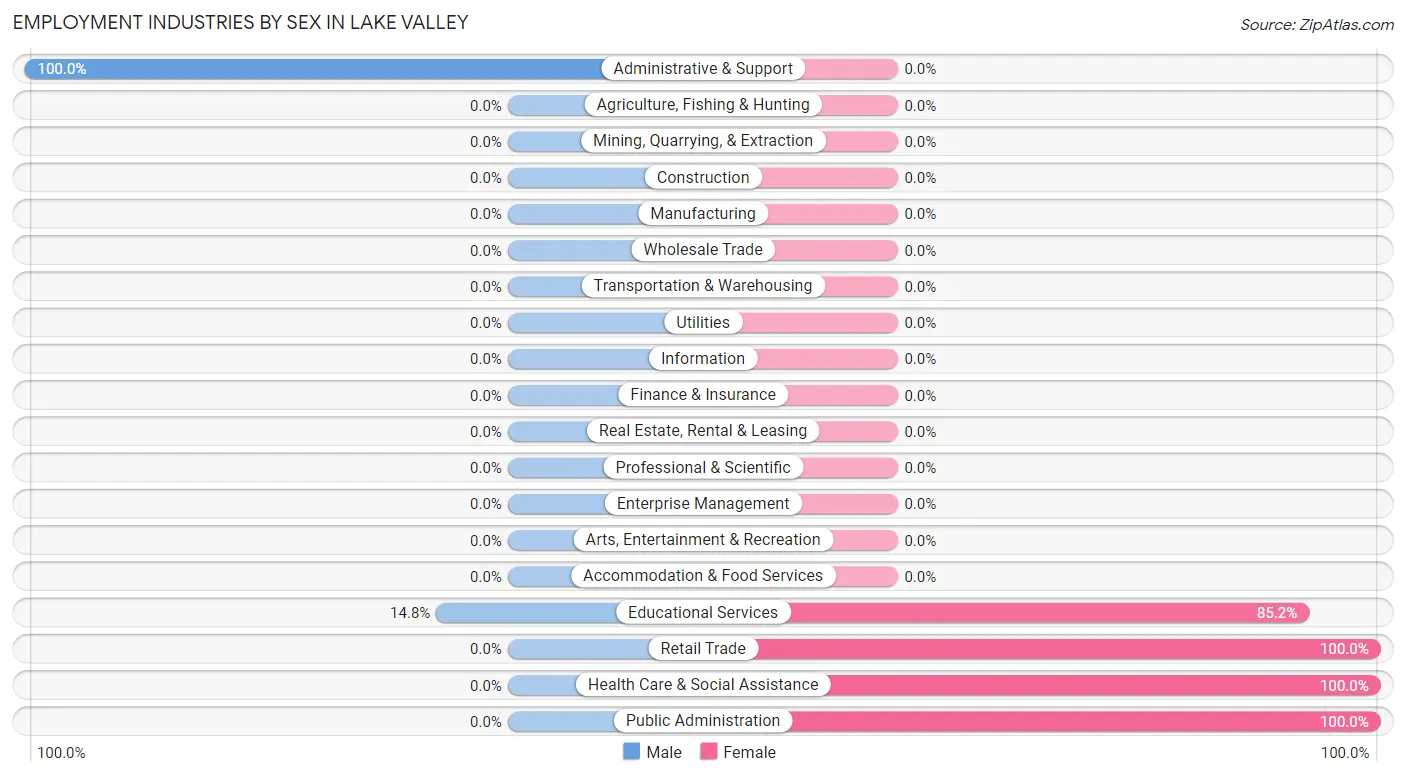
| Industry | Male | Female |
| Agriculture, Fishing & Hunting | 0 (0.0%) | 0 (0.0%) |
| Mining, Quarrying, & Extraction | 0 (0.0%) | 0 (0.0%) |
| Construction | 0 (0.0%) | 0 (0.0%) |
| Manufacturing | 0 (0.0%) | 0 (0.0%) |
| Wholesale Trade | 0 (0.0%) | 0 (0.0%) |
| Retail Trade | 0 (0.0%) | 8 (100.0%) |
| Transportation & Warehousing | 0 (0.0%) | 0 (0.0%) |
| Utilities | 0 (0.0%) | 0 (0.0%) |
| Information | 0 (0.0%) | 0 (0.0%) |
| Finance & Insurance | 0 (0.0%) | 0 (0.0%) |
| Real Estate, Rental & Leasing | 0 (0.0%) | 0 (0.0%) |
| Professional & Scientific | 0 (0.0%) | 0 (0.0%) |
| Enterprise Management | 0 (0.0%) | 0 (0.0%) |
| Administrative & Support | 3 (100.0%) | 0 (0.0%) |
| Educational Services | 4 (14.8%) | 23 (85.2%) |
| Health Care & Social Assistance | 0 (0.0%) | 1 (100.0%) |
| Arts, Entertainment & Recreation | 0 (0.0%) | 0 (0.0%) |
| Accommodation & Food Services | 0 (0.0%) | 0 (0.0%) |
| Public Administration | 0 (0.0%) | 4 (100.0%) |
| Total | 7 (16.3%) | 36 (83.7%) |
Education in Lake Valley
School Enrollment in Lake Valley
The most common levels of schooling among the 4 students in Lake Valley are elementary school (2 | 50.0%), and middle school (2 | 50.0%).
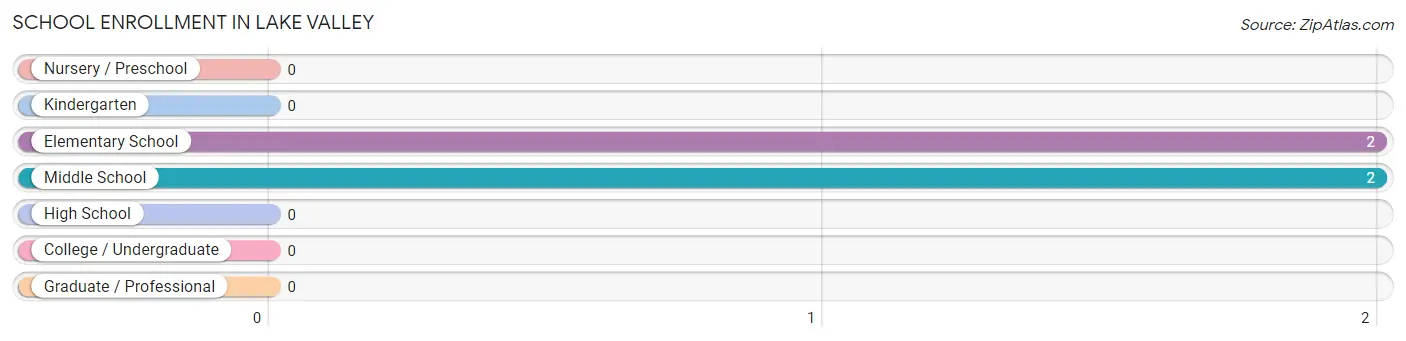
| School Level | # Students | % Students |
| Nursery / Preschool | 0 | 0.0% |
| Kindergarten | 0 | 0.0% |
| Elementary School | 2 | 50.0% |
| Middle School | 2 | 50.0% |
| High School | 0 | 0.0% |
| College / Undergraduate | 0 | 0.0% |
| Graduate / Professional | 0 | 0.0% |
| Total | 4 | 100.0% |
School Enrollment by Age by Funding Source in Lake Valley
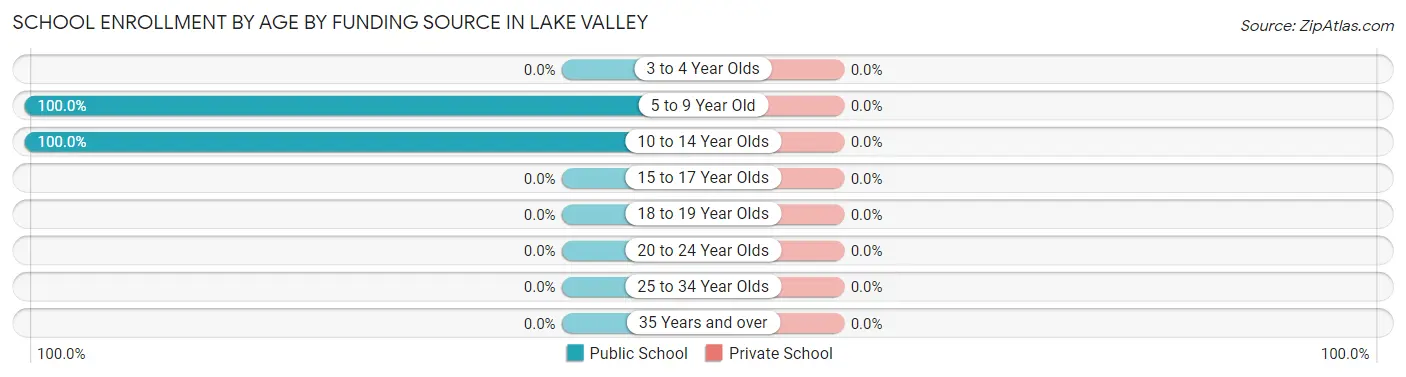
| Age Bracket | Public School | Private School |
| 3 to 4 Year Olds | 0 (0.0%) | 0 (0.0%) |
| 5 to 9 Year Old | 2 (100.0%) | 0 (0.0%) |
| 10 to 14 Year Olds | 2 (100.0%) | 0 (0.0%) |
| 15 to 17 Year Olds | 0 (0.0%) | 0 (0.0%) |
| 18 to 19 Year Olds | 0 (0.0%) | 0 (0.0%) |
| 20 to 24 Year Olds | 0 (0.0%) | 0 (0.0%) |
| 25 to 34 Year Olds | 0 (0.0%) | 0 (0.0%) |
| 35 Years and over | 0 (0.0%) | 0 (0.0%) |
| Total | 4 (100.0%) | 0 (0.0%) |
Educational Attainment by Field of Study in Lake Valley
Education (27 | 54.0%), and visual & performing arts (23 | 46.0%) are the most common fields of study among 50 individuals in Lake Valley who have obtained a bachelor's degree or higher.
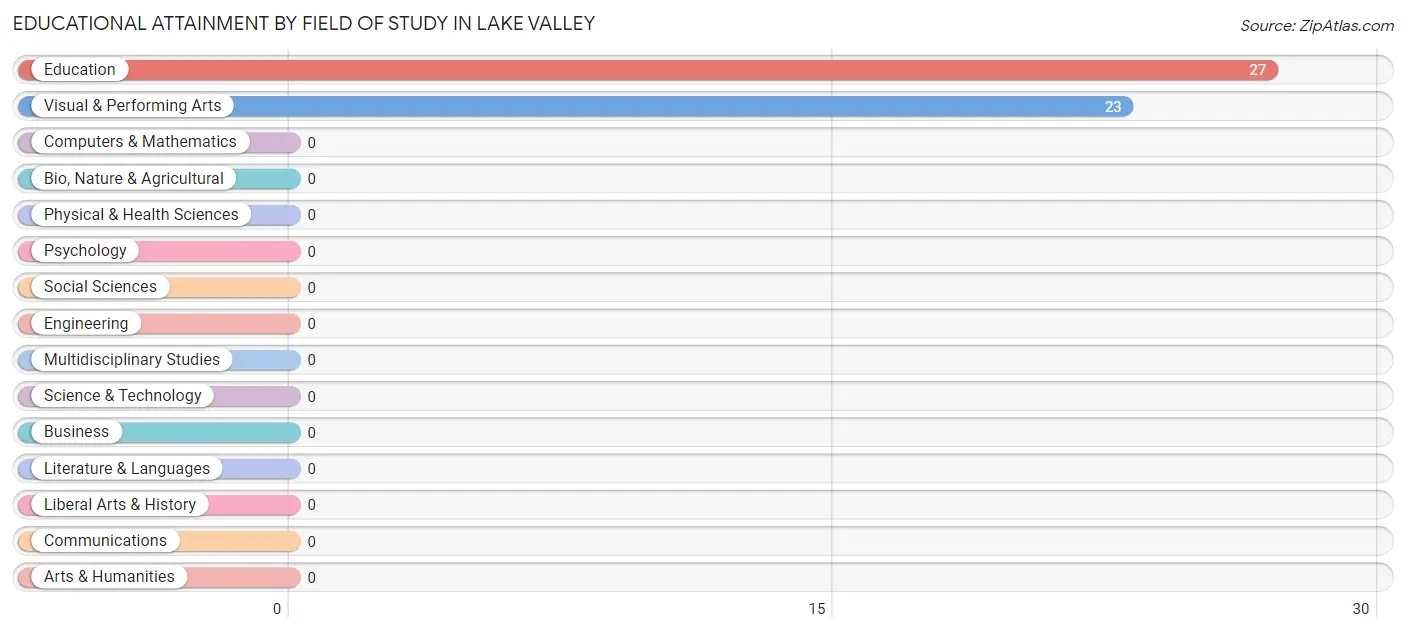
| Field of Study | # Graduates | % Graduates |
| Computers & Mathematics | 0 | 0.0% |
| Bio, Nature & Agricultural | 0 | 0.0% |
| Physical & Health Sciences | 0 | 0.0% |
| Psychology | 0 | 0.0% |
| Social Sciences | 0 | 0.0% |
| Engineering | 0 | 0.0% |
| Multidisciplinary Studies | 0 | 0.0% |
| Science & Technology | 0 | 0.0% |
| Business | 0 | 0.0% |
| Education | 27 | 54.0% |
| Literature & Languages | 0 | 0.0% |
| Liberal Arts & History | 0 | 0.0% |
| Visual & Performing Arts | 23 | 46.0% |
| Communications | 0 | 0.0% |
| Arts & Humanities | 0 | 0.0% |
| Total | 50 | 100.0% |
Transportation & Commute in Lake Valley
Vehicle Availability by Sex in Lake Valley
The most prevalent vehicle ownership categories in Lake Valley are males with 1 vehicle (7, accounting for 100.0%) and females with 1 vehicle (25, making up 19.4%).
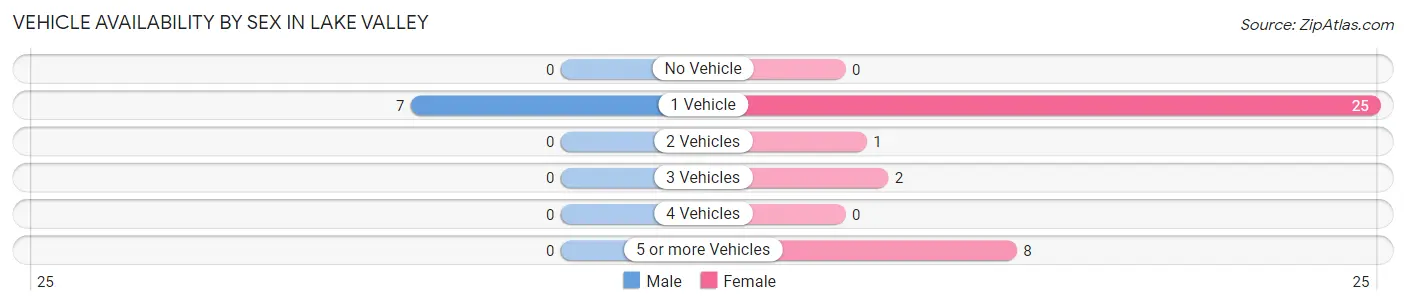
| Vehicles Available | Male | Female |
| No Vehicle | 0 (0.0%) | 0 (0.0%) |
| 1 Vehicle | 7 (100.0%) | 25 (69.4%) |
| 2 Vehicles | 0 (0.0%) | 1 (2.8%) |
| 3 Vehicles | 0 (0.0%) | 2 (5.6%) |
| 4 Vehicles | 0 (0.0%) | 0 (0.0%) |
| 5 or more Vehicles | 0 (0.0%) | 8 (22.2%) |
| Total | 7 (100.0%) | 36 (100.0%) |
Commute Time in Lake Valley
The most frequently occuring commute durations in Lake Valley are 45 to 59 minutes (25 commuters, 58.1%), 60 to 89 minutes (7 commuters, 16.3%), and 5 to 9 minutes (4 commuters, 9.3%).
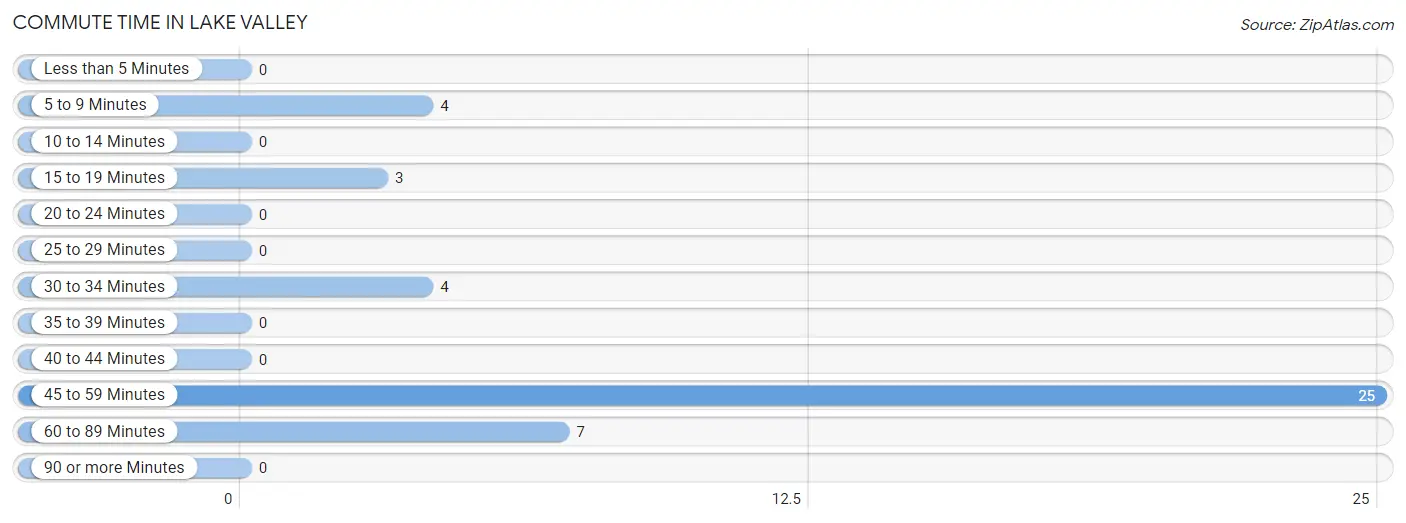
| Commute Time | # Commuters | % Commuters |
| Less than 5 Minutes | 0 | 0.0% |
| 5 to 9 Minutes | 4 | 9.3% |
| 10 to 14 Minutes | 0 | 0.0% |
| 15 to 19 Minutes | 3 | 7.0% |
| 20 to 24 Minutes | 0 | 0.0% |
| 25 to 29 Minutes | 0 | 0.0% |
| 30 to 34 Minutes | 4 | 9.3% |
| 35 to 39 Minutes | 0 | 0.0% |
| 40 to 44 Minutes | 0 | 0.0% |
| 45 to 59 Minutes | 25 | 58.1% |
| 60 to 89 Minutes | 7 | 16.3% |
| 90 or more Minutes | 0 | 0.0% |
Commute Time by Sex in Lake Valley
The most common commute times in Lake Valley are 5 to 9 minutes (4 commuters, 57.1%) for males and 45 to 59 minutes (25 commuters, 69.4%) for females.
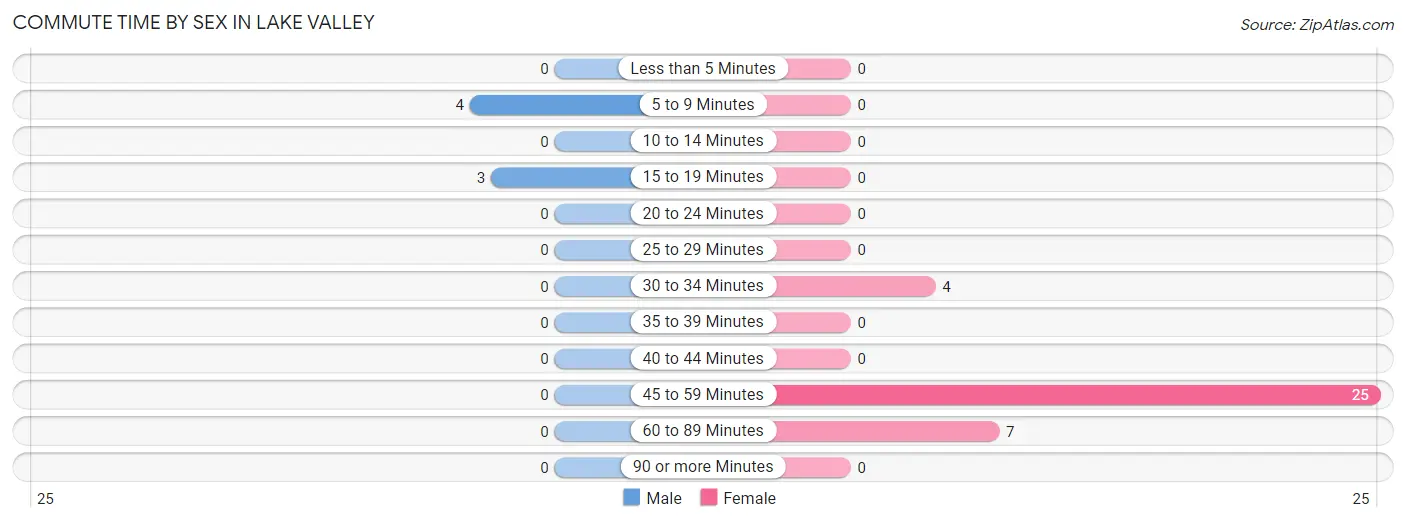
| Commute Time | Male | Female |
| Less than 5 Minutes | 0 (0.0%) | 0 (0.0%) |
| 5 to 9 Minutes | 4 (57.1%) | 0 (0.0%) |
| 10 to 14 Minutes | 0 (0.0%) | 0 (0.0%) |
| 15 to 19 Minutes | 3 (42.9%) | 0 (0.0%) |
| 20 to 24 Minutes | 0 (0.0%) | 0 (0.0%) |
| 25 to 29 Minutes | 0 (0.0%) | 0 (0.0%) |
| 30 to 34 Minutes | 0 (0.0%) | 4 (11.1%) |
| 35 to 39 Minutes | 0 (0.0%) | 0 (0.0%) |
| 40 to 44 Minutes | 0 (0.0%) | 0 (0.0%) |
| 45 to 59 Minutes | 0 (0.0%) | 25 (69.4%) |
| 60 to 89 Minutes | 0 (0.0%) | 7 (19.4%) |
| 90 or more Minutes | 0 (0.0%) | 0 (0.0%) |
Time of Departure to Work by Sex in Lake Valley
The most frequent times of departure to work in Lake Valley are 6:30 AM to 6:59 AM (4, 57.1%) for males and 6:30 AM to 6:59 AM (29, 80.6%) for females.
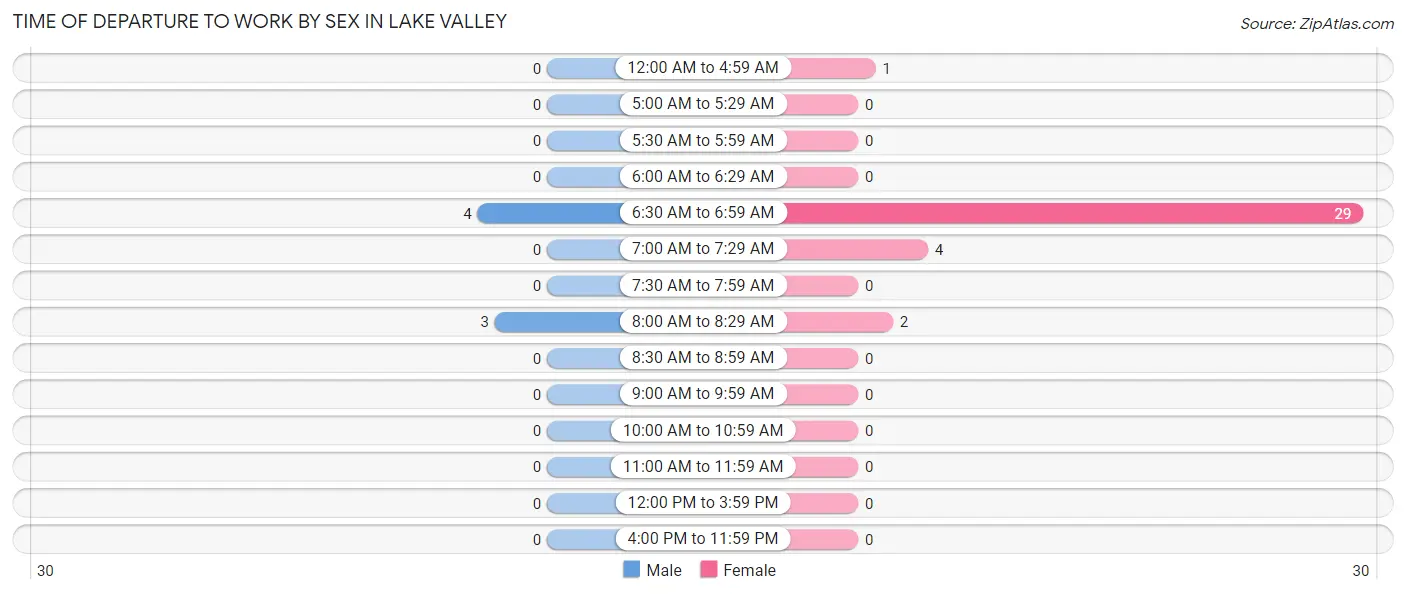
| Time of Departure | Male | Female |
| 12:00 AM to 4:59 AM | 0 (0.0%) | 1 (2.8%) |
| 5:00 AM to 5:29 AM | 0 (0.0%) | 0 (0.0%) |
| 5:30 AM to 5:59 AM | 0 (0.0%) | 0 (0.0%) |
| 6:00 AM to 6:29 AM | 0 (0.0%) | 0 (0.0%) |
| 6:30 AM to 6:59 AM | 4 (57.1%) | 29 (80.6%) |
| 7:00 AM to 7:29 AM | 0 (0.0%) | 4 (11.1%) |
| 7:30 AM to 7:59 AM | 0 (0.0%) | 0 (0.0%) |
| 8:00 AM to 8:29 AM | 3 (42.9%) | 2 (5.6%) |
| 8:30 AM to 8:59 AM | 0 (0.0%) | 0 (0.0%) |
| 9:00 AM to 9:59 AM | 0 (0.0%) | 0 (0.0%) |
| 10:00 AM to 10:59 AM | 0 (0.0%) | 0 (0.0%) |
| 11:00 AM to 11:59 AM | 0 (0.0%) | 0 (0.0%) |
| 12:00 PM to 3:59 PM | 0 (0.0%) | 0 (0.0%) |
| 4:00 PM to 11:59 PM | 0 (0.0%) | 0 (0.0%) |
| Total | 7 (100.0%) | 36 (100.0%) |
Housing Occupancy in Lake Valley
Occupancy by Ownership in Lake Valley
Of the total 43 dwellings in Lake Valley, owner-occupied units account for 13 (30.2%), while renter-occupied units make up 30 (69.8%).
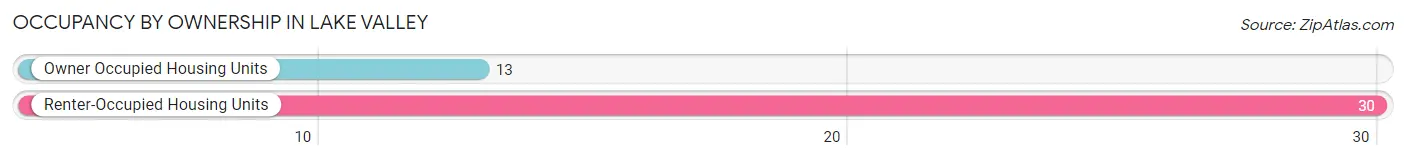
| Occupancy | # Housing Units | % Housing Units |
| Owner Occupied Housing Units | 13 | 30.2% |
| Renter-Occupied Housing Units | 30 | 69.8% |
| Total Occupied Housing Units | 43 | 100.0% |
Occupancy by Household Size in Lake Valley
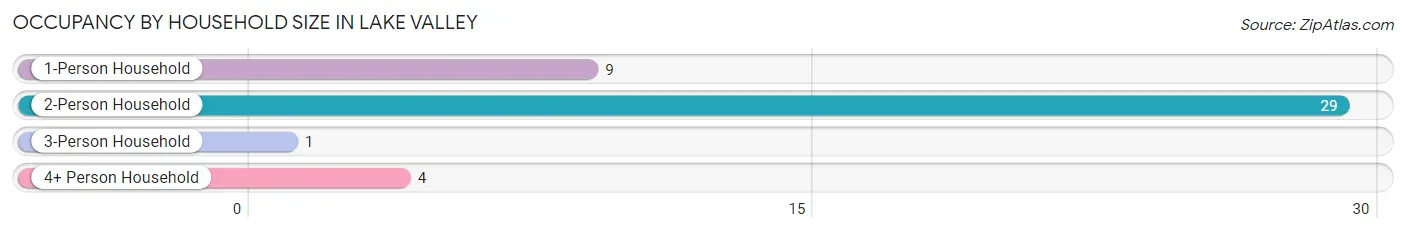
| Household Size | # Housing Units | % Housing Units |
| 1-Person Household | 9 | 20.9% |
| 2-Person Household | 29 | 67.4% |
| 3-Person Household | 1 | 2.3% |
| 4+ Person Household | 4 | 9.3% |
| Total Housing Units | 43 | 100.0% |
Occupancy by Ownership by Household Size in Lake Valley
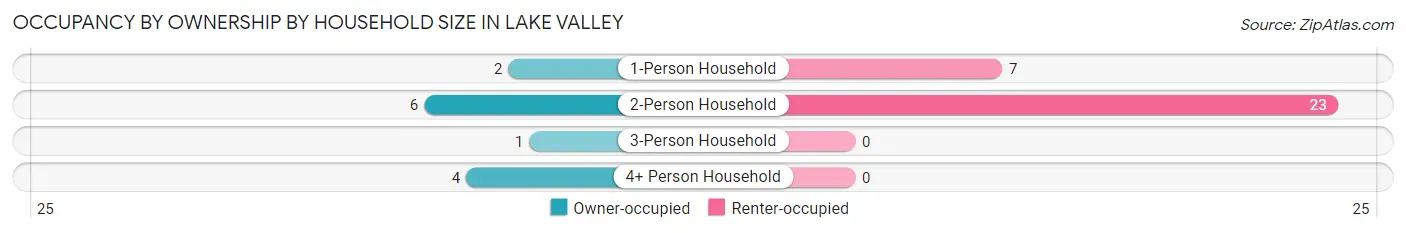
| Household Size | Owner-occupied | Renter-occupied |
| 1-Person Household | 2 (22.2%) | 7 (77.8%) |
| 2-Person Household | 6 (20.7%) | 23 (79.3%) |
| 3-Person Household | 1 (100.0%) | 0 (0.0%) |
| 4+ Person Household | 4 (100.0%) | 0 (0.0%) |
| Total Housing Units | 13 (30.2%) | 30 (69.8%) |
Occupancy by Educational Attainment in Lake Valley
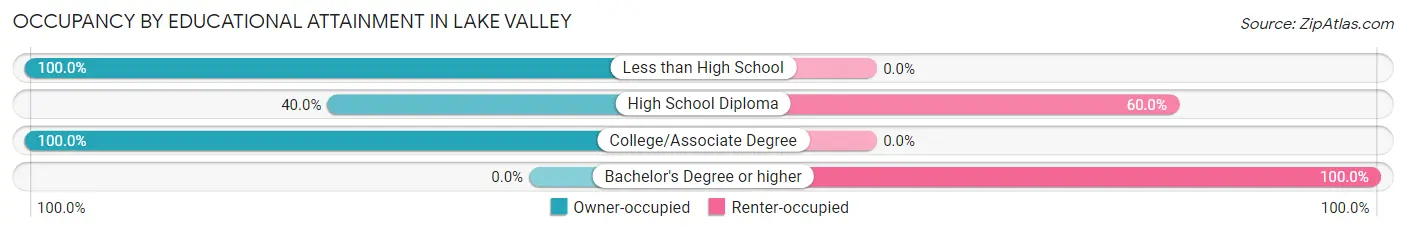
| Household Size | Owner-occupied | Renter-occupied |
| Less than High School | 8 (100.0%) | 0 (0.0%) |
| High School Diploma | 2 (40.0%) | 3 (60.0%) |
| College/Associate Degree | 3 (100.0%) | 0 (0.0%) |
| Bachelor's Degree or higher | 0 (0.0%) | 27 (100.0%) |
Occupancy by Age of Householder in Lake Valley
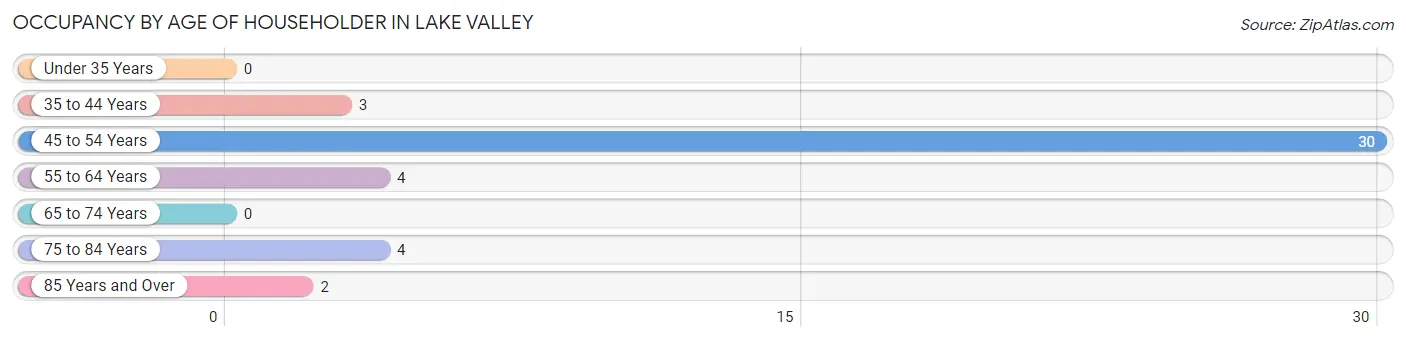
| Age Bracket | # Households | % Households |
| Under 35 Years | 0 | 0.0% |
| 35 to 44 Years | 3 | 7.0% |
| 45 to 54 Years | 30 | 69.8% |
| 55 to 64 Years | 4 | 9.3% |
| 65 to 74 Years | 0 | 0.0% |
| 75 to 84 Years | 4 | 9.3% |
| 85 Years and Over | 2 | 4.6% |
| Total | 43 | 100.0% |
Housing Finances in Lake Valley
Median Income by Occupancy in Lake Valley
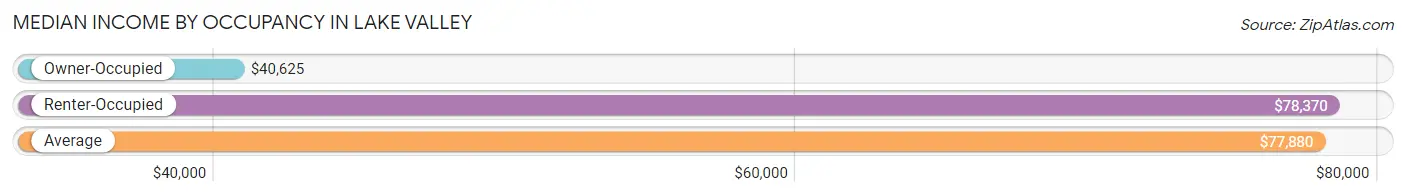
| Occupancy Type | # Households | Median Income |
| Owner-Occupied | 13 (30.2%) | $40,625 |
| Renter-Occupied | 30 (69.8%) | $78,370 |
| Average | 43 (100.0%) | $77,880 |
Occupancy by Householder Income Bracket in Lake Valley
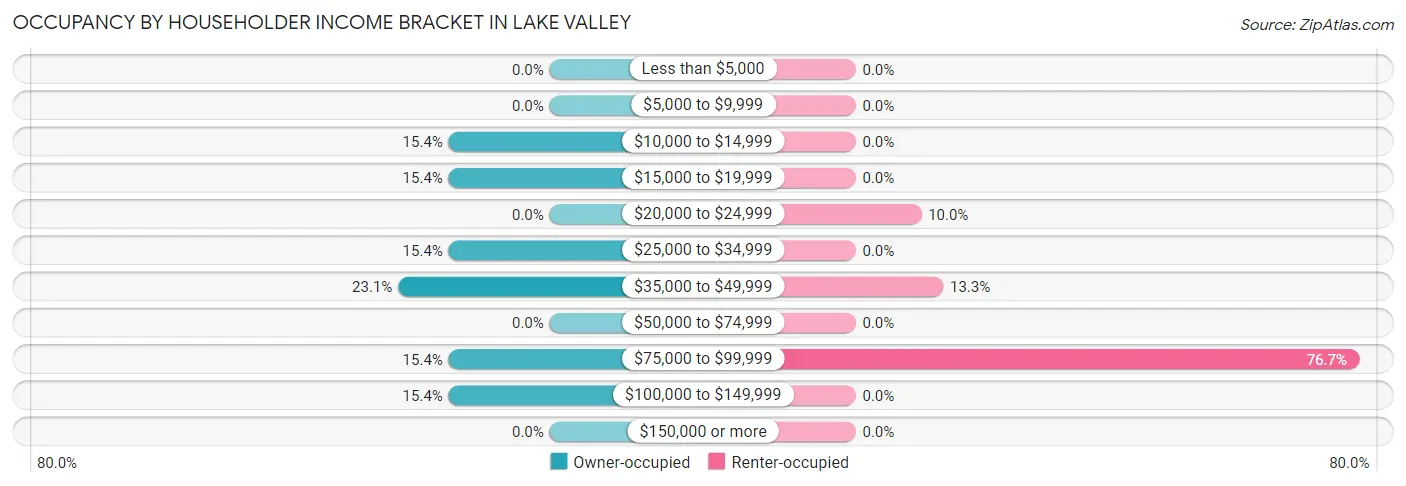
| Income Bracket | Owner-occupied | Renter-occupied |
| Less than $5,000 | 0 (0.0%) | 0 (0.0%) |
| $5,000 to $9,999 | 0 (0.0%) | 0 (0.0%) |
| $10,000 to $14,999 | 2 (15.4%) | 0 (0.0%) |
| $15,000 to $19,999 | 2 (15.4%) | 0 (0.0%) |
| $20,000 to $24,999 | 0 (0.0%) | 3 (10.0%) |
| $25,000 to $34,999 | 2 (15.4%) | 0 (0.0%) |
| $35,000 to $49,999 | 3 (23.1%) | 4 (13.3%) |
| $50,000 to $74,999 | 0 (0.0%) | 0 (0.0%) |
| $75,000 to $99,999 | 2 (15.4%) | 23 (76.7%) |
| $100,000 to $149,999 | 2 (15.4%) | 0 (0.0%) |
| $150,000 or more | 0 (0.0%) | 0 (0.0%) |
| Total | 13 (100.0%) | 30 (100.0%) |
Monthly Housing Cost Tiers in Lake Valley
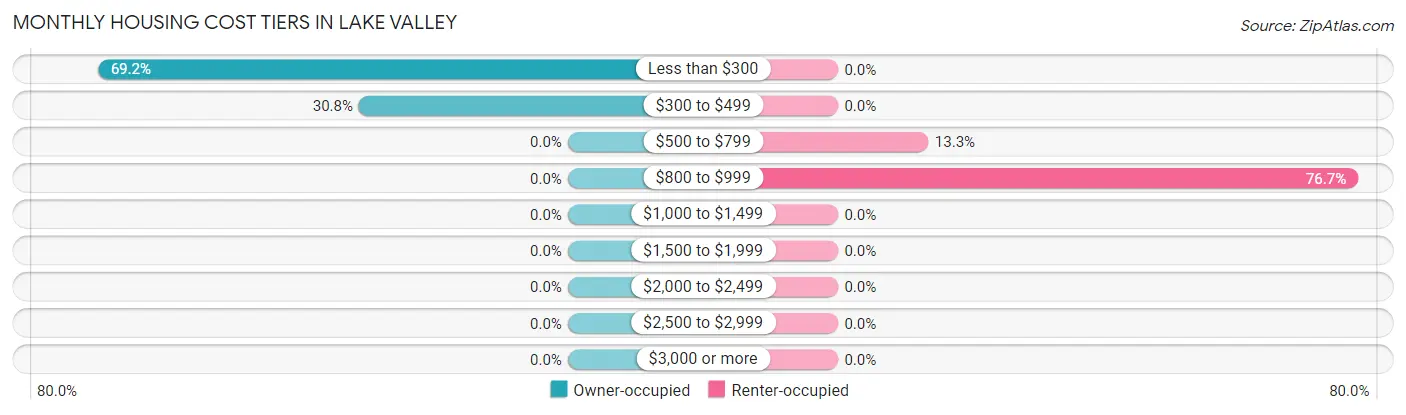
| Monthly Cost | Owner-occupied | Renter-occupied |
| Less than $300 | 9 (69.2%) | 0 (0.0%) |
| $300 to $499 | 4 (30.8%) | 0 (0.0%) |
| $500 to $799 | 0 (0.0%) | 4 (13.3%) |
| $800 to $999 | 0 (0.0%) | 23 (76.7%) |
| $1,000 to $1,499 | 0 (0.0%) | 0 (0.0%) |
| $1,500 to $1,999 | 0 (0.0%) | 0 (0.0%) |
| $2,000 to $2,499 | 0 (0.0%) | 0 (0.0%) |
| $2,500 to $2,999 | 0 (0.0%) | 0 (0.0%) |
| $3,000 or more | 0 (0.0%) | 0 (0.0%) |
| Total | 13 (100.0%) | 30 (100.0%) |
Physical Housing Characteristics in Lake Valley
Housing Structures in Lake Valley
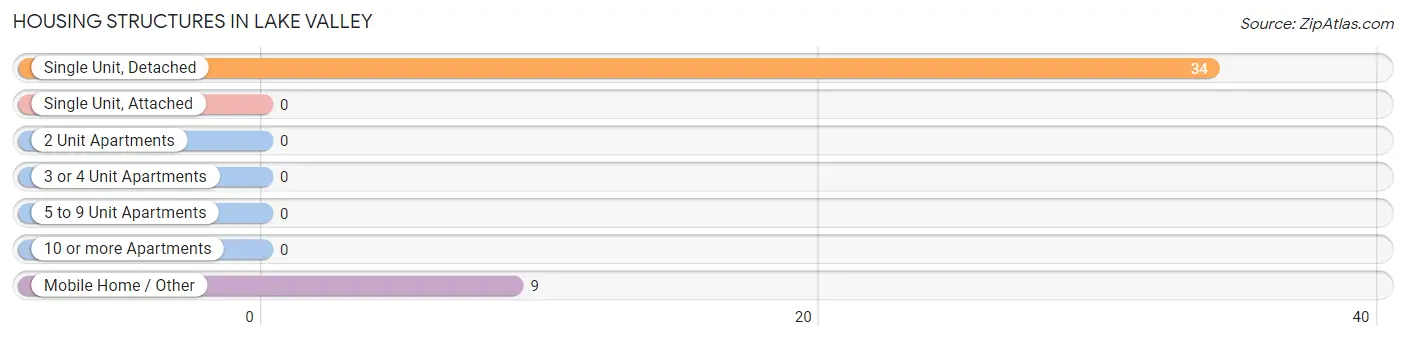
| Structure Type | # Housing Units | % Housing Units |
| Single Unit, Detached | 34 | 79.1% |
| Single Unit, Attached | 0 | 0.0% |
| 2 Unit Apartments | 0 | 0.0% |
| 3 or 4 Unit Apartments | 0 | 0.0% |
| 5 to 9 Unit Apartments | 0 | 0.0% |
| 10 or more Apartments | 0 | 0.0% |
| Mobile Home / Other | 9 | 20.9% |
| Total | 43 | 100.0% |
Housing Structures by Occupancy in Lake Valley
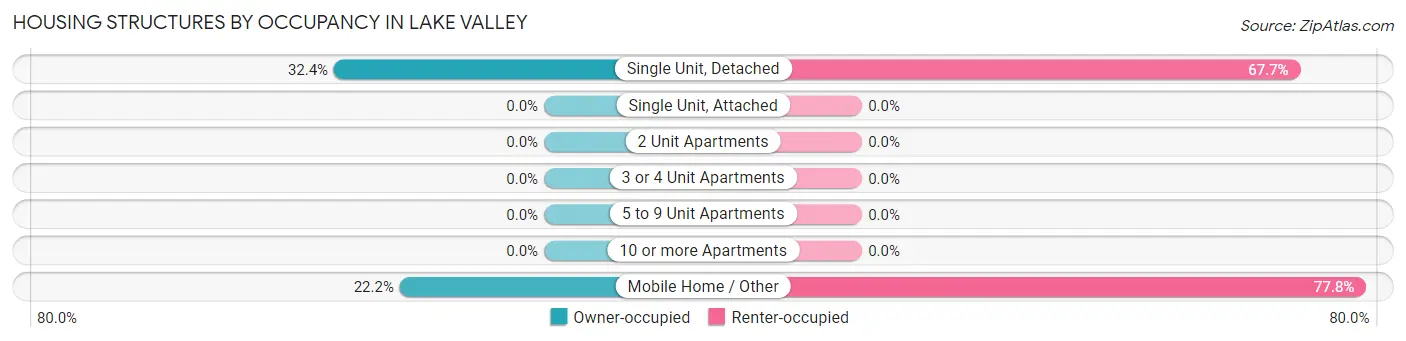
| Structure Type | Owner-occupied | Renter-occupied |
| Single Unit, Detached | 11 (32.4%) | 23 (67.6%) |
| Single Unit, Attached | 0 (0.0%) | 0 (0.0%) |
| 2 Unit Apartments | 0 (0.0%) | 0 (0.0%) |
| 3 or 4 Unit Apartments | 0 (0.0%) | 0 (0.0%) |
| 5 to 9 Unit Apartments | 0 (0.0%) | 0 (0.0%) |
| 10 or more Apartments | 0 (0.0%) | 0 (0.0%) |
| Mobile Home / Other | 2 (22.2%) | 7 (77.8%) |
| Total | 13 (30.2%) | 30 (69.8%) |
Housing Structures by Number of Rooms in Lake Valley
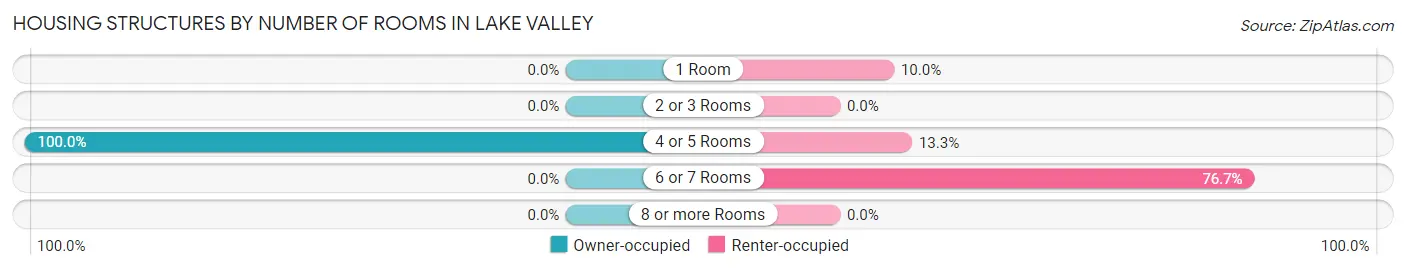
| Number of Rooms | Owner-occupied | Renter-occupied |
| 1 Room | 0 (0.0%) | 3 (10.0%) |
| 2 or 3 Rooms | 0 (0.0%) | 0 (0.0%) |
| 4 or 5 Rooms | 13 (100.0%) | 4 (13.3%) |
| 6 or 7 Rooms | 0 (0.0%) | 23 (76.7%) |
| 8 or more Rooms | 0 (0.0%) | 0 (0.0%) |
| Total | 13 (100.0%) | 30 (100.0%) |
Housing Structure by Heating Type in Lake Valley
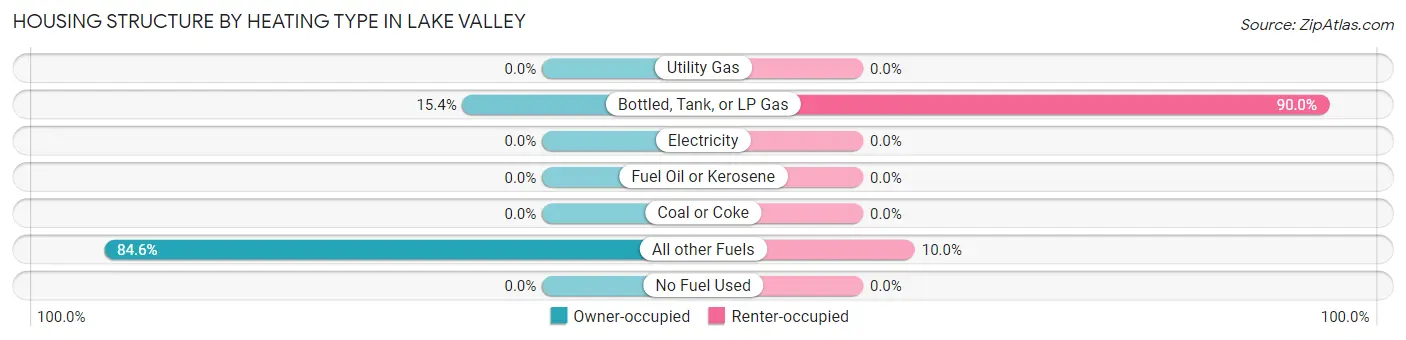
| Heating Type | Owner-occupied | Renter-occupied |
| Utility Gas | 0 (0.0%) | 0 (0.0%) |
| Bottled, Tank, or LP Gas | 2 (15.4%) | 27 (90.0%) |
| Electricity | 0 (0.0%) | 0 (0.0%) |
| Fuel Oil or Kerosene | 0 (0.0%) | 0 (0.0%) |
| Coal or Coke | 0 (0.0%) | 0 (0.0%) |
| All other Fuels | 11 (84.6%) | 3 (10.0%) |
| No Fuel Used | 0 (0.0%) | 0 (0.0%) |
| Total | 13 (100.0%) | 30 (100.0%) |
Household Vehicle Usage in Lake Valley
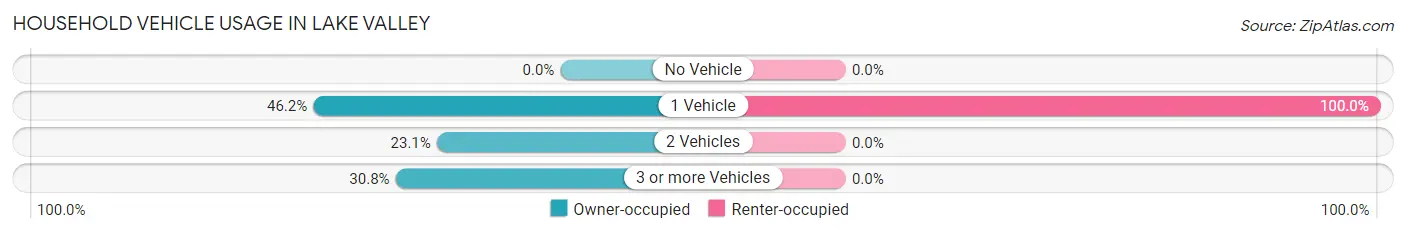
| Vehicles per Household | Owner-occupied | Renter-occupied |
| No Vehicle | 0 (0.0%) | 0 (0.0%) |
| 1 Vehicle | 6 (46.2%) | 30 (100.0%) |
| 2 Vehicles | 3 (23.1%) | 0 (0.0%) |
| 3 or more Vehicles | 4 (30.8%) | 0 (0.0%) |
| Total | 13 (100.0%) | 30 (100.0%) |
Real Estate & Mortgages in Lake Valley
Real Estate and Mortgage Overview in Lake Valley
| Characteristic | Without Mortgage | With Mortgage |
| Housing Units | 13 | 0 |
| Median Property Value | $179,200 | $0 |
| Median Household Income | $40,625 | $0 |
| Monthly Housing Costs | $269 | $0 |
| Real Estate Taxes | - | - |
Property Value by Mortgage Status in Lake Valley
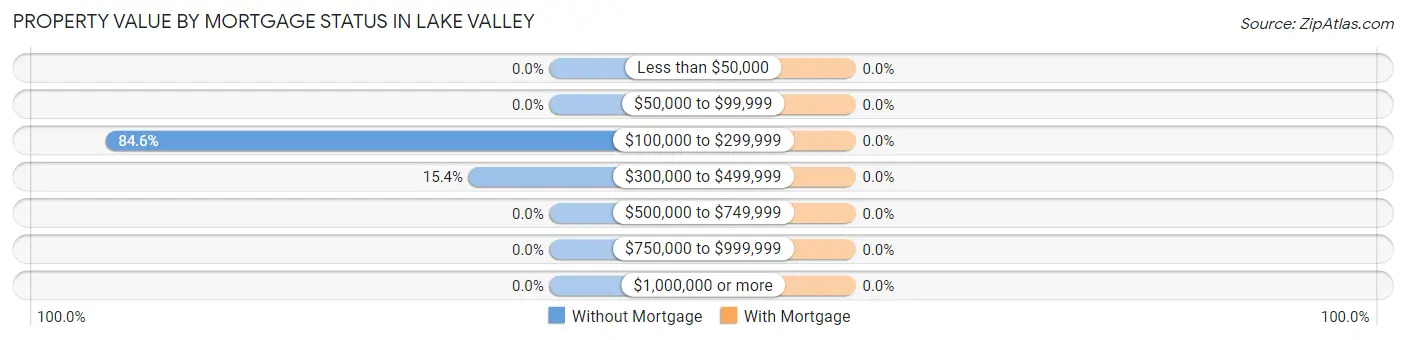
| Property Value | Without Mortgage | With Mortgage |
| Less than $50,000 | 0 (0.0%) | 0 (0.0%) |
| $50,000 to $99,999 | 0 (0.0%) | 0 (0.0%) |
| $100,000 to $299,999 | 11 (84.6%) | 0 (0.0%) |
| $300,000 to $499,999 | 2 (15.4%) | 0 (0.0%) |
| $500,000 to $749,999 | 0 (0.0%) | 0 (0.0%) |
| $750,000 to $999,999 | 0 (0.0%) | 0 (0.0%) |
| $1,000,000 or more | 0 (0.0%) | 0 (0.0%) |
| Total | 13 (100.0%) | 0 (0.0%) |
Household Income by Mortgage Status in Lake Valley
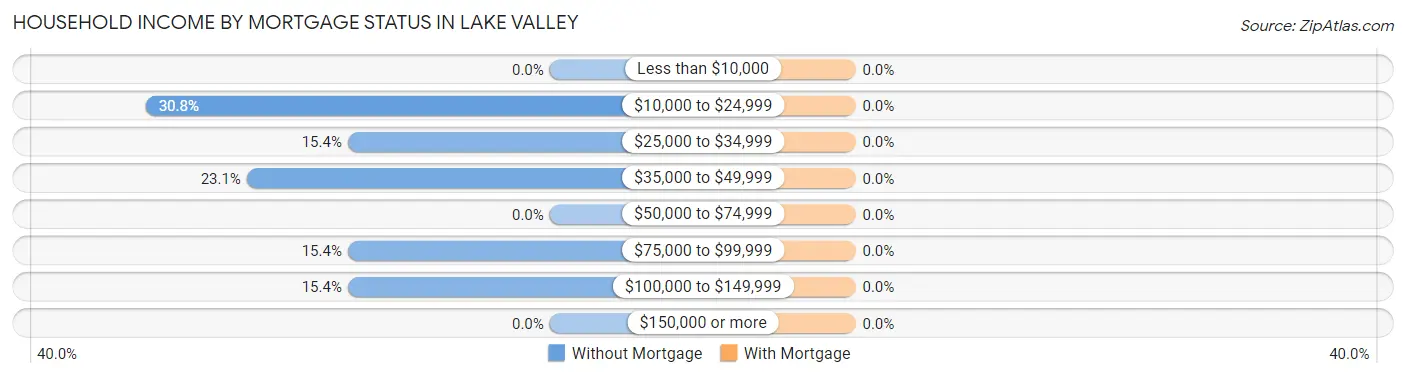
| Household Income | Without Mortgage | With Mortgage |
| Less than $10,000 | 0 (0.0%) | 0 (0.0%) |
| $10,000 to $24,999 | 4 (30.8%) | 0 (0.0%) |
| $25,000 to $34,999 | 2 (15.4%) | 0 (0.0%) |
| $35,000 to $49,999 | 3 (23.1%) | 0 (0.0%) |
| $50,000 to $74,999 | 0 (0.0%) | 0 (0.0%) |
| $75,000 to $99,999 | 2 (15.4%) | 0 (0.0%) |
| $100,000 to $149,999 | 2 (15.4%) | 0 (0.0%) |
| $150,000 or more | 0 (0.0%) | 0 (0.0%) |
| Total | 13 (100.0%) | 0 (0.0%) |
Property Value to Household Income Ratio in Lake Valley
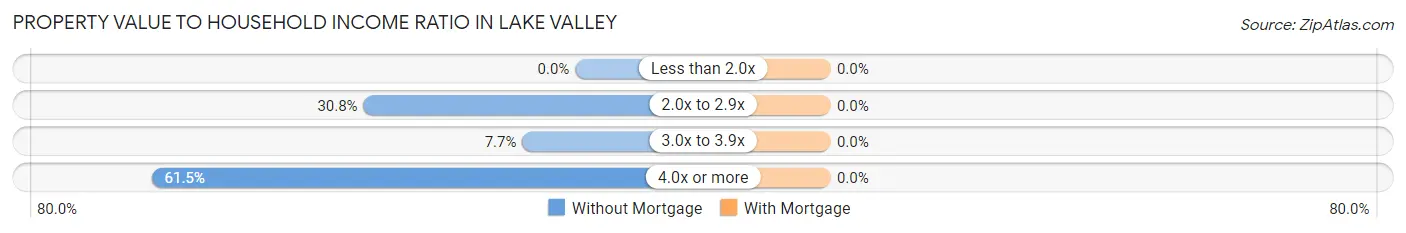
| Value-to-Income Ratio | Without Mortgage | With Mortgage |
| Less than 2.0x | 0 (0.0%) | 0 (0.0%) |
| 2.0x to 2.9x | 4 (30.8%) | 0 (0.0%) |
| 3.0x to 3.9x | 1 (7.7%) | 0 (0.0%) |
| 4.0x or more | 8 (61.5%) | 0 (0.0%) |
| Total | 13 (100.0%) | 0 (0.0%) |
Real Estate Taxes by Mortgage Status in Lake Valley
| Property Taxes | Without Mortgage | With Mortgage |
| Less than $800 | 0 (0.0%) | 0 (0.0%) |
| $800 to $1,499 | 0 (0.0%) | 0 (0.0%) |
| $800 to $1,499 | 0 (0.0%) | 0 (0.0%) |
| Total | 13 (100.0%) | 0 (0.0%) |
Health & Disability in Lake Valley
Health Insurance Coverage by Age in Lake Valley
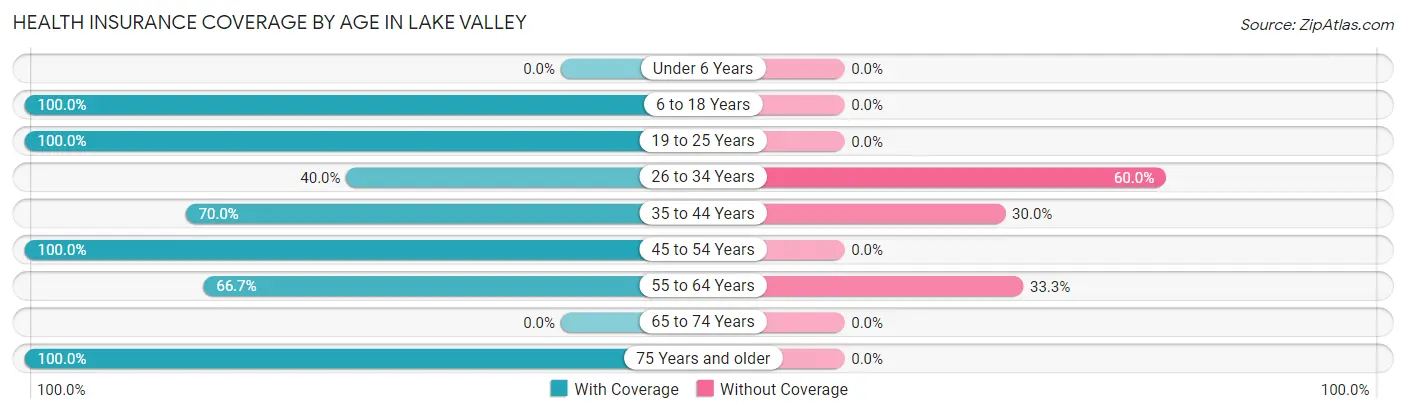
| Age Bracket | With Coverage | Without Coverage |
| Under 6 Years | 0 (0.0%) | 0 (0.0%) |
| 6 to 18 Years | 4 (100.0%) | 0 (0.0%) |
| 19 to 25 Years | 3 (100.0%) | 0 (0.0%) |
| 26 to 34 Years | 2 (40.0%) | 3 (60.0%) |
| 35 to 44 Years | 7 (70.0%) | 3 (30.0%) |
| 45 to 54 Years | 36 (100.0%) | 0 (0.0%) |
| 55 to 64 Years | 4 (66.7%) | 2 (33.3%) |
| 65 to 74 Years | 0 (0.0%) | 0 (0.0%) |
| 75 Years and older | 34 (100.0%) | 0 (0.0%) |
| Total | 90 (91.8%) | 8 (8.2%) |
Health Insurance Coverage by Citizenship Status in Lake Valley
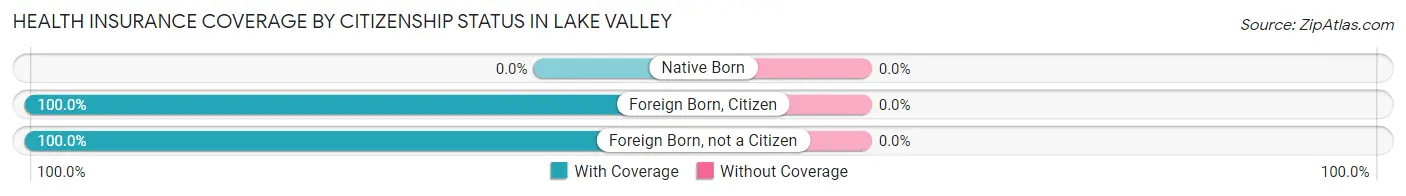
| Citizenship Status | With Coverage | Without Coverage |
| Native Born | 0 (0.0%) | 0 (0.0%) |
| Foreign Born, Citizen | 4 (100.0%) | 0 (0.0%) |
| Foreign Born, not a Citizen | 3 (100.0%) | 0 (0.0%) |
Health Insurance Coverage by Household Income in Lake Valley
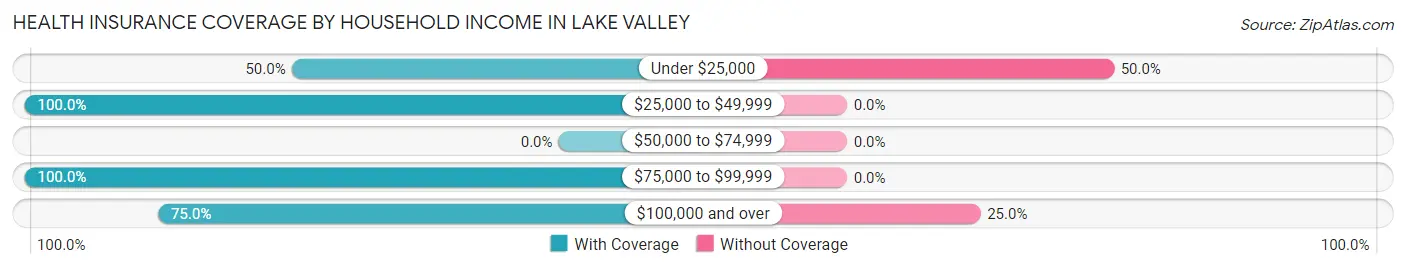
| Household Income | With Coverage | Without Coverage |
| Under $25,000 | 5 (50.0%) | 5 (50.0%) |
| $25,000 to $49,999 | 22 (100.0%) | 0 (0.0%) |
| $50,000 to $74,999 | 0 (0.0%) | 0 (0.0%) |
| $75,000 to $99,999 | 54 (100.0%) | 0 (0.0%) |
| $100,000 and over | 9 (75.0%) | 3 (25.0%) |
Public vs Private Health Insurance Coverage by Age in Lake Valley
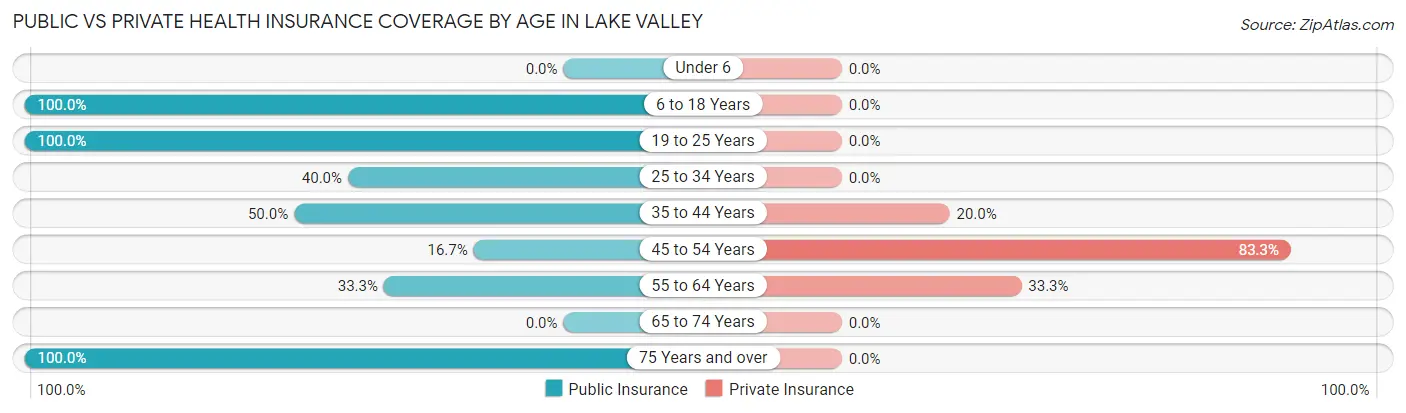
| Age Bracket | Public Insurance | Private Insurance |
| Under 6 | 0 (0.0%) | 0 (0.0%) |
| 6 to 18 Years | 4 (100.0%) | 0 (0.0%) |
| 19 to 25 Years | 3 (100.0%) | 0 (0.0%) |
| 25 to 34 Years | 2 (40.0%) | 0 (0.0%) |
| 35 to 44 Years | 5 (50.0%) | 2 (20.0%) |
| 45 to 54 Years | 6 (16.7%) | 30 (83.3%) |
| 55 to 64 Years | 2 (33.3%) | 2 (33.3%) |
| 65 to 74 Years | 0 (0.0%) | 0 (0.0%) |
| 75 Years and over | 34 (100.0%) | 0 (0.0%) |
| Total | 56 (57.1%) | 34 (34.7%) |
Disability Status by Sex by Age in Lake Valley
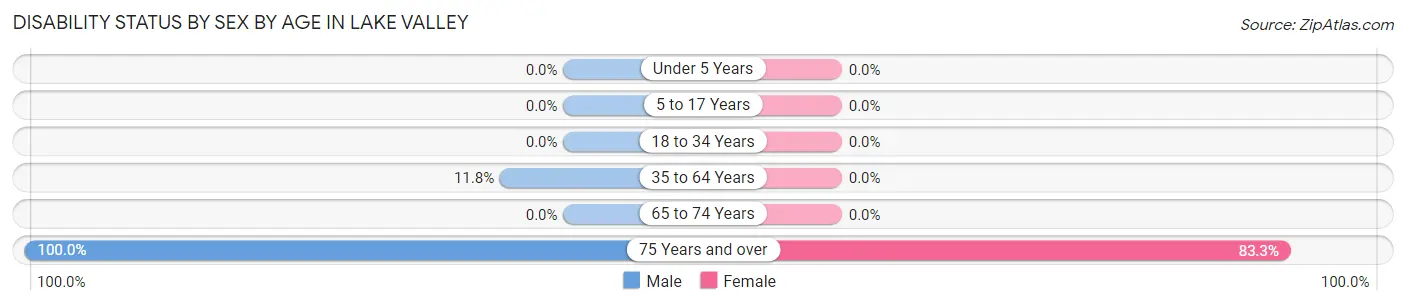
| Age Bracket | Male | Female |
| Under 5 Years | 0 (0.0%) | 0 (0.0%) |
| 5 to 17 Years | 0 (0.0%) | 0 (0.0%) |
| 18 to 34 Years | 0 (0.0%) | 0 (0.0%) |
| 35 to 64 Years | 2 (11.8%) | 0 (0.0%) |
| 65 to 74 Years | 0 (0.0%) | 0 (0.0%) |
| 75 Years and over | 4 (100.0%) | 25 (83.3%) |
Disability Class by Sex by Age in Lake Valley
Disability Class: Hearing Difficulty
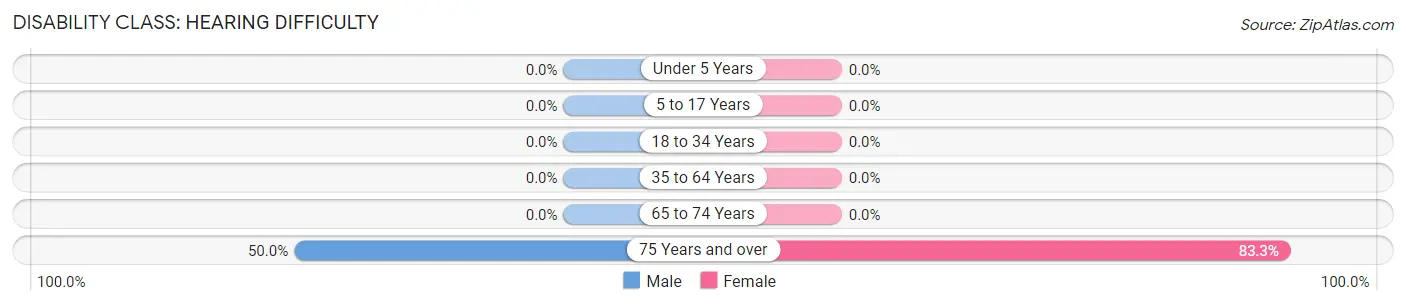
| Age Bracket | Male | Female |
| Under 5 Years | 0 (0.0%) | 0 (0.0%) |
| 5 to 17 Years | 0 (0.0%) | 0 (0.0%) |
| 18 to 34 Years | 0 (0.0%) | 0 (0.0%) |
| 35 to 64 Years | 0 (0.0%) | 0 (0.0%) |
| 65 to 74 Years | 0 (0.0%) | 0 (0.0%) |
| 75 Years and over | 2 (50.0%) | 25 (83.3%) |
Disability Class: Vision Difficulty
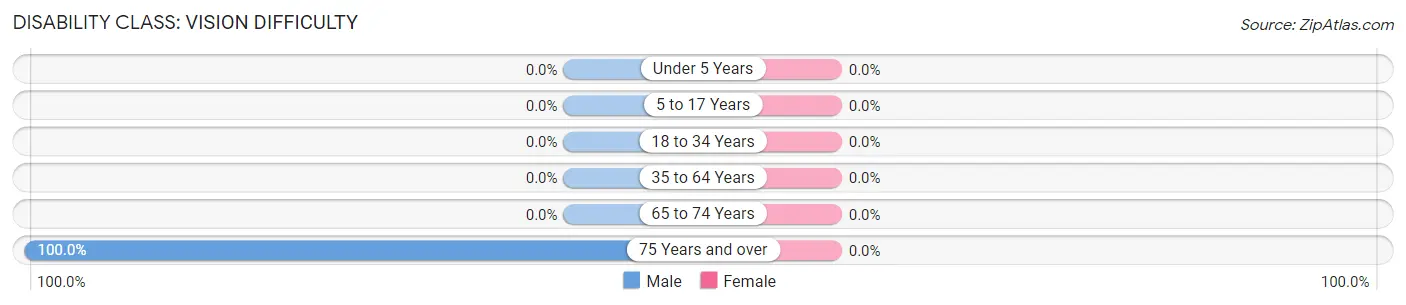
| Age Bracket | Male | Female |
| Under 5 Years | 0 (0.0%) | 0 (0.0%) |
| 5 to 17 Years | 0 (0.0%) | 0 (0.0%) |
| 18 to 34 Years | 0 (0.0%) | 0 (0.0%) |
| 35 to 64 Years | 0 (0.0%) | 0 (0.0%) |
| 65 to 74 Years | 0 (0.0%) | 0 (0.0%) |
| 75 Years and over | 4 (100.0%) | 0 (0.0%) |
Disability Class: Cognitive Difficulty
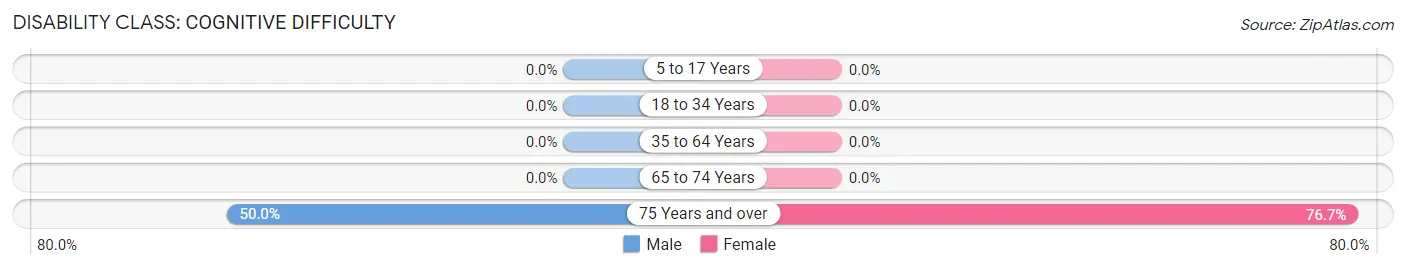
| Age Bracket | Male | Female |
| 5 to 17 Years | 0 (0.0%) | 0 (0.0%) |
| 18 to 34 Years | 0 (0.0%) | 0 (0.0%) |
| 35 to 64 Years | 0 (0.0%) | 0 (0.0%) |
| 65 to 74 Years | 0 (0.0%) | 0 (0.0%) |
| 75 Years and over | 2 (50.0%) | 23 (76.7%) |
Disability Class: Ambulatory Difficulty
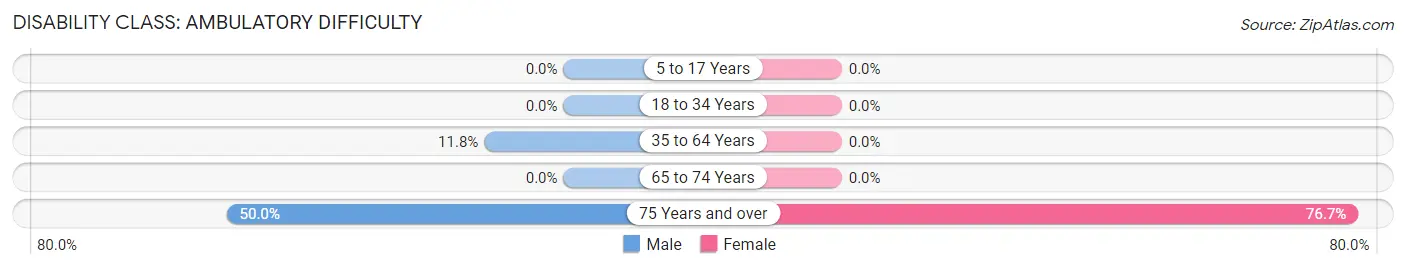
| Age Bracket | Male | Female |
| 5 to 17 Years | 0 (0.0%) | 0 (0.0%) |
| 18 to 34 Years | 0 (0.0%) | 0 (0.0%) |
| 35 to 64 Years | 2 (11.8%) | 0 (0.0%) |
| 65 to 74 Years | 0 (0.0%) | 0 (0.0%) |
| 75 Years and over | 2 (50.0%) | 23 (76.7%) |
Disability Class: Self-Care Difficulty
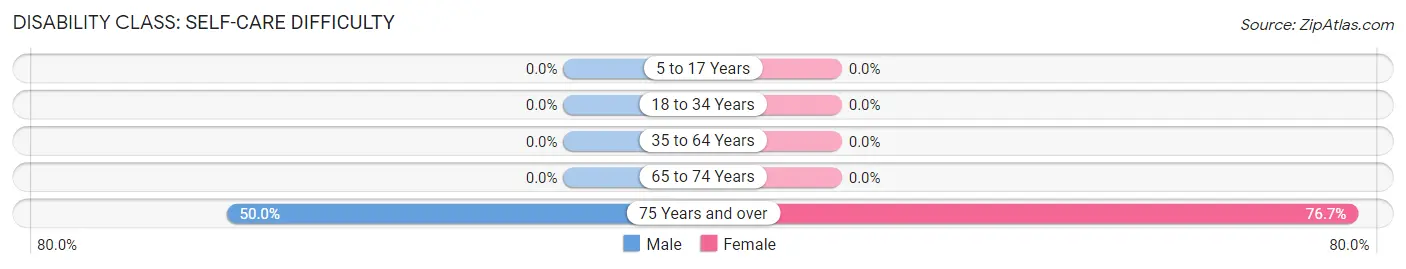
| Age Bracket | Male | Female |
| 5 to 17 Years | 0 (0.0%) | 0 (0.0%) |
| 18 to 34 Years | 0 (0.0%) | 0 (0.0%) |
| 35 to 64 Years | 0 (0.0%) | 0 (0.0%) |
| 65 to 74 Years | 0 (0.0%) | 0 (0.0%) |
| 75 Years and over | 2 (50.0%) | 23 (76.7%) |
Technology Access in Lake Valley
Computing Device Access in Lake Valley
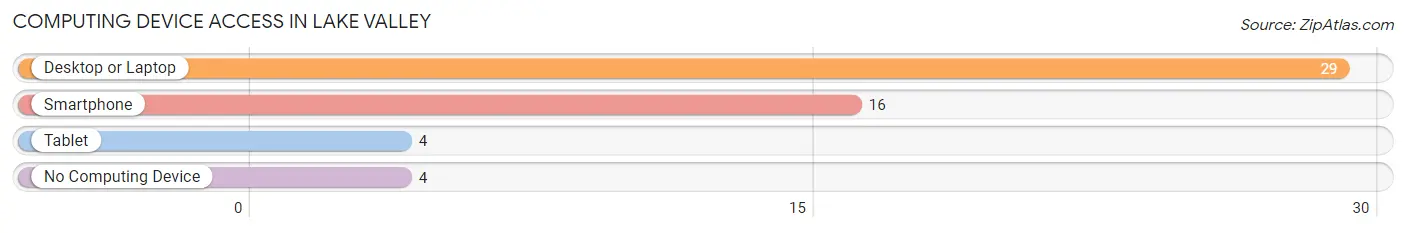
| Device Type | # Households | % Households |
| Desktop or Laptop | 29 | 67.4% |
| Smartphone | 16 | 37.2% |
| Tablet | 4 | 9.3% |
| No Computing Device | 4 | 9.3% |
| Total | 43 | 100.0% |
Internet Access in Lake Valley
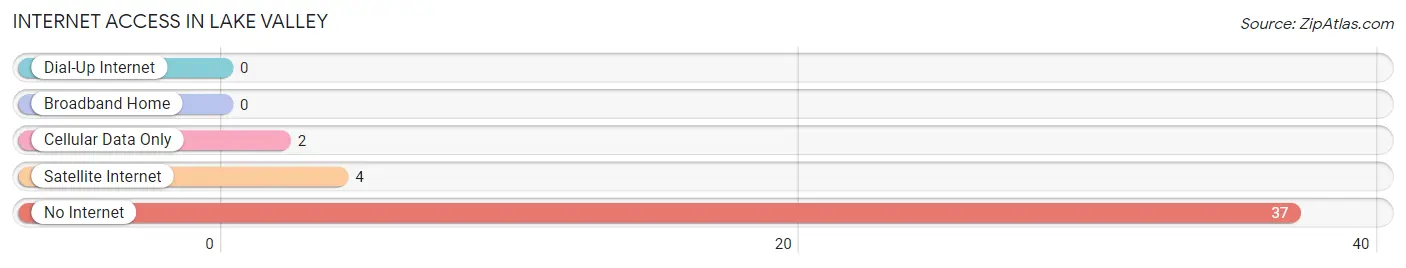
| Internet Type | # Households | % Households |
| Dial-Up Internet | 0 | 0.0% |
| Broadband Home | 0 | 0.0% |
| Cellular Data Only | 2 | 4.6% |
| Satellite Internet | 4 | 9.3% |
| No Internet | 37 | 86.1% |
| Total | 43 | 100.0% |
Lake Valley Summary
Valley, New Mexico is a small town located in the San Juan Basin of the Four Corners region of the United States. It is situated in the northwest corner of New Mexico, near the Arizona and Utah borders. Valley is the county seat of San Juan County and is the largest town in the county. The town has a population of approximately 1,500 people and is located at an elevation of 6,000 feet.
History
The area that is now Valley was first inhabited by the Anasazi people, who lived in the area from around 1000 BC to 1300 AD. The Anasazi were a nomadic people who lived in small villages and farmed the land. They were known for their pottery and basket weaving.
In the late 1800s, the area was settled by Mormon pioneers from Utah. The town of Valley was founded in 1891 and was named after the nearby Valley of the Gods. The town was originally a farming community, but it soon became a trading center for the surrounding area.
In the early 1900s, the town began to grow and develop. The first school was built in 1906 and the first bank opened in 1907. The town was incorporated in 1909 and the first newspaper was published in 1910.
Geography
Valley is located in the San Juan Basin of the Four Corners region of the United States. It is situated in the northwest corner of New Mexico, near the Arizona and Utah borders. The town is located at an elevation of 6,000 feet and is surrounded by the Chuska Mountains to the east and the San Juan Mountains to the west.
The climate in Valley is semi-arid, with hot summers and cold winters. The average annual temperature is around 50 degrees Fahrenheit. The average annual precipitation is around 10 inches.
Economy
The economy of Valley is largely based on agriculture and tourism. The town is home to several farms and ranches, which produce a variety of crops, including alfalfa, hay, corn, and wheat. The town is also home to several tourist attractions, including the Valley of the Gods, the Valley of the Ancients, and the Valley of the Sun.
The town is also home to several businesses, including restaurants, hotels, and retail stores. The town is also home to several government offices, including the San Juan County Courthouse and the San Juan County Sheriff's Office.
Demographics
As of the 2010 census, the population of Valley was 1,500. The racial makeup of the town was 94.2% White, 0.7% African American, 0.7% Native American, 0.7% Asian, 0.7% from other races, and 2.7% from two or more races. Hispanic or Latino of any race were 4.7% of the population.
The median income for a household in Valley was $35,000, and the median income for a family was $41,000. The per capita income for the town was $17,000. About 16.7% of families and 19.3% of the population were below the poverty line, including 25.0% of those under age 18 and 10.0% of those age 65 or over.
Common Questions
What is Per Capita Income in Lake Valley?
Per Capita income in Lake Valley is $28,315.
What is the Median Family Income in Lake Valley?
Median Family Income in Lake Valley is $78,370.
What is the Median Household income in Lake Valley?
Median Household Income in Lake Valley is $77,880.
What is Inequality or Gini Index in Lake Valley?
Inequality or Gini Index in Lake Valley is 0.21.
What is the Total Population of Lake Valley?
Total Population of Lake Valley is 98.
What is the Total Male Population of Lake Valley?
Total Male Population of Lake Valley is 28.
What is the Total Female Population of Lake Valley?
Total Female Population of Lake Valley is 70.
What is the Ratio of Males per 100 Females in Lake Valley?
There are 40.00 Males per 100 Females in Lake Valley.
What is the Ratio of Females per 100 Males in Lake Valley?
There are 250.00 Females per 100 Males in Lake Valley.
What is the Median Population Age in Lake Valley?
Median Population Age in Lake Valley is 53.9 Years.
What is the Average Family Size in Lake Valley
Average Family Size in Lake Valley is 2.6 People.
What is the Average Household Size in Lake Valley
Average Household Size in Lake Valley is 2.3 People.
How Large is the Labor Force in Lake Valley?
There are 48 People in the Labor Forcein in Lake Valley.
What is the Percentage of People in the Labor Force in Lake Valley?
51.1% of People are in the Labor Force in Lake Valley.
What is the Unemployment Rate in Lake Valley?
Unemployment Rate in Lake Valley is 10.4%.