La Union, NM Map & Demographics
La Union Map
La Union Overview
$28,069
PER CAPITA INCOME
$103,194
AVG FAMILY INCOME
2.1%
WAGE / INCOME GAP [ % ]
97.9¢/ $1
WAGE / INCOME GAP [ $ ]
0.37
INEQUALITY / GINI INDEX
869
TOTAL POPULATION
322
MALE POPULATION
547
FEMALE POPULATION
58.87
MALES / 100 FEMALES
169.88
FEMALES / 100 MALES
49.3
MEDIAN AGE
3.5
AVG FAMILY SIZE
3.1
AVG HOUSEHOLD SIZE
475
LABOR FORCE [ PEOPLE ]
66.0%
PERCENT IN LABOR FORCE
5.9%
UNEMPLOYMENT RATE
Income in La Union
Income Overview in La Union
| Characteristic | Number | Measure |
| Per Capita Income | 869 | $28,069 |
| Median Family Income | 233 | $103,194 |
| Mean Family Income | 233 | $92,555 |
| Median Household Income | 283 | $0 |
| Mean Household Income | 283 | $79,778 |
| Income Deficit | 233 | $0 |
| Wage / Income Gap (%) | 869 | 2.11% |
| Wage / Income Gap ($) | 869 | 97.89¢ per $1 |
| Gini / Inequality Index | 869 | 0.37 |
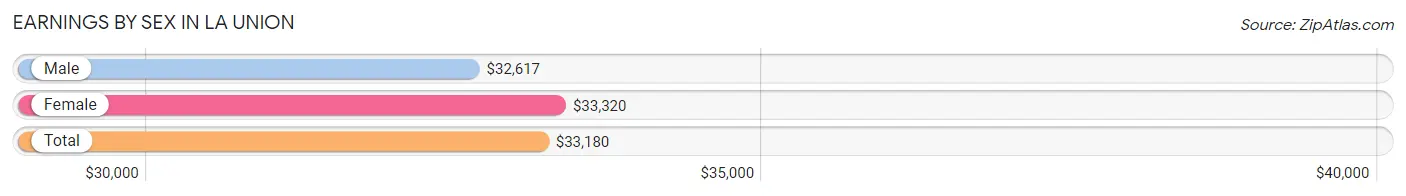
Earnings by Sex in La Union
Average Earnings in La Union are $33,180, $32,617 for men and $33,320 for women, a difference of 2.1%.
| Sex | Number | Average Earnings |
| Male | 169 (33.7%) | $32,617 |
| Female | 332 (66.3%) | $33,320 |
| Total | 501 (100.0%) | $33,180 |
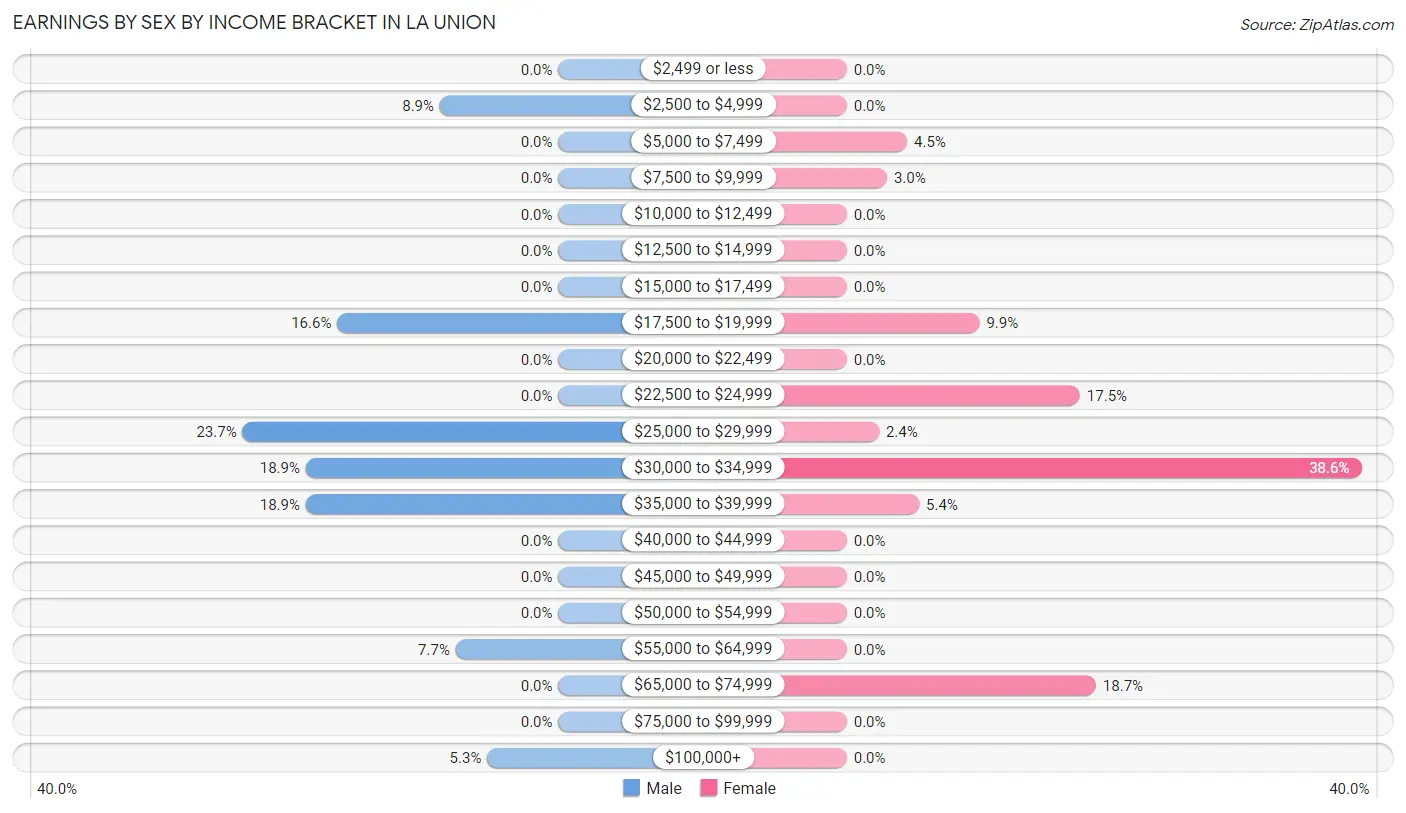
Earnings by Sex by Income Bracket in La Union
The most common earnings brackets in La Union are $25,000 to $29,999 for men (40 | 23.7%) and $30,000 to $34,999 for women (128 | 38.6%).
| Income | Male | Female |
| $2,499 or less | 0 (0.0%) | 0 (0.0%) |
| $2,500 to $4,999 | 15 (8.9%) | 0 (0.0%) |
| $5,000 to $7,499 | 0 (0.0%) | 15 (4.5%) |
| $7,500 to $9,999 | 0 (0.0%) | 10 (3.0%) |
| $10,000 to $12,499 | 0 (0.0%) | 0 (0.0%) |
| $12,500 to $14,999 | 0 (0.0%) | 0 (0.0%) |
| $15,000 to $17,499 | 0 (0.0%) | 0 (0.0%) |
| $17,500 to $19,999 | 28 (16.6%) | 33 (9.9%) |
| $20,000 to $22,499 | 0 (0.0%) | 0 (0.0%) |
| $22,500 to $24,999 | 0 (0.0%) | 58 (17.5%) |
| $25,000 to $29,999 | 40 (23.7%) | 8 (2.4%) |
| $30,000 to $34,999 | 32 (18.9%) | 128 (38.6%) |
| $35,000 to $39,999 | 32 (18.9%) | 18 (5.4%) |
| $40,000 to $44,999 | 0 (0.0%) | 0 (0.0%) |
| $45,000 to $49,999 | 0 (0.0%) | 0 (0.0%) |
| $50,000 to $54,999 | 0 (0.0%) | 0 (0.0%) |
| $55,000 to $64,999 | 13 (7.7%) | 0 (0.0%) |
| $65,000 to $74,999 | 0 (0.0%) | 62 (18.7%) |
| $75,000 to $99,999 | 0 (0.0%) | 0 (0.0%) |
| $100,000+ | 9 (5.3%) | 0 (0.0%) |
| Total | 169 (100.0%) | 332 (100.0%) |
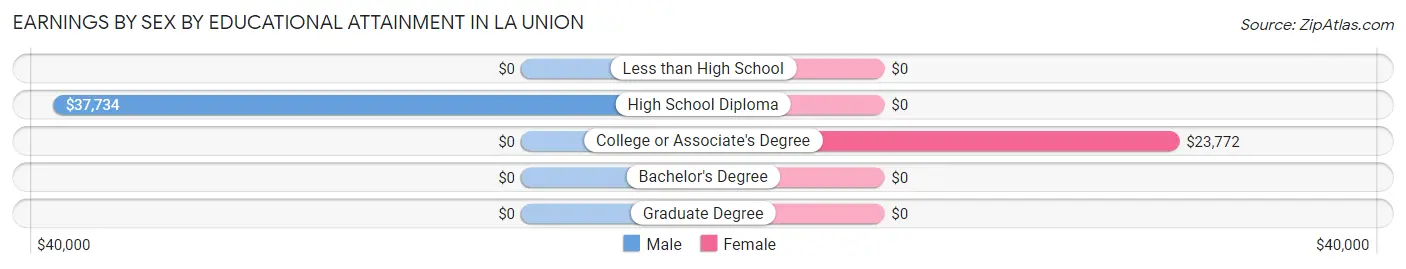
Earnings by Sex by Educational Attainment in La Union
| Educational Attainment | Male Income | Female Income |
| Less than High School | - | - |
| High School Diploma | $37,734 | $0 |
| College or Associate's Degree | - | - |
| Bachelor's Degree | - | - |
| Graduate Degree | - | - |
| Total | $33,711 | $0 |
Family Income in La Union
Family Income Brackets in La Union
According to the La Union family income data, there are 108 families falling into the $100,000 to $149,999 income range, which is the most common income bracket and makes up 46.4% of all families.
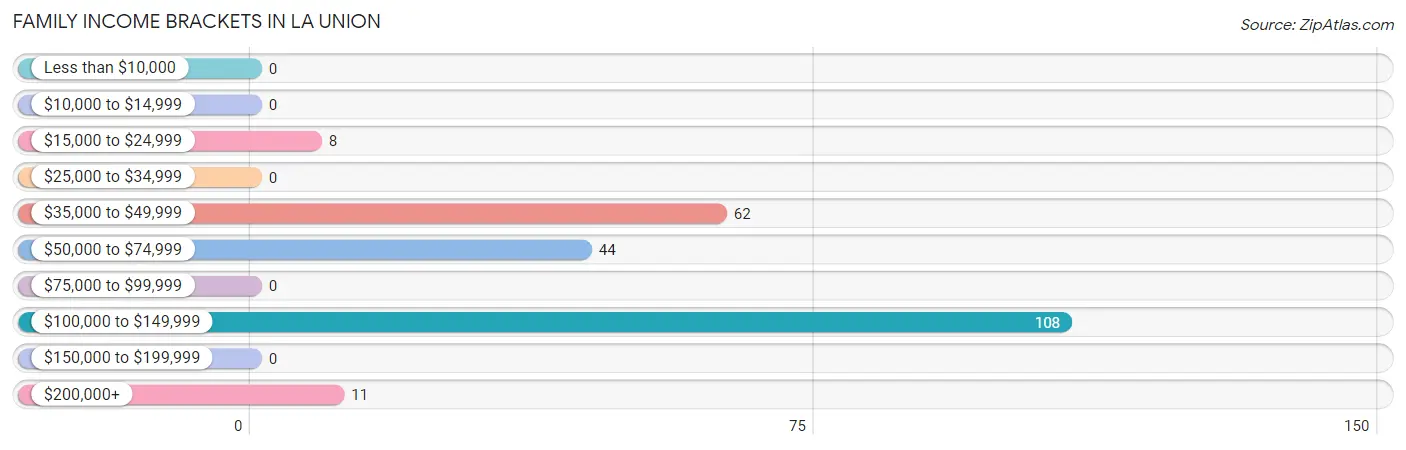
| Income Bracket | # Families | % Families |
| Less than $10,000 | 0 | 0.0% |
| $10,000 to $14,999 | 0 | 0.0% |
| $15,000 to $24,999 | 8 | 3.4% |
| $25,000 to $34,999 | 0 | 0.0% |
| $35,000 to $49,999 | 62 | 26.6% |
| $50,000 to $74,999 | 44 | 18.9% |
| $75,000 to $99,999 | 0 | 0.0% |
| $100,000 to $149,999 | 108 | 46.4% |
| $150,000 to $199,999 | 0 | 0.0% |
| $200,000+ | 11 | 4.7% |
Family Income by Famaliy Size in La Union
| Income Bracket | # Families | Median Income |
| 2-Person Families | 90 (38.6%) | $0 |
| 3-Person Families | 21 (9.0%) | $0 |
| 4-Person Families | 98 (42.1%) | $0 |
| 5-Person Families | 24 (10.3%) | $0 |
| 6-Person Families | 0 (0.0%) | $0 |
| 7+ Person Families | 0 (0.0%) | $0 |
| Total | 233 (100.0%) | $103,194 |
Family Income by Number of Earners in La Union
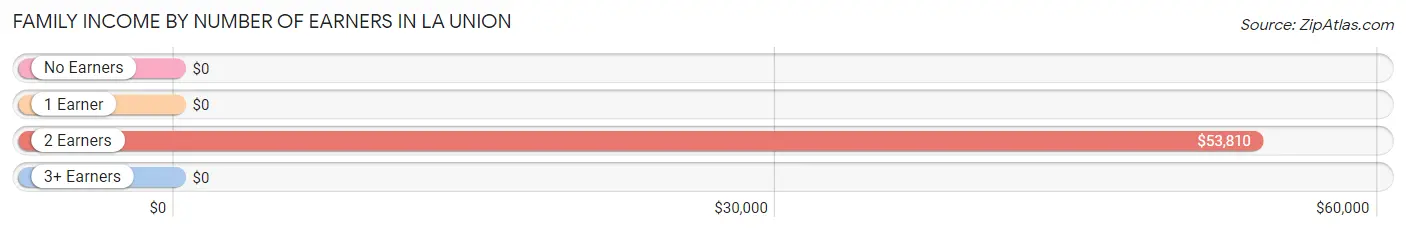
| Number of Earners | # Families | Median Income |
| No Earners | 10 (4.3%) | $0 |
| 1 Earner | 84 (36.0%) | $0 |
| 2 Earners | 88 (37.8%) | $53,810 |
| 3+ Earners | 51 (21.9%) | $0 |
| Total | 233 (100.0%) | $103,194 |
Household Income in La Union
Household Income Brackets in La Union
With 108 households falling in the category, the $100,000 to $149,999 income range is the most frequent in La Union, accounting for 38.2% of all households.
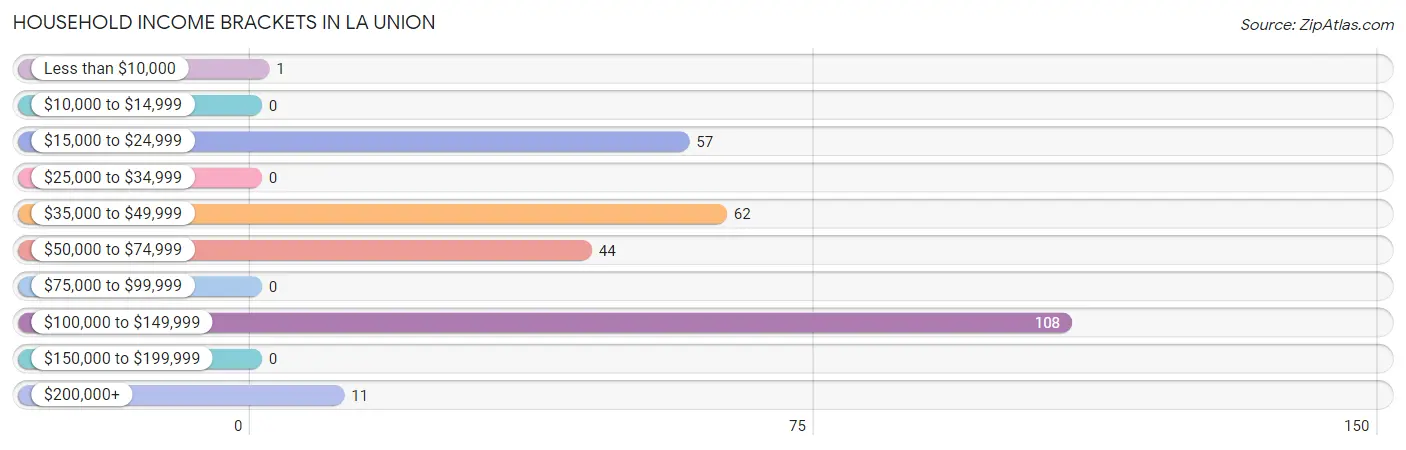
| Income Bracket | # Households | % Households |
| Less than $10,000 | 1 | 0.4% |
| $10,000 to $14,999 | 0 | 0.0% |
| $15,000 to $24,999 | 57 | 20.1% |
| $25,000 to $34,999 | 0 | 0.0% |
| $35,000 to $49,999 | 62 | 21.9% |
| $50,000 to $74,999 | 44 | 15.5% |
| $75,000 to $99,999 | 0 | 0.0% |
| $100,000 to $149,999 | 108 | 38.2% |
| $150,000 to $199,999 | 0 | 0.0% |
| $200,000+ | 11 | 3.9% |
Household Income by Householder Age in La Union
The median household income in La Union is $0, with the highest median household income of $110,464 found in the 65+ years age bracket for the primary householder. A total of 105 households (37.1%) fall into this category.
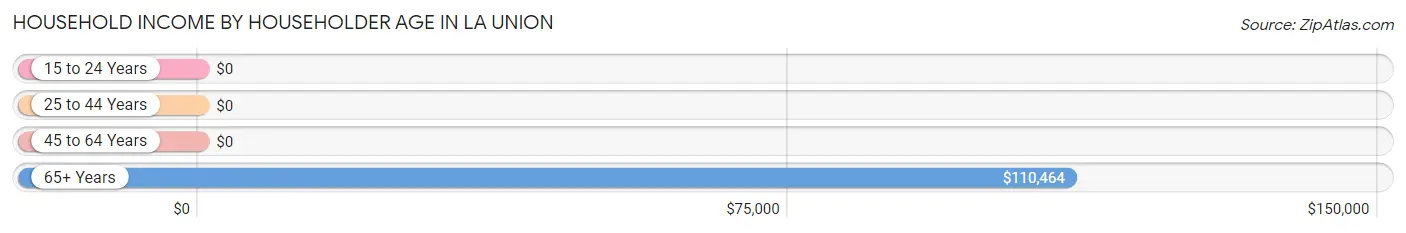
| Income Bracket | # Households | Median Income |
| 15 to 24 Years | 0 (0.0%) | $0 |
| 25 to 44 Years | 13 (4.6%) | $0 |
| 45 to 64 Years | 165 (58.3%) | $0 |
| 65+ Years | 105 (37.1%) | $110,464 |
| Total | 283 (100.0%) | $0 |
Poverty in La Union
Income Below Poverty by Sex and Age in La Union
With 2.8% poverty level for males and 5.5% for females among the residents of La Union, 55 to 64 year old males and 6 to 11 year old females are the most vulnerable to poverty, with 9 males (30.0%) and 22 females (61.1%) in their respective age groups living below the poverty level.
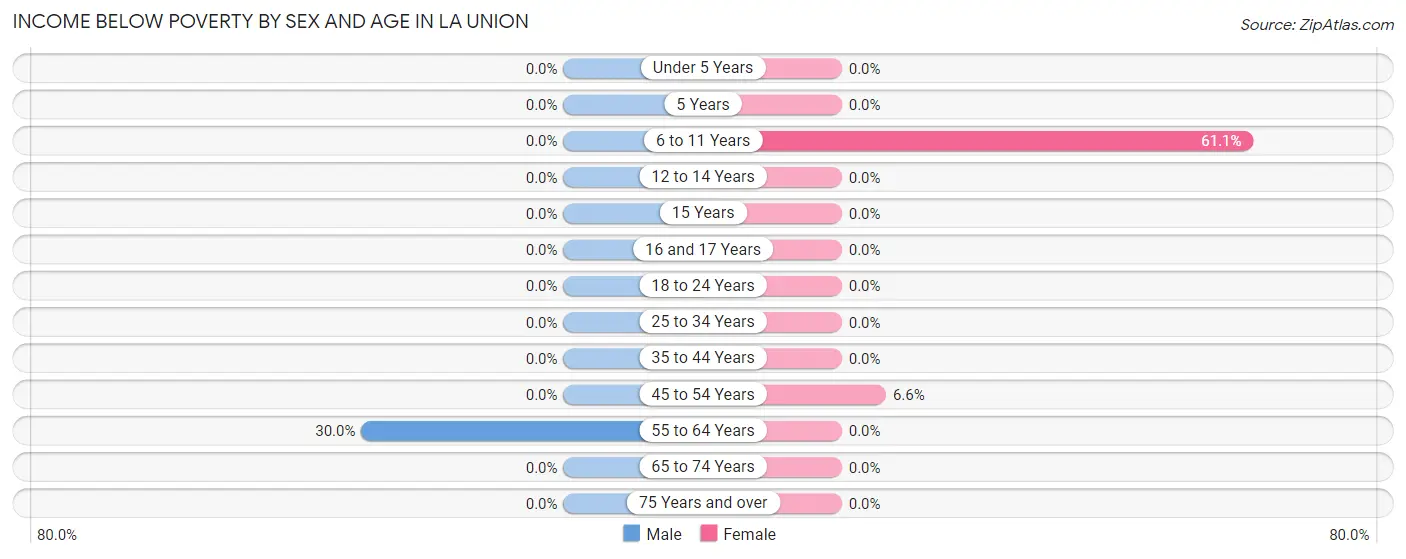
| Age Bracket | Male | Female |
| Under 5 Years | 0 (0.0%) | 0 (0.0%) |
| 5 Years | 0 (0.0%) | 0 (0.0%) |
| 6 to 11 Years | 0 (0.0%) | 22 (61.1%) |
| 12 to 14 Years | 0 (0.0%) | 0 (0.0%) |
| 15 Years | 0 (0.0%) | 0 (0.0%) |
| 16 and 17 Years | 0 (0.0%) | 0 (0.0%) |
| 18 to 24 Years | 0 (0.0%) | 0 (0.0%) |
| 25 to 34 Years | 0 (0.0%) | 0 (0.0%) |
| 35 to 44 Years | 0 (0.0%) | 0 (0.0%) |
| 45 to 54 Years | 0 (0.0%) | 8 (6.6%) |
| 55 to 64 Years | 9 (30.0%) | 0 (0.0%) |
| 65 to 74 Years | 0 (0.0%) | 0 (0.0%) |
| 75 Years and over | 0 (0.0%) | 0 (0.0%) |
| Total | 9 (2.8%) | 30 (5.5%) |
Income Above Poverty by Sex and Age in La Union
According to the poverty statistics in La Union, males aged 6 to 11 years and females aged 12 to 14 years are the age groups that are most secure financially, with 100.0% of males and 100.0% of females in these age groups living above the poverty line.
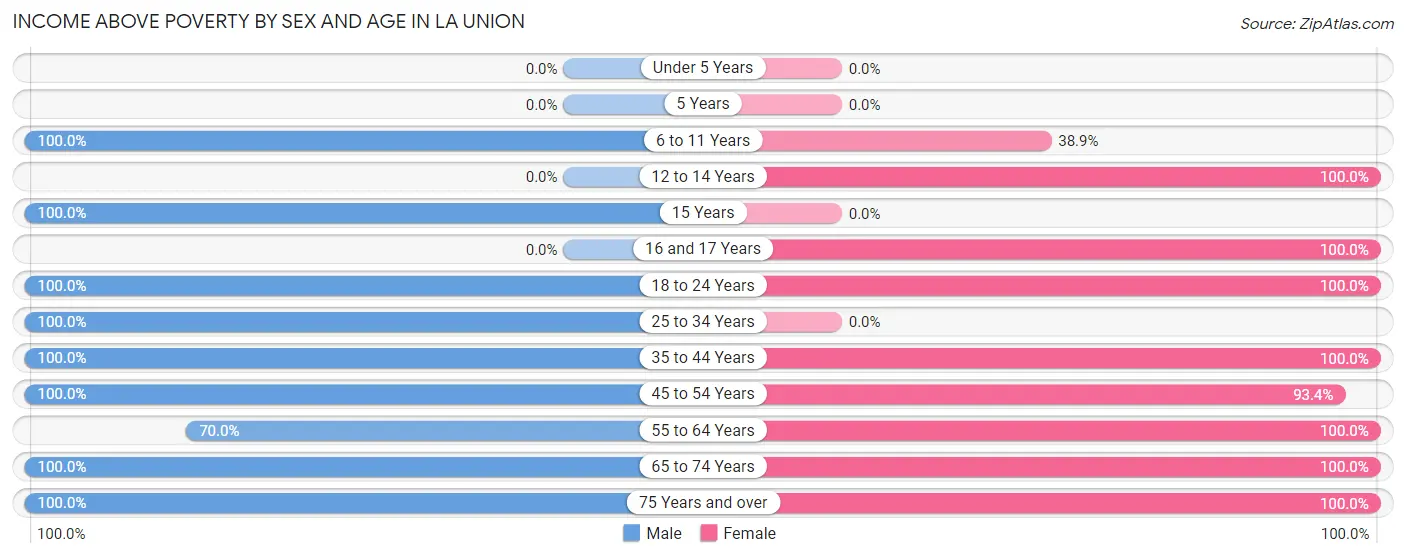
| Age Bracket | Male | Female |
| Under 5 Years | 0 (0.0%) | 0 (0.0%) |
| 5 Years | 0 (0.0%) | 0 (0.0%) |
| 6 to 11 Years | 29 (100.0%) | 14 (38.9%) |
| 12 to 14 Years | 0 (0.0%) | 39 (100.0%) |
| 15 Years | 45 (100.0%) | 0 (0.0%) |
| 16 and 17 Years | 0 (0.0%) | 9 (100.0%) |
| 18 to 24 Years | 28 (100.0%) | 143 (100.0%) |
| 25 to 34 Years | 16 (100.0%) | 0 (0.0%) |
| 35 to 44 Years | 25 (100.0%) | 22 (100.0%) |
| 45 to 54 Years | 92 (100.0%) | 114 (93.4%) |
| 55 to 64 Years | 21 (70.0%) | 97 (100.0%) |
| 65 to 74 Years | 26 (100.0%) | 45 (100.0%) |
| 75 Years and over | 31 (100.0%) | 34 (100.0%) |
| Total | 313 (97.2%) | 517 (94.5%) |
Income Below Poverty Among Married-Couple Families in La Union
The poverty statistics for married-couple families in La Union show that 4.7% or 8 of the total 169 families live below the poverty line. Families with 1 or 2 children have the highest poverty rate of 10.0%, comprising of 8 families. On the other hand, families with no children have the lowest poverty rate of 0.0%, which includes 0 families.
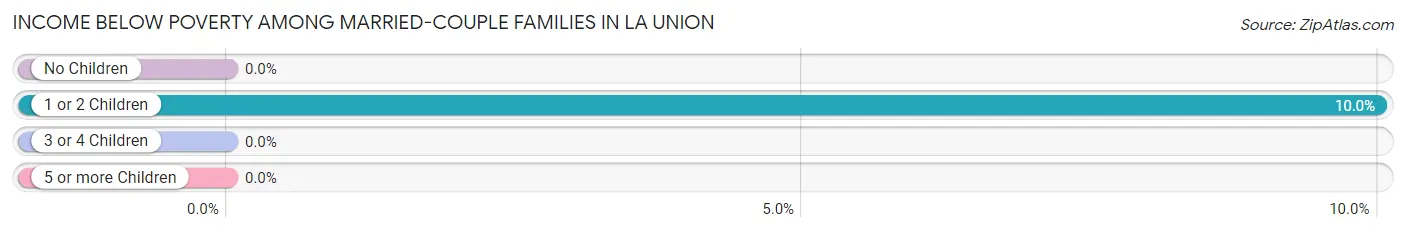
| Children | Above Poverty | Below Poverty |
| No Children | 76 (100.0%) | 0 (0.0%) |
| 1 or 2 Children | 72 (90.0%) | 8 (10.0%) |
| 3 or 4 Children | 13 (100.0%) | 0 (0.0%) |
| 5 or more Children | 0 (0.0%) | 0 (0.0%) |
| Total | 161 (95.3%) | 8 (4.7%) |
Income Below Poverty Among Single-Parent Households in La Union
| Children | Single Father | Single Mother |
| No Children | 0 (0.0%) | 0 (0.0%) |
| 1 or 2 Children | 0 (0.0%) | 0 (0.0%) |
| 3 or 4 Children | 0 (0.0%) | 0 (0.0%) |
| 5 or more Children | 0 (0.0%) | 0 (0.0%) |
| Total | 0 (0.0%) | 0 (0.0%) |
Income Below Poverty Among Married-Couple vs Single-Parent Households in La Union
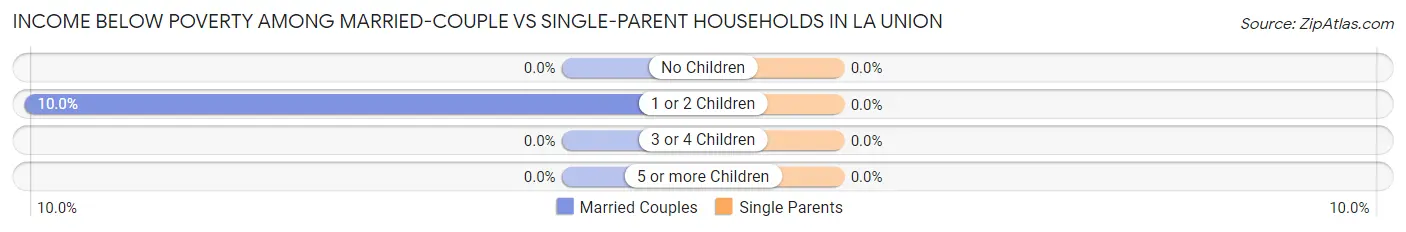
| Children | Married-Couple Families | Single-Parent Households |
| No Children | 0 (0.0%) | 0 (0.0%) |
| 1 or 2 Children | 8 (10.0%) | 0 (0.0%) |
| 3 or 4 Children | 0 (0.0%) | 0 (0.0%) |
| 5 or more Children | 0 (0.0%) | 0 (0.0%) |
| Total | 8 (4.7%) | 0 (0.0%) |
Race in La Union
The most populous races in La Union are Hispanic or Latino (820 | 94.4%), White / Caucasian (494 | 56.9%), and Some other Race (219 | 25.2%).
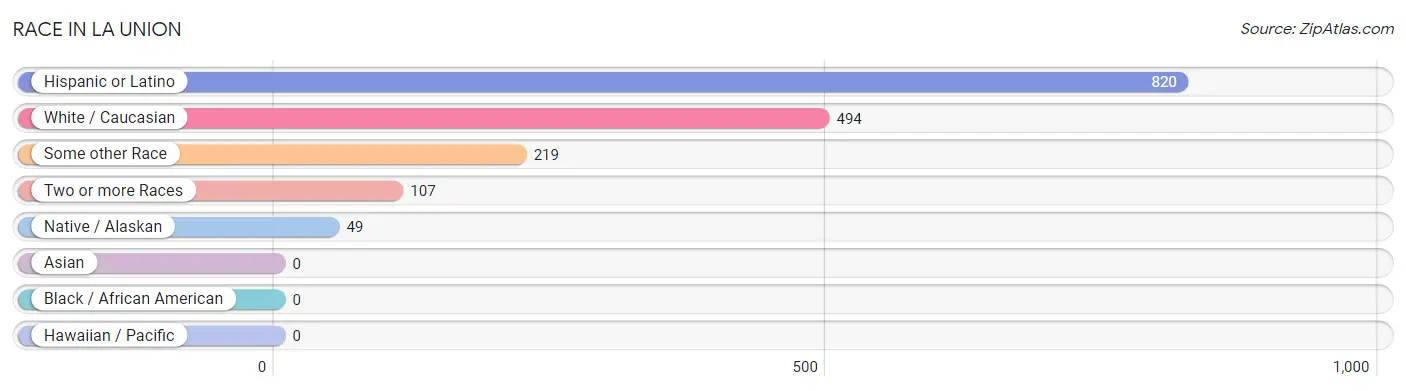
| Race | # Population | % Population |
| Asian | 0 | 0.0% |
| Black / African American | 0 | 0.0% |
| Hawaiian / Pacific | 0 | 0.0% |
| Hispanic or Latino | 820 | 94.4% |
| Native / Alaskan | 49 | 5.6% |
| White / Caucasian | 494 | 56.9% |
| Two or more Races | 107 | 12.3% |
| Some other Race | 219 | 25.2% |
| Total | 869 | 100.0% |
Ancestry in La Union
The most populous ancestries reported in La Union are Mexican (750 | 86.3%), Spaniard (70 | 8.1%), Pueblo (41 | 4.7%), Apache (26 | 3.0%), and English (19 | 2.2%), together accounting for 104.3% of all La Union residents.
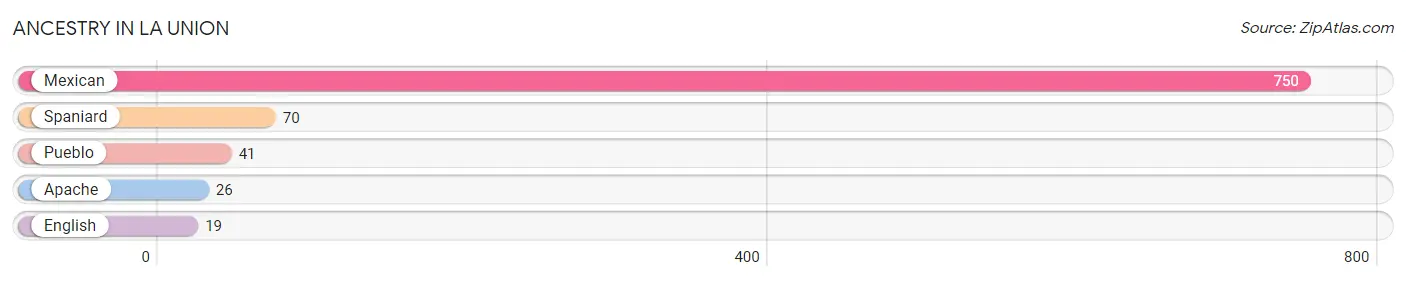
| Ancestry | # Population | % Population |
| Apache | 26 | 3.0% |
| English | 19 | 2.2% |
| Mexican | 750 | 86.3% |
| Pueblo | 41 | 4.7% |
| Spaniard | 70 | 8.1% | View All 5 Rows |
Immigrants in La Union
The most numerous immigrant groups reported in La Union came from Central America (100 | 11.5%), Latin America (100 | 11.5%), and Mexico (100 | 11.5%), together accounting for 34.5% of all La Union residents.
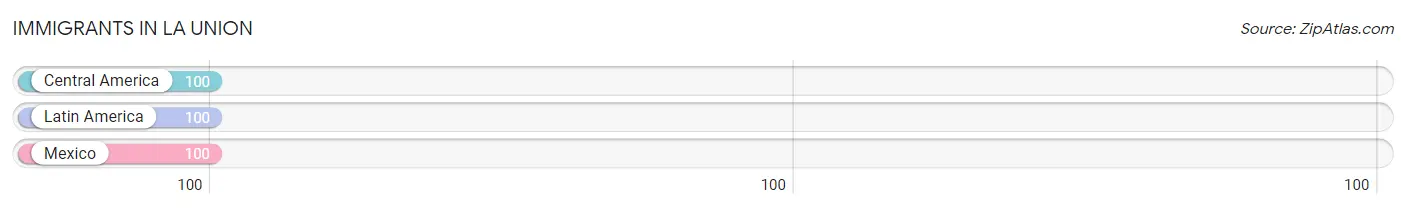
| Immigration Origin | # Population | % Population |
| Central America | 100 | 11.5% |
| Latin America | 100 | 11.5% |
| Mexico | 100 | 11.5% | View All 3 Rows |
Sex and Age in La Union
Sex and Age in La Union
The most populous age groups in La Union are 50 to 54 Years (92 | 28.6%) for men and 20 to 24 Years (128 | 23.4%) for women.
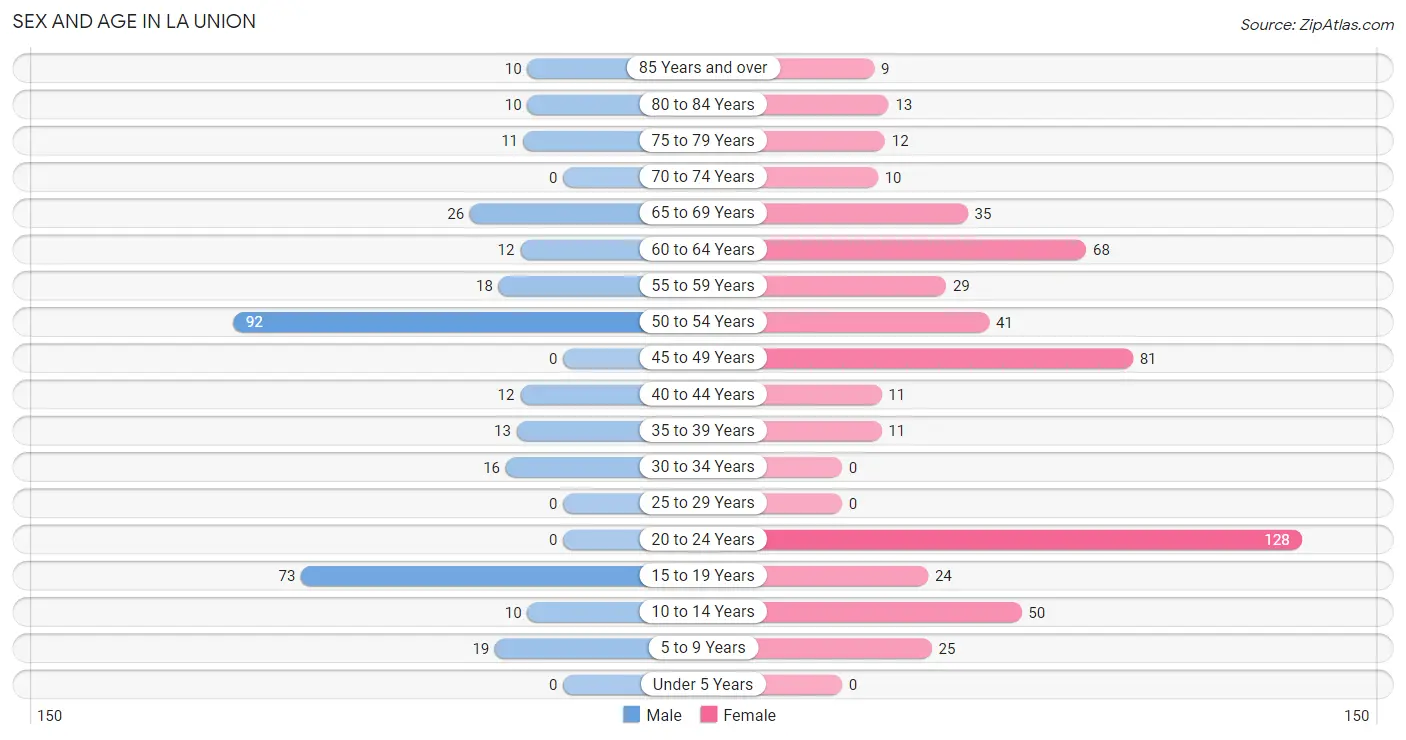
| Age Bracket | Male | Female |
| Under 5 Years | 0 (0.0%) | 0 (0.0%) |
| 5 to 9 Years | 19 (5.9%) | 25 (4.6%) |
| 10 to 14 Years | 10 (3.1%) | 50 (9.1%) |
| 15 to 19 Years | 73 (22.7%) | 24 (4.4%) |
| 20 to 24 Years | 0 (0.0%) | 128 (23.4%) |
| 25 to 29 Years | 0 (0.0%) | 0 (0.0%) |
| 30 to 34 Years | 16 (5.0%) | 0 (0.0%) |
| 35 to 39 Years | 13 (4.0%) | 11 (2.0%) |
| 40 to 44 Years | 12 (3.7%) | 11 (2.0%) |
| 45 to 49 Years | 0 (0.0%) | 81 (14.8%) |
| 50 to 54 Years | 92 (28.6%) | 41 (7.5%) |
| 55 to 59 Years | 18 (5.6%) | 29 (5.3%) |
| 60 to 64 Years | 12 (3.7%) | 68 (12.4%) |
| 65 to 69 Years | 26 (8.1%) | 35 (6.4%) |
| 70 to 74 Years | 0 (0.0%) | 10 (1.8%) |
| 75 to 79 Years | 11 (3.4%) | 12 (2.2%) |
| 80 to 84 Years | 10 (3.1%) | 13 (2.4%) |
| 85 Years and over | 10 (3.1%) | 9 (1.7%) |
| Total | 322 (100.0%) | 547 (100.0%) |
Families and Households in La Union
Median Family Size in La Union
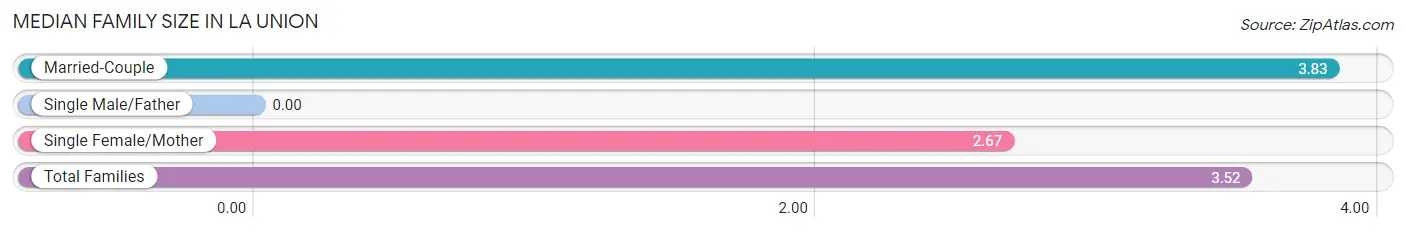
| Family Type | # Families | Family Size |
| Married-Couple | 169 (72.5%) | 3.83 |
| Single Male/Father | 0 (0.0%) | - |
| Single Female/Mother | 64 (27.5%) | 2.67 |
| Total Families | 233 (100.0%) | 3.52 |
Median Household Size in La Union
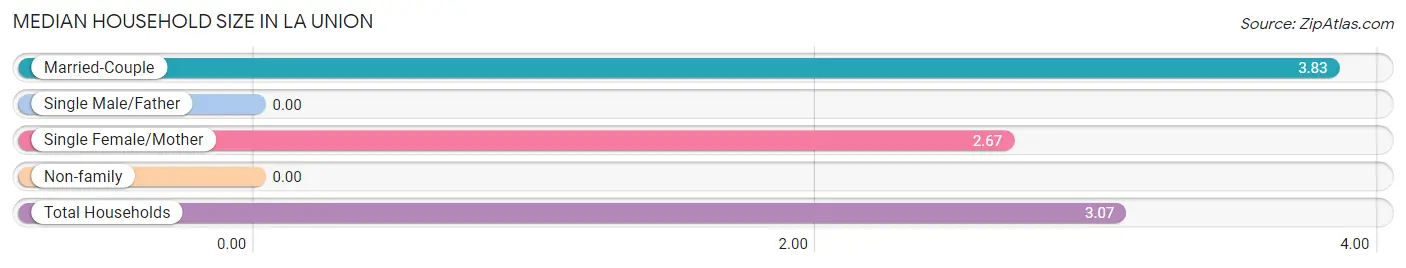
| Household Type | # Households | Household Size |
| Married-Couple | 169 (59.7%) | 3.83 |
| Single Male/Father | 0 (0.0%) | - |
| Single Female/Mother | 64 (22.6%) | 2.67 |
| Non-family | 50 (17.7%) | - |
| Total Households | 283 (100.0%) | 3.07 |
Household Size by Marriage Status in La Union
Out of a total of 283 households in La Union, 233 (82.3%) are family households, while 50 (17.7%) are nonfamily households. The most numerous type of family households are 4-person households, comprising 98, and the most common type of nonfamily households are 1-person households, comprising 50.
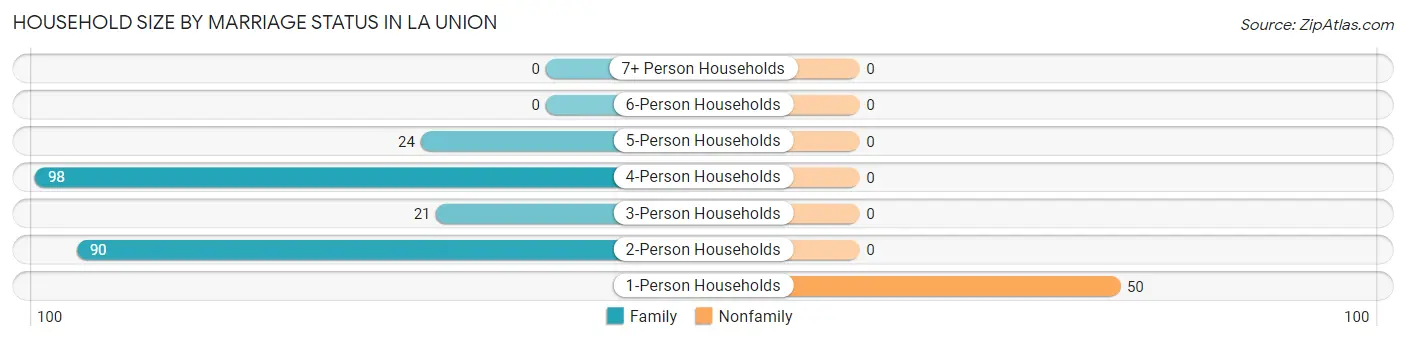
| Household Size | Family Households | Nonfamily Households |
| 1-Person Households | - | 50 (17.7%) |
| 2-Person Households | 90 (31.8%) | 0 (0.0%) |
| 3-Person Households | 21 (7.4%) | 0 (0.0%) |
| 4-Person Households | 98 (34.6%) | 0 (0.0%) |
| 5-Person Households | 24 (8.5%) | 0 (0.0%) |
| 6-Person Households | 0 (0.0%) | 0 (0.0%) |
| 7+ Person Households | 0 (0.0%) | 0 (0.0%) |
| Total | 233 (82.3%) | 50 (17.7%) |
Female Fertility in La Union
Fertility by Age in La Union
| Age Bracket | Women with Births | Births / 1,000 Women |
| 15 to 19 years | 0 (0.0%) | 0.0 |
| 20 to 34 years | 0 (0.0%) | 0.0 |
| 35 to 50 years | 0 (0.0%) | 0.0 |
| Total | 0 (0.0%) | 0.0 |
Fertility by Age by Marriage Status in La Union
| Age Bracket | Married | Unmarried |
| 15 to 19 years | 0 (0.0%) | 0 (0.0%) |
| 20 to 34 years | 0 (0.0%) | 0 (0.0%) |
| 35 to 50 years | 0 (0.0%) | 0 (0.0%) |
| Total | 0 (0.0%) | 0 (0.0%) |
Fertility by Education in La Union
| Educational Attainment | Women with Births | Births / 1,000 Women |
| Less than High School | 0 (0.0%) | 0.0 |
| High School Diploma | 0 (0.0%) | 0.0 |
| College or Associate's Degree | 0 (0.0%) | 0.0 |
| Bachelor's Degree | 0 (0.0%) | 0.0 |
| Graduate Degree | 0 (0.0%) | 0.0 |
| Total | 0 (0.0%) | 0.0 |
Fertility by Education by Marriage Status in La Union
| Educational Attainment | Married | Unmarried |
| Less than High School | 0 (0.0%) | 0 (0.0%) |
| High School Diploma | 0 (0.0%) | 0 (0.0%) |
| College or Associate's Degree | 0 (0.0%) | 0 (0.0%) |
| Bachelor's Degree | 0 (0.0%) | 0 (0.0%) |
| Graduate Degree | 0 (0.0%) | 0 (0.0%) |
| Total | 0 (0.0%) | 0 (0.0%) |
Employment Characteristics in La Union
Employment by Class of Employer in La Union
Among the 447 employed individuals in La Union, local government employees (214 | 47.9%), private company employees (122 | 27.3%), and state government employees (86 | 19.2%) make up the most common classes of employment.
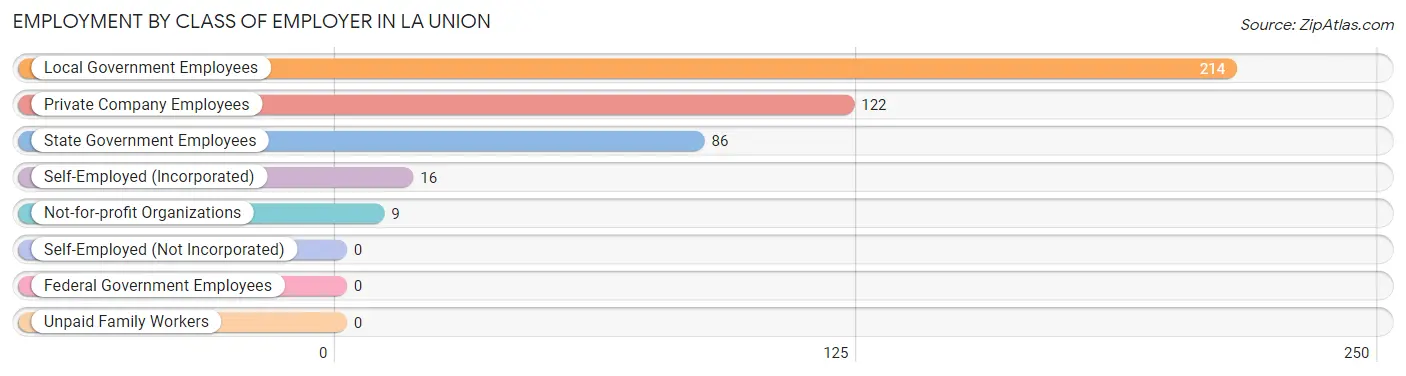
| Employer Class | # Employees | % Employees |
| Private Company Employees | 122 | 27.3% |
| Self-Employed (Incorporated) | 16 | 3.6% |
| Self-Employed (Not Incorporated) | 0 | 0.0% |
| Not-for-profit Organizations | 9 | 2.0% |
| Local Government Employees | 214 | 47.9% |
| State Government Employees | 86 | 19.2% |
| Federal Government Employees | 0 | 0.0% |
| Unpaid Family Workers | 0 | 0.0% |
| Total | 447 | 100.0% |
Employment Status by Age in La Union
According to the labor force statistics for La Union, out of the total population over 16 years of age (720), 66.0% or 475 individuals are in the labor force, with 5.9% or 28 of them unemployed. The age group with the highest labor force participation rate is 20 to 24 years, with 100.0% or 128 individuals in the labor force. Within the labor force, the 16 to 19 years age range has the highest percentage of unemployed individuals, with 100.0% or 28 of them being unemployed.
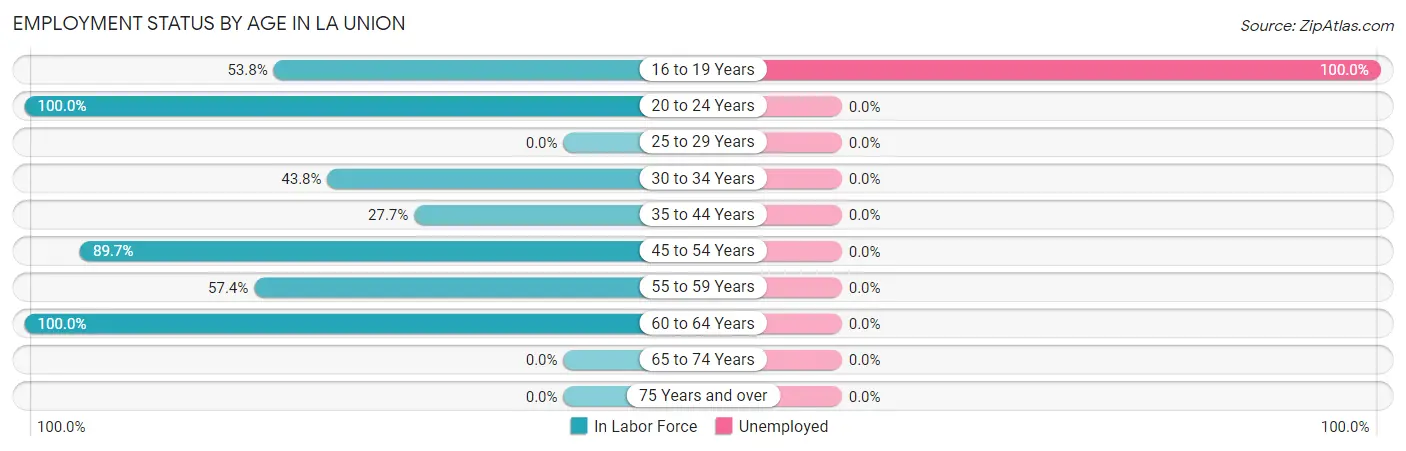
| Age Bracket | In Labor Force | Unemployed |
| 16 to 19 Years | 28 (53.8%) | 28 (100.0%) |
| 20 to 24 Years | 128 (100.0%) | 0 (0.0%) |
| 25 to 29 Years | 0 (0.0%) | 0 (0.0%) |
| 30 to 34 Years | 7 (43.8%) | 0 (0.0%) |
| 35 to 44 Years | 13 (27.7%) | 0 (0.0%) |
| 45 to 54 Years | 192 (89.7%) | 0 (0.0%) |
| 55 to 59 Years | 27 (57.4%) | 0 (0.0%) |
| 60 to 64 Years | 80 (100.0%) | 0 (0.0%) |
| 65 to 74 Years | 0 (0.0%) | 0 (0.0%) |
| 75 Years and over | 0 (0.0%) | 0 (0.0%) |
| Total | 475 (66.0%) | 28 (5.9%) |
Employment Status by Educational Attainment in La Union
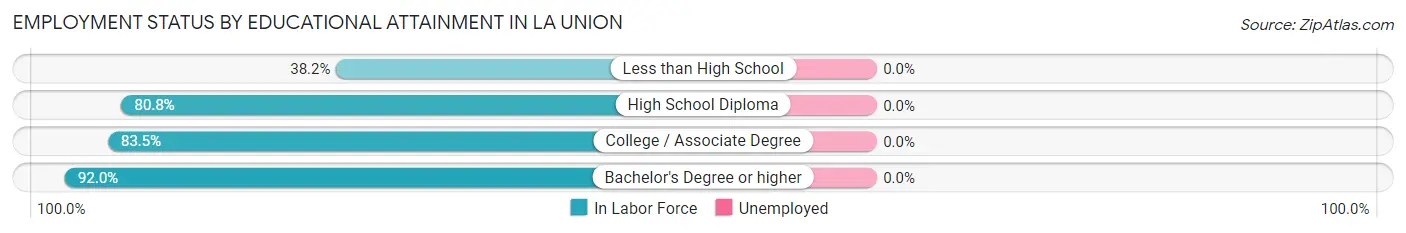
| Educational Attainment | In Labor Force | Unemployed |
| Less than High School | 21 (38.2%) | 0 (0.0%) |
| High School Diploma | 84 (80.8%) | 0 (0.0%) |
| College / Associate Degree | 111 (83.5%) | 0 (0.0%) |
| Bachelor's Degree or higher | 103 (92.0%) | 0 (0.0%) |
| Total | 319 (79.0%) | 0 (0.0%) |
Employment Occupations by Sex in La Union
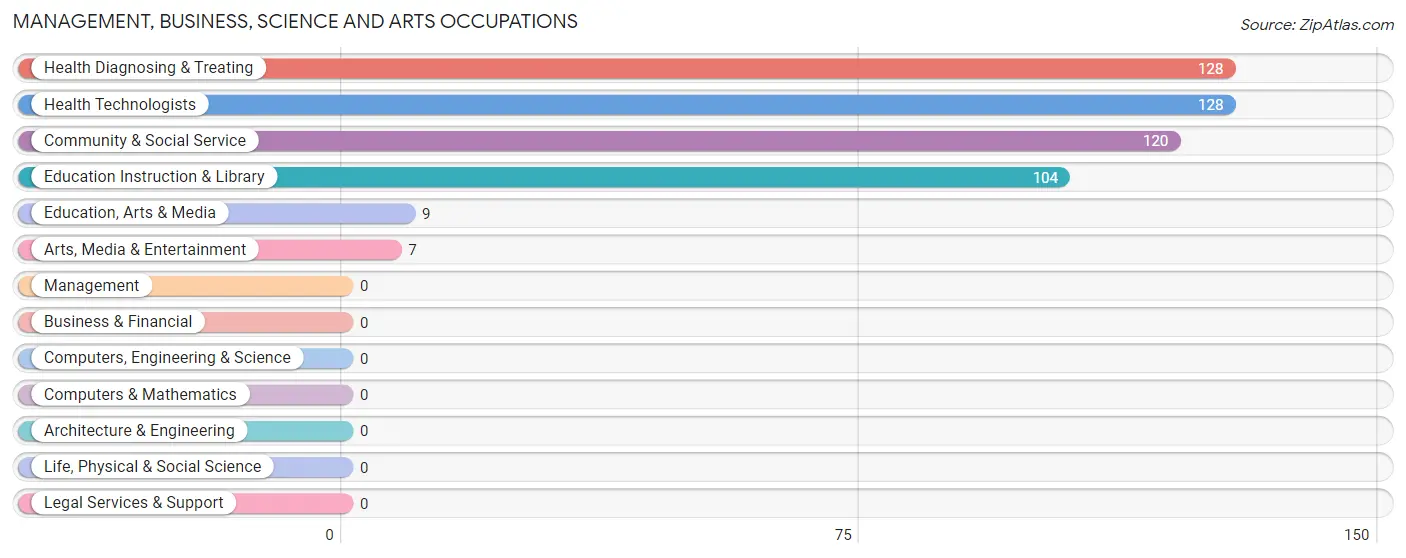
Management, Business, Science and Arts Occupations
The most common Management, Business, Science and Arts occupations in La Union are Health Diagnosing & Treating (128 | 28.6%), Health Technologists (128 | 28.6%), Community & Social Service (120 | 26.9%), Education Instruction & Library (104 | 23.3%), and Education, Arts & Media (9 | 2.0%).
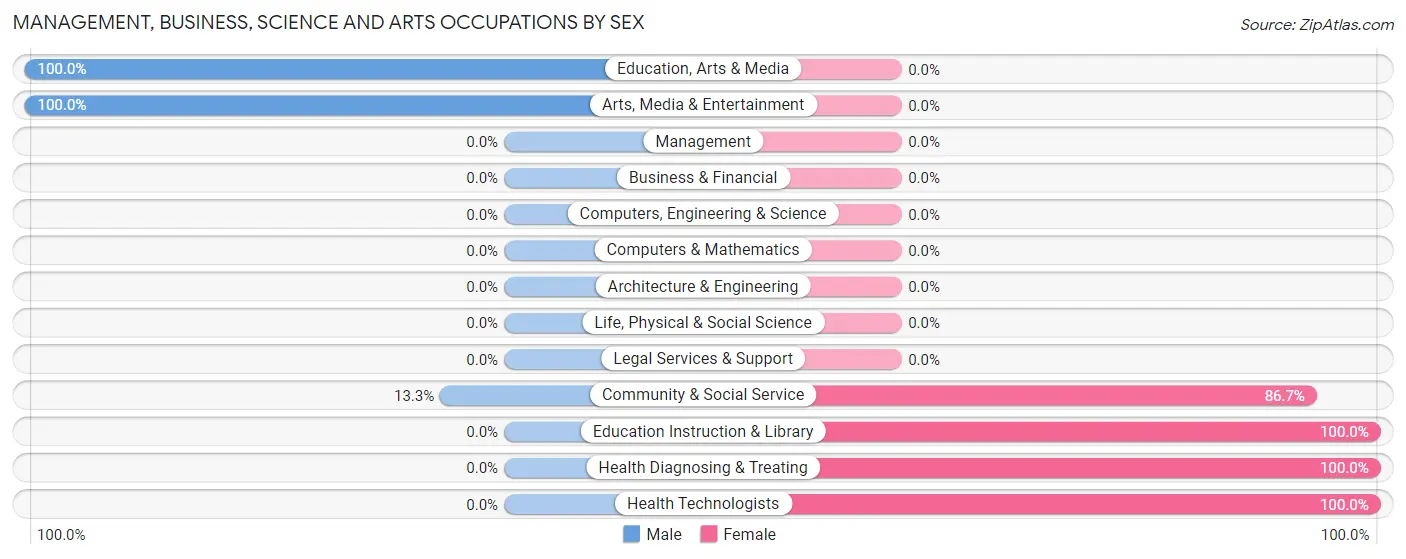
Management, Business, Science and Arts Occupations by Sex
Within the Management, Business, Science and Arts occupations in La Union, the most male-oriented occupations are Education, Arts & Media (100.0%), Arts, Media & Entertainment (100.0%), and Community & Social Service (13.3%), while the most female-oriented occupations are Education Instruction & Library (100.0%), Health Diagnosing & Treating (100.0%), and Health Technologists (100.0%).
| Occupation | Male | Female |
| Management | 0 (0.0%) | 0 (0.0%) |
| Business & Financial | 0 (0.0%) | 0 (0.0%) |
| Computers, Engineering & Science | 0 (0.0%) | 0 (0.0%) |
| Computers & Mathematics | 0 (0.0%) | 0 (0.0%) |
| Architecture & Engineering | 0 (0.0%) | 0 (0.0%) |
| Life, Physical & Social Science | 0 (0.0%) | 0 (0.0%) |
| Community & Social Service | 16 (13.3%) | 104 (86.7%) |
| Education, Arts & Media | 9 (100.0%) | 0 (0.0%) |
| Legal Services & Support | 0 (0.0%) | 0 (0.0%) |
| Education Instruction & Library | 0 (0.0%) | 104 (100.0%) |
| Arts, Media & Entertainment | 7 (100.0%) | 0 (0.0%) |
| Health Diagnosing & Treating | 0 (0.0%) | 128 (100.0%) |
| Health Technologists | 0 (0.0%) | 128 (100.0%) |
| Total (Category) | 16 (6.5%) | 232 (93.5%) |
| Total (Overall) | 141 (31.5%) | 306 (68.5%) |
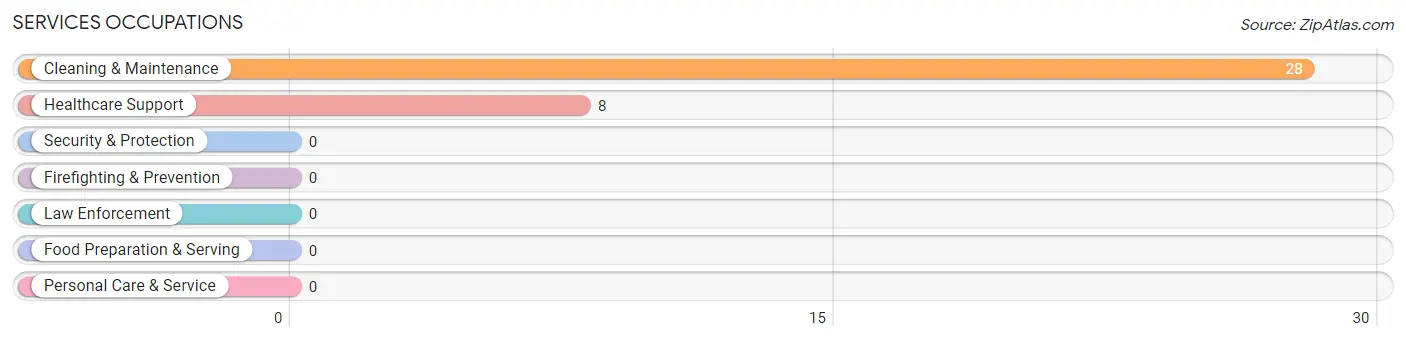
Services Occupations
The most common Services occupations in La Union are Cleaning & Maintenance (28 | 6.3%), and Healthcare Support (8 | 1.8%).
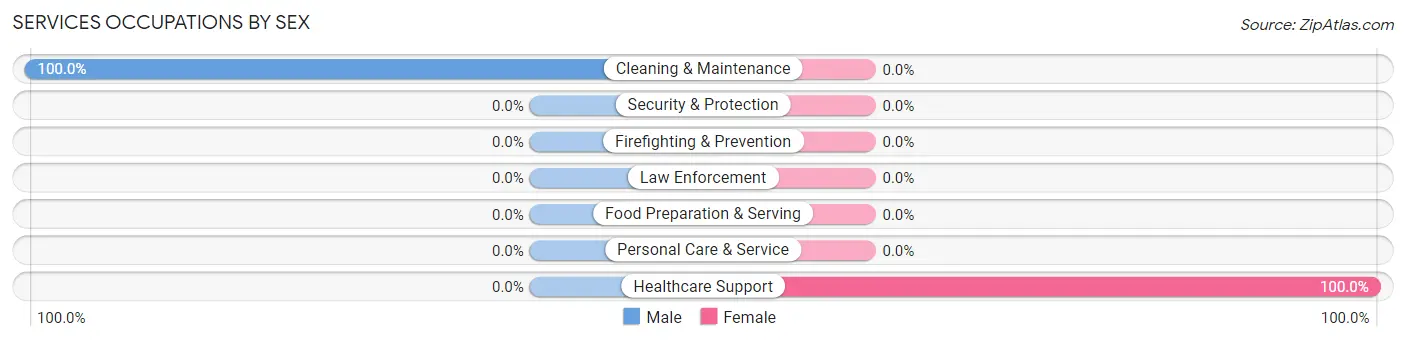
Services Occupations by Sex
| Occupation | Male | Female |
| Healthcare Support | 0 (0.0%) | 8 (100.0%) |
| Security & Protection | 0 (0.0%) | 0 (0.0%) |
| Firefighting & Prevention | 0 (0.0%) | 0 (0.0%) |
| Law Enforcement | 0 (0.0%) | 0 (0.0%) |
| Food Preparation & Serving | 0 (0.0%) | 0 (0.0%) |
| Cleaning & Maintenance | 28 (100.0%) | 0 (0.0%) |
| Personal Care & Service | 0 (0.0%) | 0 (0.0%) |
| Total (Category) | 28 (77.8%) | 8 (22.2%) |
| Total (Overall) | 141 (31.5%) | 306 (68.5%) |
Sales and Office Occupations
The most common Sales and Office occupations in La Union are Office & Administration (33 | 7.4%), and Sales & Related (10 | 2.2%).
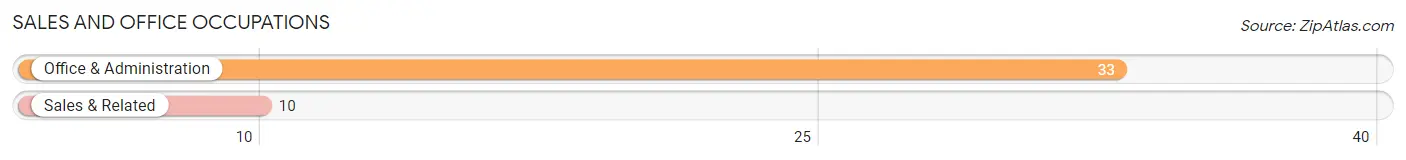
Sales and Office Occupations by Sex

| Occupation | Male | Female |
| Sales & Related | 0 (0.0%) | 10 (100.0%) |
| Office & Administration | 8 (24.2%) | 25 (75.8%) |
| Total (Category) | 8 (18.6%) | 35 (81.4%) |
| Total (Overall) | 141 (31.5%) | 306 (68.5%) |
Natural Resources, Construction and Maintenance Occupations
The most common Natural Resources, Construction and Maintenance occupations in La Union are , and Construction & Extraction (24 | 5.4%).
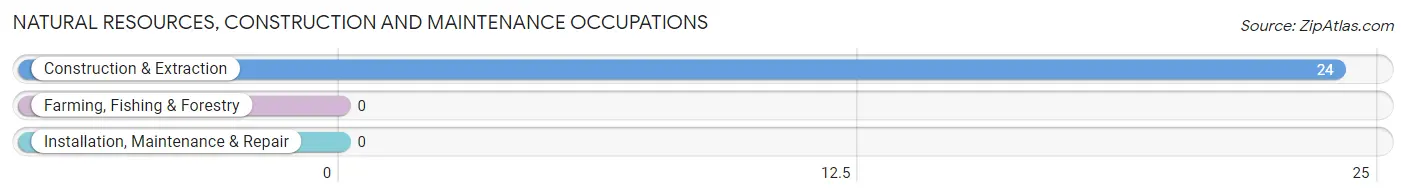
Natural Resources, Construction and Maintenance Occupations by Sex

| Occupation | Male | Female |
| Farming, Fishing & Forestry | 0 (0.0%) | 0 (0.0%) |
| Construction & Extraction | 24 (100.0%) | 0 (0.0%) |
| Installation, Maintenance & Repair | 0 (0.0%) | 0 (0.0%) |
| Total (Category) | 24 (100.0%) | 0 (0.0%) |
| Total (Overall) | 141 (31.5%) | 306 (68.5%) |
Production, Transportation and Moving Occupations
The most common Production, Transportation and Moving occupations in La Union are Production (53 | 11.9%), Transportation (31 | 6.9%), and Material Moving (12 | 2.7%).
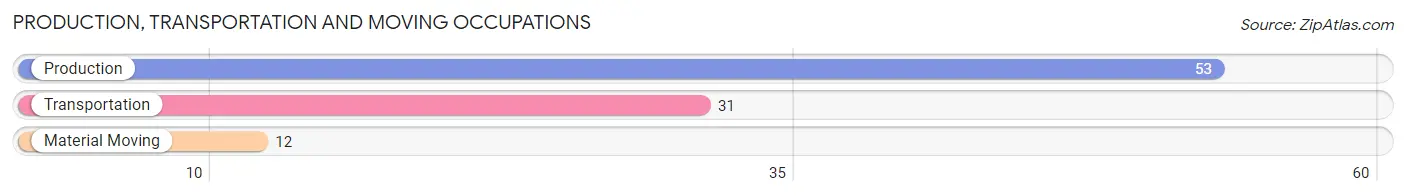
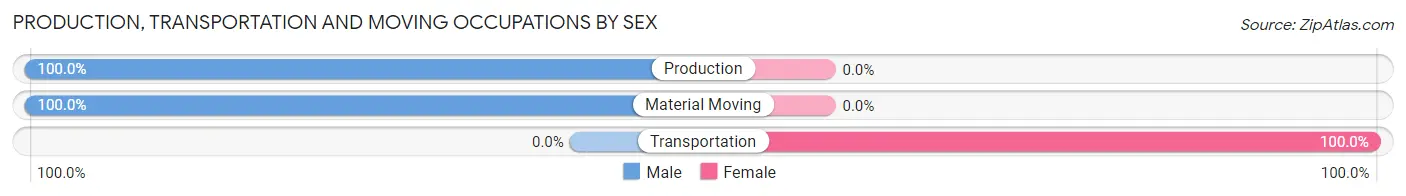
Production, Transportation and Moving Occupations by Sex
| Occupation | Male | Female |
| Production | 53 (100.0%) | 0 (0.0%) |
| Transportation | 0 (0.0%) | 31 (100.0%) |
| Material Moving | 12 (100.0%) | 0 (0.0%) |
| Total (Category) | 65 (67.7%) | 31 (32.3%) |
| Total (Overall) | 141 (31.5%) | 306 (68.5%) |
Employment Industries by Sex in La Union
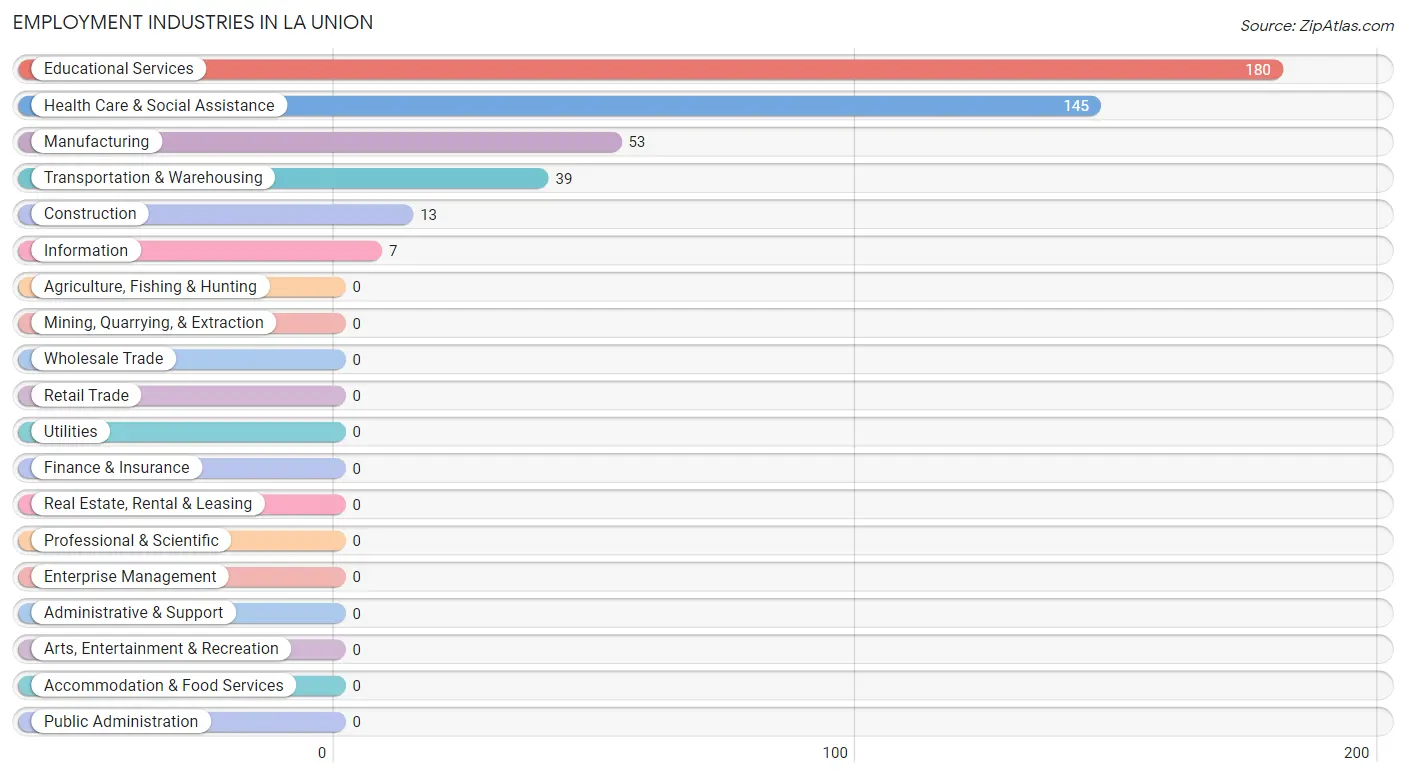
Employment Industries in La Union
The major employment industries in La Union include Educational Services (180 | 40.3%), Health Care & Social Assistance (145 | 32.4%), Manufacturing (53 | 11.9%), Transportation & Warehousing (39 | 8.7%), and Construction (13 | 2.9%).
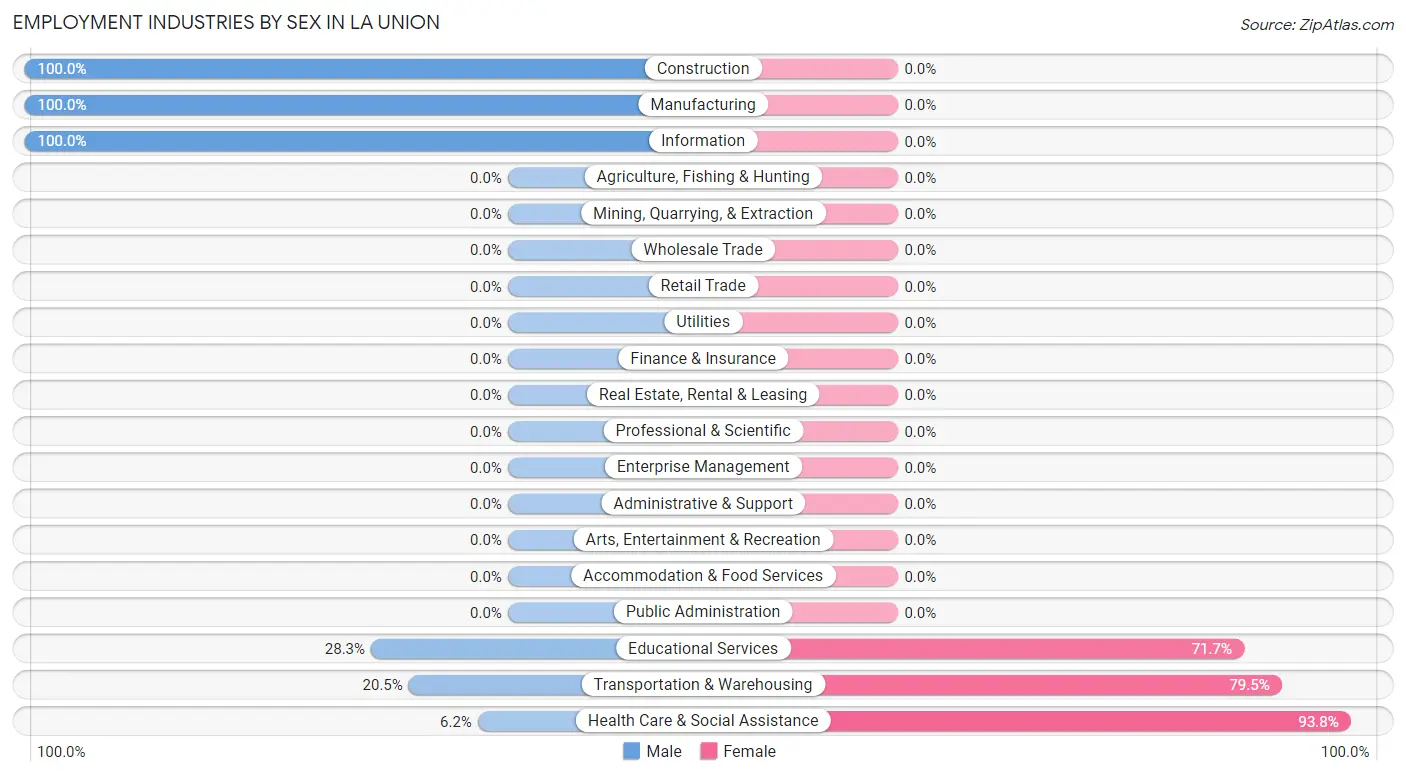
Employment Industries by Sex in La Union
The La Union industries that see more men than women are Construction (100.0%), Manufacturing (100.0%), and Information (100.0%), whereas the industries that tend to have a higher number of women are Health Care & Social Assistance (93.8%), Transportation & Warehousing (79.5%), and Educational Services (71.7%).
| Industry | Male | Female |
| Agriculture, Fishing & Hunting | 0 (0.0%) | 0 (0.0%) |
| Mining, Quarrying, & Extraction | 0 (0.0%) | 0 (0.0%) |
| Construction | 13 (100.0%) | 0 (0.0%) |
| Manufacturing | 53 (100.0%) | 0 (0.0%) |
| Wholesale Trade | 0 (0.0%) | 0 (0.0%) |
| Retail Trade | 0 (0.0%) | 0 (0.0%) |
| Transportation & Warehousing | 8 (20.5%) | 31 (79.5%) |
| Utilities | 0 (0.0%) | 0 (0.0%) |
| Information | 7 (100.0%) | 0 (0.0%) |
| Finance & Insurance | 0 (0.0%) | 0 (0.0%) |
| Real Estate, Rental & Leasing | 0 (0.0%) | 0 (0.0%) |
| Professional & Scientific | 0 (0.0%) | 0 (0.0%) |
| Enterprise Management | 0 (0.0%) | 0 (0.0%) |
| Administrative & Support | 0 (0.0%) | 0 (0.0%) |
| Educational Services | 51 (28.3%) | 129 (71.7%) |
| Health Care & Social Assistance | 9 (6.2%) | 136 (93.8%) |
| Arts, Entertainment & Recreation | 0 (0.0%) | 0 (0.0%) |
| Accommodation & Food Services | 0 (0.0%) | 0 (0.0%) |
| Public Administration | 0 (0.0%) | 0 (0.0%) |
| Total | 141 (31.5%) | 306 (68.5%) |
Education in La Union
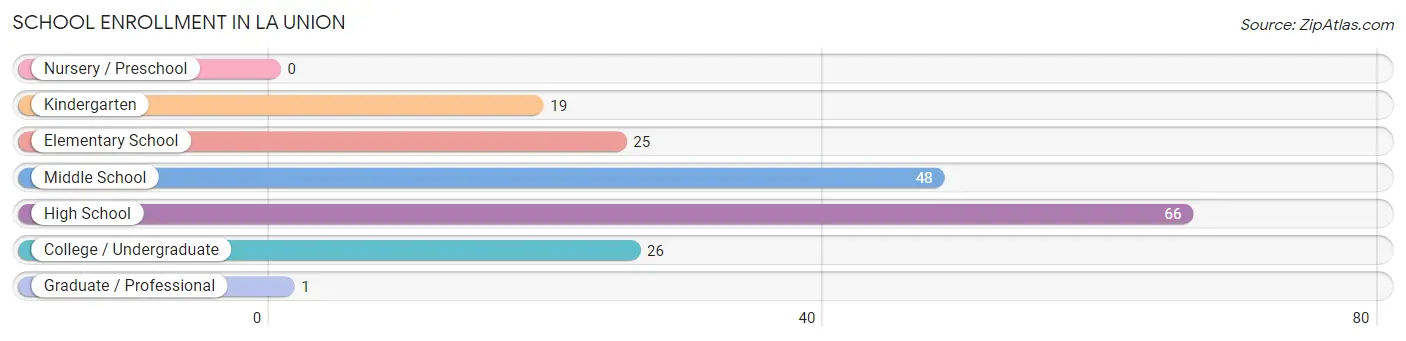
School Enrollment in La Union
The most common levels of schooling among the 185 students in La Union are high school (66 | 35.7%), middle school (48 | 26.0%), and college / undergraduate (26 | 14.1%).
| School Level | # Students | % Students |
| Nursery / Preschool | 0 | 0.0% |
| Kindergarten | 19 | 10.3% |
| Elementary School | 25 | 13.5% |
| Middle School | 48 | 26.0% |
| High School | 66 | 35.7% |
| College / Undergraduate | 26 | 14.1% |
| Graduate / Professional | 1 | 0.5% |
| Total | 185 | 100.0% |
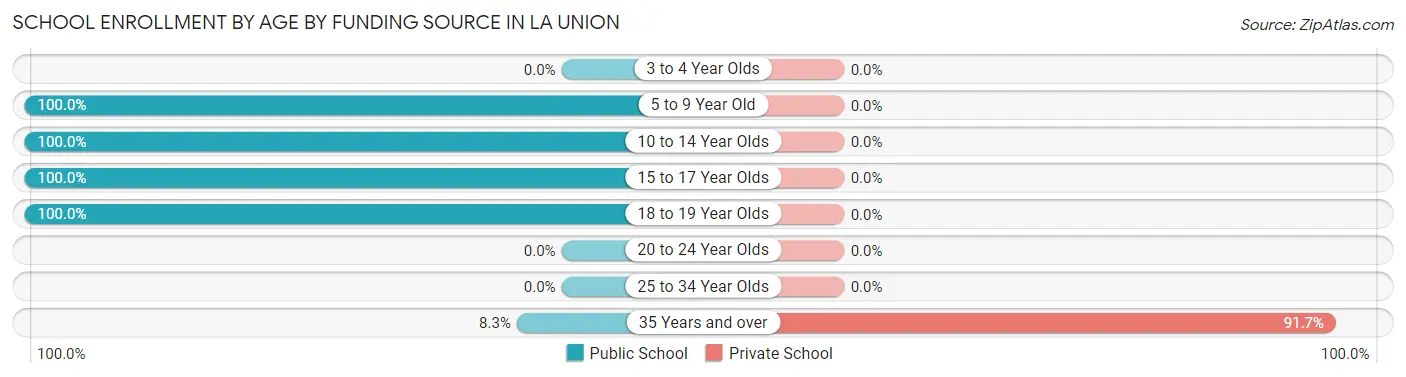
School Enrollment by Age by Funding Source in La Union
Out of a total of 185 students who are enrolled in schools in La Union, 11 (5.9%) attend a private institution, while the remaining 174 (94.1%) are enrolled in public schools. The age group of 35 years and over has the highest likelihood of being enrolled in private schools, with 11 (91.7% in the age bracket) enrolled. Conversely, the age group of 5 to 9 year old has the lowest likelihood of being enrolled in a private school, with 44 (100.0% in the age bracket) attending a public institution.
| Age Bracket | Public School | Private School |
| 3 to 4 Year Olds | 0 (0.0%) | 0 (0.0%) |
| 5 to 9 Year Old | 44 (100.0%) | 0 (0.0%) |
| 10 to 14 Year Olds | 60 (100.0%) | 0 (0.0%) |
| 15 to 17 Year Olds | 54 (100.0%) | 0 (0.0%) |
| 18 to 19 Year Olds | 15 (100.0%) | 0 (0.0%) |
| 20 to 24 Year Olds | 0 (0.0%) | 0 (0.0%) |
| 25 to 34 Year Olds | 0 (0.0%) | 0 (0.0%) |
| 35 Years and over | 1 (8.3%) | 11 (91.7%) |
| Total | 174 (94.1%) | 11 (5.9%) |
Educational Attainment by Field of Study in La Union
Education (130 | 68.1%), engineering (35 | 18.3%), science & technology (17 | 8.9%), psychology (8 | 4.2%), and business (1 | 0.5%) are the most common fields of study among 191 individuals in La Union who have obtained a bachelor's degree or higher.
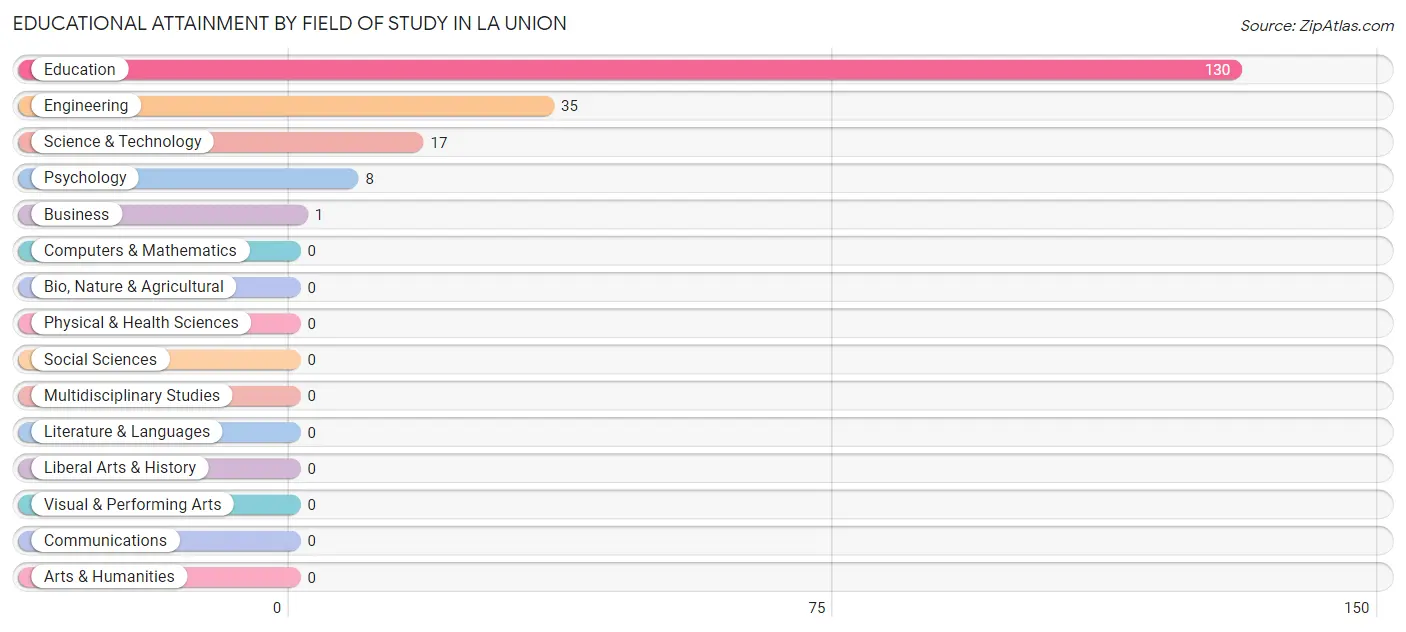
| Field of Study | # Graduates | % Graduates |
| Computers & Mathematics | 0 | 0.0% |
| Bio, Nature & Agricultural | 0 | 0.0% |
| Physical & Health Sciences | 0 | 0.0% |
| Psychology | 8 | 4.2% |
| Social Sciences | 0 | 0.0% |
| Engineering | 35 | 18.3% |
| Multidisciplinary Studies | 0 | 0.0% |
| Science & Technology | 17 | 8.9% |
| Business | 1 | 0.5% |
| Education | 130 | 68.1% |
| Literature & Languages | 0 | 0.0% |
| Liberal Arts & History | 0 | 0.0% |
| Visual & Performing Arts | 0 | 0.0% |
| Communications | 0 | 0.0% |
| Arts & Humanities | 0 | 0.0% |
| Total | 191 | 100.0% |
Transportation & Commute in La Union
Vehicle Availability by Sex in La Union
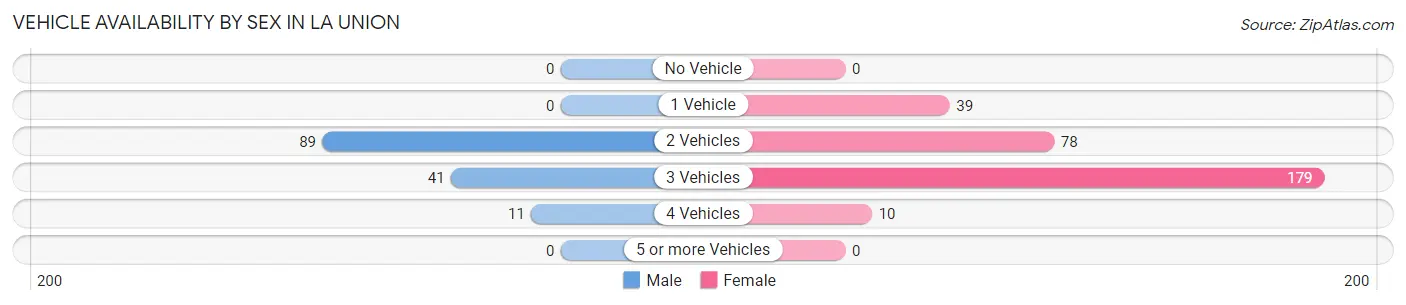
The most prevalent vehicle ownership categories in La Union are males with 2 vehicles (89, accounting for 63.1%) and females with 2 vehicles (78, making up 29.1%).
| Vehicles Available | Male | Female |
| No Vehicle | 0 (0.0%) | 0 (0.0%) |
| 1 Vehicle | 0 (0.0%) | 39 (12.8%) |
| 2 Vehicles | 89 (63.1%) | 78 (25.5%) |
| 3 Vehicles | 41 (29.1%) | 179 (58.5%) |
| 4 Vehicles | 11 (7.8%) | 10 (3.3%) |
| 5 or more Vehicles | 0 (0.0%) | 0 (0.0%) |
| Total | 141 (100.0%) | 306 (100.0%) |
Commute Time in La Union
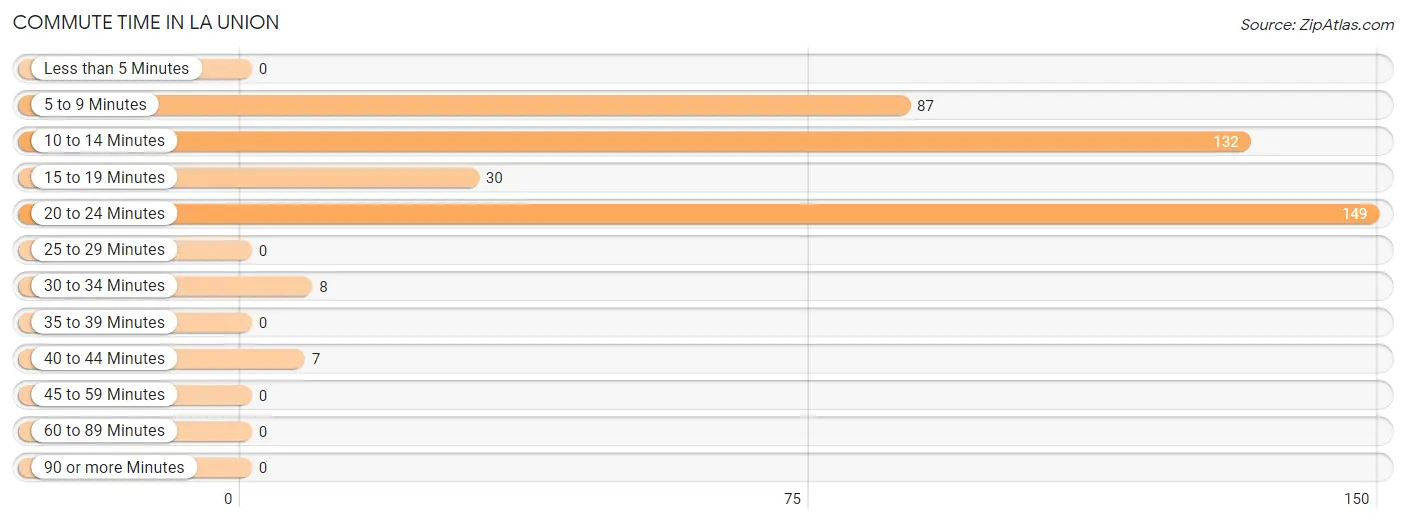
The most frequently occuring commute durations in La Union are 20 to 24 minutes (149 commuters, 36.1%), 10 to 14 minutes (132 commuters, 32.0%), and 5 to 9 minutes (87 commuters, 21.1%).
| Commute Time | # Commuters | % Commuters |
| Less than 5 Minutes | 0 | 0.0% |
| 5 to 9 Minutes | 87 | 21.1% |
| 10 to 14 Minutes | 132 | 32.0% |
| 15 to 19 Minutes | 30 | 7.3% |
| 20 to 24 Minutes | 149 | 36.1% |
| 25 to 29 Minutes | 0 | 0.0% |
| 30 to 34 Minutes | 8 | 1.9% |
| 35 to 39 Minutes | 0 | 0.0% |
| 40 to 44 Minutes | 7 | 1.7% |
| 45 to 59 Minutes | 0 | 0.0% |
| 60 to 89 Minutes | 0 | 0.0% |
| 90 or more Minutes | 0 | 0.0% |
Commute Time by Sex in La Union
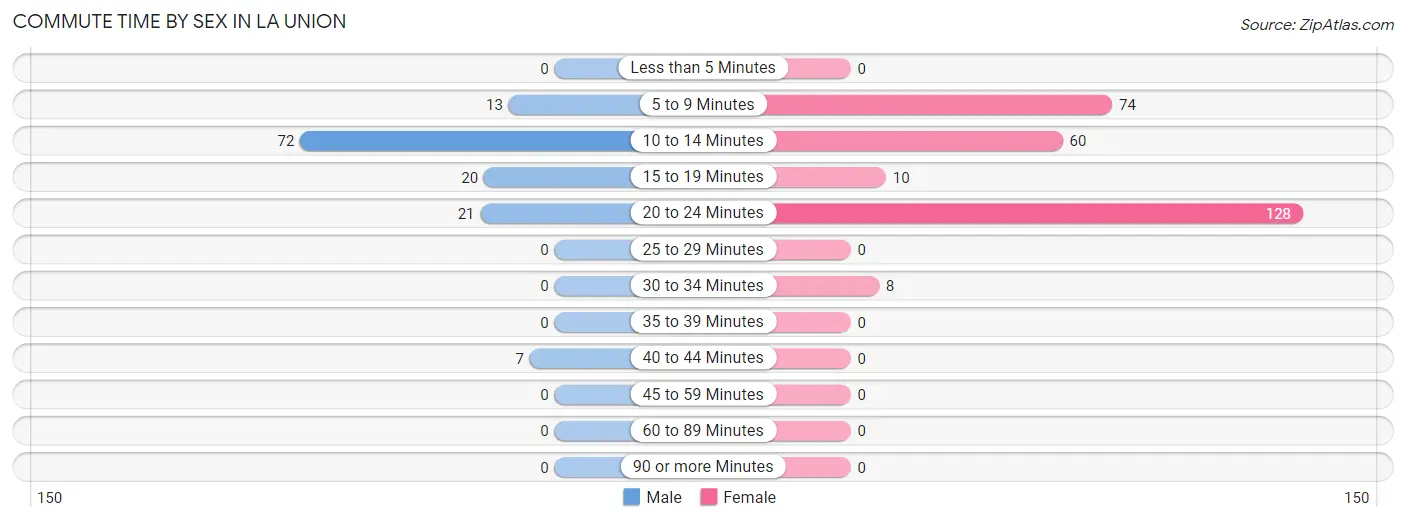
The most common commute times in La Union are 10 to 14 minutes (72 commuters, 54.1%) for males and 20 to 24 minutes (128 commuters, 45.7%) for females.
| Commute Time | Male | Female |
| Less than 5 Minutes | 0 (0.0%) | 0 (0.0%) |
| 5 to 9 Minutes | 13 (9.8%) | 74 (26.4%) |
| 10 to 14 Minutes | 72 (54.1%) | 60 (21.4%) |
| 15 to 19 Minutes | 20 (15.0%) | 10 (3.6%) |
| 20 to 24 Minutes | 21 (15.8%) | 128 (45.7%) |
| 25 to 29 Minutes | 0 (0.0%) | 0 (0.0%) |
| 30 to 34 Minutes | 0 (0.0%) | 8 (2.9%) |
| 35 to 39 Minutes | 0 (0.0%) | 0 (0.0%) |
| 40 to 44 Minutes | 7 (5.3%) | 0 (0.0%) |
| 45 to 59 Minutes | 0 (0.0%) | 0 (0.0%) |
| 60 to 89 Minutes | 0 (0.0%) | 0 (0.0%) |
| 90 or more Minutes | 0 (0.0%) | 0 (0.0%) |
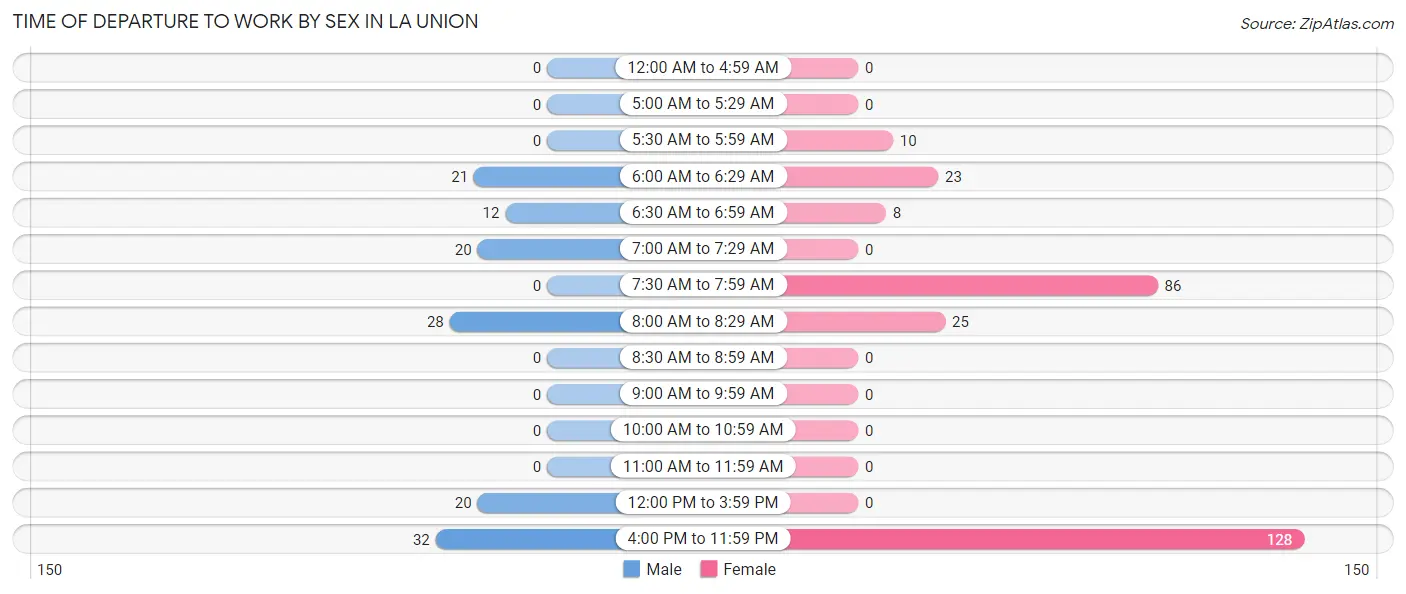
Time of Departure to Work by Sex in La Union
The most frequent times of departure to work in La Union are 4:00 PM to 11:59 PM (32, 24.1%) for males and 4:00 PM to 11:59 PM (128, 45.7%) for females.
| Time of Departure | Male | Female |
| 12:00 AM to 4:59 AM | 0 (0.0%) | 0 (0.0%) |
| 5:00 AM to 5:29 AM | 0 (0.0%) | 0 (0.0%) |
| 5:30 AM to 5:59 AM | 0 (0.0%) | 10 (3.6%) |
| 6:00 AM to 6:29 AM | 21 (15.8%) | 23 (8.2%) |
| 6:30 AM to 6:59 AM | 12 (9.0%) | 8 (2.9%) |
| 7:00 AM to 7:29 AM | 20 (15.0%) | 0 (0.0%) |
| 7:30 AM to 7:59 AM | 0 (0.0%) | 86 (30.7%) |
| 8:00 AM to 8:29 AM | 28 (21.0%) | 25 (8.9%) |
| 8:30 AM to 8:59 AM | 0 (0.0%) | 0 (0.0%) |
| 9:00 AM to 9:59 AM | 0 (0.0%) | 0 (0.0%) |
| 10:00 AM to 10:59 AM | 0 (0.0%) | 0 (0.0%) |
| 11:00 AM to 11:59 AM | 0 (0.0%) | 0 (0.0%) |
| 12:00 PM to 3:59 PM | 20 (15.0%) | 0 (0.0%) |
| 4:00 PM to 11:59 PM | 32 (24.1%) | 128 (45.7%) |
| Total | 133 (100.0%) | 280 (100.0%) |
Housing Occupancy in La Union
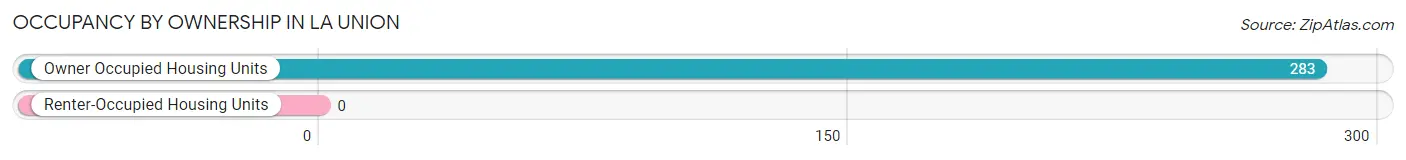
Occupancy by Ownership in La Union
Of the total 283 dwellings in La Union, owner-occupied units account for 283 (100.0%), while renter-occupied units make up 0 (0.0%).
| Occupancy | # Housing Units | % Housing Units |
| Owner Occupied Housing Units | 283 | 100.0% |
| Renter-Occupied Housing Units | 0 | 0.0% |
| Total Occupied Housing Units | 283 | 100.0% |
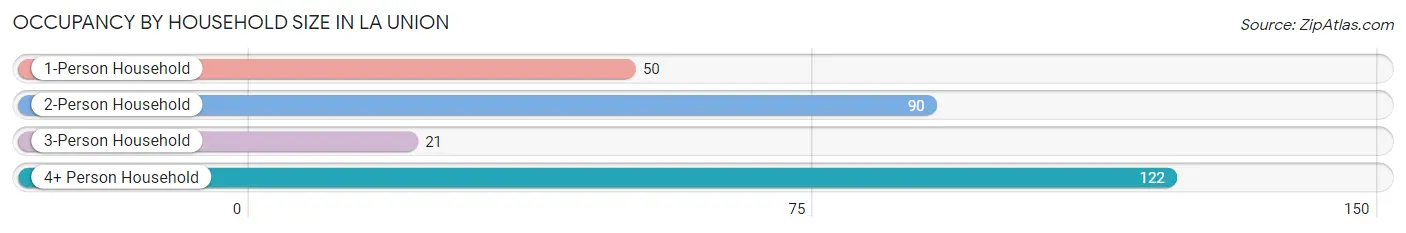
Occupancy by Household Size in La Union
| Household Size | # Housing Units | % Housing Units |
| 1-Person Household | 50 | 17.7% |
| 2-Person Household | 90 | 31.8% |
| 3-Person Household | 21 | 7.4% |
| 4+ Person Household | 122 | 43.1% |
| Total Housing Units | 283 | 100.0% |
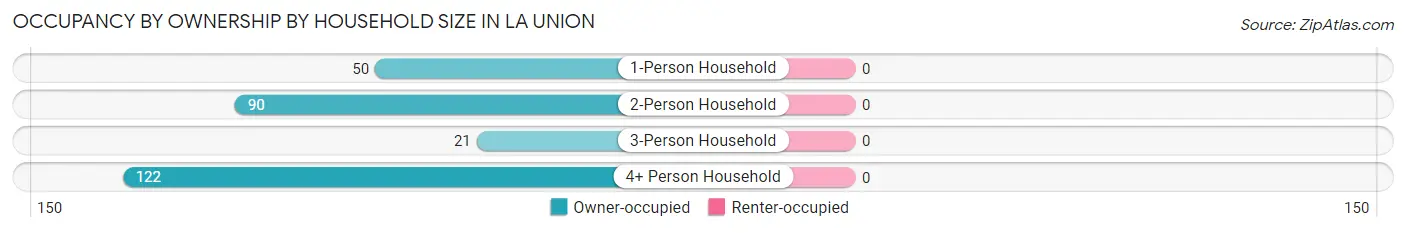
Occupancy by Ownership by Household Size in La Union
| Household Size | Owner-occupied | Renter-occupied |
| 1-Person Household | 50 (100.0%) | 0 (0.0%) |
| 2-Person Household | 90 (100.0%) | 0 (0.0%) |
| 3-Person Household | 21 (100.0%) | 0 (0.0%) |
| 4+ Person Household | 122 (100.0%) | 0 (0.0%) |
| Total Housing Units | 283 (100.0%) | 0 (0.0%) |
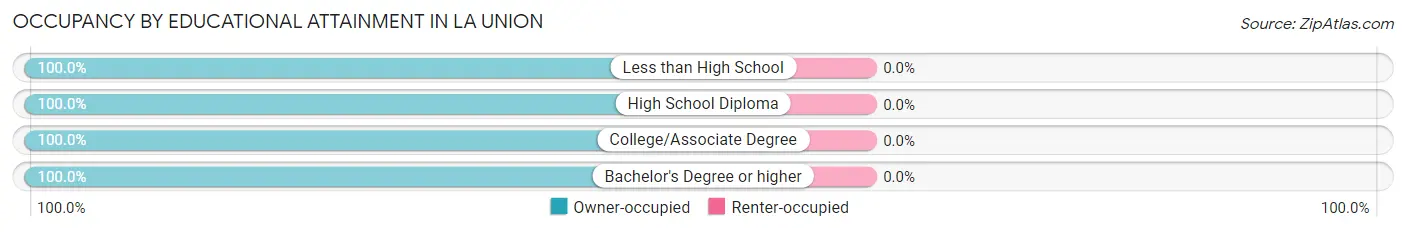
Occupancy by Educational Attainment in La Union
| Household Size | Owner-occupied | Renter-occupied |
| Less than High School | 32 (100.0%) | 0 (0.0%) |
| High School Diploma | 46 (100.0%) | 0 (0.0%) |
| College/Associate Degree | 50 (100.0%) | 0 (0.0%) |
| Bachelor's Degree or higher | 155 (100.0%) | 0 (0.0%) |
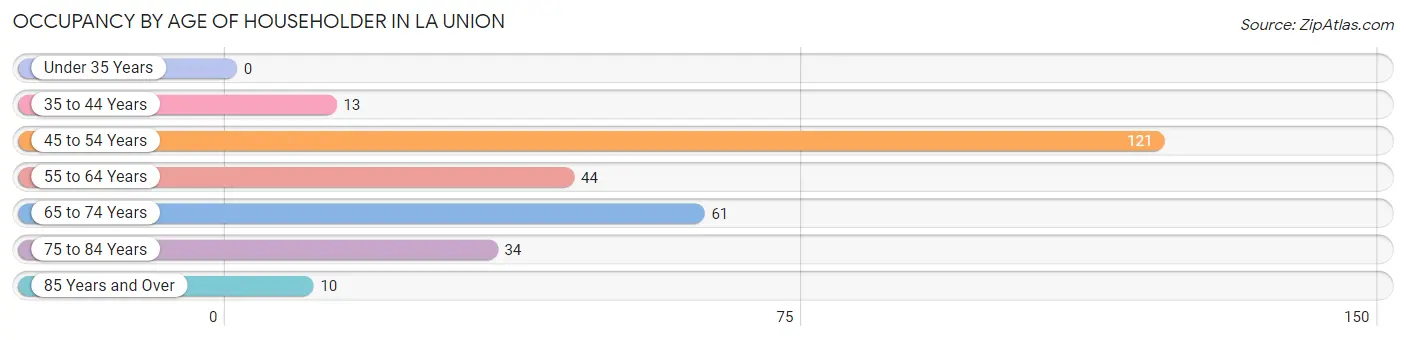
Occupancy by Age of Householder in La Union
| Age Bracket | # Households | % Households |
| Under 35 Years | 0 | 0.0% |
| 35 to 44 Years | 13 | 4.6% |
| 45 to 54 Years | 121 | 42.8% |
| 55 to 64 Years | 44 | 15.5% |
| 65 to 74 Years | 61 | 21.5% |
| 75 to 84 Years | 34 | 12.0% |
| 85 Years and Over | 10 | 3.5% |
| Total | 283 | 100.0% |
Housing Finances in La Union
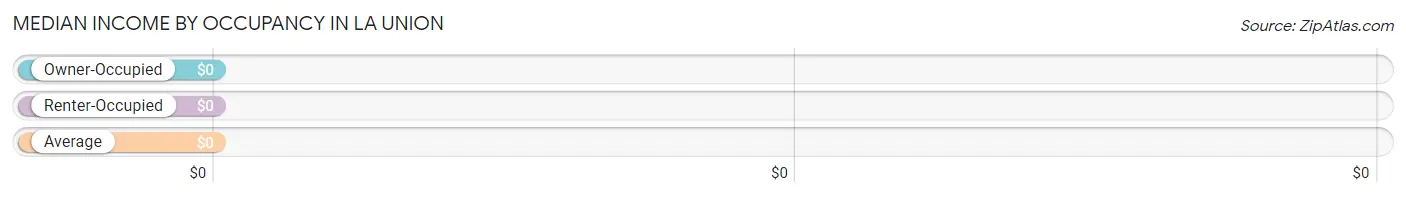
Median Income by Occupancy in La Union
| Occupancy Type | # Households | Median Income |
| Owner-Occupied | 283 (100.0%) | $0 |
| Renter-Occupied | 0 (0.0%) | $0 |
| Average | 283 (100.0%) | $0 |
Occupancy by Householder Income Bracket in La Union
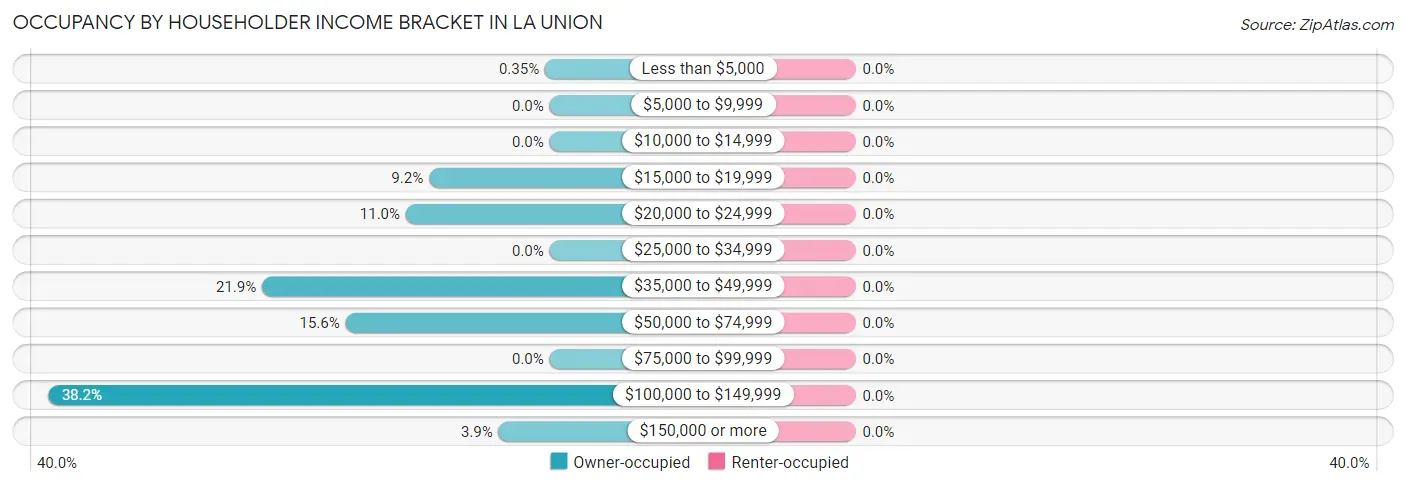
| Income Bracket | Owner-occupied | Renter-occupied |
| Less than $5,000 | 1 (0.4%) | 0 (0.0%) |
| $5,000 to $9,999 | 0 (0.0%) | 0 (0.0%) |
| $10,000 to $14,999 | 0 (0.0%) | 0 (0.0%) |
| $15,000 to $19,999 | 26 (9.2%) | 0 (0.0%) |
| $20,000 to $24,999 | 31 (11.0%) | 0 (0.0%) |
| $25,000 to $34,999 | 0 (0.0%) | 0 (0.0%) |
| $35,000 to $49,999 | 62 (21.9%) | 0 (0.0%) |
| $50,000 to $74,999 | 44 (15.5%) | 0 (0.0%) |
| $75,000 to $99,999 | 0 (0.0%) | 0 (0.0%) |
| $100,000 to $149,999 | 108 (38.2%) | 0 (0.0%) |
| $150,000 or more | 11 (3.9%) | 0 (0.0%) |
| Total | 283 (100.0%) | 0 (0.0%) |
Monthly Housing Cost Tiers in La Union
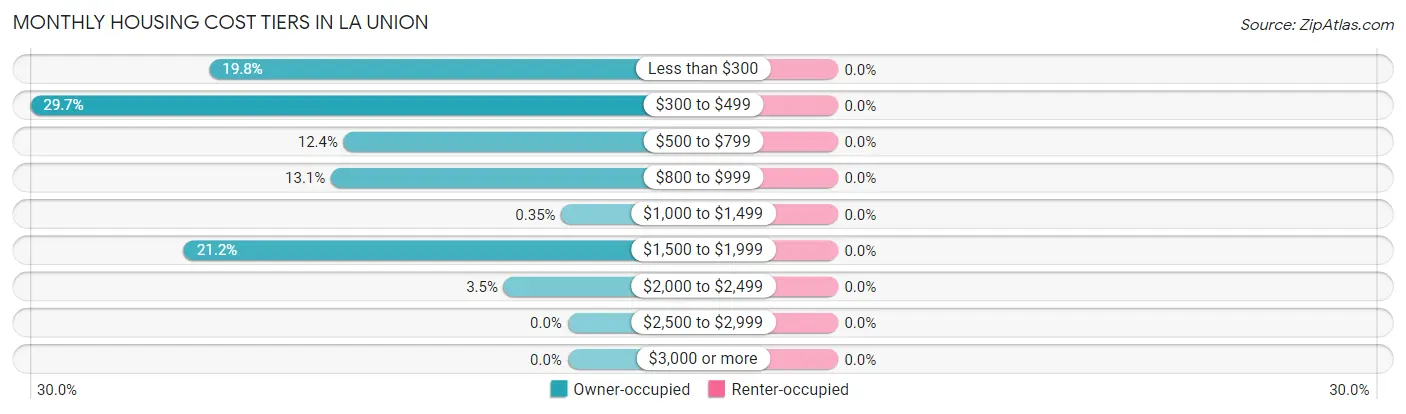
| Monthly Cost | Owner-occupied | Renter-occupied |
| Less than $300 | 56 (19.8%) | 0 (0.0%) |
| $300 to $499 | 84 (29.7%) | 0 (0.0%) |
| $500 to $799 | 35 (12.4%) | 0 (0.0%) |
| $800 to $999 | 37 (13.1%) | 0 (0.0%) |
| $1,000 to $1,499 | 1 (0.4%) | 0 (0.0%) |
| $1,500 to $1,999 | 60 (21.2%) | 0 (0.0%) |
| $2,000 to $2,499 | 10 (3.5%) | 0 (0.0%) |
| $2,500 to $2,999 | 0 (0.0%) | 0 (0.0%) |
| $3,000 or more | 0 (0.0%) | 0 (0.0%) |
| Total | 283 (100.0%) | 0 (0.0%) |
Physical Housing Characteristics in La Union
Housing Structures in La Union
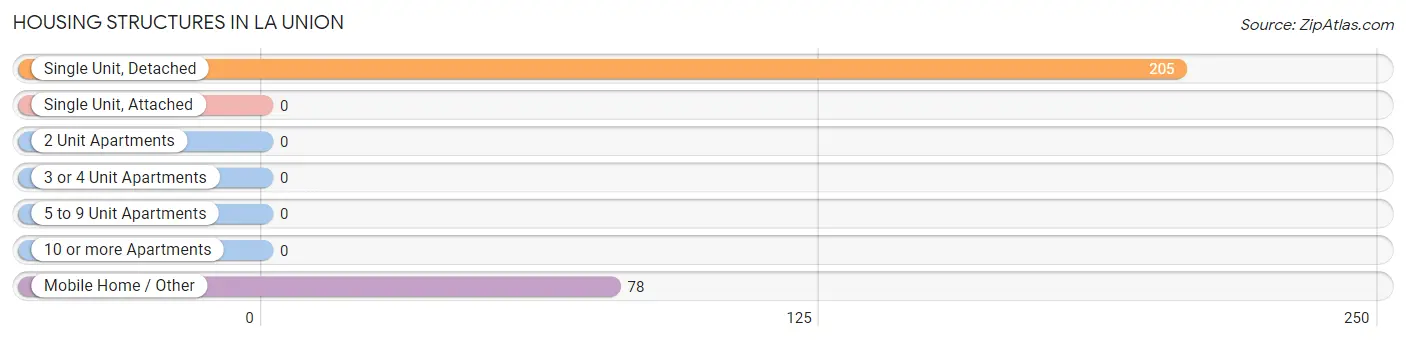
| Structure Type | # Housing Units | % Housing Units |
| Single Unit, Detached | 205 | 72.4% |
| Single Unit, Attached | 0 | 0.0% |
| 2 Unit Apartments | 0 | 0.0% |
| 3 or 4 Unit Apartments | 0 | 0.0% |
| 5 to 9 Unit Apartments | 0 | 0.0% |
| 10 or more Apartments | 0 | 0.0% |
| Mobile Home / Other | 78 | 27.6% |
| Total | 283 | 100.0% |
Housing Structures by Occupancy in La Union
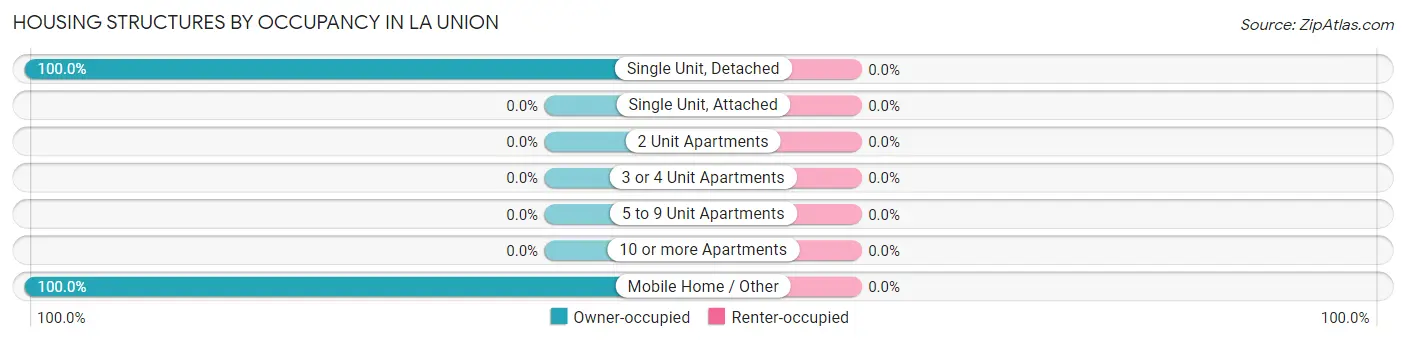
| Structure Type | Owner-occupied | Renter-occupied |
| Single Unit, Detached | 205 (100.0%) | 0 (0.0%) |
| Single Unit, Attached | 0 (0.0%) | 0 (0.0%) |
| 2 Unit Apartments | 0 (0.0%) | 0 (0.0%) |
| 3 or 4 Unit Apartments | 0 (0.0%) | 0 (0.0%) |
| 5 to 9 Unit Apartments | 0 (0.0%) | 0 (0.0%) |
| 10 or more Apartments | 0 (0.0%) | 0 (0.0%) |
| Mobile Home / Other | 78 (100.0%) | 0 (0.0%) |
| Total | 283 (100.0%) | 0 (0.0%) |
Housing Structures by Number of Rooms in La Union
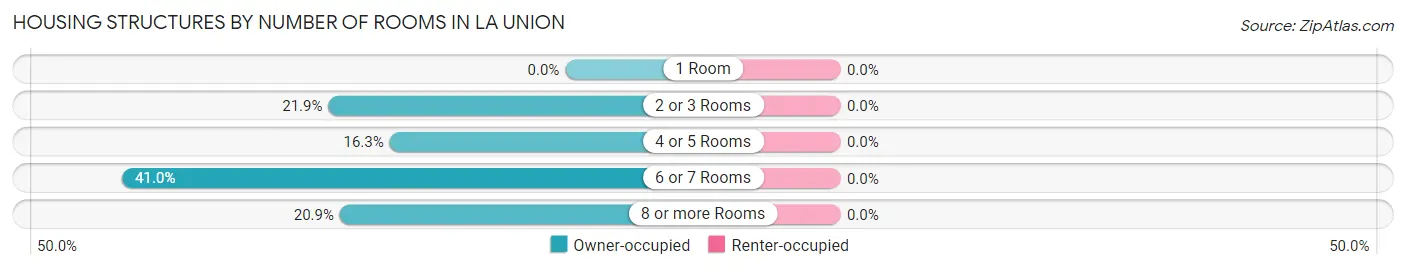
| Number of Rooms | Owner-occupied | Renter-occupied |
| 1 Room | 0 (0.0%) | 0 (0.0%) |
| 2 or 3 Rooms | 62 (21.9%) | 0 (0.0%) |
| 4 or 5 Rooms | 46 (16.3%) | 0 (0.0%) |
| 6 or 7 Rooms | 116 (41.0%) | 0 (0.0%) |
| 8 or more Rooms | 59 (20.8%) | 0 (0.0%) |
| Total | 283 (100.0%) | 0 (0.0%) |
Housing Structure by Heating Type in La Union
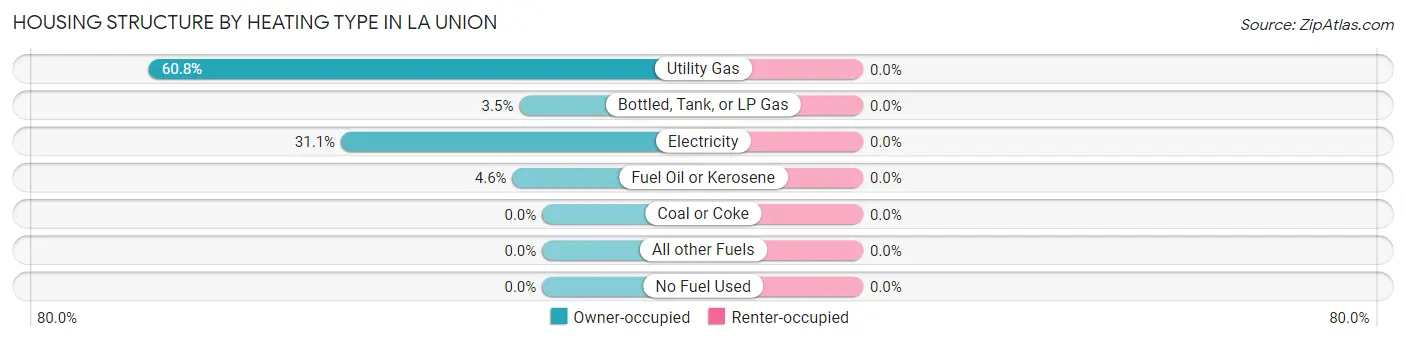
| Heating Type | Owner-occupied | Renter-occupied |
| Utility Gas | 172 (60.8%) | 0 (0.0%) |
| Bottled, Tank, or LP Gas | 10 (3.5%) | 0 (0.0%) |
| Electricity | 88 (31.1%) | 0 (0.0%) |
| Fuel Oil or Kerosene | 13 (4.6%) | 0 (0.0%) |
| Coal or Coke | 0 (0.0%) | 0 (0.0%) |
| All other Fuels | 0 (0.0%) | 0 (0.0%) |
| No Fuel Used | 0 (0.0%) | 0 (0.0%) |
| Total | 283 (100.0%) | 0 (0.0%) |
Household Vehicle Usage in La Union
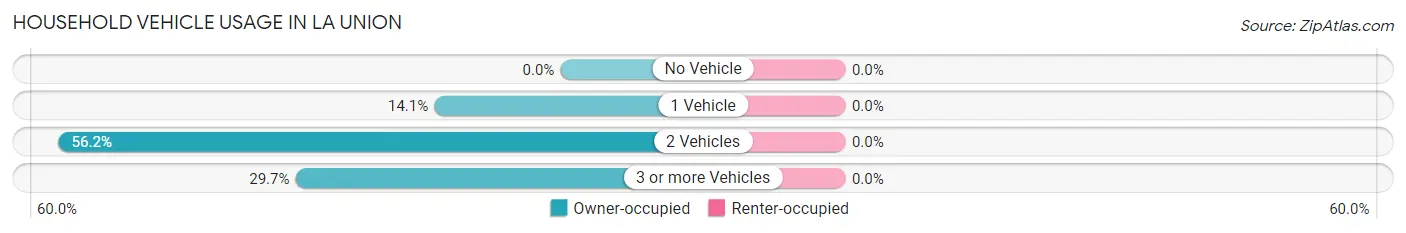
| Vehicles per Household | Owner-occupied | Renter-occupied |
| No Vehicle | 0 (0.0%) | 0 (0.0%) |
| 1 Vehicle | 40 (14.1%) | 0 (0.0%) |
| 2 Vehicles | 159 (56.2%) | 0 (0.0%) |
| 3 or more Vehicles | 84 (29.7%) | 0 (0.0%) |
| Total | 283 (100.0%) | 0 (0.0%) |
Real Estate & Mortgages in La Union
Real Estate and Mortgage Overview in La Union
| Characteristic | Without Mortgage | With Mortgage |
| Housing Units | 183 | 100 |
| Median Property Value | $66,700 | $321,600 |
| Median Household Income | $46,840 | $0 |
| Monthly Housing Costs | $367 | $0 |
| Real Estate Taxes | - | - |
Property Value by Mortgage Status in La Union
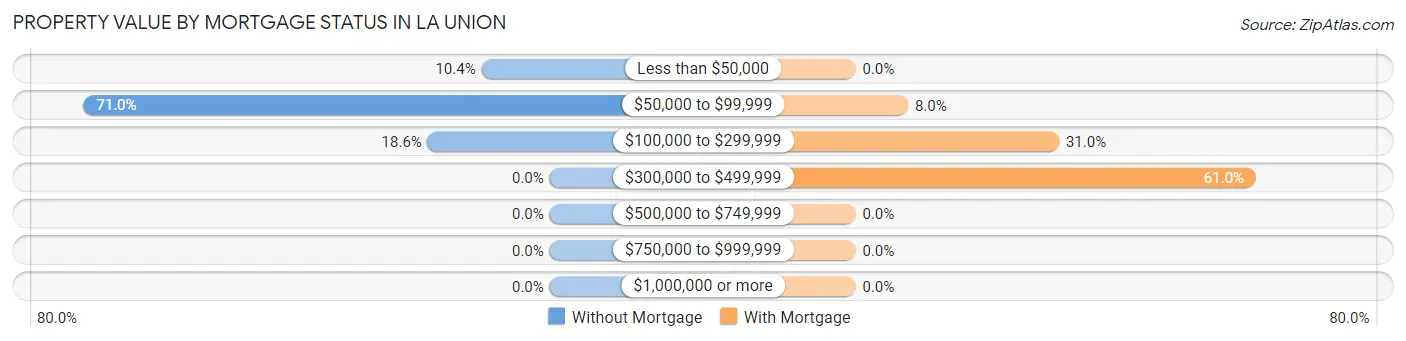
| Property Value | Without Mortgage | With Mortgage |
| Less than $50,000 | 19 (10.4%) | 0 (0.0%) |
| $50,000 to $99,999 | 130 (71.0%) | 8 (8.0%) |
| $100,000 to $299,999 | 34 (18.6%) | 31 (31.0%) |
| $300,000 to $499,999 | 0 (0.0%) | 61 (61.0%) |
| $500,000 to $749,999 | 0 (0.0%) | 0 (0.0%) |
| $750,000 to $999,999 | 0 (0.0%) | 0 (0.0%) |
| $1,000,000 or more | 0 (0.0%) | 0 (0.0%) |
| Total | 183 (100.0%) | 100 (100.0%) |
Household Income by Mortgage Status in La Union

| Household Income | Without Mortgage | With Mortgage |
| Less than $10,000 | 0 (0.0%) | 0 (0.0%) |
| $10,000 to $24,999 | 57 (31.1%) | 1 (1.0%) |
| $25,000 to $34,999 | 0 (0.0%) | 0 (0.0%) |
| $35,000 to $49,999 | 44 (24.0%) | 0 (0.0%) |
| $50,000 to $74,999 | 23 (12.6%) | 18 (18.0%) |
| $75,000 to $99,999 | 0 (0.0%) | 21 (21.0%) |
| $100,000 to $149,999 | 48 (26.2%) | 0 (0.0%) |
| $150,000 or more | 11 (6.0%) | 60 (60.0%) |
| Total | 183 (100.0%) | 100 (100.0%) |
Property Value to Household Income Ratio in La Union

| Value-to-Income Ratio | Without Mortgage | With Mortgage |
| Less than 2.0x | 78 (42.6%) | 0 (0.0%) |
| 2.0x to 2.9x | 48 (26.2%) | 9 (9.0%) |
| 3.0x to 3.9x | 57 (31.1%) | 59 (59.0%) |
| 4.0x or more | 0 (0.0%) | 0 (0.0%) |
| Total | 183 (100.0%) | 100 (100.0%) |
Real Estate Taxes by Mortgage Status in La Union
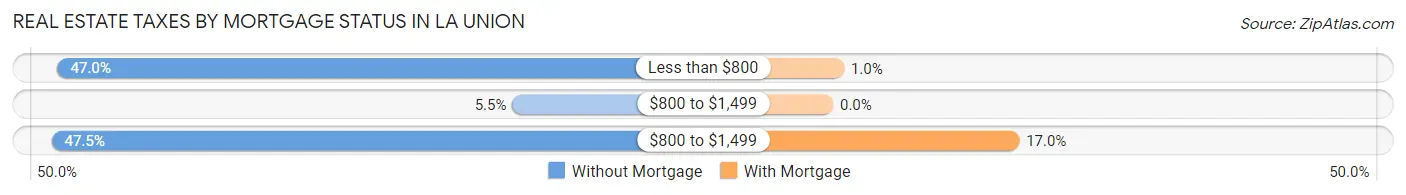
| Property Taxes | Without Mortgage | With Mortgage |
| Less than $800 | 86 (47.0%) | 1 (1.0%) |
| $800 to $1,499 | 10 (5.5%) | 0 (0.0%) |
| $800 to $1,499 | 87 (47.5%) | 17 (17.0%) |
| Total | 183 (100.0%) | 100 (100.0%) |
Health & Disability in La Union
Health Insurance Coverage by Age in La Union
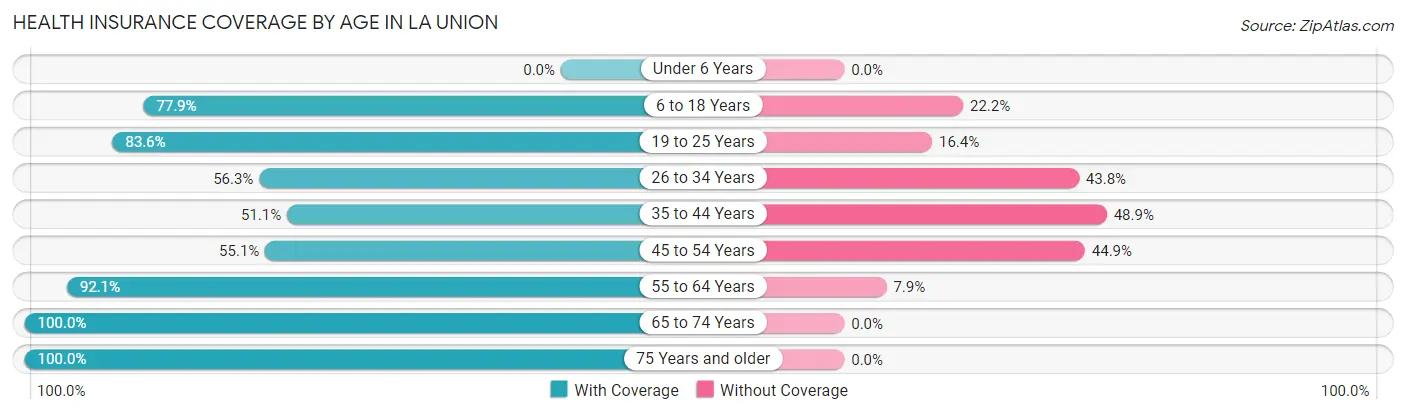
| Age Bracket | With Coverage | Without Coverage |
| Under 6 Years | 0 (0.0%) | 0 (0.0%) |
| 6 to 18 Years | 123 (77.8%) | 35 (22.2%) |
| 19 to 25 Years | 143 (83.6%) | 28 (16.4%) |
| 26 to 34 Years | 9 (56.2%) | 7 (43.8%) |
| 35 to 44 Years | 24 (51.1%) | 23 (48.9%) |
| 45 to 54 Years | 118 (55.1%) | 96 (44.9%) |
| 55 to 64 Years | 117 (92.1%) | 10 (7.9%) |
| 65 to 74 Years | 71 (100.0%) | 0 (0.0%) |
| 75 Years and older | 65 (100.0%) | 0 (0.0%) |
| Total | 670 (77.1%) | 199 (22.9%) |
Health Insurance Coverage by Citizenship Status in La Union
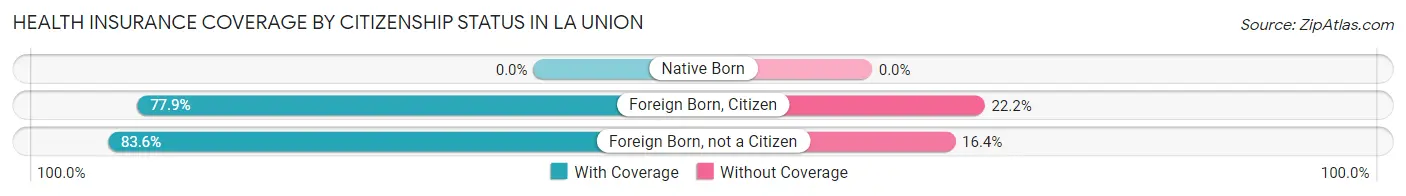
| Citizenship Status | With Coverage | Without Coverage |
| Native Born | 0 (0.0%) | 0 (0.0%) |
| Foreign Born, Citizen | 123 (77.8%) | 35 (22.2%) |
| Foreign Born, not a Citizen | 143 (83.6%) | 28 (16.4%) |
Health Insurance Coverage by Household Income in La Union
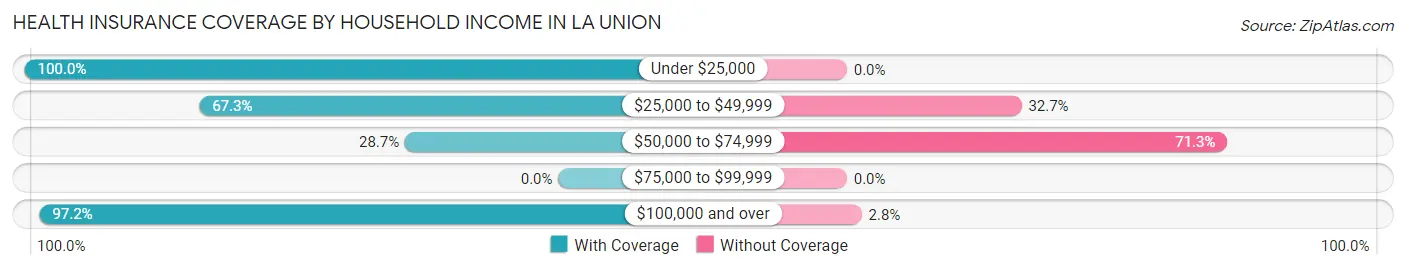
| Household Income | With Coverage | Without Coverage |
| Under $25,000 | 88 (100.0%) | 0 (0.0%) |
| $25,000 to $49,999 | 109 (67.3%) | 53 (32.7%) |
| $50,000 to $74,999 | 54 (28.7%) | 134 (71.3%) |
| $75,000 to $99,999 | 0 (0.0%) | 0 (0.0%) |
| $100,000 and over | 419 (97.2%) | 12 (2.8%) |
Public vs Private Health Insurance Coverage by Age in La Union
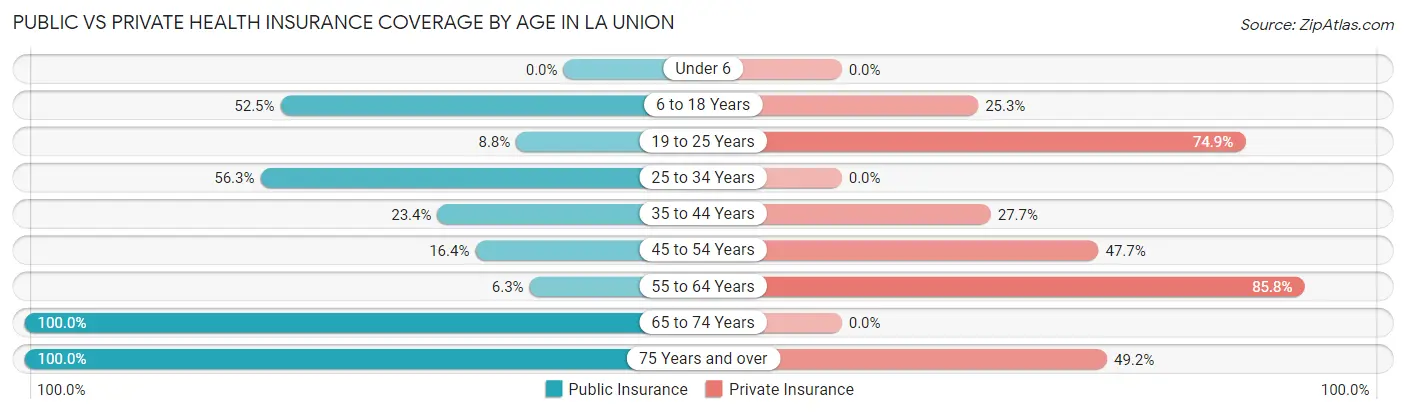
| Age Bracket | Public Insurance | Private Insurance |
| Under 6 | 0 (0.0%) | 0 (0.0%) |
| 6 to 18 Years | 83 (52.5%) | 40 (25.3%) |
| 19 to 25 Years | 15 (8.8%) | 128 (74.9%) |
| 25 to 34 Years | 9 (56.2%) | 0 (0.0%) |
| 35 to 44 Years | 11 (23.4%) | 13 (27.7%) |
| 45 to 54 Years | 35 (16.4%) | 102 (47.7%) |
| 55 to 64 Years | 8 (6.3%) | 109 (85.8%) |
| 65 to 74 Years | 71 (100.0%) | 0 (0.0%) |
| 75 Years and over | 65 (100.0%) | 32 (49.2%) |
| Total | 297 (34.2%) | 424 (48.8%) |
Disability Status by Sex by Age in La Union
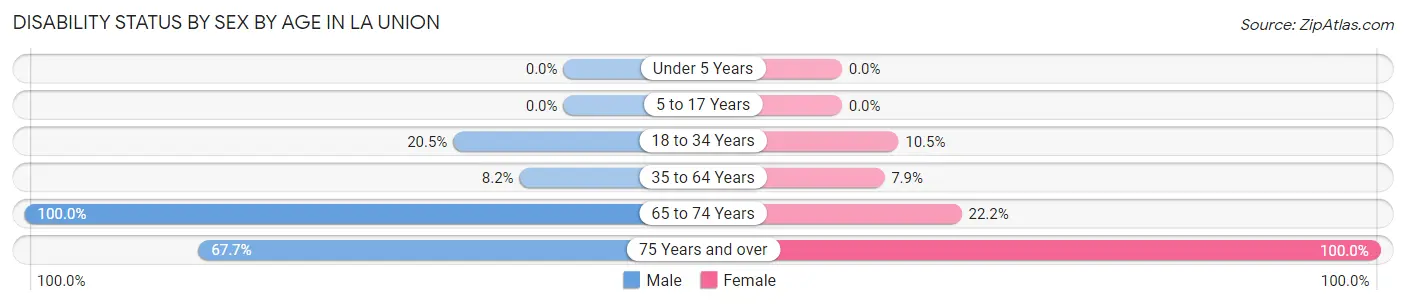
| Age Bracket | Male | Female |
| Under 5 Years | 0 (0.0%) | 0 (0.0%) |
| 5 to 17 Years | 0 (0.0%) | 0 (0.0%) |
| 18 to 34 Years | 9 (20.4%) | 15 (10.5%) |
| 35 to 64 Years | 12 (8.2%) | 19 (7.9%) |
| 65 to 74 Years | 26 (100.0%) | 10 (22.2%) |
| 75 Years and over | 21 (67.7%) | 34 (100.0%) |
Disability Class by Sex by Age in La Union
Disability Class: Hearing Difficulty
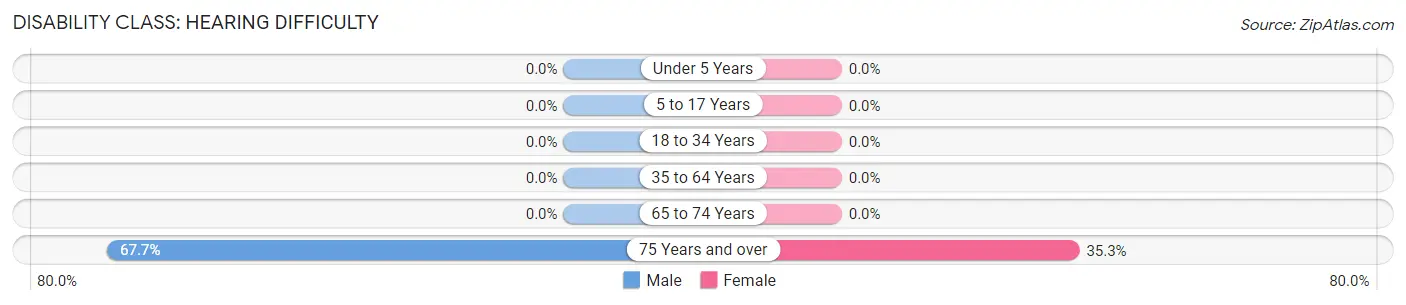
| Age Bracket | Male | Female |
| Under 5 Years | 0 (0.0%) | 0 (0.0%) |
| 5 to 17 Years | 0 (0.0%) | 0 (0.0%) |
| 18 to 34 Years | 0 (0.0%) | 0 (0.0%) |
| 35 to 64 Years | 0 (0.0%) | 0 (0.0%) |
| 65 to 74 Years | 0 (0.0%) | 0 (0.0%) |
| 75 Years and over | 21 (67.7%) | 12 (35.3%) |
Disability Class: Vision Difficulty
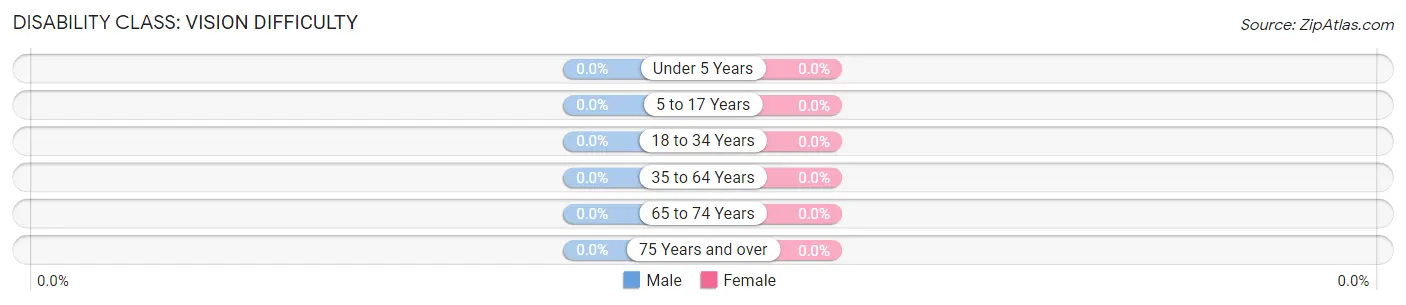
| Age Bracket | Male | Female |
| Under 5 Years | 0 (0.0%) | 0 (0.0%) |
| 5 to 17 Years | 0 (0.0%) | 0 (0.0%) |
| 18 to 34 Years | 0 (0.0%) | 0 (0.0%) |
| 35 to 64 Years | 0 (0.0%) | 0 (0.0%) |
| 65 to 74 Years | 0 (0.0%) | 0 (0.0%) |
| 75 Years and over | 0 (0.0%) | 0 (0.0%) |
Disability Class: Cognitive Difficulty
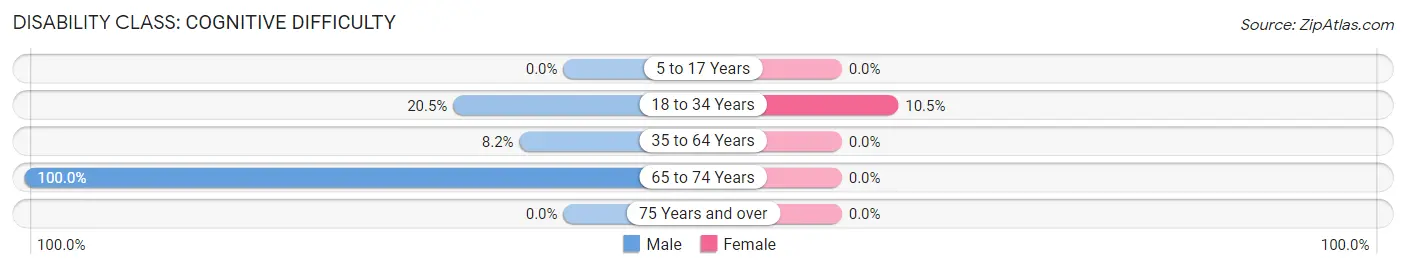
| Age Bracket | Male | Female |
| 5 to 17 Years | 0 (0.0%) | 0 (0.0%) |
| 18 to 34 Years | 9 (20.4%) | 15 (10.5%) |
| 35 to 64 Years | 12 (8.2%) | 0 (0.0%) |
| 65 to 74 Years | 26 (100.0%) | 0 (0.0%) |
| 75 Years and over | 0 (0.0%) | 0 (0.0%) |
Disability Class: Ambulatory Difficulty
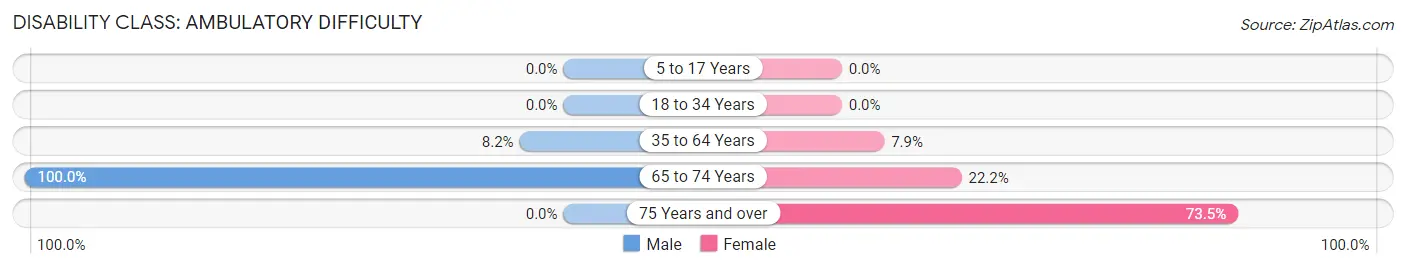
| Age Bracket | Male | Female |
| 5 to 17 Years | 0 (0.0%) | 0 (0.0%) |
| 18 to 34 Years | 0 (0.0%) | 0 (0.0%) |
| 35 to 64 Years | 12 (8.2%) | 19 (7.9%) |
| 65 to 74 Years | 26 (100.0%) | 10 (22.2%) |
| 75 Years and over | 0 (0.0%) | 25 (73.5%) |
Disability Class: Self-Care Difficulty
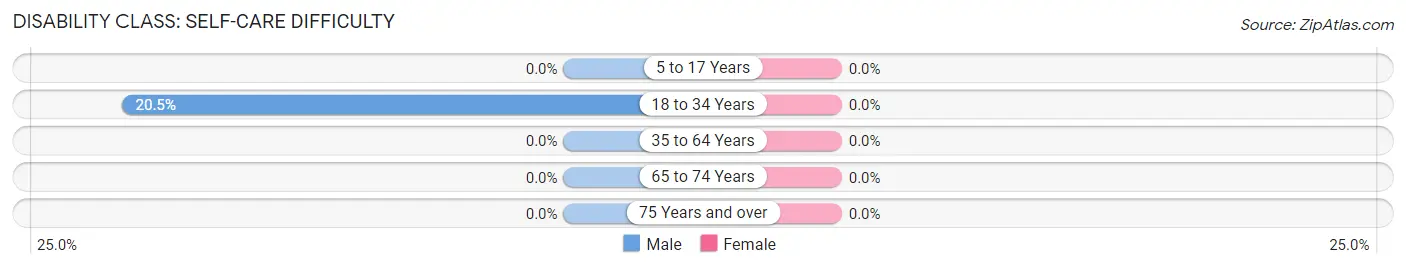
| Age Bracket | Male | Female |
| 5 to 17 Years | 0 (0.0%) | 0 (0.0%) |
| 18 to 34 Years | 9 (20.4%) | 0 (0.0%) |
| 35 to 64 Years | 0 (0.0%) | 0 (0.0%) |
| 65 to 74 Years | 0 (0.0%) | 0 (0.0%) |
| 75 Years and over | 0 (0.0%) | 0 (0.0%) |
Technology Access in La Union
Computing Device Access in La Union
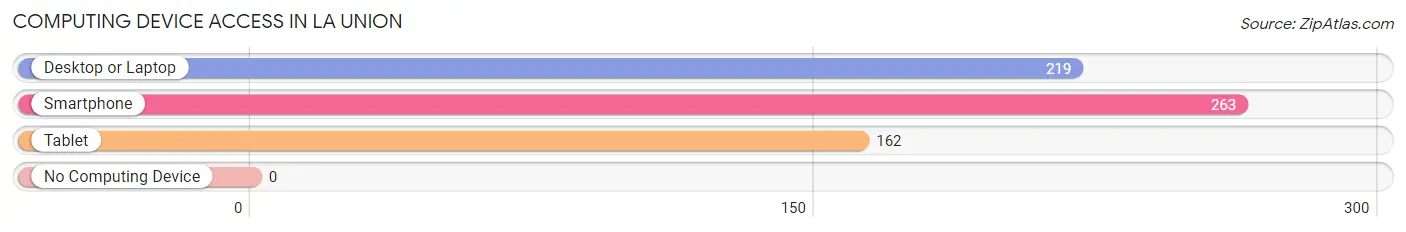
| Device Type | # Households | % Households |
| Desktop or Laptop | 219 | 77.4% |
| Smartphone | 263 | 92.9% |
| Tablet | 162 | 57.2% |
| No Computing Device | 0 | 0.0% |
| Total | 283 | 100.0% |
Internet Access in La Union
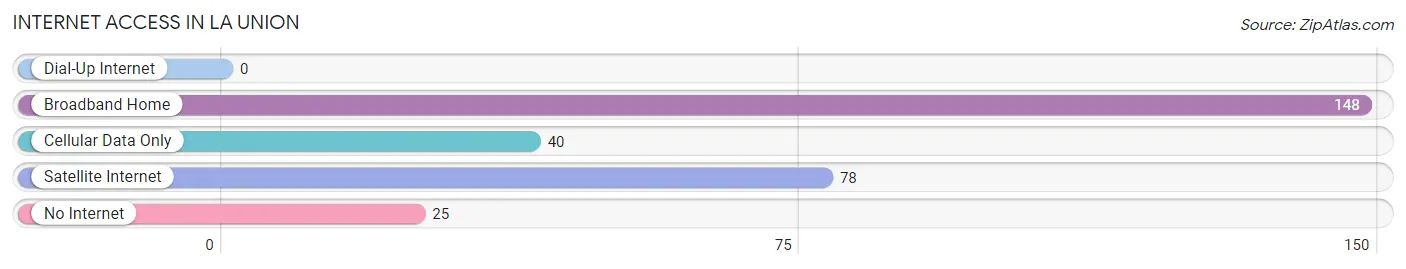
| Internet Type | # Households | % Households |
| Dial-Up Internet | 0 | 0.0% |
| Broadband Home | 148 | 52.3% |
| Cellular Data Only | 40 | 14.1% |
| Satellite Internet | 78 | 27.6% |
| No Internet | 25 | 8.8% |
| Total | 283 | 100.0% |
La Union Summary
La Union, New Mexico is a small village located in Doña Ana County, in the southern part of the state. It is situated on the Rio Grande, just south of the city of El Paso, Texas. The village is home to a population of approximately 1,500 people, and is part of the Las Cruces Metropolitan Statistical Area.
History
La Union was founded in 1854 by a group of settlers from El Paso, Texas. The settlers were looking for a place to settle and farm, and chose the area due to its fertile soil and access to the Rio Grande. The village was originally called La Union de los Rios, which translates to “The Union of the Rivers”, in reference to the Rio Grande and the Rio Conchos, which both flow through the area.
The village was officially incorporated in 1881, and the first mayor was elected in 1882. The village was a popular stop for travelers on the Butterfield Overland Mail route, which ran from St. Louis, Missouri to San Francisco, California.
Geography
La Union is located in the southern part of Doña Ana County, in the Chihuahuan Desert. The village is situated on the Rio Grande, just south of the city of El Paso, Texas. The village is located at an elevation of 3,945 feet, and has an area of 1.2 square miles.
The climate in La Union is arid and semi-arid, with hot summers and mild winters. The average annual temperature is 64°F, and the average annual precipitation is 8.5 inches.
Economy
The economy of La Union is largely based on agriculture. The village is home to several farms, which produce a variety of crops, including alfalfa, cotton, and chile peppers. The village also has a small manufacturing sector, which produces furniture, clothing, and other goods.
The village is also home to several small businesses, including restaurants, grocery stores, and other retail establishments. The village is also home to a small tourism industry, which attracts visitors from nearby El Paso, Texas.
Demographics
As of the 2010 census, the population of La Union was 1,521. The racial makeup of the village was 94.3% Hispanic or Latino, 4.2% White, 0.2% African American, 0.2% Native American, 0.2% Asian, and 0.9% from other races.
The median household income in La Union was $25,938, and the median family income was $30,938. The per capita income was $13,938. Approximately 24.3% of the population was below the poverty line.
La Union is served by the Las Cruces Public Schools system. The village is home to one elementary school, La Union Elementary School, which serves students in grades K-5. The village is also home to a branch of the Doña Ana Community College.
Common Questions
What is Per Capita Income in La Union?
Per Capita income in La Union is $28,069.
What is the Median Family Income in La Union?
Median Family Income in La Union is $103,194.
What is Income or Wage Gap in La Union?
Income or Wage Gap in La Union is 2.1%.
Women in La Union earn 97.9 cents for every dollar earned by a man.
What is Inequality or Gini Index in La Union?
Inequality or Gini Index in La Union is 0.37.
What is the Total Population of La Union?
Total Population of La Union is 869.
What is the Total Male Population of La Union?
Total Male Population of La Union is 322.
What is the Total Female Population of La Union?
Total Female Population of La Union is 547.
What is the Ratio of Males per 100 Females in La Union?
There are 58.87 Males per 100 Females in La Union.
What is the Ratio of Females per 100 Males in La Union?
There are 169.88 Females per 100 Males in La Union.
What is the Median Population Age in La Union?
Median Population Age in La Union is 49.3 Years.
What is the Average Family Size in La Union
Average Family Size in La Union is 3.5 People.
What is the Average Household Size in La Union
Average Household Size in La Union is 3.1 People.
How Large is the Labor Force in La Union?
There are 475 People in the Labor Forcein in La Union.
What is the Percentage of People in the Labor Force in La Union?
66.0% of People are in the Labor Force in La Union.
What is the Unemployment Rate in La Union?
Unemployment Rate in La Union is 5.9%.