Lordsburg, NM Map & Demographics
Lordsburg Map
Lordsburg Overview
$21,713
PER CAPITA INCOME
$57,639
AVG FAMILY INCOME
$37,240
AVG HOUSEHOLD INCOME
19.9%
WAGE / INCOME GAP [ % ]
80.1¢/ $1
WAGE / INCOME GAP [ $ ]
0.42
INEQUALITY / GINI INDEX
2,114
TOTAL POPULATION
1,081
MALE POPULATION
1,033
FEMALE POPULATION
104.65
MALES / 100 FEMALES
95.56
FEMALES / 100 MALES
37.5
MEDIAN AGE
3.6
AVG FAMILY SIZE
2.5
AVG HOUSEHOLD SIZE
735
LABOR FORCE [ PEOPLE ]
44.6%
PERCENT IN LABOR FORCE
5.2%
UNEMPLOYMENT RATE
Lordsburg Zip Codes
Income in Lordsburg
Income Overview in Lordsburg
Per Capita Income in Lordsburg is $21,713, while median incomes of families and households are $57,639 and $37,240 respectively.
| Characteristic | Number | Measure |
| Per Capita Income | 2,114 | $21,713 |
| Median Family Income | 420 | $57,639 |
| Mean Family Income | 420 | $63,036 |
| Median Household Income | 825 | $37,240 |
| Mean Household Income | 825 | $48,708 |
| Income Deficit | 420 | $0 |
| Wage / Income Gap (%) | 2,114 | 19.89% |
| Wage / Income Gap ($) | 2,114 | 80.11¢ per $1 |
| Gini / Inequality Index | 2,114 | 0.42 |
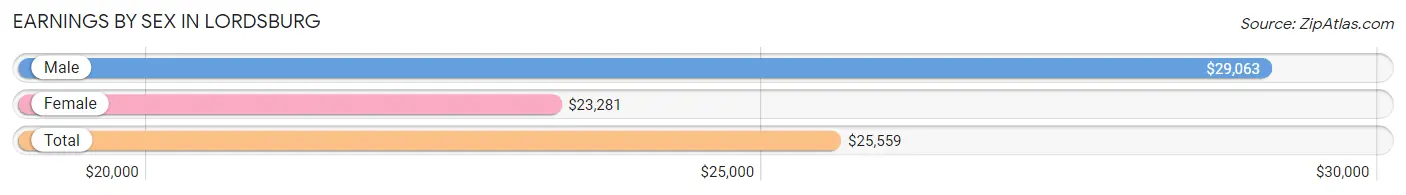
Earnings by Sex in Lordsburg
Average Earnings in Lordsburg are $25,559, $29,063 for men and $23,281 for women, a difference of 19.9%.
| Sex | Number | Average Earnings |
| Male | 444 (55.3%) | $29,063 |
| Female | 359 (44.7%) | $23,281 |
| Total | 803 (100.0%) | $25,559 |
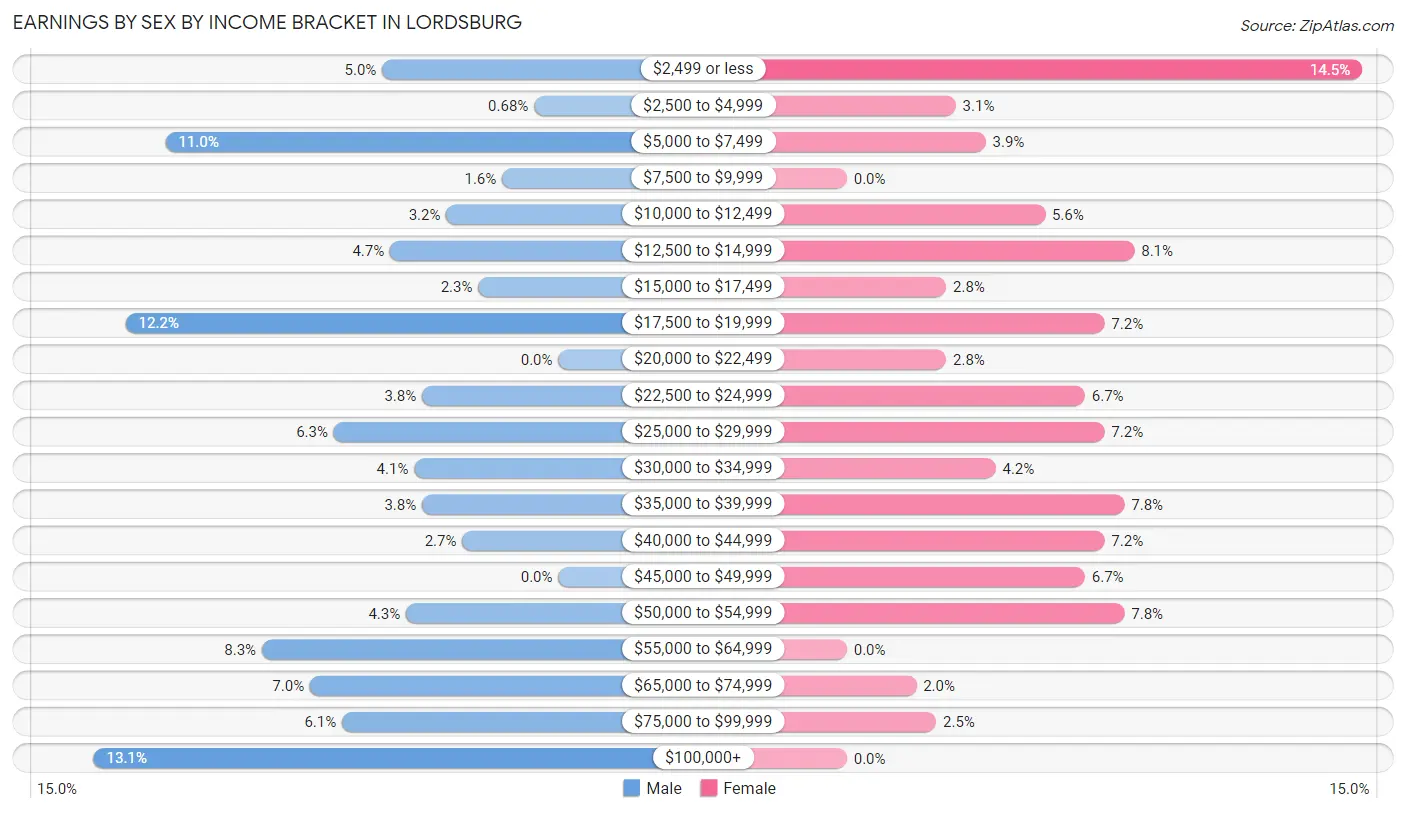
Earnings by Sex by Income Bracket in Lordsburg
The most common earnings brackets in Lordsburg are $100,000+ for men (58 | 13.1%) and $2,499 or less for women (52 | 14.5%).
| Income | Male | Female |
| $2,499 or less | 22 (5.0%) | 52 (14.5%) |
| $2,500 to $4,999 | 3 (0.7%) | 11 (3.1%) |
| $5,000 to $7,499 | 49 (11.0%) | 14 (3.9%) |
| $7,500 to $9,999 | 7 (1.6%) | 0 (0.0%) |
| $10,000 to $12,499 | 14 (3.2%) | 20 (5.6%) |
| $12,500 to $14,999 | 21 (4.7%) | 29 (8.1%) |
| $15,000 to $17,499 | 10 (2.2%) | 10 (2.8%) |
| $17,500 to $19,999 | 54 (12.2%) | 26 (7.2%) |
| $20,000 to $22,499 | 0 (0.0%) | 10 (2.8%) |
| $22,500 to $24,999 | 17 (3.8%) | 24 (6.7%) |
| $25,000 to $29,999 | 28 (6.3%) | 26 (7.2%) |
| $30,000 to $34,999 | 18 (4.1%) | 15 (4.2%) |
| $35,000 to $39,999 | 17 (3.8%) | 28 (7.8%) |
| $40,000 to $44,999 | 12 (2.7%) | 26 (7.2%) |
| $45,000 to $49,999 | 0 (0.0%) | 24 (6.7%) |
| $50,000 to $54,999 | 19 (4.3%) | 28 (7.8%) |
| $55,000 to $64,999 | 37 (8.3%) | 0 (0.0%) |
| $65,000 to $74,999 | 31 (7.0%) | 7 (1.9%) |
| $75,000 to $99,999 | 27 (6.1%) | 9 (2.5%) |
| $100,000+ | 58 (13.1%) | 0 (0.0%) |
| Total | 444 (100.0%) | 359 (100.0%) |
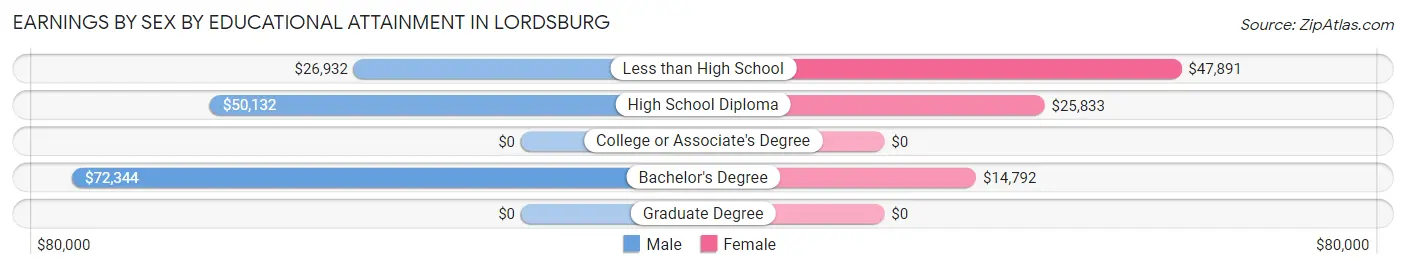
Earnings by Sex by Educational Attainment in Lordsburg
Average earnings in Lordsburg are $36,250 for men and $23,438 for women, a difference of 35.3%. Men with an educational attainment of bachelor's degree enjoy the highest average annual earnings of $72,344, while those with less than high school education earn the least with $26,932. Women with an educational attainment of less than high school earn the most with the average annual earnings of $47,891, while those with bachelor's degree education have the smallest earnings of $14,792.
| Educational Attainment | Male Income | Female Income |
| Less than High School | $26,932 | $47,891 |
| High School Diploma | $50,132 | $25,833 |
| College or Associate's Degree | - | - |
| Bachelor's Degree | $72,344 | $14,792 |
| Graduate Degree | - | - |
| Total | $36,250 | $23,438 |
Family Income in Lordsburg
Family Income Brackets in Lordsburg
According to the Lordsburg family income data, there are 103 families falling into the $50,000 to $74,999 income range, which is the most common income bracket and makes up 24.5% of all families. Conversely, the $200,000+ income bracket is the least frequent group with only 6 families (1.4%) belonging to this category.
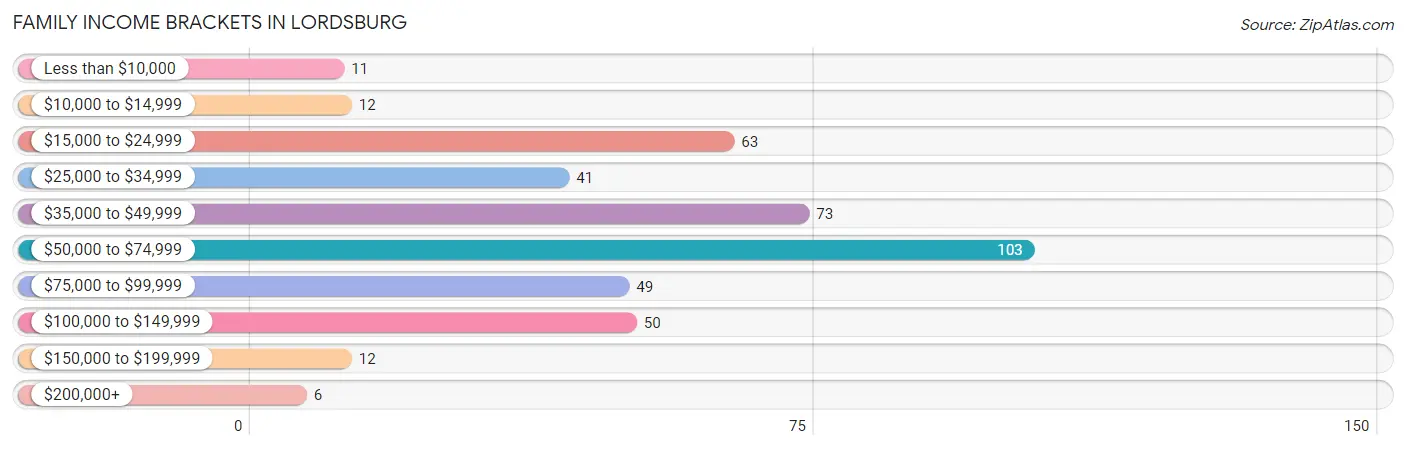
| Income Bracket | # Families | % Families |
| Less than $10,000 | 11 | 2.6% |
| $10,000 to $14,999 | 12 | 2.9% |
| $15,000 to $24,999 | 63 | 15.0% |
| $25,000 to $34,999 | 41 | 9.8% |
| $35,000 to $49,999 | 73 | 17.4% |
| $50,000 to $74,999 | 103 | 24.5% |
| $75,000 to $99,999 | 49 | 11.7% |
| $100,000 to $149,999 | 50 | 11.9% |
| $150,000 to $199,999 | 12 | 2.9% |
| $200,000+ | 6 | 1.4% |
Family Income by Famaliy Size in Lordsburg
4-person families (55 | 13.1%) account for the highest median family income in Lordsburg with $72,788 per family, while 2-person families (219 | 52.1%) have the highest median income of $29,202 per family member.
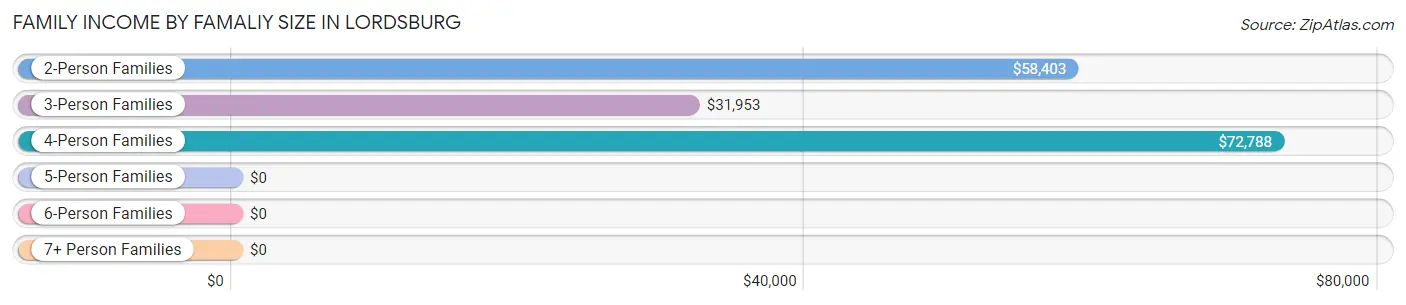
| Income Bracket | # Families | Median Income |
| 2-Person Families | 219 (52.1%) | $58,403 |
| 3-Person Families | 71 (16.9%) | $31,953 |
| 4-Person Families | 55 (13.1%) | $72,788 |
| 5-Person Families | 42 (10.0%) | $0 |
| 6-Person Families | 15 (3.6%) | $0 |
| 7+ Person Families | 18 (4.3%) | $0 |
| Total | 420 (100.0%) | $57,639 |
Family Income by Number of Earners in Lordsburg
The median family income in Lordsburg is $57,639, with families comprising 3+ earners (16) having the highest median family income of $129,000, while families with no earners (89) have the lowest median family income of $32,313, accounting for 3.8% and 21.2% of families, respectively.
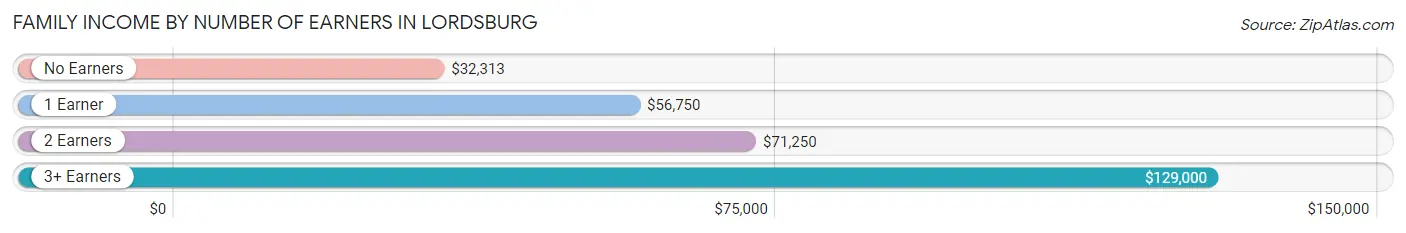
| Number of Earners | # Families | Median Income |
| No Earners | 89 (21.2%) | $32,313 |
| 1 Earner | 179 (42.6%) | $56,750 |
| 2 Earners | 136 (32.4%) | $71,250 |
| 3+ Earners | 16 (3.8%) | $129,000 |
| Total | 420 (100.0%) | $57,639 |
Household Income in Lordsburg
Household Income Brackets in Lordsburg
With 178 households falling in the category, the $50,000 to $74,999 income range is the most frequent in Lordsburg, accounting for 21.6% of all households. In contrast, only 6 households (0.7%) fall into the $200,000+ income bracket, making it the least populous group.
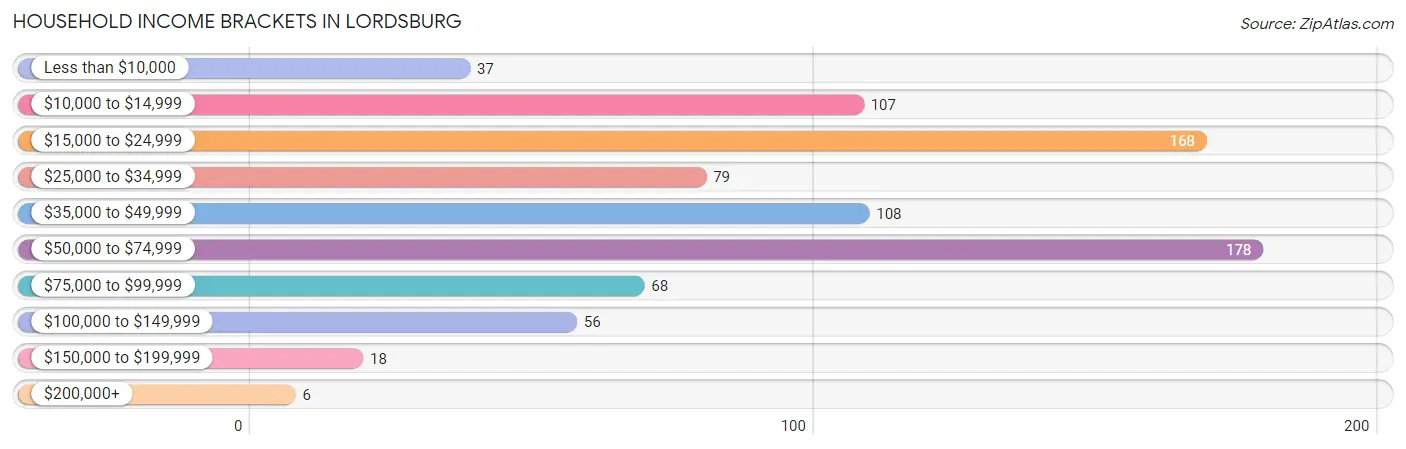
| Income Bracket | # Households | % Households |
| Less than $10,000 | 37 | 4.5% |
| $10,000 to $14,999 | 107 | 13.0% |
| $15,000 to $24,999 | 168 | 20.4% |
| $25,000 to $34,999 | 79 | 9.6% |
| $35,000 to $49,999 | 108 | 13.1% |
| $50,000 to $74,999 | 178 | 21.6% |
| $75,000 to $99,999 | 68 | 8.2% |
| $100,000 to $149,999 | 56 | 6.8% |
| $150,000 to $199,999 | 18 | 2.2% |
| $200,000+ | 6 | 0.7% |
Household Income by Householder Age in Lordsburg
The median household income in Lordsburg is $37,240, with the highest median household income of $40,489 found in the 65+ years age bracket for the primary householder. A total of 309 households (37.4%) fall into this category. Meanwhile, the 25 to 44 years age bracket for the primary householder has the lowest median household income of $0, with 209 households (25.3%) in this group.
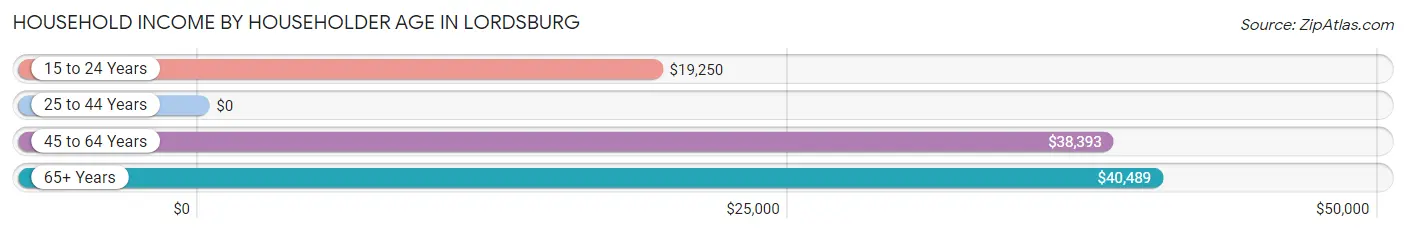
| Income Bracket | # Households | Median Income |
| 15 to 24 Years | 42 (5.1%) | $19,250 |
| 25 to 44 Years | 209 (25.3%) | $0 |
| 45 to 64 Years | 265 (32.1%) | $38,393 |
| 65+ Years | 309 (37.4%) | $40,489 |
| Total | 825 (100.0%) | $37,240 |
Poverty in Lordsburg
Income Below Poverty by Sex and Age in Lordsburg
With 29.6% poverty level for males and 23.0% for females among the residents of Lordsburg, 15 year old males and 25 to 34 year old females are the most vulnerable to poverty, with 5 males (100.0%) and 66 females (49.6%) in their respective age groups living below the poverty level.
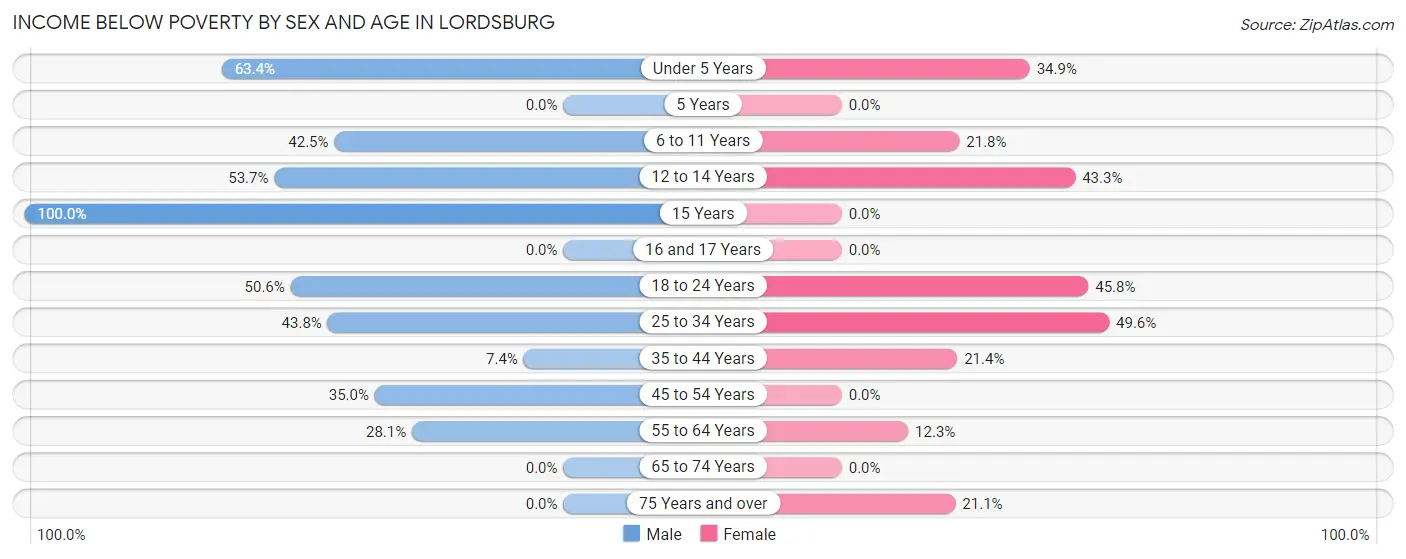
| Age Bracket | Male | Female |
| Under 5 Years | 52 (63.4%) | 30 (34.9%) |
| 5 Years | 0 (0.0%) | 0 (0.0%) |
| 6 to 11 Years | 17 (42.5%) | 36 (21.8%) |
| 12 to 14 Years | 22 (53.7%) | 13 (43.3%) |
| 15 Years | 5 (100.0%) | 0 (0.0%) |
| 16 and 17 Years | 0 (0.0%) | 0 (0.0%) |
| 18 to 24 Years | 40 (50.6%) | 27 (45.8%) |
| 25 to 34 Years | 91 (43.8%) | 66 (49.6%) |
| 35 to 44 Years | 12 (7.4%) | 15 (21.4%) |
| 45 to 54 Years | 28 (35.0%) | 0 (0.0%) |
| 55 to 64 Years | 41 (28.1%) | 17 (12.3%) |
| 65 to 74 Years | 0 (0.0%) | 0 (0.0%) |
| 75 Years and over | 0 (0.0%) | 27 (21.1%) |
| Total | 308 (29.6%) | 231 (23.0%) |
Income Above Poverty by Sex and Age in Lordsburg
According to the poverty statistics in Lordsburg, males aged 5 years and females aged 5 years are the age groups that are most secure financially, with 100.0% of males and 100.0% of females in these age groups living above the poverty line.
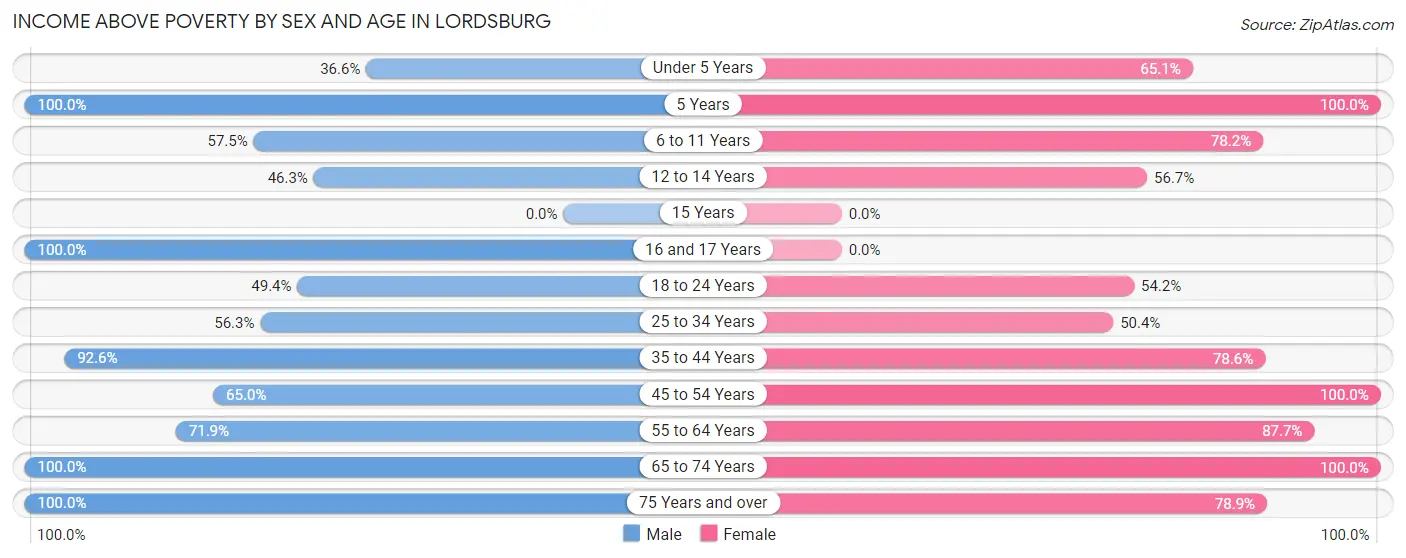
| Age Bracket | Male | Female |
| Under 5 Years | 30 (36.6%) | 56 (65.1%) |
| 5 Years | 12 (100.0%) | 6 (100.0%) |
| 6 to 11 Years | 23 (57.5%) | 129 (78.2%) |
| 12 to 14 Years | 19 (46.3%) | 17 (56.7%) |
| 15 Years | 0 (0.0%) | 0 (0.0%) |
| 16 and 17 Years | 13 (100.0%) | 0 (0.0%) |
| 18 to 24 Years | 39 (49.4%) | 32 (54.2%) |
| 25 to 34 Years | 117 (56.2%) | 67 (50.4%) |
| 35 to 44 Years | 151 (92.6%) | 55 (78.6%) |
| 45 to 54 Years | 52 (65.0%) | 60 (100.0%) |
| 55 to 64 Years | 105 (71.9%) | 121 (87.7%) |
| 65 to 74 Years | 107 (100.0%) | 131 (100.0%) |
| 75 Years and over | 65 (100.0%) | 101 (78.9%) |
| Total | 733 (70.4%) | 775 (77.0%) |
Income Below Poverty Among Married-Couple Families in Lordsburg
The poverty statistics for married-couple families in Lordsburg show that 24.3% or 62 of the total 255 families live below the poverty line. Families with 3 or 4 children have the highest poverty rate of 66.7%, comprising of 30 families. On the other hand, families with no children have the lowest poverty rate of 0.0%, which includes 0 families.
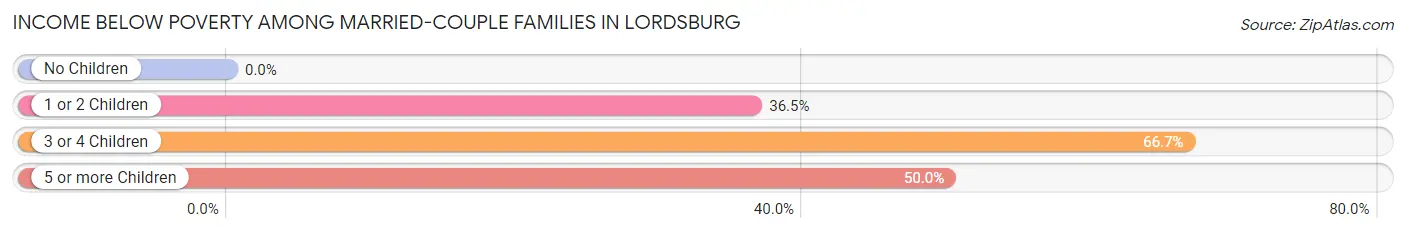
| Children | Above Poverty | Below Poverty |
| No Children | 129 (100.0%) | 0 (0.0%) |
| 1 or 2 Children | 40 (63.5%) | 23 (36.5%) |
| 3 or 4 Children | 15 (33.3%) | 30 (66.7%) |
| 5 or more Children | 9 (50.0%) | 9 (50.0%) |
| Total | 193 (75.7%) | 62 (24.3%) |
Income Below Poverty Among Single-Parent Households in Lordsburg
According to the poverty data in Lordsburg, 10.6% or 7 single-father households and 27.3% or 27 single-mother households are living below the poverty line. Among single-father households, those with 1 or 2 children have the highest poverty rate, with 7 households (50.0%) experiencing poverty. Likewise, among single-mother households, those with 3 or 4 children have the highest poverty rate, with 11 households (100.0%) falling below the poverty line.
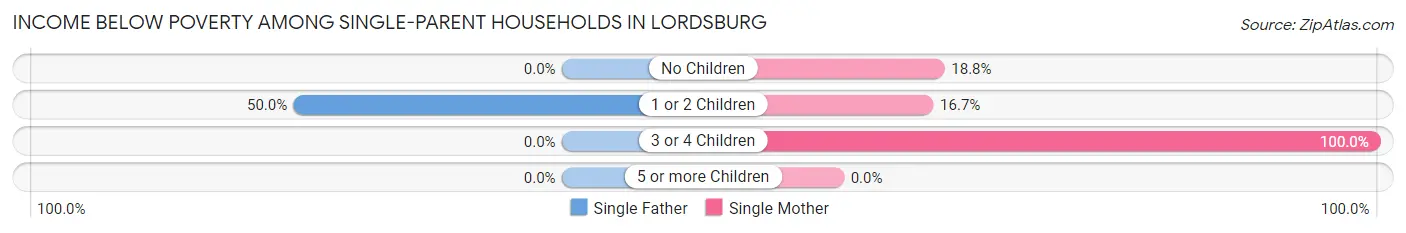
| Children | Single Father | Single Mother |
| No Children | 0 (0.0%) | 12 (18.8%) |
| 1 or 2 Children | 7 (50.0%) | 4 (16.7%) |
| 3 or 4 Children | 0 (0.0%) | 11 (100.0%) |
| 5 or more Children | 0 (0.0%) | 0 (0.0%) |
| Total | 7 (10.6%) | 27 (27.3%) |
Income Below Poverty Among Married-Couple vs Single-Parent Households in Lordsburg
The poverty data for Lordsburg shows that 62 of the married-couple family households (24.3%) and 34 of the single-parent households (20.6%) are living below the poverty level. Within the married-couple family households, those with 3 or 4 children have the highest poverty rate, with 30 households (66.7%) falling below the poverty line. Among the single-parent households, those with 3 or 4 children have the highest poverty rate, with 11 household (36.7%) living below poverty.
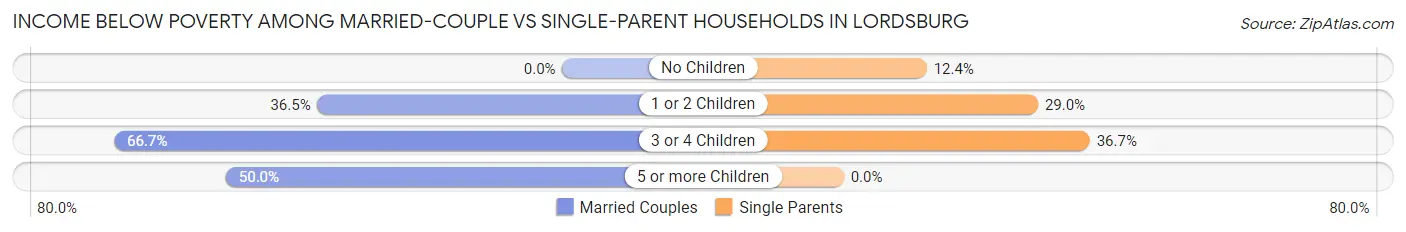
| Children | Married-Couple Families | Single-Parent Households |
| No Children | 0 (0.0%) | 12 (12.4%) |
| 1 or 2 Children | 23 (36.5%) | 11 (28.9%) |
| 3 or 4 Children | 30 (66.7%) | 11 (36.7%) |
| 5 or more Children | 9 (50.0%) | 0 (0.0%) |
| Total | 62 (24.3%) | 34 (20.6%) |
Race in Lordsburg
The most populous races in Lordsburg are Hispanic or Latino (1,558 | 73.7%), White / Caucasian (1,461 | 69.1%), and Two or more Races (343 | 16.2%).
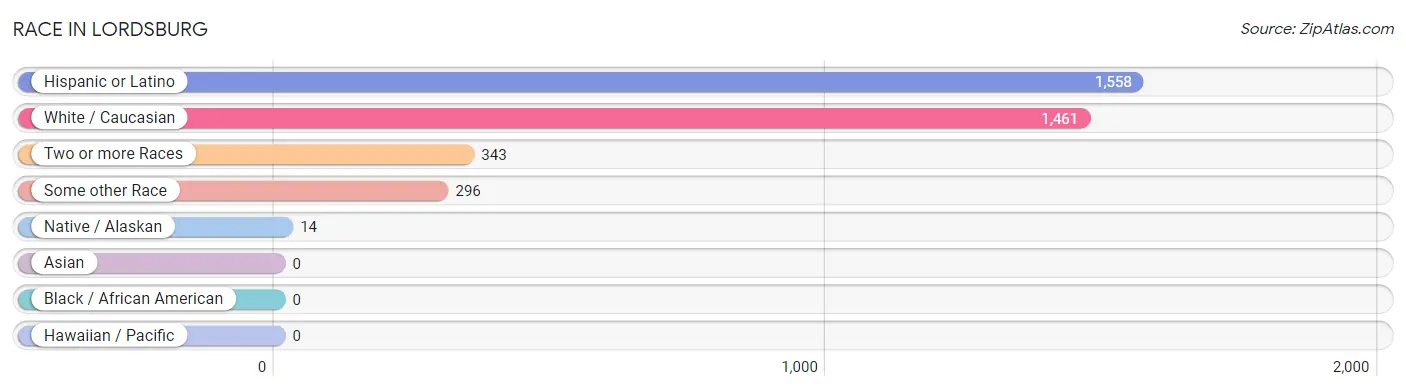
| Race | # Population | % Population |
| Asian | 0 | 0.0% |
| Black / African American | 0 | 0.0% |
| Hawaiian / Pacific | 0 | 0.0% |
| Hispanic or Latino | 1,558 | 73.7% |
| Native / Alaskan | 14 | 0.7% |
| White / Caucasian | 1,461 | 69.1% |
| Two or more Races | 343 | 16.2% |
| Some other Race | 296 | 14.0% |
| Total | 2,114 | 100.0% |
Ancestry in Lordsburg
The most populous ancestries reported in Lordsburg are Mexican (1,422 | 67.3%), German (93 | 4.4%), American (77 | 3.6%), English (76 | 3.6%), and Irish (66 | 3.1%), together accounting for 82.0% of all Lordsburg residents.
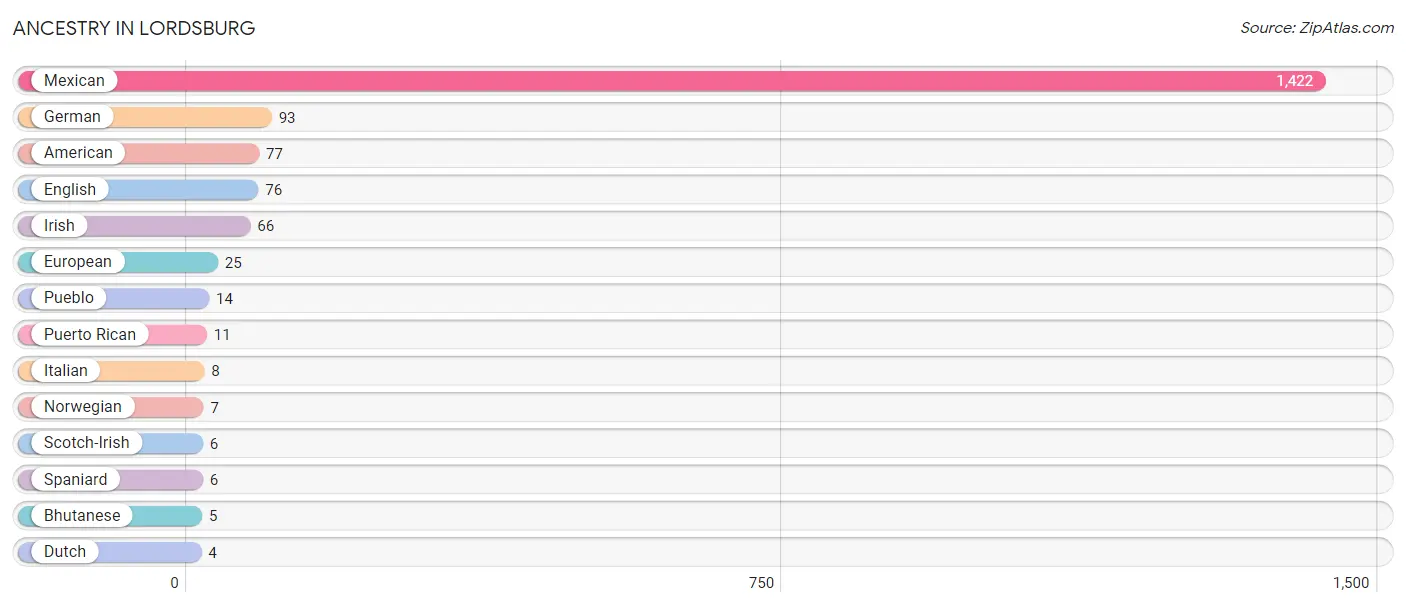
| Ancestry | # Population | % Population |
| American | 77 | 3.6% |
| Bhutanese | 5 | 0.2% |
| Dutch | 4 | 0.2% |
| English | 76 | 3.6% |
| European | 25 | 1.2% |
| German | 93 | 4.4% |
| Irish | 66 | 3.1% |
| Italian | 8 | 0.4% |
| Mexican | 1,422 | 67.3% |
| Norwegian | 7 | 0.3% |
| Pueblo | 14 | 0.7% |
| Puerto Rican | 11 | 0.5% |
| Scotch-Irish | 6 | 0.3% |
| Spaniard | 6 | 0.3% | View All 14 Rows |
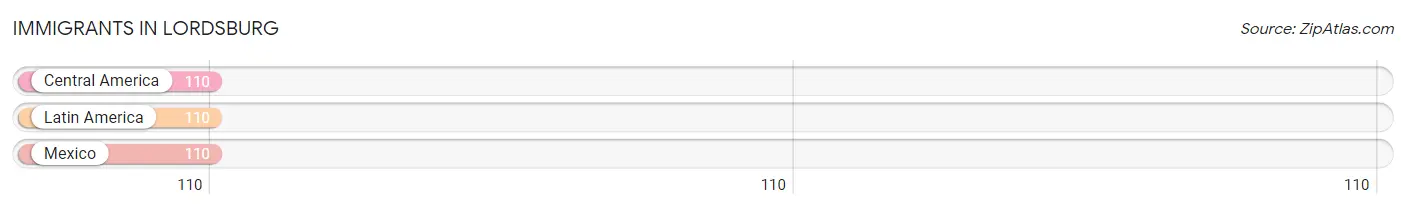
Immigrants in Lordsburg
The most numerous immigrant groups reported in Lordsburg came from Central America (110 | 5.2%), Latin America (110 | 5.2%), and Mexico (110 | 5.2%), together accounting for 15.6% of all Lordsburg residents.
| Immigration Origin | # Population | % Population |
| Central America | 110 | 5.2% |
| Latin America | 110 | 5.2% |
| Mexico | 110 | 5.2% | View All 3 Rows |
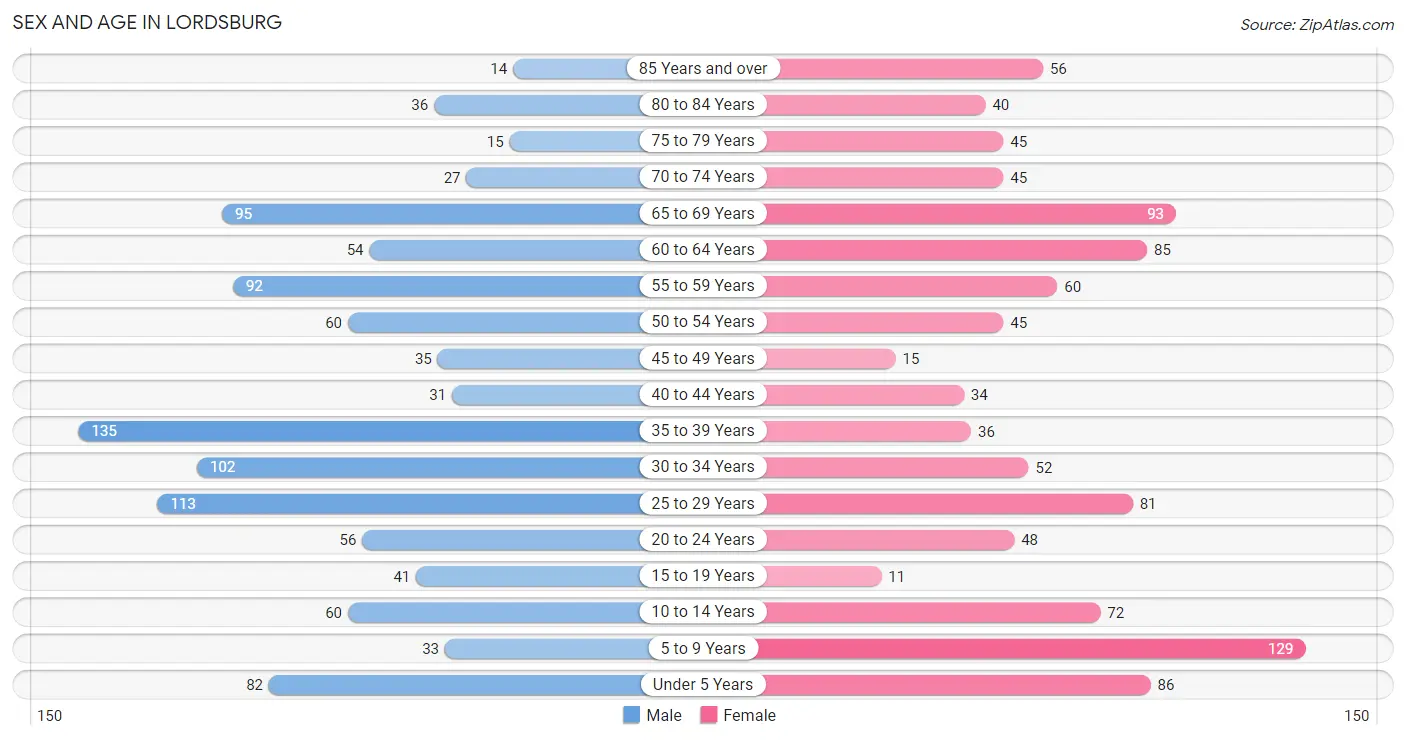
Sex and Age in Lordsburg
Sex and Age in Lordsburg
The most populous age groups in Lordsburg are 35 to 39 Years (135 | 12.5%) for men and 5 to 9 Years (129 | 12.5%) for women.
| Age Bracket | Male | Female |
| Under 5 Years | 82 (7.6%) | 86 (8.3%) |
| 5 to 9 Years | 33 (3.0%) | 129 (12.5%) |
| 10 to 14 Years | 60 (5.6%) | 72 (7.0%) |
| 15 to 19 Years | 41 (3.8%) | 11 (1.1%) |
| 20 to 24 Years | 56 (5.2%) | 48 (4.6%) |
| 25 to 29 Years | 113 (10.4%) | 81 (7.8%) |
| 30 to 34 Years | 102 (9.4%) | 52 (5.0%) |
| 35 to 39 Years | 135 (12.5%) | 36 (3.5%) |
| 40 to 44 Years | 31 (2.9%) | 34 (3.3%) |
| 45 to 49 Years | 35 (3.2%) | 15 (1.5%) |
| 50 to 54 Years | 60 (5.6%) | 45 (4.4%) |
| 55 to 59 Years | 92 (8.5%) | 60 (5.8%) |
| 60 to 64 Years | 54 (5.0%) | 85 (8.2%) |
| 65 to 69 Years | 95 (8.8%) | 93 (9.0%) |
| 70 to 74 Years | 27 (2.5%) | 45 (4.4%) |
| 75 to 79 Years | 15 (1.4%) | 45 (4.4%) |
| 80 to 84 Years | 36 (3.3%) | 40 (3.9%) |
| 85 Years and over | 14 (1.3%) | 56 (5.4%) |
| Total | 1,081 (100.0%) | 1,033 (100.0%) |
Families and Households in Lordsburg
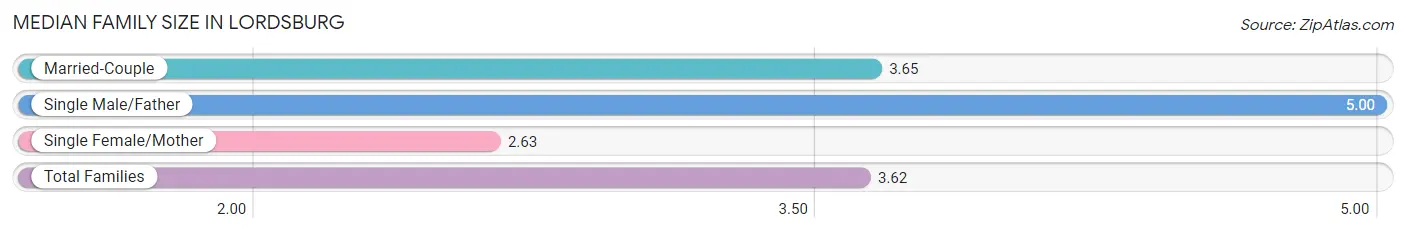
Median Family Size in Lordsburg
The median family size in Lordsburg is 3.62 persons per family, with single male/father families (66 | 15.7%) accounting for the largest median family size of 5 persons per family. On the other hand, single female/mother families (99 | 23.6%) represent the smallest median family size with 2.63 persons per family.
| Family Type | # Families | Family Size |
| Married-Couple | 255 (60.7%) | 3.65 |
| Single Male/Father | 66 (15.7%) | 5.00 |
| Single Female/Mother | 99 (23.6%) | 2.63 |
| Total Families | 420 (100.0%) | 3.62 |
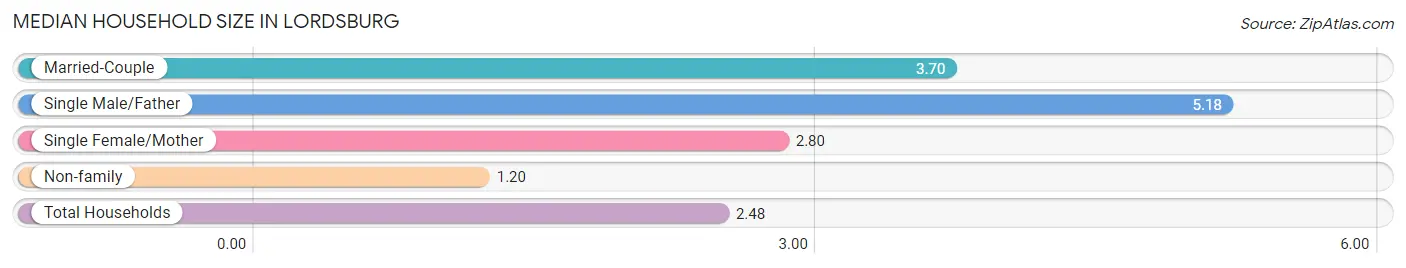
Median Household Size in Lordsburg
The median household size in Lordsburg is 2.48 persons per household, with single male/father households (66 | 8.0%) accounting for the largest median household size of 5.18 persons per household. non-family households (405 | 49.1%) represent the smallest median household size with 1.20 persons per household.
| Household Type | # Households | Household Size |
| Married-Couple | 255 (30.9%) | 3.70 |
| Single Male/Father | 66 (8.0%) | 5.18 |
| Single Female/Mother | 99 (12.0%) | 2.80 |
| Non-family | 405 (49.1%) | 1.20 |
| Total Households | 825 (100.0%) | 2.48 |
Household Size by Marriage Status in Lordsburg
Out of a total of 825 households in Lordsburg, 420 (50.9%) are family households, while 405 (49.1%) are nonfamily households. The most numerous type of family households are 2-person households, comprising 203, and the most common type of nonfamily households are 1-person households, comprising 368.
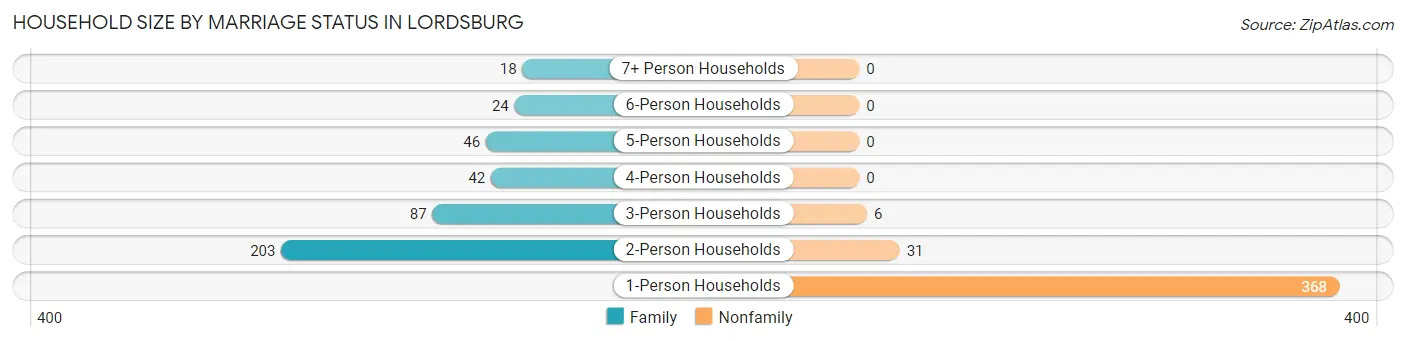
| Household Size | Family Households | Nonfamily Households |
| 1-Person Households | - | 368 (44.6%) |
| 2-Person Households | 203 (24.6%) | 31 (3.8%) |
| 3-Person Households | 87 (10.5%) | 6 (0.7%) |
| 4-Person Households | 42 (5.1%) | 0 (0.0%) |
| 5-Person Households | 46 (5.6%) | 0 (0.0%) |
| 6-Person Households | 24 (2.9%) | 0 (0.0%) |
| 7+ Person Households | 18 (2.2%) | 0 (0.0%) |
| Total | 420 (50.9%) | 405 (49.1%) |
Female Fertility in Lordsburg
Fertility by Age in Lordsburg
Average fertility rate in Lordsburg is 188.0 births per 1,000 women. Women in the age bracket of 20 to 34 years have the highest fertility rate with 243.0 births per 1,000 women. Women in the age bracket of 20 to 34 years acount for 81.5% of all women with births.
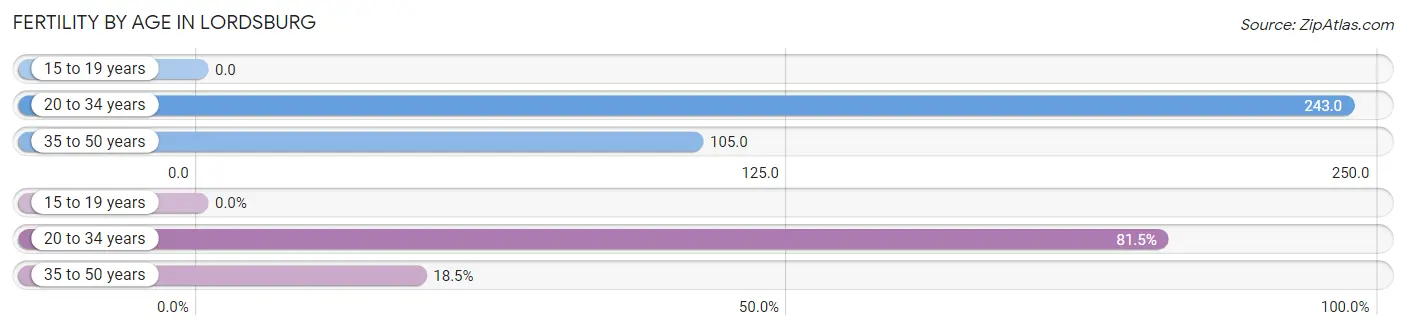
| Age Bracket | Women with Births | Births / 1,000 Women |
| 15 to 19 years | 0 (0.0%) | 0.0 |
| 20 to 34 years | 44 (81.5%) | 243.0 |
| 35 to 50 years | 10 (18.5%) | 105.0 |
| Total | 54 (100.0%) | 188.0 |
Fertility by Age by Marriage Status in Lordsburg
88.9% of women with births (54) in Lordsburg are married. The highest percentage of unmarried women with births falls into 20 to 34 years age bracket with 13.6% of them unmarried at the time of birth, while the lowest percentage of unmarried women with births belong to 35 to 50 years age bracket with 0.0% of them unmarried.
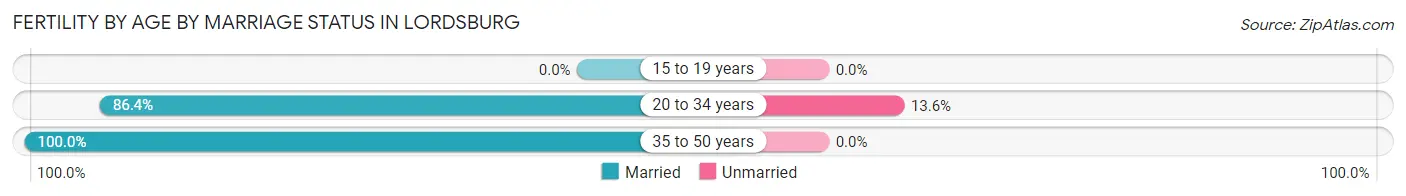
| Age Bracket | Married | Unmarried |
| 15 to 19 years | 0 (0.0%) | 0 (0.0%) |
| 20 to 34 years | 38 (86.4%) | 6 (13.6%) |
| 35 to 50 years | 10 (100.0%) | 0 (0.0%) |
| Total | 48 (88.9%) | 6 (11.1%) |
Fertility by Education in Lordsburg
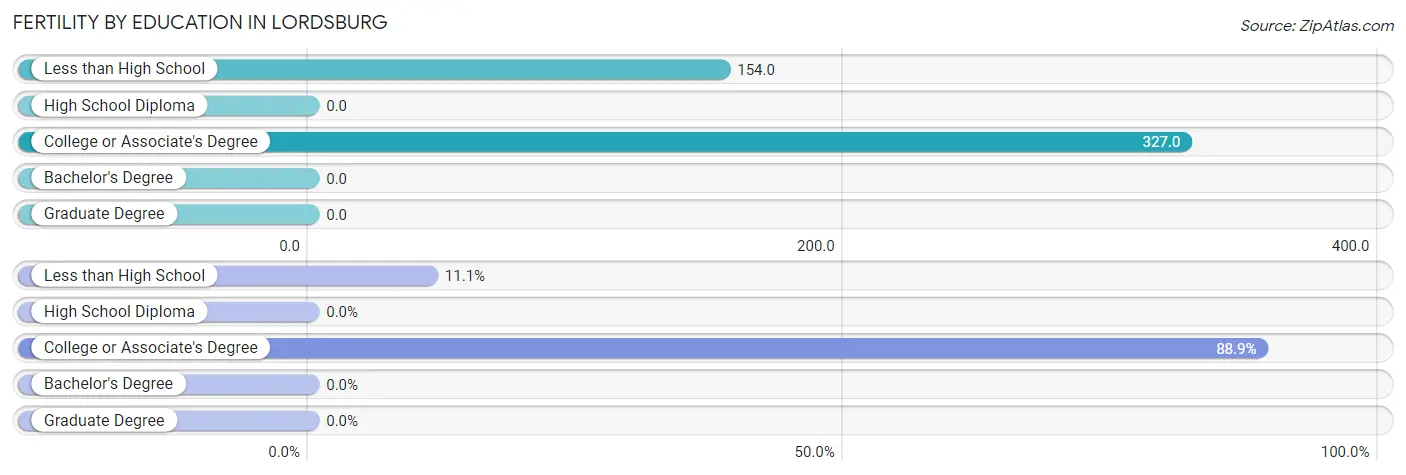
| Educational Attainment | Women with Births | Births / 1,000 Women |
| Less than High School | 6 (11.1%) | 154.0 |
| High School Diploma | 0 (0.0%) | 0.0 |
| College or Associate's Degree | 48 (88.9%) | 327.0 |
| Bachelor's Degree | 0 (0.0%) | 0.0 |
| Graduate Degree | 0 (0.0%) | 0.0 |
| Total | 54 (100.0%) | 188.0 |
Fertility by Education by Marriage Status in Lordsburg
11.1% of women with births in Lordsburg are unmarried. Women with the educational attainment of college or associate's degree are most likely to be married with 100.0% of them married at childbirth, while women with the educational attainment of less than high school are least likely to be married with 100.0% of them unmarried at childbirth.
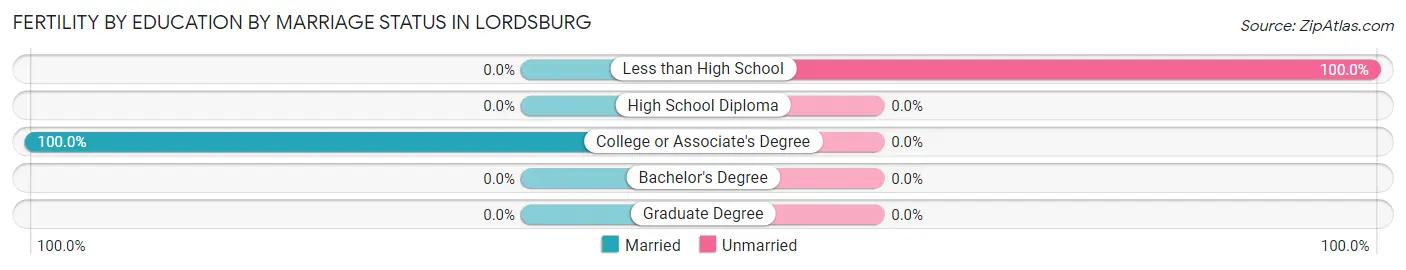
| Educational Attainment | Married | Unmarried |
| Less than High School | 0 (0.0%) | 6 (100.0%) |
| High School Diploma | 0 (0.0%) | 0 (0.0%) |
| College or Associate's Degree | 48 (100.0%) | 0 (0.0%) |
| Bachelor's Degree | 0 (0.0%) | 0 (0.0%) |
| Graduate Degree | 0 (0.0%) | 0 (0.0%) |
| Total | 48 (88.9%) | 6 (11.1%) |
Employment Characteristics in Lordsburg
Employment by Class of Employer in Lordsburg
Among the 692 employed individuals in Lordsburg, private company employees (367 | 53.0%), local government employees (118 | 17.1%), and state government employees (67 | 9.7%) make up the most common classes of employment.
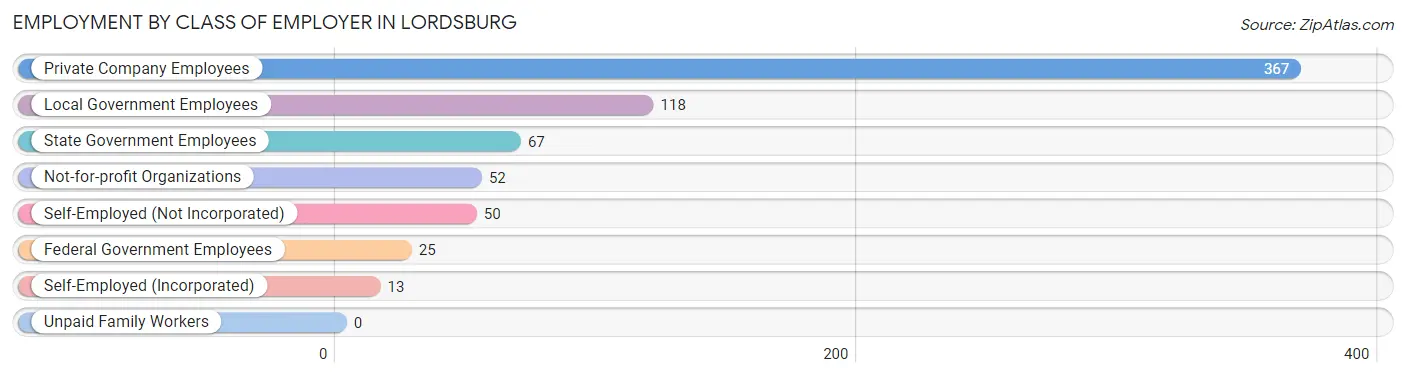
| Employer Class | # Employees | % Employees |
| Private Company Employees | 367 | 53.0% |
| Self-Employed (Incorporated) | 13 | 1.9% |
| Self-Employed (Not Incorporated) | 50 | 7.2% |
| Not-for-profit Organizations | 52 | 7.5% |
| Local Government Employees | 118 | 17.1% |
| State Government Employees | 67 | 9.7% |
| Federal Government Employees | 25 | 3.6% |
| Unpaid Family Workers | 0 | 0.0% |
| Total | 692 | 100.0% |
Employment Status by Age in Lordsburg
According to the labor force statistics for Lordsburg, out of the total population over 16 years of age (1,647), 44.6% or 735 individuals are in the labor force, with 5.2% or 38 of them unemployed. The age group with the highest labor force participation rate is 25 to 29 years, with 87.6% or 170 individuals in the labor force. Within the labor force, the 20 to 24 years age range has the highest percentage of unemployed individuals, with 35.7% or 15 of them being unemployed.
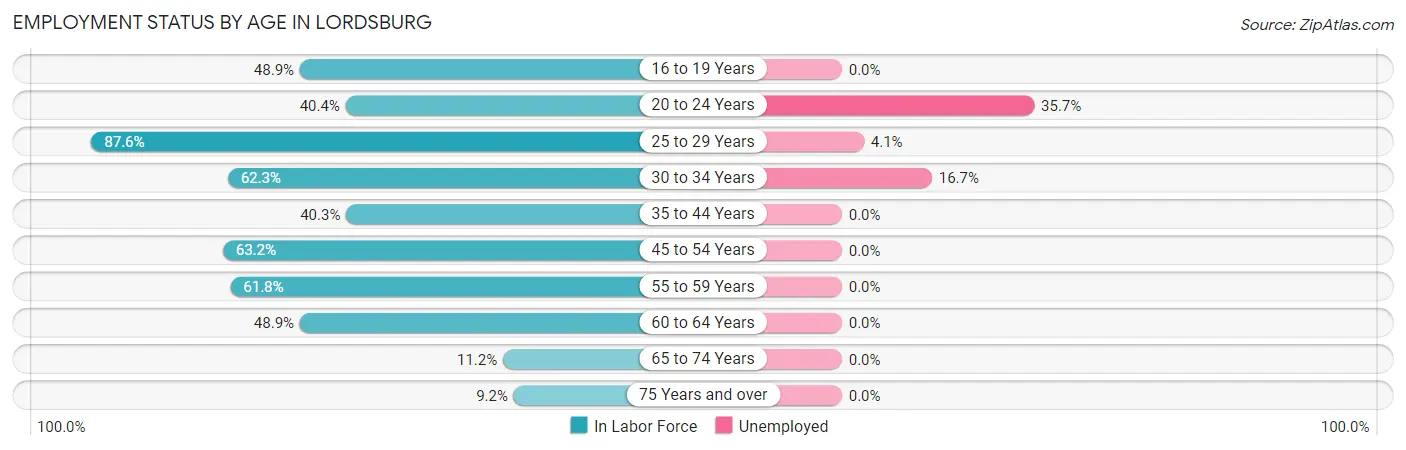
| Age Bracket | In Labor Force | Unemployed |
| 16 to 19 Years | 23 (48.9%) | 0 (0.0%) |
| 20 to 24 Years | 42 (40.4%) | 15 (35.7%) |
| 25 to 29 Years | 170 (87.6%) | 7 (4.1%) |
| 30 to 34 Years | 96 (62.3%) | 16 (16.7%) |
| 35 to 44 Years | 95 (40.3%) | 0 (0.0%) |
| 45 to 54 Years | 98 (63.2%) | 0 (0.0%) |
| 55 to 59 Years | 94 (61.8%) | 0 (0.0%) |
| 60 to 64 Years | 68 (48.9%) | 0 (0.0%) |
| 65 to 74 Years | 29 (11.2%) | 0 (0.0%) |
| 75 Years and over | 19 (9.2%) | 0 (0.0%) |
| Total | 735 (44.6%) | 38 (5.2%) |
Employment Status by Educational Attainment in Lordsburg
According to labor force statistics for Lordsburg, 60.3% of individuals (621) out of the total population between 25 and 64 years of age (1,030) are in the labor force, with 3.7% or 23 of them being unemployed. The group with the highest labor force participation rate are those with the educational attainment of bachelor's degree or higher, with 73.9% or 65 individuals in the labor force. Within the labor force, individuals with less than high school education have the highest percentage of unemployment, with 7.4% or 7 of them being unemployed.
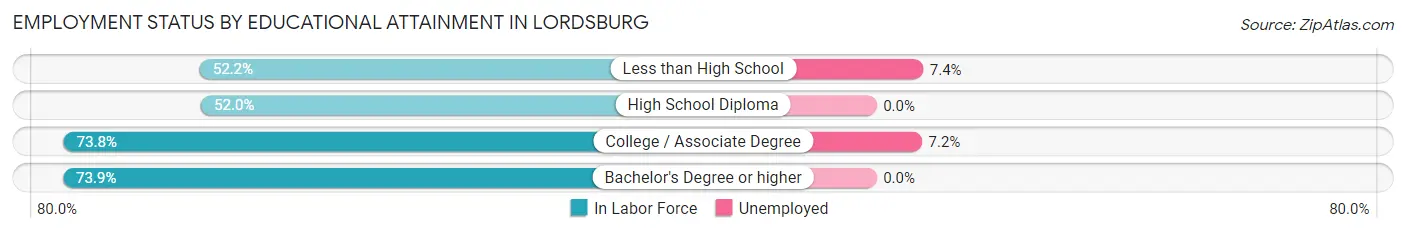
| Educational Attainment | In Labor Force | Unemployed |
| Less than High School | 95 (52.2%) | 13 (7.4%) |
| High School Diploma | 238 (52.0%) | 0 (0.0%) |
| College / Associate Degree | 223 (73.8%) | 22 (7.2%) |
| Bachelor's Degree or higher | 65 (73.9%) | 0 (0.0%) |
| Total | 621 (60.3%) | 38 (3.7%) |
Employment Occupations by Sex in Lordsburg
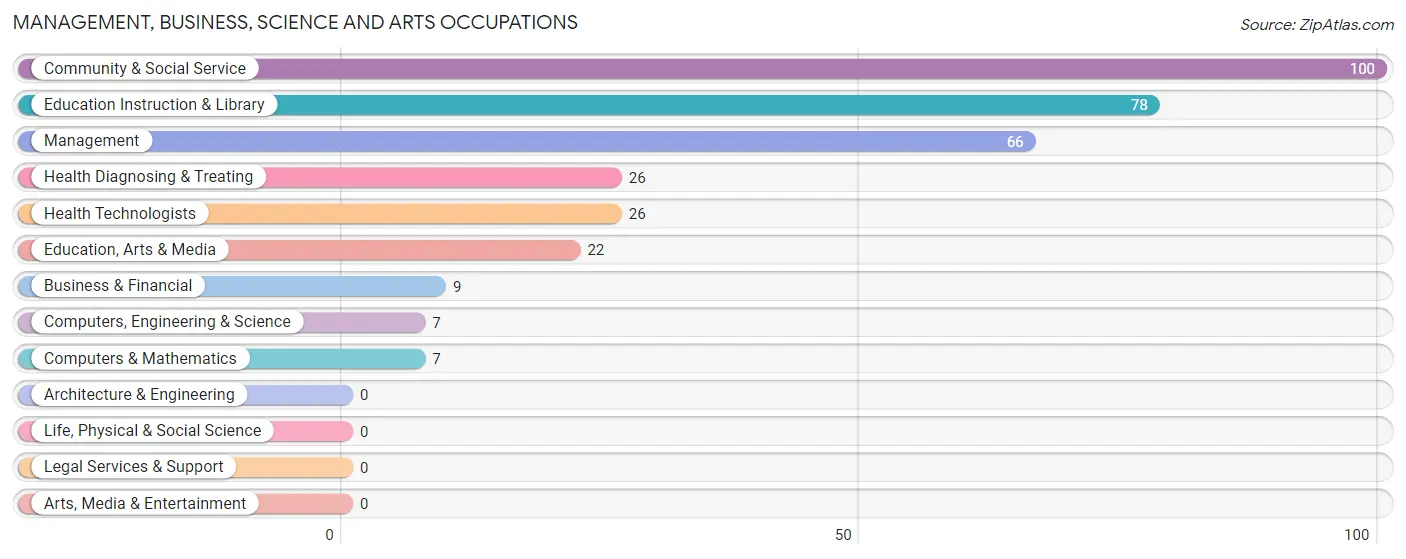
Management, Business, Science and Arts Occupations
The most common Management, Business, Science and Arts occupations in Lordsburg are Community & Social Service (100 | 14.4%), Education Instruction & Library (78 | 11.2%), Management (66 | 9.5%), Health Diagnosing & Treating (26 | 3.7%), and Health Technologists (26 | 3.7%).
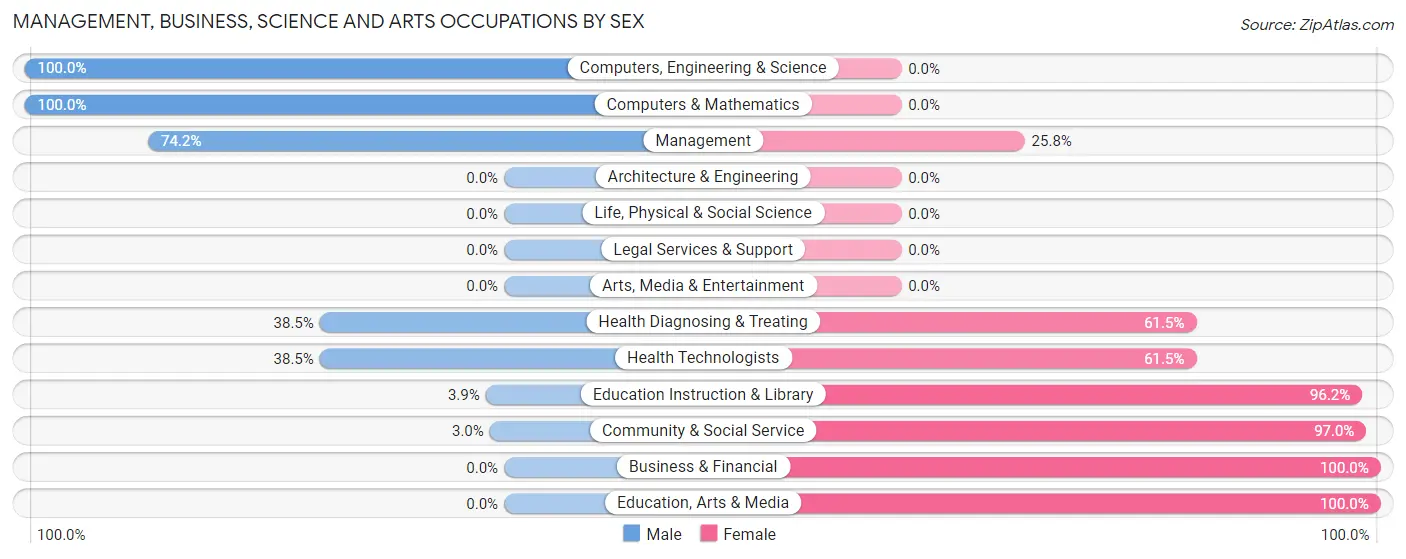
Management, Business, Science and Arts Occupations by Sex
Within the Management, Business, Science and Arts occupations in Lordsburg, the most male-oriented occupations are Computers, Engineering & Science (100.0%), Computers & Mathematics (100.0%), and Management (74.2%), while the most female-oriented occupations are Business & Financial (100.0%), Education, Arts & Media (100.0%), and Community & Social Service (97.0%).
| Occupation | Male | Female |
| Management | 49 (74.2%) | 17 (25.8%) |
| Business & Financial | 0 (0.0%) | 9 (100.0%) |
| Computers, Engineering & Science | 7 (100.0%) | 0 (0.0%) |
| Computers & Mathematics | 7 (100.0%) | 0 (0.0%) |
| Architecture & Engineering | 0 (0.0%) | 0 (0.0%) |
| Life, Physical & Social Science | 0 (0.0%) | 0 (0.0%) |
| Community & Social Service | 3 (3.0%) | 97 (97.0%) |
| Education, Arts & Media | 0 (0.0%) | 22 (100.0%) |
| Legal Services & Support | 0 (0.0%) | 0 (0.0%) |
| Education Instruction & Library | 3 (3.8%) | 75 (96.2%) |
| Arts, Media & Entertainment | 0 (0.0%) | 0 (0.0%) |
| Health Diagnosing & Treating | 10 (38.5%) | 16 (61.5%) |
| Health Technologists | 10 (38.5%) | 16 (61.5%) |
| Total (Category) | 69 (33.2%) | 139 (66.8%) |
| Total (Overall) | 381 (54.7%) | 315 (45.3%) |
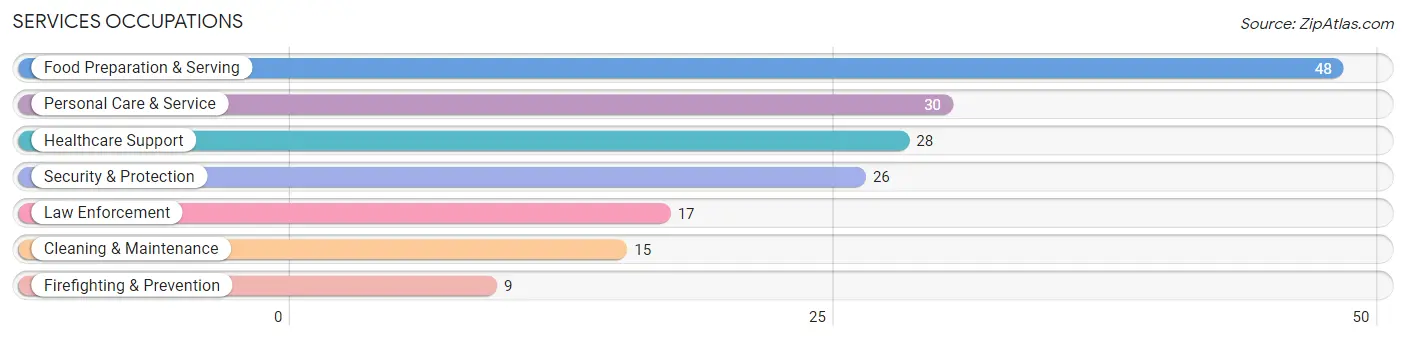
Services Occupations
The most common Services occupations in Lordsburg are Food Preparation & Serving (48 | 6.9%), Personal Care & Service (30 | 4.3%), Healthcare Support (28 | 4.0%), Security & Protection (26 | 3.7%), and Law Enforcement (17 | 2.4%).
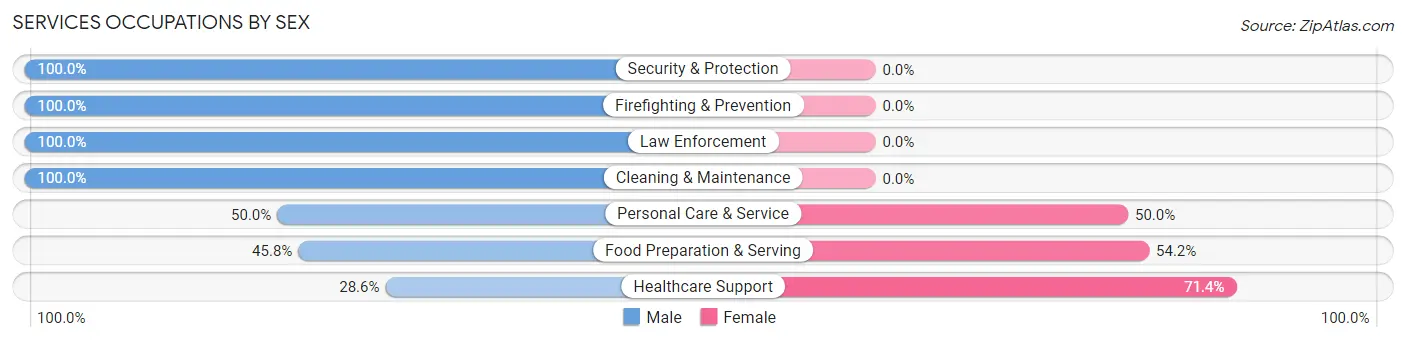
Services Occupations by Sex
Within the Services occupations in Lordsburg, the most male-oriented occupations are Security & Protection (100.0%), Firefighting & Prevention (100.0%), and Law Enforcement (100.0%), while the most female-oriented occupations are Healthcare Support (71.4%), Food Preparation & Serving (54.2%), and Personal Care & Service (50.0%).
| Occupation | Male | Female |
| Healthcare Support | 8 (28.6%) | 20 (71.4%) |
| Security & Protection | 26 (100.0%) | 0 (0.0%) |
| Firefighting & Prevention | 9 (100.0%) | 0 (0.0%) |
| Law Enforcement | 17 (100.0%) | 0 (0.0%) |
| Food Preparation & Serving | 22 (45.8%) | 26 (54.2%) |
| Cleaning & Maintenance | 15 (100.0%) | 0 (0.0%) |
| Personal Care & Service | 15 (50.0%) | 15 (50.0%) |
| Total (Category) | 86 (58.5%) | 61 (41.5%) |
| Total (Overall) | 381 (54.7%) | 315 (45.3%) |
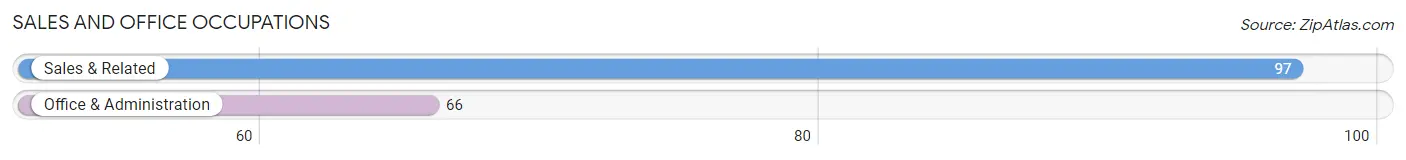
Sales and Office Occupations
The most common Sales and Office occupations in Lordsburg are Sales & Related (97 | 13.9%), and Office & Administration (66 | 9.5%).
Sales and Office Occupations by Sex
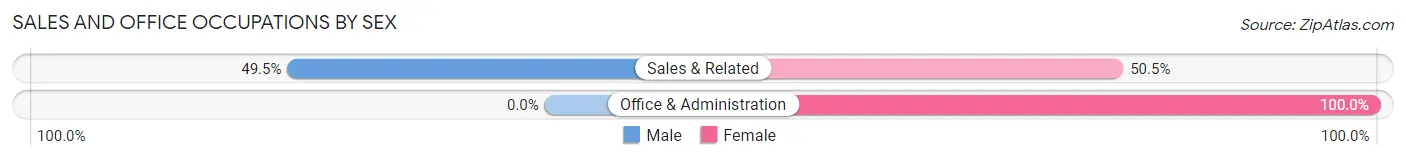
| Occupation | Male | Female |
| Sales & Related | 48 (49.5%) | 49 (50.5%) |
| Office & Administration | 0 (0.0%) | 66 (100.0%) |
| Total (Category) | 48 (29.4%) | 115 (70.6%) |
| Total (Overall) | 381 (54.7%) | 315 (45.3%) |
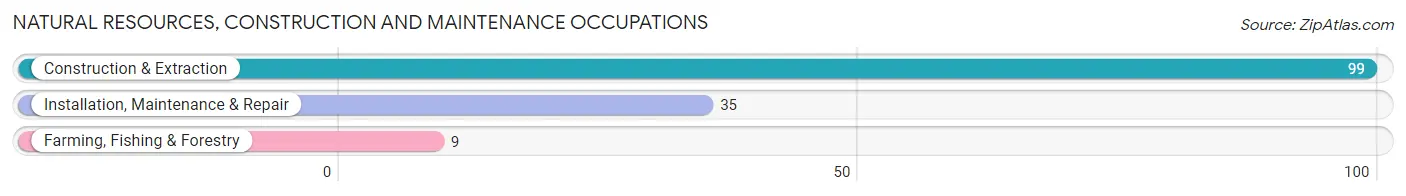
Natural Resources, Construction and Maintenance Occupations
The most common Natural Resources, Construction and Maintenance occupations in Lordsburg are Construction & Extraction (99 | 14.2%), Installation, Maintenance & Repair (35 | 5.0%), and Farming, Fishing & Forestry (9 | 1.3%).
Natural Resources, Construction and Maintenance Occupations by Sex
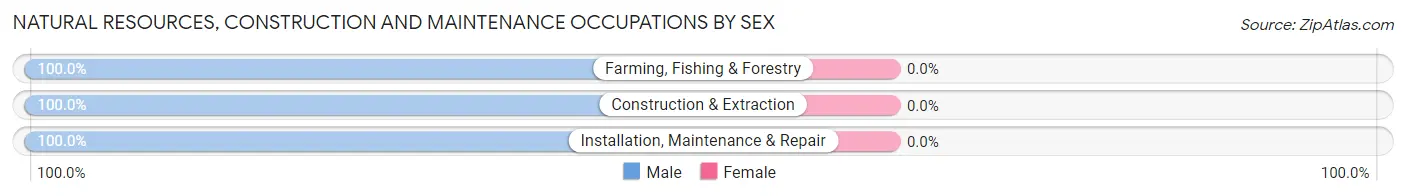
| Occupation | Male | Female |
| Farming, Fishing & Forestry | 9 (100.0%) | 0 (0.0%) |
| Construction & Extraction | 99 (100.0%) | 0 (0.0%) |
| Installation, Maintenance & Repair | 35 (100.0%) | 0 (0.0%) |
| Total (Category) | 143 (100.0%) | 0 (0.0%) |
| Total (Overall) | 381 (54.7%) | 315 (45.3%) |
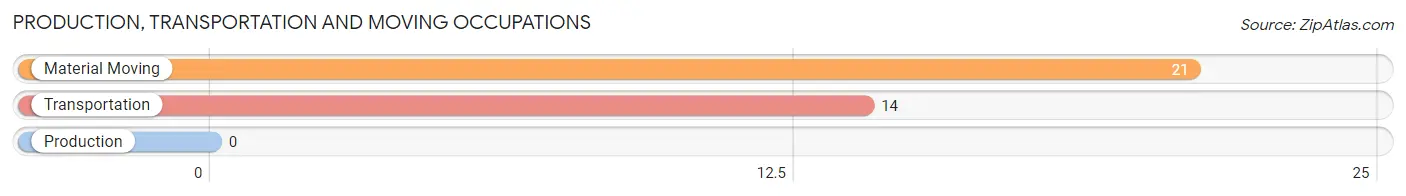
Production, Transportation and Moving Occupations
The most common Production, Transportation and Moving occupations in Lordsburg are Material Moving (21 | 3.0%), and Transportation (14 | 2.0%).
Production, Transportation and Moving Occupations by Sex
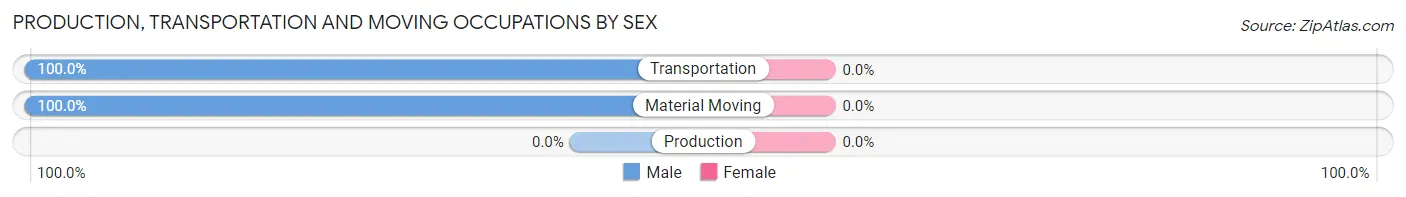
| Occupation | Male | Female |
| Production | 0 (0.0%) | 0 (0.0%) |
| Transportation | 14 (100.0%) | 0 (0.0%) |
| Material Moving | 21 (100.0%) | 0 (0.0%) |
| Total (Category) | 35 (100.0%) | 0 (0.0%) |
| Total (Overall) | 381 (54.7%) | 315 (45.3%) |
Employment Industries by Sex in Lordsburg
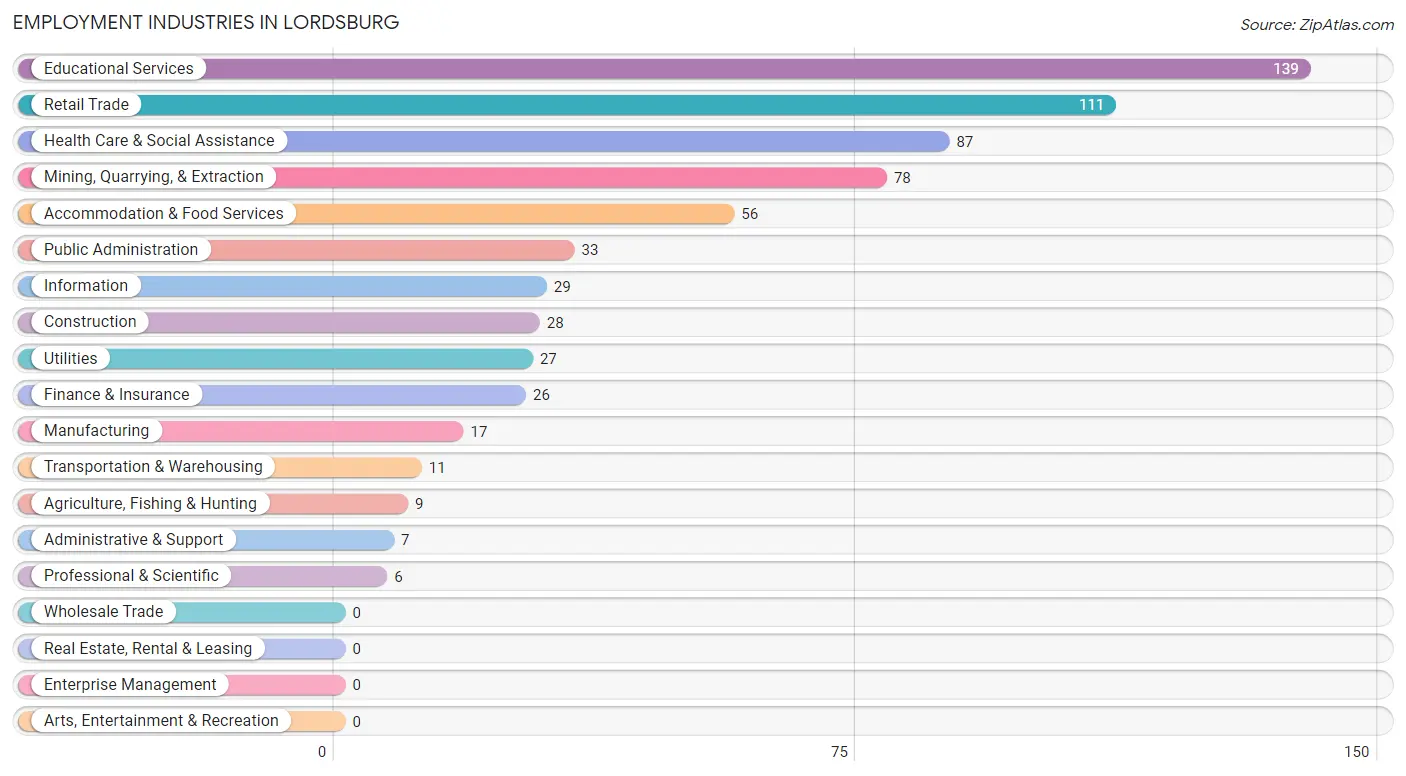
Employment Industries in Lordsburg
The major employment industries in Lordsburg include Educational Services (139 | 20.0%), Retail Trade (111 | 16.0%), Health Care & Social Assistance (87 | 12.5%), Mining, Quarrying, & Extraction (78 | 11.2%), and Accommodation & Food Services (56 | 8.1%).
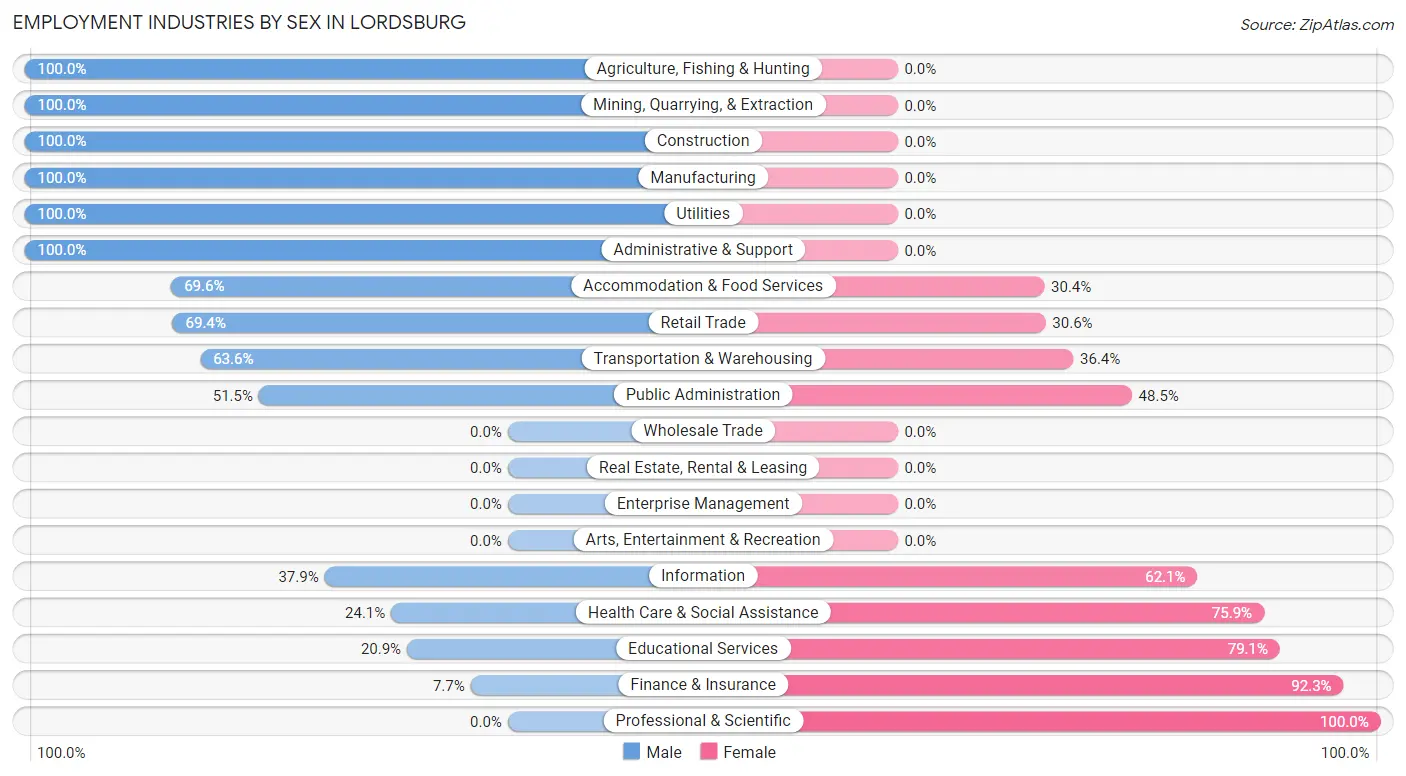
Employment Industries by Sex in Lordsburg
The Lordsburg industries that see more men than women are Agriculture, Fishing & Hunting (100.0%), Mining, Quarrying, & Extraction (100.0%), and Construction (100.0%), whereas the industries that tend to have a higher number of women are Professional & Scientific (100.0%), Finance & Insurance (92.3%), and Educational Services (79.1%).
| Industry | Male | Female |
| Agriculture, Fishing & Hunting | 9 (100.0%) | 0 (0.0%) |
| Mining, Quarrying, & Extraction | 78 (100.0%) | 0 (0.0%) |
| Construction | 28 (100.0%) | 0 (0.0%) |
| Manufacturing | 17 (100.0%) | 0 (0.0%) |
| Wholesale Trade | 0 (0.0%) | 0 (0.0%) |
| Retail Trade | 77 (69.4%) | 34 (30.6%) |
| Transportation & Warehousing | 7 (63.6%) | 4 (36.4%) |
| Utilities | 27 (100.0%) | 0 (0.0%) |
| Information | 11 (37.9%) | 18 (62.1%) |
| Finance & Insurance | 2 (7.7%) | 24 (92.3%) |
| Real Estate, Rental & Leasing | 0 (0.0%) | 0 (0.0%) |
| Professional & Scientific | 0 (0.0%) | 6 (100.0%) |
| Enterprise Management | 0 (0.0%) | 0 (0.0%) |
| Administrative & Support | 7 (100.0%) | 0 (0.0%) |
| Educational Services | 29 (20.9%) | 110 (79.1%) |
| Health Care & Social Assistance | 21 (24.1%) | 66 (75.9%) |
| Arts, Entertainment & Recreation | 0 (0.0%) | 0 (0.0%) |
| Accommodation & Food Services | 39 (69.6%) | 17 (30.4%) |
| Public Administration | 17 (51.5%) | 16 (48.5%) |
| Total | 381 (54.7%) | 315 (45.3%) |
Education in Lordsburg
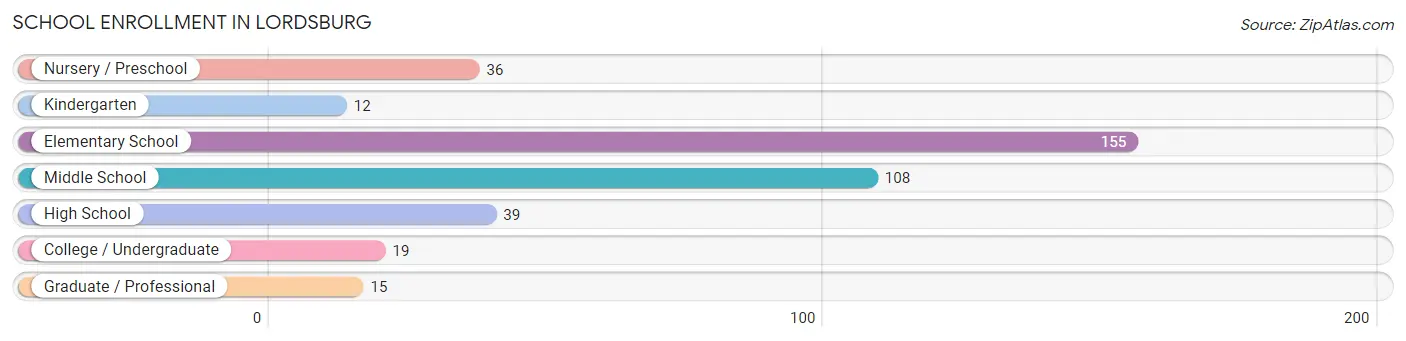
School Enrollment in Lordsburg
The most common levels of schooling among the 384 students in Lordsburg are elementary school (155 | 40.4%), middle school (108 | 28.1%), and high school (39 | 10.2%).
| School Level | # Students | % Students |
| Nursery / Preschool | 36 | 9.4% |
| Kindergarten | 12 | 3.1% |
| Elementary School | 155 | 40.4% |
| Middle School | 108 | 28.1% |
| High School | 39 | 10.2% |
| College / Undergraduate | 19 | 5.0% |
| Graduate / Professional | 15 | 3.9% |
| Total | 384 | 100.0% |
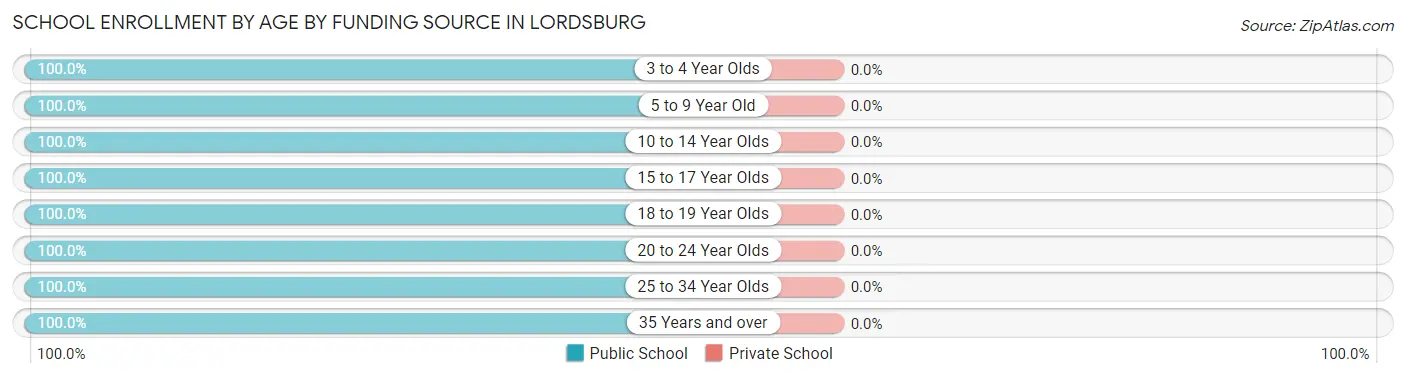
School Enrollment by Age by Funding Source in Lordsburg
| Age Bracket | Public School | Private School |
| 3 to 4 Year Olds | 29 (100.0%) | 0 (0.0%) |
| 5 to 9 Year Old | 156 (100.0%) | 0 (0.0%) |
| 10 to 14 Year Olds | 132 (100.0%) | 0 (0.0%) |
| 15 to 17 Year Olds | 18 (100.0%) | 0 (0.0%) |
| 18 to 19 Year Olds | 15 (100.0%) | 0 (0.0%) |
| 20 to 24 Year Olds | 21 (100.0%) | 0 (0.0%) |
| 25 to 34 Year Olds | 8 (100.0%) | 0 (0.0%) |
| 35 Years and over | 5 (100.0%) | 0 (0.0%) |
| Total | 384 (100.0%) | 0 (0.0%) |
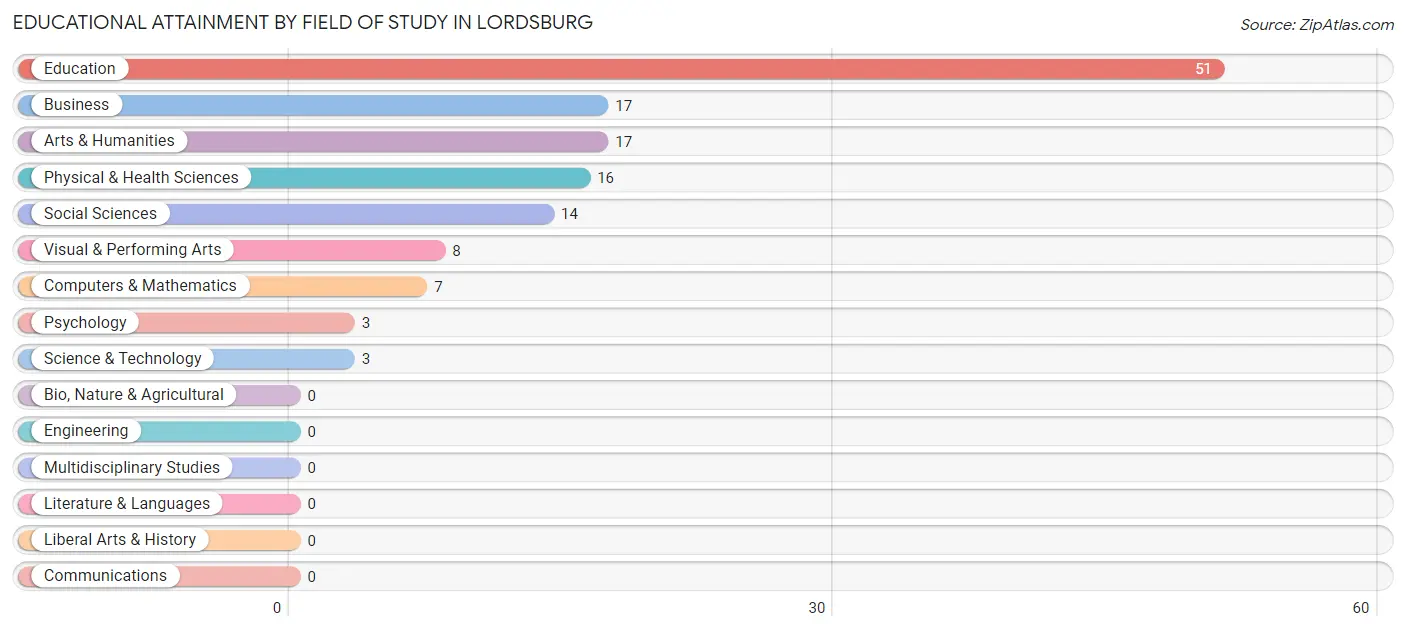
Educational Attainment by Field of Study in Lordsburg
Education (51 | 37.5%), business (17 | 12.5%), arts & humanities (17 | 12.5%), physical & health sciences (16 | 11.8%), and social sciences (14 | 10.3%) are the most common fields of study among 136 individuals in Lordsburg who have obtained a bachelor's degree or higher.
| Field of Study | # Graduates | % Graduates |
| Computers & Mathematics | 7 | 5.1% |
| Bio, Nature & Agricultural | 0 | 0.0% |
| Physical & Health Sciences | 16 | 11.8% |
| Psychology | 3 | 2.2% |
| Social Sciences | 14 | 10.3% |
| Engineering | 0 | 0.0% |
| Multidisciplinary Studies | 0 | 0.0% |
| Science & Technology | 3 | 2.2% |
| Business | 17 | 12.5% |
| Education | 51 | 37.5% |
| Literature & Languages | 0 | 0.0% |
| Liberal Arts & History | 0 | 0.0% |
| Visual & Performing Arts | 8 | 5.9% |
| Communications | 0 | 0.0% |
| Arts & Humanities | 17 | 12.5% |
| Total | 136 | 100.0% |
Transportation & Commute in Lordsburg
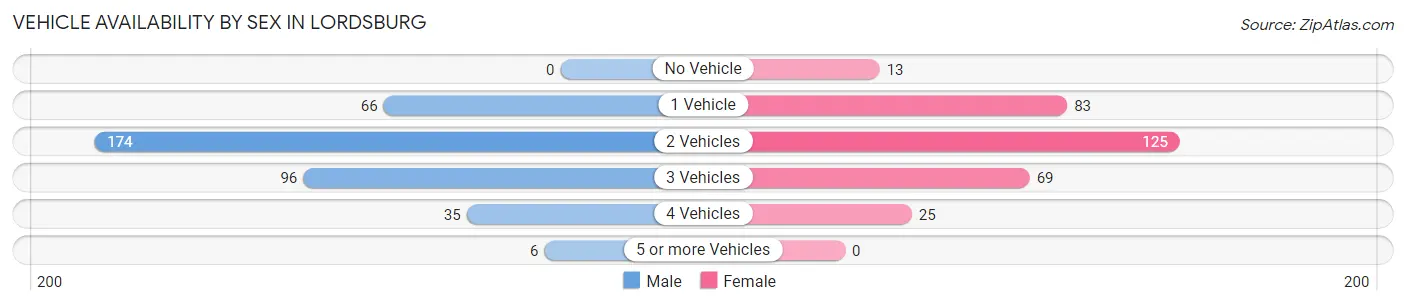
Vehicle Availability by Sex in Lordsburg
The most prevalent vehicle ownership categories in Lordsburg are males with 2 vehicles (174, accounting for 46.2%) and females with 2 vehicles (125, making up 55.2%).
| Vehicles Available | Male | Female |
| No Vehicle | 0 (0.0%) | 13 (4.1%) |
| 1 Vehicle | 66 (17.5%) | 83 (26.4%) |
| 2 Vehicles | 174 (46.2%) | 125 (39.7%) |
| 3 Vehicles | 96 (25.5%) | 69 (21.9%) |
| 4 Vehicles | 35 (9.3%) | 25 (7.9%) |
| 5 or more Vehicles | 6 (1.6%) | 0 (0.0%) |
| Total | 377 (100.0%) | 315 (100.0%) |
Commute Time in Lordsburg
The most frequently occuring commute durations in Lordsburg are 5 to 9 minutes (244 commuters, 36.9%), less than 5 minutes (134 commuters, 20.3%), and 10 to 14 minutes (86 commuters, 13.0%).
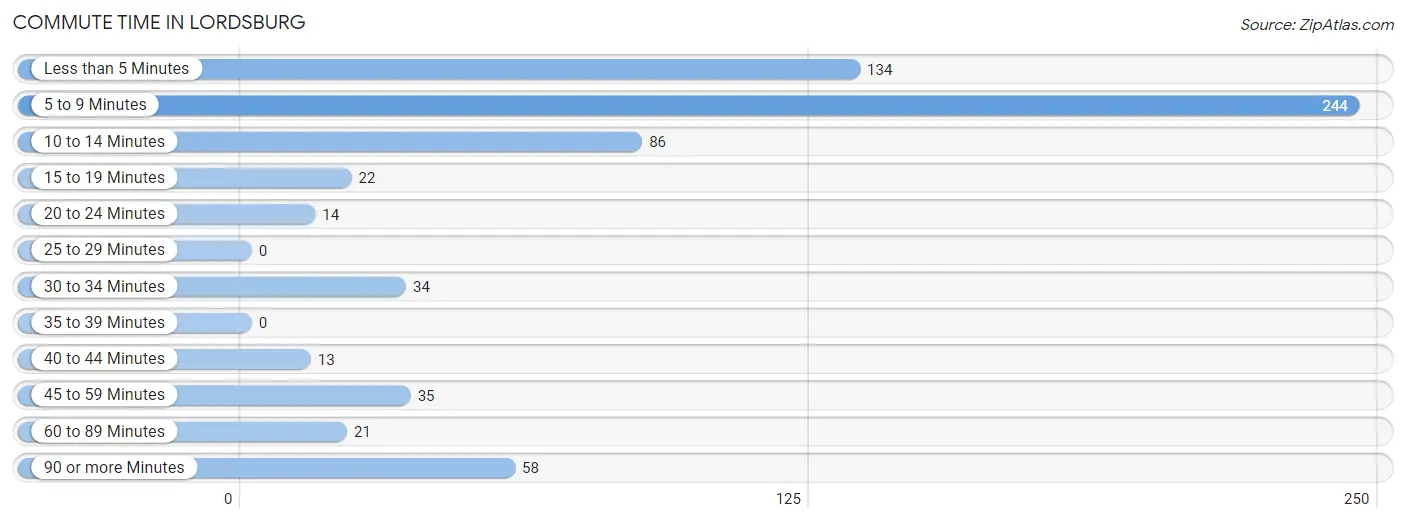
| Commute Time | # Commuters | % Commuters |
| Less than 5 Minutes | 134 | 20.3% |
| 5 to 9 Minutes | 244 | 36.9% |
| 10 to 14 Minutes | 86 | 13.0% |
| 15 to 19 Minutes | 22 | 3.3% |
| 20 to 24 Minutes | 14 | 2.1% |
| 25 to 29 Minutes | 0 | 0.0% |
| 30 to 34 Minutes | 34 | 5.1% |
| 35 to 39 Minutes | 0 | 0.0% |
| 40 to 44 Minutes | 13 | 2.0% |
| 45 to 59 Minutes | 35 | 5.3% |
| 60 to 89 Minutes | 21 | 3.2% |
| 90 or more Minutes | 58 | 8.8% |
Commute Time by Sex in Lordsburg
The most common commute times in Lordsburg are less than 5 minutes (79 commuters, 21.2%) for males and 5 to 9 minutes (166 commuters, 57.6%) for females.
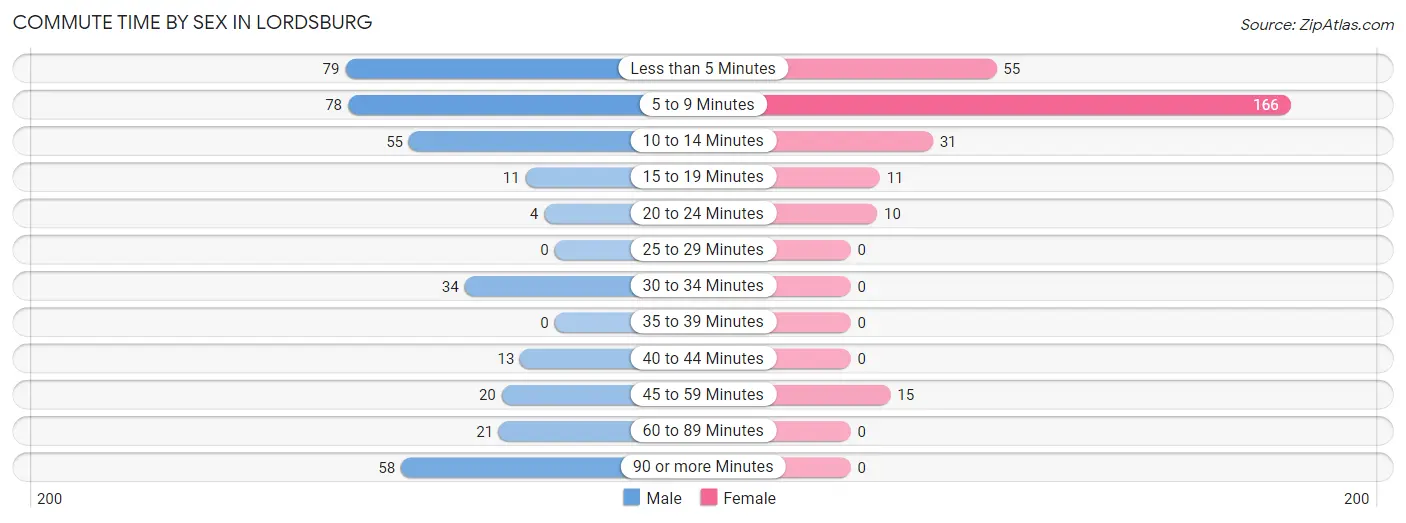
| Commute Time | Male | Female |
| Less than 5 Minutes | 79 (21.2%) | 55 (19.1%) |
| 5 to 9 Minutes | 78 (20.9%) | 166 (57.6%) |
| 10 to 14 Minutes | 55 (14.7%) | 31 (10.8%) |
| 15 to 19 Minutes | 11 (2.9%) | 11 (3.8%) |
| 20 to 24 Minutes | 4 (1.1%) | 10 (3.5%) |
| 25 to 29 Minutes | 0 (0.0%) | 0 (0.0%) |
| 30 to 34 Minutes | 34 (9.1%) | 0 (0.0%) |
| 35 to 39 Minutes | 0 (0.0%) | 0 (0.0%) |
| 40 to 44 Minutes | 13 (3.5%) | 0 (0.0%) |
| 45 to 59 Minutes | 20 (5.4%) | 15 (5.2%) |
| 60 to 89 Minutes | 21 (5.6%) | 0 (0.0%) |
| 90 or more Minutes | 58 (15.5%) | 0 (0.0%) |
Time of Departure to Work by Sex in Lordsburg
The most frequent times of departure to work in Lordsburg are 6:00 AM to 6:29 AM (68, 18.2%) for males and 7:30 AM to 7:59 AM (90, 31.2%) for females.
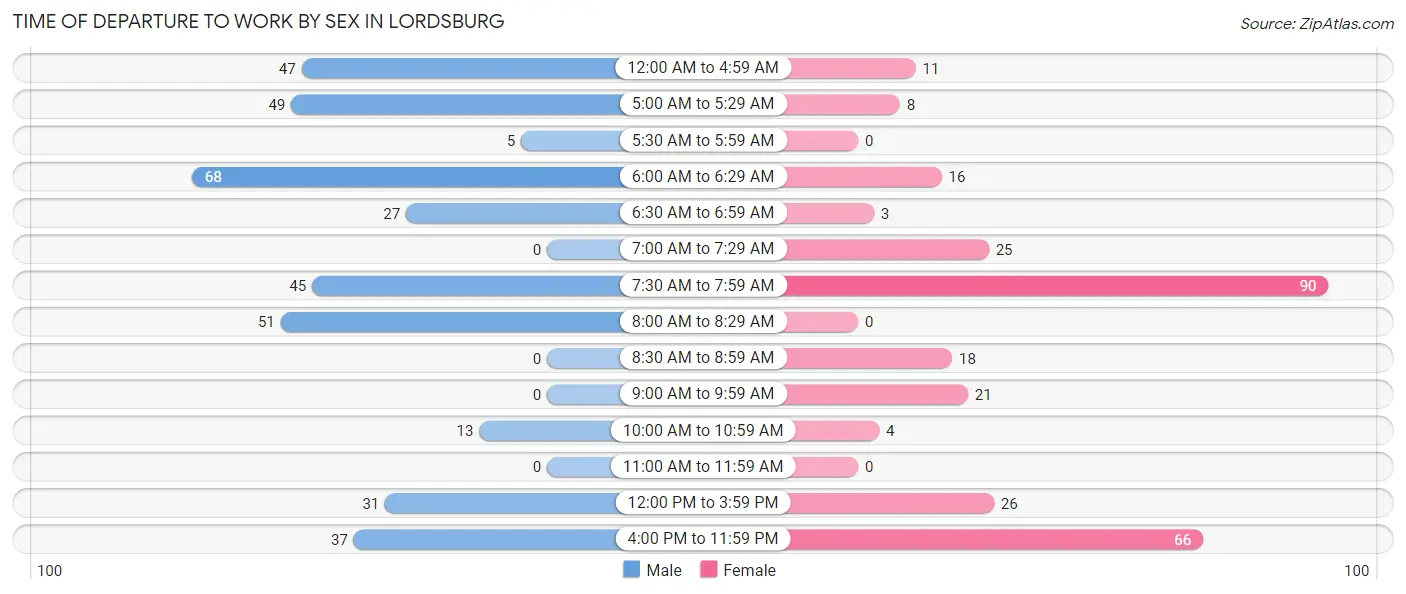
| Time of Departure | Male | Female |
| 12:00 AM to 4:59 AM | 47 (12.6%) | 11 (3.8%) |
| 5:00 AM to 5:29 AM | 49 (13.1%) | 8 (2.8%) |
| 5:30 AM to 5:59 AM | 5 (1.3%) | 0 (0.0%) |
| 6:00 AM to 6:29 AM | 68 (18.2%) | 16 (5.6%) |
| 6:30 AM to 6:59 AM | 27 (7.2%) | 3 (1.0%) |
| 7:00 AM to 7:29 AM | 0 (0.0%) | 25 (8.7%) |
| 7:30 AM to 7:59 AM | 45 (12.1%) | 90 (31.2%) |
| 8:00 AM to 8:29 AM | 51 (13.7%) | 0 (0.0%) |
| 8:30 AM to 8:59 AM | 0 (0.0%) | 18 (6.2%) |
| 9:00 AM to 9:59 AM | 0 (0.0%) | 21 (7.3%) |
| 10:00 AM to 10:59 AM | 13 (3.5%) | 4 (1.4%) |
| 11:00 AM to 11:59 AM | 0 (0.0%) | 0 (0.0%) |
| 12:00 PM to 3:59 PM | 31 (8.3%) | 26 (9.0%) |
| 4:00 PM to 11:59 PM | 37 (9.9%) | 66 (22.9%) |
| Total | 373 (100.0%) | 288 (100.0%) |
Housing Occupancy in Lordsburg
Occupancy by Ownership in Lordsburg
Of the total 825 dwellings in Lordsburg, owner-occupied units account for 472 (57.2%), while renter-occupied units make up 353 (42.8%).
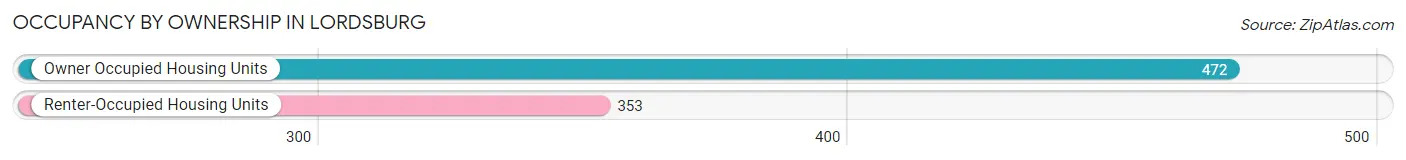
| Occupancy | # Housing Units | % Housing Units |
| Owner Occupied Housing Units | 472 | 57.2% |
| Renter-Occupied Housing Units | 353 | 42.8% |
| Total Occupied Housing Units | 825 | 100.0% |
Occupancy by Household Size in Lordsburg
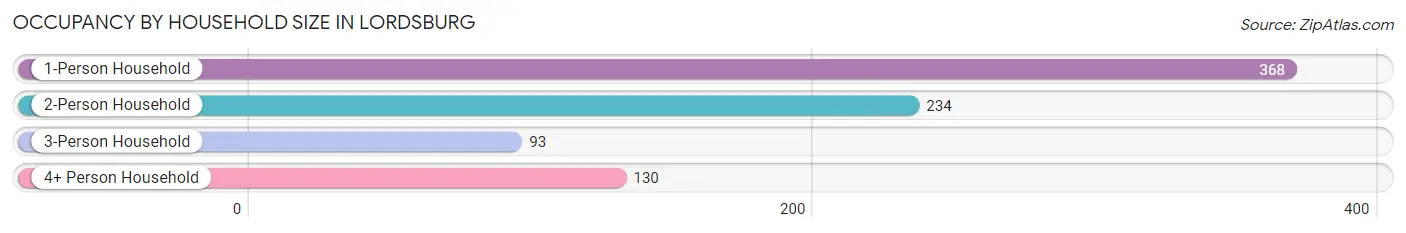
| Household Size | # Housing Units | % Housing Units |
| 1-Person Household | 368 | 44.6% |
| 2-Person Household | 234 | 28.4% |
| 3-Person Household | 93 | 11.3% |
| 4+ Person Household | 130 | 15.8% |
| Total Housing Units | 825 | 100.0% |
Occupancy by Ownership by Household Size in Lordsburg
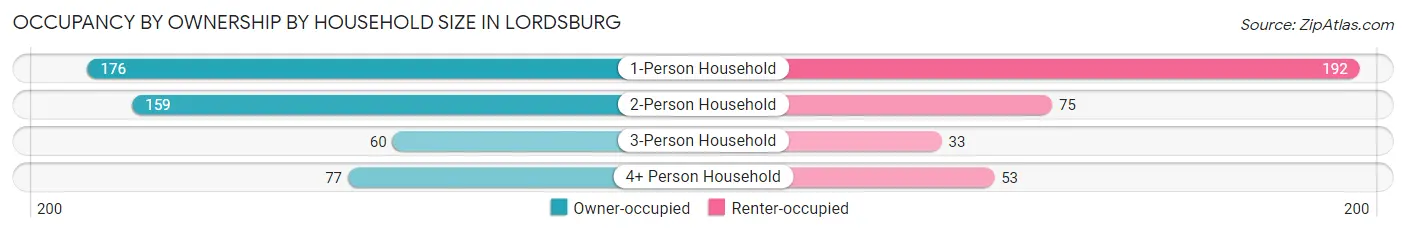
| Household Size | Owner-occupied | Renter-occupied |
| 1-Person Household | 176 (47.8%) | 192 (52.2%) |
| 2-Person Household | 159 (67.9%) | 75 (32.1%) |
| 3-Person Household | 60 (64.5%) | 33 (35.5%) |
| 4+ Person Household | 77 (59.2%) | 53 (40.8%) |
| Total Housing Units | 472 (57.2%) | 353 (42.8%) |
Occupancy by Educational Attainment in Lordsburg
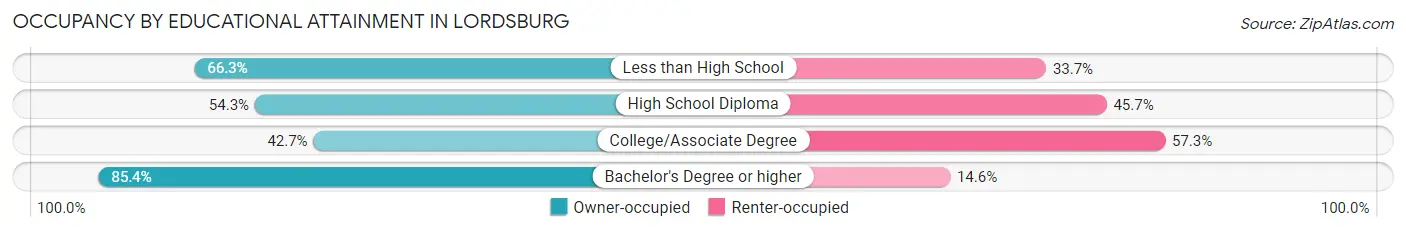
| Household Size | Owner-occupied | Renter-occupied |
| Less than High School | 136 (66.3%) | 69 (33.7%) |
| High School Diploma | 169 (54.3%) | 142 (45.7%) |
| College/Associate Degree | 97 (42.7%) | 130 (57.3%) |
| Bachelor's Degree or higher | 70 (85.4%) | 12 (14.6%) |
Occupancy by Age of Householder in Lordsburg
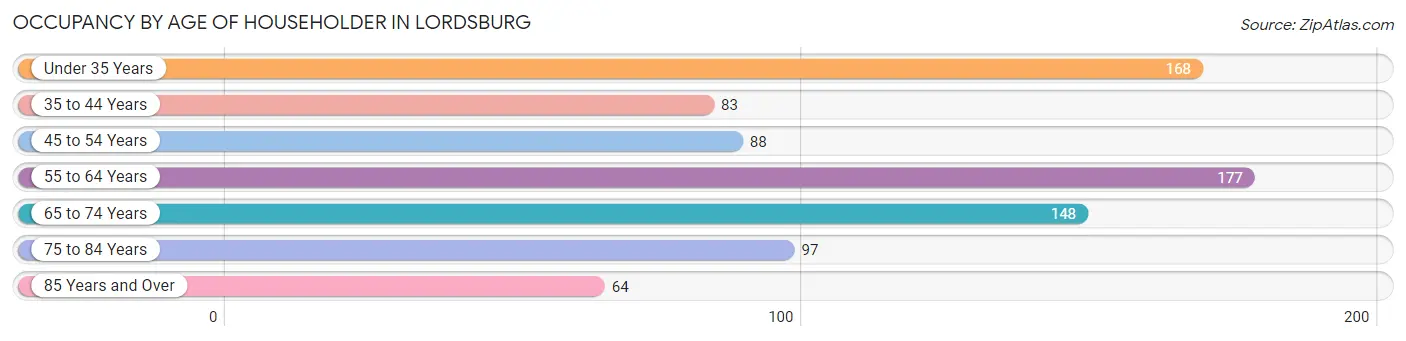
| Age Bracket | # Households | % Households |
| Under 35 Years | 168 | 20.4% |
| 35 to 44 Years | 83 | 10.1% |
| 45 to 54 Years | 88 | 10.7% |
| 55 to 64 Years | 177 | 21.4% |
| 65 to 74 Years | 148 | 17.9% |
| 75 to 84 Years | 97 | 11.8% |
| 85 Years and Over | 64 | 7.8% |
| Total | 825 | 100.0% |
Housing Finances in Lordsburg
Median Income by Occupancy in Lordsburg
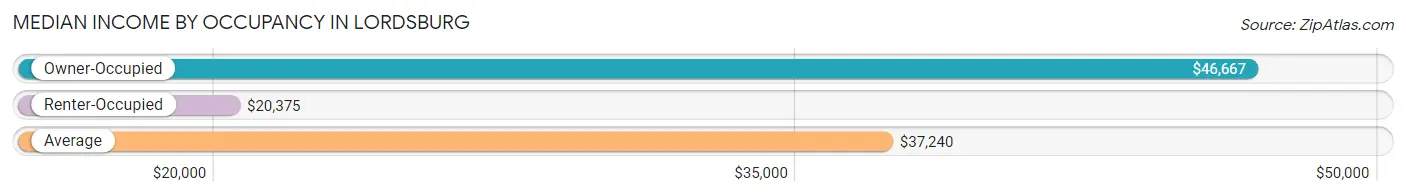
| Occupancy Type | # Households | Median Income |
| Owner-Occupied | 472 (57.2%) | $46,667 |
| Renter-Occupied | 353 (42.8%) | $20,375 |
| Average | 825 (100.0%) | $37,240 |
Occupancy by Householder Income Bracket in Lordsburg
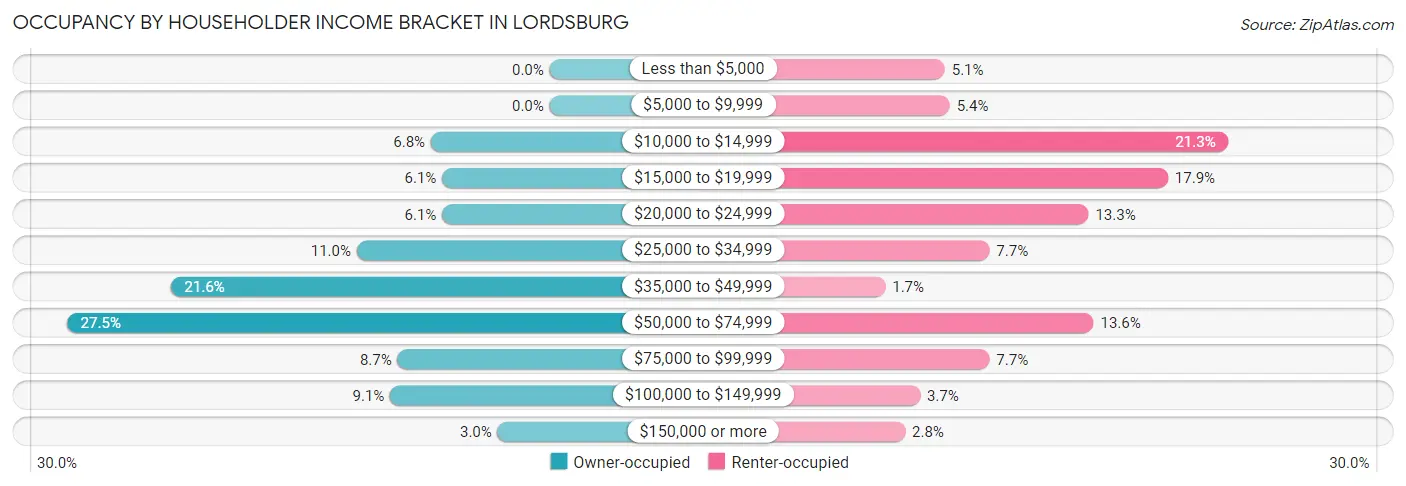
| Income Bracket | Owner-occupied | Renter-occupied |
| Less than $5,000 | 0 (0.0%) | 18 (5.1%) |
| $5,000 to $9,999 | 0 (0.0%) | 19 (5.4%) |
| $10,000 to $14,999 | 32 (6.8%) | 75 (21.2%) |
| $15,000 to $19,999 | 29 (6.1%) | 63 (17.8%) |
| $20,000 to $24,999 | 29 (6.1%) | 47 (13.3%) |
| $25,000 to $34,999 | 52 (11.0%) | 27 (7.6%) |
| $35,000 to $49,999 | 102 (21.6%) | 6 (1.7%) |
| $50,000 to $74,999 | 130 (27.5%) | 48 (13.6%) |
| $75,000 to $99,999 | 41 (8.7%) | 27 (7.6%) |
| $100,000 to $149,999 | 43 (9.1%) | 13 (3.7%) |
| $150,000 or more | 14 (3.0%) | 10 (2.8%) |
| Total | 472 (100.0%) | 353 (100.0%) |
Monthly Housing Cost Tiers in Lordsburg
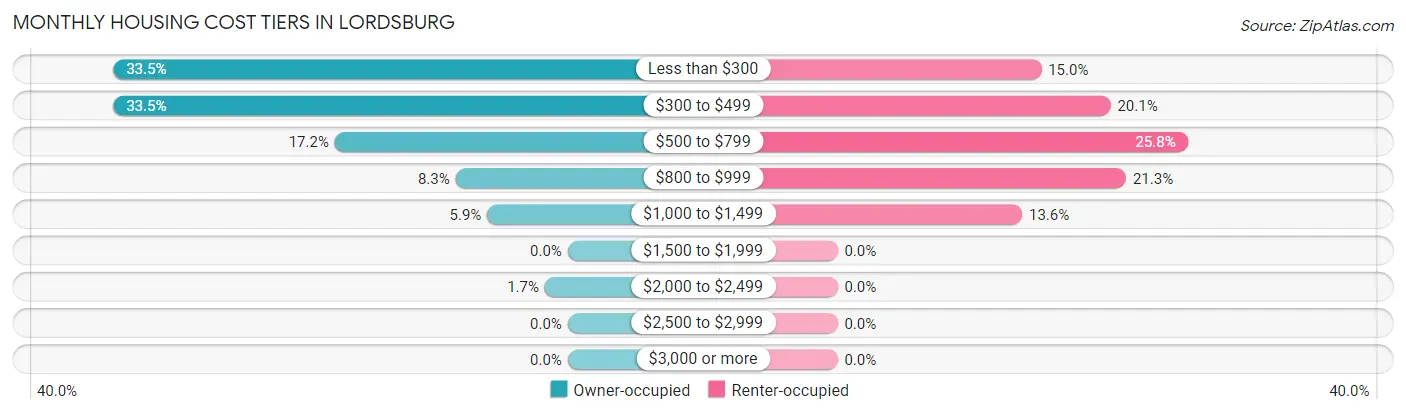
| Monthly Cost | Owner-occupied | Renter-occupied |
| Less than $300 | 158 (33.5%) | 53 (15.0%) |
| $300 to $499 | 158 (33.5%) | 71 (20.1%) |
| $500 to $799 | 81 (17.2%) | 91 (25.8%) |
| $800 to $999 | 39 (8.3%) | 75 (21.2%) |
| $1,000 to $1,499 | 28 (5.9%) | 48 (13.6%) |
| $1,500 to $1,999 | 0 (0.0%) | 0 (0.0%) |
| $2,000 to $2,499 | 8 (1.7%) | 0 (0.0%) |
| $2,500 to $2,999 | 0 (0.0%) | 0 (0.0%) |
| $3,000 or more | 0 (0.0%) | 0 (0.0%) |
| Total | 472 (100.0%) | 353 (100.0%) |
Physical Housing Characteristics in Lordsburg
Housing Structures in Lordsburg
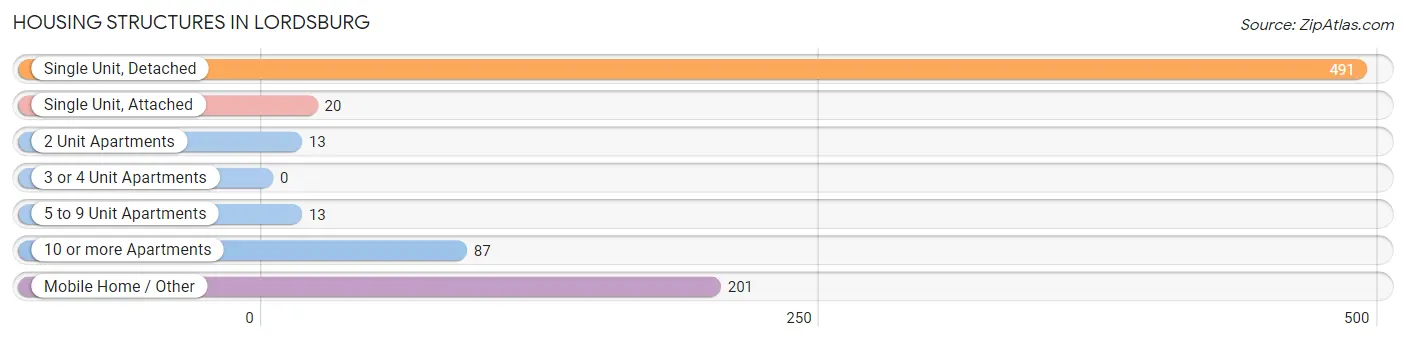
| Structure Type | # Housing Units | % Housing Units |
| Single Unit, Detached | 491 | 59.5% |
| Single Unit, Attached | 20 | 2.4% |
| 2 Unit Apartments | 13 | 1.6% |
| 3 or 4 Unit Apartments | 0 | 0.0% |
| 5 to 9 Unit Apartments | 13 | 1.6% |
| 10 or more Apartments | 87 | 10.5% |
| Mobile Home / Other | 201 | 24.4% |
| Total | 825 | 100.0% |
Housing Structures by Occupancy in Lordsburg
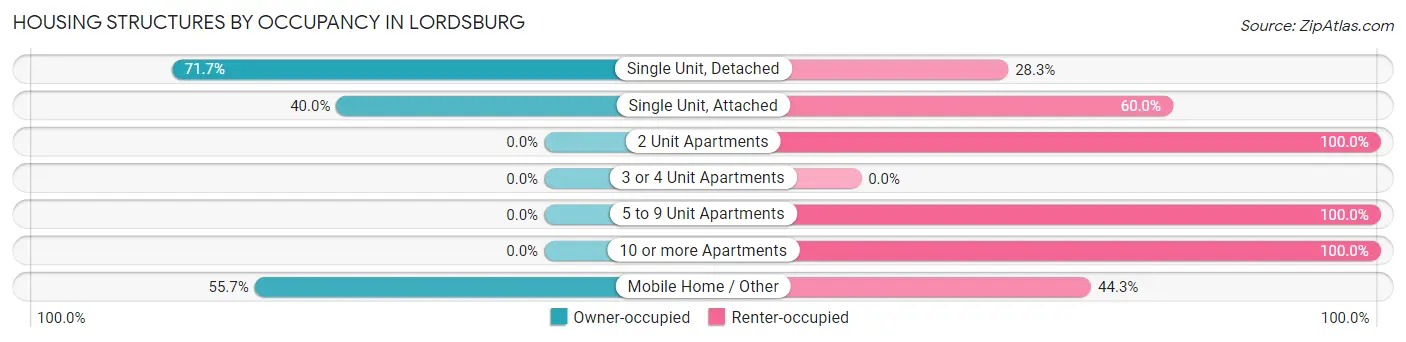
| Structure Type | Owner-occupied | Renter-occupied |
| Single Unit, Detached | 352 (71.7%) | 139 (28.3%) |
| Single Unit, Attached | 8 (40.0%) | 12 (60.0%) |
| 2 Unit Apartments | 0 (0.0%) | 13 (100.0%) |
| 3 or 4 Unit Apartments | 0 (0.0%) | 0 (0.0%) |
| 5 to 9 Unit Apartments | 0 (0.0%) | 13 (100.0%) |
| 10 or more Apartments | 0 (0.0%) | 87 (100.0%) |
| Mobile Home / Other | 112 (55.7%) | 89 (44.3%) |
| Total | 472 (57.2%) | 353 (42.8%) |
Housing Structures by Number of Rooms in Lordsburg
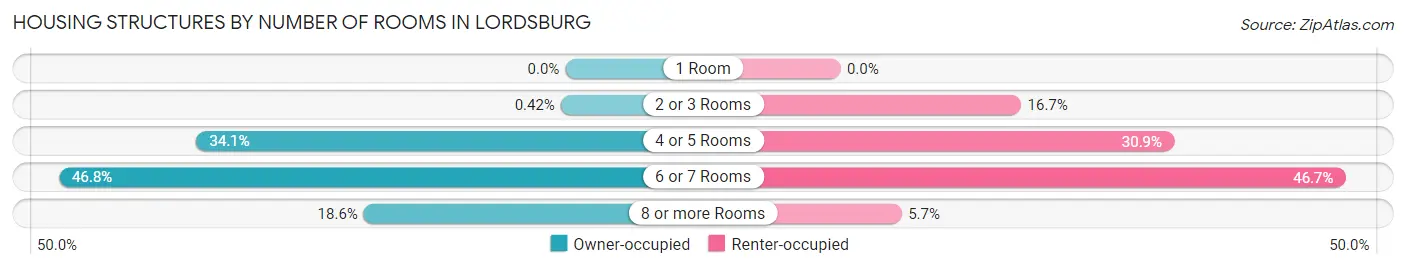
| Number of Rooms | Owner-occupied | Renter-occupied |
| 1 Room | 0 (0.0%) | 0 (0.0%) |
| 2 or 3 Rooms | 2 (0.4%) | 59 (16.7%) |
| 4 or 5 Rooms | 161 (34.1%) | 109 (30.9%) |
| 6 or 7 Rooms | 221 (46.8%) | 165 (46.7%) |
| 8 or more Rooms | 88 (18.6%) | 20 (5.7%) |
| Total | 472 (100.0%) | 353 (100.0%) |
Housing Structure by Heating Type in Lordsburg
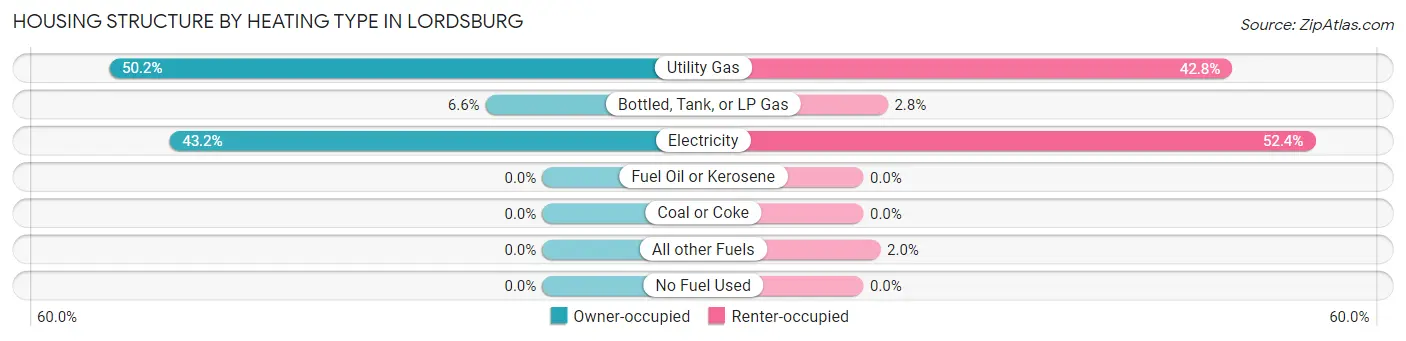
| Heating Type | Owner-occupied | Renter-occupied |
| Utility Gas | 237 (50.2%) | 151 (42.8%) |
| Bottled, Tank, or LP Gas | 31 (6.6%) | 10 (2.8%) |
| Electricity | 204 (43.2%) | 185 (52.4%) |
| Fuel Oil or Kerosene | 0 (0.0%) | 0 (0.0%) |
| Coal or Coke | 0 (0.0%) | 0 (0.0%) |
| All other Fuels | 0 (0.0%) | 7 (2.0%) |
| No Fuel Used | 0 (0.0%) | 0 (0.0%) |
| Total | 472 (100.0%) | 353 (100.0%) |
Household Vehicle Usage in Lordsburg
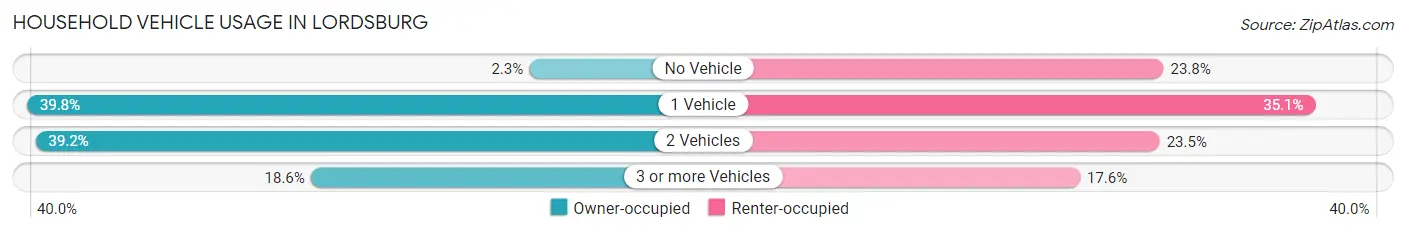
| Vehicles per Household | Owner-occupied | Renter-occupied |
| No Vehicle | 11 (2.3%) | 84 (23.8%) |
| 1 Vehicle | 188 (39.8%) | 124 (35.1%) |
| 2 Vehicles | 185 (39.2%) | 83 (23.5%) |
| 3 or more Vehicles | 88 (18.6%) | 62 (17.6%) |
| Total | 472 (100.0%) | 353 (100.0%) |
Real Estate & Mortgages in Lordsburg
Real Estate and Mortgage Overview in Lordsburg
| Characteristic | Without Mortgage | With Mortgage |
| Housing Units | 372 | 100 |
| Median Property Value | $70,800 | $98,200 |
| Median Household Income | $45,667 | $0 |
| Monthly Housing Costs | $318 | $0 |
| Real Estate Taxes | $366 | $5 |
Property Value by Mortgage Status in Lordsburg
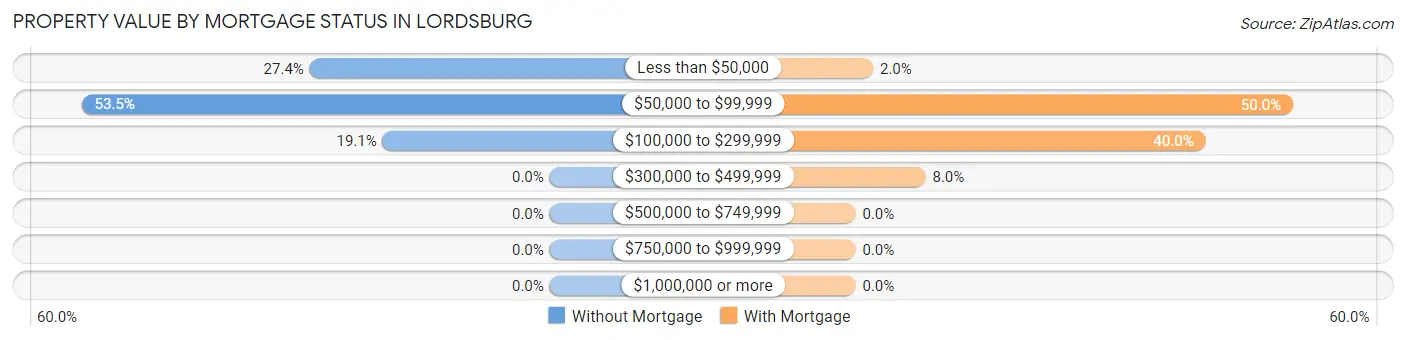
| Property Value | Without Mortgage | With Mortgage |
| Less than $50,000 | 102 (27.4%) | 2 (2.0%) |
| $50,000 to $99,999 | 199 (53.5%) | 50 (50.0%) |
| $100,000 to $299,999 | 71 (19.1%) | 40 (40.0%) |
| $300,000 to $499,999 | 0 (0.0%) | 8 (8.0%) |
| $500,000 to $749,999 | 0 (0.0%) | 0 (0.0%) |
| $750,000 to $999,999 | 0 (0.0%) | 0 (0.0%) |
| $1,000,000 or more | 0 (0.0%) | 0 (0.0%) |
| Total | 372 (100.0%) | 100 (100.0%) |
Household Income by Mortgage Status in Lordsburg
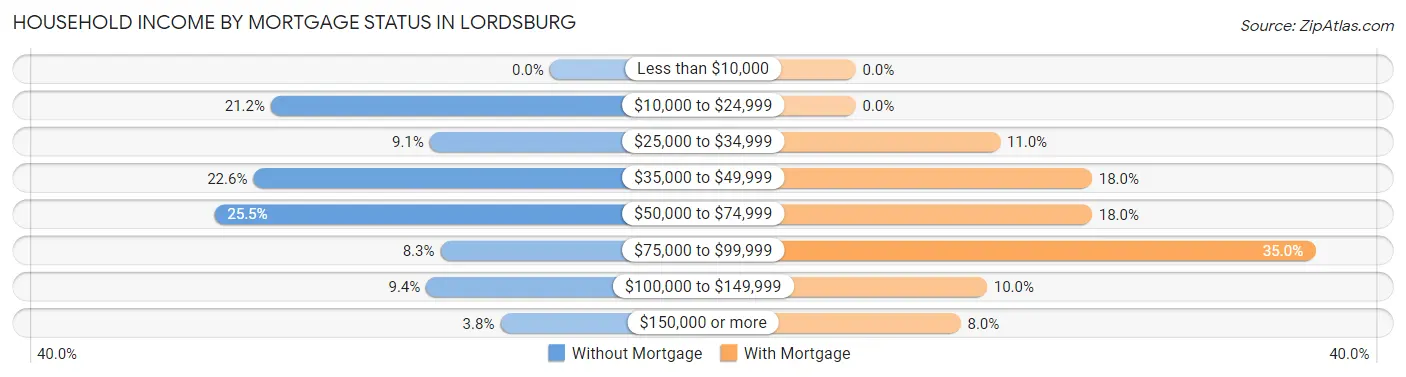
| Household Income | Without Mortgage | With Mortgage |
| Less than $10,000 | 0 (0.0%) | 0 (0.0%) |
| $10,000 to $24,999 | 79 (21.2%) | 0 (0.0%) |
| $25,000 to $34,999 | 34 (9.1%) | 11 (11.0%) |
| $35,000 to $49,999 | 84 (22.6%) | 18 (18.0%) |
| $50,000 to $74,999 | 95 (25.5%) | 18 (18.0%) |
| $75,000 to $99,999 | 31 (8.3%) | 35 (35.0%) |
| $100,000 to $149,999 | 35 (9.4%) | 10 (10.0%) |
| $150,000 or more | 14 (3.8%) | 8 (8.0%) |
| Total | 372 (100.0%) | 100 (100.0%) |
Property Value to Household Income Ratio in Lordsburg
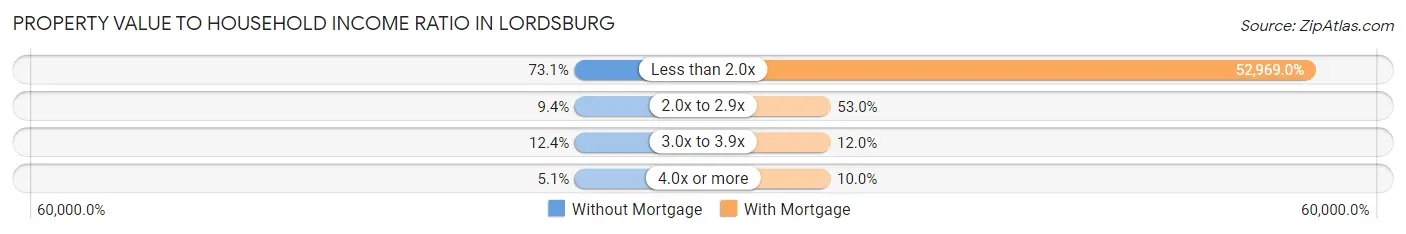
| Value-to-Income Ratio | Without Mortgage | With Mortgage |
| Less than 2.0x | 272 (73.1%) | 52,969 (52,969.0%) |
| 2.0x to 2.9x | 35 (9.4%) | 53 (53.0%) |
| 3.0x to 3.9x | 46 (12.4%) | 12 (12.0%) |
| 4.0x or more | 19 (5.1%) | 10 (10.0%) |
| Total | 372 (100.0%) | 100 (100.0%) |
Real Estate Taxes by Mortgage Status in Lordsburg
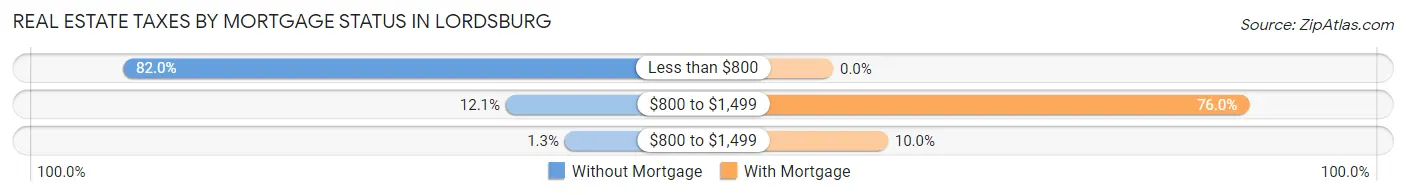
| Property Taxes | Without Mortgage | With Mortgage |
| Less than $800 | 305 (82.0%) | 0 (0.0%) |
| $800 to $1,499 | 45 (12.1%) | 76 (76.0%) |
| $800 to $1,499 | 5 (1.3%) | 10 (10.0%) |
| Total | 372 (100.0%) | 100 (100.0%) |
Health & Disability in Lordsburg
Health Insurance Coverage by Age in Lordsburg
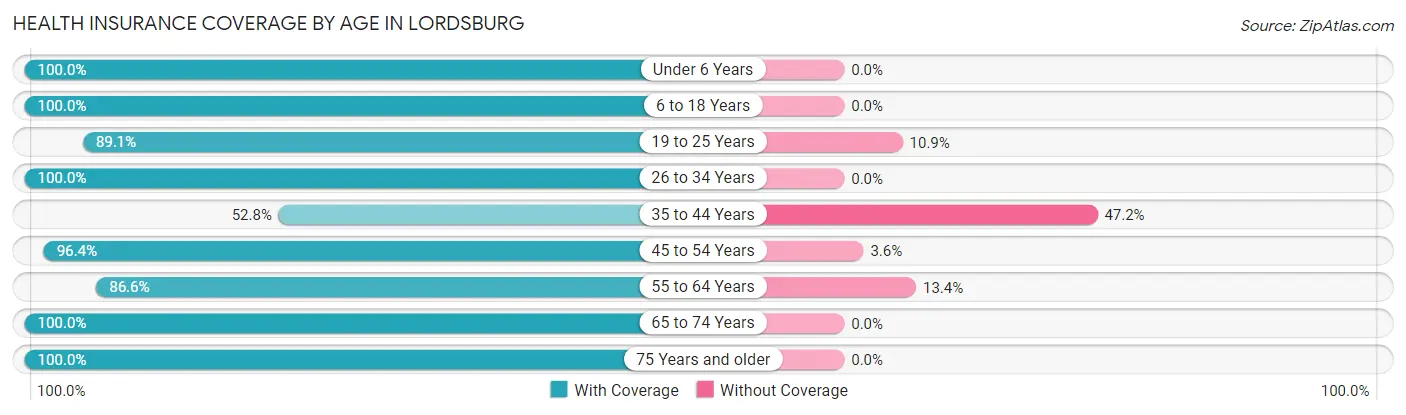
| Age Bracket | With Coverage | Without Coverage |
| Under 6 Years | 186 (100.0%) | 0 (0.0%) |
| 6 to 18 Years | 317 (100.0%) | 0 (0.0%) |
| 19 to 25 Years | 123 (89.1%) | 15 (10.9%) |
| 26 to 34 Years | 318 (100.0%) | 0 (0.0%) |
| 35 to 44 Years | 123 (52.8%) | 110 (47.2%) |
| 45 to 54 Years | 135 (96.4%) | 5 (3.6%) |
| 55 to 64 Years | 246 (86.6%) | 38 (13.4%) |
| 65 to 74 Years | 238 (100.0%) | 0 (0.0%) |
| 75 Years and older | 193 (100.0%) | 0 (0.0%) |
| Total | 1,879 (91.8%) | 168 (8.2%) |
Health Insurance Coverage by Citizenship Status in Lordsburg
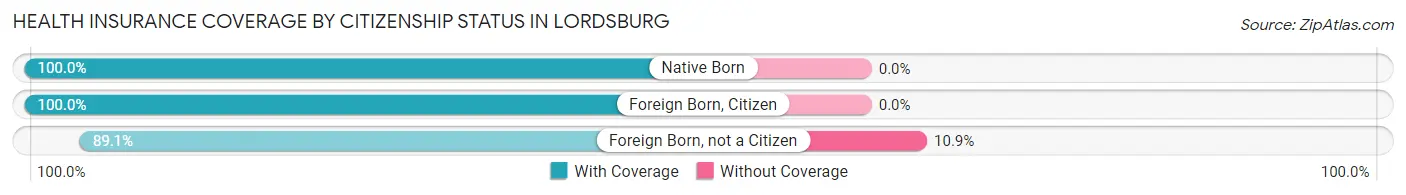
| Citizenship Status | With Coverage | Without Coverage |
| Native Born | 186 (100.0%) | 0 (0.0%) |
| Foreign Born, Citizen | 317 (100.0%) | 0 (0.0%) |
| Foreign Born, not a Citizen | 123 (89.1%) | 15 (10.9%) |
Health Insurance Coverage by Household Income in Lordsburg
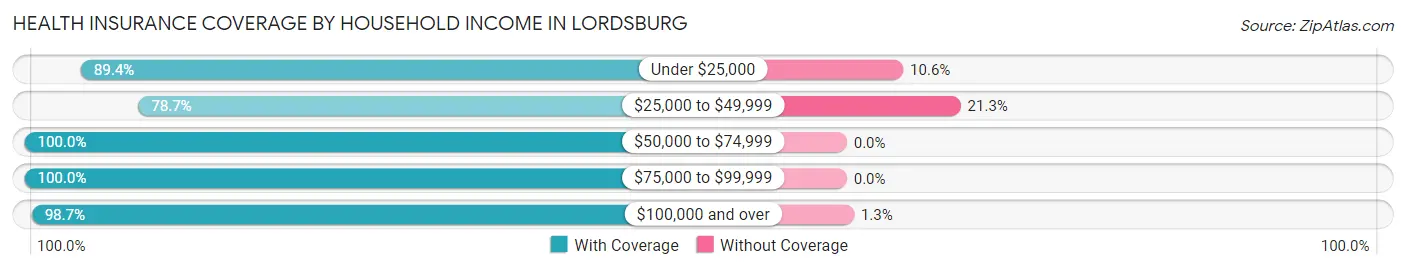
| Household Income | With Coverage | Without Coverage |
| Under $25,000 | 483 (89.4%) | 57 (10.6%) |
| $25,000 to $49,999 | 391 (78.7%) | 106 (21.3%) |
| $50,000 to $74,999 | 478 (100.0%) | 0 (0.0%) |
| $75,000 to $99,999 | 159 (100.0%) | 0 (0.0%) |
| $100,000 and over | 368 (98.7%) | 5 (1.3%) |
Public vs Private Health Insurance Coverage by Age in Lordsburg
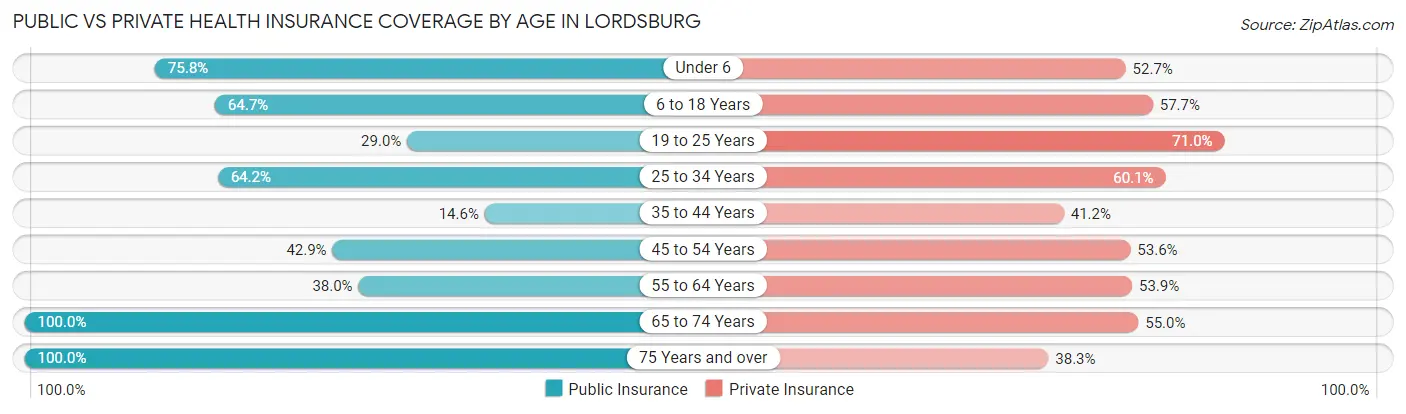
| Age Bracket | Public Insurance | Private Insurance |
| Under 6 | 141 (75.8%) | 98 (52.7%) |
| 6 to 18 Years | 205 (64.7%) | 183 (57.7%) |
| 19 to 25 Years | 40 (29.0%) | 98 (71.0%) |
| 25 to 34 Years | 204 (64.1%) | 191 (60.1%) |
| 35 to 44 Years | 34 (14.6%) | 96 (41.2%) |
| 45 to 54 Years | 60 (42.9%) | 75 (53.6%) |
| 55 to 64 Years | 108 (38.0%) | 153 (53.9%) |
| 65 to 74 Years | 238 (100.0%) | 131 (55.0%) |
| 75 Years and over | 193 (100.0%) | 74 (38.3%) |
| Total | 1,223 (59.8%) | 1,099 (53.7%) |
Disability Status by Sex by Age in Lordsburg
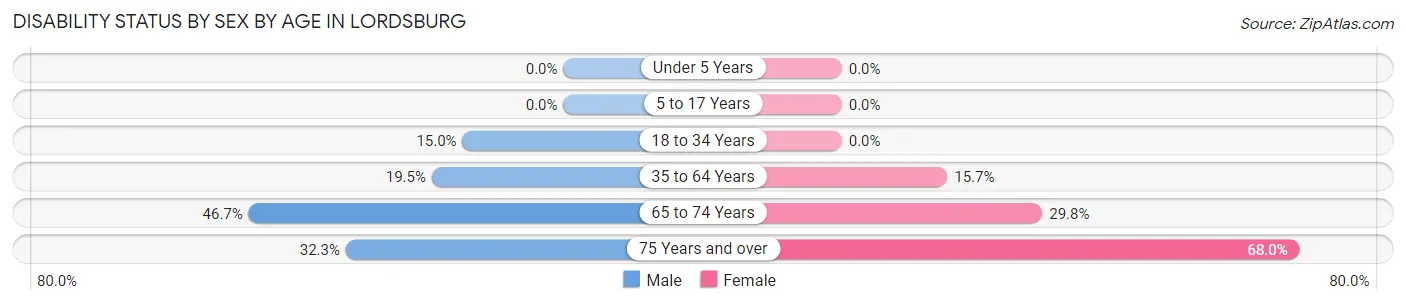
| Age Bracket | Male | Female |
| Under 5 Years | 0 (0.0%) | 0 (0.0%) |
| 5 to 17 Years | 0 (0.0%) | 0 (0.0%) |
| 18 to 34 Years | 43 (15.0%) | 0 (0.0%) |
| 35 to 64 Years | 76 (19.5%) | 42 (15.7%) |
| 65 to 74 Years | 50 (46.7%) | 39 (29.8%) |
| 75 Years and over | 21 (32.3%) | 87 (68.0%) |
Disability Class by Sex by Age in Lordsburg
Disability Class: Hearing Difficulty
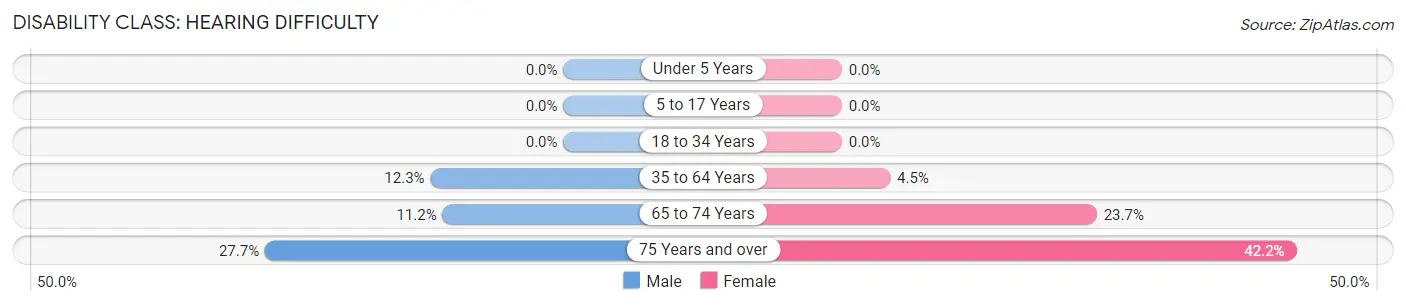
| Age Bracket | Male | Female |
| Under 5 Years | 0 (0.0%) | 0 (0.0%) |
| 5 to 17 Years | 0 (0.0%) | 0 (0.0%) |
| 18 to 34 Years | 0 (0.0%) | 0 (0.0%) |
| 35 to 64 Years | 48 (12.3%) | 12 (4.5%) |
| 65 to 74 Years | 12 (11.2%) | 31 (23.7%) |
| 75 Years and over | 18 (27.7%) | 54 (42.2%) |
Disability Class: Vision Difficulty
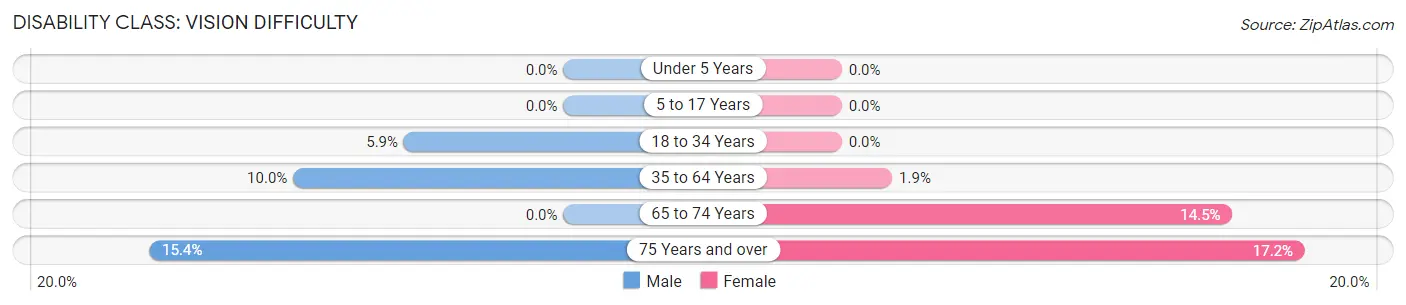
| Age Bracket | Male | Female |
| Under 5 Years | 0 (0.0%) | 0 (0.0%) |
| 5 to 17 Years | 0 (0.0%) | 0 (0.0%) |
| 18 to 34 Years | 17 (5.9%) | 0 (0.0%) |
| 35 to 64 Years | 39 (10.0%) | 5 (1.9%) |
| 65 to 74 Years | 0 (0.0%) | 19 (14.5%) |
| 75 Years and over | 10 (15.4%) | 22 (17.2%) |
Disability Class: Cognitive Difficulty
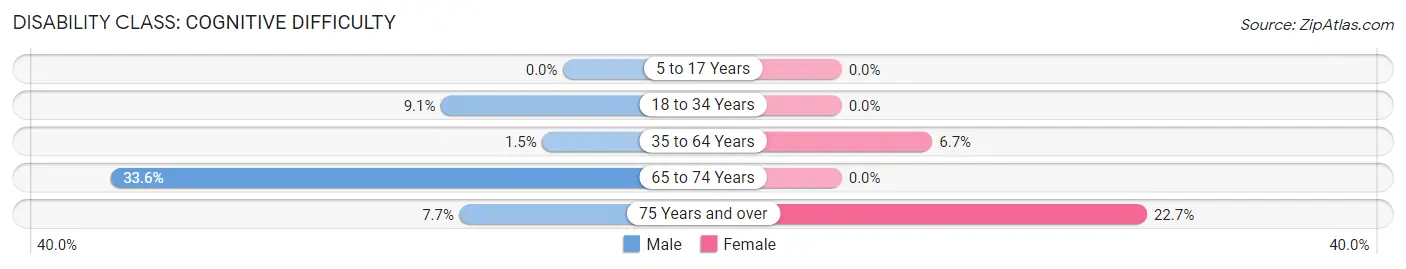
| Age Bracket | Male | Female |
| 5 to 17 Years | 0 (0.0%) | 0 (0.0%) |
| 18 to 34 Years | 26 (9.1%) | 0 (0.0%) |
| 35 to 64 Years | 6 (1.5%) | 18 (6.7%) |
| 65 to 74 Years | 36 (33.6%) | 0 (0.0%) |
| 75 Years and over | 5 (7.7%) | 29 (22.7%) |
Disability Class: Ambulatory Difficulty
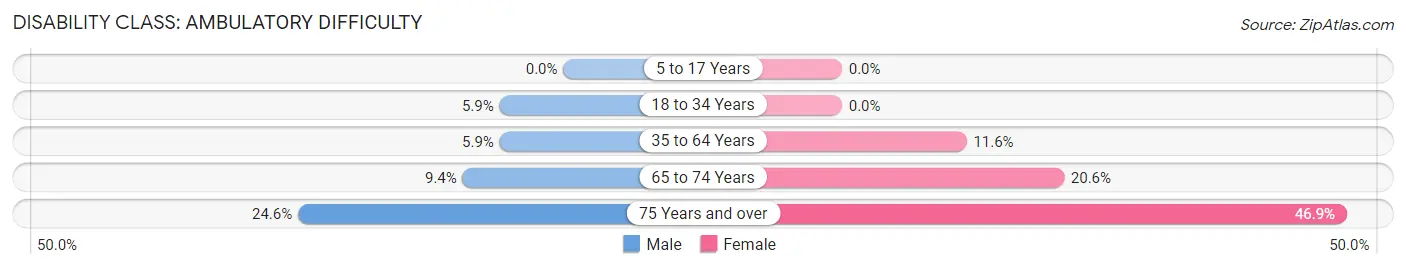
| Age Bracket | Male | Female |
| 5 to 17 Years | 0 (0.0%) | 0 (0.0%) |
| 18 to 34 Years | 17 (5.9%) | 0 (0.0%) |
| 35 to 64 Years | 23 (5.9%) | 31 (11.6%) |
| 65 to 74 Years | 10 (9.3%) | 27 (20.6%) |
| 75 Years and over | 16 (24.6%) | 60 (46.9%) |
Disability Class: Self-Care Difficulty
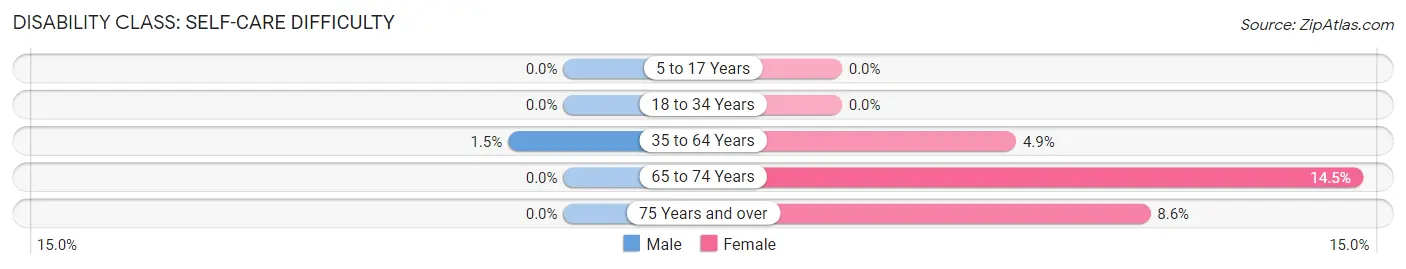
| Age Bracket | Male | Female |
| 5 to 17 Years | 0 (0.0%) | 0 (0.0%) |
| 18 to 34 Years | 0 (0.0%) | 0 (0.0%) |
| 35 to 64 Years | 6 (1.5%) | 13 (4.9%) |
| 65 to 74 Years | 0 (0.0%) | 19 (14.5%) |
| 75 Years and over | 0 (0.0%) | 11 (8.6%) |
Technology Access in Lordsburg
Computing Device Access in Lordsburg
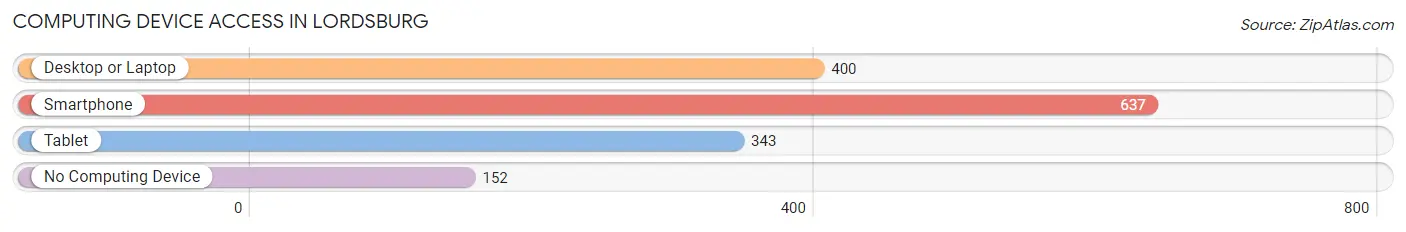
| Device Type | # Households | % Households |
| Desktop or Laptop | 400 | 48.5% |
| Smartphone | 637 | 77.2% |
| Tablet | 343 | 41.6% |
| No Computing Device | 152 | 18.4% |
| Total | 825 | 100.0% |
Internet Access in Lordsburg
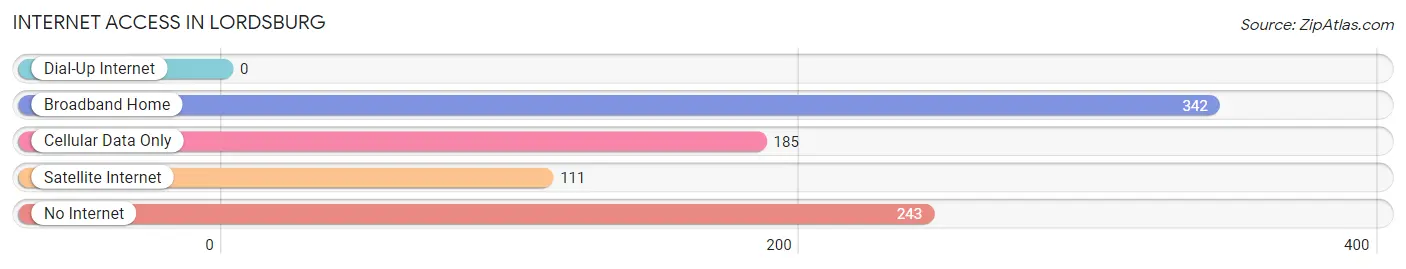
| Internet Type | # Households | % Households |
| Dial-Up Internet | 0 | 0.0% |
| Broadband Home | 342 | 41.4% |
| Cellular Data Only | 185 | 22.4% |
| Satellite Internet | 111 | 13.5% |
| No Internet | 243 | 29.4% |
| Total | 825 | 100.0% |
Lordsburg Summary
Lordsburg is a city located in Hidalgo County, New Mexico, United States. It is the county seat of Hidalgo County and is located in the southwestern corner of the state. The population was 2,379 at the 2010 census.
History
Lordsburg was founded in 1880 by the Lordsburg Town and Land Company. The company was formed by a group of investors from Lordsburg, California, who were looking to capitalize on the area's potential for growth. The town was named after the Lordsburg Mining Company, which had been established in the area in 1879.
The town quickly grew and by 1882, it had a population of over 500. The town was incorporated in 1883 and by 1890, it had a population of 1,000.
The town was a major stop on the Southern Pacific Railroad and was a popular destination for travelers. The town was also a major center for the mining industry, with several large mines in the area.
In the early 1900s, the town was a major center for the cattle industry. The town was also a major stop on the Butterfield Overland Mail route.
Geography
Lordsburg is located in the southwestern corner of New Mexico, in Hidalgo County. It is situated at an elevation of 4,000 feet (1,219 m) above sea level. The city is located at the intersection of Interstate 10 and U.S. Route 70.
The city is located in the Chihuahuan Desert and is surrounded by mountains. The nearby Animas Mountains are to the north, the Peloncillo Mountains are to the east, and the Florida Mountains are to the south.
Economy
Lordsburg is a major center for the mining industry. The town is home to several large mines, including the Lordsburg Mine, the Lordsburg Copper Mine, and the Lordsburg Gold Mine.
The town is also a major center for the cattle industry. The town is home to several large ranches, including the Lordsburg Ranch, the Lordsburg Cattle Company, and the Lordsburg Cattle Company.
The town is also a major stop on the Southern Pacific Railroad. The town is home to several large freight yards, including the Lordsburg Freight Yard and the Lordsburg Rail Yard.
Demographics
As of the 2010 census, there were 2,379 people, 890 households, and 590 families residing in the city. The population density was 1,092.3 people per square mile (422.2/km2). There were 1,039 housing units at an average density of 476.3 per square mile (184.2/km2). The racial makeup of the city was 75.2% White, 0.7% African American, 1.2% Native American, 0.2% Asian, 0.1% Pacific Islander, 20.2% from other races, and 2.6% from two or more races. Hispanic or Latino of any race were 57.2% of the population.
There were 890 households, out of which 33.2% had children under the age of 18 living with them, 44.2% were married couples living together, 16.2% had a female householder with no husband present, and 33.2% were non-families. 28.2% of all households were made up of individuals, and 12.2% had someone living alone who was 65 years of age or older. The average household size was 2.60 and the average family size was 3.17.
In the city, the population was spread out, with 28.2% under the age of 18, 8.2% from 18 to 24, 25.2% from 25 to 44, 24.2% from 45 to 64, and 14.2% who were 65 years of age or older. The median age was 36 years. For every 100 females, there were 97.2 males. For every 100 females age 18 and over, there were 94.2 males.
The median income for a household in the city was $25,938, and the median income for a family was $30,000. Males had a median income of $25,000 versus $19,375 for females. The per capita income for the city was $13,945. About 17.2% of families and 20.2% of the population were below the poverty line, including 25.2% of those under age 18 and 16.2% of those age 65 or over.
Common Questions
What is Per Capita Income in Lordsburg?
Per Capita income in Lordsburg is $21,713.
What is the Median Family Income in Lordsburg?
Median Family Income in Lordsburg is $57,639.
What is the Median Household income in Lordsburg?
Median Household Income in Lordsburg is $37,240.
What is Income or Wage Gap in Lordsburg?
Income or Wage Gap in Lordsburg is 19.9%.
Women in Lordsburg earn 80.1 cents for every dollar earned by a man.
What is Inequality or Gini Index in Lordsburg?
Inequality or Gini Index in Lordsburg is 0.42.
What is the Total Population of Lordsburg?
Total Population of Lordsburg is 2,114.
What is the Total Male Population of Lordsburg?
Total Male Population of Lordsburg is 1,081.
What is the Total Female Population of Lordsburg?
Total Female Population of Lordsburg is 1,033.
What is the Ratio of Males per 100 Females in Lordsburg?
There are 104.65 Males per 100 Females in Lordsburg.
What is the Ratio of Females per 100 Males in Lordsburg?
There are 95.56 Females per 100 Males in Lordsburg.
What is the Median Population Age in Lordsburg?
Median Population Age in Lordsburg is 37.5 Years.
What is the Average Family Size in Lordsburg
Average Family Size in Lordsburg is 3.6 People.
What is the Average Household Size in Lordsburg
Average Household Size in Lordsburg is 2.5 People.
How Large is the Labor Force in Lordsburg?
There are 735 People in the Labor Forcein in Lordsburg.
What is the Percentage of People in the Labor Force in Lordsburg?
44.6% of People are in the Labor Force in Lordsburg.
What is the Unemployment Rate in Lordsburg?
Unemployment Rate in Lordsburg is 5.2%.