Torreon CDP Sandoval County, NM Map & Demographics
Torreon CDP Sandoval County Overview
$11,986
PER CAPITA INCOME
$39,000
AVG FAMILY INCOME
26.9%
WAGE / INCOME GAP [ % ]
73.1¢/ $1
WAGE / INCOME GAP [ $ ]
0.57
INEQUALITY / GINI INDEX
489
TOTAL POPULATION
275
MALE POPULATION
214
FEMALE POPULATION
128.50
MALES / 100 FEMALES
77.82
FEMALES / 100 MALES
26.8
MEDIAN AGE
5.5
AVG FAMILY SIZE
4.7
AVG HOUSEHOLD SIZE
172
LABOR FORCE [ PEOPLE ]
47.8%
PERCENT IN LABOR FORCE
10.5%
UNEMPLOYMENT RATE
Income in Torreon CDP Sandoval County
Income Overview in Torreon CDP Sandoval County
| Characteristic | Number | Measure |
| Per Capita Income | 489 | $11,986 |
| Median Family Income | 62 | $39,000 |
| Mean Family Income | 62 | $56,248 |
| Median Household Income | 102 | $0 |
| Mean Household Income | 102 | $45,431 |
| Income Deficit | 62 | $0 |
| Wage / Income Gap (%) | 489 | 26.94% |
| Wage / Income Gap ($) | 489 | 73.06¢ per $1 |
| Gini / Inequality Index | 489 | 0.57 |
Earnings by Sex in Torreon CDP Sandoval County
Average Earnings in Torreon CDP Sandoval County are $31,094, $34,219 for men and $25,000 for women, a difference of 26.9%.
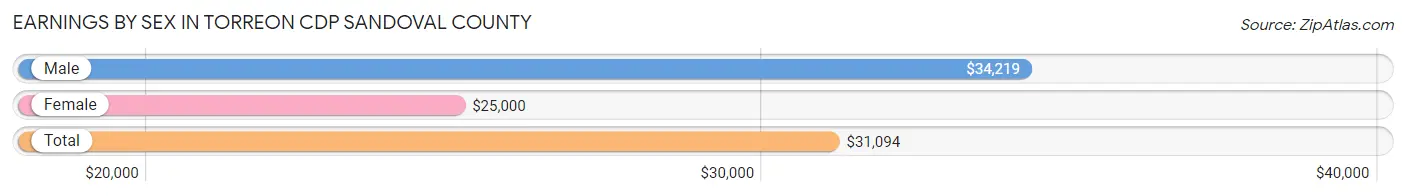
| Sex | Number | Average Earnings |
| Male | 99 (58.6%) | $34,219 |
| Female | 70 (41.4%) | $25,000 |
| Total | 169 (100.0%) | $31,094 |
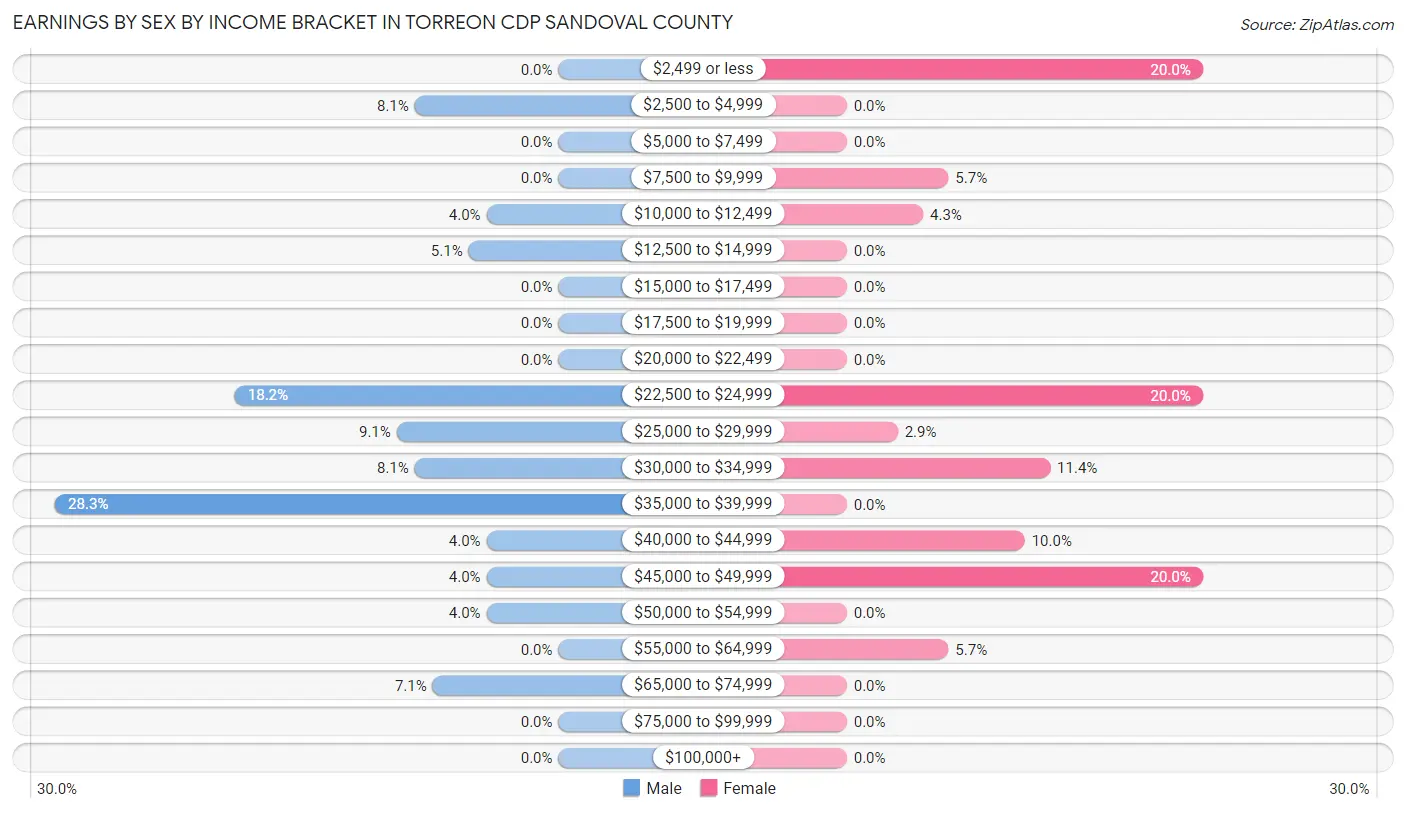
Earnings by Sex by Income Bracket in Torreon CDP Sandoval County
The most common earnings brackets in Torreon CDP Sandoval County are $35,000 to $39,999 for men (28 | 28.3%) and $2,499 or less for women (14 | 20.0%).
| Income | Male | Female |
| $2,499 or less | 0 (0.0%) | 14 (20.0%) |
| $2,500 to $4,999 | 8 (8.1%) | 0 (0.0%) |
| $5,000 to $7,499 | 0 (0.0%) | 0 (0.0%) |
| $7,500 to $9,999 | 0 (0.0%) | 4 (5.7%) |
| $10,000 to $12,499 | 4 (4.0%) | 3 (4.3%) |
| $12,500 to $14,999 | 5 (5.1%) | 0 (0.0%) |
| $15,000 to $17,499 | 0 (0.0%) | 0 (0.0%) |
| $17,500 to $19,999 | 0 (0.0%) | 0 (0.0%) |
| $20,000 to $22,499 | 0 (0.0%) | 0 (0.0%) |
| $22,500 to $24,999 | 18 (18.2%) | 14 (20.0%) |
| $25,000 to $29,999 | 9 (9.1%) | 2 (2.9%) |
| $30,000 to $34,999 | 8 (8.1%) | 8 (11.4%) |
| $35,000 to $39,999 | 28 (28.3%) | 0 (0.0%) |
| $40,000 to $44,999 | 4 (4.0%) | 7 (10.0%) |
| $45,000 to $49,999 | 4 (4.0%) | 14 (20.0%) |
| $50,000 to $54,999 | 4 (4.0%) | 0 (0.0%) |
| $55,000 to $64,999 | 0 (0.0%) | 4 (5.7%) |
| $65,000 to $74,999 | 7 (7.1%) | 0 (0.0%) |
| $75,000 to $99,999 | 0 (0.0%) | 0 (0.0%) |
| $100,000+ | 0 (0.0%) | 0 (0.0%) |
| Total | 99 (100.0%) | 70 (100.0%) |
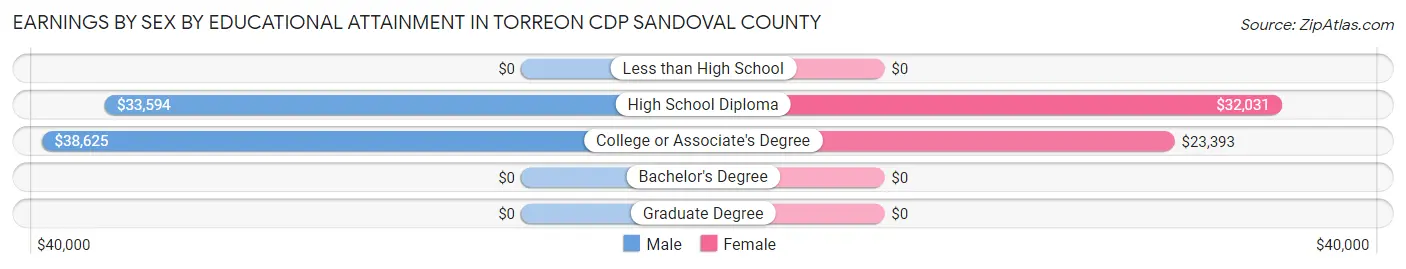
Earnings by Sex by Educational Attainment in Torreon CDP Sandoval County
Average earnings in Torreon CDP Sandoval County are $35,000 for men and $30,313 for women, a difference of 13.4%. Men with an educational attainment of college or associate's degree enjoy the highest average annual earnings of $38,625, while those with high school diploma education earn the least with $33,594. Women with an educational attainment of high school diploma earn the most with the average annual earnings of $32,031, while those with college or associate's degree education have the smallest earnings of $23,393.
| Educational Attainment | Male Income | Female Income |
| Less than High School | - | - |
| High School Diploma | $33,594 | $32,031 |
| College or Associate's Degree | $38,625 | $23,393 |
| Bachelor's Degree | - | - |
| Graduate Degree | - | - |
| Total | $35,000 | $30,313 |
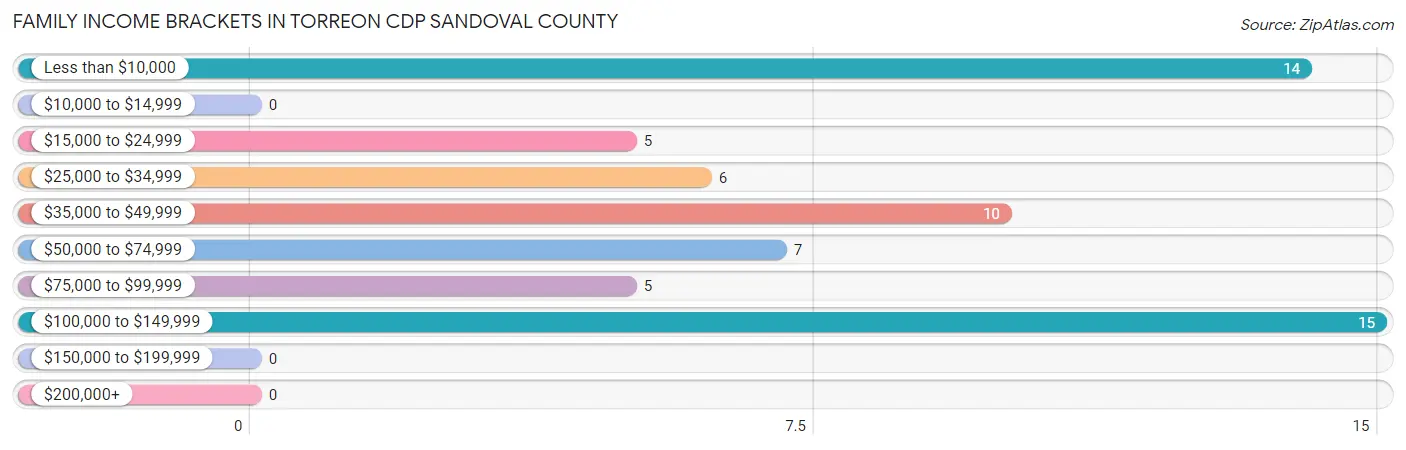
Family Income in Torreon CDP Sandoval County
Family Income Brackets in Torreon CDP Sandoval County
According to the Torreon CDP Sandoval County family income data, there are 15 families falling into the $100,000 to $149,999 income range, which is the most common income bracket and makes up 24.2% of all families.
| Income Bracket | # Families | % Families |
| Less than $10,000 | 14 | 22.6% |
| $10,000 to $14,999 | 0 | 0.0% |
| $15,000 to $24,999 | 5 | 8.1% |
| $25,000 to $34,999 | 6 | 9.7% |
| $35,000 to $49,999 | 10 | 16.1% |
| $50,000 to $74,999 | 7 | 11.3% |
| $75,000 to $99,999 | 5 | 8.1% |
| $100,000 to $149,999 | 15 | 24.2% |
| $150,000 to $199,999 | 0 | 0.0% |
| $200,000+ | 0 | 0.0% |
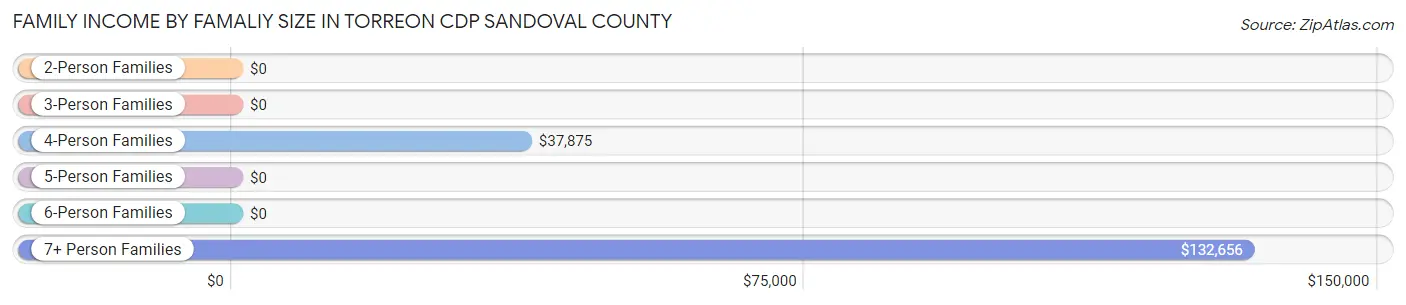
Family Income by Famaliy Size in Torreon CDP Sandoval County
7+ person families (15 | 24.2%) account for the highest median family income in Torreon CDP Sandoval County with $132,656 per family, while 7+ person families (15 | 24.2%) have the highest median income of $18,951 per family member.
| Income Bracket | # Families | Median Income |
| 2-Person Families | 2 (3.2%) | $0 |
| 3-Person Families | 18 (29.0%) | $0 |
| 4-Person Families | 23 (37.1%) | $37,875 |
| 5-Person Families | 4 (6.5%) | $0 |
| 6-Person Families | 0 (0.0%) | $0 |
| 7+ Person Families | 15 (24.2%) | $132,656 |
| Total | 62 (100.0%) | $39,000 |
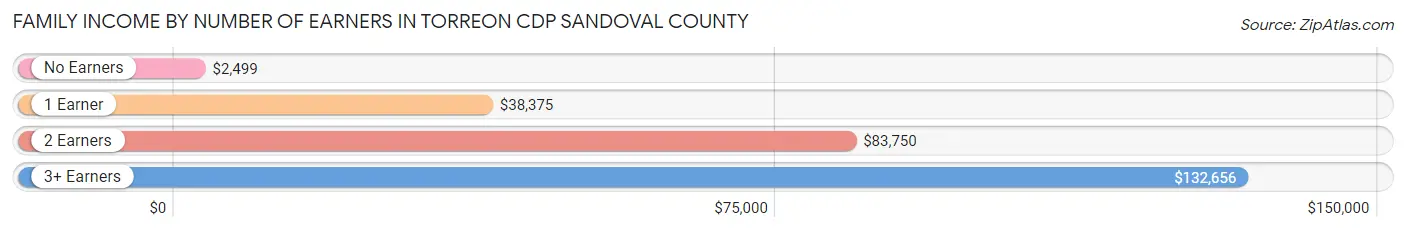
Family Income by Number of Earners in Torreon CDP Sandoval County
The median family income in Torreon CDP Sandoval County is $39,000, with families comprising 3+ earners (15) having the highest median family income of $132,656, while families with no earners (15) have the lowest median family income of $2,499, accounting for 24.2% and 24.2% of families, respectively.
| Number of Earners | # Families | Median Income |
| No Earners | 15 (24.2%) | $2,499 |
| 1 Earner | 19 (30.6%) | $38,375 |
| 2 Earners | 13 (21.0%) | $83,750 |
| 3+ Earners | 15 (24.2%) | $132,656 |
| Total | 62 (100.0%) | $39,000 |
Household Income in Torreon CDP Sandoval County
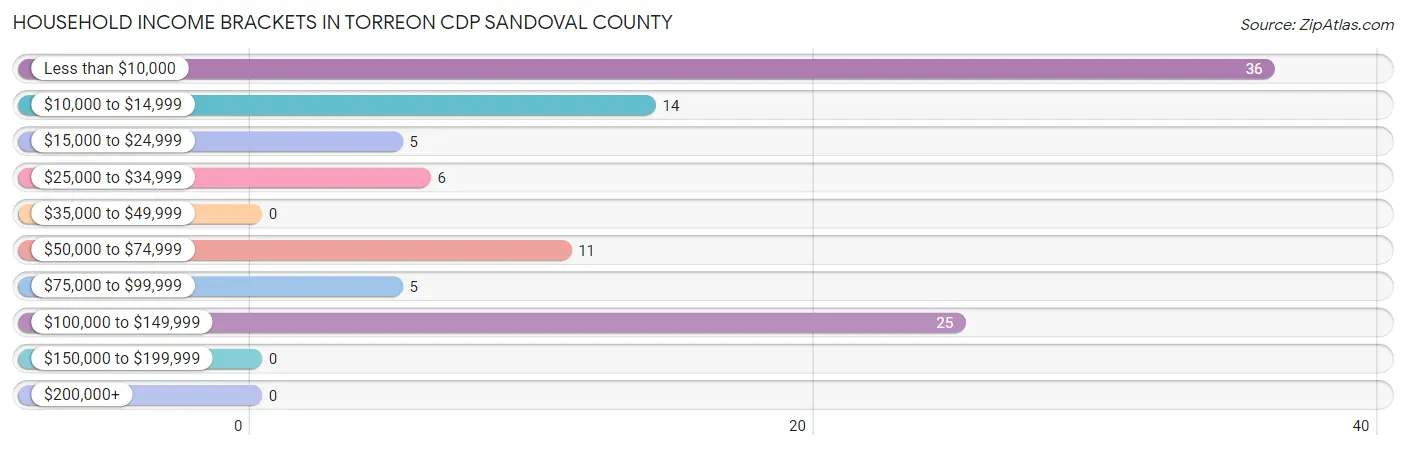
Household Income Brackets in Torreon CDP Sandoval County
With 36 households falling in the category, the less than $10,000 income range is the most frequent in Torreon CDP Sandoval County, accounting for 35.3% of all households.
| Income Bracket | # Households | % Households |
| Less than $10,000 | 36 | 35.3% |
| $10,000 to $14,999 | 14 | 13.7% |
| $15,000 to $24,999 | 5 | 4.9% |
| $25,000 to $34,999 | 6 | 5.9% |
| $35,000 to $49,999 | 0 | 0.0% |
| $50,000 to $74,999 | 11 | 10.8% |
| $75,000 to $99,999 | 5 | 4.9% |
| $100,000 to $149,999 | 25 | 24.5% |
| $150,000 to $199,999 | 0 | 0.0% |
| $200,000+ | 0 | 0.0% |
Household Income by Householder Age in Torreon CDP Sandoval County
| Income Bracket | # Households | Median Income |
| 15 to 24 Years | 0 (0.0%) | $0 |
| 25 to 44 Years | 33 (32.4%) | $0 |
| 45 to 64 Years | 58 (56.9%) | $0 |
| 65+ Years | 11 (10.8%) | $0 |
| Total | 102 (100.0%) | $0 |
Poverty in Torreon CDP Sandoval County
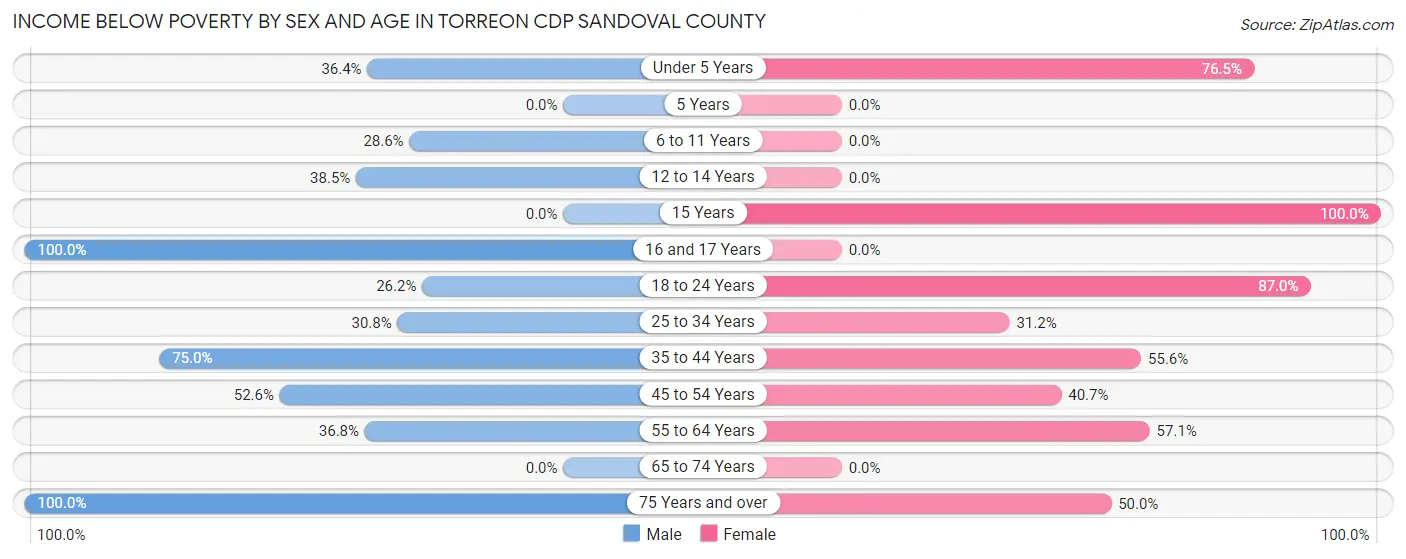
Income Below Poverty by Sex and Age in Torreon CDP Sandoval County
With 37.1% poverty level for males and 47.4% for females among the residents of Torreon CDP Sandoval County, 16 and 17 year old males and 15 year old females are the most vulnerable to poverty, with 6 males (100.0%) and 4 females (100.0%) in their respective age groups living below the poverty level.
| Age Bracket | Male | Female |
| Under 5 Years | 12 (36.4%) | 13 (76.5%) |
| 5 Years | 0 (0.0%) | 0 (0.0%) |
| 6 to 11 Years | 6 (28.6%) | 0 (0.0%) |
| 12 to 14 Years | 5 (38.5%) | 0 (0.0%) |
| 15 Years | 0 (0.0%) | 4 (100.0%) |
| 16 and 17 Years | 6 (100.0%) | 0 (0.0%) |
| 18 to 24 Years | 11 (26.2%) | 20 (87.0%) |
| 25 to 34 Years | 24 (30.8%) | 19 (31.1%) |
| 35 to 44 Years | 12 (75.0%) | 10 (55.6%) |
| 45 to 54 Years | 10 (52.6%) | 11 (40.7%) |
| 55 to 64 Years | 7 (36.8%) | 20 (57.1%) |
| 65 to 74 Years | 0 (0.0%) | 0 (0.0%) |
| 75 Years and over | 3 (100.0%) | 4 (50.0%) |
| Total | 96 (37.1%) | 101 (47.4%) |
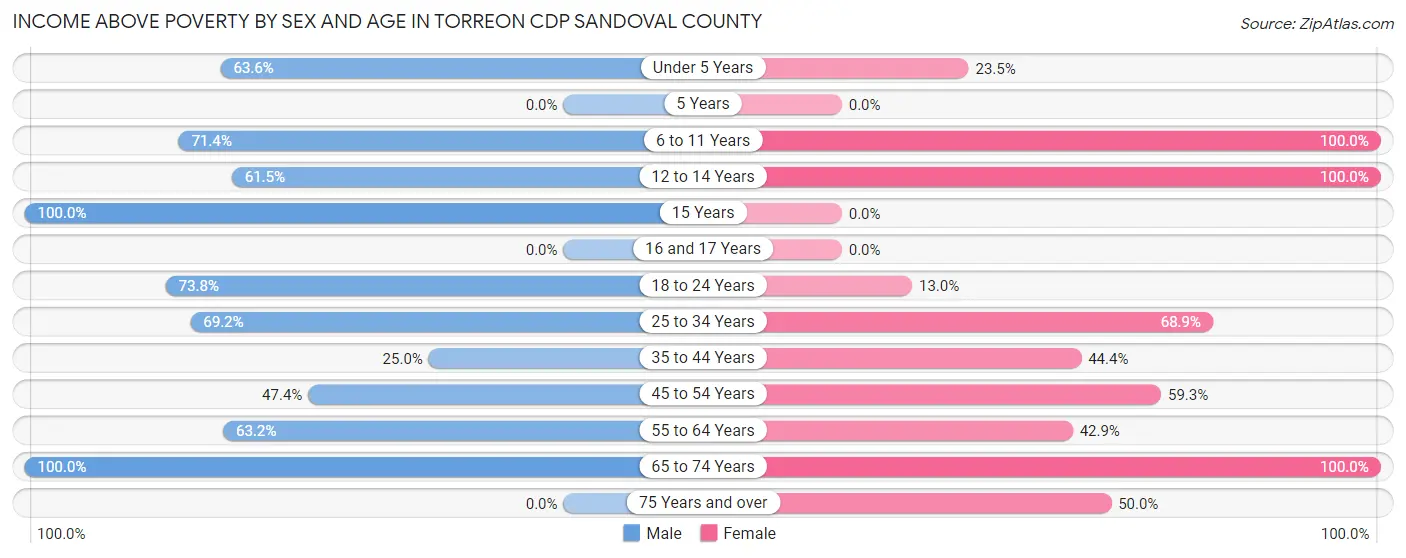
Income Above Poverty by Sex and Age in Torreon CDP Sandoval County
According to the poverty statistics in Torreon CDP Sandoval County, males aged 15 years and females aged 6 to 11 years are the age groups that are most secure financially, with 100.0% of males and 100.0% of females in these age groups living above the poverty line.
| Age Bracket | Male | Female |
| Under 5 Years | 21 (63.6%) | 4 (23.5%) |
| 5 Years | 0 (0.0%) | 0 (0.0%) |
| 6 to 11 Years | 15 (71.4%) | 11 (100.0%) |
| 12 to 14 Years | 8 (61.5%) | 7 (100.0%) |
| 15 Years | 6 (100.0%) | 0 (0.0%) |
| 16 and 17 Years | 0 (0.0%) | 0 (0.0%) |
| 18 to 24 Years | 31 (73.8%) | 3 (13.0%) |
| 25 to 34 Years | 54 (69.2%) | 42 (68.9%) |
| 35 to 44 Years | 4 (25.0%) | 8 (44.4%) |
| 45 to 54 Years | 9 (47.4%) | 16 (59.3%) |
| 55 to 64 Years | 12 (63.2%) | 15 (42.9%) |
| 65 to 74 Years | 3 (100.0%) | 2 (100.0%) |
| 75 Years and over | 0 (0.0%) | 4 (50.0%) |
| Total | 163 (62.9%) | 112 (52.6%) |
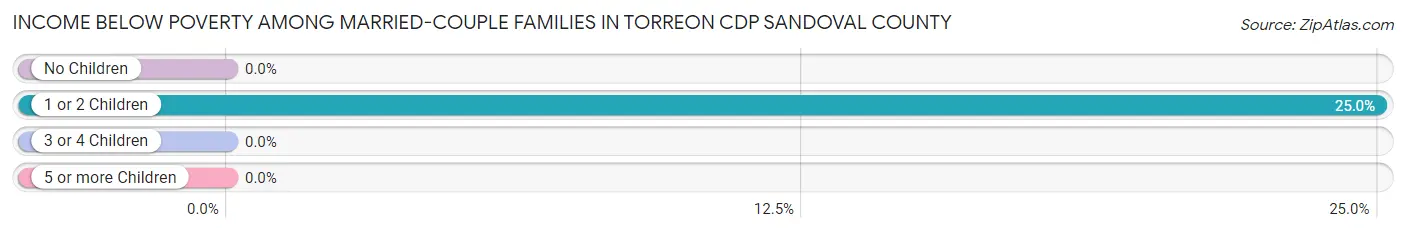
Income Below Poverty Among Married-Couple Families in Torreon CDP Sandoval County
The poverty statistics for married-couple families in Torreon CDP Sandoval County show that 23.3% or 10 of the total 43 families live below the poverty line. Families with 1 or 2 children have the highest poverty rate of 25.0%, comprising of 10 families. On the other hand, families with 3 or 4 children have the lowest poverty rate of 0.0%, which includes 0 families.
| Children | Above Poverty | Below Poverty |
| No Children | 0 (0.0%) | 0 (0.0%) |
| 1 or 2 Children | 30 (75.0%) | 10 (25.0%) |
| 3 or 4 Children | 3 (100.0%) | 0 (0.0%) |
| 5 or more Children | 0 (0.0%) | 0 (0.0%) |
| Total | 33 (76.7%) | 10 (23.3%) |
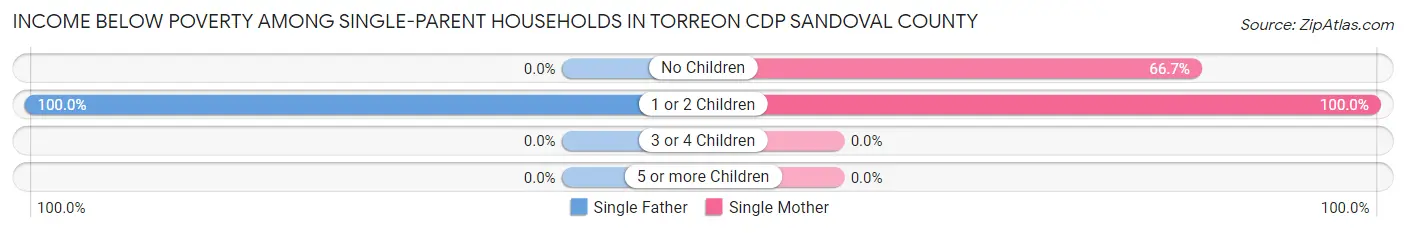
Income Below Poverty Among Single-Parent Households in Torreon CDP Sandoval County
According to the poverty data in Torreon CDP Sandoval County, 100.0% or 5 single-father households and 57.1% or 8 single-mother households are living below the poverty line. Among single-father households, those with 1 or 2 children have the highest poverty rate, with 5 households (100.0%) experiencing poverty. Likewise, among single-mother households, those with 1 or 2 children have the highest poverty rate, with 4 households (100.0%) falling below the poverty line.
| Children | Single Father | Single Mother |
| No Children | 0 (0.0%) | 4 (66.7%) |
| 1 or 2 Children | 5 (100.0%) | 4 (100.0%) |
| 3 or 4 Children | 0 (0.0%) | 0 (0.0%) |
| 5 or more Children | 0 (0.0%) | 0 (0.0%) |
| Total | 5 (100.0%) | 8 (57.1%) |
Income Below Poverty Among Married-Couple vs Single-Parent Households in Torreon CDP Sandoval County
The poverty data for Torreon CDP Sandoval County shows that 10 of the married-couple family households (23.3%) and 13 of the single-parent households (68.4%) are living below the poverty level. Within the married-couple family households, those with 1 or 2 children have the highest poverty rate, with 10 households (25.0%) falling below the poverty line. Among the single-parent households, those with 1 or 2 children have the highest poverty rate, with 9 household (100.0%) living below poverty.
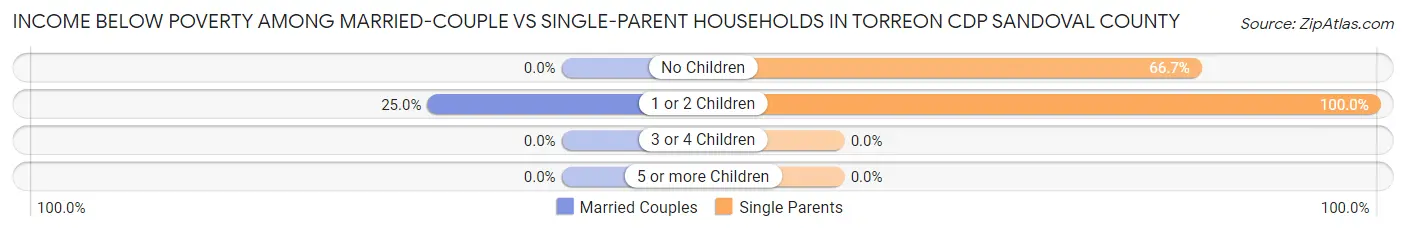
| Children | Married-Couple Families | Single-Parent Households |
| No Children | 0 (0.0%) | 4 (66.7%) |
| 1 or 2 Children | 10 (25.0%) | 9 (100.0%) |
| 3 or 4 Children | 0 (0.0%) | 0 (0.0%) |
| 5 or more Children | 0 (0.0%) | 0 (0.0%) |
| Total | 10 (23.3%) | 13 (68.4%) |
Race in Torreon CDP Sandoval County
The most populous races in Torreon CDP Sandoval County are Native / Alaskan (328 | 67.1%), White / Caucasian (143 | 29.2%), and Hispanic or Latino (22 | 4.5%).
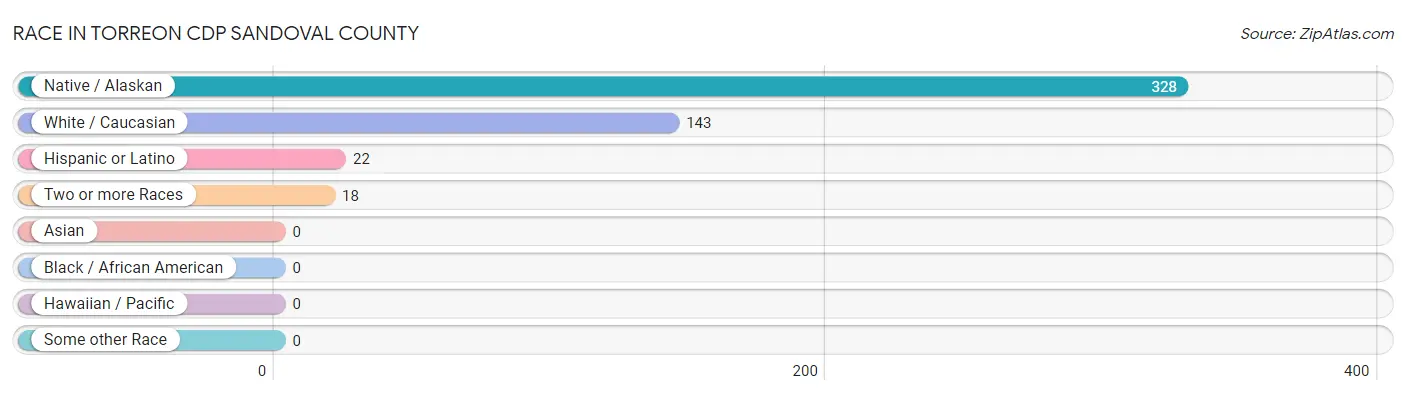
| Race | # Population | % Population |
| Asian | 0 | 0.0% |
| Black / African American | 0 | 0.0% |
| Hawaiian / Pacific | 0 | 0.0% |
| Hispanic or Latino | 22 | 4.5% |
| Native / Alaskan | 328 | 67.1% |
| White / Caucasian | 143 | 29.2% |
| Two or more Races | 18 | 3.7% |
| Some other Race | 0 | 0.0% |
| Total | 489 | 100.0% |
Ancestry in Torreon CDP Sandoval County
The most populous ancestries reported in Torreon CDP Sandoval County are Navajo (275 | 56.2%), Pueblo (53 | 10.8%), Spanish American (16 | 3.3%), Mexican (6 | 1.2%), and French (3 | 0.6%), together accounting for 72.2% of all Torreon CDP Sandoval County residents.
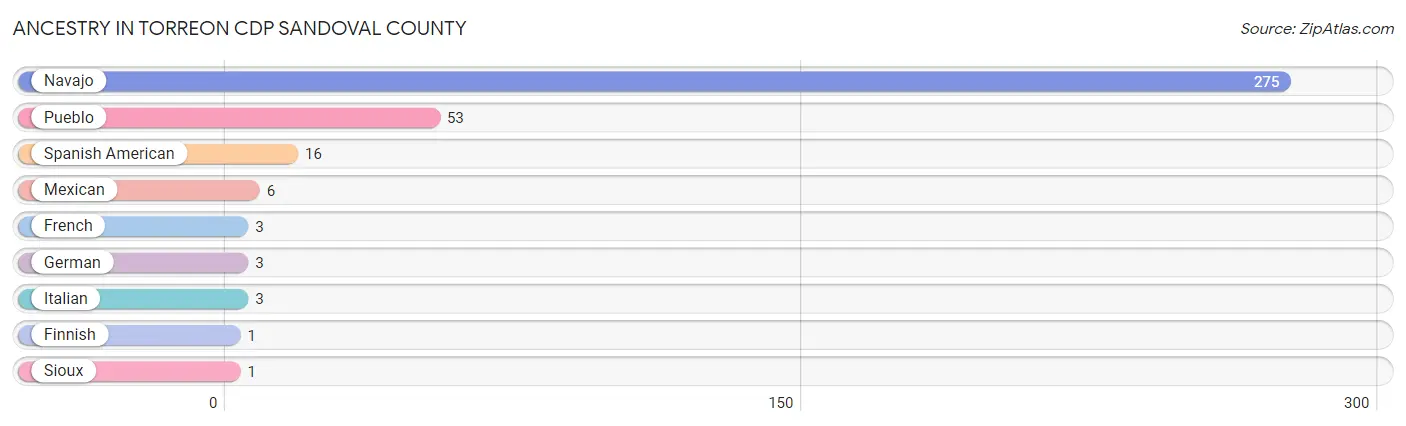
| Ancestry | # Population | % Population |
| Finnish | 1 | 0.2% |
| French | 3 | 0.6% |
| German | 3 | 0.6% |
| Italian | 3 | 0.6% |
| Mexican | 6 | 1.2% |
| Navajo | 275 | 56.2% |
| Pueblo | 53 | 10.8% |
| Sioux | 1 | 0.2% |
| Spanish American | 16 | 3.3% | View All 9 Rows |
Immigrants in Torreon CDP Sandoval County

| Immigration Origin | # Population | % Population | View All 0 Rows |
Sex and Age in Torreon CDP Sandoval County
Sex and Age in Torreon CDP Sandoval County
The most populous age groups in Torreon CDP Sandoval County are 25 to 29 Years (62 | 22.6%) for men and 25 to 29 Years (43 | 20.1%) for women.
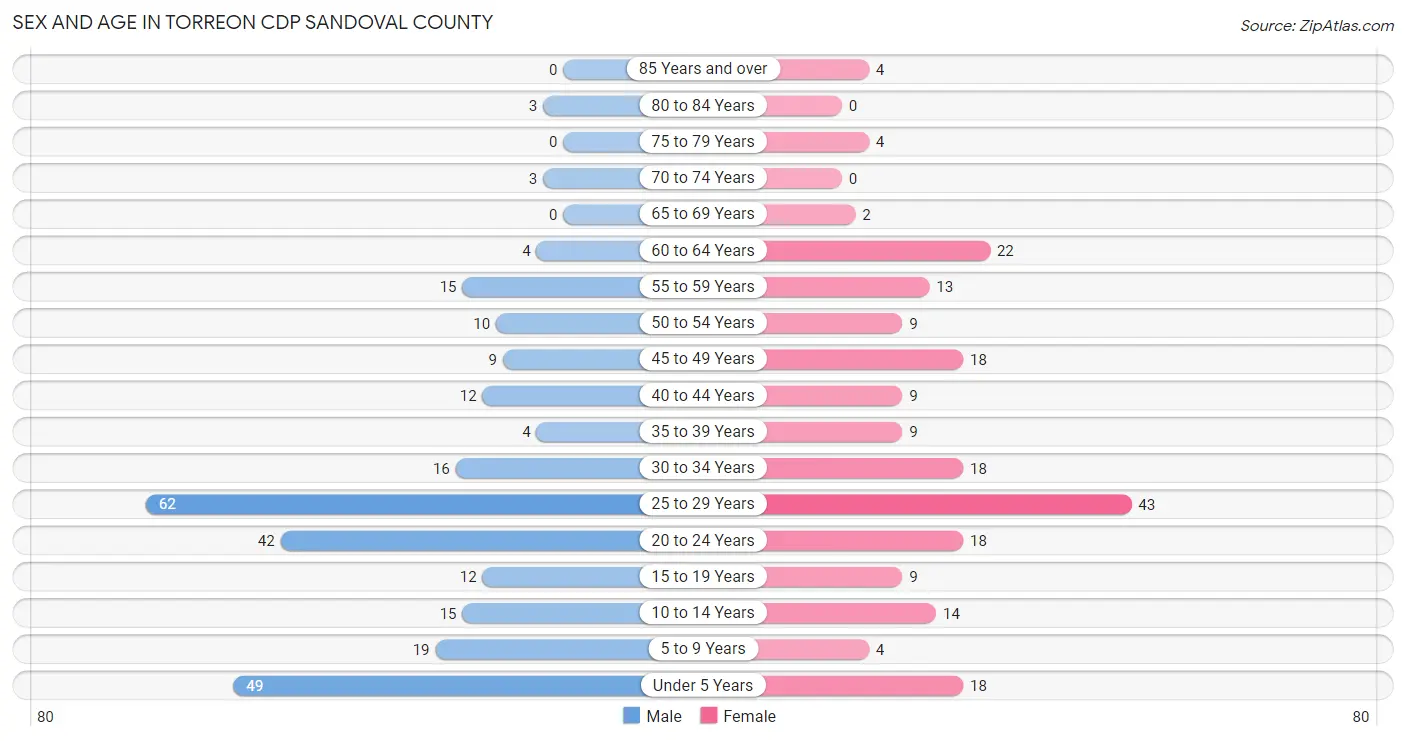
| Age Bracket | Male | Female |
| Under 5 Years | 49 (17.8%) | 18 (8.4%) |
| 5 to 9 Years | 19 (6.9%) | 4 (1.9%) |
| 10 to 14 Years | 15 (5.4%) | 14 (6.5%) |
| 15 to 19 Years | 12 (4.4%) | 9 (4.2%) |
| 20 to 24 Years | 42 (15.3%) | 18 (8.4%) |
| 25 to 29 Years | 62 (22.6%) | 43 (20.1%) |
| 30 to 34 Years | 16 (5.8%) | 18 (8.4%) |
| 35 to 39 Years | 4 (1.5%) | 9 (4.2%) |
| 40 to 44 Years | 12 (4.4%) | 9 (4.2%) |
| 45 to 49 Years | 9 (3.3%) | 18 (8.4%) |
| 50 to 54 Years | 10 (3.6%) | 9 (4.2%) |
| 55 to 59 Years | 15 (5.4%) | 13 (6.1%) |
| 60 to 64 Years | 4 (1.5%) | 22 (10.3%) |
| 65 to 69 Years | 0 (0.0%) | 2 (0.9%) |
| 70 to 74 Years | 3 (1.1%) | 0 (0.0%) |
| 75 to 79 Years | 0 (0.0%) | 4 (1.9%) |
| 80 to 84 Years | 3 (1.1%) | 0 (0.0%) |
| 85 Years and over | 0 (0.0%) | 4 (1.9%) |
| Total | 275 (100.0%) | 214 (100.0%) |
Families and Households in Torreon CDP Sandoval County
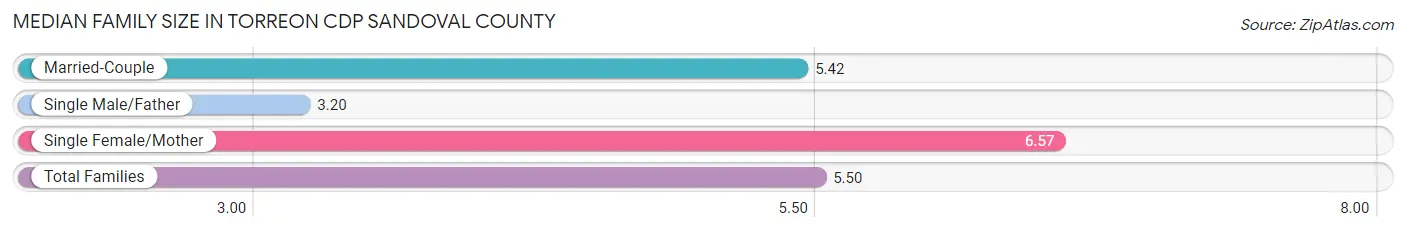
Median Family Size in Torreon CDP Sandoval County
The median family size in Torreon CDP Sandoval County is 5.50 persons per family, with single female/mother families (14 | 22.6%) accounting for the largest median family size of 6.57 persons per family. On the other hand, single male/father families (5 | 8.1%) represent the smallest median family size with 3.20 persons per family.
| Family Type | # Families | Family Size |
| Married-Couple | 43 (69.4%) | 5.42 |
| Single Male/Father | 5 (8.1%) | 3.20 |
| Single Female/Mother | 14 (22.6%) | 6.57 |
| Total Families | 62 (100.0%) | 5.50 |
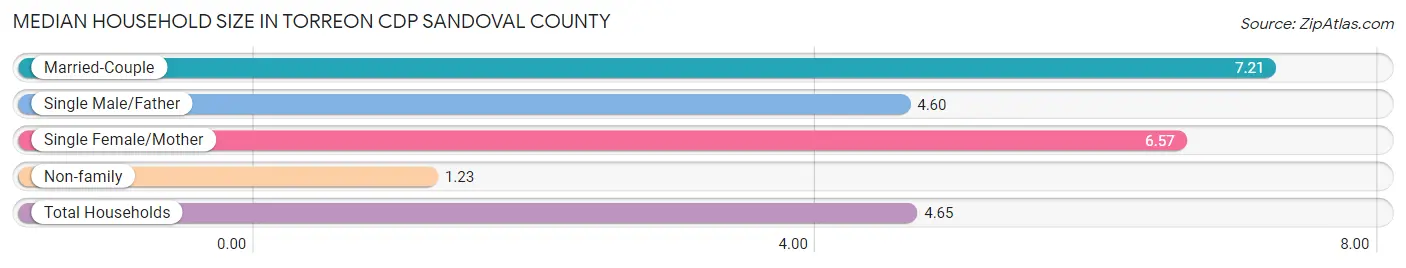
Median Household Size in Torreon CDP Sandoval County
The median household size in Torreon CDP Sandoval County is 4.65 persons per household, with married-couple households (43 | 42.2%) accounting for the largest median household size of 7.21 persons per household. non-family households (40 | 39.2%) represent the smallest median household size with 1.23 persons per household.
| Household Type | # Households | Household Size |
| Married-Couple | 43 (42.2%) | 7.21 |
| Single Male/Father | 5 (4.9%) | 4.60 |
| Single Female/Mother | 14 (13.7%) | 6.57 |
| Non-family | 40 (39.2%) | 1.23 |
| Total Households | 102 (100.0%) | 4.65 |
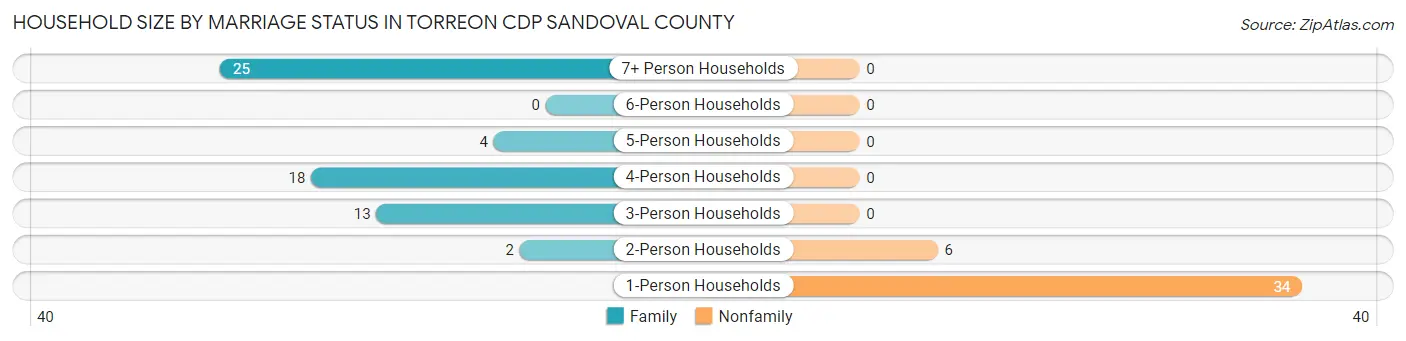
Household Size by Marriage Status in Torreon CDP Sandoval County
Out of a total of 102 households in Torreon CDP Sandoval County, 62 (60.8%) are family households, while 40 (39.2%) are nonfamily households. The most numerous type of family households are 7+ person households, comprising 25, and the most common type of nonfamily households are 1-person households, comprising 34.
| Household Size | Family Households | Nonfamily Households |
| 1-Person Households | - | 34 (33.3%) |
| 2-Person Households | 2 (2.0%) | 6 (5.9%) |
| 3-Person Households | 13 (12.8%) | 0 (0.0%) |
| 4-Person Households | 18 (17.6%) | 0 (0.0%) |
| 5-Person Households | 4 (3.9%) | 0 (0.0%) |
| 6-Person Households | 0 (0.0%) | 0 (0.0%) |
| 7+ Person Households | 25 (24.5%) | 0 (0.0%) |
| Total | 62 (60.8%) | 40 (39.2%) |
Female Fertility in Torreon CDP Sandoval County
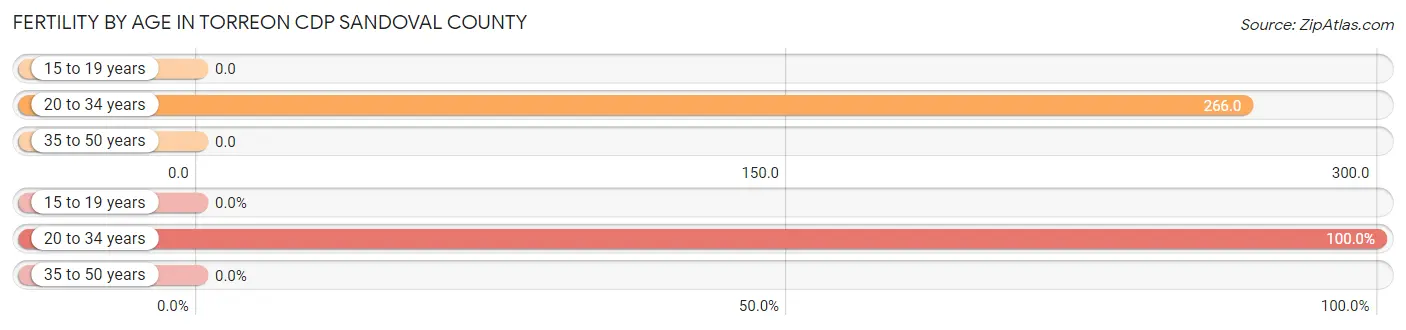
Fertility by Age in Torreon CDP Sandoval County
Average fertility rate in Torreon CDP Sandoval County is 169.0 births per 1,000 women. Women in the age bracket of 20 to 34 years have the highest fertility rate with 266.0 births per 1,000 women. Women in the age bracket of 20 to 34 years acount for 100.0% of all women with births.
| Age Bracket | Women with Births | Births / 1,000 Women |
| 15 to 19 years | 0 (0.0%) | 0.0 |
| 20 to 34 years | 21 (100.0%) | 266.0 |
| 35 to 50 years | 0 (0.0%) | 0.0 |
| Total | 21 (100.0%) | 169.0 |
Fertility by Age by Marriage Status in Torreon CDP Sandoval County
90.5% of women with births (21) in Torreon CDP Sandoval County are married. The highest percentage of unmarried women with births falls into 20 to 34 years age bracket with 9.5% of them unmarried at the time of birth, while the lowest percentage of unmarried women with births belong to 20 to 34 years age bracket with 9.5% of them unmarried.
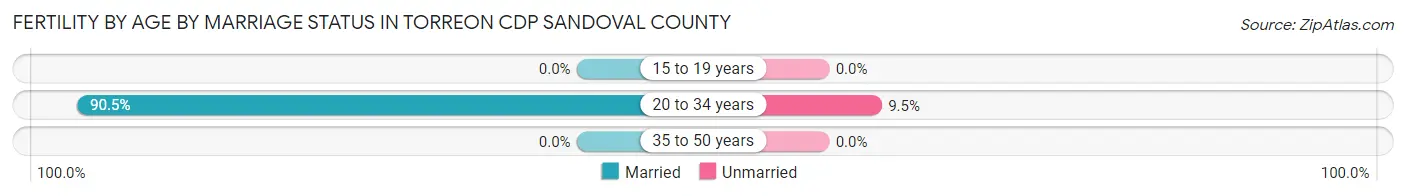
| Age Bracket | Married | Unmarried |
| 15 to 19 years | 0 (0.0%) | 0 (0.0%) |
| 20 to 34 years | 19 (90.5%) | 2 (9.5%) |
| 35 to 50 years | 0 (0.0%) | 0 (0.0%) |
| Total | 19 (90.5%) | 2 (9.5%) |
Fertility by Education in Torreon CDP Sandoval County
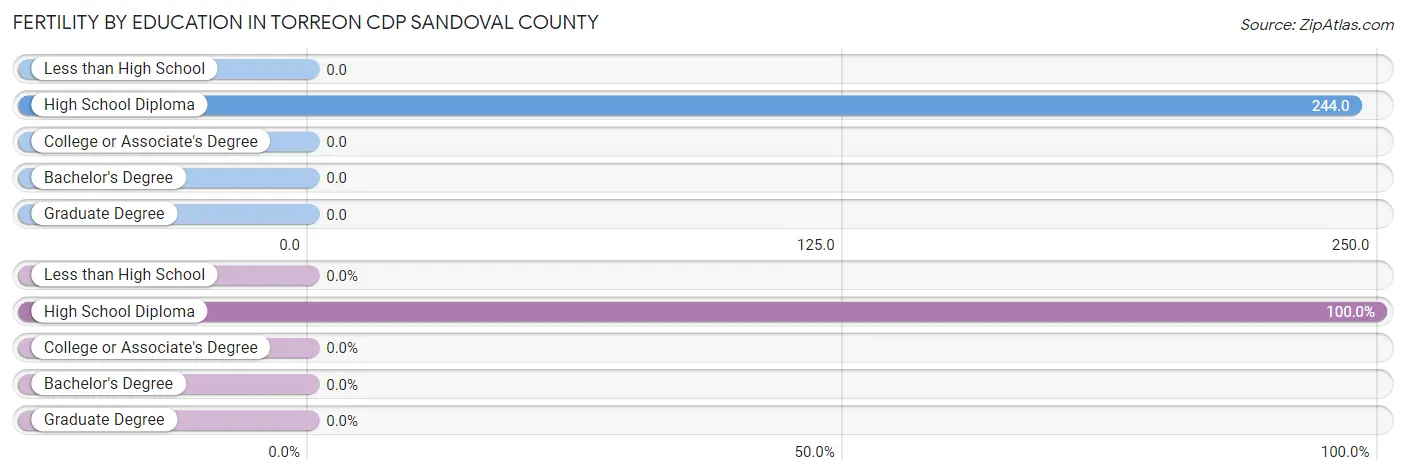
| Educational Attainment | Women with Births | Births / 1,000 Women |
| Less than High School | 0 (0.0%) | 0.0 |
| High School Diploma | 21 (100.0%) | 244.0 |
| College or Associate's Degree | 0 (0.0%) | 0.0 |
| Bachelor's Degree | 0 (0.0%) | 0.0 |
| Graduate Degree | 0 (0.0%) | 0.0 |
| Total | 21 (100.0%) | 169.0 |
Fertility by Education by Marriage Status in Torreon CDP Sandoval County
9.5% of women with births in Torreon CDP Sandoval County are unmarried. Women with the educational attainment of high school diploma are most likely to be married with 90.5% of them married at childbirth, while women with the educational attainment of high school diploma are least likely to be married with 9.5% of them unmarried at childbirth.
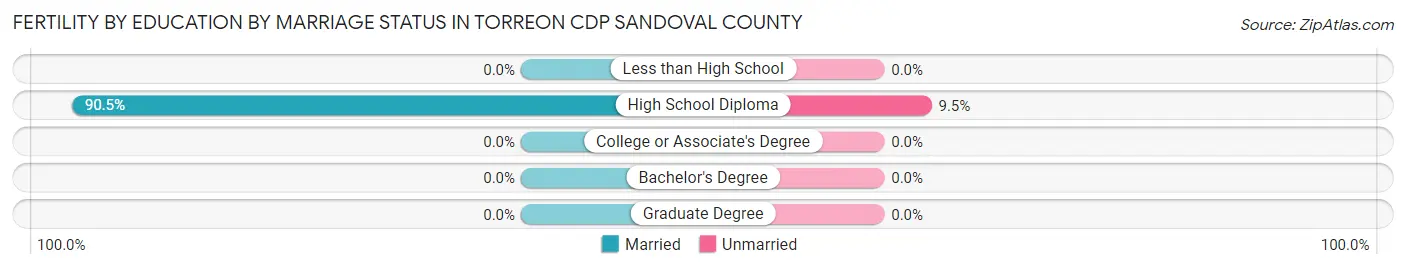
| Educational Attainment | Married | Unmarried |
| Less than High School | 0 (0.0%) | 0 (0.0%) |
| High School Diploma | 19 (90.5%) | 2 (9.5%) |
| College or Associate's Degree | 0 (0.0%) | 0 (0.0%) |
| Bachelor's Degree | 0 (0.0%) | 0 (0.0%) |
| Graduate Degree | 0 (0.0%) | 0 (0.0%) |
| Total | 19 (90.5%) | 2 (9.5%) |
Employment Characteristics in Torreon CDP Sandoval County
Employment by Class of Employer in Torreon CDP Sandoval County
Among the 154 employed individuals in Torreon CDP Sandoval County, private company employees (71 | 46.1%), federal government employees (30 | 19.5%), and not-for-profit organizations (22 | 14.3%) make up the most common classes of employment.
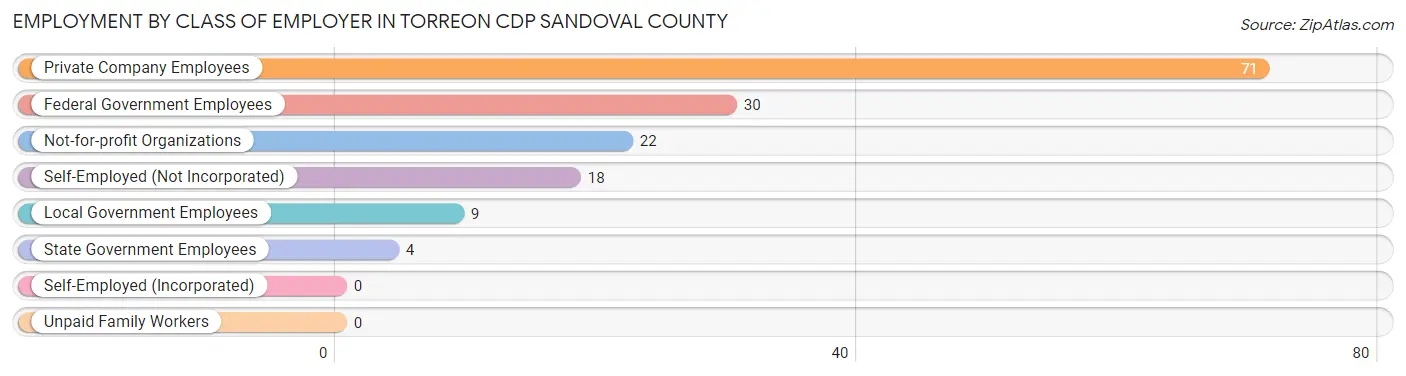
| Employer Class | # Employees | % Employees |
| Private Company Employees | 71 | 46.1% |
| Self-Employed (Incorporated) | 0 | 0.0% |
| Self-Employed (Not Incorporated) | 18 | 11.7% |
| Not-for-profit Organizations | 22 | 14.3% |
| Local Government Employees | 9 | 5.8% |
| State Government Employees | 4 | 2.6% |
| Federal Government Employees | 30 | 19.5% |
| Unpaid Family Workers | 0 | 0.0% |
| Total | 154 | 100.0% |
Employment Status by Age in Torreon CDP Sandoval County
According to the labor force statistics for Torreon CDP Sandoval County, out of the total population over 16 years of age (360), 47.8% or 172 individuals are in the labor force, with 10.5% or 18 of them unemployed. The age group with the highest labor force participation rate is 30 to 34 years, with 91.2% or 31 individuals in the labor force. Within the labor force, the 35 to 44 years age range has the highest percentage of unemployed individuals, with 29.2% or 7 of them being unemployed.
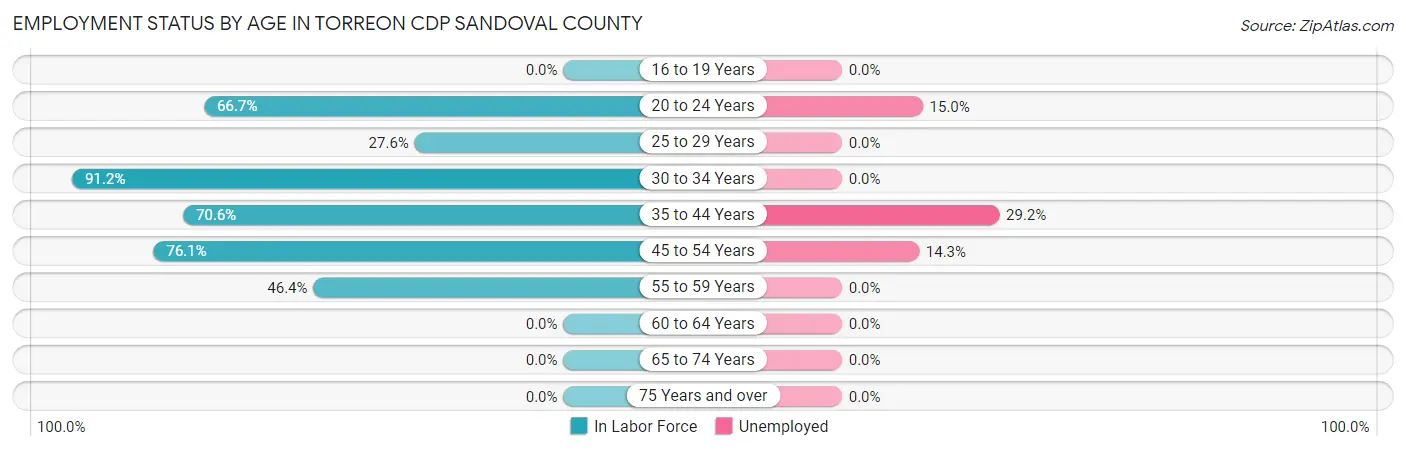
| Age Bracket | In Labor Force | Unemployed |
| 16 to 19 Years | 0 (0.0%) | 0 (0.0%) |
| 20 to 24 Years | 40 (66.7%) | 6 (15.0%) |
| 25 to 29 Years | 29 (27.6%) | 0 (0.0%) |
| 30 to 34 Years | 31 (91.2%) | 0 (0.0%) |
| 35 to 44 Years | 24 (70.6%) | 7 (29.2%) |
| 45 to 54 Years | 35 (76.1%) | 5 (14.3%) |
| 55 to 59 Years | 13 (46.4%) | 0 (0.0%) |
| 60 to 64 Years | 0 (0.0%) | 0 (0.0%) |
| 65 to 74 Years | 0 (0.0%) | 0 (0.0%) |
| 75 Years and over | 0 (0.0%) | 0 (0.0%) |
| Total | 172 (47.8%) | 18 (10.5%) |
Employment Status by Educational Attainment in Torreon CDP Sandoval County
According to labor force statistics for Torreon CDP Sandoval County, 48.4% of individuals (132) out of the total population between 25 and 64 years of age (273) are in the labor force, with 9.1% or 12 of them being unemployed. The group with the highest labor force participation rate are those with the educational attainment of bachelor's degree or higher, with 100.0% or 7 individuals in the labor force. Within the labor force, individuals with less than high school education have the highest percentage of unemployment, with 75.0% or 12 of them being unemployed.
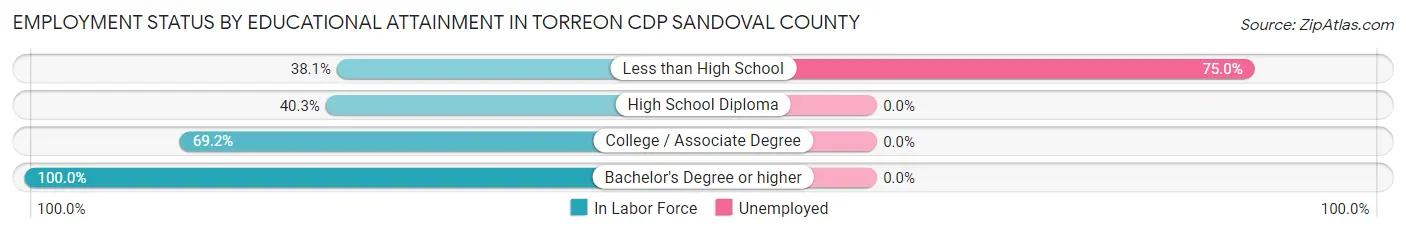
| Educational Attainment | In Labor Force | Unemployed |
| Less than High School | 16 (38.1%) | 32 (75.0%) |
| High School Diploma | 64 (40.3%) | 0 (0.0%) |
| College / Associate Degree | 45 (69.2%) | 0 (0.0%) |
| Bachelor's Degree or higher | 7 (100.0%) | 0 (0.0%) |
| Total | 132 (48.4%) | 25 (9.1%) |
Employment Occupations by Sex in Torreon CDP Sandoval County
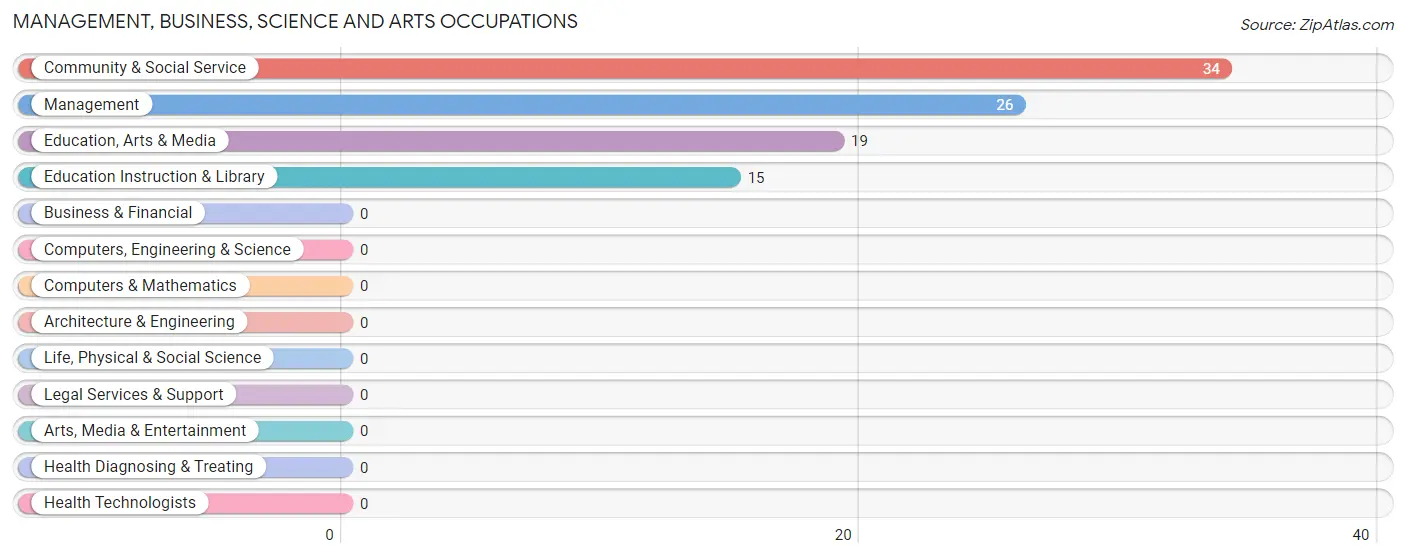
Management, Business, Science and Arts Occupations
The most common Management, Business, Science and Arts occupations in Torreon CDP Sandoval County are Community & Social Service (34 | 22.1%), Management (26 | 16.9%), Education, Arts & Media (19 | 12.3%), and Education Instruction & Library (15 | 9.7%).
Management, Business, Science and Arts Occupations by Sex
Within the Management, Business, Science and Arts occupations in Torreon CDP Sandoval County, the most male-oriented occupations are Management (100.0%), Education, Arts & Media (100.0%), and Community & Social Service (67.6%), while the most female-oriented occupations are Education Instruction & Library (73.3%), and Community & Social Service (32.4%).
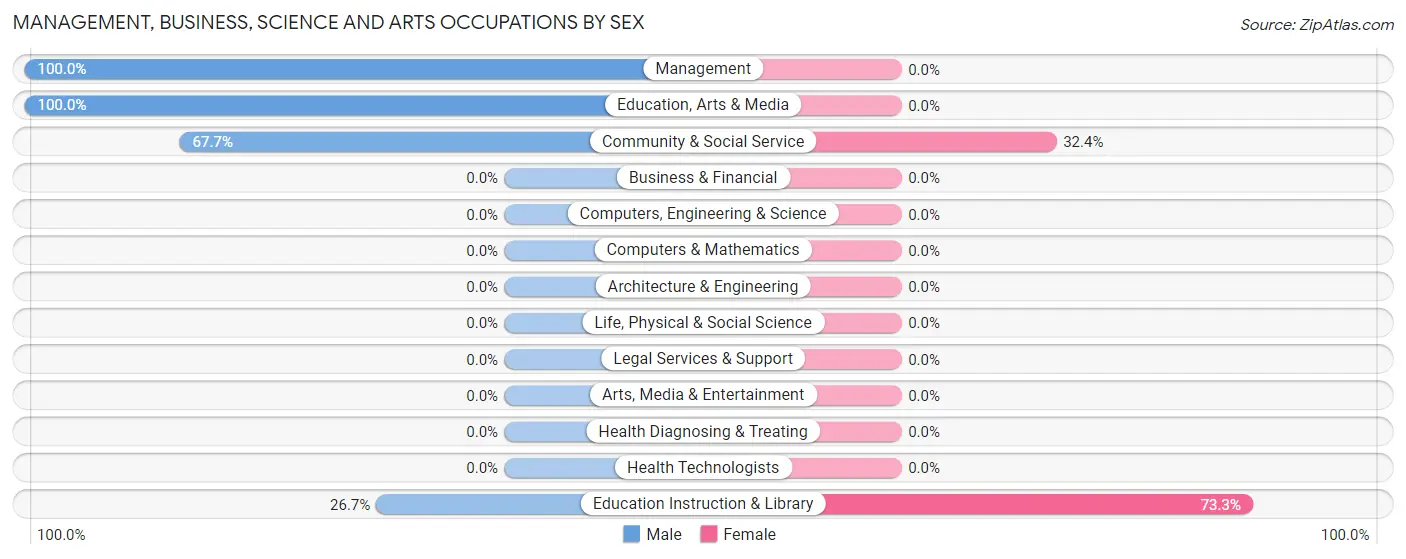
| Occupation | Male | Female |
| Management | 26 (100.0%) | 0 (0.0%) |
| Business & Financial | 0 (0.0%) | 0 (0.0%) |
| Computers, Engineering & Science | 0 (0.0%) | 0 (0.0%) |
| Computers & Mathematics | 0 (0.0%) | 0 (0.0%) |
| Architecture & Engineering | 0 (0.0%) | 0 (0.0%) |
| Life, Physical & Social Science | 0 (0.0%) | 0 (0.0%) |
| Community & Social Service | 23 (67.6%) | 11 (32.4%) |
| Education, Arts & Media | 19 (100.0%) | 0 (0.0%) |
| Legal Services & Support | 0 (0.0%) | 0 (0.0%) |
| Education Instruction & Library | 4 (26.7%) | 11 (73.3%) |
| Arts, Media & Entertainment | 0 (0.0%) | 0 (0.0%) |
| Health Diagnosing & Treating | 0 (0.0%) | 0 (0.0%) |
| Health Technologists | 0 (0.0%) | 0 (0.0%) |
| Total (Category) | 49 (81.7%) | 11 (18.3%) |
| Total (Overall) | 87 (56.5%) | 67 (43.5%) |
Services Occupations
The most common Services occupations in Torreon CDP Sandoval County are Healthcare Support (38 | 24.7%), Food Preparation & Serving (11 | 7.1%), and Personal Care & Service (5 | 3.3%).
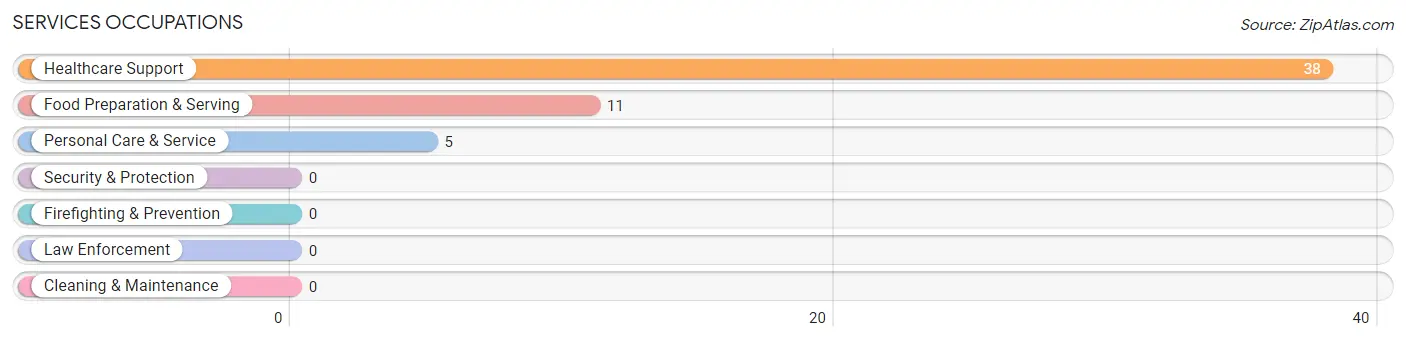
Services Occupations by Sex
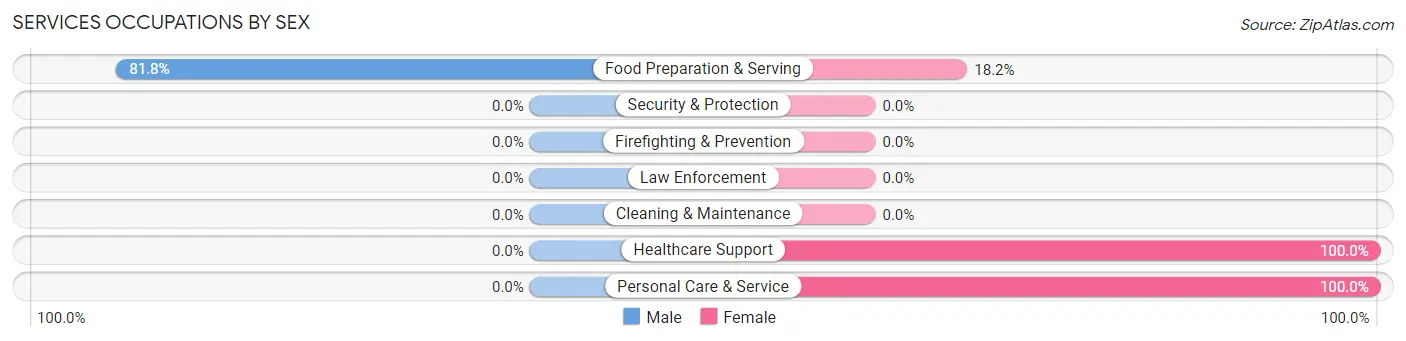
| Occupation | Male | Female |
| Healthcare Support | 0 (0.0%) | 38 (100.0%) |
| Security & Protection | 0 (0.0%) | 0 (0.0%) |
| Firefighting & Prevention | 0 (0.0%) | 0 (0.0%) |
| Law Enforcement | 0 (0.0%) | 0 (0.0%) |
| Food Preparation & Serving | 9 (81.8%) | 2 (18.2%) |
| Cleaning & Maintenance | 0 (0.0%) | 0 (0.0%) |
| Personal Care & Service | 0 (0.0%) | 5 (100.0%) |
| Total (Category) | 9 (16.7%) | 45 (83.3%) |
| Total (Overall) | 87 (56.5%) | 67 (43.5%) |
Sales and Office Occupations
The most common Sales and Office occupations in Torreon CDP Sandoval County are Sales & Related (7 | 4.5%), and Office & Administration (4 | 2.6%).
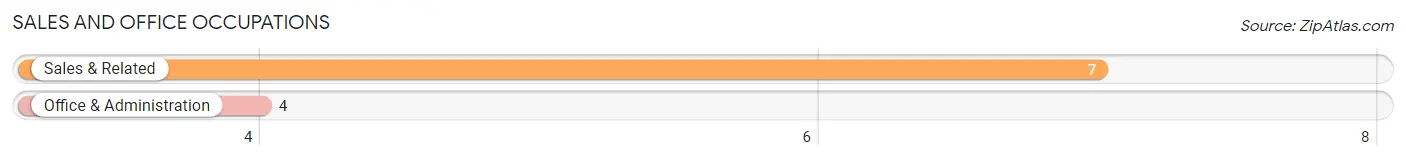
Sales and Office Occupations by Sex
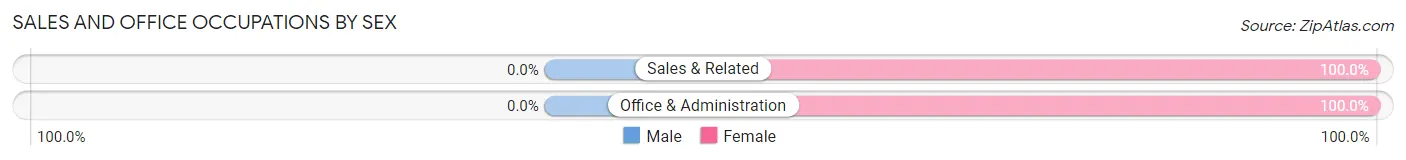
| Occupation | Male | Female |
| Sales & Related | 0 (0.0%) | 7 (100.0%) |
| Office & Administration | 0 (0.0%) | 4 (100.0%) |
| Total (Category) | 0 (0.0%) | 11 (100.0%) |
| Total (Overall) | 87 (56.5%) | 67 (43.5%) |
Natural Resources, Construction and Maintenance Occupations
The most common Natural Resources, Construction and Maintenance occupations in Torreon CDP Sandoval County are , and Installation, Maintenance & Repair (4 | 2.6%).
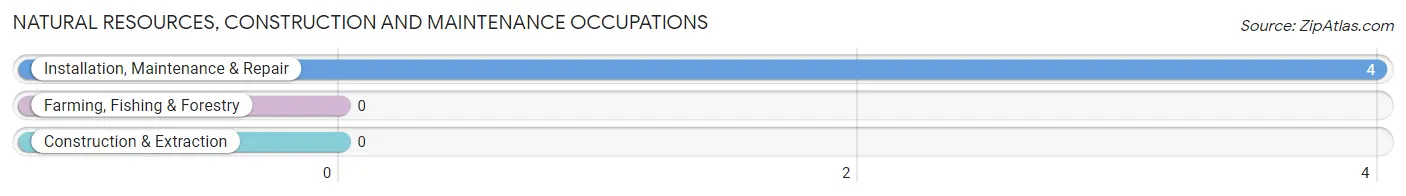
Natural Resources, Construction and Maintenance Occupations by Sex
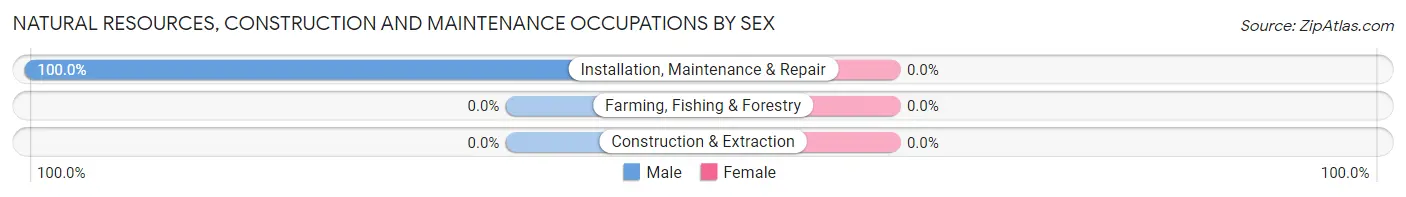
| Occupation | Male | Female |
| Farming, Fishing & Forestry | 0 (0.0%) | 0 (0.0%) |
| Construction & Extraction | 0 (0.0%) | 0 (0.0%) |
| Installation, Maintenance & Repair | 4 (100.0%) | 0 (0.0%) |
| Total (Category) | 4 (100.0%) | 0 (0.0%) |
| Total (Overall) | 87 (56.5%) | 67 (43.5%) |
Production, Transportation and Moving Occupations
The most common Production, Transportation and Moving occupations in Torreon CDP Sandoval County are , and Transportation (25 | 16.2%).
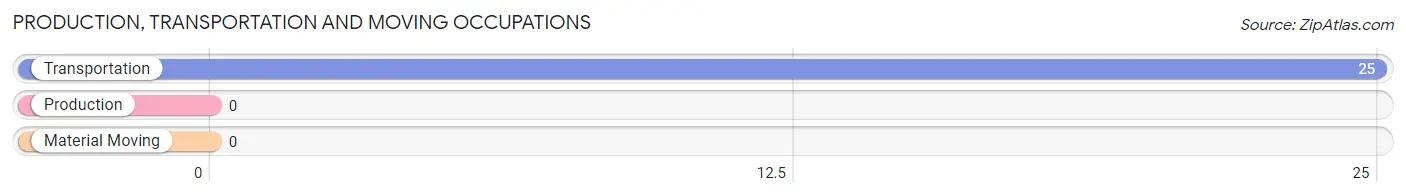
Production, Transportation and Moving Occupations by Sex
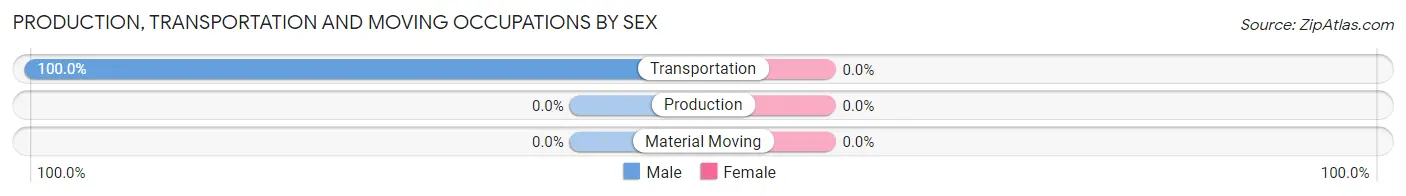
| Occupation | Male | Female |
| Production | 0 (0.0%) | 0 (0.0%) |
| Transportation | 25 (100.0%) | 0 (0.0%) |
| Material Moving | 0 (0.0%) | 0 (0.0%) |
| Total (Category) | 25 (100.0%) | 0 (0.0%) |
| Total (Overall) | 87 (56.5%) | 67 (43.5%) |
Employment Industries by Sex in Torreon CDP Sandoval County
Employment Industries in Torreon CDP Sandoval County
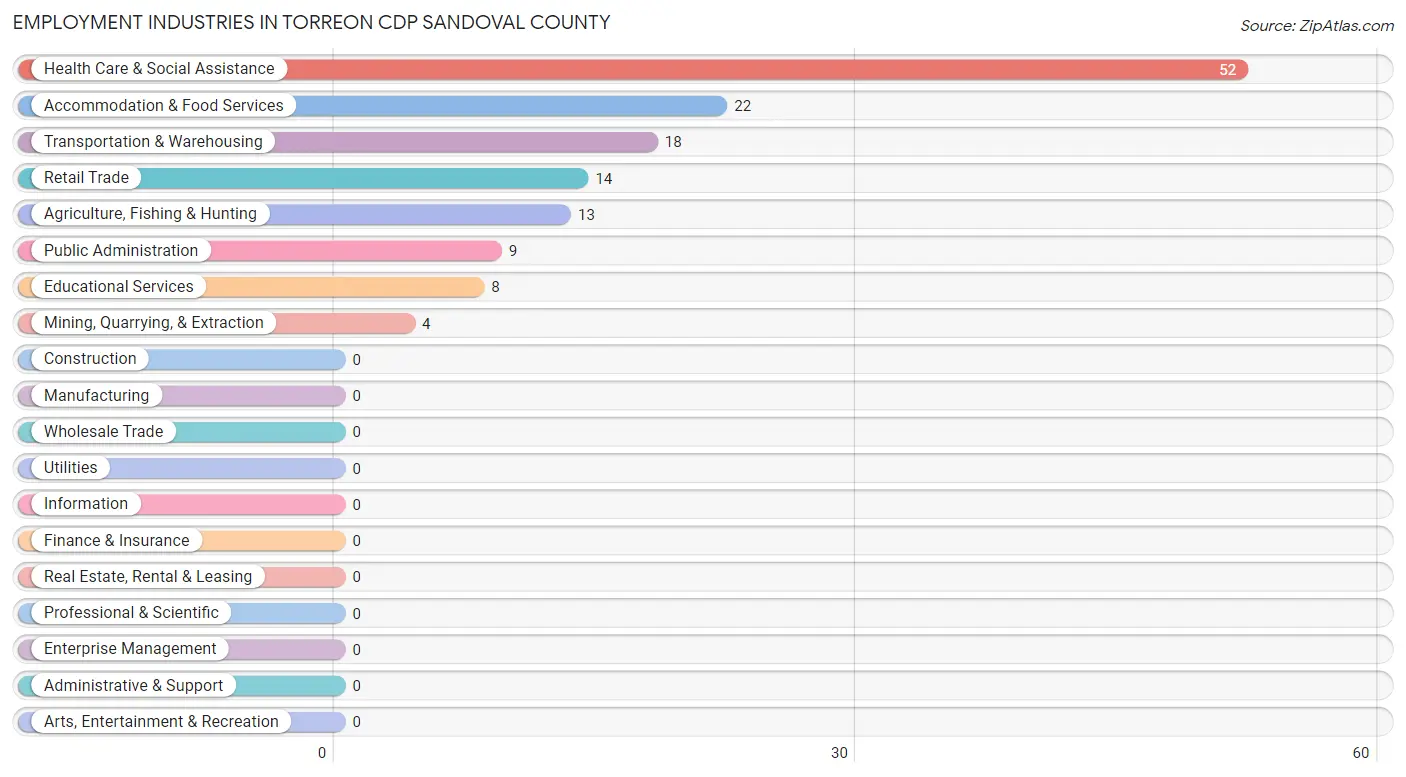
The major employment industries in Torreon CDP Sandoval County include Health Care & Social Assistance (52 | 33.8%), Accommodation & Food Services (22 | 14.3%), Transportation & Warehousing (18 | 11.7%), Retail Trade (14 | 9.1%), and Agriculture, Fishing & Hunting (13 | 8.4%).
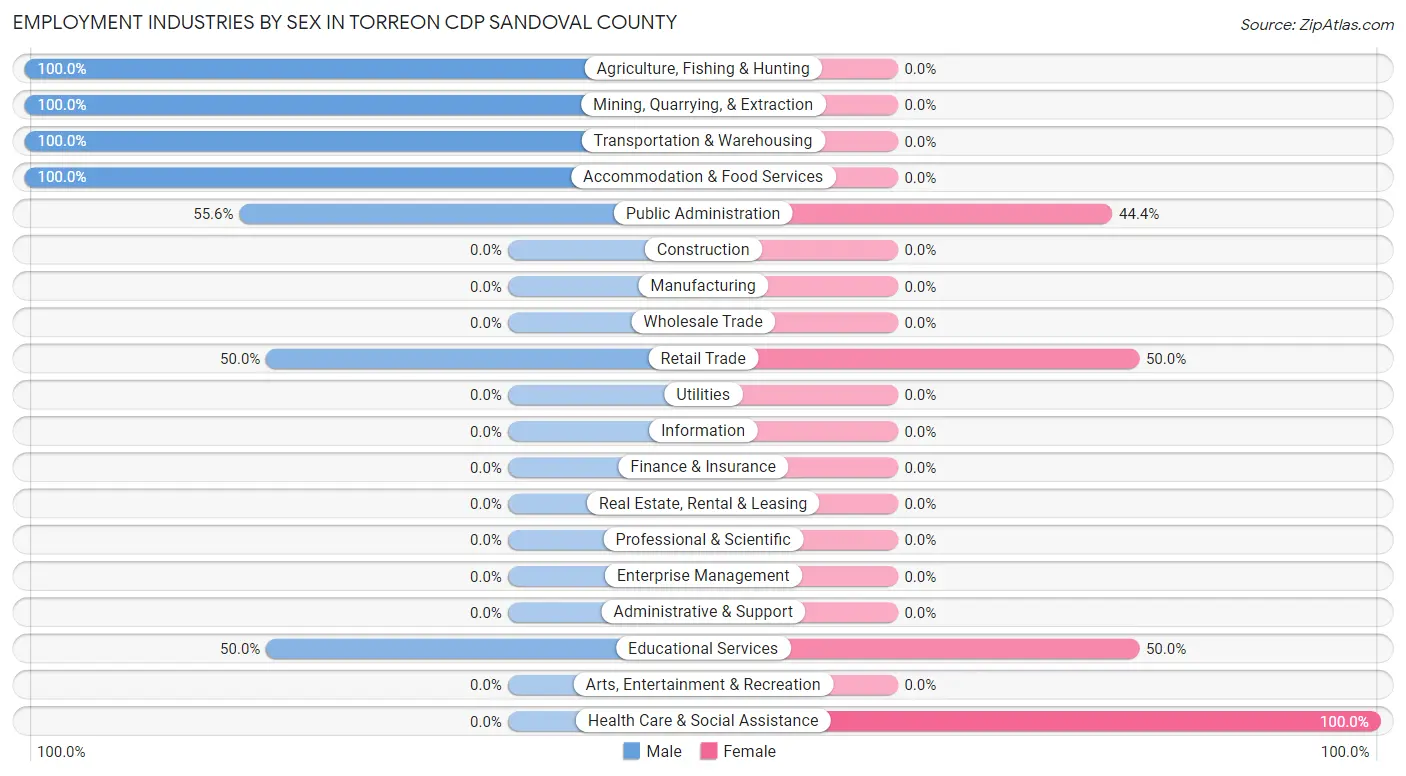
Employment Industries by Sex in Torreon CDP Sandoval County
The Torreon CDP Sandoval County industries that see more men than women are Agriculture, Fishing & Hunting (100.0%), Mining, Quarrying, & Extraction (100.0%), and Transportation & Warehousing (100.0%), whereas the industries that tend to have a higher number of women are Health Care & Social Assistance (100.0%), Retail Trade (50.0%), and Educational Services (50.0%).
| Industry | Male | Female |
| Agriculture, Fishing & Hunting | 13 (100.0%) | 0 (0.0%) |
| Mining, Quarrying, & Extraction | 4 (100.0%) | 0 (0.0%) |
| Construction | 0 (0.0%) | 0 (0.0%) |
| Manufacturing | 0 (0.0%) | 0 (0.0%) |
| Wholesale Trade | 0 (0.0%) | 0 (0.0%) |
| Retail Trade | 7 (50.0%) | 7 (50.0%) |
| Transportation & Warehousing | 18 (100.0%) | 0 (0.0%) |
| Utilities | 0 (0.0%) | 0 (0.0%) |
| Information | 0 (0.0%) | 0 (0.0%) |
| Finance & Insurance | 0 (0.0%) | 0 (0.0%) |
| Real Estate, Rental & Leasing | 0 (0.0%) | 0 (0.0%) |
| Professional & Scientific | 0 (0.0%) | 0 (0.0%) |
| Enterprise Management | 0 (0.0%) | 0 (0.0%) |
| Administrative & Support | 0 (0.0%) | 0 (0.0%) |
| Educational Services | 4 (50.0%) | 4 (50.0%) |
| Health Care & Social Assistance | 0 (0.0%) | 52 (100.0%) |
| Arts, Entertainment & Recreation | 0 (0.0%) | 0 (0.0%) |
| Accommodation & Food Services | 22 (100.0%) | 0 (0.0%) |
| Public Administration | 5 (55.6%) | 4 (44.4%) |
| Total | 87 (56.5%) | 67 (43.5%) |
Education in Torreon CDP Sandoval County
School Enrollment in Torreon CDP Sandoval County
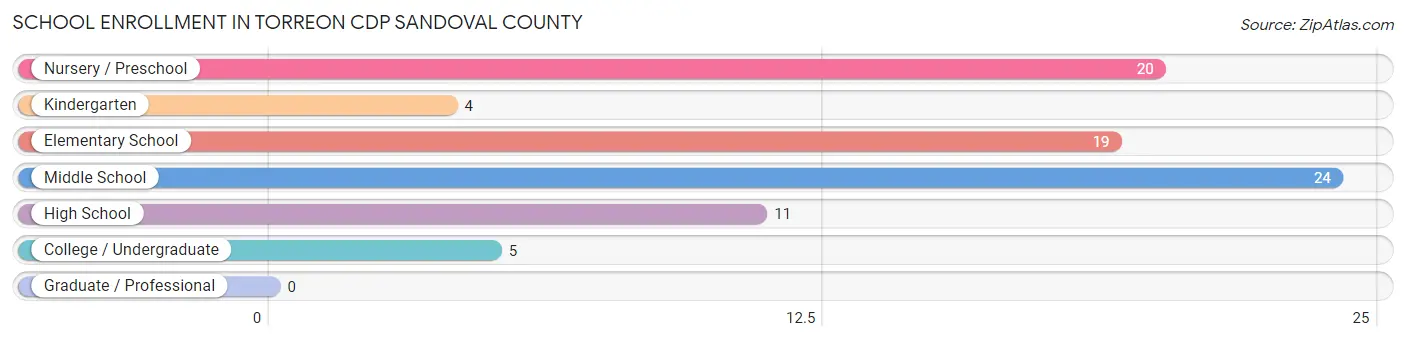
The most common levels of schooling among the 83 students in Torreon CDP Sandoval County are middle school (24 | 28.9%), nursery / preschool (20 | 24.1%), and elementary school (19 | 22.9%).
| School Level | # Students | % Students |
| Nursery / Preschool | 20 | 24.1% |
| Kindergarten | 4 | 4.8% |
| Elementary School | 19 | 22.9% |
| Middle School | 24 | 28.9% |
| High School | 11 | 13.3% |
| College / Undergraduate | 5 | 6.0% |
| Graduate / Professional | 0 | 0.0% |
| Total | 83 | 100.0% |
School Enrollment by Age by Funding Source in Torreon CDP Sandoval County
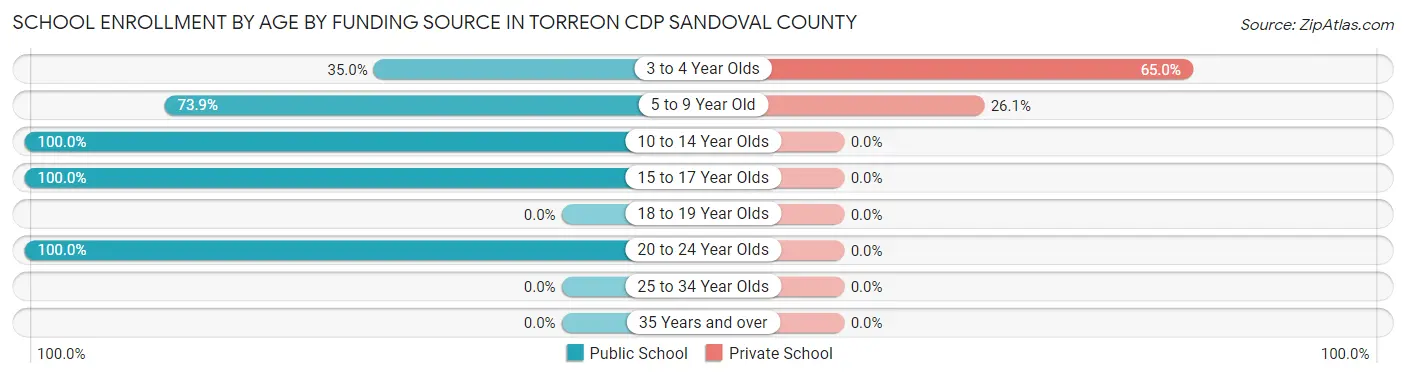
Out of a total of 83 students who are enrolled in schools in Torreon CDP Sandoval County, 19 (22.9%) attend a private institution, while the remaining 64 (77.1%) are enrolled in public schools. The age group of 3 to 4 year olds has the highest likelihood of being enrolled in private schools, with 13 (65.0% in the age bracket) enrolled. Conversely, the age group of 10 to 14 year olds has the lowest likelihood of being enrolled in a private school, with 29 (100.0% in the age bracket) attending a public institution.
| Age Bracket | Public School | Private School |
| 3 to 4 Year Olds | 7 (35.0%) | 13 (65.0%) |
| 5 to 9 Year Old | 17 (73.9%) | 6 (26.1%) |
| 10 to 14 Year Olds | 29 (100.0%) | 0 (0.0%) |
| 15 to 17 Year Olds | 6 (100.0%) | 0 (0.0%) |
| 18 to 19 Year Olds | 0 (0.0%) | 0 (0.0%) |
| 20 to 24 Year Olds | 5 (100.0%) | 0 (0.0%) |
| 25 to 34 Year Olds | 0 (0.0%) | 0 (0.0%) |
| 35 Years and over | 0 (0.0%) | 0 (0.0%) |
| Total | 64 (77.1%) | 19 (22.9%) |
Educational Attainment by Field of Study in Torreon CDP Sandoval County
Arts & humanities (7 | 58.3%), liberal arts & history (3 | 25.0%), and science & technology (2 | 16.7%) are the most common fields of study among 12 individuals in Torreon CDP Sandoval County who have obtained a bachelor's degree or higher.
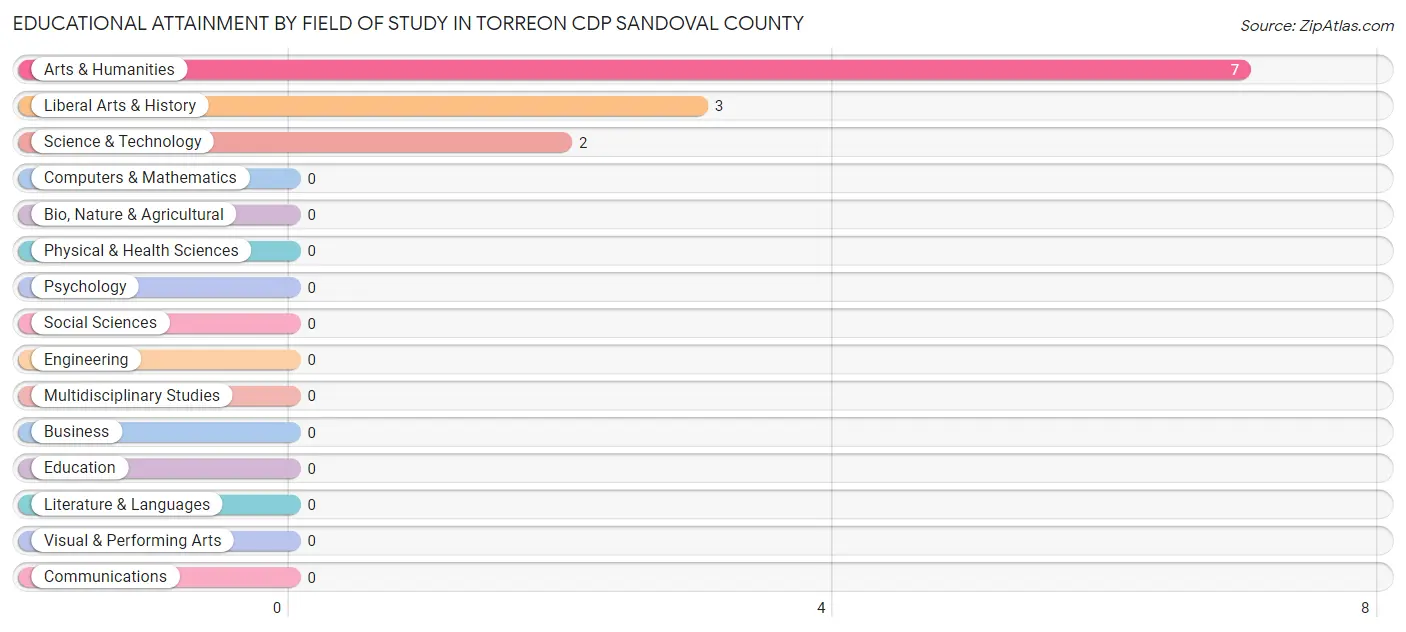
| Field of Study | # Graduates | % Graduates |
| Computers & Mathematics | 0 | 0.0% |
| Bio, Nature & Agricultural | 0 | 0.0% |
| Physical & Health Sciences | 0 | 0.0% |
| Psychology | 0 | 0.0% |
| Social Sciences | 0 | 0.0% |
| Engineering | 0 | 0.0% |
| Multidisciplinary Studies | 0 | 0.0% |
| Science & Technology | 2 | 16.7% |
| Business | 0 | 0.0% |
| Education | 0 | 0.0% |
| Literature & Languages | 0 | 0.0% |
| Liberal Arts & History | 3 | 25.0% |
| Visual & Performing Arts | 0 | 0.0% |
| Communications | 0 | 0.0% |
| Arts & Humanities | 7 | 58.3% |
| Total | 12 | 100.0% |
Transportation & Commute in Torreon CDP Sandoval County
Vehicle Availability by Sex in Torreon CDP Sandoval County
The most prevalent vehicle ownership categories in Torreon CDP Sandoval County are males with 5 or more vehicles (50, accounting for 57.5%) and females with 5 or more vehicles (20, making up 74.6%).
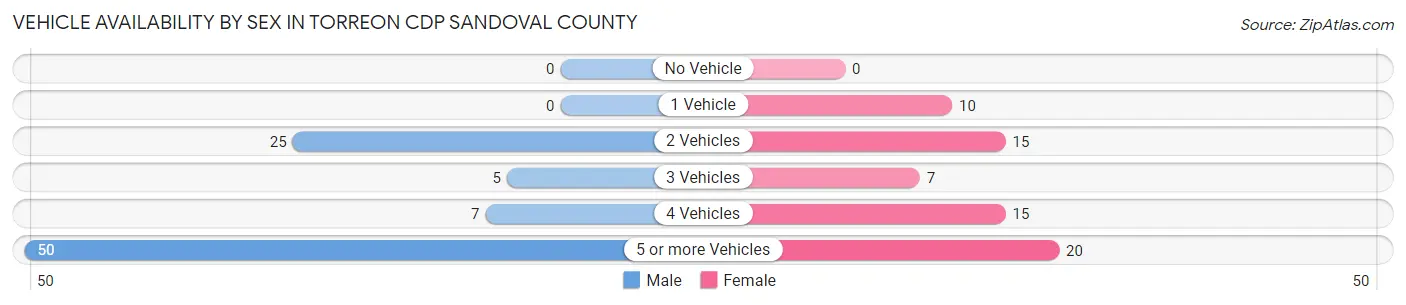
| Vehicles Available | Male | Female |
| No Vehicle | 0 (0.0%) | 0 (0.0%) |
| 1 Vehicle | 0 (0.0%) | 10 (14.9%) |
| 2 Vehicles | 25 (28.7%) | 15 (22.4%) |
| 3 Vehicles | 5 (5.8%) | 7 (10.4%) |
| 4 Vehicles | 7 (8.1%) | 15 (22.4%) |
| 5 or more Vehicles | 50 (57.5%) | 20 (29.8%) |
| Total | 87 (100.0%) | 67 (100.0%) |
Commute Time in Torreon CDP Sandoval County
The most frequently occuring commute durations in Torreon CDP Sandoval County are 30 to 34 minutes (53 commuters, 35.1%), 90 or more minutes (34 commuters, 22.5%), and 60 to 89 minutes (18 commuters, 11.9%).
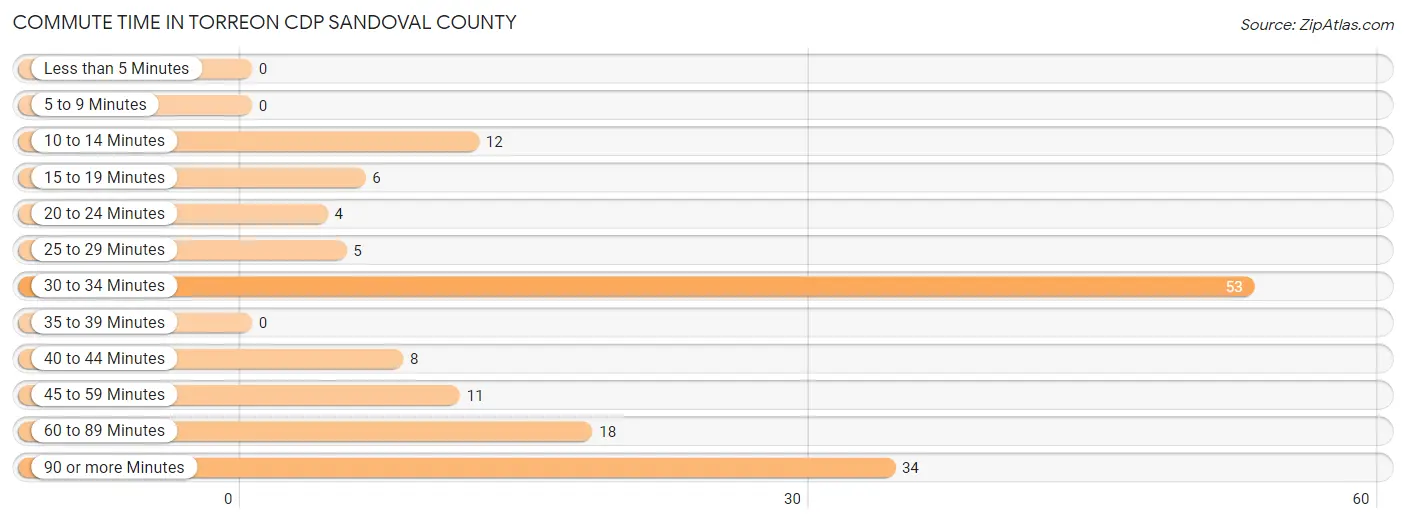
| Commute Time | # Commuters | % Commuters |
| Less than 5 Minutes | 0 | 0.0% |
| 5 to 9 Minutes | 0 | 0.0% |
| 10 to 14 Minutes | 12 | 8.0% |
| 15 to 19 Minutes | 6 | 4.0% |
| 20 to 24 Minutes | 4 | 2.6% |
| 25 to 29 Minutes | 5 | 3.3% |
| 30 to 34 Minutes | 53 | 35.1% |
| 35 to 39 Minutes | 0 | 0.0% |
| 40 to 44 Minutes | 8 | 5.3% |
| 45 to 59 Minutes | 11 | 7.3% |
| 60 to 89 Minutes | 18 | 11.9% |
| 90 or more Minutes | 34 | 22.5% |
Commute Time by Sex in Torreon CDP Sandoval County
The most common commute times in Torreon CDP Sandoval County are 30 to 34 minutes (37 commuters, 42.5%) for males and 60 to 89 minutes (18 commuters, 28.1%) for females.
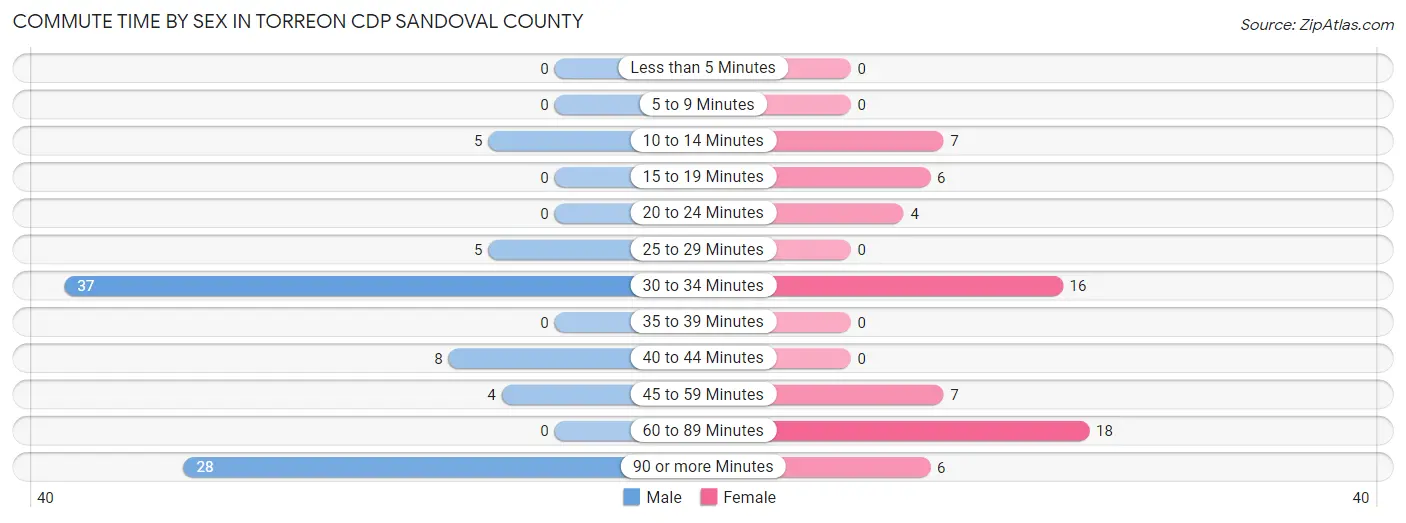
| Commute Time | Male | Female |
| Less than 5 Minutes | 0 (0.0%) | 0 (0.0%) |
| 5 to 9 Minutes | 0 (0.0%) | 0 (0.0%) |
| 10 to 14 Minutes | 5 (5.8%) | 7 (10.9%) |
| 15 to 19 Minutes | 0 (0.0%) | 6 (9.4%) |
| 20 to 24 Minutes | 0 (0.0%) | 4 (6.2%) |
| 25 to 29 Minutes | 5 (5.8%) | 0 (0.0%) |
| 30 to 34 Minutes | 37 (42.5%) | 16 (25.0%) |
| 35 to 39 Minutes | 0 (0.0%) | 0 (0.0%) |
| 40 to 44 Minutes | 8 (9.2%) | 0 (0.0%) |
| 45 to 59 Minutes | 4 (4.6%) | 7 (10.9%) |
| 60 to 89 Minutes | 0 (0.0%) | 18 (28.1%) |
| 90 or more Minutes | 28 (32.2%) | 6 (9.4%) |
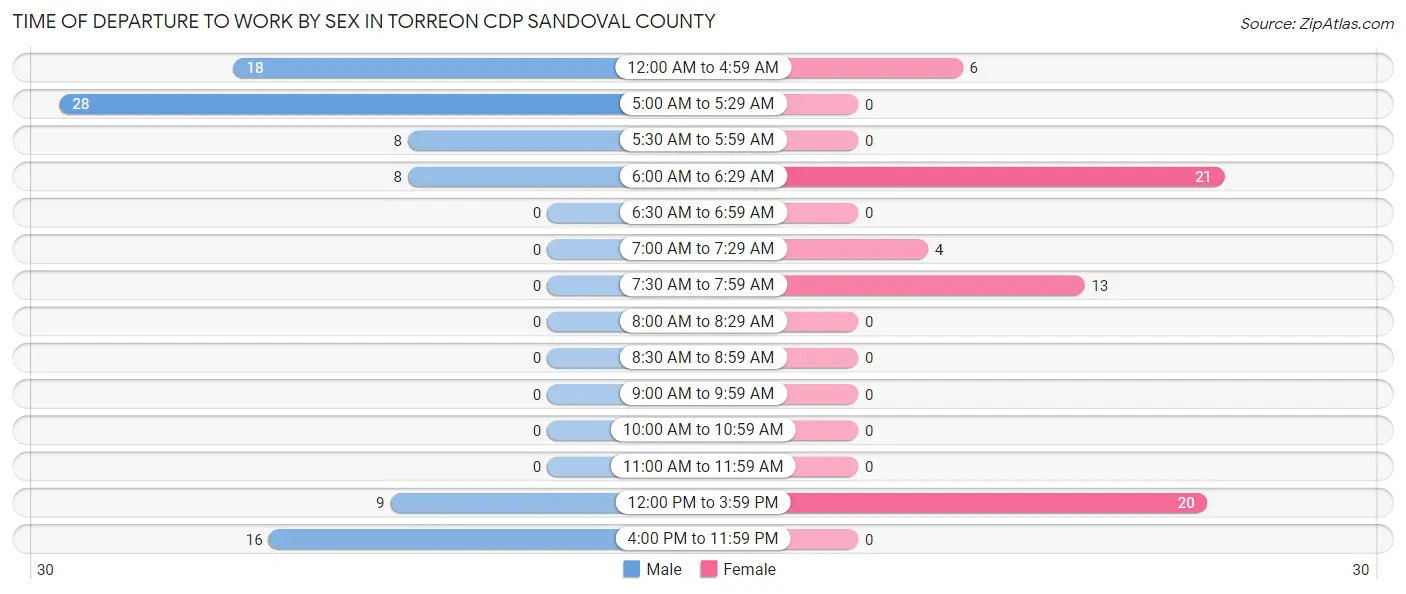
Time of Departure to Work by Sex in Torreon CDP Sandoval County
The most frequent times of departure to work in Torreon CDP Sandoval County are 5:00 AM to 5:29 AM (28, 32.2%) for males and 6:00 AM to 6:29 AM (21, 32.8%) for females.
| Time of Departure | Male | Female |
| 12:00 AM to 4:59 AM | 18 (20.7%) | 6 (9.4%) |
| 5:00 AM to 5:29 AM | 28 (32.2%) | 0 (0.0%) |
| 5:30 AM to 5:59 AM | 8 (9.2%) | 0 (0.0%) |
| 6:00 AM to 6:29 AM | 8 (9.2%) | 21 (32.8%) |
| 6:30 AM to 6:59 AM | 0 (0.0%) | 0 (0.0%) |
| 7:00 AM to 7:29 AM | 0 (0.0%) | 4 (6.2%) |
| 7:30 AM to 7:59 AM | 0 (0.0%) | 13 (20.3%) |
| 8:00 AM to 8:29 AM | 0 (0.0%) | 0 (0.0%) |
| 8:30 AM to 8:59 AM | 0 (0.0%) | 0 (0.0%) |
| 9:00 AM to 9:59 AM | 0 (0.0%) | 0 (0.0%) |
| 10:00 AM to 10:59 AM | 0 (0.0%) | 0 (0.0%) |
| 11:00 AM to 11:59 AM | 0 (0.0%) | 0 (0.0%) |
| 12:00 PM to 3:59 PM | 9 (10.3%) | 20 (31.2%) |
| 4:00 PM to 11:59 PM | 16 (18.4%) | 0 (0.0%) |
| Total | 87 (100.0%) | 64 (100.0%) |
Housing Occupancy in Torreon CDP Sandoval County
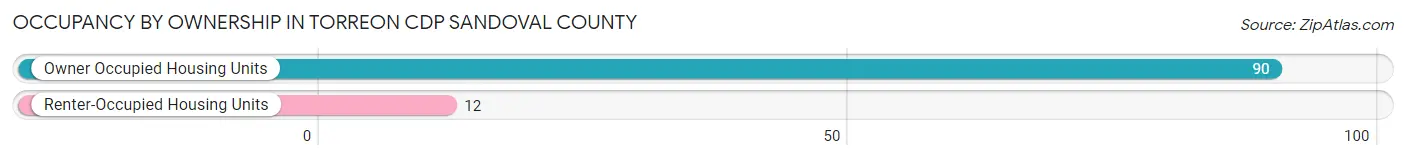
Occupancy by Ownership in Torreon CDP Sandoval County
Of the total 102 dwellings in Torreon CDP Sandoval County, owner-occupied units account for 90 (88.2%), while renter-occupied units make up 12 (11.8%).
| Occupancy | # Housing Units | % Housing Units |
| Owner Occupied Housing Units | 90 | 88.2% |
| Renter-Occupied Housing Units | 12 | 11.8% |
| Total Occupied Housing Units | 102 | 100.0% |
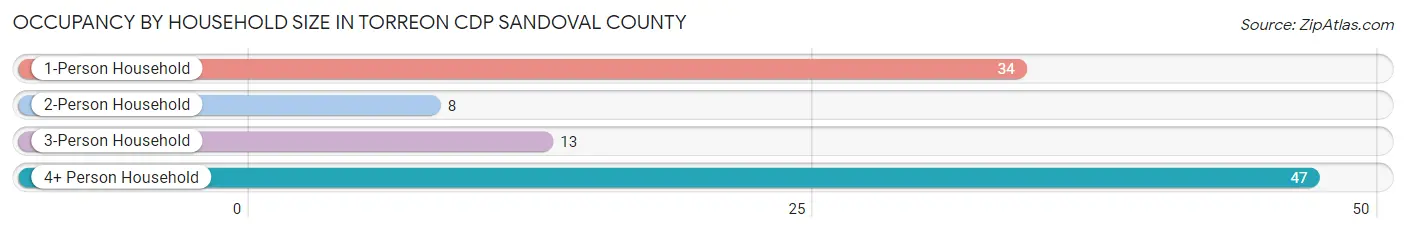
Occupancy by Household Size in Torreon CDP Sandoval County
| Household Size | # Housing Units | % Housing Units |
| 1-Person Household | 34 | 33.3% |
| 2-Person Household | 8 | 7.8% |
| 3-Person Household | 13 | 12.8% |
| 4+ Person Household | 47 | 46.1% |
| Total Housing Units | 102 | 100.0% |
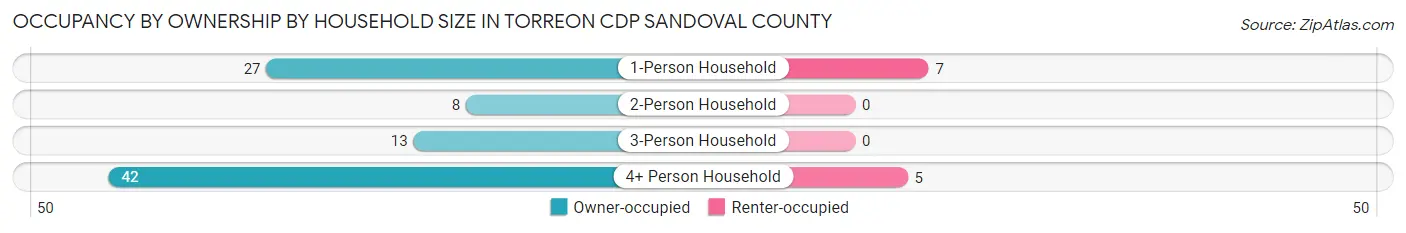
Occupancy by Ownership by Household Size in Torreon CDP Sandoval County
| Household Size | Owner-occupied | Renter-occupied |
| 1-Person Household | 27 (79.4%) | 7 (20.6%) |
| 2-Person Household | 8 (100.0%) | 0 (0.0%) |
| 3-Person Household | 13 (100.0%) | 0 (0.0%) |
| 4+ Person Household | 42 (89.4%) | 5 (10.6%) |
| Total Housing Units | 90 (88.2%) | 12 (11.8%) |
Occupancy by Educational Attainment in Torreon CDP Sandoval County
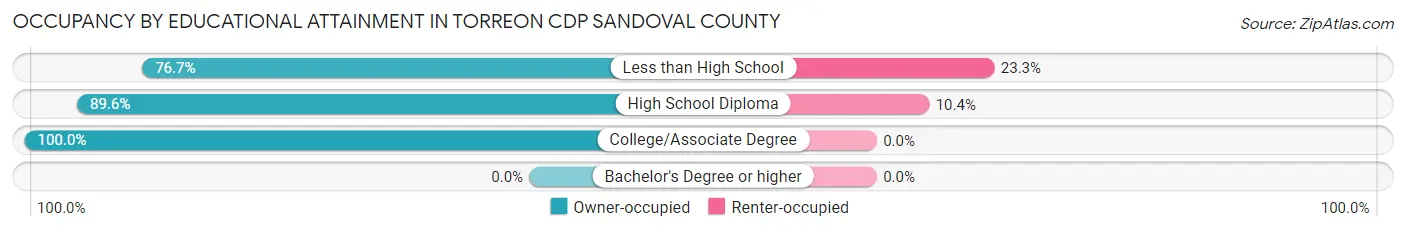
| Household Size | Owner-occupied | Renter-occupied |
| Less than High School | 23 (76.7%) | 7 (23.3%) |
| High School Diploma | 43 (89.6%) | 5 (10.4%) |
| College/Associate Degree | 24 (100.0%) | 0 (0.0%) |
| Bachelor's Degree or higher | 0 (0.0%) | 0 (0.0%) |
Occupancy by Age of Householder in Torreon CDP Sandoval County
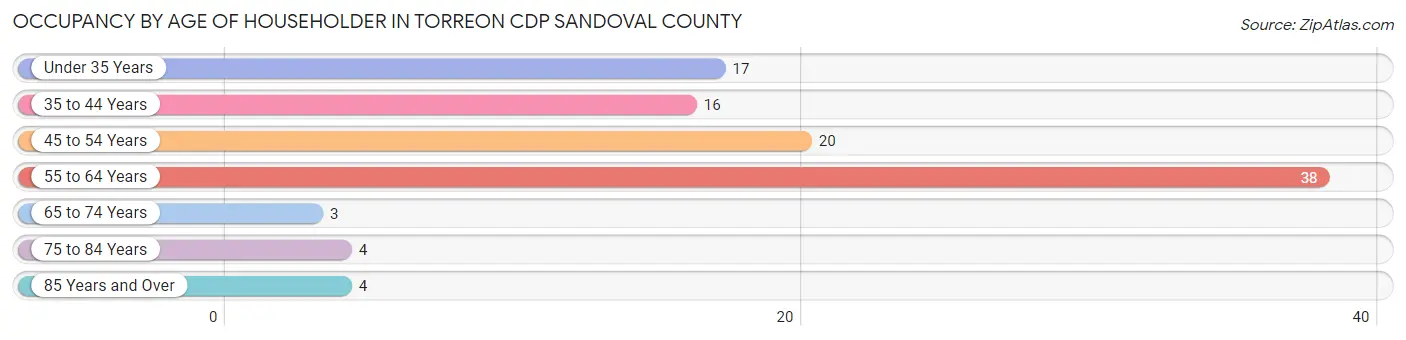
| Age Bracket | # Households | % Households |
| Under 35 Years | 17 | 16.7% |
| 35 to 44 Years | 16 | 15.7% |
| 45 to 54 Years | 20 | 19.6% |
| 55 to 64 Years | 38 | 37.2% |
| 65 to 74 Years | 3 | 2.9% |
| 75 to 84 Years | 4 | 3.9% |
| 85 Years and Over | 4 | 3.9% |
| Total | 102 | 100.0% |
Housing Finances in Torreon CDP Sandoval County
Median Income by Occupancy in Torreon CDP Sandoval County
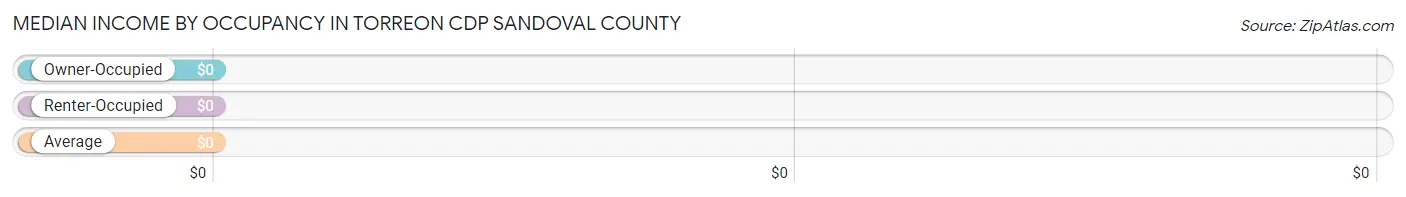
| Occupancy Type | # Households | Median Income |
| Owner-Occupied | 90 (88.2%) | $0 |
| Renter-Occupied | 12 (11.8%) | $0 |
| Average | 102 (100.0%) | $0 |
Occupancy by Householder Income Bracket in Torreon CDP Sandoval County
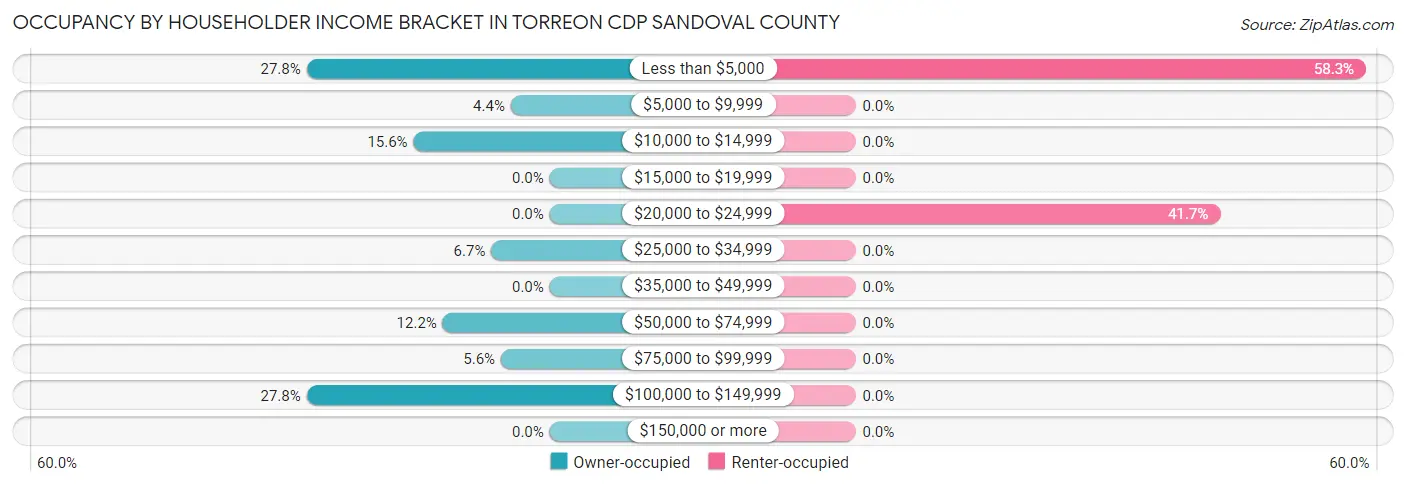
| Income Bracket | Owner-occupied | Renter-occupied |
| Less than $5,000 | 25 (27.8%) | 7 (58.3%) |
| $5,000 to $9,999 | 4 (4.4%) | 0 (0.0%) |
| $10,000 to $14,999 | 14 (15.6%) | 0 (0.0%) |
| $15,000 to $19,999 | 0 (0.0%) | 0 (0.0%) |
| $20,000 to $24,999 | 0 (0.0%) | 5 (41.7%) |
| $25,000 to $34,999 | 6 (6.7%) | 0 (0.0%) |
| $35,000 to $49,999 | 0 (0.0%) | 0 (0.0%) |
| $50,000 to $74,999 | 11 (12.2%) | 0 (0.0%) |
| $75,000 to $99,999 | 5 (5.6%) | 0 (0.0%) |
| $100,000 to $149,999 | 25 (27.8%) | 0 (0.0%) |
| $150,000 or more | 0 (0.0%) | 0 (0.0%) |
| Total | 90 (100.0%) | 12 (100.0%) |
Monthly Housing Cost Tiers in Torreon CDP Sandoval County
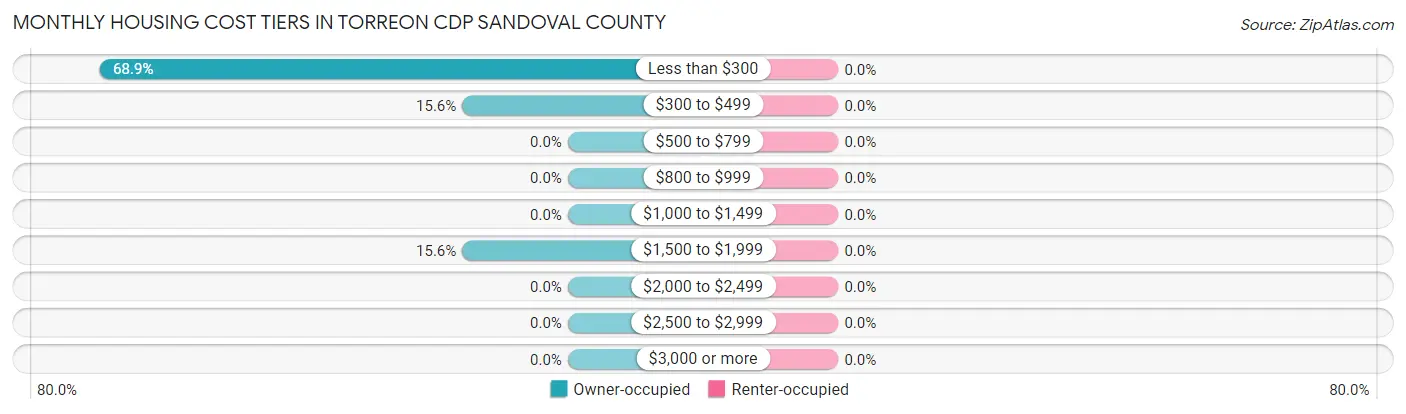
| Monthly Cost | Owner-occupied | Renter-occupied |
| Less than $300 | 62 (68.9%) | 0 (0.0%) |
| $300 to $499 | 14 (15.6%) | 0 (0.0%) |
| $500 to $799 | 0 (0.0%) | 0 (0.0%) |
| $800 to $999 | 0 (0.0%) | 0 (0.0%) |
| $1,000 to $1,499 | 0 (0.0%) | 0 (0.0%) |
| $1,500 to $1,999 | 14 (15.6%) | 0 (0.0%) |
| $2,000 to $2,499 | 0 (0.0%) | 0 (0.0%) |
| $2,500 to $2,999 | 0 (0.0%) | 0 (0.0%) |
| $3,000 or more | 0 (0.0%) | 0 (0.0%) |
| Total | 90 (100.0%) | 12 (100.0%) |
Physical Housing Characteristics in Torreon CDP Sandoval County
Housing Structures in Torreon CDP Sandoval County
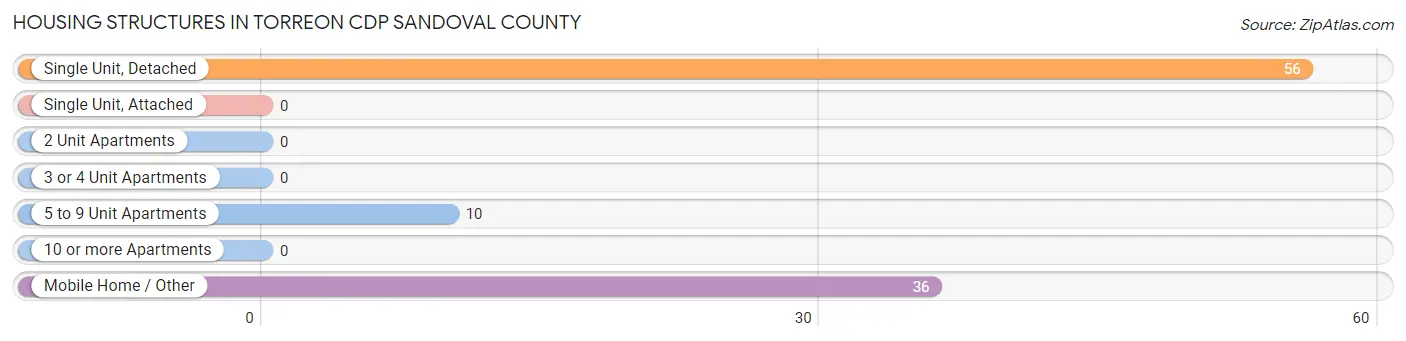
| Structure Type | # Housing Units | % Housing Units |
| Single Unit, Detached | 56 | 54.9% |
| Single Unit, Attached | 0 | 0.0% |
| 2 Unit Apartments | 0 | 0.0% |
| 3 or 4 Unit Apartments | 0 | 0.0% |
| 5 to 9 Unit Apartments | 10 | 9.8% |
| 10 or more Apartments | 0 | 0.0% |
| Mobile Home / Other | 36 | 35.3% |
| Total | 102 | 100.0% |
Housing Structures by Occupancy in Torreon CDP Sandoval County
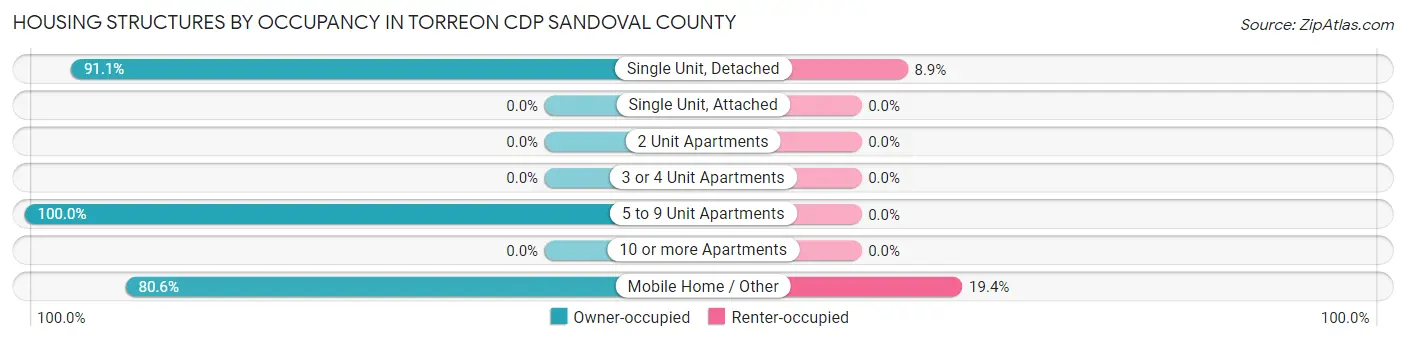
| Structure Type | Owner-occupied | Renter-occupied |
| Single Unit, Detached | 51 (91.1%) | 5 (8.9%) |
| Single Unit, Attached | 0 (0.0%) | 0 (0.0%) |
| 2 Unit Apartments | 0 (0.0%) | 0 (0.0%) |
| 3 or 4 Unit Apartments | 0 (0.0%) | 0 (0.0%) |
| 5 to 9 Unit Apartments | 10 (100.0%) | 0 (0.0%) |
| 10 or more Apartments | 0 (0.0%) | 0 (0.0%) |
| Mobile Home / Other | 29 (80.6%) | 7 (19.4%) |
| Total | 90 (88.2%) | 12 (11.8%) |
Housing Structures by Number of Rooms in Torreon CDP Sandoval County
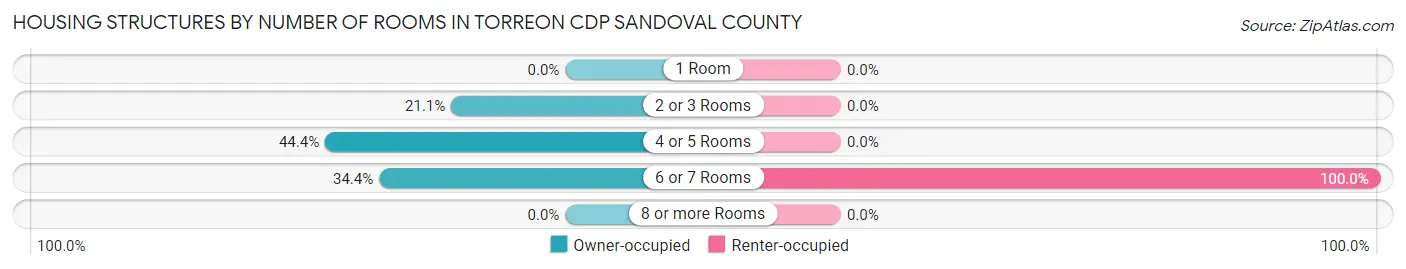
| Number of Rooms | Owner-occupied | Renter-occupied |
| 1 Room | 0 (0.0%) | 0 (0.0%) |
| 2 or 3 Rooms | 19 (21.1%) | 0 (0.0%) |
| 4 or 5 Rooms | 40 (44.4%) | 0 (0.0%) |
| 6 or 7 Rooms | 31 (34.4%) | 12 (100.0%) |
| 8 or more Rooms | 0 (0.0%) | 0 (0.0%) |
| Total | 90 (100.0%) | 12 (100.0%) |
Housing Structure by Heating Type in Torreon CDP Sandoval County
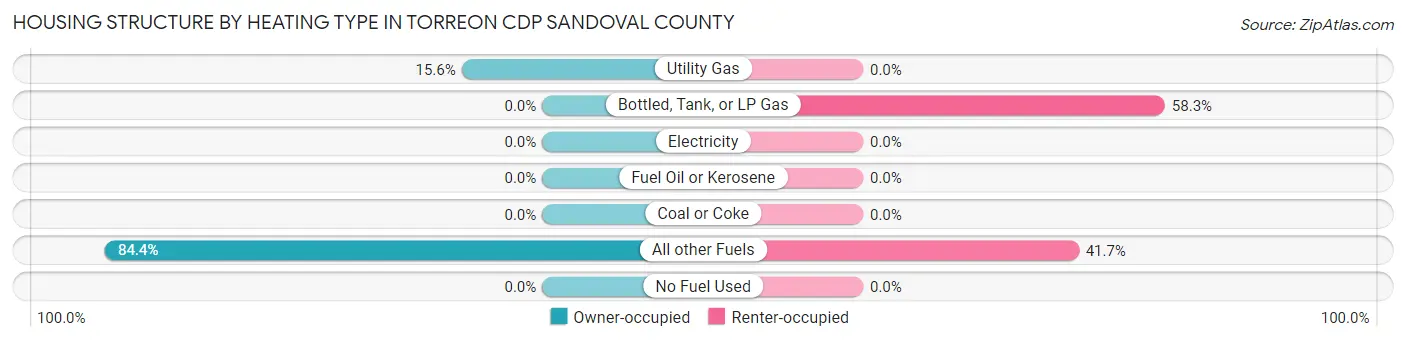
| Heating Type | Owner-occupied | Renter-occupied |
| Utility Gas | 14 (15.6%) | 0 (0.0%) |
| Bottled, Tank, or LP Gas | 0 (0.0%) | 7 (58.3%) |
| Electricity | 0 (0.0%) | 0 (0.0%) |
| Fuel Oil or Kerosene | 0 (0.0%) | 0 (0.0%) |
| Coal or Coke | 0 (0.0%) | 0 (0.0%) |
| All other Fuels | 76 (84.4%) | 5 (41.7%) |
| No Fuel Used | 0 (0.0%) | 0 (0.0%) |
| Total | 90 (100.0%) | 12 (100.0%) |
Household Vehicle Usage in Torreon CDP Sandoval County
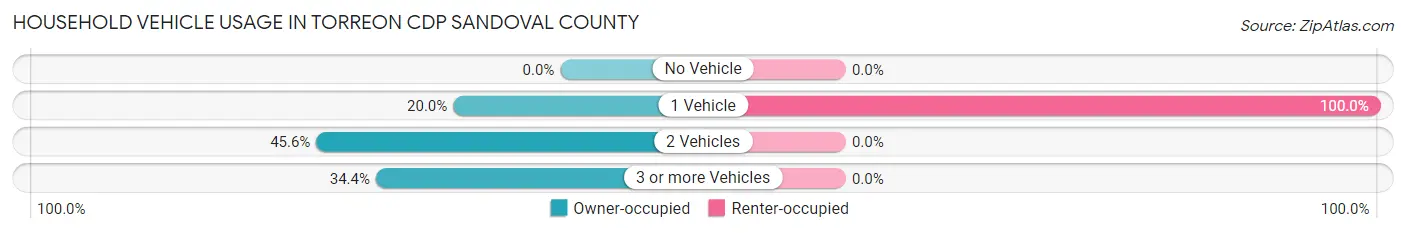
| Vehicles per Household | Owner-occupied | Renter-occupied |
| No Vehicle | 0 (0.0%) | 0 (0.0%) |
| 1 Vehicle | 18 (20.0%) | 12 (100.0%) |
| 2 Vehicles | 41 (45.6%) | 0 (0.0%) |
| 3 or more Vehicles | 31 (34.4%) | 0 (0.0%) |
| Total | 90 (100.0%) | 12 (100.0%) |
Real Estate & Mortgages in Torreon CDP Sandoval County
Real Estate and Mortgage Overview in Torreon CDP Sandoval County
| Characteristic | Without Mortgage | With Mortgage |
| Housing Units | 86 | 4 |
| Median Property Value | - | - |
| Median Household Income | - | - |
| Monthly Housing Costs | $245 | $0 |
| Real Estate Taxes | $199 | $0 |
Property Value by Mortgage Status in Torreon CDP Sandoval County
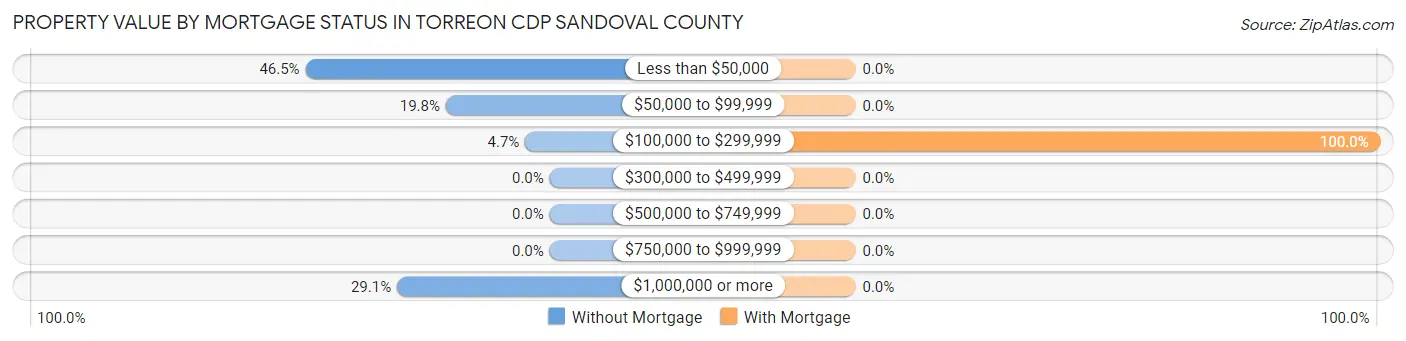
| Property Value | Without Mortgage | With Mortgage |
| Less than $50,000 | 40 (46.5%) | 0 (0.0%) |
| $50,000 to $99,999 | 17 (19.8%) | 0 (0.0%) |
| $100,000 to $299,999 | 4 (4.6%) | 4 (100.0%) |
| $300,000 to $499,999 | 0 (0.0%) | 0 (0.0%) |
| $500,000 to $749,999 | 0 (0.0%) | 0 (0.0%) |
| $750,000 to $999,999 | 0 (0.0%) | 0 (0.0%) |
| $1,000,000 or more | 25 (29.1%) | 0 (0.0%) |
| Total | 86 (100.0%) | 4 (100.0%) |
Household Income by Mortgage Status in Torreon CDP Sandoval County
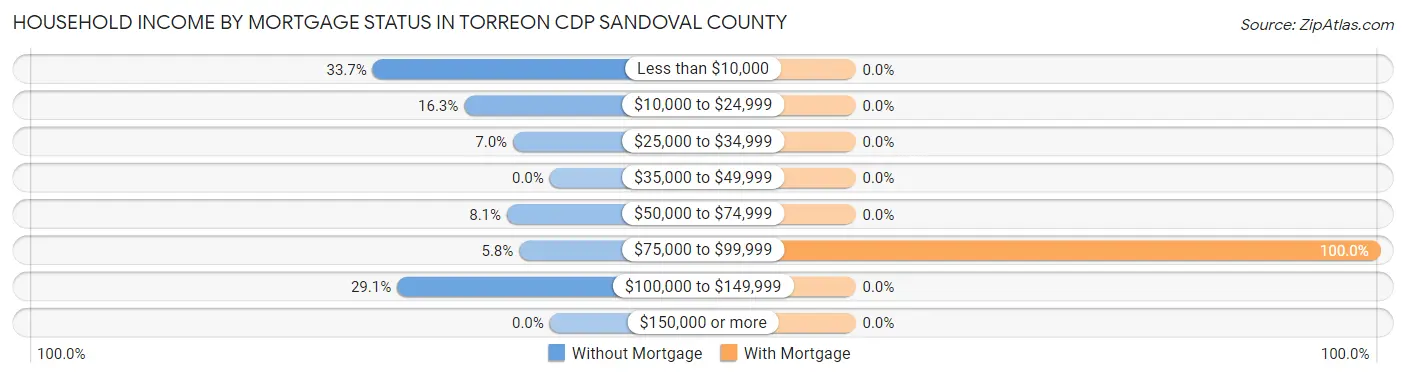
| Household Income | Without Mortgage | With Mortgage |
| Less than $10,000 | 29 (33.7%) | 0 (0.0%) |
| $10,000 to $24,999 | 14 (16.3%) | 0 (0.0%) |
| $25,000 to $34,999 | 6 (7.0%) | 0 (0.0%) |
| $35,000 to $49,999 | 0 (0.0%) | 0 (0.0%) |
| $50,000 to $74,999 | 7 (8.1%) | 0 (0.0%) |
| $75,000 to $99,999 | 5 (5.8%) | 4 (100.0%) |
| $100,000 to $149,999 | 25 (29.1%) | 0 (0.0%) |
| $150,000 or more | 0 (0.0%) | 0 (0.0%) |
| Total | 86 (100.0%) | 4 (100.0%) |
Property Value to Household Income Ratio in Torreon CDP Sandoval County
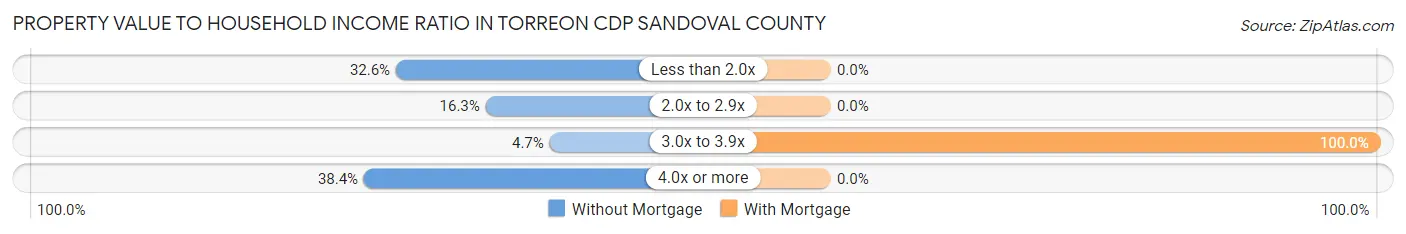
| Value-to-Income Ratio | Without Mortgage | With Mortgage |
| Less than 2.0x | 28 (32.6%) | 0 (0.0%) |
| 2.0x to 2.9x | 14 (16.3%) | 0 (0.0%) |
| 3.0x to 3.9x | 4 (4.6%) | 4 (100.0%) |
| 4.0x or more | 33 (38.4%) | 0 (0.0%) |
| Total | 86 (100.0%) | 4 (100.0%) |
Real Estate Taxes by Mortgage Status in Torreon CDP Sandoval County
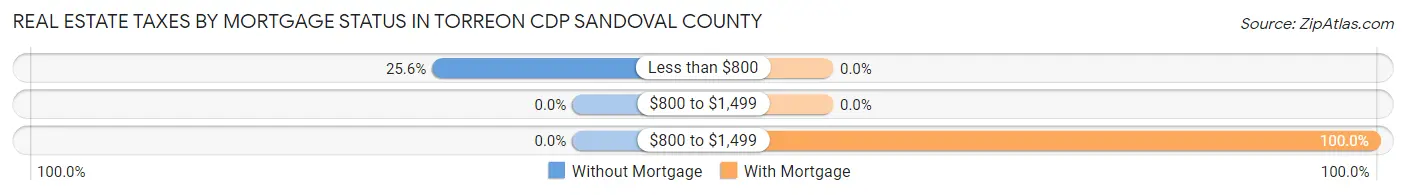
| Property Taxes | Without Mortgage | With Mortgage |
| Less than $800 | 22 (25.6%) | 0 (0.0%) |
| $800 to $1,499 | 0 (0.0%) | 0 (0.0%) |
| $800 to $1,499 | 0 (0.0%) | 4 (100.0%) |
| Total | 86 (100.0%) | 4 (100.0%) |
Health & Disability in Torreon CDP Sandoval County
Health Insurance Coverage by Age in Torreon CDP Sandoval County
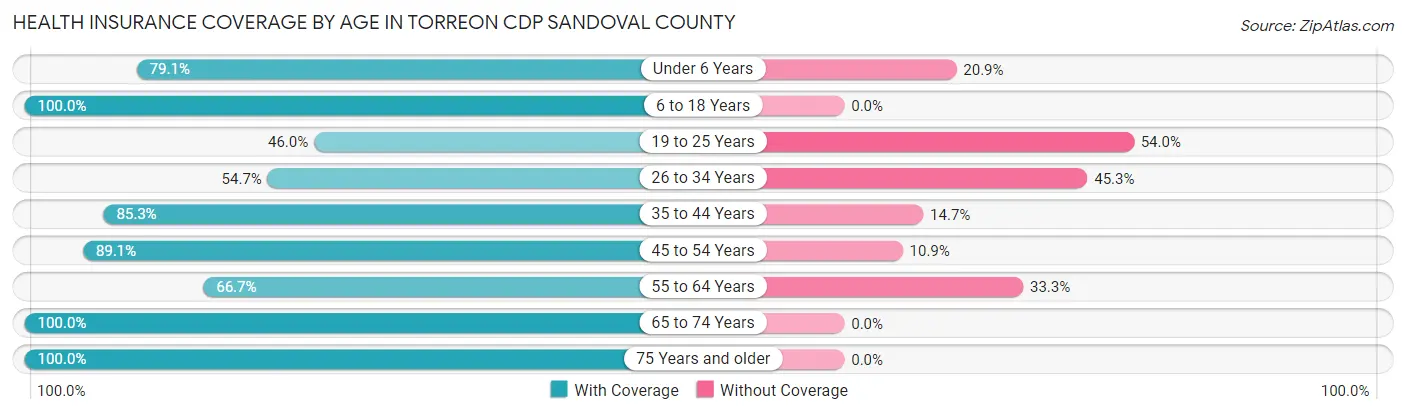
| Age Bracket | With Coverage | Without Coverage |
| Under 6 Years | 53 (79.1%) | 14 (20.9%) |
| 6 to 18 Years | 70 (100.0%) | 0 (0.0%) |
| 19 to 25 Years | 29 (46.0%) | 34 (54.0%) |
| 26 to 34 Years | 76 (54.7%) | 63 (45.3%) |
| 35 to 44 Years | 29 (85.3%) | 5 (14.7%) |
| 45 to 54 Years | 41 (89.1%) | 5 (10.9%) |
| 55 to 64 Years | 36 (66.7%) | 18 (33.3%) |
| 65 to 74 Years | 5 (100.0%) | 0 (0.0%) |
| 75 Years and older | 11 (100.0%) | 0 (0.0%) |
| Total | 350 (71.6%) | 139 (28.4%) |
Health Insurance Coverage by Citizenship Status in Torreon CDP Sandoval County
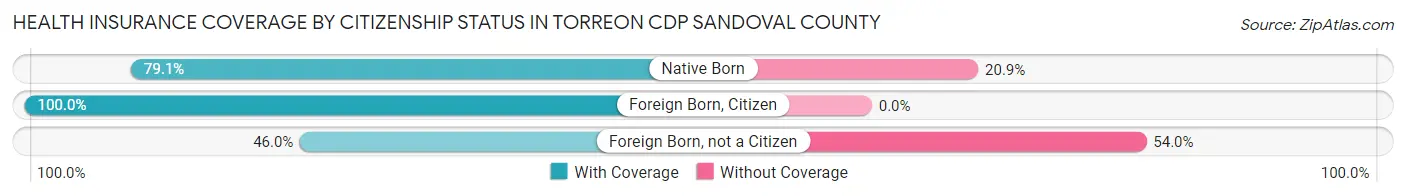
| Citizenship Status | With Coverage | Without Coverage |
| Native Born | 53 (79.1%) | 14 (20.9%) |
| Foreign Born, Citizen | 70 (100.0%) | 0 (0.0%) |
| Foreign Born, not a Citizen | 29 (46.0%) | 34 (54.0%) |
Health Insurance Coverage by Household Income in Torreon CDP Sandoval County
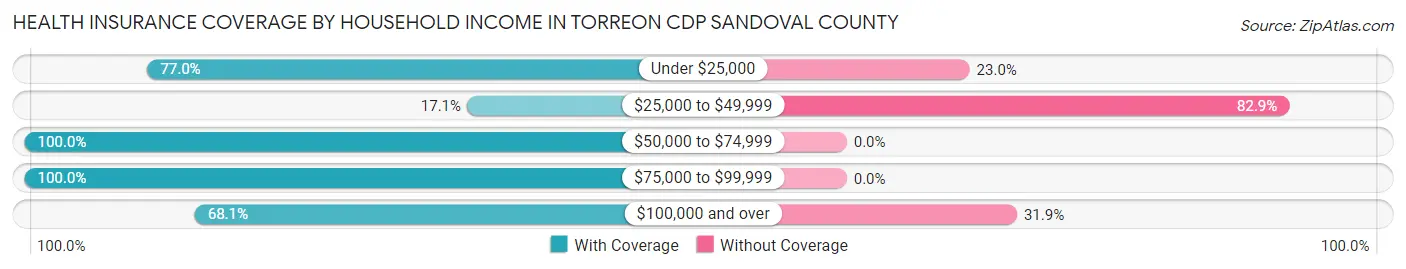
| Household Income | With Coverage | Without Coverage |
| Under $25,000 | 97 (77.0%) | 29 (23.0%) |
| $25,000 to $49,999 | 6 (17.1%) | 29 (82.9%) |
| $50,000 to $74,999 | 42 (100.0%) | 0 (0.0%) |
| $75,000 to $99,999 | 17 (100.0%) | 0 (0.0%) |
| $100,000 and over | 173 (68.1%) | 81 (31.9%) |
Public vs Private Health Insurance Coverage by Age in Torreon CDP Sandoval County
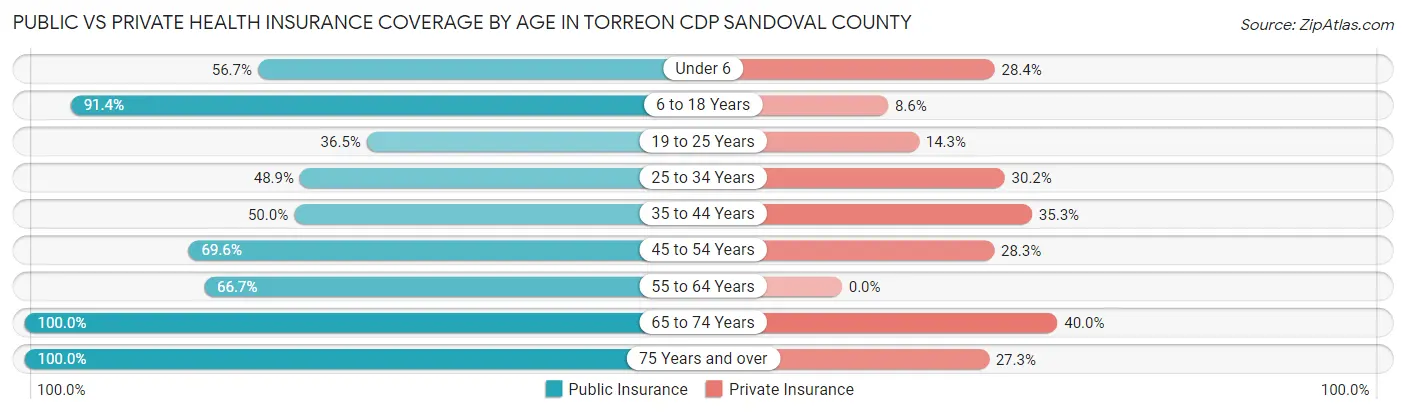
| Age Bracket | Public Insurance | Private Insurance |
| Under 6 | 38 (56.7%) | 19 (28.4%) |
| 6 to 18 Years | 64 (91.4%) | 6 (8.6%) |
| 19 to 25 Years | 23 (36.5%) | 9 (14.3%) |
| 25 to 34 Years | 68 (48.9%) | 42 (30.2%) |
| 35 to 44 Years | 17 (50.0%) | 12 (35.3%) |
| 45 to 54 Years | 32 (69.6%) | 13 (28.3%) |
| 55 to 64 Years | 36 (66.7%) | 0 (0.0%) |
| 65 to 74 Years | 5 (100.0%) | 2 (40.0%) |
| 75 Years and over | 11 (100.0%) | 3 (27.3%) |
| Total | 294 (60.1%) | 106 (21.7%) |
Disability Status by Sex by Age in Torreon CDP Sandoval County
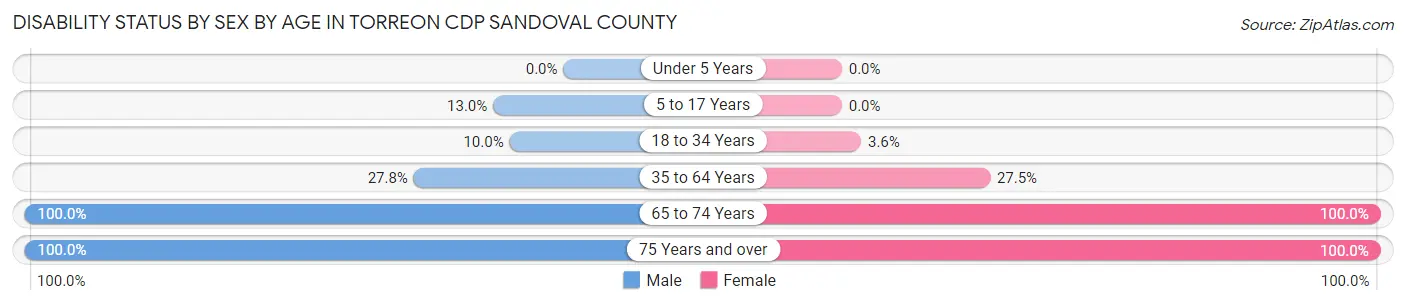
| Age Bracket | Male | Female |
| Under 5 Years | 0 (0.0%) | 0 (0.0%) |
| 5 to 17 Years | 6 (13.0%) | 0 (0.0%) |
| 18 to 34 Years | 12 (10.0%) | 3 (3.6%) |
| 35 to 64 Years | 15 (27.8%) | 22 (27.5%) |
| 65 to 74 Years | 3 (100.0%) | 2 (100.0%) |
| 75 Years and over | 3 (100.0%) | 8 (100.0%) |
Disability Class by Sex by Age in Torreon CDP Sandoval County
Disability Class: Hearing Difficulty
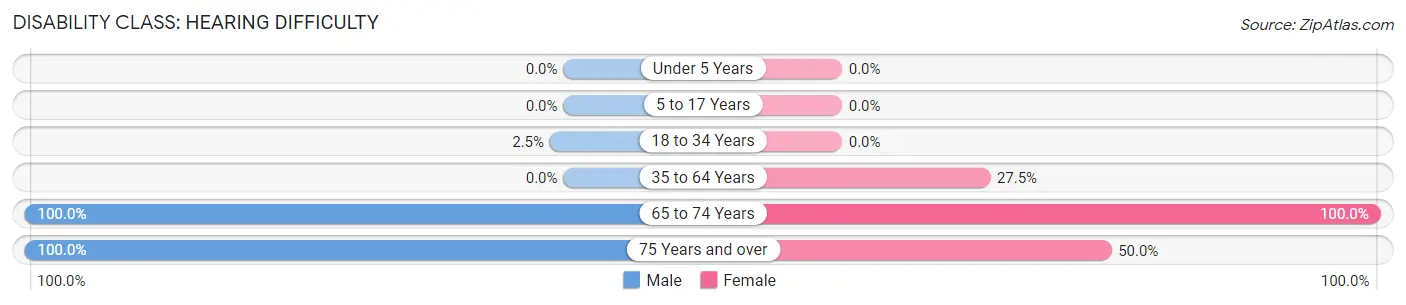
| Age Bracket | Male | Female |
| Under 5 Years | 0 (0.0%) | 0 (0.0%) |
| 5 to 17 Years | 0 (0.0%) | 0 (0.0%) |
| 18 to 34 Years | 3 (2.5%) | 0 (0.0%) |
| 35 to 64 Years | 0 (0.0%) | 22 (27.5%) |
| 65 to 74 Years | 3 (100.0%) | 2 (100.0%) |
| 75 Years and over | 3 (100.0%) | 4 (50.0%) |
Disability Class: Vision Difficulty
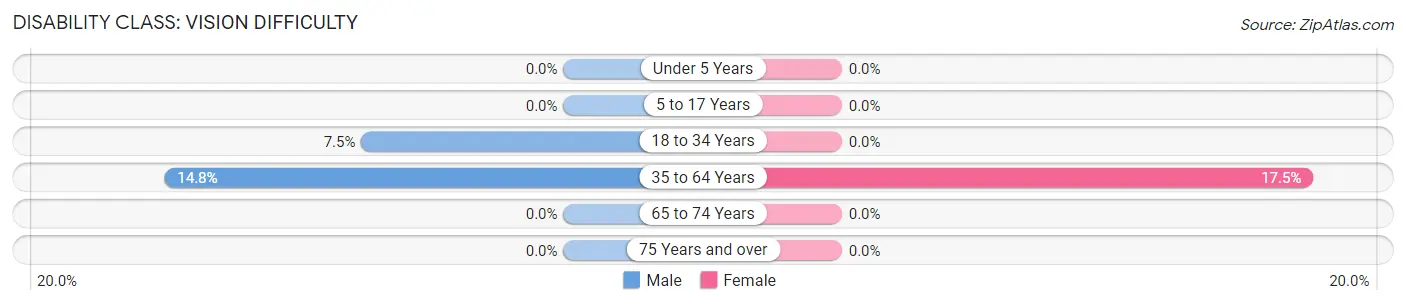
| Age Bracket | Male | Female |
| Under 5 Years | 0 (0.0%) | 0 (0.0%) |
| 5 to 17 Years | 0 (0.0%) | 0 (0.0%) |
| 18 to 34 Years | 9 (7.5%) | 0 (0.0%) |
| 35 to 64 Years | 8 (14.8%) | 14 (17.5%) |
| 65 to 74 Years | 0 (0.0%) | 0 (0.0%) |
| 75 Years and over | 0 (0.0%) | 0 (0.0%) |
Disability Class: Cognitive Difficulty
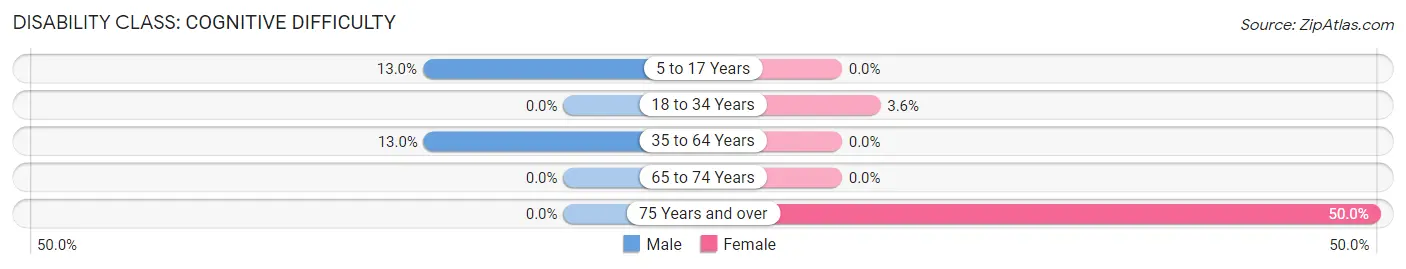
| Age Bracket | Male | Female |
| 5 to 17 Years | 6 (13.0%) | 0 (0.0%) |
| 18 to 34 Years | 0 (0.0%) | 3 (3.6%) |
| 35 to 64 Years | 7 (13.0%) | 0 (0.0%) |
| 65 to 74 Years | 0 (0.0%) | 0 (0.0%) |
| 75 Years and over | 0 (0.0%) | 4 (50.0%) |
Disability Class: Ambulatory Difficulty
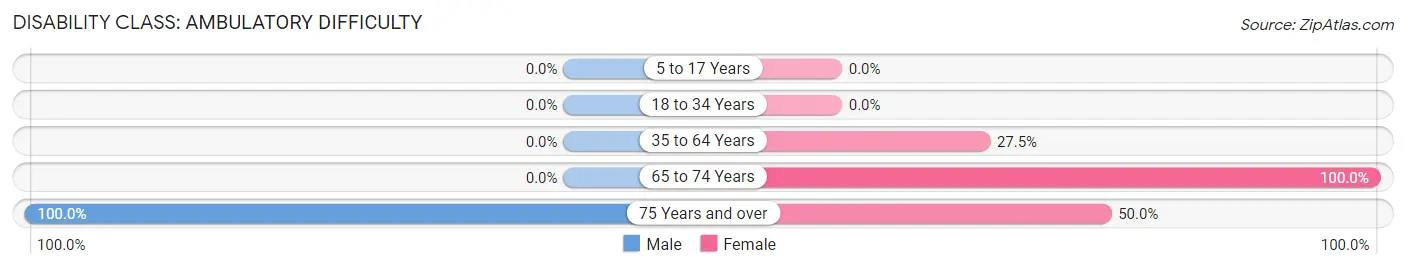
| Age Bracket | Male | Female |
| 5 to 17 Years | 0 (0.0%) | 0 (0.0%) |
| 18 to 34 Years | 0 (0.0%) | 0 (0.0%) |
| 35 to 64 Years | 0 (0.0%) | 22 (27.5%) |
| 65 to 74 Years | 0 (0.0%) | 2 (100.0%) |
| 75 Years and over | 3 (100.0%) | 4 (50.0%) |
Disability Class: Self-Care Difficulty
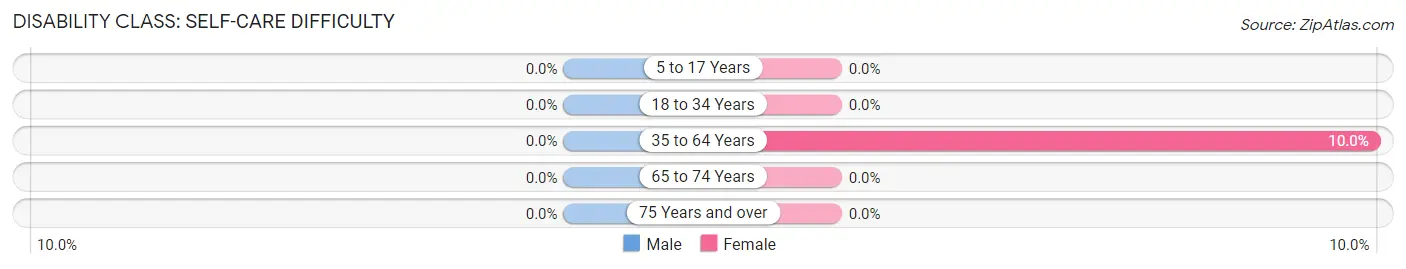
| Age Bracket | Male | Female |
| 5 to 17 Years | 0 (0.0%) | 0 (0.0%) |
| 18 to 34 Years | 0 (0.0%) | 0 (0.0%) |
| 35 to 64 Years | 0 (0.0%) | 8 (10.0%) |
| 65 to 74 Years | 0 (0.0%) | 0 (0.0%) |
| 75 Years and over | 0 (0.0%) | 0 (0.0%) |
Technology Access in Torreon CDP Sandoval County
Computing Device Access in Torreon CDP Sandoval County
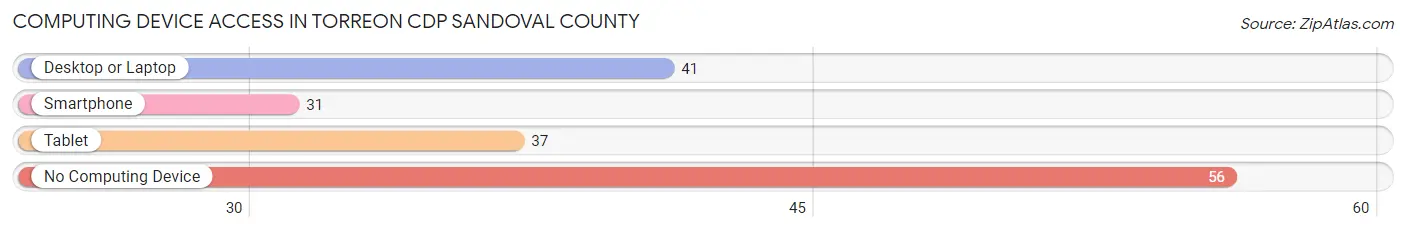
| Device Type | # Households | % Households |
| Desktop or Laptop | 41 | 40.2% |
| Smartphone | 31 | 30.4% |
| Tablet | 37 | 36.3% |
| No Computing Device | 56 | 54.9% |
| Total | 102 | 100.0% |
Internet Access in Torreon CDP Sandoval County
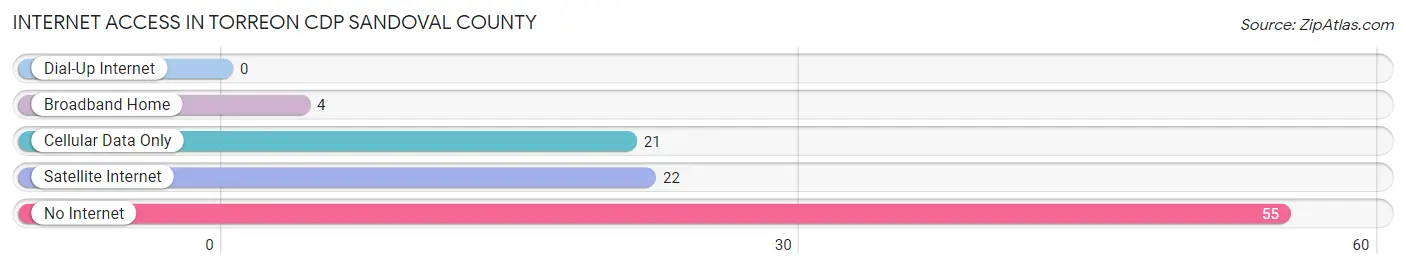
| Internet Type | # Households | % Households |
| Dial-Up Internet | 0 | 0.0% |
| Broadband Home | 4 | 3.9% |
| Cellular Data Only | 21 | 20.6% |
| Satellite Internet | 22 | 21.6% |
| No Internet | 55 | 53.9% |
| Total | 102 | 100.0% |
Torreon CDP Sandoval County Summary
Torreon Cdp is a census-designated place (CDP) located in Sandoval County, New Mexico. It is situated in the northern part of the state, approximately 25 miles north of Albuquerque. As of the 2010 census, the population of Torreon Cdp was 1,845.
Geography
Torreon Cdp is located at 35°25'17" North, 106°37'45" West (35.4214, -106.6292). It has an elevation of 6,845 feet above sea level. The CDP covers an area of 4.3 square miles, all of which is land.
The climate in Torreon Cdp is semi-arid, with hot summers and cold winters. The average annual temperature is 54°F, with an average high of 79°F in July and an average low of 28°F in January. The average annual precipitation is 11.5 inches, with most of it falling in the summer months.
Demographics
As of the 2010 census, there were 1,845 people, 645 households, and 486 families residing in Torreon Cdp. The population density was 428.3 people per square mile. The racial makeup of the CDP was 79.2% White, 0.7% African American, 1.2% Native American, 0.2% Asian, 0.1% Pacific Islander, 16.2% from other races, and 2.6% from two or more races. Hispanic or Latino of any race were 43.2% of the population.
There were 645 households, out of which 37.2% had children under the age of 18 living with them, 54.3% were married couples living together, 13.2% had a female householder with no husband present, and 25.2% were non-families. 20.2% of all households were made up of individuals, and 6.2% had someone living alone who was 65 years of age or older. The average household size was 2.86 and the average family size was 3.30.
The median age in Torreon Cdp was 33.3 years. 28.2% of residents were under the age of 18; 8.7% were between the ages of 18 and 24; 27.2% were from 25 to 44; 25.2% were from 45 to 64; and 10.7% were 65 years of age or older. The gender makeup of the CDP was 49.2% male and 50.8% female.
Economy
The economy of Torreon Cdp is largely based on agriculture and tourism. The area is home to several farms and ranches, which produce a variety of crops, including alfalfa, hay, and corn. The area is also popular with tourists, who come to enjoy the scenic views and outdoor activities.
The median household income in Torreon Cdp was $37,917 in 2018, and the median family income was $41,917. The per capita income was $17,917. About 16.2% of families and 19.2% of the population were below the poverty line, including 25.2% of those under age 18 and 8.7% of those age 65 or over.
Conclusion
Torreon Cdp is a census-designated place located in Sandoval County, New Mexico. It is situated in the northern part of the state, approximately 25 miles north of Albuquerque. As of the 2010 census, the population of Torreon Cdp was 1,845. The CDP covers an area of 4.3 square miles, all of which is land. The climate in Torreon Cdp is semi-arid, with hot summers and cold winters. The economy of Torreon Cdp is largely based on agriculture and tourism. The median household income in Torreon Cdp was $37,917 in 2018, and the median family income was $41,917.
Common Questions
What is Per Capita Income in Torreon CDP Sandoval County?
Per Capita income in Torreon CDP Sandoval County is $11,986.
What is the Median Family Income in Torreon CDP Sandoval County?
Median Family Income in Torreon CDP Sandoval County is $39,000.
What is Income or Wage Gap in Torreon CDP Sandoval County?
Income or Wage Gap in Torreon CDP Sandoval County is 26.9%.
Women in Torreon CDP Sandoval County earn 73.1 cents for every dollar earned by a man.
What is Inequality or Gini Index in Torreon CDP Sandoval County?
Inequality or Gini Index in Torreon CDP Sandoval County is 0.57.
What is the Total Population of Torreon CDP Sandoval County?
Total Population of Torreon CDP Sandoval County is 489.
What is the Total Male Population of Torreon CDP Sandoval County?
Total Male Population of Torreon CDP Sandoval County is 275.
What is the Total Female Population of Torreon CDP Sandoval County?
Total Female Population of Torreon CDP Sandoval County is 214.
What is the Ratio of Males per 100 Females in Torreon CDP Sandoval County?
There are 128.50 Males per 100 Females in Torreon CDP Sandoval County.
What is the Ratio of Females per 100 Males in Torreon CDP Sandoval County?
There are 77.82 Females per 100 Males in Torreon CDP Sandoval County.
What is the Median Population Age in Torreon CDP Sandoval County?
Median Population Age in Torreon CDP Sandoval County is 26.8 Years.
What is the Average Family Size in Torreon CDP Sandoval County
Average Family Size in Torreon CDP Sandoval County is 5.5 People.
What is the Average Household Size in Torreon CDP Sandoval County
Average Household Size in Torreon CDP Sandoval County is 4.7 People.
How Large is the Labor Force in Torreon CDP Sandoval County?
There are 172 People in the Labor Forcein in Torreon CDP Sandoval County.
What is the Percentage of People in the Labor Force in Torreon CDP Sandoval County?
47.8% of People are in the Labor Force in Torreon CDP Sandoval County.
What is the Unemployment Rate in Torreon CDP Sandoval County?
Unemployment Rate in Torreon CDP Sandoval County is 10.5%.