Duquesne, MO Map & Demographics
Duquesne Map
Duquesne Overview
$25,897
PER CAPITA INCOME
$59,688
AVG FAMILY INCOME
$48,561
AVG HOUSEHOLD INCOME
23.4%
WAGE / INCOME GAP [ % ]
76.6¢/ $1
WAGE / INCOME GAP [ $ ]
0.35
INEQUALITY / GINI INDEX
2,297
TOTAL POPULATION
1,145
MALE POPULATION
1,152
FEMALE POPULATION
99.39
MALES / 100 FEMALES
100.61
FEMALES / 100 MALES
36.2
MEDIAN AGE
3.0
AVG FAMILY SIZE
2.4
AVG HOUSEHOLD SIZE
1,190
LABOR FORCE [ PEOPLE ]
63.1%
PERCENT IN LABOR FORCE
2.9%
UNEMPLOYMENT RATE
Income in Duquesne
Income Overview in Duquesne
Per Capita Income in Duquesne is $25,897, while median incomes of families and households are $59,688 and $48,561 respectively.
| Characteristic | Number | Measure |
| Per Capita Income | 2,297 | $25,897 |
| Median Family Income | 554 | $59,688 |
| Mean Family Income | 554 | $66,979 |
| Median Household Income | 971 | $48,561 |
| Mean Household Income | 971 | $60,585 |
| Income Deficit | 554 | $0 |
| Wage / Income Gap (%) | 2,297 | 23.39% |
| Wage / Income Gap ($) | 2,297 | 76.61¢ per $1 |
| Gini / Inequality Index | 2,297 | 0.35 |
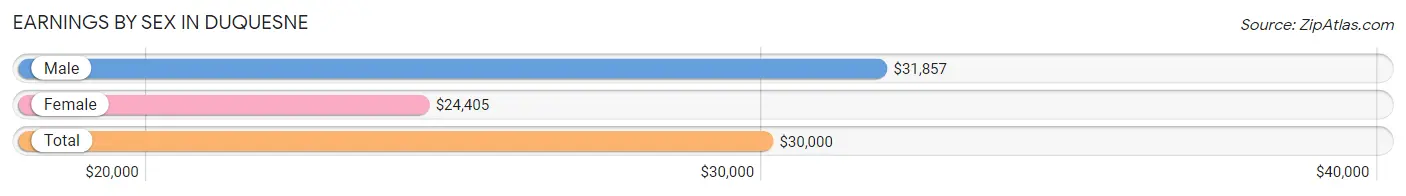
Earnings by Sex in Duquesne
Average Earnings in Duquesne are $30,000, $31,857 for men and $24,405 for women, a difference of 23.4%.
| Sex | Number | Average Earnings |
| Male | 676 (53.1%) | $31,857 |
| Female | 598 (46.9%) | $24,405 |
| Total | 1,274 (100.0%) | $30,000 |
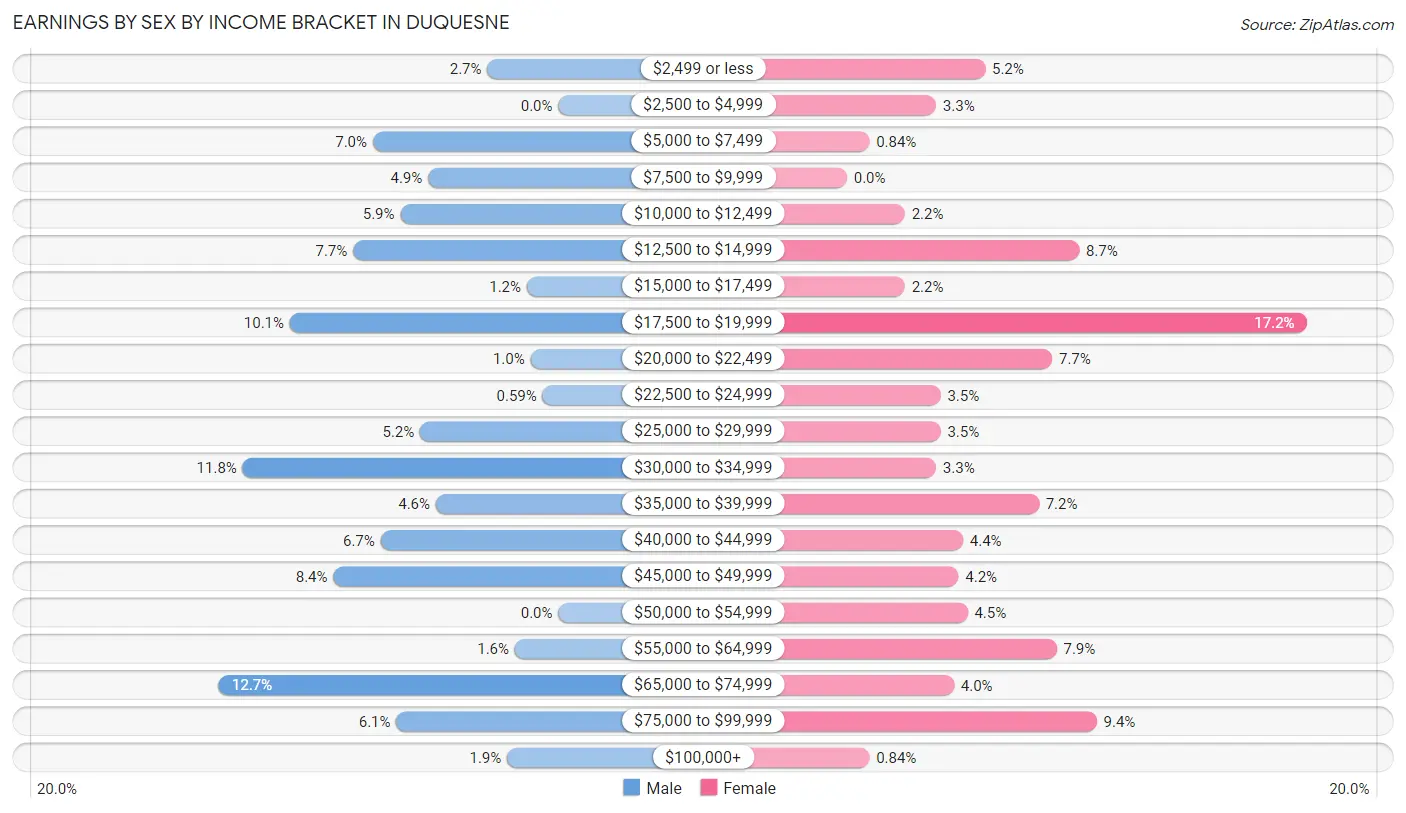
Earnings by Sex by Income Bracket in Duquesne
The most common earnings brackets in Duquesne are $65,000 to $74,999 for men (86 | 12.7%) and $17,500 to $19,999 for women (103 | 17.2%).
| Income | Male | Female |
| $2,499 or less | 18 (2.7%) | 31 (5.2%) |
| $2,500 to $4,999 | 0 (0.0%) | 20 (3.3%) |
| $5,000 to $7,499 | 47 (7.0%) | 5 (0.8%) |
| $7,500 to $9,999 | 33 (4.9%) | 0 (0.0%) |
| $10,000 to $12,499 | 40 (5.9%) | 13 (2.2%) |
| $12,500 to $14,999 | 52 (7.7%) | 52 (8.7%) |
| $15,000 to $17,499 | 8 (1.2%) | 13 (2.2%) |
| $17,500 to $19,999 | 68 (10.1%) | 103 (17.2%) |
| $20,000 to $22,499 | 7 (1.0%) | 46 (7.7%) |
| $22,500 to $24,999 | 4 (0.6%) | 21 (3.5%) |
| $25,000 to $29,999 | 35 (5.2%) | 21 (3.5%) |
| $30,000 to $34,999 | 80 (11.8%) | 20 (3.3%) |
| $35,000 to $39,999 | 31 (4.6%) | 43 (7.2%) |
| $40,000 to $44,999 | 45 (6.7%) | 26 (4.3%) |
| $45,000 to $49,999 | 57 (8.4%) | 25 (4.2%) |
| $50,000 to $54,999 | 0 (0.0%) | 27 (4.5%) |
| $55,000 to $64,999 | 11 (1.6%) | 47 (7.9%) |
| $65,000 to $74,999 | 86 (12.7%) | 24 (4.0%) |
| $75,000 to $99,999 | 41 (6.1%) | 56 (9.4%) |
| $100,000+ | 13 (1.9%) | 5 (0.8%) |
| Total | 676 (100.0%) | 598 (100.0%) |
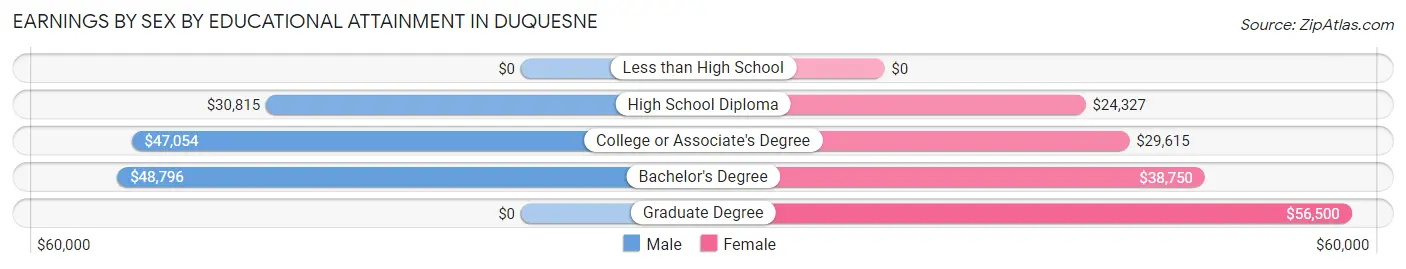
Earnings by Sex by Educational Attainment in Duquesne
Average earnings in Duquesne are $36,250 for men and $32,708 for women, a difference of 9.8%. Men with an educational attainment of bachelor's degree enjoy the highest average annual earnings of $48,796, while those with high school diploma education earn the least with $30,815. Women with an educational attainment of graduate degree earn the most with the average annual earnings of $56,500, while those with high school diploma education have the smallest earnings of $24,327.
| Educational Attainment | Male Income | Female Income |
| Less than High School | - | - |
| High School Diploma | $30,815 | $24,327 |
| College or Associate's Degree | $47,054 | $29,615 |
| Bachelor's Degree | $48,796 | $38,750 |
| Graduate Degree | - | - |
| Total | $36,250 | $32,708 |
Family Income in Duquesne
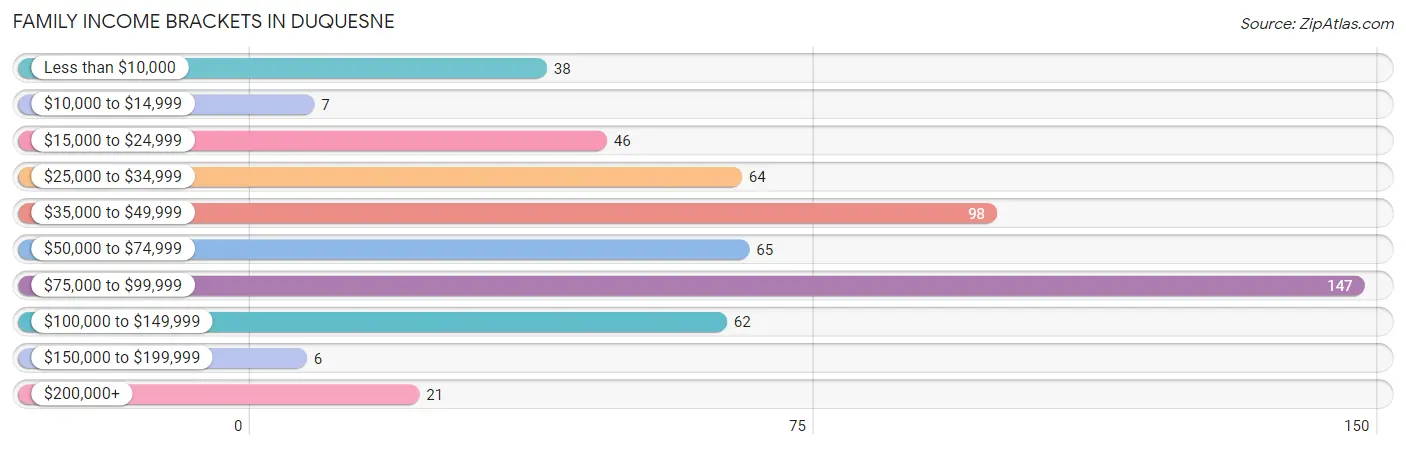
Family Income Brackets in Duquesne
According to the Duquesne family income data, there are 147 families falling into the $75,000 to $99,999 income range, which is the most common income bracket and makes up 26.5% of all families. Conversely, the $150,000 to $199,999 income bracket is the least frequent group with only 6 families (1.1%) belonging to this category.
| Income Bracket | # Families | % Families |
| Less than $10,000 | 38 | 6.9% |
| $10,000 to $14,999 | 7 | 1.3% |
| $15,000 to $24,999 | 46 | 8.3% |
| $25,000 to $34,999 | 64 | 11.6% |
| $35,000 to $49,999 | 98 | 17.7% |
| $50,000 to $74,999 | 65 | 11.7% |
| $75,000 to $99,999 | 147 | 26.5% |
| $100,000 to $149,999 | 62 | 11.2% |
| $150,000 to $199,999 | 6 | 1.1% |
| $200,000+ | 21 | 3.8% |
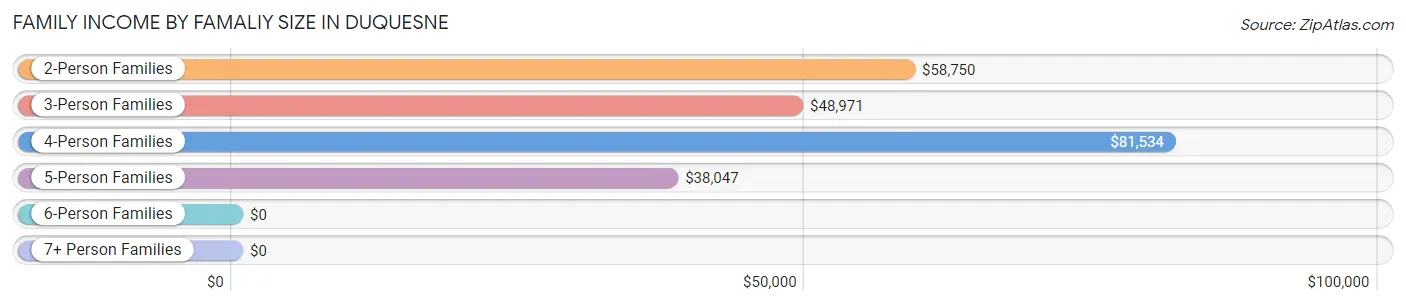
Family Income by Famaliy Size in Duquesne
4-person families (63 | 11.4%) account for the highest median family income in Duquesne with $81,534 per family, while 2-person families (260 | 46.9%) have the highest median income of $29,375 per family member.
| Income Bracket | # Families | Median Income |
| 2-Person Families | 260 (46.9%) | $58,750 |
| 3-Person Families | 192 (34.7%) | $48,971 |
| 4-Person Families | 63 (11.4%) | $81,534 |
| 5-Person Families | 35 (6.3%) | $38,047 |
| 6-Person Families | 0 (0.0%) | $0 |
| 7+ Person Families | 4 (0.7%) | $0 |
| Total | 554 (100.0%) | $59,688 |
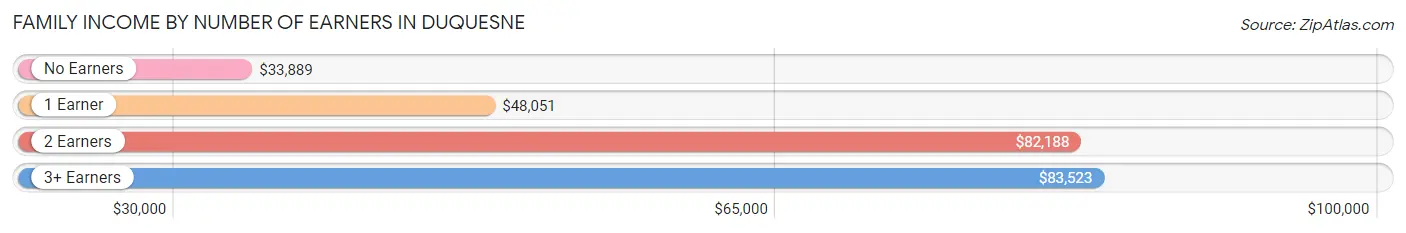
Family Income by Number of Earners in Duquesne
The median family income in Duquesne is $59,688, with families comprising 3+ earners (37) having the highest median family income of $83,523, while families with no earners (86) have the lowest median family income of $33,889, accounting for 6.7% and 15.5% of families, respectively.
| Number of Earners | # Families | Median Income |
| No Earners | 86 (15.5%) | $33,889 |
| 1 Earner | 175 (31.6%) | $48,051 |
| 2 Earners | 256 (46.2%) | $82,188 |
| 3+ Earners | 37 (6.7%) | $83,523 |
| Total | 554 (100.0%) | $59,688 |
Household Income in Duquesne
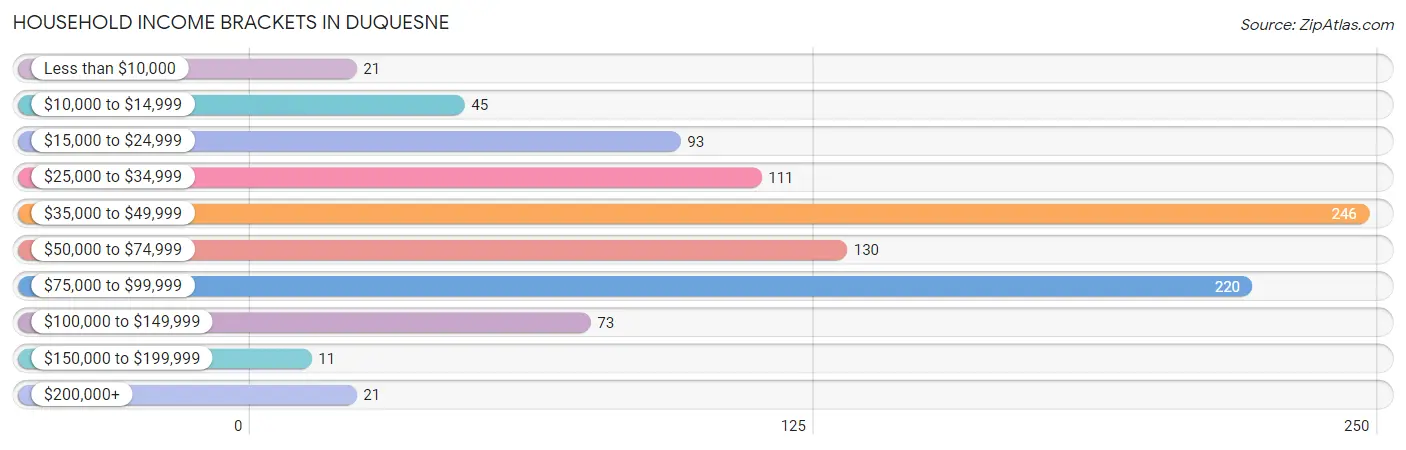
Household Income Brackets in Duquesne
With 246 households falling in the category, the $35,000 to $49,999 income range is the most frequent in Duquesne, accounting for 25.3% of all households. In contrast, only 11 households (1.1%) fall into the $150,000 to $199,999 income bracket, making it the least populous group.
| Income Bracket | # Households | % Households |
| Less than $10,000 | 21 | 2.2% |
| $10,000 to $14,999 | 45 | 4.6% |
| $15,000 to $24,999 | 93 | 9.6% |
| $25,000 to $34,999 | 111 | 11.4% |
| $35,000 to $49,999 | 246 | 25.3% |
| $50,000 to $74,999 | 130 | 13.4% |
| $75,000 to $99,999 | 220 | 22.7% |
| $100,000 to $149,999 | 73 | 7.5% |
| $150,000 to $199,999 | 11 | 1.1% |
| $200,000+ | 21 | 2.2% |
Household Income by Householder Age in Duquesne
The median household income in Duquesne is $48,561, with the highest median household income of $63,125 found in the 15 to 24 years age bracket for the primary householder. A total of 74 households (7.6%) fall into this category. Meanwhile, the 65+ years age bracket for the primary householder has the lowest median household income of $42,545, with 225 households (23.2%) in this group.
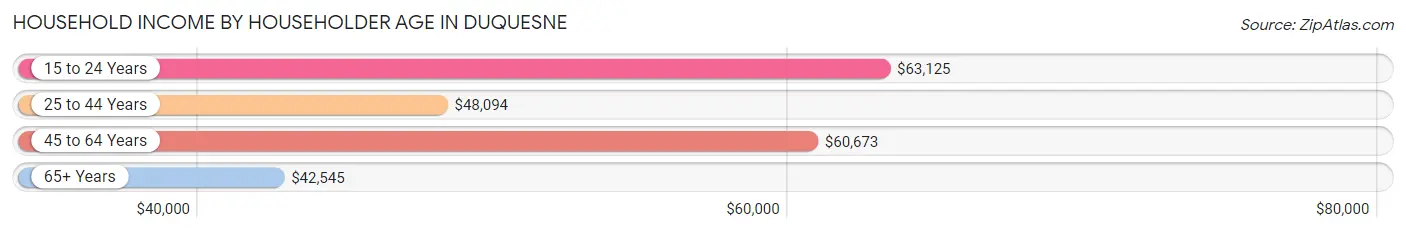
| Income Bracket | # Households | Median Income |
| 15 to 24 Years | 74 (7.6%) | $63,125 |
| 25 to 44 Years | 351 (36.1%) | $48,094 |
| 45 to 64 Years | 321 (33.1%) | $60,673 |
| 65+ Years | 225 (23.2%) | $42,545 |
| Total | 971 (100.0%) | $48,561 |
Poverty in Duquesne
Income Below Poverty by Sex and Age in Duquesne
With 16.9% poverty level for males and 17.5% for females among the residents of Duquesne, 15 year old males and under 5 year old females are the most vulnerable to poverty, with 7 males (100.0%) and 33 females (91.7%) in their respective age groups living below the poverty level.
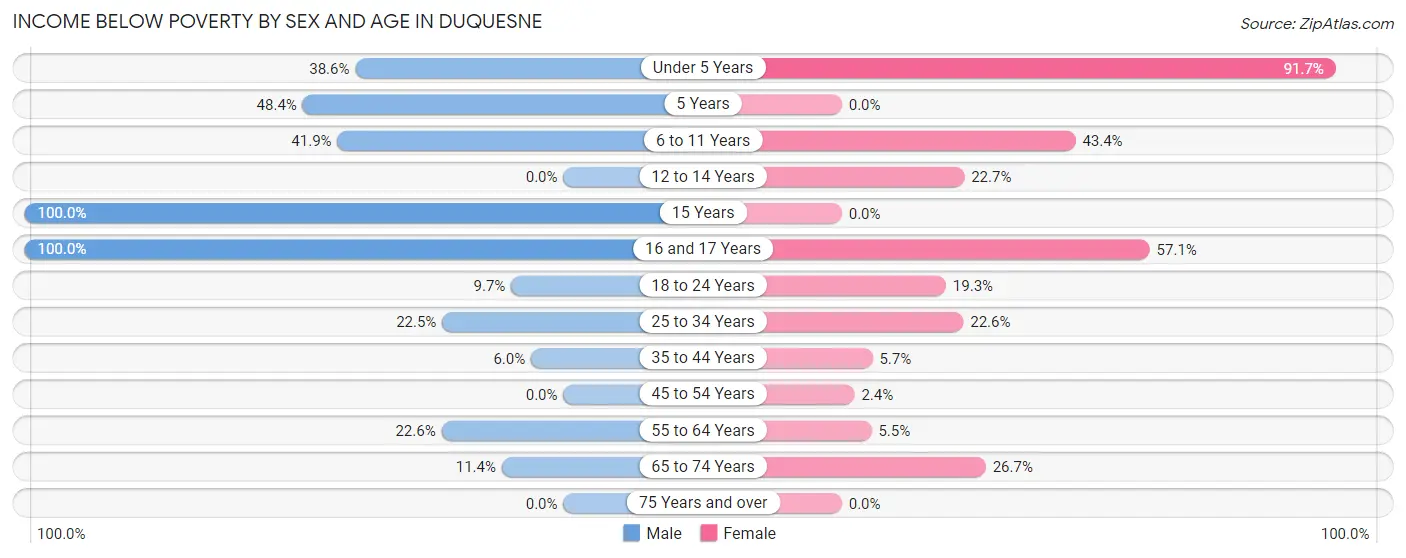
| Age Bracket | Male | Female |
| Under 5 Years | 39 (38.6%) | 33 (91.7%) |
| 5 Years | 15 (48.4%) | 0 (0.0%) |
| 6 to 11 Years | 26 (41.9%) | 36 (43.4%) |
| 12 to 14 Years | 0 (0.0%) | 5 (22.7%) |
| 15 Years | 7 (100.0%) | 0 (0.0%) |
| 16 and 17 Years | 10 (100.0%) | 4 (57.1%) |
| 18 to 24 Years | 18 (9.7%) | 23 (19.3%) |
| 25 to 34 Years | 38 (22.5%) | 46 (22.6%) |
| 35 to 44 Years | 9 (6.0%) | 7 (5.7%) |
| 45 to 54 Years | 0 (0.0%) | 5 (2.4%) |
| 55 to 64 Years | 19 (22.6%) | 7 (5.5%) |
| 65 to 74 Years | 12 (11.4%) | 31 (26.7%) |
| 75 Years and over | 0 (0.0%) | 0 (0.0%) |
| Total | 193 (16.9%) | 197 (17.5%) |
Income Above Poverty by Sex and Age in Duquesne
According to the poverty statistics in Duquesne, males aged 12 to 14 years and females aged 5 years are the age groups that are most secure financially, with 100.0% of males and 100.0% of females in these age groups living above the poverty line.
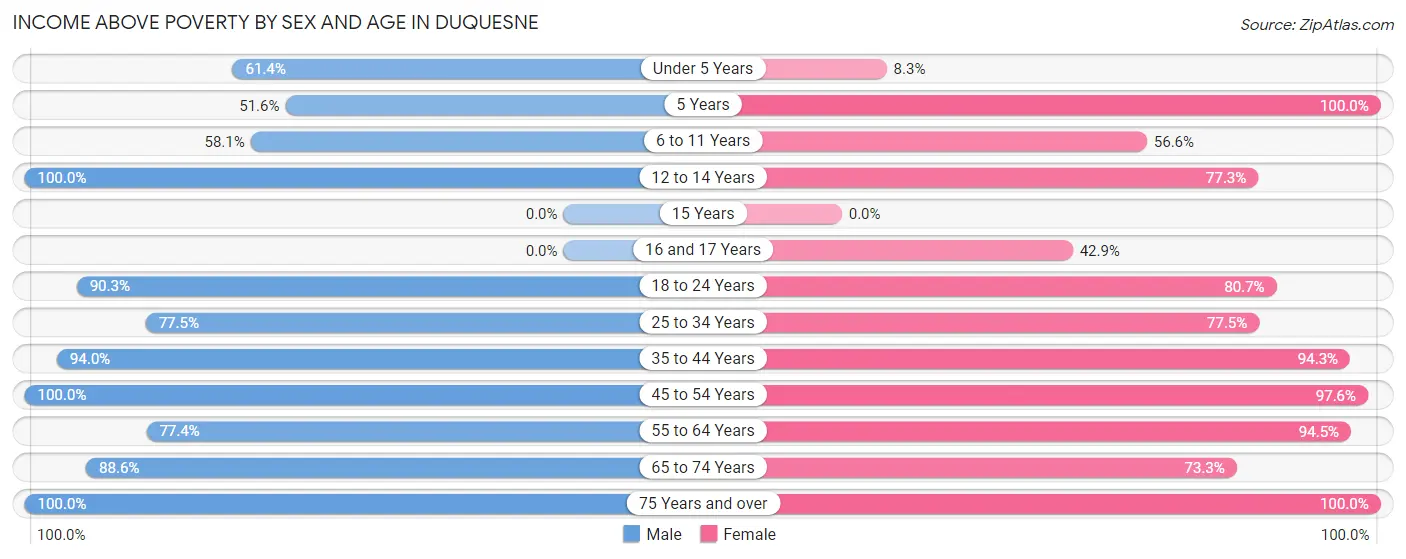
| Age Bracket | Male | Female |
| Under 5 Years | 62 (61.4%) | 3 (8.3%) |
| 5 Years | 16 (51.6%) | 6 (100.0%) |
| 6 to 11 Years | 36 (58.1%) | 47 (56.6%) |
| 12 to 14 Years | 39 (100.0%) | 17 (77.3%) |
| 15 Years | 0 (0.0%) | 0 (0.0%) |
| 16 and 17 Years | 0 (0.0%) | 3 (42.9%) |
| 18 to 24 Years | 168 (90.3%) | 96 (80.7%) |
| 25 to 34 Years | 131 (77.5%) | 158 (77.4%) |
| 35 to 44 Years | 141 (94.0%) | 116 (94.3%) |
| 45 to 54 Years | 150 (100.0%) | 207 (97.6%) |
| 55 to 64 Years | 65 (77.4%) | 120 (94.5%) |
| 65 to 74 Years | 93 (88.6%) | 85 (73.3%) |
| 75 Years and over | 51 (100.0%) | 73 (100.0%) |
| Total | 952 (83.1%) | 931 (82.5%) |
Income Below Poverty Among Married-Couple Families in Duquesne
The poverty statistics for married-couple families in Duquesne show that 3.4% or 12 of the total 349 families live below the poverty line. Families with no children have the highest poverty rate of 4.7%, comprising of 12 families. On the other hand, families with 1 or 2 children have the lowest poverty rate of 0.0%, which includes 0 families.
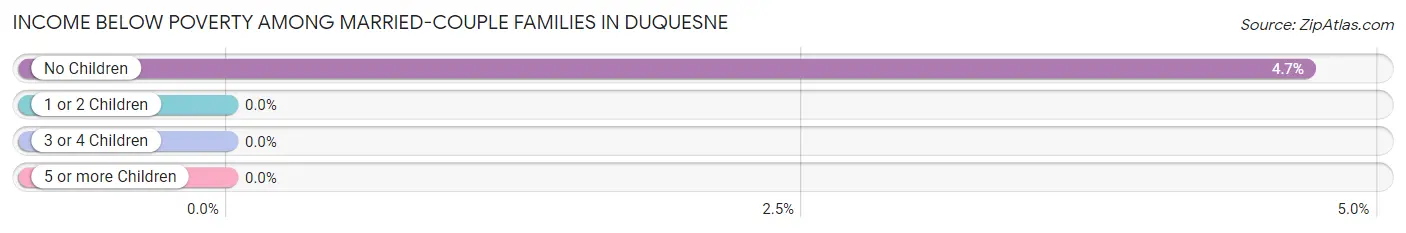
| Children | Above Poverty | Below Poverty |
| No Children | 244 (95.3%) | 12 (4.7%) |
| 1 or 2 Children | 93 (100.0%) | 0 (0.0%) |
| 3 or 4 Children | 0 (0.0%) | 0 (0.0%) |
| 5 or more Children | 0 (0.0%) | 0 (0.0%) |
| Total | 337 (96.6%) | 12 (3.4%) |
Income Below Poverty Among Single-Parent Households in Duquesne
According to the poverty data in Duquesne, 57.4% or 39 single-father households and 25.6% or 35 single-mother households are living below the poverty line. Among single-father households, those with 1 or 2 children have the highest poverty rate, with 33 households (84.6%) experiencing poverty. Likewise, among single-mother households, those with 3 or 4 children have the highest poverty rate, with 14 households (58.3%) falling below the poverty line.
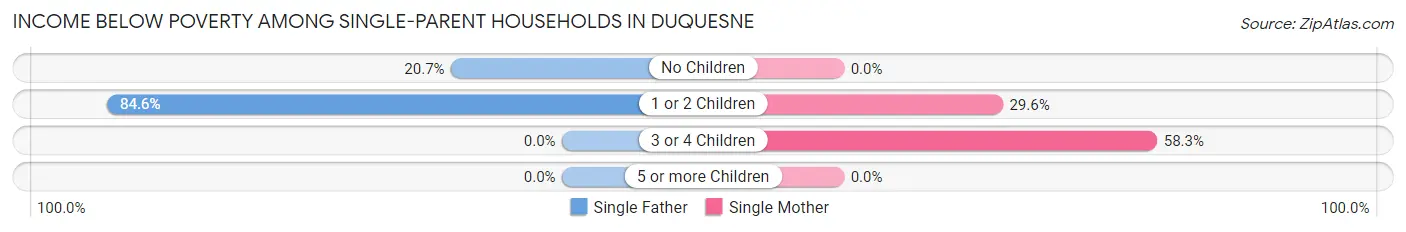
| Children | Single Father | Single Mother |
| No Children | 6 (20.7%) | 0 (0.0%) |
| 1 or 2 Children | 33 (84.6%) | 21 (29.6%) |
| 3 or 4 Children | 0 (0.0%) | 14 (58.3%) |
| 5 or more Children | 0 (0.0%) | 0 (0.0%) |
| Total | 39 (57.4%) | 35 (25.6%) |
Income Below Poverty Among Married-Couple vs Single-Parent Households in Duquesne
The poverty data for Duquesne shows that 12 of the married-couple family households (3.4%) and 74 of the single-parent households (36.1%) are living below the poverty level. Within the married-couple family households, those with no children have the highest poverty rate, with 12 households (4.7%) falling below the poverty line. Among the single-parent households, those with 3 or 4 children have the highest poverty rate, with 14 household (58.3%) living below poverty.
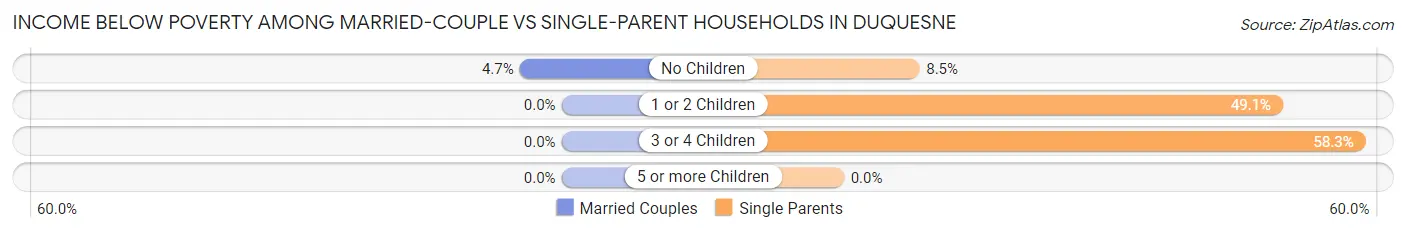
| Children | Married-Couple Families | Single-Parent Households |
| No Children | 12 (4.7%) | 6 (8.5%) |
| 1 or 2 Children | 0 (0.0%) | 54 (49.1%) |
| 3 or 4 Children | 0 (0.0%) | 14 (58.3%) |
| 5 or more Children | 0 (0.0%) | 0 (0.0%) |
| Total | 12 (3.4%) | 74 (36.1%) |
Race in Duquesne
The most populous races in Duquesne are White / Caucasian (1,953 | 85.0%), Two or more Races (194 | 8.5%), and Asian (93 | 4.1%).
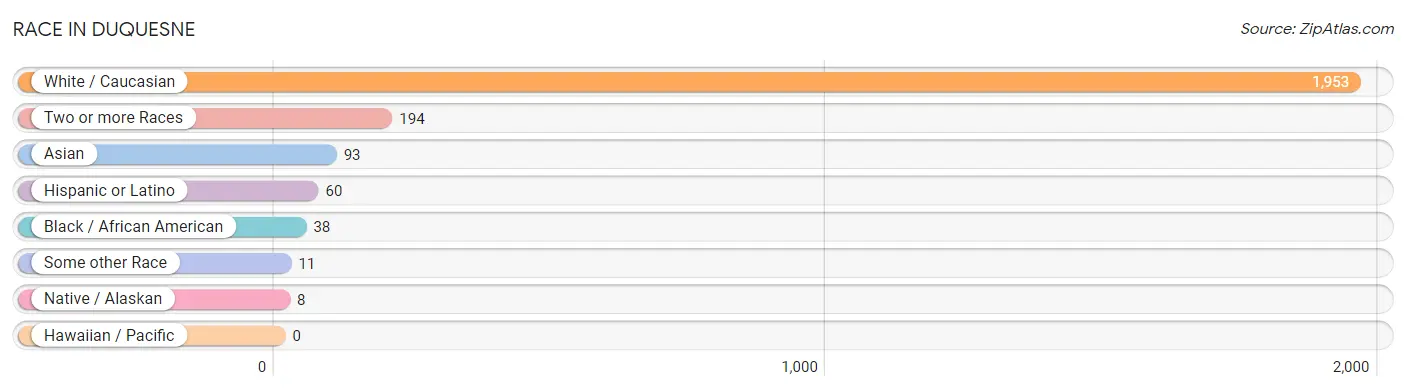
| Race | # Population | % Population |
| Asian | 93 | 4.1% |
| Black / African American | 38 | 1.7% |
| Hawaiian / Pacific | 0 | 0.0% |
| Hispanic or Latino | 60 | 2.6% |
| Native / Alaskan | 8 | 0.4% |
| White / Caucasian | 1,953 | 85.0% |
| Two or more Races | 194 | 8.5% |
| Some other Race | 11 | 0.5% |
| Total | 2,297 | 100.0% |
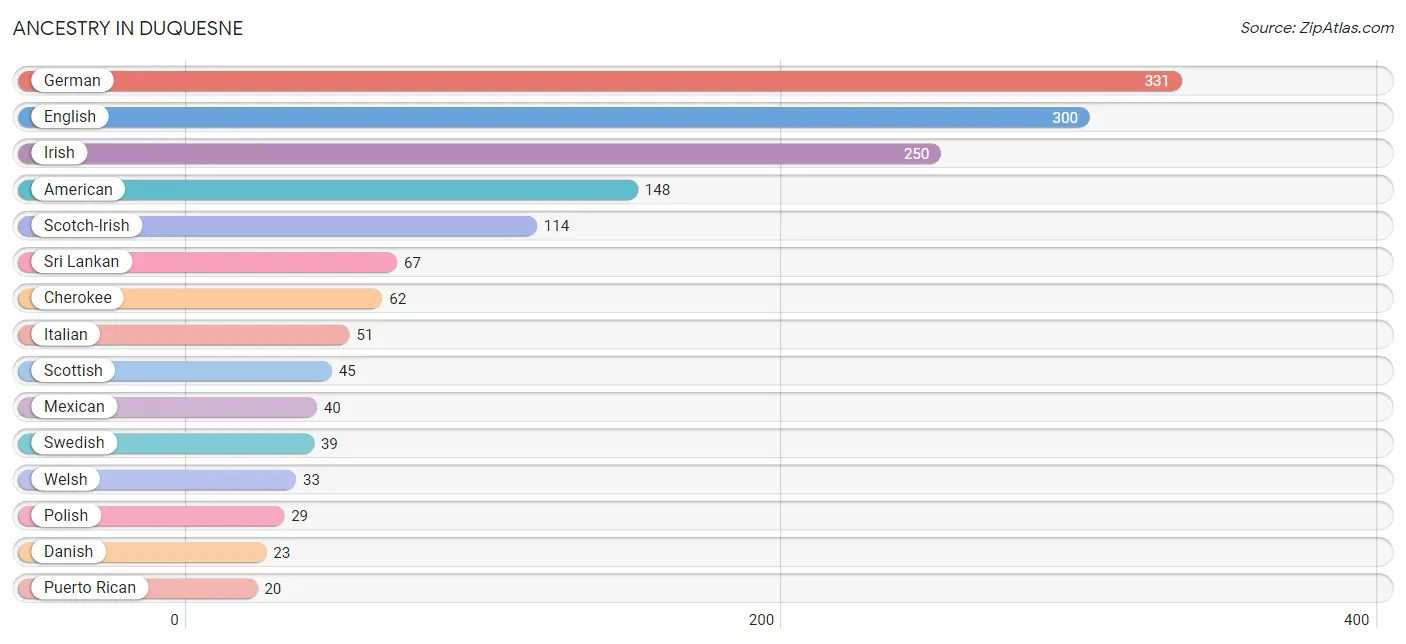
Ancestry in Duquesne
The most populous ancestries reported in Duquesne are German (331 | 14.4%), English (300 | 13.1%), Irish (250 | 10.9%), American (148 | 6.4%), and Scotch-Irish (114 | 5.0%), together accounting for 49.7% of all Duquesne residents.
| Ancestry | # Population | % Population |
| American | 148 | 6.4% |
| Arab | 5 | 0.2% |
| Australian | 5 | 0.2% |
| Bhutanese | 5 | 0.2% |
| Burmese | 12 | 0.5% |
| Canadian | 4 | 0.2% |
| Cherokee | 62 | 2.7% |
| Choctaw | 5 | 0.2% |
| Croatian | 7 | 0.3% |
| Czechoslovakian | 10 | 0.4% |
| Danish | 23 | 1.0% |
| Dutch | 18 | 0.8% |
| English | 300 | 13.1% |
| European | 10 | 0.4% |
| French | 19 | 0.8% |
| German | 331 | 14.4% |
| Greek | 13 | 0.6% |
| Indian (Asian) | 9 | 0.4% |
| Irish | 250 | 10.9% |
| Iroquois | 5 | 0.2% |
| Italian | 51 | 2.2% |
| Jamaican | 13 | 0.6% |
| Mexican | 40 | 1.7% |
| Norwegian | 9 | 0.4% |
| Polish | 29 | 1.3% |
| Potawatomi | 13 | 0.6% |
| Puerto Rican | 20 | 0.9% |
| Russian | 7 | 0.3% |
| Scandinavian | 6 | 0.3% |
| Scotch-Irish | 114 | 5.0% |
| Scottish | 45 | 2.0% |
| Sioux | 5 | 0.2% |
| Slovak | 9 | 0.4% |
| Sri Lankan | 67 | 2.9% |
| Swedish | 39 | 1.7% |
| Thai | 17 | 0.7% |
| Welsh | 33 | 1.4% | View All 37 Rows |
Immigrants in Duquesne
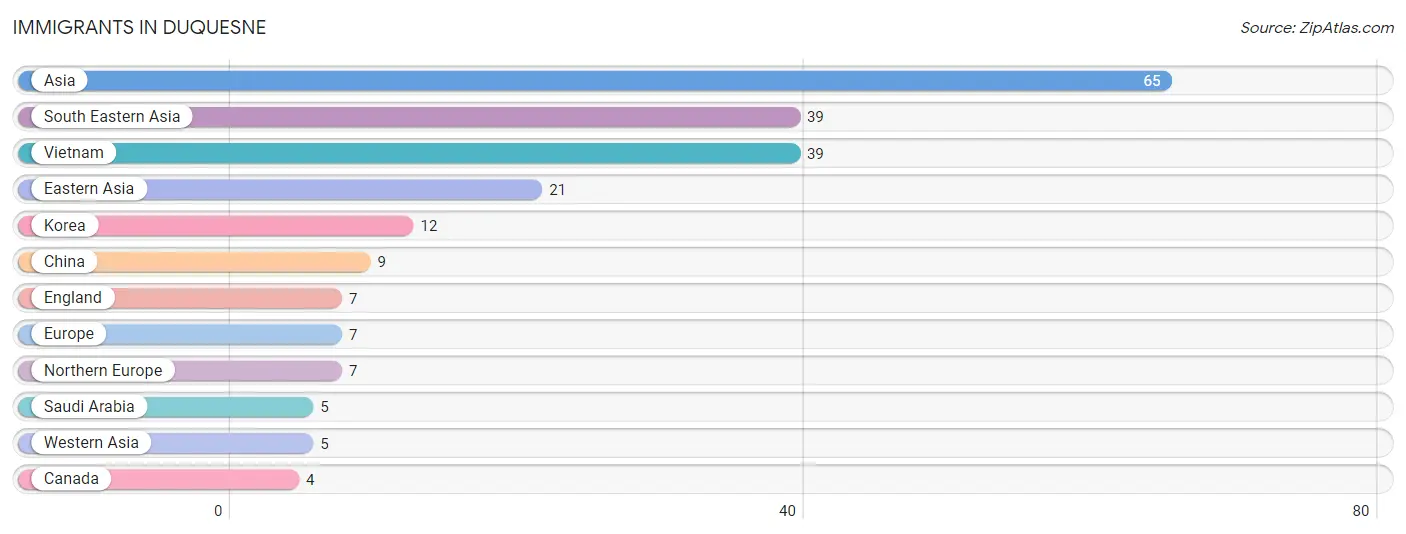
The most numerous immigrant groups reported in Duquesne came from Asia (65 | 2.8%), South Eastern Asia (39 | 1.7%), Vietnam (39 | 1.7%), Eastern Asia (21 | 0.9%), and Korea (12 | 0.5%), together accounting for 7.7% of all Duquesne residents.
| Immigration Origin | # Population | % Population |
| Asia | 65 | 2.8% |
| Canada | 4 | 0.2% |
| China | 9 | 0.4% |
| Eastern Asia | 21 | 0.9% |
| England | 7 | 0.3% |
| Europe | 7 | 0.3% |
| Korea | 12 | 0.5% |
| Northern Europe | 7 | 0.3% |
| Saudi Arabia | 5 | 0.2% |
| South Eastern Asia | 39 | 1.7% |
| Vietnam | 39 | 1.7% |
| Western Asia | 5 | 0.2% | View All 12 Rows |
Sex and Age in Duquesne
Sex and Age in Duquesne
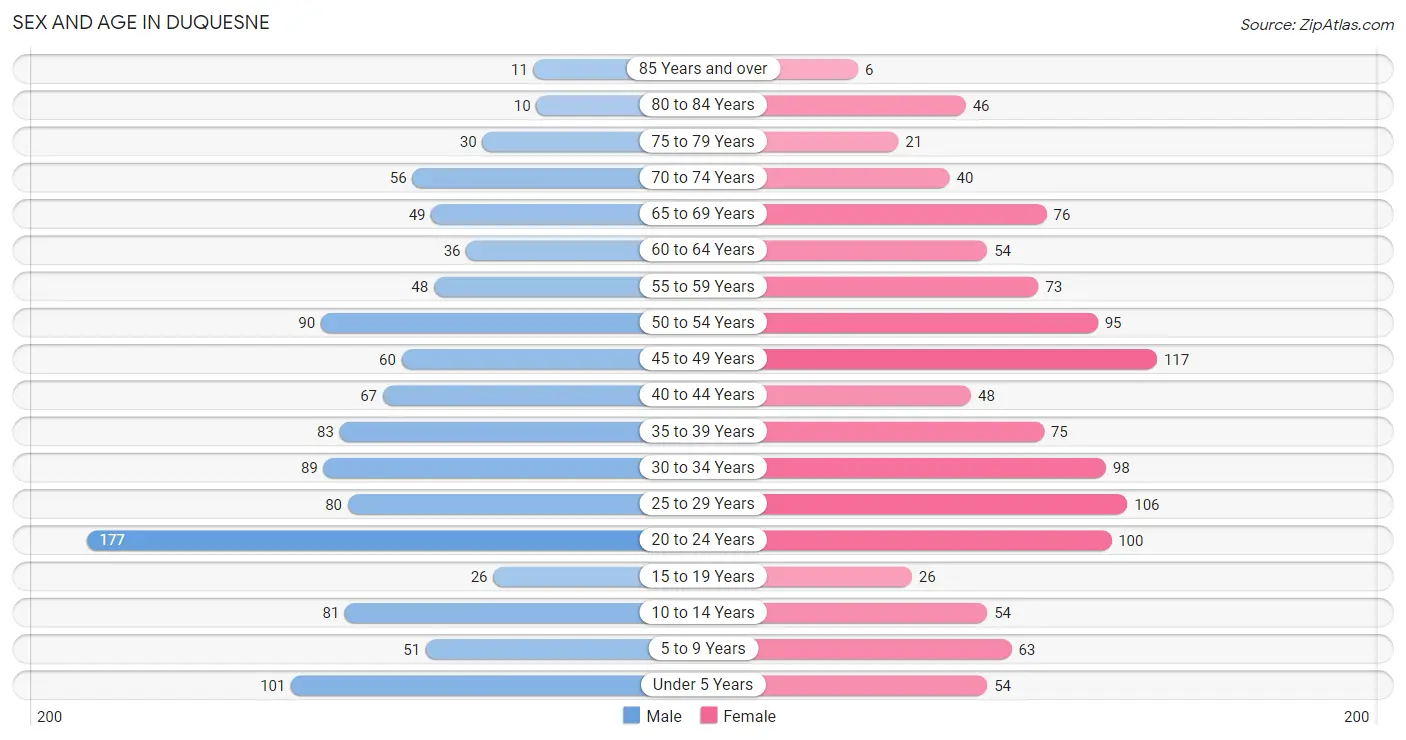
The most populous age groups in Duquesne are 20 to 24 Years (177 | 15.5%) for men and 45 to 49 Years (117 | 10.2%) for women.
| Age Bracket | Male | Female |
| Under 5 Years | 101 (8.8%) | 54 (4.7%) |
| 5 to 9 Years | 51 (4.4%) | 63 (5.5%) |
| 10 to 14 Years | 81 (7.1%) | 54 (4.7%) |
| 15 to 19 Years | 26 (2.3%) | 26 (2.3%) |
| 20 to 24 Years | 177 (15.5%) | 100 (8.7%) |
| 25 to 29 Years | 80 (7.0%) | 106 (9.2%) |
| 30 to 34 Years | 89 (7.8%) | 98 (8.5%) |
| 35 to 39 Years | 83 (7.2%) | 75 (6.5%) |
| 40 to 44 Years | 67 (5.9%) | 48 (4.2%) |
| 45 to 49 Years | 60 (5.2%) | 117 (10.2%) |
| 50 to 54 Years | 90 (7.9%) | 95 (8.3%) |
| 55 to 59 Years | 48 (4.2%) | 73 (6.3%) |
| 60 to 64 Years | 36 (3.1%) | 54 (4.7%) |
| 65 to 69 Years | 49 (4.3%) | 76 (6.6%) |
| 70 to 74 Years | 56 (4.9%) | 40 (3.5%) |
| 75 to 79 Years | 30 (2.6%) | 21 (1.8%) |
| 80 to 84 Years | 10 (0.9%) | 46 (4.0%) |
| 85 Years and over | 11 (1.0%) | 6 (0.5%) |
| Total | 1,145 (100.0%) | 1,152 (100.0%) |
Families and Households in Duquesne
Median Family Size in Duquesne
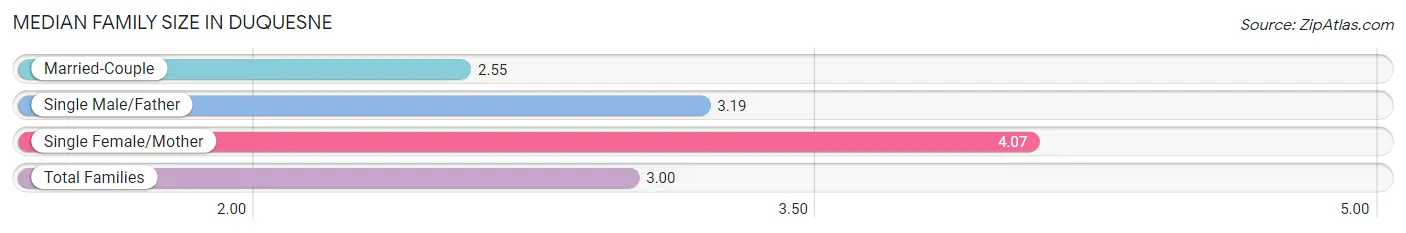
The median family size in Duquesne is 3.00 persons per family, with single female/mother families (137 | 24.7%) accounting for the largest median family size of 4.07 persons per family. On the other hand, married-couple families (349 | 63.0%) represent the smallest median family size with 2.55 persons per family.
| Family Type | # Families | Family Size |
| Married-Couple | 349 (63.0%) | 2.55 |
| Single Male/Father | 68 (12.3%) | 3.19 |
| Single Female/Mother | 137 (24.7%) | 4.07 |
| Total Families | 554 (100.0%) | 3.00 |
Median Household Size in Duquesne
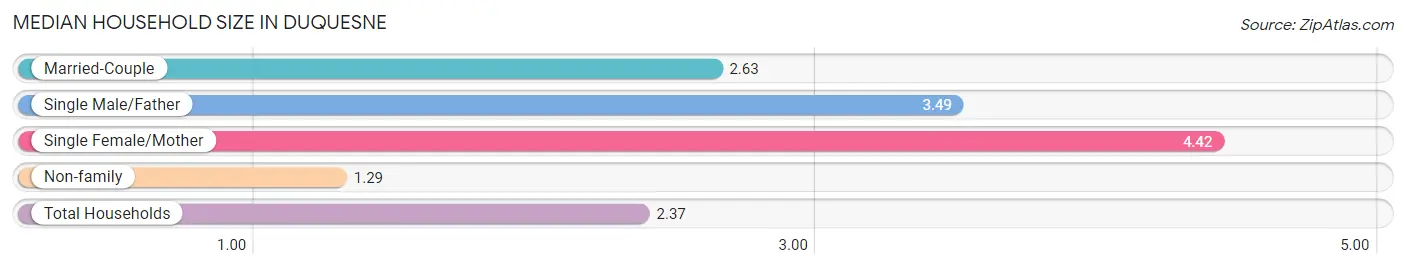
The median household size in Duquesne is 2.37 persons per household, with single female/mother households (137 | 14.1%) accounting for the largest median household size of 4.42 persons per household. non-family households (417 | 42.9%) represent the smallest median household size with 1.29 persons per household.
| Household Type | # Households | Household Size |
| Married-Couple | 349 (35.9%) | 2.63 |
| Single Male/Father | 68 (7.0%) | 3.49 |
| Single Female/Mother | 137 (14.1%) | 4.42 |
| Non-family | 417 (42.9%) | 1.29 |
| Total Households | 971 (100.0%) | 2.37 |
Household Size by Marriage Status in Duquesne
Out of a total of 971 households in Duquesne, 554 (57.1%) are family households, while 417 (42.9%) are nonfamily households. The most numerous type of family households are 2-person households, comprising 237, and the most common type of nonfamily households are 1-person households, comprising 348.
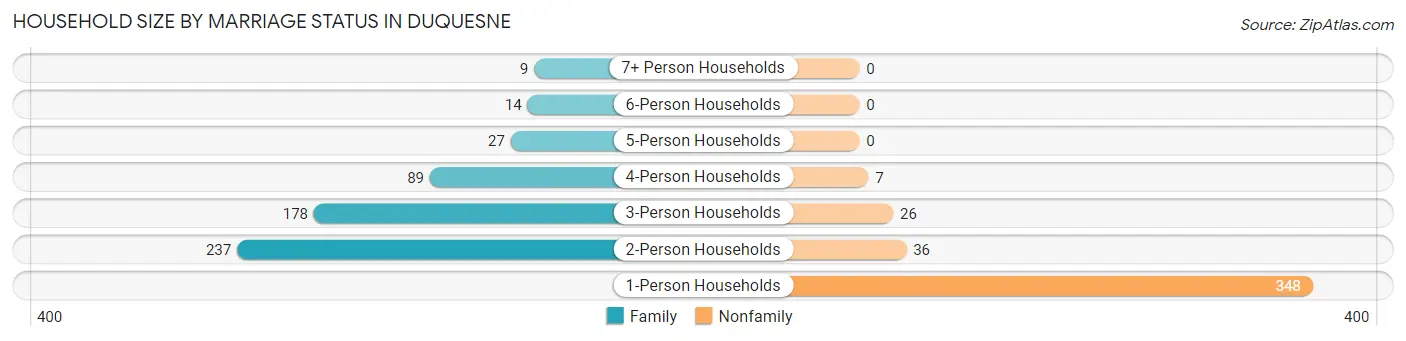
| Household Size | Family Households | Nonfamily Households |
| 1-Person Households | - | 348 (35.8%) |
| 2-Person Households | 237 (24.4%) | 36 (3.7%) |
| 3-Person Households | 178 (18.3%) | 26 (2.7%) |
| 4-Person Households | 89 (9.2%) | 7 (0.7%) |
| 5-Person Households | 27 (2.8%) | 0 (0.0%) |
| 6-Person Households | 14 (1.4%) | 0 (0.0%) |
| 7+ Person Households | 9 (0.9%) | 0 (0.0%) |
| Total | 554 (57.1%) | 417 (42.9%) |
Female Fertility in Duquesne
Fertility by Age in Duquesne
Average fertility rate in Duquesne is 15.0 births per 1,000 women. Women in the age bracket of 20 to 34 years have the highest fertility rate with 30.0 births per 1,000 women. Women in the age bracket of 20 to 34 years acount for 100.0% of all women with births.
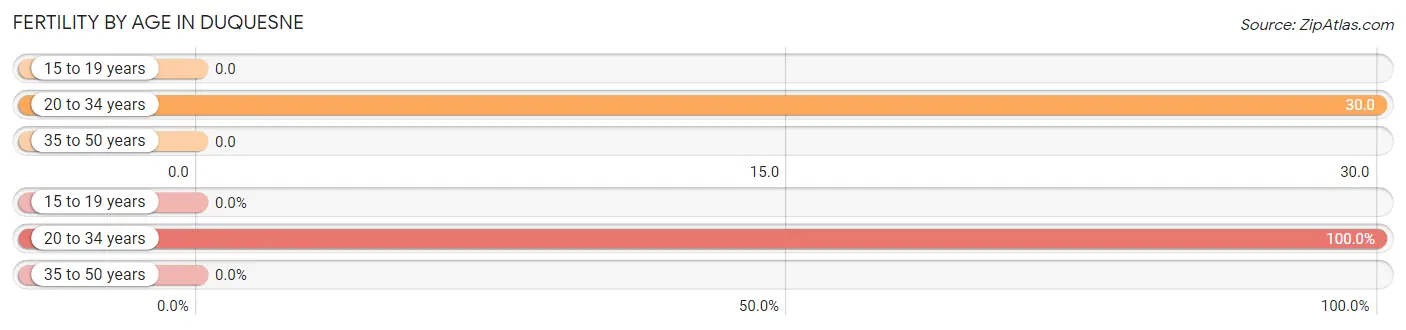
| Age Bracket | Women with Births | Births / 1,000 Women |
| 15 to 19 years | 0 (0.0%) | 0.0 |
| 20 to 34 years | 9 (100.0%) | 30.0 |
| 35 to 50 years | 0 (0.0%) | 0.0 |
| Total | 9 (100.0%) | 15.0 |
Fertility by Age by Marriage Status in Duquesne
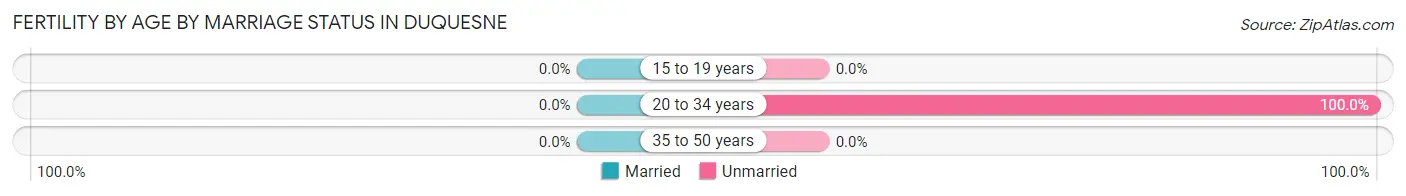
| Age Bracket | Married | Unmarried |
| 15 to 19 years | 0 (0.0%) | 0 (0.0%) |
| 20 to 34 years | 0 (0.0%) | 9 (100.0%) |
| 35 to 50 years | 0 (0.0%) | 0 (0.0%) |
| Total | 0 (0.0%) | 9 (100.0%) |
Fertility by Education in Duquesne
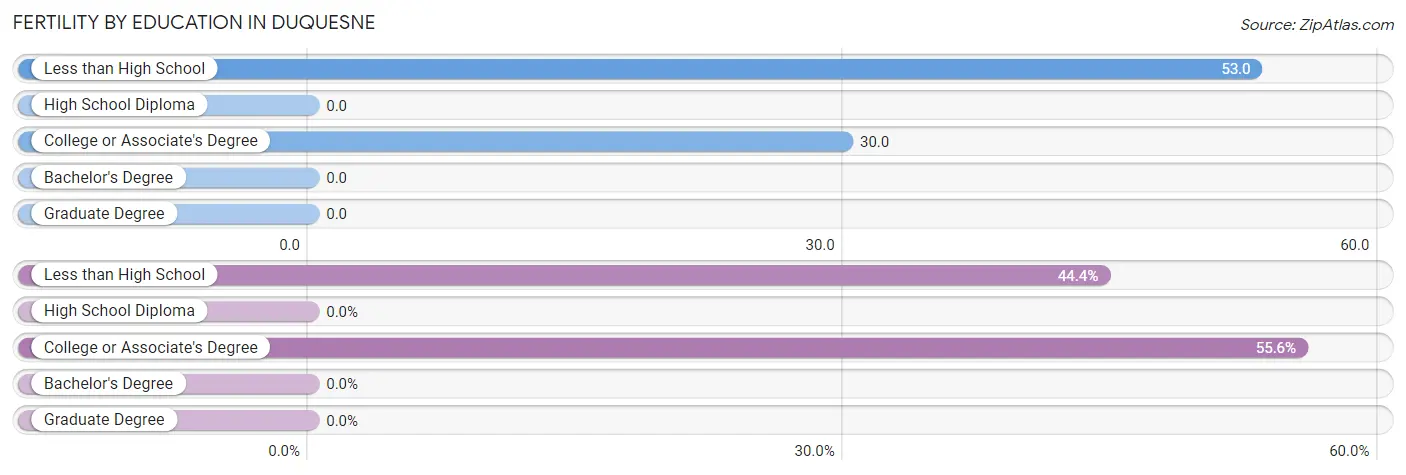
| Educational Attainment | Women with Births | Births / 1,000 Women |
| Less than High School | 4 (44.4%) | 53.0 |
| High School Diploma | 0 (0.0%) | 0.0 |
| College or Associate's Degree | 5 (55.6%) | 30.0 |
| Bachelor's Degree | 0 (0.0%) | 0.0 |
| Graduate Degree | 0 (0.0%) | 0.0 |
| Total | 9 (100.0%) | 15.0 |
Fertility by Education by Marriage Status in Duquesne
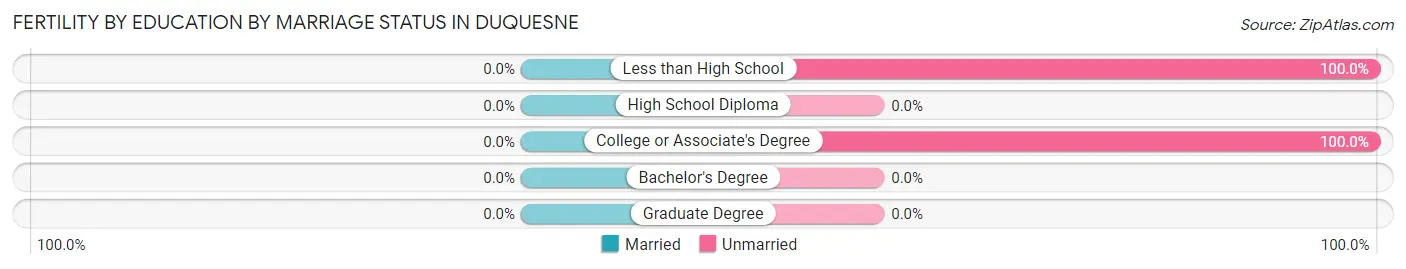
| Educational Attainment | Married | Unmarried |
| Less than High School | 0 (0.0%) | 4 (100.0%) |
| High School Diploma | 0 (0.0%) | 0 (0.0%) |
| College or Associate's Degree | 0 (0.0%) | 5 (100.0%) |
| Bachelor's Degree | 0 (0.0%) | 0 (0.0%) |
| Graduate Degree | 0 (0.0%) | 0 (0.0%) |
| Total | 0 (0.0%) | 9 (100.0%) |
Employment Characteristics in Duquesne
Employment by Class of Employer in Duquesne
Among the 1,129 employed individuals in Duquesne, private company employees (814 | 72.1%), not-for-profit organizations (131 | 11.6%), and local government employees (46 | 4.1%) make up the most common classes of employment.
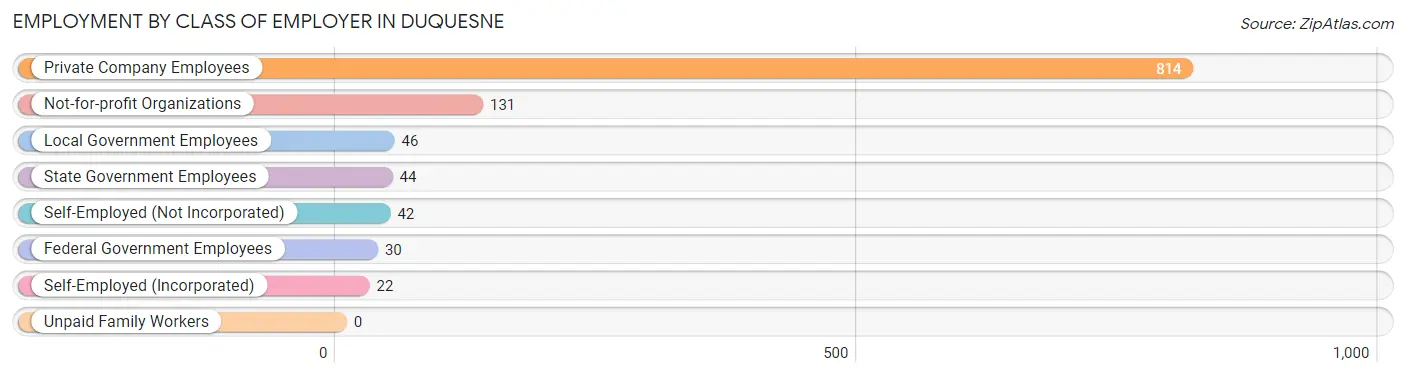
| Employer Class | # Employees | % Employees |
| Private Company Employees | 814 | 72.1% |
| Self-Employed (Incorporated) | 22 | 1.9% |
| Self-Employed (Not Incorporated) | 42 | 3.7% |
| Not-for-profit Organizations | 131 | 11.6% |
| Local Government Employees | 46 | 4.1% |
| State Government Employees | 44 | 3.9% |
| Federal Government Employees | 30 | 2.7% |
| Unpaid Family Workers | 0 | 0.0% |
| Total | 1,129 | 100.0% |
Employment Status by Age in Duquesne
According to the labor force statistics for Duquesne, out of the total population over 16 years of age (1,886), 63.1% or 1,190 individuals are in the labor force, with 2.9% or 35 of them unemployed. The age group with the highest labor force participation rate is 20 to 24 years, with 95.3% or 264 individuals in the labor force. Within the labor force, the 35 to 44 years age range has the highest percentage of unemployed individuals, with 13.3% or 26 of them being unemployed.
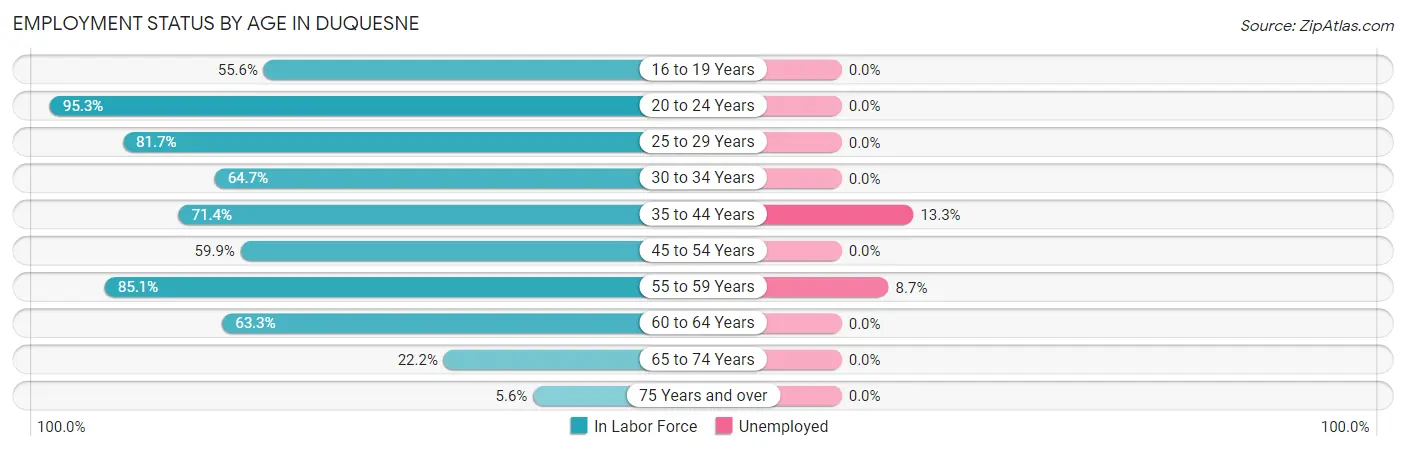
| Age Bracket | In Labor Force | Unemployed |
| 16 to 19 Years | 25 (55.6%) | 0 (0.0%) |
| 20 to 24 Years | 264 (95.3%) | 0 (0.0%) |
| 25 to 29 Years | 152 (81.7%) | 0 (0.0%) |
| 30 to 34 Years | 121 (64.7%) | 0 (0.0%) |
| 35 to 44 Years | 195 (71.4%) | 26 (13.3%) |
| 45 to 54 Years | 217 (59.9%) | 0 (0.0%) |
| 55 to 59 Years | 103 (85.1%) | 9 (8.7%) |
| 60 to 64 Years | 57 (63.3%) | 0 (0.0%) |
| 65 to 74 Years | 49 (22.2%) | 0 (0.0%) |
| 75 Years and over | 7 (5.6%) | 0 (0.0%) |
| Total | 1,190 (63.1%) | 35 (2.9%) |
Employment Status by Educational Attainment in Duquesne
According to labor force statistics for Duquesne, 69.3% of individuals (845) out of the total population between 25 and 64 years of age (1,219) are in the labor force, with 4.1% or 35 of them being unemployed. The group with the highest labor force participation rate are those with the educational attainment of bachelor's degree or higher, with 85.6% or 249 individuals in the labor force. Within the labor force, individuals with college / associate degree education have the highest percentage of unemployment, with 5.4% or 17 of them being unemployed.
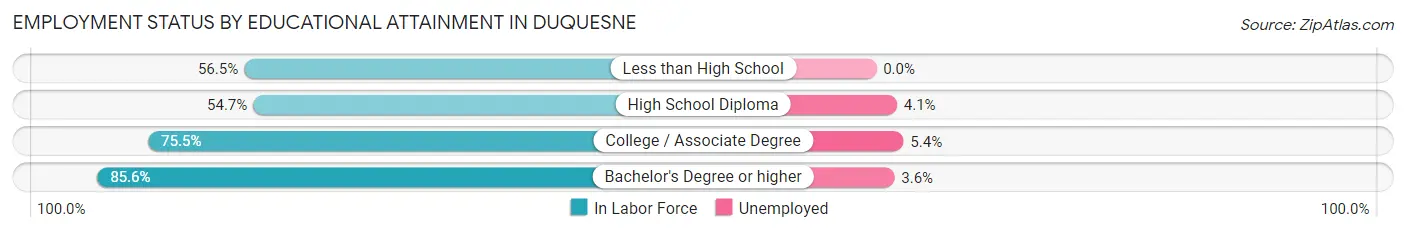
| Educational Attainment | In Labor Force | Unemployed |
| Less than High School | 65 (56.5%) | 0 (0.0%) |
| High School Diploma | 217 (54.7%) | 16 (4.1%) |
| College / Associate Degree | 314 (75.5%) | 22 (5.4%) |
| Bachelor's Degree or higher | 249 (85.6%) | 10 (3.6%) |
| Total | 845 (69.3%) | 50 (4.1%) |
Employment Occupations by Sex in Duquesne
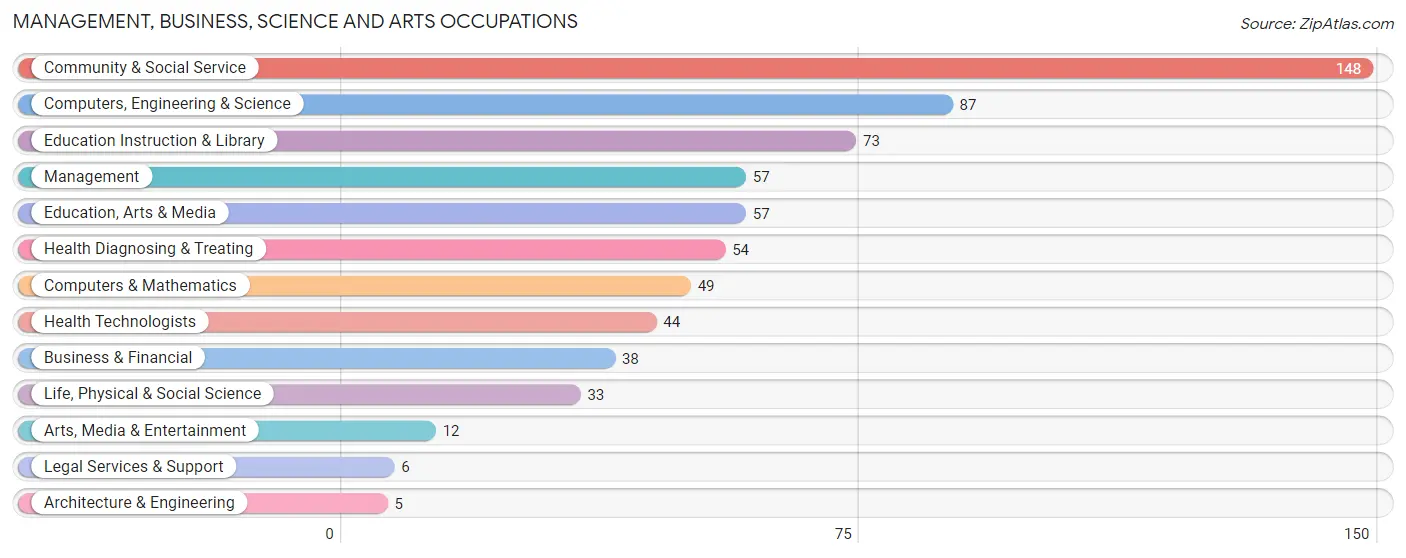
Management, Business, Science and Arts Occupations
The most common Management, Business, Science and Arts occupations in Duquesne are Community & Social Service (148 | 12.8%), Computers, Engineering & Science (87 | 7.5%), Education Instruction & Library (73 | 6.3%), Management (57 | 4.9%), and Education, Arts & Media (57 | 4.9%).
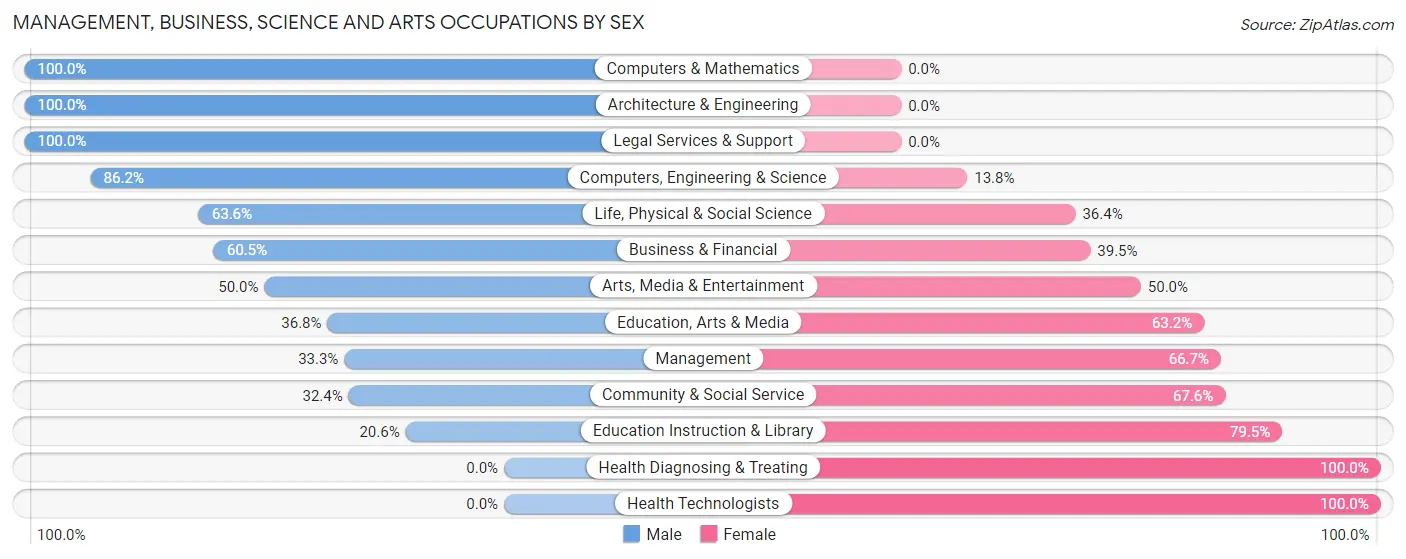
Management, Business, Science and Arts Occupations by Sex
Within the Management, Business, Science and Arts occupations in Duquesne, the most male-oriented occupations are Computers & Mathematics (100.0%), Architecture & Engineering (100.0%), and Legal Services & Support (100.0%), while the most female-oriented occupations are Health Diagnosing & Treating (100.0%), Health Technologists (100.0%), and Education Instruction & Library (79.4%).
| Occupation | Male | Female |
| Management | 19 (33.3%) | 38 (66.7%) |
| Business & Financial | 23 (60.5%) | 15 (39.5%) |
| Computers, Engineering & Science | 75 (86.2%) | 12 (13.8%) |
| Computers & Mathematics | 49 (100.0%) | 0 (0.0%) |
| Architecture & Engineering | 5 (100.0%) | 0 (0.0%) |
| Life, Physical & Social Science | 21 (63.6%) | 12 (36.4%) |
| Community & Social Service | 48 (32.4%) | 100 (67.6%) |
| Education, Arts & Media | 21 (36.8%) | 36 (63.2%) |
| Legal Services & Support | 6 (100.0%) | 0 (0.0%) |
| Education Instruction & Library | 15 (20.5%) | 58 (79.4%) |
| Arts, Media & Entertainment | 6 (50.0%) | 6 (50.0%) |
| Health Diagnosing & Treating | 0 (0.0%) | 54 (100.0%) |
| Health Technologists | 0 (0.0%) | 44 (100.0%) |
| Total (Category) | 165 (43.0%) | 219 (57.0%) |
| Total (Overall) | 614 (53.2%) | 541 (46.8%) |
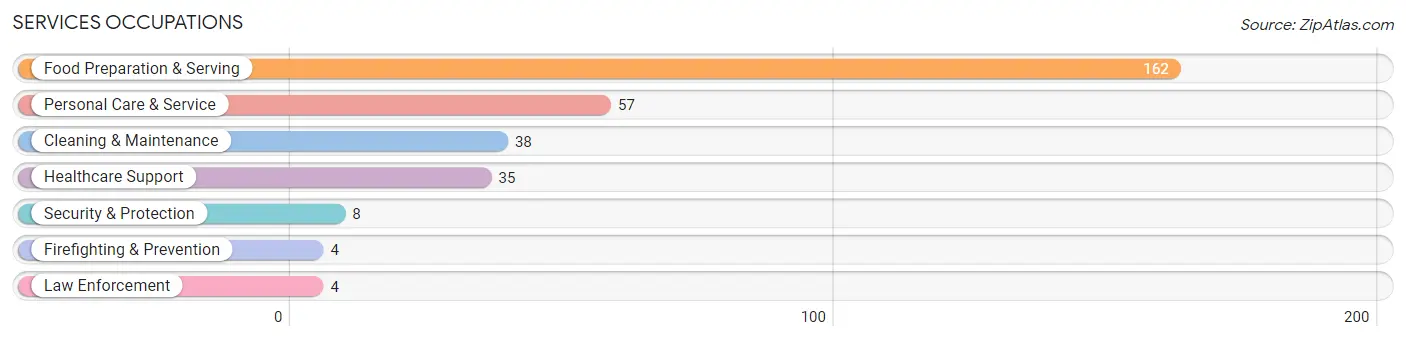
Services Occupations
The most common Services occupations in Duquesne are Food Preparation & Serving (162 | 14.0%), Personal Care & Service (57 | 4.9%), Cleaning & Maintenance (38 | 3.3%), Healthcare Support (35 | 3.0%), and Security & Protection (8 | 0.7%).
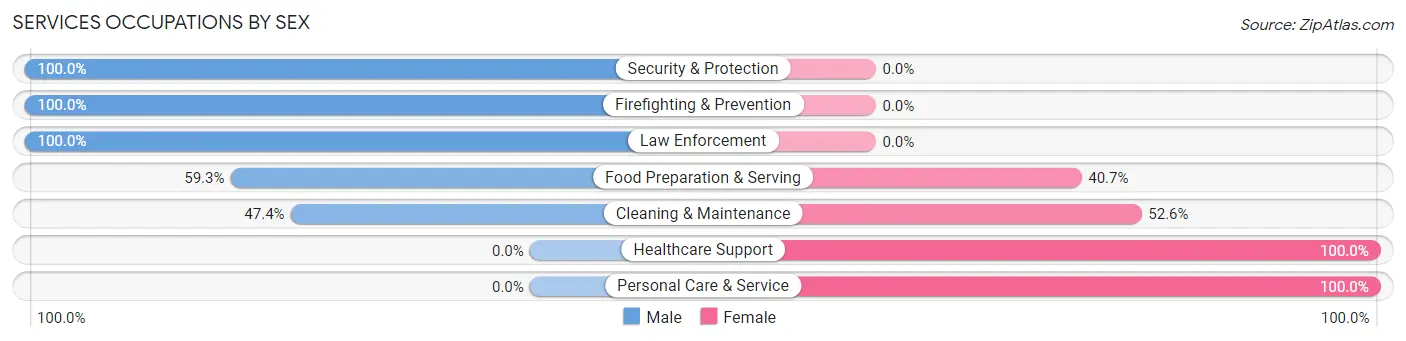
Services Occupations by Sex
Within the Services occupations in Duquesne, the most male-oriented occupations are Security & Protection (100.0%), Firefighting & Prevention (100.0%), and Law Enforcement (100.0%), while the most female-oriented occupations are Healthcare Support (100.0%), Personal Care & Service (100.0%), and Cleaning & Maintenance (52.6%).
| Occupation | Male | Female |
| Healthcare Support | 0 (0.0%) | 35 (100.0%) |
| Security & Protection | 8 (100.0%) | 0 (0.0%) |
| Firefighting & Prevention | 4 (100.0%) | 0 (0.0%) |
| Law Enforcement | 4 (100.0%) | 0 (0.0%) |
| Food Preparation & Serving | 96 (59.3%) | 66 (40.7%) |
| Cleaning & Maintenance | 18 (47.4%) | 20 (52.6%) |
| Personal Care & Service | 0 (0.0%) | 57 (100.0%) |
| Total (Category) | 122 (40.7%) | 178 (59.3%) |
| Total (Overall) | 614 (53.2%) | 541 (46.8%) |
Sales and Office Occupations
The most common Sales and Office occupations in Duquesne are Office & Administration (157 | 13.6%), and Sales & Related (88 | 7.6%).

Sales and Office Occupations by Sex

| Occupation | Male | Female |
| Sales & Related | 79 (89.8%) | 9 (10.2%) |
| Office & Administration | 64 (40.8%) | 93 (59.2%) |
| Total (Category) | 143 (58.4%) | 102 (41.6%) |
| Total (Overall) | 614 (53.2%) | 541 (46.8%) |
Natural Resources, Construction and Maintenance Occupations
The most common Natural Resources, Construction and Maintenance occupations in Duquesne are Construction & Extraction (43 | 3.7%), and Installation, Maintenance & Repair (14 | 1.2%).
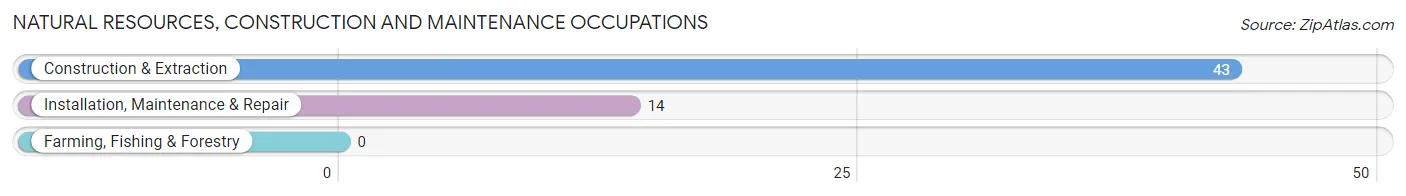
Natural Resources, Construction and Maintenance Occupations by Sex
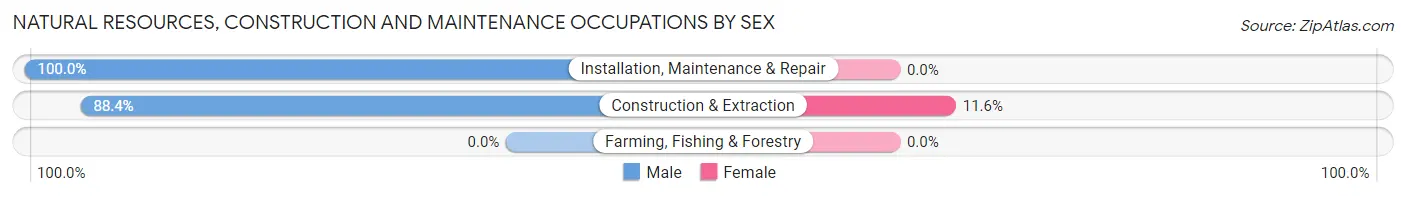
| Occupation | Male | Female |
| Farming, Fishing & Forestry | 0 (0.0%) | 0 (0.0%) |
| Construction & Extraction | 38 (88.4%) | 5 (11.6%) |
| Installation, Maintenance & Repair | 14 (100.0%) | 0 (0.0%) |
| Total (Category) | 52 (91.2%) | 5 (8.8%) |
| Total (Overall) | 614 (53.2%) | 541 (46.8%) |
Production, Transportation and Moving Occupations
The most common Production, Transportation and Moving occupations in Duquesne are Material Moving (80 | 6.9%), Production (70 | 6.1%), and Transportation (19 | 1.7%).
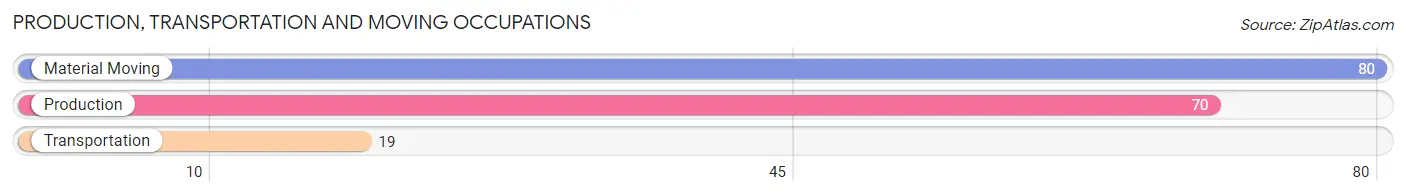
Production, Transportation and Moving Occupations by Sex
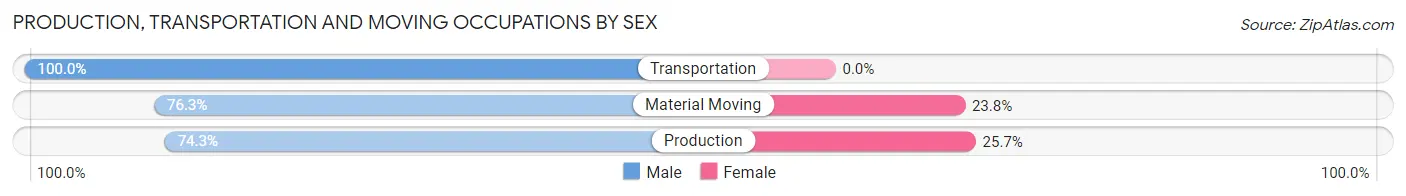
| Occupation | Male | Female |
| Production | 52 (74.3%) | 18 (25.7%) |
| Transportation | 19 (100.0%) | 0 (0.0%) |
| Material Moving | 61 (76.2%) | 19 (23.7%) |
| Total (Category) | 132 (78.1%) | 37 (21.9%) |
| Total (Overall) | 614 (53.2%) | 541 (46.8%) |
Employment Industries by Sex in Duquesne
Employment Industries in Duquesne
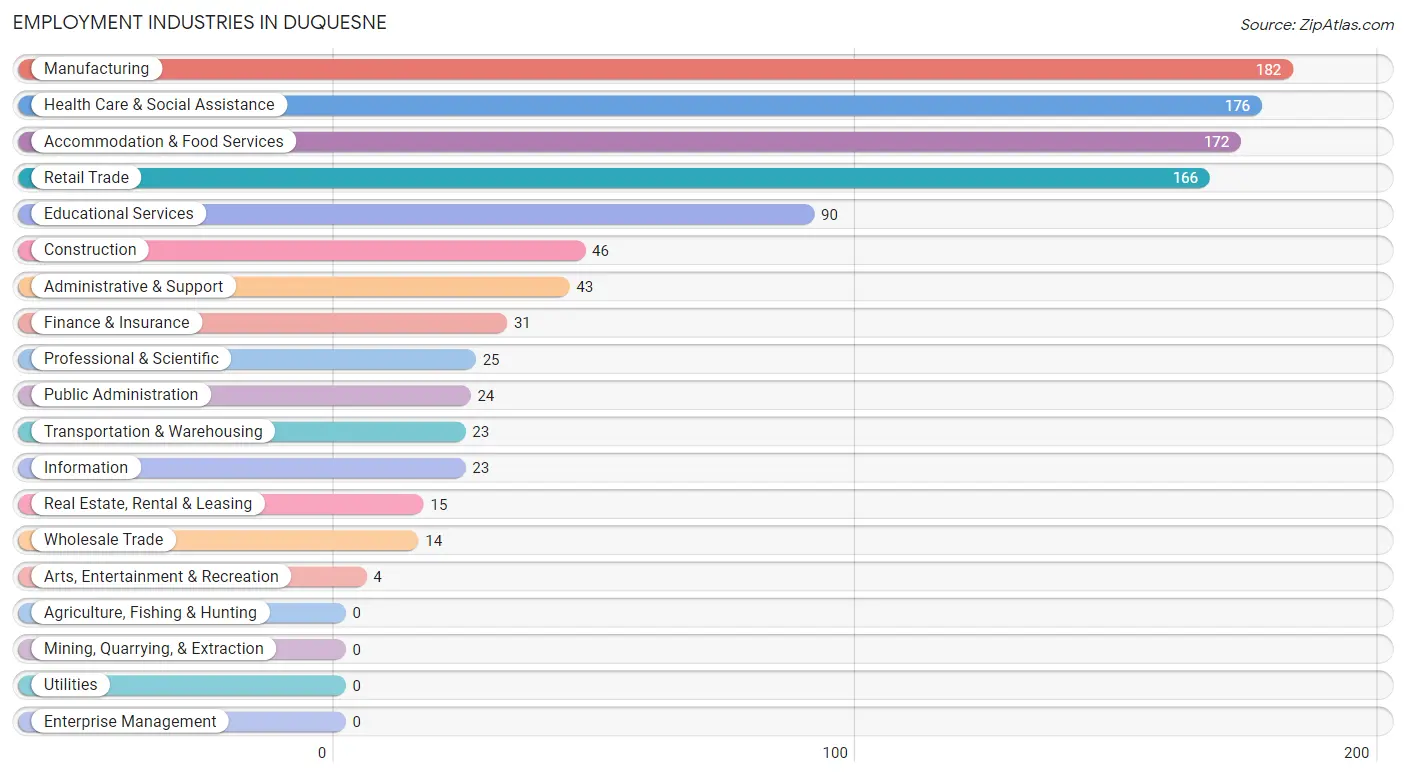
The major employment industries in Duquesne include Manufacturing (182 | 15.8%), Health Care & Social Assistance (176 | 15.2%), Accommodation & Food Services (172 | 14.9%), Retail Trade (166 | 14.4%), and Educational Services (90 | 7.8%).
Employment Industries by Sex in Duquesne
The Duquesne industries that see more men than women are Wholesale Trade (100.0%), Real Estate, Rental & Leasing (100.0%), and Arts, Entertainment & Recreation (100.0%), whereas the industries that tend to have a higher number of women are Health Care & Social Assistance (95.5%), Finance & Insurance (83.9%), and Professional & Scientific (76.0%).
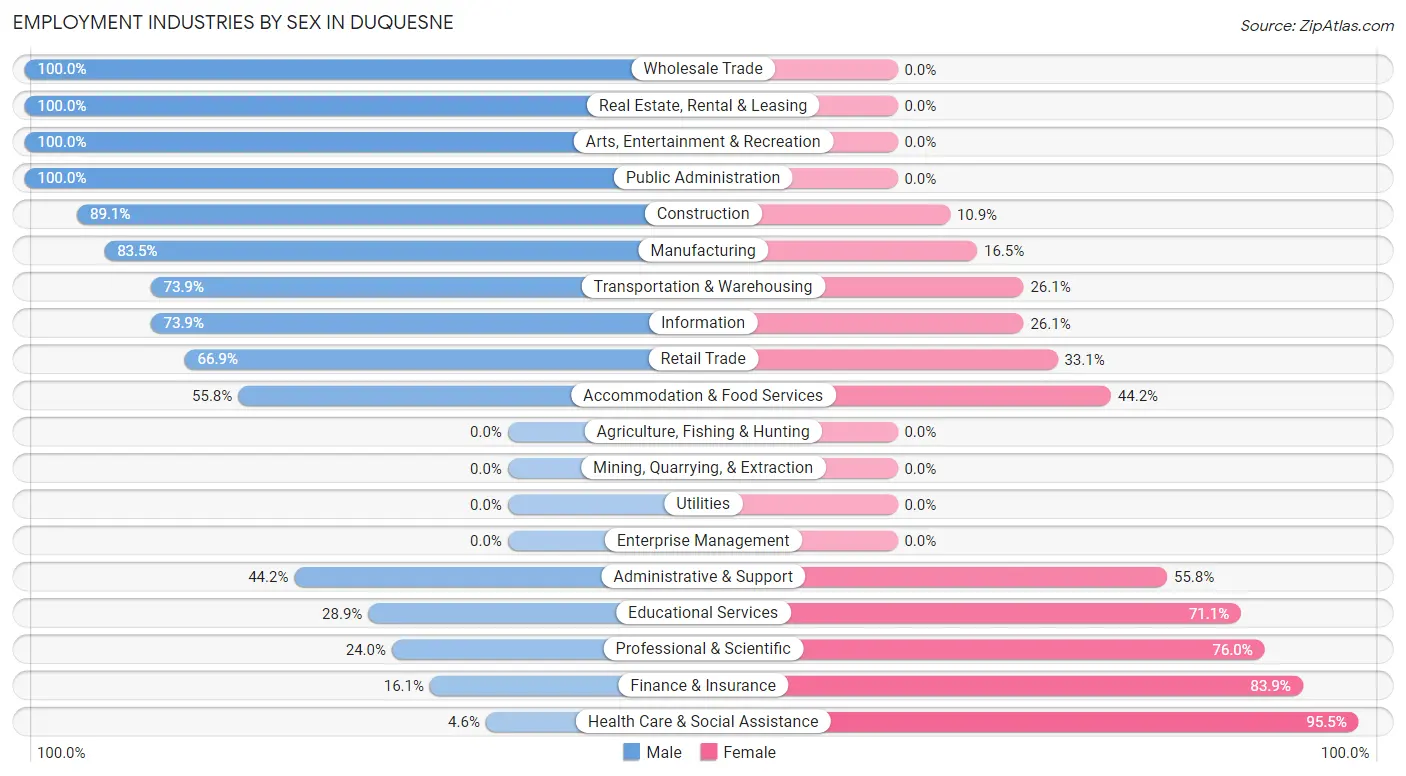
| Industry | Male | Female |
| Agriculture, Fishing & Hunting | 0 (0.0%) | 0 (0.0%) |
| Mining, Quarrying, & Extraction | 0 (0.0%) | 0 (0.0%) |
| Construction | 41 (89.1%) | 5 (10.9%) |
| Manufacturing | 152 (83.5%) | 30 (16.5%) |
| Wholesale Trade | 14 (100.0%) | 0 (0.0%) |
| Retail Trade | 111 (66.9%) | 55 (33.1%) |
| Transportation & Warehousing | 17 (73.9%) | 6 (26.1%) |
| Utilities | 0 (0.0%) | 0 (0.0%) |
| Information | 17 (73.9%) | 6 (26.1%) |
| Finance & Insurance | 5 (16.1%) | 26 (83.9%) |
| Real Estate, Rental & Leasing | 15 (100.0%) | 0 (0.0%) |
| Professional & Scientific | 6 (24.0%) | 19 (76.0%) |
| Enterprise Management | 0 (0.0%) | 0 (0.0%) |
| Administrative & Support | 19 (44.2%) | 24 (55.8%) |
| Educational Services | 26 (28.9%) | 64 (71.1%) |
| Health Care & Social Assistance | 8 (4.5%) | 168 (95.5%) |
| Arts, Entertainment & Recreation | 4 (100.0%) | 0 (0.0%) |
| Accommodation & Food Services | 96 (55.8%) | 76 (44.2%) |
| Public Administration | 24 (100.0%) | 0 (0.0%) |
| Total | 614 (53.2%) | 541 (46.8%) |
Education in Duquesne
School Enrollment in Duquesne
The most common levels of schooling among the 500 students in Duquesne are college / undergraduate (156 | 31.2%), middle school (114 | 22.8%), and elementary school (93 | 18.6%).
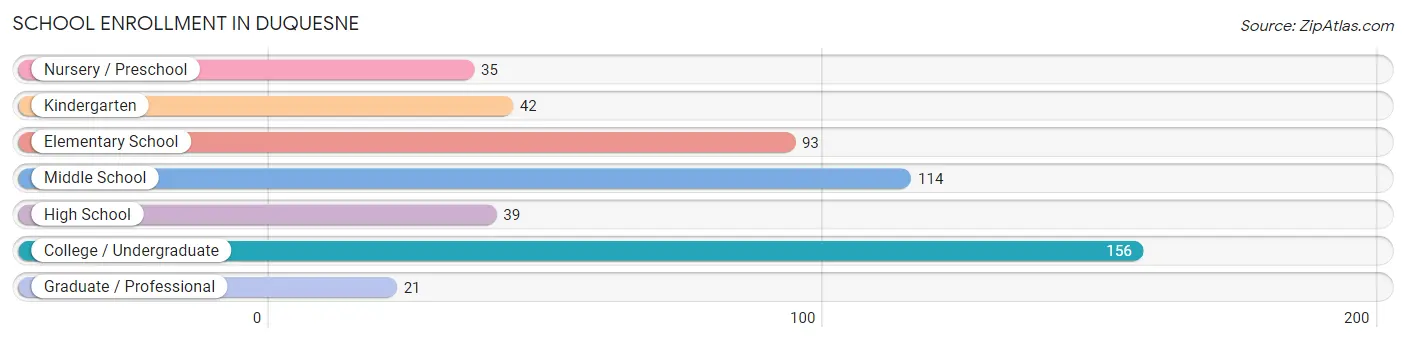
| School Level | # Students | % Students |
| Nursery / Preschool | 35 | 7.0% |
| Kindergarten | 42 | 8.4% |
| Elementary School | 93 | 18.6% |
| Middle School | 114 | 22.8% |
| High School | 39 | 7.8% |
| College / Undergraduate | 156 | 31.2% |
| Graduate / Professional | 21 | 4.2% |
| Total | 500 | 100.0% |
School Enrollment by Age by Funding Source in Duquesne
Out of a total of 500 students who are enrolled in schools in Duquesne, 63 (12.6%) attend a private institution, while the remaining 437 (87.4%) are enrolled in public schools. The age group of 35 years and over has the highest likelihood of being enrolled in private schools, with 5 (31.2% in the age bracket) enrolled. Conversely, the age group of 3 to 4 year olds has the lowest likelihood of being enrolled in a private school, with 35 (100.0% in the age bracket) attending a public institution.
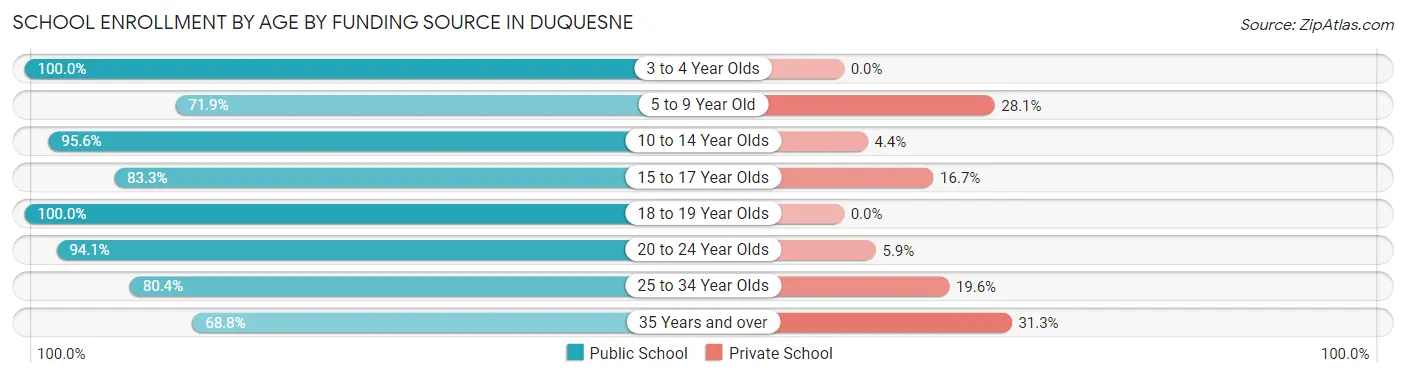
| Age Bracket | Public School | Private School |
| 3 to 4 Year Olds | 35 (100.0%) | 0 (0.0%) |
| 5 to 9 Year Old | 82 (71.9%) | 32 (28.1%) |
| 10 to 14 Year Olds | 129 (95.6%) | 6 (4.4%) |
| 15 to 17 Year Olds | 20 (83.3%) | 4 (16.7%) |
| 18 to 19 Year Olds | 24 (100.0%) | 0 (0.0%) |
| 20 to 24 Year Olds | 95 (94.1%) | 6 (5.9%) |
| 25 to 34 Year Olds | 41 (80.4%) | 10 (19.6%) |
| 35 Years and over | 11 (68.8%) | 5 (31.2%) |
| Total | 437 (87.4%) | 63 (12.6%) |
Educational Attainment by Field of Study in Duquesne
Education (55 | 15.9%), bio, nature & agricultural (50 | 14.4%), psychology (39 | 11.3%), liberal arts & history (35 | 10.1%), and science & technology (33 | 9.5%) are the most common fields of study among 346 individuals in Duquesne who have obtained a bachelor's degree or higher.
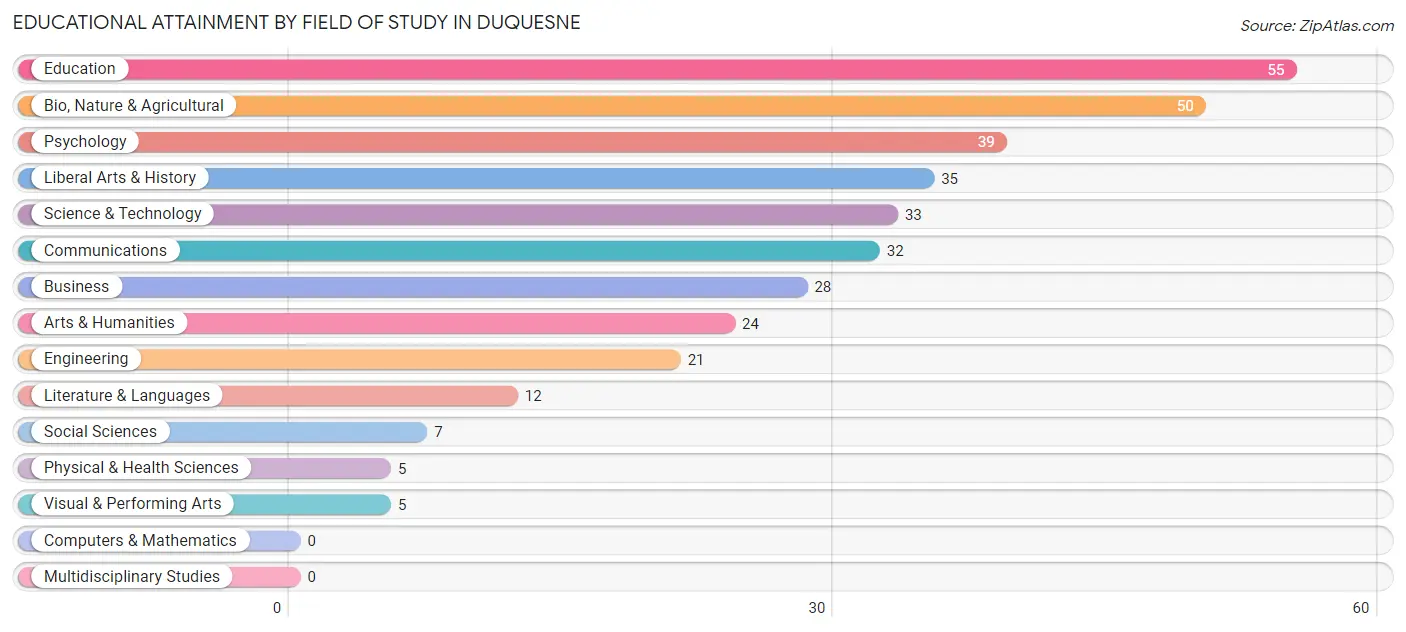
| Field of Study | # Graduates | % Graduates |
| Computers & Mathematics | 0 | 0.0% |
| Bio, Nature & Agricultural | 50 | 14.4% |
| Physical & Health Sciences | 5 | 1.5% |
| Psychology | 39 | 11.3% |
| Social Sciences | 7 | 2.0% |
| Engineering | 21 | 6.1% |
| Multidisciplinary Studies | 0 | 0.0% |
| Science & Technology | 33 | 9.5% |
| Business | 28 | 8.1% |
| Education | 55 | 15.9% |
| Literature & Languages | 12 | 3.5% |
| Liberal Arts & History | 35 | 10.1% |
| Visual & Performing Arts | 5 | 1.5% |
| Communications | 32 | 9.2% |
| Arts & Humanities | 24 | 6.9% |
| Total | 346 | 100.0% |
Transportation & Commute in Duquesne
Vehicle Availability by Sex in Duquesne
The most prevalent vehicle ownership categories in Duquesne are males with 3 vehicles (232, accounting for 37.8%) and females with 3 vehicles (128, making up 45.1%).
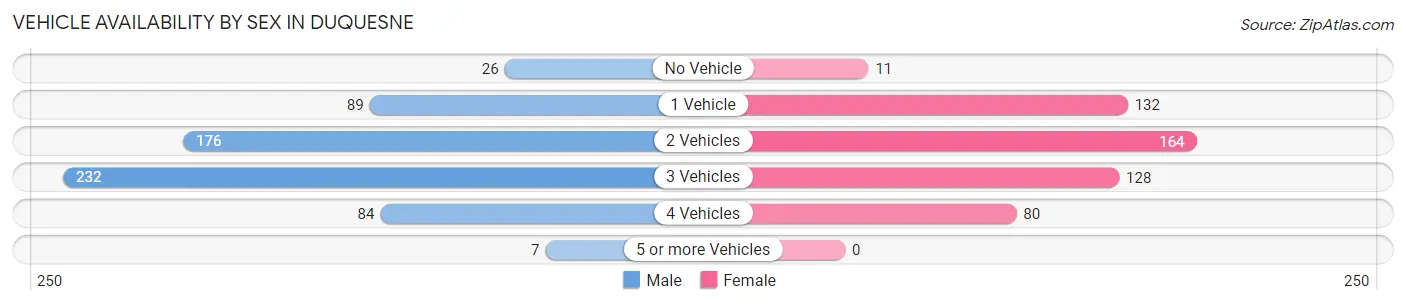
| Vehicles Available | Male | Female |
| No Vehicle | 26 (4.2%) | 11 (2.1%) |
| 1 Vehicle | 89 (14.5%) | 132 (25.6%) |
| 2 Vehicles | 176 (28.7%) | 164 (31.8%) |
| 3 Vehicles | 232 (37.8%) | 128 (24.8%) |
| 4 Vehicles | 84 (13.7%) | 80 (15.5%) |
| 5 or more Vehicles | 7 (1.1%) | 0 (0.0%) |
| Total | 614 (100.0%) | 515 (100.0%) |
Commute Time in Duquesne
The most frequently occuring commute durations in Duquesne are 15 to 19 minutes (309 commuters, 29.0%), 5 to 9 minutes (218 commuters, 20.4%), and 10 to 14 minutes (218 commuters, 20.4%).
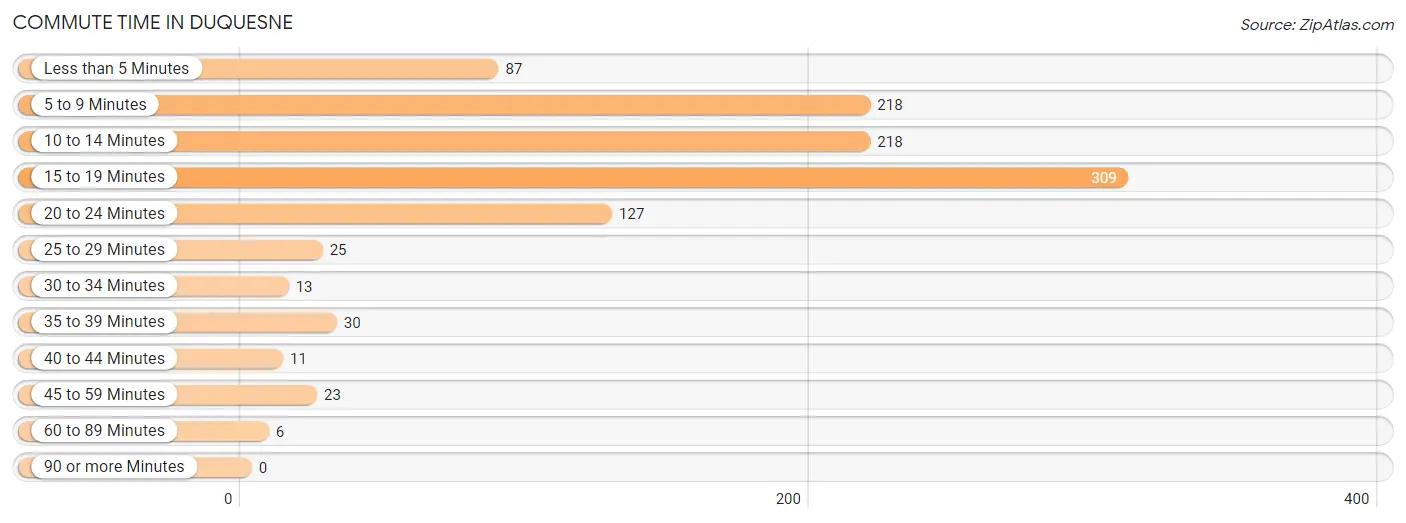
| Commute Time | # Commuters | % Commuters |
| Less than 5 Minutes | 87 | 8.2% |
| 5 to 9 Minutes | 218 | 20.4% |
| 10 to 14 Minutes | 218 | 20.4% |
| 15 to 19 Minutes | 309 | 29.0% |
| 20 to 24 Minutes | 127 | 11.9% |
| 25 to 29 Minutes | 25 | 2.3% |
| 30 to 34 Minutes | 13 | 1.2% |
| 35 to 39 Minutes | 30 | 2.8% |
| 40 to 44 Minutes | 11 | 1.0% |
| 45 to 59 Minutes | 23 | 2.2% |
| 60 to 89 Minutes | 6 | 0.6% |
| 90 or more Minutes | 0 | 0.0% |
Commute Time by Sex in Duquesne
The most common commute times in Duquesne are 15 to 19 minutes (157 commuters, 26.5%) for males and 15 to 19 minutes (152 commuters, 32.0%) for females.
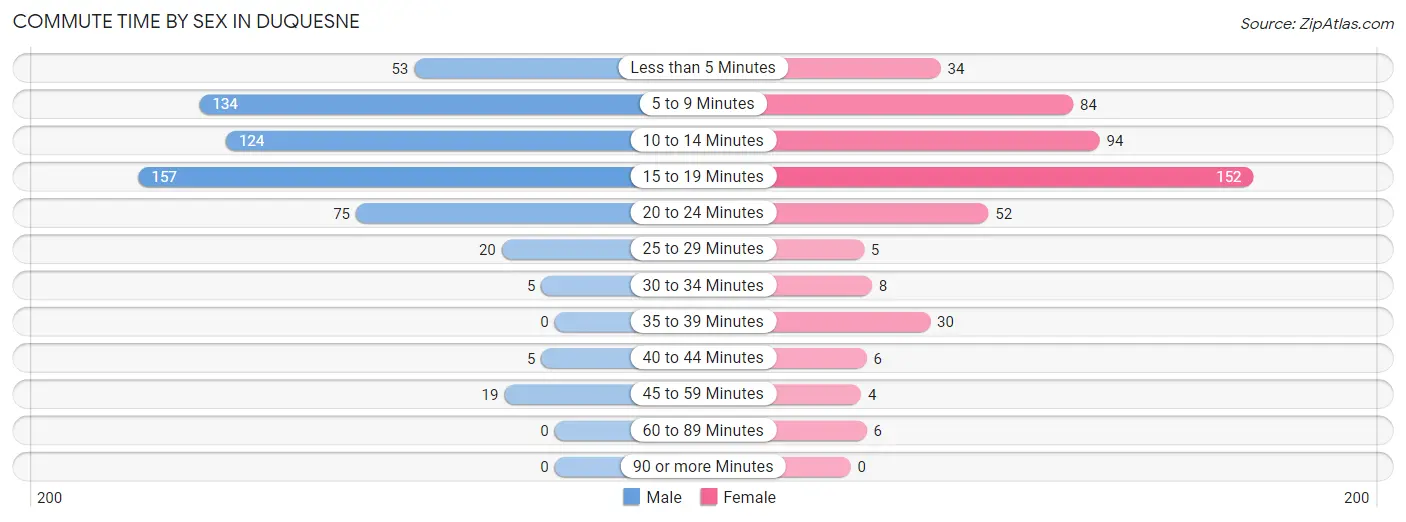
| Commute Time | Male | Female |
| Less than 5 Minutes | 53 (8.9%) | 34 (7.2%) |
| 5 to 9 Minutes | 134 (22.6%) | 84 (17.7%) |
| 10 to 14 Minutes | 124 (20.9%) | 94 (19.8%) |
| 15 to 19 Minutes | 157 (26.5%) | 152 (32.0%) |
| 20 to 24 Minutes | 75 (12.7%) | 52 (11.0%) |
| 25 to 29 Minutes | 20 (3.4%) | 5 (1.1%) |
| 30 to 34 Minutes | 5 (0.8%) | 8 (1.7%) |
| 35 to 39 Minutes | 0 (0.0%) | 30 (6.3%) |
| 40 to 44 Minutes | 5 (0.8%) | 6 (1.3%) |
| 45 to 59 Minutes | 19 (3.2%) | 4 (0.8%) |
| 60 to 89 Minutes | 0 (0.0%) | 6 (1.3%) |
| 90 or more Minutes | 0 (0.0%) | 0 (0.0%) |
Time of Departure to Work by Sex in Duquesne
The most frequent times of departure to work in Duquesne are 7:30 AM to 7:59 AM (110, 18.6%) for males and 7:30 AM to 7:59 AM (128, 27.0%) for females.
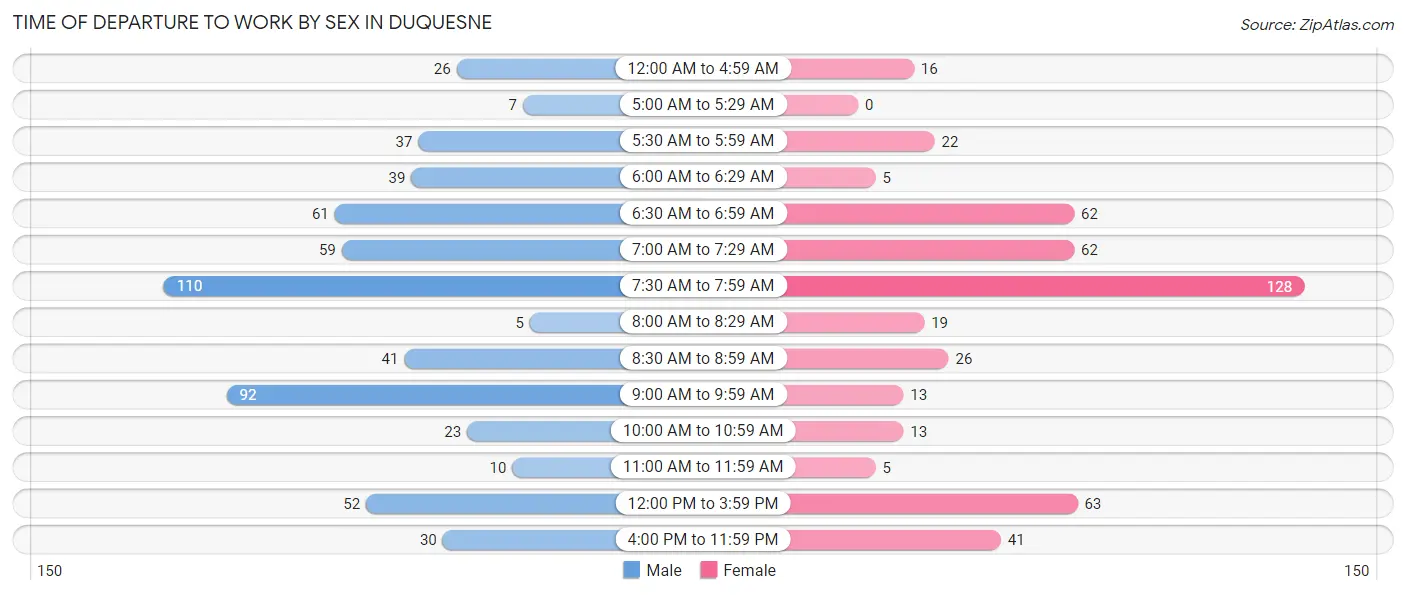
| Time of Departure | Male | Female |
| 12:00 AM to 4:59 AM | 26 (4.4%) | 16 (3.4%) |
| 5:00 AM to 5:29 AM | 7 (1.2%) | 0 (0.0%) |
| 5:30 AM to 5:59 AM | 37 (6.2%) | 22 (4.6%) |
| 6:00 AM to 6:29 AM | 39 (6.6%) | 5 (1.1%) |
| 6:30 AM to 6:59 AM | 61 (10.3%) | 62 (13.1%) |
| 7:00 AM to 7:29 AM | 59 (10.0%) | 62 (13.1%) |
| 7:30 AM to 7:59 AM | 110 (18.6%) | 128 (27.0%) |
| 8:00 AM to 8:29 AM | 5 (0.8%) | 19 (4.0%) |
| 8:30 AM to 8:59 AM | 41 (6.9%) | 26 (5.5%) |
| 9:00 AM to 9:59 AM | 92 (15.5%) | 13 (2.7%) |
| 10:00 AM to 10:59 AM | 23 (3.9%) | 13 (2.7%) |
| 11:00 AM to 11:59 AM | 10 (1.7%) | 5 (1.1%) |
| 12:00 PM to 3:59 PM | 52 (8.8%) | 63 (13.3%) |
| 4:00 PM to 11:59 PM | 30 (5.1%) | 41 (8.6%) |
| Total | 592 (100.0%) | 475 (100.0%) |
Housing Occupancy in Duquesne
Occupancy by Ownership in Duquesne
Of the total 971 dwellings in Duquesne, owner-occupied units account for 493 (50.8%), while renter-occupied units make up 478 (49.2%).
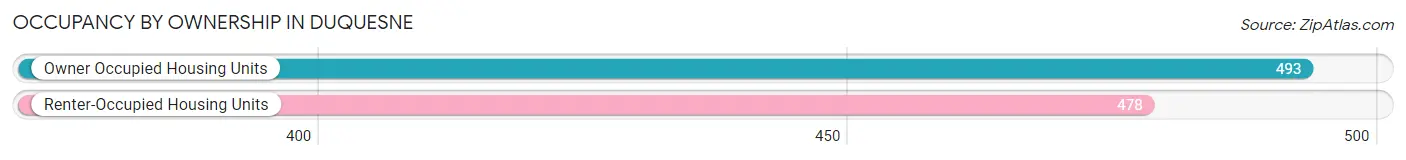
| Occupancy | # Housing Units | % Housing Units |
| Owner Occupied Housing Units | 493 | 50.8% |
| Renter-Occupied Housing Units | 478 | 49.2% |
| Total Occupied Housing Units | 971 | 100.0% |
Occupancy by Household Size in Duquesne
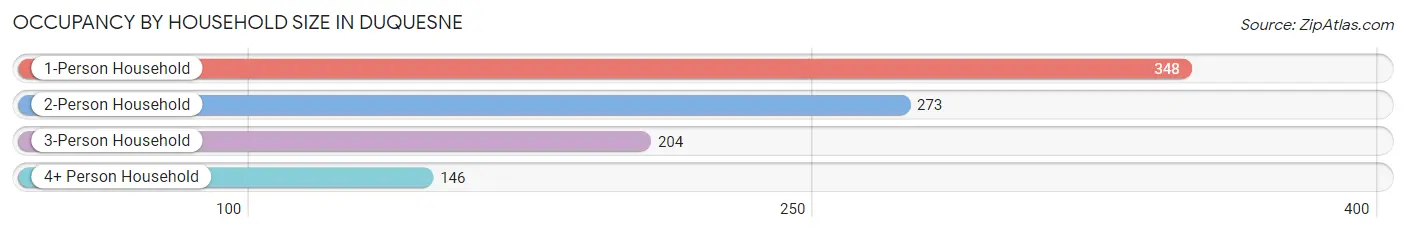
| Household Size | # Housing Units | % Housing Units |
| 1-Person Household | 348 | 35.8% |
| 2-Person Household | 273 | 28.1% |
| 3-Person Household | 204 | 21.0% |
| 4+ Person Household | 146 | 15.0% |
| Total Housing Units | 971 | 100.0% |
Occupancy by Ownership by Household Size in Duquesne
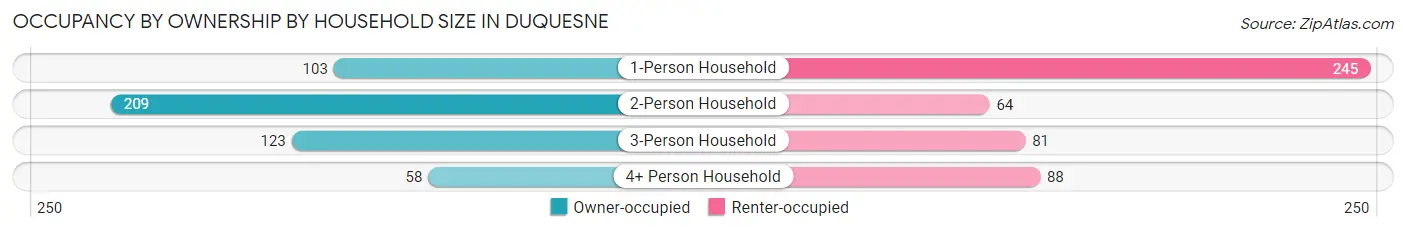
| Household Size | Owner-occupied | Renter-occupied |
| 1-Person Household | 103 (29.6%) | 245 (70.4%) |
| 2-Person Household | 209 (76.6%) | 64 (23.4%) |
| 3-Person Household | 123 (60.3%) | 81 (39.7%) |
| 4+ Person Household | 58 (39.7%) | 88 (60.3%) |
| Total Housing Units | 493 (50.8%) | 478 (49.2%) |
Occupancy by Educational Attainment in Duquesne
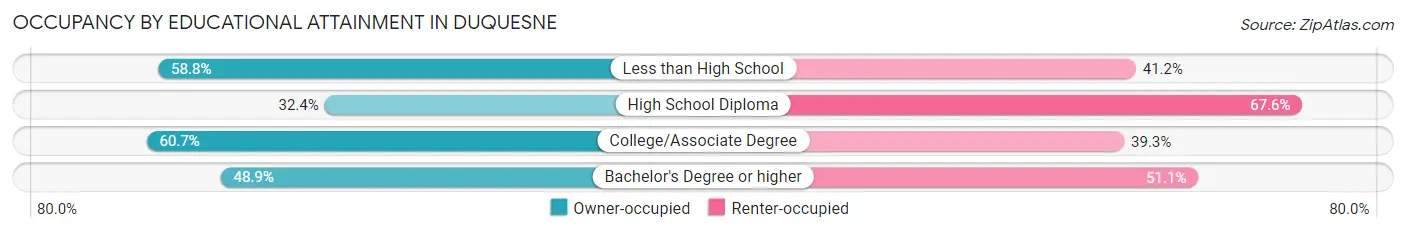
| Household Size | Owner-occupied | Renter-occupied |
| Less than High School | 50 (58.8%) | 35 (41.2%) |
| High School Diploma | 71 (32.4%) | 148 (67.6%) |
| College/Associate Degree | 236 (60.7%) | 153 (39.3%) |
| Bachelor's Degree or higher | 136 (48.9%) | 142 (51.1%) |
Occupancy by Age of Householder in Duquesne
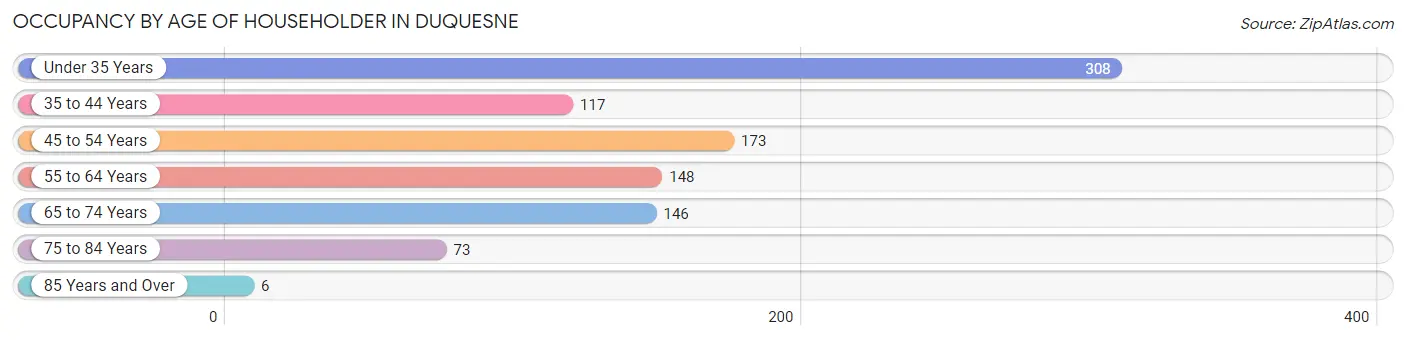
| Age Bracket | # Households | % Households |
| Under 35 Years | 308 | 31.7% |
| 35 to 44 Years | 117 | 12.0% |
| 45 to 54 Years | 173 | 17.8% |
| 55 to 64 Years | 148 | 15.2% |
| 65 to 74 Years | 146 | 15.0% |
| 75 to 84 Years | 73 | 7.5% |
| 85 Years and Over | 6 | 0.6% |
| Total | 971 | 100.0% |
Housing Finances in Duquesne
Median Income by Occupancy in Duquesne
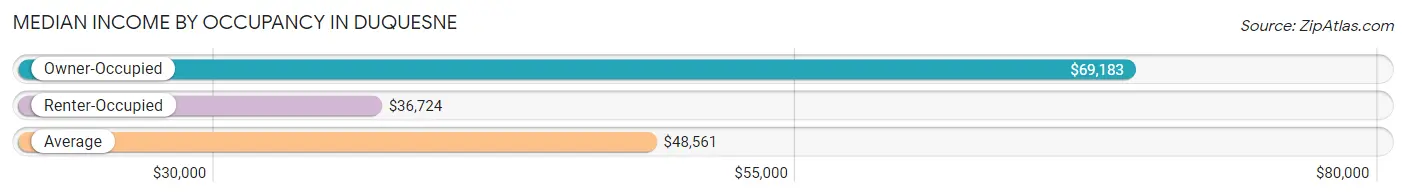
| Occupancy Type | # Households | Median Income |
| Owner-Occupied | 493 (50.8%) | $69,183 |
| Renter-Occupied | 478 (49.2%) | $36,724 |
| Average | 971 (100.0%) | $48,561 |
Occupancy by Householder Income Bracket in Duquesne
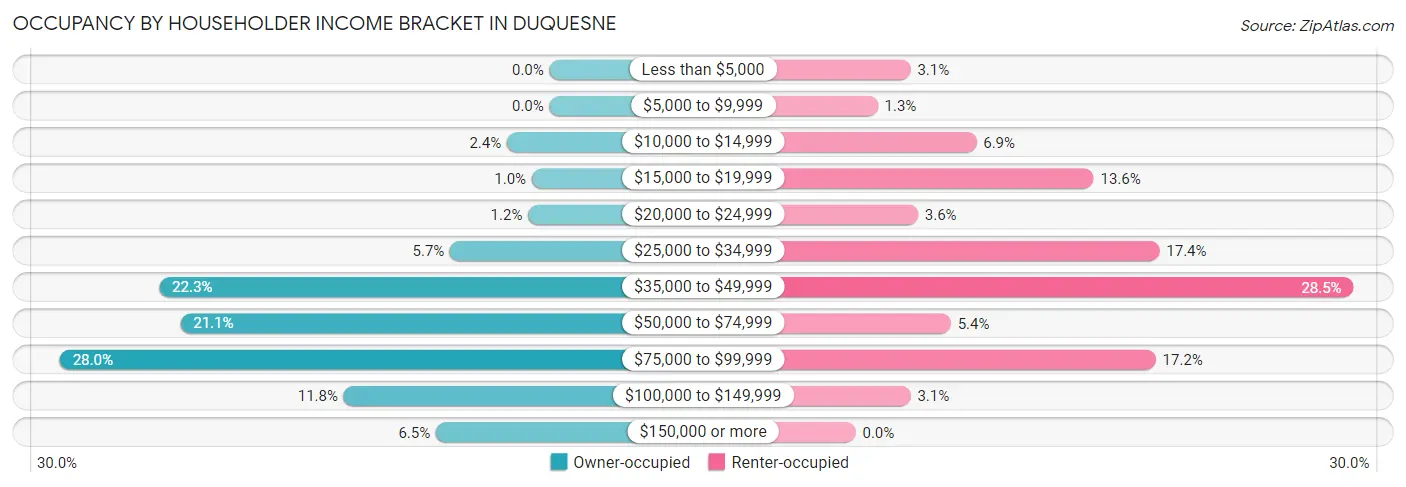
| Income Bracket | Owner-occupied | Renter-occupied |
| Less than $5,000 | 0 (0.0%) | 15 (3.1%) |
| $5,000 to $9,999 | 0 (0.0%) | 6 (1.3%) |
| $10,000 to $14,999 | 12 (2.4%) | 33 (6.9%) |
| $15,000 to $19,999 | 5 (1.0%) | 65 (13.6%) |
| $20,000 to $24,999 | 6 (1.2%) | 17 (3.6%) |
| $25,000 to $34,999 | 28 (5.7%) | 83 (17.4%) |
| $35,000 to $49,999 | 110 (22.3%) | 136 (28.4%) |
| $50,000 to $74,999 | 104 (21.1%) | 26 (5.4%) |
| $75,000 to $99,999 | 138 (28.0%) | 82 (17.2%) |
| $100,000 to $149,999 | 58 (11.8%) | 15 (3.1%) |
| $150,000 or more | 32 (6.5%) | 0 (0.0%) |
| Total | 493 (100.0%) | 478 (100.0%) |
Monthly Housing Cost Tiers in Duquesne
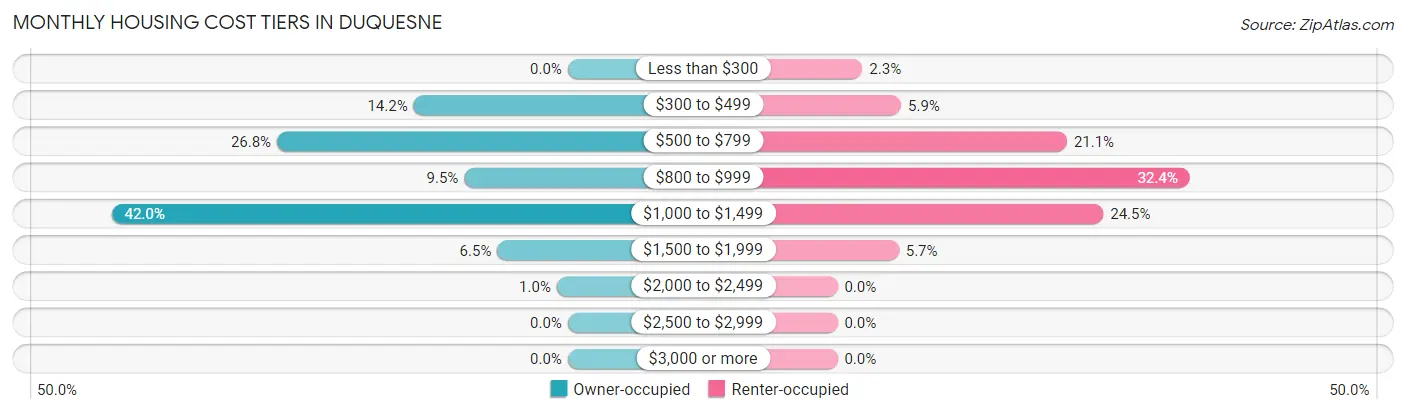
| Monthly Cost | Owner-occupied | Renter-occupied |
| Less than $300 | 0 (0.0%) | 11 (2.3%) |
| $300 to $499 | 70 (14.2%) | 28 (5.9%) |
| $500 to $799 | 132 (26.8%) | 101 (21.1%) |
| $800 to $999 | 47 (9.5%) | 155 (32.4%) |
| $1,000 to $1,499 | 207 (42.0%) | 117 (24.5%) |
| $1,500 to $1,999 | 32 (6.5%) | 27 (5.7%) |
| $2,000 to $2,499 | 5 (1.0%) | 0 (0.0%) |
| $2,500 to $2,999 | 0 (0.0%) | 0 (0.0%) |
| $3,000 or more | 0 (0.0%) | 0 (0.0%) |
| Total | 493 (100.0%) | 478 (100.0%) |
Physical Housing Characteristics in Duquesne
Housing Structures in Duquesne
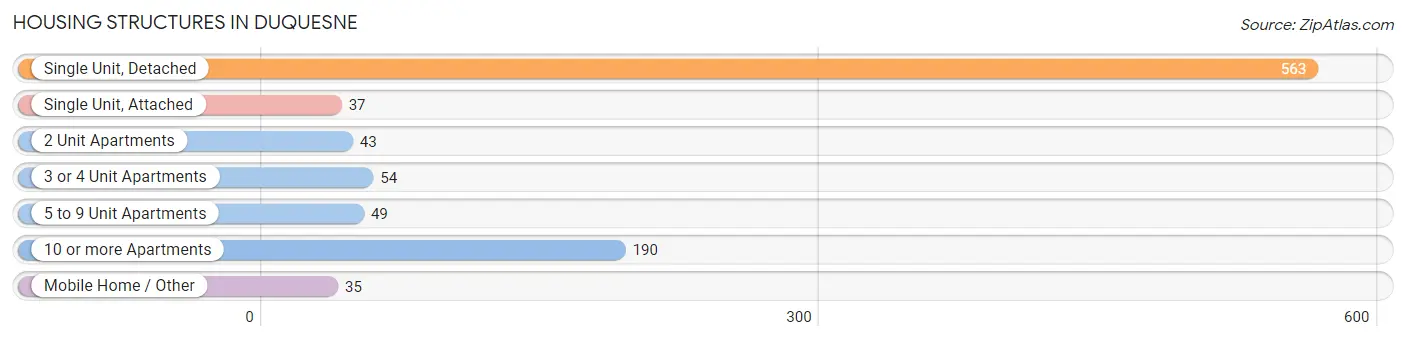
| Structure Type | # Housing Units | % Housing Units |
| Single Unit, Detached | 563 | 58.0% |
| Single Unit, Attached | 37 | 3.8% |
| 2 Unit Apartments | 43 | 4.4% |
| 3 or 4 Unit Apartments | 54 | 5.6% |
| 5 to 9 Unit Apartments | 49 | 5.1% |
| 10 or more Apartments | 190 | 19.6% |
| Mobile Home / Other | 35 | 3.6% |
| Total | 971 | 100.0% |
Housing Structures by Occupancy in Duquesne
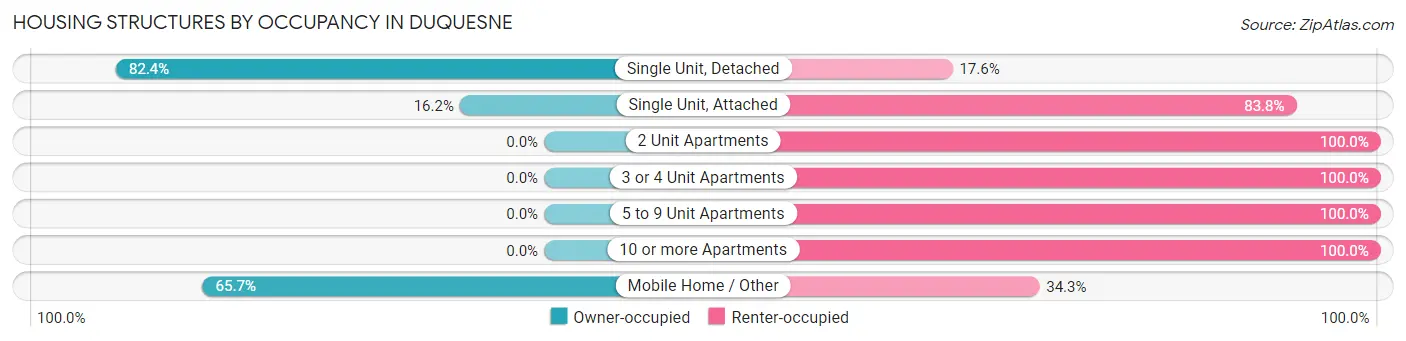
| Structure Type | Owner-occupied | Renter-occupied |
| Single Unit, Detached | 464 (82.4%) | 99 (17.6%) |
| Single Unit, Attached | 6 (16.2%) | 31 (83.8%) |
| 2 Unit Apartments | 0 (0.0%) | 43 (100.0%) |
| 3 or 4 Unit Apartments | 0 (0.0%) | 54 (100.0%) |
| 5 to 9 Unit Apartments | 0 (0.0%) | 49 (100.0%) |
| 10 or more Apartments | 0 (0.0%) | 190 (100.0%) |
| Mobile Home / Other | 23 (65.7%) | 12 (34.3%) |
| Total | 493 (50.8%) | 478 (49.2%) |
Housing Structures by Number of Rooms in Duquesne
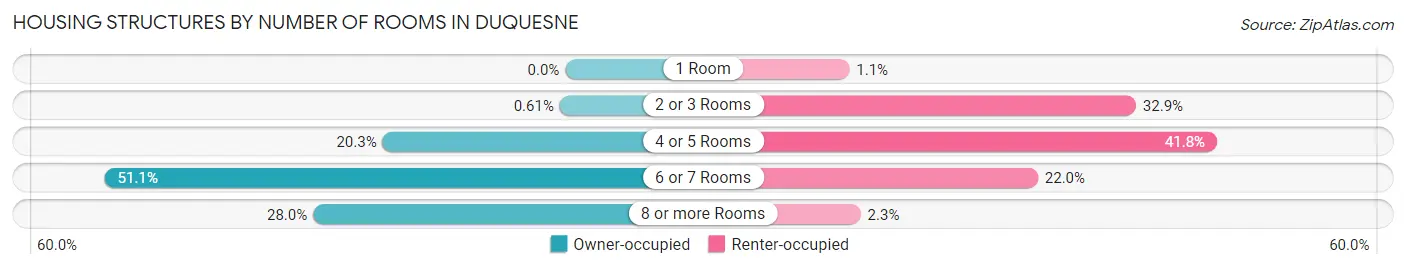
| Number of Rooms | Owner-occupied | Renter-occupied |
| 1 Room | 0 (0.0%) | 5 (1.1%) |
| 2 or 3 Rooms | 3 (0.6%) | 157 (32.9%) |
| 4 or 5 Rooms | 100 (20.3%) | 200 (41.8%) |
| 6 or 7 Rooms | 252 (51.1%) | 105 (22.0%) |
| 8 or more Rooms | 138 (28.0%) | 11 (2.3%) |
| Total | 493 (100.0%) | 478 (100.0%) |
Housing Structure by Heating Type in Duquesne
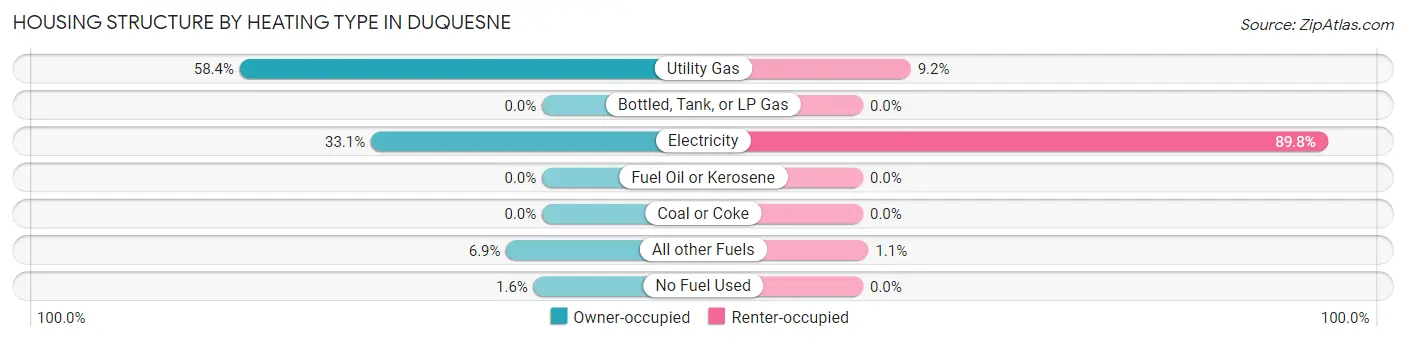
| Heating Type | Owner-occupied | Renter-occupied |
| Utility Gas | 288 (58.4%) | 44 (9.2%) |
| Bottled, Tank, or LP Gas | 0 (0.0%) | 0 (0.0%) |
| Electricity | 163 (33.1%) | 429 (89.7%) |
| Fuel Oil or Kerosene | 0 (0.0%) | 0 (0.0%) |
| Coal or Coke | 0 (0.0%) | 0 (0.0%) |
| All other Fuels | 34 (6.9%) | 5 (1.1%) |
| No Fuel Used | 8 (1.6%) | 0 (0.0%) |
| Total | 493 (100.0%) | 478 (100.0%) |
Household Vehicle Usage in Duquesne
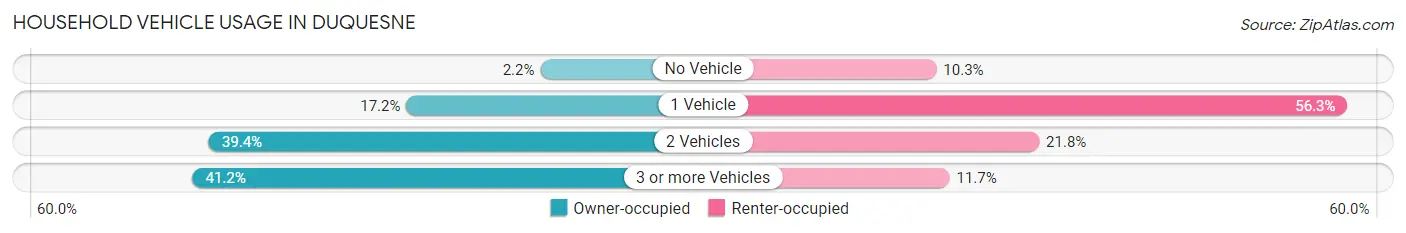
| Vehicles per Household | Owner-occupied | Renter-occupied |
| No Vehicle | 11 (2.2%) | 49 (10.2%) |
| 1 Vehicle | 85 (17.2%) | 269 (56.3%) |
| 2 Vehicles | 194 (39.4%) | 104 (21.8%) |
| 3 or more Vehicles | 203 (41.2%) | 56 (11.7%) |
| Total | 493 (100.0%) | 478 (100.0%) |
Real Estate & Mortgages in Duquesne
Real Estate and Mortgage Overview in Duquesne
| Characteristic | Without Mortgage | With Mortgage |
| Housing Units | 175 | 318 |
| Median Property Value | $171,400 | $152,400 |
| Median Household Income | $61,354 | $32 |
| Monthly Housing Costs | $607 | $0 |
| Real Estate Taxes | $1,289 | $5 |
Property Value by Mortgage Status in Duquesne
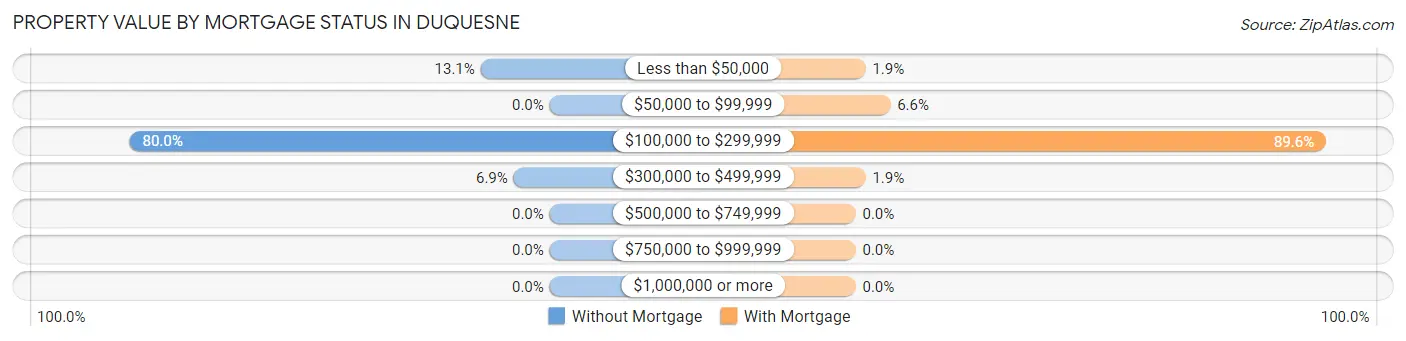
| Property Value | Without Mortgage | With Mortgage |
| Less than $50,000 | 23 (13.1%) | 6 (1.9%) |
| $50,000 to $99,999 | 0 (0.0%) | 21 (6.6%) |
| $100,000 to $299,999 | 140 (80.0%) | 285 (89.6%) |
| $300,000 to $499,999 | 12 (6.9%) | 6 (1.9%) |
| $500,000 to $749,999 | 0 (0.0%) | 0 (0.0%) |
| $750,000 to $999,999 | 0 (0.0%) | 0 (0.0%) |
| $1,000,000 or more | 0 (0.0%) | 0 (0.0%) |
| Total | 175 (100.0%) | 318 (100.0%) |
Household Income by Mortgage Status in Duquesne
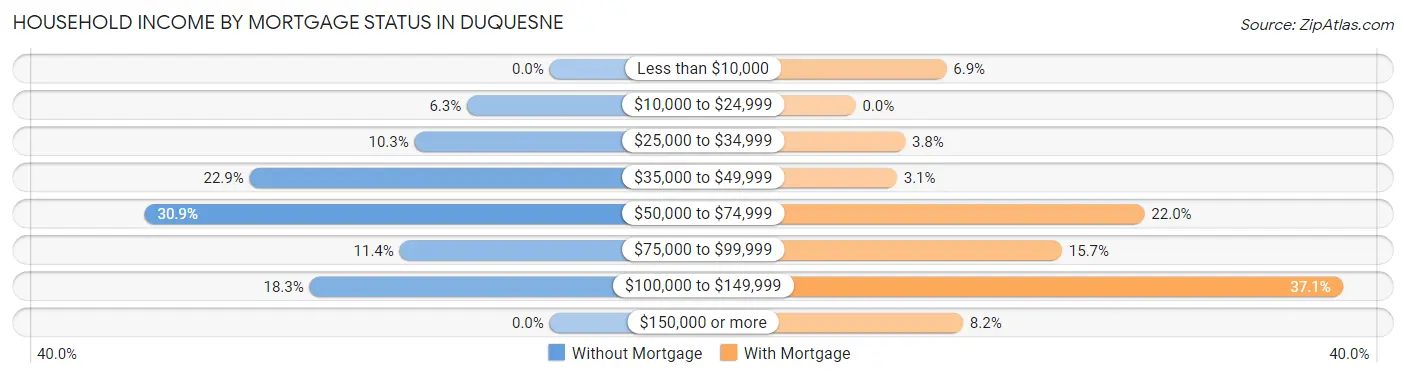
| Household Income | Without Mortgage | With Mortgage |
| Less than $10,000 | 0 (0.0%) | 22 (6.9%) |
| $10,000 to $24,999 | 11 (6.3%) | 0 (0.0%) |
| $25,000 to $34,999 | 18 (10.3%) | 12 (3.8%) |
| $35,000 to $49,999 | 40 (22.9%) | 10 (3.1%) |
| $50,000 to $74,999 | 54 (30.9%) | 70 (22.0%) |
| $75,000 to $99,999 | 20 (11.4%) | 50 (15.7%) |
| $100,000 to $149,999 | 32 (18.3%) | 118 (37.1%) |
| $150,000 or more | 0 (0.0%) | 26 (8.2%) |
| Total | 175 (100.0%) | 318 (100.0%) |
Property Value to Household Income Ratio in Duquesne
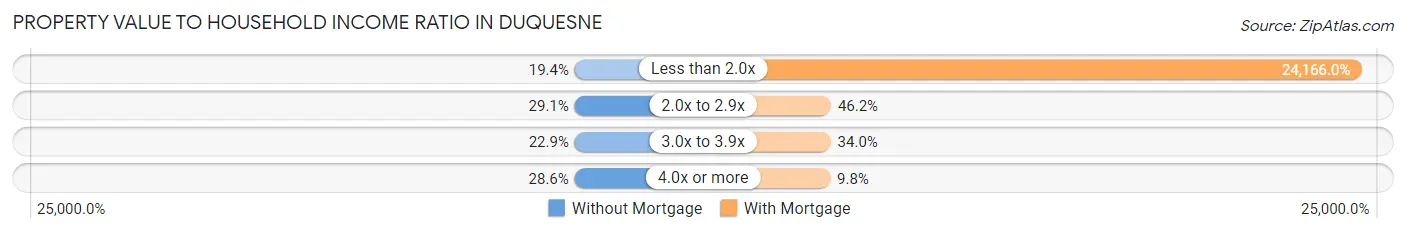
| Value-to-Income Ratio | Without Mortgage | With Mortgage |
| Less than 2.0x | 34 (19.4%) | 76,848 (24,166.0%) |
| 2.0x to 2.9x | 51 (29.1%) | 147 (46.2%) |
| 3.0x to 3.9x | 40 (22.9%) | 108 (34.0%) |
| 4.0x or more | 50 (28.6%) | 31 (9.8%) |
| Total | 175 (100.0%) | 318 (100.0%) |
Real Estate Taxes by Mortgage Status in Duquesne
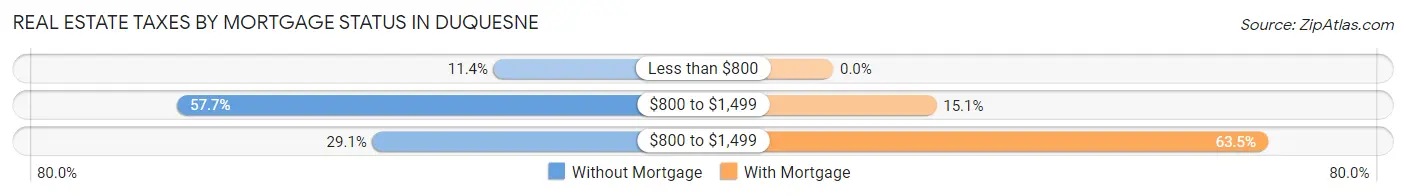
| Property Taxes | Without Mortgage | With Mortgage |
| Less than $800 | 20 (11.4%) | 0 (0.0%) |
| $800 to $1,499 | 101 (57.7%) | 48 (15.1%) |
| $800 to $1,499 | 51 (29.1%) | 202 (63.5%) |
| Total | 175 (100.0%) | 318 (100.0%) |
Health & Disability in Duquesne
Health Insurance Coverage by Age in Duquesne
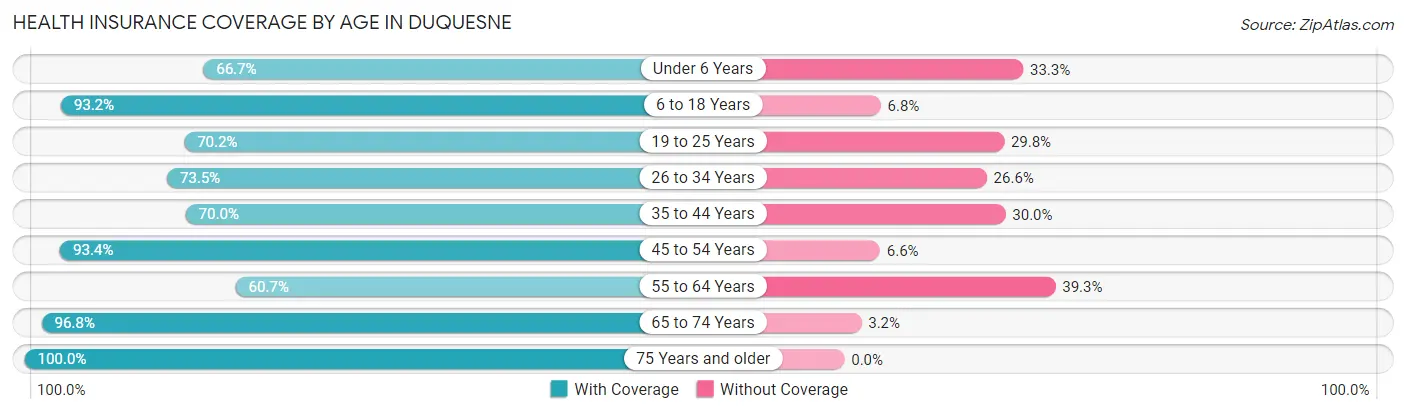
| Age Bracket | With Coverage | Without Coverage |
| Under 6 Years | 128 (66.7%) | 64 (33.3%) |
| 6 to 18 Years | 234 (93.2%) | 17 (6.8%) |
| 19 to 25 Years | 217 (70.2%) | 92 (29.8%) |
| 26 to 34 Years | 260 (73.5%) | 94 (26.6%) |
| 35 to 44 Years | 191 (70.0%) | 82 (30.0%) |
| 45 to 54 Years | 338 (93.4%) | 24 (6.6%) |
| 55 to 64 Years | 128 (60.7%) | 83 (39.3%) |
| 65 to 74 Years | 214 (96.8%) | 7 (3.2%) |
| 75 Years and older | 124 (100.0%) | 0 (0.0%) |
| Total | 1,834 (79.8%) | 463 (20.2%) |
Health Insurance Coverage by Citizenship Status in Duquesne
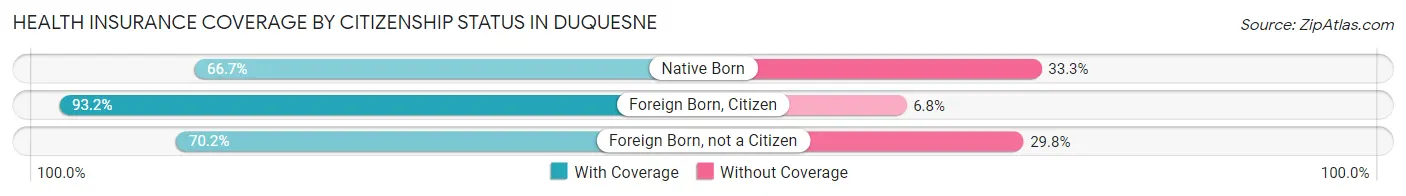
| Citizenship Status | With Coverage | Without Coverage |
| Native Born | 128 (66.7%) | 64 (33.3%) |
| Foreign Born, Citizen | 234 (93.2%) | 17 (6.8%) |
| Foreign Born, not a Citizen | 217 (70.2%) | 92 (29.8%) |
Health Insurance Coverage by Household Income in Duquesne
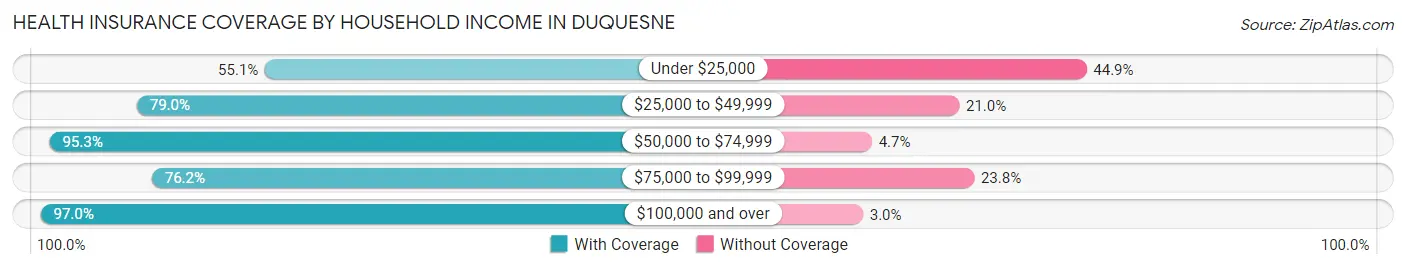
| Household Income | With Coverage | Without Coverage |
| Under $25,000 | 167 (55.1%) | 136 (44.9%) |
| $25,000 to $49,999 | 627 (79.0%) | 167 (21.0%) |
| $50,000 to $74,999 | 245 (95.3%) | 12 (4.7%) |
| $75,000 to $99,999 | 438 (76.2%) | 137 (23.8%) |
| $100,000 and over | 357 (97.0%) | 11 (3.0%) |
Public vs Private Health Insurance Coverage by Age in Duquesne
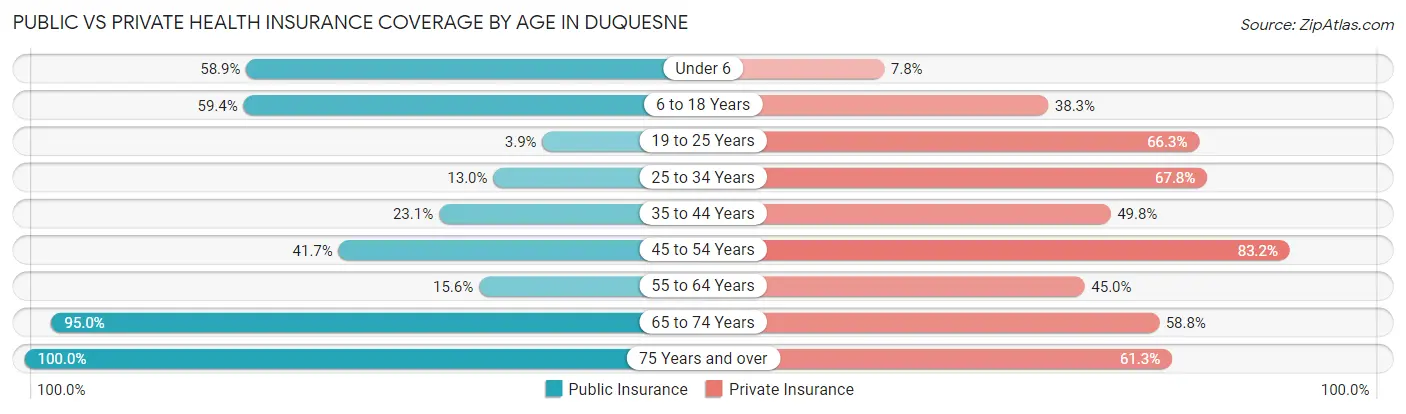
| Age Bracket | Public Insurance | Private Insurance |
| Under 6 | 113 (58.9%) | 15 (7.8%) |
| 6 to 18 Years | 149 (59.4%) | 96 (38.3%) |
| 19 to 25 Years | 12 (3.9%) | 205 (66.3%) |
| 25 to 34 Years | 46 (13.0%) | 240 (67.8%) |
| 35 to 44 Years | 63 (23.1%) | 136 (49.8%) |
| 45 to 54 Years | 151 (41.7%) | 301 (83.2%) |
| 55 to 64 Years | 33 (15.6%) | 95 (45.0%) |
| 65 to 74 Years | 210 (95.0%) | 130 (58.8%) |
| 75 Years and over | 124 (100.0%) | 76 (61.3%) |
| Total | 901 (39.2%) | 1,294 (56.3%) |
Disability Status by Sex by Age in Duquesne
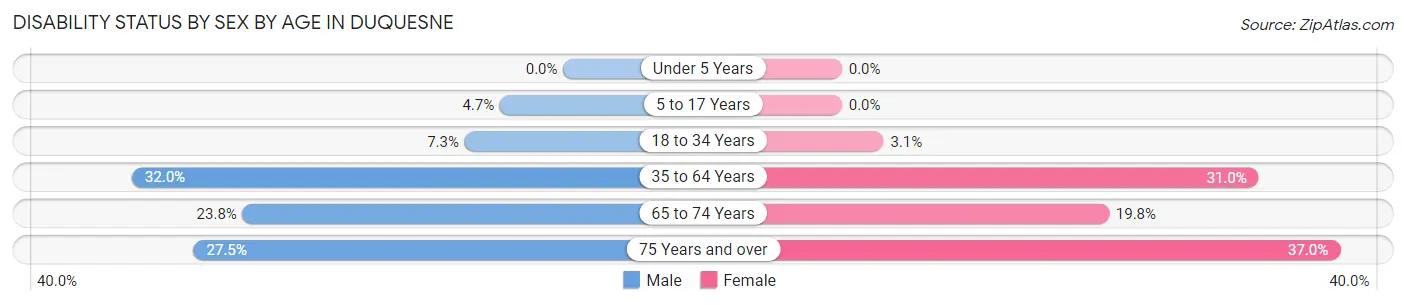
| Age Bracket | Male | Female |
| Under 5 Years | 0 (0.0%) | 0 (0.0%) |
| 5 to 17 Years | 7 (4.7%) | 0 (0.0%) |
| 18 to 34 Years | 26 (7.3%) | 10 (3.1%) |
| 35 to 64 Years | 123 (32.0%) | 143 (30.9%) |
| 65 to 74 Years | 25 (23.8%) | 23 (19.8%) |
| 75 Years and over | 14 (27.5%) | 27 (37.0%) |
Disability Class by Sex by Age in Duquesne
Disability Class: Hearing Difficulty
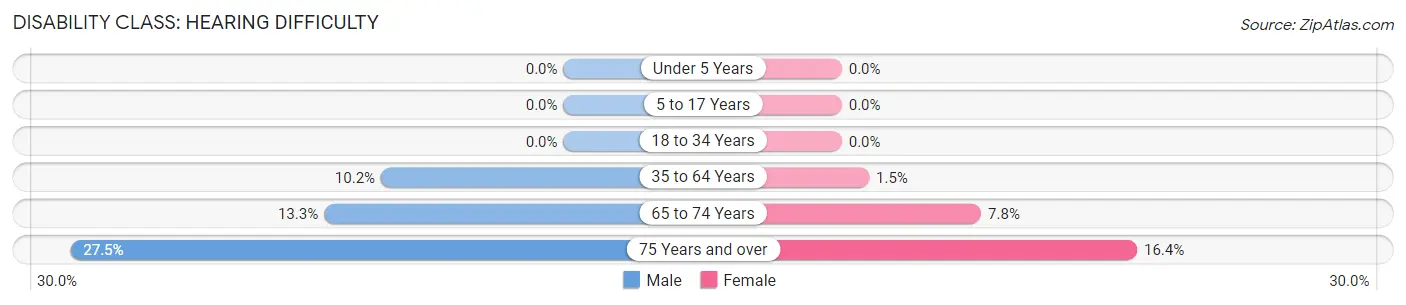
| Age Bracket | Male | Female |
| Under 5 Years | 0 (0.0%) | 0 (0.0%) |
| 5 to 17 Years | 0 (0.0%) | 0 (0.0%) |
| 18 to 34 Years | 0 (0.0%) | 0 (0.0%) |
| 35 to 64 Years | 39 (10.2%) | 7 (1.5%) |
| 65 to 74 Years | 14 (13.3%) | 9 (7.8%) |
| 75 Years and over | 14 (27.5%) | 12 (16.4%) |
Disability Class: Vision Difficulty
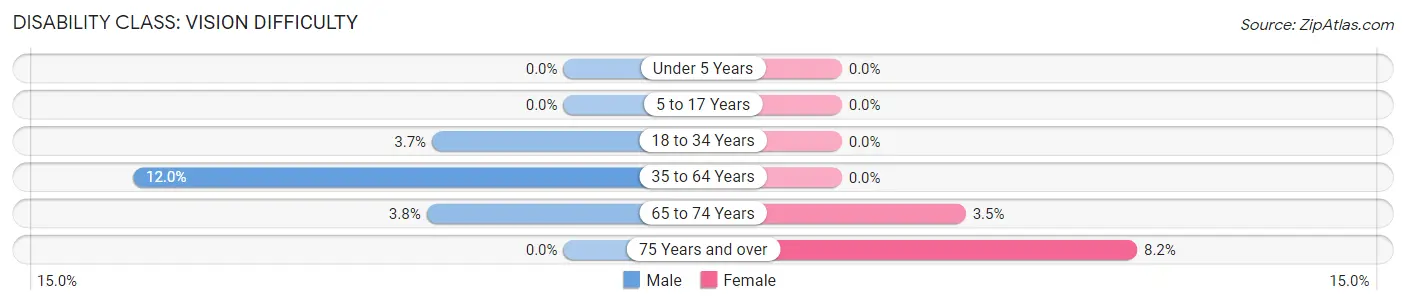
| Age Bracket | Male | Female |
| Under 5 Years | 0 (0.0%) | 0 (0.0%) |
| 5 to 17 Years | 0 (0.0%) | 0 (0.0%) |
| 18 to 34 Years | 13 (3.7%) | 0 (0.0%) |
| 35 to 64 Years | 46 (12.0%) | 0 (0.0%) |
| 65 to 74 Years | 4 (3.8%) | 4 (3.5%) |
| 75 Years and over | 0 (0.0%) | 6 (8.2%) |
Disability Class: Cognitive Difficulty
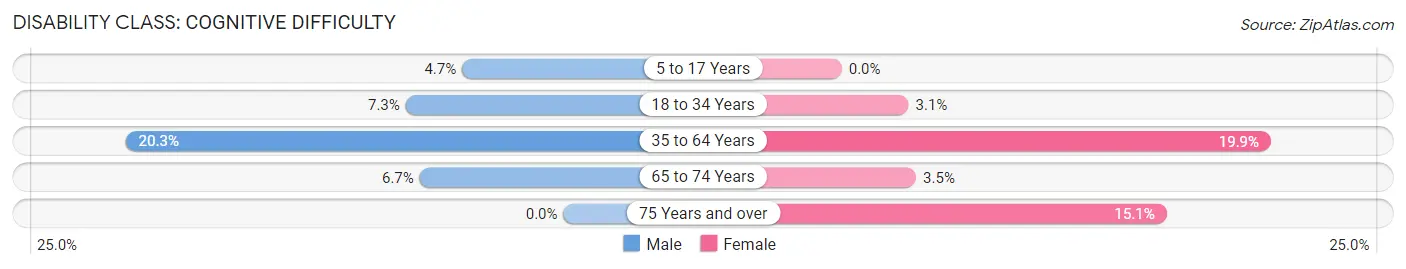
| Age Bracket | Male | Female |
| 5 to 17 Years | 7 (4.7%) | 0 (0.0%) |
| 18 to 34 Years | 26 (7.3%) | 10 (3.1%) |
| 35 to 64 Years | 78 (20.3%) | 92 (19.9%) |
| 65 to 74 Years | 7 (6.7%) | 4 (3.5%) |
| 75 Years and over | 0 (0.0%) | 11 (15.1%) |
Disability Class: Ambulatory Difficulty
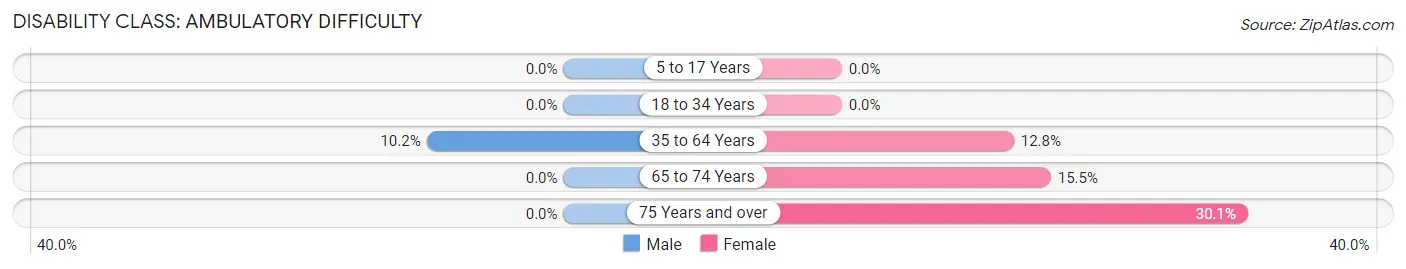
| Age Bracket | Male | Female |
| 5 to 17 Years | 0 (0.0%) | 0 (0.0%) |
| 18 to 34 Years | 0 (0.0%) | 0 (0.0%) |
| 35 to 64 Years | 39 (10.2%) | 59 (12.8%) |
| 65 to 74 Years | 0 (0.0%) | 18 (15.5%) |
| 75 Years and over | 0 (0.0%) | 22 (30.1%) |
Disability Class: Self-Care Difficulty
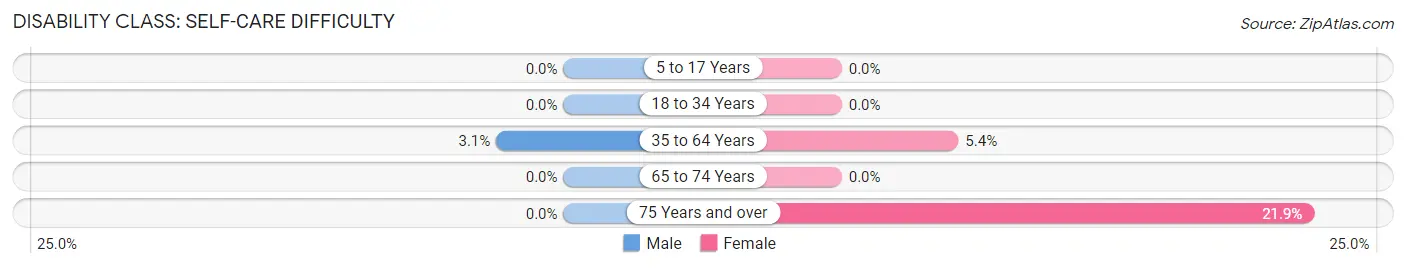
| Age Bracket | Male | Female |
| 5 to 17 Years | 0 (0.0%) | 0 (0.0%) |
| 18 to 34 Years | 0 (0.0%) | 0 (0.0%) |
| 35 to 64 Years | 12 (3.1%) | 25 (5.4%) |
| 65 to 74 Years | 0 (0.0%) | 0 (0.0%) |
| 75 Years and over | 0 (0.0%) | 16 (21.9%) |
Technology Access in Duquesne
Computing Device Access in Duquesne
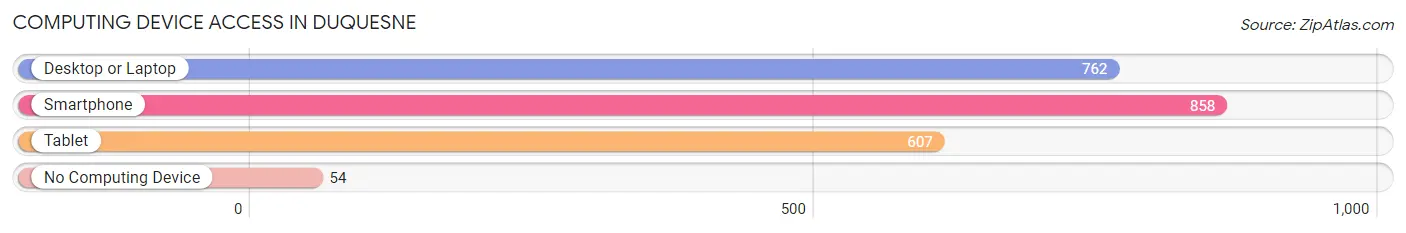
| Device Type | # Households | % Households |
| Desktop or Laptop | 762 | 78.5% |
| Smartphone | 858 | 88.4% |
| Tablet | 607 | 62.5% |
| No Computing Device | 54 | 5.6% |
| Total | 971 | 100.0% |
Internet Access in Duquesne
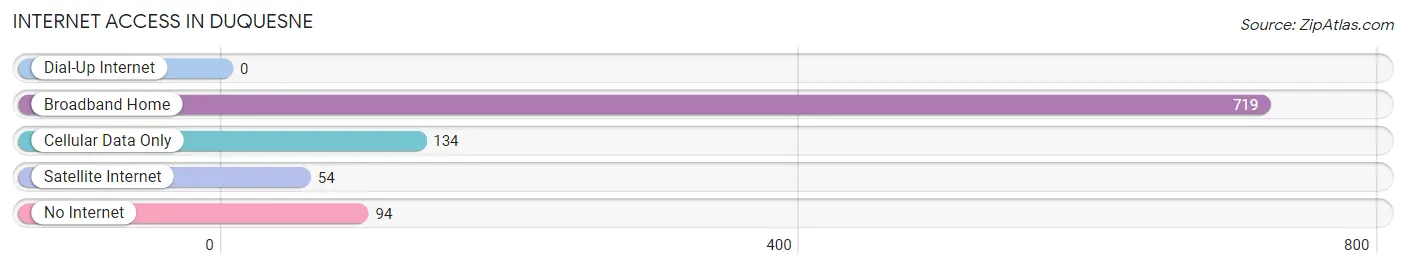
| Internet Type | # Households | % Households |
| Dial-Up Internet | 0 | 0.0% |
| Broadband Home | 719 | 74.1% |
| Cellular Data Only | 134 | 13.8% |
| Satellite Internet | 54 | 5.6% |
| No Internet | 94 | 9.7% |
| Total | 971 | 100.0% |
Duquesne Summary
Duquesne, Missouri is a small town located in the southeastern corner of the state, in St. Francois County. It is situated on the banks of the Big River, and is surrounded by rolling hills and lush forests. The town has a population of just over 1,000 people, and is known for its rural charm and friendly atmosphere.
History
Duquesne was founded in 1883 by a group of French settlers who had come to the area in search of a better life. The town was named after the Duke of Duquesne, a French nobleman who had served in the French and Indian War. The settlers built a small trading post and began to farm the land. The town grew slowly, but steadily, and by the early 1900s, it had become a thriving community.
In the early 1900s, the town was home to a number of businesses, including a general store, a blacksmith shop, a sawmill, and a gristmill. The town also had a school, a post office, and a church. The town was connected to the outside world by a railroad line, which allowed for the transport of goods and people.
Geography
Duquesne is located in the southeastern corner of Missouri, in St. Francois County. It is situated on the banks of the Big River, and is surrounded by rolling hills and lush forests. The town is located about 30 miles from St. Louis, and is accessible by car or train.
The town has a humid continental climate, with hot summers and cold winters. The average temperature in the summer is around 80 degrees Fahrenheit, and in the winter it is around 40 degrees Fahrenheit. The town receives an average of 40 inches of precipitation each year, with most of it falling in the spring and summer months.
Economy
Duquesne’s economy is largely based on agriculture and tourism. The town is home to a number of farms, which produce a variety of crops, including corn, soybeans, wheat, and hay. The town also has a number of small businesses, including restaurants, shops, and a gas station.
The town is also a popular tourist destination, as it is located near several state parks and recreational areas. The town is home to a number of historic sites, including the Duquesne Cemetery, which is the final resting place of many of the town’s original settlers.
Demographics
As of the 2010 census, the population of Duquesne was 1,072. The town is predominantly white, with a small African American population. The median household income is $37,500, and the median home value is $90,000. The town has a low unemployment rate, and the majority of the population is employed in the agricultural and tourism industries.
Duquesne is a small town with a rich history and a friendly atmosphere. It is a great place to live, work, and raise a family. The town is home to a number of businesses, farms, and recreational areas, and is a popular tourist destination. The town is a great place to experience the rural charm of Missouri.
Common Questions
What is Per Capita Income in Duquesne?
Per Capita income in Duquesne is $25,897.
What is the Median Family Income in Duquesne?
Median Family Income in Duquesne is $59,688.
What is the Median Household income in Duquesne?
Median Household Income in Duquesne is $48,561.
What is Income or Wage Gap in Duquesne?
Income or Wage Gap in Duquesne is 23.4%.
Women in Duquesne earn 76.6 cents for every dollar earned by a man.
What is Inequality or Gini Index in Duquesne?
Inequality or Gini Index in Duquesne is 0.35.
What is the Total Population of Duquesne?
Total Population of Duquesne is 2,297.
What is the Total Male Population of Duquesne?
Total Male Population of Duquesne is 1,145.
What is the Total Female Population of Duquesne?
Total Female Population of Duquesne is 1,152.
What is the Ratio of Males per 100 Females in Duquesne?
There are 99.39 Males per 100 Females in Duquesne.
What is the Ratio of Females per 100 Males in Duquesne?
There are 100.61 Females per 100 Males in Duquesne.
What is the Median Population Age in Duquesne?
Median Population Age in Duquesne is 36.2 Years.
What is the Average Family Size in Duquesne
Average Family Size in Duquesne is 3.0 People.
What is the Average Household Size in Duquesne
Average Household Size in Duquesne is 2.4 People.
How Large is the Labor Force in Duquesne?
There are 1,190 People in the Labor Forcein in Duquesne.
What is the Percentage of People in the Labor Force in Duquesne?
63.1% of People are in the Labor Force in Duquesne.
What is the Unemployment Rate in Duquesne?
Unemployment Rate in Duquesne is 2.9%.