Lewis and Clark Village, MO Map & Demographics
Lewis and Clark Village Map
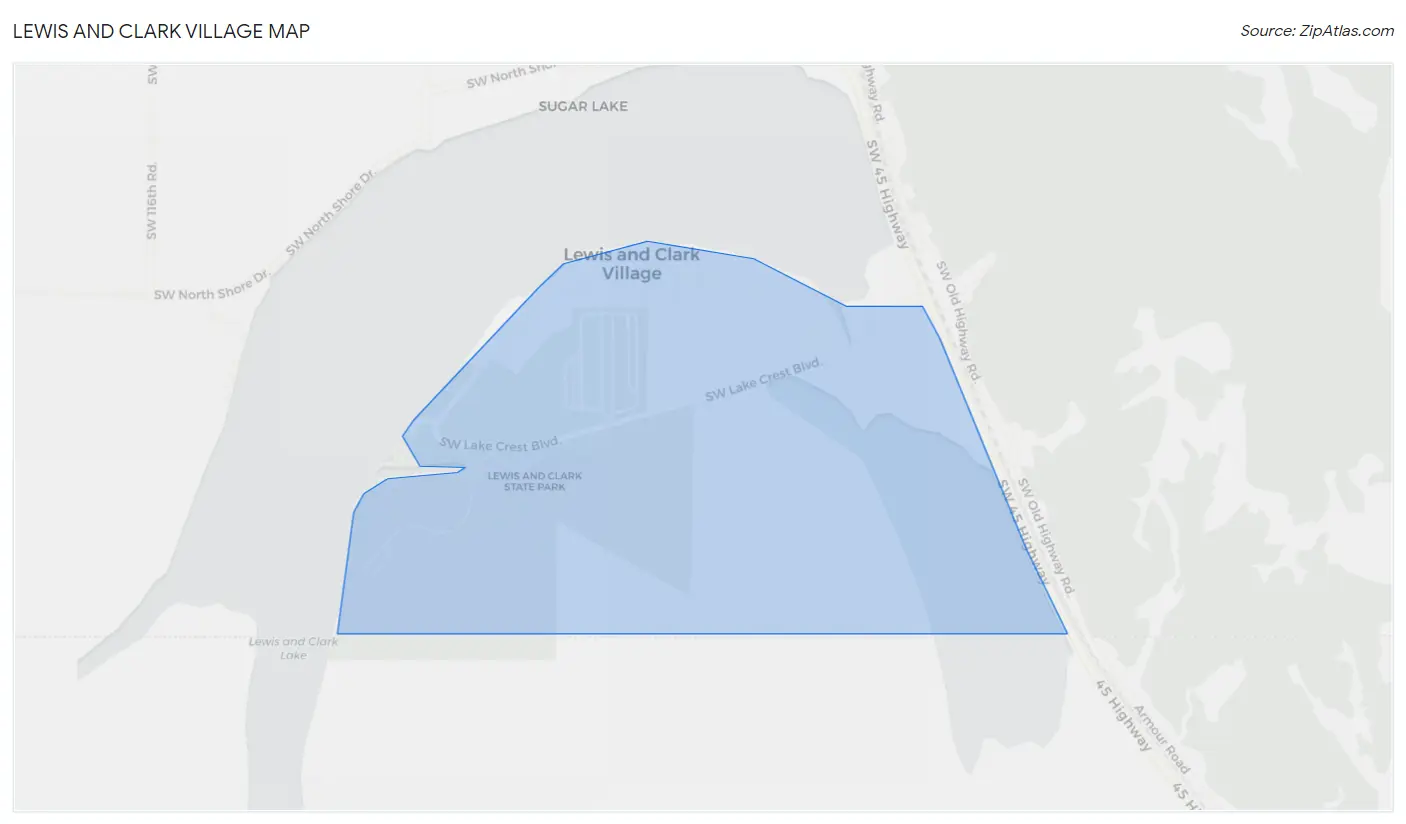
Lewis and Clark Village Overview
$29,487
PER CAPITA INCOME
$95,417
AVG FAMILY INCOME
$78,125
AVG HOUSEHOLD INCOME
0.40
INEQUALITY / GINI INDEX
102
TOTAL POPULATION
44
MALE POPULATION
58
FEMALE POPULATION
75.86
MALES / 100 FEMALES
131.82
FEMALES / 100 MALES
35.8
MEDIAN AGE
3.1
AVG FAMILY SIZE
2.8
AVG HOUSEHOLD SIZE
56
LABOR FORCE [ PEOPLE ]
75.7%
PERCENT IN LABOR FORCE
3.6%
UNEMPLOYMENT RATE
Income in Lewis and Clark Village
Income Overview in Lewis and Clark Village
Per Capita Income in Lewis and Clark Village is $29,487, while median incomes of families and households are $95,417 and $78,125 respectively.
| Characteristic | Number | Measure |
| Per Capita Income | 102 | $29,487 |
| Median Family Income | 29 | $95,417 |
| Mean Family Income | 29 | $99,659 |
| Median Household Income | 37 | $78,125 |
| Mean Household Income | 37 | $84,408 |
| Income Deficit | 29 | $0 |
| Wage / Income Gap (%) | 102 | 0.00% |
| Wage / Income Gap ($) | 102 | 100.00¢ per $1 |
| Gini / Inequality Index | 102 | 0.40 |
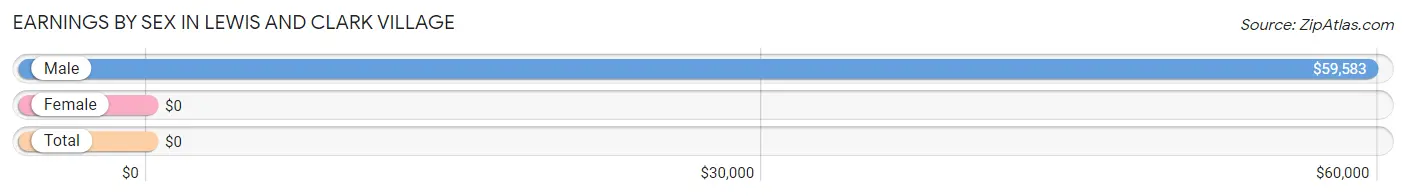
Earnings by Sex in Lewis and Clark Village
| Sex | Number | Average Earnings |
| Male | 29 (53.7%) | $59,583 |
| Female | 25 (46.3%) | $0 |
| Total | 54 (100.0%) | $0 |
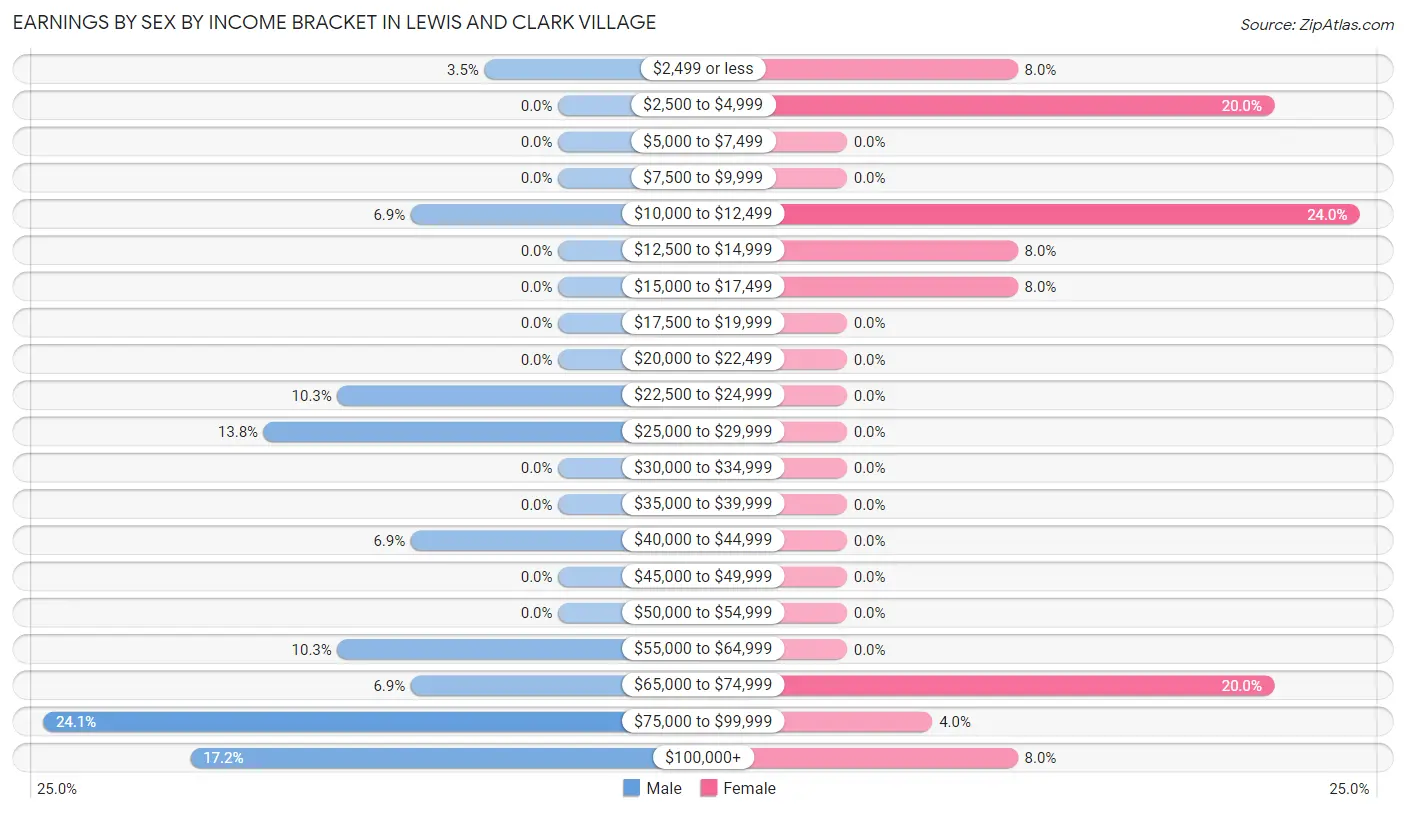
Earnings by Sex by Income Bracket in Lewis and Clark Village
The most common earnings brackets in Lewis and Clark Village are $75,000 to $99,999 for men (7 | 24.1%) and $10,000 to $12,499 for women (6 | 24.0%).
| Income | Male | Female |
| $2,499 or less | 1 (3.5%) | 2 (8.0%) |
| $2,500 to $4,999 | 0 (0.0%) | 5 (20.0%) |
| $5,000 to $7,499 | 0 (0.0%) | 0 (0.0%) |
| $7,500 to $9,999 | 0 (0.0%) | 0 (0.0%) |
| $10,000 to $12,499 | 2 (6.9%) | 6 (24.0%) |
| $12,500 to $14,999 | 0 (0.0%) | 2 (8.0%) |
| $15,000 to $17,499 | 0 (0.0%) | 2 (8.0%) |
| $17,500 to $19,999 | 0 (0.0%) | 0 (0.0%) |
| $20,000 to $22,499 | 0 (0.0%) | 0 (0.0%) |
| $22,500 to $24,999 | 3 (10.3%) | 0 (0.0%) |
| $25,000 to $29,999 | 4 (13.8%) | 0 (0.0%) |
| $30,000 to $34,999 | 0 (0.0%) | 0 (0.0%) |
| $35,000 to $39,999 | 0 (0.0%) | 0 (0.0%) |
| $40,000 to $44,999 | 2 (6.9%) | 0 (0.0%) |
| $45,000 to $49,999 | 0 (0.0%) | 0 (0.0%) |
| $50,000 to $54,999 | 0 (0.0%) | 0 (0.0%) |
| $55,000 to $64,999 | 3 (10.3%) | 0 (0.0%) |
| $65,000 to $74,999 | 2 (6.9%) | 5 (20.0%) |
| $75,000 to $99,999 | 7 (24.1%) | 1 (4.0%) |
| $100,000+ | 5 (17.2%) | 2 (8.0%) |
| Total | 29 (100.0%) | 25 (100.0%) |
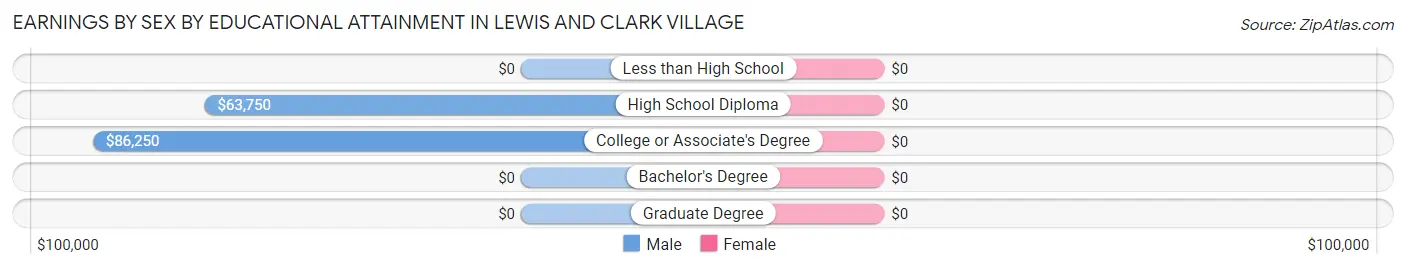
Earnings by Sex by Educational Attainment in Lewis and Clark Village
| Educational Attainment | Male Income | Female Income |
| Less than High School | - | - |
| High School Diploma | $63,750 | $0 |
| College or Associate's Degree | $86,250 | $0 |
| Bachelor's Degree | - | - |
| Graduate Degree | - | - |
| Total | $68,750 | $0 |
Family Income in Lewis and Clark Village
Family Income Brackets in Lewis and Clark Village
According to the Lewis and Clark Village family income data, there are 9 families falling into the $75,000 to $99,999 income range, which is the most common income bracket and makes up 31.0% of all families.
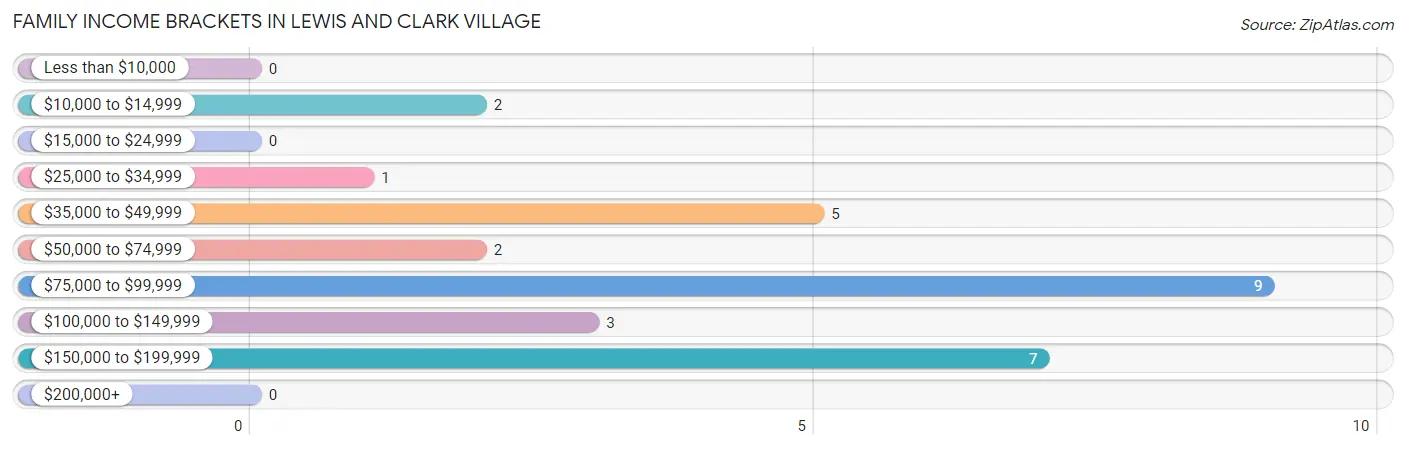
| Income Bracket | # Families | % Families |
| Less than $10,000 | 0 | 0.0% |
| $10,000 to $14,999 | 2 | 6.9% |
| $15,000 to $24,999 | 0 | 0.0% |
| $25,000 to $34,999 | 1 | 3.4% |
| $35,000 to $49,999 | 5 | 17.2% |
| $50,000 to $74,999 | 2 | 6.9% |
| $75,000 to $99,999 | 9 | 31.0% |
| $100,000 to $149,999 | 3 | 10.3% |
| $150,000 to $199,999 | 7 | 24.1% |
| $200,000+ | 0 | 0.0% |
Family Income by Famaliy Size in Lewis and Clark Village
2-person families (15 | 51.7%) account for the highest median family income in Lewis and Clark Village with $131,875 per family, while 2-person families (15 | 51.7%) have the highest median income of $65,938 per family member.
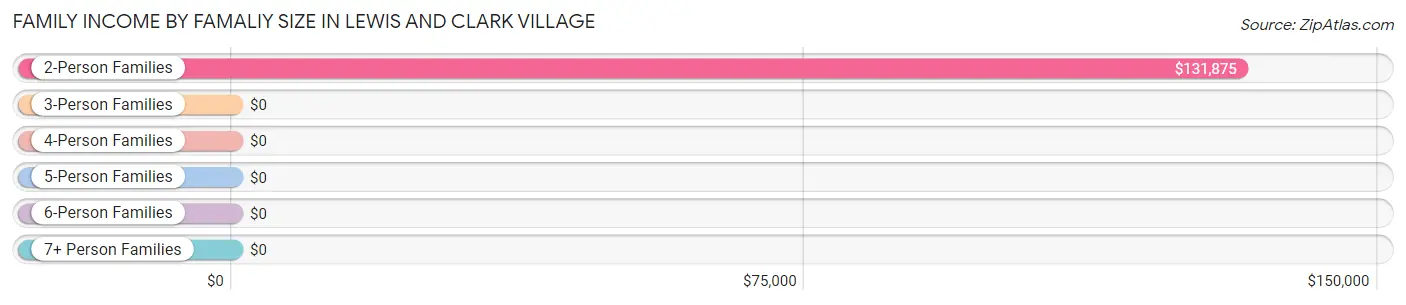
| Income Bracket | # Families | Median Income |
| 2-Person Families | 15 (51.7%) | $131,875 |
| 3-Person Families | 6 (20.7%) | $0 |
| 4-Person Families | 4 (13.8%) | $0 |
| 5-Person Families | 0 (0.0%) | $0 |
| 6-Person Families | 2 (6.9%) | $0 |
| 7+ Person Families | 2 (6.9%) | $0 |
| Total | 29 (100.0%) | $95,417 |
Family Income by Number of Earners in Lewis and Clark Village
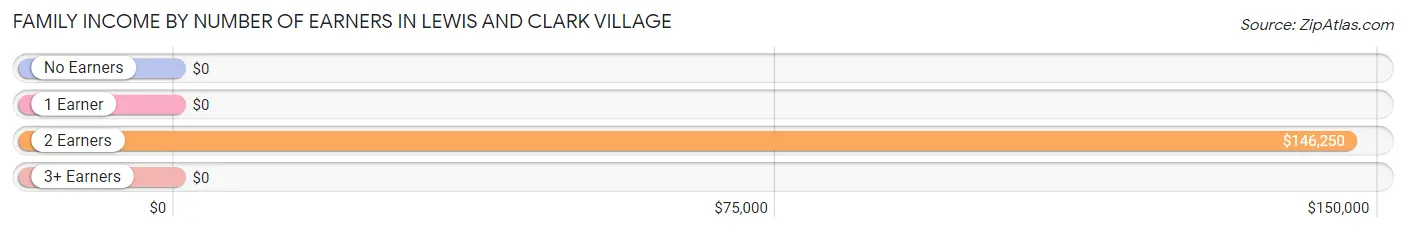
| Number of Earners | # Families | Median Income |
| No Earners | 0 (0.0%) | $0 |
| 1 Earner | 10 (34.5%) | $0 |
| 2 Earners | 14 (48.3%) | $146,250 |
| 3+ Earners | 5 (17.2%) | $0 |
| Total | 29 (100.0%) | $95,417 |
Household Income in Lewis and Clark Village
Household Income Brackets in Lewis and Clark Village
With 7 households falling in the category, the $35,000 to $49,999 income range is the most frequent in Lewis and Clark Village, accounting for 18.9% of all households.
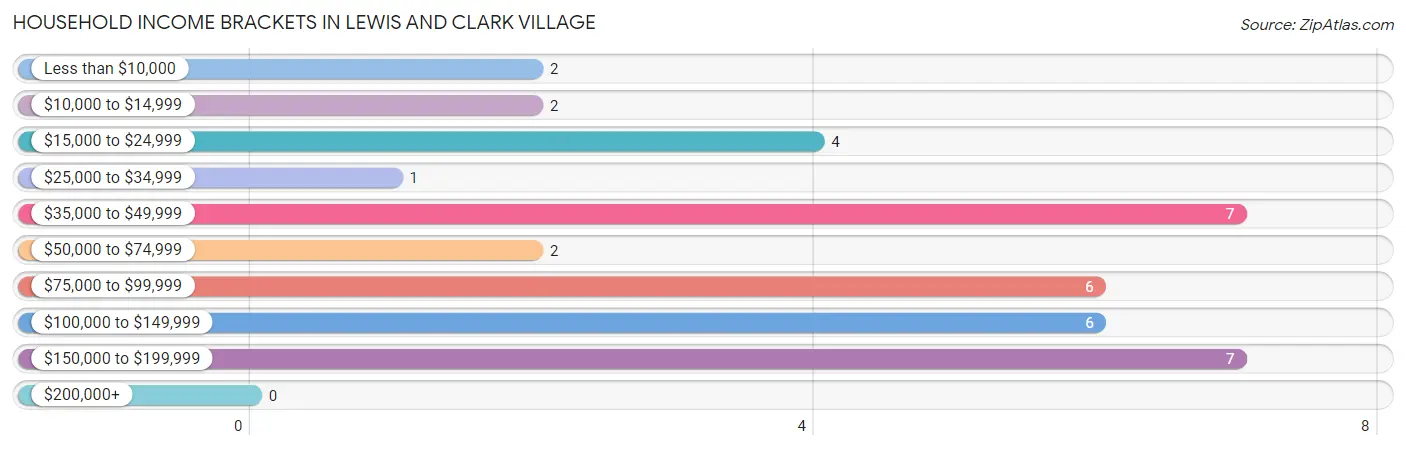
| Income Bracket | # Households | % Households |
| Less than $10,000 | 2 | 5.4% |
| $10,000 to $14,999 | 2 | 5.4% |
| $15,000 to $24,999 | 4 | 10.8% |
| $25,000 to $34,999 | 1 | 2.7% |
| $35,000 to $49,999 | 7 | 18.9% |
| $50,000 to $74,999 | 2 | 5.4% |
| $75,000 to $99,999 | 6 | 16.2% |
| $100,000 to $149,999 | 6 | 16.2% |
| $150,000 to $199,999 | 7 | 18.9% |
| $200,000+ | 0 | 0.0% |
Household Income by Householder Age in Lewis and Clark Village
The median household income in Lewis and Clark Village is $78,125, with the highest median household income of $90,625 found in the 25 to 44 years age bracket for the primary householder. A total of 13 households (35.1%) fall into this category.
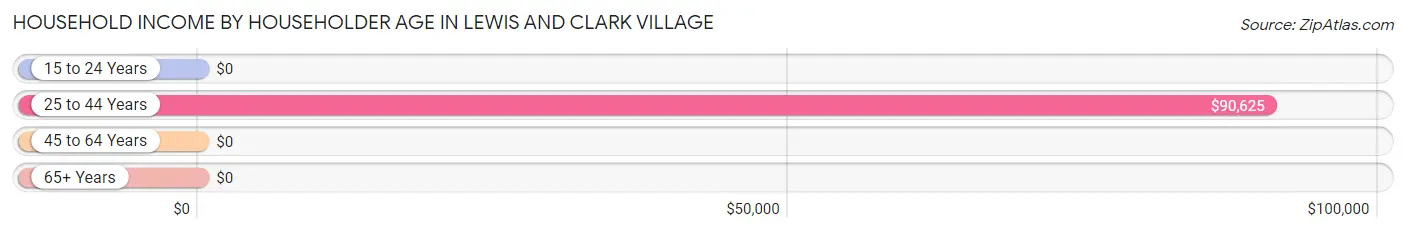
| Income Bracket | # Households | Median Income |
| 15 to 24 Years | 0 (0.0%) | $0 |
| 25 to 44 Years | 13 (35.1%) | $90,625 |
| 45 to 64 Years | 14 (37.8%) | $0 |
| 65+ Years | 10 (27.0%) | $0 |
| Total | 37 (100.0%) | $78,125 |
Poverty in Lewis and Clark Village
Income Below Poverty by Sex and Age in Lewis and Clark Village
With 4.5% poverty level for males and 19.0% for females among the residents of Lewis and Clark Village, 12 to 14 year old males and under 5 year old females are the most vulnerable to poverty, with 2 males (40.0%) and 3 females (42.9%) in their respective age groups living below the poverty level.
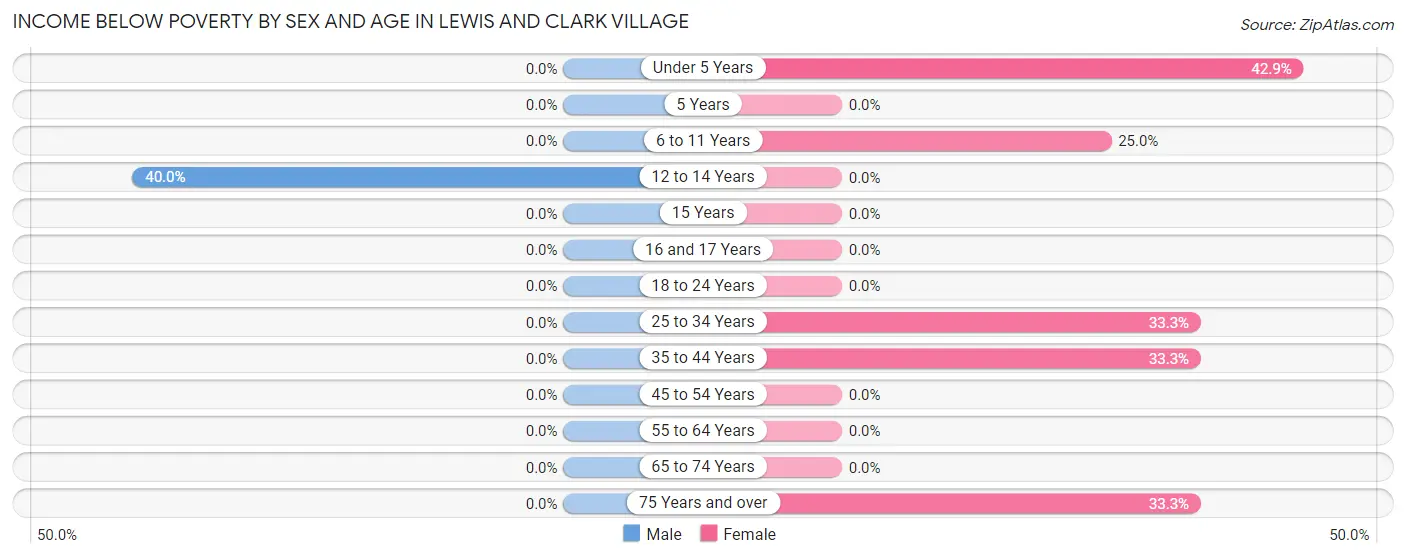
| Age Bracket | Male | Female |
| Under 5 Years | 0 (0.0%) | 3 (42.9%) |
| 5 Years | 0 (0.0%) | 0 (0.0%) |
| 6 to 11 Years | 0 (0.0%) | 2 (25.0%) |
| 12 to 14 Years | 2 (40.0%) | 0 (0.0%) |
| 15 Years | 0 (0.0%) | 0 (0.0%) |
| 16 and 17 Years | 0 (0.0%) | 0 (0.0%) |
| 18 to 24 Years | 0 (0.0%) | 0 (0.0%) |
| 25 to 34 Years | 0 (0.0%) | 2 (33.3%) |
| 35 to 44 Years | 0 (0.0%) | 2 (33.3%) |
| 45 to 54 Years | 0 (0.0%) | 0 (0.0%) |
| 55 to 64 Years | 0 (0.0%) | 0 (0.0%) |
| 65 to 74 Years | 0 (0.0%) | 0 (0.0%) |
| 75 Years and over | 0 (0.0%) | 2 (33.3%) |
| Total | 2 (4.5%) | 11 (19.0%) |
Income Above Poverty by Sex and Age in Lewis and Clark Village
According to the poverty statistics in Lewis and Clark Village, males aged 6 to 11 years and females aged 5 years are the age groups that are most secure financially, with 100.0% of males and 100.0% of females in these age groups living above the poverty line.
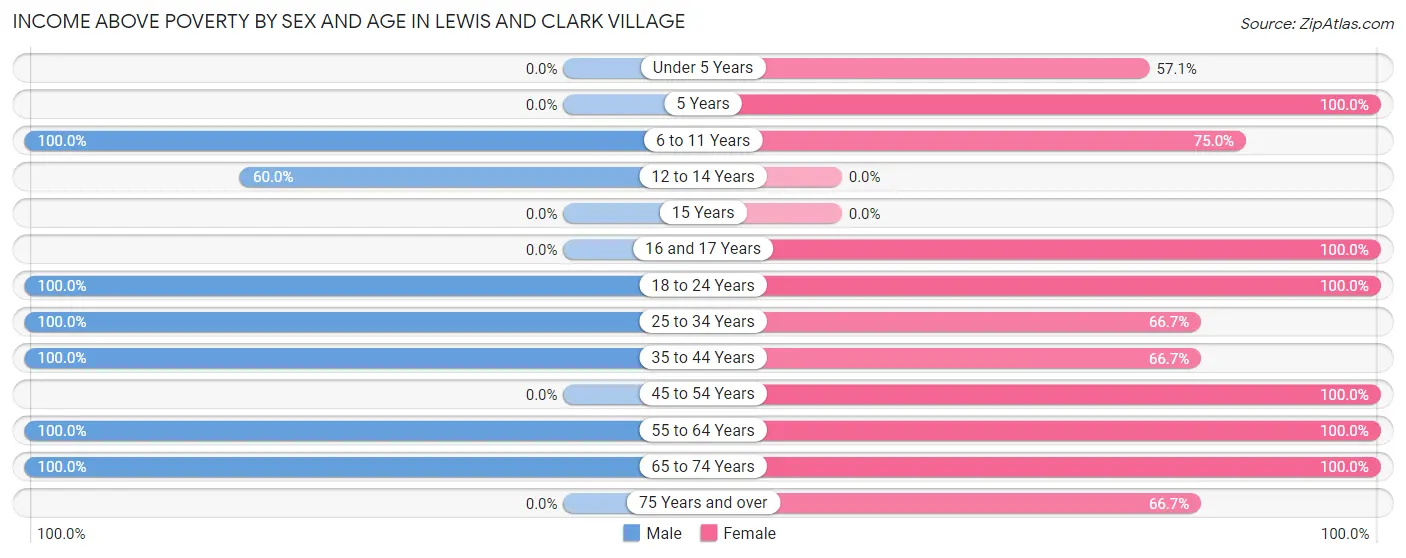
| Age Bracket | Male | Female |
| Under 5 Years | 0 (0.0%) | 4 (57.1%) |
| 5 Years | 0 (0.0%) | 3 (100.0%) |
| 6 to 11 Years | 5 (100.0%) | 6 (75.0%) |
| 12 to 14 Years | 3 (60.0%) | 0 (0.0%) |
| 15 Years | 0 (0.0%) | 0 (0.0%) |
| 16 and 17 Years | 0 (0.0%) | 2 (100.0%) |
| 18 to 24 Years | 5 (100.0%) | 4 (100.0%) |
| 25 to 34 Years | 2 (100.0%) | 4 (66.7%) |
| 35 to 44 Years | 15 (100.0%) | 4 (66.7%) |
| 45 to 54 Years | 0 (0.0%) | 10 (100.0%) |
| 55 to 64 Years | 10 (100.0%) | 1 (100.0%) |
| 65 to 74 Years | 2 (100.0%) | 5 (100.0%) |
| 75 Years and over | 0 (0.0%) | 4 (66.7%) |
| Total | 42 (95.5%) | 47 (81.0%) |
Income Below Poverty Among Married-Couple Families in Lewis and Clark Village
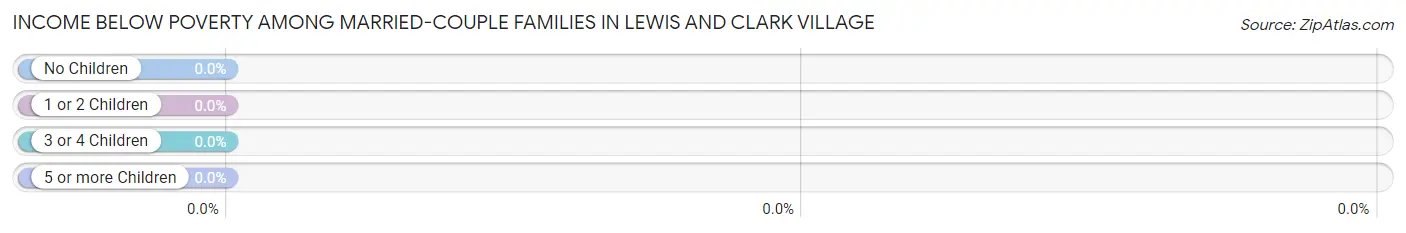
| Children | Above Poverty | Below Poverty |
| No Children | 17 (100.0%) | 0 (0.0%) |
| 1 or 2 Children | 2 (100.0%) | 0 (0.0%) |
| 3 or 4 Children | 4 (100.0%) | 0 (0.0%) |
| 5 or more Children | 0 (0.0%) | 0 (0.0%) |
| Total | 23 (100.0%) | 0 (0.0%) |
Income Below Poverty Among Single-Parent Households in Lewis and Clark Village
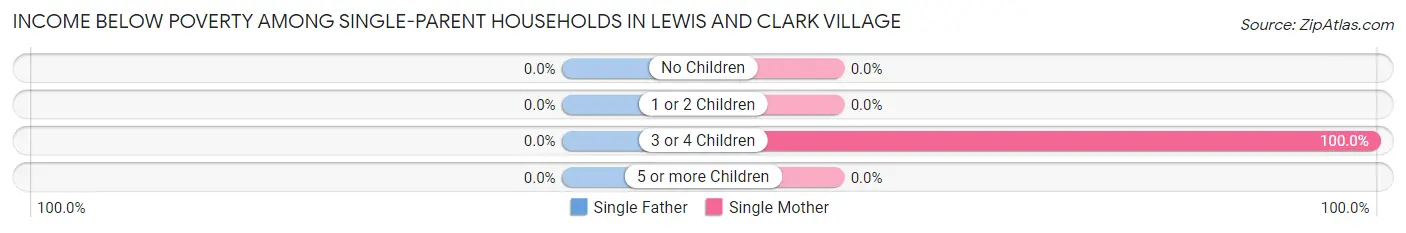
| Children | Single Father | Single Mother |
| No Children | 0 (0.0%) | 0 (0.0%) |
| 1 or 2 Children | 0 (0.0%) | 0 (0.0%) |
| 3 or 4 Children | 0 (0.0%) | 2 (100.0%) |
| 5 or more Children | 0 (0.0%) | 0 (0.0%) |
| Total | 0 (0.0%) | 2 (66.7%) |
Income Below Poverty Among Married-Couple vs Single-Parent Households in Lewis and Clark Village
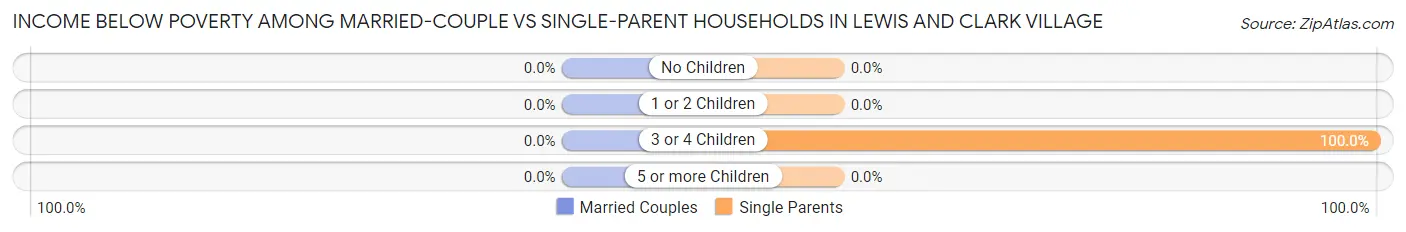
| Children | Married-Couple Families | Single-Parent Households |
| No Children | 0 (0.0%) | 0 (0.0%) |
| 1 or 2 Children | 0 (0.0%) | 0 (0.0%) |
| 3 or 4 Children | 0 (0.0%) | 2 (100.0%) |
| 5 or more Children | 0 (0.0%) | 0 (0.0%) |
| Total | 0 (0.0%) | 2 (33.3%) |
Race in Lewis and Clark Village
The most populous races in Lewis and Clark Village are White / Caucasian (98 | 96.1%), and Two or more Races (4 | 3.9%).
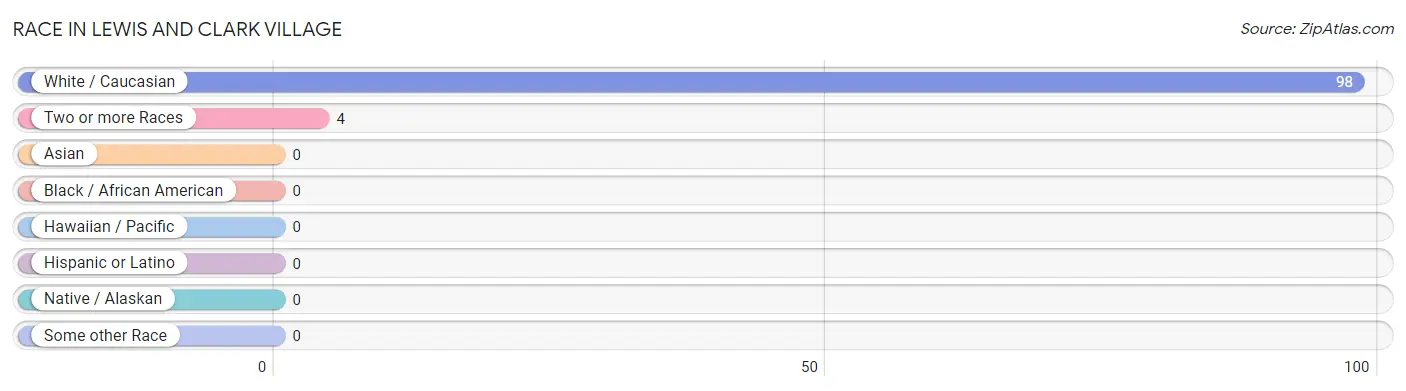
| Race | # Population | % Population |
| Asian | 0 | 0.0% |
| Black / African American | 0 | 0.0% |
| Hawaiian / Pacific | 0 | 0.0% |
| Hispanic or Latino | 0 | 0.0% |
| Native / Alaskan | 0 | 0.0% |
| White / Caucasian | 98 | 96.1% |
| Two or more Races | 4 | 3.9% |
| Some other Race | 0 | 0.0% |
| Total | 102 | 100.0% |
Ancestry in Lewis and Clark Village
The most populous ancestries reported in Lewis and Clark Village are Irish (29 | 28.4%), German (21 | 20.6%), English (9 | 8.8%), Cherokee (4 | 3.9%), and Dutch (3 | 2.9%), together accounting for 64.7% of all Lewis and Clark Village residents.
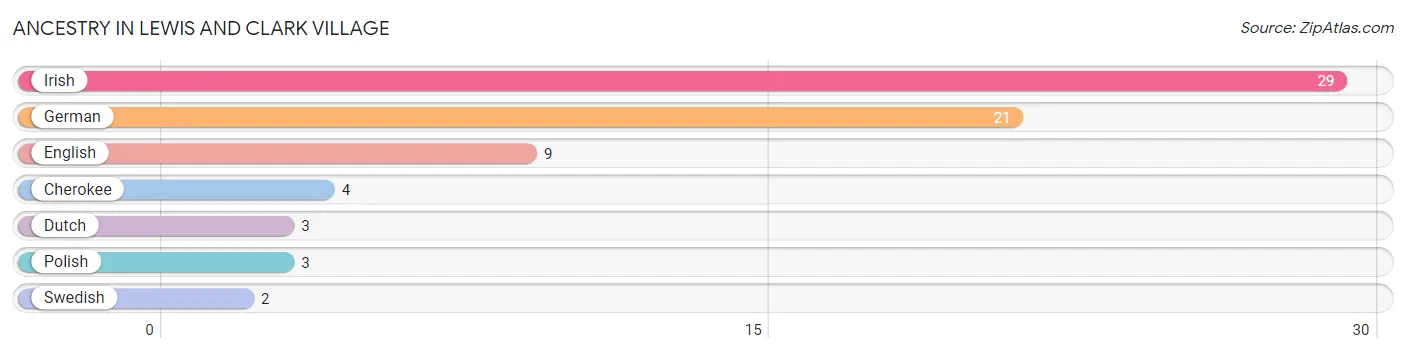
| Ancestry | # Population | % Population |
| Cherokee | 4 | 3.9% |
| Dutch | 3 | 2.9% |
| English | 9 | 8.8% |
| German | 21 | 20.6% |
| Irish | 29 | 28.4% |
| Polish | 3 | 2.9% |
| Swedish | 2 | 2.0% | View All 7 Rows |
Immigrants in Lewis and Clark Village

| Immigration Origin | # Population | % Population | View All 0 Rows |
Sex and Age in Lewis and Clark Village
Sex and Age in Lewis and Clark Village
The most populous age groups in Lewis and Clark Village are 35 to 39 Years (9 | 20.4%) for men and 45 to 49 Years (10 | 17.2%) for women.
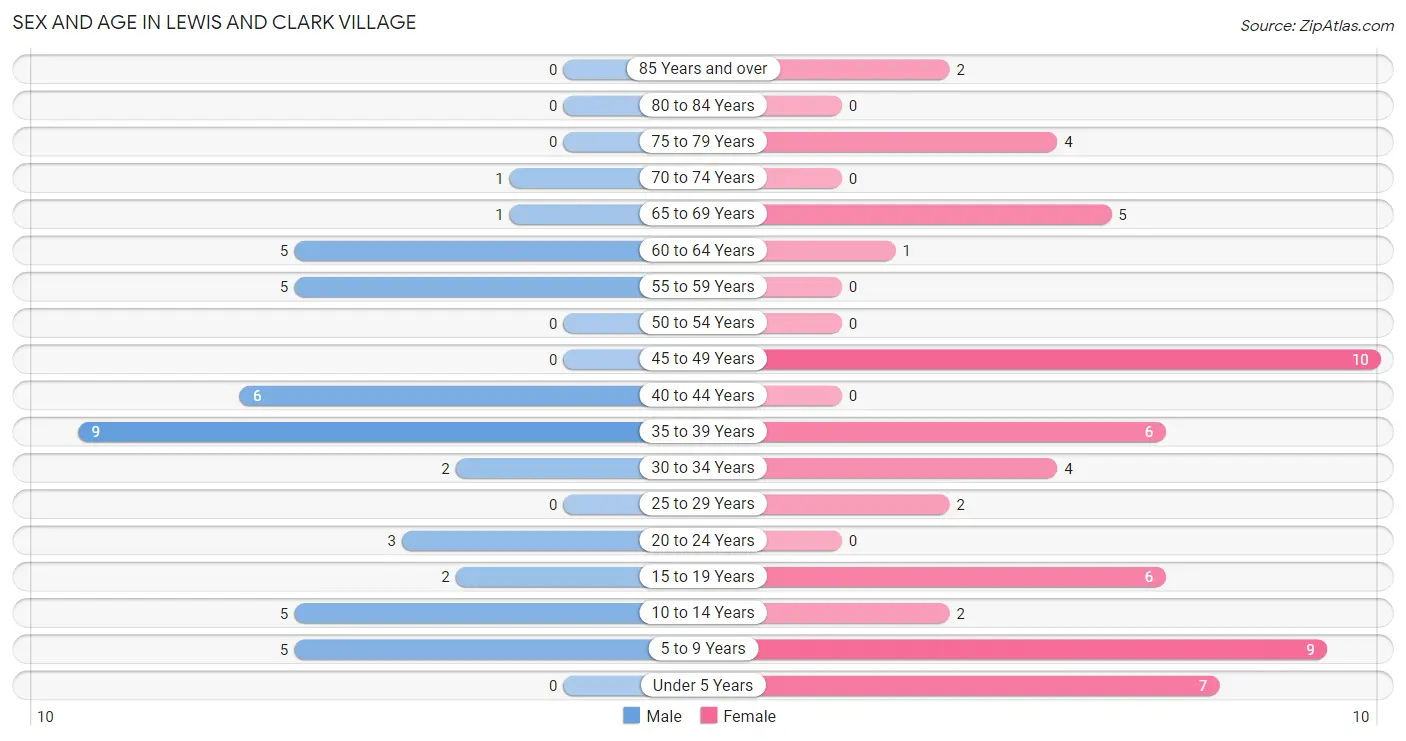
| Age Bracket | Male | Female |
| Under 5 Years | 0 (0.0%) | 7 (12.1%) |
| 5 to 9 Years | 5 (11.4%) | 9 (15.5%) |
| 10 to 14 Years | 5 (11.4%) | 2 (3.5%) |
| 15 to 19 Years | 2 (4.5%) | 6 (10.3%) |
| 20 to 24 Years | 3 (6.8%) | 0 (0.0%) |
| 25 to 29 Years | 0 (0.0%) | 2 (3.5%) |
| 30 to 34 Years | 2 (4.5%) | 4 (6.9%) |
| 35 to 39 Years | 9 (20.4%) | 6 (10.3%) |
| 40 to 44 Years | 6 (13.6%) | 0 (0.0%) |
| 45 to 49 Years | 0 (0.0%) | 10 (17.2%) |
| 50 to 54 Years | 0 (0.0%) | 0 (0.0%) |
| 55 to 59 Years | 5 (11.4%) | 0 (0.0%) |
| 60 to 64 Years | 5 (11.4%) | 1 (1.7%) |
| 65 to 69 Years | 1 (2.3%) | 5 (8.6%) |
| 70 to 74 Years | 1 (2.3%) | 0 (0.0%) |
| 75 to 79 Years | 0 (0.0%) | 4 (6.9%) |
| 80 to 84 Years | 0 (0.0%) | 0 (0.0%) |
| 85 Years and over | 0 (0.0%) | 2 (3.5%) |
| Total | 44 (100.0%) | 58 (100.0%) |
Families and Households in Lewis and Clark Village
Median Family Size in Lewis and Clark Village
The median family size in Lewis and Clark Village is 3.07 persons per family, with single female/mother families (3 | 10.3%) accounting for the largest median family size of 4 persons per family. On the other hand, single male/father families (3 | 10.3%) represent the smallest median family size with 1.67 persons per family.
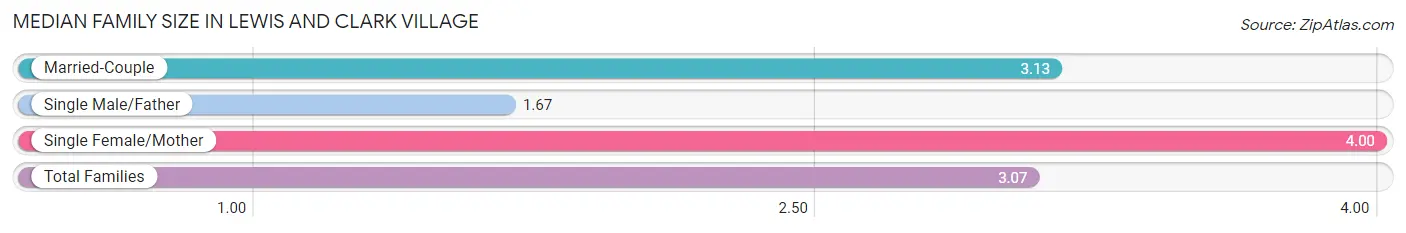
| Family Type | # Families | Family Size |
| Married-Couple | 23 (79.3%) | 3.13 |
| Single Male/Father | 3 (10.3%) | 1.67 |
| Single Female/Mother | 3 (10.3%) | 4.00 |
| Total Families | 29 (100.0%) | 3.07 |
Median Household Size in Lewis and Clark Village
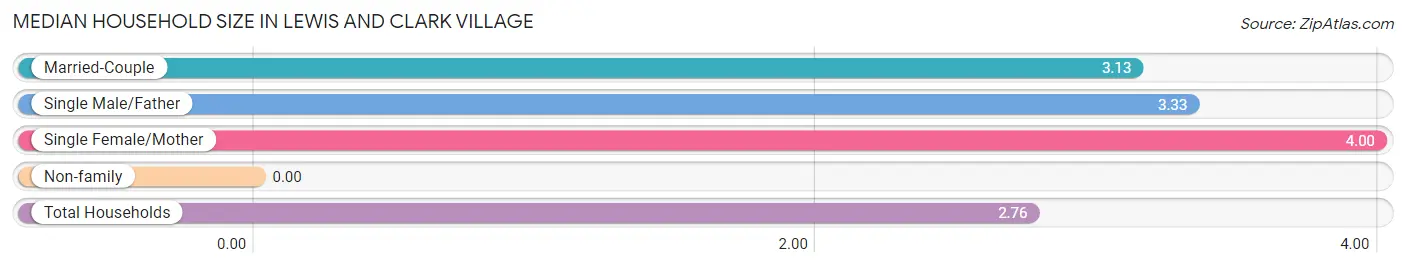
| Household Type | # Households | Household Size |
| Married-Couple | 23 (62.2%) | 3.13 |
| Single Male/Father | 3 (8.1%) | 3.33 |
| Single Female/Mother | 3 (8.1%) | 4.00 |
| Non-family | 8 (21.6%) | - |
| Total Households | 37 (100.0%) | 2.76 |
Household Size by Marriage Status in Lewis and Clark Village
Out of a total of 37 households in Lewis and Clark Village, 29 (78.4%) are family households, while 8 (21.6%) are nonfamily households. The most numerous type of family households are 2-person households, comprising 12, and the most common type of nonfamily households are 1-person households, comprising 8.
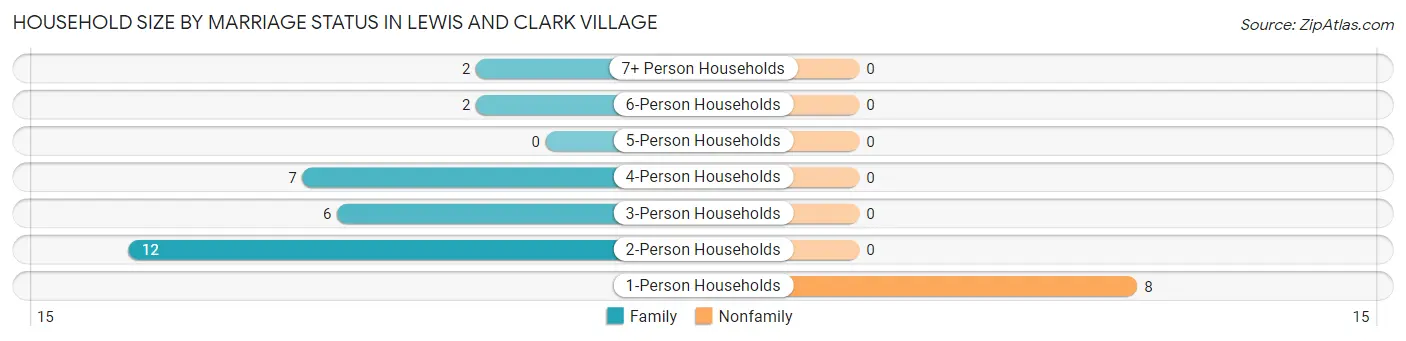
| Household Size | Family Households | Nonfamily Households |
| 1-Person Households | - | 8 (21.6%) |
| 2-Person Households | 12 (32.4%) | 0 (0.0%) |
| 3-Person Households | 6 (16.2%) | 0 (0.0%) |
| 4-Person Households | 7 (18.9%) | 0 (0.0%) |
| 5-Person Households | 0 (0.0%) | 0 (0.0%) |
| 6-Person Households | 2 (5.4%) | 0 (0.0%) |
| 7+ Person Households | 2 (5.4%) | 0 (0.0%) |
| Total | 29 (78.4%) | 8 (21.6%) |
Female Fertility in Lewis and Clark Village
Fertility by Age in Lewis and Clark Village
Average fertility rate in Lewis and Clark Village is 143.0 births per 1,000 women. Women in the age bracket of 20 to 34 years have the highest fertility rate with 667.0 births per 1,000 women. Women in the age bracket of 20 to 34 years acount for 100.0% of all women with births.
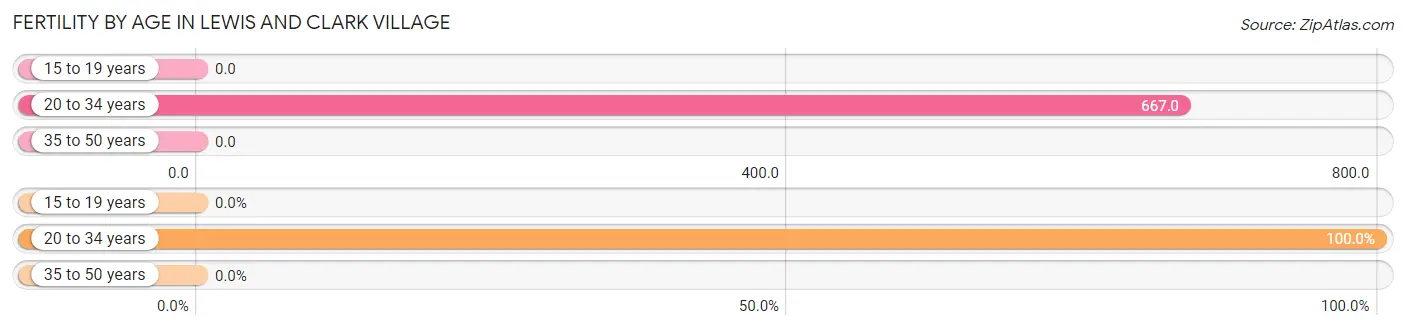
| Age Bracket | Women with Births | Births / 1,000 Women |
| 15 to 19 years | 0 (0.0%) | 0.0 |
| 20 to 34 years | 4 (100.0%) | 667.0 |
| 35 to 50 years | 0 (0.0%) | 0.0 |
| Total | 4 (100.0%) | 143.0 |
Fertility by Age by Marriage Status in Lewis and Clark Village
50.0% of women with births (4) in Lewis and Clark Village are married. The highest percentage of unmarried women with births falls into 20 to 34 years age bracket with 50.0% of them unmarried at the time of birth, while the lowest percentage of unmarried women with births belong to 20 to 34 years age bracket with 50.0% of them unmarried.
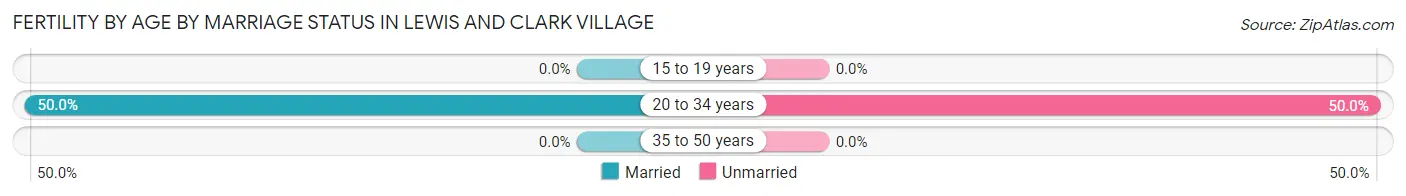
| Age Bracket | Married | Unmarried |
| 15 to 19 years | 0 (0.0%) | 0 (0.0%) |
| 20 to 34 years | 2 (50.0%) | 2 (50.0%) |
| 35 to 50 years | 0 (0.0%) | 0 (0.0%) |
| Total | 2 (50.0%) | 2 (50.0%) |
Fertility by Education in Lewis and Clark Village
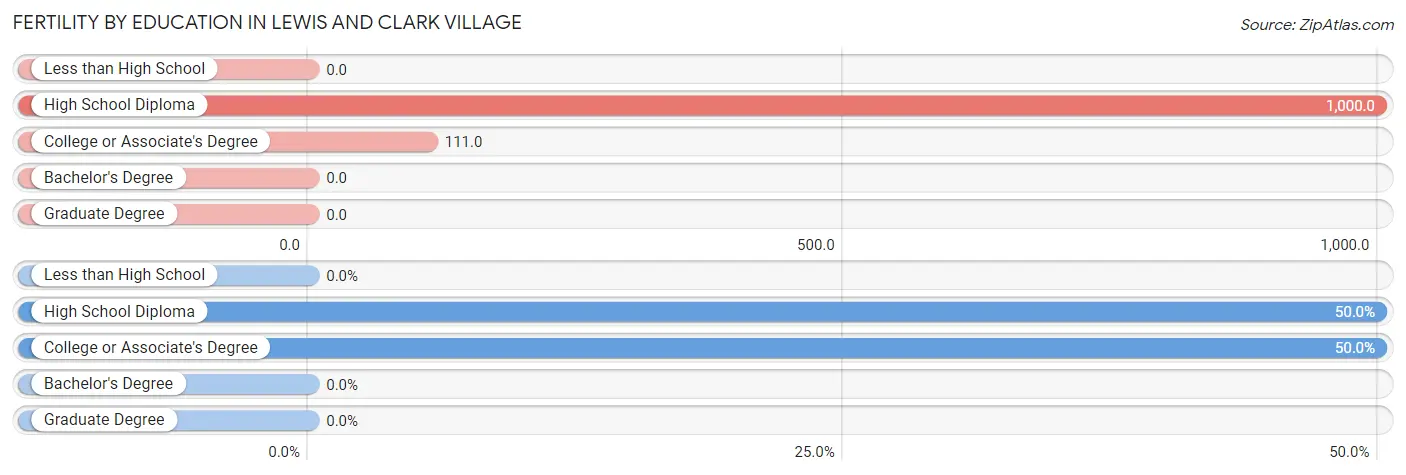
| Educational Attainment | Women with Births | Births / 1,000 Women |
| Less than High School | 0 (0.0%) | 0.0 |
| High School Diploma | 2 (50.0%) | 1,000.0 |
| College or Associate's Degree | 2 (50.0%) | 111.0 |
| Bachelor's Degree | 0 (0.0%) | 0.0 |
| Graduate Degree | 0 (0.0%) | 0.0 |
| Total | 4 (100.0%) | 143.0 |
Fertility by Education by Marriage Status in Lewis and Clark Village
50.0% of women with births in Lewis and Clark Village are unmarried. Women with the educational attainment of college or associate's degree are most likely to be married with 100.0% of them married at childbirth, while women with the educational attainment of high school diploma are least likely to be married with 100.0% of them unmarried at childbirth.
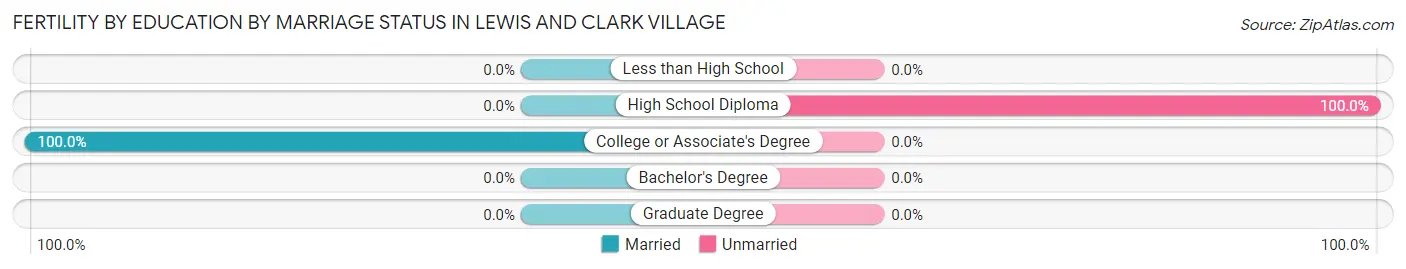
| Educational Attainment | Married | Unmarried |
| Less than High School | 0 (0.0%) | 0 (0.0%) |
| High School Diploma | 0 (0.0%) | 2 (100.0%) |
| College or Associate's Degree | 2 (100.0%) | 0 (0.0%) |
| Bachelor's Degree | 0 (0.0%) | 0 (0.0%) |
| Graduate Degree | 0 (0.0%) | 0 (0.0%) |
| Total | 2 (50.0%) | 2 (50.0%) |
Employment Characteristics in Lewis and Clark Village
Employment by Class of Employer in Lewis and Clark Village
Among the 53 employed individuals in Lewis and Clark Village, private company employees (43 | 81.1%), federal government employees (5 | 9.4%), and local government employees (2 | 3.8%) make up the most common classes of employment.
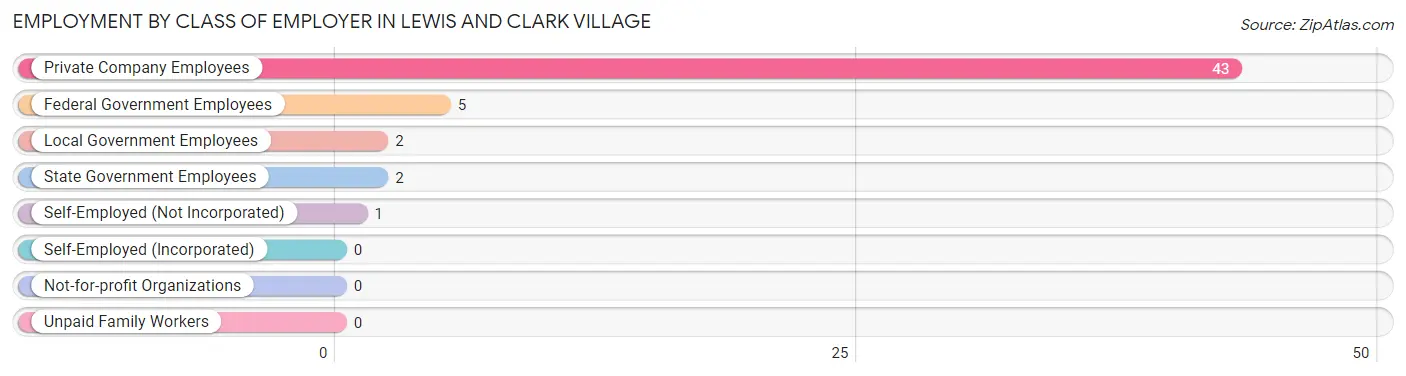
| Employer Class | # Employees | % Employees |
| Private Company Employees | 43 | 81.1% |
| Self-Employed (Incorporated) | 0 | 0.0% |
| Self-Employed (Not Incorporated) | 1 | 1.9% |
| Not-for-profit Organizations | 0 | 0.0% |
| Local Government Employees | 2 | 3.8% |
| State Government Employees | 2 | 3.8% |
| Federal Government Employees | 5 | 9.4% |
| Unpaid Family Workers | 0 | 0.0% |
| Total | 53 | 100.0% |
Employment Status by Age in Lewis and Clark Village
According to the labor force statistics for Lewis and Clark Village, out of the total population over 16 years of age (74), 75.7% or 56 individuals are in the labor force, with 3.6% or 2 of them unemployed. The age group with the highest labor force participation rate is 20 to 24 years, with 100.0% or 3 individuals in the labor force. Within the labor force, the 75 years and over age range has the highest percentage of unemployed individuals, with 100.0% or 2 of them being unemployed.
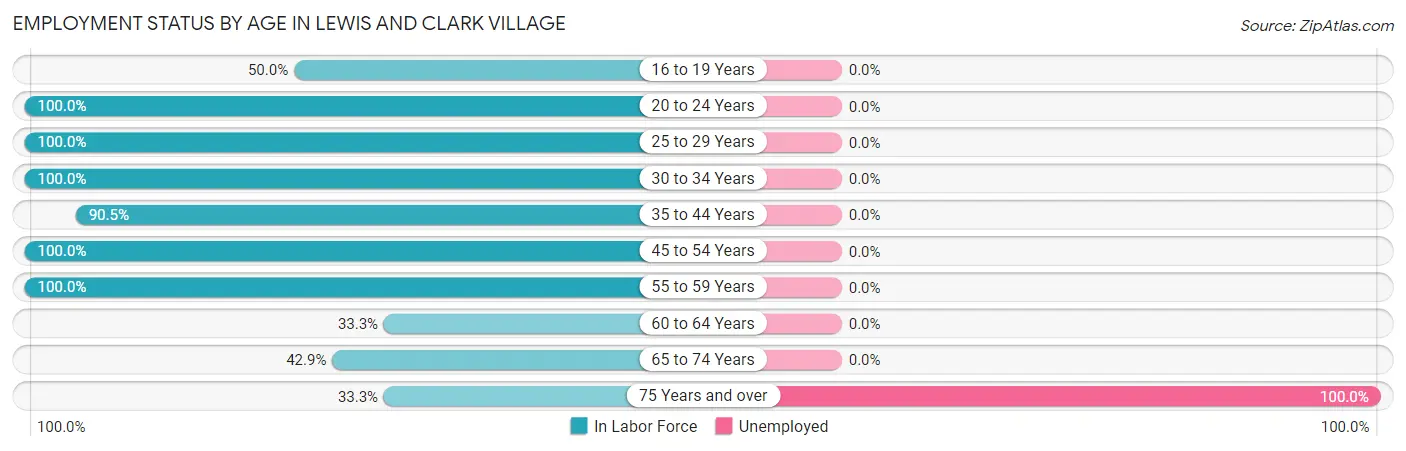
| Age Bracket | In Labor Force | Unemployed |
| 16 to 19 Years | 4 (50.0%) | 0 (0.0%) |
| 20 to 24 Years | 3 (100.0%) | 0 (0.0%) |
| 25 to 29 Years | 2 (100.0%) | 0 (0.0%) |
| 30 to 34 Years | 6 (100.0%) | 0 (0.0%) |
| 35 to 44 Years | 19 (90.5%) | 0 (0.0%) |
| 45 to 54 Years | 10 (100.0%) | 0 (0.0%) |
| 55 to 59 Years | 5 (100.0%) | 0 (0.0%) |
| 60 to 64 Years | 2 (33.3%) | 0 (0.0%) |
| 65 to 74 Years | 3 (42.9%) | 0 (0.0%) |
| 75 Years and over | 2 (33.3%) | 2 (100.0%) |
| Total | 56 (75.7%) | 2 (3.6%) |
Employment Status by Educational Attainment in Lewis and Clark Village
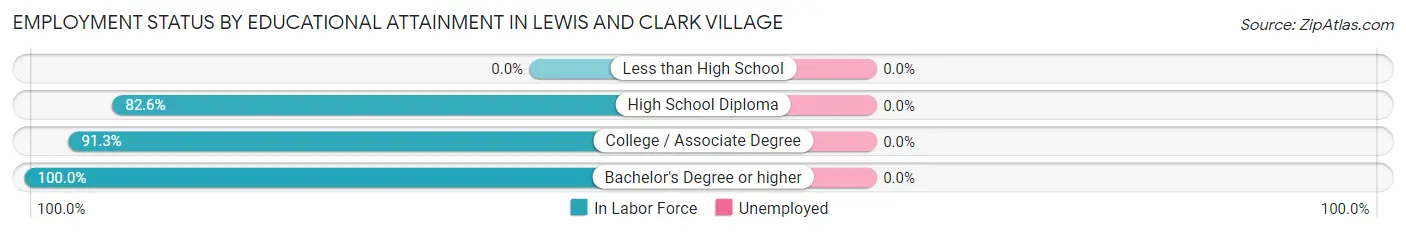
| Educational Attainment | In Labor Force | Unemployed |
| Less than High School | 0 (0.0%) | 0 (0.0%) |
| High School Diploma | 19 (82.6%) | 0 (0.0%) |
| College / Associate Degree | 21 (91.3%) | 0 (0.0%) |
| Bachelor's Degree or higher | 4 (100.0%) | 0 (0.0%) |
| Total | 44 (88.0%) | 0 (0.0%) |
Employment Occupations by Sex in Lewis and Clark Village
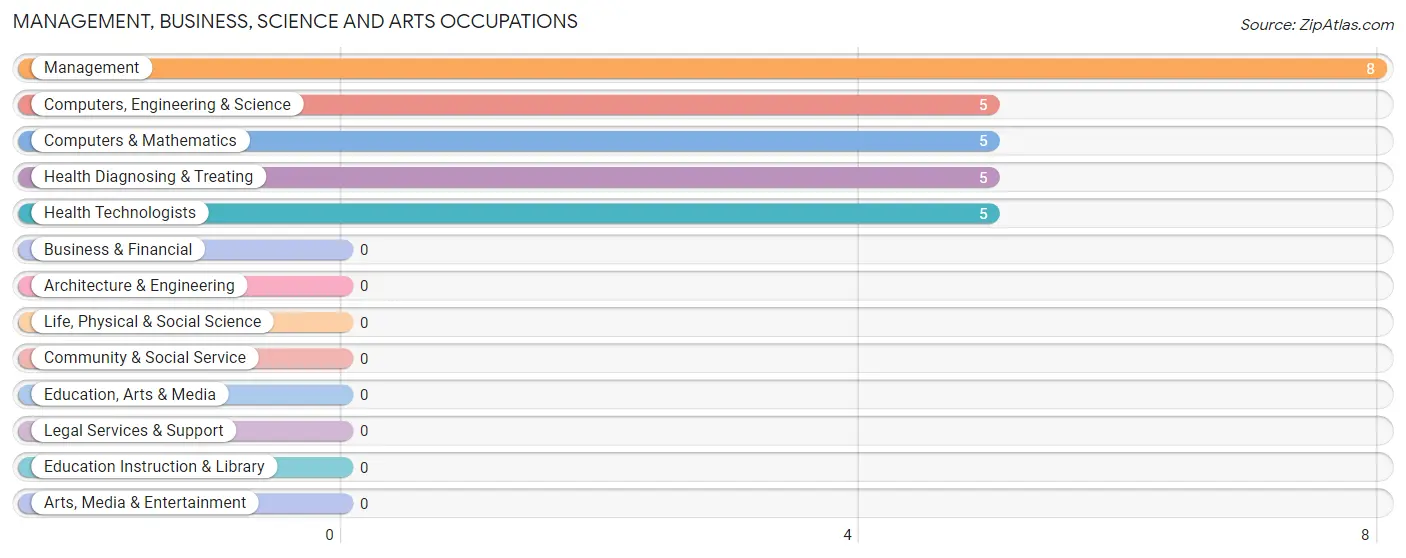
Management, Business, Science and Arts Occupations
The most common Management, Business, Science and Arts occupations in Lewis and Clark Village are Management (8 | 14.8%), Computers, Engineering & Science (5 | 9.3%), Computers & Mathematics (5 | 9.3%), Health Diagnosing & Treating (5 | 9.3%), and Health Technologists (5 | 9.3%).
Management, Business, Science and Arts Occupations by Sex
Within the Management, Business, Science and Arts occupations in Lewis and Clark Village, the most male-oriented occupations are Computers, Engineering & Science (100.0%), Computers & Mathematics (100.0%), and Management (75.0%), while the most female-oriented occupations are Health Diagnosing & Treating (100.0%), Health Technologists (100.0%), and Management (25.0%).
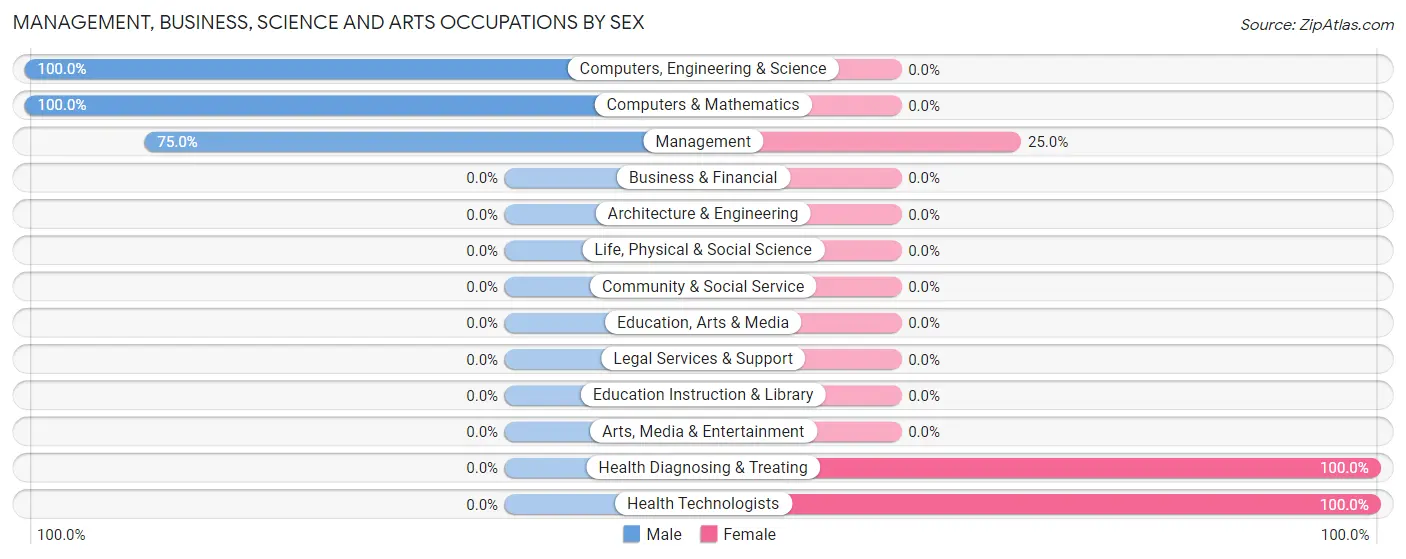
| Occupation | Male | Female |
| Management | 6 (75.0%) | 2 (25.0%) |
| Business & Financial | 0 (0.0%) | 0 (0.0%) |
| Computers, Engineering & Science | 5 (100.0%) | 0 (0.0%) |
| Computers & Mathematics | 5 (100.0%) | 0 (0.0%) |
| Architecture & Engineering | 0 (0.0%) | 0 (0.0%) |
| Life, Physical & Social Science | 0 (0.0%) | 0 (0.0%) |
| Community & Social Service | 0 (0.0%) | 0 (0.0%) |
| Education, Arts & Media | 0 (0.0%) | 0 (0.0%) |
| Legal Services & Support | 0 (0.0%) | 0 (0.0%) |
| Education Instruction & Library | 0 (0.0%) | 0 (0.0%) |
| Arts, Media & Entertainment | 0 (0.0%) | 0 (0.0%) |
| Health Diagnosing & Treating | 0 (0.0%) | 5 (100.0%) |
| Health Technologists | 0 (0.0%) | 5 (100.0%) |
| Total (Category) | 11 (61.1%) | 7 (38.9%) |
| Total (Overall) | 29 (53.7%) | 25 (46.3%) |
Services Occupations
The most common Services occupations in Lewis and Clark Village are Food Preparation & Serving (11 | 20.4%), and Healthcare Support (7 | 13.0%).
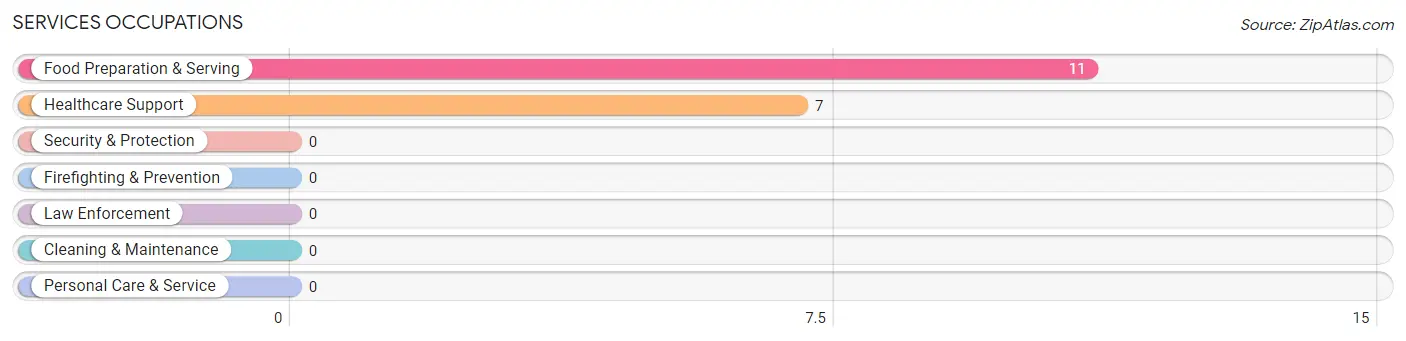
Services Occupations by Sex
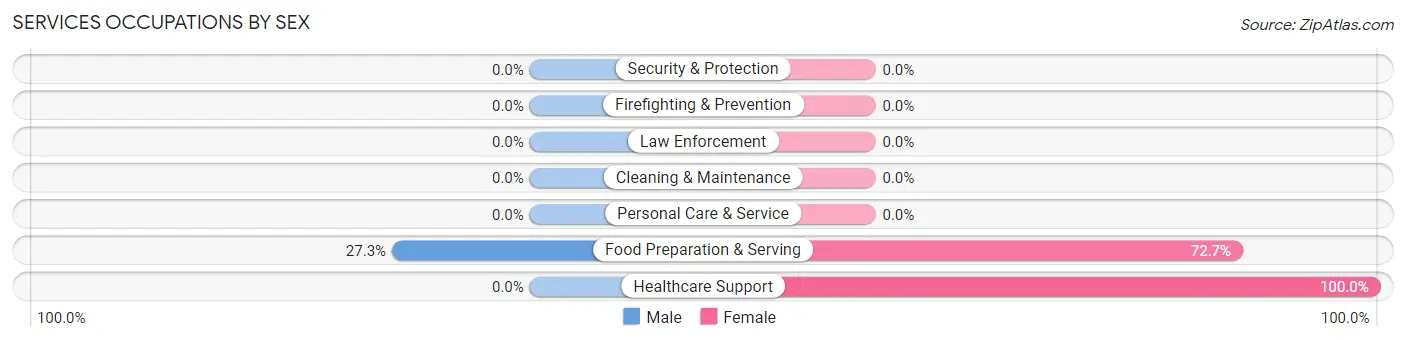
| Occupation | Male | Female |
| Healthcare Support | 0 (0.0%) | 7 (100.0%) |
| Security & Protection | 0 (0.0%) | 0 (0.0%) |
| Firefighting & Prevention | 0 (0.0%) | 0 (0.0%) |
| Law Enforcement | 0 (0.0%) | 0 (0.0%) |
| Food Preparation & Serving | 3 (27.3%) | 8 (72.7%) |
| Cleaning & Maintenance | 0 (0.0%) | 0 (0.0%) |
| Personal Care & Service | 0 (0.0%) | 0 (0.0%) |
| Total (Category) | 3 (16.7%) | 15 (83.3%) |
| Total (Overall) | 29 (53.7%) | 25 (46.3%) |
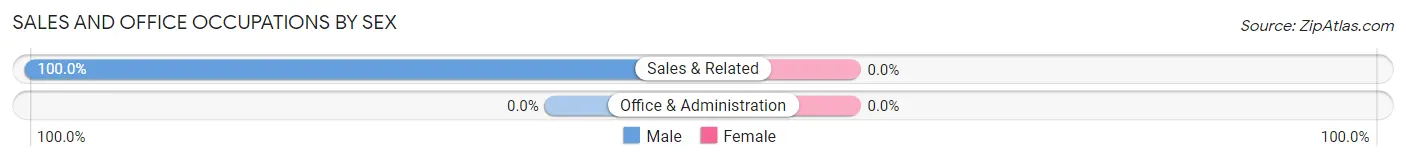
Sales and Office Occupations
The most common Sales and Office occupations in Lewis and Clark Village are , and Sales & Related (4 | 7.4%).
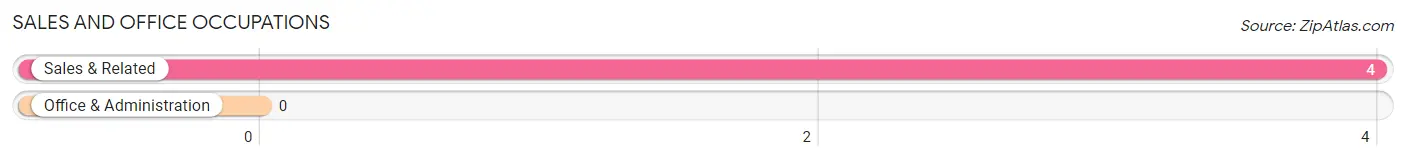
Sales and Office Occupations by Sex
| Occupation | Male | Female |
| Sales & Related | 4 (100.0%) | 0 (0.0%) |
| Office & Administration | 0 (0.0%) | 0 (0.0%) |
| Total (Category) | 4 (100.0%) | 0 (0.0%) |
| Total (Overall) | 29 (53.7%) | 25 (46.3%) |
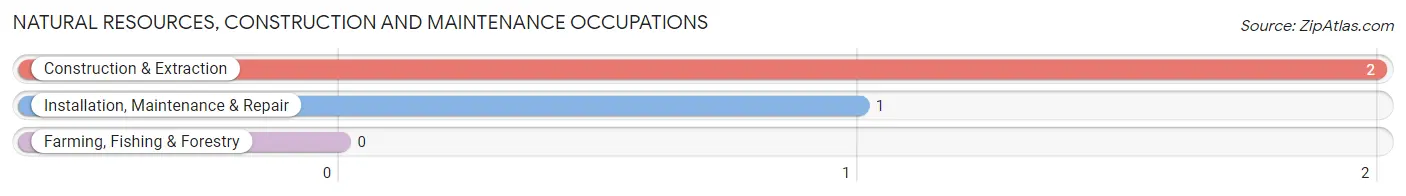
Natural Resources, Construction and Maintenance Occupations
The most common Natural Resources, Construction and Maintenance occupations in Lewis and Clark Village are Construction & Extraction (2 | 3.7%), and Installation, Maintenance & Repair (1 | 1.8%).
Natural Resources, Construction and Maintenance Occupations by Sex
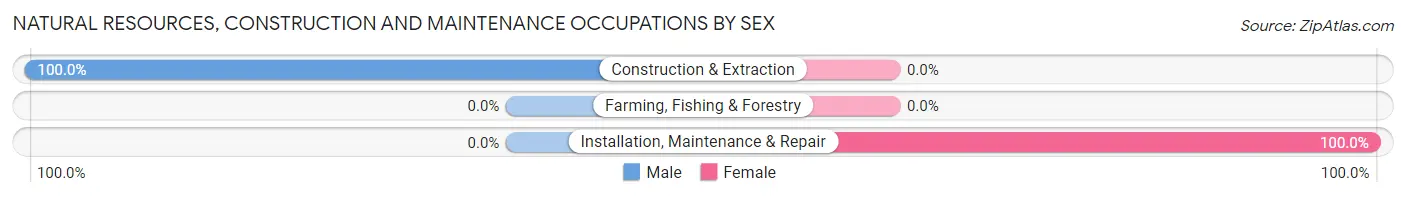
| Occupation | Male | Female |
| Farming, Fishing & Forestry | 0 (0.0%) | 0 (0.0%) |
| Construction & Extraction | 2 (100.0%) | 0 (0.0%) |
| Installation, Maintenance & Repair | 0 (0.0%) | 1 (100.0%) |
| Total (Category) | 2 (66.7%) | 1 (33.3%) |
| Total (Overall) | 29 (53.7%) | 25 (46.3%) |
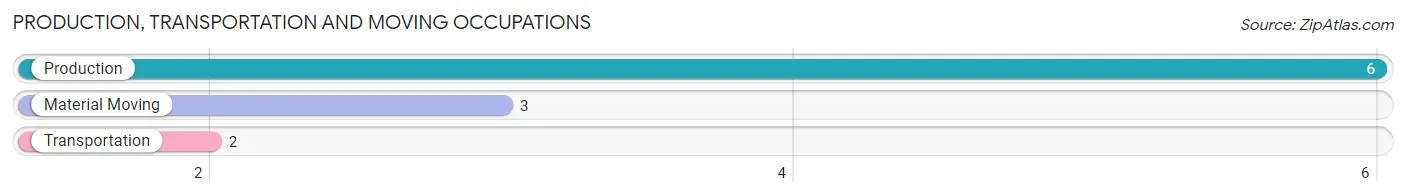
Production, Transportation and Moving Occupations
The most common Production, Transportation and Moving occupations in Lewis and Clark Village are Production (6 | 11.1%), Material Moving (3 | 5.6%), and Transportation (2 | 3.7%).
Production, Transportation and Moving Occupations by Sex
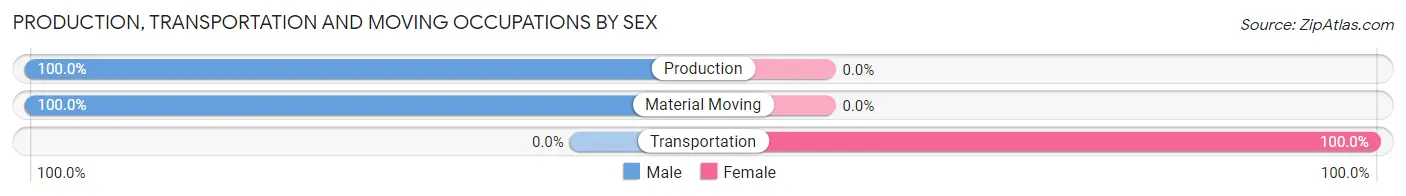
| Occupation | Male | Female |
| Production | 6 (100.0%) | 0 (0.0%) |
| Transportation | 0 (0.0%) | 2 (100.0%) |
| Material Moving | 3 (100.0%) | 0 (0.0%) |
| Total (Category) | 9 (81.8%) | 2 (18.2%) |
| Total (Overall) | 29 (53.7%) | 25 (46.3%) |
Employment Industries by Sex in Lewis and Clark Village
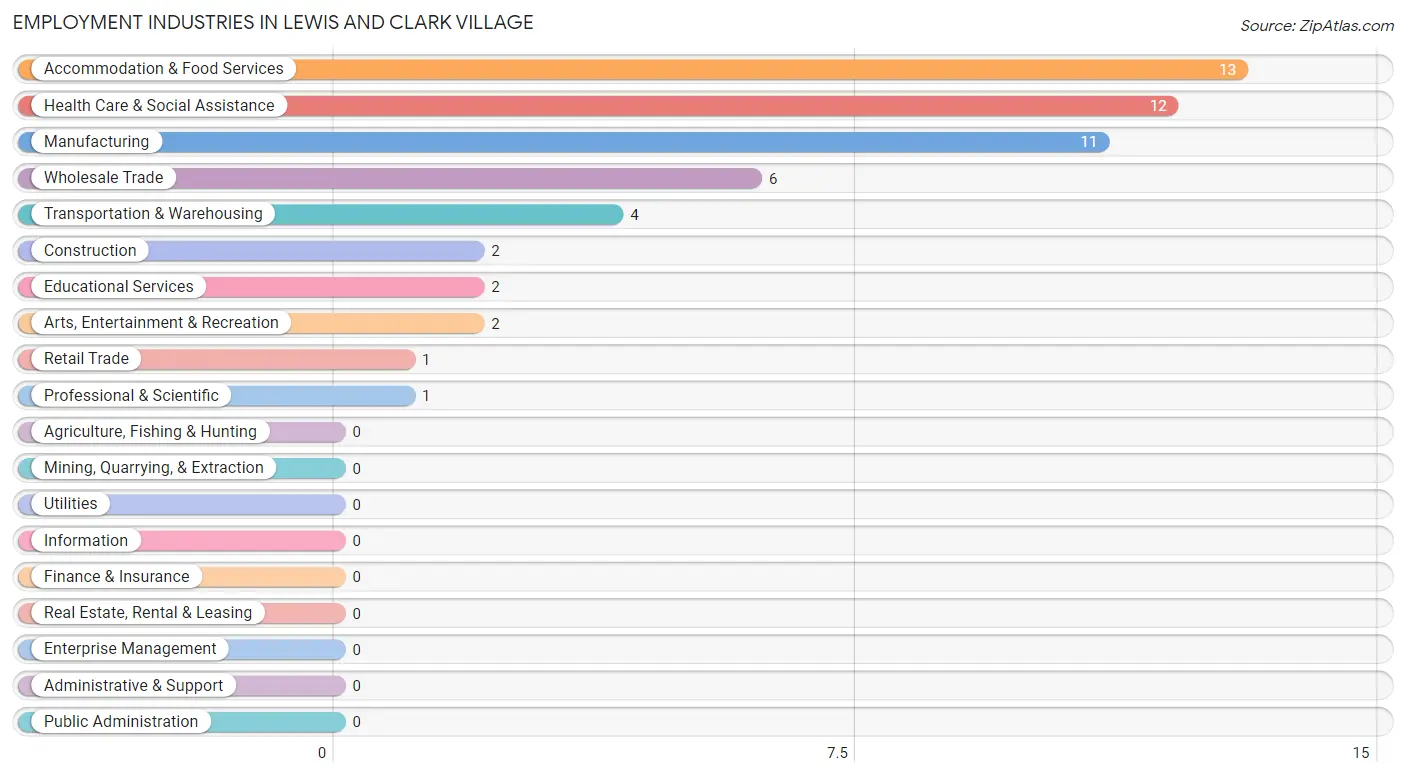
Employment Industries in Lewis and Clark Village
The major employment industries in Lewis and Clark Village include Accommodation & Food Services (13 | 24.1%), Health Care & Social Assistance (12 | 22.2%), Manufacturing (11 | 20.4%), Wholesale Trade (6 | 11.1%), and Transportation & Warehousing (4 | 7.4%).
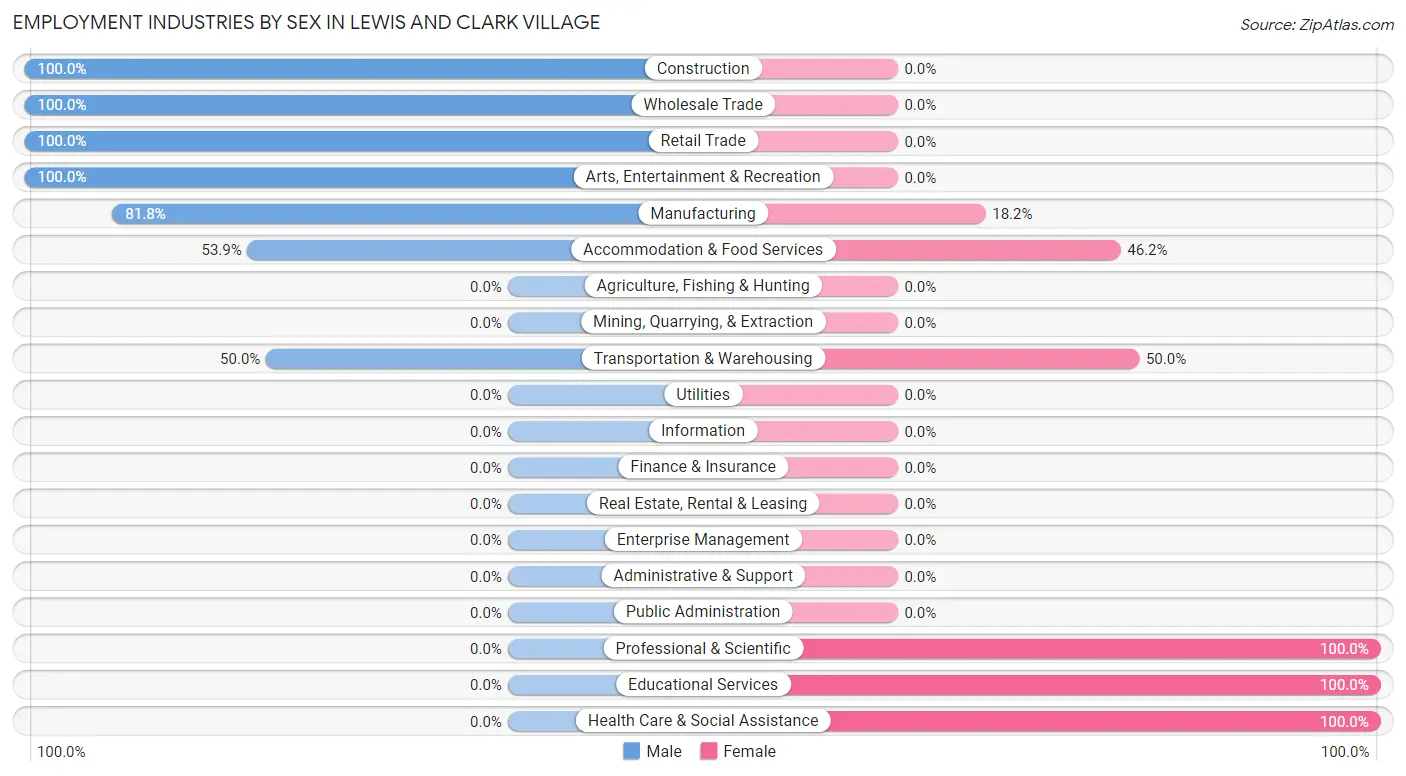
Employment Industries by Sex in Lewis and Clark Village
The Lewis and Clark Village industries that see more men than women are Construction (100.0%), Wholesale Trade (100.0%), and Retail Trade (100.0%), whereas the industries that tend to have a higher number of women are Professional & Scientific (100.0%), Educational Services (100.0%), and Health Care & Social Assistance (100.0%).
| Industry | Male | Female |
| Agriculture, Fishing & Hunting | 0 (0.0%) | 0 (0.0%) |
| Mining, Quarrying, & Extraction | 0 (0.0%) | 0 (0.0%) |
| Construction | 2 (100.0%) | 0 (0.0%) |
| Manufacturing | 9 (81.8%) | 2 (18.2%) |
| Wholesale Trade | 6 (100.0%) | 0 (0.0%) |
| Retail Trade | 1 (100.0%) | 0 (0.0%) |
| Transportation & Warehousing | 2 (50.0%) | 2 (50.0%) |
| Utilities | 0 (0.0%) | 0 (0.0%) |
| Information | 0 (0.0%) | 0 (0.0%) |
| Finance & Insurance | 0 (0.0%) | 0 (0.0%) |
| Real Estate, Rental & Leasing | 0 (0.0%) | 0 (0.0%) |
| Professional & Scientific | 0 (0.0%) | 1 (100.0%) |
| Enterprise Management | 0 (0.0%) | 0 (0.0%) |
| Administrative & Support | 0 (0.0%) | 0 (0.0%) |
| Educational Services | 0 (0.0%) | 2 (100.0%) |
| Health Care & Social Assistance | 0 (0.0%) | 12 (100.0%) |
| Arts, Entertainment & Recreation | 2 (100.0%) | 0 (0.0%) |
| Accommodation & Food Services | 7 (53.8%) | 6 (46.2%) |
| Public Administration | 0 (0.0%) | 0 (0.0%) |
| Total | 29 (53.7%) | 25 (46.3%) |
Education in Lewis and Clark Village
School Enrollment in Lewis and Clark Village
The most common levels of schooling among the 28 students in Lewis and Clark Village are elementary school (9 | 32.1%), kindergarten (6 | 21.4%), and middle school (5 | 17.9%).
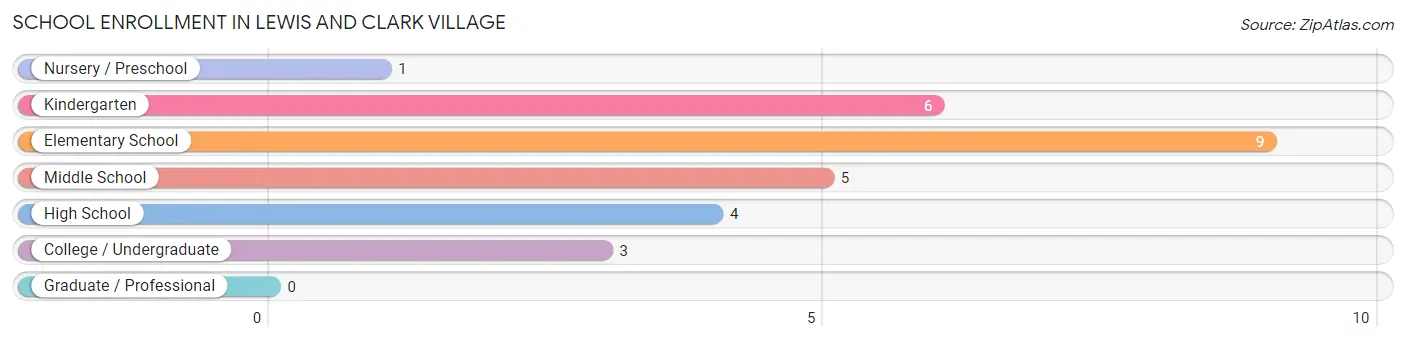
| School Level | # Students | % Students |
| Nursery / Preschool | 1 | 3.6% |
| Kindergarten | 6 | 21.4% |
| Elementary School | 9 | 32.1% |
| Middle School | 5 | 17.9% |
| High School | 4 | 14.3% |
| College / Undergraduate | 3 | 10.7% |
| Graduate / Professional | 0 | 0.0% |
| Total | 28 | 100.0% |
School Enrollment by Age by Funding Source in Lewis and Clark Village
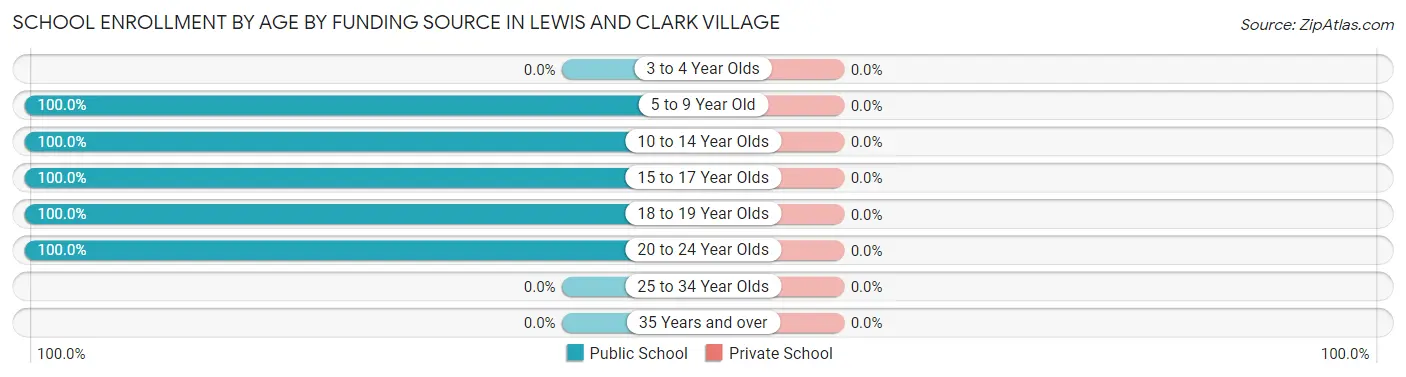
| Age Bracket | Public School | Private School |
| 3 to 4 Year Olds | 0 (0.0%) | 0 (0.0%) |
| 5 to 9 Year Old | 14 (100.0%) | 0 (0.0%) |
| 10 to 14 Year Olds | 7 (100.0%) | 0 (0.0%) |
| 15 to 17 Year Olds | 2 (100.0%) | 0 (0.0%) |
| 18 to 19 Year Olds | 2 (100.0%) | 0 (0.0%) |
| 20 to 24 Year Olds | 3 (100.0%) | 0 (0.0%) |
| 25 to 34 Year Olds | 0 (0.0%) | 0 (0.0%) |
| 35 Years and over | 0 (0.0%) | 0 (0.0%) |
| Total | 28 (100.0%) | 0 (0.0%) |
Educational Attainment by Field of Study in Lewis and Clark Village
Psychology (2 | 33.3%), engineering (2 | 33.3%), and education (2 | 33.3%) are the most common fields of study among 6 individuals in Lewis and Clark Village who have obtained a bachelor's degree or higher.
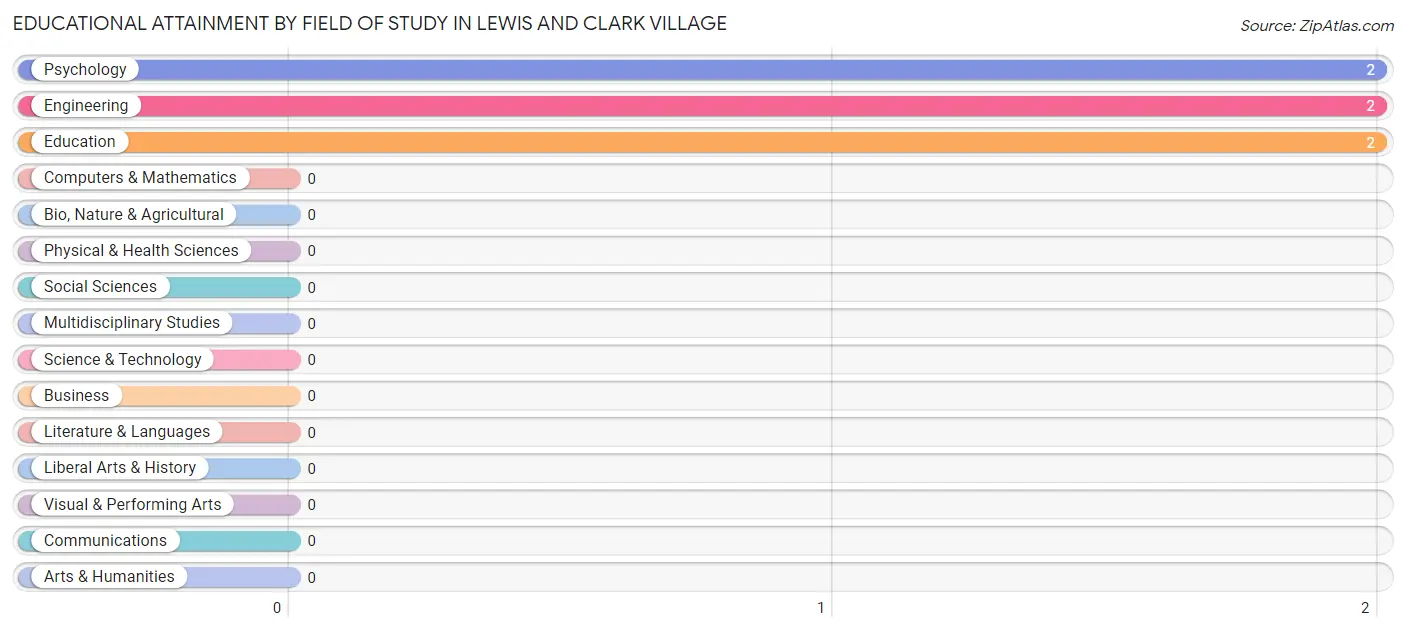
| Field of Study | # Graduates | % Graduates |
| Computers & Mathematics | 0 | 0.0% |
| Bio, Nature & Agricultural | 0 | 0.0% |
| Physical & Health Sciences | 0 | 0.0% |
| Psychology | 2 | 33.3% |
| Social Sciences | 0 | 0.0% |
| Engineering | 2 | 33.3% |
| Multidisciplinary Studies | 0 | 0.0% |
| Science & Technology | 0 | 0.0% |
| Business | 0 | 0.0% |
| Education | 2 | 33.3% |
| Literature & Languages | 0 | 0.0% |
| Liberal Arts & History | 0 | 0.0% |
| Visual & Performing Arts | 0 | 0.0% |
| Communications | 0 | 0.0% |
| Arts & Humanities | 0 | 0.0% |
| Total | 6 | 100.0% |
Transportation & Commute in Lewis and Clark Village
Vehicle Availability by Sex in Lewis and Clark Village
The most prevalent vehicle ownership categories in Lewis and Clark Village are males with 2 vehicles (10, accounting for 35.7%) and females with 2 vehicles (5, making up 40.0%).
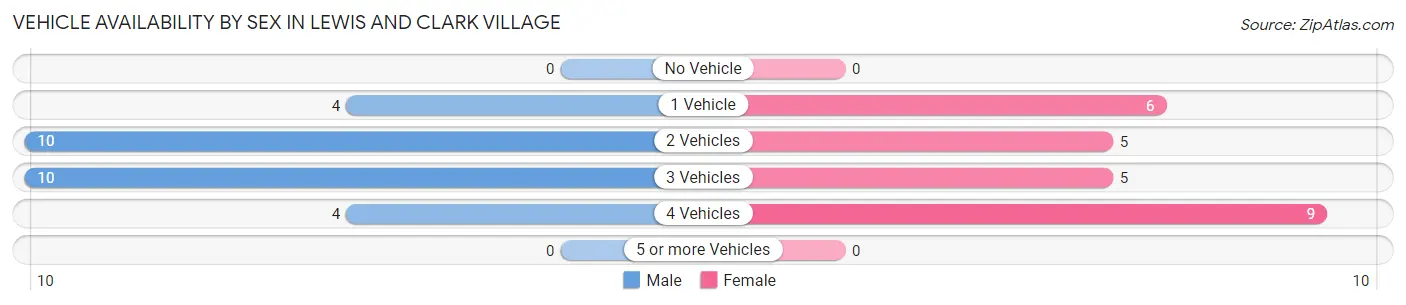
| Vehicles Available | Male | Female |
| No Vehicle | 0 (0.0%) | 0 (0.0%) |
| 1 Vehicle | 4 (14.3%) | 6 (24.0%) |
| 2 Vehicles | 10 (35.7%) | 5 (20.0%) |
| 3 Vehicles | 10 (35.7%) | 5 (20.0%) |
| 4 Vehicles | 4 (14.3%) | 9 (36.0%) |
| 5 or more Vehicles | 0 (0.0%) | 0 (0.0%) |
| Total | 28 (100.0%) | 25 (100.0%) |
Commute Time in Lewis and Clark Village
The most frequently occuring commute durations in Lewis and Clark Village are 25 to 29 minutes (14 commuters, 29.2%), 35 to 39 minutes (9 commuters, 18.8%), and 30 to 34 minutes (8 commuters, 16.7%).
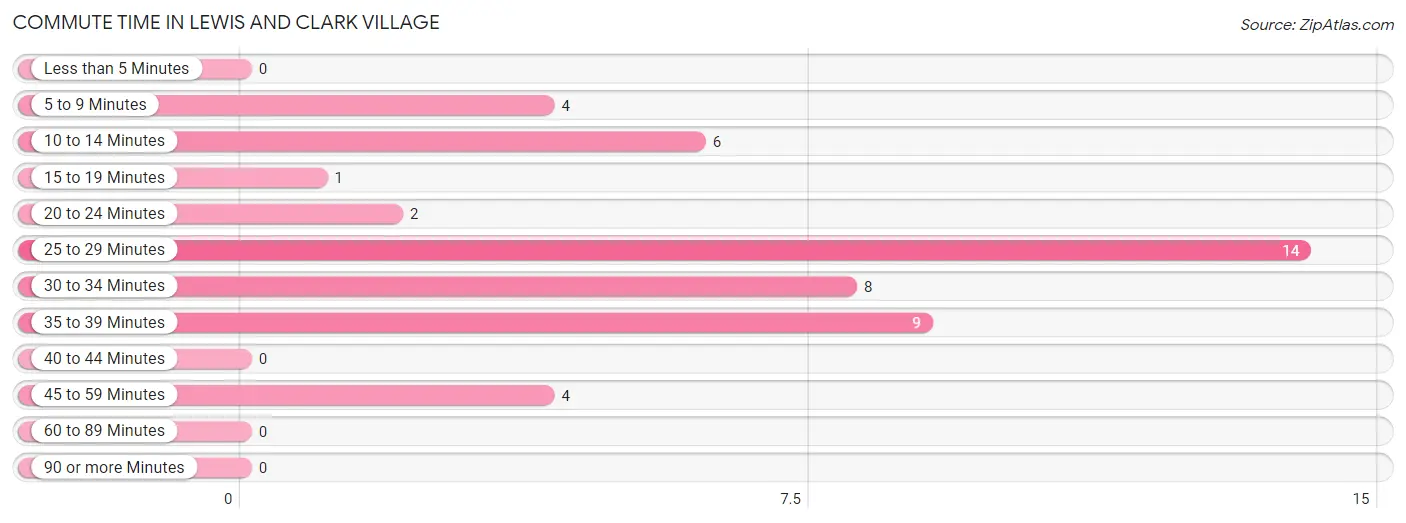
| Commute Time | # Commuters | % Commuters |
| Less than 5 Minutes | 0 | 0.0% |
| 5 to 9 Minutes | 4 | 8.3% |
| 10 to 14 Minutes | 6 | 12.5% |
| 15 to 19 Minutes | 1 | 2.1% |
| 20 to 24 Minutes | 2 | 4.2% |
| 25 to 29 Minutes | 14 | 29.2% |
| 30 to 34 Minutes | 8 | 16.7% |
| 35 to 39 Minutes | 9 | 18.8% |
| 40 to 44 Minutes | 0 | 0.0% |
| 45 to 59 Minutes | 4 | 8.3% |
| 60 to 89 Minutes | 0 | 0.0% |
| 90 or more Minutes | 0 | 0.0% |
Commute Time by Sex in Lewis and Clark Village
The most common commute times in Lewis and Clark Village are 25 to 29 minutes (14 commuters, 60.9%) for males and 35 to 39 minutes (9 commuters, 36.0%) for females.
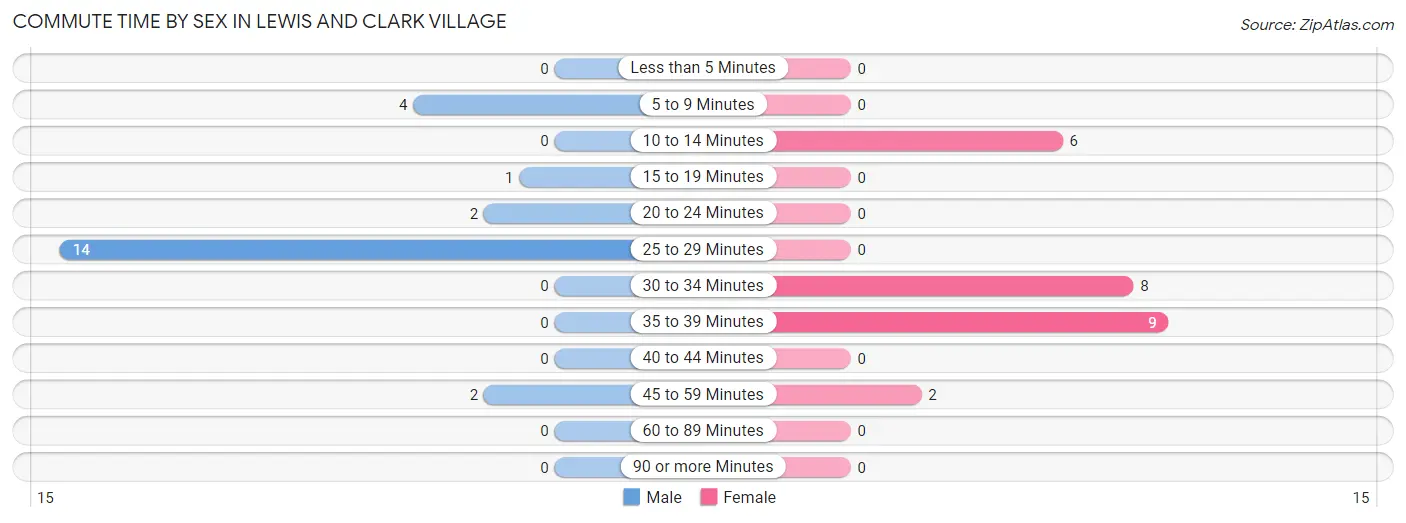
| Commute Time | Male | Female |
| Less than 5 Minutes | 0 (0.0%) | 0 (0.0%) |
| 5 to 9 Minutes | 4 (17.4%) | 0 (0.0%) |
| 10 to 14 Minutes | 0 (0.0%) | 6 (24.0%) |
| 15 to 19 Minutes | 1 (4.3%) | 0 (0.0%) |
| 20 to 24 Minutes | 2 (8.7%) | 0 (0.0%) |
| 25 to 29 Minutes | 14 (60.9%) | 0 (0.0%) |
| 30 to 34 Minutes | 0 (0.0%) | 8 (32.0%) |
| 35 to 39 Minutes | 0 (0.0%) | 9 (36.0%) |
| 40 to 44 Minutes | 0 (0.0%) | 0 (0.0%) |
| 45 to 59 Minutes | 2 (8.7%) | 2 (8.0%) |
| 60 to 89 Minutes | 0 (0.0%) | 0 (0.0%) |
| 90 or more Minutes | 0 (0.0%) | 0 (0.0%) |
Time of Departure to Work by Sex in Lewis and Clark Village
The most frequent times of departure to work in Lewis and Clark Village are 6:30 AM to 6:59 AM (6, 26.1%) for males and 12:00 PM to 3:59 PM (9, 36.0%) for females.
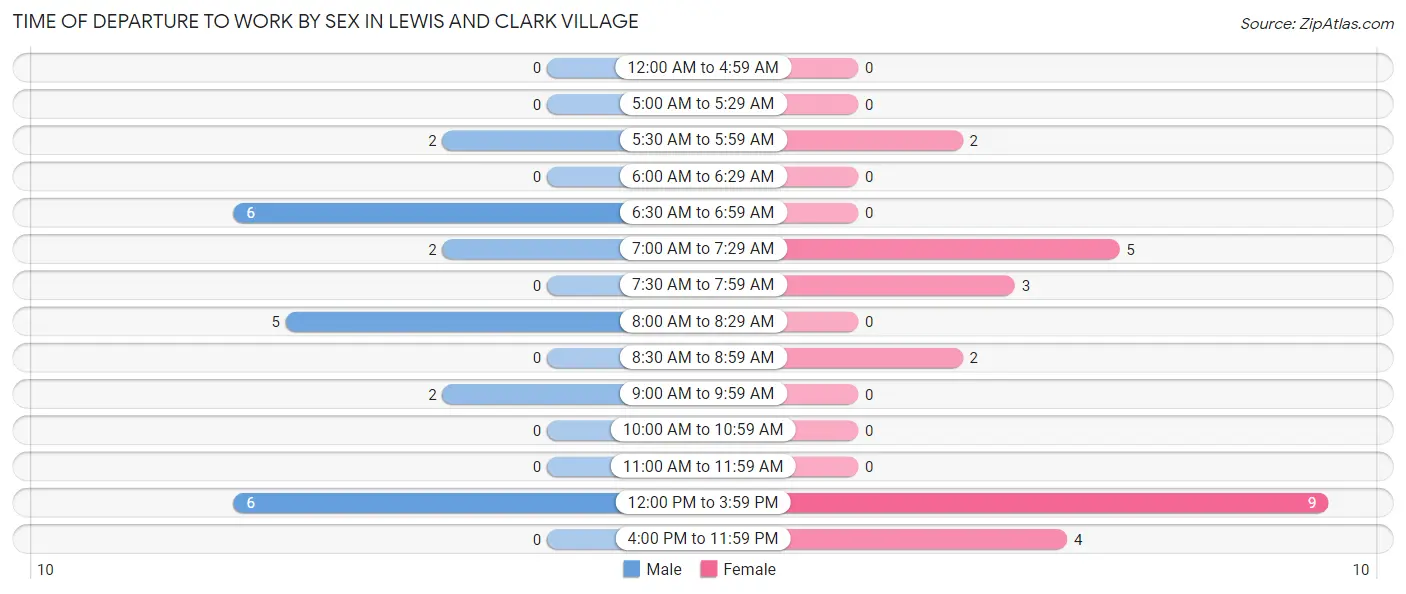
| Time of Departure | Male | Female |
| 12:00 AM to 4:59 AM | 0 (0.0%) | 0 (0.0%) |
| 5:00 AM to 5:29 AM | 0 (0.0%) | 0 (0.0%) |
| 5:30 AM to 5:59 AM | 2 (8.7%) | 2 (8.0%) |
| 6:00 AM to 6:29 AM | 0 (0.0%) | 0 (0.0%) |
| 6:30 AM to 6:59 AM | 6 (26.1%) | 0 (0.0%) |
| 7:00 AM to 7:29 AM | 2 (8.7%) | 5 (20.0%) |
| 7:30 AM to 7:59 AM | 0 (0.0%) | 3 (12.0%) |
| 8:00 AM to 8:29 AM | 5 (21.7%) | 0 (0.0%) |
| 8:30 AM to 8:59 AM | 0 (0.0%) | 2 (8.0%) |
| 9:00 AM to 9:59 AM | 2 (8.7%) | 0 (0.0%) |
| 10:00 AM to 10:59 AM | 0 (0.0%) | 0 (0.0%) |
| 11:00 AM to 11:59 AM | 0 (0.0%) | 0 (0.0%) |
| 12:00 PM to 3:59 PM | 6 (26.1%) | 9 (36.0%) |
| 4:00 PM to 11:59 PM | 0 (0.0%) | 4 (16.0%) |
| Total | 23 (100.0%) | 25 (100.0%) |
Housing Occupancy in Lewis and Clark Village
Occupancy by Ownership in Lewis and Clark Village
Of the total 37 dwellings in Lewis and Clark Village, owner-occupied units account for 34 (91.9%), while renter-occupied units make up 3 (8.1%).
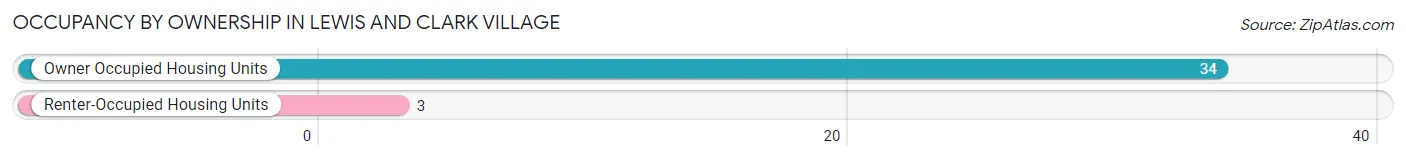
| Occupancy | # Housing Units | % Housing Units |
| Owner Occupied Housing Units | 34 | 91.9% |
| Renter-Occupied Housing Units | 3 | 8.1% |
| Total Occupied Housing Units | 37 | 100.0% |
Occupancy by Household Size in Lewis and Clark Village
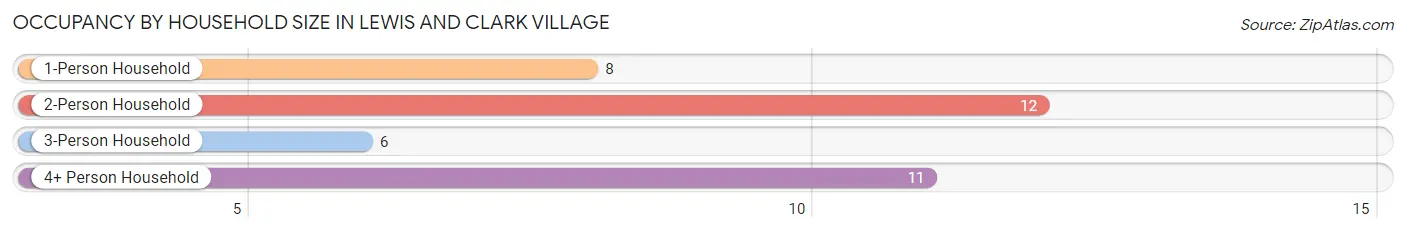
| Household Size | # Housing Units | % Housing Units |
| 1-Person Household | 8 | 21.6% |
| 2-Person Household | 12 | 32.4% |
| 3-Person Household | 6 | 16.2% |
| 4+ Person Household | 11 | 29.7% |
| Total Housing Units | 37 | 100.0% |
Occupancy by Ownership by Household Size in Lewis and Clark Village
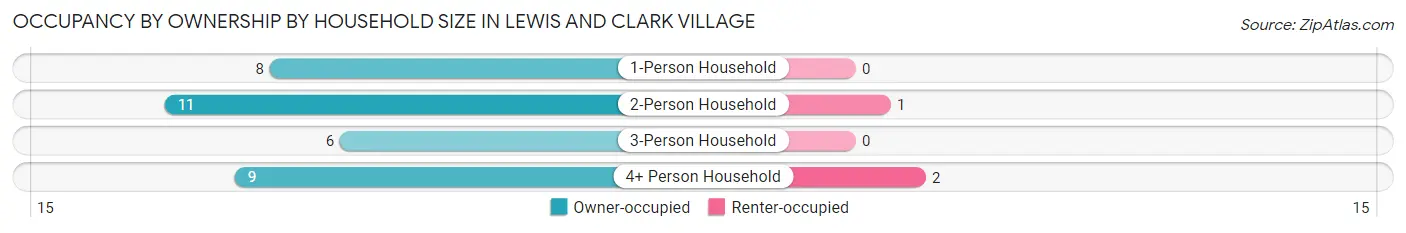
| Household Size | Owner-occupied | Renter-occupied |
| 1-Person Household | 8 (100.0%) | 0 (0.0%) |
| 2-Person Household | 11 (91.7%) | 1 (8.3%) |
| 3-Person Household | 6 (100.0%) | 0 (0.0%) |
| 4+ Person Household | 9 (81.8%) | 2 (18.2%) |
| Total Housing Units | 34 (91.9%) | 3 (8.1%) |
Occupancy by Educational Attainment in Lewis and Clark Village
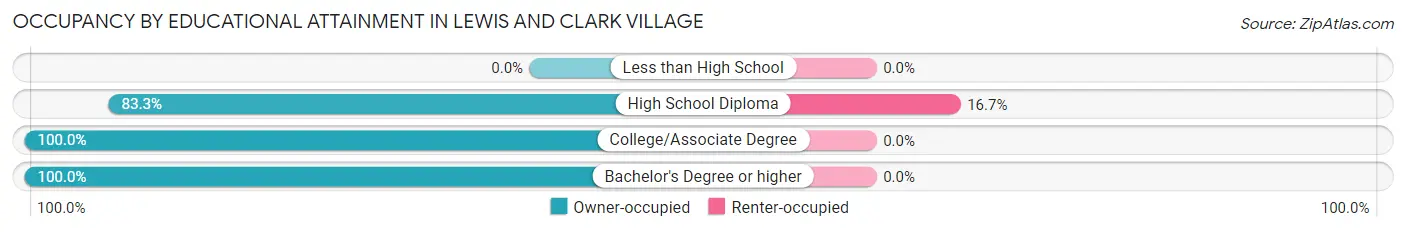
| Household Size | Owner-occupied | Renter-occupied |
| Less than High School | 0 (0.0%) | 0 (0.0%) |
| High School Diploma | 15 (83.3%) | 3 (16.7%) |
| College/Associate Degree | 15 (100.0%) | 0 (0.0%) |
| Bachelor's Degree or higher | 4 (100.0%) | 0 (0.0%) |
Occupancy by Age of Householder in Lewis and Clark Village
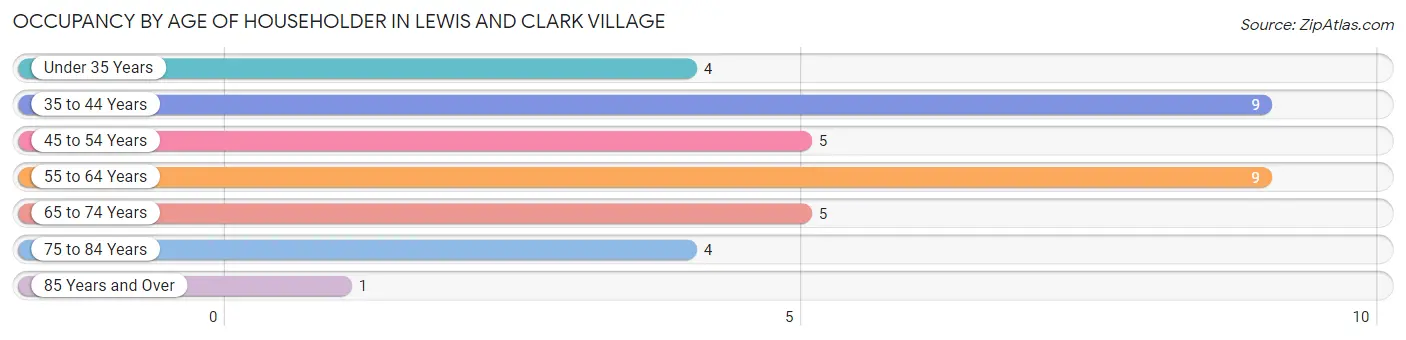
| Age Bracket | # Households | % Households |
| Under 35 Years | 4 | 10.8% |
| 35 to 44 Years | 9 | 24.3% |
| 45 to 54 Years | 5 | 13.5% |
| 55 to 64 Years | 9 | 24.3% |
| 65 to 74 Years | 5 | 13.5% |
| 75 to 84 Years | 4 | 10.8% |
| 85 Years and Over | 1 | 2.7% |
| Total | 37 | 100.0% |
Housing Finances in Lewis and Clark Village
Median Income by Occupancy in Lewis and Clark Village
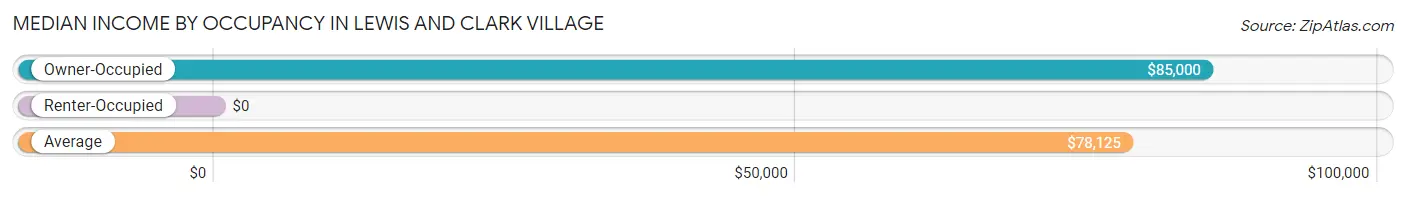
| Occupancy Type | # Households | Median Income |
| Owner-Occupied | 34 (91.9%) | $85,000 |
| Renter-Occupied | 3 (8.1%) | $0 |
| Average | 37 (100.0%) | $78,125 |
Occupancy by Householder Income Bracket in Lewis and Clark Village
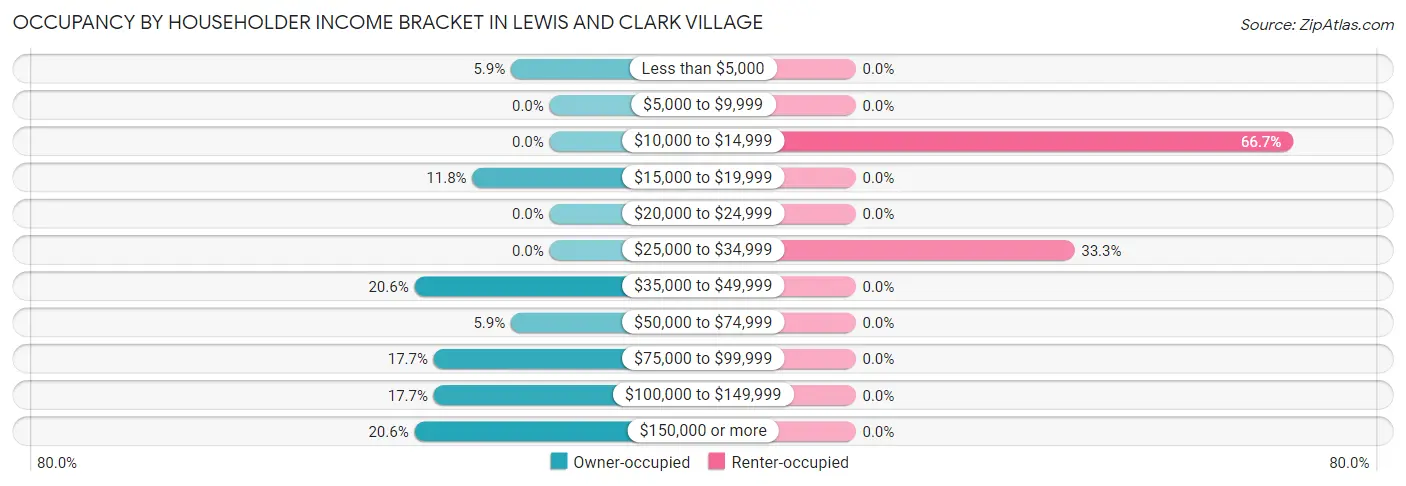
| Income Bracket | Owner-occupied | Renter-occupied |
| Less than $5,000 | 2 (5.9%) | 0 (0.0%) |
| $5,000 to $9,999 | 0 (0.0%) | 0 (0.0%) |
| $10,000 to $14,999 | 0 (0.0%) | 2 (66.7%) |
| $15,000 to $19,999 | 4 (11.8%) | 0 (0.0%) |
| $20,000 to $24,999 | 0 (0.0%) | 0 (0.0%) |
| $25,000 to $34,999 | 0 (0.0%) | 1 (33.3%) |
| $35,000 to $49,999 | 7 (20.6%) | 0 (0.0%) |
| $50,000 to $74,999 | 2 (5.9%) | 0 (0.0%) |
| $75,000 to $99,999 | 6 (17.6%) | 0 (0.0%) |
| $100,000 to $149,999 | 6 (17.6%) | 0 (0.0%) |
| $150,000 or more | 7 (20.6%) | 0 (0.0%) |
| Total | 34 (100.0%) | 3 (100.0%) |
Monthly Housing Cost Tiers in Lewis and Clark Village
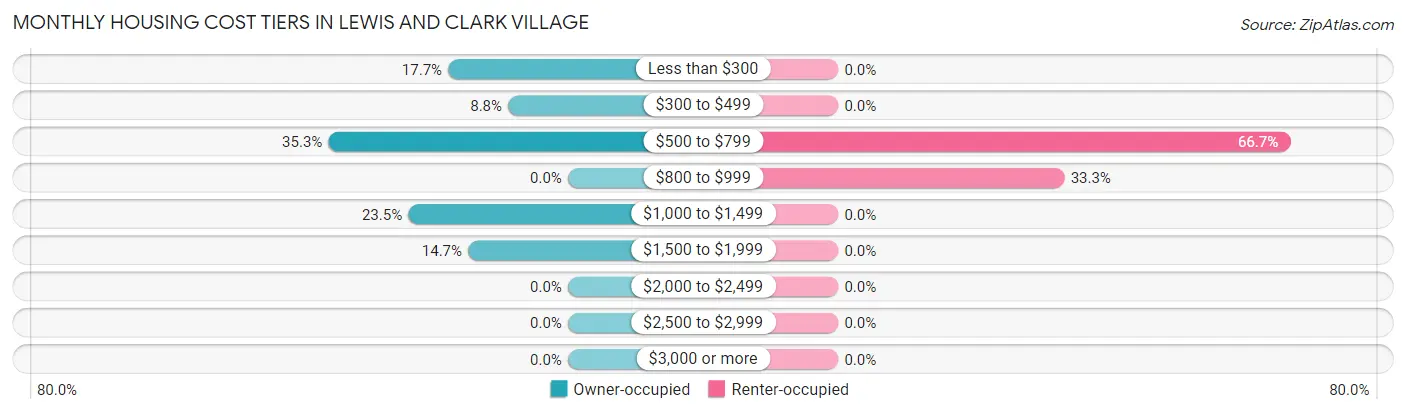
| Monthly Cost | Owner-occupied | Renter-occupied |
| Less than $300 | 6 (17.6%) | 0 (0.0%) |
| $300 to $499 | 3 (8.8%) | 0 (0.0%) |
| $500 to $799 | 12 (35.3%) | 2 (66.7%) |
| $800 to $999 | 0 (0.0%) | 1 (33.3%) |
| $1,000 to $1,499 | 8 (23.5%) | 0 (0.0%) |
| $1,500 to $1,999 | 5 (14.7%) | 0 (0.0%) |
| $2,000 to $2,499 | 0 (0.0%) | 0 (0.0%) |
| $2,500 to $2,999 | 0 (0.0%) | 0 (0.0%) |
| $3,000 or more | 0 (0.0%) | 0 (0.0%) |
| Total | 34 (100.0%) | 3 (100.0%) |
Physical Housing Characteristics in Lewis and Clark Village
Housing Structures in Lewis and Clark Village
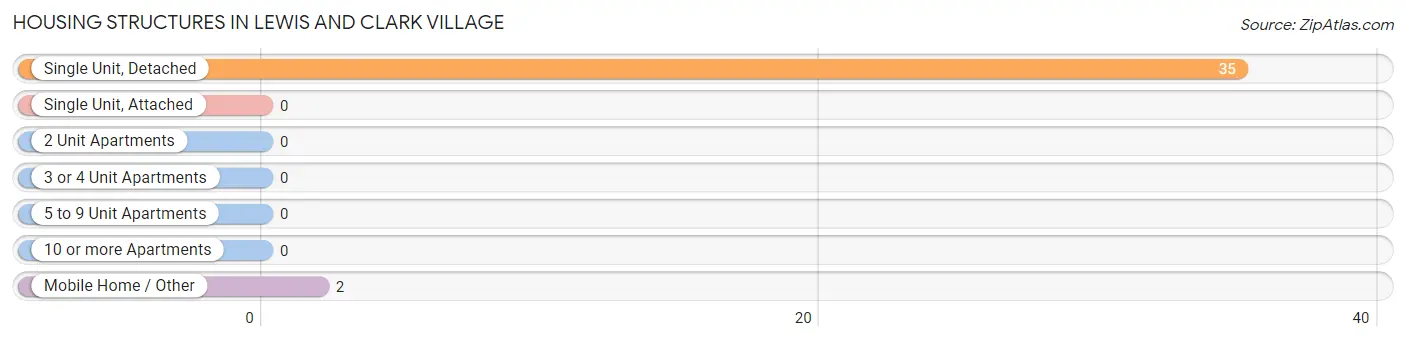
| Structure Type | # Housing Units | % Housing Units |
| Single Unit, Detached | 35 | 94.6% |
| Single Unit, Attached | 0 | 0.0% |
| 2 Unit Apartments | 0 | 0.0% |
| 3 or 4 Unit Apartments | 0 | 0.0% |
| 5 to 9 Unit Apartments | 0 | 0.0% |
| 10 or more Apartments | 0 | 0.0% |
| Mobile Home / Other | 2 | 5.4% |
| Total | 37 | 100.0% |
Housing Structures by Occupancy in Lewis and Clark Village
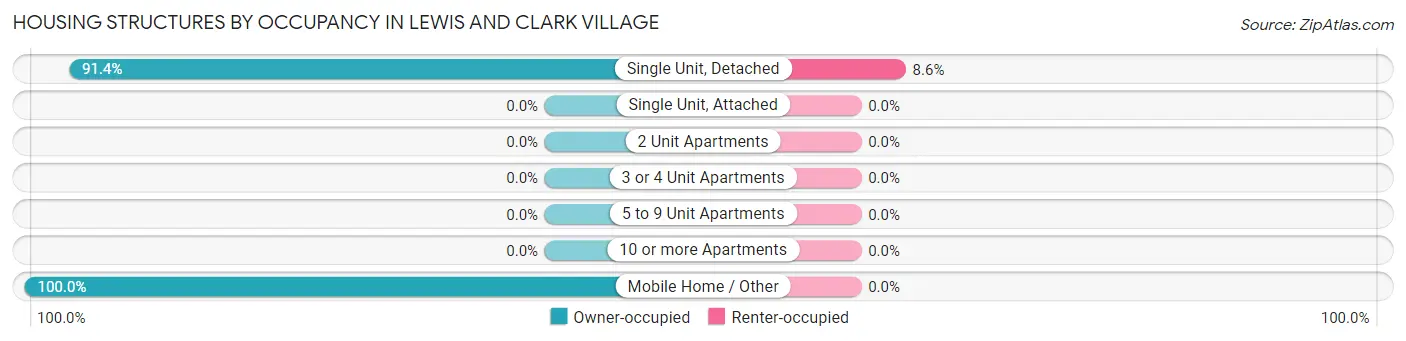
| Structure Type | Owner-occupied | Renter-occupied |
| Single Unit, Detached | 32 (91.4%) | 3 (8.6%) |
| Single Unit, Attached | 0 (0.0%) | 0 (0.0%) |
| 2 Unit Apartments | 0 (0.0%) | 0 (0.0%) |
| 3 or 4 Unit Apartments | 0 (0.0%) | 0 (0.0%) |
| 5 to 9 Unit Apartments | 0 (0.0%) | 0 (0.0%) |
| 10 or more Apartments | 0 (0.0%) | 0 (0.0%) |
| Mobile Home / Other | 2 (100.0%) | 0 (0.0%) |
| Total | 34 (91.9%) | 3 (8.1%) |
Housing Structures by Number of Rooms in Lewis and Clark Village
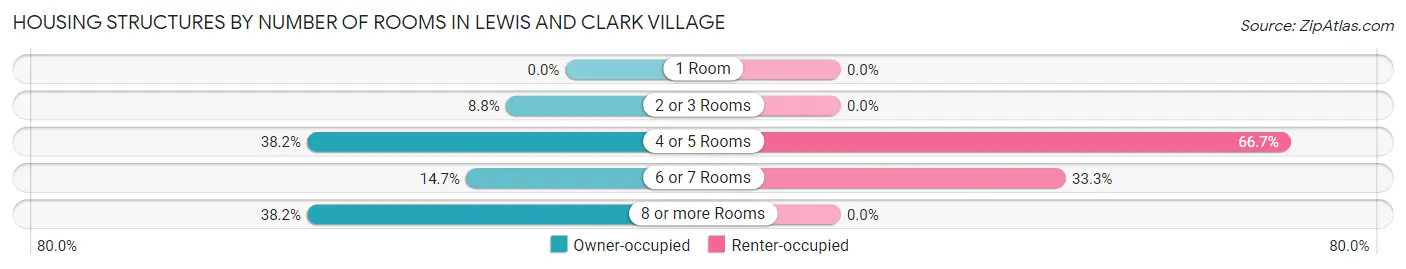
| Number of Rooms | Owner-occupied | Renter-occupied |
| 1 Room | 0 (0.0%) | 0 (0.0%) |
| 2 or 3 Rooms | 3 (8.8%) | 0 (0.0%) |
| 4 or 5 Rooms | 13 (38.2%) | 2 (66.7%) |
| 6 or 7 Rooms | 5 (14.7%) | 1 (33.3%) |
| 8 or more Rooms | 13 (38.2%) | 0 (0.0%) |
| Total | 34 (100.0%) | 3 (100.0%) |
Housing Structure by Heating Type in Lewis and Clark Village
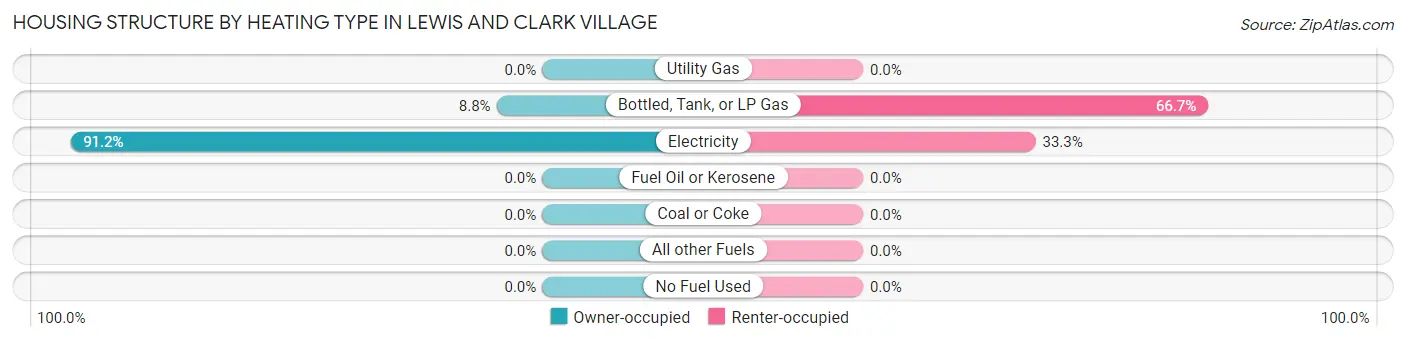
| Heating Type | Owner-occupied | Renter-occupied |
| Utility Gas | 0 (0.0%) | 0 (0.0%) |
| Bottled, Tank, or LP Gas | 3 (8.8%) | 2 (66.7%) |
| Electricity | 31 (91.2%) | 1 (33.3%) |
| Fuel Oil or Kerosene | 0 (0.0%) | 0 (0.0%) |
| Coal or Coke | 0 (0.0%) | 0 (0.0%) |
| All other Fuels | 0 (0.0%) | 0 (0.0%) |
| No Fuel Used | 0 (0.0%) | 0 (0.0%) |
| Total | 34 (100.0%) | 3 (100.0%) |
Household Vehicle Usage in Lewis and Clark Village
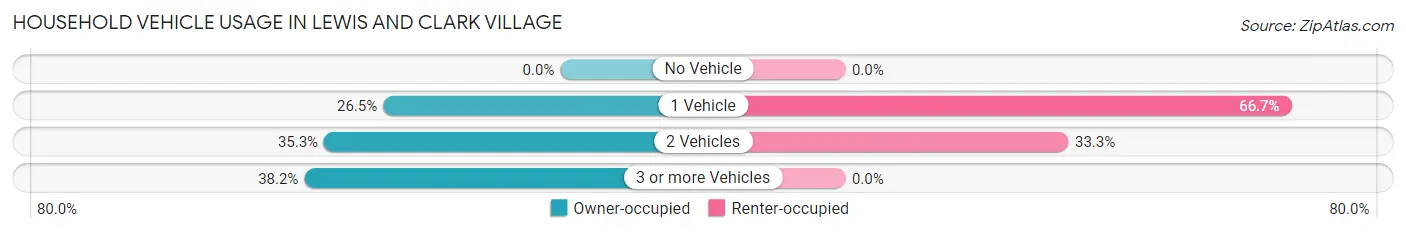
| Vehicles per Household | Owner-occupied | Renter-occupied |
| No Vehicle | 0 (0.0%) | 0 (0.0%) |
| 1 Vehicle | 9 (26.5%) | 2 (66.7%) |
| 2 Vehicles | 12 (35.3%) | 1 (33.3%) |
| 3 or more Vehicles | 13 (38.2%) | 0 (0.0%) |
| Total | 34 (100.0%) | 3 (100.0%) |
Real Estate & Mortgages in Lewis and Clark Village
Real Estate and Mortgage Overview in Lewis and Clark Village
| Characteristic | Without Mortgage | With Mortgage |
| Housing Units | 21 | 13 |
| Median Property Value | $117,500 | $140,600 |
| Median Household Income | - | - |
| Monthly Housing Costs | $517 | $0 |
| Real Estate Taxes | $957 | $0 |
Property Value by Mortgage Status in Lewis and Clark Village
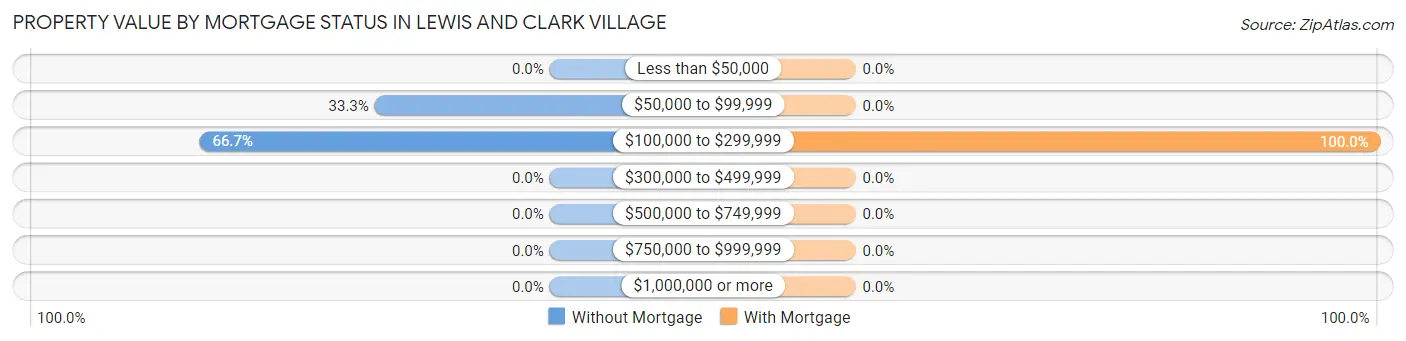
| Property Value | Without Mortgage | With Mortgage |
| Less than $50,000 | 0 (0.0%) | 0 (0.0%) |
| $50,000 to $99,999 | 7 (33.3%) | 0 (0.0%) |
| $100,000 to $299,999 | 14 (66.7%) | 13 (100.0%) |
| $300,000 to $499,999 | 0 (0.0%) | 0 (0.0%) |
| $500,000 to $749,999 | 0 (0.0%) | 0 (0.0%) |
| $750,000 to $999,999 | 0 (0.0%) | 0 (0.0%) |
| $1,000,000 or more | 0 (0.0%) | 0 (0.0%) |
| Total | 21 (100.0%) | 13 (100.0%) |
Household Income by Mortgage Status in Lewis and Clark Village
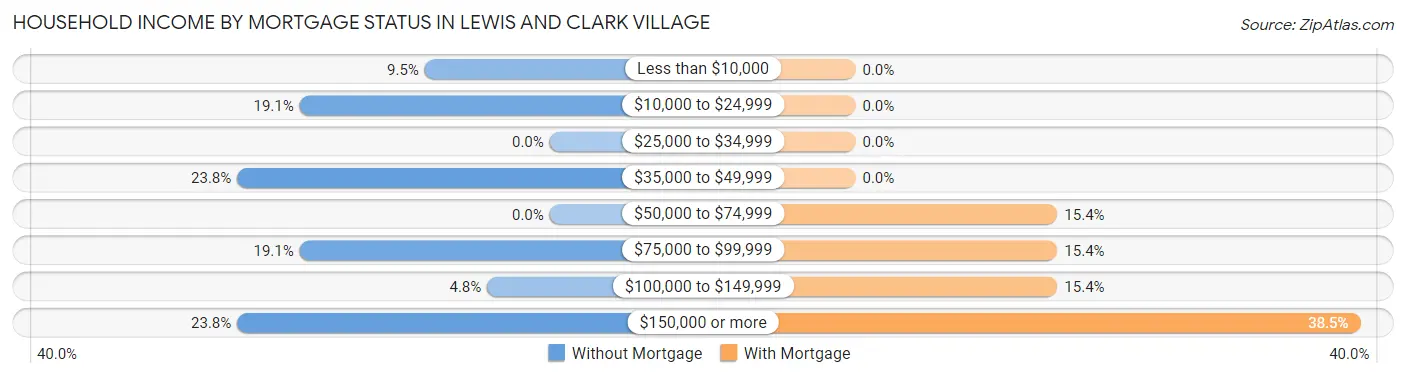
| Household Income | Without Mortgage | With Mortgage |
| Less than $10,000 | 2 (9.5%) | 0 (0.0%) |
| $10,000 to $24,999 | 4 (19.1%) | 0 (0.0%) |
| $25,000 to $34,999 | 0 (0.0%) | 0 (0.0%) |
| $35,000 to $49,999 | 5 (23.8%) | 0 (0.0%) |
| $50,000 to $74,999 | 0 (0.0%) | 2 (15.4%) |
| $75,000 to $99,999 | 4 (19.1%) | 2 (15.4%) |
| $100,000 to $149,999 | 1 (4.8%) | 2 (15.4%) |
| $150,000 or more | 5 (23.8%) | 5 (38.5%) |
| Total | 21 (100.0%) | 13 (100.0%) |
Property Value to Household Income Ratio in Lewis and Clark Village
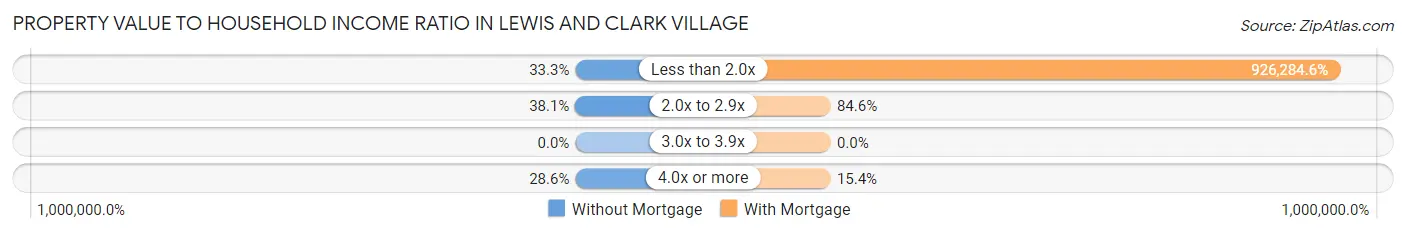
| Value-to-Income Ratio | Without Mortgage | With Mortgage |
| Less than 2.0x | 7 (33.3%) | 120,417 (926,284.6%) |
| 2.0x to 2.9x | 8 (38.1%) | 11 (84.6%) |
| 3.0x to 3.9x | 0 (0.0%) | 0 (0.0%) |
| 4.0x or more | 6 (28.6%) | 2 (15.4%) |
| Total | 21 (100.0%) | 13 (100.0%) |
Real Estate Taxes by Mortgage Status in Lewis and Clark Village
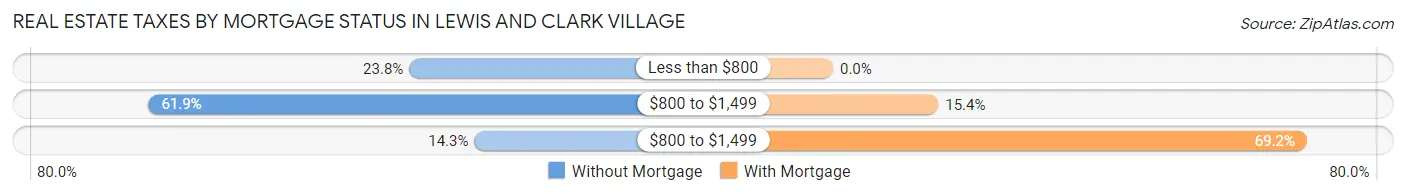
| Property Taxes | Without Mortgage | With Mortgage |
| Less than $800 | 5 (23.8%) | 0 (0.0%) |
| $800 to $1,499 | 13 (61.9%) | 2 (15.4%) |
| $800 to $1,499 | 3 (14.3%) | 9 (69.2%) |
| Total | 21 (100.0%) | 13 (100.0%) |
Health & Disability in Lewis and Clark Village
Health Insurance Coverage by Age in Lewis and Clark Village
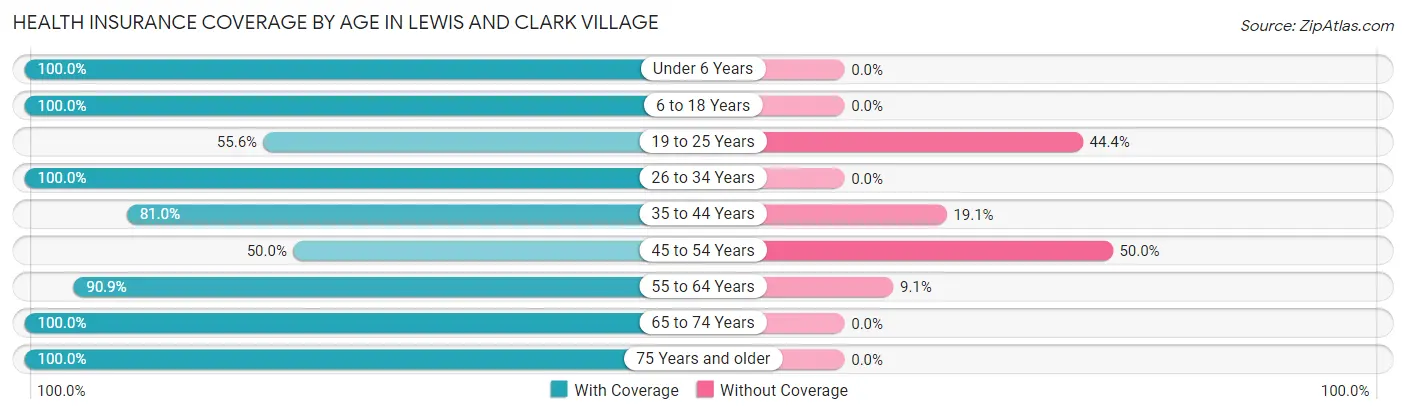
| Age Bracket | With Coverage | Without Coverage |
| Under 6 Years | 10 (100.0%) | 0 (0.0%) |
| 6 to 18 Years | 22 (100.0%) | 0 (0.0%) |
| 19 to 25 Years | 5 (55.6%) | 4 (44.4%) |
| 26 to 34 Years | 6 (100.0%) | 0 (0.0%) |
| 35 to 44 Years | 17 (80.9%) | 4 (19.1%) |
| 45 to 54 Years | 5 (50.0%) | 5 (50.0%) |
| 55 to 64 Years | 10 (90.9%) | 1 (9.1%) |
| 65 to 74 Years | 7 (100.0%) | 0 (0.0%) |
| 75 Years and older | 6 (100.0%) | 0 (0.0%) |
| Total | 88 (86.3%) | 14 (13.7%) |
Health Insurance Coverage by Citizenship Status in Lewis and Clark Village
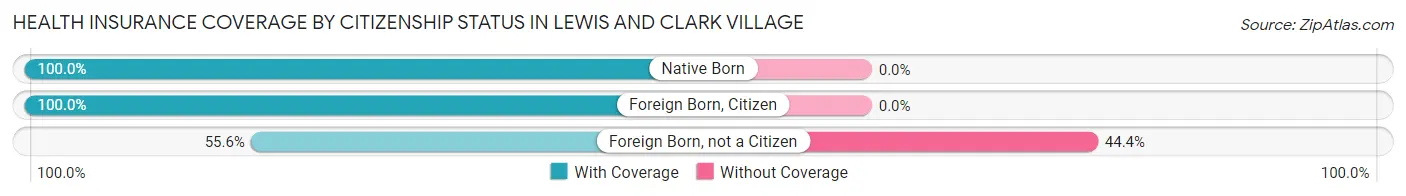
| Citizenship Status | With Coverage | Without Coverage |
| Native Born | 10 (100.0%) | 0 (0.0%) |
| Foreign Born, Citizen | 22 (100.0%) | 0 (0.0%) |
| Foreign Born, not a Citizen | 5 (55.6%) | 4 (44.4%) |
Health Insurance Coverage by Household Income in Lewis and Clark Village
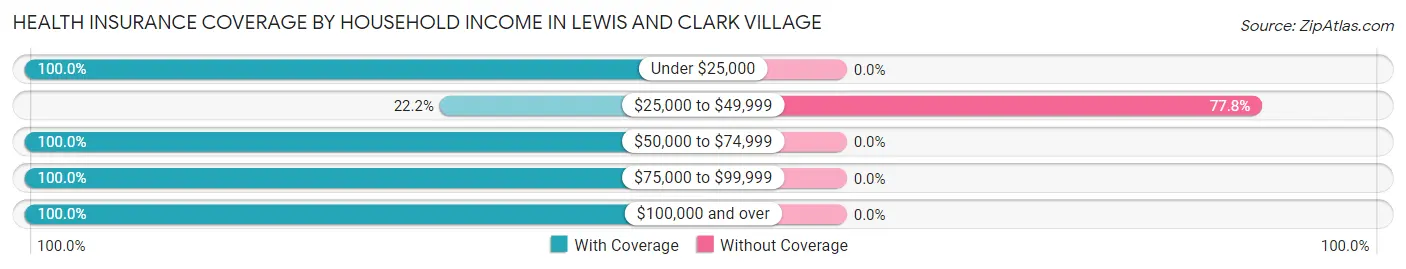
| Household Income | With Coverage | Without Coverage |
| Under $25,000 | 15 (100.0%) | 0 (0.0%) |
| $25,000 to $49,999 | 4 (22.2%) | 14 (77.8%) |
| $50,000 to $74,999 | 11 (100.0%) | 0 (0.0%) |
| $75,000 to $99,999 | 27 (100.0%) | 0 (0.0%) |
| $100,000 and over | 31 (100.0%) | 0 (0.0%) |
Public vs Private Health Insurance Coverage by Age in Lewis and Clark Village
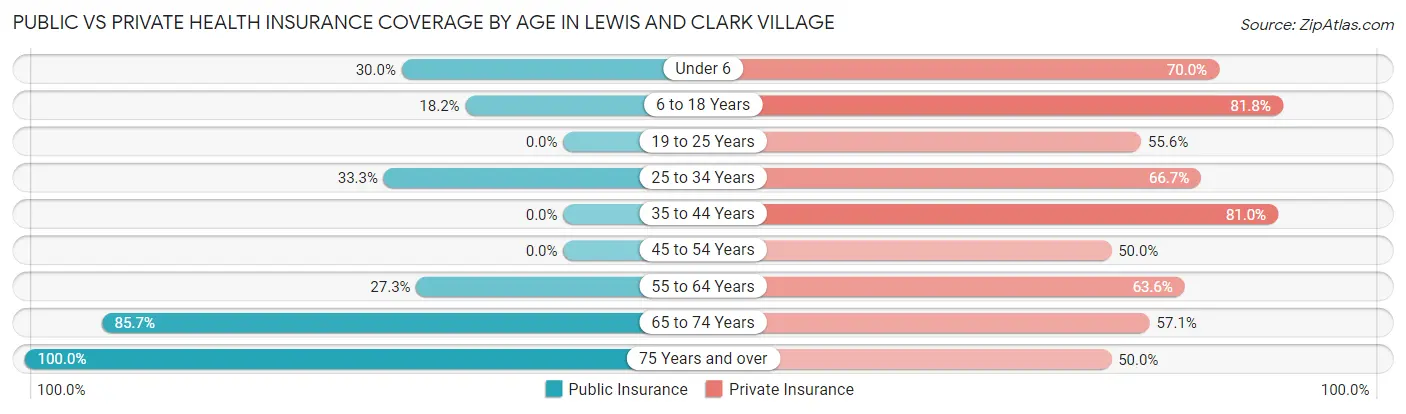
| Age Bracket | Public Insurance | Private Insurance |
| Under 6 | 3 (30.0%) | 7 (70.0%) |
| 6 to 18 Years | 4 (18.2%) | 18 (81.8%) |
| 19 to 25 Years | 0 (0.0%) | 5 (55.6%) |
| 25 to 34 Years | 2 (33.3%) | 4 (66.7%) |
| 35 to 44 Years | 0 (0.0%) | 17 (80.9%) |
| 45 to 54 Years | 0 (0.0%) | 5 (50.0%) |
| 55 to 64 Years | 3 (27.3%) | 7 (63.6%) |
| 65 to 74 Years | 6 (85.7%) | 4 (57.1%) |
| 75 Years and over | 6 (100.0%) | 3 (50.0%) |
| Total | 24 (23.5%) | 70 (68.6%) |
Disability Status by Sex by Age in Lewis and Clark Village
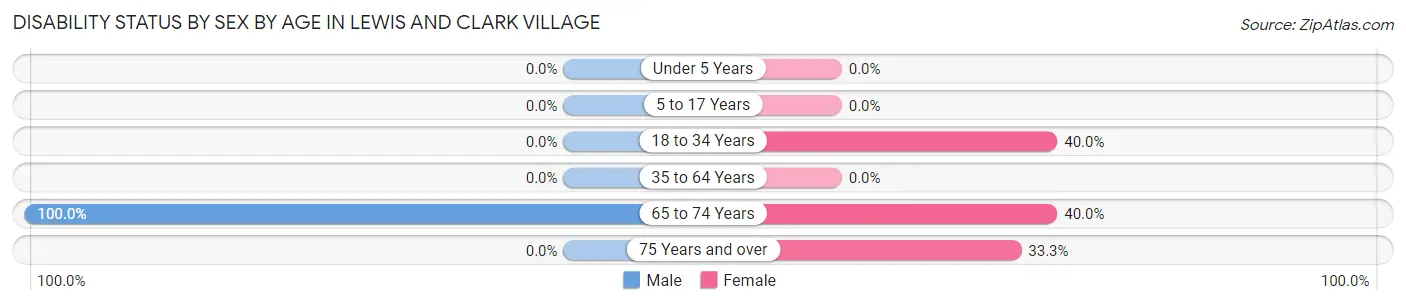
| Age Bracket | Male | Female |
| Under 5 Years | 0 (0.0%) | 0 (0.0%) |
| 5 to 17 Years | 0 (0.0%) | 0 (0.0%) |
| 18 to 34 Years | 0 (0.0%) | 4 (40.0%) |
| 35 to 64 Years | 0 (0.0%) | 0 (0.0%) |
| 65 to 74 Years | 2 (100.0%) | 2 (40.0%) |
| 75 Years and over | 0 (0.0%) | 2 (33.3%) |
Disability Class by Sex by Age in Lewis and Clark Village
Disability Class: Hearing Difficulty
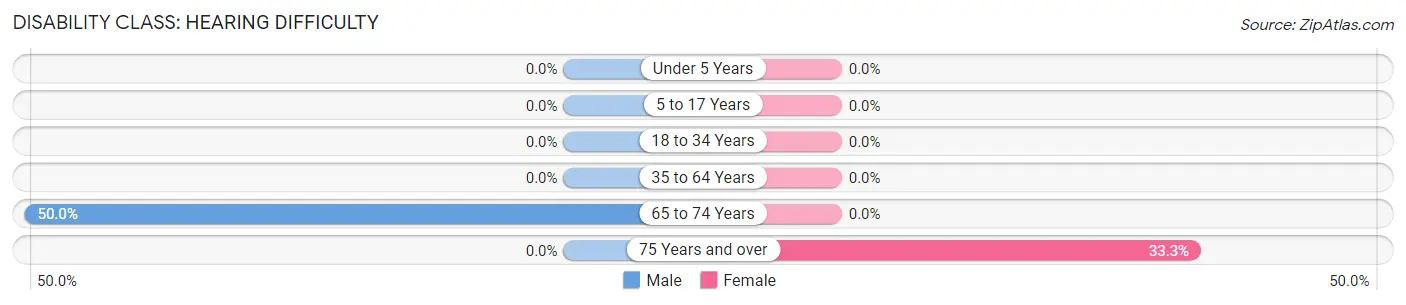
| Age Bracket | Male | Female |
| Under 5 Years | 0 (0.0%) | 0 (0.0%) |
| 5 to 17 Years | 0 (0.0%) | 0 (0.0%) |
| 18 to 34 Years | 0 (0.0%) | 0 (0.0%) |
| 35 to 64 Years | 0 (0.0%) | 0 (0.0%) |
| 65 to 74 Years | 1 (50.0%) | 0 (0.0%) |
| 75 Years and over | 0 (0.0%) | 2 (33.3%) |
Disability Class: Vision Difficulty
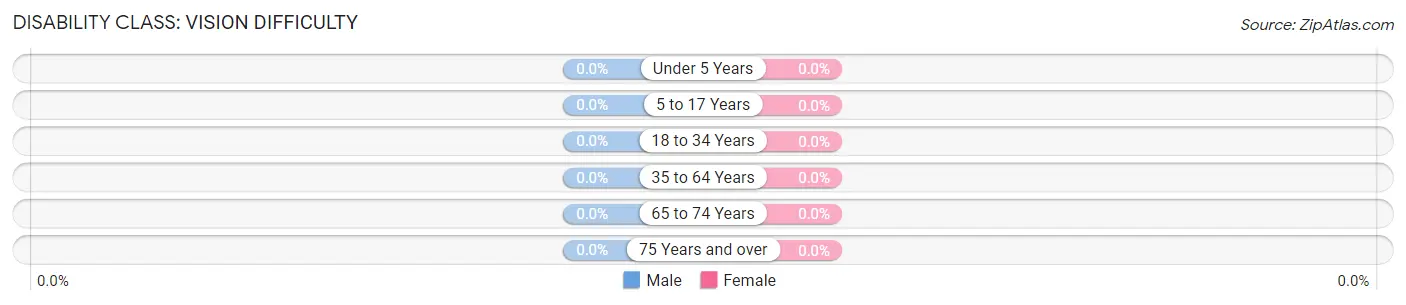
| Age Bracket | Male | Female |
| Under 5 Years | 0 (0.0%) | 0 (0.0%) |
| 5 to 17 Years | 0 (0.0%) | 0 (0.0%) |
| 18 to 34 Years | 0 (0.0%) | 0 (0.0%) |
| 35 to 64 Years | 0 (0.0%) | 0 (0.0%) |
| 65 to 74 Years | 0 (0.0%) | 0 (0.0%) |
| 75 Years and over | 0 (0.0%) | 0 (0.0%) |
Disability Class: Cognitive Difficulty
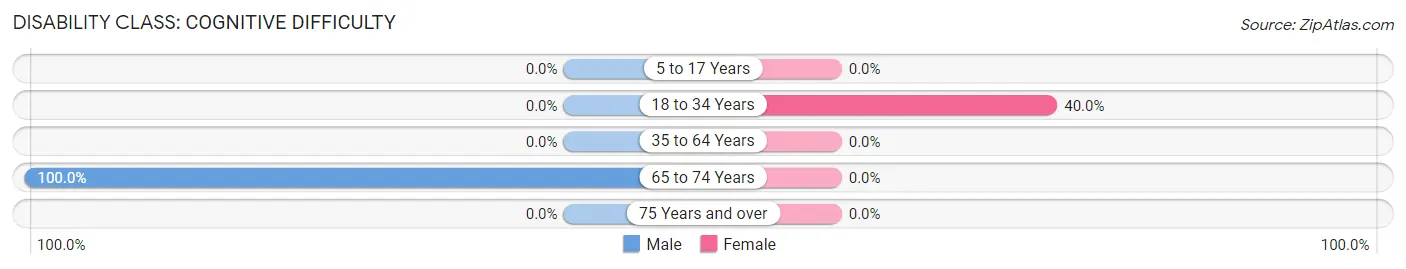
| Age Bracket | Male | Female |
| 5 to 17 Years | 0 (0.0%) | 0 (0.0%) |
| 18 to 34 Years | 0 (0.0%) | 4 (40.0%) |
| 35 to 64 Years | 0 (0.0%) | 0 (0.0%) |
| 65 to 74 Years | 2 (100.0%) | 0 (0.0%) |
| 75 Years and over | 0 (0.0%) | 0 (0.0%) |
Disability Class: Ambulatory Difficulty
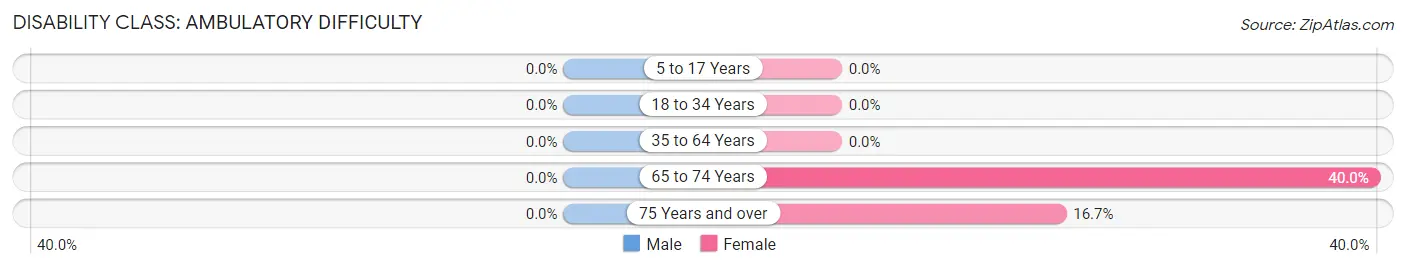
| Age Bracket | Male | Female |
| 5 to 17 Years | 0 (0.0%) | 0 (0.0%) |
| 18 to 34 Years | 0 (0.0%) | 0 (0.0%) |
| 35 to 64 Years | 0 (0.0%) | 0 (0.0%) |
| 65 to 74 Years | 0 (0.0%) | 2 (40.0%) |
| 75 Years and over | 0 (0.0%) | 1 (16.7%) |
Disability Class: Self-Care Difficulty
| Age Bracket | Male | Female |
| 5 to 17 Years | 0 (0.0%) | 0 (0.0%) |
| 18 to 34 Years | 0 (0.0%) | 0 (0.0%) |
| 35 to 64 Years | 0 (0.0%) | 0 (0.0%) |
| 65 to 74 Years | 0 (0.0%) | 0 (0.0%) |
| 75 Years and over | 0 (0.0%) | 0 (0.0%) |
Technology Access in Lewis and Clark Village
Computing Device Access in Lewis and Clark Village
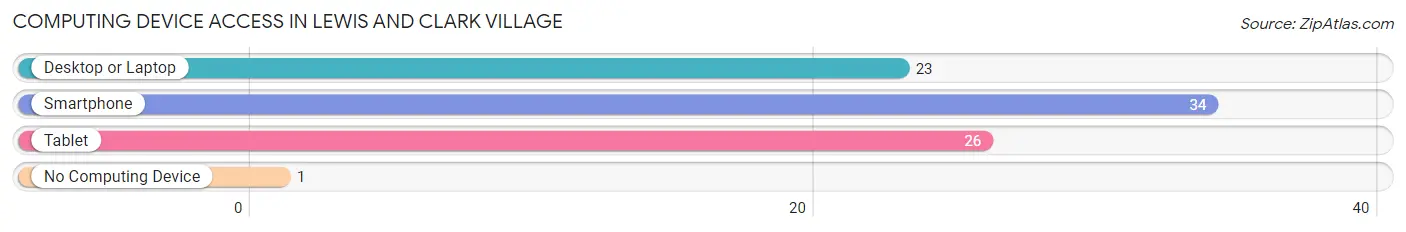
| Device Type | # Households | % Households |
| Desktop or Laptop | 23 | 62.2% |
| Smartphone | 34 | 91.9% |
| Tablet | 26 | 70.3% |
| No Computing Device | 1 | 2.7% |
| Total | 37 | 100.0% |
Internet Access in Lewis and Clark Village
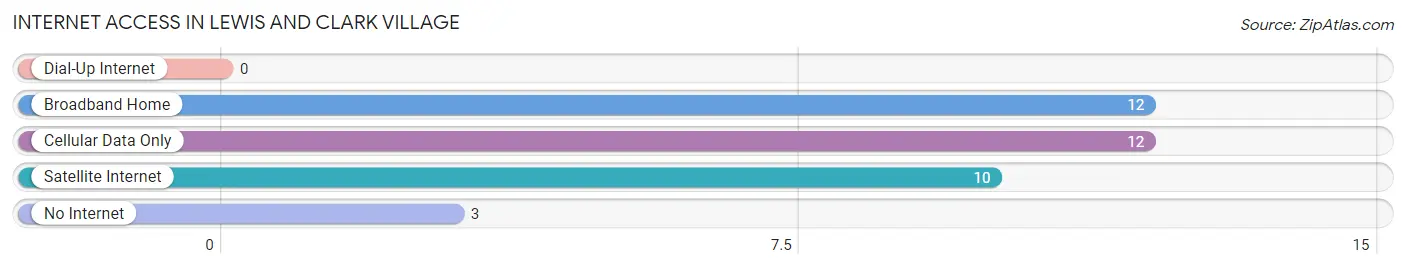
| Internet Type | # Households | % Households |
| Dial-Up Internet | 0 | 0.0% |
| Broadband Home | 12 | 32.4% |
| Cellular Data Only | 12 | 32.4% |
| Satellite Internet | 10 | 27.0% |
| No Internet | 3 | 8.1% |
| Total | 37 | 100.0% |
Lewis and Clark Village Summary
Lewis and Clark Village is a small village located in St. Charles County, Missouri. It is situated on the banks of the Missouri River, just north of St. Louis. The village was named after the famous explorers, Meriwether Lewis and William Clark, who explored the area in 1804.
History
The area that is now Lewis and Clark Village was first settled in the early 1800s by French and German immigrants. The village was originally known as “L’Eau Claire”, which means “clear water” in French. The village was officially incorporated in 1837 and was renamed Lewis and Clark Village in 1845.
The village was a popular stop for travelers on the Missouri River, as it was the closest settlement to St. Louis. The village was also a popular destination for steamboat passengers, who would often stop to take in the scenery and enjoy the hospitality of the locals.
In the late 1800s, the village began to experience a period of growth and prosperity. The village was home to several businesses, including a general store, a blacksmith, a hotel, and a post office. The village also had a school, a church, and a library.
The village experienced a decline in the early 1900s, as the steamboat industry began to decline and the population began to move away. The village was eventually annexed by St. Charles County in the 1950s.
Geography
Lewis and Clark Village is located in St. Charles County, Missouri. It is situated on the banks of the Missouri River, just north of St. Louis. The village is located in a rural area, surrounded by farmland and wooded areas.
The village is located at an elevation of approximately 500 feet above sea level. The climate in the area is humid continental, with hot summers and cold winters. The average annual temperature is around 50 degrees Fahrenheit.
Economy
The economy of Lewis and Clark Village is largely based on agriculture and tourism. The village is home to several farms, which produce a variety of crops, including corn, soybeans, and wheat. The village also has several wineries, which produce a variety of wines.
The village is also a popular tourist destination, as it is located close to St. Louis and the Missouri River. The village is home to several historic sites, including the Lewis and Clark Monument and the Lewis and Clark Trail. The village also has several restaurants, shops, and other attractions.
Demographics
As of the 2010 census, the population of Lewis and Clark Village was 1,845. The population is predominantly white, with a small percentage of African Americans and Hispanics. The median household income in the village is $50,000, and the median home value is $150,000.
The village is served by the St. Charles County Public Schools system. The village is also home to several churches, including the First Baptist Church of Lewis and Clark Village.
Conclusion
Lewis and Clark Village is a small village located in St. Charles County, Missouri. It is situated on the banks of the Missouri River, just north of St. Louis. The village was named after the famous explorers, Meriwether Lewis and William Clark, who explored the area in 1804. The village has a long history of settlement and growth, and today it is a popular tourist destination and home to several farms and wineries. The population of the village is predominantly white, with a small percentage of African Americans and Hispanics. The village is served by the St. Charles County Public Schools system and is home to several churches.
Common Questions
What is Per Capita Income in Lewis and Clark Village?
Per Capita income in Lewis and Clark Village is $29,487.
What is the Median Family Income in Lewis and Clark Village?
Median Family Income in Lewis and Clark Village is $95,417.
What is the Median Household income in Lewis and Clark Village?
Median Household Income in Lewis and Clark Village is $78,125.
What is Inequality or Gini Index in Lewis and Clark Village?
Inequality or Gini Index in Lewis and Clark Village is 0.40.
What is the Total Population of Lewis and Clark Village?
Total Population of Lewis and Clark Village is 102.
What is the Total Male Population of Lewis and Clark Village?
Total Male Population of Lewis and Clark Village is 44.
What is the Total Female Population of Lewis and Clark Village?
Total Female Population of Lewis and Clark Village is 58.
What is the Ratio of Males per 100 Females in Lewis and Clark Village?
There are 75.86 Males per 100 Females in Lewis and Clark Village.
What is the Ratio of Females per 100 Males in Lewis and Clark Village?
There are 131.82 Females per 100 Males in Lewis and Clark Village.
What is the Median Population Age in Lewis and Clark Village?
Median Population Age in Lewis and Clark Village is 35.8 Years.
What is the Average Family Size in Lewis and Clark Village
Average Family Size in Lewis and Clark Village is 3.1 People.
What is the Average Household Size in Lewis and Clark Village
Average Household Size in Lewis and Clark Village is 2.8 People.
How Large is the Labor Force in Lewis and Clark Village?
There are 56 People in the Labor Forcein in Lewis and Clark Village.
What is the Percentage of People in the Labor Force in Lewis and Clark Village?
75.7% of People are in the Labor Force in Lewis and Clark Village.
What is the Unemployment Rate in Lewis and Clark Village?
Unemployment Rate in Lewis and Clark Village is 3.6%.