Lexington, MO Map & Demographics
Lexington Map
Lexington Overview
$31,351
PER CAPITA INCOME
$95,869
AVG FAMILY INCOME
$69,815
AVG HOUSEHOLD INCOME
7.1%
WAGE / INCOME GAP [ % ]
92.9¢/ $1
WAGE / INCOME GAP [ $ ]
0.38
INEQUALITY / GINI INDEX
4,592
TOTAL POPULATION
2,429
MALE POPULATION
2,163
FEMALE POPULATION
112.30
MALES / 100 FEMALES
89.05
FEMALES / 100 MALES
34.5
MEDIAN AGE
3.4
AVG FAMILY SIZE
2.6
AVG HOUSEHOLD SIZE
2,269
LABOR FORCE [ PEOPLE ]
64.3%
PERCENT IN LABOR FORCE
4.3%
UNEMPLOYMENT RATE
Lexington Zip Codes
Lexington Area Codes
Income in Lexington
Income Overview in Lexington
Per Capita Income in Lexington is $31,351, while median incomes of families and households are $95,869 and $69,815 respectively.
| Characteristic | Number | Measure |
| Per Capita Income | 4,592 | $31,351 |
| Median Family Income | 957 | $95,869 |
| Mean Family Income | 957 | $90,459 |
| Median Household Income | 1,713 | $69,815 |
| Mean Household Income | 1,713 | $79,128 |
| Income Deficit | 957 | $0 |
| Wage / Income Gap (%) | 4,592 | 7.06% |
| Wage / Income Gap ($) | 4,592 | 92.94¢ per $1 |
| Gini / Inequality Index | 4,592 | 0.38 |
Earnings by Sex in Lexington
Average Earnings in Lexington are $39,700, $39,034 for men and $42,000 for women, a difference of 7.1%.
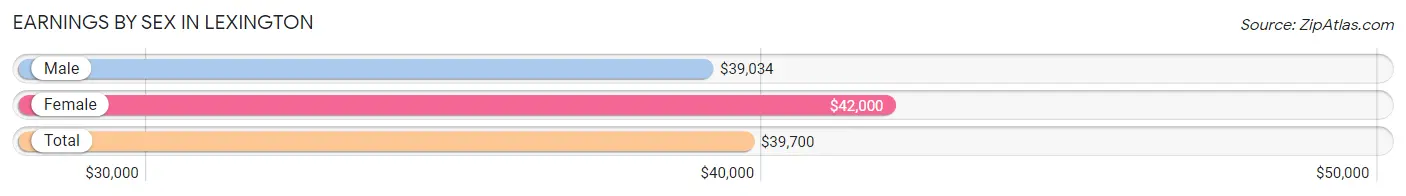
| Sex | Number | Average Earnings |
| Male | 1,437 (58.0%) | $39,034 |
| Female | 1,040 (42.0%) | $42,000 |
| Total | 2,477 (100.0%) | $39,700 |
Earnings by Sex by Income Bracket in Lexington
The most common earnings brackets in Lexington are $35,000 to $39,999 for men (258 | 17.9%) and $50,000 to $54,999 for women (225 | 21.6%).
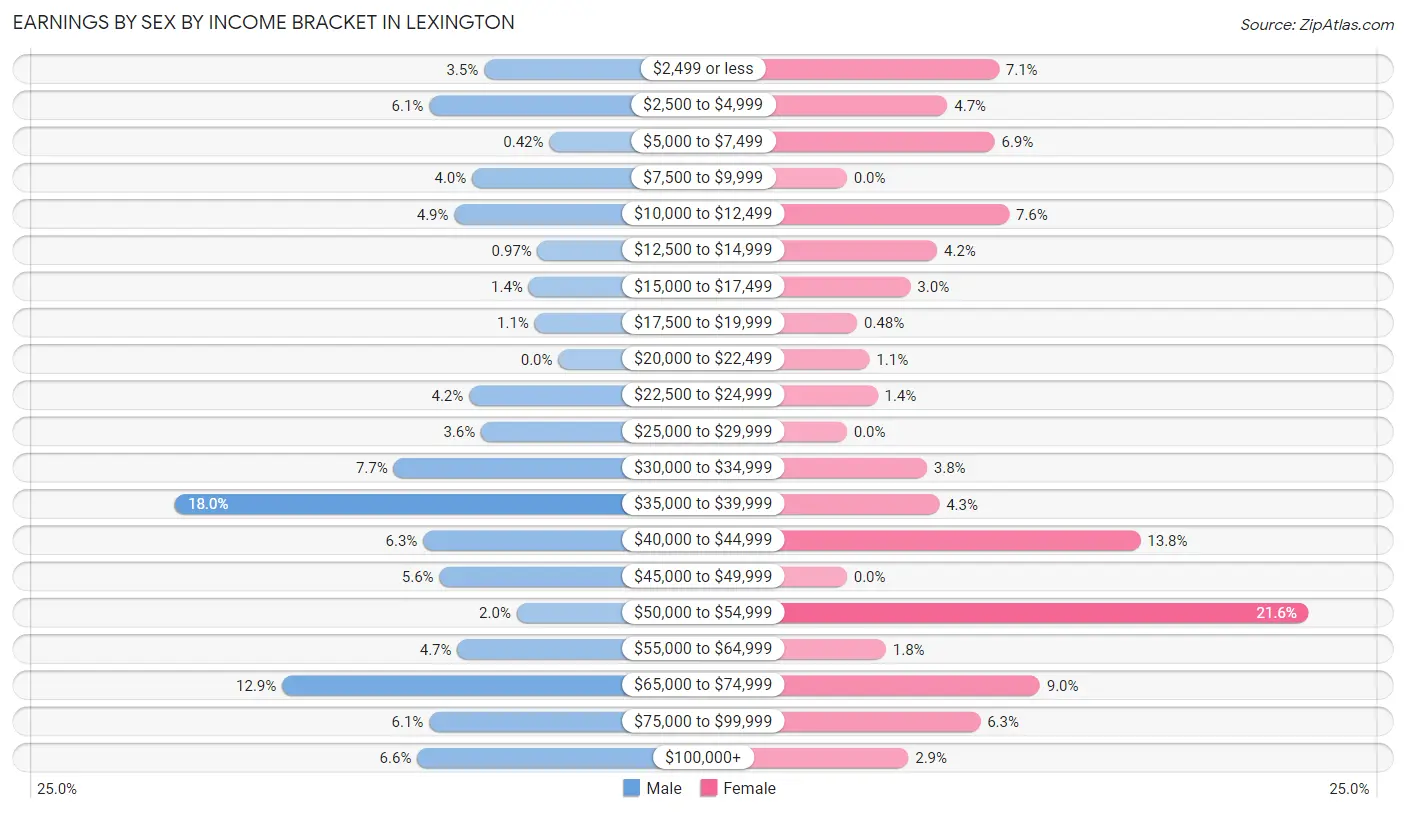
| Income | Male | Female |
| $2,499 or less | 50 (3.5%) | 74 (7.1%) |
| $2,500 to $4,999 | 87 (6.0%) | 49 (4.7%) |
| $5,000 to $7,499 | 6 (0.4%) | 72 (6.9%) |
| $7,500 to $9,999 | 58 (4.0%) | 0 (0.0%) |
| $10,000 to $12,499 | 70 (4.9%) | 79 (7.6%) |
| $12,500 to $14,999 | 14 (1.0%) | 44 (4.2%) |
| $15,000 to $17,499 | 20 (1.4%) | 31 (3.0%) |
| $17,500 to $19,999 | 16 (1.1%) | 5 (0.5%) |
| $20,000 to $22,499 | 0 (0.0%) | 11 (1.1%) |
| $22,500 to $24,999 | 60 (4.2%) | 15 (1.4%) |
| $25,000 to $29,999 | 52 (3.6%) | 0 (0.0%) |
| $30,000 to $34,999 | 111 (7.7%) | 39 (3.7%) |
| $35,000 to $39,999 | 258 (17.9%) | 45 (4.3%) |
| $40,000 to $44,999 | 91 (6.3%) | 143 (13.8%) |
| $45,000 to $49,999 | 80 (5.6%) | 0 (0.0%) |
| $50,000 to $54,999 | 28 (1.9%) | 225 (21.6%) |
| $55,000 to $64,999 | 68 (4.7%) | 19 (1.8%) |
| $65,000 to $74,999 | 186 (12.9%) | 94 (9.0%) |
| $75,000 to $99,999 | 87 (6.0%) | 65 (6.2%) |
| $100,000+ | 95 (6.6%) | 30 (2.9%) |
| Total | 1,437 (100.0%) | 1,040 (100.0%) |
Earnings by Sex by Educational Attainment in Lexington
Average earnings in Lexington are $40,813 for men and $44,384 for women, a difference of 8.1%. Men with an educational attainment of college or associate's degree enjoy the highest average annual earnings of $49,542, while those with graduate degree education earn the least with $40,508. Women with an educational attainment of bachelor's degree earn the most with the average annual earnings of $53,830, while those with graduate degree education have the smallest earnings of $50,469.
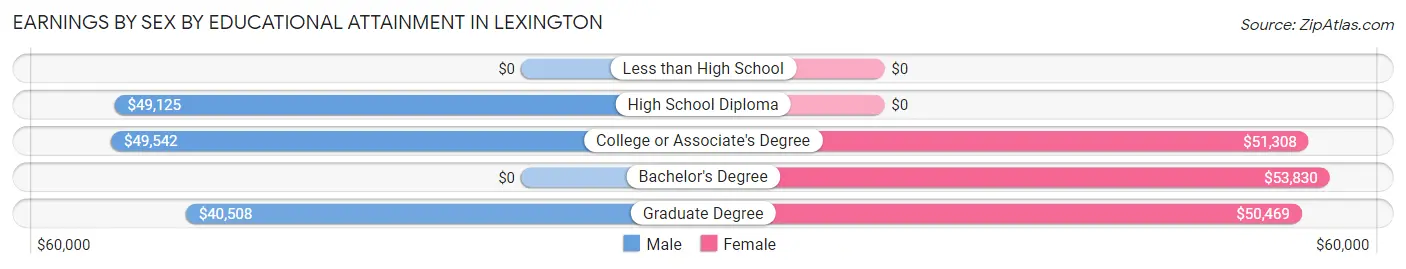
| Educational Attainment | Male Income | Female Income |
| Less than High School | - | - |
| High School Diploma | $49,125 | $0 |
| College or Associate's Degree | $49,542 | $51,308 |
| Bachelor's Degree | - | - |
| Graduate Degree | $40,508 | $50,469 |
| Total | $40,813 | $44,384 |
Family Income in Lexington
Family Income Brackets in Lexington
According to the Lexington family income data, there are 223 families falling into the $75,000 to $99,999 income range, which is the most common income bracket and makes up 23.3% of all families.
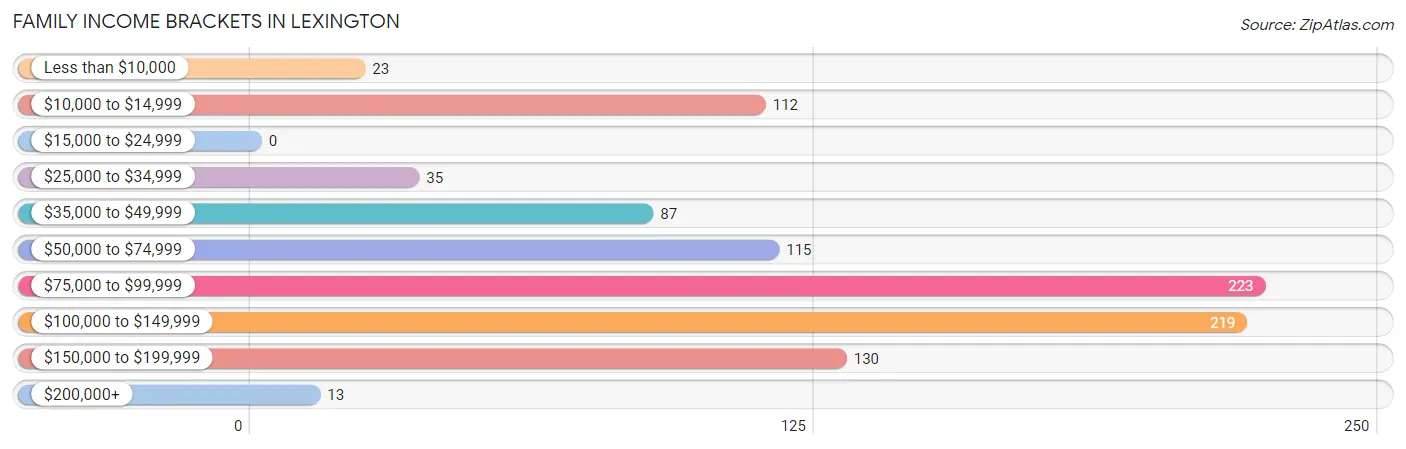
| Income Bracket | # Families | % Families |
| Less than $10,000 | 23 | 2.4% |
| $10,000 to $14,999 | 112 | 11.7% |
| $15,000 to $24,999 | 0 | 0.0% |
| $25,000 to $34,999 | 35 | 3.7% |
| $35,000 to $49,999 | 87 | 9.1% |
| $50,000 to $74,999 | 115 | 12.0% |
| $75,000 to $99,999 | 223 | 23.3% |
| $100,000 to $149,999 | 219 | 22.9% |
| $150,000 to $199,999 | 130 | 13.6% |
| $200,000+ | 13 | 1.4% |
Family Income by Famaliy Size in Lexington
4-person families (138 | 14.4%) account for the highest median family income in Lexington with $99,423 per family, while 2-person families (423 | 44.2%) have the highest median income of $44,943 per family member.
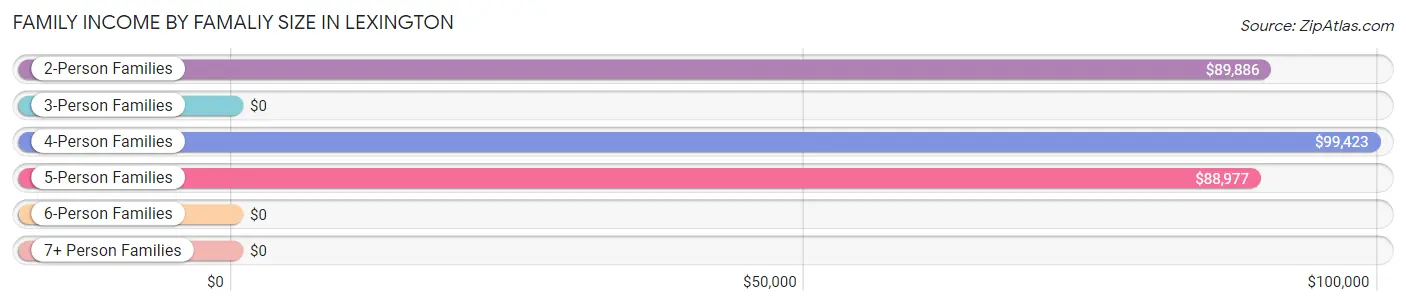
| Income Bracket | # Families | Median Income |
| 2-Person Families | 423 (44.2%) | $89,886 |
| 3-Person Families | 189 (19.8%) | $0 |
| 4-Person Families | 138 (14.4%) | $99,423 |
| 5-Person Families | 127 (13.3%) | $88,977 |
| 6-Person Families | 57 (6.0%) | $0 |
| 7+ Person Families | 23 (2.4%) | $0 |
| Total | 957 (100.0%) | $95,869 |
Family Income by Number of Earners in Lexington
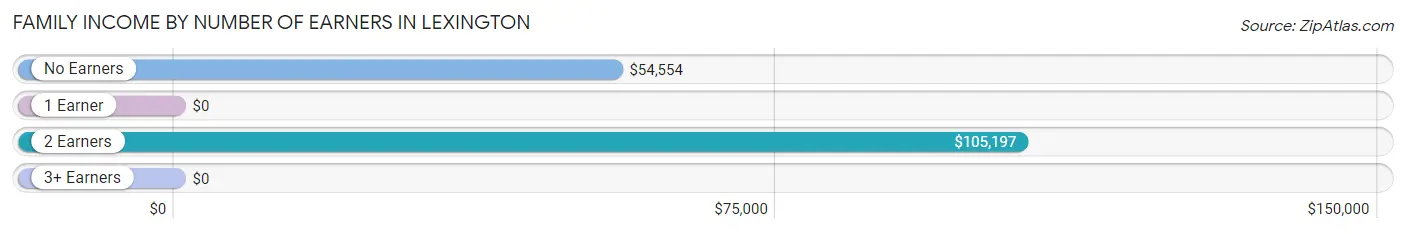
| Number of Earners | # Families | Median Income |
| No Earners | 144 (15.0%) | $54,554 |
| 1 Earner | 215 (22.5%) | $0 |
| 2 Earners | 443 (46.3%) | $105,197 |
| 3+ Earners | 155 (16.2%) | $0 |
| Total | 957 (100.0%) | $95,869 |
Household Income in Lexington
Household Income Brackets in Lexington
With 360 households falling in the category, the $100,000 to $149,999 income range is the most frequent in Lexington, accounting for 21.0% of all households. In contrast, only 38 households (2.2%) fall into the $200,000+ income bracket, making it the least populous group.
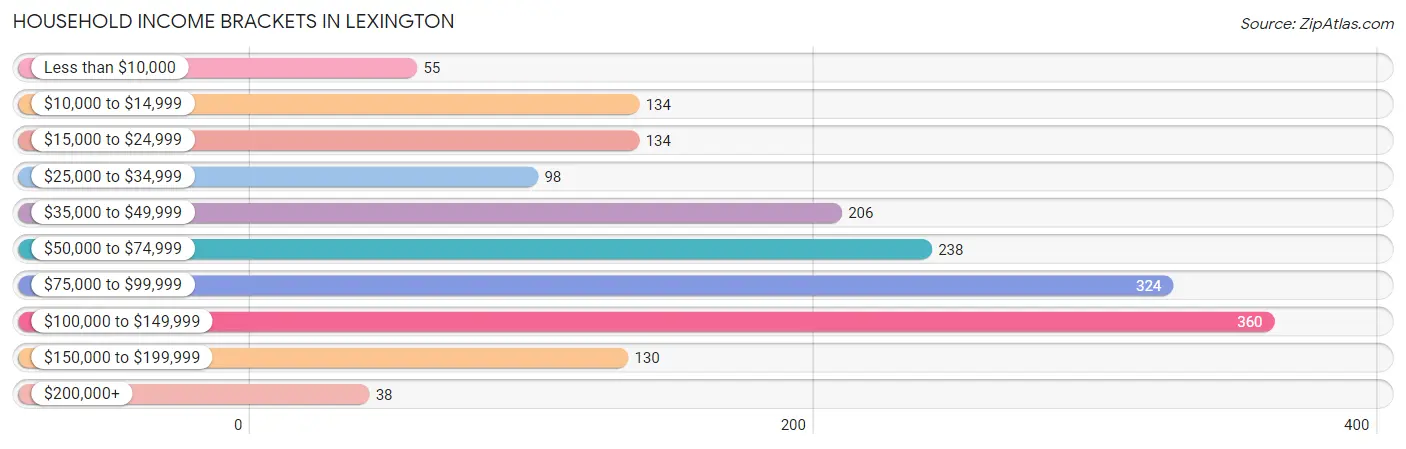
| Income Bracket | # Households | % Households |
| Less than $10,000 | 55 | 3.2% |
| $10,000 to $14,999 | 134 | 7.8% |
| $15,000 to $24,999 | 134 | 7.8% |
| $25,000 to $34,999 | 98 | 5.7% |
| $35,000 to $49,999 | 206 | 12.0% |
| $50,000 to $74,999 | 238 | 13.9% |
| $75,000 to $99,999 | 324 | 18.9% |
| $100,000 to $149,999 | 360 | 21.0% |
| $150,000 to $199,999 | 130 | 7.6% |
| $200,000+ | 38 | 2.2% |
Household Income by Householder Age in Lexington
The median household income in Lexington is $69,815, with the highest median household income of $98,349 found in the 45 to 64 years age bracket for the primary householder. A total of 507 households (29.6%) fall into this category. Meanwhile, the 15 to 24 years age bracket for the primary householder has the lowest median household income of $0, with 20 households (1.2%) in this group.
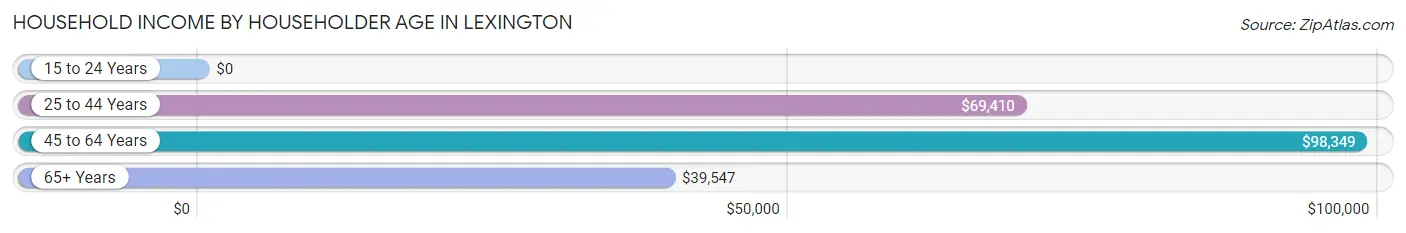
| Income Bracket | # Households | Median Income |
| 15 to 24 Years | 20 (1.2%) | $0 |
| 25 to 44 Years | 745 (43.5%) | $69,410 |
| 45 to 64 Years | 507 (29.6%) | $98,349 |
| 65+ Years | 441 (25.7%) | $39,547 |
| Total | 1,713 (100.0%) | $69,815 |
Poverty in Lexington
Income Below Poverty by Sex and Age in Lexington
With 11.6% poverty level for males and 19.8% for females among the residents of Lexington, under 5 year old males and 12 to 14 year old females are the most vulnerable to poverty, with 108 males (67.1%) and 39 females (58.2%) in their respective age groups living below the poverty level.
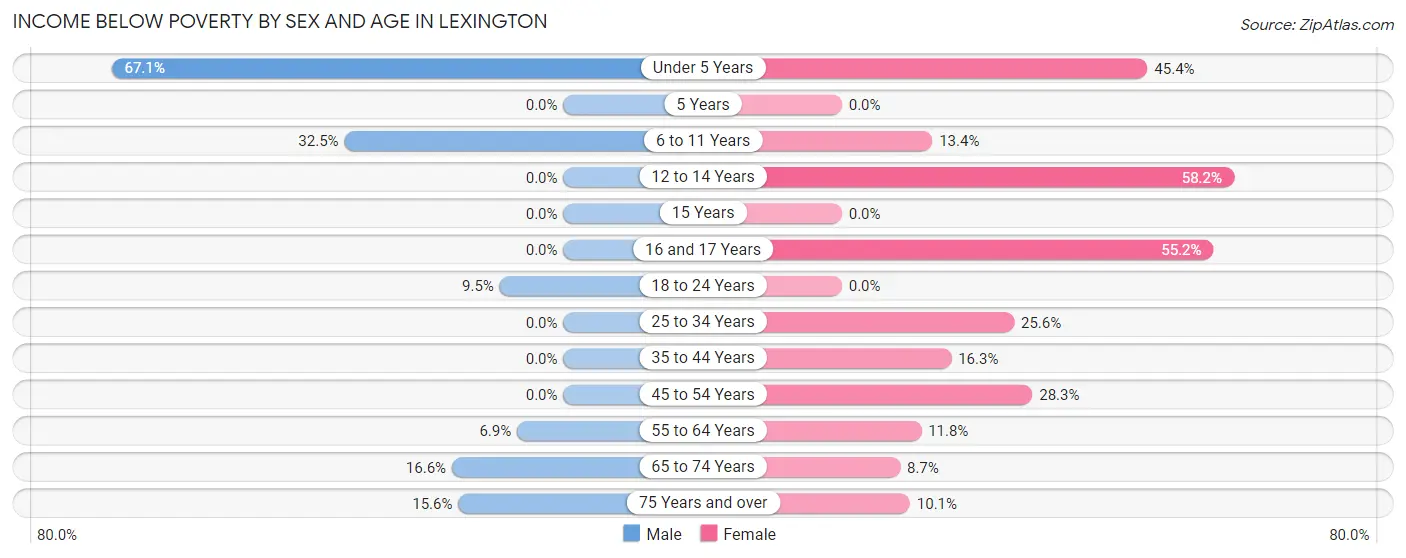
| Age Bracket | Male | Female |
| Under 5 Years | 108 (67.1%) | 59 (45.4%) |
| 5 Years | 0 (0.0%) | 0 (0.0%) |
| 6 to 11 Years | 79 (32.5%) | 27 (13.4%) |
| 12 to 14 Years | 0 (0.0%) | 39 (58.2%) |
| 15 Years | 0 (0.0%) | 0 (0.0%) |
| 16 and 17 Years | 0 (0.0%) | 16 (55.2%) |
| 18 to 24 Years | 12 (9.5%) | 0 (0.0%) |
| 25 to 34 Years | 0 (0.0%) | 99 (25.6%) |
| 35 to 44 Years | 0 (0.0%) | 39 (16.3%) |
| 45 to 54 Years | 0 (0.0%) | 73 (28.3%) |
| 55 to 64 Years | 28 (6.9%) | 25 (11.8%) |
| 65 to 74 Years | 23 (16.6%) | 16 (8.6%) |
| 75 Years and over | 17 (15.6%) | 18 (10.1%) |
| Total | 267 (11.6%) | 411 (19.8%) |
Income Above Poverty by Sex and Age in Lexington
According to the poverty statistics in Lexington, males aged 12 to 14 years and females aged 5 years are the age groups that are most secure financially, with 100.0% of males and 100.0% of females in these age groups living above the poverty line.
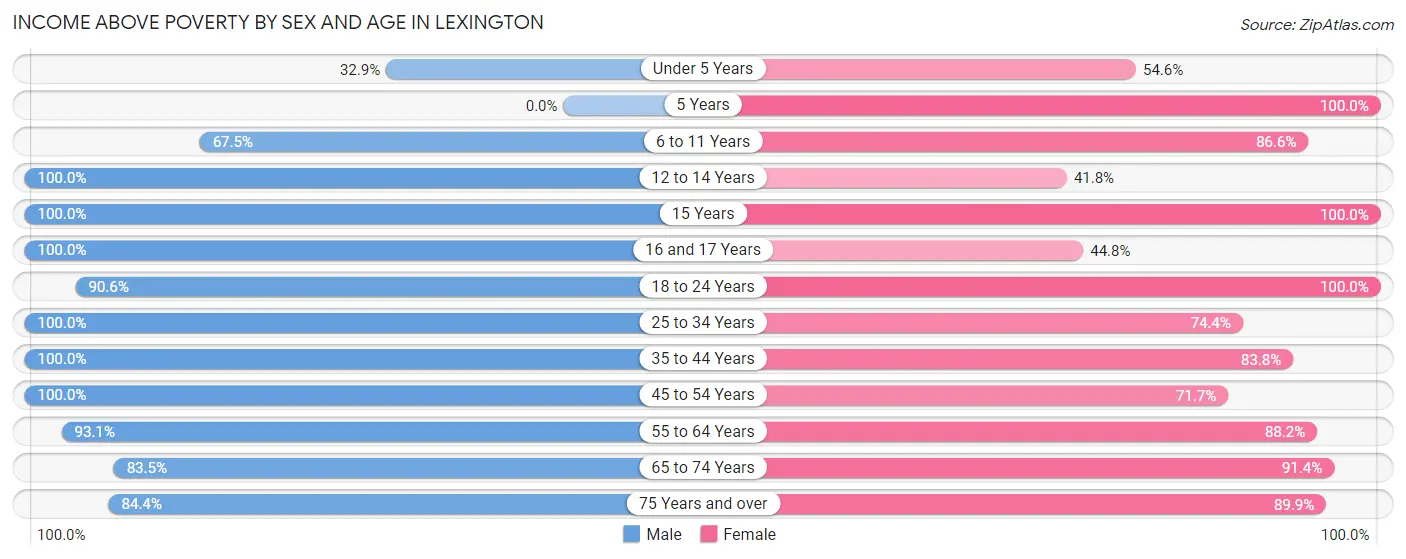
| Age Bracket | Male | Female |
| Under 5 Years | 53 (32.9%) | 71 (54.6%) |
| 5 Years | 0 (0.0%) | 21 (100.0%) |
| 6 to 11 Years | 164 (67.5%) | 174 (86.6%) |
| 12 to 14 Years | 146 (100.0%) | 28 (41.8%) |
| 15 Years | 47 (100.0%) | 48 (100.0%) |
| 16 and 17 Years | 128 (100.0%) | 13 (44.8%) |
| 18 to 24 Years | 115 (90.5%) | 120 (100.0%) |
| 25 to 34 Years | 344 (100.0%) | 288 (74.4%) |
| 35 to 44 Years | 369 (100.0%) | 201 (83.8%) |
| 45 to 54 Years | 84 (100.0%) | 185 (71.7%) |
| 55 to 64 Years | 379 (93.1%) | 187 (88.2%) |
| 65 to 74 Years | 116 (83.5%) | 169 (91.3%) |
| 75 Years and over | 92 (84.4%) | 160 (89.9%) |
| Total | 2,037 (88.4%) | 1,665 (80.2%) |
Income Below Poverty Among Married-Couple Families in Lexington
The poverty statistics for married-couple families in Lexington show that 2.5% or 17 of the total 670 families live below the poverty line. Families with no children have the highest poverty rate of 4.8%, comprising of 17 families. On the other hand, families with 1 or 2 children have the lowest poverty rate of 0.0%, which includes 0 families.
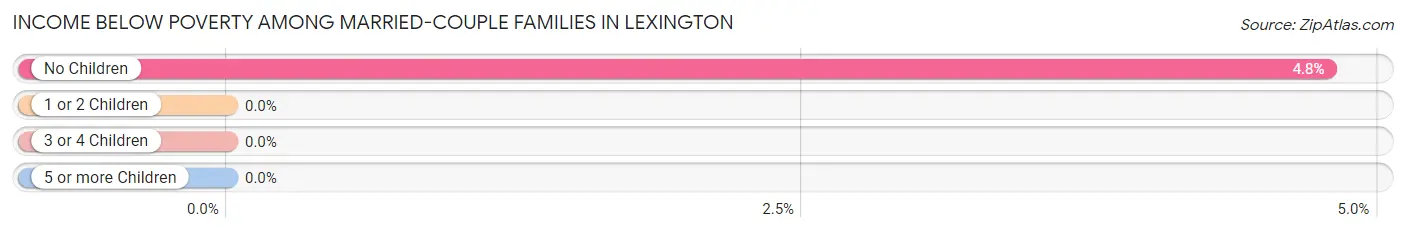
| Children | Above Poverty | Below Poverty |
| No Children | 339 (95.2%) | 17 (4.8%) |
| 1 or 2 Children | 130 (100.0%) | 0 (0.0%) |
| 3 or 4 Children | 184 (100.0%) | 0 (0.0%) |
| 5 or more Children | 0 (0.0%) | 0 (0.0%) |
| Total | 653 (97.5%) | 17 (2.5%) |
Income Below Poverty Among Single-Parent Households in Lexington
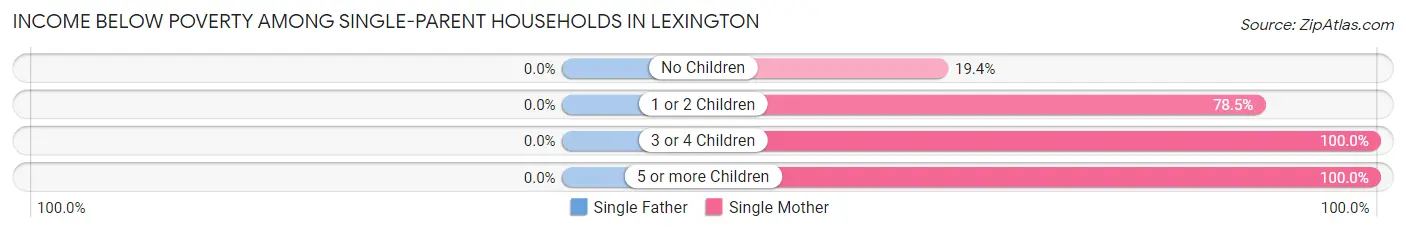
| Children | Single Father | Single Mother |
| No Children | 0 (0.0%) | 14 (19.4%) |
| 1 or 2 Children | 0 (0.0%) | 95 (78.5%) |
| 3 or 4 Children | 0 (0.0%) | 9 (100.0%) |
| 5 or more Children | 0 (0.0%) | 23 (100.0%) |
| Total | 0 (0.0%) | 141 (62.7%) |
Income Below Poverty Among Married-Couple vs Single-Parent Households in Lexington
The poverty data for Lexington shows that 17 of the married-couple family households (2.5%) and 141 of the single-parent households (49.1%) are living below the poverty level. Within the married-couple family households, those with no children have the highest poverty rate, with 17 households (4.8%) falling below the poverty line. Among the single-parent households, those with 3 or 4 children have the highest poverty rate, with 9 household (100.0%) living below poverty.
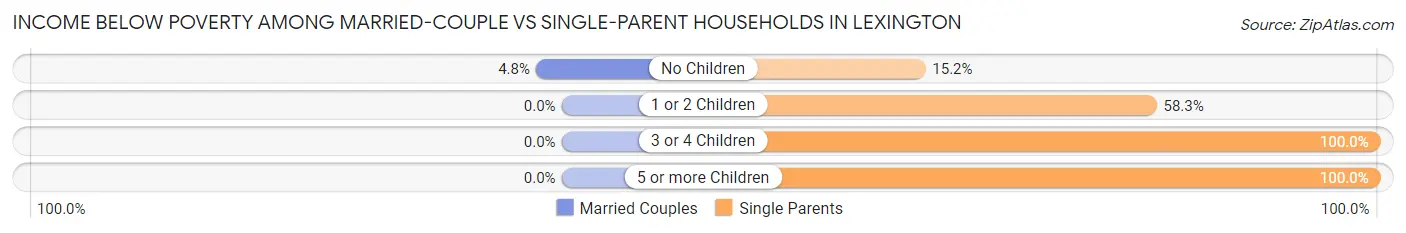
| Children | Married-Couple Families | Single-Parent Households |
| No Children | 17 (4.8%) | 14 (15.2%) |
| 1 or 2 Children | 0 (0.0%) | 95 (58.3%) |
| 3 or 4 Children | 0 (0.0%) | 9 (100.0%) |
| 5 or more Children | 0 (0.0%) | 23 (100.0%) |
| Total | 17 (2.5%) | 141 (49.1%) |
Race in Lexington
The most populous races in Lexington are White / Caucasian (4,035 | 87.9%), Hispanic or Latino (488 | 10.6%), and Two or more Races (317 | 6.9%).
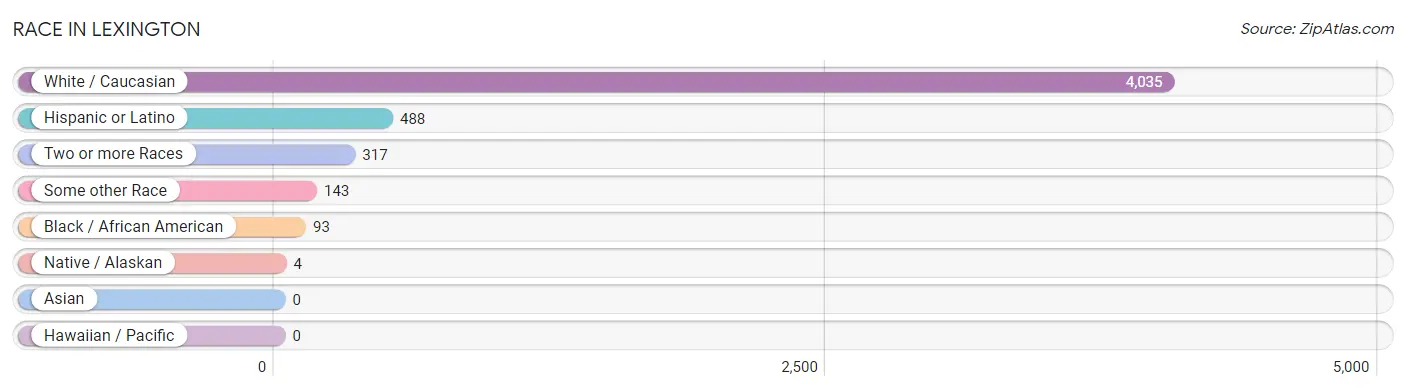
| Race | # Population | % Population |
| Asian | 0 | 0.0% |
| Black / African American | 93 | 2.0% |
| Hawaiian / Pacific | 0 | 0.0% |
| Hispanic or Latino | 488 | 10.6% |
| Native / Alaskan | 4 | 0.1% |
| White / Caucasian | 4,035 | 87.9% |
| Two or more Races | 317 | 6.9% |
| Some other Race | 143 | 3.1% |
| Total | 4,592 | 100.0% |
Ancestry in Lexington
The most populous ancestries reported in Lexington are Irish (729 | 15.9%), American (563 | 12.3%), Mexican (483 | 10.5%), English (474 | 10.3%), and German (365 | 8.0%), together accounting for 56.9% of all Lexington residents.
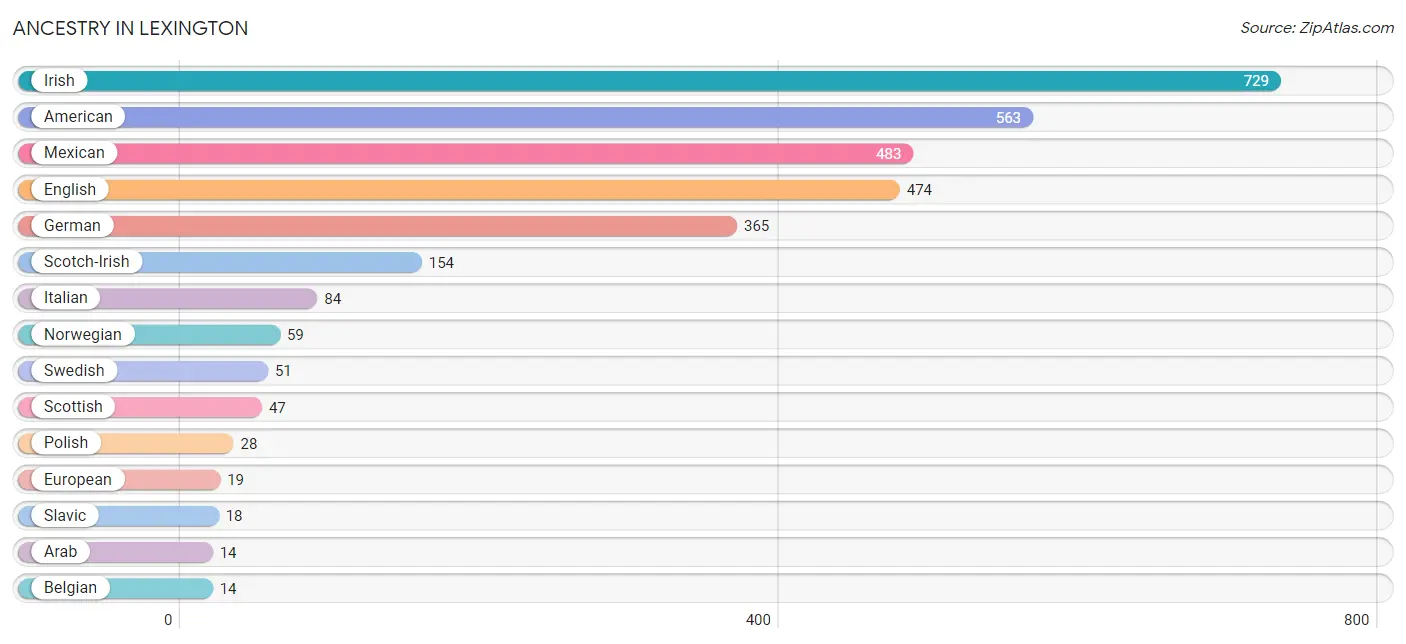
| Ancestry | # Population | % Population |
| American | 563 | 12.3% |
| Arab | 14 | 0.3% |
| Belgian | 14 | 0.3% |
| Cree | 4 | 0.1% |
| Dutch | 13 | 0.3% |
| English | 474 | 10.3% |
| European | 19 | 0.4% |
| French | 5 | 0.1% |
| German | 365 | 8.0% |
| Irish | 729 | 15.9% |
| Italian | 84 | 1.8% |
| Mexican | 483 | 10.5% |
| Norwegian | 59 | 1.3% |
| Polish | 28 | 0.6% |
| Puerto Rican | 5 | 0.1% |
| Scandinavian | 12 | 0.3% |
| Scotch-Irish | 154 | 3.4% |
| Scottish | 47 | 1.0% |
| Slavic | 18 | 0.4% |
| Swedish | 51 | 1.1% |
| Swiss | 14 | 0.3% | View All 21 Rows |
Immigrants in Lexington
The most numerous immigrant groups reported in Lexington came from Central America (241 | 5.2%), Latin America (241 | 5.2%), Mexico (241 | 5.2%), Africa (10 | 0.2%), and Canada (4 | 0.1%), together accounting for 16.1% of all Lexington residents.
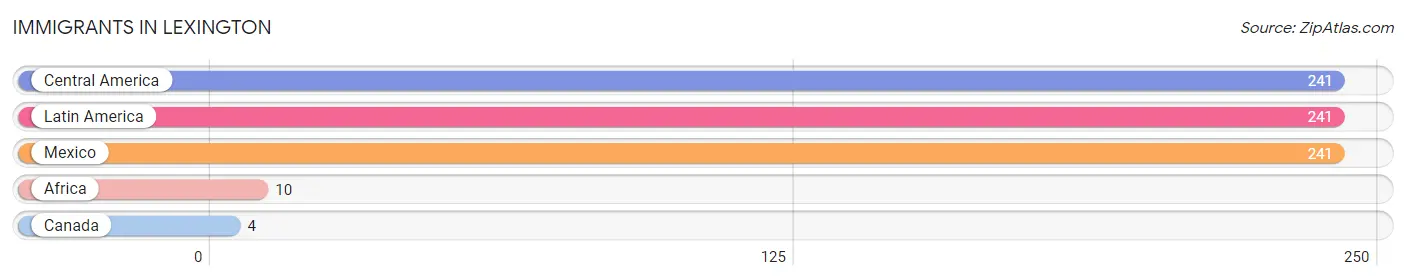
| Immigration Origin | # Population | % Population |
| Africa | 10 | 0.2% |
| Canada | 4 | 0.1% |
| Central America | 241 | 5.2% |
| Latin America | 241 | 5.2% |
| Mexico | 241 | 5.2% | View All 5 Rows |
Sex and Age in Lexington
Sex and Age in Lexington
The most populous age groups in Lexington are 25 to 29 Years (277 | 11.4%) for men and 30 to 34 Years (282 | 13.0%) for women.
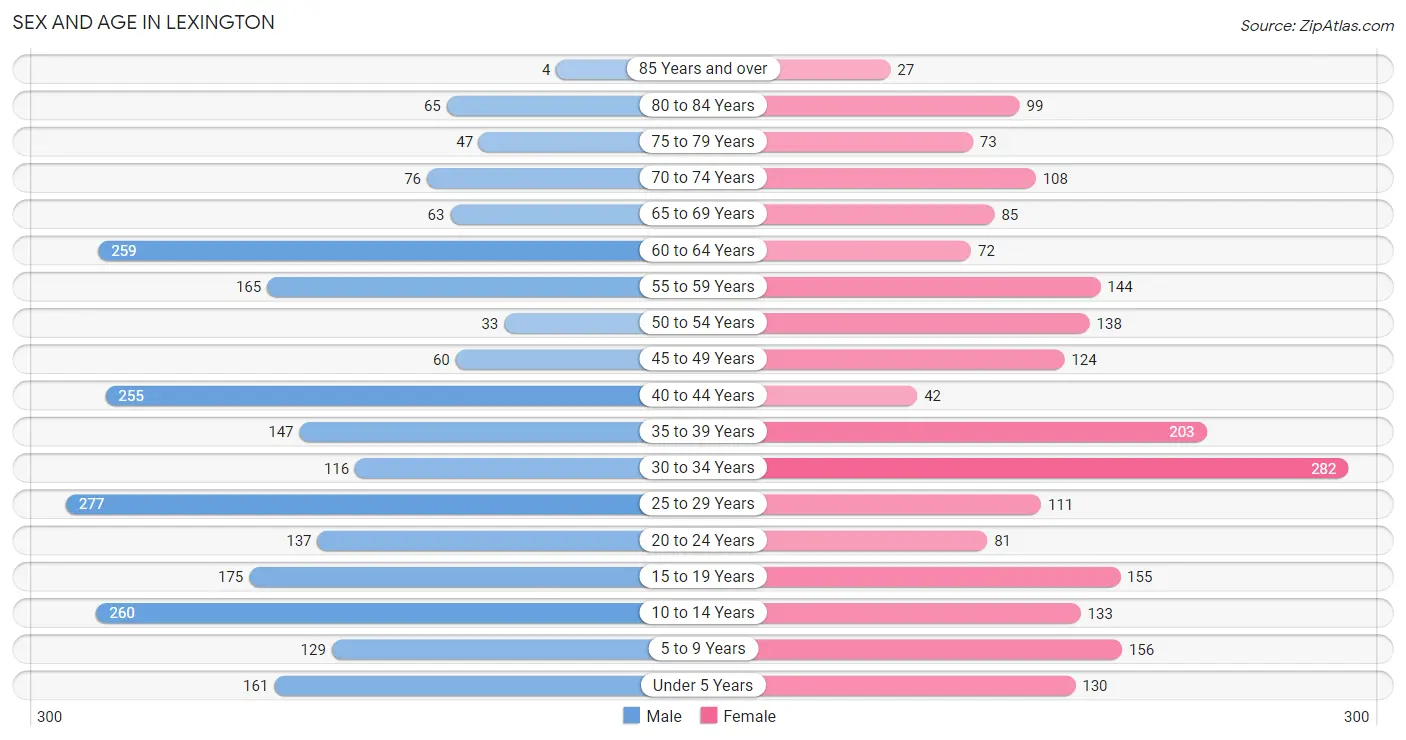
| Age Bracket | Male | Female |
| Under 5 Years | 161 (6.6%) | 130 (6.0%) |
| 5 to 9 Years | 129 (5.3%) | 156 (7.2%) |
| 10 to 14 Years | 260 (10.7%) | 133 (6.1%) |
| 15 to 19 Years | 175 (7.2%) | 155 (7.2%) |
| 20 to 24 Years | 137 (5.6%) | 81 (3.7%) |
| 25 to 29 Years | 277 (11.4%) | 111 (5.1%) |
| 30 to 34 Years | 116 (4.8%) | 282 (13.0%) |
| 35 to 39 Years | 147 (6.0%) | 203 (9.4%) |
| 40 to 44 Years | 255 (10.5%) | 42 (1.9%) |
| 45 to 49 Years | 60 (2.5%) | 124 (5.7%) |
| 50 to 54 Years | 33 (1.4%) | 138 (6.4%) |
| 55 to 59 Years | 165 (6.8%) | 144 (6.7%) |
| 60 to 64 Years | 259 (10.7%) | 72 (3.3%) |
| 65 to 69 Years | 63 (2.6%) | 85 (3.9%) |
| 70 to 74 Years | 76 (3.1%) | 108 (5.0%) |
| 75 to 79 Years | 47 (1.9%) | 73 (3.4%) |
| 80 to 84 Years | 65 (2.7%) | 99 (4.6%) |
| 85 Years and over | 4 (0.2%) | 27 (1.3%) |
| Total | 2,429 (100.0%) | 2,163 (100.0%) |
Families and Households in Lexington
Median Family Size in Lexington
The median family size in Lexington is 3.40 persons per family, with single male/father families (62 | 6.5%) accounting for the largest median family size of 3.81 persons per family. On the other hand, single female/mother families (225 | 23.5%) represent the smallest median family size with 3.26 persons per family.
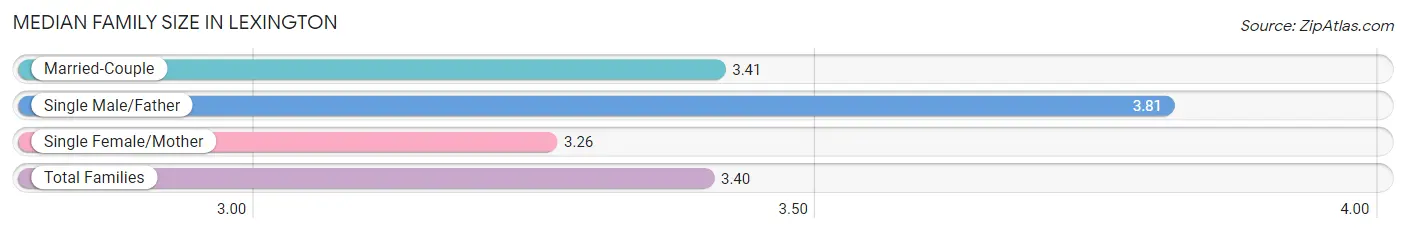
| Family Type | # Families | Family Size |
| Married-Couple | 670 (70.0%) | 3.41 |
| Single Male/Father | 62 (6.5%) | 3.81 |
| Single Female/Mother | 225 (23.5%) | 3.26 |
| Total Families | 957 (100.0%) | 3.40 |
Median Household Size in Lexington
The median household size in Lexington is 2.56 persons per household, with single male/father households (62 | 3.6%) accounting for the largest median household size of 4.5 persons per household. non-family households (756 | 44.1%) represent the smallest median household size with 1.37 persons per household.
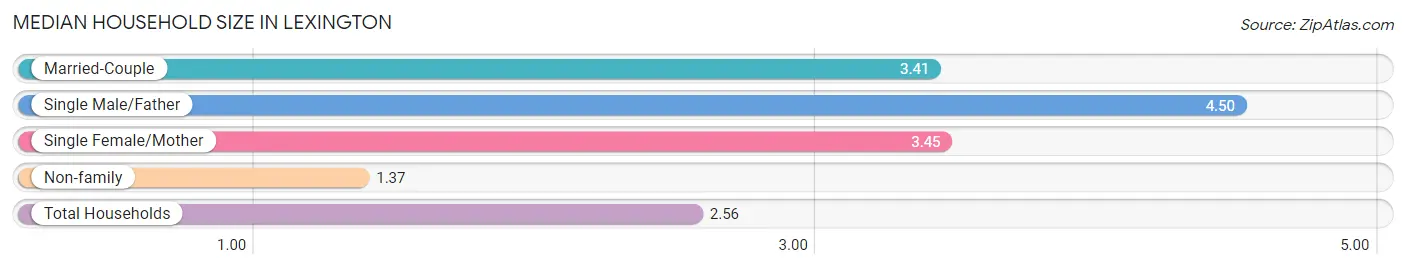
| Household Type | # Households | Household Size |
| Married-Couple | 670 (39.1%) | 3.41 |
| Single Male/Father | 62 (3.6%) | 4.50 |
| Single Female/Mother | 225 (13.1%) | 3.45 |
| Non-family | 756 (44.1%) | 1.37 |
| Total Households | 1,713 (100.0%) | 2.56 |
Household Size by Marriage Status in Lexington
Out of a total of 1,713 households in Lexington, 957 (55.9%) are family households, while 756 (44.1%) are nonfamily households. The most numerous type of family households are 2-person households, comprising 389, and the most common type of nonfamily households are 1-person households, comprising 567.
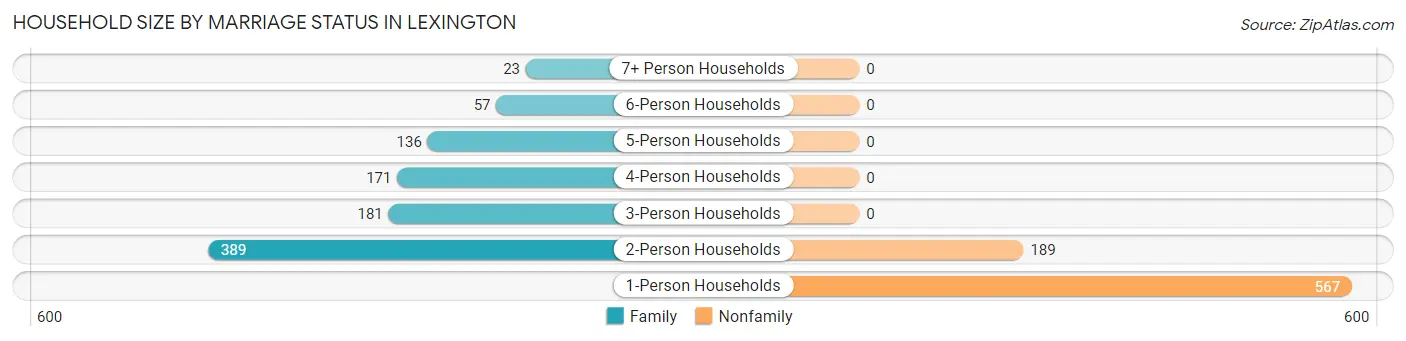
| Household Size | Family Households | Nonfamily Households |
| 1-Person Households | - | 567 (33.1%) |
| 2-Person Households | 389 (22.7%) | 189 (11.0%) |
| 3-Person Households | 181 (10.6%) | 0 (0.0%) |
| 4-Person Households | 171 (10.0%) | 0 (0.0%) |
| 5-Person Households | 136 (7.9%) | 0 (0.0%) |
| 6-Person Households | 57 (3.3%) | 0 (0.0%) |
| 7+ Person Households | 23 (1.3%) | 0 (0.0%) |
| Total | 957 (55.9%) | 756 (44.1%) |
Female Fertility in Lexington
Fertility by Age in Lexington
Average fertility rate in Lexington is 64.0 births per 1,000 women. Women in the age bracket of 20 to 34 years have the highest fertility rate with 93.0 births per 1,000 women. Women in the age bracket of 20 to 34 years acount for 65.7% of all women with births.
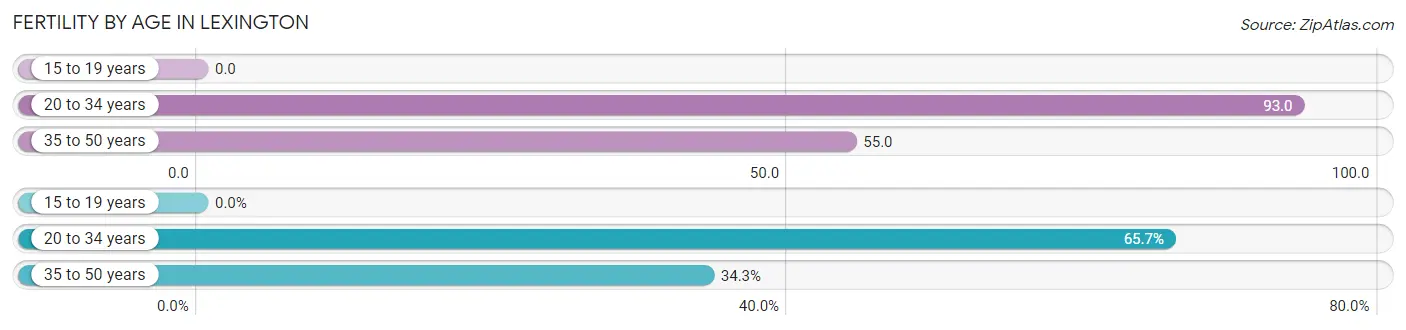
| Age Bracket | Women with Births | Births / 1,000 Women |
| 15 to 19 years | 0 (0.0%) | 0.0 |
| 20 to 34 years | 44 (65.7%) | 93.0 |
| 35 to 50 years | 23 (34.3%) | 55.0 |
| Total | 67 (100.0%) | 64.0 |
Fertility by Age by Marriage Status in Lexington
68.7% of women with births (67) in Lexington are married. The highest percentage of unmarried women with births falls into 20 to 34 years age bracket with 47.7% of them unmarried at the time of birth, while the lowest percentage of unmarried women with births belong to 35 to 50 years age bracket with 0.0% of them unmarried.
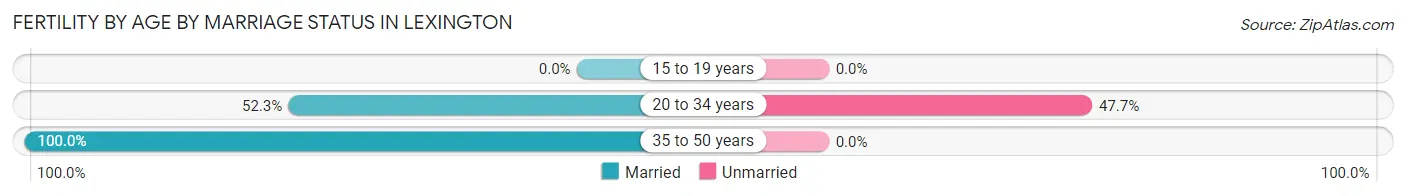
| Age Bracket | Married | Unmarried |
| 15 to 19 years | 0 (0.0%) | 0 (0.0%) |
| 20 to 34 years | 23 (52.3%) | 21 (47.7%) |
| 35 to 50 years | 23 (100.0%) | 0 (0.0%) |
| Total | 46 (68.7%) | 21 (31.3%) |
Fertility by Education in Lexington
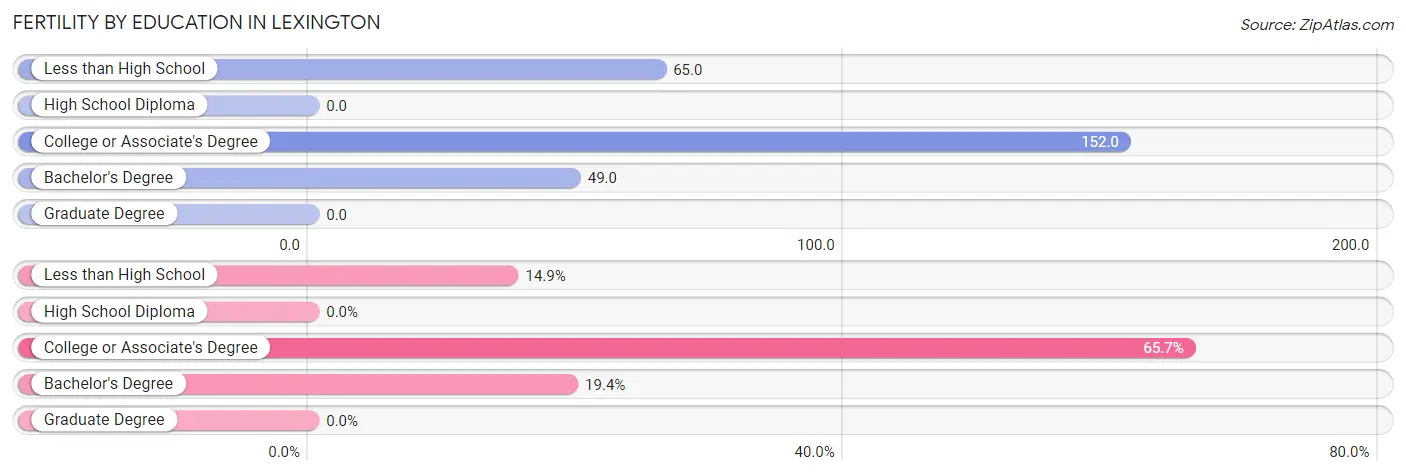
| Educational Attainment | Women with Births | Births / 1,000 Women |
| Less than High School | 10 (14.9%) | 65.0 |
| High School Diploma | 0 (0.0%) | 0.0 |
| College or Associate's Degree | 44 (65.7%) | 152.0 |
| Bachelor's Degree | 13 (19.4%) | 49.0 |
| Graduate Degree | 0 (0.0%) | 0.0 |
| Total | 67 (100.0%) | 64.0 |
Fertility by Education by Marriage Status in Lexington
31.3% of women with births in Lexington are unmarried. Women with the educational attainment of less than high school are most likely to be married with 100.0% of them married at childbirth, while women with the educational attainment of college or associate's degree are least likely to be married with 47.7% of them unmarried at childbirth.
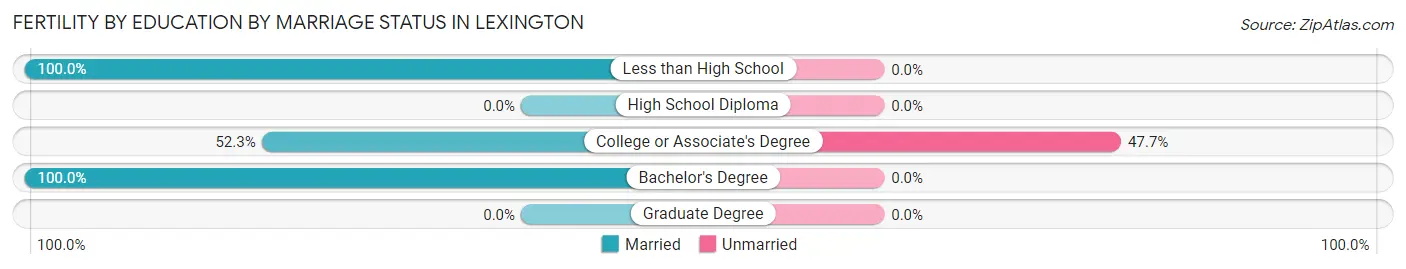
| Educational Attainment | Married | Unmarried |
| Less than High School | 10 (100.0%) | 0 (0.0%) |
| High School Diploma | 0 (0.0%) | 0 (0.0%) |
| College or Associate's Degree | 23 (52.3%) | 21 (47.7%) |
| Bachelor's Degree | 13 (100.0%) | 0 (0.0%) |
| Graduate Degree | 0 (0.0%) | 0 (0.0%) |
| Total | 46 (68.7%) | 21 (31.3%) |
Employment Characteristics in Lexington
Employment by Class of Employer in Lexington
Among the 1,995 employed individuals in Lexington, private company employees (1,598 | 80.1%), not-for-profit organizations (117 | 5.9%), and state government employees (103 | 5.2%) make up the most common classes of employment.
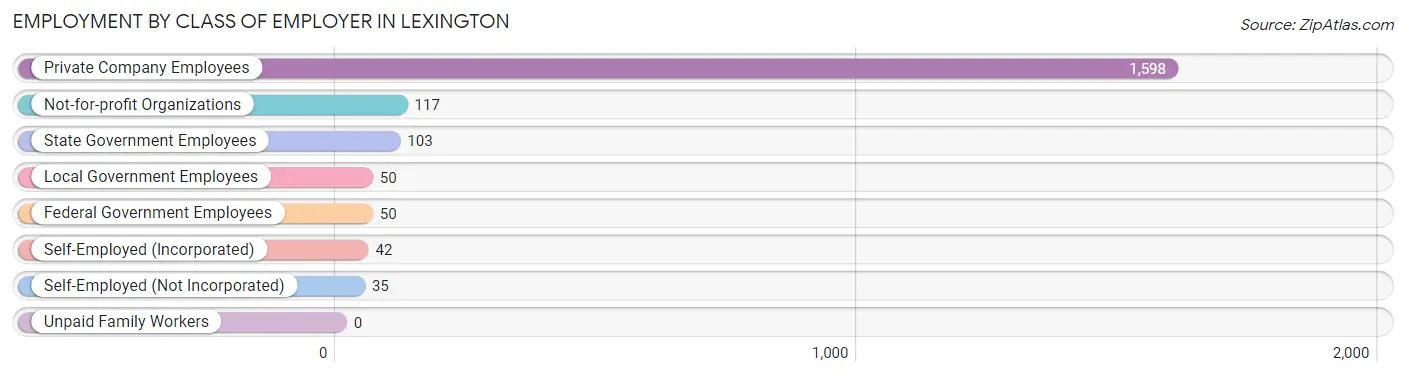
| Employer Class | # Employees | % Employees |
| Private Company Employees | 1,598 | 80.1% |
| Self-Employed (Incorporated) | 42 | 2.1% |
| Self-Employed (Not Incorporated) | 35 | 1.8% |
| Not-for-profit Organizations | 117 | 5.9% |
| Local Government Employees | 50 | 2.5% |
| State Government Employees | 103 | 5.2% |
| Federal Government Employees | 50 | 2.5% |
| Unpaid Family Workers | 0 | 0.0% |
| Total | 1,995 | 100.0% |
Employment Status by Age in Lexington
According to the labor force statistics for Lexington, out of the total population over 16 years of age (3,528), 64.3% or 2,269 individuals are in the labor force, with 4.3% or 98 of them unemployed. The age group with the highest labor force participation rate is 30 to 34 years, with 89.9% or 358 individuals in the labor force. Within the labor force, the 35 to 44 years age range has the highest percentage of unemployed individuals, with 14.2% or 81 of them being unemployed.
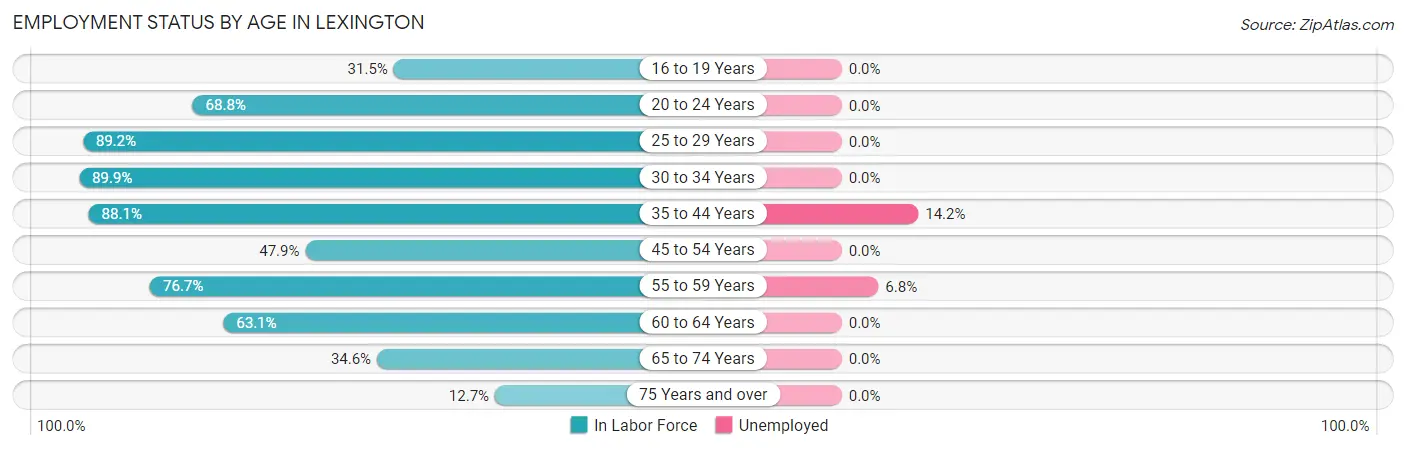
| Age Bracket | In Labor Force | Unemployed |
| 16 to 19 Years | 74 (31.5%) | 0 (0.0%) |
| 20 to 24 Years | 150 (68.8%) | 0 (0.0%) |
| 25 to 29 Years | 346 (89.2%) | 0 (0.0%) |
| 30 to 34 Years | 358 (89.9%) | 0 (0.0%) |
| 35 to 44 Years | 570 (88.1%) | 81 (14.2%) |
| 45 to 54 Years | 170 (47.9%) | 0 (0.0%) |
| 55 to 59 Years | 237 (76.7%) | 16 (6.8%) |
| 60 to 64 Years | 209 (63.1%) | 0 (0.0%) |
| 65 to 74 Years | 115 (34.6%) | 0 (0.0%) |
| 75 Years and over | 40 (12.7%) | 0 (0.0%) |
| Total | 2,269 (64.3%) | 98 (4.3%) |
Employment Status by Educational Attainment in Lexington
According to labor force statistics for Lexington, 77.8% of individuals (1,889) out of the total population between 25 and 64 years of age (2,428) are in the labor force, with 5.1% or 96 of them being unemployed. The group with the highest labor force participation rate are those with the educational attainment of college / associate degree, with 88.7% or 488 individuals in the labor force. Within the labor force, individuals with less than high school education have the highest percentage of unemployment, with 36.5% or 58 of them being unemployed.
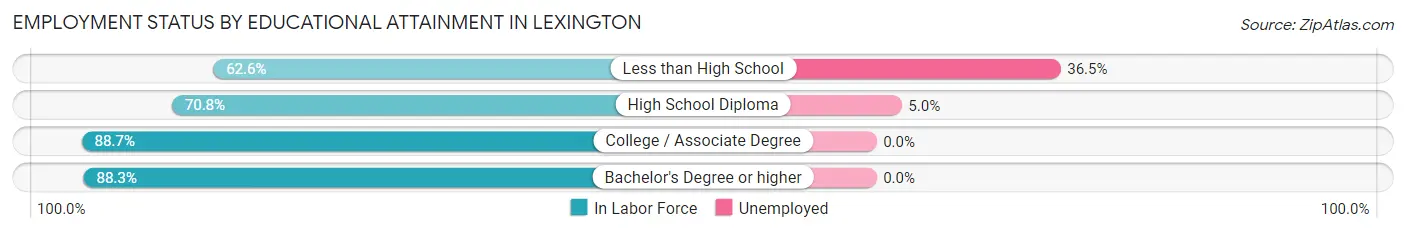
| Educational Attainment | In Labor Force | Unemployed |
| Less than High School | 159 (62.6%) | 93 (36.5%) |
| High School Diploma | 774 (70.8%) | 55 (5.0%) |
| College / Associate Degree | 488 (88.7%) | 0 (0.0%) |
| Bachelor's Degree or higher | 469 (88.3%) | 0 (0.0%) |
| Total | 1,889 (77.8%) | 124 (5.1%) |
Employment Occupations by Sex in Lexington
Management, Business, Science and Arts Occupations
The most common Management, Business, Science and Arts occupations in Lexington are Health Diagnosing & Treating (279 | 12.9%), Health Technologists (202 | 9.3%), Computers, Engineering & Science (92 | 4.2%), Computers & Mathematics (92 | 4.2%), and Management (70 | 3.2%).
Management, Business, Science and Arts Occupations by Sex
Within the Management, Business, Science and Arts occupations in Lexington, the most male-oriented occupations are Education, Arts & Media (100.0%), Community & Social Service (61.9%), and Education Instruction & Library (46.7%), while the most female-oriented occupations are Business & Financial (100.0%), Health Diagnosing & Treating (97.5%), and Health Technologists (96.5%).
| Occupation | Male | Female |
| Management | 32 (45.7%) | 38 (54.3%) |
| Business & Financial | 0 (0.0%) | 51 (100.0%) |
| Computers, Engineering & Science | 28 (30.4%) | 64 (69.6%) |
| Computers & Mathematics | 28 (30.4%) | 64 (69.6%) |
| Architecture & Engineering | 0 (0.0%) | 0 (0.0%) |
| Life, Physical & Social Science | 0 (0.0%) | 0 (0.0%) |
| Community & Social Service | 39 (61.9%) | 24 (38.1%) |
| Education, Arts & Media | 18 (100.0%) | 0 (0.0%) |
| Legal Services & Support | 0 (0.0%) | 0 (0.0%) |
| Education Instruction & Library | 21 (46.7%) | 24 (53.3%) |
| Arts, Media & Entertainment | 0 (0.0%) | 0 (0.0%) |
| Health Diagnosing & Treating | 7 (2.5%) | 272 (97.5%) |
| Health Technologists | 7 (3.5%) | 195 (96.5%) |
| Total (Category) | 106 (19.1%) | 449 (80.9%) |
| Total (Overall) | 1,310 (60.3%) | 862 (39.7%) |
Services Occupations
The most common Services occupations in Lexington are Food Preparation & Serving (115 | 5.3%), Security & Protection (102 | 4.7%), Law Enforcement (69 | 3.2%), Firefighting & Prevention (33 | 1.5%), and Cleaning & Maintenance (28 | 1.3%).
Services Occupations by Sex
Within the Services occupations in Lexington, the most male-oriented occupations are Firefighting & Prevention (100.0%), Food Preparation & Serving (60.9%), and Cleaning & Maintenance (53.6%), while the most female-oriented occupations are Healthcare Support (100.0%), Personal Care & Service (100.0%), and Law Enforcement (82.6%).
| Occupation | Male | Female |
| Healthcare Support | 0 (0.0%) | 21 (100.0%) |
| Security & Protection | 45 (44.1%) | 57 (55.9%) |
| Firefighting & Prevention | 33 (100.0%) | 0 (0.0%) |
| Law Enforcement | 12 (17.4%) | 57 (82.6%) |
| Food Preparation & Serving | 70 (60.9%) | 45 (39.1%) |
| Cleaning & Maintenance | 15 (53.6%) | 13 (46.4%) |
| Personal Care & Service | 0 (0.0%) | 22 (100.0%) |
| Total (Category) | 130 (45.1%) | 158 (54.9%) |
| Total (Overall) | 1,310 (60.3%) | 862 (39.7%) |
Sales and Office Occupations
The most common Sales and Office occupations in Lexington are Office & Administration (198 | 9.1%), and Sales & Related (133 | 6.1%).
Sales and Office Occupations by Sex
| Occupation | Male | Female |
| Sales & Related | 60 (45.1%) | 73 (54.9%) |
| Office & Administration | 100 (50.5%) | 98 (49.5%) |
| Total (Category) | 160 (48.3%) | 171 (51.7%) |
| Total (Overall) | 1,310 (60.3%) | 862 (39.7%) |
Natural Resources, Construction and Maintenance Occupations
The most common Natural Resources, Construction and Maintenance occupations in Lexington are Construction & Extraction (345 | 15.9%), Installation, Maintenance & Repair (124 | 5.7%), and Farming, Fishing & Forestry (86 | 4.0%).
Natural Resources, Construction and Maintenance Occupations by Sex
| Occupation | Male | Female |
| Farming, Fishing & Forestry | 86 (100.0%) | 0 (0.0%) |
| Construction & Extraction | 331 (95.9%) | 14 (4.1%) |
| Installation, Maintenance & Repair | 124 (100.0%) | 0 (0.0%) |
| Total (Category) | 541 (97.5%) | 14 (2.5%) |
| Total (Overall) | 1,310 (60.3%) | 862 (39.7%) |
Production, Transportation and Moving Occupations
The most common Production, Transportation and Moving occupations in Lexington are Production (185 | 8.5%), Transportation (168 | 7.7%), and Material Moving (90 | 4.1%).
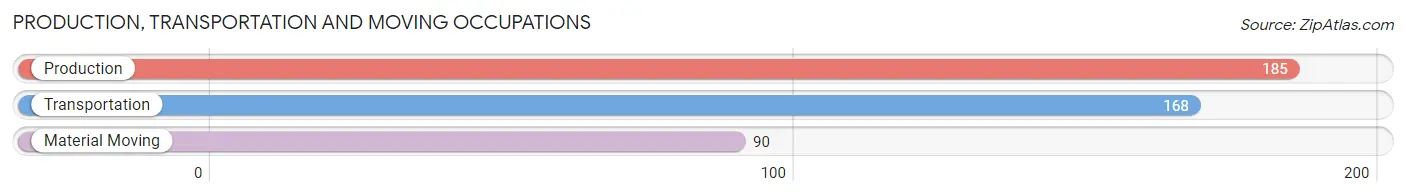
Production, Transportation and Moving Occupations by Sex
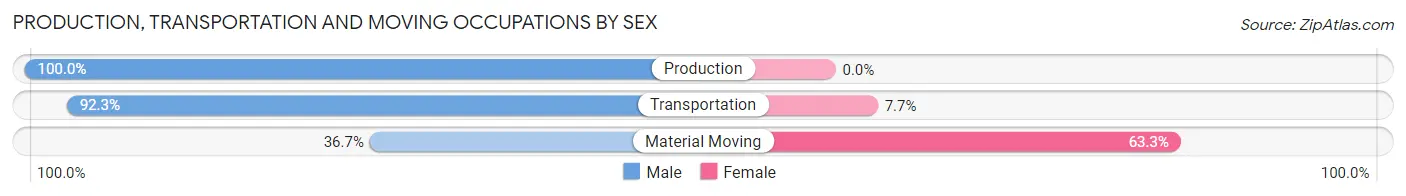
| Occupation | Male | Female |
| Production | 185 (100.0%) | 0 (0.0%) |
| Transportation | 155 (92.3%) | 13 (7.7%) |
| Material Moving | 33 (36.7%) | 57 (63.3%) |
| Total (Category) | 373 (84.2%) | 70 (15.8%) |
| Total (Overall) | 1,310 (60.3%) | 862 (39.7%) |
Employment Industries by Sex in Lexington
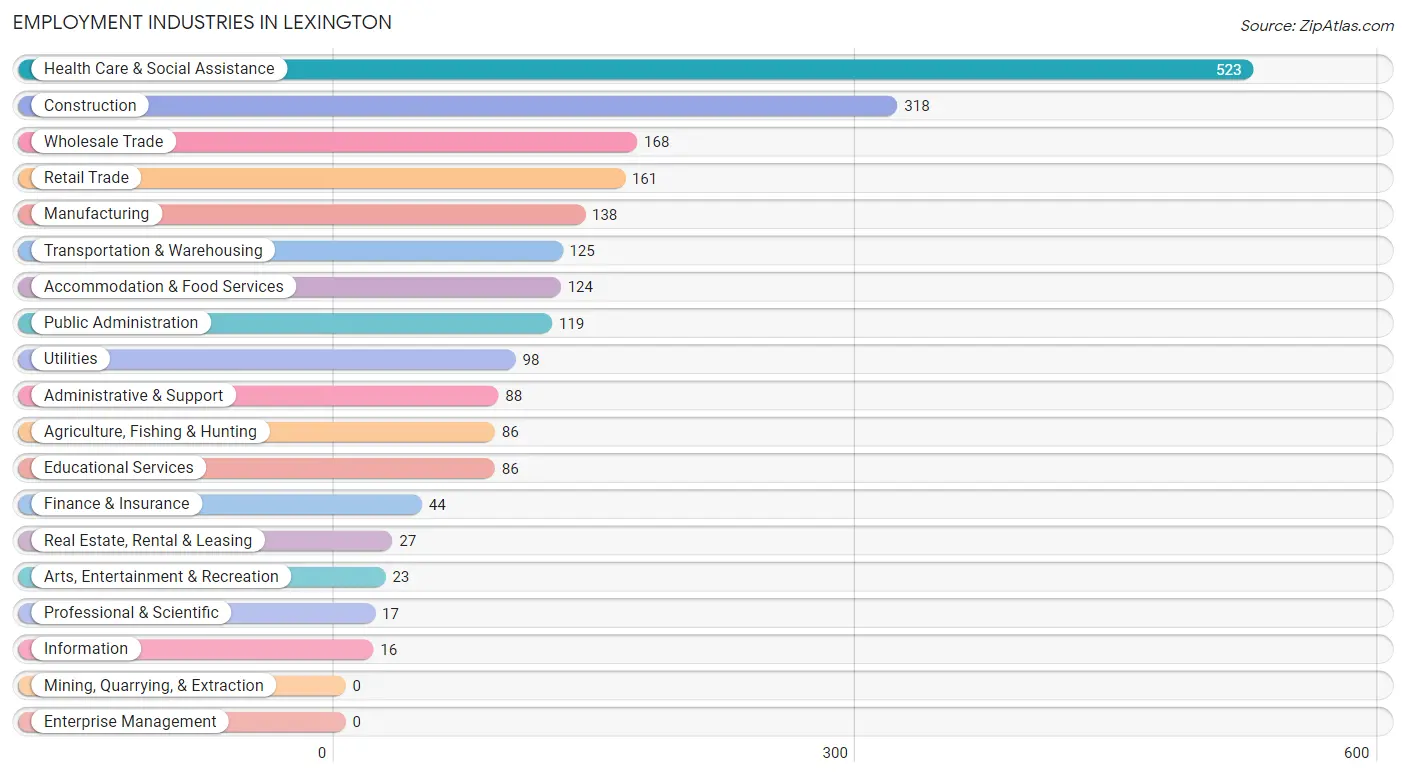
Employment Industries in Lexington
The major employment industries in Lexington include Health Care & Social Assistance (523 | 24.1%), Construction (318 | 14.6%), Wholesale Trade (168 | 7.7%), Retail Trade (161 | 7.4%), and Manufacturing (138 | 6.4%).
Employment Industries by Sex in Lexington
The Lexington industries that see more men than women are Agriculture, Fishing & Hunting (100.0%), Construction (100.0%), and Utilities (100.0%), whereas the industries that tend to have a higher number of women are Information (100.0%), Finance & Insurance (100.0%), and Professional & Scientific (100.0%).
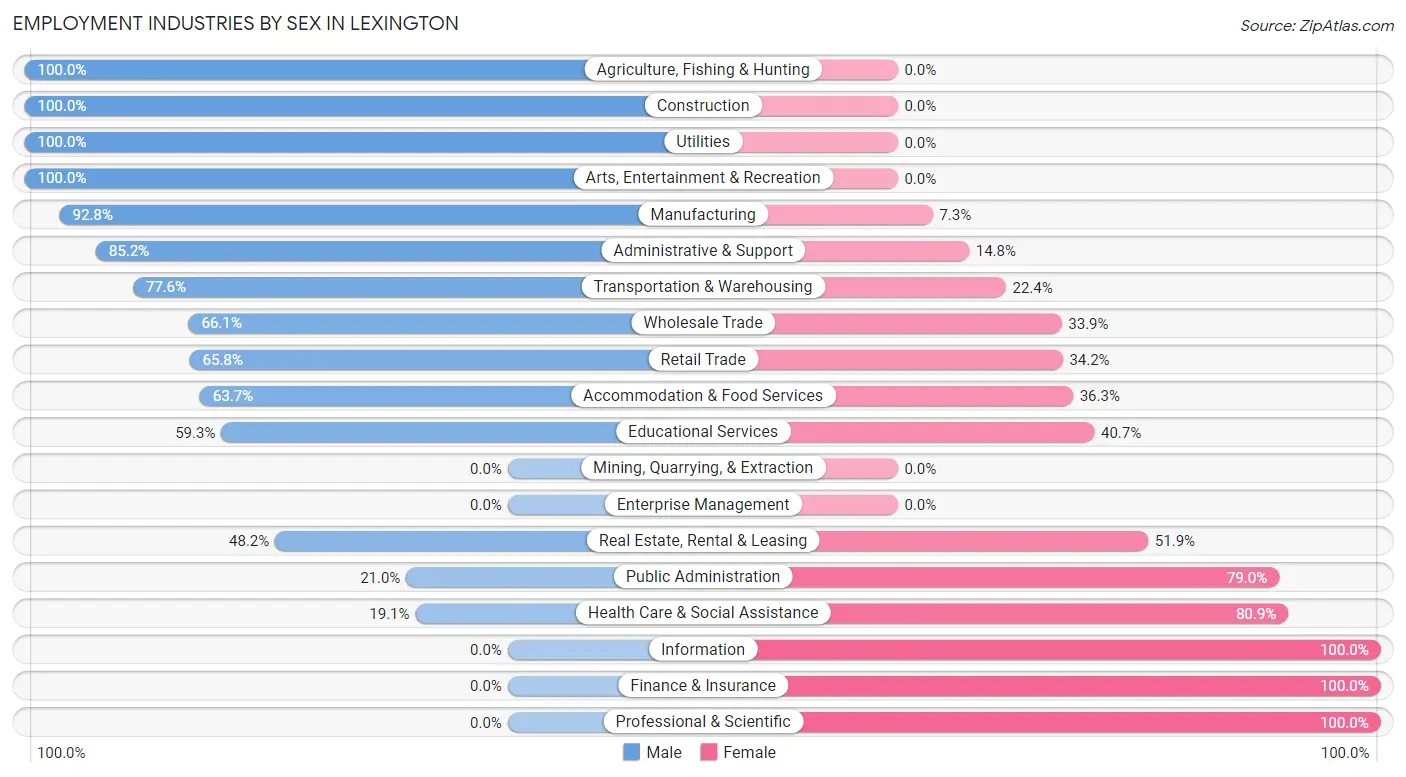
| Industry | Male | Female |
| Agriculture, Fishing & Hunting | 86 (100.0%) | 0 (0.0%) |
| Mining, Quarrying, & Extraction | 0 (0.0%) | 0 (0.0%) |
| Construction | 318 (100.0%) | 0 (0.0%) |
| Manufacturing | 128 (92.7%) | 10 (7.2%) |
| Wholesale Trade | 111 (66.1%) | 57 (33.9%) |
| Retail Trade | 106 (65.8%) | 55 (34.2%) |
| Transportation & Warehousing | 97 (77.6%) | 28 (22.4%) |
| Utilities | 98 (100.0%) | 0 (0.0%) |
| Information | 0 (0.0%) | 16 (100.0%) |
| Finance & Insurance | 0 (0.0%) | 44 (100.0%) |
| Real Estate, Rental & Leasing | 13 (48.1%) | 14 (51.8%) |
| Professional & Scientific | 0 (0.0%) | 17 (100.0%) |
| Enterprise Management | 0 (0.0%) | 0 (0.0%) |
| Administrative & Support | 75 (85.2%) | 13 (14.8%) |
| Educational Services | 51 (59.3%) | 35 (40.7%) |
| Health Care & Social Assistance | 100 (19.1%) | 423 (80.9%) |
| Arts, Entertainment & Recreation | 23 (100.0%) | 0 (0.0%) |
| Accommodation & Food Services | 79 (63.7%) | 45 (36.3%) |
| Public Administration | 25 (21.0%) | 94 (79.0%) |
| Total | 1,310 (60.3%) | 862 (39.7%) |
Education in Lexington
School Enrollment in Lexington
The most common levels of schooling among the 1,105 students in Lexington are middle school (307 | 27.8%), high school (252 | 22.8%), and elementary school (233 | 21.1%).
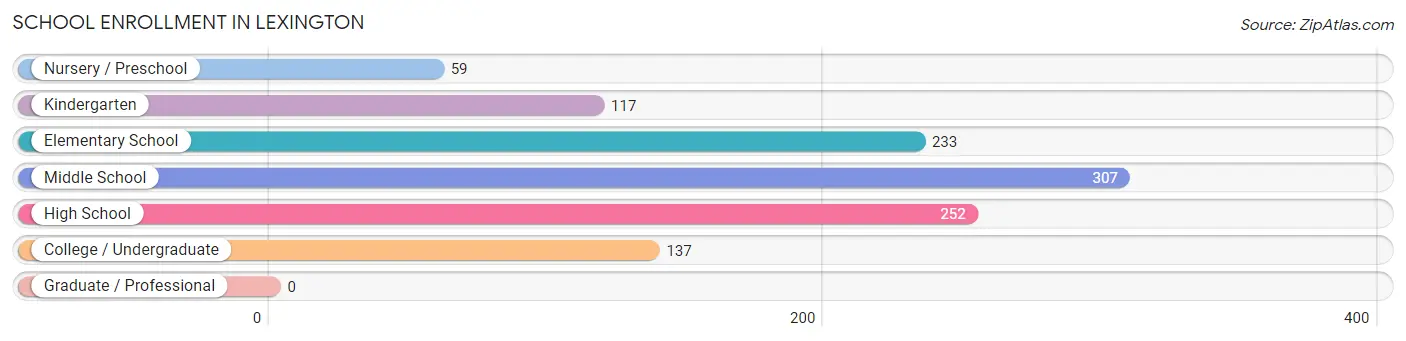
| School Level | # Students | % Students |
| Nursery / Preschool | 59 | 5.3% |
| Kindergarten | 117 | 10.6% |
| Elementary School | 233 | 21.1% |
| Middle School | 307 | 27.8% |
| High School | 252 | 22.8% |
| College / Undergraduate | 137 | 12.4% |
| Graduate / Professional | 0 | 0.0% |
| Total | 1,105 | 100.0% |
School Enrollment by Age by Funding Source in Lexington
Out of a total of 1,105 students who are enrolled in schools in Lexington, 39 (3.5%) attend a private institution, while the remaining 1,066 (96.5%) are enrolled in public schools. The age group of 18 to 19 year olds has the highest likelihood of being enrolled in private schools, with 11 (50.0% in the age bracket) enrolled. Conversely, the age group of 10 to 14 year olds has the lowest likelihood of being enrolled in a private school, with 393 (100.0% in the age bracket) attending a public institution.
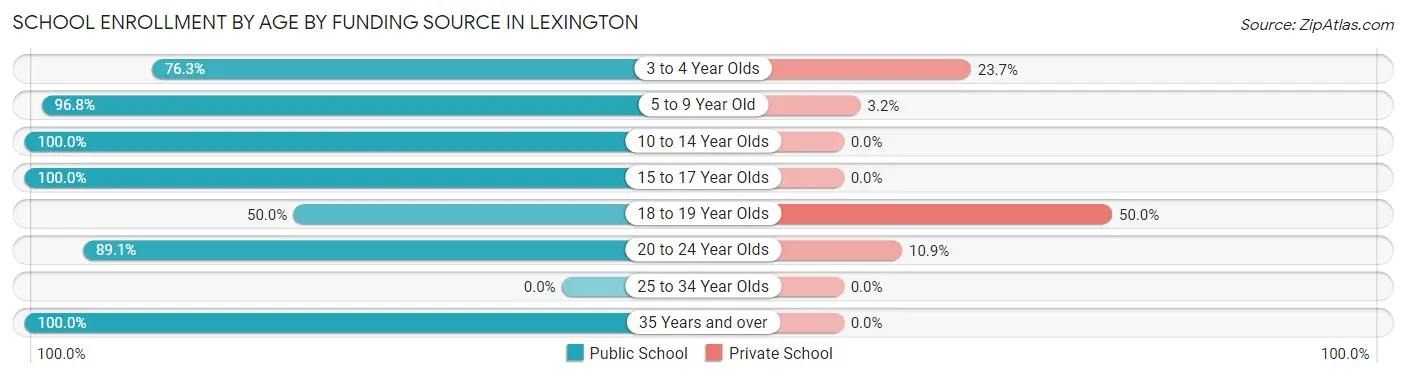
| Age Bracket | Public School | Private School |
| 3 to 4 Year Olds | 29 (76.3%) | 9 (23.7%) |
| 5 to 9 Year Old | 276 (96.8%) | 9 (3.2%) |
| 10 to 14 Year Olds | 393 (100.0%) | 0 (0.0%) |
| 15 to 17 Year Olds | 252 (100.0%) | 0 (0.0%) |
| 18 to 19 Year Olds | 11 (50.0%) | 11 (50.0%) |
| 20 to 24 Year Olds | 82 (89.1%) | 10 (10.9%) |
| 25 to 34 Year Olds | 0 (0.0%) | 0 (0.0%) |
| 35 Years and over | 23 (100.0%) | 0 (0.0%) |
| Total | 1,066 (96.5%) | 39 (3.5%) |
Educational Attainment by Field of Study in Lexington
Business (179 | 25.1%), education (100 | 14.0%), arts & humanities (93 | 13.1%), science & technology (78 | 11.0%), and physical & health sciences (64 | 9.0%) are the most common fields of study among 712 individuals in Lexington who have obtained a bachelor's degree or higher.
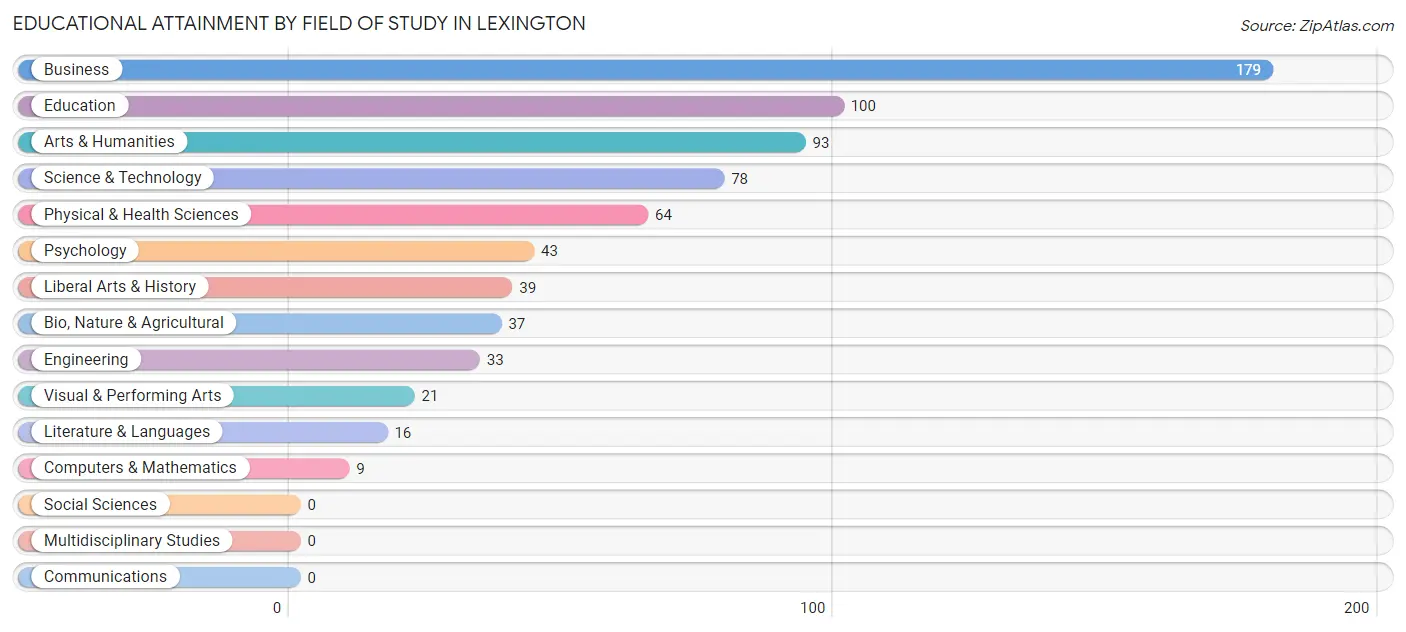
| Field of Study | # Graduates | % Graduates |
| Computers & Mathematics | 9 | 1.3% |
| Bio, Nature & Agricultural | 37 | 5.2% |
| Physical & Health Sciences | 64 | 9.0% |
| Psychology | 43 | 6.0% |
| Social Sciences | 0 | 0.0% |
| Engineering | 33 | 4.6% |
| Multidisciplinary Studies | 0 | 0.0% |
| Science & Technology | 78 | 11.0% |
| Business | 179 | 25.1% |
| Education | 100 | 14.0% |
| Literature & Languages | 16 | 2.2% |
| Liberal Arts & History | 39 | 5.5% |
| Visual & Performing Arts | 21 | 2.9% |
| Communications | 0 | 0.0% |
| Arts & Humanities | 93 | 13.1% |
| Total | 712 | 100.0% |
Transportation & Commute in Lexington
Vehicle Availability by Sex in Lexington
The most prevalent vehicle ownership categories in Lexington are males with 2 vehicles (642, accounting for 52.7%) and females with 2 vehicles (501, making up 85.0%).
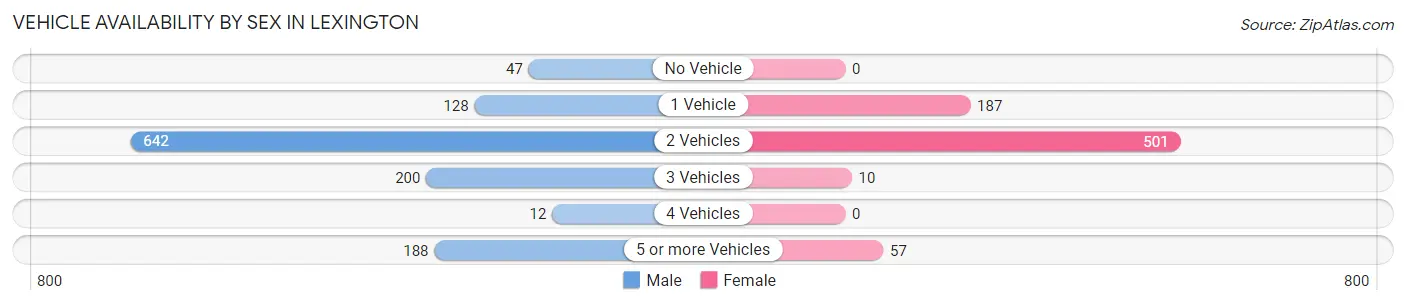
| Vehicles Available | Male | Female |
| No Vehicle | 47 (3.9%) | 0 (0.0%) |
| 1 Vehicle | 128 (10.5%) | 187 (24.8%) |
| 2 Vehicles | 642 (52.7%) | 501 (66.4%) |
| 3 Vehicles | 200 (16.4%) | 10 (1.3%) |
| 4 Vehicles | 12 (1.0%) | 0 (0.0%) |
| 5 or more Vehicles | 188 (15.4%) | 57 (7.5%) |
| Total | 1,217 (100.0%) | 755 (100.0%) |
Commute Time in Lexington
The most frequently occuring commute durations in Lexington are 5 to 9 minutes (313 commuters, 16.1%), 15 to 19 minutes (243 commuters, 12.5%), and 25 to 29 minutes (180 commuters, 9.3%).
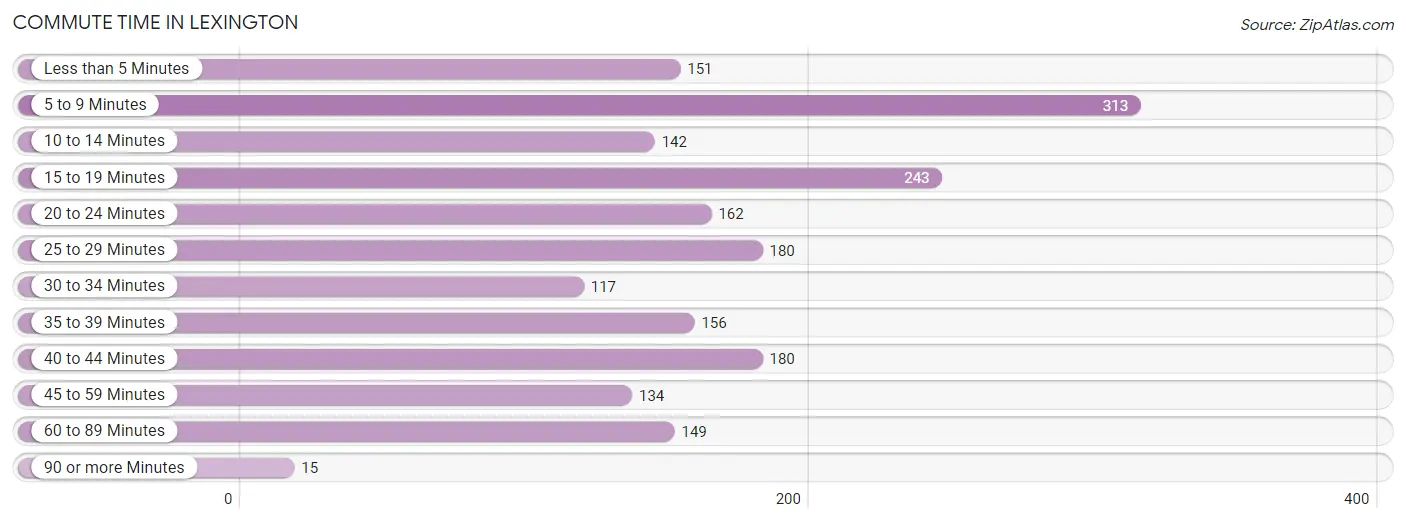
| Commute Time | # Commuters | % Commuters |
| Less than 5 Minutes | 151 | 7.8% |
| 5 to 9 Minutes | 313 | 16.1% |
| 10 to 14 Minutes | 142 | 7.3% |
| 15 to 19 Minutes | 243 | 12.5% |
| 20 to 24 Minutes | 162 | 8.3% |
| 25 to 29 Minutes | 180 | 9.3% |
| 30 to 34 Minutes | 117 | 6.0% |
| 35 to 39 Minutes | 156 | 8.0% |
| 40 to 44 Minutes | 180 | 9.3% |
| 45 to 59 Minutes | 134 | 6.9% |
| 60 to 89 Minutes | 149 | 7.7% |
| 90 or more Minutes | 15 | 0.8% |
Commute Time by Sex in Lexington
The most common commute times in Lexington are 15 to 19 minutes (161 commuters, 13.4%) for males and 5 to 9 minutes (215 commuters, 28.9%) for females.
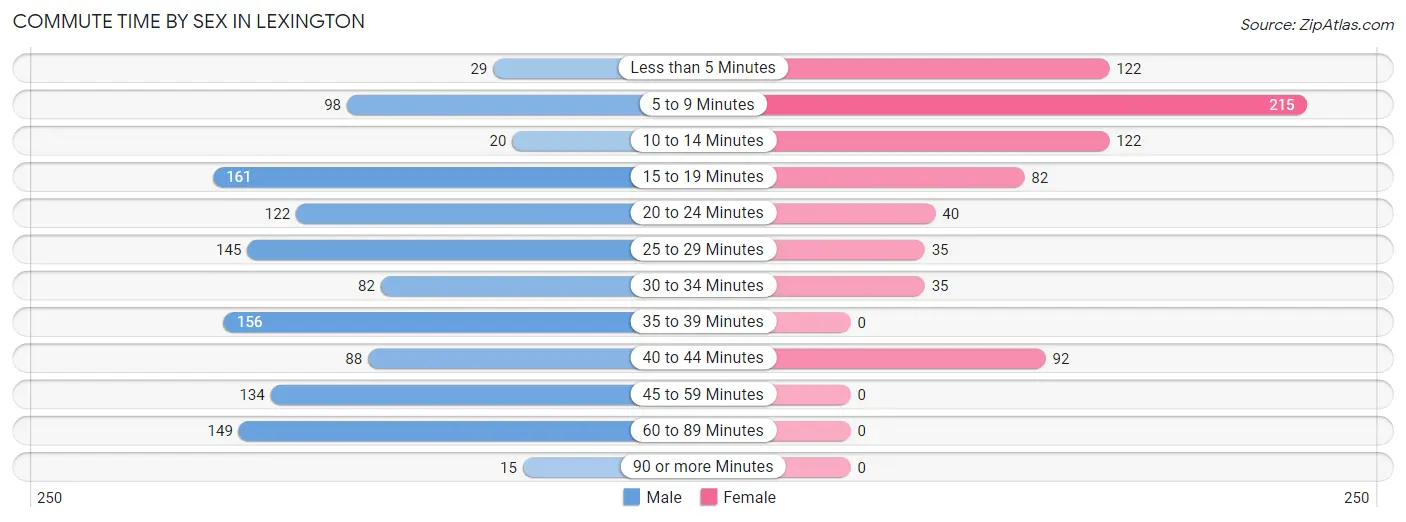
| Commute Time | Male | Female |
| Less than 5 Minutes | 29 (2.4%) | 122 (16.4%) |
| 5 to 9 Minutes | 98 (8.2%) | 215 (28.9%) |
| 10 to 14 Minutes | 20 (1.7%) | 122 (16.4%) |
| 15 to 19 Minutes | 161 (13.4%) | 82 (11.0%) |
| 20 to 24 Minutes | 122 (10.2%) | 40 (5.4%) |
| 25 to 29 Minutes | 145 (12.1%) | 35 (4.7%) |
| 30 to 34 Minutes | 82 (6.8%) | 35 (4.7%) |
| 35 to 39 Minutes | 156 (13.0%) | 0 (0.0%) |
| 40 to 44 Minutes | 88 (7.3%) | 92 (12.4%) |
| 45 to 59 Minutes | 134 (11.2%) | 0 (0.0%) |
| 60 to 89 Minutes | 149 (12.4%) | 0 (0.0%) |
| 90 or more Minutes | 15 (1.3%) | 0 (0.0%) |
Time of Departure to Work by Sex in Lexington
The most frequent times of departure to work in Lexington are 6:30 AM to 6:59 AM (317, 26.4%) for males and 7:00 AM to 7:29 AM (163, 21.9%) for females.
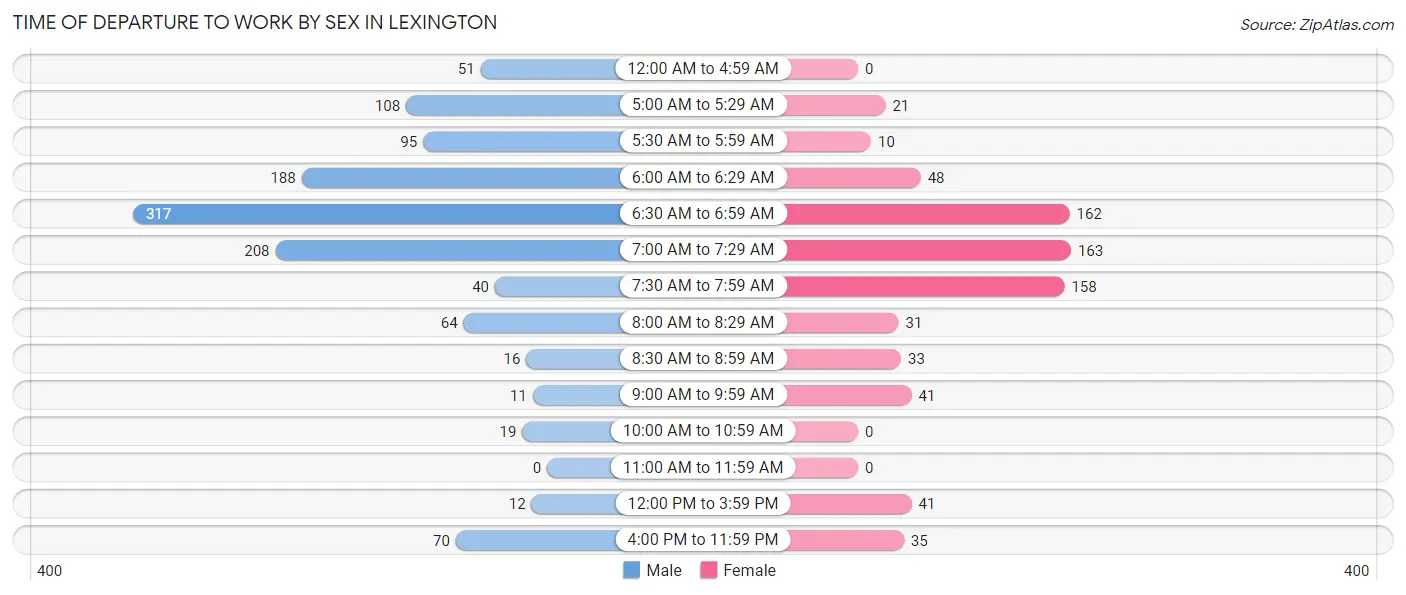
| Time of Departure | Male | Female |
| 12:00 AM to 4:59 AM | 51 (4.3%) | 0 (0.0%) |
| 5:00 AM to 5:29 AM | 108 (9.0%) | 21 (2.8%) |
| 5:30 AM to 5:59 AM | 95 (7.9%) | 10 (1.3%) |
| 6:00 AM to 6:29 AM | 188 (15.7%) | 48 (6.5%) |
| 6:30 AM to 6:59 AM | 317 (26.4%) | 162 (21.8%) |
| 7:00 AM to 7:29 AM | 208 (17.3%) | 163 (21.9%) |
| 7:30 AM to 7:59 AM | 40 (3.3%) | 158 (21.3%) |
| 8:00 AM to 8:29 AM | 64 (5.3%) | 31 (4.2%) |
| 8:30 AM to 8:59 AM | 16 (1.3%) | 33 (4.4%) |
| 9:00 AM to 9:59 AM | 11 (0.9%) | 41 (5.5%) |
| 10:00 AM to 10:59 AM | 19 (1.6%) | 0 (0.0%) |
| 11:00 AM to 11:59 AM | 0 (0.0%) | 0 (0.0%) |
| 12:00 PM to 3:59 PM | 12 (1.0%) | 41 (5.5%) |
| 4:00 PM to 11:59 PM | 70 (5.8%) | 35 (4.7%) |
| Total | 1,199 (100.0%) | 743 (100.0%) |
Housing Occupancy in Lexington
Occupancy by Ownership in Lexington
Of the total 1,713 dwellings in Lexington, owner-occupied units account for 1,024 (59.8%), while renter-occupied units make up 689 (40.2%).
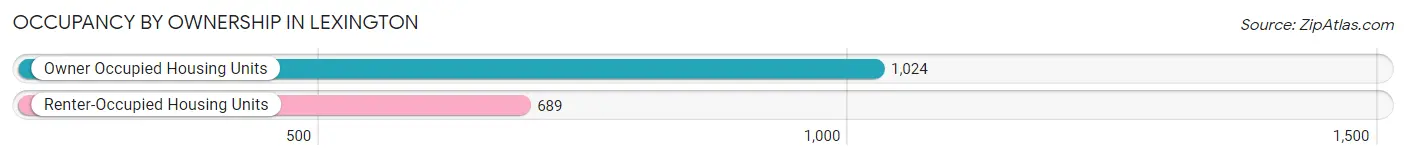
| Occupancy | # Housing Units | % Housing Units |
| Owner Occupied Housing Units | 1,024 | 59.8% |
| Renter-Occupied Housing Units | 689 | 40.2% |
| Total Occupied Housing Units | 1,713 | 100.0% |
Occupancy by Household Size in Lexington
| Household Size | # Housing Units | % Housing Units |
| 1-Person Household | 567 | 33.1% |
| 2-Person Household | 578 | 33.7% |
| 3-Person Household | 181 | 10.6% |
| 4+ Person Household | 387 | 22.6% |
| Total Housing Units | 1,713 | 100.0% |
Occupancy by Ownership by Household Size in Lexington
| Household Size | Owner-occupied | Renter-occupied |
| 1-Person Household | 323 (57.0%) | 244 (43.0%) |
| 2-Person Household | 375 (64.9%) | 203 (35.1%) |
| 3-Person Household | 77 (42.5%) | 104 (57.5%) |
| 4+ Person Household | 249 (64.3%) | 138 (35.7%) |
| Total Housing Units | 1,024 (59.8%) | 689 (40.2%) |
Occupancy by Educational Attainment in Lexington
| Household Size | Owner-occupied | Renter-occupied |
| Less than High School | 0 (0.0%) | 28 (100.0%) |
| High School Diploma | 435 (55.9%) | 343 (44.1%) |
| College/Associate Degree | 282 (54.3%) | 237 (45.7%) |
| Bachelor's Degree or higher | 307 (79.1%) | 81 (20.9%) |
Occupancy by Age of Householder in Lexington
| Age Bracket | # Households | % Households |
| Under 35 Years | 505 | 29.5% |
| 35 to 44 Years | 260 | 15.2% |
| 45 to 54 Years | 121 | 7.1% |
| 55 to 64 Years | 386 | 22.5% |
| 65 to 74 Years | 197 | 11.5% |
| 75 to 84 Years | 230 | 13.4% |
| 85 Years and Over | 14 | 0.8% |
| Total | 1,713 | 100.0% |
Housing Finances in Lexington
Median Income by Occupancy in Lexington
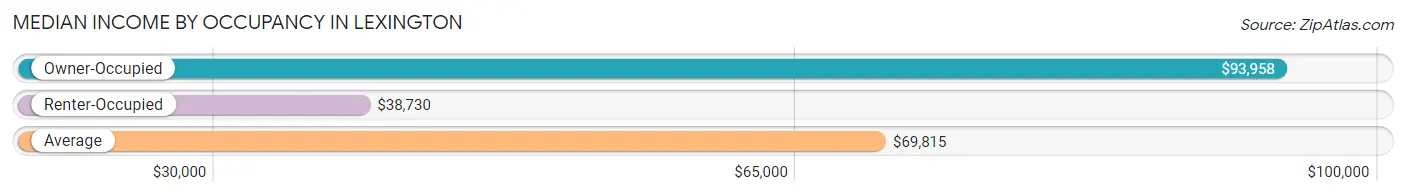
| Occupancy Type | # Households | Median Income |
| Owner-Occupied | 1,024 (59.8%) | $93,958 |
| Renter-Occupied | 689 (40.2%) | $38,730 |
| Average | 1,713 (100.0%) | $69,815 |
Occupancy by Householder Income Bracket in Lexington
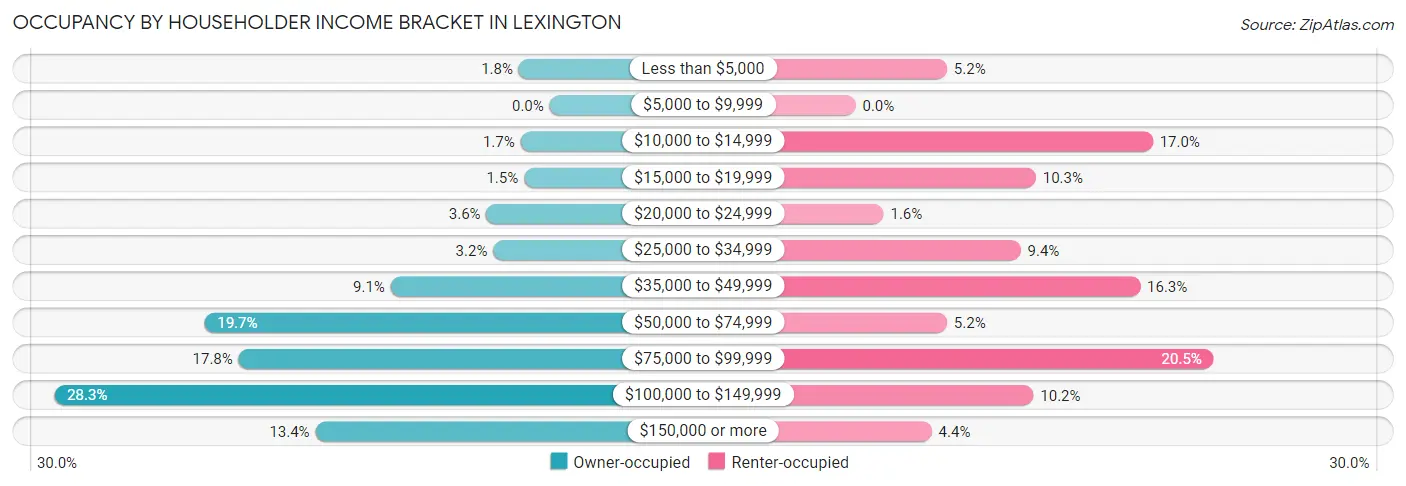
| Income Bracket | Owner-occupied | Renter-occupied |
| Less than $5,000 | 18 (1.8%) | 36 (5.2%) |
| $5,000 to $9,999 | 0 (0.0%) | 0 (0.0%) |
| $10,000 to $14,999 | 17 (1.7%) | 117 (17.0%) |
| $15,000 to $19,999 | 15 (1.5%) | 71 (10.3%) |
| $20,000 to $24,999 | 37 (3.6%) | 11 (1.6%) |
| $25,000 to $34,999 | 33 (3.2%) | 65 (9.4%) |
| $35,000 to $49,999 | 93 (9.1%) | 112 (16.3%) |
| $50,000 to $74,999 | 202 (19.7%) | 36 (5.2%) |
| $75,000 to $99,999 | 182 (17.8%) | 141 (20.5%) |
| $100,000 to $149,999 | 290 (28.3%) | 70 (10.2%) |
| $150,000 or more | 137 (13.4%) | 30 (4.3%) |
| Total | 1,024 (100.0%) | 689 (100.0%) |
Monthly Housing Cost Tiers in Lexington
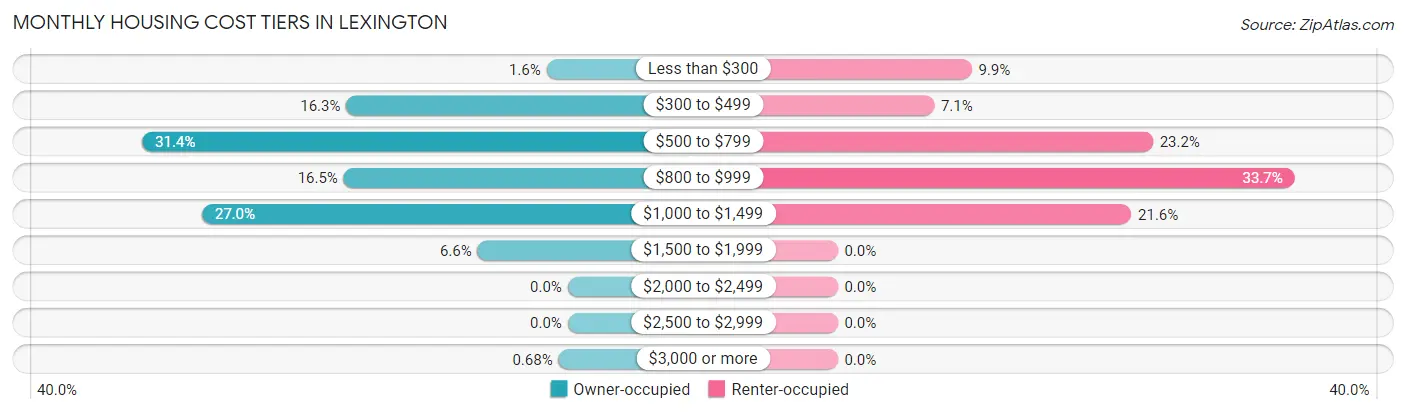
| Monthly Cost | Owner-occupied | Renter-occupied |
| Less than $300 | 16 (1.6%) | 68 (9.9%) |
| $300 to $499 | 167 (16.3%) | 49 (7.1%) |
| $500 to $799 | 321 (31.4%) | 160 (23.2%) |
| $800 to $999 | 169 (16.5%) | 232 (33.7%) |
| $1,000 to $1,499 | 276 (27.0%) | 149 (21.6%) |
| $1,500 to $1,999 | 68 (6.6%) | 0 (0.0%) |
| $2,000 to $2,499 | 0 (0.0%) | 0 (0.0%) |
| $2,500 to $2,999 | 0 (0.0%) | 0 (0.0%) |
| $3,000 or more | 7 (0.7%) | 0 (0.0%) |
| Total | 1,024 (100.0%) | 689 (100.0%) |
Physical Housing Characteristics in Lexington
Housing Structures in Lexington
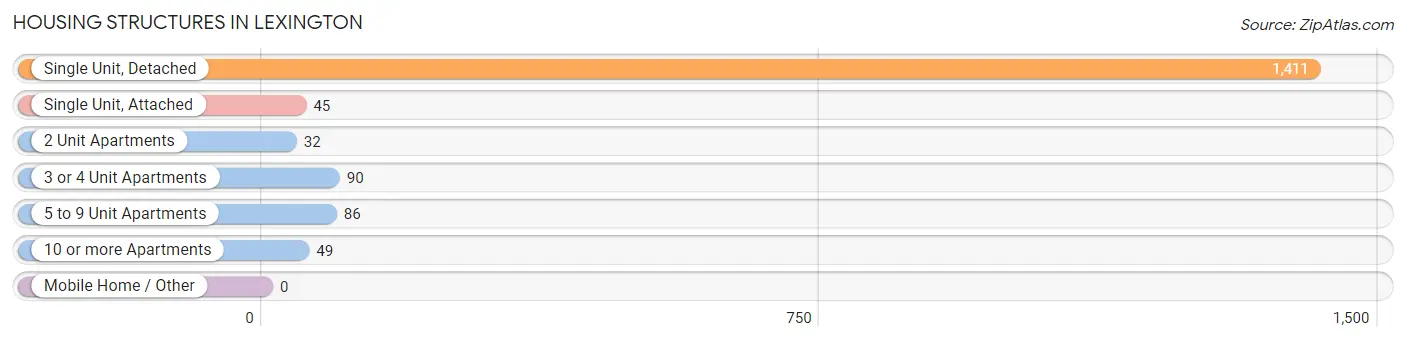
| Structure Type | # Housing Units | % Housing Units |
| Single Unit, Detached | 1,411 | 82.4% |
| Single Unit, Attached | 45 | 2.6% |
| 2 Unit Apartments | 32 | 1.9% |
| 3 or 4 Unit Apartments | 90 | 5.2% |
| 5 to 9 Unit Apartments | 86 | 5.0% |
| 10 or more Apartments | 49 | 2.9% |
| Mobile Home / Other | 0 | 0.0% |
| Total | 1,713 | 100.0% |
Housing Structures by Occupancy in Lexington
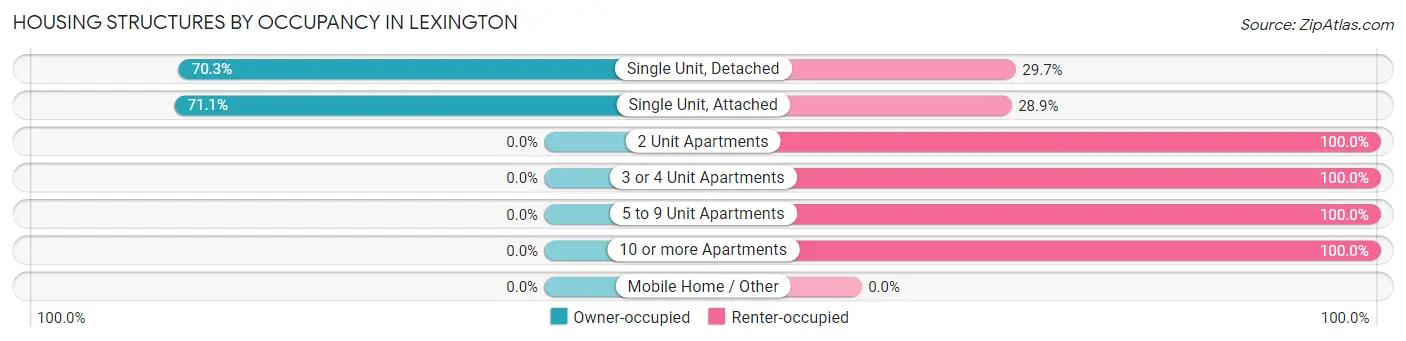
| Structure Type | Owner-occupied | Renter-occupied |
| Single Unit, Detached | 992 (70.3%) | 419 (29.7%) |
| Single Unit, Attached | 32 (71.1%) | 13 (28.9%) |
| 2 Unit Apartments | 0 (0.0%) | 32 (100.0%) |
| 3 or 4 Unit Apartments | 0 (0.0%) | 90 (100.0%) |
| 5 to 9 Unit Apartments | 0 (0.0%) | 86 (100.0%) |
| 10 or more Apartments | 0 (0.0%) | 49 (100.0%) |
| Mobile Home / Other | 0 (0.0%) | 0 (0.0%) |
| Total | 1,024 (59.8%) | 689 (40.2%) |
Housing Structures by Number of Rooms in Lexington
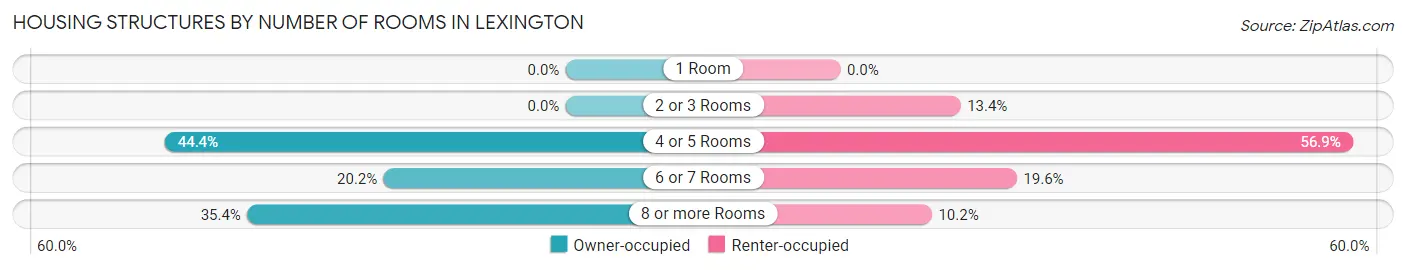
| Number of Rooms | Owner-occupied | Renter-occupied |
| 1 Room | 0 (0.0%) | 0 (0.0%) |
| 2 or 3 Rooms | 0 (0.0%) | 92 (13.4%) |
| 4 or 5 Rooms | 455 (44.4%) | 392 (56.9%) |
| 6 or 7 Rooms | 207 (20.2%) | 135 (19.6%) |
| 8 or more Rooms | 362 (35.3%) | 70 (10.2%) |
| Total | 1,024 (100.0%) | 689 (100.0%) |
Housing Structure by Heating Type in Lexington
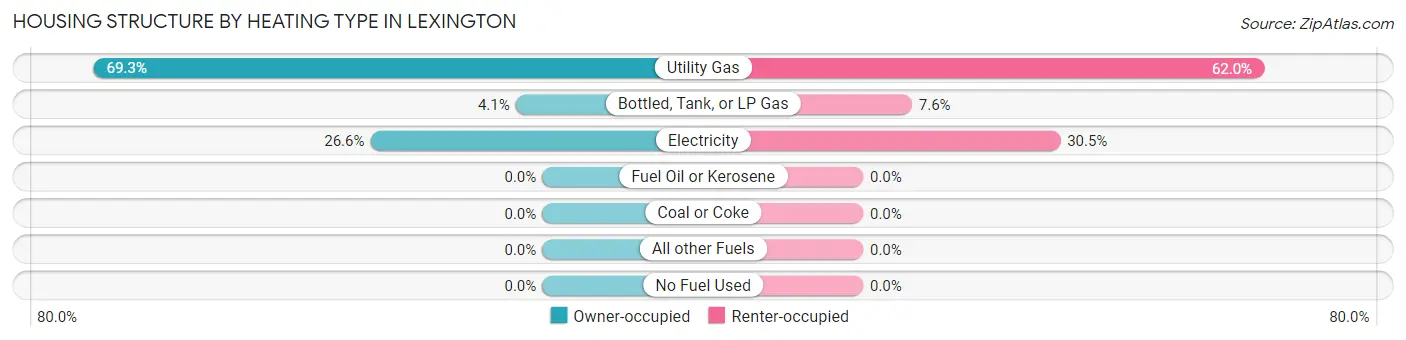
| Heating Type | Owner-occupied | Renter-occupied |
| Utility Gas | 710 (69.3%) | 427 (62.0%) |
| Bottled, Tank, or LP Gas | 42 (4.1%) | 52 (7.5%) |
| Electricity | 272 (26.6%) | 210 (30.5%) |
| Fuel Oil or Kerosene | 0 (0.0%) | 0 (0.0%) |
| Coal or Coke | 0 (0.0%) | 0 (0.0%) |
| All other Fuels | 0 (0.0%) | 0 (0.0%) |
| No Fuel Used | 0 (0.0%) | 0 (0.0%) |
| Total | 1,024 (100.0%) | 689 (100.0%) |
Household Vehicle Usage in Lexington
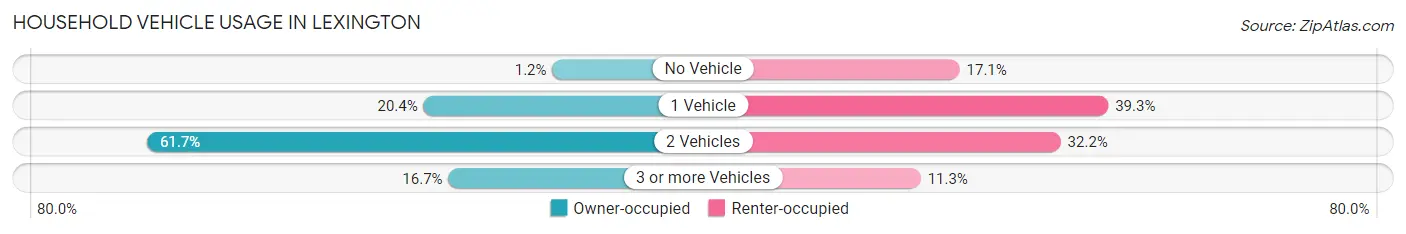
| Vehicles per Household | Owner-occupied | Renter-occupied |
| No Vehicle | 12 (1.2%) | 118 (17.1%) |
| 1 Vehicle | 209 (20.4%) | 271 (39.3%) |
| 2 Vehicles | 632 (61.7%) | 222 (32.2%) |
| 3 or more Vehicles | 171 (16.7%) | 78 (11.3%) |
| Total | 1,024 (100.0%) | 689 (100.0%) |
Real Estate & Mortgages in Lexington
Real Estate and Mortgage Overview in Lexington
| Characteristic | Without Mortgage | With Mortgage |
| Housing Units | 471 | 553 |
| Median Property Value | $141,100 | $137,800 |
| Median Household Income | $111,641 | $116 |
| Monthly Housing Costs | $546 | $7 |
| Real Estate Taxes | $1,379 | $20 |
Property Value by Mortgage Status in Lexington
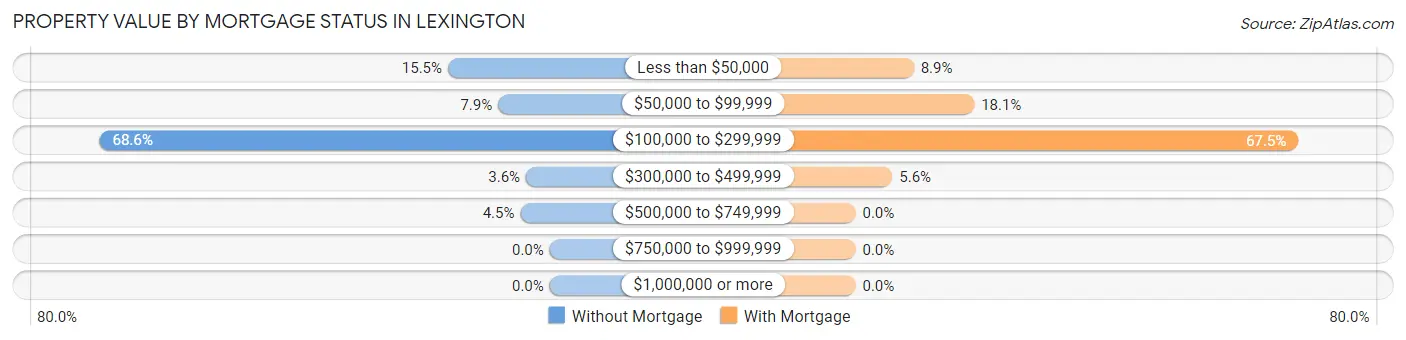
| Property Value | Without Mortgage | With Mortgage |
| Less than $50,000 | 73 (15.5%) | 49 (8.9%) |
| $50,000 to $99,999 | 37 (7.9%) | 100 (18.1%) |
| $100,000 to $299,999 | 323 (68.6%) | 373 (67.4%) |
| $300,000 to $499,999 | 17 (3.6%) | 31 (5.6%) |
| $500,000 to $749,999 | 21 (4.5%) | 0 (0.0%) |
| $750,000 to $999,999 | 0 (0.0%) | 0 (0.0%) |
| $1,000,000 or more | 0 (0.0%) | 0 (0.0%) |
| Total | 471 (100.0%) | 553 (100.0%) |
Household Income by Mortgage Status in Lexington
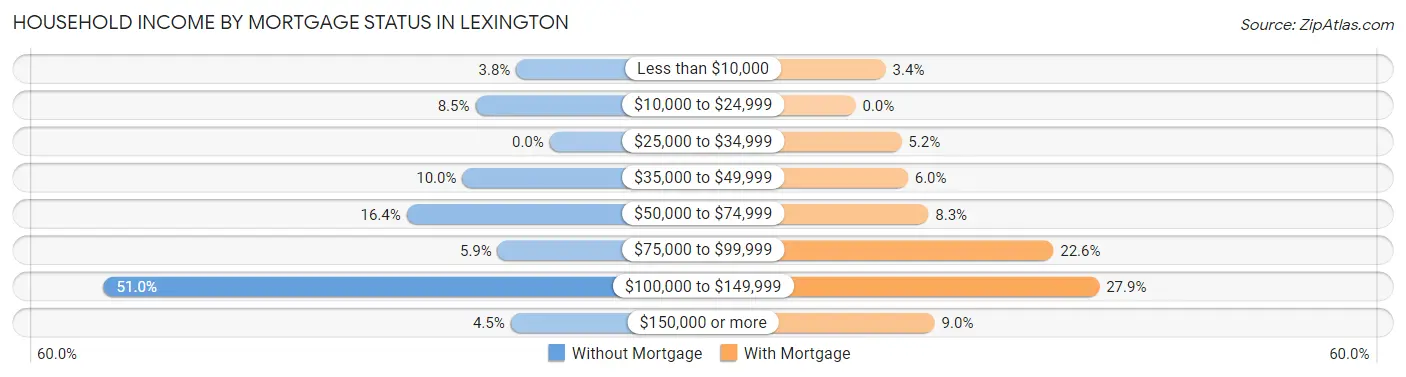
| Household Income | Without Mortgage | With Mortgage |
| Less than $10,000 | 18 (3.8%) | 19 (3.4%) |
| $10,000 to $24,999 | 40 (8.5%) | 0 (0.0%) |
| $25,000 to $34,999 | 0 (0.0%) | 29 (5.2%) |
| $35,000 to $49,999 | 47 (10.0%) | 33 (6.0%) |
| $50,000 to $74,999 | 77 (16.4%) | 46 (8.3%) |
| $75,000 to $99,999 | 28 (5.9%) | 125 (22.6%) |
| $100,000 to $149,999 | 240 (51.0%) | 154 (27.9%) |
| $150,000 or more | 21 (4.5%) | 50 (9.0%) |
| Total | 471 (100.0%) | 553 (100.0%) |
Property Value to Household Income Ratio in Lexington
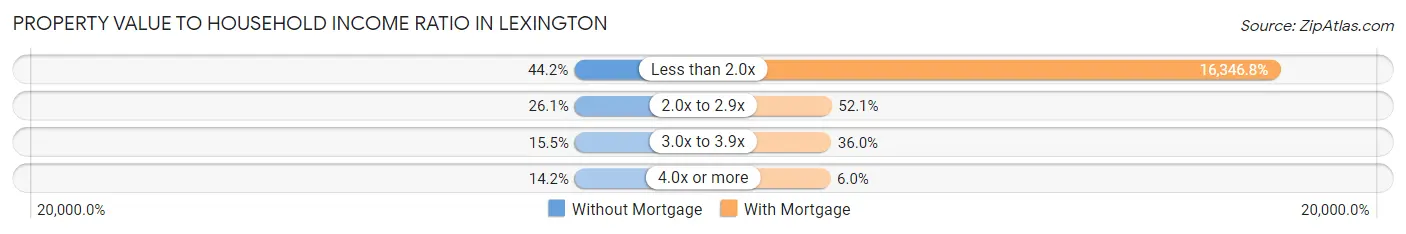
| Value-to-Income Ratio | Without Mortgage | With Mortgage |
| Less than 2.0x | 208 (44.2%) | 90,398 (16,346.8%) |
| 2.0x to 2.9x | 123 (26.1%) | 288 (52.1%) |
| 3.0x to 3.9x | 73 (15.5%) | 199 (36.0%) |
| 4.0x or more | 67 (14.2%) | 33 (6.0%) |
| Total | 471 (100.0%) | 553 (100.0%) |
Real Estate Taxes by Mortgage Status in Lexington
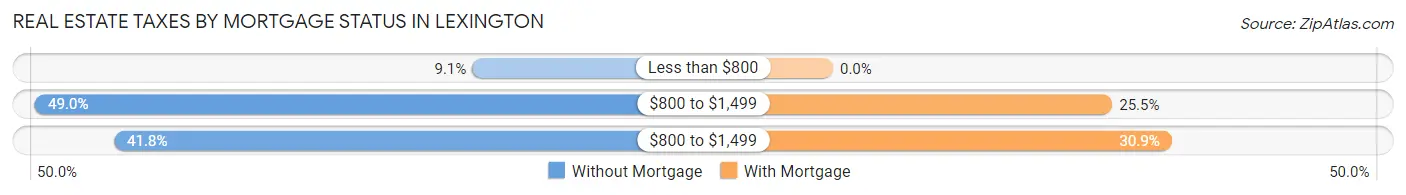
| Property Taxes | Without Mortgage | With Mortgage |
| Less than $800 | 43 (9.1%) | 0 (0.0%) |
| $800 to $1,499 | 231 (49.0%) | 141 (25.5%) |
| $800 to $1,499 | 197 (41.8%) | 171 (30.9%) |
| Total | 471 (100.0%) | 553 (100.0%) |
Health & Disability in Lexington
Health Insurance Coverage by Age in Lexington
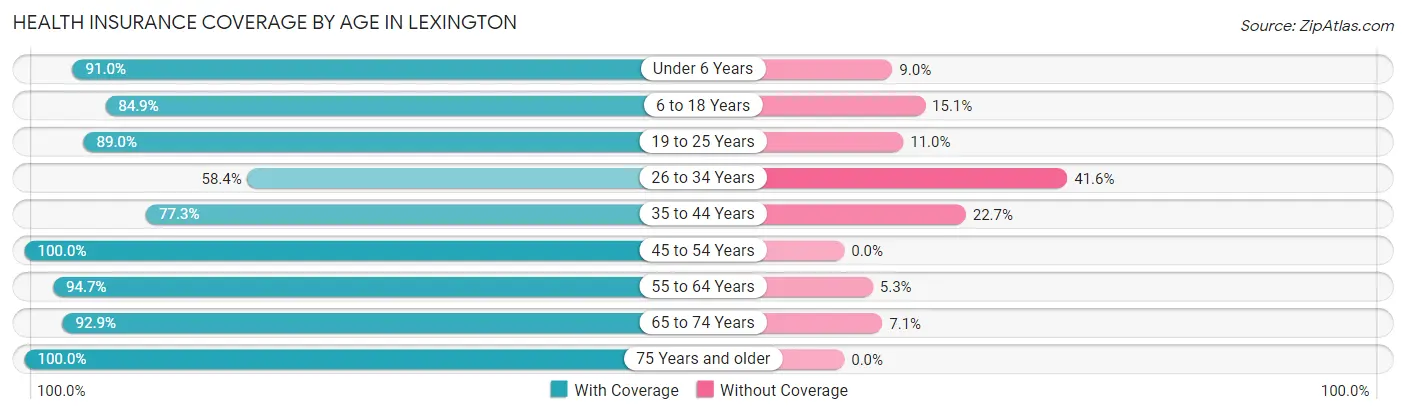
| Age Bracket | With Coverage | Without Coverage |
| Under 6 Years | 284 (91.0%) | 28 (9.0%) |
| 6 to 18 Years | 772 (84.9%) | 137 (15.1%) |
| 19 to 25 Years | 291 (89.0%) | 36 (11.0%) |
| 26 to 34 Years | 406 (58.4%) | 289 (41.6%) |
| 35 to 44 Years | 471 (77.3%) | 138 (22.7%) |
| 45 to 54 Years | 342 (100.0%) | 0 (0.0%) |
| 55 to 64 Years | 586 (94.7%) | 33 (5.3%) |
| 65 to 74 Years | 301 (92.9%) | 23 (7.1%) |
| 75 Years and older | 287 (100.0%) | 0 (0.0%) |
| Total | 3,740 (84.5%) | 684 (15.5%) |
Health Insurance Coverage by Citizenship Status in Lexington
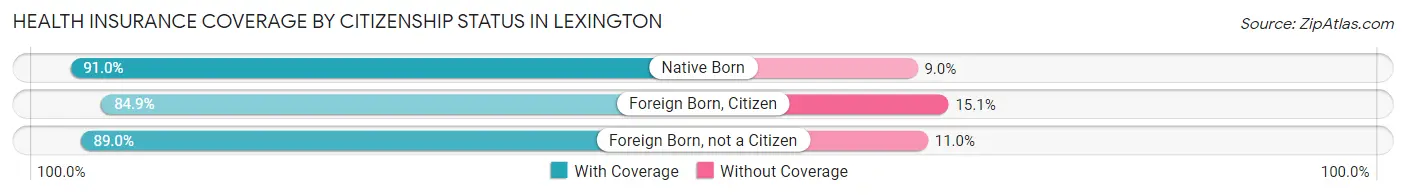
| Citizenship Status | With Coverage | Without Coverage |
| Native Born | 284 (91.0%) | 28 (9.0%) |
| Foreign Born, Citizen | 772 (84.9%) | 137 (15.1%) |
| Foreign Born, not a Citizen | 291 (89.0%) | 36 (11.0%) |
Health Insurance Coverage by Household Income in Lexington
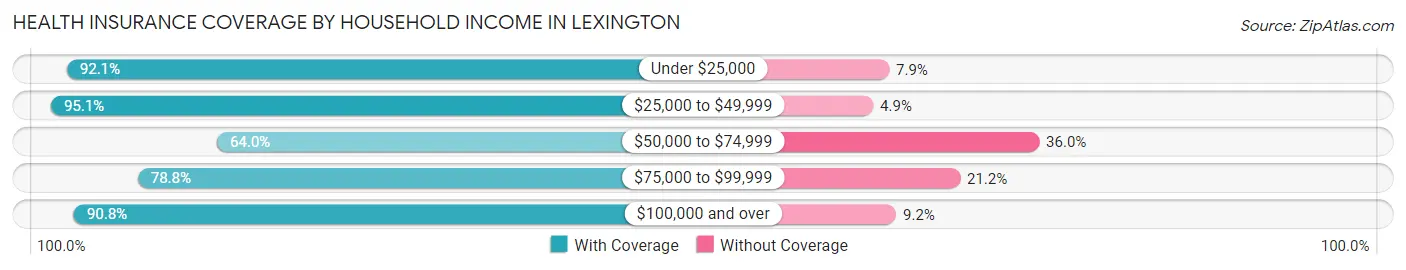
| Household Income | With Coverage | Without Coverage |
| Under $25,000 | 488 (92.1%) | 42 (7.9%) |
| $25,000 to $49,999 | 616 (95.1%) | 32 (4.9%) |
| $50,000 to $74,999 | 456 (64.0%) | 257 (36.0%) |
| $75,000 to $99,999 | 810 (78.8%) | 218 (21.2%) |
| $100,000 and over | 1,326 (90.8%) | 135 (9.2%) |
Public vs Private Health Insurance Coverage by Age in Lexington
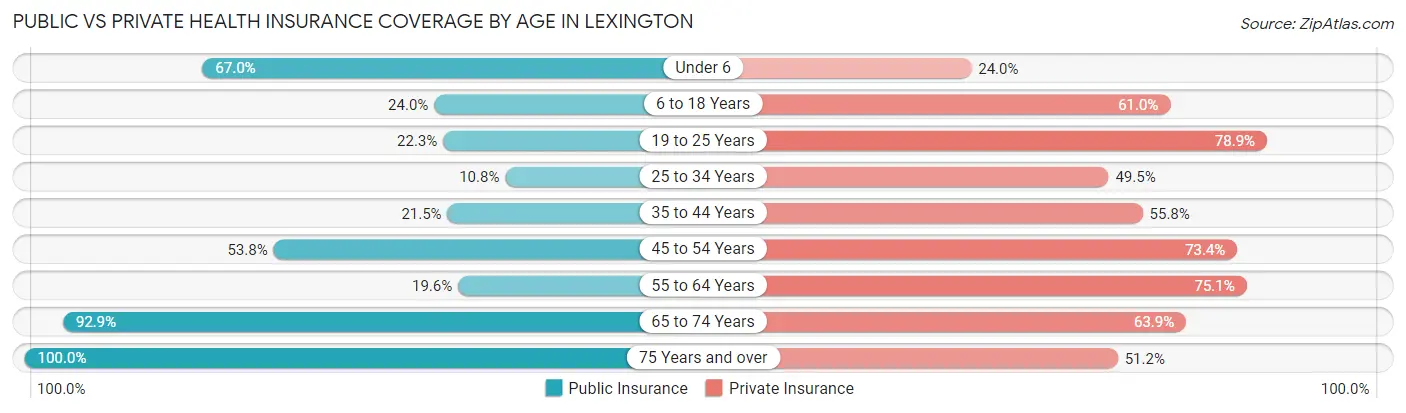
| Age Bracket | Public Insurance | Private Insurance |
| Under 6 | 209 (67.0%) | 75 (24.0%) |
| 6 to 18 Years | 218 (24.0%) | 554 (61.0%) |
| 19 to 25 Years | 73 (22.3%) | 258 (78.9%) |
| 25 to 34 Years | 75 (10.8%) | 344 (49.5%) |
| 35 to 44 Years | 131 (21.5%) | 340 (55.8%) |
| 45 to 54 Years | 184 (53.8%) | 251 (73.4%) |
| 55 to 64 Years | 121 (19.6%) | 465 (75.1%) |
| 65 to 74 Years | 301 (92.9%) | 207 (63.9%) |
| 75 Years and over | 287 (100.0%) | 147 (51.2%) |
| Total | 1,599 (36.1%) | 2,641 (59.7%) |
Disability Status by Sex by Age in Lexington
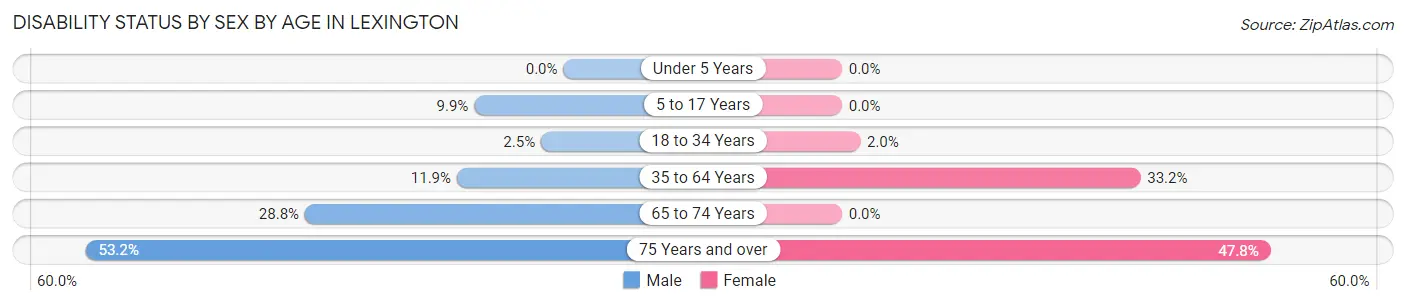
| Age Bracket | Male | Female |
| Under 5 Years | 0 (0.0%) | 0 (0.0%) |
| 5 to 17 Years | 56 (9.9%) | 0 (0.0%) |
| 18 to 34 Years | 12 (2.5%) | 11 (2.0%) |
| 35 to 64 Years | 102 (11.9%) | 236 (33.2%) |
| 65 to 74 Years | 40 (28.8%) | 0 (0.0%) |
| 75 Years and over | 58 (53.2%) | 85 (47.7%) |
Disability Class by Sex by Age in Lexington
Disability Class: Hearing Difficulty
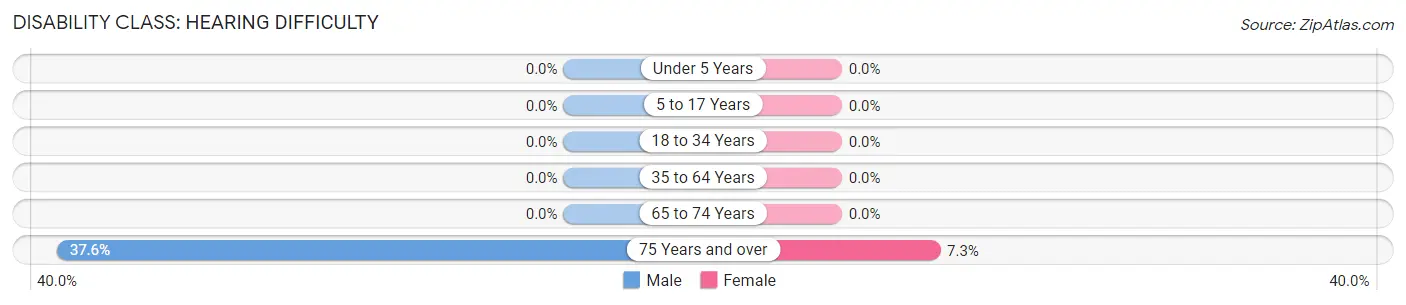
| Age Bracket | Male | Female |
| Under 5 Years | 0 (0.0%) | 0 (0.0%) |
| 5 to 17 Years | 0 (0.0%) | 0 (0.0%) |
| 18 to 34 Years | 0 (0.0%) | 0 (0.0%) |
| 35 to 64 Years | 0 (0.0%) | 0 (0.0%) |
| 65 to 74 Years | 0 (0.0%) | 0 (0.0%) |
| 75 Years and over | 41 (37.6%) | 13 (7.3%) |
Disability Class: Vision Difficulty
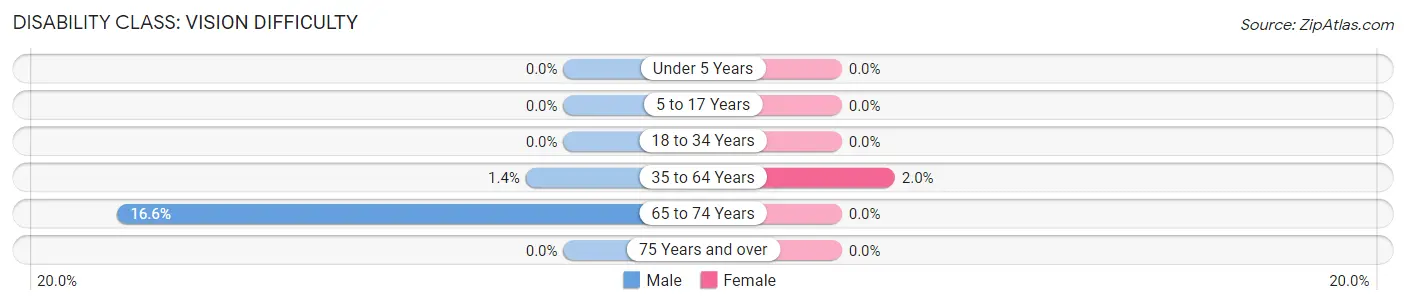
| Age Bracket | Male | Female |
| Under 5 Years | 0 (0.0%) | 0 (0.0%) |
| 5 to 17 Years | 0 (0.0%) | 0 (0.0%) |
| 18 to 34 Years | 0 (0.0%) | 0 (0.0%) |
| 35 to 64 Years | 12 (1.4%) | 14 (2.0%) |
| 65 to 74 Years | 23 (16.6%) | 0 (0.0%) |
| 75 Years and over | 0 (0.0%) | 0 (0.0%) |
Disability Class: Cognitive Difficulty
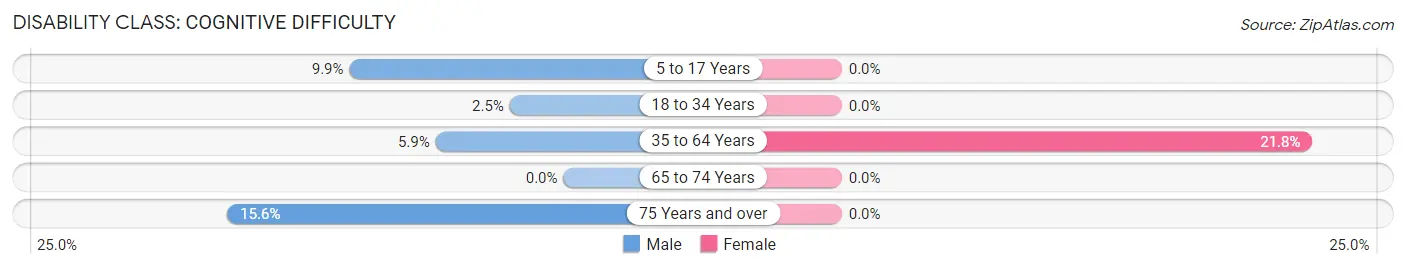
| Age Bracket | Male | Female |
| 5 to 17 Years | 56 (9.9%) | 0 (0.0%) |
| 18 to 34 Years | 12 (2.5%) | 0 (0.0%) |
| 35 to 64 Years | 51 (5.9%) | 155 (21.8%) |
| 65 to 74 Years | 0 (0.0%) | 0 (0.0%) |
| 75 Years and over | 17 (15.6%) | 0 (0.0%) |
Disability Class: Ambulatory Difficulty
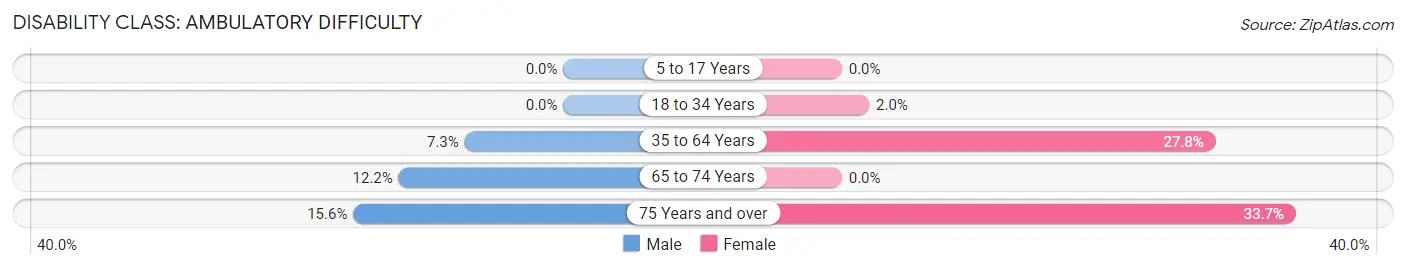
| Age Bracket | Male | Female |
| 5 to 17 Years | 0 (0.0%) | 0 (0.0%) |
| 18 to 34 Years | 0 (0.0%) | 11 (2.0%) |
| 35 to 64 Years | 63 (7.3%) | 197 (27.8%) |
| 65 to 74 Years | 17 (12.2%) | 0 (0.0%) |
| 75 Years and over | 17 (15.6%) | 60 (33.7%) |
Disability Class: Self-Care Difficulty
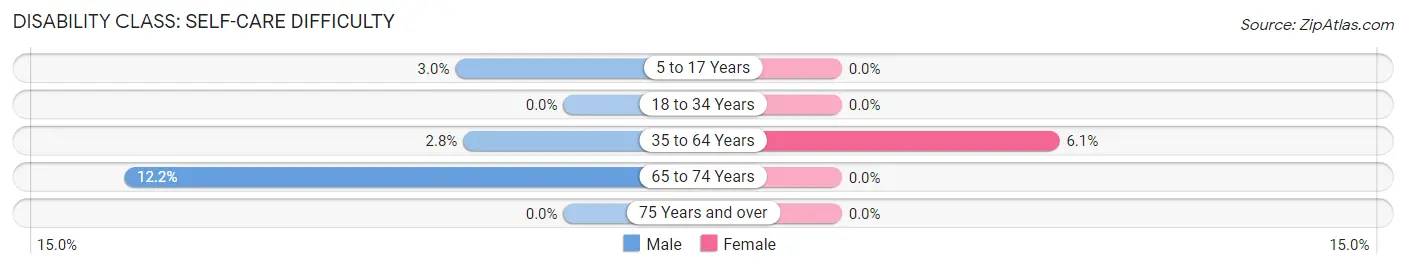
| Age Bracket | Male | Female |
| 5 to 17 Years | 17 (3.0%) | 0 (0.0%) |
| 18 to 34 Years | 0 (0.0%) | 0 (0.0%) |
| 35 to 64 Years | 24 (2.8%) | 43 (6.1%) |
| 65 to 74 Years | 17 (12.2%) | 0 (0.0%) |
| 75 Years and over | 0 (0.0%) | 0 (0.0%) |
Technology Access in Lexington
Computing Device Access in Lexington
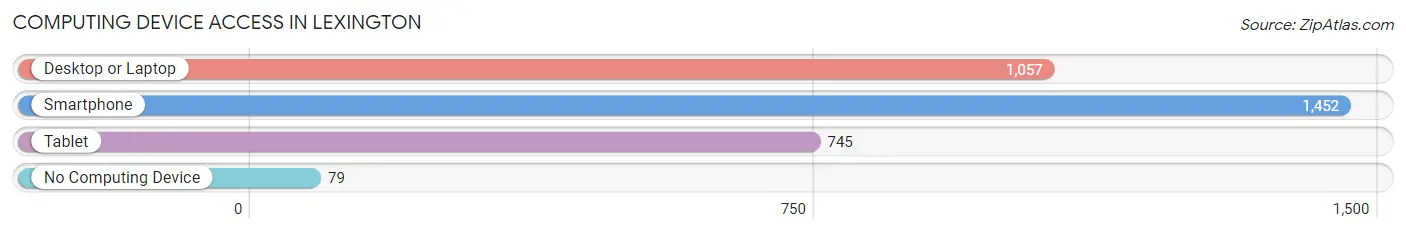
| Device Type | # Households | % Households |
| Desktop or Laptop | 1,057 | 61.7% |
| Smartphone | 1,452 | 84.8% |
| Tablet | 745 | 43.5% |
| No Computing Device | 79 | 4.6% |
| Total | 1,713 | 100.0% |
Internet Access in Lexington
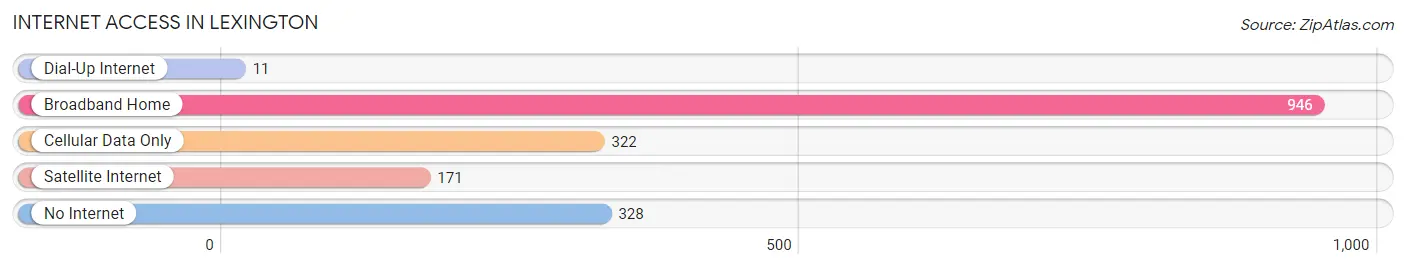
| Internet Type | # Households | % Households |
| Dial-Up Internet | 11 | 0.6% |
| Broadband Home | 946 | 55.2% |
| Cellular Data Only | 322 | 18.8% |
| Satellite Internet | 171 | 10.0% |
| No Internet | 328 | 19.2% |
| Total | 1,713 | 100.0% |
Lexington Summary
Lexington, Missouri is a small city located in Lafayette County, Missouri. It is the county seat of Lafayette County and is located about 40 miles east of Kansas City. The city has a population of about 4,500 people and is part of the Kansas City metropolitan area.
History
The area that is now Lexington was first settled in 1819 by a group of settlers from Kentucky. The town was originally called “Lexington” after the city of Lexington, Kentucky. The town was officially incorporated in 1837 and was named the county seat of Lafayette County in 1839.
In the late 19th century, Lexington was a major stop on the Hannibal and St. Joseph Railroad. The railroad brought many new settlers to the area and helped to spur economic growth. The town also became a major center for the production of hemp and tobacco.
In the early 20th century, Lexington was a major center for the production of automobiles. The town was home to the Lexington Motor Company, which produced cars from 1910 to 1915. The company was eventually bought out by the Ford Motor Company.
Geography
Lexington is located in the northern part of Lafayette County, Missouri. The city is situated on the Missouri River and is surrounded by rolling hills and farmland. The city has a total area of 4.2 square miles, all of which is land.
The climate in Lexington is humid continental, with hot summers and cold winters. The average annual temperature is around 54 degrees Fahrenheit. The average annual precipitation is around 40 inches.
Economy
The economy of Lexington is largely based on agriculture and manufacturing. The city is home to several large agricultural companies, including the Cargill Corporation and the Monsanto Company. The city is also home to several manufacturing companies, including the Lexington Motor Company and the Ford Motor Company.
The city is also home to several small businesses, including restaurants, retail stores, and professional services. The city is also home to several educational institutions, including the University of Missouri-Columbia and the University of Central Missouri.
Demographics
As of the 2010 census, the population of Lexington was 4,453. The racial makeup of the city was 87.3% White, 8.2% African American, 0.3% Native American, 0.7% Asian, 0.1% Pacific Islander, and 2.4% from other races. Hispanic or Latino of any race were 3.2% of the population.
The median income for a household in the city was $37,917, and the median income for a family was $45,938. The per capita income for the city was $19,945. About 11.2% of families and 14.2% of the population were below the poverty line, including 19.2% of those under age 18 and 8.2% of those age 65 or over.
Common Questions
What is Per Capita Income in Lexington?
Per Capita income in Lexington is $31,351.
What is the Median Family Income in Lexington?
Median Family Income in Lexington is $95,869.
What is the Median Household income in Lexington?
Median Household Income in Lexington is $69,815.
What is Income or Wage Gap in Lexington?
Income or Wage Gap in Lexington is 7.1%.
Women in Lexington earn 92.9 cents for every dollar earned by a man.
What is Inequality or Gini Index in Lexington?
Inequality or Gini Index in Lexington is 0.38.
What is the Total Population of Lexington?
Total Population of Lexington is 4,592.
What is the Total Male Population of Lexington?
Total Male Population of Lexington is 2,429.
What is the Total Female Population of Lexington?
Total Female Population of Lexington is 2,163.
What is the Ratio of Males per 100 Females in Lexington?
There are 112.30 Males per 100 Females in Lexington.
What is the Ratio of Females per 100 Males in Lexington?
There are 89.05 Females per 100 Males in Lexington.
What is the Median Population Age in Lexington?
Median Population Age in Lexington is 34.5 Years.
What is the Average Family Size in Lexington
Average Family Size in Lexington is 3.4 People.
What is the Average Household Size in Lexington
Average Household Size in Lexington is 2.6 People.
How Large is the Labor Force in Lexington?
There are 2,269 People in the Labor Forcein in Lexington.
What is the Percentage of People in the Labor Force in Lexington?
64.3% of People are in the Labor Force in Lexington.
What is the Unemployment Rate in Lexington?
Unemployment Rate in Lexington is 4.3%.