Liberal, MO Map & Demographics
Liberal Map
Liberal Overview
$24,697
PER CAPITA INCOME
$68,594
AVG FAMILY INCOME
$49,464
AVG HOUSEHOLD INCOME
32.2%
WAGE / INCOME GAP [ % ]
67.8¢/ $1
WAGE / INCOME GAP [ $ ]
0.43
INEQUALITY / GINI INDEX
794
TOTAL POPULATION
384
MALE POPULATION
410
FEMALE POPULATION
93.66
MALES / 100 FEMALES
106.77
FEMALES / 100 MALES
40.8
MEDIAN AGE
3.2
AVG FAMILY SIZE
2.5
AVG HOUSEHOLD SIZE
347
LABOR FORCE [ PEOPLE ]
56.6%
PERCENT IN LABOR FORCE
14.2%
UNEMPLOYMENT RATE
Liberal Zip Codes
Liberal Area Codes
Income in Liberal
Income Overview in Liberal
Per Capita Income in Liberal is $24,697, while median incomes of families and households are $68,594 and $49,464 respectively.
| Characteristic | Number | Measure |
| Per Capita Income | 794 | $24,697 |
| Median Family Income | 193 | $68,594 |
| Mean Family Income | 193 | $79,973 |
| Median Household Income | 319 | $49,464 |
| Mean Household Income | 319 | $61,071 |
| Income Deficit | 193 | $0 |
| Wage / Income Gap (%) | 794 | 32.24% |
| Wage / Income Gap ($) | 794 | 67.76¢ per $1 |
| Gini / Inequality Index | 794 | 0.43 |
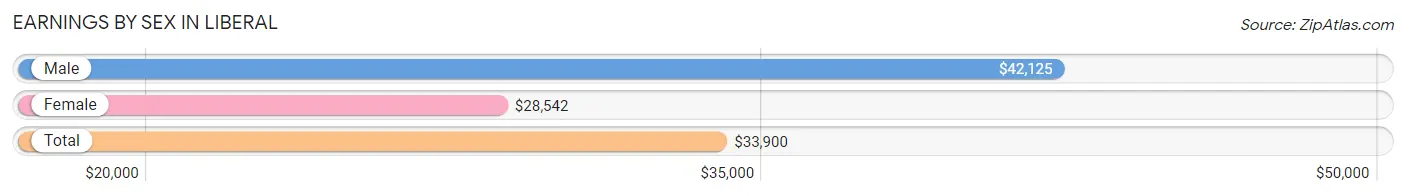
Earnings by Sex in Liberal
Average Earnings in Liberal are $33,900, $42,125 for men and $28,542 for women, a difference of 32.2%.
| Sex | Number | Average Earnings |
| Male | 189 (52.2%) | $42,125 |
| Female | 173 (47.8%) | $28,542 |
| Total | 362 (100.0%) | $33,900 |
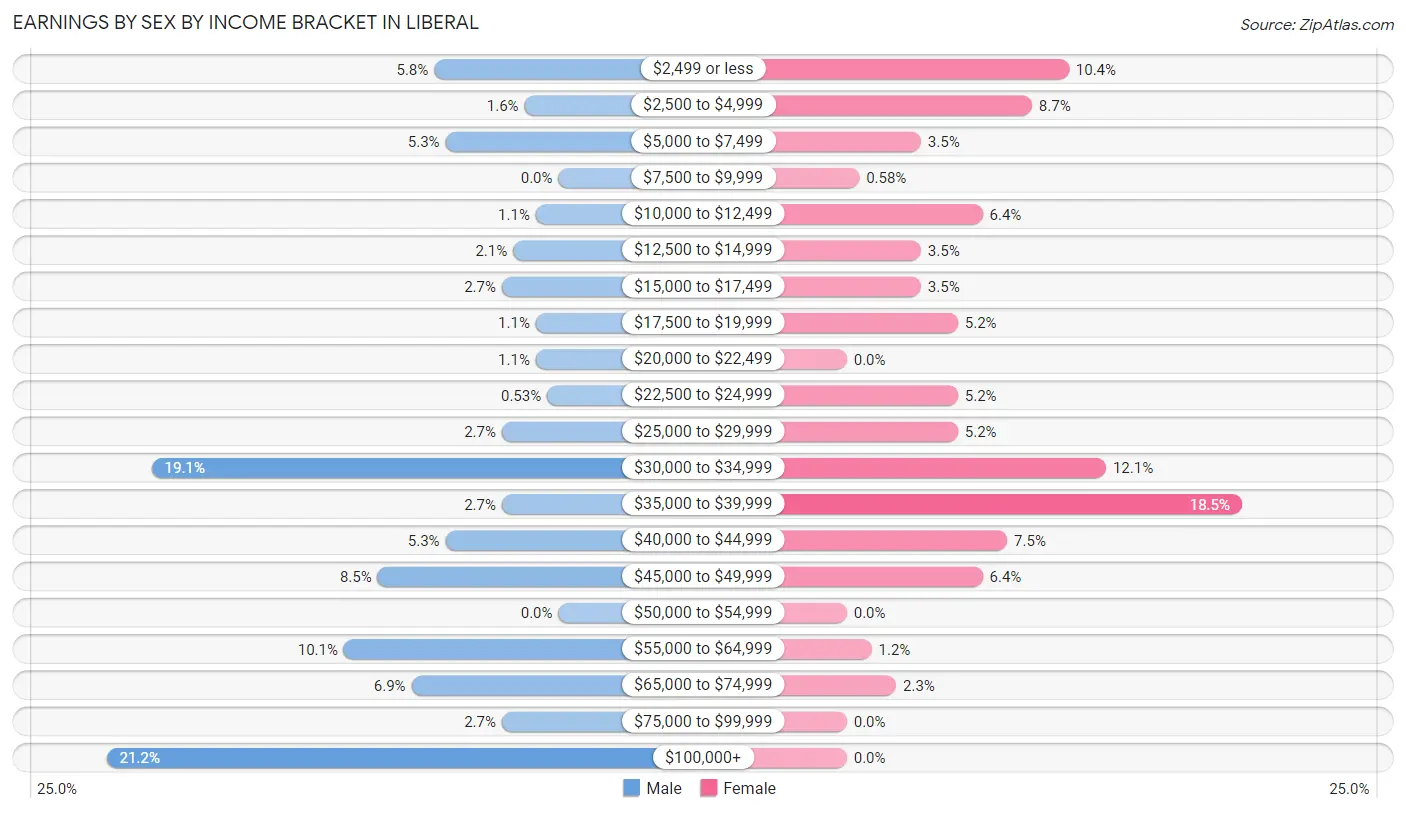
Earnings by Sex by Income Bracket in Liberal
The most common earnings brackets in Liberal are $100,000+ for men (40 | 21.2%) and $35,000 to $39,999 for women (32 | 18.5%).
| Income | Male | Female |
| $2,499 or less | 11 (5.8%) | 18 (10.4%) |
| $2,500 to $4,999 | 3 (1.6%) | 15 (8.7%) |
| $5,000 to $7,499 | 10 (5.3%) | 6 (3.5%) |
| $7,500 to $9,999 | 0 (0.0%) | 1 (0.6%) |
| $10,000 to $12,499 | 2 (1.1%) | 11 (6.4%) |
| $12,500 to $14,999 | 4 (2.1%) | 6 (3.5%) |
| $15,000 to $17,499 | 5 (2.6%) | 6 (3.5%) |
| $17,500 to $19,999 | 2 (1.1%) | 9 (5.2%) |
| $20,000 to $22,499 | 2 (1.1%) | 0 (0.0%) |
| $22,500 to $24,999 | 1 (0.5%) | 9 (5.2%) |
| $25,000 to $29,999 | 5 (2.6%) | 9 (5.2%) |
| $30,000 to $34,999 | 36 (19.1%) | 21 (12.1%) |
| $35,000 to $39,999 | 5 (2.6%) | 32 (18.5%) |
| $40,000 to $44,999 | 10 (5.3%) | 13 (7.5%) |
| $45,000 to $49,999 | 16 (8.5%) | 11 (6.4%) |
| $50,000 to $54,999 | 0 (0.0%) | 0 (0.0%) |
| $55,000 to $64,999 | 19 (10.1%) | 2 (1.2%) |
| $65,000 to $74,999 | 13 (6.9%) | 4 (2.3%) |
| $75,000 to $99,999 | 5 (2.6%) | 0 (0.0%) |
| $100,000+ | 40 (21.2%) | 0 (0.0%) |
| Total | 189 (100.0%) | 173 (100.0%) |
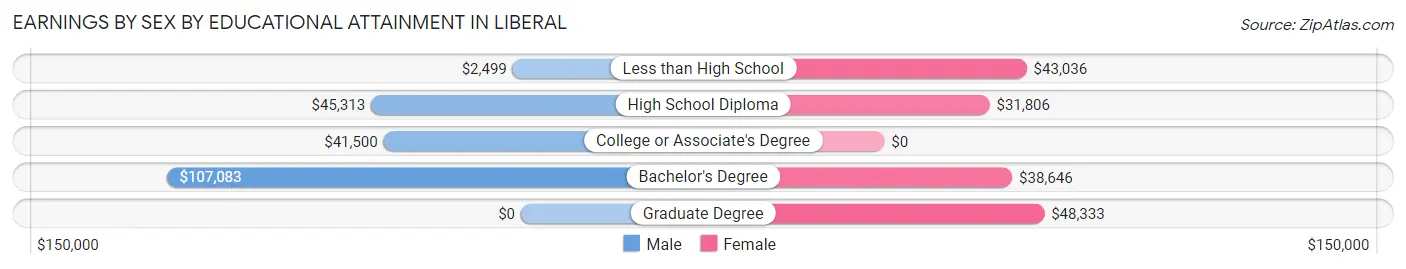
Earnings by Sex by Educational Attainment in Liberal
Average earnings in Liberal are $46,719 for men and $31,944 for women, a difference of 31.6%. Men with an educational attainment of bachelor's degree enjoy the highest average annual earnings of $107,083, while those with less than high school education earn the least with $2,499. Women with an educational attainment of graduate degree earn the most with the average annual earnings of $48,333, while those with high school diploma education have the smallest earnings of $31,806.
| Educational Attainment | Male Income | Female Income |
| Less than High School | $2,499 | $43,036 |
| High School Diploma | $45,313 | $31,806 |
| College or Associate's Degree | $41,500 | $0 |
| Bachelor's Degree | $107,083 | $38,646 |
| Graduate Degree | - | - |
| Total | $46,719 | $31,944 |
Family Income in Liberal
Family Income Brackets in Liberal
According to the Liberal family income data, there are 48 families falling into the $100,000 to $149,999 income range, which is the most common income bracket and makes up 24.9% of all families. Conversely, the less than $10,000 income bracket is the least frequent group with only 3 families (1.5%) belonging to this category.
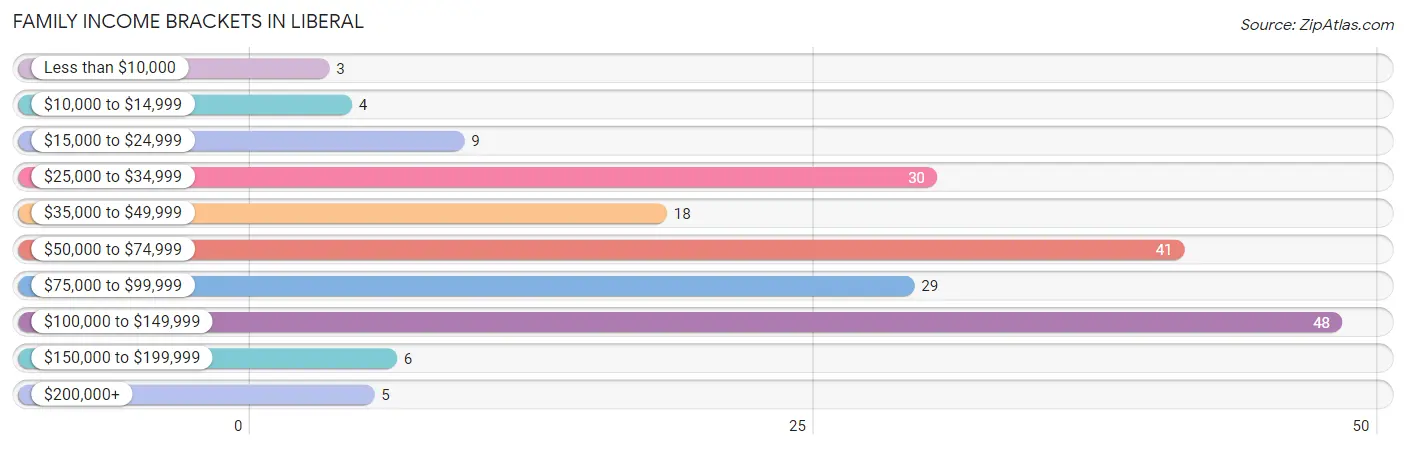
| Income Bracket | # Families | % Families |
| Less than $10,000 | 3 | 1.6% |
| $10,000 to $14,999 | 4 | 2.1% |
| $15,000 to $24,999 | 9 | 4.7% |
| $25,000 to $34,999 | 30 | 15.5% |
| $35,000 to $49,999 | 18 | 9.3% |
| $50,000 to $74,999 | 41 | 21.2% |
| $75,000 to $99,999 | 29 | 15.0% |
| $100,000 to $149,999 | 48 | 24.9% |
| $150,000 to $199,999 | 6 | 3.1% |
| $200,000+ | 5 | 2.6% |
Family Income by Famaliy Size in Liberal
3-person families (59 | 30.6%) account for the highest median family income in Liberal with $119,583 per family, while 3-person families (59 | 30.6%) have the highest median income of $39,861 per family member.
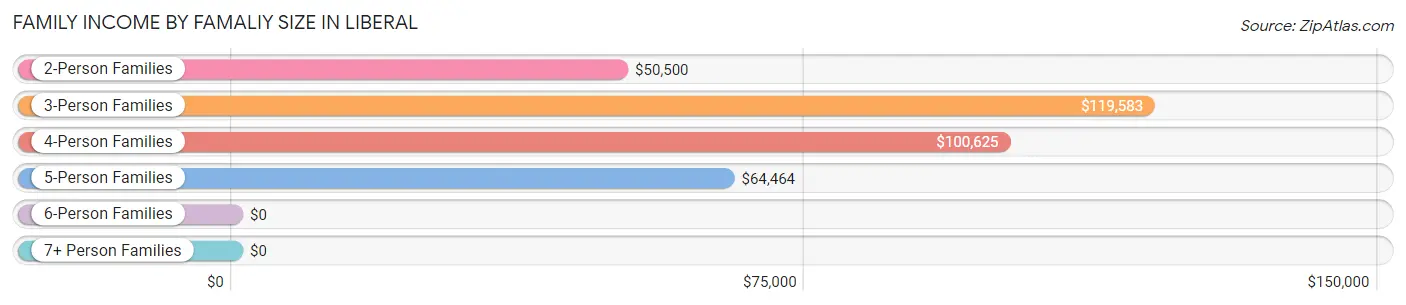
| Income Bracket | # Families | Median Income |
| 2-Person Families | 88 (45.6%) | $50,500 |
| 3-Person Families | 59 (30.6%) | $119,583 |
| 4-Person Families | 28 (14.5%) | $100,625 |
| 5-Person Families | 11 (5.7%) | $64,464 |
| 6-Person Families | 3 (1.5%) | $0 |
| 7+ Person Families | 4 (2.1%) | $0 |
| Total | 193 (100.0%) | $68,594 |
Family Income by Number of Earners in Liberal
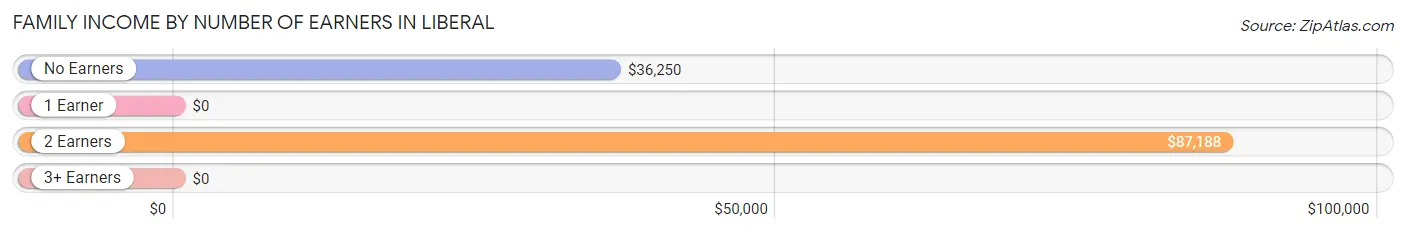
| Number of Earners | # Families | Median Income |
| No Earners | 22 (11.4%) | $36,250 |
| 1 Earner | 58 (30.0%) | $0 |
| 2 Earners | 101 (52.3%) | $87,188 |
| 3+ Earners | 12 (6.2%) | $0 |
| Total | 193 (100.0%) | $68,594 |
Household Income in Liberal
Household Income Brackets in Liberal
With 61 households falling in the category, the $50,000 to $74,999 income range is the most frequent in Liberal, accounting for 19.1% of all households. In contrast, only 5 households (1.6%) fall into the $200,000+ income bracket, making it the least populous group.
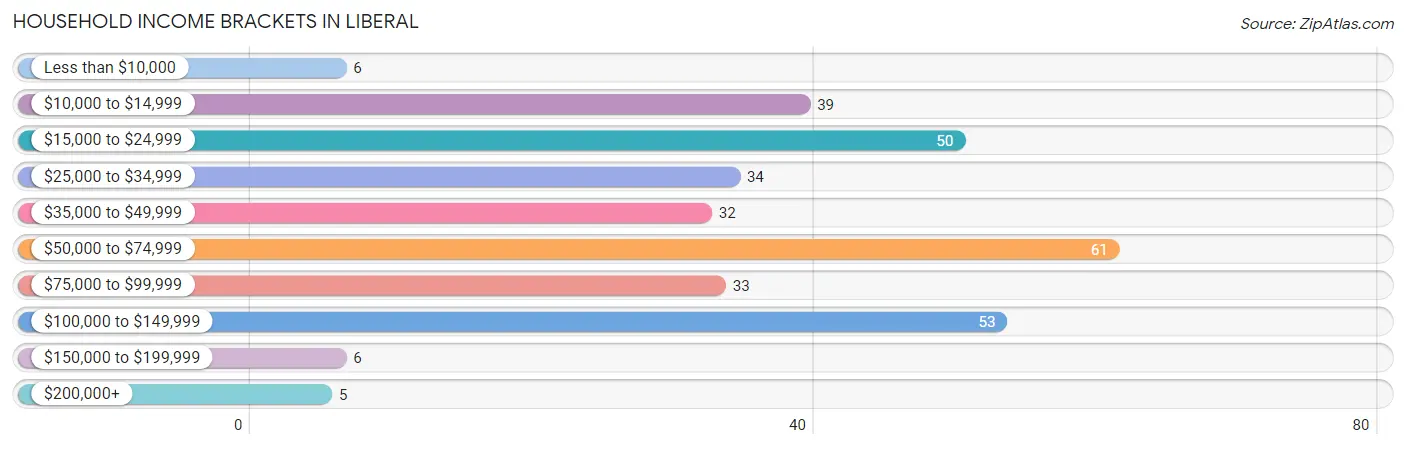
| Income Bracket | # Households | % Households |
| Less than $10,000 | 6 | 1.9% |
| $10,000 to $14,999 | 39 | 12.2% |
| $15,000 to $24,999 | 50 | 15.7% |
| $25,000 to $34,999 | 34 | 10.7% |
| $35,000 to $49,999 | 32 | 10.0% |
| $50,000 to $74,999 | 61 | 19.1% |
| $75,000 to $99,999 | 33 | 10.3% |
| $100,000 to $149,999 | 53 | 16.6% |
| $150,000 to $199,999 | 6 | 1.9% |
| $200,000+ | 5 | 1.6% |
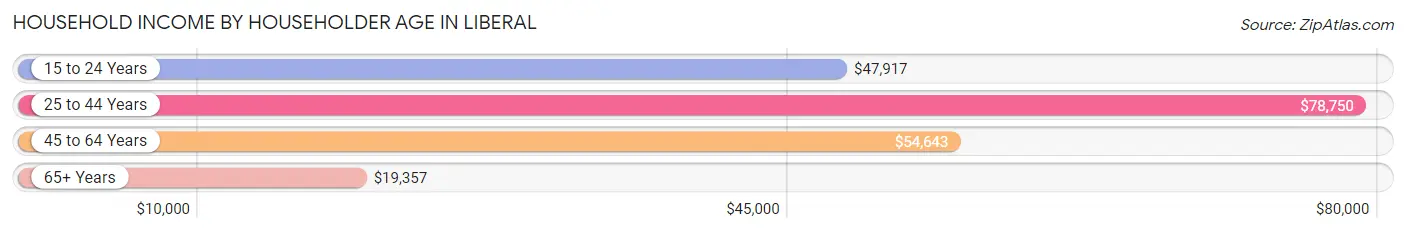
Household Income by Householder Age in Liberal
The median household income in Liberal is $49,464, with the highest median household income of $78,750 found in the 25 to 44 years age bracket for the primary householder. A total of 67 households (21.0%) fall into this category. Meanwhile, the 65+ years age bracket for the primary householder has the lowest median household income of $19,357, with 94 households (29.5%) in this group.
| Income Bracket | # Households | Median Income |
| 15 to 24 Years | 10 (3.1%) | $47,917 |
| 25 to 44 Years | 67 (21.0%) | $78,750 |
| 45 to 64 Years | 148 (46.4%) | $54,643 |
| 65+ Years | 94 (29.5%) | $19,357 |
| Total | 319 (100.0%) | $49,464 |
Poverty in Liberal
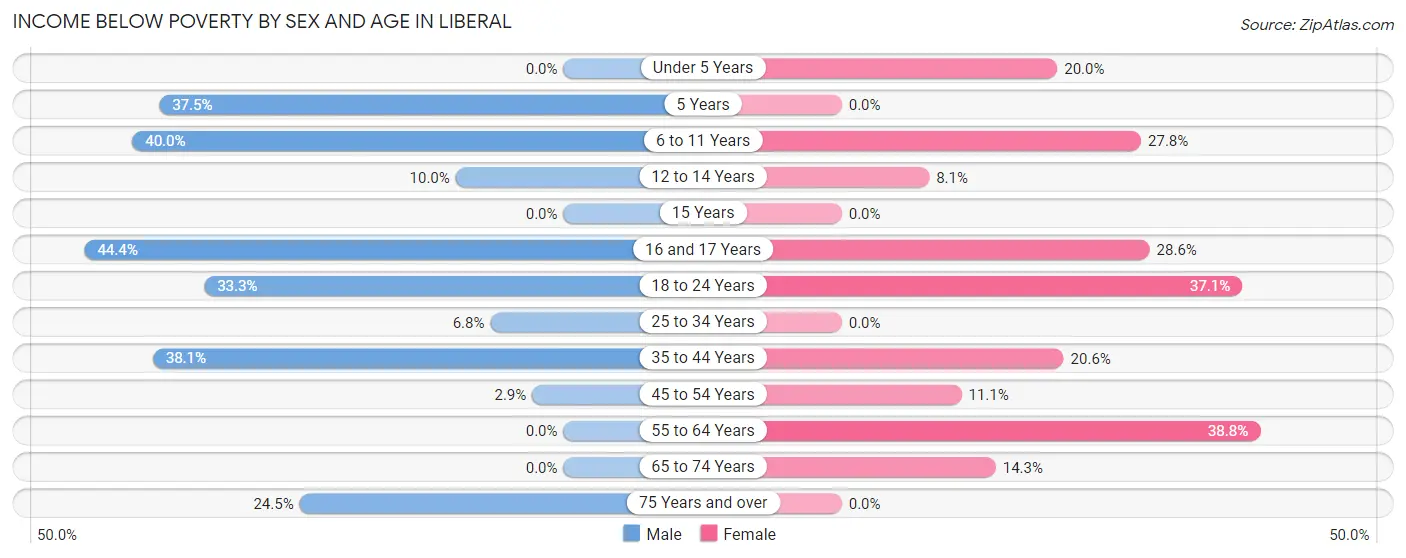
Income Below Poverty by Sex and Age in Liberal
With 14.3% poverty level for males and 18.8% for females among the residents of Liberal, 16 and 17 year old males and 55 to 64 year old females are the most vulnerable to poverty, with 4 males (44.4%) and 26 females (38.8%) in their respective age groups living below the poverty level.
| Age Bracket | Male | Female |
| Under 5 Years | 0 (0.0%) | 6 (20.0%) |
| 5 Years | 3 (37.5%) | 0 (0.0%) |
| 6 to 11 Years | 8 (40.0%) | 5 (27.8%) |
| 12 to 14 Years | 3 (10.0%) | 3 (8.1%) |
| 15 Years | 0 (0.0%) | 0 (0.0%) |
| 16 and 17 Years | 4 (44.4%) | 2 (28.6%) |
| 18 to 24 Years | 11 (33.3%) | 13 (37.1%) |
| 25 to 34 Years | 4 (6.8%) | 0 (0.0%) |
| 35 to 44 Years | 8 (38.1%) | 7 (20.6%) |
| 45 to 54 Years | 2 (2.9%) | 8 (11.1%) |
| 55 to 64 Years | 0 (0.0%) | 26 (38.8%) |
| 65 to 74 Years | 0 (0.0%) | 6 (14.3%) |
| 75 Years and over | 12 (24.5%) | 0 (0.0%) |
| Total | 55 (14.3%) | 76 (18.8%) |
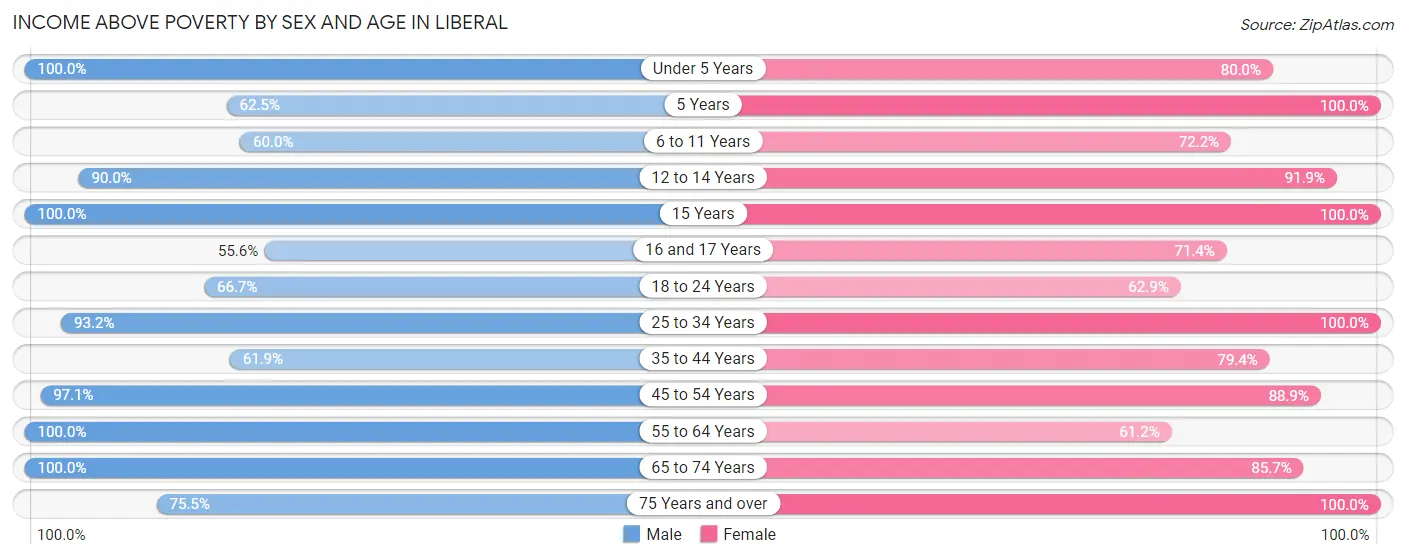
Income Above Poverty by Sex and Age in Liberal
According to the poverty statistics in Liberal, males aged under 5 years and females aged 5 years are the age groups that are most secure financially, with 100.0% of males and 100.0% of females in these age groups living above the poverty line.
| Age Bracket | Male | Female |
| Under 5 Years | 20 (100.0%) | 24 (80.0%) |
| 5 Years | 5 (62.5%) | 5 (100.0%) |
| 6 to 11 Years | 12 (60.0%) | 13 (72.2%) |
| 12 to 14 Years | 27 (90.0%) | 34 (91.9%) |
| 15 Years | 4 (100.0%) | 4 (100.0%) |
| 16 and 17 Years | 5 (55.6%) | 5 (71.4%) |
| 18 to 24 Years | 22 (66.7%) | 22 (62.9%) |
| 25 to 34 Years | 55 (93.2%) | 37 (100.0%) |
| 35 to 44 Years | 13 (61.9%) | 27 (79.4%) |
| 45 to 54 Years | 67 (97.1%) | 64 (88.9%) |
| 55 to 64 Years | 40 (100.0%) | 41 (61.2%) |
| 65 to 74 Years | 22 (100.0%) | 36 (85.7%) |
| 75 Years and over | 37 (75.5%) | 17 (100.0%) |
| Total | 329 (85.7%) | 329 (81.2%) |
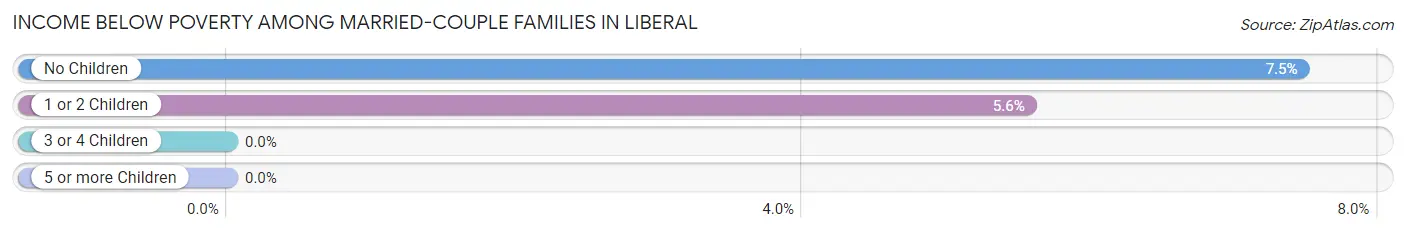
Income Below Poverty Among Married-Couple Families in Liberal
The poverty statistics for married-couple families in Liberal show that 6.2% or 9 of the total 144 families live below the poverty line. Families with no children have the highest poverty rate of 7.5%, comprising of 5 families. On the other hand, families with 3 or 4 children have the lowest poverty rate of 0.0%, which includes 0 families.
| Children | Above Poverty | Below Poverty |
| No Children | 62 (92.5%) | 5 (7.5%) |
| 1 or 2 Children | 68 (94.4%) | 4 (5.6%) |
| 3 or 4 Children | 3 (100.0%) | 0 (0.0%) |
| 5 or more Children | 2 (100.0%) | 0 (0.0%) |
| Total | 135 (93.8%) | 9 (6.2%) |
Income Below Poverty Among Single-Parent Households in Liberal
According to the poverty data in Liberal, 9.5% or 2 single-father households and 17.9% or 5 single-mother households are living below the poverty line. Among single-father households, those with 5 or more children have the highest poverty rate, with 2 households (100.0%) experiencing poverty. Likewise, among single-mother households, those with no children have the highest poverty rate, with 5 households (33.3%) falling below the poverty line.
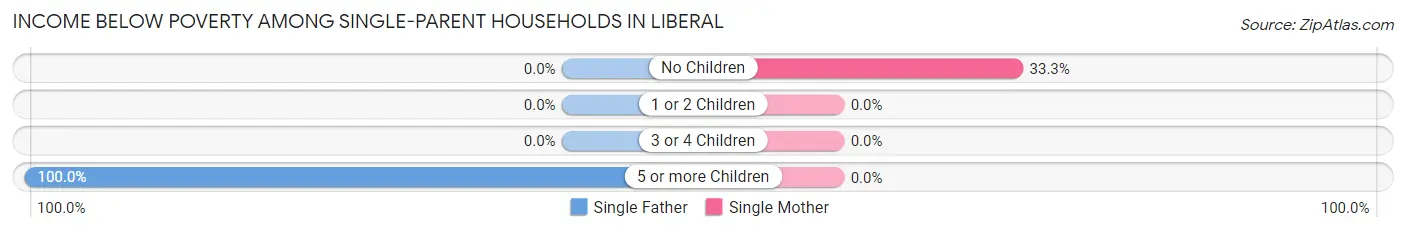
| Children | Single Father | Single Mother |
| No Children | 0 (0.0%) | 5 (33.3%) |
| 1 or 2 Children | 0 (0.0%) | 0 (0.0%) |
| 3 or 4 Children | 0 (0.0%) | 0 (0.0%) |
| 5 or more Children | 2 (100.0%) | 0 (0.0%) |
| Total | 2 (9.5%) | 5 (17.9%) |
Income Below Poverty Among Married-Couple vs Single-Parent Households in Liberal
The poverty data for Liberal shows that 9 of the married-couple family households (6.2%) and 7 of the single-parent households (14.3%) are living below the poverty level. Within the married-couple family households, those with no children have the highest poverty rate, with 5 households (7.5%) falling below the poverty line. Among the single-parent households, those with 5 or more children have the highest poverty rate, with 2 household (100.0%) living below poverty.
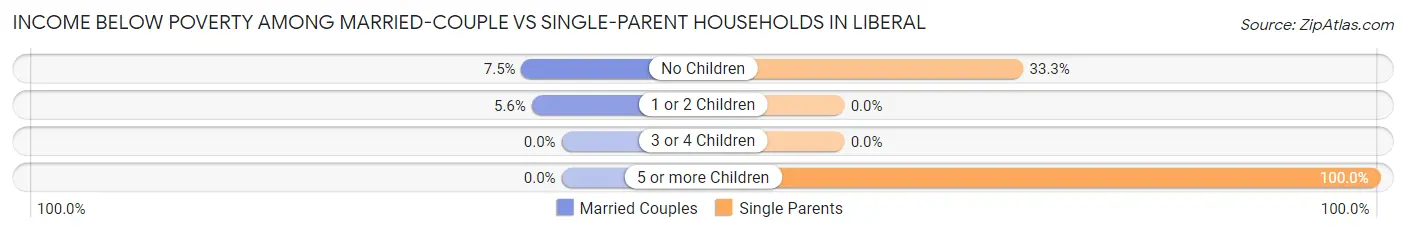
| Children | Married-Couple Families | Single-Parent Households |
| No Children | 5 (7.5%) | 5 (33.3%) |
| 1 or 2 Children | 4 (5.6%) | 0 (0.0%) |
| 3 or 4 Children | 0 (0.0%) | 0 (0.0%) |
| 5 or more Children | 0 (0.0%) | 2 (100.0%) |
| Total | 9 (6.2%) | 7 (14.3%) |
Race in Liberal
The most populous races in Liberal are White / Caucasian (705 | 88.8%), Two or more Races (59 | 7.4%), and Native / Alaskan (28 | 3.5%).
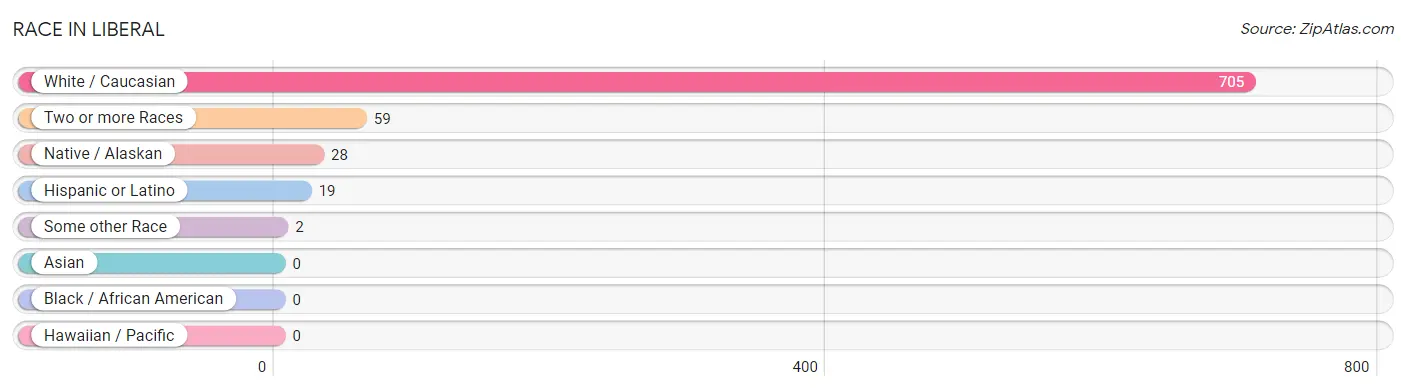
| Race | # Population | % Population |
| Asian | 0 | 0.0% |
| Black / African American | 0 | 0.0% |
| Hawaiian / Pacific | 0 | 0.0% |
| Hispanic or Latino | 19 | 2.4% |
| Native / Alaskan | 28 | 3.5% |
| White / Caucasian | 705 | 88.8% |
| Two or more Races | 59 | 7.4% |
| Some other Race | 2 | 0.3% |
| Total | 794 | 100.0% |
Ancestry in Liberal
The most populous ancestries reported in Liberal are German (141 | 17.8%), English (139 | 17.5%), Irish (99 | 12.5%), American (60 | 7.6%), and European (35 | 4.4%), together accounting for 59.7% of all Liberal residents.
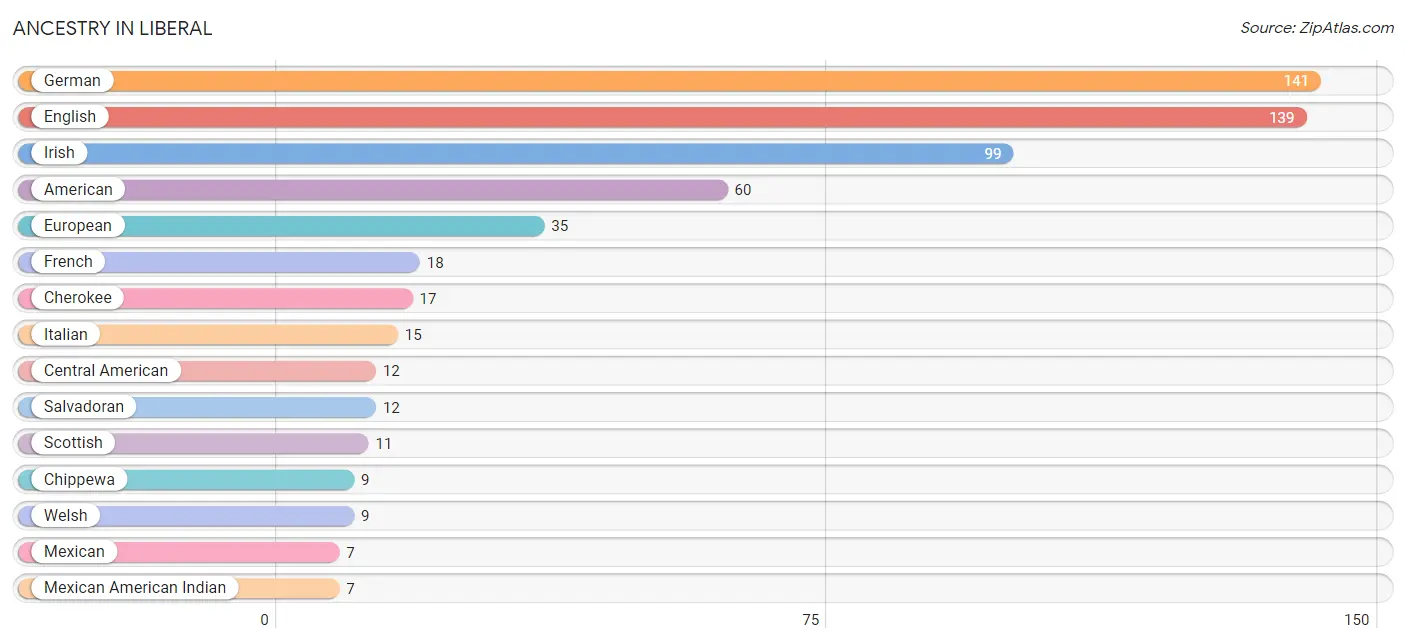
| Ancestry | # Population | % Population |
| American | 60 | 7.6% |
| British | 5 | 0.6% |
| Central American | 12 | 1.5% |
| Cherokee | 17 | 2.1% |
| Chippewa | 9 | 1.1% |
| Choctaw | 5 | 0.6% |
| Croatian | 2 | 0.3% |
| Danish | 2 | 0.3% |
| Eastern European | 1 | 0.1% |
| English | 139 | 17.5% |
| European | 35 | 4.4% |
| French | 18 | 2.3% |
| German | 141 | 17.8% |
| Irish | 99 | 12.5% |
| Italian | 15 | 1.9% |
| Mexican | 7 | 0.9% |
| Mexican American Indian | 7 | 0.9% |
| Norwegian | 7 | 0.9% |
| Polish | 4 | 0.5% |
| Romanian | 2 | 0.3% |
| Russian | 4 | 0.5% |
| Salvadoran | 12 | 1.5% |
| Scotch-Irish | 5 | 0.6% |
| Scottish | 11 | 1.4% |
| Welsh | 9 | 1.1% | View All 25 Rows |
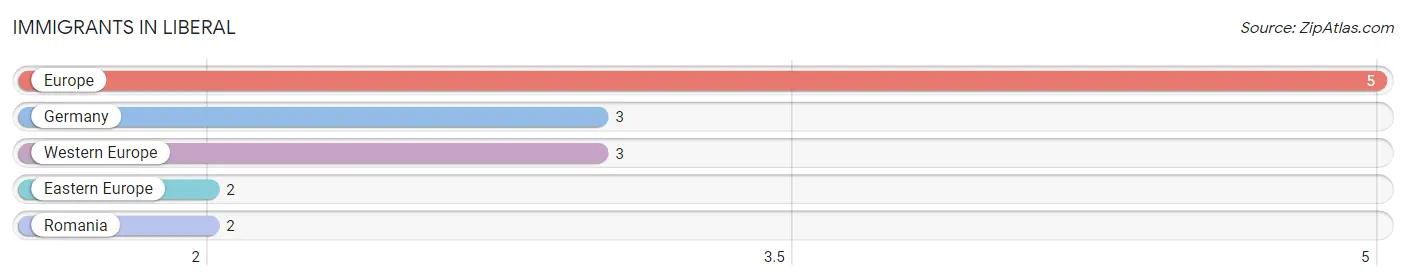
Immigrants in Liberal
The most numerous immigrant groups reported in Liberal came from Europe (5 | 0.6%), Germany (3 | 0.4%), Western Europe (3 | 0.4%), Eastern Europe (2 | 0.3%), and Romania (2 | 0.3%), together accounting for 1.9% of all Liberal residents.
| Immigration Origin | # Population | % Population |
| Eastern Europe | 2 | 0.3% |
| Europe | 5 | 0.6% |
| Germany | 3 | 0.4% |
| Romania | 2 | 0.3% |
| Western Europe | 3 | 0.4% | View All 5 Rows |
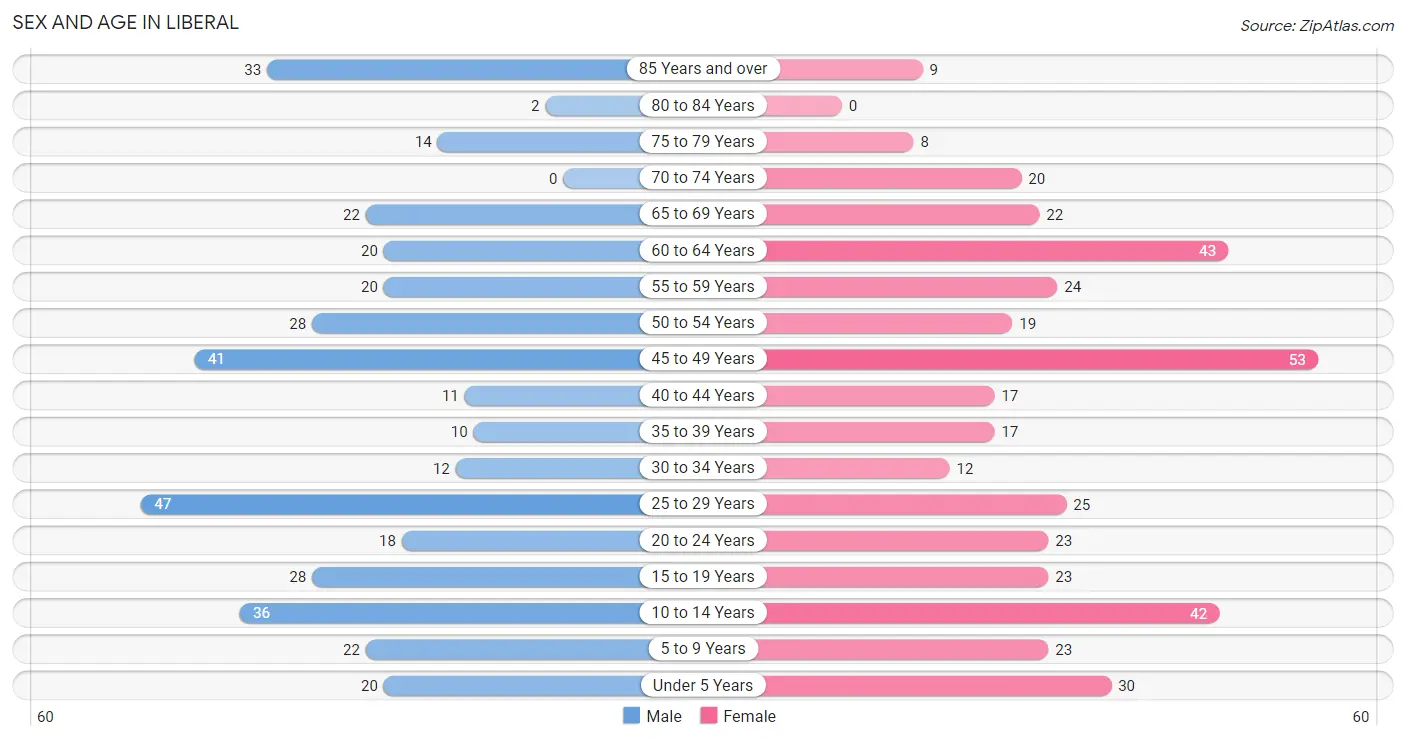
Sex and Age in Liberal
Sex and Age in Liberal
The most populous age groups in Liberal are 25 to 29 Years (47 | 12.2%) for men and 45 to 49 Years (53 | 12.9%) for women.
| Age Bracket | Male | Female |
| Under 5 Years | 20 (5.2%) | 30 (7.3%) |
| 5 to 9 Years | 22 (5.7%) | 23 (5.6%) |
| 10 to 14 Years | 36 (9.4%) | 42 (10.2%) |
| 15 to 19 Years | 28 (7.3%) | 23 (5.6%) |
| 20 to 24 Years | 18 (4.7%) | 23 (5.6%) |
| 25 to 29 Years | 47 (12.2%) | 25 (6.1%) |
| 30 to 34 Years | 12 (3.1%) | 12 (2.9%) |
| 35 to 39 Years | 10 (2.6%) | 17 (4.2%) |
| 40 to 44 Years | 11 (2.9%) | 17 (4.2%) |
| 45 to 49 Years | 41 (10.7%) | 53 (12.9%) |
| 50 to 54 Years | 28 (7.3%) | 19 (4.6%) |
| 55 to 59 Years | 20 (5.2%) | 24 (5.9%) |
| 60 to 64 Years | 20 (5.2%) | 43 (10.5%) |
| 65 to 69 Years | 22 (5.7%) | 22 (5.4%) |
| 70 to 74 Years | 0 (0.0%) | 20 (4.9%) |
| 75 to 79 Years | 14 (3.6%) | 8 (1.9%) |
| 80 to 84 Years | 2 (0.5%) | 0 (0.0%) |
| 85 Years and over | 33 (8.6%) | 9 (2.2%) |
| Total | 384 (100.0%) | 410 (100.0%) |
Families and Households in Liberal
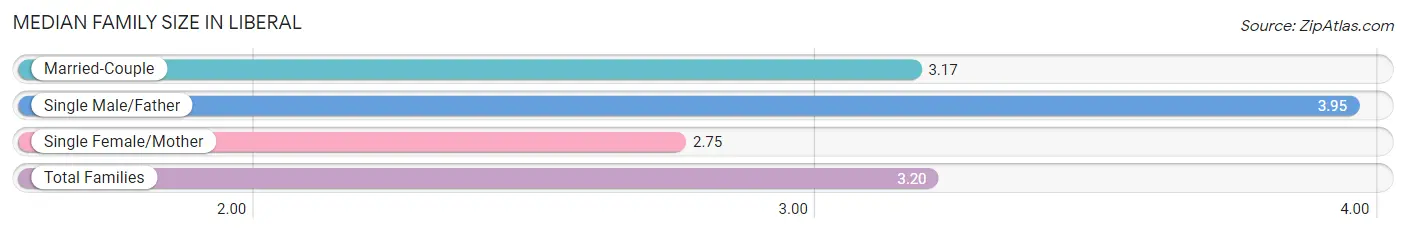
Median Family Size in Liberal
The median family size in Liberal is 3.20 persons per family, with single male/father families (21 | 10.9%) accounting for the largest median family size of 3.95 persons per family. On the other hand, single female/mother families (28 | 14.5%) represent the smallest median family size with 2.75 persons per family.
| Family Type | # Families | Family Size |
| Married-Couple | 144 (74.6%) | 3.17 |
| Single Male/Father | 21 (10.9%) | 3.95 |
| Single Female/Mother | 28 (14.5%) | 2.75 |
| Total Families | 193 (100.0%) | 3.20 |
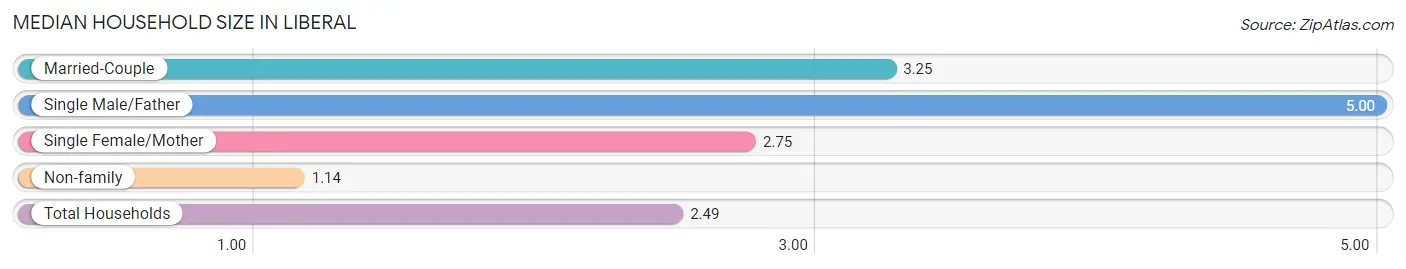
Median Household Size in Liberal
The median household size in Liberal is 2.49 persons per household, with single male/father households (21 | 6.6%) accounting for the largest median household size of 5 persons per household. non-family households (126 | 39.5%) represent the smallest median household size with 1.14 persons per household.
| Household Type | # Households | Household Size |
| Married-Couple | 144 (45.1%) | 3.25 |
| Single Male/Father | 21 (6.6%) | 5.00 |
| Single Female/Mother | 28 (8.8%) | 2.75 |
| Non-family | 126 (39.5%) | 1.14 |
| Total Households | 319 (100.0%) | 2.49 |
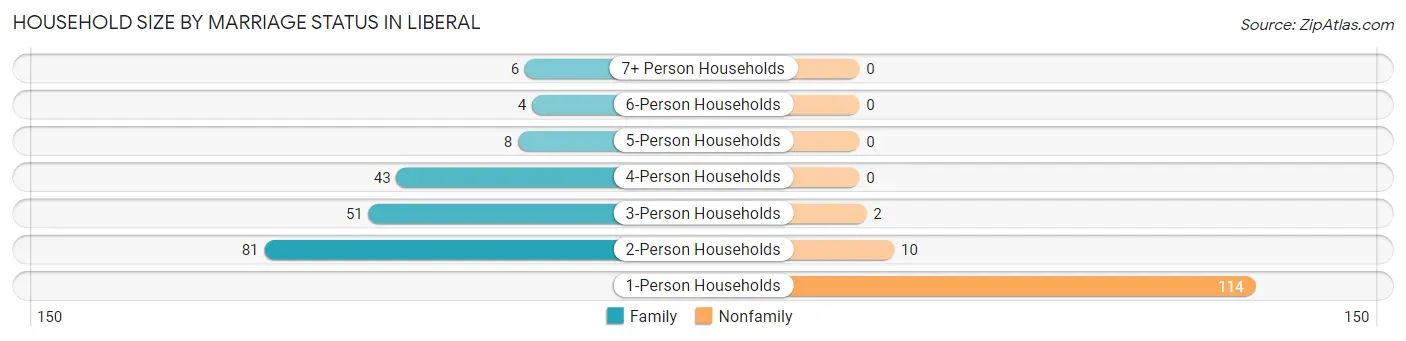
Household Size by Marriage Status in Liberal
Out of a total of 319 households in Liberal, 193 (60.5%) are family households, while 126 (39.5%) are nonfamily households. The most numerous type of family households are 2-person households, comprising 81, and the most common type of nonfamily households are 1-person households, comprising 114.
| Household Size | Family Households | Nonfamily Households |
| 1-Person Households | - | 114 (35.7%) |
| 2-Person Households | 81 (25.4%) | 10 (3.1%) |
| 3-Person Households | 51 (16.0%) | 2 (0.6%) |
| 4-Person Households | 43 (13.5%) | 0 (0.0%) |
| 5-Person Households | 8 (2.5%) | 0 (0.0%) |
| 6-Person Households | 4 (1.3%) | 0 (0.0%) |
| 7+ Person Households | 6 (1.9%) | 0 (0.0%) |
| Total | 193 (60.5%) | 126 (39.5%) |
Female Fertility in Liberal
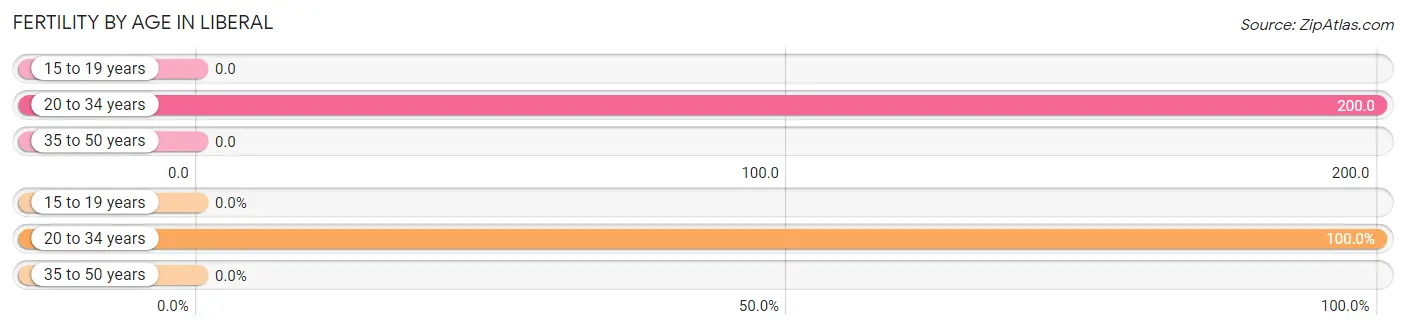
Fertility by Age in Liberal
Average fertility rate in Liberal is 69.0 births per 1,000 women. Women in the age bracket of 20 to 34 years have the highest fertility rate with 200.0 births per 1,000 women. Women in the age bracket of 20 to 34 years acount for 100.0% of all women with births.
| Age Bracket | Women with Births | Births / 1,000 Women |
| 15 to 19 years | 0 (0.0%) | 0.0 |
| 20 to 34 years | 12 (100.0%) | 200.0 |
| 35 to 50 years | 0 (0.0%) | 0.0 |
| Total | 12 (100.0%) | 69.0 |
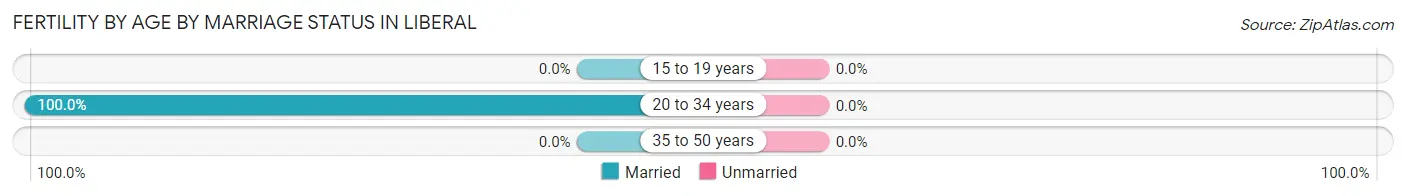
Fertility by Age by Marriage Status in Liberal
| Age Bracket | Married | Unmarried |
| 15 to 19 years | 0 (0.0%) | 0 (0.0%) |
| 20 to 34 years | 12 (100.0%) | 0 (0.0%) |
| 35 to 50 years | 0 (0.0%) | 0 (0.0%) |
| Total | 12 (100.0%) | 0 (0.0%) |
Fertility by Education in Liberal
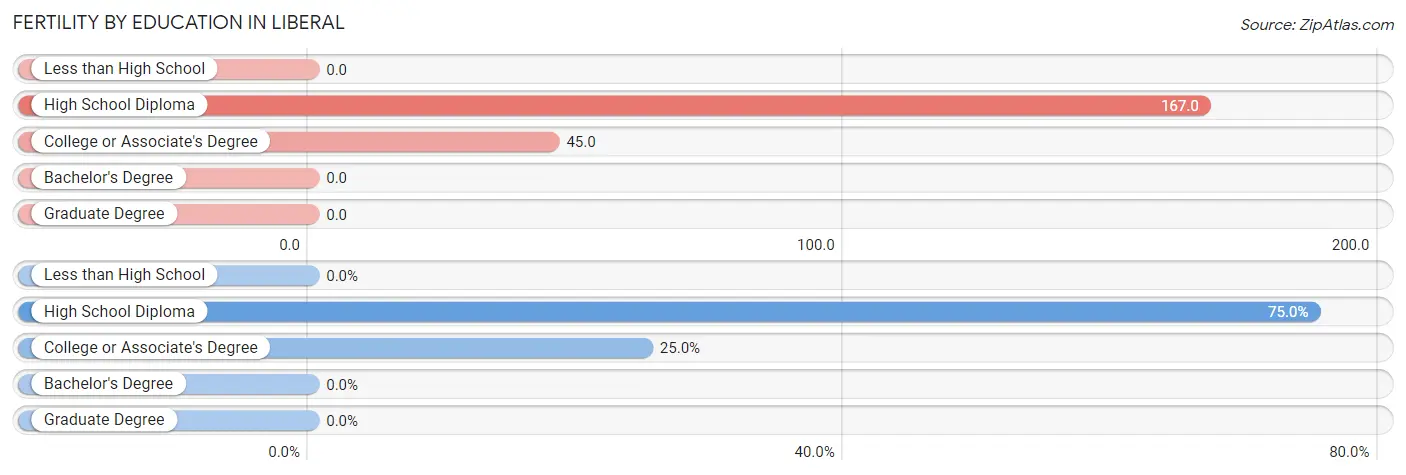
| Educational Attainment | Women with Births | Births / 1,000 Women |
| Less than High School | 0 (0.0%) | 0.0 |
| High School Diploma | 9 (75.0%) | 167.0 |
| College or Associate's Degree | 3 (25.0%) | 45.0 |
| Bachelor's Degree | 0 (0.0%) | 0.0 |
| Graduate Degree | 0 (0.0%) | 0.0 |
| Total | 12 (100.0%) | 69.0 |
Fertility by Education by Marriage Status in Liberal
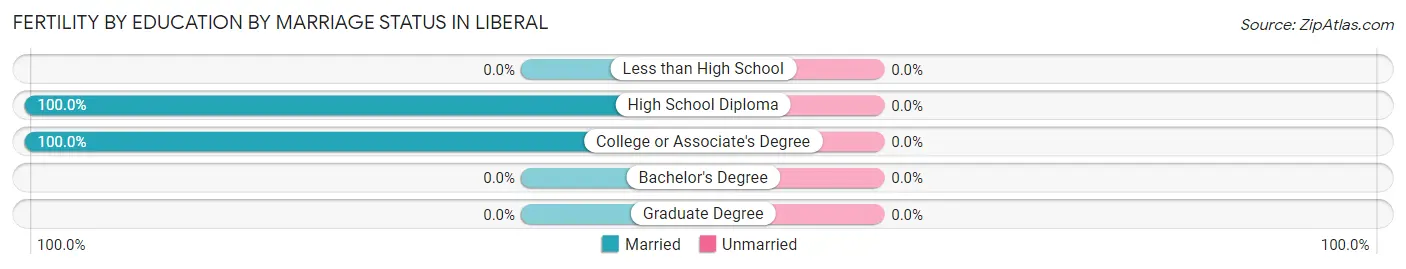
| Educational Attainment | Married | Unmarried |
| Less than High School | 0 (0.0%) | 0 (0.0%) |
| High School Diploma | 9 (100.0%) | 0 (0.0%) |
| College or Associate's Degree | 3 (100.0%) | 0 (0.0%) |
| Bachelor's Degree | 0 (0.0%) | 0 (0.0%) |
| Graduate Degree | 0 (0.0%) | 0 (0.0%) |
| Total | 12 (100.0%) | 0 (0.0%) |
Employment Characteristics in Liberal
Employment by Class of Employer in Liberal
Among the 296 employed individuals in Liberal, private company employees (187 | 63.2%), local government employees (34 | 11.5%), and self-employed (incorporated) (29 | 9.8%) make up the most common classes of employment.
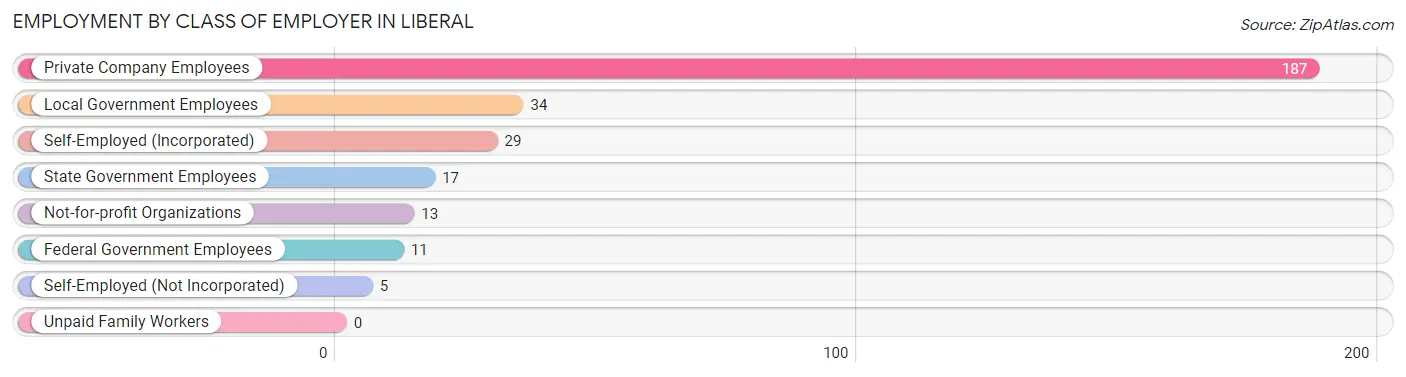
| Employer Class | # Employees | % Employees |
| Private Company Employees | 187 | 63.2% |
| Self-Employed (Incorporated) | 29 | 9.8% |
| Self-Employed (Not Incorporated) | 5 | 1.7% |
| Not-for-profit Organizations | 13 | 4.4% |
| Local Government Employees | 34 | 11.5% |
| State Government Employees | 17 | 5.7% |
| Federal Government Employees | 11 | 3.7% |
| Unpaid Family Workers | 0 | 0.0% |
| Total | 296 | 100.0% |
Employment Status by Age in Liberal
According to the labor force statistics for Liberal, out of the total population over 16 years of age (613), 56.6% or 347 individuals are in the labor force, with 14.2% or 49 of them unemployed. The age group with the highest labor force participation rate is 25 to 29 years, with 95.8% or 69 individuals in the labor force. Within the labor force, the 25 to 29 years age range has the highest percentage of unemployed individuals, with 21.7% or 15 of them being unemployed.
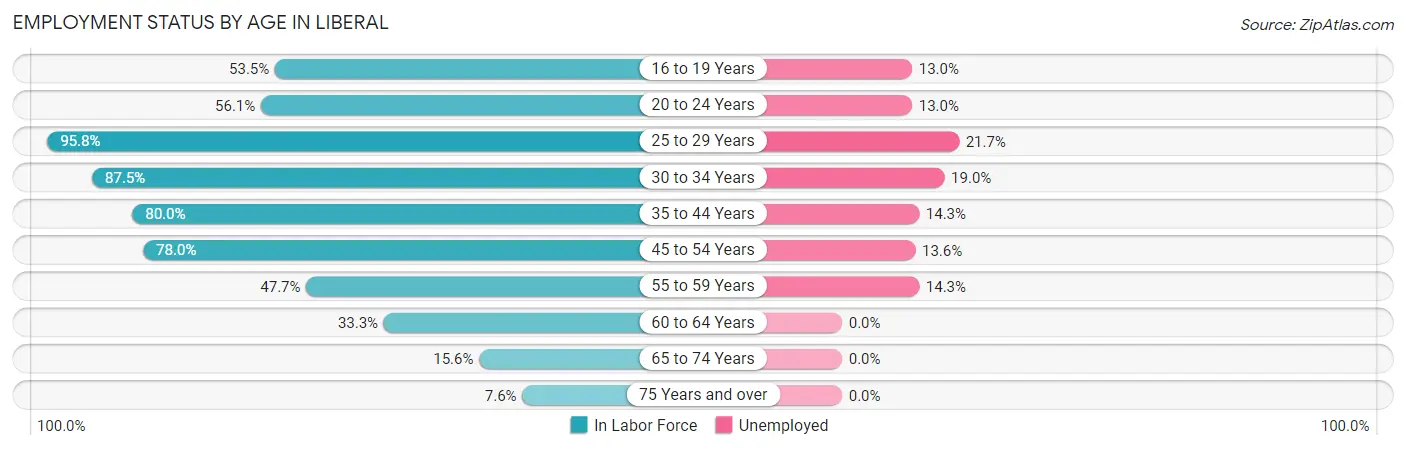
| Age Bracket | In Labor Force | Unemployed |
| 16 to 19 Years | 23 (53.5%) | 3 (13.0%) |
| 20 to 24 Years | 23 (56.1%) | 3 (13.0%) |
| 25 to 29 Years | 69 (95.8%) | 15 (21.7%) |
| 30 to 34 Years | 21 (87.5%) | 4 (19.0%) |
| 35 to 44 Years | 44 (80.0%) | 6 (14.3%) |
| 45 to 54 Years | 110 (78.0%) | 15 (13.6%) |
| 55 to 59 Years | 21 (47.7%) | 3 (14.3%) |
| 60 to 64 Years | 21 (33.3%) | 0 (0.0%) |
| 65 to 74 Years | 10 (15.6%) | 0 (0.0%) |
| 75 Years and over | 5 (7.6%) | 0 (0.0%) |
| Total | 347 (56.6%) | 49 (14.2%) |
Employment Status by Educational Attainment in Liberal
According to labor force statistics for Liberal, 71.7% of individuals (286) out of the total population between 25 and 64 years of age (399) are in the labor force, with 15.1% or 43 of them being unemployed. The group with the highest labor force participation rate are those with the educational attainment of bachelor's degree or higher, with 93.2% or 69 individuals in the labor force. Within the labor force, individuals with college / associate degree education have the highest percentage of unemployment, with 24.1% or 20 of them being unemployed.
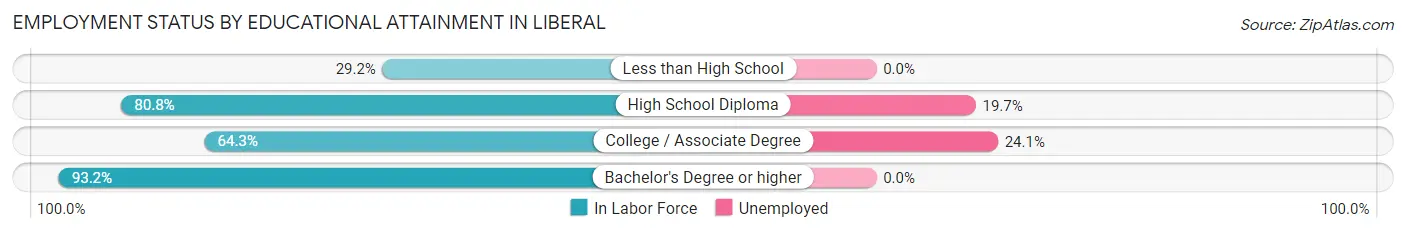
| Educational Attainment | In Labor Force | Unemployed |
| Less than High School | 14 (29.2%) | 0 (0.0%) |
| High School Diploma | 122 (80.8%) | 30 (19.7%) |
| College / Associate Degree | 81 (64.3%) | 30 (24.1%) |
| Bachelor's Degree or higher | 69 (93.2%) | 0 (0.0%) |
| Total | 286 (71.7%) | 60 (15.1%) |
Employment Occupations by Sex in Liberal
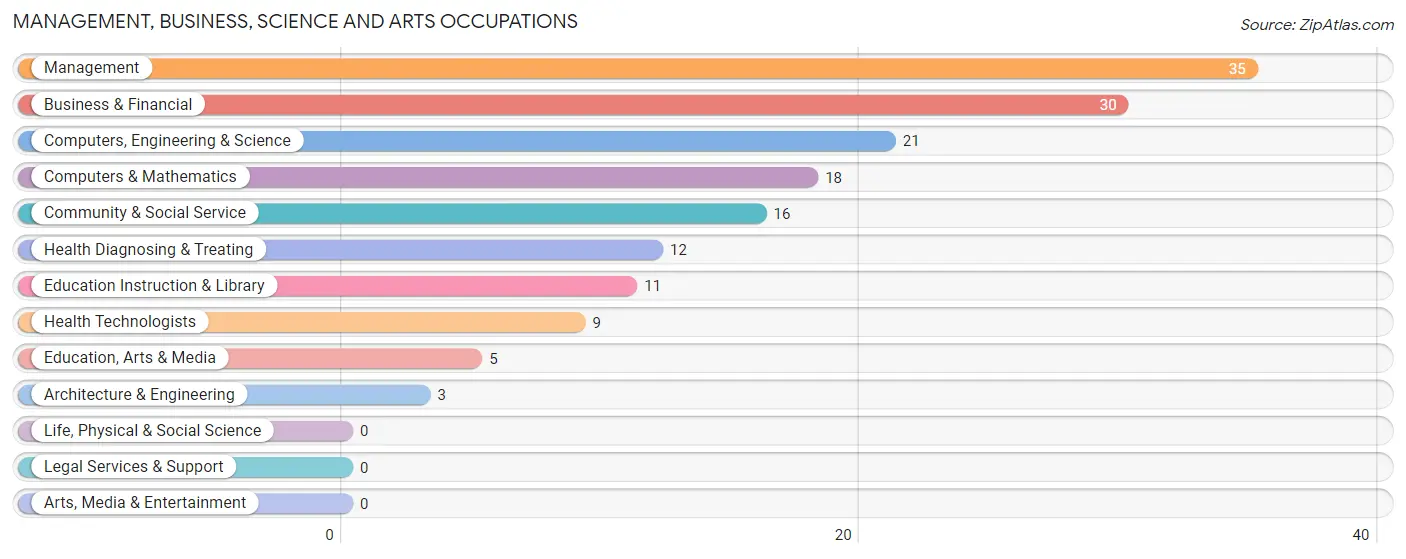
Management, Business, Science and Arts Occupations
The most common Management, Business, Science and Arts occupations in Liberal are Management (35 | 11.8%), Business & Financial (30 | 10.1%), Computers, Engineering & Science (21 | 7.1%), Computers & Mathematics (18 | 6.1%), and Community & Social Service (16 | 5.4%).
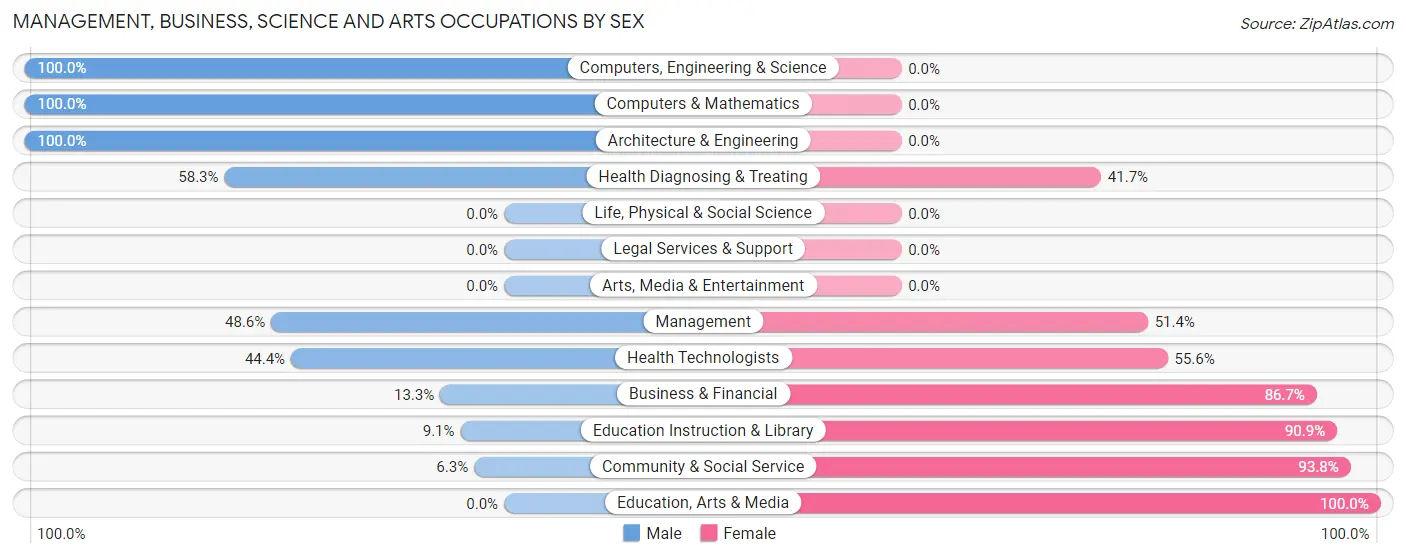
Management, Business, Science and Arts Occupations by Sex
Within the Management, Business, Science and Arts occupations in Liberal, the most male-oriented occupations are Computers, Engineering & Science (100.0%), Computers & Mathematics (100.0%), and Architecture & Engineering (100.0%), while the most female-oriented occupations are Education, Arts & Media (100.0%), Community & Social Service (93.8%), and Education Instruction & Library (90.9%).
| Occupation | Male | Female |
| Management | 17 (48.6%) | 18 (51.4%) |
| Business & Financial | 4 (13.3%) | 26 (86.7%) |
| Computers, Engineering & Science | 21 (100.0%) | 0 (0.0%) |
| Computers & Mathematics | 18 (100.0%) | 0 (0.0%) |
| Architecture & Engineering | 3 (100.0%) | 0 (0.0%) |
| Life, Physical & Social Science | 0 (0.0%) | 0 (0.0%) |
| Community & Social Service | 1 (6.2%) | 15 (93.8%) |
| Education, Arts & Media | 0 (0.0%) | 5 (100.0%) |
| Legal Services & Support | 0 (0.0%) | 0 (0.0%) |
| Education Instruction & Library | 1 (9.1%) | 10 (90.9%) |
| Arts, Media & Entertainment | 0 (0.0%) | 0 (0.0%) |
| Health Diagnosing & Treating | 7 (58.3%) | 5 (41.7%) |
| Health Technologists | 4 (44.4%) | 5 (55.6%) |
| Total (Category) | 50 (43.9%) | 64 (56.1%) |
| Total (Overall) | 150 (50.7%) | 146 (49.3%) |
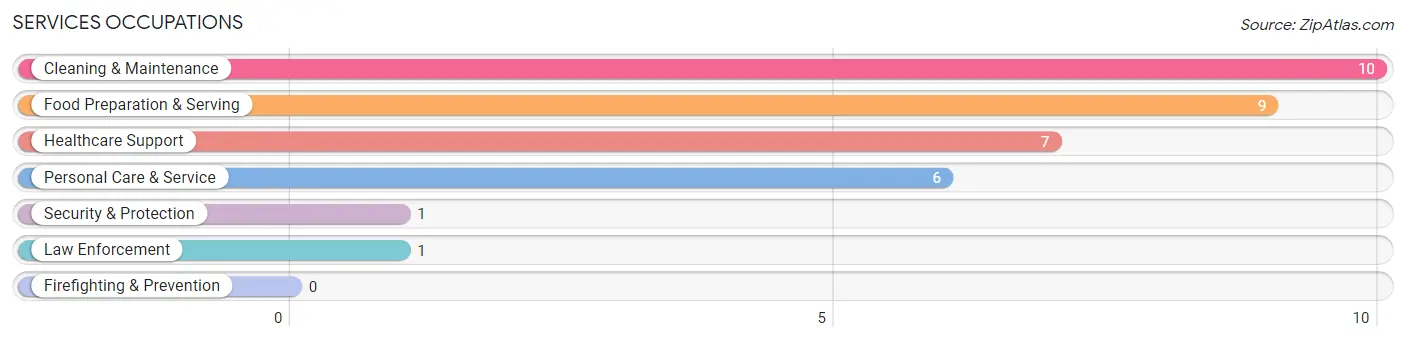
Services Occupations
The most common Services occupations in Liberal are Cleaning & Maintenance (10 | 3.4%), Food Preparation & Serving (9 | 3.0%), Healthcare Support (7 | 2.4%), Personal Care & Service (6 | 2.0%), and Security & Protection (1 | 0.3%).
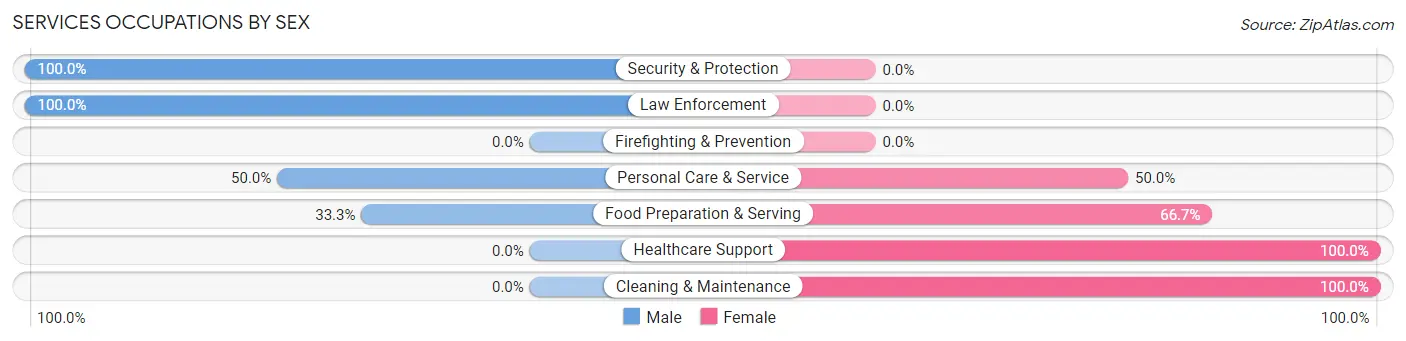
Services Occupations by Sex
Within the Services occupations in Liberal, the most male-oriented occupations are Security & Protection (100.0%), Law Enforcement (100.0%), and Personal Care & Service (50.0%), while the most female-oriented occupations are Healthcare Support (100.0%), Cleaning & Maintenance (100.0%), and Food Preparation & Serving (66.7%).
| Occupation | Male | Female |
| Healthcare Support | 0 (0.0%) | 7 (100.0%) |
| Security & Protection | 1 (100.0%) | 0 (0.0%) |
| Firefighting & Prevention | 0 (0.0%) | 0 (0.0%) |
| Law Enforcement | 1 (100.0%) | 0 (0.0%) |
| Food Preparation & Serving | 3 (33.3%) | 6 (66.7%) |
| Cleaning & Maintenance | 0 (0.0%) | 10 (100.0%) |
| Personal Care & Service | 3 (50.0%) | 3 (50.0%) |
| Total (Category) | 7 (21.2%) | 26 (78.8%) |
| Total (Overall) | 150 (50.7%) | 146 (49.3%) |
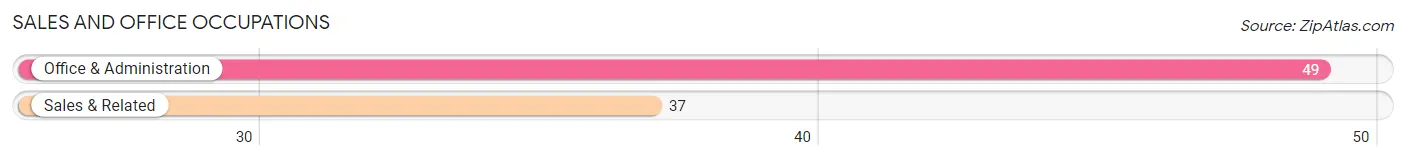
Sales and Office Occupations
The most common Sales and Office occupations in Liberal are Office & Administration (49 | 16.6%), and Sales & Related (37 | 12.5%).
Sales and Office Occupations by Sex
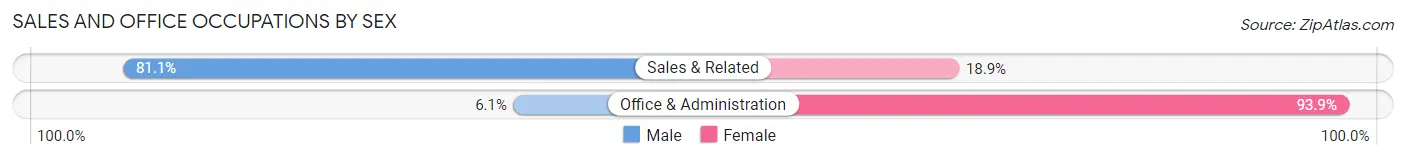
| Occupation | Male | Female |
| Sales & Related | 30 (81.1%) | 7 (18.9%) |
| Office & Administration | 3 (6.1%) | 46 (93.9%) |
| Total (Category) | 33 (38.4%) | 53 (61.6%) |
| Total (Overall) | 150 (50.7%) | 146 (49.3%) |
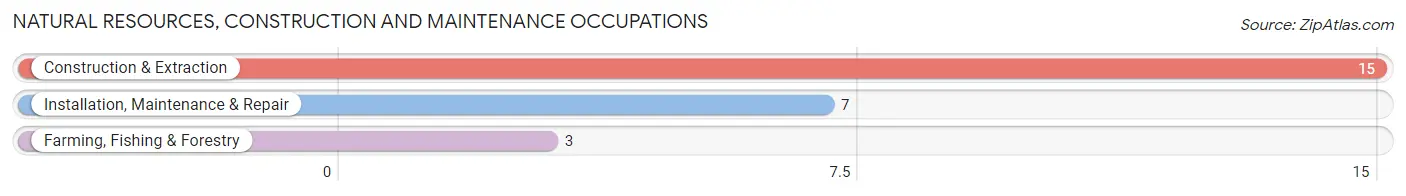
Natural Resources, Construction and Maintenance Occupations
The most common Natural Resources, Construction and Maintenance occupations in Liberal are Construction & Extraction (15 | 5.1%), Installation, Maintenance & Repair (7 | 2.4%), and Farming, Fishing & Forestry (3 | 1.0%).
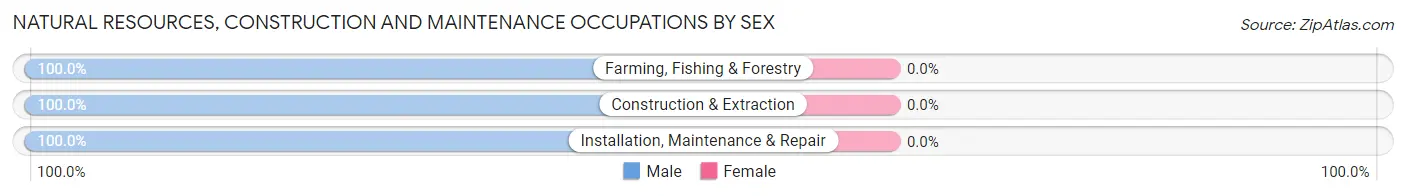
Natural Resources, Construction and Maintenance Occupations by Sex
| Occupation | Male | Female |
| Farming, Fishing & Forestry | 3 (100.0%) | 0 (0.0%) |
| Construction & Extraction | 15 (100.0%) | 0 (0.0%) |
| Installation, Maintenance & Repair | 7 (100.0%) | 0 (0.0%) |
| Total (Category) | 25 (100.0%) | 0 (0.0%) |
| Total (Overall) | 150 (50.7%) | 146 (49.3%) |
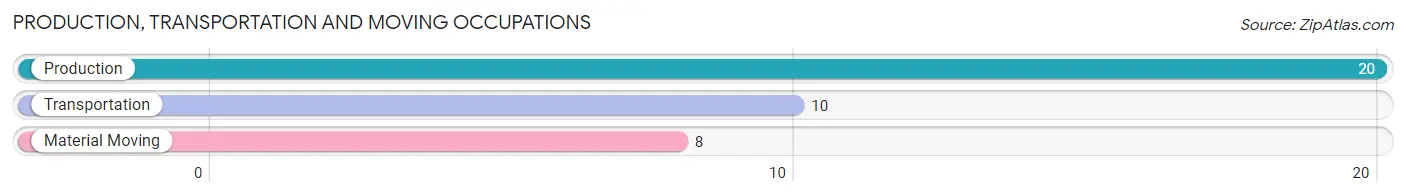
Production, Transportation and Moving Occupations
The most common Production, Transportation and Moving occupations in Liberal are Production (20 | 6.8%), Transportation (10 | 3.4%), and Material Moving (8 | 2.7%).
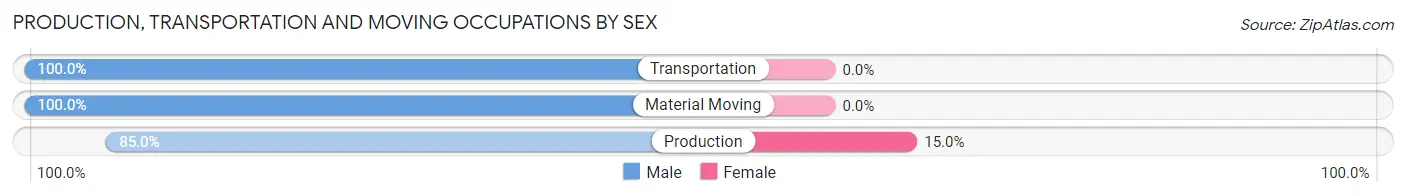
Production, Transportation and Moving Occupations by Sex
| Occupation | Male | Female |
| Production | 17 (85.0%) | 3 (15.0%) |
| Transportation | 10 (100.0%) | 0 (0.0%) |
| Material Moving | 8 (100.0%) | 0 (0.0%) |
| Total (Category) | 35 (92.1%) | 3 (7.9%) |
| Total (Overall) | 150 (50.7%) | 146 (49.3%) |
Employment Industries by Sex in Liberal
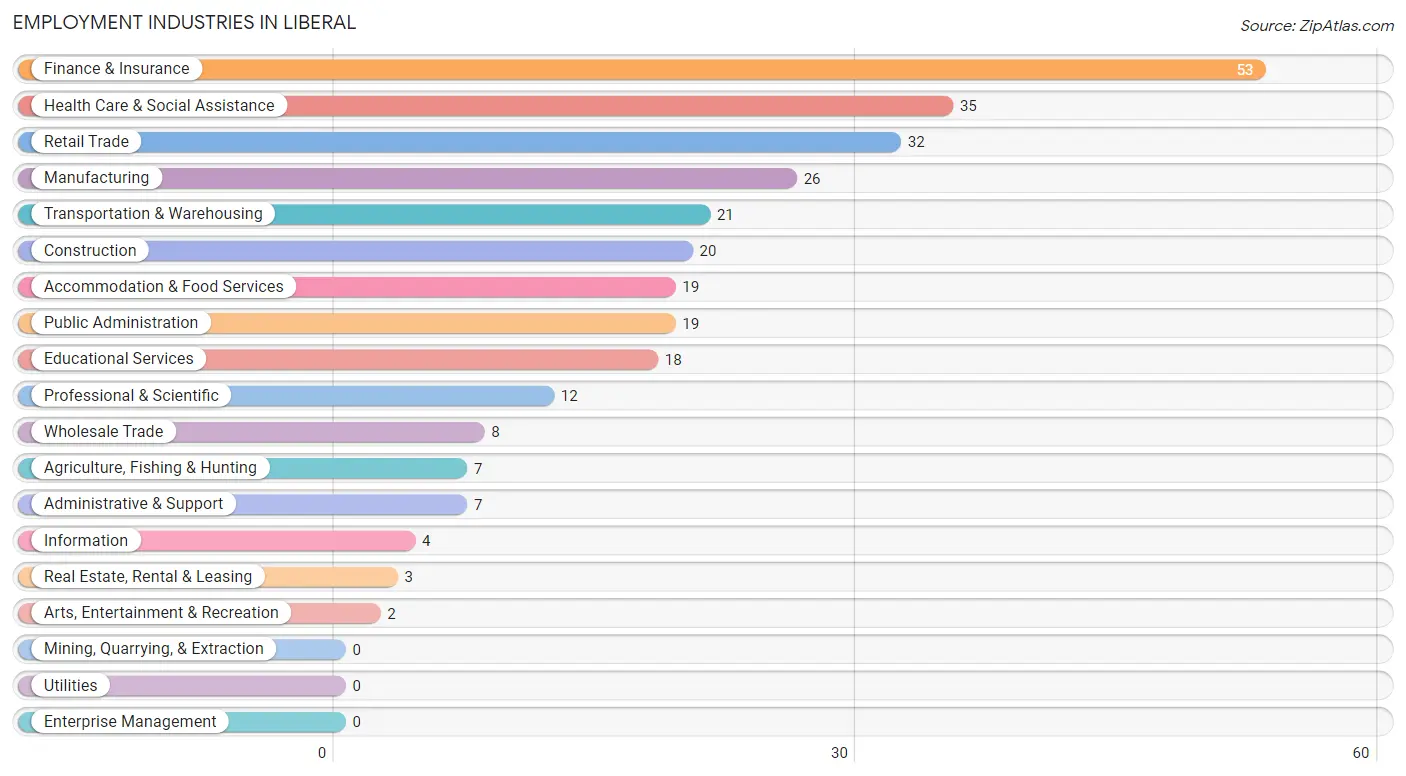
Employment Industries in Liberal
The major employment industries in Liberal include Finance & Insurance (53 | 17.9%), Health Care & Social Assistance (35 | 11.8%), Retail Trade (32 | 10.8%), Manufacturing (26 | 8.8%), and Transportation & Warehousing (21 | 7.1%).
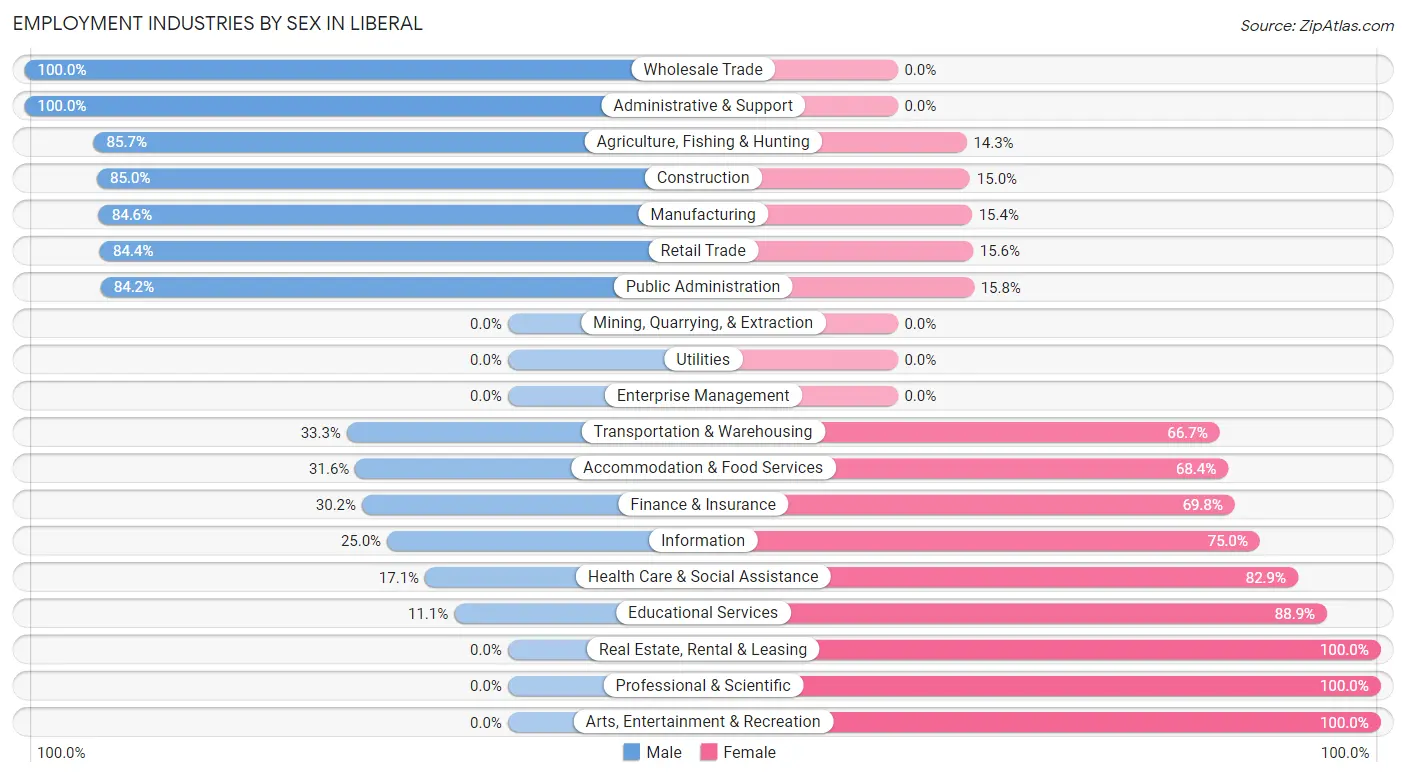
Employment Industries by Sex in Liberal
The Liberal industries that see more men than women are Wholesale Trade (100.0%), Administrative & Support (100.0%), and Agriculture, Fishing & Hunting (85.7%), whereas the industries that tend to have a higher number of women are Real Estate, Rental & Leasing (100.0%), Professional & Scientific (100.0%), and Arts, Entertainment & Recreation (100.0%).
| Industry | Male | Female |
| Agriculture, Fishing & Hunting | 6 (85.7%) | 1 (14.3%) |
| Mining, Quarrying, & Extraction | 0 (0.0%) | 0 (0.0%) |
| Construction | 17 (85.0%) | 3 (15.0%) |
| Manufacturing | 22 (84.6%) | 4 (15.4%) |
| Wholesale Trade | 8 (100.0%) | 0 (0.0%) |
| Retail Trade | 27 (84.4%) | 5 (15.6%) |
| Transportation & Warehousing | 7 (33.3%) | 14 (66.7%) |
| Utilities | 0 (0.0%) | 0 (0.0%) |
| Information | 1 (25.0%) | 3 (75.0%) |
| Finance & Insurance | 16 (30.2%) | 37 (69.8%) |
| Real Estate, Rental & Leasing | 0 (0.0%) | 3 (100.0%) |
| Professional & Scientific | 0 (0.0%) | 12 (100.0%) |
| Enterprise Management | 0 (0.0%) | 0 (0.0%) |
| Administrative & Support | 7 (100.0%) | 0 (0.0%) |
| Educational Services | 2 (11.1%) | 16 (88.9%) |
| Health Care & Social Assistance | 6 (17.1%) | 29 (82.9%) |
| Arts, Entertainment & Recreation | 0 (0.0%) | 2 (100.0%) |
| Accommodation & Food Services | 6 (31.6%) | 13 (68.4%) |
| Public Administration | 16 (84.2%) | 3 (15.8%) |
| Total | 150 (50.7%) | 146 (49.3%) |
Education in Liberal
School Enrollment in Liberal
The most common levels of schooling among the 190 students in Liberal are middle school (72 | 37.9%), elementary school (32 | 16.8%), and high school (31 | 16.3%).
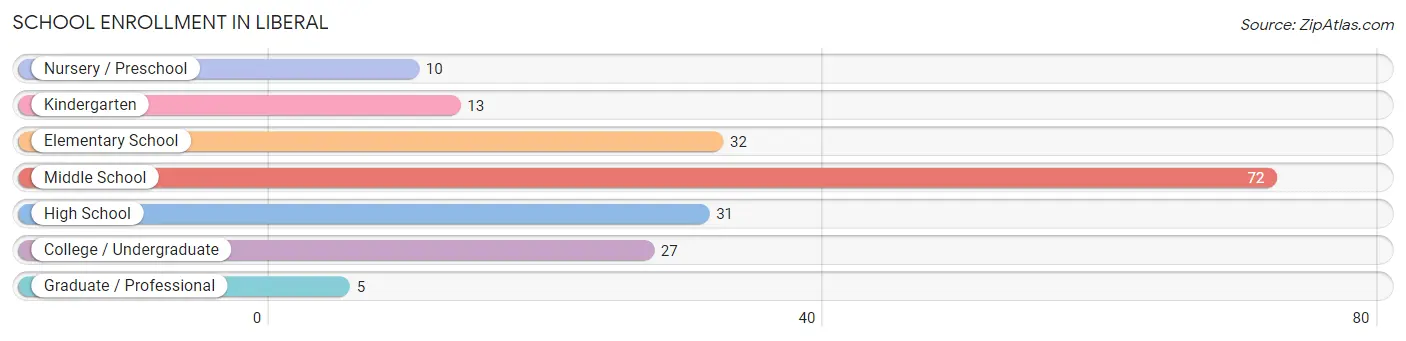
| School Level | # Students | % Students |
| Nursery / Preschool | 10 | 5.3% |
| Kindergarten | 13 | 6.8% |
| Elementary School | 32 | 16.8% |
| Middle School | 72 | 37.9% |
| High School | 31 | 16.3% |
| College / Undergraduate | 27 | 14.2% |
| Graduate / Professional | 5 | 2.6% |
| Total | 190 | 100.0% |
School Enrollment by Age by Funding Source in Liberal
Out of a total of 190 students who are enrolled in schools in Liberal, 30 (15.8%) attend a private institution, while the remaining 160 (84.2%) are enrolled in public schools. The age group of 10 to 14 year olds has the highest likelihood of being enrolled in private schools, with 20 (25.6% in the age bracket) enrolled. Conversely, the age group of 3 to 4 year olds has the lowest likelihood of being enrolled in a private school, with 10 (100.0% in the age bracket) attending a public institution.
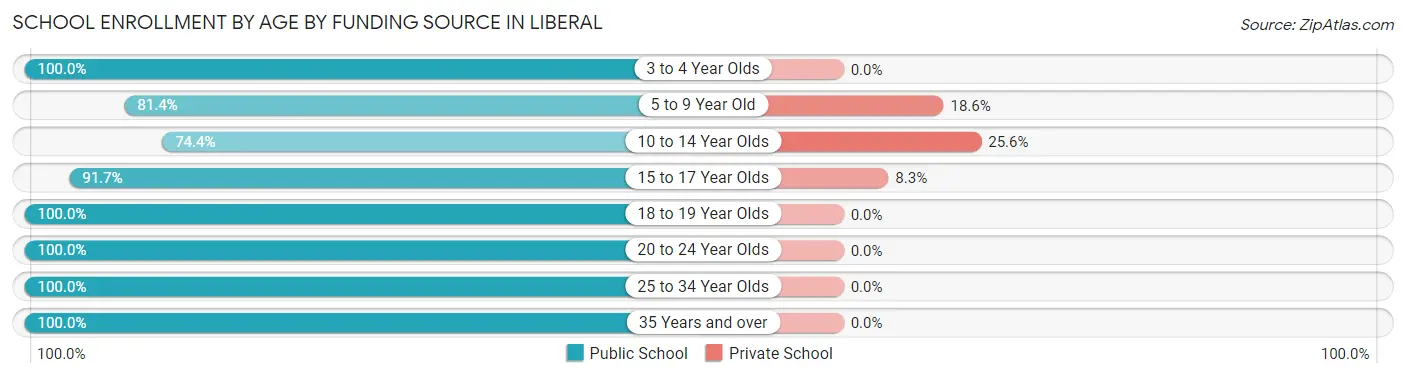
| Age Bracket | Public School | Private School |
| 3 to 4 Year Olds | 10 (100.0%) | 0 (0.0%) |
| 5 to 9 Year Old | 35 (81.4%) | 8 (18.6%) |
| 10 to 14 Year Olds | 58 (74.4%) | 20 (25.6%) |
| 15 to 17 Year Olds | 22 (91.7%) | 2 (8.3%) |
| 18 to 19 Year Olds | 10 (100.0%) | 0 (0.0%) |
| 20 to 24 Year Olds | 5 (100.0%) | 0 (0.0%) |
| 25 to 34 Year Olds | 12 (100.0%) | 0 (0.0%) |
| 35 Years and over | 8 (100.0%) | 0 (0.0%) |
| Total | 160 (84.2%) | 30 (15.8%) |
Educational Attainment by Field of Study in Liberal
Education (26 | 26.5%), business (19 | 19.4%), communications (14 | 14.3%), physical & health sciences (12 | 12.2%), and science & technology (7 | 7.1%) are the most common fields of study among 98 individuals in Liberal who have obtained a bachelor's degree or higher.
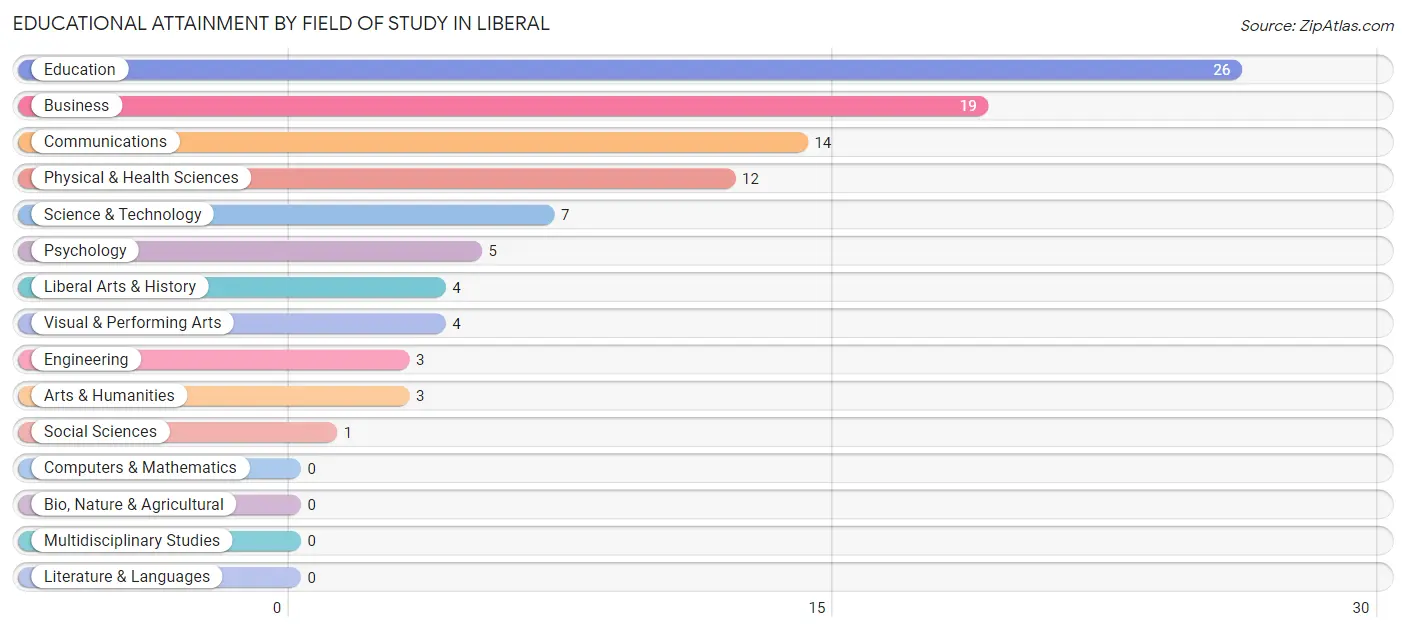
| Field of Study | # Graduates | % Graduates |
| Computers & Mathematics | 0 | 0.0% |
| Bio, Nature & Agricultural | 0 | 0.0% |
| Physical & Health Sciences | 12 | 12.2% |
| Psychology | 5 | 5.1% |
| Social Sciences | 1 | 1.0% |
| Engineering | 3 | 3.1% |
| Multidisciplinary Studies | 0 | 0.0% |
| Science & Technology | 7 | 7.1% |
| Business | 19 | 19.4% |
| Education | 26 | 26.5% |
| Literature & Languages | 0 | 0.0% |
| Liberal Arts & History | 4 | 4.1% |
| Visual & Performing Arts | 4 | 4.1% |
| Communications | 14 | 14.3% |
| Arts & Humanities | 3 | 3.1% |
| Total | 98 | 100.0% |
Transportation & Commute in Liberal
Vehicle Availability by Sex in Liberal
The most prevalent vehicle ownership categories in Liberal are males with 2 vehicles (72, accounting for 48.0%) and females with 2 vehicles (53, making up 49.3%).
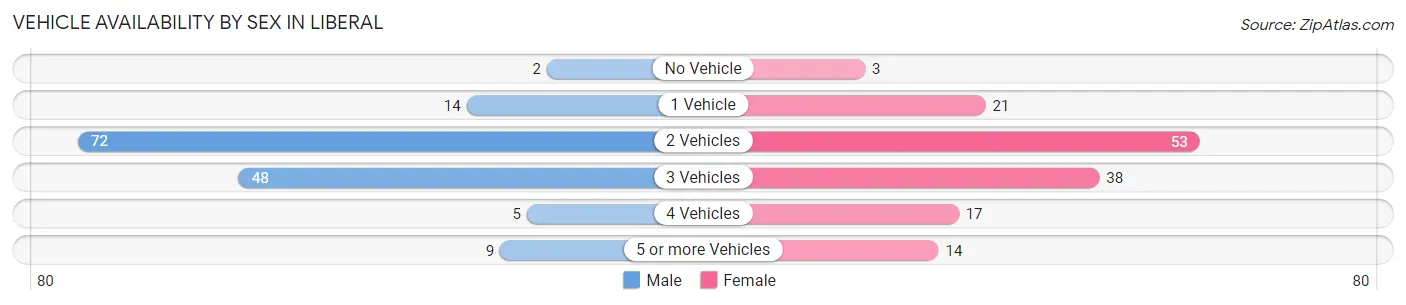
| Vehicles Available | Male | Female |
| No Vehicle | 2 (1.3%) | 3 (2.1%) |
| 1 Vehicle | 14 (9.3%) | 21 (14.4%) |
| 2 Vehicles | 72 (48.0%) | 53 (36.3%) |
| 3 Vehicles | 48 (32.0%) | 38 (26.0%) |
| 4 Vehicles | 5 (3.3%) | 17 (11.6%) |
| 5 or more Vehicles | 9 (6.0%) | 14 (9.6%) |
| Total | 150 (100.0%) | 146 (100.0%) |
Commute Time in Liberal
The most frequently occuring commute durations in Liberal are 30 to 34 minutes (81 commuters, 27.7%), less than 5 minutes (42 commuters, 14.3%), and 20 to 24 minutes (32 commuters, 10.9%).
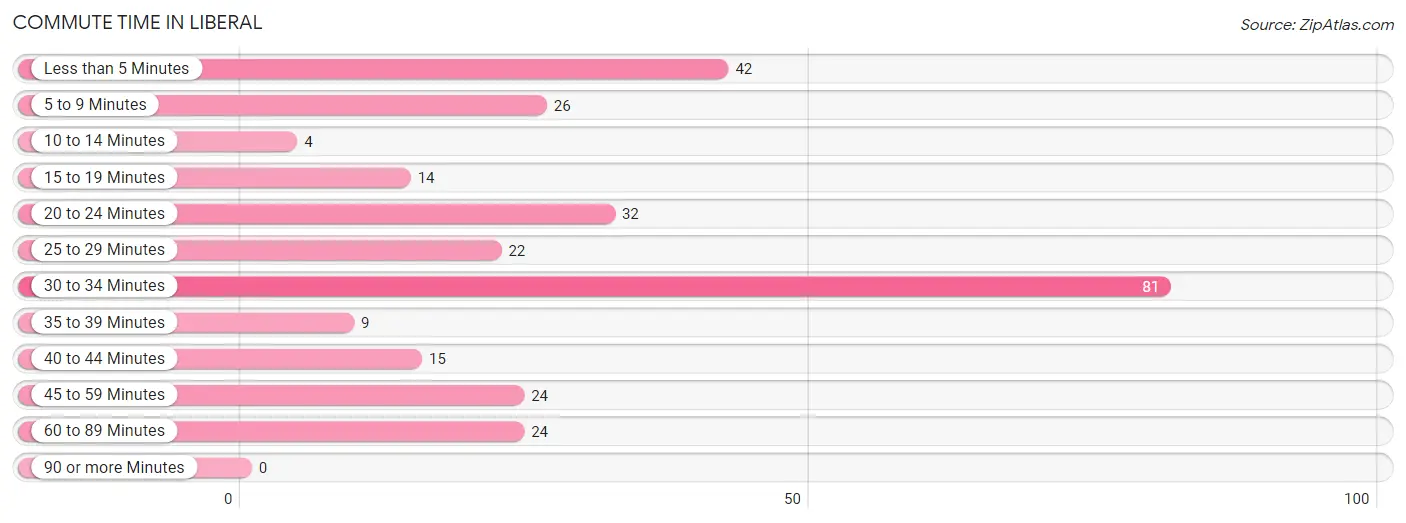
| Commute Time | # Commuters | % Commuters |
| Less than 5 Minutes | 42 | 14.3% |
| 5 to 9 Minutes | 26 | 8.9% |
| 10 to 14 Minutes | 4 | 1.4% |
| 15 to 19 Minutes | 14 | 4.8% |
| 20 to 24 Minutes | 32 | 10.9% |
| 25 to 29 Minutes | 22 | 7.5% |
| 30 to 34 Minutes | 81 | 27.7% |
| 35 to 39 Minutes | 9 | 3.1% |
| 40 to 44 Minutes | 15 | 5.1% |
| 45 to 59 Minutes | 24 | 8.2% |
| 60 to 89 Minutes | 24 | 8.2% |
| 90 or more Minutes | 0 | 0.0% |
Commute Time by Sex in Liberal
The most common commute times in Liberal are 30 to 34 minutes (43 commuters, 28.7%) for males and 30 to 34 minutes (38 commuters, 26.6%) for females.
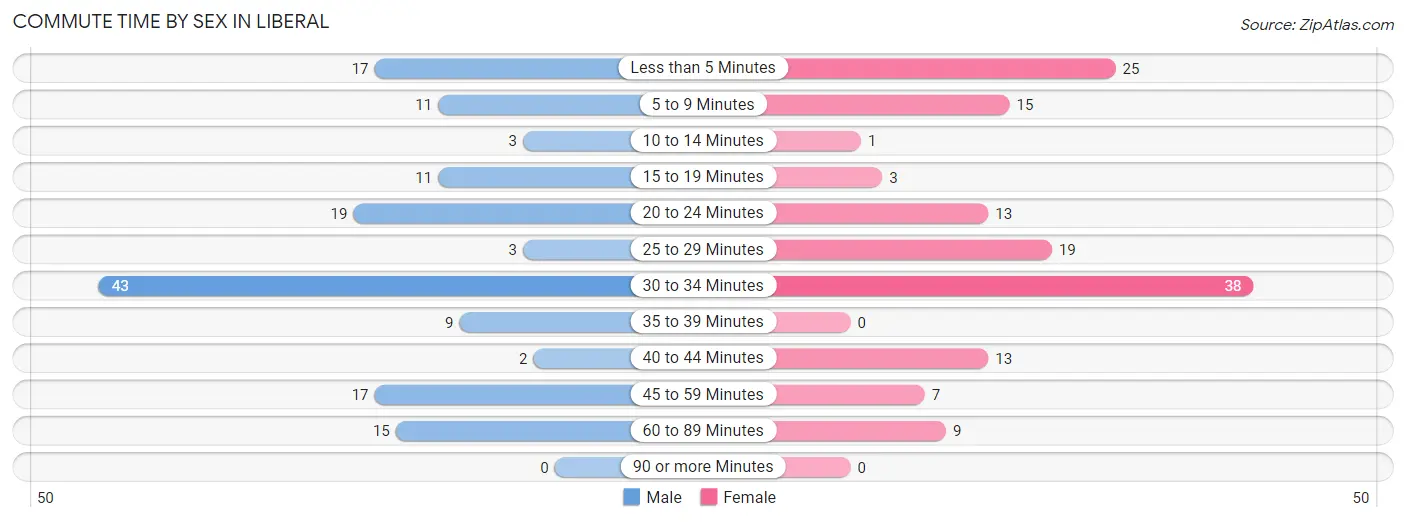
| Commute Time | Male | Female |
| Less than 5 Minutes | 17 (11.3%) | 25 (17.5%) |
| 5 to 9 Minutes | 11 (7.3%) | 15 (10.5%) |
| 10 to 14 Minutes | 3 (2.0%) | 1 (0.7%) |
| 15 to 19 Minutes | 11 (7.3%) | 3 (2.1%) |
| 20 to 24 Minutes | 19 (12.7%) | 13 (9.1%) |
| 25 to 29 Minutes | 3 (2.0%) | 19 (13.3%) |
| 30 to 34 Minutes | 43 (28.7%) | 38 (26.6%) |
| 35 to 39 Minutes | 9 (6.0%) | 0 (0.0%) |
| 40 to 44 Minutes | 2 (1.3%) | 13 (9.1%) |
| 45 to 59 Minutes | 17 (11.3%) | 7 (4.9%) |
| 60 to 89 Minutes | 15 (10.0%) | 9 (6.3%) |
| 90 or more Minutes | 0 (0.0%) | 0 (0.0%) |
Time of Departure to Work by Sex in Liberal
The most frequent times of departure to work in Liberal are 6:30 AM to 6:59 AM (41, 27.3%) for males and 7:30 AM to 7:59 AM (39, 27.3%) for females.
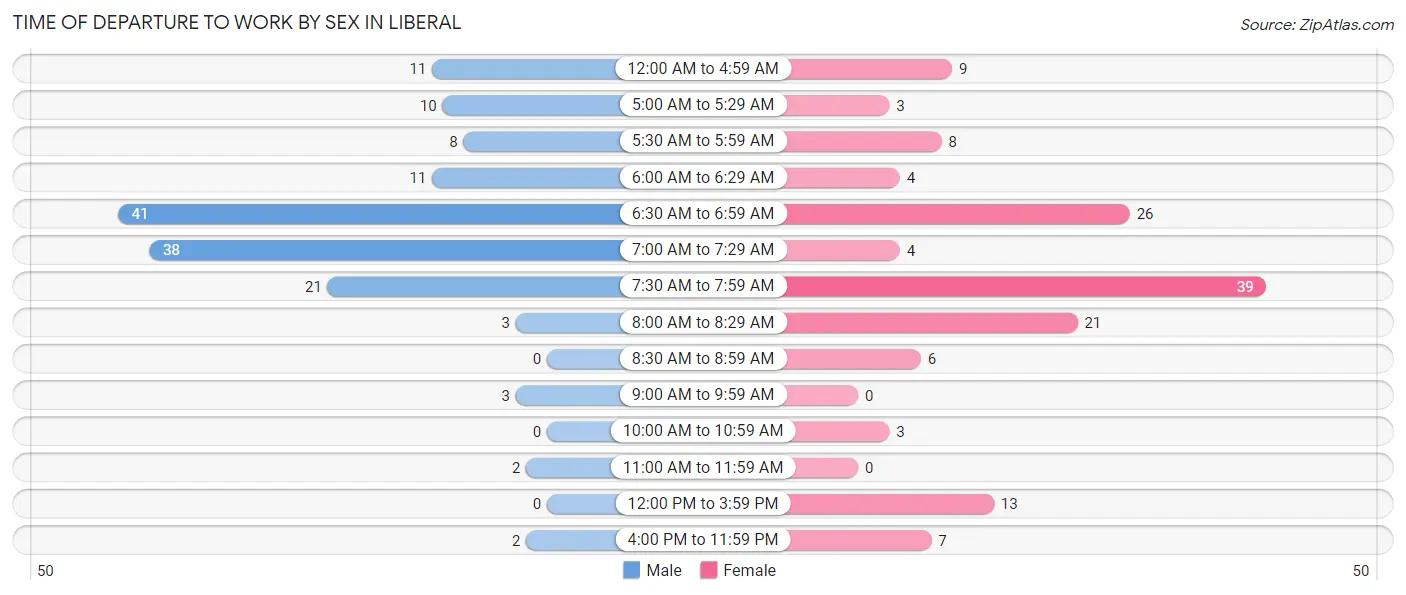
| Time of Departure | Male | Female |
| 12:00 AM to 4:59 AM | 11 (7.3%) | 9 (6.3%) |
| 5:00 AM to 5:29 AM | 10 (6.7%) | 3 (2.1%) |
| 5:30 AM to 5:59 AM | 8 (5.3%) | 8 (5.6%) |
| 6:00 AM to 6:29 AM | 11 (7.3%) | 4 (2.8%) |
| 6:30 AM to 6:59 AM | 41 (27.3%) | 26 (18.2%) |
| 7:00 AM to 7:29 AM | 38 (25.3%) | 4 (2.8%) |
| 7:30 AM to 7:59 AM | 21 (14.0%) | 39 (27.3%) |
| 8:00 AM to 8:29 AM | 3 (2.0%) | 21 (14.7%) |
| 8:30 AM to 8:59 AM | 0 (0.0%) | 6 (4.2%) |
| 9:00 AM to 9:59 AM | 3 (2.0%) | 0 (0.0%) |
| 10:00 AM to 10:59 AM | 0 (0.0%) | 3 (2.1%) |
| 11:00 AM to 11:59 AM | 2 (1.3%) | 0 (0.0%) |
| 12:00 PM to 3:59 PM | 0 (0.0%) | 13 (9.1%) |
| 4:00 PM to 11:59 PM | 2 (1.3%) | 7 (4.9%) |
| Total | 150 (100.0%) | 143 (100.0%) |
Housing Occupancy in Liberal
Occupancy by Ownership in Liberal
Of the total 319 dwellings in Liberal, owner-occupied units account for 216 (67.7%), while renter-occupied units make up 103 (32.3%).
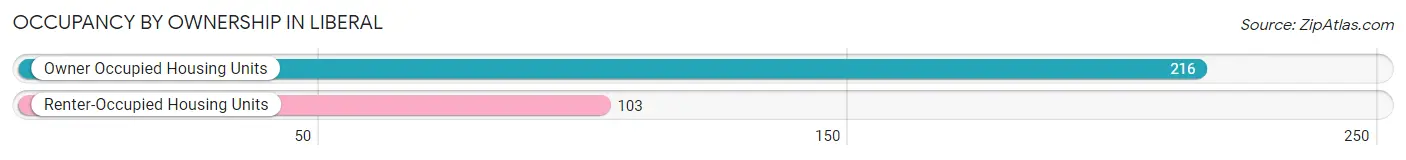
| Occupancy | # Housing Units | % Housing Units |
| Owner Occupied Housing Units | 216 | 67.7% |
| Renter-Occupied Housing Units | 103 | 32.3% |
| Total Occupied Housing Units | 319 | 100.0% |
Occupancy by Household Size in Liberal
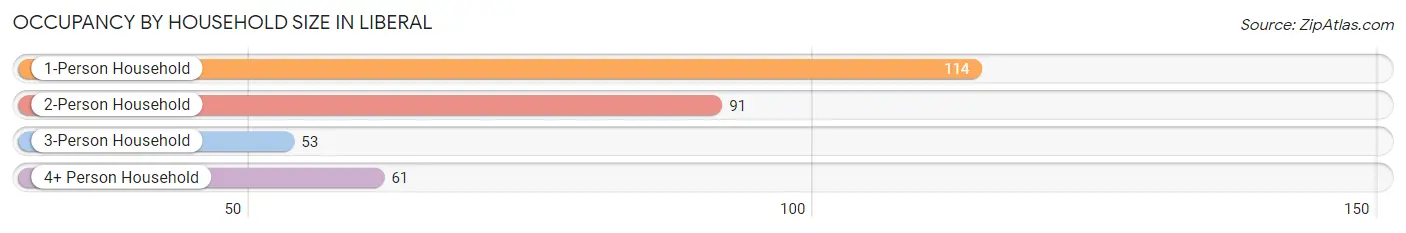
| Household Size | # Housing Units | % Housing Units |
| 1-Person Household | 114 | 35.7% |
| 2-Person Household | 91 | 28.5% |
| 3-Person Household | 53 | 16.6% |
| 4+ Person Household | 61 | 19.1% |
| Total Housing Units | 319 | 100.0% |
Occupancy by Ownership by Household Size in Liberal
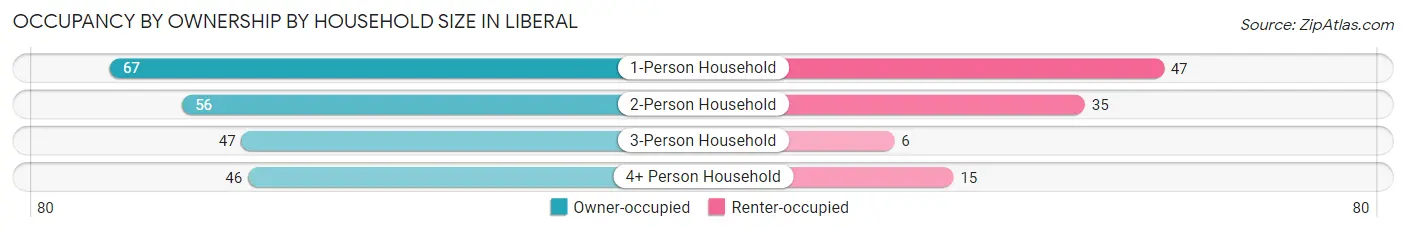
| Household Size | Owner-occupied | Renter-occupied |
| 1-Person Household | 67 (58.8%) | 47 (41.2%) |
| 2-Person Household | 56 (61.5%) | 35 (38.5%) |
| 3-Person Household | 47 (88.7%) | 6 (11.3%) |
| 4+ Person Household | 46 (75.4%) | 15 (24.6%) |
| Total Housing Units | 216 (67.7%) | 103 (32.3%) |
Occupancy by Educational Attainment in Liberal
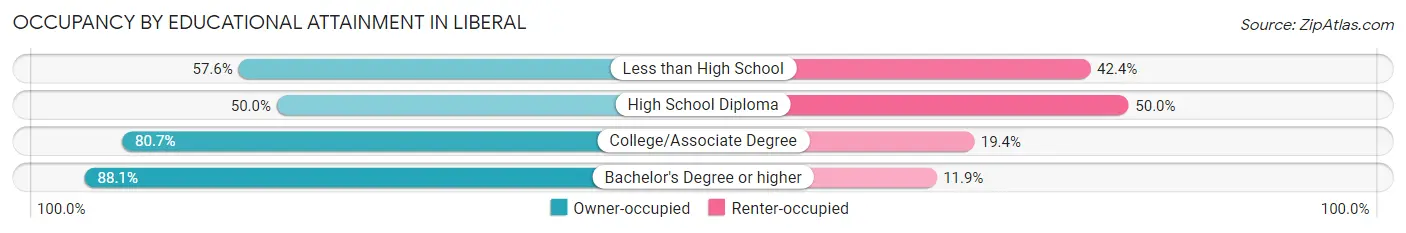
| Household Size | Owner-occupied | Renter-occupied |
| Less than High School | 19 (57.6%) | 14 (42.4%) |
| High School Diploma | 60 (50.0%) | 60 (50.0%) |
| College/Associate Degree | 100 (80.6%) | 24 (19.4%) |
| Bachelor's Degree or higher | 37 (88.1%) | 5 (11.9%) |
Occupancy by Age of Householder in Liberal
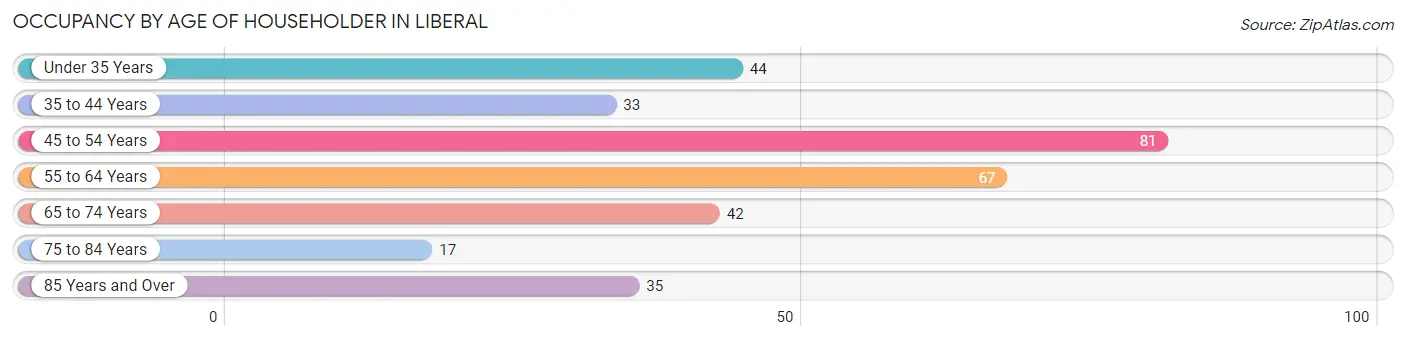
| Age Bracket | # Households | % Households |
| Under 35 Years | 44 | 13.8% |
| 35 to 44 Years | 33 | 10.3% |
| 45 to 54 Years | 81 | 25.4% |
| 55 to 64 Years | 67 | 21.0% |
| 65 to 74 Years | 42 | 13.2% |
| 75 to 84 Years | 17 | 5.3% |
| 85 Years and Over | 35 | 11.0% |
| Total | 319 | 100.0% |
Housing Finances in Liberal
Median Income by Occupancy in Liberal

| Occupancy Type | # Households | Median Income |
| Owner-Occupied | 216 (67.7%) | $57,500 |
| Renter-Occupied | 103 (32.3%) | $30,625 |
| Average | 319 (100.0%) | $49,464 |
Occupancy by Householder Income Bracket in Liberal
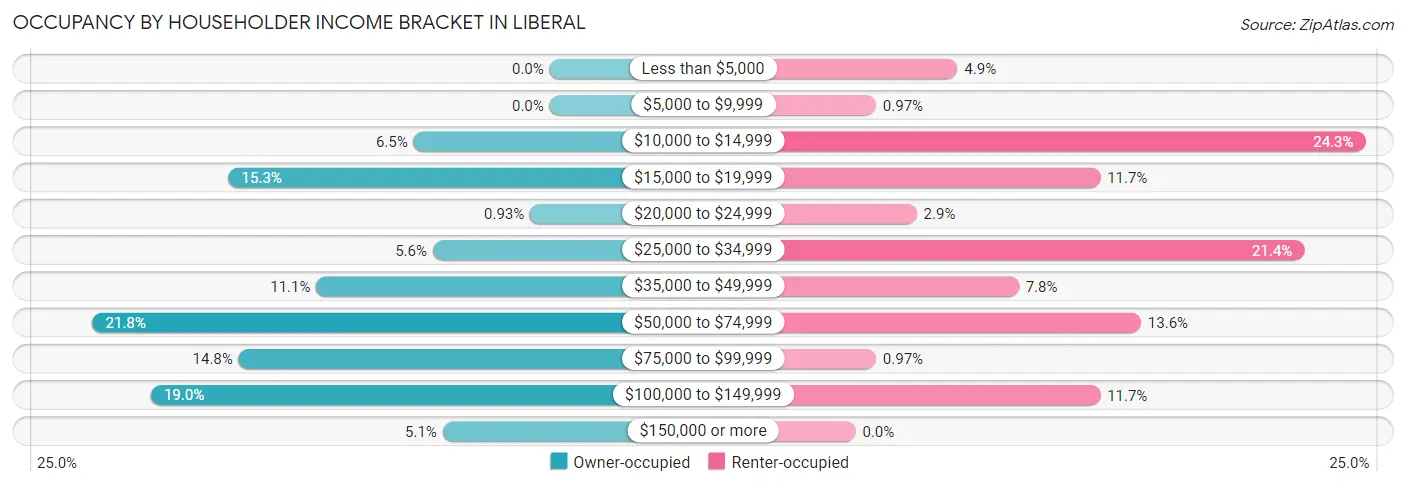
| Income Bracket | Owner-occupied | Renter-occupied |
| Less than $5,000 | 0 (0.0%) | 5 (4.9%) |
| $5,000 to $9,999 | 0 (0.0%) | 1 (1.0%) |
| $10,000 to $14,999 | 14 (6.5%) | 25 (24.3%) |
| $15,000 to $19,999 | 33 (15.3%) | 12 (11.7%) |
| $20,000 to $24,999 | 2 (0.9%) | 3 (2.9%) |
| $25,000 to $34,999 | 12 (5.6%) | 22 (21.4%) |
| $35,000 to $49,999 | 24 (11.1%) | 8 (7.8%) |
| $50,000 to $74,999 | 47 (21.8%) | 14 (13.6%) |
| $75,000 to $99,999 | 32 (14.8%) | 1 (1.0%) |
| $100,000 to $149,999 | 41 (19.0%) | 12 (11.7%) |
| $150,000 or more | 11 (5.1%) | 0 (0.0%) |
| Total | 216 (100.0%) | 103 (100.0%) |
Monthly Housing Cost Tiers in Liberal
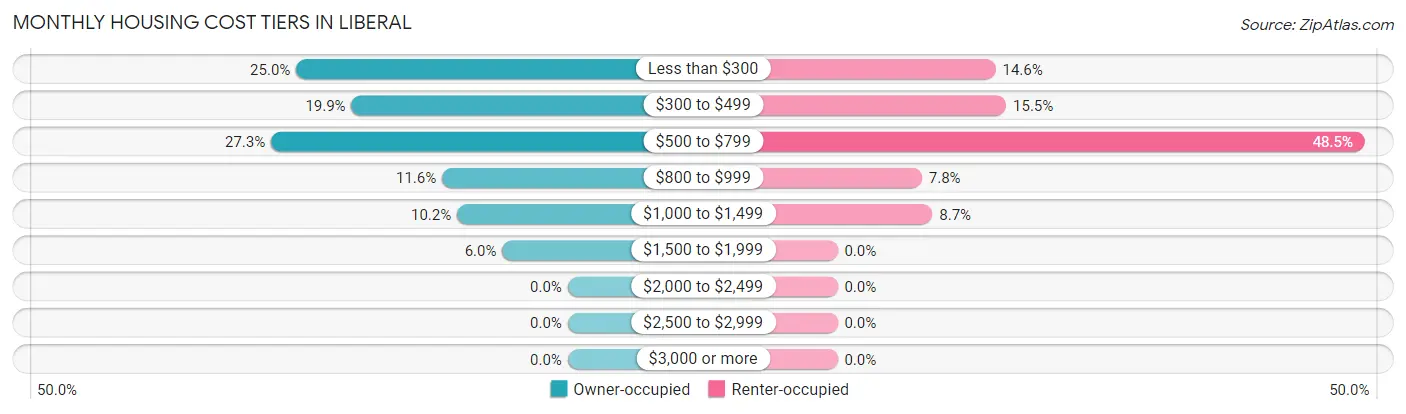
| Monthly Cost | Owner-occupied | Renter-occupied |
| Less than $300 | 54 (25.0%) | 15 (14.6%) |
| $300 to $499 | 43 (19.9%) | 16 (15.5%) |
| $500 to $799 | 59 (27.3%) | 50 (48.5%) |
| $800 to $999 | 25 (11.6%) | 8 (7.8%) |
| $1,000 to $1,499 | 22 (10.2%) | 9 (8.7%) |
| $1,500 to $1,999 | 13 (6.0%) | 0 (0.0%) |
| $2,000 to $2,499 | 0 (0.0%) | 0 (0.0%) |
| $2,500 to $2,999 | 0 (0.0%) | 0 (0.0%) |
| $3,000 or more | 0 (0.0%) | 0 (0.0%) |
| Total | 216 (100.0%) | 103 (100.0%) |
Physical Housing Characteristics in Liberal
Housing Structures in Liberal
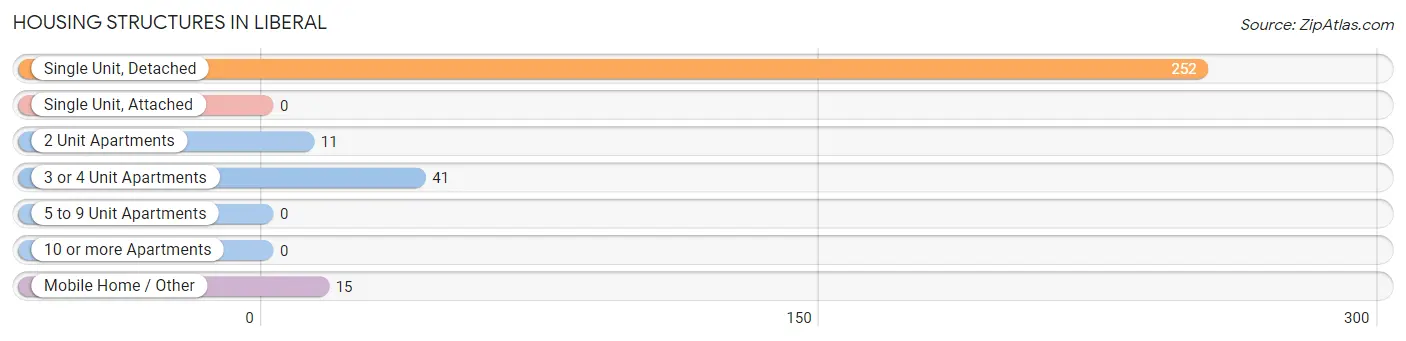
| Structure Type | # Housing Units | % Housing Units |
| Single Unit, Detached | 252 | 79.0% |
| Single Unit, Attached | 0 | 0.0% |
| 2 Unit Apartments | 11 | 3.5% |
| 3 or 4 Unit Apartments | 41 | 12.9% |
| 5 to 9 Unit Apartments | 0 | 0.0% |
| 10 or more Apartments | 0 | 0.0% |
| Mobile Home / Other | 15 | 4.7% |
| Total | 319 | 100.0% |
Housing Structures by Occupancy in Liberal
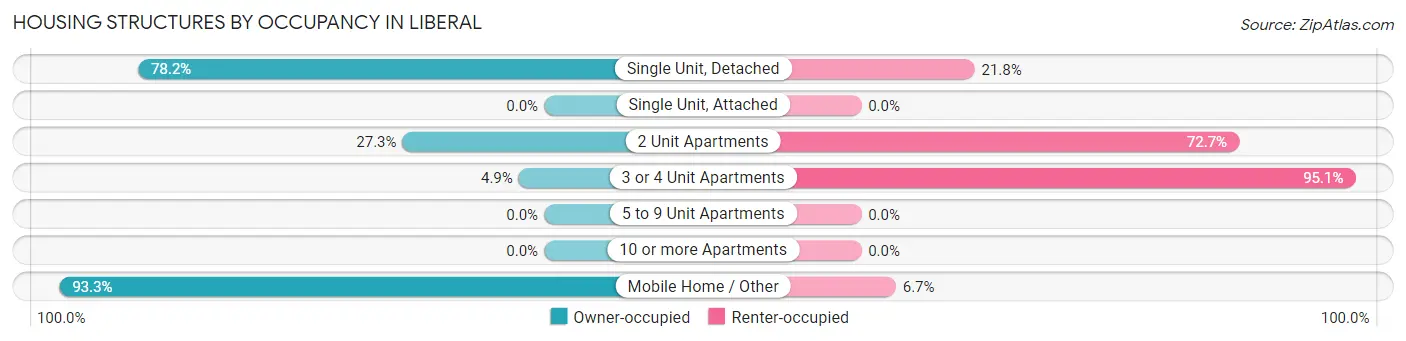
| Structure Type | Owner-occupied | Renter-occupied |
| Single Unit, Detached | 197 (78.2%) | 55 (21.8%) |
| Single Unit, Attached | 0 (0.0%) | 0 (0.0%) |
| 2 Unit Apartments | 3 (27.3%) | 8 (72.7%) |
| 3 or 4 Unit Apartments | 2 (4.9%) | 39 (95.1%) |
| 5 to 9 Unit Apartments | 0 (0.0%) | 0 (0.0%) |
| 10 or more Apartments | 0 (0.0%) | 0 (0.0%) |
| Mobile Home / Other | 14 (93.3%) | 1 (6.7%) |
| Total | 216 (67.7%) | 103 (32.3%) |
Housing Structures by Number of Rooms in Liberal
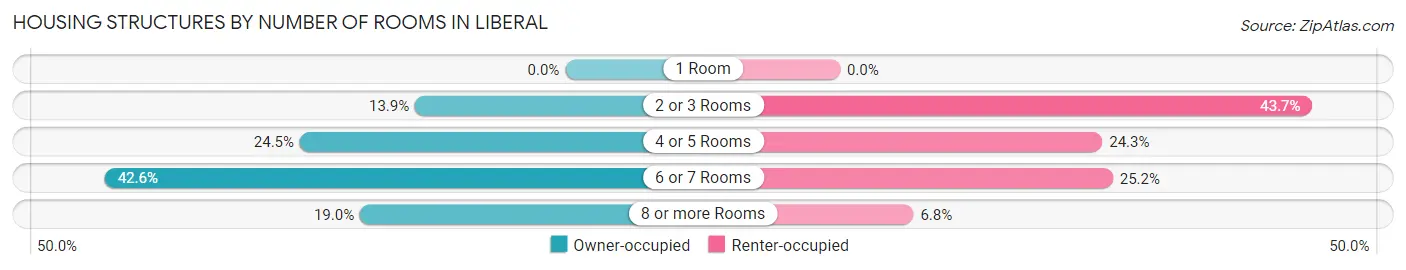
| Number of Rooms | Owner-occupied | Renter-occupied |
| 1 Room | 0 (0.0%) | 0 (0.0%) |
| 2 or 3 Rooms | 30 (13.9%) | 45 (43.7%) |
| 4 or 5 Rooms | 53 (24.5%) | 25 (24.3%) |
| 6 or 7 Rooms | 92 (42.6%) | 26 (25.2%) |
| 8 or more Rooms | 41 (19.0%) | 7 (6.8%) |
| Total | 216 (100.0%) | 103 (100.0%) |
Housing Structure by Heating Type in Liberal
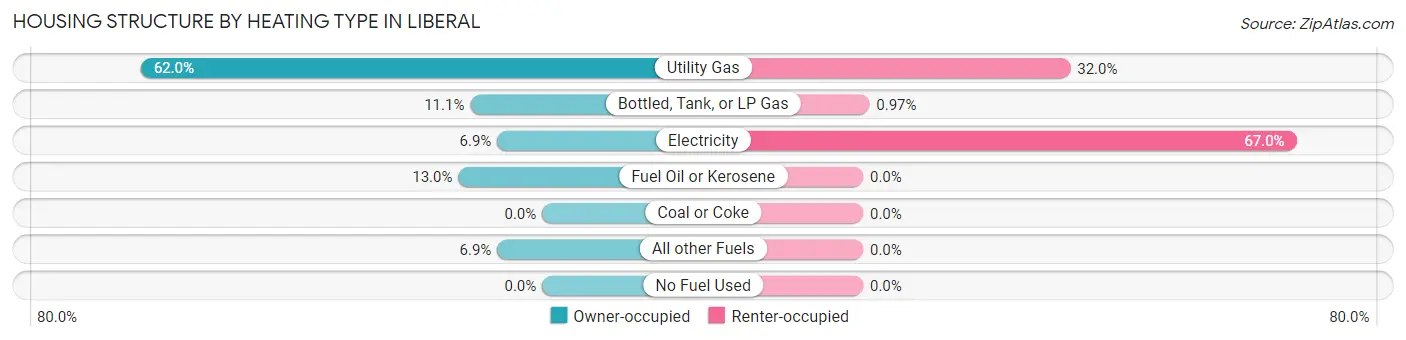
| Heating Type | Owner-occupied | Renter-occupied |
| Utility Gas | 134 (62.0%) | 33 (32.0%) |
| Bottled, Tank, or LP Gas | 24 (11.1%) | 1 (1.0%) |
| Electricity | 15 (6.9%) | 69 (67.0%) |
| Fuel Oil or Kerosene | 28 (13.0%) | 0 (0.0%) |
| Coal or Coke | 0 (0.0%) | 0 (0.0%) |
| All other Fuels | 15 (6.9%) | 0 (0.0%) |
| No Fuel Used | 0 (0.0%) | 0 (0.0%) |
| Total | 216 (100.0%) | 103 (100.0%) |
Household Vehicle Usage in Liberal
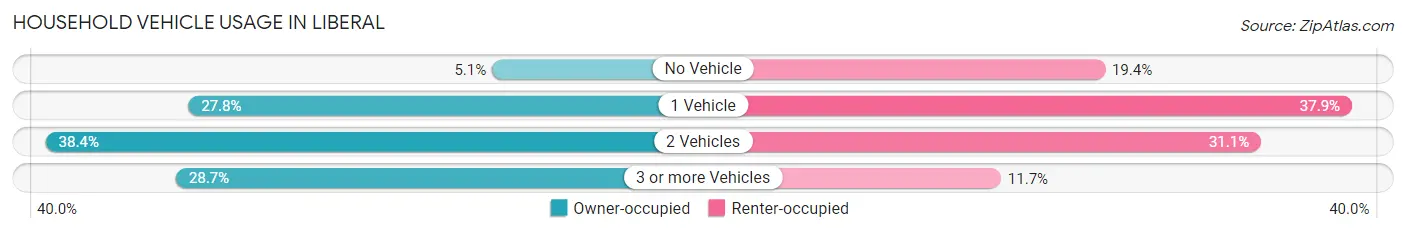
| Vehicles per Household | Owner-occupied | Renter-occupied |
| No Vehicle | 11 (5.1%) | 20 (19.4%) |
| 1 Vehicle | 60 (27.8%) | 39 (37.9%) |
| 2 Vehicles | 83 (38.4%) | 32 (31.1%) |
| 3 or more Vehicles | 62 (28.7%) | 12 (11.7%) |
| Total | 216 (100.0%) | 103 (100.0%) |
Real Estate & Mortgages in Liberal
Real Estate and Mortgage Overview in Liberal
| Characteristic | Without Mortgage | With Mortgage |
| Housing Units | 123 | 93 |
| Median Property Value | $38,400 | $91,300 |
| Median Household Income | $36,875 | $11 |
| Monthly Housing Costs | $321 | $0 |
| Real Estate Taxes | $272 | $4 |
Property Value by Mortgage Status in Liberal
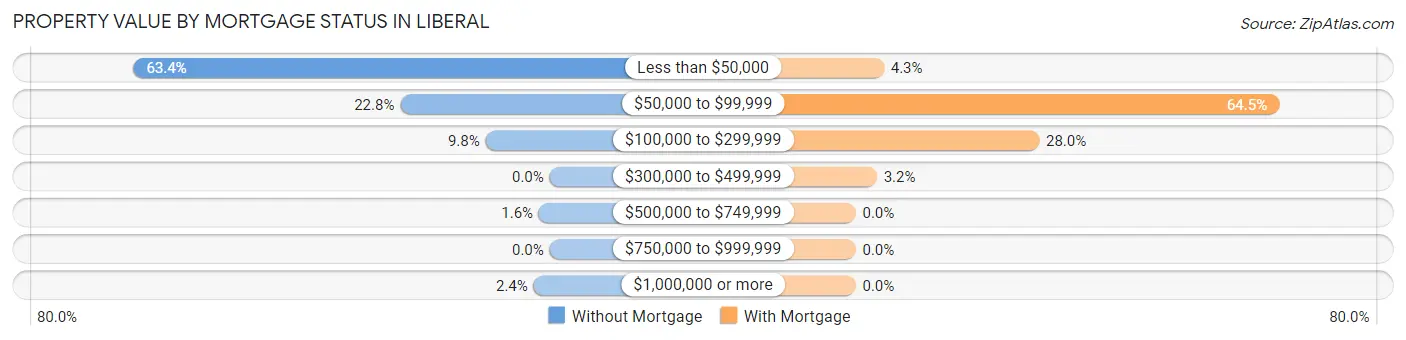
| Property Value | Without Mortgage | With Mortgage |
| Less than $50,000 | 78 (63.4%) | 4 (4.3%) |
| $50,000 to $99,999 | 28 (22.8%) | 60 (64.5%) |
| $100,000 to $299,999 | 12 (9.8%) | 26 (28.0%) |
| $300,000 to $499,999 | 0 (0.0%) | 3 (3.2%) |
| $500,000 to $749,999 | 2 (1.6%) | 0 (0.0%) |
| $750,000 to $999,999 | 0 (0.0%) | 0 (0.0%) |
| $1,000,000 or more | 3 (2.4%) | 0 (0.0%) |
| Total | 123 (100.0%) | 93 (100.0%) |
Household Income by Mortgage Status in Liberal
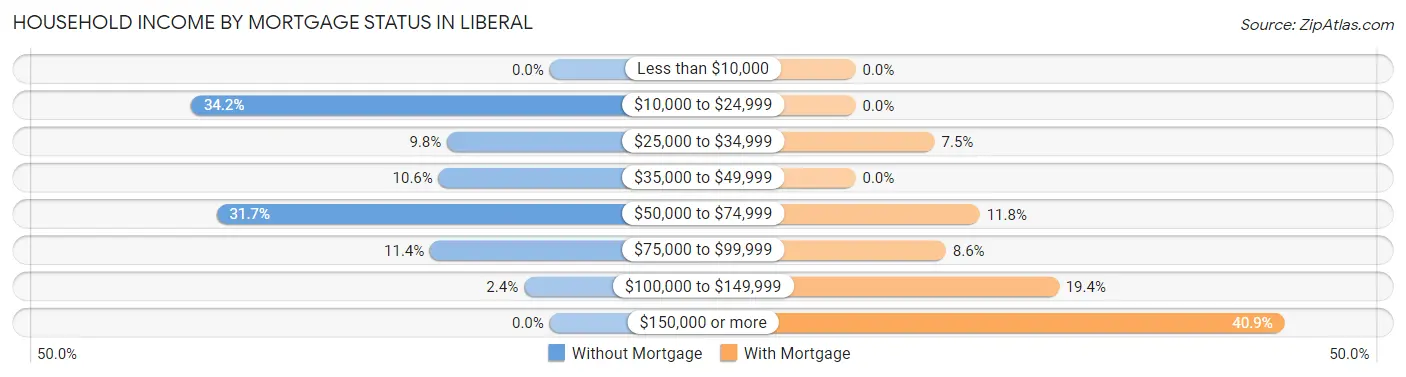
| Household Income | Without Mortgage | With Mortgage |
| Less than $10,000 | 0 (0.0%) | 0 (0.0%) |
| $10,000 to $24,999 | 42 (34.2%) | 0 (0.0%) |
| $25,000 to $34,999 | 12 (9.8%) | 7 (7.5%) |
| $35,000 to $49,999 | 13 (10.6%) | 0 (0.0%) |
| $50,000 to $74,999 | 39 (31.7%) | 11 (11.8%) |
| $75,000 to $99,999 | 14 (11.4%) | 8 (8.6%) |
| $100,000 to $149,999 | 3 (2.4%) | 18 (19.4%) |
| $150,000 or more | 0 (0.0%) | 38 (40.9%) |
| Total | 123 (100.0%) | 93 (100.0%) |
Property Value to Household Income Ratio in Liberal
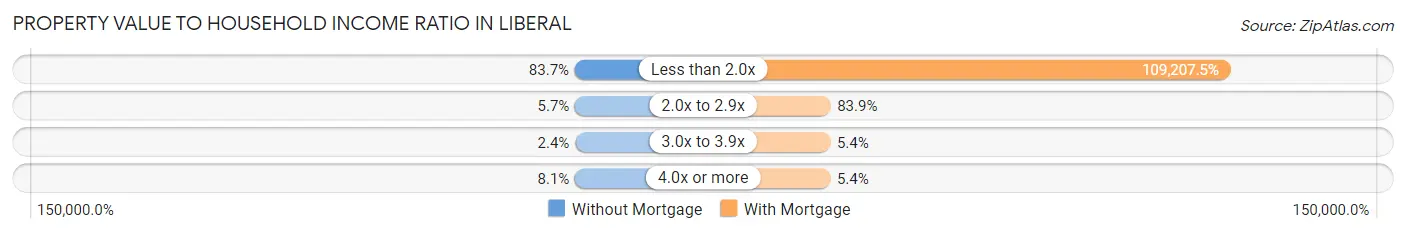
| Value-to-Income Ratio | Without Mortgage | With Mortgage |
| Less than 2.0x | 103 (83.7%) | 101,563 (109,207.5%) |
| 2.0x to 2.9x | 7 (5.7%) | 78 (83.9%) |
| 3.0x to 3.9x | 3 (2.4%) | 5 (5.4%) |
| 4.0x or more | 10 (8.1%) | 5 (5.4%) |
| Total | 123 (100.0%) | 93 (100.0%) |
Real Estate Taxes by Mortgage Status in Liberal
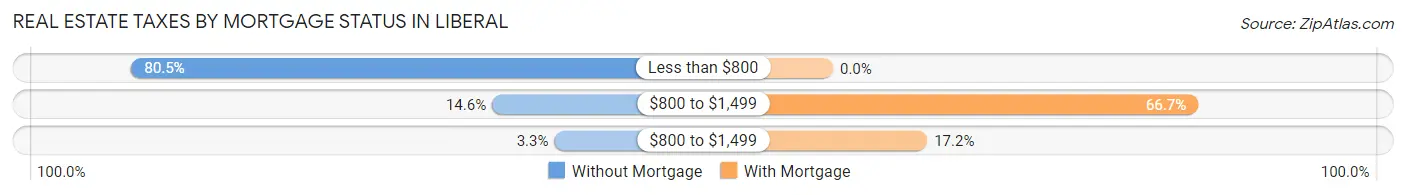
| Property Taxes | Without Mortgage | With Mortgage |
| Less than $800 | 99 (80.5%) | 0 (0.0%) |
| $800 to $1,499 | 18 (14.6%) | 62 (66.7%) |
| $800 to $1,499 | 4 (3.3%) | 16 (17.2%) |
| Total | 123 (100.0%) | 93 (100.0%) |
Health & Disability in Liberal
Health Insurance Coverage by Age in Liberal
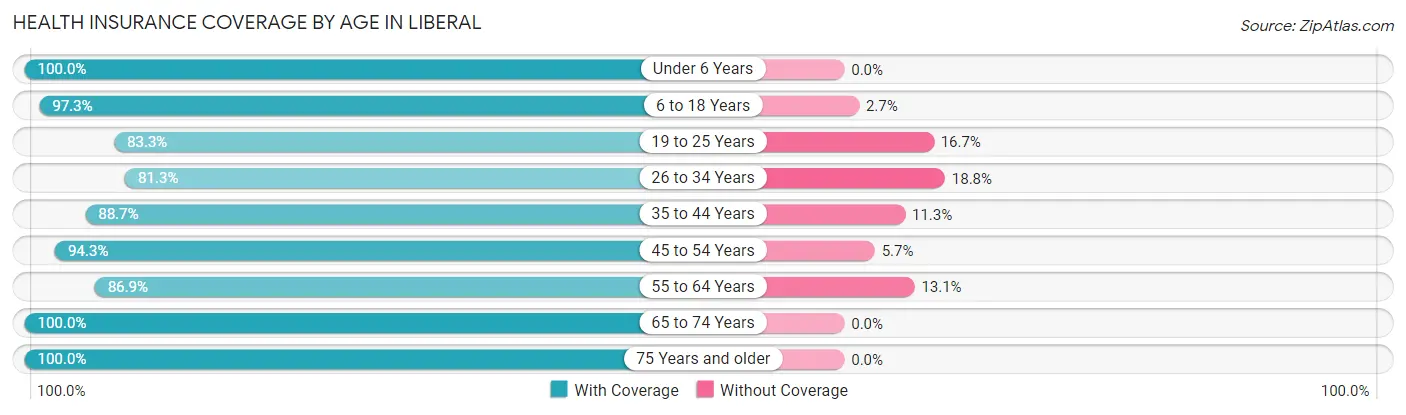
| Age Bracket | With Coverage | Without Coverage |
| Under 6 Years | 63 (100.0%) | 0 (0.0%) |
| 6 to 18 Years | 142 (97.3%) | 4 (2.7%) |
| 19 to 25 Years | 60 (83.3%) | 12 (16.7%) |
| 26 to 34 Years | 65 (81.2%) | 15 (18.8%) |
| 35 to 44 Years | 47 (88.7%) | 6 (11.3%) |
| 45 to 54 Years | 133 (94.3%) | 8 (5.7%) |
| 55 to 64 Years | 93 (86.9%) | 14 (13.1%) |
| 65 to 74 Years | 64 (100.0%) | 0 (0.0%) |
| 75 Years and older | 66 (100.0%) | 0 (0.0%) |
| Total | 733 (92.5%) | 59 (7.4%) |
Health Insurance Coverage by Citizenship Status in Liberal
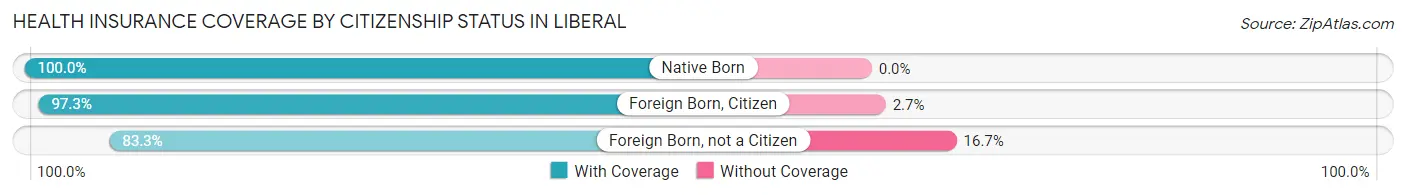
| Citizenship Status | With Coverage | Without Coverage |
| Native Born | 63 (100.0%) | 0 (0.0%) |
| Foreign Born, Citizen | 142 (97.3%) | 4 (2.7%) |
| Foreign Born, not a Citizen | 60 (83.3%) | 12 (16.7%) |
Health Insurance Coverage by Household Income in Liberal
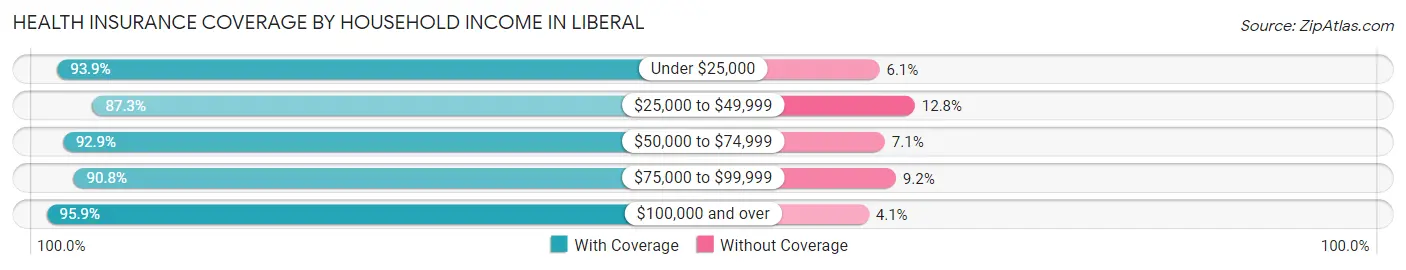
| Household Income | With Coverage | Without Coverage |
| Under $25,000 | 107 (93.9%) | 7 (6.1%) |
| $25,000 to $49,999 | 130 (87.3%) | 19 (12.8%) |
| $50,000 to $74,999 | 208 (92.9%) | 16 (7.1%) |
| $75,000 to $99,999 | 79 (90.8%) | 8 (9.2%) |
| $100,000 and over | 209 (95.9%) | 9 (4.1%) |
Public vs Private Health Insurance Coverage by Age in Liberal
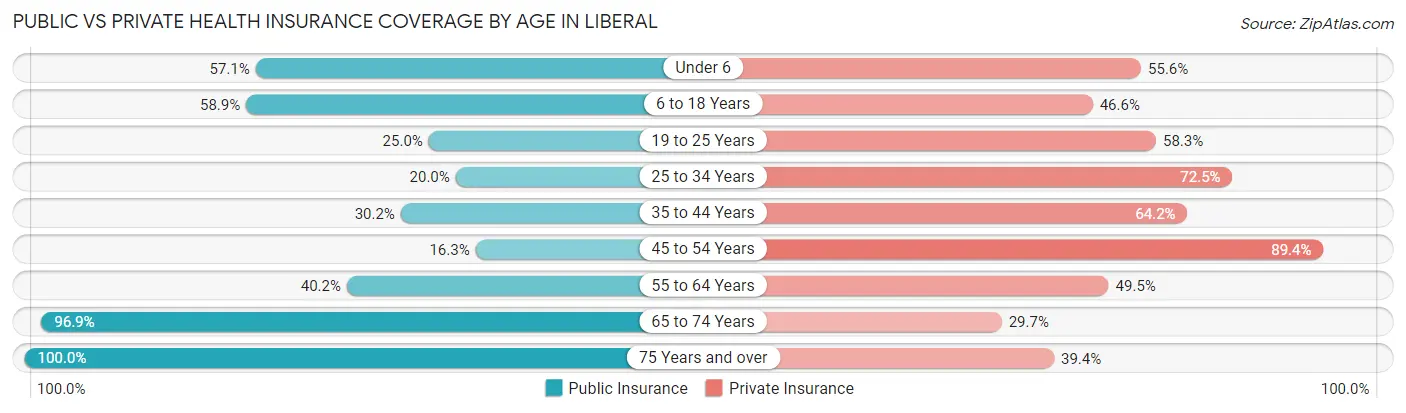
| Age Bracket | Public Insurance | Private Insurance |
| Under 6 | 36 (57.1%) | 35 (55.6%) |
| 6 to 18 Years | 86 (58.9%) | 68 (46.6%) |
| 19 to 25 Years | 18 (25.0%) | 42 (58.3%) |
| 25 to 34 Years | 16 (20.0%) | 58 (72.5%) |
| 35 to 44 Years | 16 (30.2%) | 34 (64.1%) |
| 45 to 54 Years | 23 (16.3%) | 126 (89.4%) |
| 55 to 64 Years | 43 (40.2%) | 53 (49.5%) |
| 65 to 74 Years | 62 (96.9%) | 19 (29.7%) |
| 75 Years and over | 66 (100.0%) | 26 (39.4%) |
| Total | 366 (46.2%) | 461 (58.2%) |
Disability Status by Sex by Age in Liberal
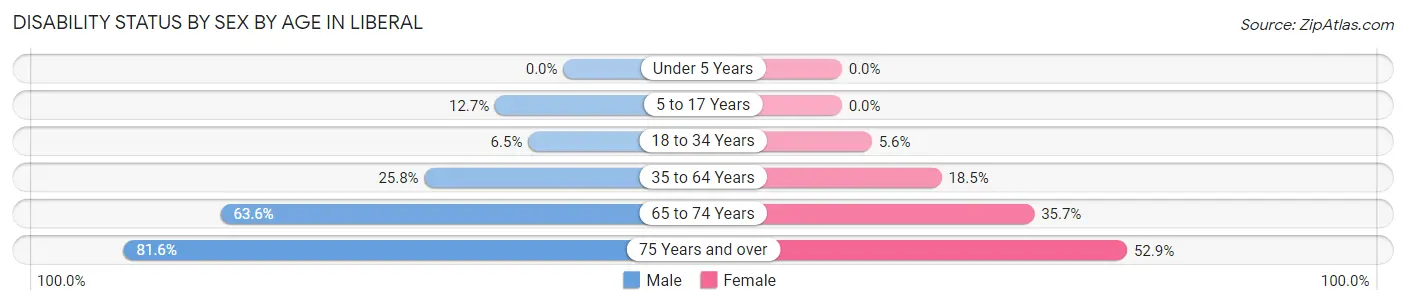
| Age Bracket | Male | Female |
| Under 5 Years | 0 (0.0%) | 0 (0.0%) |
| 5 to 17 Years | 9 (12.7%) | 0 (0.0%) |
| 18 to 34 Years | 6 (6.5%) | 4 (5.6%) |
| 35 to 64 Years | 33 (25.8%) | 32 (18.5%) |
| 65 to 74 Years | 14 (63.6%) | 15 (35.7%) |
| 75 Years and over | 40 (81.6%) | 9 (52.9%) |
Disability Class by Sex by Age in Liberal
Disability Class: Hearing Difficulty
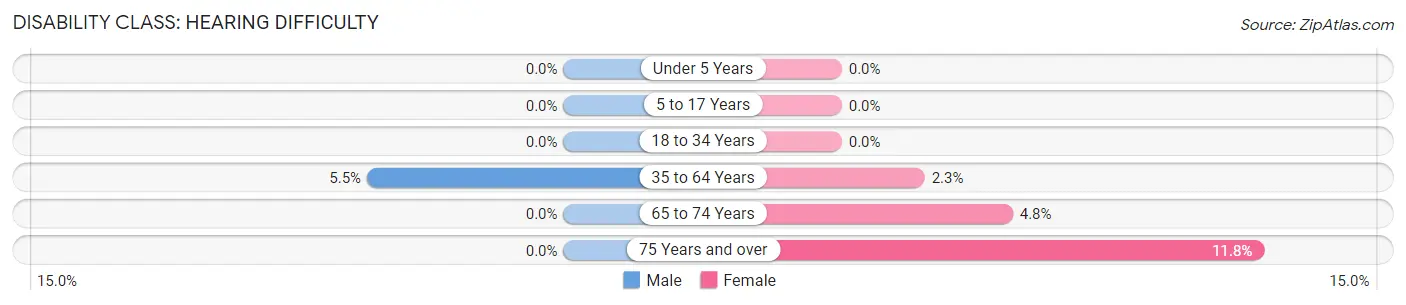
| Age Bracket | Male | Female |
| Under 5 Years | 0 (0.0%) | 0 (0.0%) |
| 5 to 17 Years | 0 (0.0%) | 0 (0.0%) |
| 18 to 34 Years | 0 (0.0%) | 0 (0.0%) |
| 35 to 64 Years | 7 (5.5%) | 4 (2.3%) |
| 65 to 74 Years | 0 (0.0%) | 2 (4.8%) |
| 75 Years and over | 0 (0.0%) | 2 (11.8%) |
Disability Class: Vision Difficulty
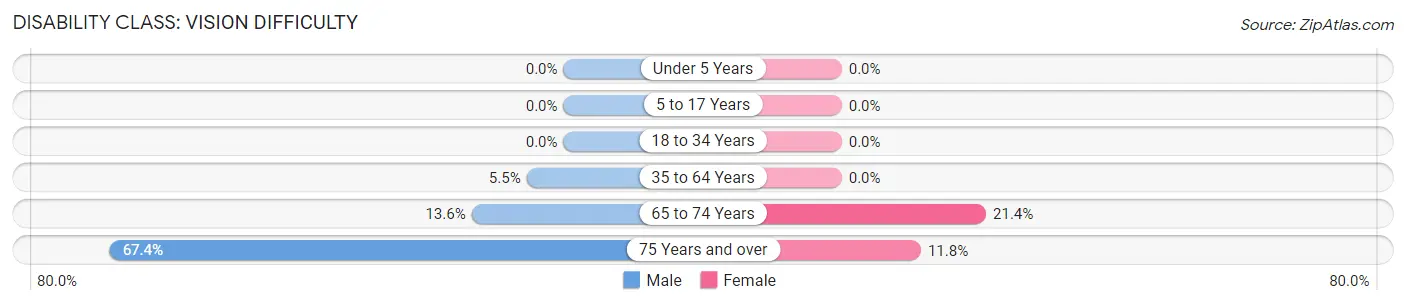
| Age Bracket | Male | Female |
| Under 5 Years | 0 (0.0%) | 0 (0.0%) |
| 5 to 17 Years | 0 (0.0%) | 0 (0.0%) |
| 18 to 34 Years | 0 (0.0%) | 0 (0.0%) |
| 35 to 64 Years | 7 (5.5%) | 0 (0.0%) |
| 65 to 74 Years | 3 (13.6%) | 9 (21.4%) |
| 75 Years and over | 33 (67.3%) | 2 (11.8%) |
Disability Class: Cognitive Difficulty
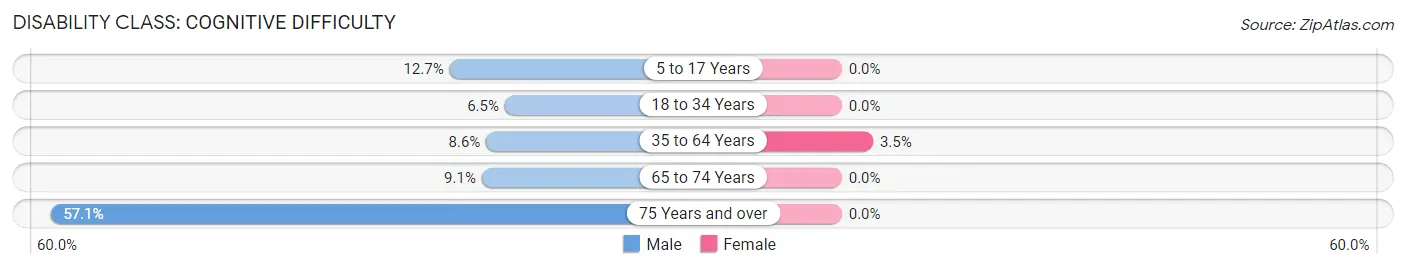
| Age Bracket | Male | Female |
| 5 to 17 Years | 9 (12.7%) | 0 (0.0%) |
| 18 to 34 Years | 6 (6.5%) | 0 (0.0%) |
| 35 to 64 Years | 11 (8.6%) | 6 (3.5%) |
| 65 to 74 Years | 2 (9.1%) | 0 (0.0%) |
| 75 Years and over | 28 (57.1%) | 0 (0.0%) |
Disability Class: Ambulatory Difficulty
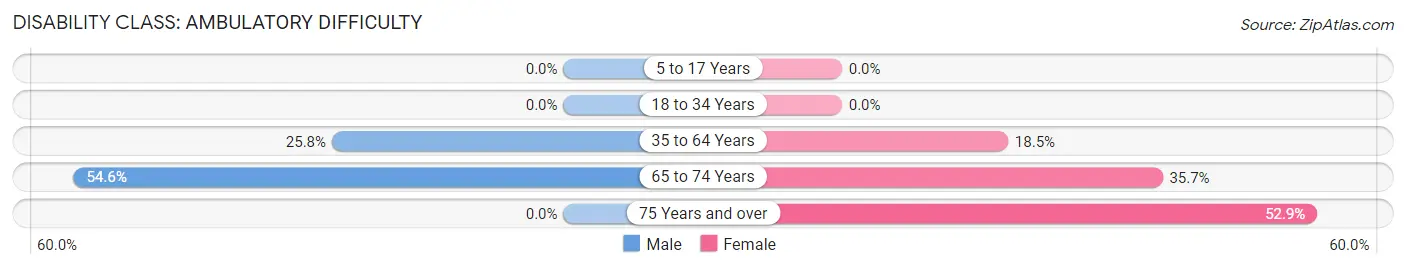
| Age Bracket | Male | Female |
| 5 to 17 Years | 0 (0.0%) | 0 (0.0%) |
| 18 to 34 Years | 0 (0.0%) | 0 (0.0%) |
| 35 to 64 Years | 33 (25.8%) | 32 (18.5%) |
| 65 to 74 Years | 12 (54.5%) | 15 (35.7%) |
| 75 Years and over | 0 (0.0%) | 9 (52.9%) |
Disability Class: Self-Care Difficulty
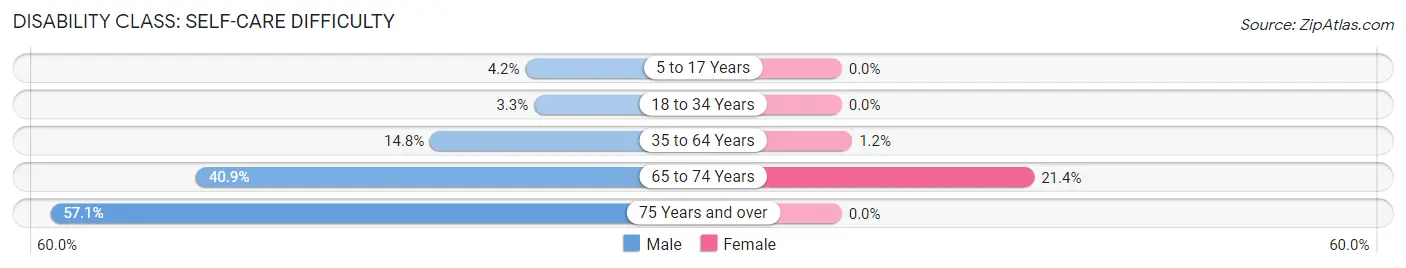
| Age Bracket | Male | Female |
| 5 to 17 Years | 3 (4.2%) | 0 (0.0%) |
| 18 to 34 Years | 3 (3.3%) | 0 (0.0%) |
| 35 to 64 Years | 19 (14.8%) | 2 (1.2%) |
| 65 to 74 Years | 9 (40.9%) | 9 (21.4%) |
| 75 Years and over | 28 (57.1%) | 0 (0.0%) |
Technology Access in Liberal
Computing Device Access in Liberal
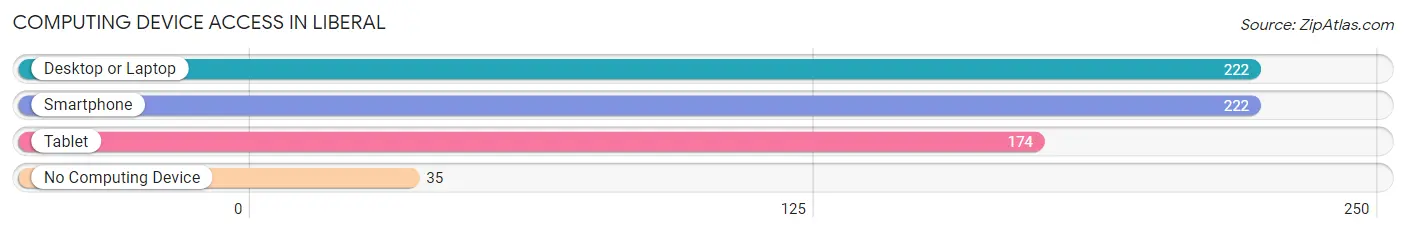
| Device Type | # Households | % Households |
| Desktop or Laptop | 222 | 69.6% |
| Smartphone | 222 | 69.6% |
| Tablet | 174 | 54.5% |
| No Computing Device | 35 | 11.0% |
| Total | 319 | 100.0% |
Internet Access in Liberal
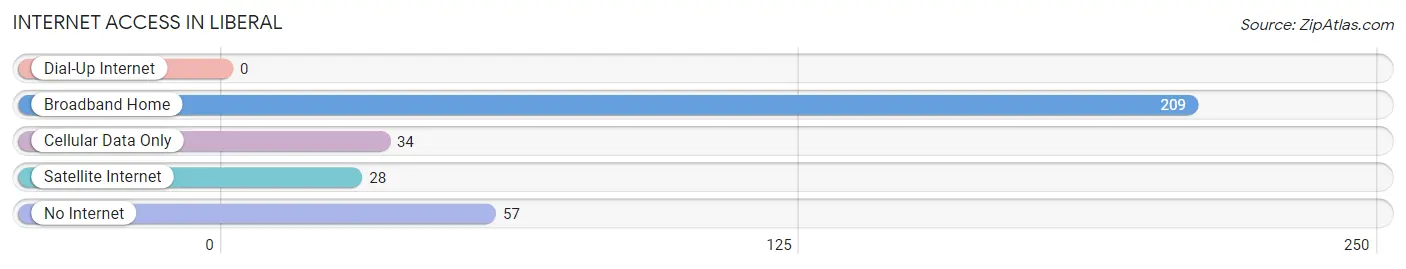
| Internet Type | # Households | % Households |
| Dial-Up Internet | 0 | 0.0% |
| Broadband Home | 209 | 65.5% |
| Cellular Data Only | 34 | 10.7% |
| Satellite Internet | 28 | 8.8% |
| No Internet | 57 | 17.9% |
| Total | 319 | 100.0% |
Liberal Summary
Liberal is a city located in the southwestern corner of Missouri, in Barton County. It is situated on the banks of the Marmaton River, and is the county seat of Barton County. The city has a population of approximately 1,400 people, and is part of the Joplin, Missouri Metropolitan Statistical Area.
History
The area that is now Liberal was first settled in the late 1800s, when a group of settlers from Kentucky and Tennessee arrived in the area. The settlement was originally known as “Marmaton”, after the nearby river. In 1887, the town was officially incorporated as “Liberal”, and the name was chosen to reflect the liberal views of the settlers.
In the early 1900s, Liberal experienced a period of growth and prosperity. The town was home to several businesses, including a flour mill, a sawmill, a blacksmith shop, and a general store. The town also had a school, a post office, and a newspaper.
In the 1920s, Liberal experienced a period of decline. The Great Depression caused many of the businesses in the town to close, and the population began to decline. However, the town was able to survive, and in the 1950s, the population began to grow again.
Geography
Liberal is located in the southwestern corner of Missouri, in Barton County. The city is situated on the banks of the Marmaton River, and is surrounded by rolling hills and farmland. The city is located approximately 30 miles south of Joplin, Missouri, and is part of the Joplin, Missouri Metropolitan Statistical Area.
Economy
The economy of Liberal is largely based on agriculture. The city is home to several farms, and the surrounding area is known for its production of corn, soybeans, and wheat. The city is also home to several small businesses, including a grocery store, a hardware store, and a restaurant.
Demographics
As of the 2010 census, the population of Liberal was 1,400. The racial makeup of the city was 95.3% White, 0.7% African American, 0.7% Native American, 0.3% Asian, 0.1% Pacific Islander, and 2.0% from other races. The median household income in Liberal was $35,000, and the median age was 40.5 years.
Common Questions
What is Per Capita Income in Liberal?
Per Capita income in Liberal is $24,697.
What is the Median Family Income in Liberal?
Median Family Income in Liberal is $68,594.
What is the Median Household income in Liberal?
Median Household Income in Liberal is $49,464.
What is Income or Wage Gap in Liberal?
Income or Wage Gap in Liberal is 32.2%.
Women in Liberal earn 67.8 cents for every dollar earned by a man.
What is Inequality or Gini Index in Liberal?
Inequality or Gini Index in Liberal is 0.43.
What is the Total Population of Liberal?
Total Population of Liberal is 794.
What is the Total Male Population of Liberal?
Total Male Population of Liberal is 384.
What is the Total Female Population of Liberal?
Total Female Population of Liberal is 410.
What is the Ratio of Males per 100 Females in Liberal?
There are 93.66 Males per 100 Females in Liberal.
What is the Ratio of Females per 100 Males in Liberal?
There are 106.77 Females per 100 Males in Liberal.
What is the Median Population Age in Liberal?
Median Population Age in Liberal is 40.8 Years.
What is the Average Family Size in Liberal
Average Family Size in Liberal is 3.2 People.
What is the Average Household Size in Liberal
Average Household Size in Liberal is 2.5 People.
How Large is the Labor Force in Liberal?
There are 347 People in the Labor Forcein in Liberal.
What is the Percentage of People in the Labor Force in Liberal?
56.6% of People are in the Labor Force in Liberal.
What is the Unemployment Rate in Liberal?
Unemployment Rate in Liberal is 14.2%.